and enhanced prospects coz flooding …/67531/metadc666658/m2/1/high...enhanced prospects for coz...
TRANSCRIPT

Quarterly Technical Progress Report
PRRC 96-02
IMPROVED EFFICIENCY OF MISCIBLE CO, FLOODS AND ENHANCED PROSPECTS FOR COZ FLOODING HETEROGENEOUS RESERVOIRS
DOE Contract No. DE-FG22-94BC14977
New Mexico Petroleum Recovery Research Center New Mexico Institute of Mining and Technology Socorro, NM 87801 (505) 835-5142
Contract Date: April 14, 1994 Anticipated Completion Date: April 13, 1997 DOE Award for FY 1995: $324,126
Program Manager: F. David Martin Principal Investigators: Reid B. Grigg
David S. Schechter
Contracting Officer's Representative:
Reporting Period:
Jerry Casteel Bartlesville Project Office
October 1, 1995 to December 31, 1995
US/DOE Patent Clearance is required prior to the publication of this document.
DISCLAIMER
This report was prepared as an account of work sponsored by an agency of the United States Government. Neither the United States Government nor any agency thereof, nor any of their employees, makes any warranty, express or implied, or assumes any legal liability or responsi- bility for the accuracy, completeness, or usefulness of any information, apparatus, product, or process disclosed, or represents that its use would not infringe privately owned rights. Refer- ence herein to any specific commercial product, process, or service by trade name, trademark, manufacturer, or otherwise does not necessarily constitute or imply its endorsement, r m m - mendation, or favoring by the United States Government or any agency thereof. The views and opinions of authors expressed herein do not necessarily state or reflect those of the United States Government or any agency thereof.
~. - - - - ~ ~- ~~ _--- ~ - .
DI§TRI~'JT\OI~ OF Tdfs DOCUMENT 1s uxLlrdiTEBk

OBJECTIVE
The objective of this experimental research is to improve the effectiveness of CO, flooding in heterogeneous reservoirs. Activities are being conducted in three closely related areas: 1) exploring further the applicability of selective mobility reduction (SMR) in the use of foam flooding, 2) exploring the possibility of higher economic viability of floods at slightly reduced CO, injection pressures, and 3) taking advantage of gravitational forces during low interfacial tension (IFT), CO, flooding in tight, vertically fractured reservoirs.
SUMMARY OF PROGRESS
Progress made this quarter in each of the three areas of the project is discussed below.
TASK 1 - CO2-FOAMS FOR SELECTIVE MOBILITY REDUCTION ( S M R )
Progress on this task in the past quarter has been made in the experimental study and modeling analysis of SMR-enhanced foam flooding. The experimental tests include mobility measurements of C0,- brine mixture and C0,-foam in a new series composite core. The numerical modeling examines the effect of flow geometry on the SMR-enhanced foam flooding in a simple field situation. In addition to this progress, three technical papers relevant to this task are being prepared for SPE conferences to be held this year in Midland and Tulsa.
Experiments A second new series composite core was constructed by assembling two Berea core samples of
differing permeabilies in the same coreholder. In this assembly, the unavoidable space between the two core faces was filled with a fine sand. The heterogeneity of this new system was determined by measuring the brine permeability at four sections along the core. Initial mobility experiments on two-phase flow of C0,- brine show no pressure anomaly in the fine sand section. This fmding suggests that a fine sand might be a better material to join cores than a fine filter paper when simulating longer flow systems.
Additional experiments were conducted on foam mobility measurements with this composite core. The results are presented in Fig. 1, where the mobility of C0,-brine or C0,-foam is plotted against the sectional permeability along the core sample. As shown on this graph, the slope of C0,-brine mobility data of (as determined by the regression) is 1.46. A slope greater than one indicates that the mobility of the fluid is more than proportional to core permeability. As a consequence, the fluid will flow through higher permeability rocks at a higher rate than would be expected for the given pressure gradient. Such a feature is opposite to the nature of displacement of a SMR fluid and will result in a poor sweep efficiency in the oil recovery process. On the other hand, when 1000 ppm surfactant is added into the brine phase, the mobility of C0,-foam is reduced and the slope falls to 0.51 for both surfactants: CD1050 and CD1045. A slope of 0.5 1 implies that the foam, as generated by these two surfactants, exhibits moderate S M R behavior. These results are similar to what we have previously reported, when SMR was observed in separate small core samples which are not in capillary contact. The small differences with earlier work could be the result of core size, core type, and brine concentration. We are currently conducting experiments to confirm these observations and we plan to use other types of surfactants with this same composite core system for further
2

study.
Modeling Numerical modeling work continues to examine the effect of radial flow geometry on oil recovery
by using a SMR fluid in the displacement process. The results of this work show that C0,-foam floods, augmented by SMR, show promise for improved oil recovery in which the recovery efficiency depends on the extent of SMR and the permeability contrasts that are normally encountered in the reservoir. The benefits of using SMR-enhanced foam in oil recovery become more obvious when the displacement of foam takes place in a radial flow geometry in the reservoir. As shown in Fig. 2, the breakthrough time of a moderate SMR-enhanced foam (exponent of 0.75) in a faster layer is delayed in a radial flow geometry when it is compared to that in a linear flow geometry. Furthermore, the pore volume of fluid required to achieve 90% of oil recovery can be reduced from 1.6 PV to 1.25 PV.
These results demonstrate the order of magnitude of the effect. In an actual reservoir with other considerations such as shape, well placement, horizontal as well as vertical permeability variations, and fluid properties, a much more detailed and sophisticated reservoir simulation must be used to assess the value of SMR-enhanced foam in the oil recovery application.
TASK 2 - REDUCTION OF THE AMOUNT OF C02 RlEQUIRED IN C02 FLOODING
During this quarter, good progress has been achieved in several areas. In the laboratory, achievements include the completion test ora conventional PVT study and CO, swelling tests for Sulimar Queen recombined live crude, recombination and a bubble point check for a large sample of Spraberry live crude, a number of compositional analyses of produced samples from a CO, gravity drainage test, and a series of mobility coreflood tests. Several programming bugs have been identified and eliminated in DOE’S reservoir simulator MASTER, with some comparison runs with UTCOMP completed. Both are showing foam results similar to those obtained from earlier field tests. Two technical papers relevant to this task are being prepared for the 1996 SPEDOE Symposium on Improved Oil Recovery to be held on April 21-24 in Tulsa.
PVT Studies The laboratory work has been completed on a conventional PVT study on Sulimar Queen reservoir
fluid and CO, was incrementally injected to 90 mole % CO,. The PVT study was undertaken to obtain this information for another study and to establish a baseline for comparison when adding CO, to the system. The swelling tests can be used as a good, but conservative estimate, of the CO, MMP at reservoir temperatures below 120°F. This MMP estimate represents the upper pressure of the three phase region at high C02 concentrations in the pressure/composition phase diagram, as seen in Fig. 3. The temperature of this reservoir is in the 65 to 75°F range. The upper phase boundary of the three-phase region is less than 850 psig, which should be achievable in a 2000 ft deep reservoir. The swelling curve also provides information valuable for reservoir simulation on the amount of recovery to expect from reservoir crude due to oil swelling.
Spraberry Bubble point tests have been completed on a sample of live Spraberry oil. This oil will be used for
a number of tests during the next two quarters that will include MMP determinations, swelling tests, and continuous phase equilibrium tests. A series of compositional tests on samples of Spraberry crude produced
3

fiom the gravity drainage tests, related to Task 3, were analyzed. The results of the analysis showed significant reduction in the C,, components in the produced fluid in all samples except those taken at the end of the test when heat was applied to the system. The low Go+ recovery is indicative of an extraction or stripping process by the COz rather than displacement as the major production mechanism.
Coreflood Tests Baseline experiments for coreflood foam tests were performed for various CO, flow fractions, 0.80,
0.67,0.50,0.33, and 0.20, by simultaneously injecting C02 and brine into a and brine-saturated core until a steady-state pressure drop across the core was obtained. Three flow rates, 16.8, 8.4, and 4.2 c c h were used during each CO, flow fraction test. The mobility of CO,/brine for each test can be obtained based on the results from the tests of three different flow rates. The results indicate that the mobility of CO,/brine increases with increasing CO, flow fraction. As hoped, the single phase mobility of brine and CO, are much higher than the mobility of C02/brine. The mobility data obtained from baseline experiments will be used to calculate the foam resistance factor of each test. Foam tests will be performed to examine the influence of foam quality at a lower range on C0,-foam flow behavior.
Reservoir Simulations Additional progress on the validation of foam options in MASTER was made in the past quarter.
Both UTCOMP and MASTER use the same foam test to validate the foam options. However, the results of the foam test fiom MASTER are not similar to the results obtained from UTCOMP, indicating that bugs may still be in the code of MASTER. Ctirrently, our time is spent debugging and validating MASTER. The effect of foam can be identified by comparing the results of the foam test with the results of the base case without foam.
TASK 3 - LOW IFT PROCESSES AM) GAS INJECTION IN FRACTURED RESERVOIRS
Research continues in two primary areas: 1) Understanding-the fundamentals of low interfacial tension behavior via theory and experiment and the influence on multiphase flow behavior and 2) Modeling low IFT gravity drainage for application of gas injection in fractured reservoirs.
In the first year of our contract, we presented all the fundamental background for reservoir IFT calculation of crude oiVgas mixtures. The calculation methodology developed was presented as a standard for industry's use in predicting IFT accurately. We presented evidence for the conditions in our first annual report showing that the scaling exponents can apply far from the critical point.
The first quarter of the second year was spent measuring the IFT of pure component liquidvapor systems in our completed pendant drop apparatus. Our experimental data is presented in the quarterly report. The report supports the assumptions necessary for simple, yet theoretically accurate parachor calculations. The second quarter of year 2 was spent on CO, gravity drainage experiments. We presented experimental data and compared the results with a mathematical model of gravity drainage in the quarterly report.
While continuing measurement of IFT of multi-component systems, we devoted the third quarter of year 2 on CO,/oil (non-equilibrium) gravity drainage experiments using a reservoir core at reservoir conditions.
We conducted a non-equilibrium gravity drainage experiment using a Sprabeny core, stock tank oil
4

and CO, at reservoir temperature near the MMP. A sketch of experimental apparatus was shown in the last quarterly report, In our experiment, a 4" x 24" reservoir core (0.01 md) taken fiom Spraberry Trend in West Texas was saturated with synthetic reservoir brine. The brine was displaced with STO to connate water saturation. During the gravity drainage process, CO, was injected into the annulus in the core holder and the temperature in the core holder was maintained at about 139°F. Pressure was between 2,000 psig and 1,500 psig, as seen in Fig. 4.
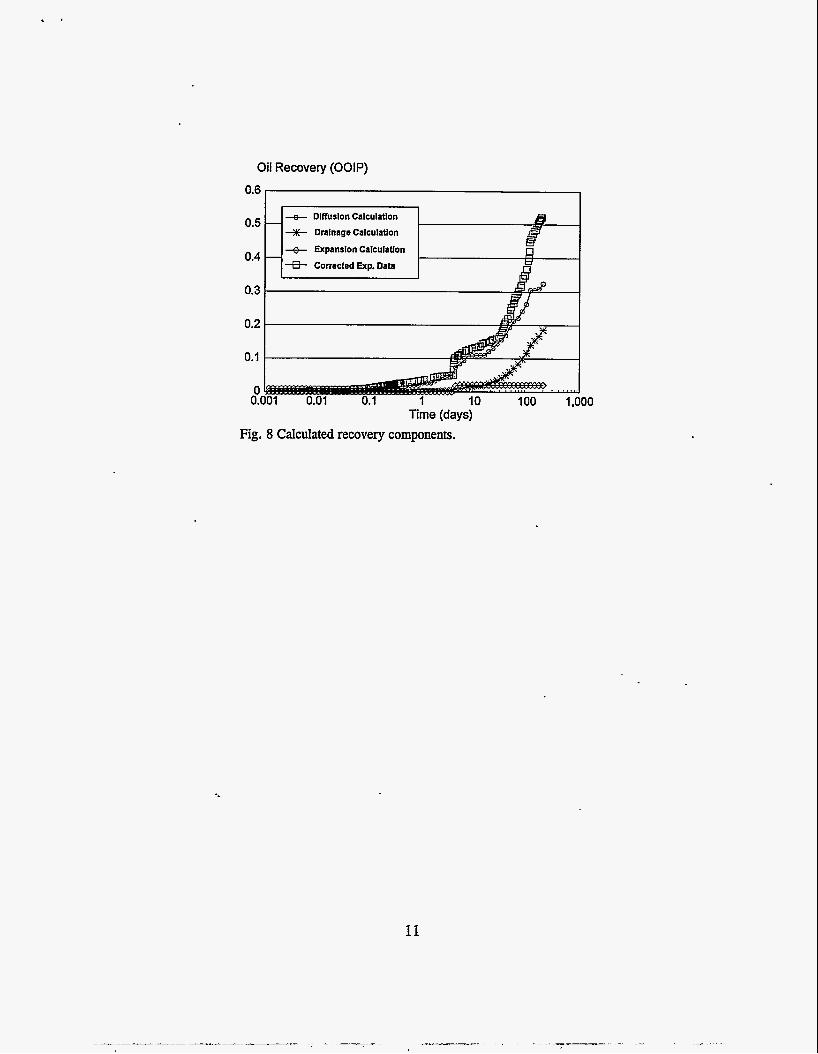
The oil recovery volume was collected at ambient pressure, seen in Fig. 5. The collected oil samples are mostly yellow and brown in color. Table 1 presents the composition difference between the input oil and the produced oil. Table 2 shows the density and viscosity of the produced oil at atmospheric pressure. Table 1 clearly shows that the produced oil is lighter than the input oil. More importantly, Table 1 indicates that some light hydrocarbons escaped with CO, gas during collection of the produced liquid. The hydrocarbon escape is because the liquid was collected at a temperature that is close to reservoir temperature. It is estimated that up to 70% of light hydrocarbons were lost during the experiment. Figure 6 presents corrected recovery volume using data fiom GC analysis. Figure 7 demonstrates the comparison between the experimental oil recovery and its matching with our mathematical model and procedure reported in the last quarterly report. Figure 8 shows calculated recovery components due to vertical drainage, horizontal difision and gas expansion caused by depressurization. It is indicated fiom Figure 8 that horizontal molecular difision is the dominating mechanism for the CO, oil recovery from the low permeability reservoirs. This is consistent with the composition and color of produced oil.
5

Table 1. Composition of separator oil and produced oil. Hydrocarbon STO Mole Fraction Yellow Brown Oil Number . Oil 5 0.091 14 0.00122 0.00143 6 0.0663 1 0.00058 0.00103 7 0.14649 0.00190 0.00612 8 0.10466 0.00585 0.0 1799 9 0.061 15 0.01425 0.03063 10 0.05053 0.03 84 1 0.0573 1 11 0.03 73 6 0.061 10 0.07372 12 0.03561 0.08715 0.09773 13 0.033 13 0.10453 0.1 1466 14 0.02572 0.08705 0.09355 15 0.02151 0.07932 0.08366 16 0.02020 0.07220 0.07295 17 0.02088 0.07893 0.07774 18 0.01485 0.05368 0.05020 .- . 19 0.01609 0.05446 0.04840 20 0.01 142 0.03545 0.03029 21 0.01068 0.03057 0.02560 22 0.01016 0.02579 0.02109 23 0.00957 0.02142 0.01730 24 0.00898 0.01721 0.01382 25 0.00599 0.01051 0.00853 26 0.00846 0.01187 0.00952 27 0.00574 0.00682 0.0055 1 28 0.00852 0.00867 0.0071 1 29 0.00583 0.00488 0.00406 30 0.00566 0.00414 0.00354 31 0.00569 0.00363 0 .O 03 20 32 0.00555 0.00320 0 .O 0293 33 0.00536 0.00291 0.00280 34 0.00540 0.00283 0.00283 35 0.00550 0.00285 0.00296 36 0.00822 0.00439 0.00472 37+ 0.12763 0.06224 0.00709
Total -- 1.00000 1.00000 1.00000
Mw 219.39 251.80 222.34
6

Table 2. Density and viscosity of the yellow oil.
Temperature "C Density g/cc Viscosity cp
40 0.835 3.3
60 0.820 2.1
50 0.828 2.5
70 0.812 1.7
1,000
300
n 100 Y u 30 a
Y E 10
P I .- b a 3 -
0.3 1 Flow velocity = 9.4 Alday Surfactant conc = 1000 ppm
0.1 I I I I , I , .
100 200 300 500 700 1,000 Permeability (md)
COUbrine CD1050 CD1045 4- -e- -0-
Slope 1.46 0.51 0.51
Series compwite con system
prcunretlp picking mittrid
Fig. 1 Mobility dependence on permeability in a composite core.
7

Fivelayer reservoir model
I 500 ad I
1 -
- z - 0.8 2 0.6 -
2 0.4 - 8
pZl S M R exponent - 0.75 20 md
I I I I
0 1 2 3 4 5 Dimensionless time (PV)
linear flow radial flow -.- -e.
Fig. 2 Effect of flow geometry on oil recovery or vertical sweep efficiency in a five-layer reservoir model.
4,000 I
Phase Region, Ll + 3,500
3,000 c
2,500 a
Two Phase Regions
0 20 40 60 80 100 Mole % C02
Fig. 3 Pressurecomposition phase diagram for CO, added to S u l i i Queen Oil.
8

Pressure, 1000 psig
1.8
Oil Recovery (OOIP) 0.35
0.3
0.25
0.2
0.15
0.1
0.05
0 0.001 0.01 0.1 1 10 100 1,000
Time (days) Fig. 5 Recovery from a Sprabeny core.
9

Oil Recovery (OOIP) 0.6
0.5
0.4
0.3
0.2
0.1
0 0.001 0.01 0.1 1 10 100 1,000
Time (days) Fig. 6 Corrected oil recovery data.
0.6
0.5
0.4
0.3
0.2
0.1
Oil Recovery (OOIP)
++ ComtedExp.Data
* . . , * I . . ,.... ,I , . . .. 0 0.001 0.01 0.1 1 10 100 1,000
Time (days) Fig. 7 History match of oil recovery.
10
Oil Recovery (OOIP) 0.6
0.5
0.4
0.3
0.2
0.1
0 0.1
++ Drainage Calculaffon
+ Expanslon Calculatlon
Corrected Exp. Data
I1 0.01 0.1 1 10 100 1,000 Time (days)
Fig. 8 Calculated recovery components.
11