and growing the economy 2013 - ministry of finance honourable charles sousa minister of finance...
TRANSCRIPT

The Honourable C h a r l e s s o u s aMinister of Finance
oNTarIo eCoNoMIC ouTlooKaNd FIsCal reVIeW
Creating Jobs and
growing the eConomy
2013
B aC KG r o u N d Pa P e r s

The Honourable C h a r l e s s o u s aMinister of Finance
oNTarIo eCoNoMIC ouTlooKaNd FIsCal reVIeW
Creating Jobs and
growing the eConomy
2013
B aC KG r o u N d Pa P e r s

For general inquiries regarding the 2013 Ontario Economic Outlook and Fiscal Review, Background Papers, please call:
Toll-free English & French inquiries: 1-800-337-7222Teletypewriter (TTY): 1-800-263-7776
For electronic copies of this document, visit our website atwww.fin.gov.on.ca
© Queen’s Printer for Ontario, 2013ISSN 1483-5967 (Print)ISSN 1496-2829 (PDF/HTML)
Ce document est disponible en français sous le titre :Perspectives économiques et revue financière de l’Ontario de 2013, Documents d’information

Table of Contents
iii
Contents
Foreword
Managing Responsibly ............................................................................. xiv
Growing the Economy and Reforming Public Services ................................ xv
Investing in People .................................................................................. xvi
Canada Pension Plan ........................................................................... xvii
Helping Our Youth .............................................................................. xviii
Fair Society ....................................................................................... xviii
Investing in Modern Infrastructure ............................................................ xix
Dynamic and Innovative Business Climate .................................................. xxi
Jobs of Tomorrow ................................................................................ xxi
More Competitive Businesses ................................................................ xxii
The Need for a Committed Federal Partner ............................................... xxiii
Conclusion ........................................................................................... xxiv
Chapter I: Creating Jobs and Growing the Economy
Highlights ................................................................................................ 3
Section A: Jobs and Growth
Introduction ............................................................................................. 7
Responsible Management of Program Expense ........................................... 7
Economic Recovery ................................................................................ 8
1. Investing in People .............................................................................. 10
Leading the Way to Secure Retirement.................................................... 10
Connecting People to Tomorrow’s Jobs .................................................... 11
21st-Century Learning ........................................................................... 14
Increasing Access to Health Care ........................................................... 18
Keeping Seniors Active ......................................................................... 19
Protecting Consumers ........................................................................... 19
Cutting Auto Insurance Rates ................................................................ 22

2013 Ontario Economic Outlook and Fiscal Review
iv
2. Investing in Modern Infrastructure ......................................................... 25
Public Infrastructure Benefits Ontario’s Economy ...................................... 26
Ontario’s Long-Term Energy Plan and Clean Energy .................................. 35
3. Supporting a Dynamic and Innovative Business Climate ............................ 39
Ontario’s Businesses Could Be Investing More .......................................... 39
Encouraging More Business Investment Activity ........................................ 43
Building Sector Partnerships for Success .................................................. 45
Going Global Trade Strategy .................................................................. 56
Investing in Entrepreneurship and Innovation .......................................... 58
Supporting Communities ....................................................................... 59
Section B: Managing Responsibly
Ontario’s Path to Balance ......................................................................... 61
An Efficient and Accountable Government ................................................... 63
Moving Forward on Recommendations of the Commission on
the Reform of Ontario’s Public Services ................................................... 65
Public-Sector Compensation .................................................................. 68
Executive and Members of Provincial Parliament Compensation................... 70
Health Care System Changes ................................................................. 70
School Board Efficiencies and Modernization ............................................. 72
Managing the Size of the Ontario Public Service ........................................ 72
Improving Accountability ....................................................................... 74
Balanced Choices .................................................................................... 76
Chapter II: Economic Outlook
Highlights .............................................................................................. 79
Overview ............................................................................................... 81
Recent Economic Developments ................................................................ 83
Ontario’s Economic Performance since the Recession ................................. 84
Table of Contents
v
Global Economic Developments and Outlook ............................................... 87
U.S. Economy ..................................................................................... 88
Oil Prices ............................................................................................ 90
The Canadian Dollar ............................................................................. 91
Financial Markets ................................................................................. 92
Outlook for Ontario Economic Growth ........................................................ 95
Details of the Ontario Economic Outlook ................................................... 103
Private-Sector Forecasts ..................................................................... 104
Change in the Economic Outlook .......................................................... 105
Comparison to the 2013 Budget ........................................................... 106
Chapter III: Fiscal Outlook
Highlights ............................................................................................ 109
Section A: Overview ...................................................................... 111
Section B: 2013–14 Fiscal Performance
2013–14 Revenue Changes since the 2013 Budget ................................. 114
2013–14 Expense Changes since the 2013 Budget .................................. 116
Section C: Details of Ontario’s Finances
Fiscal Tables and Charts ......................................................................... 119
Chapter IV: The Need for a Committed Federal Partner
Highlights ............................................................................................ 131
The Case for Committed Partnerships ...................................................... 133
A Committed Federal Partner to Build the Economy Together ...................... 134
Long-Term Investment in Public Infrastructure ....................................... 134
Investment in Public Transit ................................................................ 134
Labour Market Training ....................................................................... 135
Supporting Ontario’s Leading Sectors .................................................... 136
A Committed Federal Partner to Strengthen the
Retirement Income System .................................................................... 139

2013 Ontario Economic Outlook and Fiscal Review
vi
A Committed Federal Partner to Invest in Healthy Ontario Communities ........ 140
Investment in Social and Affordable Housing .......................................... 140
Immigration and Refugees .................................................................. 140
First Nation Communities .................................................................... 141
Investing in Healthy Ontarians ............................................................. 142
A Committed Federal Partner to Establish a Fair Fiscal Arrangement ............. 143
Impacts of Unilateral Federal Actions ....................................................... 146
Federal Actions with Impacts on Ontario Communities ............................. 146
Federal Actions with Impacts on Ontario’s Finances
and Public Services ............................................................................ 147
Managing Risks from Federal Actions .................................................... 149
Chapter V: Retirement Income Security
Highlights ............................................................................................ 153
Strengthening Ontario’s Retirement Income System ................................... 155
The Case for Action ............................................................................ 157
Leading the Way in Reforming the Retirement Income System ................. 160
A Strategy to Enhance Retirement Savings ............................................... 161
1. For Ontarians without Workplace Pension Plans................................... 162
2. For Ontarians with Self-Directed Retirement Savings ........................... 166
3. For Ontarians with Defined Benefit Pension Plans ................................ 168
Chapter VI: Taxation
Highlights ............................................................................................ 177
Introduction ......................................................................................... 179
Overview .......................................................................................... 179
Support for People ................................................................................ 180
Ontario Trillium Benefit ....................................................................... 180
Fresh Food Donation Tax Credit............................................................ 180
Dividend Tax Credits .......................................................................... 181

Table of Contents
vii
Support for Business ............................................................................. 184
Accelerated Capital Cost Allowance for Manufacturing and
Processing Machinery and Equipment .................................................... 184
Business Support Programs Review ...................................................... 184
A Fair and Efficient Tax System ............................................................... 185
Property Tax ........................................................................................ 186
Provincial Land Tax Reform ................................................................. 186
Education Property Tax ....................................................................... 187
Residential Education Tax ................................................................... 188
Business Education Tax ...................................................................... 188
Other Measures .................................................................................... 189
Employer Health Tax Exemption ........................................................... 189
Apprenticeship Training Tax Credit ....................................................... 190
Revenue Integrity Measures ................................................................ 191
Ontario’s Tobacco Strategy .................................................................. 192
Chapter VII: Borrowing and Debt Management
Highlights ............................................................................................ 195
Long-Term Public Borrowing ................................................................... 197
Debt ................................................................................................... 202
Residual Stranded Debt Update ............................................................... 203
Total Debt Composition .......................................................................... 205
Debt-to-GDP Ratios ............................................................................... 206
Cost of Debt ......................................................................................... 208
Risk Exposure....................................................................................... 209
Chapter VIII: Pre-Budget Consultations
How to Participate in the 2014 Pre-Budget Consultations ............................ 213
Online Submissions ............................................................................ 213
Written Submissions ........................................................................... 214

2013 Ontario Economic Outlook and Fiscal Review
viii
Tables
Chapter I: Creating Jobs and Growing the Economy
Table 1.1 Ontario Youth Jobs Strategy —
$295 Million over Two Years ......................................... 12
Chapter II: Economic Outlook
Table 2.1 Ontario Economic Outlook ............................................ 81
Table 2.2 Outlook for External Factors ......................................... 93
Table 2.3 Impacts of Sustained Changes in Key External Factors
on Ontario’s Real GDP Growth ...................................... 94
Table 2.4 The Ontario Economy, 2011 to 2016 ............................ 103
Table 2.5 Private-Sector Forecasts for Ontario Real
GDP Growth ............................................................. 104
Table 2.6 Changes in Ministry of Finance Key Economic Forecast
Assumptions: 2013 Budget Compared to
2013 Fall Economic Statement .................................... 106
Chapter III: Fiscal Outlook
Table 3.1 2013–14 In-Year Fiscal Performance ............................ 113
Table 3.2 Summary of Revenue Changes since the
2013 Budget ............................................................ 114
Table 3.3 Summary of Expense Changes since the
2013 Budget ............................................................ 116
Table 3.4 Fiscal Summary ........................................................ 119
Table 3.5 Revenue .................................................................. 120
Table 3.6 Total Expense .......................................................... 121
Table 3.7 Other Expense ......................................................... 122
Table 3.8 2013–14 Infrastructure Expenditures ........................... 123
Table 3.9 Ten-Year Review of Selected Financial and
Economic Statistics ................................................... 124

Table of Contents
ix
Chapter VII: Borrowing and Debt Management
Table 7.1 2013–14 Borrowing Plan ............................................ 199
Table 7.2 Medium-Term Borrowing Outlook ................................ 201
2013 Ontario Economic Outlook and Fiscal Review
x
Charts
Chapter I: Creating Jobs and Growing the Economy
Chart 1.1 Ontario Job Recovery Ahead of Key Competitors................ 8
Chart 1.2 Poverty Reduction Strategy Helps Lower Child Poverty ..... 13
Chart 1.3 Canadian Corporate Cash Balances Above
Long-Term Average .................................................... 41
Chart 1.4 Ontario Business Investment Lags Canada
and the United States .................................................. 42
Chart 1.5 Ontario Business R&D Spending Below the U.S. ............... 44
Chart 1.6 Ontario’s 2013 Budget Plan to Eliminate the Deficit .......... 62
Chart 1.7 Year-Over-Year Program Expense Changes ..................... 63
Chart 1.8 Ontario Wage Settlements ........................................... 69
Chart 1.9 Ontario Public Service Staffing Levels ............................ 73
Chapter II: Economic Outlook
Chart 2.1 Ontario Real GDP since 2008–09 Recession .................... 84
Chart 2.2 Employment Gains Concentrated in Full-Time,
Private-Sector, Above-Average Wage Jobs ...................... 85
Chart 2.3 Ontario Job Recovery Ahead of U.S.
and OECD Average...................................................... 86
Chart 2.4 Global Economic Growth to Improve .............................. 88
Chart 2.5 Strengthening U.S. Recovery ........................................ 89
Chart 2.6 Oil Prices to Remain High ............................................. 90
Chart 2.7 Canadian Dollar to Remain Close to Parity ...................... 91
Chart 2.8 Interest Rates to Rise Gradually .................................... 92
Chart 2.9 Household Spending, Business Investment and
Trade Will Support Economic Growth ............................. 95
Chart 2.10 Employment Expected to Rise over the
Medium Term ............................................................. 96

Table of Contents
xi
Chart 2.11 Housing in Ontario to Remain Affordable ........................ 97
Chart 2.12 Canadian Household Debt Remains Elevated ................... 98
Chart 2.13 Household Net Worth Improving ................................... 99
Chart 2.14 Ontario Business Machinery and Equipment Investment
Lags the United States .............................................. 100
Chart 2.15 Exports Expected to Increase ..................................... 102
Chart 2.16 Weaker Private-Sector Outlook for Growth
in 2013 and 2014 ..................................................... 105
Chapter III: Fiscal Outlook
Chart 3.1 Composition of Revenue, 2013–14 .............................. 126
Chart 3.2 Composition of Total Expense, 2013–14 ....................... 127
Chart 3.3 Composition of Program Expense, 2013–14 .................. 128
Chapter IV: The Need for a Committed Federal Partner
Chart 4.1 In 2013–14, Ontario’s Fiscal Capacity Is Fifth
but Federal Transfers Bring Ontario to Last ................... 143
Chart 4.2 Net Contribution to Equalization by Province,
2013–14 ................................................................. 145
Chapter V: Retirement Income Security
Chart 5.1 Retirement Income Targets and Potential Gaps ............. 158
Chapter VI: Taxation
Chart 6.1 Education Property Taxes as a Per Cent of
Elementary and Secondary Education Funding .............. 187

2013 Ontario Economic Outlook and Fiscal Review
xii
Chapter VII: Borrowing and Debt Management
Chart 7.1 2013–14 Borrowing ................................................... 198
Chart 7.2 Residual Stranded Debt since April 1, 1999 ................... 203
Chart 7.3 Total Debt Composition as at September 30, 2013 ........ 205
Chart 7.4 Net Debt-to-GDP ...................................................... 206
Chart 7.5 Accumulated Deficit-to-GDP ....................................... 207
Chart 7.6 Effective Interest Rate (Weighted Average)
on Total Debt ........................................................... 208
Chart 7.7 Interest Rate Exposure .............................................. 209
Chart 7.8 Foreign Exchange Exposure ........................................ 210

Foreword
xiii
Foreword The Ontario government is introducing a new three‐part plan to grow the
economy and create jobs. This plan invests in people, builds modern infrastructure
and supports a dynamic and innovative business climate.
We do so at a time when the world’s recovery from the global recession remains
uncertain, causing many families to feel unsure about the security of their job and
their financial future. We must work to expand opportunities for Ontario families
and in order to do so must make new choices and take new decisions.
Premier Kathleen Wynne and our team have created a new plan to spur growth,
create jobs and strengthen services that help families.
That plan involves three core priorities:
Investing in our people;
Building modern infrastructure; and
Supporting a dynamic and innovative business climate.
The government’s plan is focused and strategic.
By investing in our people, we will prepare them for the economy of today
and tomorrow. By building more modern infrastructure, we will create jobs
immediately and increase our competitiveness for the long term. And by fostering
a dynamic business climate, we will help small and medium‐sized businesses grow
and attract larger companies to invest and create good Ontario jobs.
And with growth, we will have the revenue to balance our budget.
With hard work and discipline, Ontario families are helping our province emerge
from the global recession. But there continue to be uncertainties for people and
businesses. We now face decisions about the way forward that will test our
priorities and our values.

2013 Ontario Economic Outlook and Fiscal Review
xiv
There are those who believe we must cut deeply even at the risk of stalling growth
and harming vital public services in order to eliminate the deficit even sooner than
planned. Others would increase taxes recklessly, hurting job‐creating businesses
and Ontario families. Neither approach is sensible. Both approaches would hurt
businesses and jeopardize public services on which Ontario families rely.
Our plan calls for a fair and responsible approach.
That will mean new strategic investments to spur growth, create jobs,
strengthen services and help families. We remain on track to balance the budget
by 2017–18.
However, should global economic conditions falter, causing revenue growth to
fall further, our priority is clear — this government will continue to protect
investments in jobs, growth and our families ahead of short‐term targets.
Stronger growth and new jobs are the surest, fairest path to higher revenues
and a balanced budget.
Indeed, our three‐part plan will be critical to fostering the jobs and growth
necessary to both support Ontario’s families and generate the revenues necessary
to eliminate the deficit.
Managing Responsibly Continuing global economic uncertainty is slowing Ontario’s economic growth
and reducing revenues. These external forces have led to lower revenues since
the 2010 Budget, totalling $5 billion less than projected.
Your government, however, has taken firm, effective measures to reduce
spending growth, which has allowed us to overachieve on deficit‐reduction targets
four years in a row — something no other government in Canada has accomplished.
Your government will continue to make strategic investments to grow the
economy, which will eliminate the deficit and protect important public services
on which Ontarians rely.
This approach is balanced, fiscally responsible and fair to Ontario families.

Foreword
xv
Growing the Economy and Reforming Public Services
As a matter of fairness and fiscal discipline, Ontario’s government has undertaken
important reforms to control spending while maintaining and improving the
quality of public services. Ontario has the lowest per‐capita program spending in
Canada. For two years running, growth in program expenditures overall has been
held to less than one per cent. And last year, total government spending fell for
the first time in more than a decade.
From this disciplined position, we must approach additional reforms to public
services with careful attention to how Ontario families might be impacted.
We will hold our spending firm. Vital public services are simply too important to
the well‐being of Ontario families. Cutting funding to health care and education —
as some have done in the past and would suggest that we do again — would put
our province’s schools, hospitals and jobs at risk.
Instead, we will maintain a rigorous approach to control program spending to
reduce Ontario’s net debt‐to‐GDP ratio to the pre‐recession level of 27 per cent.
In order to do so, we are currently moving forward with 60 per cent of the
recommendations of the Commission on the Reform of Ontario’s Public Services,
including increasing the use of nurse practitioners, offering online driver’s licence
renewals and providing increased access to mental health consultations for
youth through videoconferencing. Our next step will be to analyze all remaining
recommendations, except those already ruled out because they do not align
with the priorities of Ontario families.

2013 Ontario Economic Outlook and Fiscal Review
xvi
Investing in People The Ontario government’s plan will make new investments in our people its
foremost priority. In challenging economic times such as these, the role of
government is to provide families with the opportunity to realize their full
potential and to ensure their access to vital public services. A healthy,
well‐educated population leads to a stronger economy.
Investing in people begins with education and health care. We will continue to
invest in early learning to give our kids the best start in life. Our schools must be
safe and well equipped. Our hospitals and home care must be effective and
responsive to the needs of patients, especially our seniors and most vulnerable.
Your government continues to improve care in our province’s hospitals. More than
100 hospital projects have been built or are under construction across Ontario in
communities such as Thunder Bay, London and Cornwall. To ease the critical
transition from hospital to home, we are also investing substantially in home and
community care services, particularly for our seniors.
The government is also helping seniors stay active, healthy and connected to the
community. We are creating Ontario’s first‐ever grants program dedicated solely
to helping seniors participate in additional community activities and continue
learning in areas like technology and financial literacy.

Foreword
xvii
Canada Pension Plan
A fundamental priority for your government is retirement income security —
especially for the middle class. Long‐term savings and investment play a critical
role. So too, governments must ensure a reliable and responsible retirement
income system — one that evolves and responds to the practical realities of
our times.
The Canada Pension Plan (CPP) is the foundation of the nation’s retirement
income system. It is a program that has served generations of Ontarians well.
The CPP has brought provincial and federal governments together in the common
cause of supporting our seniors for nearly half a century. To enhance it for
Ontarians, particularly for the middle class, we must make improvements now.
However, the federal government is resisting calls for improvement from
provinces, from Premier Kathleen Wynne and from independent experts.
Your government is leading the way to secure a new agreement among provinces,
territories and the federal government to enhance the CPP — to strengthen the
benefits it provides. If an agreement cannot be reached, we will move forward
with a “made in Ontario” solution.
Your government’s efforts to ensure retirement income do not conclude with
CPP reform. We also recognize that ensuring a strong and stable retirement
income system requires a comprehensive, long‐term strategy and a range of tools.
We will continue to work with Ontarians to provide more retirement savings
options such as pooled registered pension plans. We will also work to assist those
with workplace‐based pension plans to ensure that these plans are sustainable
and reliable over the longer term. For those who are accumulating retirement
savings on their own, we will be vigilant in our effort to help reduce the costs
associated with investing and consider options such as enhancing the oversight
of financial advisers.

2013 Ontario Economic Outlook and Fiscal Review
xviii
Helping Our Youth
To remain strong at home and competitive in the global economy, we must
continue to support the efforts of our youth to gain the education they require,
the skills they seek and the opportunities they deserve. This will help all Ontario
families both in the near term and for the long run. Your government is taking
specific actions to help youth.
Together, we are helping Ontario families cover the costs of postsecondary
education. Many families work hard to send their kids to college or university.
Our 30% Off Ontario Tuition grant helps families with those costs, and helps young
people get the education they need to secure a brighter future. This grant helps
more than 200,000 students every year pay for their education.
And, as part of our government’s plan to help create jobs and grow our economy,
in the 2013 Budget, we announced a Youth Jobs Strategy to help young people
find their way into the workforce. Over the next two years, 30,000 young people
will gain the benefit of on‐the‐job workplace experience, introducing them to
employers and offering them a head start on their future careers.
Fair Society
Ontario’s economy is strengthened when everyone has the opportunity to achieve
their full potential. Strategic investments in education, health and income support
help reduce reliance on social services, build the workforce and strengthen
Ontario’s economy. While the minimum wage was frozen for a nine‐year period
before 2003, our government has increased it by 50 per cent to $10.25 per hour.
We are currently awaiting recommendations on the appropriate timing and scale
of future minimum‐wage increases. We are also helping people get back into the
workforce by removing barriers faced by social assistance recipients.
Our government recently increased access to French‐language postsecondary
education and services to help Ontarians prepare for future jobs.
And in order to reduce costs for consumers, we will consider changes to the
Drive Clean program to ensure that it remains cost neutral over its lifetime.

Foreword
xix
Investing in Modern Infrastructure The second part of our plan is to build more modern infrastructure, helping to
drive economic growth and prosperity. Such an approach attracts private‐sector
investment and spurs the creation of good Ontario jobs.
By investing in our roads, bridges, highways and transit systems, we help to make
our province safer, more competitive and more productive. Just as important,
we boost the quality of life that families enjoy when they are able to spend less
time trapped in traffic.
We need to invest the money necessary to put people to work and modernize our
transit systems, roads, bridges, schools, hospitals and other important
infrastructure projects.
To focus this effort, your government plans to create a special fund dedicated to
the support of our province’s most pressing and important infrastructure projects.
The Trillium Trust would receive revenue gains from asset sales, such as the sale
of our interest in GM shares, and put that money to work by creating jobs and
building an even stronger Ontario.
Building transit is an economic priority — we know that congestion costs our
economy $6 billion annually. This merits specific attention and is already a
cornerstone of your government’s approach to creating jobs and spurring
economic growth. However, new innovative approaches are required to meet
new challenges.
In addition to the work Metrolinx has done devising new revenue tools,
Ontario would be the first province in Canada to develop and sell “Green Bonds.”
The proceeds from these financial instruments would finance environmentally
friendly infrastructure projects across our province — in communities of all sorts
and sizes — while offering Ontarians an innovative way to contribute to the
province’s future and earn a return on their money. The new bonds would
capitalize on the Province’s ability to raise funds at competitive interest rates
and serve as a tool to address critical infrastructure needs, create jobs and
strengthen the economy.

2013 Ontario Economic Outlook and Fiscal Review
xx
Your government is also investing more than $35 billion over the next three
years in capital projects that increase Ontario’s competitiveness and productivity.
These investments will help create and support more than 100,000 jobs on
average per year and make Ontario’s economy stronger for years to come.
Communities across the province will benefit from the building and improvement
of roads, bridges and transit systems as well as schools and hospitals. These will be
modern facilities equipped and constructed to respond to tomorrow’s demands,
including the effects of climate change and extreme weather.
All regions will benefit from this enhanced focus on modernizing our
infrastructure. A special fund was launched to continue to meet the unique needs
of small, rural and northern municipalities. The government is looking at details
of what a permanent fund would look like.
Your government will also work to ensure that these infrastructure projects
are completed on time and on budget, with efficiency and focus. Already,
Infrastructure Ontario, through its alternative financing and procurement (AFP)
model, has helped reduce costs and risks to Ontario in many major projects.
New projects set to be developed through AFP include the Eglinton Crosstown,
Burlington’s Joseph Brant Hospital, Cambridge Memorial Hospital and University
of Ottawa Heart Institute.
This model has been a success. Now we will build on its strengths and enhance
it with provisions to increase the number of Ontario-based companies that
participate in the construction of AFP projects.
Over the last eight years, Ontario companies have developed world-class expertise
in the AFP model. As more countries see the value of this approach, Infrastructure
Ontario will work with Ontario’s international trade offices around the world to
export the expertise of our construction companies, engineers, financial services
industry and architects.

Foreword
xxi
Dynamic and Innovative Business Climate Our plan’s third priority is to foster a dynamic and innovative business climate.
Despite the uncertainties in the global economy, the fundamentals of Ontario’s
economy are strong and our industries are well positioned to take advantage
of new opportunities as they arise.
In order to attract more investment, your government has created a stable and
competitive business climate for jobs and growth by encouraging investment with
favourable tax policies such as eliminating the Capital Tax and lowering Corporate
Income Tax rates. This attracts prosperity, spending and hiring. Your government
also recently introduced legislation to cut the Employer Health Tax for 60,000
small businesses. With this change, almost 90 per cent of Ontario businesses
would not pay this tax. This would help small businesses compete and grow across
our province. That is why we urge all parties in the legislature to pass this Bill as
soon as possible.
Jobs of Tomorrow
There is a heated competition among jurisdictions to attract the jobs and
industries of tomorrow. Ontario is committed to succeed in this effort on behalf of
the countless families who will rely on these good, well-paying jobs in the future.
As the government works to develop important sector strategies for Ontario
industries, it will take targeted measures to encourage new investments from
global information and communications technologies (ICT) companies.
Aerospace is another example of a sector that is increasing its presence in Ontario,
creating good, well-paying jobs. To further accelerate this success, your
government will work with partners to offer enhanced training for this sector.
For example, Centennial College will partner with Bombardier, Canada’s leading
aerospace manufacturer, on a new facility at Downsview Park.
In addition, Niagara College will expand its existing advanced manufacturing
program to serve more businesses.
These initiatives will help create the next generation of manufacturing in
the province.

2013 Ontario Economic Outlook and Fiscal Review
xxii
Two months ago, Ontario opened its first law school and school of architecture
in more than 40 years — both in northern Ontario. To continue helping young
people find their future careers, Lakehead University in Thunder Bay opened its
law school and Laurentian University in Sudbury opened its school of architecture.
Ontario also has an innovative agri-food industry that supports more than
740,000 jobs across the province. We have recently proposed a Local Food Act
that, if passed, would celebrate and support the good things grown, harvested
and made in Ontario.
To encourage entrepreneurial activity, we are also reinvesting in Communitech,
an innovation hub that anchors the Waterloo Region’s vibrant technology cluster.
Through targeted mentorship and access to seed investment, Communitech will
help to grow Ontario technology companies into global players.
More Competitive Businesses
Your government wants to help businesses become even more competitive
by encouraging them to invest in new machinery and equipment. Recent research
shows that many companies are not taking advantage of potential opportunities
to innovate, improve productivity and expand.
We will consider measures, including some taken in other places in the world to
promote capital investment — including changes to research and development
(R&D) tax credits to reward incremental R&D spending and a new “pay or play”
incentive where a special corporate tax could be earned back through investments
in new equipment, R&D or training.
Your government will also partner with industry to measure and report
investments in innovation, training and technology, and showcase top performers
against international benchmarks.
Your government will take targeted measures to encourage new investments
from global companies with strength in IT, manufacturing and R&D. And we will
continue to capitalize on our emerging growth opportunities at home and around
the globe.

Foreword
xxiii
Our government is also helping communities through its economic
development funds:
For example:
In North Bay, the Northern Ontario Heritage Fund invested in Cementation,
creating 10 jobs;
In Kingston, the Eastern Ontario Development Fund invested in MetalCraft
Marine, creating nearly 40 jobs; and
In Woodstock, the Southwestern Ontario Development Fund invested in North
American Stamping Group, creating almost 50 jobs and protecting 210.
The Need for a Committed Federal Partner Building a prosperous and fair society requires collaboration among all orders
of government. The results of successful partnerships are making a positive
difference to Ontarians.
Unfortunately, in an effort to balance the federal budget, the federal government
has been making a series of changes to programs and funding that negatively
affect Ontario and other provinces.
These decisions often involve cutbacks in financial support and offload many
responsibilities onto provinces and territories without proper consultation or
compensation, including in such areas as public transit, skills training for workers,
and support for our mining sector in the north and the Ring of Fire.
The federal government is announcing new immigration allocations to provinces
through the Provincial Nominee Program. An increase would be a positive step
forward. Our allocation has been too low and we have not had the same flexibility
in the program as other provinces to meet changing labour market needs.
We need a committed federal partner to work with us to enhance the quality of
life for all Ontario individuals and the competitiveness of Ontario’s businesses.

2013 Ontario
xxiv
ConclusThis provinc
One Ontario
public servic
Your govern
path. By inve
and fosterin
in Ontario.
We remain o
the economy
We cannot c
As Ontarians
employees;
We will work
Your govern
infrastructur
in an uncerta
families and
That is our p
We are takin
to grow a str
The Honoura
Minister of F
o Economic O
sion e and its peo
o — spurring e
ces and helpin
ment has a fa
esting in our p
g a dynamic b
on track to ba
y and protect
cut our way to
s, we will not
rural and urb
k together as
ment knows
re, and suppo
ain global eco
helps to bala
plan for jobs a
ng positive, p
ronger Ontar
able Charles S
Finance
Outlook and F
ple are strong
economic gro
ng our familie
air and respo
people, build
business clim
alance the bu
ting vital pub
o prosperity.
create false d
ban; north and
One.
that we must
ort a dynamic
onomy, to pro
ance our prov
and growth.
ractical steps
io, One Ontar
Sousa
Fiscal Review
ger when we
owth, creating
es.
nsible approa
ing new and
ate, we can a
dget by 2017
lic services ou
Nor can we t
divisions betw
d south.
t invest strate
c and innovati
omote growt
vince’s budge
to grow the
rio.
work togeth
g new jobs, st
ach to pursue
more modern
achieve even
7–18, but we
ur top priority
tax our way to
ween employ
egically in our
ive business c
h that helps s
et.
economy and
er as
trengthening
e precisely thi
n infrastructu
greater prosp
will make gro
y.
o growth.
yers and
r people, in o
climate, parti
support Onta
d create jobs,
is
ure,
perity
owing
our
icularly
ario
,

Chapter I
Creating Jobs and Growing the Economy


Chapter I: Creating Jobs and Growing the Economy
3
Highlights Section A: Jobs and Growth
Investing in People
The government is committed to help Ontarians save for a strong and secure
retirement and is leading the way by working to secure agreement among the
provinces and the federal government on enhancing the Canada Pension
Plan. If an agreement cannot be reached, the Province will move forward
with a “made in Ontario” solution.
Implementing the Ontario Youth Jobs Strategy will help 30,000 young people
gain the benefit of on‐the‐job workplace experience, introduce them to
employers and offer a head start on their future careers.
Changes will help protect consumers and make certain services, such as cell
phone and wireless service contracts, the Drive Clean program and auto
insurance, more affordable.
The government will provide support to Ontarians in greatest need and
ensure that they can participate in the economy to their full potential by
working to better match skilled workers with employment and releasing a
second five‐year Poverty Reduction Strategy that would focus on supporting
attachment to the labour market.
Investing in Modern Infrastructure
The introduction of green bonds and Ontario’s new Trillium Trust, and
support for increased investment by pension plans in public infrastructure
projects, would help address congestion, increase private‐sector productivity
and improve the quality of life for Ontarians.
The government will introduce legislation that would require the Province to
table a 10‐year infrastructure plan in the legislature, supporting job creation,
training opportunities and economic growth.

2013 Ontario Economic Outlook and Fiscal Review
4
Building on Ontario’s status as a global leader for alternative financing and
procurement (AFP) projects, the government will enhance its AFP approach
to improve the delivery of large and complex infrastructure projects and
increase the number of Ontario‐based companies that participate in the
construction of AFP projects.
Supporting a Dynamic and Innovative Business Climate
The government will build on Ontario’s strong fundamentals and encourage
investment by partnering with industry and research organizations to help
Ontario companies become more competitive and productive in order to
create jobs, innovate and export.
Building partnerships among colleges, universities and industry leaders
to connect Ontario’s highly skilled workforce with innovative businesses,
facilitate learning and training, and encourage new investment,
will support growth in key sectors such as aerospace and information
and communications technologies.
The government is proposing to support small businesses by cutting
the Employer Health Tax, helping 60,000 small employers save money,
including 12,000 that would no longer pay this tax.
Section B: Managing Responsibly
Continuing global uncertainty is slowing Ontario’s economic and revenue
growth, but the government will continue to protect investments in jobs,
growth and families ahead of short‐term targets.
The government has taken firm, effective measures to reduce spending
growth, allowing the Province to overachieve on its deficit‐reduction targets,
and remains on track to balance the budget by 2017–18.
Ontario has the lowest per‐capita program spending in Canada and for
the last two years has held growth in overall program spending below
one per cent. The 2012–2013 Public Accounts of Ontario reported that
program expense in 2012–13 was lower than the previous year for the
first time in more than a decade.
Chapter I: Creating Jobs and Growing the Economy
5
To maintain the government’s approach to managing program spending
growth, the government is moving forward with 60 per cent of the
recommendations of the Commission on the Reform of Ontario’s
Public Services and will analyze the remaining recommendations.
The government has taken steps to make the Ontario Public Service (OPS)
more efficient and reduce its size through attrition or other measures.
By March 31, 2012, the government had achieved the objective announced in
the 2009 Budget of a five per cent reduction of full‐time equivalent staff and
is well on its way towards a further reduction of 1,500 full‐time equivalent
staff by March 31, 2014.
With over half of all government spending going to salaries and benefits,
the government has taken steps to manage public‐sector compensation
costs. Ontario public‐sector wage settlements are below the growth of
those in the private sector, municipal sector and federal public sector.
The government is also reviewing executive compensation for the
broader public sector.
The government has taken action to increase the accountability of
government agencies by strengthening oversight and enhancing the
governance of classified agencies, and will begin benchmarking government
enterprises such as the LCBO, Ontario Lottery and Gaming Corporation,
Ontario Power Generation, Hydro One and other agencies.
The establishment of the Financial Accountability Officer will ensure that
the legislature and Ontarians have the financial information necessary to
understand the state of the Province’s finances.

2013 Ontario Economic Outlook and Fiscal Review
6

Chapter I: Creating Jobs and Growing the Economy
7
Section A: Jobs and Growth
Introduction Ontario families have weathered the global economic recession with strength
and resolve. As a result, Ontario is emerging stronger than ever. The recession
has shown that government has an important role to play in creating a climate
of economic growth and helping people in their everyday lives. To create jobs
and protect key public services that Ontarians rely on, the government is
implementing a plan that will drive economic growth by:
Investing in people;
Investing in modern infrastructure; and
Supporting a dynamic and innovative business climate.
Ontario’s plan will build on its competitive strengths. It will increase job creation
in high potential growth sectors while supporting mature sectors so that they can
continue to be competitive. It will also help entrepreneurs to access the tools they
need for success in order to create more innovative companies and will help give
them access to emerging markets.
Responsible Management of Program Expense
The government remains on track to balance the budget by 2017–18 in a fair
and responsible way. This will mean new strategic investments to spur growth,
create jobs, strengthen services and help families. Fiscal discipline is fundamental
to the government’s approach. The government is making responsible choices
that reflect the state of the world around us. Across‐the‐board cuts would hurt
Ontario families, impact economic growth, damage key public services and
result in substantial job losses. On the other hand, reckless tax hikes would hurt
job‐creating businesses and, by direct extension, Ontario families. Instead, the
government remains committed to controlling spending by transforming the
delivery of services.
2013 Ontario Economic Outlook and Fiscal Review
8
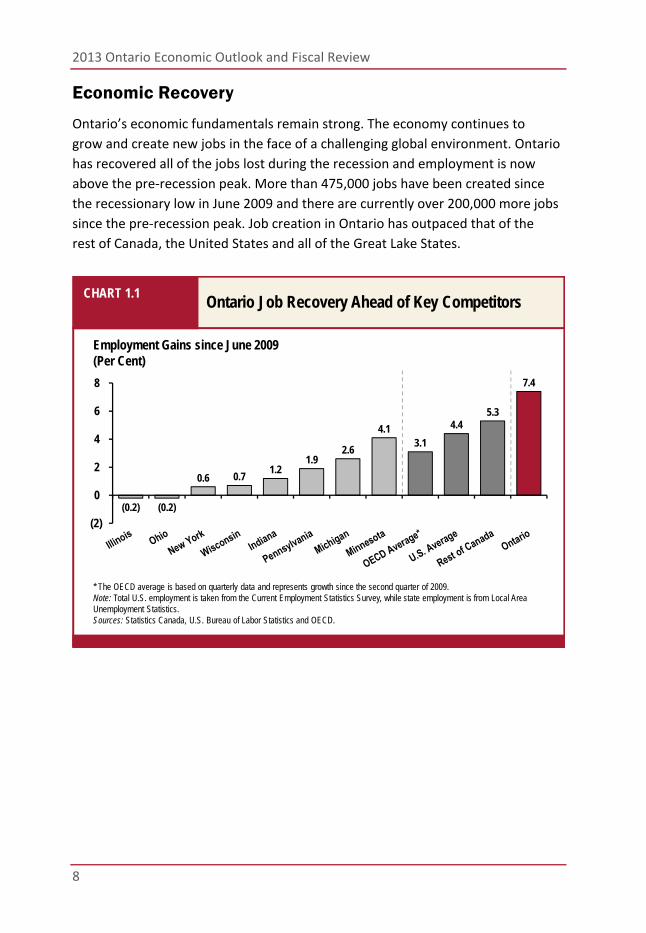
Economic Recovery
Ontario’s economic fundamentals remain strong. The economy continues to
grow and create new jobs in the face of a challenging global environment. Ontario
has recovered all of the jobs lost during the recession and employment is now
above the pre‐recession peak. More than 475,000 jobs have been created since
the recessionary low in June 2009 and there are currently over 200,000 more jobs
since the pre‐recession peak. Job creation in Ontario has outpaced that of the
rest of Canada, the United States and all of the Great Lake States.
* The OECD average is based on quarterly data and represents growth since the second quarter of 2009.Note: Total U.S. employment is taken from the Current Employment Statistics Survey, while state employment is from Local Area Unemployment Statistics.Sources: Statistics Canada, U.S. Bureau of Labor Statistics and OECD.
Employment Gains since June 2009(Per Cent)
Ontario Job Recovery Ahead of Key CompetitorsCHART 1.1
(0.2) (0.2)
0.6 0.7 1.2
1.9 2.6
4.1 3.1
4.4 5.3
7.4
(2)
0
2
4
6
8

Chapter I: Creating Jobs and Growing the Economy
9
Real gross domestic product (GDP), an important measure of economic growth,
has increased 8.9 per cent since the end of the recession and is more than
three per cent higher than its pre‐recession level. But given a fragile global
recovery, many businesses, communities and people continue to feel vulnerable
to economic change, and are uncertain about the future.
That is why the government has a bold plan to create jobs and grow the economy
across the entire province. Through this approach, the government will help
ensure that everyone has the opportunity to contribute to a stronger Ontario,
One Ontario.
Ontario’s economic fundamentals are strong:
Well-educated, highly skilled workforce — 65 per cent of Ontarians have a postsecondary education, among the highest rates in the world.
Sound financial system — Ontario’s financial sector is one of the strongest in the world.
Competitive tax system — Since 2009, the marginal effective tax rate on new business investment in Ontario has been cut in half.
Fostering an environment of innovation — Leading universities and research centres support the commercialization of innovation.
Effective public services — Strong universal health care and elementary and secondary education.

2013 Ontario Economic Outlook and Fiscal Review
10
1. Investing in People Leading the Way to Secure Retirement
Long‐term savings and investment are critical to ensuring Ontarians prepare
financially for their retirement. Many Ontarians today are having difficulty putting
aside sufficient savings for retirement and are worried about their future
financial security.
The government is committed to help Ontarians save for a strong and secure
retirement so they are able to enjoy their retirement years. It will assist working
Ontarians in planning for their retirement, whether they rely on retirement
income provided through the Canada Pension Plan (CPP), are accumulating
retirement savings independently, or have access to a workplace pension plan.
This commitment will ease the financial pressure on their children and
grandchildren.
The CPP forms the foundation of the nation’s retirement income system.
An enhancement to the CPP is critical to ensuring that Ontarians, particularly
middle‐income earners, have greater financial security in retirement.
The government is leading the way by working to secure agreement among
provinces and the federal government on enhancing the CPP. If an agreement
cannot be reached, Ontario will move forward with a “made in Ontario” solution.
The government will also implement innovative retirement savings models such
as pooled registered pension plans (PRPPs) to promote increased retirement
savings in the province. Before introducing legislation, it will consult on an Ontario
framework for PRPPs to provide employees, particularly those working in small
and medium‐sized businesses, with a simplified, low‐cost retirement
savings vehicle.
For Ontarians with self‐directed retirement savings, such as registered retirement
savings plans (RRSPs), Ontario will work to reduce the cost of investing and
provide individuals with the help they need to make informed decisions about
financial savings. The government will examine recommendations by the Ontario
Securities Commission (OSC), which is looking at the structure of mutual fund fees,
and consider more tailored regulation of financial advisers and planners.

Chapter I: Creating Jobs and Growing the Economy
11
Recognizing recent funding challenges, the government will also help those
with defined benefit (DB) pension plans by implementing new and revised
rules to ensure Ontario’s private‐sector DB plans remain financially sound and
public‐sector DB plans remain affordable and sustainable. (See Chapter V:
Retirement Income Security for more details.)
Connecting People to Tomorrow’s Jobs
To ensure all Ontarians can participate in the economy to their full potential,
Ontario is continuing to take action by helping youth and workers needing
additional training and support, and providing additional support for those
in greatest need.
Implementation of the Ontario Youth Jobs Strategy
The government created the Ontario Youth Jobs Strategy to help young people
find jobs, start their own businesses and gain valuable skills. A key element of the
strategy, the Youth Employment Fund, was launched in September 2013 through
the Province’s network of employment services across Ontario. The program gives
employers incentives to offer four‐ to six‐month job and training placements for
young people of up to $6,800 to help cover wage and training costs, and up to
$1,000 to help young workers pay for job‐related costs like tools and
transportation to work, with 2,000 jobs already created.
This initiative builds on Ontario’s investments totalling over $1 billion per year in
employment and training services under Employment Ontario. Youth aged 15 to
29 accounted for 35 per cent of Employment Ontario participants in 2012.

2013 Ontario Economic Outlook and Fiscal Review
12
TABLE 1.1 Ontario Youth Jobs Strategy — $295 Million over Two Years Y
ou
th E
mp
loym
ent
Ontario Youth Employment Fund
Launched in September, this fund will provide employment opportunities for about 25,000 youth across Ontario.
The fund helps employers offer four- to six-month job training placements for youth.
Ontario Youth Skills
Connections Fund
Will partner about 3,000 young people with industry, not-for-profit and academic leaders to help them build career skills and secure jobs.
You
th E
ntr
epre
neu
rsh
ip
Ontario Youth Innovation Fund
Will provide about 2,000 training and employment opportunities for graduate students and postgraduate students, and help up to 1,000 postsecondary students launch startups by funding campus-linked business accelerators.
Ontario Youth Entrepreneurship
Fund
Will generate about 6,000 mentorship and job opportunities by increasing funding for existing programs, such as Summer Company, and new programs to support the growth of youth-led companies with training, mentorship and seed financing.
Connecting Companies to Workers
The Ministry of Training, Colleges and Universities’ Rapid Re‐employment and
Training Service (RRTS) currently provides immediate response to announced
layoffs, by connecting individuals with the relevant and appropriate Employment
Ontario services that will help them regain employment. This response is always
adapted to meet the unique circumstances of each situation.
The capacity will be expanded to better match skilled workers seeking
employment with either existing employers expanding or new companies
investing in Ontario. This would contribute to Ontario’s renewed focus on
engaging employers across all regions.

Chapter I: Creating Jobs and Growing the Economy
13
Reducing Poverty Helps Strengthen the Economy
Ontario’s economy is strengthened when everyone has the opportunity to achieve
their full potential. Strategic investments in education, health and income support
help reduce reliance on social services, build the workforce and strengthen
Ontario’s economy. That is why the government introduced the first Poverty
Reduction Strategy, Breaking the Cycle, in 2008.
Ontario is making progress on its Poverty Reduction Strategy. The number of
children living in poverty in Ontario has dropped 47,000 since 2008, a decline of
11.4 per cent. This reduction in poverty happened as Ontario’s economy was
battered by the global financial crisis and ensuing recession. Without the Poverty
Reduction Strategy, an estimated 15.9 per cent of Ontario children would have
been living in low‐income families in 2011. As a result of the Strategy, the actual
child poverty rate was 13.6 per cent.
Building on this success, Ontario will release its second five‐year plan in the
coming months, with a focus on helping support attachment to the labour market.
22.524.9
26.1
22.2
15.2 15.416.7 15.915.2 14.6 13.8 13.6
0
5
10
15
20
25
30
2008 2009 2010 2011
Child Poverty Under No Government Transfers ScenarioChild Poverty Under No Poverty Reduction Strategy ScenarioActual Child Poverty
Note: 2010 and 2011 include the sales tax transition benefit.Source: Ontario Ministry of Finance, based on Statistics Canada’s Survey of Labour and Income Dynamics.
Per Cent
Poverty Reduction Strategy Helps Lower Child Poverty
CHART 1.2

2013 Ontario Economic Outlook and Fiscal Review
14
While the minimum wage was frozen for a nine‐year period, before 2003,
the government has since increased it by 50 per cent to $10.25 per hour.
The Province has also struck a Panel that will provide recommendations
on the appropriate timing and scale of future minimum‐wage increases.
Social assistance reform that helps remove barriers to employment can make a
meaningful and lasting improvement in economic well‐being. The 2013 Budget
announced a new $200 monthly earnings exemption for those receiving Ontario
Works (OW) and Ontario Disability Support Program (ODSP) supports to
encourage employment. In addition, OW and ODSP recipients are able to keep
50 cents for every $1 of employment earnings above $200.
The government will continue to help people get back into the workforce by
removing barriers faced by social assistance recipients.
21st-Century Learning
Creative, Innovative and Entrepreneurial Learning
Ontario students continue to lead the way in educational excellence, supported
by the province’s world‐class schools. Investments in education will continue
to build on student achievement, support innovative, technology‐enabled
teaching and learning practices, and integrate the higher‐order skills such as
critical thinking, communication, collaboration and entrepreneurship that young
students need to succeed in the 21st‐century global labour market.
McKinsey & Company Cites Ontario’s Education System as One of the Best in the World In the 2010 McKinsey report “How the World’s Most Improved School Systems Keep Getting Better,” Ontario was recognized as being near the top among 20 school systems that “have registered significant, sustained, and widespread student outcome gains.” It was rated as “great” and on a trajectory to “excellent.” Then, in a subsequent McKinsey report titled “Capturing the Leadership Premium” (2010), Ontario was one of eight systems selected for review as a result of strong performance on international assessments and “good practices in school leadership.”

Chapter I: Creating Jobs and Growing the Economy
15
Ontario remains committed to preparing its youngest students for a productive
future. Full‐day kindergarten gives children a better start in school and prepares
them for success in Grade 1 and beyond.
This school year, full‐day kindergarten is available to about 184,000 four‐ and
five‐year‐olds in approximately 2,600 schools. When the program is fully
implemented in September 2014, all four‐ and five‐year‐olds will have access,
benefiting approximately 265,000 children and saving families up to $6,500
per child per year on child care costs.
In October 2013, the Ministry of Education released the findings of a study
conducted in partnership with Queen’s and McMaster universities. The evaluation
provides preliminary evidence that full‐day kindergarten is having a favourable
impact on four‐ and five‐year‐olds in Ontario. The study showed that children
with two years of full‐day kindergarten instruction had reduced risks in social
competence development, in language and cognitive development, and in
communication skills and general knowledge development as compared to
children with no full‐day kindergarten instruction.
To remain competitive in the global economy, the government’s commitment and
investments must continue to foster innovation in the education sector to drive
towards even higher levels of student achievement. The government continues
to consult with the public on moving Ontario’s education system from “great to
excellent.” This vision will guide the next phase of Ontario’s education strategy.

2013 Ontario Economic Outlook and Fiscal Review
16
Ontario continues to make significant improvements in student achievement.
In 2011–12, the high school graduation rate increased to 83 per cent, an increase of 15 percentage points over the 2003–04 level of 68 per cent. This means 115,500 more students graduated than had the rate remained at the 2003–04 level.
In 2002–03, only 54 per cent of children in Grades 3 and 6 were meeting the provincial standard in literacy and numeracy. Today, that number is 71 per cent, an increase of 17 percentage points. This means over 150,000 more elementary students are reaching the standard than would have in 2002–03.
The government expects to conclude formal consultations on Building the Next Phase in Ontario’s Education Strategy in November 2013 and anticipates launching an updated vision in early 2014.
Postsecondary Education Transformation and Training
Education is the cornerstone of the government’s economic plan. Ontario colleges
and universities prepare the next generation for good jobs. Recognizing these
benefits, Ontario has introduced a number of initiatives resulting in significant
achievements to boost higher education.
The government has improved access for low‐ and middle‐income families with
the introduction of the 30% Off Ontario Tuition grant in 2011–12. About 230,000
students received this grant in 2012–13, up from 207,000 the previous year.
Further proposed enhancements include better alignment of tuition fee deadlines
with Ontario Student Assistance Program (OSAP) payments, so that students do
not face penalties for late payment while they are waiting for their student
assistance to arrive.
The 2013 Ontario Budget reaffirmed the government’s commitment to integrate
employment and training services across government with Employment Ontario.
This will give individuals and employers improved access to the services they
need — whether it is training to improve skills, opportunities to gain work
experience, or strategies and tools to recruit local talent.
The Ministry of Training, Colleges and Universities continues to develop options
on how best to implement this initiative. The government is also engaging key
stakeholders to better integrate the programs.

Chapter I: Creating Jobs and Growing the Economy
17
Over 120,000 apprentices are learning a trade today — more than double
the number in 2002–03. The Ontario government continues to invest in the
apprenticeship system to ensure that the province has the skilled workers it
needs, including supports and incentives to increase apprenticeship completions.
The Ontario government is working with colleges, universities, students and
other stakeholders to build a sustainable postsecondary education system that
supports job creation, enhanced productivity and better collaboration with
regional communities.
Key government priorities in creating a sustainable postsecondary education
system include:
Improved collaboration with industry on program development and
applied research;
A differentiated postsecondary education system that will place a premium
on collaboration between institutions to support the government’s vision and
priorities for postsecondary education, and support institutions to build on
their distinctive strengths; and
Improved credit transfers between institutions so students have more options.
Expanding French Postsecondary Education
Ontario recently announced more opportunities to study in French and prepare
for future jobs. The province’s Action Plan for French-language Postsecondary
Education will increase access to French-language postsecondary education and
services in central and southwestern Ontario. Ontario is providing $16.5 million
to help universities and colleges expand their French-language programs and
services, including expansions already underway at York University's Glendon
College, Collège Boréal and La Cité collégiale in the Greater Toronto Area.
The government has increased funding to French-language postsecondary
education by more than 62 per cent since 2003–04.

2013 Ontario Economic Outlook and Fiscal Review
18
Supporting Northern Ontario Students
Ontario is committed to making smart investments that will help northern
Ontario’s economy grow and create more jobs. The Ontario government has
invested $1.5 million in Lakehead University’s new Faculty of Law and $21 million
in Laurentian University’s new School of Architecture, northern Ontario’s first law
and architecture schools. Lakehead’s law school welcomed its inaugural class in
September 2013. The first phase of the new School of Architecture at Laurentian
was completed in 2013.
These schools will help northern Ontario students enter the law and architecture
professions, and study closer to their families and the communities where they
grew up.
Increasing Access to Health Care
A healthy, well-educated population leads to a stronger economy. More doctors
and nurses mean more people can access family health care when they need it.
The government has made significant investments to increase the number and
availability of primary care providers in the province, including initiatives to
support the training and employment of physicians and nurses, such as:
Creating four new medical education campuses in St. Catharines,
Kitchener-Waterloo, Windsor and Mississauga, which are successfully
training doctors;
Opening the Northern Ontario School of Medicine in 2005 — the first new
medical school in Canada in over 30 years. As of 2012, the school was training
a total of 249 undergraduate medical students;
Expanding opportunities for International Medical Graduates (IMGs) to
practise in the province. Ontario currently offers more training positions and
assessments for IMGs than all other provinces combined. IMGs account for
approximately 25 per cent of the province’s physician workforce;
Continuing to support nurses to work to their full scope of practice so patients
can get the services they need; and
Creating the Nursing Career OrIENtation Initiative, an employment initiative to
help internationally educated nurses transition to practise full time in Ontario.

Chapter I: Creating Jobs and Growing the Economy
19
Keeping Seniors Active
Seniors helped build this province. Through Ontario’s Action Plan for Seniors,
released earlier this year, the government is helping seniors stay active, healthy
and connected to the community. It is building on this commitment by announcing
Ontario’s first-ever grants program solely dedicated to seniors. This $500,000
program will help seniors participate in more community activities, continue their
learning in areas like technology and financial literacy, and develop a strong sense
of social inclusion and community participation. This grant program is another
step towards making Ontario the best place to age, to live longer and to live well.
Protecting Consumers
The government has recently introduced changes that will help protect consumers
and make certain services more affordable.
Stronger Rights for Wireless Consumers
Cell phones are the new utilities. They are not luxuries, they are necessities of
modern life. Wireless costs are too high in Ontario. Ontario is committed to
providing consumers with clear information and fewer surprises when they enter
into cell phone and wireless services contracts.
Ontario is moving forward to protect wireless and cell phone customers with
the passage of the Wireless Services Agreements Act, 2013. The new legislation
will benefit wireless consumers by:
Limiting the cost associated with cancelling a contract;
Requiring contracts to be written in plain, easy-to-understand language;
Ensuring contracts clearly spell out which services come with the basic fee,
and which would result in a higher bill; and
Showing all-inclusive prices in wireless services pricing and advertisements.
These reforms will protect the rights of consumers while furthering the
government’s commitment to building a strong economy and a fair, safe and
informed marketplace.
2013 Ontario Economic Outlook and Fiscal Review
20
Stronger Rights and More Protection for Consumers
Educating and protecting Ontario consumers is part of the government’s plan
to ensure a fair marketplace and help people in their everyday lives. If passed,
the government’s proposed Bill 55, Stronger Protection for Ontario Consumers
Act, 2013, would:
Curb aggressive door-to-door sales tactics on the sale of water heaters;
Protect vulnerable, indebted consumers against the abusive practices of some
companies offering debt settlement services;
Help protect home buyers and sellers in real estate bidding; and
Give home buyers and sellers more power to negotiate both fees and
commissions when working with a real estate professional.
Protecting Ontario’s Consumers and Investors
Ontario’s capital markets are well regulated and foster safe, stable and attractive
investment opportunities. The government remains committed to modernizing
securities laws and the regulatory framework to ensure sound and efficient
markets that help investors and savers work towards their financial objectives.
Financial literacy helps Ontarians make informed investment decisions.
The government encourages individuals of all ages to plan for their economic
future and will continue to work with its partners, including the Ontario Securities
Commission (OSC), to promote the financial literacy of all Ontarians. The Investor
Education Fund, which is funded through monetary settlements and fines resulting
from OSC enforcement proceedings, has created and maintains a website with the
most popular financial material of its kind in Canada.
The OSC is currently engaged in a number of high profile consultations affecting
investors and capital markets. One such OSC consultation relates to the
examination of the structure of mutual fund fees (including trailer fees) in Canada
to see whether there are investor protection or fairness issues, and to determine
whether any regulatory responses are needed.

Chapter I: Creating Jobs and Growing the Economy
21
Financial advisers, including financial planners, also play a significant role in
the savings and investment decisions of many individuals and provide a broad
range of available financial planning services. People who seek the assistance
of financial planners expect access to sound, professional advice to ensure that
their investment decisions best serve their financial goals. The government will
investigate the merits of proceeding with more tailored regulation of financial
planners. It will consider the appropriate regulatory framework for doing so,
including possible reforms put forward by industry organizations.
Renewing the Drive Clean Program
In the coming months, the Ministry of the Environment will announce a reduction
in Drive Clean fees paid by consumers to ensure the program remains revenue
neutral over its lifetime. The Drive Clean program protects public health by
reducing smog-causing emissions by more than a third every year, removing
335,000 tonnes of smog-causing pollutants from the air since 1999.

2013 Ontario Economic Outlook and Fiscal Review
22
Cutting Auto Insurance Rates
As part of the government’s plan to make everyday life more affordable, the
government announced a multi-faceted plan, in August 2013, to reduce Ontario
auto insurance rates by 15 per cent on average within the next two years —
with an overall average eight per cent reduction target by August 2014.
Ontario’s Auto Insurance Cost and Rate Reduction Strategy
To help achieve the average rate reduction, the government gave the Financial
Services Commission of Ontario (FSCO) the authority to require insurers to re-file
new rates for FSCO approval. Insurers have started to file new rates with FSCO
as a result of this new authority. The government also made the Superintendent
of FSCO’s guidelines binding to help reduce unexpected costs.
The government expects that the January 2014 report on approved rates from
FSCO will provide the first evidence that its strategy to reduce costs and rates
is working.
Transforming the auto insurance dispute resolution system is another key element
of the government’s Cost and Rate Reduction Strategy. The Province appointed
former Associate Chief Justice of the Superior Court of Justice, the Honourable
J. Douglas Cunningham, to lead a review and make recommendations on how to
make this a more efficient and effective system. An interim report is expected in
the fall, in which the Honourable J.D. Cunningham will outline preliminary
recommendations as well as a framework for possible legislation towards a new
auto insurance dispute resolution system. Stakeholder consultations on the
recommended legislative direction will be held in the coming months in
preparation for the final report.
The government also committed to protecting consumers by continuing to ensure
that insurer rate filings include rates that reward safe drivers and by helping to
ensure that all regions of Ontario benefit fairly from cost savings.
Chapter I: Creating Jobs and Growing the Economy
23
Tackling Fraud
The Ontario government is also continuing to crack down on auto insurance
fraud to further benefit consumers. The government has already taken a number
of actions to address key recommendations made by the Auto Insurance
Anti-Fraud Task Force, such as a framework for licensing health clinics in the
auto insurance system, and expanding the regulator’s investigation and
enforcement authority.
The Task Force identified consumer engagement and education as an important
part of the fight against fraud. FSCO has launched an Anti-Fraud Hotline
at 1-855-5TIP-NOW that will allow the public to play a greater role in
combating fraud. Ontario has also added important information to the Ministry
of Transportation’s Driver’s Handbook to help new drivers understand and
prevent auto insurance fraud.
The government is also actively working to develop a province-wide system to
oversee the towing industry. In the winter of 2014, the government will work
closely with the sector, the Association of Municipalities of Ontario, the City of
Toronto and other key stakeholders on the development of a proposed model.
As part of this work, the government will also look at the issues of vehicle storage
and collision repair practices.
In addition, the insurance industry is working to fight fraud. It recently announced
the creation of Canadian National Insurance Crime Services (CANATICS), a new
not-for-profit organization that will use data analytics to identify suspicious claims.
The Task Force supported the use of data analytics to combat auto insurance fraud
and recommended the creation of such an organization in its final report.

2013 Ontario Economic Outlook and Fiscal Review
24
Increasing Transparency and Accountability
To increase the transparency and accountability of the system, the government
will provide independent annual public reports on progress made on the Cost and
Rate Reduction Strategy.
The government is taking strong action to make auto insurance more affordable
for the province’s over nine million drivers. However, the insurance industry must
also do more. For example, the industry needs to review its claims management
practices regularly to ensure that it is operating as effectively and efficiently
as possible.
Ensuring market competition in the provision of auto insurance will continue to
play an important role in keeping auto insurance rates down.
The government will continue to consult with stakeholders on any possible new
measures that can work to reduce costs and lower auto insurance rates
for consumers.

Chapter I: Creating Jobs and Growing the Economy
25
2. Investing in Modern Infrastructure Building modern public infrastructure is a key driver of economic growth,
prosperity and job creation.
Infrastructure investments help address congestion, increase private-sector
productivity, and improve the quality of life for Ontarians. Public transit and
integrated transportation networks support economic growth by giving Ontarians
better access to jobs, attracting business investment, helping to prevent
bottlenecks and expanding access to suppliers, buyers and skilled workers.
Investments in health infrastructure, schools and postsecondary facilities support
the delivery of high quality health care and provide better places to learn.
The government is introducing three new initiatives to further invest in
infrastructure priorities such as public transit, highways, hospitals and schools:
Ontario’s New Trillium Trust: The government would create the Trillium Trust
where revenue gains from asset sales would be placed in a consolidated trust
and used to finance key public infrastructure priorities.
Green Bonds: The government would make Ontario the first province in
Canada to develop and sell green bonds. Green bonds are a tool to raise
capital for projects with specific environmental benefits. The proceeds from
green bonds would be invested in transit and other environmentally friendly
infrastructure projects across the province and allow Ontarians to directly
invest in the future of their province.
Pension Plan Investment in Ontario Infrastructure: The government will
propose regulations that would allow pension plans to further invest in local
infrastructure by exempting plans’ investments in certain Ontario public
infrastructure projects from the “30 per cent” pension investment rule.
This rule prohibits Ontario pension plans from owning more than 30 per cent
of the voting shares of a single corporation, restricting pension plans from
taking an active role in infrastructure and other investments. The government
is proposing to remove this obstacle to investments in Ontario public
infrastructure projects, which could represent a significant new source
of capital to support economic growth and job creation in Ontario.

2013 Ontario Economic Outlook and Fiscal Review
26
Public Infrastructure Benefits Ontario’s Economy
Economic Impacts of Public Infrastructure in Ontario A growing body of research demonstrates the significant economic benefits of public infrastructure.
A 2013 Conference Board of Canada report cited Ontario’s current and planned real infrastructure investments from 2006 to 2014, and reported that:
each $100 million of public infrastructure investment in Ontario boosts gross domestic product by $114 million, particularly in the construction and manufacturing sectors; and
public infrastructure adds over $1,000 to the average annual income of Ontarians by 2014 and lowers the unemployment rate by about one percentage point compared to what it would have been in the absence of these investments.
A 2009 Statistics Canada report estimated that roughly 50 per cent of Canada’s growth in productivity from 1962 to 2006 was the result of public infrastructure.
A 2008 Statistics Canada report stated that public infrastructure spending decreases business costs by 11 cents on the dollar and manufacturing costs specifically by 27 cents on average.
Chapter I: Creating Jobs and Growing the Economy
27
The Province has invested more than $85 billion in public infrastructure since 2003
to reverse the underinvestment that had accumulated over several previous
decades. All regions of Ontario have benefited from these investments,
which have resulted in:
more than 7,900 kilometres of provincial highways built or repaired in Ontario,
including over 4,000 kilometres in northern Ontario;
more than 950 bridges constructed or repaired on provincial highways;
over 100 major hospital projects initiated, including 40 under construction
or in planning; and
610 new schools opened, planned, or under construction.
The Province will continue to make significant investments in infrastructure of
more than $35 billion over the next three years, including about $13.5 billion in
2013–14. Planned infrastructure investments over the next three years would
support well over 100,000 jobs on average each year in construction and related
industries across the province.
Given the importance of Ontario’s economy to Canada, Ontario believes
the federal government needs to be a full partner in strategic infrastructure
investments through adequate and predictable funding that is coordinated
and consistent with provincial infrastructure plans. (See Chapter IV: The Need
for a Committed Federal Partner for more details.)

2013 Ontario Economic Outlook and Fiscal Review
28
Introducing Ontario’s First Long-Term Infrastructure Legislation
Building on the government’s commitment to support the economy through
infrastructure investments, the Province will introduce legislation that, if passed,
would require the government to table a 10-year infrastructure plan in the
legislature. This would support job creation and training opportunities,
economic growth and protection of the environment.
Making Strategic Investments in Infrastructure
Building Public Transit
Investments in public transit help manage congestion, reduce transportation
costs, and improve the livability of cities. The Province is investing over $3 billion
in transit infrastructure in 2013–14.
This year, Ontario enacted legislation to make the Dedicated Gas Tax Program
permanent. This program provides two cents per litre of gas tax revenue to help
municipalities improve public transit. These revenues will support 96 municipal
transit systems serving 130 communities, and represent an investment of
$2.6 billion since 2004. This funding is helping municipalities expand and improve
public transit infrastructure, increase accessibility, buy more conventional and
specialized transit vehicles, add more routes and extend hours of service.
The 2013 Budget also announced increasing investments in GO Transit over
the next 10 years to address underserviced areas, meet projected demand for
peak-hour service, and help lay the foundation for major initiatives included in
Metrolinx’s regional transportation plan, The Big Move. In June, the Province
announced that GO Train service along the Lakeshore line between Aldershot
and Oshawa will run every 30 minutes, seven days a week. This adds 263 new
train trips in total every week along the line, offering greater flexibility to
commuters in the Greater Toronto and Hamilton Area (GTHA).
In May 2013, Metrolinx made recommendations to support the funding and
implementation of projects under The Big Move, estimated at a capital cost of
$50 billion. There will also be associated financing costs and, as these projects
come into service, they will require ongoing funding to maintain and operate
these new assets over their lifetime.

Chapter I: Creating Jobs and Growing the Economy
29
Given the importance of transit funding in Ontario, the government has
established a 13-member panel to evaluate dedicated sources of revenue to
fund further investments in public transit infrastructure. Throughout November,
these experts will engage the public on the recommendations presented
by Metrolinx and other potential options to support ongoing investment
in transportation.
At the same time, the Province is committed to introducing high-occupancy toll
(HOV/HOT) lanes in the GTHA, in which carpooling drivers would continue to drive
for free, but individual drivers would be able to choose to drive in the HOT lane for
a toll. Toll-free options would exist on all highways that have HOV/HOT lanes.
Congestion Is Hurting Ontario’s Economy “In the Greater Toronto and Hamilton Area, the commonly used estimate is that congestion costs the economy about $6 billion per year … this report estimates the additional costs [above the $6 billion] to be at least $1.5 billion and as much as $5 billion per year [in lost wages].”
C.D. Howe Institute, “Cars, Congestion and Costs: A New Approach to Evaluating Government Infrastructure Investment,” July 2013, p. 1.
Building Highways
As important as public transit is, a modern, efficient highway network plays an
important role in helping address traffic congestion. Investments in the provincial
highway network support the movement of goods to market and commuters
between their homes and workplaces. Ontario is making strategic investments
to expand provincial highways, including widening Highway 417 in Ottawa and
Highway 11/17 between Thunder Bay and Nipigon, and extending Highway 407
east through Durham Region.

2013 Ontario Economic Outlook and Fiscal Review
30
Building Municipal Infrastructure
To build stronger communities, support jobs and grow local businesses,
the Province announced as part of the 2013 Budget a new $100 million
infrastructure fund to help small, rural and northern municipalities undertake
critical infrastructure projects.
Over the summer, the Province heard from more than 500 municipal delegates
on the design of the program. Informed by these consultations, the new Small,
Rural and Northern Municipal Infrastructure Fund has three parts:
$71 million for road, bridge, water and wastewater projects that are identified
as priorities in municipal asset management plans;
$25 million to fund 20 previously submitted critical project proposals; and
$4 million to help municipalities with populations under 5,000 complete asset
management plans to ensure that the highest-priority projects are built.
The Province is continuing to take consultation feedback into account as it
considers options to make the Fund permanent through the 2014 Budget.

Chapter I: Creating Jobs and Growing the Economy
31
Investing in Health Infrastructure
The Province continues to make significant progress in ensuring the provision of
the right care, at the right time, in the right place. This includes initiating over
100 major hospital projects that are complete or underway. For example, the new
Humber River Regional Hospital, once complete, will provide for increased patient
capacity and expanded emergency services for the surrounding community in
north Toronto. Another example is the provincial investment to expand the
dialysis facility at Renfrew Victoria Hospital, which will reduce the need for
patients to commute to Ottawa to meet their dialysis needs.
In Cornwall, the Province is supporting the construction of a new hospital that
would consolidate all acute and rehabilitation hospital services from two sites into
one. The redevelopment project at Atikokan General Hospital will give families
access to quality health care services in state-of-the-art inpatient facilities.
In addition, the Ministry of Health and Long-Term Care is developing a long-term
solution to address the capital investment needs of the community health
care sector.
Investing in Education and Postsecondary Infrastructure
Investments in schools and postsecondary facilities provide better places to learn
and train the highly educated workforce that Ontario’s economy needs. Across
Ontario, 610 new schools have been opened, planned, or are under construction.
In January 2013, the Province also announced the retrofit of another 48 schools
to help meet the needs of the province’s growing communities, revitalize older
schools and improve the efficiency of education infrastructure.
The increase in college and university enrolment in Ontario over the past decade
has put pressure on postsecondary infrastructure. The government is investing in
20 capital projects throughout the province to support postsecondary education.

2013 Ontario Economic Outlook and Fiscal Review
32
Additionally, the Province recognizes that despite recent growth in enrolment
capacity, many of the largest and fastest growing communities in Ontario do not
have postsecondary campuses or have campuses that provide limited local options
for students. The government remains committed to improving the alignment
of future capacity with long-term demand growth to ensure more students have
quality learning closer to home. This fall, the government will release a policy
framework to govern future expansion in the postsecondary sector either through
creation of three new campuses or through major expansion at existing campuses.
The Province will also initiate a call for proposals with an announcement of
potential locations in early 2014.
Innovative Approaches to Infrastructure Investment
Alternative Financing and Procurement
Ontario is a global leader for alternative financing and procurement (AFP) projects.
Infrastructure Ontario (IO) and its private-sector partners are consistently
delivering valuable public infrastructure assets on time and on budget.
The Ontario government, through IO, is delivering over 80 projects using the
AFP model, valued at about $35 billion. This includes over 50 projects completed
or under construction, with an estimated $3 billion in value-for-money savings.
A recent review of the 30 completed projects found that 29 were completed at
or below budget and 28 were completed on or ahead of schedule, or within
three months of schedule.
Leading the Way “Infrastructure Ontario is recognized as an international leader in leveraging private-sector expertise to deliver projects on time and on budget.”
Her Majesty’s Treasury (United Kingdom), December 2012.
Building on this success, each year IO will continue to release a market update that
identifies upcoming projects, estimated project sizes and procurement timelines,
to allow firms to better organize their resources.

Chapter I: Creating Jobs and Growing the Economy
33
With its partners, IO will play a critical role in delivering important infrastructure
projects including:
Eglinton Crosstown;
Burlington’s Joseph Brant Hospital;
Cambridge Memorial Hospital;
University of Ottawa Heart Institute; and
St. Joseph’s Health Care – West 5th Campus in Hamilton.
Further, based on progress on the Humber and Sheridan College projects,
IO will move forward in partnership with the Ministry of Training, Colleges and
Universities and Seneca College to expand learning facilities using the AFP
delivery model.
The government is taking action to enhance the AFP approach to improve the
delivery of large and complex projects, particularly integrated transit systems
with significant risk and scope. These enhancements would enable companies
of various sizes to compete and participate while maintaining the commitment
to on-time and on-budget delivery. Pilot AFP initiatives are also anticipated to
increase opportunities for apprentices.
The Conference Board of Canada’s August 2013 report and the December 2012
report from the U.K. Treasury cite IO as a global leader in delivering public
investment with the private sector. Infrastructure Ontario will work with
Ontario’s international trade offices to create export opportunities for Ontario’s
construction companies, engineers, architects and financial services. Recently,
IO was invited to be an expert adviser to the National Governors Association
in the United States to assist with their delivery of public infrastructure with
private-sector partners. This is an example of how the government can help
Ontario-based companies do more business abroad.

2013 Ontario Economic Outlook and Fiscal Review
34
Maximizing the Value of Government Assets
The government’s priority is to invest in jobs, not real estate. That is why the
government continues to reduce its real estate footprint to achieve greater value
from its existing assets.
The government is moving forward with the sale of the LCBO head office located
on Lake Shore Boulevard in Toronto. The one-time proceeds from this sale would
be placed into the new Trillium Trust to fund priority infrastructure projects.
Additionally, the government is reviewing options for the Ontario Power
Generation (OPG) head office building located at 700 University Avenue in
Toronto. OPG already leases out a majority of the building, and the Province and
OPG will explore opportunities to unlock value associated with this property for
the benefit of Ontarians.
The government will also continue to evaluate its assets in conjunction with IO,
in order to support jobs, protect public services and grow the economy.
On September 10, 2013, Ontario, along with the federal government, sold its
interest in 10 million shares of General Motors (GM) Company, resulting in a
revenue gain to the Province of $249 million. The Province continues to hold an
interest in approximately 36.7 million GM shares, and will continue to monitor
the value of these remaining shares to assess the appropriate timing for share
divestiture. Revenue gains from this divestiture would be placed into the new
Trillium Trust and used to finance key public infrastructure priorities.

Chapter I: Creating Jobs and Growing the Economy
35
Ontario’s Long-Term Energy Plan and Clean Energy
In 2003, Ontario’s electricity system had no long-term plan and for the
previous decade, little investment had been made in the province’s electricity
infrastructure. There was not enough generation to reliably meet demand and
transmission lines were aging.
Over the last 10 years, over 7,500 kilometres of transmission and distribution lines
have been upgraded in the province, representing an investment of more than
$10 billion, including the Bruce-to-Milton transmission reinforcement project.
As well, about 12,000 megawatts (MW) of new and refurbished generating
capacity have been added, representing investments of over $21 billion. Today,
Ontarians can feel secure that the lights will come on when they flip the switch.
The government has been regularly updating a 20-year, long-term energy plan
to forecast energy needs and plan for conservation and new supply to meet the
province’s electricity needs. The government initiated a consultation process
this summer as part of its review process for an updated Long-Term Energy
Plan (LTEP).
Eliminating Coal-Fired Generation The Province is eliminating coal-fired generation, and has moved forward the 2014 closure date for the Lambton and Nanticoke coal-powered generating stations to before the end of 2013. On October 23, 2013, the Province marked the end of burning coal at the Lambton Generating Station.
Ontario’s elimination of coal-fired electricity generation is the single largest greenhouse-gas reduction measure being undertaken in North America in this timeframe — the equivalent of taking seven million cars off the road. Since 2005, various initiatives have helped Ontario families and businesses conserve more than 1,900 megawatts of electricity — the equivalent of taking more than 600,000 homes off the power grid. Conserving energy not only saves money for families and businesses, but also lowers demand on the electricity system and helps reduce greenhouse gas emissions.

2013 Ontario Economic Outlook and Fiscal Review
36
The key principles of an updated LTEP are expected to include a focus on
conservation, a clean and reliable electricity system, cost effectiveness and
community engagement. The updated LTEP will have a renewed focus on
facilitating the transition from planning to siting for new electricity infrastructure
projects as well as minimizing costs to ratepayers.
The timing and amount of new resources to be procured will be informed by the
updated LTEP. By putting conservation first, the updated LTEP will be able to avoid
generation costs. Updated projections on demand, conservation and supply
enable deferring the construction of two new reactors at Darlington. As a result,
billions of dollars of costs will be avoided. The government has also taken action
in a number of areas:
In May 2013, the Ministry of Energy made changes to the Feed-in Tariff (FIT)
Program, including removing from the program the future procurement of
large renewable projects (greater than 500 kilowatts) and developing with the
Ontario Power Authority (OPA) a new competitive process that will consider
input from stakeholders and communities.
In October 2013, the government announced its plan to improve the siting of
large energy infrastructure projects by implementing the recommendations
made by the OPA and Independent Electricity System Operator (IESO).
The new rules will ensure infrastructure is located in the right place from the
start, improve municipal engagement and public consultation, and ensure
greater predictability for the energy sector.

Chapter I: Creating Jobs and Growing the Economy
37
The government has also taken action to mitigate electricity rates for Ontario
families and businesses.
In June 2013, the government announced an update to the Green Energy
Investment Agreement (GEIA) with the Korean Consortium, reducing the
contracted capacity from 2,500 MW to 1,369 MW, and reducing the total
contract commitment of the project by $3.7 billion.
Through changes to the FIT program, from FIT 2.0 to FIT 3.0, the Ministry of
Energy has estimated a cost reduction from lower FIT prices of approximately
$1.9 billion.
As Ontario negotiates new power purchase agreements with existing
Non-Utility Generators (NUGs), it will be done with an eye to ensuring
maximum value to ratepayers. If a NUG is not required for power system
needs, then a new contract will not be executed.
Competitive and Innovative Climate for Transmission
As part of the government’s upcoming LTEP, the Ministry of Energy will work
with IO and Hydro One to explore ways to apply IO’s proven alternative financing
and procurement (AFP) model for competitive procurement, to new large-scale
transmission grid projects. This would allow these projects to take advantage of
private-sector expertise and innovation to drive construction costs down and
further mitigate future rate pressures for Ontario electricity consumers.
Electricity Cost-Containment Measures The government has taken significant actions to reduce ratepayer impacts and contain electricity costs through the following measures:
Reducing the amount of capacity contracted with the Korean Consortium from 2,500 megawatts to 1,369 megawatts, reducing the total contract commitment by $3.7 billion.
Changing the Feed-in Tariff (FIT) program, with lower FIT prices, resulting in an estimated cost reduction of approximately $1.9 billion.
Negotiating new power purchase agreements with existing Non-Utility Generators, only to meet system needs and ensure maximum value to ratepayers.
Deferring the construction of two new nuclear reactors at Darlington and avoiding billions of dollars of costs.

2013 Ontario Economic Outlook and Fiscal Review
38
Supporting Aboriginal Participation in Energy Infrastructure
The government announced in the 2009 Budget the Aboriginal Loan Guarantee
Program (ALGP) to provide loan guarantees to support Aboriginal investment in
renewable energy generation and transmission infrastructure projects. In 2012,
the Province increased the program’s envelope from $250 million to $400 million.
The government continues to be committed to supporting Aboriginal
communities’ equity investments in electricity generation and transmission
infrastructure projects in Ontario. The ALGP is well suited to support significant
Aboriginal investments in larger projects. To date, applications have been received
representing planned Aboriginal participation in projects totalling over 1,250 MW
of new renewable energy supply. Three loan guarantees have been approved so
far, including the recently approved loan guarantee supporting a portion of the
investment by the six First Nation members of United Chiefs and Councils of
Mnidoo Mnising in the McLean’s Mountain Wind Project.

Chapter I: Creating Jobs and Growing the Economy
39
3. Supporting a Dynamic and Innovative Business Climate
The fundamentals of Ontario’s economy are solid and its industries are well
positioned to take advantage of growing opportunities in the global economy.
Ontario has a well-diversified economy with key industries such as agriculture,
forestry, mining, manufacturing and services. These industries represent
opportunities for growth and increased business investment to improve
their competitiveness.
The government has put in place a competitive tax system for business, made
regulations less burdensome, and enhanced the safety and efficiency of capital
markets, while delivering lower-than-forecasted deficits. In addition, the marginal
effective tax rate, which is a key determinant of business investment, has been cut
in half. Nevertheless, many firms continue to underinvest in innovation and
productivity-enhancing technologies such as R&D, new equipment and
computer software.
Ontario’s Businesses Could Be Investing More
Ontario’s businesses have strengthened their financial positions despite a
challenging global economic backdrop. Many analysts and the Bank of Canada
have pointed to the generally strong balance sheets of Canadian businesses and
concluded that the business sector is now well positioned to make increased
investments to improve innovation and productivity.

2013 Ontario Economic Outlook and Fiscal Review
40
Increasing Opportunities for Businesses to Invest
A recent report by CIBC Economics suggests that Canadian businesses are extremely well positioned to increase investment. CIBC Economics’ composite indicator of corporate strength — which includes nine key measures of corporate performance — is close to an all-time high. The improvement in these key indicators includes historically low debt-to-equity ratios, strong cash positions and record low business bankruptcies. In particular, the corporate cash position of Canadian corporations is at a near record high relative to assets.
CIBC Economics, “Why Corporate Canada Will Surprise on the Upside in 2014,” October 2013.
“Previous studies have shown that despite a strong dollar, low interest rates and a stable investment environment, many of our businesses invest materially less in the research and development (R&D) and machinery and equipment (M&E) (including information and communication technology (ICT)) that are vital to improving productivity. Our new research suggests that a significant portion of Canadian firms mistakenly believe they are making competitive levels of investment when they are not — causing them to slip behind their peers.”
Deloitte Canada, “The Future of Productivity: A Wake-Up Call for Canadian Companies,” 2013, p. 1.

Chapter I: Creating Jobs and Growing the Economy
41
Healthy corporate balance sheets provide businesses with flexibility to expand
operations. However, Ontario lags the United States and the rest of Canada when
it comes to business investment as a share of GDP. Ontario’s businesses have the
potential to invest more and create more good, well-paying jobs. The government
is committed to working with industry to help it activate this capital to stimulate
economic growth.
Source: Statistics Canada.
Per Cent of Total Assets
Long-Term Average
0
1
2
3
4
5
6
7
8
9
1988q1 1992q1 1996q1 2000q1 2004q1 2008q1 2012q1
Canadian Corporate Cash Balances Above Long-Term Average
CHART 1.3

2013 Ontario Economic Outlook and Fiscal Review
42
Strong business investment matters critically for labour productivity growth,
both because it increases the amount of capital per worker, but most importantly
because it brings new technology to the workplace. New technologies spur
innovation, efficiency gains, higher output and increased competitiveness.
Note: Includes intellectual property products.Sources: Statistics Canada, U.S. Bureau of Economic Analysis and Ontario Ministry of Finance.
Plant and Equipment Investment as a Per Cent of GDP
5
6
7
8
9
10
11
12
13
14
15
2007 2008 2009 2010 2011 2012
Ontario Business Investment Lags Canada and the United States
CHART 1.4
Canada
U.S.
Ontario

Chapter I: Creating Jobs and Growing the Economy
43
Encouraging More Business Investment Activity
The government will work with industry and research organizations to find
solutions to help more Ontario companies become more competitive and
productive in order to create jobs, innovate and export.
In addition, the government will partner with industry on measuring and reporting
investment in innovation, training and technology, and showcasing top performers
according to international benchmarks. To demonstrate the government’s
commitment, it will begin to benchmark government enterprises such as the
LCBO, Ontario Lottery and Gaming Corporation, Ontario Power Generation,
Hydro One and other agencies. The responsible ministries will report annually
on the performance of these enterprises.
The Province will also study various approaches, including those taken in other
jurisdictions, to encourage higher levels of business investment, such as:
Replacing existing research and development (R&D) tax credits with an
incentive that would reward incremental R&D spending. The new credit
would redirect support to incremental R&D expenditure growth, to provide
an incentive for businesses to increase R&D and/or expand research
operations in Ontario. The majority of U.S. states provide R&D tax credits
based on incremental R&D expenditures. Ontario’s and Canada’s business
R&D investment as a proportion of GDP remains significantly lower than
that of the United States.
“Pay or play” tax incentives, such as:
a special corporate tax that could be eliminated or reduced through
investments in new equipment or other eligible investment expenses; and
a payroll tax that could be eliminated or reduced by employer investments
in employee training and/or by funding training programs. Quebec, France
and a number of U.S. states have payroll taxes that encourage or support
training expenditures.

2013 Ontario Economic Outlook and Fiscal Review
44
Investment Ready Program
In a highly competitive global economy, businesses need to move fast when
making investment decisions. To build on Ontario’s success in attracting new
business investment, the government has introduced a program to pre-certify
industrial sites that are investment ready. This ensures that sites have the
proper services a business needs to start up its operations.
Open for Business
The government is continuing to work on the Open for Business initiative,
to help make Ontario more attractive for business development while
protecting the public interest.
It has reduced regulations, which has resulted in a reduced burden on business
and stakeholders of over 17 per cent (or over 80,000 regulatory requirements).
Sources: U.S. Bureau of Economic Analysis, National Science Foundation and Statistics Canada.
Per Cent of GDP
0.6
0.8
1.0
1.2
1.4
1.6
1.8
2.0
2.2
2000 2001 2002 2003 2004 2005 2006 2007 2008 2009 2010 2011
Ontario Business R&D Spending Below the U.S.CHART 1.5
U.S.
Ontario
Canada

Chapter I: Creating Jobs and Growing the Economy
45
Building Sector Partnerships for Success
Leveraging Partnerships with Ontario’s Diverse Industries
Industrial diversity is an important contributor to economic strength
and resilience. Ontario’s economy is well diversified with many industries,
some mature and some emerging rapidly and poised for future growth.
The government is partnering with all key sectors of the economy, identifying
opportunities and offering solutions to challenges. It will build on its competitive
strengths to drive jobs and growth.

2013 Ontario Economic Outlook and Fiscal Review
46
Chapter I: Creating Jobs and Growing the Economy
47
Growing Ontario’s Agri-Food Industry
Ontario’s innovative agri-food industry, including its large and diverse farming
sector, competitive food processing industry and large food services sector,
supports more than 740,000 jobs across the province. Ontario has the sixth largest
food processing sector in North America, and a strong food safety culture that is
in high demand in world markets, including fast-growing emerging economies.
Premier Kathleen Wynne recently issued a challenge to the agri-food industry
to double its exports and create 120,000 jobs by 2020. The government will
work in greater partnership with key industry sectors to identify opportunities
for increased trade, investment in innovation, training and productivity,
and cooperation within the sectors. The Jobs and Prosperity Council has
identified these as key success factors for future economic growth. For its
part, the government will maintain a competitive tax system for business,
make regulations smarter and less burdensome, and enhance the safety
and efficiency of capital markets.
The government has proposed a Local Food Act that, if passed, would
celebrate and support the good things grown, harvested and made in Ontario.
The legislation is one part of the Local Food Strategy, which aims to increase
local food awareness, access and sales in Ontario, as well as help farmers and
create jobs.
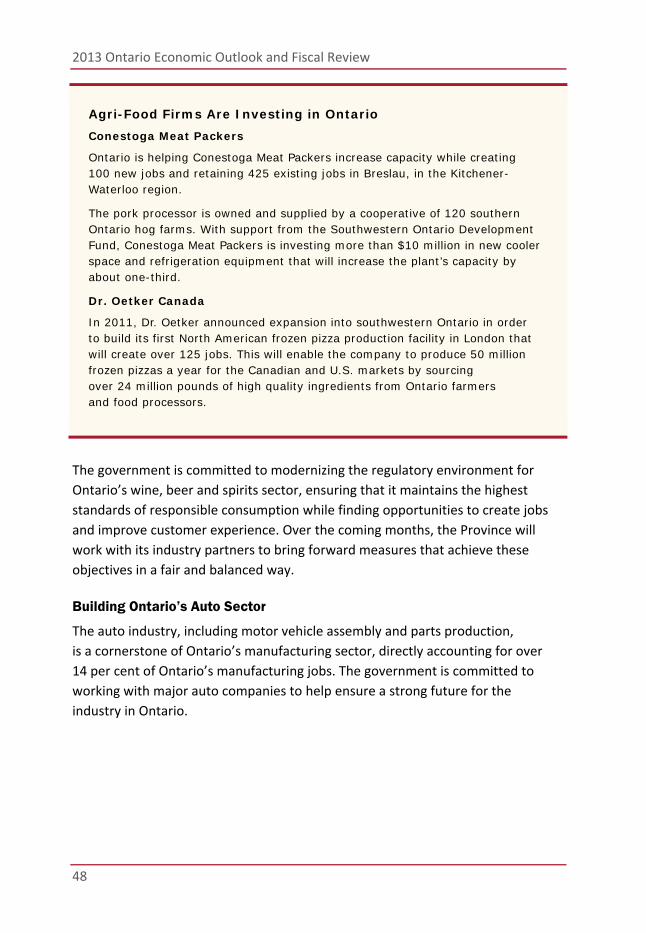
2013 Ontario Economic Outlook and Fiscal Review
48
Agri-Food Firms Are Investing in Ontario Conestoga Meat Packers
Ontario is helping Conestoga Meat Packers increase capacity while creating 100 new jobs and retaining 425 existing jobs in Breslau, in the Kitchener-Waterloo region.
The pork processor is owned and supplied by a cooperative of 120 southern Ontario hog farms. With support from the Southwestern Ontario Development Fund, Conestoga Meat Packers is investing more than $10 million in new cooler space and refrigeration equipment that will increase the plant’s capacity by about one-third.
Dr. Oetker Canada
In 2011, Dr. Oetker announced expansion into southwestern Ontario in order to build its first North American frozen pizza production facility in London that will create over 125 jobs. This will enable the company to produce 50 million frozen pizzas a year for the Canadian and U.S. markets by sourcing over 24 million pounds of high quality ingredients from Ontario farmers and food processors.
The government is committed to modernizing the regulatory environment for
Ontario’s wine, beer and spirits sector, ensuring that it maintains the highest
standards of responsible consumption while finding opportunities to create jobs
and improve customer experience. Over the coming months, the Province will
work with its industry partners to bring forward measures that achieve these
objectives in a fair and balanced way.
Building Ontario’s Auto Sector
The auto industry, including motor vehicle assembly and parts production,
is a cornerstone of Ontario’s manufacturing sector, directly accounting for over
14 per cent of Ontario’s manufacturing jobs. The government is committed to
working with major auto companies to help ensure a strong future for the
industry in Ontario.

Chapter I: Creating Jobs and Growing the Economy
49
Building Ontario’s Auto Sector Ford Motor Company recently announced an investment of more than $700 million in its Oakville facility to upgrade the assembly plant with global manufacturing processes, making it more efficient and competitive. The investment, supported by a grant of up to $70.9 million from the government, will help to secure more than 2,800 jobs and will anchor new research and development activities.
General Motors (GM) announced that it is keeping its Consolidated Line assembly plant in Oshawa open until 2016. The plant is helping GM meet resurgent demand for its vehicles in the North American market. The plant also won the second highest rating among North and South American assembly plants in this year’s J.D. Power Awards for Assembly Line Quality.
Increasing the Competitiveness of the Aerospace and Manufacturing Sectors
The government supports partnerships among colleges, universities and industry
leaders to help ensure there is on-the-ground, hands-on learning and training
available to train students for next-generation advanced manufacturing jobs.
Ontario has established an aerospace engineering and manufacturing sector
with 13 of the top global aerospace companies operating in the province.
The government will support the relocation of Centennial College’s aerospace
training programs to Downsview Park, providing opportunities for future
expansion in the aerospace industry, including by Bombardier. This will support
projected demand for skilled aerospace workers in Ontario, improve the future
competitiveness of Ontario’s aerospace industry, and establish a solid foundation
for collaboration across industry partners and among colleges and universities.
The Province will also support a permanent Industry Innovation Centre at
Niagara College. Since 2011, Niagara College’s research and innovation branch
has provided assistance to small and medium-sized manufacturers that do not
have the in‐house capacity or equipment needed to undertake research and
development. A permanent, state-of-the-art facility in the Niagara region will
allow Ontario-based manufacturers to access business services, equipment,
research and expertise provided by the faculty and students at Niagara College.

2013 Ontario Economic Outlook and Fiscal Review
50
The government continues to encourage partnerships between business,
colleges and universities to facilitate industry-relevant training. For example,
the Ontario Network of Entrepreneurs (ONE) is a coordinated series of innovation
and small business centres across the province that has supported the skills
development of more than 48,000 students, researchers, entrepreneurs and
private-sector employees since 2007. The ONE also administers the recently
launched Collaboration Voucher Program, which will allow eligible companies
to access the expertise and knowledge available at Ontario universities,
colleges and research hospitals.
Growing the Financial Services Sector
The financial services sector remains an engine of growth for Ontario — the
economy’s second-largest major sector after manufacturing based on output.
It has continued to create jobs this year at a rate faster than the overall economy.
It is also enabling economic growth in the rest of the economy by supporting
ancillary jobs in business services industries, as well as savings, access to capital
and investment. The financial services sector is a leader behind the outward
orientation of the Ontario economy, trading and investing globally with the rest
of the world. Financial services exports from Canada grew strongly by six per cent
in the first half of 2013 from the previous year. Financial services foreign direct
investment (FDI) to other countries grew by five per cent in 2012, remaining the
largest sector for outward FDI in Canada, with 40 per cent of the total, followed
by mining and manufacturing.
Toronto is the financial capital of Canada and a global financial centre —
home to many leading banks, securities dealers, insurers and pension funds.
As a global financial centre, Toronto ranks strongly in the world — number seven
on The Banker magazine ranking and number eleven on the U.K.-based Global
Financial Centres Index. The government is continuing to work with the financial
services sector, Toronto Financial Services Alliance and other orders of
government in implementing a financial services sector growth and
competitiveness strategy.

Chapter I: Creating Jobs and Growing the Economy
51
Ontario has long been a leader in advocating for the creation of a common
securities regulator. It sees a cooperative securities regulator as key to the
country’s ability to sustain and grow its financial services industry. Moving to
a cooperative securities regulator would foster more efficient and globally
competitive capital markets in Canada through streamlined, less burdensome
regulation for market participants. It would strengthen Canada’s capacity to
identify and manage risks to its financial system on a national basis. It would
provide better protection for investors through more integrated compliance and
enforcement activities to allow households to save and invest with confidence.
Ontario’s perseverance and outreach to other governments in pursuit of this goal
culminated with the recent announcement that British Columbia, Ontario and
Canada have reached an agreement in principle to establish a cooperative capital
markets regulatory system.
Strengthening the Mining Sector
The mining sector plays an important role in Ontario’s economy. The province
ranks among the top 10 world producers of platinum, nickel and cobalt, and
is a significant producer of gold, silver, copper and zinc. Ontario also produces,
processes and markets diamonds. The sector is well positioned to respond to
the growing global demand for metals and minerals driven mainly by economic
growth in emerging economies such as China, India and Brazil.

2013 Ontario Economic Outlook and Fiscal Review
52
Ring of Fire Ontario’s Ring of Fire area, located about 535 kilometres northeast of Thunder Bay, holds significant mineral deposits. Recent estimates suggest that the value of mineral resources in the Ring of Fire area could be up to $50 billion, for known chromite and nickel deposits.
Potential development of the Ring of Fire represents tremendous economic development opportunities that will generate new wealth, social benefits and employment for Ontario’s North, including First Nation communities.
Ontario has appointed former Supreme Court of Canada Justice Frank Iacobucci as lead negotiator on behalf of Ontario in discussions with Chiefs of the Matawa Tribal Council on resource developments in the Ring of Fire.
Ontario has taken a leadership role in planning for development in partnership with commercial proponents and First Nations. The federal government must come to the table as a partner to fund the regional infrastructure necessary to develop the Ring of Fire.
Growing Ontario’s Film and Music Sector
Ontario’s film and TV industry recorded its best year ever in 2012, contributing
$1.28 billion to the provincial economy. For the second consecutive year,
Ontario ranked first in Canada for production expenditures and third in North
America, just after California and New York.
The province offers a complete range of advantages including top-notch technical
and creative crews, world-class studios and post-production facilities, a dynamic
talent pool, a variety of locations, and financial support. The government remains
committed to ensuring that Ontario remains a top location for film production.
As announced in the 2013 Budget, the government will provide funding of
$9 million over three years, starting in 2013–14, to support the Canadian Film
Centre’s educational programs for advanced film, television and new media.

Chapter I: Creating Jobs and Growing the Economy
53
The 2013 Budget announced a new Ontario Music Fund, with funding of
$45 million in grants over three years, which launched in October. The province-
wide fund will support Ontario-based music companies and boost music
production and distribution through four streams: music company development,
music industry development, music futures and live music. Grants from the
fund will help the industry to innovate, invest and take advantage of opportunities
in the global music marketplace, bringing more recording activity to the province.
The fund will capitalize on Ontario’s infrastructure, critical mass and competitive
edge to drive economic growth and jobs.
Supporting the Information and Communications Technologies Sector
Clusters, which are associated with innovation and positive economic outcomes,
are concentrations of related businesses, academic institutions and
entrepreneurs. Clusters exist across the province, from the mining and forestry
clusters in northern Ontario, to the financial services cluster in Toronto, and the
information and communications technologies (ICT) clusters in Ottawa, Toronto
and Kitchener-Waterloo.

2013 Ontario Economic Outlook and Fiscal Review
54
Ontario’s Information and Communications Technologies (ICT) Corridor Ontario’s ICT sector is concentrated in three clusters — Toronto, Ottawa and Kitchener-Waterloo. This corridor accounted for almost 80 per cent of Ontario’s ICT employment in 2012, and has strong concentrations of research and development activity and venture capital investment. The government is committed to supporting its continued growth.
In January 2013, the Province announced $15 million in funding to establish a new innovation complex in Ottawa to support the city’s ICT cluster and its broader knowledge economy.
In partnership with Communitech, Waterloo Region’s innovation hub, the government is contributing $15 million over three years to accelerate entrepreneurial activity in the region through access to seed investment, mentoring and business advice.
Working with the federal government, Ontario’s new venture capital fund of up to $300 million will support investment in innovative new firms, including firms in the ICT sector.
The government is developing a new big data strategy that will produce the high quality talent that industry needs to accelerate the adoption of advanced computing and build strong collaborations between public institutions and critical industries that rely on big data, including advanced manufacturing.
The government is offering supports for recently laid-off workers so they can continue to contribute to Ontario’s productivity and innovation.
In addition, significant anchor investments by business are being encouraged by the government to further develop Ontario’s ICT clusters.
Ontario is a global ICT leader and will continue to support a world-class
environment and a highly skilled workforce that attracts new investments.
In September 2013, Ericsson, a Swedish-based multinational corporation,
opened a new research and development lab in Ottawa with provincial support.
The new facility will leverage the Ottawa area’s expertise in wireless
communications.

Chapter I: Creating Jobs and Growing the Economy
55
Successful Innovation in Ontario
Polar (formerly Polar Mobile), based in Toronto, is a world leader in the development of mobile applications for media companies such as CBS, Sports Illustrated, Bloomberg BusinessWeek and many others. Polar has received support from the MaRS Centre and Ontario Venture Capital Fund.
Waterloo-based OpenText is Canada’s largest software company and is at the forefront of enterprise content management (ECM) for firms such as Unilever and Siemens. Provincial funding is supporting OpenText’s expanded workforce in Waterloo, Richmond Hill and Ottawa.
Intel opened the Intel Developer Zone in June 2013, located in Waterloo’s Communitech Hub. The Developer Zone will give local entrepreneurs access to technology mentorship in order to support the development of new products and services.
The government will continue to engage with its partners in all sectors to help
grow the economy.

2013 Ontario Economic Outlook and Fiscal Review
56
Going Global Trade Strategy
The Going Global Trade Strategy will expand the reach of Ontario’s trade,
including to fast-growing emerging markets that are quickly increasing their share
of the global economy.
The Going Global Trade Strategy will help Ontario companies — especially
small and medium-sized business — increase their success exporting to global
markets and create jobs in Ontario.
In collaboration with exporters, sector associations, researchers, industry and the
federal government, the trade strategy will:
Promote Ontario’s many export industry strengths and expand market access
beyond Ontario’s borders to other provinces, the United States and other
nations. This includes major industrialized economies such as the European
Union, one of the largest and richest markets in the world.
Continue to work with the federal government to finalize a historic trade
and investment agreement with the European Union. The deal would mean
expanded access to European markets for Ontario manufacturers and
service providers, more sales of goods and services, and, as a result, more job
creation. Ontario remains concerned about the potential impacts on its
pharmaceutical, dairy, and wine and spirits industries, and has raised these
concerns with the federal government. See Chapter IV: The Need for a
Committed Federal Partner for more details.
Broaden the reach of Ontario’s exports to high-growth emerging economies,
including working with the federal government to pursue new trade
agreements that increase market access abroad to South America and Asia,
including India, Japan and South Korea.
Build the province’s competitive advantage abroad by promoting Ontario
companies’ quality goods and services, including opening Ontario’s
11th International Marketing Centre in São Paulo early next year to help
companies explore export opportunities and connect with international
buyers and investors in Brazil.
Streamline export programs and resources for businesses so they can more
easily access the supports they need to go global.

Chapter I: Creating Jobs and Growing the Economy
57
Lead trade missions to promote Ontario as an internationally competitive
source of products and innovative solutions, a strategic location for
investment, and a leading jurisdiction for collaborative research and
innovation in priority sectors to key markets worldwide. These include Asia,
the European Union, Russia, the Middle East, Latin America and the United
States. Recently, Ontario led overseas trade missions to Paris, Stuttgart,
Tokyo, San Francisco and Israel.
Connect Infrastructure Ontario with Ontario’s international trade offices to
create export opportunities for Ontario firms that have participated in AFP
projects. This will help Ontario-based construction companies, engineers and
architects compete internationally.
Ontario recently hosted a major global exporter forum where companies in
Ontario’s leading advanced industries learned about export opportunities
in the Asia-Pacific Region. A global exporter forum focused on Latin America
is planned for the spring of 2014.

2013 Ontario Economic Outlook and Fiscal Review
58
Investing in Entrepreneurship and Innovation
Successful small businesses are one of the biggest job creators in the economy.
Many of these businesses are founded and led by entrepreneurs who bring new
ideas, products and services to the marketplace. New businesses that are more
innovative and export oriented play a key role in driving economic growth in the
new economy.
The Province has introduced legislation to increase the Employer Health Tax
exemption from $400,000 to $450,000 of annual Ontario payroll to support small
business, effective January 1, 2014. This would increase the relief the exemption
provides by up to $975 per employer with an annual Ontario payroll of $5 million
or less.
To better meet the needs of entrepreneurs and small business owners,
the Ontario Network of Entrepreneurs (ONE) has consolidated three support
networks into a unified one-window approach. This will help to more easily
connect entrepreneurs across the province with organizations such as Waterloo’s
Communitech. In addition, the Ontario Centres of Excellence, a member of ONE,
recently signed an agreement with Chinese counterparts to develop an Ontario-
China network of entrepreneurs and investors.
The government is establishing the Ontario Health Innovation Council (OHIC) to
bring together experts in the health care, research, business and not-for-profit
sector along with patient groups to identify opportunities for practical, evidence-
based strategies that will further enhance the quality of health care at a lower cost
to the system while growing Ontario’s economy through the cultivation of highly
skilled jobs. OHIC will pursue initiatives that would put Ontario on a path to
becoming a world leader in health care advancements and create a dynamic
business environment that raises Ontario’s capacity for innovation and
commercialization.
To improve access to capital for entrepreneurs, the Province continues to work
with the federal government to introduce a new venture capital fund of up to
$300 million in partnership with the private sector.

Chapter I: Creating Jobs and Growing the Economy
59
In August 2013, the Ontario Securities Commission (OSC) published a progress
report on its ongoing review of crowdfunding and other ways for small businesses
to raise capital without issuing prospectuses. The report identified four capital-
raising methods, including crowdfunding, that OSC staff were directed to develop
for more detailed consideration.
Supporting Communities
The government is helping communities create jobs through business investment
and support for regional projects initiated by municipal governments or other
economic development associations. The Eastern Ontario Development Fund
(EODF) and Southwestern Ontario Development Fund (SWODF) support
businesses, municipalities and not-for-profit organizations for economic
development projects in the south. The Northern Ontario Heritage Fund
Corporation (NOHFC) offers support for business and skills development
as well as assistance with important infrastructure investments for small rural
communities in the north.
Results to date include:
Since its launch in October 2012, the SWODF has leveraged a total investment
of $285 million. These investments have created and protected over
7,000 jobs.
Southwestern Ontario Development Fund (SWODF) International Beams Inc.
International Beams invested $16.2 million in their first Ontario facility in Tillsonburg, creating 55 jobs. SWODF has supported this investment with a $2.4 million loan. The new mill will specialize in wood products for the residential and commercial construction industries.
North American Stamping Group Inc.
The Canadian-owned stamping and welding assembly company for the automotive industry received a $1.5 million grant from SWODF to support a $12.3 million new facility in Woodstock, creating 50 jobs and protecting 210 jobs.
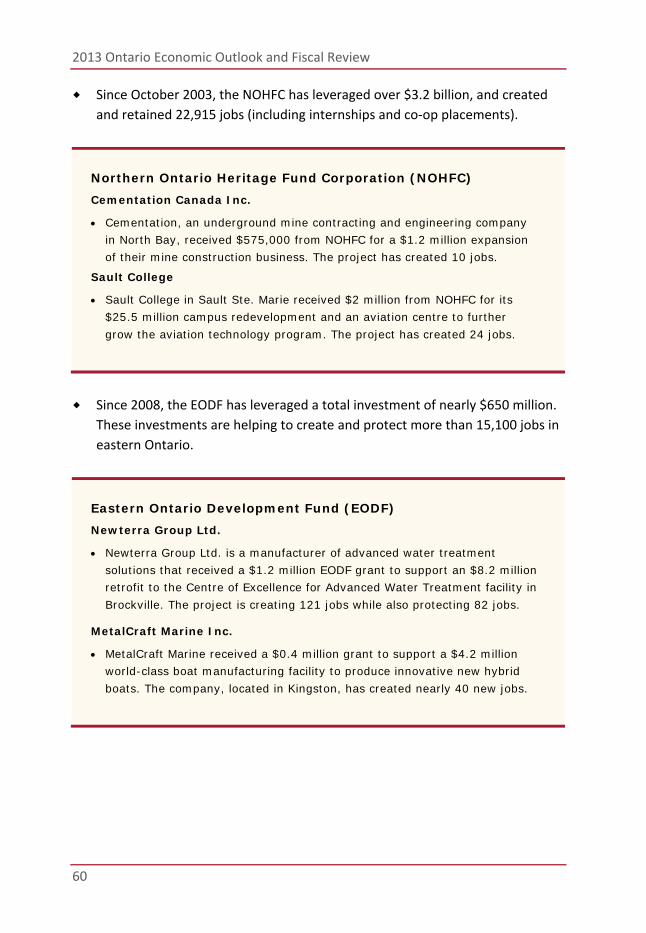
2013 Ontario Economic Outlook and Fiscal Review
60
Since October 2003, the NOHFC has leveraged over $3.2 billion, and created
and retained 22,915 jobs (including internships and co-op placements).
Northern Ontario Heritage Fund Corporation (NOHFC) Cementation Canada Inc.
Cementation, an underground mine contracting and engineering company in North Bay, received $575,000 from NOHFC for a $1.2 million expansion of their mine construction business. The project has created 10 jobs.
Sault College
Sault College in Sault Ste. Marie received $2 million from NOHFC for its $25.5 million campus redevelopment and an aviation centre to further grow the aviation technology program. The project has created 24 jobs.
Since 2008, the EODF has leveraged a total investment of nearly $650 million.
These investments are helping to create and protect more than 15,100 jobs in
eastern Ontario.
Eastern Ontario Development Fund (EODF) Newterra Group Ltd.
Newterra Group Ltd. is a manufacturer of advanced water treatment solutions that received a $1.2 million EODF grant to support an $8.2 million retrofit to the Centre of Excellence for Advanced Water Treatment facility in Brockville. The project is creating 121 jobs while also protecting 82 jobs.
MetalCraft Marine Inc.
MetalCraft Marine received a $0.4 million grant to support a $4.2 million world-class boat manufacturing facility to produce innovative new hybrid boats. The company, located in Kingston, has created nearly 40 new jobs.

Chapter I: Creating Jobs and Growing the Economy
61
Section B: Managing Responsibly
Ontario’s Path to Balance The government is on track to balance the budget by 2017–18 in a fair and
responsible way. This will mean new strategic investments to spur growth, create
jobs, strengthen services and help families. The world’s recovery from the global
recession remains uncertain, and many families are still feeling unsure about their
job security and their financial future.
Should global economic conditions falter, causing revenue growth to fall further,
the government’s priority will be to continue to protect investments in jobs,
growth and families ahead of short‐term targets. Stronger growth and new jobs
are the surest and fairest path to balancing the budget. These investments will be
critical to helping foster the growth necessary to both support Ontario’s families
and generate revenues necessary to support eliminating the deficit.
For four years in a row, the government has overachieved on the deficit targets it
established after the 2009 global recession based on disciplined actions to reduce
spending. In September, the 2012–2013 Public Accounts of Ontario reported that
the deficit for 2012–13 was $9.2 billion — $0.6 billion lower than projected at the
time of the 2013 Budget. The 2013 Ontario Economic Outlook and Fiscal Review
projects that the deficit for 2013–14 will be $11.7 billion, on track with the
2013 Budget forecast and more than $1.0 billion ahead of the deficit projection
for 2013–14 outlined in the 2012 Budget.
Ontario continues to face global economic uncertainty, which is holding
back economic growth and therefore the outlook for Provincial revenues.
In response, the government will drive further savings through an expenditure
review; continue to move forward with 60 per cent of the recommendations
of the Commission on the Reform of Ontario’s Public Services; and consider
other tools, as necessary, to ensure the deficit is eliminated by 2017–18.
(See Chapter VI: Taxation for more details.)

2013 Ontario Economic Outlook and Fiscal Review
62
(19.3)
(14.0)(13.0)
(9.2)
(11.7)(10.1)
(7.2)
(3.5)
0.5
(25.0)
(20.0)
(15.0)
(10.0)
(5.0)
0.0
5.02009–10 2010–11 2011–12 2012–13 2013–14 2014–15 2015–16 2016–17 2017–18
Fiscal Forecast2
Performance1
Actual
(13.3)
Ontario’s 2013 Budget Plan to Eliminate the Deficit
(24.7)
(19.7)(17.3)
(15.9)
Fiscal Balance($ Billions)
PlanMedium-Term
OutlookExtendedOutlook
1 Represents the 2013 Budget forecast for 2013–14 to 2017–18. For 2009–10 to 2012–13, actual results are presented.2 Forecast for 2010–11 to 2013–14 based on the 2010 Budget. Projection for 2009–10 from the 2009 Ontario Economic
Outlook and Fiscal Review.
CHART 1.6

Chapter I: Creating Jobs and Growing the Economy
63
An Efficient and Accountable Government In 2011–12, year‐over‐year growth in program spending was held to less than
one per cent. The 2012–2013 Public Accounts of Ontario reported that total
spending and program spending in 2012–13 fell from the previous year for the
first time in more than a decade.
As indicated by the Commission on the Reform of Ontario’s Public Services,
chaired by Don Drummond in 2012, slowing the rate of growth in program
spending through fiscal discipline is essential for eliminating the deficit
by 2017–18.
Ontario currently has the lowest program spending per capita among Canadian
provinces and ranks the lowest among provinces in terms of public‐sector
employees per capita. In 2012, the latest year for which data are available,
Ontario had 6.5 public‐sector employees per 1,000 people, compared to a
national average of 9.7 employees per 1,000 people.
Year-Over-Year Program Expense Changes
Annual Growth Rate(Per Cent)
12.0
4.5
0.9
(0.4) (2.0)
0.0
2.0
4.0
6.0
8.0
10.0
12.0
14.0
2009–10 2010–11 2011–12 2012–13
CHART 1.7
Source: Ontario Ministry of Finance.

2013 Ontario Economic Outlook and Fiscal Review
64
The 2013 Budget put in place targeted actions that will continue to control the
rate of growth in program spending in a way that is fair and balanced, while also
ensuring that key public services continue to be funded. Key actions include:
Respecting the collective bargaining process. Collective bargaining enhances
the ability of responsible employers and bargaining agents to increase
productivity, maintain services and ensure fiscal sustainability. Any modest
wage increases that are negotiated must be absorbed by employers within
available funding and within Ontario’s existing fiscal plan through efficiency
and productivity gains or other tradeoffs so that service levels continue to
meet public needs. All public‐sector partners need to continue to work
together to control current and future compensation costs;
Slowing the growth rate of health care spending — currently 42 per cent of
Provincial program spending — to an annual average of two per cent over the
medium term. The government will continue to move forward with its Action
Plan for Health Care to transform the health care system and provide better
value for money;
Driving benefit transformation initiatives aimed at improving access and
effectiveness for Ontarians and achieving long‐term administrative cost
savings and program efficiencies; and
Reviewing executive compensation for the broader public sector.

Chapter I: Creating Jobs and Growing the Economy
65
Moving Forward on Recommendations of the Commission on the Reform of Ontario’s Public Services
The Province continues to move forward with 60 per cent of the recommendations
of the Commission on the Reform of Ontario’s Public Services. The Commission
provided valuable advice to the government on how to deliver the most effective
and efficient public services possible and achieve a sustainable fiscal balance.
Recent actions to implement recommendations include:
Ministry of Health and Long‐Term Care:
Continuing the move from a global funding model for hospitals by
increasing the overall share of their budgets based on patient‐ and
activity‐based funding — from 46 per cent in 2012–13 to 51 per cent
in 2013–14.
Maximizing opportunities to use highly trained and skilled nurse
practitioners, with the aim of efficiency while maintaining excellent
care, by continuing to increase investments in home care and community
services. These investments will support Ontario’s 26 Nurse Practitioner‐
Led Clinics. Nurse Practitioner‐Led Clinics are a made‐in‐Ontario initiative
to make it easier and faster for families to access primary care in their
local community. At full capacity, these clinics are expected to serve more
than 40,000 patients across the province.
Expanding access to publicly funded, clinic‐based physiotherapy that
will provide more than 200,000 seniors and patients with improved access
to high‐quality physiotherapy, exercise and falls prevention classes.
Expanding the scope of practice for pharmacists to include administering
the flu shot, prescribing medication to help people quit smoking,
and demonstrating how to use an asthma inhaler or inject insulin.

2013 Ontario Economic Outlook and Fiscal Review
66
Ministry of Health and Long‐Term Care, Ministry of Children and
Youth Services:
Continuing to implement a series of recommendations by the Healthy
Kids Panel to help start all kids on the path to healthier lives and healthy
communities. The Province has been moving forward on the Panel’s
recommendations since the 2013 Budget by:
providing enhanced breastfeeding support to new mothers who
require support;
committing to introduce legislation after consulting with the food
industry and health care sector to help parents and their children
make healthier choices by putting calories on menus at large
chain restaurants;
expanding the Student Nutrition Program by delivering more
nutritious meals and snacks to children and youth in elementary
schools, secondary schools and community agencies across
Ontario; and
expanding Ontario’s After School Program to provide an additional
650 children and youth with the opportunity to get involved in
programs that promote sport, active living and healthy lifestyles.
Ministry of Training, Colleges and Universities:
Addressing the oversupply of teachers in Ontario as part of the changes
to the teacher education program announced in June. The enhanced
program will extend learning time from two semesters to four and
increase classroom placements from a minimum of 40 days to a minimum
of 80 days, starting in September 2015. In addition to expanding the
length of teacher’s college, admissions will be reduced by 50 per cent.
Establishing multi‐year mandate agreements with universities and colleges
that provide more differentiation and minimize duplication. The Ministry
of Training, Colleges and Universities recently released a draft
Differentiation Policy Framework.

Chapter I: Creating Jobs and Growing the Economy
67
Ministry of Finance:
Phasing down the Ontario Municipal Partnership Fund (OMPF) to
$500 million by 2016. The overall support to municipalities continues
to increase, with provincial uploads more than offsetting the reduction
to the program.
Establishing a Business Support Programs Review Panel to review and
evaluate Ontario’s business support programs including tax credits.
ServiceOntario:
Directing clients to more convenient and less expensive channels.
This development allows Ontarians to access more government
services online, thereby improving access while making greater use
of ServiceOntario’s capabilities. Ontario has become the first province
in Canada to offer online driver’s licence renewal.
Ministry of Community and Social Services:
Undertaking the initial steps to implement recommendations proposed
by the Commission for the Review of Social Assistance in Ontario to
remove barriers and increase opportunities to participate in the
workforce. In September 2013, Ontario implemented a number of reform
measures, including increasing liquid asset levels and thereby allowing
single Ontario Works clients to retain up to $2,500 in assets, like cash and
bank accounts, without affecting their eligibility for the program.
Ministry of Children and Youth Services:
Continuing to transform the child welfare sector with the introduction in
April 2013 of a new funding model and a new approach to accountability
that will ultimately include measurement and reporting on outcomes for
children and youth.
Providing 800 more children and youth in rural, remote and underserved
communities with access to mental health consultations through
videoconferencing starting this fall.

2013 Ontario Economic Outlook and Fiscal Review
68
Building on previous initiatives to be more efficient and accountable, the
government is going to drive further savings through an expenditure review.
The review will consider additional proposals recommended by the Commission
while also pursuing opportunities to accelerate the implementation of others.
Public-Sector Compensation
With over half of all government spending going to salaries and benefits,
managing public‐sector compensation costs is an important part of the plan to
eliminate the deficit and protect the front‐line government services that Ontario
families rely on. As stated in the 2013 Budget, compensation costs must be
addressed within Ontario’s existing fiscal framework.
The government continues to respect the collective bargaining process.
Collective bargaining enhances the ability of responsible employers and bargaining
agents to increase productivity, maintain services and ensure fiscal sustainability.
Any modest wage increases that are negotiated must be absorbed by employers
within available funding and within Ontario’s existing fiscal plan through efficiency
and productivity gains or other tradeoffs so that service levels continue to meet
public needs. All public‐sector partners need to continue to work together to
control current and future compensation costs.
Collective bargaining has achieved results. Ontario public‐sector settlements are
below the average of those in the private sector, municipal sector and federal
public sector.

Chapter I: Creating Jobs and Growing the Economy
69
Ontario Wage Settlements
Note: Data are for agreements with over 150 employees, ratified between July 17, 2012, and October 2, 2013. Sources: Ontario Ministry of Government Services and Ontario Ministry of Labour.
Per Cent
0.0
0.5
1.0
1.5
2.0
2.5
Ontario Public Sector Ontario Private Sector Ontario Municipalities Federal Public Sector (inOntario)
Average Annual Base Wage Increases
CHART 1.8
Federal Public Sector(in Ontario)

2013 Ontario Economic Outlook and Fiscal Review
70
Executive and Members of Provincial Parliament Compensation
The government has frozen salaries for designated executives at hospitals,
universities, colleges, school boards and provincially owned electricity companies.
All aspects of compensation plans are frozen, and base salaries cannot be
increased. In addition, the overall performance pay envelopes at designated
employers are frozen. These restraint measures will be in place until the deficit
is eliminated. Members of Provincial Parliament (MPPs) will also continue to see
their wages frozen — bringing the total length of the current freeze to five years.
The government is modernizing compensation structures for senior executives in
the broader public sector. This is being informed by sector‐specific compensation
studies with the objective of establishing modern compensation structures,
including the consideration of appropriate cross‐sector benchmarks, salary grids
and hard caps, to hold executives accountable for results and achievement of
government and board priorities.
Current compensation practices for public appointees are also being reviewed,
including special advisers and appointees to classified agencies and short‐term
bodies as per the Government Appointees Directive.
Health Care System Changes
Since launching its Action Plan for Health Care, the government has made
significant progress in transforming health care services into a more sustainable,
high‐quality system to manage the growth in health care spending. While ensuring
Ontarians get better value for their health dollars, Ontario’s strategy is making
health care options available closer to home, enhancing supports for seniors and
promoting healthy lifestyles.
Funding for the health care system cannot continue to grow at past rates.
The Province is committed to managing the growth in health care funding to an
annual average of two per cent over the medium term as it continues to improve
integration, offer new service delivery, implement new funding models and offer
more services for complex care patients in the community setting.

Chapter I: Creating Jobs and Growing the Economy
71
While the challenge ahead is significant, substantial progress has already been
made, including:
Ongoing implementation of a transparent, patient‐centred funding model
for hospitals to encourage efficient delivery of services;
Continuing to direct funding to where evidence shows the greatest value
and quality improvement;
Strengthening the coordination of care for high‐needs patients — Ontario
has to date created 37 Health Links, a new model that encourages greater
collaboration among health care providers and could reduce unnecessary
hospital visits and readmissions for patients with complex needs;
Funding two new midwife‐led birth centres and shifting routine procedures
traditionally conducted in hospitals to specialized, not‐for‐profit community
clinics, starting with vision care. These clinics can serve more patients more
quickly and at a lower cost, while achieving excellent patient outcomes;
Continuing to implement key recommendations from Dr. Samir Sinha’s report,
“Living Longer, Living Well,” by increasing investment in home and community
care services to better meet patients’ needs and moving care out of the much
more costly hospital setting. The government is building on this commitment
by increasing overall funding for home and community care services by an
average of over five per cent annually over the next three years;
Negotiating and implementing a new Physician Services Agreement with
the Ontario Medical Association. The agreement, which runs to March 2014,
represents a cumulative net savings over two years of approximately
$295 million in physician services savings and $100 million in broader
health system savings to help manage health spending. It also allows for
reinvestments into better care for Ontarians, including support
for e‐consults among patients, doctors and specialists;
Investing in 30,000 more house calls by primary care providers; and
Funding three million more personal support worker hours over the next
three years to assist seniors with daily activities and staying healthy at home.
This investment will improve the quality of life for 90,000 more seniors.
2013 Ontario Economic Outlook and Fiscal Review
72
School Board Efficiencies and Modernization
In the 2013 Budget, the Province announced the introduction of an efficiencies
and modernization savings strategy that aims to achieve long‐term sustainability
in school board funding.
The Ministry of Education is currently engaging education stakeholders and
working with school boards on this strategy.
The Ministry has conducted operational reviews of all 72 school boards across
the province over several years, beginning in 2007. The goal of the operational
reviews was to enhance management capacity within school boards,
by encouraging good stewardship of public resources and by leveraging and
sharing best practices.
Managing the Size of the Ontario Public Service
The government recognizes the important work of the Ontario Public Service
(OPS) in delivering vital services to citizens and propelling the province forward.
The 2009 Budget announced measures to make the OPS more efficient by
reducing its size by five per cent or approximately 3,400 full‐time equivalent staff
over three years through attrition and other measures. The Province achieved the
five per cent reduction by March 31, 2012.
In the 2011 Budget, the government expanded on this target by committing
to a further reduction of 1,500 full‐time equivalent staff by March 31, 2014.
It is well on its way to meeting that commitment.

Chapter I: Creating Jobs and Growing the Economy
73
68,645
65,245
63,745
61,000
62,000
63,000
64,000
65,000
66,000
67,000
68,000
69,000
70,000
October 2008 March 2012 March 2014
2009 Budget reduction target:
3,400 FTEs
2011 Budget additional reduction target:
1,500 FTEs
Source: Ontario Ministry of Government Services.
CHART 1.9Ontario Public Service Staffing Levels
Full-Time Equivalents (FTEs)

2013 Ontario Economic Outlook and Fiscal Review
74
Improving Accountability
Agency Accountability
The government has strengthened the Agency Establishment and Accountability
Directive (AEAD) by introducing a risk‐based approach to the oversight of classified
agencies. The government has also acted on the recommendations of the Report
of the Special Advisor on Agencies to further enhance the governance of
classified agencies.
The enhanced AEAD requires ministries to undertake annual risk assessment
evaluations for classified agencies. In addition, ministries will undertake
mandate reviews for specific operational agencies to assess their effectiveness.
Over the next several years, ministries will undertake mandate reviews of all
classified agencies with a view to support the achievement of government
priorities. The government is also strengthening board governance training for
appointees to further enhance accountability.
To demonstrate the government’s commitment, it will begin to benchmark
government enterprises such as the LCBO, Ontario Lottery and Gaming
Corporation, Ontario Power Generation, Hydro One and other agencies.
The responsible ministries will report annually on the performance of
these enterprises.

Chapter I: Creating Jobs and Growing the Economy
75
Financial Accountability Officer
The government recognizes the need for fiscal transparency and accountability,
to ensure that the legislature and Ontarians have the financial information
necessary to understand the state of the Province’s finances. The legislation to
establish the Financial Accountability Officer received Royal Assent in September,
making Ontario the first province in Canada to establish such an officer.
The Financial Accountability Officer Act, 2013, outlines that the mandate of
the Officer will be to:
Provide independent analysis to all MPPs about the state of the Province’s
finances, including the Ontario Budget, as well as look at trends in the
provincial and national economies; and
At the request of a legislative committee or an MPP, provide other types of
research, including reviewing and estimating the financial costs or benefits to
the Province of any proposal that falls under the jurisdiction of the legislature,
such as any public bill or proposal brought forward by members.
2013 Ontario Economic Outlook and Fiscal Review
76
Balanced Choices An expenditure review will find greater efficiencies in support of the government’s
plan to control spending. This will help inform the government on the path to
balance, while transforming public services to increase efficiencies
and improve outcomes.
Expenditure Review As part of ongoing and efficient government approaches, an expenditure
review will inform the development of the 2014 Budget. This work will build on the significant progress the government has already made in controlling growth in spending — Ontario already has the lowest per capita program spending among Canadian provinces.
The expenditure review will consider recommendations of the Commission on the Reform of Ontario’s Public Services that have not yet been fully implemented and those for which implementation could be accelerated, as well as other strategies to drive further savings to free up resources to protect vital public services. The review will not consider recommendations of the Commission that the government has already rejected, as they are inconsistent with the priorities of Ontario families.
The government will also look to employ other tools, as necessary, to ensure
the deficit is eliminated by 2017–18, while avoiding across‐the‐board cuts that
could jeopardize vital public services or reckless tax increases that would hurt
job creation.

II
Economic Outlook
Chapter


Chapter II: Economic Outlook
79
Highlights Government‐projected real GDP growth — 1.3 per cent in 2013,
strengthening to 2.1 per cent in 2014.
These projections for 2013 and 2014 are both down 0.2 percentage point
from the 2013 Budget forecast.
Private‐sector average projected real GDP growth — 1.4 per cent in 2013
and 2.2 per cent in 2014.
Since the 2013 Budget, the private‐sector forecasts for Ontario real GDP
growth are down 0.2 percentage point in both 2013 and 2014.
Net new jobs created since the recessionary low in June 2009 — 475,600.

2013 Ontario Economic Outlook and Fiscal Review
80

Chapter II: Economic Outlook
81
Overview Ontario’s economy continues to grow, albeit modestly. Global economic
uncertainty has contributed to restrained export growth and business investment,
holding back the overall pace of growth in the Ontario economy. As global growth
improves, Ontario’s exports will strengthen, spurring business investment.
Household spending, which accounts for close to 60 per cent of the economy,
is also expected to grow modestly.
As part of building Ontario’s fiscal plan, the Ministry of Finance is assuming real
gross domestic product (GDP) growth of 1.3 per cent in 2013, 2.1 per cent in 2014
and 2.5 per cent in both 2015 and 2016.1 This compares to a forecast for real GDP
growth at the time of the 2013 Budget of 1.5 per cent in 2013, 2.3 per cent in
2014 and 2.4 per cent in both 2015 and 2016.
TABLE 2.1 Ontario Economic Outlook
(Per Cent)
2010 2011 2012 2013p 2014p 2015p 2016p
Real GDP Growth 3.3 1.8 1.5 1.3 2.1 2.5 2.5 Nominal GDP Growth 5.1 4.8 3.0 2.5 3.8 4.3 4.3 Employment Growth 1.7 1.8 0.8 1.5 1.4 1.6 1.5 CPI Inflation 2.5 3.1 1.4 1.1 1.8 2.0 2.0 p = Ontario Ministry of Finance planning projection. Sources: Statistics Canada and Ontario Ministry of Finance.
1 Based on information available to October 24, 2013.

2013 Ontario Economic Outlook and Fiscal Review
82
While a forecast for sustained moderate growth is a reasonable basis for planning,
there are considerable risks in the global economy. An emerging but fragile U.S.
economic recovery could be derailed by persistent political discord, which has
increased uncertainty and resulted in a 16‐day partial government shutdown in
October. There is a possibility of a further government shutdown if an agreement
is not reached by January 15, 2014, and a renewed crisis over the debt ceiling,
which will be reached again in February 2014.
In addition, the gradual withdrawal of exceptional monetary stimulus by the
U.S. Federal Reserve could trigger increased financial market volatility. In Europe,
there are early but modest signs of economic improvement, although significant
fiscal challenges remain for a number of countries.

Chapter II: Economic Outlook
83
Recent Economic Developments Ontario’s economy continues to create jobs. Over the first nine months of 2013,
employment is up 105,600 (+1.6 per cent) compared to the same period last year.
The majority of jobs gained so far this year were in full‐time positions and in the
private sector.
Ontario’s unemployment rate continues to trend lower, down 0.4 percentage
point from the beginning of the year to 7.3 per cent in September 2013 and
well below the recessionary high of 9.4 per cent in June 2009.
In the second quarter of 2013, Ontario’s real GDP advanced 0.6 per cent.
Strong gains in international exports and solid household spending helped boost
Ontario’s economy in the second quarter.
The view among private‐sector economists, supported by recent economic data,
suggests Ontario’s economy is well positioned for continued growth over the
second half of 2013 and over the forecast period.

2013 Ontario Economic Outlook and Fiscal Review
84
Ontario’s Economic Performance since the Recession
Ontario’s economy was hard hit by the global recession, with real GDP declining
by 5.2 per cent from the second quarter of 2008 to the second quarter of 2009.
Employment dropped by 266,000 net jobs, or 4.0 per cent, from September
2008 to the recessionary low in June 2009.
Government stimulus investment in infrastructure, business investment in
plant and equipment, and strong growth in residential construction supported
Ontario’s economic recovery. Major economic indicators, including real GDP
and employment, are now well above pre‐recession levels. Ontario’s real GDP
has increased by 8.9 per cent since the recessionary low and, as of the second
quarter of 2013, real GDP was 3.3 per cent above its pre‐recession peak.
But given the modest economic recovery, many households and businesses
continue to feel vulnerable about the uncertain global economic environment
and its impact on their future.
Sources: Statistics Canada and Ontario Ministry of Finance.
($ Billions, 2007)
500
550
600
650
2008Q1 2008Q3 2009Q1 2009Q3 2010Q1 2010Q3 2011Q1 2011Q3 2012Q1 2012Q3 2013Q1
Ontario Real GDP since 2008–09 RecessionCHART 2.1
Pre-recession level:$601.6B in 2008Q2
Recession Trough:$570.6B in 2009Q2
$621.4B in 2013Q2

Chapter II: Economic Outlook
85
Since the recessionary low in June 2009, 475,600 net new jobs have been created.
A strong recovery of 452,900 full‐time jobs accounted for over 95 per cent of the
employment gains since the end of the recession, while part‐time employment
increased by 22,800 net jobs. The majority of the net new jobs were in the private
sector and in industries paying above‐average wages. As of September 2013,
Ontario had 209,800 more jobs than at the pre‐recession peak in September 2008.
Ontario’s unemployment rate has also declined from a recessionary high of
9.4 per cent in June 2009 to 7.3 per cent in September 2013.
476 453
23
342
71 63
306
169
0
100
200
300
400
500
Note: Above-average wage industries are defined as those with earnings above the average hourly earnings of all industries.Sources: Statistics Canada and Ontario Ministry of Finance.
Employment Gains since June 2009(Thousands)
Employment Gains Concentrated in Full-Time,Private-Sector, Above-Average Wage Jobs
CHART 2.2

2013 Ontario Economic Outlook and Fiscal Review
86
The pace of job creation in Ontario since June 2009 has been stronger than in
most developed economies, including the United States and the average for
member countries in the Organisation for Economic Co‐operation and
Development (OECD). In addition, the pace of job creation in Ontario since
June 2009 is ahead of all the Great Lakes States and the rest of Canada combined.
Sources: Statistics Canada, U.S. Bureau of Labor Statistics and OECD.
Employment (Per Cent Change from Peak)
U.S.
Ontario
OECD
(8)
(6)
(4)
(2)
0
2
4
2008 2009 2010 2011 2012 2013
Ontario Job Recovery Ahead of U.S. and OECD Average
CHART 2.3

Chapter II: Economic Outlook
87
Global Economic Developments and Outlook The global economy continues to grow at a modest rate. However, real GDP
growth is expected to slow from 3.2 per cent in 2012 to 2.9 per cent this year.
In the United States, tax increases and spending cuts have been a significant
drag on overall growth while the European economy is only just emerging from
a six‐quarter‐long recession. The pace of growth in the major emerging market
economies has also weakened, in part due to increased financial volatility,
a reflection of the anticipated reduction of exceptional monetary stimulus,
or “tapering,” in the United States.
Global economic growth is projected to improve in 2014. Economic growth in
the United States is expected to gradually strengthen. Europe is also expected
to sustain a modest recovery, although weak demand, high unemployment rates
and fiscal challenges continue to pose significant risks. China’s growth is expected
to remain relatively robust, even as it transitions to a more consumption‐based
economy. Other emerging markets are expected to strengthen, as they benefit
from stronger growth in global demand.

2013 Ontario Economic Outlook and Fiscal Review
88
U.S. Economy
The U.S. economy grew at an uneven pace in the first half of 2013 as it
adjusted to higher taxes, spending cuts and volatile financial markets.
However, the underlying momentum of the U.S. economy has proven resilient.
Employment gains, averaging about 180,000 jobs per month so far this year,
have supported stronger household consumption. Motor vehicle sales have
rebounded and the housing market remains on an upward trend.
Long‐term interest rates have increased since April, reflecting market expectations
of a withdrawal of monetary stimulus by the U.S. Federal Reserve. The 10‐year
Treasury yield rose from a low of 1.7 per cent in April to a peak of 3.0 per cent
in early September. Interest rates have partially retraced this increase,
reflecting revised expectations that the Federal Reserve will postpone
the start of “tapering.”
Global Economic Growth to Improve
p = International Monetary Fund projection.Source: International Monetary Fund (October 2013).
5.2
3.93.2 2.9
3.63.0
1.7 1.5 1.2
2.0
7.5
6.2
4.94.5
5.1
0.0
1.0
2.0
3.0
4.0
5.0
6.0
7.0
8.0 Global Economy Emerging and Developing Economies Advanced Economies
Real GDP Growth(Per Cent Change)
CHART 2.4

Chapter II: Economic Outlook
89
U.S. house prices are now about 16 per cent above their recent lows.
Steady employment gains and higher housing and equity prices have helped
repair consumer balance sheets. Household net worth has more than recovered
from the impact of the recession, helping to support consumer spending and
residential investment.
U.S. real GDP is expected to increase by 1.6 per cent this year and to average
2.8 per cent growth over the 2014–16 period. Employment is expected to improve
modestly, with the unemployment rate declining from 7.5 per cent in 2013 to
6.1 per cent by 2016.
Although the markets for Ontario exports have become more diversified in recent
years, the United States remains by far Ontario’s largest trading partner. It was
the destination for about 78 per cent of the province’s international merchandise
exports in 2012. Ontario exports of motor vehicles and parts to the United States
totalled $54.5 billion and accounted for about 34 per cent of Ontario’s
merchandise exports in 2012. U.S. motor vehicle sales are expected to reach
15.6 million units in 2013, up 8.0 per cent from 2012, and to increase to
16.4 million units by 2016, providing a buoyant market for Ontario exports.
Strengthening U.S. Recovery
p = projection.Sources: U.S. Bureau of Economic Analysis and Blue Chip Economic Indicators (October 2013).
(2.8)
2.5 1.8
2.8
1.6
2.6 2.9 2.8
(4.0)
(3.0)
(2.0)
(1.0)
0.0
1.0
2.0
3.0
4.0
2009 2010 2011 2012 2013p 2014p 2015p 2016p
Real GDP Growth(Per Cent Change)
CHART 2.5

2013 Ontario Economic Outlook and Fiscal Review
90
Oil Prices
The price of West Texas Intermediate (WTI) crude oil has averaged $98 US
per barrel so far this year, up from $94 US in 2012. North American oil production
is expected to increase strongly in the near term, the result of technological
innovations in the oil sector. However, despite these increases, strengthening
global demand combined with high recovery costs will keep oil prices at relatively
high levels over the forecast period. Oil prices are forecast to average
$98 US per barrel in 2014, with private‐sector forecasts ranging from $93 US
to $108 US per barrel.
0
20
40
60
80
100
120
2000 2002 2004 2006 2008 2010 2012 2014p 2016p
p = Ontario Ministry of Finance planning projection.Sources: U.S. Energy Information Administration and Ontario Ministry of Finance.
West Texas Intermediate (WTI) Crude Oil ($ US Per Barrel)
CHART 2.6Oil Prices to Remain High

Chapter II: Economic Outlook
91
The Canadian Dollar
The Canadian dollar has edged down from close to parity in 2012 to an average of
98 cents US so far in 2013. The dollar is expected to remain just below parity over
the medium term, although there is a wide divergence of views on the outlook for
the currency. Private‐sector forecasts for the Canada–U.S. dollar exchange rate
in 2016 range from a high of 103 cents US to a low of 93 cents US.
Canadian Dollar to Remain Close to Parity
60
70
80
90
100
110
1990 1992 1994 1996 1998 2000 2002 2004 2006 2008 2010 2012 2014p 2016p
Low and High Private-Sector Projections
p = Ontario Ministry of Finance planning projection.Sources: Bank of Canada, Ontario Ministry of Finance Survey of Forecasters (October 2013) and Ontario Ministry of Finance.
Cents US
CHART 2.7

2013 Ontario Economic Outlook and Fiscal Review
92
Financial Markets
Short‐term interest rates have remained relatively low as central banks around
the world maintain accommodative policies to support growth. Long‐term
interest rates have begun to rise as global financial markets anticipate the
gradual reduction of exceptional monetary stimulus. The timing and pace
of the adjustment are uncertain and, as a result, longer‐term interest rates
are likely to remain volatile. However, both short‐ and long‐term interest rates
are expected to rise over the medium term.
Private‐sector economists expect the interest rate on three‐month Canadian
treasury bills to average 1.0 per cent this year, rise to 1.1 per cent in 2014 and
reach 2.8 per cent by 2016. The yield on 10‐year Government of Canada bonds
is forecast to gradually rise from 2.3 per cent in 2013 to 3.8 per cent by 2016.
Interest Rates to Rise Gradually
0
2
4
6
8
10
12
14
1990 1992 1994 1996 1998 2000 2002 2004 2006 2008 2010 2012 2014p 2016p
3-month Government of Canada Treasury Bill 10-year Government of Canada Bond
p = Ontario Ministry of Finance planning projection.Sources: Bank of Canada and Ontario Ministry of Finance.
Per Cent
CHART 2.8

Chapter II: Economic Outlook
93
Forecasts for key external factors are summarized in the table below.
These are used as the basis for the Ministry of Finance’s forecast for Ontario’s
economic growth.
TABLE 2.2 Outlook for External Factors
2010 2011 2012 2013p 2014p 2015p 2016p
World Real GDP Growth (Per Cent) 5.2 3.9 3.2 2.9 3.6 4.0 4.1 U.S. Real GDP Growth (Per Cent) 2.5 1.8 2.8 1.6 2.6 2.9 2.8 West Texas Intermediate Crude Oil ($US/bbl.) 79 95 94 99 98 96 96 Canadian Dollar (Cents US) 97.1 101.1 100.1 97.4 96.5 97.0 97.0 Three-Month Treasury Bill Rate1
(Per Cent) 0.6 0.9 0.9 1.0 1.1 1.9 2.8 10-Year Government Bond Rate1
(Per Cent) 3.2 2.8 1.9 2.3 3.0 3.3 3.8 p = Ontario Ministry of Finance planning projection based on external sources. 1 Government of Canada interest rates. Sources: IMF World Economic Outlook (October 2013), U.S. Bureau of Economic Analysis, Blue Chip Economic Indicators (October 2013), U.S. Energy Information Administration, Bank of Canada, Ontario Ministry of Finance Survey of Forecasts (October 2013) and Ontario Ministry of Finance.

2013 Ontario Economic Outlook and Fiscal Review
94
Table 2.3 provides current estimates of the impact of changes in key external
factors on the growth of Ontario’s real GDP, assuming other external factors
remain unchanged. The relatively wide range for the impacts reflects uncertainty
regarding how the economy would be expected to respond to these changes in
external conditions.
TABLE 2.3 Impacts of Sustained Changes in Key External Factors on Ontario’s Real GDP Growth
(Percentage Point Change)
First Year Second Year
Canadian Dollar Depreciates by Five Cents US +0.1 to +0.8 +0.2 to +0.9 Crude Oil Prices Increase by $10 US per Barrel –0.1 to –0.3 –0.1 to –0.3 U.S. Real GDP Growth Increases by One Percentage Point +0.3 to +0.7 +0.4 to +0.8 Canadian Interest Rates Increase by One Percentage Point –0.1 to –0.5 –0.2 to –0.6 Source: Ontario Ministry of Finance.

Chapter II: Economic Outlook
95
Outlook for Ontario Economic Growth The Ministry of Finance is forecasting continued growth in Ontario’s economy,
with real GDP projected to grow by 1.3 per cent in 2013, 2.1 per cent in 2014
and 2.5 per cent in both 2015 and 2016. This compares to a forecast for real GDP
growth at the time of the 2013 Budget of 1.5 per cent in 2013, 2.3 per cent in
2014 and 2.4 per cent in both 2015 and 2016.
Gains in exports and business investment will lead economic growth over
the forecast period. Household spending will also grow moderately, in line with
growth in household income.
Household Spending, Business Investment and Trade Will Support Economic Growth
p = Ontario Ministry of Finance planning projection.* For the 2013–16 period, includes intellectual property and inventories.Sources: Statistics Canada and Ontario Ministry of Finance.
2.32.0
0.80.2 0.4
(1.1)
2.1
1.2
(0.1)
0.00.4 0.4
(3.0)
(2.0)
(1.0)
0
1.0
2.0
3.0
Ontario RealGDP Growth
HouseholdSpending
Government ResidentialInvestment
Plant &Equipment*
Net Trade
2000–07 2013–16p
Average Annual Per Cent Change
Average Annual Percentage Point Contribution to Real GDP Growth
CHART 2.9

2013 Ontario Economic Outlook and Fiscal Review
96
Job creation is expected to strengthen over the medium term, with employment
gains averaging 1.5 per cent a year over the forecast period. By 2016, Ontario will
have created nearly a million net new jobs compared to 2003. Solid employment
growth will allow the unemployment rate to decline steadily from an average of
7.5 per cent in 2013 to 6.6 per cent by 2016.
The Ontario Consumer Price Index (CPI) is expected to increase by 1.1 per cent
in 2013, down from a 1.4 per cent increase in 2012. Consumer price inflation
is forecast to be 1.8 per cent in 2014 and then rise to 2.0 per cent in 2015,
the mid‐point of the Bank of Canada’s target range for Canadian CPI inflation.
Real household spending growth is expected to remain steady this year at
1.5 per cent, in line with the increase in real income. Over the 2014–16 period,
real household spending growth is expected to average 2.2 per cent per year.
Employment Expected to Rise over the Medium Term
p = Ontario Ministry of Finance planning projection.Sources: Statistics Canada and Ontario Ministry of Finance.
6.56.6
6.76.8
6.97.0
7.17.2
6.0
6.2
6.4
6.6
6.8
7.0
7.2
7.4
2009 2010 2011 2012 2013p 2014p 2015p 2016p
Employment (Millions)
CHART 2.10

Chapter II: Economic Outlook
97
Housing starts are expected to total 59,000 units in 2013, down from a recent
peak of 77,000 units in 2012. Existing home sales are expected to be essentially
unchanged in 2013, following a 2.1 per cent decline in 2012. Demand for
new homes in Ontario will continue to be sustained by growth in the population.
Housing starts are expected to average 62,500 units per year between 2013
and 2016.
The average Ontario resale home price is expected to increase 3.0 per cent in
2013. Going forward, a balanced resale market is expected to contribute to more
stable average home prices. Although interest rates are expected to rise over
the medium term, mortgage carrying costs are expected to remain affordable.
However, rising debt levels may place some households in a vulnerable position
as interest rates rise.
Housing in Ontario to Remain Affordable
p = Ontario Ministry of Finance planning projection.Note: Carrying cost is based on the average five-year mortgage rate, a 25-year amortization and a 25 per cent down payment.Sources: Statistics Canada, Bank of Canada, Canadian Real Estate Association and Ontario Ministry of Finance.
Mortgage Carrying Cost as a Share of Disposable Income per Household(Per Cent)
15
20
25
30
35
40
45
CHART 2.11
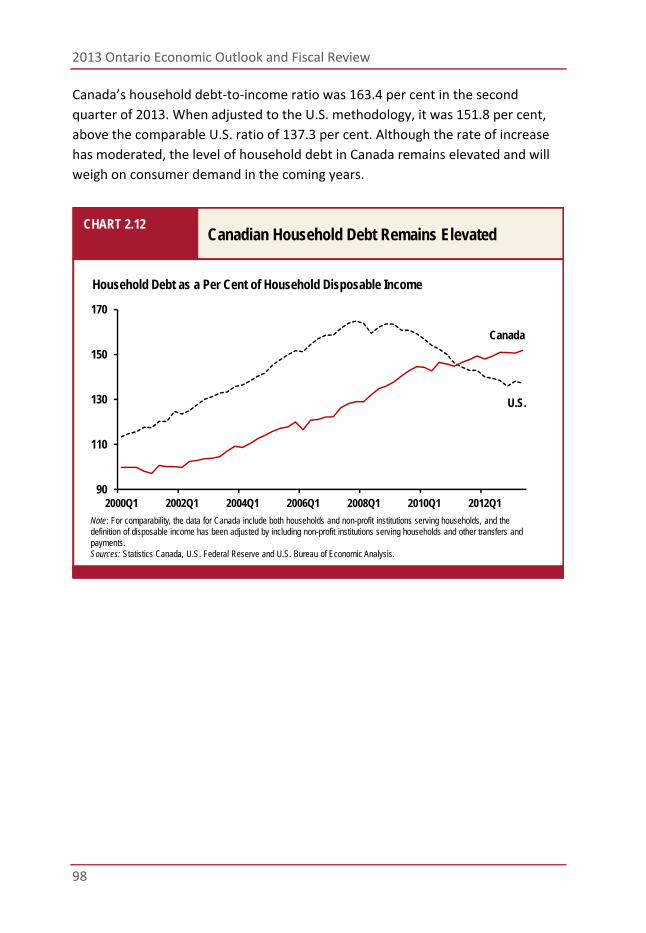
2013 Ontario Economic Outlook and Fiscal Review
98
Canada’s household debt‐to‐income ratio was 163.4 per cent in the second
quarter of 2013. When adjusted to the U.S. methodology, it was 151.8 per cent,
above the comparable U.S. ratio of 137.3 per cent. Although the rate of increase
has moderated, the level of household debt in Canada remains elevated and will
weigh on consumer demand in the coming years.
Canadian Household Debt Remains Elevated
90
110
130
150
170
2000Q1 2002Q1 2004Q1 2006Q1 2008Q1 2010Q1 2012Q1
Note: For comparability, the data for Canada include both households and non-profit institutions serving households, and the definition of disposable income has been adjusted by including non-profit institutions serving households and other transfers and payments.Sources: Statistics Canada, U.S. Federal Reserve and U.S. Bureau of Economic Analysis.
Household Debt as a Per Cent of Household Disposable Income
Canada
U.S.
CHART 2.12
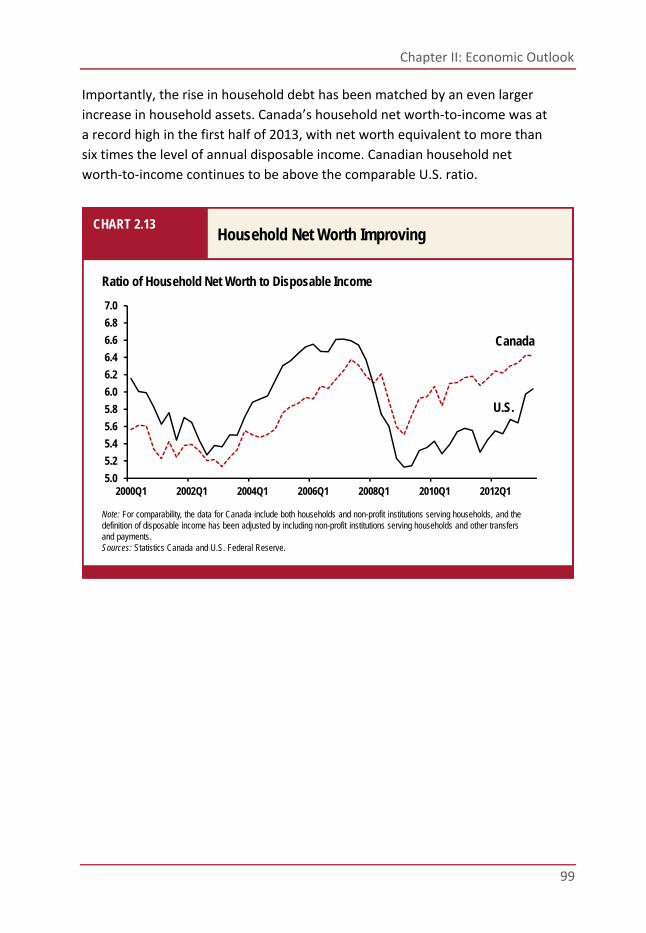
Chapter II: Economic Outlook
99
Importantly, the rise in household debt has been matched by an even larger
increase in household assets. Canada’s household net worth‐to‐income was at
a record high in the first half of 2013, with net worth equivalent to more than
six times the level of annual disposable income. Canadian household net
worth‐to‐income continues to be above the comparable U.S. ratio.
Household Net Worth Improving
5.0
5.2
5.4
5.6
5.8
6.0
6.2
6.4
6.6
6.8
7.0
2000Q1 2002Q1 2004Q1 2006Q1 2008Q1 2010Q1 2012Q1
Canada
Note: For comparability, the data for Canada include both households and non-profit institutions serving households, and the definition of disposable income has been adjusted by including non-profit institutions serving households and other transfers and payments.Sources: Statistics Canada and U.S. Federal Reserve.
Ratio of Household Net Worth to Disposable Income
U.S.
CHART 2.13

2013 Ontario Economic Outlook and Fiscal Review
100
Business investment contributes to Ontario’s economic growth, jobs and prosperity.
However, Ontario lags the United States and the rest of Canada when it comes to
business investment as a share of GDP.
Since the recovery began, Ontario machinery and equipment (M&E) investment,
a key determinant of labour productivity, has trailed investment growth in the
United States. Although Ontario’s real M&E investment is improving, the gap
with the United States has widened.
Ontario Business Machinery and Equipment Investment Lags the United States
p = projection.Note: Business machinery and equipment investment includes intellectual property.Sources: Statistics Canada, U.S. Bureau of Economic Analysis, Blue Chip Economic Indicators (September 2013) and Ontario Ministry of Finance.
75
85
95
105
115
125
2008 2009 2010 2011 2012 2013p 2014p
Ontario
U.S.
(2008=100)
CHART 2.14
Chapter II: Economic Outlook
101
In recent years, Ontario has seen a significant evolution in both the composition
and the destination of its exports. Between 2007 and 2012, exports of services —
including financial services and professional, scientific and computer services —
rose by over 19 per cent. Exports to other provinces rose by about 13 per cent.
Over the same period, merchandise exports to the United States declined by
over 14 per cent while exports to countries other than the United States grew
by 23 per cent.
This dramatic shift in Ontario’s exports is expected to continue. Ontario’s growing
knowledge economy will contribute to a rise in services exports. Exports of
services, which account for about 33 per cent of total exports, are projected to
grow at a faster pace than goods exports. As well, exports to other provinces,
which account for about 35 per cent of total Ontario exports, are expected to
strengthen as economic growth in the rest of Canada accelerates. Ontario
exporters are also developing new markets in fast‐growing emerging economies,
such as China, India and Indonesia. At the same time, the continuing recovery
in U.S. consumption and business investment, including motor vehicle sales,
will also support Ontario’s international exports. Real exports are projected
to increase by an average of 3.2 per cent annually between 2013 and 2016,
outpacing a 2.4 per cent increase in imports. This will lead to an improvement
in Ontario’s net trade position and contribute to overall economic growth.

2013 Ontario Economic Outlook and Fiscal Review
102
Exports Expected to Increase
p = Ontario Ministry of Finance planning projection.Sources: Statistics Canada and Ontario Ministry of Finance.
336
317
277
302
320
334340
352
367379
250
300
350
400
2007 2008 2009 2010 2011 2012 2013p 2014p 2015p 2016p
($ Billions, 2007)
CHART 2.15

Chapter II: Economic Outlook
103
Details of the Ontario Economic Outlook The following table provides details of the Ministry of Finance’s economic outlook
for 2013 to 2016.
TABLE 2.4 The Ontario Economy, 2011 to 2016
(Per Cent Change)
Actual Projection
2011 2012 2013 2014 2015 2016
Real Gross Domestic Product 1.8 1.5 1.3 2.1 2.5 2.5
Household Consumption 2.3 1.4 1.5 2.1 2.2 2.2 Residential Construction 3.9 6.7 0.2 (0.9) 1.0 2.4 Non-residential Construction 8.0 0.4 (0.6) 3.4 3.2 3.5 Machinery and Equipment 17.5 4.8 0.5 5.6 5.4 5.3 Exports 6.1 4.4 1.7 3.7 4.0 3.3 Imports 7.4 4.3 1.6 2.7 3.0 2.2 Nominal Gross Domestic Product 4.8 3.0 2.5 3.8 4.3 4.3
Other Economic Indicators
Retail Sales 3.6 1.6 1.9 3.8 3.8 3.8 Housing Starts (000s) 67.8 76.7 59.0 58.0 65.0 68.0 Home Resales 2.6 (2.1) 0.5 2.0 2.0 2.0 Primary Household Income 4.2 3.2 2.9 3.6 4.4 4.7 Compensation of Employees 4.3 3.1 2.9 3.7 4.2 4.4 Net Operating Surplus — Corporations 14.1 (2.0) (3.6) 4.6 4.2 4.4 Consumer Price Index 3.1 1.4 1.1 1.8 2.0 2.0 Employment 1.8 0.8 1.5 1.4 1.6 1.5 Job Creation (000s) 121 52 104 97 114 110 Unemployment Rate (Per Cent) 7.8 7.8 7.5 7.3 7.0 6.6 Key External Variables
U.S. Real Gross Domestic Product 1.8 2.8 1.6 2.6 2.9 2.8 WTI Crude Oil ($ US per Barrel) 95 94 99 98 96 96 Canadian Dollar (Cents US) 101.1 100.1 97.4 96.5 97.0 97.0 3-month Treasury Bill Rate1 0.9 0.9 1.0 1.1 1.9 2.8 10-year Government Bond Rate1 2.8 1.9 2.3 3.0 3.3 3.8 1 Government of Canada interest rates (per cent). Sources: Statistics Canada, Canada Mortgage and Housing Corporation, Bank of Canada, U.S. Bureau of Economic Analysis, Blue Chip Economic Indicators (October 2013), U.S. Energy Information Administration and Ontario Ministry of Finance.

2013 Ontario Economic Outlook and Fiscal Review
104
Private-Sector Forecasts
The Ministry of Finance consults with private‐sector economists and tracks their
forecasts to inform the government’s planning assumptions. Additionally, in the
process of preparing the 2013 Ontario Economic Outlook and Fiscal Review,
the Minister of Finance met with private‐sector economists to discuss their views
on the economy. All private‐sector economists are projecting continued growth
for Ontario over the forecast horizon. On average, private‐sector economists are
projecting growth of 1.4 per cent in 2013, 2.2 per cent in 2014 and 2.6 per cent in
both 2015 and 2016. For prudent fiscal planning, the Ministry of Finance’s real
GDP growth projections are slightly below the average private‐sector forecast.
TABLE 2.5 Private‐Sector Forecasts for Ontario Real GDP Growth
(Per Cent)
2013 2014 2015 2016
BMO Capital Markets (October) 1.4 2.2 – – Central 1 Credit Union (October) 1.2 1.9 2.6 2.8 Centre for Spatial Economics (August) 1.3 1.4 2.4 2.4 CIBC World Markets (October/April) 1.4 2.3 2.3 2.1 Conference Board of Canada (July) 1.2 2.2 2.8 2.6 Desjardins Group (October/June) 1.4 2.3 2.8 2.5 IHS Global Insight (July) 1.5 2.4 2.7 2.7 Laurentian Bank Securities (September) 1.5 2.3 2.5 – National Bank (October) 1.2 2.1 – – RBC Financial Group (September) 1.3 2.8 – – Scotiabank Group (October) 1.4 2.0 – – TD Bank Financial Group (October) 1.5 2.3 2.7 – University of Toronto (August) 1.3 2.4 2.9 2.9 Private-Sector Survey Average 1.4 2.2 2.6 2.6
Ontario’s Planning Assumption 1.3 2.1 2.5 2.5
Sources: Ontario Ministry of Finance Survey of Forecasts (October 2013) and Ontario Ministry of Finance.

Chapter II: Economic Outlook
105
Change in the Economic Outlook
The current private‐sector average outlook for Ontario real GDP growth
is 1.4 per cent in 2013, down from 1.6 per cent projected at the time of the
2013 Budget. The softer outlook reflects slower growth in the United States.
Forecasts for 2014 have also been revised down somewhat compared
to forecasts at the time of the 2013 Budget.
Weaker Private-Sector Outlook for Growth in 2013 and 2014
1.6
2.4 2.5 2.5
1.4
2.2
2.6 2.6
0.0
0.5
1.0
1.5
2.0
2.5
3.0
3.5
2013p 2014p 2015p 2016p
2013 Budget Current
Projections for Ontario Real GDP Growth(Per Cent)
p = private-sector survey average projection. Source: Ontario Ministry of Finance Survey of Forecasts.
CHART 2.16
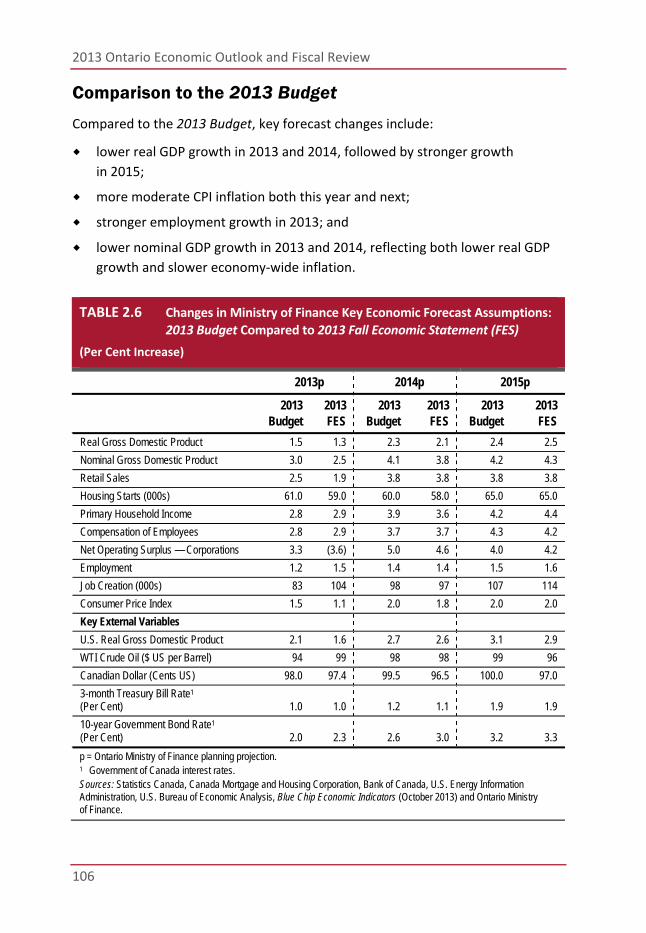
2013 Ontario Economic Outlook and Fiscal Review
106
Comparison to the 2013 Budget
Compared to the 2013 Budget, key forecast changes include:
lower real GDP growth in 2013 and 2014, followed by stronger growth
in 2015;
more moderate CPI inflation both this year and next;
stronger employment growth in 2013; and
lower nominal GDP growth in 2013 and 2014, reflecting both lower real GDP
growth and slower economy‐wide inflation.
TABLE 2.6 Changes in Ministry of Finance Key Economic Forecast Assumptions:
2013 Budget Compared to 2013 Fall Economic Statement (FES)
(Per Cent Increase)
2013p 2014p 2015p
2013 Budget
2013 FES
2013 Budget
2013 FES
2013 Budget
2013 FES
Real Gross Domestic Product 1.5 1.3 2.3 2.1 2.4 2.5 Nominal Gross Domestic Product 3.0 2.5 4.1 3.8 4.2 4.3 Retail Sales 2.5 1.9 3.8 3.8 3.8 3.8 Housing Starts (000s) 61.0 59.0 60.0 58.0 65.0 65.0 Primary Household Income 2.8 2.9 3.9 3.6 4.2 4.4 Compensation of Employees 2.8 2.9 3.7 3.7 4.3 4.2 Net Operating Surplus — Corporations 3.3 (3.6) 5.0 4.6 4.0 4.2 Employment 1.2 1.5 1.4 1.4 1.5 1.6 Job Creation (000s) 83 104 98 97 107 114 Consumer Price Index 1.5 1.1 2.0 1.8 2.0 2.0 Key External Variables U.S. Real Gross Domestic Product 2.1 1.6 2.7 2.6 3.1 2.9 WTI Crude Oil ($ US per Barrel) 94 99 98 98 99 96 Canadian Dollar (Cents US) 98.0 97.4 99.5 96.5 100.0 97.0 3-month Treasury Bill Rate1 (Per Cent) 1.0 1.0 1.2 1.1 1.9 1.9 10-year Government Bond Rate1 (Per Cent) 2.0 2.3 2.6 3.0 3.2 3.3 p = Ontario Ministry of Finance planning projection. 1 Government of Canada interest rates. Sources: Statistics Canada, Canada Mortgage and Housing Corporation, Bank of Canada, U.S. Energy Information Administration, U.S. Bureau of Economic Analysis, Blue Chip Economic Indicators (October 2013) and Ontario Ministry of Finance.

III
Fiscal Outlook
Chapter


Chapter III: Fiscal Outlook
109
Highlights 2012–13 deficit — $9.2 billion, $0.6 billion lower than projected at the time
of the 2013 Budget.
2013–14 deficit projection — $11.7 billion, on track with the 2013 Budget
forecast and more than $1.0 billion ahead of the projection in the
2012 Budget.
Despite slower economic growth in 2013 and 2014, the revenue projection
for 2013–14 is consistent with the 2013 Budget forecast.
Outlook for program spending in 2013–14 — $117.0 billion, unchanged from
the 2013 Budget forecast and the 2012 Budget projection.

2013 Ontario Economic Outlook and Fiscal Review
110
Chapter III: Fiscal Outlook
111
Section A: Overview
The government is on track to balance the budget by 2017–18 in a fair and
responsible way. This will mean new strategic investments to spur growth,
create jobs, strengthen services and help families. The world’s recovery from the
global recession remains uncertain, and many families are still feeling unsure
about their job security and their financial future.
Should global economic conditions falter, causing revenues to fall further,
the government’s continued priority will be to protect investments in jobs,
growth and families ahead of short‐term targets. Stronger growth and new jobs
are the surest and fairest path to balancing the budget. These investments will be
critical to helping foster the growth necessary to both support Ontario’s families
and generate revenues necessary to support eliminating the deficit.
For four years in a row, the government has overachieved on the deficit targets it
established after the 2009 global recession based on disciplined actions to reduce
spending. In September, the 2012–2013 Public Accounts of Ontario reported that
the deficit for 2012–13 was $9.2 billion — $0.6 billion lower than projected at the
time of the 2013 Budget.
The 2013 Ontario Economic Outlook and Fiscal Review projects that the deficit for
2013–14 will be $11.7 billion, on track with the 2013 Budget forecast and more
than $1.0 billion ahead of the deficit projection for 2013–14 outlined in the 2012
Budget. The outlook for program spending in 2013–14, at $117.0 billion, remains
unchanged from the 2013 Budget forecast and the 2012 Budget projection.
Ontario continues to face global economic uncertainty, which is holding back
economic growth and therefore the outlook for Provincial revenues. Since the
2013 Budget, slower growth in the United States has resulted in a lower forecast
for economic growth in Ontario.

2013 Ontario Economic Outlook and Fiscal Review
112

Chapter III: Fiscal Outlook
113
Section B: 2013–14 Fiscal Performance
The deficit for 2013–14 is currently projected to be $11.7 billion, on track with the
2013 Budget forecast and more than $1.0 billion ahead of the deficit projection for
2013–14 outlined in the 2012 Budget. Despite slower economic growth in 2013
and 2014, revenues are on track with the 2013 Budget projection.
Similarly, expense is on track with the 2013 Budget projection, reflecting the
government’s commitment to manage spending. The 2013–14 program expense
outlook is essentially unchanged from the 2013 Budget projection and is also
consistent with the 2012 Budget projection, which forecasted program expense
of $117.0 billion in 2013–14.
With the economy in a period of sustained moderate growth, the government
remains on track to balance the budget by 2017–18 in a fair and responsible way.
The 2013–14 outlook maintains a $1.0 billion reserve to protect the fiscal plan
against any adverse changes in the Province’s revenue and expense. If the reserve
is not needed by year‐end, it will be applied to reduce the deficit.
TABLE 3.1 2013–14 In‐Year Fiscal Performance
($ Millions)
Budget
Plan Current Outlook
In-Year Change
Revenue 116,845 116,834 (11)
Expense Programs 116,983 116,970 (13) Interest on Debt 10,605 10,605 – Total Expense 127,588 127,575 (13)
Reserve 1,000 1,000 – Surplus/(Deficit) (11,743) (11,741) 2
Note: Numbers may not add due to rounding.

2013 Ontario Economic Outlook and Fiscal Review
114
2013–14 Revenue Changes since the 2013 Budget
The 2013–14 revenue outlook, at $116,834 million, is $11 million below the
projection in the 2013 Budget.
TABLE 3.2 Summary of Revenue Changes since the 2013 Budget
($ Millions)
2013–14
Taxation Corporations Tax 750 Personal Income Tax (700) Ontario Health Premium (70) Sales Tax (250) Land Transfer Tax 80 All Other Taxes (70) Total Taxation (260)
Other Non-Tax Revenue Gain on Sale of GM Shares 249 Total Other Non-Tax Revenue 249
Total Revenue Changes since the 2013 Budget (11)
Note: Numbers may not add due to rounding.
Details of 2013–14 In-Year Revenue Changes
Key changes to revenue projections since the 2013 Budget include:
Corporations Tax revenue is $750 million, or 6.7 per cent, higher due to
stronger‐than‐expected 2012 and prior‐year assessments based on tax returns
processed since the 2013 Budget.
Personal Income Tax revenue is $700 million, or 2.5 per cent, lower due to
weaker‐than‐projected 2012 and prior‐year assessments based on tax returns
processed since the 2013 Budget.
Ontario Health Premium revenue is $70 million, or 2.2 per cent, lower due to
weaker‐than‐projected 2012 and prior‐year assessments based on tax returns
processed since the 2013 Budget.

Chapter III: Fiscal Outlook
115
Sales Tax revenue is $250 million, or 1.3 per cent, lower mostly due to a
downward revision to Ontario’s estimated 2013 Harmonized Sales Tax
entitlement by the federal government.
Land Transfer Tax is $80 million, or 5.8 per cent, higher, reflecting stronger
receipts to date as the Ontario housing market has outperformed
expectations.
Other Taxes are $70 million lower, mainly due to lower‐than‐expected
Mining Tax revenue mostly because of large prior‐year refunds and lower
instalment payments.
The $249 million increase in Other Non‐Tax revenue reflects the gain on
the sale, announced on September 10, 2013, of the Province’s interest in
10 million shares of General Motors Company. The government is committed
to using the proceeds from this sale in the future to strategically invest in
Ontario’s infrastructure. The government proposes to establish the Trillium
Trust to ensure the proceeds are invested strategically and at the
appropriate time.

2013 Ontario Economic Outlook and Fiscal Review
116
2013–14 Expense Changes since the 2013 Budget
The 2013–14 total expense outlook, at $127,575 million, is $13 million lower than
the projection in the 2013 Budget.
Details of 2013–14 In-Year Expense Changes
Key changes to expense projections since the 2013 Budget with offsets from
the Contingency Funds include:
An increase of $32.0 million to cover emergency forest firefighting expenses
until the end of the 2013 fire season.
An increase of $18.0 million to provide financial assistance to a number of
municipalities and victims affected by spring flooding in Central, Eastern and
Northern Ontario through the Ministry of Municipal Affairs and Housing’s
Ontario Disaster Relief Assistance Program.
An increase of $8.5 million to help showcase Ontario and create a lasting
legacy for people across the province surrounding the 2015 Pan/Parapan
American Games.
TABLE 3.3 Summary of Expense Changes since the 2013 Budget
($ Millions)
2013–14
Program Expense Changes
Ontario Northland Transportation Commission 75.0 Emergency forest firefighting 32.0 Ontario Disaster Relief Assistance Program 18.0 2015 Pan/Parapan American Games: promotion and legacy strategy 8.5 Ministry of Natural Resources transformation plan (13.0) Contingency Funds (58.5) Transition Fund (75.0) Total Program Expense Changes (13.0)
Interest on Debt – Total Expense Changes since the 2013 Budget (13.0)
Note: Numbers may not add due to rounding.
Chapter III: Fiscal Outlook
117
Key changes to expense projections since the 2013 Budget with offsets from
the Transition Fund include:
An increase of $75.0 million to the Ontario Northland Transportation
Commission to support ongoing operations in 2013–14 and to ensure safety
while stakeholder consultations and transformation activities continue.
Other key changes to expense projections since the 2013 Budget include:
A decrease of $13.0 million resulting from an internal realignment of funds
from operating expense to capital asset, which is amortized over the life of
the asset. This investment is part of the Ministry of Natural Resources’
transformation plan and is primarily for improving capital infrastructure
in Ontario parks.
Interest on debt expense is unchanged from the forecast in the 2013 Budget.

2013 Ontario Economic Outlook and Fiscal Review
118

Chapter III: Fiscal Outlook
119
Section C: Details of Ontario’s Finances
Fiscal Tables and Charts This section provides information on the Province’s historical financial
performance, key fiscal indicators, and details of Ontario’s fiscal plan and outlook.
TABLE 3.4 Fiscal Summary
($ Millions)
2013–14
Actual
2012–13 Budget
Plan Current Outlook
Change since
Budget
Revenue 113,369 116,845 116,834 (11)
Expense Programs 112,248 116,983 116,970 (13) Interest on Debt 10,341 10,605 10,605 – Total Expense 122,589 127,588 127,575 (13)
Reserve – 1,000 1,000 – Surplus/(Deficit) (9,220) (11,743) (11,741) 2
Note: Numbers may not add due to rounding.

2013 Ontario Economic Outlook and Fiscal Review
120
TABLE 3.5 Revenue
($ Millions)
2010–11 2011–12 Actual
2012–13
Current Outlook 2013–14
Taxation Revenue Personal Income Tax 23,711 24,548 25,574 26,878 Sales Tax1 18,813 20,159 20,957 21,606 Corporations Tax 9,067 9,944 12,093 12,019 Education Property Tax2 5,659 5,765 5,511 5,694 Employer Health Tax 4,733 5,092 5,137 5,318 Ontario Health Premium 2,934 2,916 3,067 3,156 Gasoline Tax 2,358 2,380 2,390 2,377 Land Transfer Tax 1,247 1,432 1,484 1,462 Tobacco Tax 1,160 1,150 1,142 1,123 Fuel Tax 702 710 710 719 Beer and Wine Tax 397 561 560 574 Electricity Payments-In-Lieu of Taxes 321 367 324 366 Other Taxes 562 574 469 423 71,664 75,598 79,418 81,715 Government of Canada Canada Health Transfer 10,184 10,705 11,315 12,067 Canada Social Transfer 4,330 4,469 4,591 4,727 Equalization 972 2,200 3,261 3,169 Infrastructure Programs 1,712 362 116 145 Labour Market Programs 1,201 904 897 905 Social Housing 493 489 483 468 Wait Times Reduction Fund 97 97 97 97 Other Federal Payments 4,052 2,079 901 897 23,041 21,305 21,661 22,475 Government Business Enterprises Ontario Lottery and Gaming Corporation 1,956 1,882 1,816 2,020 Liquor Control Board of Ontario 1,562 1,659 1,721 1,747 Ontario Power Generation Inc./Hydro One Inc. 1,048 872 932 712 4,566 4,413 4,469 4,479 Other Non-Tax Revenue Reimbursements 1,036 831 932 973 Vehicle and Driver Registration Fees 1,080 1,075 1,125 1,273 Electricity Debt Retirement Charge 944 952 939 957 Power Supply Contract Recoveries 1,288 1,372 1,323 1,274 Sales and Rentals 1,015 1,193 1,188 1,075 Other Fees and Licences 715 776 760 821 Net Reduction of Power Purchase Contract Liability 339 317 263 243 Royalties 145 200 226 242 Miscellaneous Other Non-Tax Revenue3 1,342 1,741 1,065 1,307 7,904 8,457 7,821 8,165 Total Revenue 107,175 109,773 113,369 116,834 1 Beginning July 1, 2010, most of the Retail Sales Tax was replaced with a value-added tax and combined with the federal
Goods and Services Tax to create a federally administered Harmonized Sales Tax (HST). Sales Tax revenue is net of the Ontario Sales Tax Credit and the energy component of the Ontario Energy and Property Tax Credit.
2 Education Property Tax revenue is net of the property tax credit component of the Ontario Energy and Property Tax Credit and the Ontario Senior Homeowners’ Property Tax Grant.
3 Miscellaneous Other Non-Tax Revenue in 2011–12 is higher than other years due to one-time revenues including Chrysler’s repayment of an Ontario loan and higher-than-usual recoveries of prior-year expenditures from government ministries.
Note: Numbers may not add due to rounding.

Chapter III: Fiscal Outlook
121
TABLE 3.6 Total Expense
($ Millions)
Ministry Expense 2010–11 2011–12 Actual
2012–13
Current Outlook 2013–14
Aboriginal Affairs1 65 67 65 64.7 Agriculture and Food / Rural Affairs1 895 1,038 1,017 1,034.5 Attorney General 1,594 1,705 1,683 1,751.3 Board of Internal Economy2 194 271 197 200.0 Children and Youth Services 3,882 3,943 3,999 4,160.9 Citizenship and Immigration 104 108 111 103.9 Community and Social Services 8,920 9,347 9,720 10,173.0 Community Safety and Correctional Services 2,216 2,171 2,282 2,326.1 Consumer Services 18 19 20 24.0 Economic Development, Trade and Employment / Research and Innovation1 876 973 963 911.1 Education1 21,871 22,944 23,044 24,147.6 Energy1 724 498 341 339.6 Environment1 512 529 491 495.2 Executive Offices 32 31 30 30.8 Finance1 1,050 932 847 1,043.8 Francophone Affairs, Office of 5 5 5 5.0 Government Services1 1,030 1,105 1,145 1,064.4 Health and Long-Term Care 44,414 46,503 47,582 48,854.9 Infrastructure1 305 331 66 221.7 Labour 186 184 280 305.4 Municipal Affairs and Housing1 881 824 827 789.6 Natural Resources1 718 713 688 702.5 Northern Development and Mines 704 726 718 799.6 Tourism, Culture and Sport1 1,086 1,180 1,431 1,197.3 Training, Colleges and Universities1 6,704 7,121 7,355 7,665.1 Transportation 2,263 2,339 2,479 2,767.1 Interest on Debt3 9,480 10,082 10,341 10,605.0 Other Expense1 10,457 7,053 4,862 6,791.0 Year-End Savings4 – – – (1,000.0) Total Expense 121,186 122,742 122,589 127,575.0 1 Details on other ministry expense can be found in Table 3.7, Other Expense. 2 The 2011–12 amount includes expenses for the 2011 general election. 3 Interest on debt is net of interest capitalized during construction of tangible capital assets of $203 million in 2010–11,
$234 million in 2011–12, $232 million in 2012–13 and $271 million in 2013–14. 4 As in past years, the Year-End Savings provision reflects anticipated underspending that has historically arisen at
year-end due to factors such as program efficiencies, and changes in project startups and implementation plans. Note: Numbers may not add due to rounding.

2013 Ontario Economic Outlook and Fiscal Review
122
TABLE 3.7 Other Expense
($ Millions)
Ministry Expense 2010–11 2011–12 Actual
2012–13
Current Outlook 2013–14
Aboriginal Affairs One-Time Investments — Settlements 6 28 – – Agriculture and Food / Rural Affairs Time-Limited Investments in Infrastructure 1,496 247 19 136.3 Time-Limited Assistance 9 – – – Economic Development, Trade and Employment / Research and Innovation Time-Limited Investments for Youth – – – 50.0 Education One-Time Savings — Labour Savings – – (1,296) – Teachers’ Pension Plan1 522 523 895 939.0 Energy Ontario Clean Energy Benefit 300 1,033 994 1,040.0 Environment Time-Limited Investments – – 78 – Finance Harmonized Sales Tax Transitional Support 3,039 1,440 – – Ontario Municipal Partnership Fund 684 598 592 568.9 Operating Contingency Fund – – – 442.7 Power Supply Contract Costs 1,288 1,375 1,323 1,274.0 Transition Fund – – – 75.0 Government Services Pension and Other Employee Future Benefits 1,182 1,300 1,519 1,516.0 Infrastructure Capital Contingency Fund – – – 98.8 Municipal Affairs and Housing Time-Limited Investments in Municipal Social and
Affordable Housing 668 59 158 155.2 Time-Limited Investments 21 9 42 21.0 Natural Resources Emergency Forest Firefighting 100 209 180 102.7 Tourism, Culture and Sport Time-Limited Investments—Sport Program 288 37 – – One-Time Investments 22 3 – – Time-Limited Investments to Support the
2015 Pan/Parapan American Games 16 59 358 293.4 Training, Colleges and Universities Time-Limited Investments 816 133 – 78.0 Total Other Expense 10,457 7,053 4,862 6,791.0 1 Numbers reflect PSAB pension expense. Ontario’s matching contributions to the plan grow from $1,316 million in
2010–11 to $1,452 million in 2013–14. Note: Numbers may not add due to rounding.
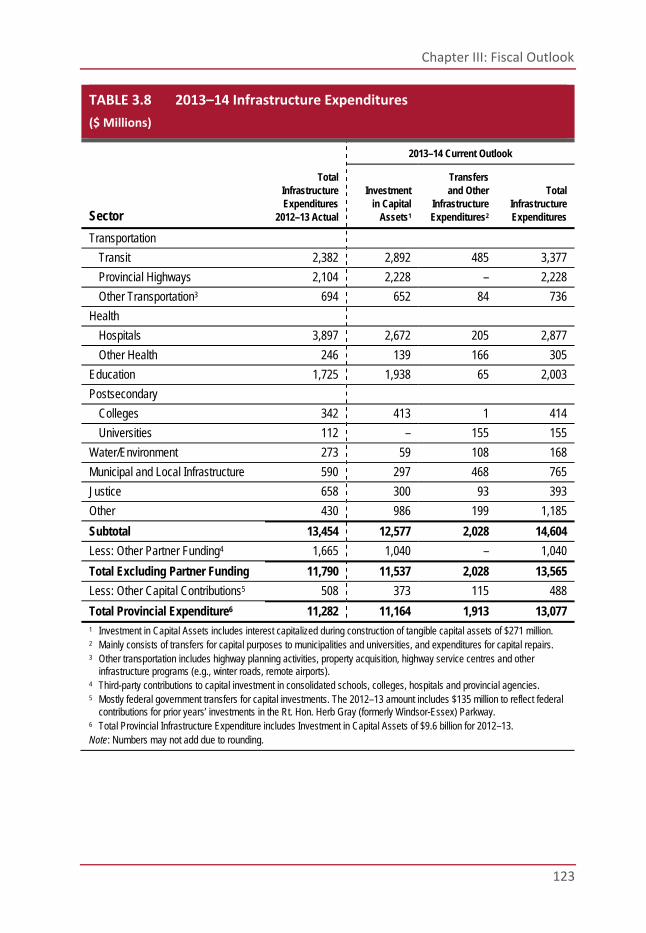
Chapter III: Fiscal Outlook
123
TABLE 3.8 2013–14 Infrastructure Expenditures
($ Millions)
Sector
Total Infrastructure Expenditures
2012–13 Actual
2013–14 Current Outlook
Investment in Capital
Assets1
Transfers and Other
Infrastructure Expenditures2
Total Infrastructure Expenditures
Transportation Transit 2,382 2,892 485 3,377 Provincial Highways 2,104 2,228 – 2,228 Other Transportation3 694 652 84 736 Health Hospitals 3,897 2,672 205 2,877 Other Health 246 139 166 305 Education 1,725 1,938 65 2,003 Postsecondary Colleges 342 413 1 414 Universities 112 – 155 155 Water/Environment 273 59 108 168 Municipal and Local Infrastructure 590 297 468 765 Justice 658 300 93 393 Other 430 986 199 1,185 Subtotal 13,454 12,577 2,028 14,604
Less: Other Partner Funding4 1,665 1,040 – 1,040 Total Excluding Partner Funding 11,790 11,537 2,028 13,565
Less: Other Capital Contributions5 508 373 115 488 Total Provincial Expenditure6 11,282 11,164 1,913 13,077 1 Investment in Capital Assets includes interest capitalized during construction of tangible capital assets of $271 million. 2 Mainly consists of transfers for capital purposes to municipalities and universities, and expenditures for capital repairs. 3 Other transportation includes highway planning activities, property acquisition, highway service centres and other
infrastructure programs (e.g., winter roads, remote airports). 4 Third-party contributions to capital investment in consolidated schools, colleges, hospitals and provincial agencies. 5 Mostly federal government transfers for capital investments. The 2012–13 amount includes $135 million to reflect federal
contributions for prior years’ investments in the Rt. Hon. Herb Gray (formerly Windsor-Essex) Parkway. 6 Total Provincial Infrastructure Expenditure includes Investment in Capital Assets of $9.6 billion for 2012–13. Note: Numbers may not add due to rounding.
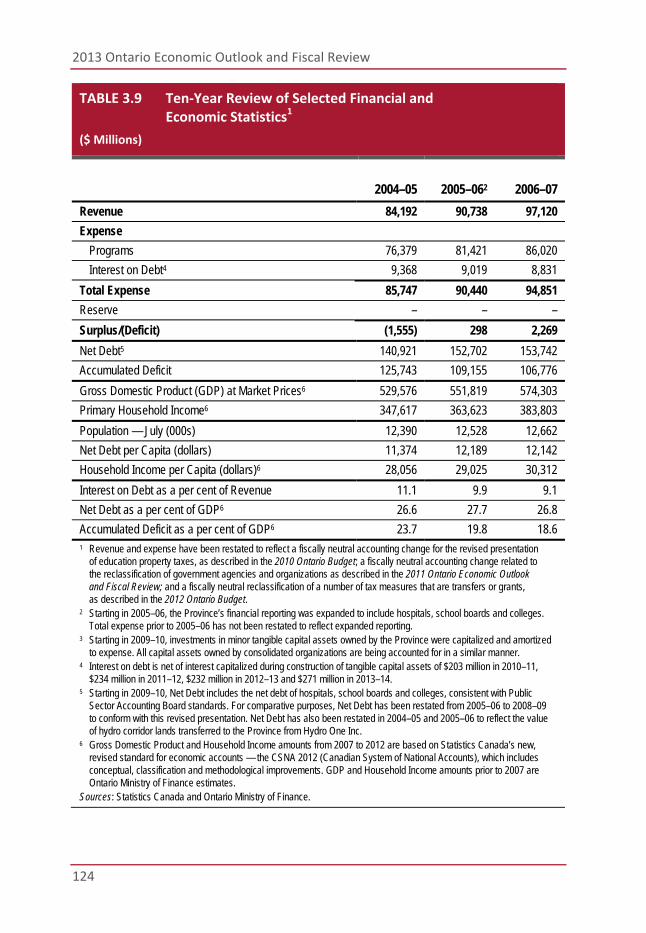
2013 Ontario Economic Outlook and Fiscal Review
124
TABLE 3.9 Ten‐Year Review of Selected Financial and Economic Statistics1
($ Millions)
2004–05 2005–062 2006–07
Revenue 84,192 90,738 97,120
Expense Programs 76,379 81,421 86,020 Interest on Debt4 9,368 9,019 8,831 Total Expense 85,747 90,440 94,851
Reserve – – – Surplus/(Deficit) (1,555) 298 2,269
Net Debt5 140,921 152,702 153,742 Accumulated Deficit 125,743 109,155 106,776 Gross Domestic Product (GDP) at Market Prices6 529,576 551,819 574,303 Primary Household Income6 347,617 363,623 383,803 Population — July (000s) 12,390 12,528 12,662 Net Debt per Capita (dollars) 11,374 12,189 12,142 Household Income per Capita (dollars)6 28,056 29,025 30,312 Interest on Debt as a per cent of Revenue 11.1 9.9 9.1 Net Debt as a per cent of GDP6 26.6 27.7 26.8 Accumulated Deficit as a per cent of GDP6 23.7 19.8 18.6 1 Revenue and expense have been restated to reflect a fiscally neutral accounting change for the revised presentation
of education property taxes, as described in the 2010 Ontario Budget; a fiscally neutral accounting change related to the reclassification of government agencies and organizations as described in the 2011 Ontario Economic Outlook and Fiscal Review; and a fiscally neutral reclassification of a number of tax measures that are transfers or grants, as described in the 2012 Ontario Budget.
2 Starting in 2005–06, the Province’s financial reporting was expanded to include hospitals, school boards and colleges. Total expense prior to 2005–06 has not been restated to reflect expanded reporting.
3 Starting in 2009–10, investments in minor tangible capital assets owned by the Province were capitalized and amortized to expense. All capital assets owned by consolidated organizations are being accounted for in a similar manner.
4 Interest on debt is net of interest capitalized during construction of tangible capital assets of $203 million in 2010–11, $234 million in 2011–12, $232 million in 2012–13 and $271 million in 2013–14.
5 Starting in 2009–10, Net Debt includes the net debt of hospitals, school boards and colleges, consistent with Public Sector Accounting Board standards. For comparative purposes, Net Debt has been restated from 2005–06 to 2008–09 to conform with this revised presentation. Net Debt has also been restated in 2004–05 and 2005–06 to reflect the value of hydro corridor lands transferred to the Province from Hydro One Inc.
6 Gross Domestic Product and Household Income amounts from 2007 to 2012 are based on Statistics Canada’s new, revised standard for economic accounts — the CSNA 2012 (Canadian System of National Accounts), which includes conceptual, classification and methodological improvements. GDP and Household Income amounts prior to 2007 are Ontario Ministry of Finance estimates.
Sources: Statistics Canada and Ontario Ministry of Finance.
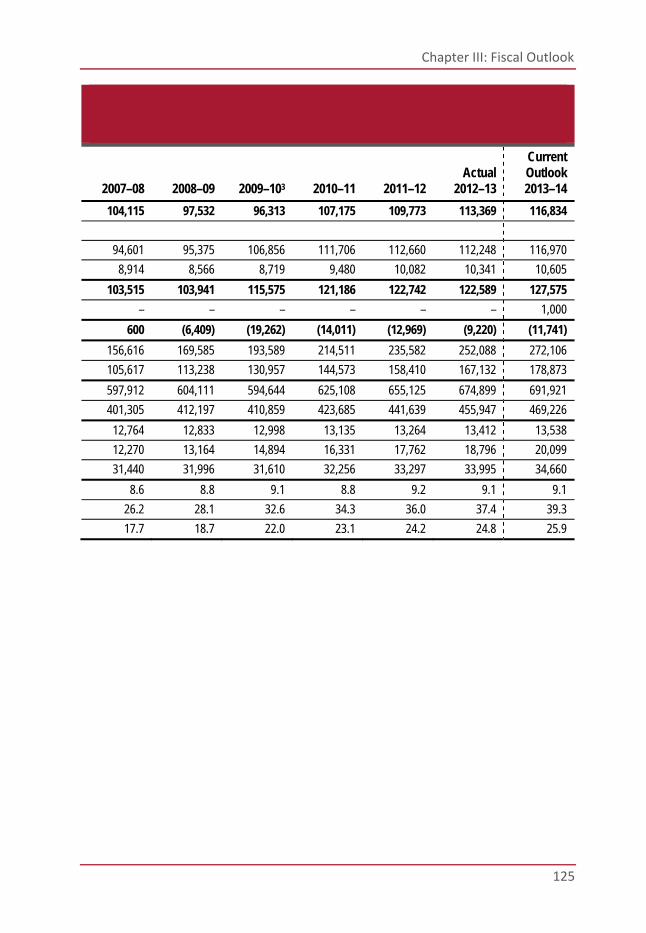
Chapter III: Fiscal Outlook
125
2007–08
2008–09
2009–103
2010–11 2011–12 Actual
2012–13
Current Outlook 2013–14
104,115 97,532 96,313 107,175 109,773 113,369 116,834
94,601 95,375 106,856 111,706 112,660 112,248 116,970 8,914 8,566 8,719 9,480 10,082 10,341 10,605
103,515 103,941 115,575 121,186 122,742 122,589 127,575
– – – – – – 1,000 600 (6,409) (19,262) (14,011) (12,969) (9,220) (11,741)
156,616 169,585 193,589 214,511 235,582 252,088 272,106 105,617 113,238 130,957 144,573 158,410 167,132 178,873 597,912 604,111 594,644 625,108 655,125 674,899 691,921 401,305 412,197 410,859 423,685 441,639 455,947 469,226 12,764 12,833 12,998 13,135 13,264 13,412 13,538 12,270 13,164 14,894 16,331 17,762 18,796 20,099 31,440 31,996 31,610 32,256 33,297 33,995 34,660
8.6 8.8 9.1 8.8 9.2 9.1 9.1 26.2 28.1 32.6 34.3 36.0 37.4 39.3 17.7 18.7 22.0 23.1 24.2 24.8 25.9

2013 Ontario Economic Outlook and Fiscal Review
126
Note: Numbers may not add due to rounding.
Composition of Revenue, 2013–14CHART 3.1
Education Property Tax4.9% $5.7B
Personal Income Tax
23.0% $26.9B
Employer Health Tax4.6% $5.3B
Corporations Tax10.3% $12.0B
Gasoline and Fuel Taxes2.7% $3.1B
Other Taxes3.4% $3.9B
Other Non-Tax Revenue7.0% $8.2B Income from Government
Business Enterprises3.8% $4.5B
Ontario Health Premium2.7% $3.2B
Sales Tax18.5% $21.6B
Federal Transfers
19.2% $22.5B

Chapter III: Fiscal Outlook
127
1 Excludes Teachers’ Pension Plan. Teachers’ Pension Plan expense is included in Other Programs.Note: Numbers may not add due to rounding.
Composition of Total Expense, 2013–14CHART 3.2
Postsecondary and Training Sector
6.1% $7.7B
Interest on Debt8.3% $10.6B
Justice Sector3.2% $4.1B
Children’s and Social Services Sector11.2% $14.3B
Other Programs14.0% $17.8B
Education Sector1
18.9% $24.1B
Health Sector38.3% $48.9B

2013 Ontario Economic Outlook and Fiscal Review
128
Composition of Program Expense,1 2013–14CHART 3.3
Postsecondary and Training Sector
6.6% $7.7B
Justice Sector3.5% $4.1B
Children’s and Social Services Sector12.3% $14.3B
Other Programs15.2% $17.8B
Education Sector2
20.6% $24.1B
Health Sector41.8% $48.9B
1 Program expense equals total expense minus interest on debt.2 Excludes Teachers’ Pension Plan. Teachers’ Pension Plan expense is included in Other Programs.Note: Numbers may not add due to rounding.

IV
The Need for a Committed Federal Partner
Chapter


Chapter IV: The Need for a Committed Federal Partner
131
Highlights Ontario needs a committed federal partner to support the Province’s plan for jobs
and economic growth and to sustain the public services that Ontarians deserve
and expect. A federal partner needs to be willing to:
Build the Economy Together
Collaborate with provinces and territories on strengthening initiatives for
strategic infrastructure investment and skills and training.
Ensure dedicated federal funding for public transit and transportation
infrastructure.
Strengthen the Retirement Income System
Help ensure that today’s workers maintain a comparable standard of living
when they retire by supporting an enhancement to the Canada Pension Plan.
Invest in Healthy Ontario Communities
Make long‐term, predictable investments in social and affordable housing.
Establish a Fair Fiscal Arrangement
Work with provinces and territories to make federal–provincial fiscal
arrangements more fair, efficient and suitable to address the economic
and demographic challenges facing provinces and territories.
Work Together with Provinces and Territories
Avoid further unilateral changes to programs affecting provinces and
territories, and particularly measures involving cutbacks in financial support,
including offloading or downloading responsibilities.
Recognize that the Province cannot fill gaps left by the federal government
every time the latter decides to make changes without considering the
pressures they put on Ontario.

2013 Ontario Economic Outlook and Fiscal Review
132

Chapter IV: The Need for a Committed Federal Partner
133
The Case for Committed Partnerships Building a prosperous and fair society requires collaboration among all orders of
government. This is demonstrated each time the Province works with other orders
of government to create jobs and make businesses more competitive — from
successful joint initiatives with the federal government, such as support for the
auto sector and sales tax harmonization, to moving towards a cooperative capital
markets regulator with the federal government and British Columbia. The results
of creating effective partnerships are making a positive difference to Ontarians.
Meaningful and results‐oriented conversations have taken place at the provincial
and territorial level under Ontario’s leadership. As host of the 2013 Council of the
Federation, Ontario chaired discussions on a range of priorities focused on
building a strong economy and ensuring a fair society for all Canadians. At the
meeting, hosted in Niagara‐on‐the‐Lake, Premiers discussed ways to create jobs
and promote economic growth through collaborative actions on skills and training,
strategic infrastructure investment, immigration, international trade and energy.
Unfortunately, in an effort to balance the federal budget, the federal government
recently made a series of changes to programs and funding that negatively affect
Ontario and other provinces and territories. These federal decisions often involve
cutbacks in financial support and changes to federal programs that offload many
responsibilities onto provinces and territories, without proper consultation or
compensation. A number of federal initiatives currently under consideration
could, if implemented, continue the trend of declining federal responsibilities and
potentially disrupt Ontario’s finances.
Ontario, much like the rest of Canada, is operating in a post‐recession world of
a rapidly evolving economy, growing competition for skilled workers, an aging
population and communities with increasingly diverse needs. The challenges
facing provinces and territories require intergovernmental coordination,
not unilateral, top‐down decision‐making.
Ontario seeks to build on past successes of federal and provincial–territorial
coordination to develop partnerships rooted in mutual understanding and
consultation that are oriented towards the effective use of public dollars
and the right balance of resources and responsibilities in the federation.
Ontario expects the federal government to provide the long‐term support
needed to build a stronger Ontario — for a stronger Canada.

2013 Ontario Economic Outlook and Fiscal Review
134
A Committed Federal Partner to Build the Economy Together Long-Term Investment in Public Infrastructure
Ontario is pleased that the new Building Canada plan, as announced in the
2013 federal budget, will focus investment on projects that promote economic
productivity and growth.
Given Ontario’s significance to the national economy, and its strategic
infrastructure needs, it is critical that Ontario receive a fair share of the $14 billion
in funding available nationally through the Building Canada Fund, a key
component of the new Building Canada plan. The Province is committed to
delivering a plan in partnership with the federal government that not only
promotes Ontario’s strategic infrastructure priorities and meets the unique
needs of its communities, but also provides economic returns to Canada.
Investment in Public Transit
Ontario encourages the federal government to provide predictable long‐term
funding to support a transit and transportation strategy instead of one‐off funding
decisions. Investment in public transit and transportation infrastructure is critical,
given the significant economic drag from congestion. Congestion deters skilled
employees, wastes labour productivity, slows the movement of goods, and
hinders the ability of businesses to operate and grow.
Public transit allows people to connect to the economy and access educational
opportunities and services outside their neighbourhoods. Improving public
transportation can also help reduce greenhouse gas emissions and improve quality
of life. With an aging population, more people may rely on transit in their
everyday lives and public transit systems will need to be even more accessible
and integrated.
The Province remains concerned about the lack of federal investments in transit
and transportation projects in Ontario. It is important going forward that the
federal government work together with Ontario in an effort to address shared
priorities in a collaborative manner.

Chapter IV: The Need for a Committed Federal Partner
135
Labour Market Training
Ontario needs a strong federal partner to help ensure that Ontarians, including
groups struggling in the labour market, receive skills training and employment
supports to succeed. This includes continued stable and fair funding as well as
flexibility to target clients and design programs that best respond to Ontario’s
labour market needs. The Province will not divert substantial funding from
programs delivering results for a one‐size‐fits‐all program that may not work
for Ontario.
In its 2013 budget, the federal government announced its plan to renegotiate
three major federal–provincial labour market funding agreements: the Labour
Market Agreement, Labour Market Development Agreement and Labour Market
Agreement for Persons with Disabilities. The current proposal for the Labour
Market Agreement would redirect 60 per cent of the federal government’s
$500 million national funding to the Canada Job Grant by 2017–18. The new
Canada Job Grant would also require matching contributions from
provinces/territories and employers.
Ontario has significant concerns as the proposed federal offer would limit
Ontario’s ability to serve vulnerable people, especially those not eligible for
Employment Insurance‐funded services, including immigrants, Aboriginals,
people with disabilities and social assistance recipients. Many of those who need
help to improve their skills and get back to work would be left out as the Canada
Job Grant would only support Ontarians with an employer willing to fund their
training. Engaging all Ontarians to fully participate in the labour market is crucial
for the Province’s and Canada’s long‐term economic growth.
In order to maintain current programs and fully implement the Canada Job Grant,
Ontario would have to cut roughly $232 million a year in funding from other
programs. All provinces and territories share the concern that the Canada Job
Grant could jeopardize the success of current training programs, particularly those
that help vulnerable people.

2013 Ontario Economic Outlook and Fiscal Review
136
Ontario is pleased that its leadership through the Council of the Federation
enabled all provinces and territories to present a united front in pressing their
concerns about the proposed Canada Job Grant program, resulting in the federal
government taking a second look at the terms of this program. Ontario is
determined to negotiate new labour market funding agreements that serve the
needs of its workers and employers. Ontario will soon be meeting with the federal
government and all other provinces and territories to discuss the renewal of
current federal funding agreements and the federal proposal for a Canada
Job Grant.
Supporting Ontario’s Leading Sectors
Access to Global Markets
Ontario is working with the federal government to pursue new trade agreements
that would improve access for exporters to foreign markets and benefit Canadian
consumers. Canada is negotiating a Trans‐Pacific Partnership with a number of
countries as well as free trade agreements with nations such as India, Japan and
South Korea.
On October 18, 2013, the federal government announced that an agreement
in principle had been reached on the Canada‐European Union Comprehensive
Economic and Trade Agreement (CETA). The deal would mean expanded access
to European markets for Ontario manufacturers and service providers, increased
sales of goods and services and, as a result, more job creation.
Many sectors of Ontario’s economy would benefit from CETA, including advanced
manufacturing and automotive, financial services, metals and mining, and
information and communications technologies. The deal is expected to create as
many as 30,000 jobs in Ontario.
The CETA will benefit Ontario’s economy and consumers but the Province has
raised concerns with the federal government as the deal moves from being
an agreement in principle to a final agreement. The Province has asked the
federal government to guarantee that provinces will be fully compensated for
any increase in costs as a result of the deal’s intellectual property provisions
on pharmaceuticals. Ontario also needs the federal government to support the
wine and spirits sector and work with the Province to support the sector’s growth.
Chapter IV: The Need for a Committed Federal Partner
137
Agri-Food Support
The CETA will negatively impact various agricultural sectors including dairy
farmers, grape growers, and cheese producers and processors. Ontario expects
adequate and real compensation for its hardworking farmers and agri‐food
workers, and has communicated this to the federal government.
Ontario is exploring innovative approaches to managing producer risk, such as
the Ontario Corn‐Fed Beef Risk Management Fund, which allows producers and
processors to take greater leadership and ownership in ensuring price stability.
Ontario has provided initial seed funding and encourages the federal government
to match it to reduce fiscal pressures for both Ontario and Canada.
Ring of Fire
Ontario’s Ring of Fire area, located about 535 kilometres northeast of Thunder
Bay, holds significant deposits of minerals. Recent estimates suggest that the value
of mineral resources in the Ring of Fire area could be up to $50 billion, for known
chromite and nickel deposits.
The Province is working towards smart, sustainable and collaborative
development in the Ring of Fire. Ontario has a leadership role in development,
but the federal government, municipalities, First Nations and industry all have
a part to play. The Province calls on the federal government to provide adequate
support to advance regional infrastructure development in the Ring of Fire.
Successful development of the Ring of Fire requires sound preparation and
planning, and full engagement by the federal government. This development
will support a more robust northern economy, delivering long‐term benefits
to Aboriginal communities and strengthening community infrastructure.
The Province is committed to working with First Nations near the Ring of Fire.
In the 2013 Budget, the Province committed $5 million to support community
readiness and capacity building in the Ring of Fire communities, and has entered
into a historic, community‐driven, regional negotiation process with the
Matawa First Nations, which is being led through the appointed negotiators,
the Honourable Justice Frank Iacobucci and the Honourable Bob Rae.

2013 Ontario Economic Outlook and Fiscal Review
138
Support for Clean Energy
Ontario is a North American leader in clean energy with its commitment to
replace coal‐fired electricity generation with cleaner sources, the feed‐in tariff
program, large renewable procurements and a variety of conservation programs.
Since 2009, the Province’s Green Energy Act has attracted billions of dollars in
private‐sector investments, created 31,000 jobs and attracted more than 30 clean
energy companies to the province. In its August 2012 report, “Canada’s Emissions
Trends,” the federal government recognized Ontario’s important contributions
to meeting Canada‐wide greenhouse gas emission reduction targets under the
Copenhagen Accord. However, the federal government continues to provide
significant support for energy sectors other than renewables, which does not
meet the needs of Ontario. Enhanced federal support for clean energy would
help Ontario transition to a low‐carbon economy.
Ontario is seeking federal support and the appropriate regulatory environment
for an east–west transmission grid that would transmit electricity across provincial
borders. Greater regional integration of electricity grids would encourage the
development of new, larger‐scale renewable projects that would benefit the
economy, both in Ontario and elsewhere in the country.
To support stronger, healthier northern remote communities, the Province
expects to seek federal engagement on proposals for cost sharing of investments
to connect certain remote First Nation communities to the Ontario electricity grid.
This would reduce these communities’ reliance on diesel generators for
electricity supply.

Chapter IV: The Need for a Committed Federal Partner
139
A Committed Federal Partner to Strengthen the Retirement Income System Long‐term savings and investment are critical to ensuring Ontarians prepare
financially for their retirement. Many Ontarians today are having difficulty
putting aside sufficient savings for retirement and are worried about their
future financial security.
The Province is committed to a strong and secure retirement income system to
help ensure that Ontarians are able to enjoy their retirement years. The Province
will assist working Ontarians in planning for their retirement, whether they
rely on retirement income provided through the Canada Pension Plan (CPP),
are accumulating retirement savings independently, or have access to a
workplace pension plan.
The CPP forms the foundation of the nation’s retirement income system.
An enhancement to the CPP is critical to ensuring that Ontarians, particularly
middle‐income earners, have greater financial security in retirement.
At this summer’s Council of the Federation, Premiers reiterated their commitment
to the principle of enhancing Canada’s public and private pension plans, as the
economy improves. Premiers directed provincial and territorial finance ministers
to consider specific options for enhancing the retirement income system, including
the CPP/Quebec Pension Plan and pooled registered pension plans (PRPPs).
Ontario will continue to lead the way to advance an enhancement to the CPP
and work to secure agreement among provinces and the federal government.
In the event that federal–provincial–territorial discussions on a CPP
enhancement are unsuccessful, the Province will move forward with a
“made in Ontario” solution.
See Chapter V: Retirement Income Security for more details.

2013 Ontario Economic Outlook and Fiscal Review
140
A Committed Federal Partner to Invest in Healthy Ontario Communities Investment in Social and Affordable Housing
Ontario is working to develop an agreement with the federal government to
extend the jointly funded federal–provincial Investment in Affordable Housing
program. While the extended Investment in Affordable Housing program would
help increase access to new affordable housing units and repair units built since
the mid‐1990s, it would not help repair the existing stock of older social housing
units, some of which are over 50 years old.
The Province calls on the federal government to make long‐term, predictable
investments in social housing. The lack of affordable and appropriate shelter
is a barrier to health, education and employment.
Immigration and Refugees
The Province understands the important role immigration plays in the Ontario
economy. That is why the Province developed the first‐ever Ontario
Immigration Strategy.
The federal government is announcing Ontario’s allocation for the Provincial
Nominee Program (PNP) for 2014. An increase would be a positive step forward
that would recognize the important role that Ontario plays in immigration in
Canada. Ontario’s Immigration Strategy calls on the federal government to
increase its PNP allocation to 5,000 by 2014. This Province should have the same
flexibility and capacity as the other provinces to meet changing labour market
needs and to help the economy grow.

Chapter IV: The Need for a Committed Federal Partner
141
Caring for refugee claimants is a federal responsibility. However, changes made
to the Interim Federal Health Program, which provides health care coverage to
refugees, have left many refugee claimant groups without basic primary care.
This unilateral federal action may increase provincial health spending.
Ensuring refugee claimants are receiving health care coverage that is similar to
the coverage offered through OHIP could cost as much as $20 million per year.
The Province urges the federal government to reverse its changes to the
Interim Federal Health Program and reinstate health care coverage for all
refugee claimants.
First Nation Communities
The federal government has chronically underfunded on‐reserve First Nations.
While Ontario welcomes investments announced in the 2013 federal budget
to support postsecondary educational attainment for First Nations and
Inuit students, these investments do not address the current state of
on‐reserve schools for kindergarten through Grade 12. The Province believes
that all children, whether they live on‐reserve or not, should have the same
opportunities and that the federal government has an obligation to make
those opportunities available and accessible.
The federal government should provide adequate funding for First Nation
education that at least reaches parity with per‐student provincial funding for
elementary and secondary education. Working with Aboriginal communities
to improve educational and economic outcomes has the potential to create
benefits across the province.
“The Commission believes that there is an urgent need to significantly improve the provision of on-reserve First Nations education in the province… There is a substantial and growing gap in education attainment between First Nations peoples living on-reserve and the rest of the Canadian population.”
Commission on the Reform of Ontario’s Public Services, “Public Services for Ontarians: A Path to Sustainability and Excellence,” 2012, p. 209.

2013 Ontario Economic Outlook and Fiscal Review
142
Investing in Healthy Ontarians
The unilateral federal decision to limit the growth of the Canada Health Transfer
will have a significant impact on Ontario’s delivery of quality public services.
Instead of maintaining the Canada Health Transfer growth rate at six per cent,
the transfer is now expected to increase at the rate of nominal economic growth,
starting in 2017–18.
This federal action will remove $8.2 billion from health care in Ontario by
2023–24, when the transfer will be up for renewal. This cumulative impact
would be equivalent to reducing federal funding of health care by an estimated
$550 for every Ontarian by 2023. The federal funding that is being reduced could
instead be used to help support Ontario’s ongoing efforts to decrease wait times
for surgical and diagnostic services, accelerate hiring of doctors and nurses who
provide Ontarians with access to primary care, and improve investments in
the province’s home care initiatives that help older Ontarians live healthier,
more independent lives.
An aging population brings more vulnerable and complex care patients into
the health care system, making federal funding for health care more important.
This, and other challenges facing provinces and territories, clearly shows that
the current suite of federal transfers and fiscal arrangements needs to be
improved and modernized.

Chapter IV: The Need for a Committed Federal Partner
143
A Committed Federal Partner to Establish a Fair Fiscal Arrangement Ontario insists the federal government work with the provinces and territories
to modernize federal–provincial fiscal arrangements — that is, to make Canada’s
fiscal architecture more fair, efficient and suitable to address the economic and
demographic challenges facing provinces and territories.
It is increasingly apparent that federal fiscal arrangements are neither fair nor
sufficient to address the needs of Ontarians. Among provinces, Ontario is fifth
in ability to raise revenues from its residents. However, Ontario falls to last after
federal transfers — including the Canada Health Transfer, Canada Social Transfer
and Equalization — are taken into account because the outdated system of fiscal
arrangements is out of line with current economic realities (see Chart 4.1).
Notes: Fiscal capacity figures are presented as calculated for the purpose of 2013–14 Equalization entitlements. The revenue data are a weighted average of the 2009–10, 2010–11 and 2011–12 fiscal years. Calculated using 100 per cent natural resource revenue inclusion. Per capita values are based on unweighted population estimates. Transfers include 2013–14 entitlements for the Canada Health Transfer, Canada Social Transfer, Equalization, Offshore Accords and Protection Payments.Source: Ontario Ministry of Finance calculations based on data from Finance Canada.
In 2013–14, Ontario’s Fiscal Capacity Is Fifth but Federal Transfers Bring Ontario to Last
CHART 4.1
0
2,000
4,000
6,000
8,000
10,000
12,000
AB NL SK BC ON QC MB NS NB PE
($ Per Capita)
02,0004,0006,0008,000
10,00012,00014,000
AB NL SK NS BC NB QC PE MB ON
Provincial Average
Provincial Average
Per Capita Fiscal Capacity Before Transfers
Per Capita Fiscal Capacity After Transfers
Own-Source
Federal Transfers
2013 Ontario Economic Outlook and Fiscal Review
144
The evidence increasingly suggests that the current system of federal–provincial
fiscal arrangements is working against, not for, the people of Ontario. The Mowat
Centre’s report, “Filling the Gap,” estimates that the shortfall between what the
people of Ontario pay in federal taxes versus what they receive in federal transfers
and services was $11.1 billion, or 1.9 per cent of Ontario’s economy, in 2009–10.1
“[P]rograms that discriminate against Ontarians include federal investments in economic development, infrastructure funding, affordable and social housing, support for the energy sector, and funding for labour market training. By treating Canadians inconsistently, these programs each contribute to the broader structural imbalance that Ontario faces in the federation, and put pressures on Ontario and its municipal governments, as well as community organizations and individuals to pick up the slack.”
Noah Zon, Mowat Centre, “Filling the Gap: Measuring Ontario’s Balance with the Federation,” 2013, p. 8.
A good example of an arrangement that works against Ontario and needs to
be modernized is the Equalization program. Ontario remains the largest net
contributor to the program despite fast‐growing, resource‐based economies in
Western Canada. The difference between what the people of Ontario pay into
the Equalization program through federal taxes and what the Province receives
back from the program is $3.1 billion, or about $226 per person, in 2013–14
(see Chart 4.2). Over the past 10 years, Ontario has contributed approximately
$50 billion to the Equalization program.
Ontario is committed to the principles of the Equalization program. However,
the Province does not support a system of transfers that puts Ontario’s public
services at risk and provides inequitable levels of support to different parts of
Canada. Ontario is entitled to its fair share in the Equalization program.
1 The Mowat Centre analysis relies on data from Statistics Canada (Provincial Economic
Accounts) that have not been updated since 2010.

Chapter IV: The Need for a Committed Federal Partner
145
“Even though Ontario receives Equalization, Ontarians continue to contribute more to the program than they receive in return. This highlights a problem with the arrangements in the federation — federal transfers disproportionately benefit other provinces, at a cost to Ontarians.”
Commission on the Reform of Ontario’s Public Services, “Public Services for Ontarians: A Path to Sustainability and Excellence,” 2012, p. 454.
(5.0)
(4.0)
(3.0)
(2.0)
(1.0)
0.0
1.0
2.0
3.0
4.0
ON AB BC SK NL PE NS NB MB QC
Note: Net contribution represents Equalization payments received less taxpayer contributions through federal revenue.Source: Ontario Ministry of Finance.
($ Billions)
Net Contribution to Equalization by Province,2013–14
CHART 4.2

2013 Ontario Economic Outlook and Fiscal Review
146
Impacts of Unilateral Federal Actions The federal government has made a number of decisions that offload many
responsibilities onto Ontario without proper compensation or advanced dialogue.
Numerous examples of unilateral federal actions are already explained throughout
this chapter — from changes proposed to the Labour Market Agreement and
introducing the Canada Job Grant, to limiting the growth rate of the Canada
Health Transfer and reducing the Interim Federal Health Program. Broadly,
federal actions typically include:
Changes to program‐specific financial support or federal transfers to provinces
that reduce federal contributions below levels previously committed;
Changes to eligibility criteria of federal programs or federal transfers to
persons — e.g., elderly benefits — that impact how Ontarians benefit from
these services and benefits, and affect the demand for provincial services;
Changes to shared common tax bases that lead to reductions in provincial
taxation revenues and have an impact on provincial tax policies; and
Changes to legislation or regulations, especially in areas of integrated
federal–provincial services such as the criminal justice system, that create
undue pressures on provincial programs and services to meet federal rules.
These unilateral federal actions have direct impacts on Ontario communities,
the Province’s finances and its delivery of core public services.
Federal Actions with Impacts on Ontario Communities
Federal government support for policing through the Police Officers Recruitment
Fund expired on March 31, 2013. This time-limited program provided annual
funding of $31.4 million to support up to 329 police officers in communities across
Ontario, including 40 First Nation police officers. As the federal government has
not committed to extend this funding, the 2013 Budget provided additional annual
funding of $4 million to continue to fund the 40 First Nation police officers hired
under the Police Officers Recruitment Fund to ensure the safety of First Nation
communities. Ontario calls on the federal government to fully fund the police
officers hired under the Police Officers Recruitment Fund and to make the
funding permanent.

Chapter IV: The Need for a Committed Federal Partner
147
Recently, the federal government announced it will raise the minimum age
eligibility for Old Age Security (OAS) and the Guaranteed Income Supplement (GIS)
by two years, beginning in 2023 and to be fully implemented in 2030. This federal
action is estimated to increase the number of seniors living in poverty by about
44,000 and may result in a loss of $4.4 billion in OAS and GIS payments for the
630,000 Ontario seniors aged 65 to 67 in 2030. That means that a low-income
senior who is 66 could lose out on benefits of up to $23,000 in 2030.
The federal decision to change the eligibility criteria for these federal elderly
benefits is also expected to create financial pressures on provincial and municipal
programs, such as social assistance, that provide support to low-income adults
and seniors.
Federal Actions with Impacts on Ontario’s Finances and Public Services
The new Building Canada plan, specifically the Building Canada Fund program,
may include funding conditions that could skew spending priorities. Ontario
expects the federal government to provide greater flexibility when negotiating
funding agreements. Ontario looks forward to working with the federal
government on options that reduce the financial and administrative burden
on Ontario.
Certain federal actions — such as those included in the Safe Streets and
Communities Act — will increase justice sector costs for the Province. This will
limit Ontario’s ability to provide the public services on which its residents rely.
Ontario calls on the federal government to provide additional funding to fully
address any provincial costs that may result from federal policy changes,
including changes to the criminal justice system.

2013 Ontario Economic Outlook and Fiscal Review
148
Ontario agreed to share common tax bases with the federal government on
the understanding that complexity for taxpayers and administrative costs would
be reduced. However, unilateral federal actions that impact a tax base can
significantly reduce provincial revenue. For example, there are proposals at the
federal level to introduce income splitting for families and to double contribution
limits for Tax-Free Savings Accounts when the federal budget is balanced,
which is forecasted for 2015–16. These proposals, if implemented unilaterally by
the federal government, could have a significant impact on the Province’s path to
eliminating the deficit. The Province expects the federal government to consult
with Ontario on the policy objectives and the implementation of any federal
proposals that significantly affect a shared tax base.
“Proposed federal changes on income splitting and Tax-Free Savings Accounts would affect the shared personal income tax base because Ontario would probably mirror these changes to maintain similarity. These two proposals alone could result in $1.3 billion less revenue for Ontario per year.”
Commission on the Reform of Ontario’s Public Services, “Public Services for Ontarians: A Path to Sustainability and Excellence,” 2012, p. 458.

Chapter IV: The Need for a Committed Federal Partner
149
Managing Risks from Federal Actions
The government remains on track to balance the budget by 2017–18 in a fair
and responsible way. The Province cannot fill gaps left by the federal government
every time the latter decides to make changes without considering the pressures
it puts on Ontario. Time-limited transfers and unilateral changes to shared
common tax bases and federal programs increase volatility in Ontario’s fiscal
plan and could create discontinuity of services. The Province expects the federal
government to support its efforts, rather than undermine Ontario’s plan for jobs
and economic growth and put at risk the public services that Ontarians deserve
and expect.
At this summer’s Council of the Federation at Niagara-on-the-Lake, Premiers
called on the federal government to avoid further unilateral changes to programs
affecting provinces and territories, and particularly measures involving cutbacks
in financial support, including offloading or downloading responsibilities. Finance
ministers will prepare an inventory of federal downloading and other unilateral
actions impacting provinces and territories for Premiers to review at the upcoming
Council of the Federation meeting in Toronto in November.

2013 Ontario Economic Outlook and Fiscal Review
150

V
Retirement Income Security
Chapter


Chapter V: Retirement Income Security
153
Highlights Taking a leadership role through a bold strategy to improve Ontario’s retirement
income system, the Ontario government will:
Work to secure agreement with the federal government and other provinces
for an enhancement to the Canada Pension Plan (CPP) to protect the middle
class in retirement. If agreement cannot be reached, the government will
move forward with a “made in Ontario” solution;
Engage with interested parties on a target benefit framework for eligible
multi‐employer pension plans (MEPPs) in the winter of 2014;
Engage with interested parties in the fall of 2013 on how pooled registered
pension plans (PRPPs) should be implemented in Ontario;
Develop regulations that would allow defined contribution (DC) plans to pay
retirement income directly to retirees;
Finalize new regulations on split pensions and asset transfers between
pension plans, which, if approved, are expected to take effect in
January 2014;
Look to the technical working group established following the 2013 Budget,
for advice on design, governance and transition issues, in implementing
an asset pooling framework for public‐sector pension plans in 2014;
Commit to seeing changes in electricity sector pension plans, including cost
sharing, governance and other provisions, that will ensure these plans are
more affordable; and
Modernize the investment rules governing Ontario pension plans, including
changes to remove barriers to investments in Ontario public infrastructure
projects, potentially creating a significant new source of capital to support
economic growth and job creation in Ontario.

2013 Ontario Economic Outlook and Fiscal Review
154

Chapter V: Retirement Income Security
155
Strengthening Ontario’s Retirement Income System
Long‐term savings and investment are critical to ensuring Ontarians prepare
financially for their retirement. Many Ontarians today are having difficulty putting
aside sufficient savings for retirement and are worried about their future
financial security.
The government is committed to a strong and secure retirement income
system to help ensure that Ontarians are able to enjoy their retirement years.
It will assist working Ontarians in planning for their retirement, whether they
rely on retirement income provided through the Canada Pension Plan (CPP),
are accumulating retirement savings independently, or have access to a
workplace pension plan.
The CPP forms the foundation of the nation’s retirement income system.
An enhancement to the CPP is critical to ensuring that Ontarians, particularly
middle‐income earners, have greater financial security in retirement.
The government is leading the way by working to secure agreement among
provinces and the federal government on a CPP enhancement. If an agreement
cannot be reached, Ontario will move forward with a “made in Ontario” solution.
The government will also implement innovative retirement savings models such
as pooled registered pension plans (PRPPs) to promote increased retirement
savings in the province. Before introducing legislation, it will consult on an
Ontario framework for PRPPs to provide employees, particularly those working
in small and medium‐sized businesses, with a simplified, low‐cost retirement
savings vehicle.

2013 Ontario Economic Outlook and Fiscal Review
156
For Ontarians with self‐directed retirement savings, such as registered retirement
savings plans (RRSPs), Ontario will work to reduce the cost of investing and
provide individuals with the help they need to make informed decisions about
financial savings. The government will examine recommendations by the Ontario
Securities Commission (OSC), which is looking at the structure of mutual fund fees,
and consider tailored regulations for financial advisers and planners.
Recognizing recent funding challenges, the government will also help those
with defined benefit (DB) pension plans. It will continue implementing new
and revised rules to ensure Ontario’s private‐sector DB plans remain financially
sound and public‐sector DB plans remain affordable and sustainable.
“A significant minority of Canadian households are not on track to maintain their standard of living in retirement. This lack of preparedness does not have a single root cause — some households are unprepared because the public benefits are eroding over time; some are not saving enough (or have not saved enough); and others will be unable to compensate for the steep clawback of universal benefits. The only way to address this multifaceted challenge is with a multifaceted response.”
McKinsey & Company, “Are Canadians Ready for Retirement?”, 2012, p. 20.

Chapter V: Retirement Income Security
157
The Case for Action
Studies and analyses from pension experts, academics and research institutes
indicate today’s workers may not be saving sufficiently for retirement. This is
happening for a variety of reasons:
Employment pension coverage is low. Fewer than 35 per cent of workers in
Ontario have a workplace‐based pension plan. Coverage for workers in the
private sector is even lower, with only 28 per cent having the benefit of plan
membership. Defined benefit plan coverage in particular is on the decline and,
where DB plans exist, many are facing funding challenges in light of historically
low interest rates and demographic pressures.
Ontarians who do not have access to workplace pensions must rely on
RRSPs and alternative savings vehicles. Most people are not able to put aside
enough income in these plans. For some of those who have managed to save,
investment returns are still below the long‐term averages, and traditional
investment vehicles like mutual funds often attract high fees.
These concerns also come at a time when people are living much longer and
spending a larger portion of their life in retirement. Increasing lifespans have put
pressure on savings to provide lifelong income over a retirement period that can
amount to several decades. As a result, longevity risk or “outliving one’s savings”
has become a concern for many retirees.
In 1998, reforms ensured that the CPP was secure and sustainable. Now is the
time to address the adequacy of the CPP.
Retirement experts suggest that households should aim to replace 50 per cent
to 70 per cent of their pre‐retirement income in retirement. Research shows an
increasing risk of middle‐income households being unable to meet this target.

2013 Ontario Economic Outlook and Fiscal Review
158
Chart 5.1 shows how different earnings levels during working years affect an
individual’s ability to reach this target. Retirement income provided by Old Age
Security (OAS) and the Guaranteed Income Supplement (GIS), combined with
existing CPP benefits, already provides close to or more than 100 per cent
earnings replacement for lower‐earning workers. By contrast, those with average
career earnings between $40,000 and $75,000 are unable to reach a 70 per cent
retirement income target through CPP and OAS, and must rely on alternative
sources of income to fill this gap. Alternative sources of retirement income include
workplace pension plans, tax‐assisted savings vehicles such as RRSPs, home equity
and other personal savings.
$0
$10,000
$20,000
$30,000
$40,000
$50,000
$60,000
Series1
Series2
Series3
Series4
Series5
Series6
Series7
Series8
Series9
Series10
Series11
Series12
Series13
Series14
Series15
Series16
Series17
Series18
Series19
Series20
Series21
Annual Pre-Retirement Income (Before Tax)OAS OAS OAS
Current CPPCurrent CPP
Current CPPGIS
Notes: (1) The CPP amounts assume the individual worked for 40 years and began collecting CPP benefits at age 65 and had steady career before-tax earnings of $20,000, $40,000 or $75,000, expressed in 2013 dollars. (2) Old Age Security is reduced at net income above $70,954.Source: Ontario Ministry of Finance.
At $20,000 At $40,000 At $75,000
Income Target $14,000 $28,000 $52,500
Potential Gap $0 $11,891 $34,358
Income Replacement Target(Based on 70% of Pre-Retirement Income)
Retirement Income Targets and Potential Gaps(Single Person)
CHART 5.1
Potential Gap
Potential Gap
Annual Retirement Income (Before Tax)

Chapter V: Retirement Income Security
159
Those with higher incomes have a greater capacity to save and accumulate
wealth. By contrast, middle‐income earners have fewer opportunities to save.
Most workers are not members of an employment pension plan. Their personal
savings are relatively low and RRSPs remain underutilized by many of those with
middle incomes. Middle‐income earners need more help if they are to maintain
a comparable standard of living in their retirement.

2013 Ontario Economic Outlook and Fiscal Review
160
Leading the Way in Reforming the Retirement Income System
Ontario, recognizing the retirement savings challenge, has already taken
significant steps in reform.
In 2008, the Report of the Expert Commission on Pensions laid out a
comprehensive blueprint for pension reform and encouraged a national
discussion on improvements to the system. The Report included
recommendations to modernize and strengthen pension laws in Ontario through
the Pension Benefits Act, which had not been updated in more than 20 years.
In response, the legislature passed two pension reform bills and many of the new
regulations required to implement their provisions have been approved by the
government or are underway.
In 2010, Ontario released a discussion paper on possible approaches to strengthen
the retirement income system, including a fully funded CPP enhancement
supplemented by pension innovation to expand retirement plan coverage and
encourage lower‐cost savings options.
In 2012, the government extended the solvency funding relief for private‐sector
pension plans provided in 2009 for a further three years to help employers
manage their pension costs and help make these plans sustainable in the
long term. Temporary solvency funding relief was also provided to public‐sector
DB plans provided they took steps to put their plans on a more sustainable track.
In the 2013 Budget, Ontario indicated that it would continue to take a leadership
role in advocating for a fully funded enhancement to CPP and would also move
forward to introduce innovative pension models such as PRPPs and a framework
for target benefit plans.
While important work has been done, Ontario must strengthen its retirement
income system. The government is committed to building on its efforts to date
and pursuing a bold new strategy to enhance retirement savings.

Chapter V: Retirement Income Security
161
A Strategy to Enhance Retirement Savings A bold new strategy requires collaboration from all sectors — individuals,
employers, labour, financial and investment services, and all orders of
government — and a range of tools to address a complex and varied problem.
Ontario will continue to take a leadership role through a sustained and
balanced approach to implement its strategy to improve Ontario’s retirement
income system:
For Ontarians without workplace pension plans: The government will
develop innovative pension models to promote increased retirement
savings in Ontario. In particular, to help ensure that all Canadians have a
reasonable level of income replacement throughout their retirement years,
Ontario will:
Work to secure agreement among provinces and the federal government
on a CPP enhancement. If agreement cannot be reached, Ontario will
move forward with an alternative “made in Ontario” solution;
Facilitate the use of target benefit plans by clarifying the rules for
multi‐employer pension plans (MEPPs) that provide target benefits and
establishing a framework for single‐employer, target benefit plans; and
Encourage expanded retirement savings by consulting on a framework
before introducing legislation to implement PRPPs, a low‐cost,
portable retirement savings tool.
For Ontarians with self‐directed retirement savings: Ontario will work
to improve the efficiency and stability of capital markets to reduce the
cost to individuals of investing, and provide the tools to encourage
informed decisions about financial savings.
For Ontarians with DB pension plans: Ontario will continue to work with
employers and employees to enhance the sustainability of DB pension plans.
After taking steps to help plan sponsors manage funding obligations in the
face of historically low long‐term interest rates, the government continues
to make efforts to ensure Ontario’s private‐sector DB plans remain financially
sound and public‐sector DB plans remain affordable and sustainable.

2013 Ontario Economic Outlook and Fiscal Review
162
1. For Ontarians without Workplace Pension Plans
Ontario is committed to strengthening retirement income through improvements
to existing public pension programs as well as developing new savings options.
An Enhancement to the Canada Pension Plan
The CPP is an efficient and effective mandatory public pension program, with
contributions shared equally by employers and employees. Self‐employed workers
contribute both shares. The CPP provides Canadians with a secure pension that is
indexed to inflation and paid for life. It is fully portable across Canada, supporting
a modern and mobile labour force.
As a mandatory public pension program, a CPP enhancement would provide
a higher level of predictable retirement income for all workers, including the
self‐employed, and ensure participation by employers in improving retirement
savings. Taken together as part of a comprehensive strategy that includes pension
innovation, supporting DB plans and changes to help individuals save, a CPP
enhancement would make a real difference in improving the retirement income
security of today’s workers.
In addition to financial security for beneficiaries, the CPP has an overall positive
impact on the economy and allows Canadians to retire with dignity. A stable,
predictable income allows retirees to spend at higher rates, and reinvest that
income in the economy through the consumption of goods and services.
Federal, provincial and territorial ministers of finance and the Council of the
Federation, currently chaired by Premier Kathleen Wynne, have been engaged
in ongoing discussions on possible improvements to Canada’s retirement
income system.
Ontario will continue to work with the federal government and other provinces
to develop an enhancement to the CPP to help improve the adequacy and
predictability of earnings replacement for future retirees, particularly for
middle‐income workers.

Chapter V: Retirement Income Security
163
A number of objectives will guide Ontario in determining the preferred design
of a CPP enhancement. These objectives are intended to focus an enhancement
where it is needed most and to strike a balance between the needs of future
retirees and the impacts on businesses and the economy.
Enhancement that focuses on today’s workers
A CPP enhancement should be “fully funded” to avoid intergenerational inequity
and improve the future retirement incomes of today’s workers.
A fully funded enhancement means that enhanced CPP benefits would accrue
to workers as they are paid for through contributions. Any CPP benefit increases
would occur gradually over time, based on the contribution that workers and
their employers have made.
Moderate the effect on the economy
The magnitude of any CPP enhancement should take into account potential
effects on businesses, people and the economy.
A CPP enhancement would increase contributions by businesses and workers.
A notice period and an adequate phase‐in of higher contributions would moderate
the effect on the economy by giving businesses and workers time to adjust.
Also, additional contributions collected from an enhancement would be
reinvested both domestically and internationally, creating jobs and
economic growth.
Over the longer term, higher retirement income would contribute to a greater
quality of life for retirees and a more stable, stronger economy.

2013 Ontario Economic Outlook and Fiscal Review
164
Improve the retirement incomes of those most at risk
With increasing life expectancies, individuals must accumulate more savings to
have sufficient income for what could be a 20‐ to 30‐year period of retirement.
A CPP enhancement should be aimed at improving the retirement income
of workers who are most at risk of undersaving — middle‐income earners.
Retirement income provided by OAS and GIS benefits, combined with existing
CPP benefits, already provides close to, or more than, 100 per cent of earnings
replacement for lower‐income workers.
An enhancement to the CPP should acknowledge the adequate coverage provided
by existing benefit programs, and should limit or minimize unnecessary additional
contributions from low‐wage earners and the businesses that employ them.
Securing an agreement
An enhancement to the CPP is essential in helping to ensure that hardworking
Ontarians are able to maintain a similar standard of living in retirement and enjoy
their retirement years. This critical initiative requires agreement among seven
of the ten provinces, representing two‐thirds of the population of the provinces,
and a willing federal partner. The government will move forward with a “made in
Ontario” solution in the event that federal–provincial–territorial discussions on
CPP enhancement are unsuccessful.
Target Benefit Plans
Target benefit pension plans provide a more flexible approach to saving for
retirement and are another example of Ontario’s commitment to innovative
pension arrangements.
Target benefit plans combine features of DB and defined contribution (DC) plans.
While they “target” a specific benefit level funded by fixed contributions, benefits
may be reduced to address any funding shortfalls in the pension fund.

Chapter V: Retirement Income Security
165
“[I]n a context where single-employer plans are becoming increasingly rare, the jointly governed target benefit pension plan (JGTBPP) is, quite frankly, a strategy designed to tempt employers back into offering pensions and to ensure that plan members and retirees are not left with high aspirations but no pension coverage.”
Report of the Expert Commission on Pensions, “A Fine Balance: Safe Pensions, Affordable Plans, Fair Rules,” 2008, p. 176.
With a more predictable cost structure, employers that may not be able to
manage the risks of a DB plan would have another option through target benefit
plans to offer employees to help save for retirement.
The 2013 Budget announced that Ontario would be moving ahead on regulatory
changes related to target benefits in eligible MEPPs and also made a commitment
to develop a framework for single‐employer, target benefit pension plans.
Ontario will be moving ahead with consultations on a target benefit framework
for eligible MEPPs in the winter of 2014.
Pooled Registered Pension Plans
Pooled registered pension plans are a new form of tax‐assisted individual
retirement savings account. These plans are intended to make it easier to save
for retirement by offering employees and self‐employed individuals an additional
savings vehicle that is low cost (achieved through a simple design and economies
of scale), professionally managed and portable from one workplace to another.
Pooled registered pension plans are intended to be particularly beneficial for small
and medium‐sized businesses that may not have the capacity to offer traditional
pension plans.
Ontario will engage with interested parties on how PRPPs should be implemented
in Ontario in the fall of 2013 before introducing legislation.

2013 Ontario Economic Outlook and Fiscal Review
166
2. For Ontarians with Self-Directed Retirement Savings
Investor Education
To help individuals make informed savings and investment choices, the Ontario
government will promote financial literacy through organizations such as the
Financial Services Commission of Ontario, the OSC and Investor Education
Fund (IEF), a non‐profit organization established by the OSC.
The IEF website has the most popular financial education material of its kind in
Canada. Its consumer‐focused content provides unique tools that give Ontario
investors the information they need to make better decisions about retirement,
education savings, investing, fees and debt repayments.
More Efficient Capital Markets
Canada’s capital markets are regulated by 13 provincial and territorial securities
regulators applying 13 sets of securities laws. Ontario has played a leadership role
in developing provincial, territorial and federal government support for a common
securities regulator that will administer a single set of securities regulations.
Ontario, British Columbia and the federal government have agreed in principle
to establish a cooperative capital markets regulator (CCMR), in the interest of
fostering more efficient and globally competitive capital markets; strengthening
the ability to identify and manage systemic risk; providing better protection for
investors; and enabling Canada to speak with a single voice to play a more
influential role in international regulatory initiatives.
Ontario, together with British Columbia and the federal government,
is implementing the CCMR and will encourage broader provincial and
territorial participation.

Chapter V: Retirement Income Security
167
Reducing Costs and Protecting Investors
Ontario is also working to reduce the cost to individuals of investing. The OSC has
conducted extensive consultations on the structure of mutual fund fees (including
trailer fees) in Canada to determine if there are investor protection or fairness
issues and whether any regulatory responses are warranted. The OSC is reviewing
the feedback provided in public roundtable and other meetings and comment
letters, and is considering the perspectives of investor advocates, the investment
industry and other market participants. The government looks forward to the
OSC’s recommendations on this issue.
Sound Financial Advice for Ontarians
People need access to informed, professional financial advice to ensure that their
investment decisions serve their financial goals. Financial planning is not currently
subject to general regulatory oversight or self‐regulatory rules. The government
will investigate the merits of proceeding with more tailored regulation of financial
planners and consider the appropriate regulatory framework for doing so.
Allowing DC Plans to Pay Pensions Directly to Retirees
Currently, individuals retiring from a DC plan must transfer their pension account
to a financial institution. Allowing plan administrators to pay retirement income
directly to retirees would provide DC plan members with another option. These
retirees could benefit from the investment expertise and cost efficiencies
associated with leaving their assets in the plan.
The government will develop regulations that would allow DC plans to pay
retirement income directly to retirees.

2013 Ontario Economic Outlook and Fiscal Review
168
3. For Ontarians with Defined Benefit Pension Plans
Improving Long-Term Sustainability
Ontario has made a number of reforms intended to enhance funding flexibility
and mitigate the effects of the 2008 market downturn on DB pension plans.
The government plans to implement further funding changes, including limits
on contribution holidays and accelerated funding of benefit improvements,
to enhance the long‐term sustainability of these plans.
Addressing the Issues of Asset Transfers and Split Pensions
Regulatory requirements and various court decisions have made it difficult,
expensive and time consuming to transfer pension assets between pension plans
as part of a corporate restructuring or government divestment. Individuals
affected by such transactions are often left with “split pensions.” A split pension
means that a person will collect two pensions at retirement; one earned while
working for a former employer and a second earned while working for a new
employer. There is a risk that the sum of the two pensions may be less than it
would have been if their two pensions had been consolidated into a single pension
sponsored by the new employer.
The government has posted draft regulations concerning split pensions
and asset transfers that would:
Allow certain plans to enter into agreements to offer eligible individuals
an opportunity to consolidate their benefits in the successor plan; and
Facilitate the restructuring of pension plans while protecting benefit security
for retirees and plan members.
Feedback will be taken into consideration in the new regulations for asset
transfers and split pensions. These are expected to take effect in January 2014.

Chapter V: Retirement Income Security
169
Ensuring More Sustainable Public-Sector Pension Plans
Many public‐sector pension plans, like their private‐sector counterparts,
are facing sustainability challenges.
The Commission on the Reform of Ontario’s Public Services recommended
that the government work with employer and employee sponsors of jointly
sponsored pension plans (JSPPs) in the public sector to limit contribution rate
increases and address potential future funding shortfalls through reductions in
future benefits. It also recommended measures to contain costs and improve
the sustainability of public‐sector single‐employer pension plans (SEPPs).
Jointly Sponsored Pension Plans
Most of Ontario’s largest public‐sector plans are JSPPs, in which ongoing
contributions and funding shortfalls are the joint responsibility of employers and
plan members. The four JSPPs consolidated in the Province’s financial statements
are the Healthcare of Ontario Pension Plan, Ontario Public Service Employees
Union Pension Plan, Colleges of Applied Arts and Technology Pension Plan,
and Ontario Teachers’ Pension Plan.
The 2012 Budget noted that contribution rates for many JSPPs had risen
significantly as a result of recent funding challenges. In response, the government
consulted on a framework that would freeze contribution rates until the deficit
is eliminated.
After extensive engagement, the government reached agreements with the
four JSPPs consolidated in the Province’s financial statements to freeze employer
contribution rates for a period of five years. These agreements will avoid up to
$1.5 billion in employer contributions that might otherwise have been required.
Should a new funding shortfall occur during the freeze period (December 31, 2012
to December 30, 2017), the plans would be required to reduce future pension
benefits, to a limit, instead of raising contributions to address the shortfall.
These negotiated agreements eliminated the need for a legislative framework.

2013 Ontario Economic Outlook and Fiscal Review
170
Single-Employer Pension Plans
Since May 2011, the government has provided temporary solvency funding
relief to certain public‐sector SEPPs. In exchange for this relief, these SEPPs
are expected to negotiate plan changes that would improve sustainability and
affordability over the long term.
The government’s temporary solvency funding relief regime for public‐sector
SEPPs has been successful. Since implemented, 25 plans have been granted relief
and have begun to negotiate plan changes — 19 of them in the university sector.
The 17 plans that were accepted into the regime as of the 2013 Budget have
had their solvency payment requirements reduced by $240 million annually.
As the latest eight plans accepted into the regime begin to make use of the relief,
the total reduction in solvency payment requirements resulting from the relief
regime will increase further.
Almost all university pension plans have negotiated increases in member
contribution rates and/or reductions in future benefits. Among these university
pension plans, at least 12 are now either at or close to 50/50 cost sharing for
ongoing contributions between members and employers.
The 2013 Budget announced the government’s ongoing commitment to support
the sustainability and affordability of public‐sector SEPPs through:
Continuing the movement to 50/50 cost sharing for ongoing contributions;
Exploring opportunities to support joint sponsorship as the model for pension
plan governance and funding in the public sector; and
Developing a framework that would, if specific conditions are met, permit
the transfer of assets from SEPPs to JSPPs and allow certain SEPPs to merge
with or be converted to JSPPs.
Building on that commitment and the announcement that the government would
consider additional tools to advance these priorities, the Province intends to
provide additional relief of solvency funding obligations for public‐sector SEPPs
that have demonstrated movement towards increased affordability and
sustainability. As well, the government intends to permit the use of letters of
credit by eligible SEPP employer‐sponsors that are engaged in discussions with
members and retirees to convert to a JSPP once a framework is in place.

Chapter V: Retirement Income Security
171
Further to the 2013 Budget announcement, the government has established a
technical working group with expertise in design, governance and transition issues
related to implementing a new pooled asset management entity for public‐sector
SEPPs. The working group’s advice will assist the government in determining how
to move forward with implementation in 2014. This initiative follows up on the
2012 announcement of the government’s intention to introduce an asset pooling
framework for public‐sector pension plans, the subsequent report by the
Province’s Pension Investment Advisor, Bill Morneau, that recommended the
government establish a new entity for this purpose, and the Commission’s
recommendations to achieve efficiencies for broader public‐sector plans.
Making Ontario’s Electricity Sector Pensions More Affordable
Compared to other public‐sector pension plans, electricity sector plans
generally require lower contributions from employees, while providing generous
benefits. As a result, electricity sector employers are responsible for a large
share of pension contributions. This imbalance in cost sharing is borne by
electricity ratepayers.
There has been incremental movement towards 50/50 cost sharing for ongoing
employee contributions negotiated by some companies, such as Hydro One,
in the most recent round of collective bargaining.
However, the affordability of these plans cannot be solved by small increases
to employee contributions over time. Changes must take place more promptly.
The government is committed to seeing changes in cost sharing, governance,
and other provisions that will ensure these plans are more affordable.

2013 Ontario Economic Outlook and Fiscal Review
172
Modernized Pension Investment Rules
In 2000, Ontario harmonized the investment rules governing Ontario‐registered
pension plans with the federal framework in place at that time. The Province has
adopted amendments made by the federal government since then.
As recommended by the Ontario Expert Commission on Pensions, the government
has continued to review the investment rules to ensure that they make sense
for Ontario pension plans. Certain limits imposed by the current rules can have
an impact on plans’ ability to effectively manage risk and contribute to
Ontario’s economy.
Pension plans are prohibited from owning more than 30 per cent of the voting
shares of a single corporation. The rule is intended to restrict the ability of pension
plans to control the corporations in which they invest, essentially making them
“passive” investors.
This limit may, however, create an obstacle to investments in Ontario public
infrastructure projects by Ontario’s pension plans, which potentially represent
a significant new source of capital to support economic growth and job creation
in Ontario.
Another rule limits the percentage of plan assets that can be invested in any one
person or entity, or a group of associated entities or corporations, to 10 per cent.
It is intended to reduce the risk of concentration and promote diversification of
assets. This limit can have the effect, however, of preventing investments in assets
that may be suitable for a particular plan’s liabilities. For example, pension plans
with long‐term liabilities related to inflation‐indexed benefits may wish to better
manage investment risk by holding more inflation‐linked securities.

Chapter V: Retirement Income Security
173
Proposed Regulatory Changes
To modernize the investment rules, the Ontario government will develop
regulatory amendments under the Pension Benefits Act to:
Allow pension plans to further invest in Ontario infrastructure by exempting
plans’ investments in certain Ontario public infrastructure projects from the
rule limiting ownership in a single corporation to 30 per cent of voting
shares; and
Provide plan administrators with greater flexibility to pursue investment
strategies that allow a better match with plan liabilities, through an exemption
to the limit in the current rule for certain government‐issued, inflation‐
indexed securities (e.g., U.S. Treasury Inflation‐Protected Securities).

2013 Ontario Economic Outlook and Fiscal Review
174

VI
Taxation
Chapter


Chapter VI: Taxation
177
Highlights The government is working with the other Members of Provincial Parliament
on a non‐refundable tax credit to encourage the donation of surplus fresh
food to those in need.
The 2013 Budget announced that the three contact centre apprenticeship
trades will no longer qualify for the Apprenticeship Training Tax Credit,
effective April 1, 2014. To help apprentices hired before the 2013 Budget
announcement complete their programs, the government will provide a
transitional support program. Employers will also be able to access regional
economic development programs and the Youth Employment Fund.
The government will be consulting with municipalities, taxpayers and
other northern stakeholders on reforms to the Provincial Land Tax (PLT)
and bringing forward solutions in 2014 that address tax fairness in northern
Ontario. While the review is underway, PLT rates will be frozen for 2014
at the 2013 rates.
To seek broad input for stakeholders, the government will delay the
implementation of the raw leaf tobacco oversight system until
January 1, 2015.
Ontario is proposing to improve the fairness of the taxation of dividends
through changes to its dividend tax credits so that they have the same
value for taxpayers at all income levels.
The government has introduced legislation to provide greater tax relief
to smaller private‐sector employers by increasing the Employer Health
Tax exemption.

2013 Ontario Economic Outlook and Fiscal Review
178

Chapter VI: Taxation
179
Introduction Overview
A competitive and fair tax system delivers relief to people and provides incentives
for business to invest and create jobs in Ontario. The Ontario government has
taken important steps in recent years to foster a competitive and fair tax
environment for people and business.
For people, the Ontario government has:
introduced the Healthy Homes Renovation Tax Credit to make it easier
for seniors to stay safely in their homes for longer;
enhanced sales and property tax credits; and
lowered the Personal Income Tax rate on income in the first bracket
from 6.05 to 5.05 per cent.
For business, the Ontario government has:
reduced Ontario’s Corporate Income Tax (CIT) rates and eliminated the
Capital Tax;
replaced the Retail Sales Tax with the Harmonized Sales Tax (HST), a more
modern value‐added tax;
cut high Business Education Tax (BET) rates significantly, resulting in savings
of over $200 million per year for Ontario businesses; and
streamlined CIT and sales tax administration, saving businesses over
$635 million per year in compliance costs.
In addition, Ontario is paralleling the 2013 federal budget measure to extend the
accelerated Capital Cost Allowance for manufacturing and processing machinery
and equipment acquired in 2014 or 2015, which will help Ontario manufacturers
expand and hire more people.
The government is working with the other Members of Provincial Parliament on
a non‐refundable tax credit to encourage the donation of surplus fresh food to
those in need.
Ontario also proposes changes to the calculation of its dividend tax credits starting in 2014 to improve the fairness of the tax system.
2013 Ontario Economic Outlook and Fiscal Review
180
Support for People Ontario Trillium Benefit
The Ontario Trillium Benefit (OTB) combines the payments of the Ontario Sales
Tax Credit, the Ontario Energy and Property Tax Credit, and the Northern Ontario
Energy Credit into one monthly payment for low‐ to moderate‐income Ontarians.
The 2013 OTB will provide an estimated $2.5 billion in assistance.
After listening to Ontarians, the government made changes to the OTB so that,
beginning in 2014, each recipient will have the choice of receiving their benefit
in monthly instalments or as a single payment at the end of the benefit period.
The OTB monthly payments are delivered from July of one year to June of
the next.
Starting in 2014, recipients will be able to indicate whether they want to receive
their OTB in a single payment by checking a box on their tax returns. For the
2014 OTB, recipients who do not check the box on their 2013 tax return will
receive their monthly payments from July 2014 to June 2015. Those who do check
the box will receive a single payment in June 2015.
Providing a single payment at the end of the benefit period ensures that each
recipient will receive the same total benefit, whether they choose single or
monthly payments. In either case, payments will continue to take into account
events during the year, such as the birth of a child, death, or moving out of
Ontario, that can affect a recipient’s total benefit.
Fresh Food Donation Tax Credit
Each year, Ontario farmers dispose of or plow back into their fields over 11 million
kilograms of fresh food, according to the Ontario Association of Food Banks.
The government is working with the other Members of Provincial Parliament on a
non‐refundable tax credit to encourage the donation of this surplus fresh food to
those in need.
Chapter VI: Taxation
181
Dividend Tax Credits
Individual investors pay Personal Income Tax (PIT) on dividends, which are paid
from corporate earnings that have already been taxed. To avoid this “double
taxation,” federal and provincial dividend tax credits are intended to compensate
individual shareholders for income tax paid by Canadian companies in which they
have invested.
The 2013 federal budget announced changes to the tax treatment of dividend
income from small companies to reflect lower small business tax rates across the
country. Under the tax collection agreement with the federal government, Ontario
will automatically parallel these changes. Ontario’s surtax would result in these
changes having inequitable impacts on taxpayers with different incomes.
The government is proposing to take action to improve fairness for investors
before the federal changes take effect.
Higher‐income people pay the Ontario surtax applied to their basic income tax.
Unlike other PIT rates, the surtax is applied after non‐refundable credits (like
dividend tax credits) have been deducted from basic income tax. As a result, while
these tax credits reduce only the basic tax for non‐surtax payers, they reduce both
the basic tax and the surtax for higher‐income people. Thus, Ontario’s dividend
tax credits provide a greater benefit for people with higher incomes — up to
56 per cent more — than for non‐surtax payers.
For example, a senior with moderate income who receives $1,000 in dividends from a large Canadian company receives an Ontario dividend tax credit of about $88, while a higher-income investor benefits by about $138.
To improve fairness for investors, the government proposes to change the
calculation of the Ontario surtax with respect to dividend tax credits. With these
proposed changes, Ontario’s dividend tax credits would have the same value for
all taxpayers, regardless of their incomes. The government will continue to review
the tax system to see whether other changes can be made to enhance fairness.

2013 Ontario Economic Outlook and Fiscal Review
182
These changes would take effect January 1, 2014. About 925,000 people with
generally low to moderate incomes would pay on average $145 less Ontario PIT,
and 110,000 higher‐income people would pay on average $1,180 more. These
changes would provide net savings to investors of about $4 million per year.
Details of Proposed Dividend Tax Credit Changes Ontario’s dividend tax credit rates have been set to provide recognition for the tax paid at the corporate level when determining the tax payable by the individual investor. These rates also take into account the Ontario surtax on higher-income people. Because the surtax is calculated as a percentage of basic Ontario tax after dividend tax credits have been deducted, the tax credits reduce both the basic amount of tax and the surtax.
Dividend tax credits have two rates to recognize the different CIT rates that apply to corporate income:
Canadian-controlled private corporations pay a lower Ontario CIT rate (4.5 per cent) on the first $500,000 of active business income. Dividends paid from this income (“non-eligible dividends”) qualify for a lower dividend tax credit rate to reflect the lower CIT rate; and
Other dividends that are paid from income taxed at the 10 or 11.5 per cent Ontario CIT rates (“eligible dividends”) qualify for a higher dividend tax credit.
Non-eligible dividends: Dividends paid from income taxed at the small business rate (4.5 per cent in Ontario) qualify for a 4.5 per cent dividend tax credit. Surtax payers receive up to 56 per cent more tax relief — for a total of about 7 per cent, which is more than the CIT notionally paid. Because Ontario’s dividend tax credits are calculated as percentages of the federal credits, the federal government’s changes would have the unintended effect of reducing Ontario’s 4.5 per cent tax credit rate to 3.7 per cent if Ontario were to make no change.

Chapter VI: Taxation
183
Eligible dividends: Dividends paid from other corporate income taxed at higher CIT rates (10 or 11.5 per cent in Ontario) qualify for a 6.4 per cent dividend tax credit. Surtax payers receive a total benefit of up to 10 per cent because of the interaction of the credit with the surtax. However, non-surtax payers, who receive a tax credit of only 6.4 per cent, are undercompensated.
To improve fairness for investors, the government proposes to:
Calculate the Ontario surtax before deducting dividend tax credits from Ontario tax;
Reset the tax credit rate for non-eligible dividends to the 2013 rate of 4.5 per cent; and
Increase the tax credit rate for eligible dividends from 6.4 per cent to 10 per cent.
Effective Ontario Dividend Tax Credit Rates
Dividends from: Taxpayers 2013 2014
(proposed)
Small Business Income
Non‐surtax 4.5% 4.5%
Surtax 7.0%
Other Corporate Income
Non‐surtax 6.4% 10%
Surtax 10%

2013 Ontario Economic Outlook and Fiscal Review
184
Support for Business Accelerated Capital Cost Allowance for Manufacturing and Processing Machinery and Equipment
To increase the incentive for manufacturers in Ontario to invest, the Province is
paralleling the 2013 federal budget measure to extend the accelerated Capital
Cost Allowance for manufacturing and processing machinery and equipment
acquired in 2014 or 2015. This measure will provide about $265 million of
support for manufacturing businesses over three years, beginning in 2013–14.
Business Support Programs Review
In the 2013 Budget, the Province announced it would establish a Technical Panel
to review and evaluate Ontario’s business support programs according to
established criteria, including those recommended by the Jobs and Prosperity
Council: innovation, productivity and increasing exports. All forms of business
support will be considered. Business supports include tax credits, grants and other
direct support programs. The final report is expected to be provided to the
Province in time to inform the 2014 Budget.

Chapter VI: Taxation
185
A Fair and Efficient Tax System Building on the changes to the dividend tax credits to make the Ontario tax
system fairer, the government will review whether the interaction of the
surtax with other Personal Income Tax credits results in inequitable treatment
of taxpayers. Any decisions on the treatment of the surtax will be made in the
context of creating a fairer tax system.
As outlined in Chapter I, Section A, the government will study various approaches,
including those taken in other jurisdictions, to encourage higher levels of
business investment in new equipment, research and development, and training.
On October 28, 2013, the Institute for Competitiveness and Prosperity released
a Working Paper entitled “Taxing for Growth: A Close Look at Tax Policy in
Ontario.” The paper calls for an effective, equitable and efficient tax system in
Ontario, and points out numerous potential changes to achieve these goals.
Recommendations include reviewing targeted personal tax incentives and the
efficiency of the corporate tax system. These recommendations and others will
be studied by the government to ensure that Ontario’s tax system is progressive,
fair, and designed to encourage jobs and growth.
2013 Ontario Economic Outlook and Fiscal Review
186
Property Tax Provincial Land Tax Reform
Provincial Land Tax (PLT) is a property tax that applies in unincorporated areas
outside municipal boundaries.
The Province is responsible for setting PLT rates, which have not been adjusted
in several decades. As a result, PLT rates are currently significantly lower than
municipal property tax rates in neighbouring municipalities.
For example, homeowners in northern municipalities pay on average about
$2,200 in municipal property taxes each year, whereas residential PLT taxes in
bordering communities average less than $150. In fact, PLT taxes are less than
$325 for 90 per cent of residential properties. Even when other local levies are
taken into consideration, property tax rates in the unincorporated areas are
much lower than in municipalities.
While a portion of this tax difference may arise from differences in available
services, northern municipalities have expressed serious concerns with the
inequity they have identified between taxpayers within their boundaries and
those outside. Municipalities have also suggested that very low PLT rates have
encouraged development in unincorporated areas just beyond their boundaries,
while these developments continue to rely on services in the municipality.
The Province is committed to addressing the concerns of northern municipalities
in a fair and balanced manner. The government will be consulting with
municipalities, taxpayers and other northern stakeholders on reforms to the PLT
and bringing forward solutions in 2014 that address tax fairness in the north.
While the review is underway, PLT rates will be frozen for 2014 at the 2013 rates.

Chapter VI: Taxation
187
Education Property Tax
As part of efforts to protect the Province’s revenue base, the government will
explore options to avoid further erosion of the support education property taxes
provide to Ontario’s elementary and secondary schools.
As noted by the Commission on the Reform of Ontario’s Public Services,
the Province’s education property tax rate policies have resulted in a significant
decline in the share of funding for elementary and secondary schools in Ontario
that is supported by education property taxes.
The Commission determined that since the Province first assumed responsibility
for education tax rates in 1998, the share of education funding that is supported
by education property taxes had decreased from 44 per cent to 30 per cent in
2010–11. It is worth noting that subsequent to the Commission’s report,
the share has continued to decrease to 28 per cent in 2012–13.
To date, the Province has increased transfers to school boards by $3.8 billion to
offset the decline in property tax support for education.
Education Property Taxes as a Per Cent of Elementary and Secondary Education Funding
Per Cent
44
28
15
20
25
30
35
40
45
50
1998–99 2012–13
CHART 6.1
Source: Ontario Ministry of Finance.

2013 Ontario Economic Outlook and Fiscal Review
188
Residential Education Tax
According to the Commission on the Reform of Ontario’s Public Services,
the decline in the share of education funding that is supported by education
property taxes is primarily the result of the Province’s tax rate policies.
Since 1998, the Province has reduced education tax rates to fully offset
reassessment increases. In fact, the residential education tax rate has been
cut in half since 1998.
As recommended by the Commission, the Province will review its residential
education tax rate policies in order to explore options to avoid further erosion
of property tax support for Ontario’s elementary and secondary schools.
It is also important to note that the Province provides a total of over $1 billion
per year in municipal and education property tax relief to low- to moderate-
income people. This tax relief represents a significant portion of the total
$2.9 billion in residential education tax revenue raised each year.
Business Education Tax
The Commission on the Reform of Ontario’s Public Services also raised concerns
related to economic distortions caused by the wide range of Business Education
Tax (BET) rates across the province. This variance in BET rates reflects historical
assessment and tax inequities that existed before the Province assumed
responsibility for the rates. To address these inequities and distortions, the
Commission recommended moving towards a policy of a single province-wide
BET rate for all regions of the province.
Since 2007, the Province has made significant progress in addressing BET rate
inequities by lowering high rates towards a BET target rate that was set well below
the average BET rate. However, the Province has not adjusted low rates upwards
towards the BET target rate.
In recognition of the importance of continuing to narrow the variance in BET rates,
the Province will review the Commission’s recommendation to move towards a
single uniform BET rate.
Chapter VI: Taxation
189
Other Measures Employer Health Tax Exemption
As proposed in the 2013 Budget, to support small business, the Employer Health
Tax (EHT) exemption for private-sector employers would be increased from
$400,000 to $450,000 of annual Ontario payroll. This change would be effective
January 1, 2014, and would increase the tax relief the exemption provides by
up to $975 per employer with annual Ontario payroll of $5 million or less.
With this change, over 60,000 smaller employers would pay less EHT, including
more than 12,000 that would no longer pay this tax and would save on the cost
of filing an EHT return. In 2014, an estimated 88 per cent of Ontario private-sector
employers would not pay EHT.
The exemption would be adjusted for inflation every five years using the Ontario
Consumer Price Index.
To better target this exemption to smaller employers, it would be eliminated for
employers (including groups of associated employers) with annual Ontario payrolls
over $5 million. This would increase EHT paid by up to $7,800 per year for over
5,000 larger employers. Registered charities, including those with Ontario payrolls
over $5 million, would continue to claim the exemption.
When these changes are combined, the cost of the additional EHT relief
provided to smaller employers would be largely offset by additional EHT paid
by larger employers.
The government has introduced legislation through Bill 105, Supporting Small
Businesses Act, 2013, to implement these changes. To implement these changes
by January 1, 2014, the legislation would need to be approved by the end of 2013.

2013 Ontario Economic Outlook and Fiscal Review
190
Apprenticeship Training Tax Credit
The Apprenticeship Training Tax Credit (ATTC) provides businesses with a
35 to 45 per cent refundable tax credit on the salaries and wages paid to eligible
apprentices in designated construction, industrial, motive power and service
trades. The ATTC, together with other provincial apprenticeship programs,
supports the availability of skilled workers by encouraging businesses to hire
and train apprentices in the skilled trades.
To better target the ATTC and help improve completion rates among ATTC-eligible
trades, the 2013 Budget announced that three contact centre apprenticeship
trades will no longer qualify under the ATTC beginning on April 1, 2014.
After March 31, 2014, employers of apprentices registered in these three trades
will continue to be able to apply for other apprenticeship incentives such as the
$1,000 bonus for each apprentice upon completion of the apprenticeship.
In addition, contact centre employers will be able to apply for regional economic
development programs and the Youth Employment Fund, which was launched
in September 2013.
The government will provide qualifying employers with some transitional support.
Transitional support will be available for employers who hired eligible apprentices
in the three affected trades before May 3, 2013, and will last for up to 24 months
from the date the apprentices were hired. This funding will help these apprentices
complete their training.
This support will be provided through a grant program. Further details will be
announced by the Ministry of Training, Colleges and Universities.

Chapter VI: Taxation
191
Revenue Integrity Measures
The government is committed to ensuring that all taxpayers pay their fair
share of taxes. In this regard, the government is implementing a number of
initiatives to address the underground economy and corporate tax avoidance.
Specifically, working with the federal government, Ontario is supporting enhanced
compliance activities that could generate more than $700 million in tax revenues
over the next four years. Furthermore, in the administration of its own tax
statutes, Ontario is conducting enhanced audits of accounts in high-risk areas
and is on track to realize $65 million in tax revenues in 2013–14. The government
also plans to introduce additional underground economy measures that will
promote awareness and sharing of information among jurisdictions, and
strengthen overall enforcement activities.
“[T]he Province also needs to look to enhanced administration and enforcement activities as a way to improve the integrity of the tax system…. Ontario businesses that employ aggressive tax planning as their competitive advantage must be challenged…. Addressing the underground economy creates a level playing field for taxpayers and businesses.”
Commission on the Reform of Ontario’s Public Services, “Public Services for Ontarians: A Path to Sustainability and Excellence,” 2012, pp. 411–12.

2013 Ontario Economic Outlook and Fiscal Review
192
Ontario’s Tobacco Strategy
In the 2013 Budget, the government reaffirmed its commitment to the Smoke-
Free Ontario Strategy aimed at protecting the health of Ontarians from tobacco
use. Ontario is determined to have the lowest smoking rates in Canada and to
reduce the supply of low-cost, illegal tobacco available to young people.
Building stronger partnerships with First Nation communities on issues related to
tobacco remains a priority for the government. Good progress has been made on
pilot projects commenced last year with the Chippewas of the Thames First Nation
and the Mohawk Council of Akwesasne. These discussions have focused on
research and analysis that will help Ontario and the pilot First Nation communities
identify appropriate community-based regulatory approaches for tobacco on
reserve. This opportunity may be expanded to other First Nation communities.
The government is commencing a formal review of the current system of
allocating unmarked cigarettes. Bill 186, Supporting Smoke‐Free Ontario by
Reducing Contraband Tobacco Act, 2011, amended the Tobacco Tax Act to permit
the government to enter into arrangements and agreements with Band Councils
with respect to tobacco on-reserve. First Nation communities will be engaged with
a view to modernizing the current allocation system, which has its limitations.
Given the impact on the tobacco industry and the need to seek broad input from
various stakeholders, the government has decided to delay the implementation
of the raw leaf tobacco oversight system until January 1, 2015.
The government also recognizes the need to address the problem of illegal
tobacco through a balanced approach of enforcement and partnership.
In this regard, the government will continue to work with law enforcement
agencies to seize illegal products and to prosecute those who violate the law.
New enforcement measures will continue to be explored.

VII
Borrowing and Debt Management
Chapter


Chapter VII: Borrowing and Debt Management
195
Highlights The total long‐term public borrowing requirement over the 2013–16 period
has been reduced by $0.5 billion compared to the 2013 Budget, primarily due
to the lower deficit recorded in the 2012–2013 Public Accounts of Ontario.
The forecast for long‐term public borrowing for 2013–14 remains
at $33.4 billion, as forecast in the 2013 Budget.
The interest on debt (IOD) expense for 2013–14, forecast at
$10,605 million, remains the same as in the 2013 Budget.
Net debt and accumulated deficit are forecast to be $0.7 billion and
$1.1 billion respectively lower than projected in the 2013 Budget,
primarily due to the lower deficit recorded in the 2012–2013 Public
Accounts of Ontario.
Net debt is projected to be $272.1 billion as at March 31, 2014.
Accumulated deficit is projected to be $178.9 billion as at March 31, 2014.
The difference of $93.2 billion between net debt and accumulated deficit
is due to net investments in capital assets.
The government will maintain a rigorous approach to control program
spending to reduce Ontario’s net debt‐to‐GDP ratio to its pre‐recession
level of 27 per cent.
The government would make Ontario the first province in Canada to offer
green bonds.

2013 Ontario Economic Outlook and Fiscal Review
196

Chapter VII: Borrowing and Debt Management
197
Long-Term Public Borrowing The forecast long‐term public borrowing requirement for 2013–14 remains at
$33.4 billion, as forecast in the 2013 Budget. As at October 23, 2013, $21.9 billion,
or 65 per cent, of this year’s long‐term public borrowing requirement was
completed. This figure includes Ontario Savings Bond sales of $0.4 billion.
The weighted‐average term to maturity of long‐term provincial debt issued
so far in 2013–14 is 13.8 years, compared to 12.4 years for 2012–13 and
13.0 years for 2011–12. The term of debt may be extended or shortened
depending on the future direction of interest rates and the term preference
of investors. The interest on debt (IOD) expense for 2013–14, forecast at
$10,605 million, remains the same as in the 2013 Budget.
Ontario has issued $17.5 billion in long‐term debt in the Canadian dollar market
so far this year, representing 80 per cent of total borrowing to date. The Province
expects to end the year with at least 70 per cent of its borrowing in the Canadian
market, as set out in the 2013 Budget.

2013 Ontario Economic Outlook and Fiscal Review
198
Canadian dollar borrowing has been completed through:
syndicated issues;
floating rate notes;
medium‐term notes; and
Ontario Savings Bonds.
The U.S. dollar market has remained an important source of funding for Ontario
this year. About $4.4 billion, or 20 per cent, of borrowing has been completed
through global bonds in U.S. dollars.
Domestic Syndicated
Bonds$15.6B 71.4%
Domestic Floating Rate
Notes $1.4B 6.3%
OntarioSavings Bonds
$0.4B2.0%
Domestic Medium-Term
Notes $0.02B0.1%
U.S. Dollar Global Bonds
$4.4B20.1%
Note: Numbers may not add due to rounding.Source: Ontario Financing Authority.
$21.9 Billion Issued
CHART 7.12013–14 Borrowing

Chapter VII: Borrowing and Debt Management
199
TABLE 7.1 2013–14 Borrowing Plan
($ Billions)
Budget Plan
Current Outlook
In-Year Change
Deficit 11.7 11.7 – Investment in Capital Assets 11.1 11.2 0.1 Non-Cash Adjustments (3.9) (3.9) – Net Loans/Investments 1.6 1.6 – Debt Maturities 23.7 23.6 (0.1) Debt Redemptions 0.3 0.3 – Total Funding Requirement 44.5 44.5 –
Decrease/(Increase) in Short-Term Borrowing (1.5) (1.5) – Increase/(Decrease) in Cash, Cash Equivalents and Temporary Investments (5.8) (5.8) – Maturity of Debt Buybacks (3.7) (3.7) – Total Long-Term Public Borrowing Requirement 33.4 33.4 –
Note: Numbers may not add due to rounding.
Long‐term public borrowing in 2013–14 will remain at $33.4 billion as forecast in
the 2013 Budget.
Over the summer and early fall, long‐term interest rates rose above those forecast
in the 2013 Budget. If interest rates resume their rise during the remainder of
2013–14, there could be potential upward pressure on IOD costs depending on
the term of debt issued.
The credit ratings of debt issued in the capital markets affect the cost of
borrowing. The government will maintain a rigorous approach to control program
spending to reduce Ontario’s net debt‐to‐GDP ratio to its pre‐recession level of
27 per cent. This will help keep IOD at a manageable level and protect future
generations from rising interest costs, which could otherwise crowd out spending
on government priorities.

2013 Ontario Economic Outlook and Fiscal Review
200
To finance further investment in transit, the government would make Ontario
the first province in Canada to offer green bonds to finance transit projects.
Green bonds, pioneered by the World Bank in 2008, are a tool to raise capital
for projects with specific environmental benefits. Green bonds would be issued
by Ontario for green transit initiatives, and other environmentally friendly
infrastructure projects, to capitalize on the Province’s ability to raise
low‐cost funds.

Chapter VII: Borrowing and Debt Management
201
TABLE 7.2 Medium‐Term Borrowing Outlook
($ Billions)
2013–14 2014–15 2015–16
Deficit 11.7 10.1 7.2 Investment in Capital Assets 11.2 10.4 10.4 Non-Cash Adjustments (3.9) (3.1) (3.0) Net Loans/Investments 1.6 0.4 1.8 Debt Maturities 23.6 21.7 20.4 Debt Redemptions 0.3 0.3 0.3 Total Funding Requirement 44.5 39.8 37.1
Decrease/(Increase) in Short-Term Borrowing (1.5) (1.5) – Increase/(Decrease) in Cash and Cash Equivalents (5.8) (1.3) – Maturity of Debt Buybacks (3.7) – – Total Long-Term Public Borrowing 33.4 37.0 37.1
Note: Numbers may not add due to rounding.
The total long‐term public borrowing requirement over the 2013–16 period has
been reduced by $0.5 billion compared to the 2013 Budget primarily due to the
lower deficit recorded in the 2012–2013 Public Accounts of Ontario.

2013 Ontario Economic Outlook and Fiscal Review
202
Debt Total debt, which represents all borrowing without offsetting financial assets,
is projected to be $291.9 billion as at March 31, 2014, compared to $281.1 billion
as at March 31, 2013.
Ontario’s net debt is the difference between total liabilities and total financial
assets. It is projected to be $272.1 billion as at March 31, 2014, $0.7 billion lower
than forecast in the 2013 Budget. Net debt was $252.1 billion as at
March 31, 2013.
Accumulated deficit is projected to be $178.9 billion as at March 31, 2014,
compared to $179.9 billion forecast in the 2013 Budget. The projected difference
of $93.2 billion between net debt and accumulated deficit is due to net
investments in capital assets.
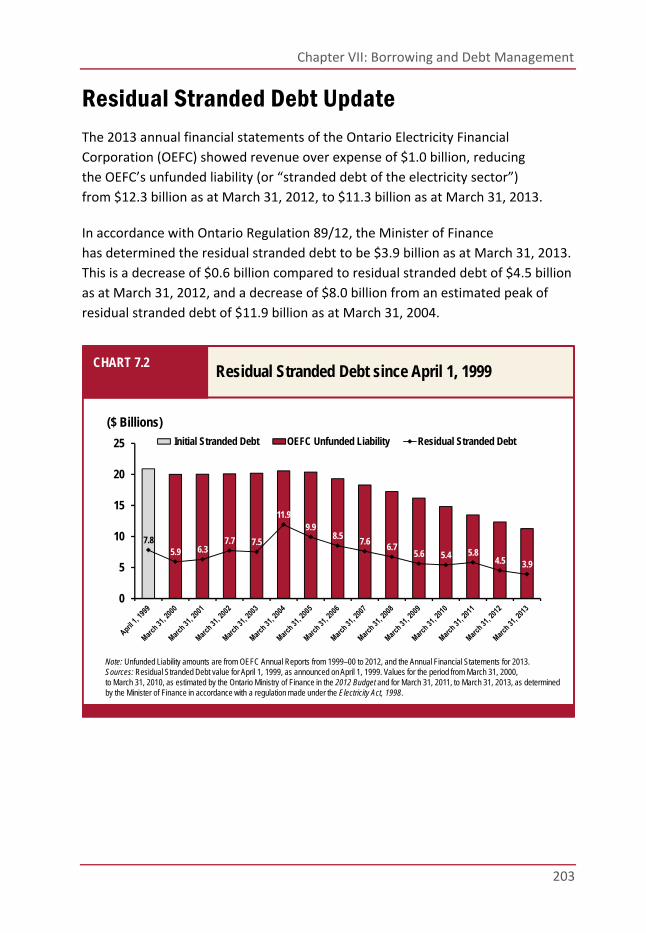
Chapter VII: Borrowing and Debt Management
203
Residual Stranded Debt Update
The 2013 annual financial statements of the Ontario Electricity Financial
Corporation (OEFC) showed revenue over expense of $1.0 billion, reducing
the OEFC’s unfunded liability (or “stranded debt of the electricity sector”)
from $12.3 billion as at March 31, 2012, to $11.3 billion as at March 31, 2013.
In accordance with Ontario Regulation 89/12, the Minister of Finance
has determined the residual stranded debt to be $3.9 billion as at March 31, 2013.
This is a decrease of $0.6 billion compared to residual stranded debt of $4.5 billion
as at March 31, 2012, and a decrease of $8.0 billion from an estimated peak of
residual stranded debt of $11.9 billion as at March 31, 2004.
7.85.9 6.3
7.7 7.5
11.99.9
8.57.6
6.75.6 5.4 5.8
4.5 3.9
0
5
10
15
20
25 Initial Stranded Debt OEFC Unfunded Liability Residual Stranded Debt
Note: Unfunded Liability amounts are from OEFC Annual Reports from 1999–00 to 2012, and the Annual Financial Statements for 2013.Sources: Residual Stranded Debt value for April 1, 1999, as announced on April 1, 1999. Values for the period from March 31, 2000, to March 31, 2010, as estimated by the Ontario Ministry of Finance in the 2012 Budget and for March 31, 2011, to March 31, 2013, as determined by the Minister of Finance in accordance with a regulation made under the Electricity Act, 1998.
($ Billions)
CHART 7.2Residual Stranded Debt since April 1, 1999

2013 Ontario Economic Outlook and Fiscal Review
204
The residual stranded debt determination as at March 31, 2013, is based on a
stranded debt amount of $11.3 billion, reduced by the estimated present value
of future dedicated revenues to OEFC of $7.4 billion. This results in the calculated
$3.9 billion of residual stranded debt as at March 31, 2013.
The Electricity Act, 1998, provides for the Debt Retirement Charge (DRC) to be
paid by consumers until the residual stranded debt is retired. The estimate for
when the residual stranded debt will likely be retired is between 2015 and 2018.
The estimated timing for residual stranded debt retirement and the end of the
DRC is provided as a range to reflect the uncertainty in forecasting future OEFC
results and dedicated revenues to OEFC, which depend on the financial
performance of Ontario Power Generation, Hydro One and municipal electrical
utilities, as well as other factors such as interest rates and electricity consumption.

Chapter VII: Borrowing and Debt Management
205
Total Debt Composition Total debt is composed of bonds issued in the public capital markets,
non‐public debt, treasury bills and U.S. commercial paper.
Ontario total debt was $288.1 billion as at September 30, 2013. Public debt totals
$274.8 billion, primarily consisting of bonds issued in the long‐term markets in
Canadian dollars and internationally in U.S. dollars and nine other currencies.
The Province also has $13.3 billion outstanding in non‐public debt issued in
Canadian dollars. Non‐public debt primarily consists of debt instruments issued
to the Canada Pension Plan. This debt is not marketable and cannot be traded.
International Bonds• Canadian dollars• U.S. dollars• Euros• Japanese yen• New Zealand dollars• Norwegian kroner• Swiss francs• U.K. pounds sterling• Australian dollars• South African rand• Hong Kong dollars
Domestic Bonds• Syndicated bonds• Medium-term notes• Floating rate notes• Ontario Savings Bonds• Bond auctions• Real return bonds
CHART 7.3Total Debt Composition as at September 30, 2013
$288.1 Billion Outstanding
Non-Public Debt$13.3B
4%
Treasury Bills and U.S. Commercial
Paper$19.7B
7%
International Bonds$65.5B
23%
Domestic Bonds $189.6B
66%
Note: Numbers may not add due to rounding.Source: Ontario Financing Authority.
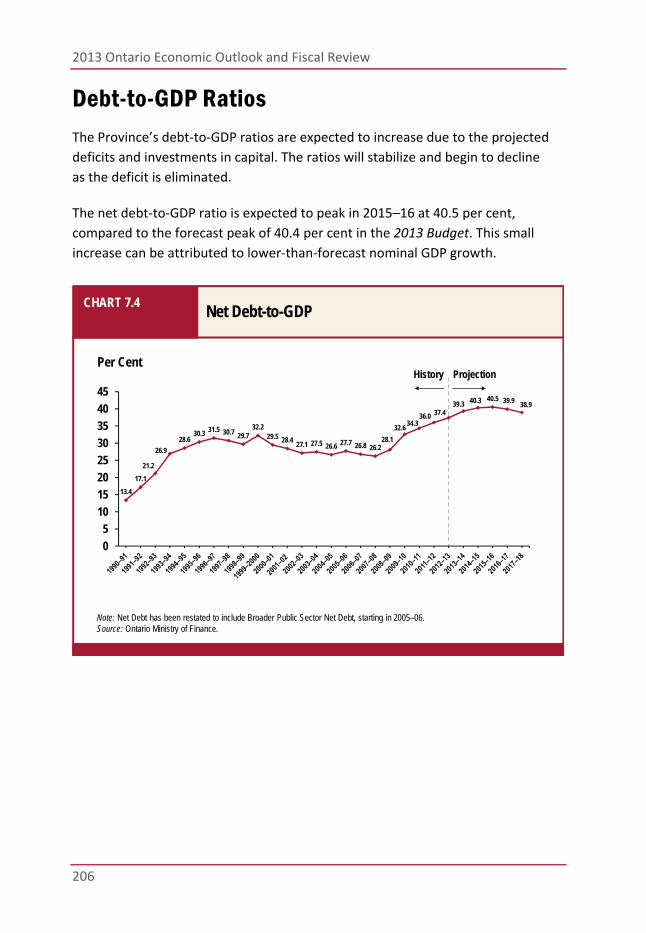
2013 Ontario Economic Outlook and Fiscal Review
206
Debt-to-GDP Ratios The Province’s debt‐to‐GDP ratios are expected to increase due to the projected
deficits and investments in capital. The ratios will stabilize and begin to decline
as the deficit is eliminated.
The net debt‐to‐GDP ratio is expected to peak in 2015–16 at 40.5 per cent,
compared to the forecast peak of 40.4 per cent in the 2013 Budget. This small
increase can be attributed to lower‐than‐forecast nominal GDP growth.
Note: Net Debt has been restated to include Broader Public Sector Net Debt, starting in 2005–06.Source: Ontario Ministry of Finance.
Per Cent
CHART 7.4Net Debt-to-GDP
13.4
17.1
21.2
26.9
28.630.3 31.5 30.7 29.7
32.229.5 28.4
27.1 27.5 26.6 27.7 26.8 26.228.1
32.634.3
36.0 37.439.3 40.3 40.5 39.9 38.9
0
5
10
15
20
25
30
35
40
45
History Projection

Chapter VII: Borrowing and Debt Management
207
Source: Ontario Ministry of Finance.
Per Cent
CHART 7.5Accumulated Deficit-to-GDP
13.4
17.1
21.2
26.9
28.630.3
31.5 30.729.7
32.2
29.5 28.4
24.3 24.623.7
19.818.6 17.7
18.722.0
23.1 24.224.8
25.9 26.3 26.2 25.624.5
0
5
10
15
20
25
30
35History Projection

2013 Ontario Economic Outlook and Fiscal Review
208
Cost of Debt The effective interest rate (on a weighted‐average basis) on total debt
was 4.0 per cent as at September 30, 2013, compared to 4.1 per cent as at
March 31, 2013. This drop occurred because the debt issued in the first half of
this fiscal year had lower interest rates than that of maturing debt, even though
long‐term interest rates have risen above those forecast in 2013 Budget. The rate
of decline in the Province’s effective interest rate has slowed, however, and if
long‐term interest rates continue to rise, this trend will reverse and the effective
interest rates on total debt will begin to rise.
*As at September 30, 2013.Sources: Public Accounts of Ontario (1991–2013) and Ontario Financing Authority.
Per Cent
CHART 7.6 Effective Interest Rate (Weighted Average) on Total Debt
10.9 10.710.1
9.59.8
9.49.0 9.0
8.6 8.4 8.27.6
7.26.7
6.4 6.1 6.0 5.85.2
4.6 4.5 4.4 4.1 4.0
0
2
4
6
8
10
12

Chapter VII: Borrowing and Debt Management
209
Risk Exposure The Province limits itself to a maximum net interest rate resetting exposure
of 35 per cent of debt issued for Provincial purposes and a maximum foreign
exchange exposure of five per cent of debt issued for Provincial purposes.
As at September 30, 2013, the net interest rate resetting exposure was
8.9 per cent and foreign exchange exposure was 0.4 per cent.
Note: Excludes OEFC debt.Source: Ontario Financing Authority.
11.5 11.48.3 8.3 8.9 8.9
0
5
10
15
20
25
30
35
March 31, 2009 March 31, 2010 March 31, 2011 March 31, 2012 March 31, 2013 September 30, 2013
As a Percentage of Debt Issued for Provincial Purposes(Interest Rate Exposure Limit Set at 35 Per Cent)
CHART 7.7Interest Rate Exposure

2013 Ontario Economic Outlook and Fiscal Review
210
Note: Excludes OEFC debt.Source: Ontario Financing Authority.
0.2 0.1
1.0 1.00.8
0.4
0
1
2
3
4
5
March 31, 2009 March 31, 2010 March 31, 2011 March 31, 2012 March 31, 2013 September 30, 2013
As a Percentage of Debt Issued for Provincial Purposes(Foreign Exchange Exposure Limit Set at 5 Per Cent)
CHART 7.8Foreign Exchange Exposure

VIII
Pre-Budget Consultations
Chapter


Chapter VIII: Pre‐Budget Consultations
213
How to Participate in the 2014 Pre-Budget Consultations Last year, the government had its most successful consultations to date.
This year, once again the Minister of Finance will be hosting pre‐budget
consultations with individuals and organizations as part of the Ontario
government’s ongoing dialogue with the citizens of Ontario.
Through the use of modern technology, including virtual town halls, the Minister
of Finance will continue to reach a broader audience in communities throughout
the province.
A series of online consultations will provide a new interactive forum for
participants to provide input. In particular, the Minister of Finance wants to hear
Ontarians’ views regarding what more the government can do to create jobs and
grow the economy, while eliminating the deficit.
Below is information on how you can share your views and ideas for the upcoming
2014 Budget.
Online Submissions
Individuals can also submit ideas for the 2014 Budget by completing a form on
the Ministry of Finance website at www.fin.gov.on.ca. Click on the “Pre‐Budget
Consultations” item in the Ontario’s Fiscal Cycle menu.

2013 Ontario Economic Outlook and Fiscal Review
214
Written Submissions
Individuals and organizations can mail, email or fax submissions directly to the
Minister of Finance.
Mailing Address
The Honourable Charles Sousa
Minister of Finance
c/o Budget Secretariat
Frost Building North, 3rd Floor
95 Grosvenor Street
Toronto, ON M7A 1Z1
Email Address
Fax
416‐325‐0969

Chart Descriptions
Chart Descriptions
Chart 1.1: Ontario Job Recovery Ahead of Key Competitors
Bar chart shows the per cent change in Ontario’s employment since June 2009
compared to Great Lake States, the OECD average, the U.S. average and the rest
of Canada.
Ontario’s employment has increased by 7.4 per cent since June 2009.
Illinois and Ohio were down 0.2 per cent, New York was up 0.6 per cent,
Wisconsin was up 0.7 per cent, Indiana was up 1.2 per cent, Pennsylvania was up
1.9 per cent, Michigan was up 2.6 per cent, Minnesota was up 4.1 per cent, the
OECD average was up 3.1 per cent, the U.S. average was up 4.4 per cent and the
rest of Canada was up 5.3 per cent.
Return to Chart 1.1
Chart 1.2: Poverty Reduction Strategy Helps Lower Child Poverty
This bar chart shows that the government's Poverty Reduction Strategy is helping
to lower child poverty. For 2011, the poverty rate for children was 22.2 per cent
before taxes and transfers. After accounting for the impact of taxes and transfers,
the poverty rate for 2011 declined to 15.9 per cent. The impact of the poverty
reduction strategy was to further lower the child poverty rate to 13.6 per cent.
Return to Chart 1.2
Chart 1.3: Canadian Corporate Cash Balances Above Long-Term Average
The line chart shows Canadian non‐financial corporate cash balances as a per cent
of total assets between the first quarter of 1988 and the second quarter of 2013.
It has risen from just below 4 per cent to a peak of 7.7 per cent in the fourth
quarter of 2011. It has since declined to 7.3 per cent, but remains well above its
long‐term average of 5.3 per cent.
Return to Chart 1.3
2013 Ontario Economic Outlook and Fiscal Review
Chart 1.4: Ontario Business Investment Lags Canada and the United States
The line chart shows plant and equipment investment as a per cent of GDP for
Ontario, Canada and the United States over the 2007 to 2012 period. Ontario
plant and equipment as a share of GDP remains below that of Canada and the
United States over the entire period. Ontario’s plant and equipment share of GDP
was 9.5 per cent in 2007, rising to 9.7 per cent in 2008. It trended down over the
next two years, falling to a low of 8.3 per cent in 2010. The share has risen since,
hitting 8.9 per cent in 2012. From a high of 13.3 per cent in 2007, U.S. plant and
equipment as a share of GDP has trended lower, falling to 11.1 per cent in 2010.
The U.S. share has rebounded since, hitting 12.1 per cent in 2012. Canadian plant
and equipment as a share of GDP was 12.6 per cent in 2007, rising to 12.9 per cent
in 2008. It fell to a low of 11.2 per cent in 2010, but trended higher over the next
three years, reaching 12.8 per cent in 2012, above both the U.S. and Ontario
shares that year.
Return to Chart 1.4
Chart 1.5: Ontario Business R&D Spending Below the U.S.
Ontario businesses continue to underinvest in productivity‐enhancing activities
such as research and development (R&D). Business R&D as a percentage of GDP
in Ontario has continuously lagged behind the United States. Between 2001 and
2011, Ontario’s business R&D as a percentage of GDP declined from 1.7 per cent
to 1.2 per cent, while the United States remained at 1.9 per cent.
Return to Chart 1.5
Strengthening Ontario’s Sectors
Aerospace
Key Fact: 2nd largest aerospace sector in Canada.
Key Initiatives: Partnering with industry and academia to help build a leading
aerospace cluster around Downsview Park in Toronto.
Agri‐Food
Key Fact: 6th largest in food and beverage processing in North America.
Key Initiatives: Supporting farmers through funding for business risk management
and innovation programs while partnering with manufacturers, like Dr. Oetker, to
add value to Ontario‐grown food.

Chart Descriptions
Auto
Key Fact: A top sub‐national NAFTA jurisdiction in vehicle assembly.
Key Initiatives: Working with major auto companies to support assembly facilities
that will anchor the automotive cluster in Ontario, including recent support for
Ford Motor Company in Oakville.
Chemistry
Key Fact: Sarnia‐Lambton is Canada’s largest chemistry cluster.
Key Initiatives: Supporting the production of innovative and new products
including basic organic and inorganic chemicals, synthetic resins and fertilizers.
Clean Tech
Key Fact: Ontario’s clean tech sector has 10,100 jobs and 200 firms.
Key Initiatives: Working with industry on research and development and
manufacturing of bio‐based technologies, processes and products. Also, Ontario’s
Water Sector Strategy will help to strengthen the water sector and help innovative
firms compete in global markets and provide solutions to global water challenges.
Financial Services
Key Fact: Toronto is 2nd largest by employment in North America.
Key Initiatives: Working with industry and other levels of government to
implement a financial services sector growth and competitiveness strategy.
Ontario, British Columbia and the federal government have signed an agreement
in principle to establish a cooperative capital markets regulator (CCMR) and have
commenced work on implementation of the new system.
Forestry
Key Fact: In 2012, forest products exports were valued at $3.5B.
Key Initiatives: Supporting the transformation of the forest sector towards
production of higher value‐added products to preserve and create jobs through
existing funding programs and reforms to the tenure and pricing system for
Crown forest resources.
ICT
Key Fact: 3rd in ICT in North America.
Key Initiatives: Supporting Ericsson to expand its R&D centre in Ottawa
and working with Communitech to support entrepreneurial activity in
Kitchener‐Waterloo.

2013 Ontario Economic Outlook and Fiscal Review
Life Sciences
Key Fact: 2nd in life sciences in North America.
Key Initiatives: Fostering health care advancements and their commercialization
by establishing the Ontario Health Innovation Council with private and public
partners as well as funding research in genomics and personalized medicine in
partnership with the Ontario Genomics Institute.
Mining
Key Fact: Top 10 world producer of nickel and platinum metals.
Key Initiatives: Providing incentives and special deductions through the mining tax
system to encourage investment.
Entertainment and Creative Cluster
Key Fact: Largest in Canada and 3rd largest in North America.
Key Initiatives: Growing Ontario’s music production and distribution through the
new Ontario Music Fund and providing support to the film industry to ensure that
Ontario remains a top location for film production.
Return to Strengthening Ontario’s Sectors
Chart 1.6: Ontario’s 2013 Budget Plan to Eliminate the Deficit
Bar chart shows Ontario’s 2013 Budget Plan to eliminate the deficit. In the
2009 Ontario Economic Outlook and Fiscal Review, Ontario projected a
$24.7 billion deficit for 2009–10. The actual result for 2009–10 was a deficit of
$19.3 billion. The 2010 Budget projected deficits of $19.7 billion for 2010–11,
$17.3 billion for 2011–12, $15.9 billion for 2012–13 and $13.3 billion for 2013–14.
The actual result for 2010–11 was a deficit of $14.0 billion. The actual result for
2011–12 was a deficit of $13.0 billion. The actual result for 2012–13 was a deficit
of $9.2 billion.
For the medium‐term and extended outlook, the 2013 Budget projected a deficit
of $11.7 billion for 2013–14, a deficit of $10.1 billion for 2014–15, a deficit of
$7.2 billion for 2015–16, a deficit of $3.5 billion for 2016–17 and a surplus of
$0.5 billion for 2017–18.
Return to Chart 1.6

Chart Descriptions
Chart 1.7: Year-Over-Year Program Expense Changes
Bar chart shows that the annual growth rate in program expense was
12.0 per cent in 2009–10, 4.5 per cent in 2010–11, 0.9 per cent in 2011–12
and –0.4 per cent in 2012–13.
Return to Chart 1.7
Chart 1.8: Ontario Wage Settlements
Average wage settlements for the Ontario public sector were 0.3 per cent —
lower than the settlements for the private sector, which were 2.0 per cent, the
municipal sector, which were 2.0 per cent, and the federal public sector in
Ontario, which were 1.7 per cent.
Return to Chart 1.8
Chart 1.9: Ontario Public Service Staffing Levels
Bar chart shows that the number of Full Time Equivalent Staff (FTEs) was 68,645
in October 2008, the 2009 Budget Target for March 2012 (which was achieved),
was 65,245, and the 2011 Budget Target to be achieved by March 2014 is 63,745.
The chart notes that the 2009 Budget Target was a reduction of 3,400 FTEs and
that 2011 Budget Target was a further reduction of 1,500 FTEs.
Return to Chart 1.9
Chart 2.1: Ontario Real GDP since 2008–09 Recession
Line chart shows the level of Ontario real GDP between the first quarter of 2008
and the second quarter of 2013. Ontario real GDP reached its pre‐recession peak
of $601.6 billion in the second quarter of 2008 and declined to its recessionary
trough of $570.6 billion in the second quarter of 2009. As of the second quarter
of 2013, real GDP has risen to $621.4 billion.
Return to Chart 2.1

2013 Ontario Economic Outlook and Fiscal Review
Chart 2.2: Employment Gains Concentrated in Full-Time, Private-Sector, Above-Average Wage Jobs
Bar chart shows Ontario employment gains since June 2009. Total employment
increased by 476,000 since June 2009. Full‐time employment increased by
453,000, while part‐time employment increased by 23,000. Private‐sector
employment increased by 342,000, while public‐sector employment increased
by 71,000 and self‐employment rose by 63,000. Employment in above‐average
wage industries increased by 306,000, while employment in below‐average
industries increased by 169,000.
Return to Chart 2.2
Chart 2.3: Ontario Job Recovery Ahead of U.S. and OECD Average
Line chart compares the percentage change in employment relative to its
pre‐recession peak in Ontario, the average for the member countries of the
Organisation for Economic Co‐operation and Development (OECD) and the
United States between the first quarter of 2008 and the third quarter of 2013.
As of the third quarter of 2013, employment in Ontario has recovered to well
above its pre‐recession peak while the United States is below its pre‐recession
peak. As of the second quarter of 2013, the OECD is slightly higher than its pre‐
recession peak.
Return to Chart 2.3

Chart Descriptions
Chart 2.4: Global Economic Growth to Improve
Bar chart shows real GDP growth for the global economy, advanced economies
and emerging and developing economies from 2010 to 2014.
Real GDP growth for the global economy was 5.2 per cent in 2010, 3.9 per cent
in 2011 and 3.2 per cent in 2012. According to the International Monetary Fund
(IMF), growth is projected to be 2.9 per cent in 2013 and 3.6 per cent in 2014.
Real GDP growth for advanced economies was 3.0 per cent in 2010, 1.7 per cent
in 2011 and 1.5 per cent in 2012. According to the IMF, growth is projected to be
1.2 per cent in 2013 and 2.0 per cent in 2014.
Real GDP growth for emerging and developing economies was 7.5 per cent
in 2010, 6.2 per cent in 2011 and 4.9 per cent in 2012. According to the IMF,
growth is projected to be 4.5 per cent in 2013 and 5.1 per cent in 2014.
Return to Chart 2.4
Chart 2.5: Strengthening U.S. Recovery
Bar chart shows U.S. real GDP growth from 2009 to 2016. U.S. real GDP declined
2.8 per cent in 2009 and grew by 2.5 per cent in 2010, 1.8 per cent in 2011 and
2.8 per cent in 2012. According to Blue Chip Economic Indicators, U.S. real GDP
is projected to grow by 1.6 per cent in 2013, 2.6 per cent in 2014, 2.9 per cent
in 2015 and 2.8 per cent in 2016.
Return to Chart 2.5
Chart 2.6: Oil Prices to Remain High
Line chart shows the price of WTI crude oil from 2000 to 2016. The price of West
Texas Intermediate (WTI) crude oil rose from $30 US per barrel in 2000 to $94 US
per barrel in 2012. Oil prices are expected to average $99 US per barrel in 2013.
The Ontario Ministry of Finance projects oil prices will fall to $98 US per barrel in
2014 and then average $96 US per barrel in 2015 and 2016.
Return to Chart 2.6

2013 Ontario Economic Outlook and Fiscal Review
Chart 2.7: Canadian Dollar to Remain Close to Parity
Line chart showing the Canadian exchange rate from 1990 to 2016 and the low
and high private‐sector projections for 2013 to 2016. The Canadian dollar fell from
87 cents US in 1991 to a low of 64 cents US in 2002. It trended up over the 2003 to
2012 period and was 100 cents US in 2012. The Ministry of Finance projects the
Canadian dollar will remain just below parity through 2016, with private‐sector
projections ranging from a high of 103 cents US to a low of 93 cents US in 2016.
Return to Chart 2.7
Chart 2.8: Interest Rates to Rise Gradually
Line chart showing the 10‐year Government of Canada bond yield and the three‐
month Government of Canada treasury bill rate from 1990 to 2016. The 10‐year
Government of Canada bond yield has declined from over 10 per cent in 1990 to a
low of 1.9 per cent in 2012. It is expected to rise gradually to 3.8 per cent in 2016.
The three‐month treasury bill rate has declined from close to 13 per cent in 1990
to 0.9 per cent in 2012. It is expected to rise gradually to 2.8 per cent in 2016.
Return to Chart 2.8

Chart Descriptions
Chart 2.9: Household Spending, Business Investment and Trade Will Support Economic Growth
Bar chart shows the average annual real GDP growth and contributions to
real GDP growth over the 2000 to 2007 period and forecasts over the 2013
to 2016 period.
Ontario’s annual real GDP growth averaged 2.3 per cent for the 2000 to 2007
period and is projected to average 2.1 per cent for the 2013 to 2016 period.
Household spending contributed 2.0 percentage points to growth over the
2000 to 2007 period, but is expected to contribute 1.2 percentage points over
the 2013 to 2016 period.
Government contributed 0.8 percentage point to growth over the 2000 to 2007
period and is expected to subtract 0.1 percentage point from growth over the
2013 to 2016 period.
Residential investment contributed 0.2 percentage point to growth over the 2000
to 2007 period and is expected to make no contribution to growth over the 2013
to 2016 period.
Plant and equipment investment, which includes intellectual property and
inventories, contributed 0.4 percentage point to growth over the 2000 to 2007
period and is expected to also contribute 0.4 percentage point to growth over
the 2013 to 2016 period.
Net trade subtracted 1.1 percentage points from growth over the 2000 to 2007
period and is expected to contribute 0.4 percentage point from growth over
the 2013 to 2016 period.
Return to Chart 2.9

2013 Ontario Economic Outlook and Fiscal Review
Chart 2.10: Employment Expected to Rise Over the Medium Term
Bar chart shows the annual level of Ontario employment from 2009 to 2016.
Ontario employment rose from 6.5 million in 2009 to 6.8 million in 2012.
The Ontario Ministry of Finance projects employment will increase to 6.9 million
in 2013, 7.0 million in 2014, 7.1 million in 2015 and 7.2 million in 2016.
Return to Chart 2.10
Chart 2.11: Housing in Ontario to Remain Affordable
Line chart shows the mortgage carrying cost as a share of disposable income
per household in Ontario from 1981 to 2016. The line increased to a high of almost
37 per cent in 1990 and then declined to a low of 20 per cent in 1998. It has since
trended higher, reaching 26 per cent in 2012. The Ontario Ministry of Finance
projects the share to remain close to 27 per cent over the 2013 to 2016 period.
Return to Chart 2.11
Chart 2.12: Canadian Household Debt Remains Elevated
Line chart shows household debt as a percentage of household disposable income
in Canada and the United States from the first quarter of 2000 to the second
quarter of 2013.
The line for Canada increased steadily from 100 per cent in the first quarter of
2000 to 152 per cent in the second quarter of 2013. The line for the United States
increased from 113 per cent in the first quarter of 2000 to 165 per cent in the
fourth quarter of 2007. It has since declined to 137 per cent in the second quarter
of 2013. Canada’s percentage was below the United States before the second
quarter of 2011, but since then the Canadian percentage has remained above
that of the United States.
Note: For comparability, the data for Canada include both households and
non‐profit institutions serving households, and the definition of disposable income
has been adjusted by including non‐profit institutions serving households and
other transfers and payments.
Return to Chart 2.12
Chart Descriptions
Chart 2.13: Household Net Worth Improving
Line chart shows household net worth as a ratio to disposable income in Canada
and the United States from the first quarter of 2000 to the second quarter of
2013. The line for Canada fell from 6.4 in the second quarter of 2007 to 5.5 in
the first quarter of 2009, while the line for the United States fell from 6.6 in the
first quarter of 2007 to 5.1 in the first quarter of 2009. Since then, the ratio of
household net worth to disposable income has risen for both counties, with
Canada at 6.4 and the United States at 6.0 in the second quarter of 2013.
Note: For comparability, the data for Canada include both households and
non‐profit institutions serving households, and the definition of disposable income
has been adjusted by including non‐profit institutions serving households and
other transfers and payments.
Return to Chart 2.13
Chart 2.14: Ontario Business Machinery and Equipment Investment Lags the United States
The line chart shows business machinery and equipment investment, which
includes intellectual property, indexed to 2008=100 for Ontario and the United
States from 2008 to 2014. The indexes for machinery and equipment fell in 2009
to 80.9 for Ontario and 85.7 for the United States. Since then, the indexes have
both risen, reaching 100.6 for Ontario and 108.4 for the United States in 2012.
According to Blue Chip Economic Indicators, the U.S. machinery and equipment
investment will be 18.5 per cent above the 2008 level in 2014, while the Ontario
Ministry of Finance projects Ontario’s machinery and equipment investment
levels will be 6.3 per cent above 2008 levels in 2014.
Return to Chart 2.14
Chart 2.15: Exports Expected to Increase
The bar chart shows the annual level of Ontario exports in 2007 dollars from
2007 to 2016. Exports fell from $336 billion in 2007 to a low of $277 billion in
2009. Exports steadily increased to $334 billion in 2012. The Ontario Ministry
of Finance projects exports will increase to $379 billion by 2016.
Return to Chart 2.15

2013 Ontario Economic Outlook and Fiscal Review
Chart 2.16: Weaker Private-Sector Outlook for Growth in 2013 and 2014
The bar chart shows the average private‐sector projection for Ontario’s real GDP
growth at the time of the 2013 Budget and 2013 Ontario Economic Outlook and
Fiscal Review (the current view).
The average private‐sector forecast for Ontario real GDP growth for 2013 was
1.6 per cent in the 2013 Budget and 1.4 per cent currently.
The average private‐sector forecast for Ontario real GDP growth for 2014 was
2.4 per cent in the 2013 Budget and 2.2 per cent currently.
The average private‐sector forecast for Ontario real GDP growth for 2015 and
2016 was 2.5 per cent in the 2013 Budget and 2.6 per cent currently.
Return to Chart 2.16
Chart 3.1: Composition of Revenue, 2013–14
This chart shows the share of total revenues in 2013–14 and dollar amounts
by major revenue category. The largest taxation revenue source is personal
income tax revenue at $26.9 billion, accounting for 23.0 per cent of total revenue.
This is followed by Sales Tax at 21.6 billion, or 18.5 per cent of total revenue, and
Corporations Tax at $12.0 billion, or 10.3 per cent of total revenue. Tax revenues
in total account for $81.7 billion, or 69.9 per cent of total revenues. The other
major non‐taxation sources of revenue are Federal Transfers at $22.5 billion,
or 19.2 per cent of total revenue, Income from Government Business Enterprises
at $4.5 billion, or 3.8 per cent of total revenue, and various Other Non‐Tax
Revenues at $8.2 billion, or 7.0 per cent of total revenue.
Return to Chart 3.1

Chart Descriptions
Chart 3.2: Composition of Total Expense, 2013–14
This chart shows the share of total expense in 2013–14 and dollar amounts by
sector. The largest expense is the Health Sector at $48.9 billion, accounting for
38.3 per cent of total expense. The remaining sectors of total expense include the
Education Sector at $24.1 billion or 18.9 per cent; the Postsecondary and Training
Sector at $7.7 billion or 6.1 per cent; the Children’s and Social Services Sector at
$14.3 billion or 11.2 per cent; the Justice Sector at $4.1 billion or 3.2 per cent;
and Other Programs at $17.8 billion or 14.0 per cent. Interest on Debt, included
as part of Total Expense, is $10.6 billion or 8.3 per cent.
Note: The Education Sector excludes Teachers’ Pension Plan. Teachers’ Pension
Plan expense is included in Other Programs.
Return to Chart 3.2
Chart 3.3: Composition of Program Expense, 2013–14
This chart shows the share of program expense in 2013–14 and dollar amounts
by sector. Program expense equals total expense minus interest on debt.
The largest expense is the Health Sector at $48.9 billion, accounting for
41.8 per cent of total expense.
The remaining sectors of program expense include the Education Sector at
$24.1 billion or 20.6 per cent; the Postsecondary and Training Sector at $7.7 billion
or 6.6 per cent; the Children’s and Social Services Sector at $14.3 billion or
12.3 per cent; the Justice Sector at $4.1 billion or 3.5 per cent; and Other
Programs at $17.8 billion or 15.2 per cent.
Note: The Education Sector excludes Teachers’ Pension Plan. Teachers’ Pension
Plan expense is included in Other Programs.
Return to Chart 3.3

2013 Ontario Economic Outlook and Fiscal Review
Chart 4.1: In 2013–14, Ontario’s Fiscal Capacity Is Fifth But Federal Transfers Bring Ontario to Last
This chart presents provinces ranked by per‐capita fiscal capacity — before
and after federal transfers — for 2013–14. Before transfers from the federal
government, Ontario’s per‐capita fiscal capacity ranks fifth compared to other
provinces based on own‐source revenues in 2013–14. After transfers from the
federal government are included, Ontario’s per‐capita fiscal capacity drops to last.
Both before and after federal transfers, the top three provinces in terms of
per‐capita fiscal capacity are Alberta, Newfoundland and Labrador, and
Saskatchewan. British Columbia falls from fourth to fifth after federal transfers.
Quebec falls from sixth to seventh after federal transfers. Manitoba falls from
seventh to ninth after federal transfers. Nova Scotia moves from eighth to fourth
after federal transfers. New Brunswick moves from ninth to sixth after federal
transfers. PEI moves from tenth to eighth after federal transfers.
Return to Chart 4.1
Chart 4.2: Net Contribution to Equalization by Province, 2013–14
In 2013–14, Ontario is the largest net contributor to the Equalization program.
Ontario is followed by Alberta, British Columbia, Saskatchewan, and
Newfoundland and Labrador. The other provinces — Prince Edward Island,
Nova Scotia, New Brunswick, Manitoba and Quebec — receive more in
Equalization payments than their taxpayers contribute through federal taxes.
Among Equalization‐receiving provinces, Ontario is the only province where
its taxpayers contribute more than what the Province receives in
Equalization payments.
Return to Chart 4.2

Chart Descriptions
Chart 5.1: Retirement Income Targets and Potential Gaps
Currently, Old Age Security (OAS), the Guaranteed Income Supplement (GIS) and
the Canada Pension Plan (CPP) provide full income replacement for lower‐income
earners (e.g., annual pre‐retirement income of $20,000), based on a retirement
income target of 70 per cent of pre‐retirement income. Those with annual
pre‐retirement income of $40,000 and $75,000 are unable to achieve their income
replacement targets through OAS and CPP alone and face a potential gap in
retirement income that must be filled by other savings such as workplace pension
plans, RRSPs and home equity.
Return to Chart 5.1
Chart 6.1: Education Property Taxes as a Per Cent of Elementary and Secondary Education Expenditures
Bar chart shows that the share of education funding that is supported by
education property taxes has decreased from 44 per cent in 1998–99 to
28 per cent in 2012–13.
Return to Chart 6.1
Chart 7.1: 2013–14 Borrowing
As at October 23, 2013, the Province’s 2013–14 borrowing program totalled
$21.9 billion, and consisted of $15.6 billion of domestic syndicated bonds,
$1.4 billion of domestic floating rate notes, $0.02 billion of domestic medium‐term
notes, $0.4 billion of Ontario Savings Bonds and $4.4 billion of U.S. dollar
global bonds.
Return to Chart 7.1
Chart 7.2: Residual Stranded Debt since April 1, 1999
As at March 31, 2013, as determined by the Minister of Finance, the residual
stranded debt was $3.9 billion, a decrease of $0.6 billion compared to residual
stranded debt of $4.5 billion as at March 31, 2012. This is also a total estimated
decrease of $8.0 billion from an estimated peak of residual stranded debt of
$11.9 billion as at March 31, 2004.
Return to Chart 7.2
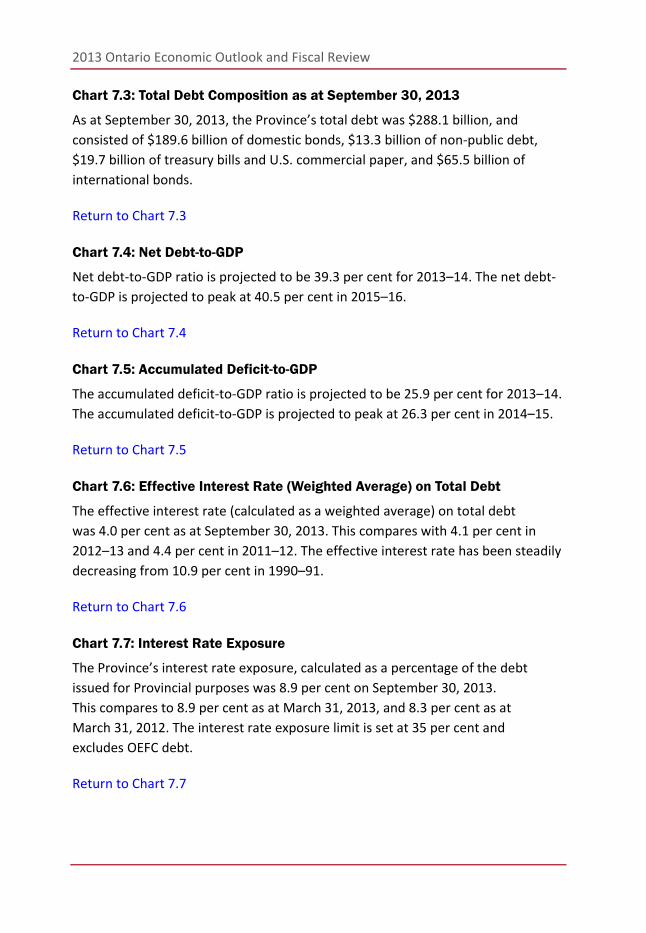
2013 Ontario Economic Outlook and Fiscal Review
Chart 7.3: Total Debt Composition as at September 30, 2013
As at September 30, 2013, the Province’s total debt was $288.1 billion, and
consisted of $189.6 billion of domestic bonds, $13.3 billion of non‐public debt,
$19.7 billion of treasury bills and U.S. commercial paper, and $65.5 billion of
international bonds.
Return to Chart 7.3
Chart 7.4: Net Debt-to-GDP
Net debt‐to‐GDP ratio is projected to be 39.3 per cent for 2013–14. The net debt‐
to‐GDP is projected to peak at 40.5 per cent in 2015–16.
Return to Chart 7.4
Chart 7.5: Accumulated Deficit-to-GDP
The accumulated deficit‐to‐GDP ratio is projected to be 25.9 per cent for 2013–14.
The accumulated deficit‐to‐GDP is projected to peak at 26.3 per cent in 2014–15.
Return to Chart 7.5
Chart 7.6: Effective Interest Rate (Weighted Average) on Total Debt
The effective interest rate (calculated as a weighted average) on total debt
was 4.0 per cent as at September 30, 2013. This compares with 4.1 per cent in
2012–13 and 4.4 per cent in 2011–12. The effective interest rate has been steadily
decreasing from 10.9 per cent in 1990–91.
Return to Chart 7.6
Chart 7.7: Interest Rate Exposure
The Province’s interest rate exposure, calculated as a percentage of the debt
issued for Provincial purposes was 8.9 per cent on September 30, 2013.
This compares to 8.9 per cent as at March 31, 2013, and 8.3 per cent as at
March 31, 2012. The interest rate exposure limit is set at 35 per cent and
excludes OEFC debt.
Return to Chart 7.7

Chart Descriptions
Chart 7.8: Foreign Exchange Exposure
The Province’s foreign exchange exposure, calculated as a percentage of the
debt issued for Provincial purposes, was 0.4 per cent as at September 30, 2013.
This compares to 0.8 per cent as at March 31, 2013, and 1.0 per cent as at
March 31, 2012. The foreign exchange exposure limit is set at 5 per cent and
excludes OEFC debt.
Return to Chart 7.8

© QUEEN ’S PRINTER FOR ONTARIO, 2013
ISSN 1483-5967 (PRINT ) | ISSN 1496-2829 (PDF/HTML)
The Honourable C h a r l e s s o u s a