android application for aalborg university
TRANSCRIPT

....

Antonio Arfe, Pierre Deguy, Lou Guillot, Thibaut Le Guilly andRegis Louge
Android Application for Aalborg
University
SSE3 ProjectSept 2010 - Dec 2010
To be evaluated on January 17th 2011
Department of Computer ScienceAalborg UniversitySelma Lagerlofs Vej 300DK–9220 Aalborg ØDENMARK
Faculty of Engineering and ScienceAalborg University
Department of Computer Science
TITLE:
Android Application for AalborgUniversity
PROJECT PERIOD:SSE3,Sept 1st 2010 -Dec 20th 2010
PROJECT GROUP:d522a
GROUP MEMBERS:Antonio Arfe, Pierre Deguy,Lou Guillot, Thibaut Le Guilly,Regis Louge
SUPERVISORS:Mads Christian Olesen, Arne Skou
CENSOR:Rene R. Hansen
NUMBER OF COPIES: 8
REPORT PAGES: 84
APPENDIX PAGES: 7
TOTAL PAGES: 92
SYNOPSIS:
Nowadays, all universities provide theirown dedicated intranet systems. However,only few of them provide students andteachers features like internal communica-tion system, context aware information inthe campus and perhaps, all of this acces-sible from a smartphone.We propose an Android OS applicationdedicated to the students of Aalborg Uni-versity, capable to achieve two main func-tionalities accessible from a smartphone: aChat System and an Indoor GeolocationSystem.The Chat is based on a Peer-To-Peer ar-chitecture, no server either administratorsintervention is needed. Building a ZeroConfiguration network, the system uses theXMPP protocol combined with JmDNS inorder to allow students to multicast theirpresence over the network and see otherconnected users in order to discuss withthem.The Indoor Geolocation System uses theaccess points’ RSS of the already exist-ing WiFi infrastructure; no administra-tor’s intervention neither particular hard-ware is needed. We apply a Finger-printing methodology. It creates on eachsmartphone, with a user-based training, adatabase of fingerprints containing sniffedRSS, BSSID and location-name. An algo-rithm is later applied to estimate the user’slocation against the database.The results of different experiments andseveral prototypes’ implementation arealso presented. We detail the difficultiesthat have been encountered and the pos-sible solutions using concepts such as elec-tion algorithms, the final results and futureimprovements.
2

Contents
1 Introduction 51.1 Summary . . . . . . . . . . . . . . . . . . . . . . . . . . . . . . . . . . . . . . . . 7
2 Requirements 82.1 User’s requirements . . . . . . . . . . . . . . . . . . . . . . . . . . . . . . . . . . . 82.2 System’s requirements . . . . . . . . . . . . . . . . . . . . . . . . . . . . . . . . . 8
3 Prerequisites 133.1 Indoor Geolocation and Smartphones . . . . . . . . . . . . . . . . . . . . . . . . . 13
3.1.1 Geolocation: the broad picture . . . . . . . . . . . . . . . . . . . . . . . . 133.1.2 Geolocation in Android based smartphones . . . . . . . . . . . . . . . . . 20
3.2 Chat Systems Technologies . . . . . . . . . . . . . . . . . . . . . . . . . . . . . . 213.2.1 Existing Chat Systems . . . . . . . . . . . . . . . . . . . . . . . . . . . . . 213.2.2 Overview of the Architectures . . . . . . . . . . . . . . . . . . . . . . . . . 223.2.3 Peer-To-Peer system middlewares . . . . . . . . . . . . . . . . . . . . . . . 263.2.4 Pure Peer-To-Peer XMPP Middleware: Smack API and the XMPP ex-
tensions . . . . . . . . . . . . . . . . . . . . . . . . . . . . . . . . . . . . . 283.2.5 XMPP security considerations . . . . . . . . . . . . . . . . . . . . . . . . 33
4 Experiments 344.1 Wireless Received Signal Strength fluctuations . . . . . . . . . . . . . . . . . . . 34
4.1.1 Merging the Probabilistic Analysis with the Distribution graphs information 434.1.2 Comparison with the Redpin Experiment . . . . . . . . . . . . . . . . . . 44
4.2 The basic sniffer application on Android . . . . . . . . . . . . . . . . . . . . . . . 46
5 Design 485.1 Indoor Geo-positioning on a smartphone: Feasible approach . . . . . . . . . . . . 48
5.1.1 Feasible Technologies . . . . . . . . . . . . . . . . . . . . . . . . . . . . . . 485.1.2 Feasible Methodologies . . . . . . . . . . . . . . . . . . . . . . . . . . . . . 485.1.3 The Design of the Fingerprinting system . . . . . . . . . . . . . . . . . . . 51
5.2 Chat Design . . . . . . . . . . . . . . . . . . . . . . . . . . . . . . . . . . . . . . . 565.2.1 Feasible Chat middlewares . . . . . . . . . . . . . . . . . . . . . . . . . . 565.2.2 Feasible technologies to set up P2P networks . . . . . . . . . . . . . . . . 575.2.3 Setting up the P2P chat system using XMPP and JmDNS . . . . . . . . . 57
6 Implementation 606.1 Geolocation Prototype . . . . . . . . . . . . . . . . . . . . . . . . . . . . . . . . . 60
6.1.1 Introduction . . . . . . . . . . . . . . . . . . . . . . . . . . . . . . . . . . 606.1.2 Application Class Description . . . . . . . . . . . . . . . . . . . . . . . . . 61
3
6.1.3 Positioning Algorithm . . . . . . . . . . . . . . . . . . . . . . . . . . . . . 646.2 Peer-to-Peer Chat Prototype . . . . . . . . . . . . . . . . . . . . . . . . . . . . . 65
6.2.1 Introduction . . . . . . . . . . . . . . . . . . . . . . . . . . . . . . . . . . 656.2.2 First Prototype: Multicast Issues on Android Phones and the University
network . . . . . . . . . . . . . . . . . . . . . . . . . . . . . . . . . . . . . 656.2.3 Second Prototype: Using the Link Local Smack API . . . . . . . . . . . . 736.2.4 Third Prototype: JmDNS Presence . . . . . . . . . . . . . . . . . . . . . . 76
7 Conclusions 787.1 The Geolocation System . . . . . . . . . . . . . . . . . . . . . . . . . . . . . . . . 78
7.1.1 The accuracy . . . . . . . . . . . . . . . . . . . . . . . . . . . . . . . . . . 797.2 The Communication System . . . . . . . . . . . . . . . . . . . . . . . . . . . . . . 807.3 Future Work . . . . . . . . . . . . . . . . . . . . . . . . . . . . . . . . . . . . . . 81
7.3.1 Geolocation . . . . . . . . . . . . . . . . . . . . . . . . . . . . . . . . . . . 817.3.2 Chat . . . . . . . . . . . . . . . . . . . . . . . . . . . . . . . . . . . . . . . 817.3.3 Merge the Geolocation and Communication systems . . . . . . . . . . . . 81
References . . . . . . . . . . . . . . . . . . . . . . . . . . . . . . . . . . . . . . . . . . . 84Appendix . . . . . . . . . . . . . . . . . . . . . . . . . . . . . . . . . . . . . . . . . . . 85
Long time experiment graphs over AP2 and AP3 . . . . . . . . . . . . . . . . . . 85Long and Short experiment, mass distribution of the data . . . . . . . . . . . . . 85Geolocation Testing and Accuracy . . . . . . . . . . . . . . . . . . . . . . . . . . 85CD-Rom . . . . . . . . . . . . . . . . . . . . . . . . . . . . . . . . . . . . . . . . . 91
4

Chapter 1
Introduction
People, and especially the new generation, spend more and more time using new technologies:computers, mobile phones, MP3 players and similar devices are essential for anyone. In ad-dition to this, now more than ever, these devices are constantly connected among each other,often using the Internet as a common medium, eventually creating a large, highly mobile andubiquitous network.
Looking at this from a student’s point of view, without access to the Internet, he could notaccess his courses’ schedule, register to courses, receive or send e-mails and be quickly aware ofthe latest news concerning exam dates, meeting times or simple Friday bar meeting. In additionto that, if we think about new students just arrived at the university (number which could havean order of hundreds of people in Aalborg University), they are also in strong need of guidancethrough all the services which are offered. These can be printers or wireless networks, libraryaccess or secretary opening hours. Moreover, a lot of new students could be wondering: “Wheream I in the campus right now? And where is the main Auditorium?”.
Hence, for this purpose, the Internet is even more effective when provided on a phone, sincea student will usually be in need of these information when he is around the campus, in hisdepartment, or just going from his room to the library, wondering if the latter would still beopen. The type of access to the Internet, through a mobile, makes the communication and theretrieving of information “real-time”.
Moreover, nowadays a smartphone is inevitable in a student’s pocket, and in order to realizeour SSE3 project, we decided to develop an application that might be useful for the students ofAalborg University (AAU). The main idea we had in mind concerned the possibility for a studentto fetch information on his mobile using the university website (or specifically the department’swebsite). Then we thought that it could be practical for teachers to directly communicatewith students, maybe with a chat system, and last, for students to know where they are in thecampus, allowing possibility to receive context-aware information. Eventually, our applicationfocuses on two features that demonstrated to be the most challenging, summarized below:
• Communication among students and teachers in the campus area.
• Geolocation of a student in the campus.
The application will be helpful for the students as well as the teachers. It will make commu-nications easier and more straightforward. For a teacher it could be possible to cancel a courseshortly before its beginning, or just to change the room without having to go around looking forthe students who did not know about the last-minute changes. With the Geolocation feature,new students will be able to get quickly use to the new campus, classrooms, buildings and otherfacilities.
5

Figure 1.1: Market Share of Android Phones and iPhone from January 2010 to August 2010
Having well defined the main purposes, we immediately went through an important choice:to make this application as useful as possible and to reach a large amount of people, we hadto choose between the two most popular mobile operating systems: Android OS and iPhone OS.
As students interested in new technologies, we have observed the growing of Android overiPhone all around the world and especially in Aalborg University. To confirm this observation,the Nielsen company [19] published a survey on acquired smartphones from January to August2010. We see in Figure 1.1 that Android has climbed and is now the most popular operatingsystem. These two kind of smartphones combine cell phone, email, internet, camera, GPS andother features. Apple phones provide an intuitive interface on a large and clear screen, andits security is reinforced by the fact that Apple must approve all applications distributed onthe Apple Application Store. On the other hand, Android is an open platform, thus, manufac-turers have the choice of which hardware to use and developers do not need a license to program.
By combining all these points, we thought that for our university it would be better toprovide an open application, not specifically bounded to any vendor, either of software orhardware. That meant targeting the Android OS. Moreover, if the trend of Figure 1.1 will beconfirmed in the following months, the number of sold smartphones equipped with Android OScould rapidly increase, giving the possibility to our application to reach a longer life-cycle andmore possibilities of testing/improvements. This choice will also give us the ability to try theapplication on different mobiles, since the Android OS is available for several devices, thingwhich is not possible when using the Apple iOS only available on iPhone and iPad.Our attempt is then to provide AAU with an Android application that responds to the students’needs in terms of communication and context-aware information through the possibility ofknowing where they are.
6

1.1 Summary
As the application is formed by two different parts, namely, the communication among studentsand the location service, the report will usually provide two different sections in each Chapter.The first one regarding the location and the other one regarding the communication system.This would hopefully bring clarity to the whole report, avoiding to mix requirements, prereq-uisites, design choices and implementation descriptions which are related to two completelydifferent topics. The remainder of this report is structured as follows:
Chapter 2 shows the requirements of our project, both in terms of user requirements andin term of system requirements. In Chapter 3 we describe the prerequisites for the two mainparts of our application. Concerning the location, Section 3.1 gives an overview of differentGeolocation techniques, to later go through the existing technologies and the methodologiesbuilt upon them. We finish the section by providing information about how to use Geolocationtechnologies on Android based phones. The other section 3.2, concerning the CommunicationSystem, which we implement in the form of a chat, starts describing three of the most famouschat systems available nowadays, chosen for their different architectural designs. Later on in thesection, we formalize advantages and disadvantages of the two main architectural design possi-bilities: the Client-Server and the Peer-to-Peer (P2P). Then we focus on giving an insight onsome middlewares which provide P2P communications. We conclude this section by introducingpure P2P XMPP middleware and some security considerations about the XMPP protocol.
The following Chapter 4, reports the experiments we have made to strengthen our under-standing of the Geolocation topic. Section 4.1 provides the result of an experiment concerningthe power fluctuations of wireless signals in an indoor environment. Section 4.2 explains ourattempt to build a basic sniffer application using the Android OS, to test the ease of use of theGeolocation technologies provided by the Google OS.
The next Chapter 5 provides key aspects of our design. For the Geolocation, Section 5.1,based on the knowledge acquired in the prerequisites, gives the reasons why we chose the wire-less technology and the Fingerprinting methodology. Moreover, the high level design of thesystem and its components’ interactions are shown as well. Section 5.2, shows the Design of theChat system. We discuss the opportunities given by XMPP and the reasons why we preferredit. Then we present the technologies available to set up a network with minimal efforts, inparticular, a P2P network. At the end, we give an overview of the steps needed to create a chatconnection using XMPP and JmDNS.
Chapter 6 contains information about Geolocation and the Chat prototypes. We will seefirst how the Geolocation one (Section 6.1) has been implemented, taking a look at its structure,and at the positioning algorithm (Section 5.1.3.4) that was used. Then we will go through theimplementation of the different P2P chat prototypes in Section 6.2. The first one will revealus multicast issues on some of the Android phones and on the University wireless network.The second one will test the functionalities of the Link Local Smack API. We will see for thisprototype a deeper description of its structure, and the JmDNS issue that was revealed by it.The third prototype has been implemented to find out if the previously mentioned issue wascoming from the JmDNS library or from the Smack API.
Finally Chapter 7 discusses the conclusions and possible future work to improve the ap-plication for both the Geolocation and the Chat system. For the Geolocation the testing andaccuracy results are also provided.
7
Chapter 2
Requirements
This project’s goal is to create an optimal and reliable solution for an Android Application forthe university. Overall, this application will integrate several functionalities. In this part user’sand system’s minimal requirements are presented.
2.1 User’s requirements
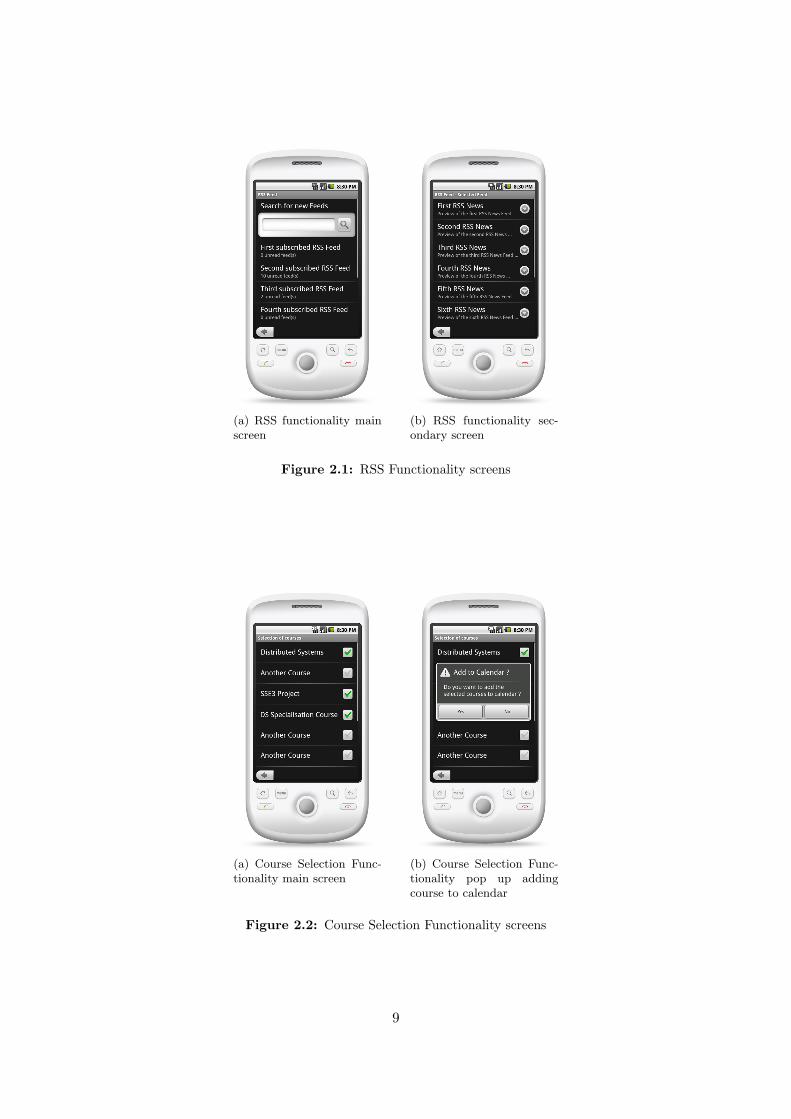
Several requirements could be coming from the choice of creating a Communication/Geolocationsystem. We go through them to later pick the most interesting and challenging ones. The firstfunctionality of the application is the RSS, shown in Figure 2.1 which is meant to show newsfrom the departments’ RSS feed and it allows the user to subscribe to them. The second one isthe course functionality shown in Figure 2.2, where the user is able to subscribe to courses inorder to have links and information about them. It is directly linked to the third function whichis the schedule. Indeed, for all the selected courses, their schedule appears directly linked to theinformation about the different lectures. Then the last basic functionality shown in Figure 2.3is a simple Frequently Asked Questions that allows the user to have answers and to add newquestions. Moreover, context-aware information, like knowing if the room we are standing infront is used by a teacher, could also be available.
Having all that figured out, we wanted to focus on the two following functionalities: the realtime indoor positioning and the communication system; this because several other requirementscould be built on the top of these. The first one shown in Figure 2.4(a) will allow the user,at all time, to know his position inside the buildings. The idea is to create an indoor mobileGeolocation system for the Computer Science Department at first and for the whole universityin a second time. On the top of it, we could add functionalities such as guidance system orcontext-aware information.
The chat system functionality shown in Figure 2.5 will be an indoor chat system which willallow students to communicate together. There will also be chat rooms where people are ableto discuss about specific topics. This may also allow the teacher to make announcements, lastminute modifications, etc. Incoming events will be announced to the users using notifications,as shown in Figure 2.4(b), so that it will not be necessary to use the application at all time toreceive them.
2.2 System’s requirements
In order to satisfy user’s requirements, the system must be composed by a mobile phone usingthe Android operating system. The application can be downloaded for free. This system is ini-
8
(a) RSS functionality mainscreen
(b) RSS functionality sec-ondary screen
Figure 2.1: RSS Functionality screens
(a) Course Selection Func-tionality main screen
(b) Course Selection Func-tionality pop up addingcourse to calendar
Figure 2.2: Course Selection Functionality screens
9

(a) FAQ functionality mainscreen
(b) FAQ functionality sec-ondary screen
Figure 2.3: FAQ Functionality screens
(a) Positioning Functional-ity screens
(b) Notifications Function-ality screens
Figure 2.4: Positioning and Notifications Functionalities
10
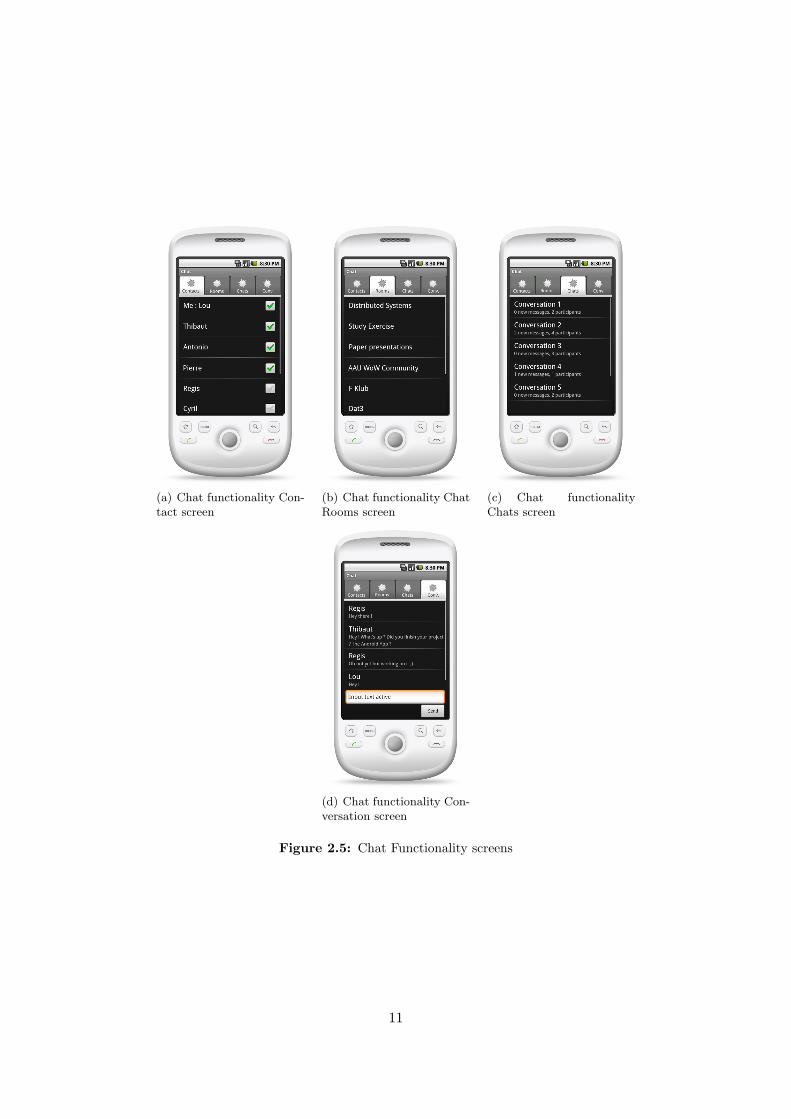
(a) Chat functionality Con-tact screen
(b) Chat functionality ChatRooms screen
(c) Chat functionalityChats screen
(d) Chat functionality Con-versation screen
Figure 2.5: Chat Functionality screens
11

tially developed only for the Cassiopea building, then it will evolve to cover the entire University.
The chat system is a service:
• created for both personal and professional use. Indeed teachers and students can exploitit to exchange information on courses, general topics, etc. This is why the technologyneeds to be strong and rely on several users in order to avoid a single point of failure.
• that should not use any server to be instantiated. This allows the system to obtain theequality of the peers, avoiding set up mechanisms to decide who is a server and who is anormal user.
• which needs to provide alerts about the incoming messages. Indeed the problematic isthat the user should be able to know that messages have arrived when he is not using theapplication.
• which would also provide presence status in order for the user to be aware of who is usingthe application.
Indoor positioning system has to be implemented:
• using an existing infrastructure and only technologies available on modern smartphones,such as GSM, GPS, WiFi or Bluetooth. This avoids to spend money and time on thedeployment of new infrastructures and research time focusing on specific techniques andmethodologies for indoor positioning.
• having a mean distance error of less than 10 meters in order to achieve a room accuracy.
• having a minimal intervention from administrators to set up the application. Thus, thesystem can be autonomous.
• in a way that when few information sources are available, it is still possible to estimatethe user’s location.
The technical explanations concerning all these modules are provided further. Eventually,the indoor Geolocation and the Chat systems are the kernel of our application in terms ofresearch, time and difficulties.
12

Chapter 3
Prerequisites
The section will be structured in two main parts describing the different methodologies andpossibilities we have to realize the modules of:
• Indoor Geolocation and Smartphones
• P2P Chat
3.1 Indoor Geolocation and Smartphones
This section briefly introduces the concept of Geolocation and provides an overview of thetoday’s technologies and different methodologies built upon them. After presenting the generalconcepts and background, it will narrow down its focus to the indoor Geolocation, giving moreinformation on the techniques feasible for its requirements. In the end, the possibilities that theAndroid platform provides concerning the use of the technologies required for the Geolocationare shown.
3.1.1 Geolocation: the broad picture
Geolocation[42] is the practice of retrieving the geographical position of a device. Nowadaysit has become a recurrent and requested feature to accomplish a variety of different tasks andto provide a wide range of services. Just to mention some of the services already available orin current development: Turn by Turn navigation, context-aware information supply, location-based games and social networking. To achieve Geolocation of a device, we cannot set thecontext in which we are trying to realize it apart; that is because different contexts will havedifferent requirements concerning accuracy, energy consumption, reliability and several otherdemands. Figure 3.1 gives an overview of the different contexts and accuracy requirements inwhich Geolocation can be applied; the figure will be further discussed as soon as the differenttechnologies are presented.
Thus, given a specific context, different methodologies and technologies might be helpfulto reach the goal of locating a device, some of them are interchangeable and others are onlysuitable for a specific need (e.g. the GPS technology in its basic form, even though it is one ofthe most accurate and reliable methods, cannot be used in an indoor environment).
3.1.1.1 Overview of the Geolocation Technologies and Methodologies
One important point to clarify before going on is that, concerning Geolocation, technologiesand methodologies are two different concepts, even though they seem strictly correlated and
13

sometimes overlap each other. Technologies concern all the hardware, transmission systems,receivers, protocols and infrastructures used to gather the information needed for the location,e.g. the strength of a received signal or the identifiers of some transmitting towers. Themethodologies instead, are usually seen as built upon the technologies; they compute the finalposition of the device using different algorithms and measurement techniques1.
This section will follow a two-step structure, briefly presenting:
1. Geolocation Technologies, Section 3.1.1.2.
2. Geolocation Methodologies (measuring principles and positioning algorithms), Section3.1.1.3.
Even though the overview is quite wide, the point of this section is not to go deep inoverwhelming details on all the methodologies and technologies; it is only meant to show theproduct of our research in finding the best suitable combination of technology and methodologyfor our final purpose: the indoor location of a smartphone device. Further references and linksto all the information presented in the following paragraphs can be found in [32].
3.1.1.2 Geolocation Technologies
Geolocation technologies can be categorized in several ways, taking into account features suchas cost, coverage scale, hardware complexity and many others characteristics.
As suggested in the indoor positioning techniques overview provided by Liu et al. [32], theGeolocation technologies can be summarized in 5 main groups, further explained in the followingparagraphs. Others solutions are also available, such as the mix of different basic technologiesand sensors or the positioning “Cordless Phone System” (CPS), but we do not include them inour survey as they might be seen as extensions of the basic technologies.
• UWB, proprietary microwave solutions.
• RF and IR, RF and Ultrasonic hybrid methods.
• WLAN, Bluetooth, Zigbee, HomeRFPositioning.
• GPS, DGPS, Wireless assisted GPS.
• GSM, CDMA /3G mobile cellular network.
The corresponding positions on the scale/accuracy graph can be seen in Figure 3.1. Thevertical axis shows the scale of applicability, from indoor to broad and open space scenarioswhile the horizontal axis shows the resolution which might be achieved, from an order of 10centimeters to some kilometers.
UWB (Ultra WideBand) and proprietary microwave solutions The UWB technology(see Figure 3.2(a)) uses dedicated hardware capable of transmitting very short-pulsed frequencysignals (from 3.1 to 10.6 GHz). Using such a short cycle of frequencies, it overcomes the problemof interferences with other radio systems and the presence of walls and objects. It can achievea very high accuracy (20 cm) and the energy consumption is kept low by the use of these highfrequencies.
1In this paper we will often use the term Geolocation methodologies or positioning algorithms/measurementtechniques with a similar meaning.
14

+
Figure 3.1: The five Geoposition families and the place they cover on the scale/resolution graph [32]
Radio Frequency Identification: RF and IR, RF and Ultrasonic hybrid methodsThe Radio Frequency technologies (see Figure 3.2(b)) use two main components: RFID readers(fixed) and RFID tags (movable, active or passive). For example, a reader can be placed on adoor, and a tag applied on the device (or the person) which needs to be positioned. The rangeand the consumption depend on the use of the active or passive tags; the range usually variesbetween 1-2 meters to tens of meters, while the energy consumption may considerably vary.
WLAN (Wireless Lan) and WPAN (Wireless Personal Area Network) The Wire-less Lan IEEE 802.15 (see Figure 3.3(a)) is the dominant local wireless networking standard,while other minor technologies using a different range of frequencies, fall in the WPAN cate-gory (Wireless Personal Area Network, IEEE 802.15.4-2006 or ISO/IEC 18000-7). The maindifference is the distance range and the data rate: WLAN usually goes between 50-100 meterswith a high data throughput, while the WPAN has a range of 10 meters at most, and data ratearound 250 Kbit. It is worth mentioning the most used WPAN technologies on the market:
• Bluetooth, IrDA, UWB, Z-Wave.
• DASH7 (ISO/IEC 18000-7).
• ZigBee.
• 6LoWPAN.
GPS (Global Position System) and its variance: Wireless Assisted-GPS GPS (seeFigure 3.3(b)) is the most successful system for outdoor environment Geolocation. It uses 27satellites in orbit around the Earth and as soon as four of them are visible by the mobile receiverthe position can be calculated. It needs a GPS receiver installed. The accuracy varies from 2to 100 meters. The original version of the GPS is bounded to the possibility of the receiver
15

(a) UWB technologies and its scale/resolution (b) RF technologies and their scale/resolution
Figure 3.2: Geolocation technologies and the range of applicability
to have a direct line of sight (LOS) with 4 satellites. Indeed, a variance has been created forindoor positioning: the Wireless Assisted-GPS [20] and SuperSense2. These improved versionsof the GPS aim to locate the mobile device even in a city-like scenario, where no line of sightis available. When the power of the received GPS signal is too low they will lean on a network(it might be wireless internet network) to obtain information about the position of the device.
GSM, CDMA/3G mobile cellular network It is the network commonly used for mobiletelephonic communications (see Figure 3.3(c)). The strength of the signal received by the mobilecan be measured and used to calculate the distance from the transmitting antenna (often morethan one) and hence the position of the mobile. The position is calculated using differentalgorithms, such as: Enhanced Observed Time Difference (EOTD), Time Of Arrival (TOA),Angle of Arrival (AOA) and CELL ID (the most commonly used). The accuracy varies from200m to 10+ Km.
3.1.1.3 Geolocation Methodologies
A precise and complete positioning system is very difficult to obtain, due to the presence ofnot always measurable variables (e.g. walls and floors’ thickness) and the low probability ofhaving a direct line of sight. The information provided by the different technologies section(Section 3.1.1.2) concerning the strength (in dBm) of these signals, says that it may consider-ably vary depending on the number of people present in the building, their movements and thepossibility of having a direct (and clean) LOS. For example, an empirical experiment reportingthe variations of wireless access points’ signal strength, measured from a static point (laptopsplaced in the same position for a week), during typical office workdays, can be found in thepaper describing the Redpin application [12], which is an indoor localization system throughuser collaboration and in our experiments section (Section 4.1).
There are mainly three methodologies, each of them uses different algorithms and calcula-tions to elaborate the position of an object in space:
1. Triangulation.
2. Proximity.
3. Scene Analysis (Fingerprinting).2created by the two companies Atmel and U-blox, http://www.atmel.com and http://www.U-blox.com
16
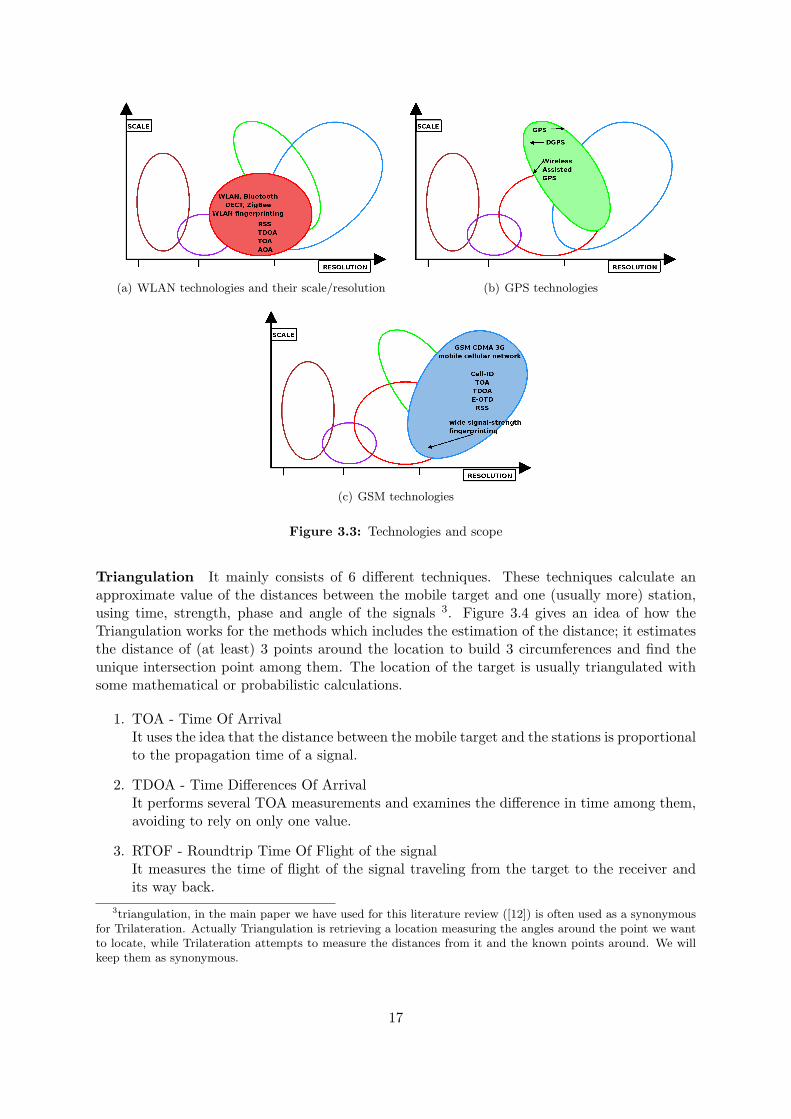
(a) WLAN technologies and their scale/resolution (b) GPS technologies
(c) GSM technologies
Figure 3.3: Technologies and scope
Triangulation It mainly consists of 6 different techniques. These techniques calculate anapproximate value of the distances between the mobile target and one (usually more) station,using time, strength, phase and angle of the signals 3. Figure 3.4 gives an idea of how theTriangulation works for the methods which includes the estimation of the distance; it estimatesthe distance of (at least) 3 points around the location to build 3 circumferences and find theunique intersection point among them. The location of the target is usually triangulated withsome mathematical or probabilistic calculations.
1. TOA - Time Of ArrivalIt uses the idea that the distance between the mobile target and the stations is proportionalto the propagation time of a signal.
2. TDOA - Time Differences Of ArrivalIt performs several TOA measurements and examines the difference in time among them,avoiding to rely on only one value.
3. RTOF - Roundtrip Time Of Flight of the signalIt measures the time of flight of the signal traveling from the target to the receiver andits way back.
3triangulation, in the main paper we have used for this literature review ([12]) is often used as a synonymousfor Trilateration. Actually Triangulation is retrieving a location measuring the angles around the point we wantto locate, while Trilateration attempts to measure the distances from it and the known points around. We willkeep them as synonymous.
17
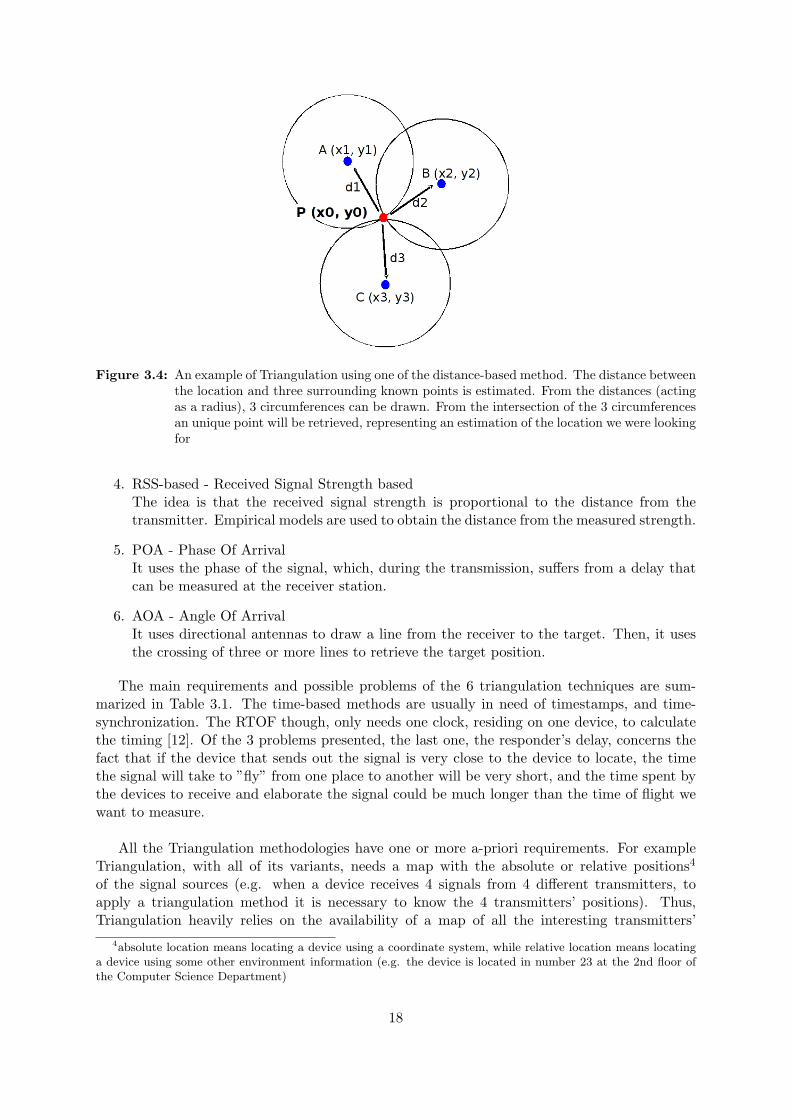
Figure 3.4: An example of Triangulation using one of the distance-based method. The distance betweenthe location and three surrounding known points is estimated. From the distances (actingas a radius), 3 circumferences can be drawn. From the intersection of the 3 circumferencesan unique point will be retrieved, representing an estimation of the location we were lookingfor
4. RSS-based - Received Signal Strength basedThe idea is that the received signal strength is proportional to the distance from thetransmitter. Empirical models are used to obtain the distance from the measured strength.
5. POA - Phase Of ArrivalIt uses the phase of the signal, which, during the transmission, suffers from a delay thatcan be measured at the receiver station.
6. AOA - Angle Of ArrivalIt uses directional antennas to draw a line from the receiver to the target. Then, it usesthe crossing of three or more lines to retrieve the target position.
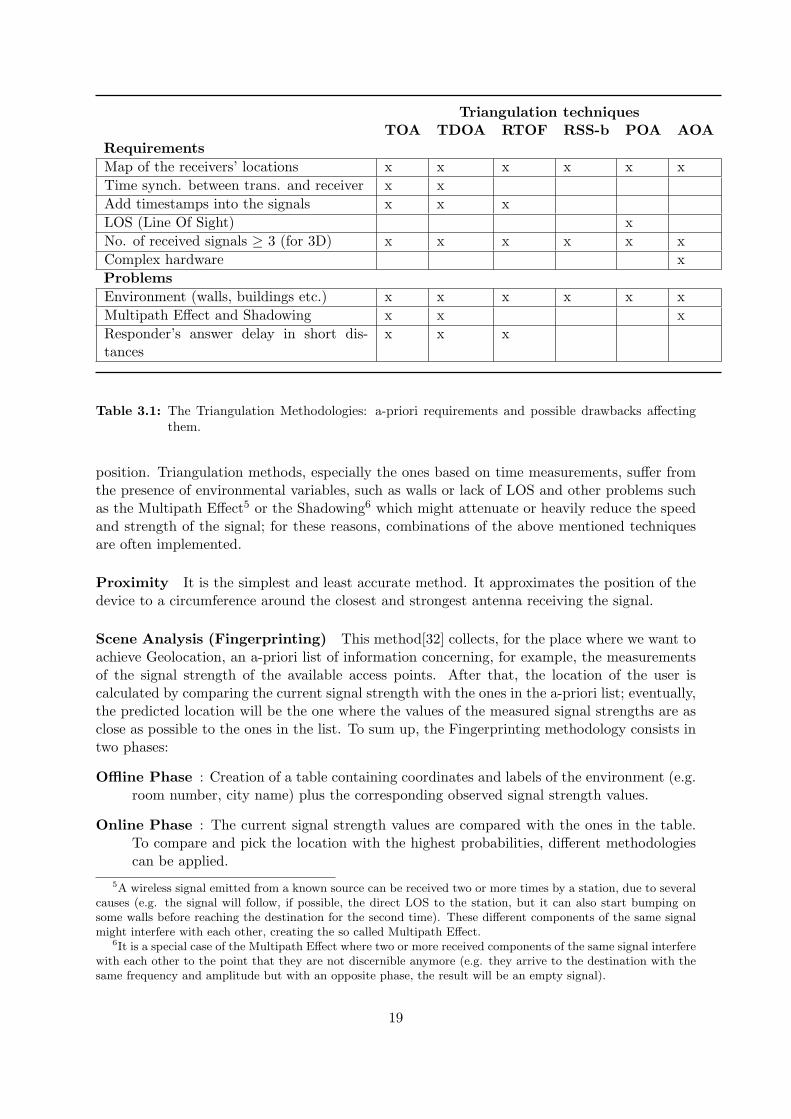
The main requirements and possible problems of the 6 triangulation techniques are sum-marized in Table 3.1. The time-based methods are usually in need of timestamps, and time-synchronization. The RTOF though, only needs one clock, residing on one device, to calculatethe timing [12]. Of the 3 problems presented, the last one, the responder’s delay, concerns thefact that if the device that sends out the signal is very close to the device to locate, the timethe signal will take to ”fly” from one place to another will be very short, and the time spent bythe devices to receive and elaborate the signal could be much longer than the time of flight wewant to measure.
All the Triangulation methodologies have one or more a-priori requirements. For exampleTriangulation, with all of its variants, needs a map with the absolute or relative positions4
of the signal sources (e.g. when a device receives 4 signals from 4 different transmitters, toapply a triangulation method it is necessary to know the 4 transmitters’ positions). Thus,Triangulation heavily relies on the availability of a map of all the interesting transmitters’
4absolute location means locating a device using a coordinate system, while relative location means locatinga device using some other environment information (e.g. the device is located in number 23 at the 2nd floor ofthe Computer Science Department)
18
Triangulation techniquesTOA TDOA RTOF RSS-b POA AOA
RequirementsMap of the receivers’ locations x x x x x xTime synch. between trans. and receiver x xAdd timestamps into the signals x x xLOS (Line Of Sight) xNo. of received signals ≥ 3 (for 3D) x x x x x xComplex hardware xProblemsEnvironment (walls, buildings etc.) x x x x x xMultipath Effect and Shadowing x x xResponder’s answer delay in short dis-tances
x x x
Table 3.1: The Triangulation Methodologies: a-priori requirements and possible drawbacks affectingthem.
position. Triangulation methods, especially the ones based on time measurements, suffer fromthe presence of environmental variables, such as walls or lack of LOS and other problems suchas the Multipath Effect5 or the Shadowing6 which might attenuate or heavily reduce the speedand strength of the signal; for these reasons, combinations of the above mentioned techniquesare often implemented.
Proximity It is the simplest and least accurate method. It approximates the position of thedevice to a circumference around the closest and strongest antenna receiving the signal.
Scene Analysis (Fingerprinting) This method[32] collects, for the place where we want toachieve Geolocation, an a-priori list of information concerning, for example, the measurementsof the signal strength of the available access points. After that, the location of the user iscalculated by comparing the current signal strength with the ones in the a-priori list; eventually,the predicted location will be the one where the values of the measured signal strengths are asclose as possible to the ones in the list. To sum up, the Fingerprinting methodology consists intwo phases:
Offline Phase : Creation of a table containing coordinates and labels of the environment (e.g.room number, city name) plus the corresponding observed signal strength values.
Online Phase : The current signal strength values are compared with the ones in the table.To compare and pick the location with the highest probabilities, different methodologiescan be applied.
5A wireless signal emitted from a known source can be received two or more times by a station, due to severalcauses (e.g. the signal will follow, if possible, the direct LOS to the station, but it can also start bumping onsome walls before reaching the destination for the second time). These different components of the same signalmight interfere with each other, creating the so called Multipath Effect.
6It is a special case of the Multipath Effect where two or more received components of the same signal interferewith each other to the point that they are not discernible anymore (e.g. they arrive to the destination with thesame frequency and amplitude but with an opposite phase, the result will be an empty signal).
19

Related work on Fingerprinting in an indoor environment: The Redpin projectTo gather information, either theoretical and practical, concerning the Fingerprinting locationmethodology, a good start is the Redpin project[11] which describes a method and an implemen-tation of a Fingerprinting system applied to a company or university-like environment (severalfloors, numbered rooms, good wireless access points coverage, either in power or in numbers).The Redpin application has very few constraints and a-priori requirements; the most importantis that it needs the collaboration of the users to train the system, especially during the initialphase. To support their choice of user-trained system, they also cite website such as Wikipediaor OpenStreetMap, completely based and running on users’ intervention. The Redpin projectimplements the Fingerprinting system above a distributed architecture, composed of mobilesmartphones working as RSS’s sniffers from the APs and a server to which is addressed thestoring of the fingerprints and the positioning calculation. The Database of fingerprints is cre-ated by collecting the received signals from all the available sources among GSM towers, wirelessaccess points and static Bluetooth equipments.
As the calculations and the storing is done on a server, the system is continuously work-ing, retrieving data from the phones and checking the user’s location in the Database. In casethe server considers the user’s location as unknown, which means that no fingerprint in theDatabase is “close” enough according to a manually set threshold, the user will be asked witha popup to insert the name of the new location. As they state in Chapter 4, using a server tostore fingerprints and retrieve the location sacrifices the users’ privacy, but it is necessary toguarantee the collaboration, higher accuracy and area-coverage. Concerning the location calcu-lations, it is done on the server by using a simple algorithm: it measures the “distance” betweenthe current measured fingerprint and all the entries in the Database; the distance is a numberwhich decreases if an AP is present both in the current fingerprint and in the Database entryand increases if it is not present. Moreover, the distance increases or decreases also dependingon the measured RSS values, if the RSS of an AP in a fingerprint in the Database is very close(it is not specified in the Redpin paper if they use different threshold levels or just one) to thecurrent one, the distance will decrease. At the end, the fingerprint with the smallest distanceis elected as the estimated user’s location.
In a further improvement, described in [13] and called Asynchronous Interval Labeling, theynoticed through an experiment (see Section 4.1.2 for a comparison of this experiment with ourexperiments) that an important source of uncertainties is the high short-time variations of theAPs’ RSS. Moreover, in their system, the user is asked to intervene whenever the applicationdoes not recognize a location, even when he is not moving. So the user can get annoyed bythe redundant queries. For that they decided to measure many fingerprints for each location,and to do it in an automatic way, they used the accelerometer (it measures the accelerationof the mobile, namely, if the device is moving and in which direction) to notice when themobile is moving or not. As far as the phone is still, they measure multiple fingerprints for thesame location. This way they avoid with overwhelming the user of redundant location labelingqueries.
3.1.2 Geolocation in Android based smartphones
Android has three ways to perceive users’ location [7]:
• GPS (accurate but energy consuming and presenting reception problems when indoor).
• Cell tower.
20

• WiFi.
Possible sources of error are:
• Trade-off among number of location sources versus speed, battery efficiency and accuracy.
• The user is moving.
• Accuracy of the different location sources.
Eventually, Android has a class, LocationManager, which might retrieve either the GPSposition (method GPS PROVIDER()) or a mix of both Cell tower and WiFi spot information(method NETWORK PROVIDER()). For both techniques Android will provide latitude/-longitude data plus some optional data if available. The reliability and the accuracy of theinformation heavily rely on the possibility to use GPS satellites and the number and distanceof GSM antennas connected to the mobile [41] 7.These classes provide the geographical position and the possibility to run an application oncereached a specific location[6].
3.2 Chat Systems Technologies
This section introduces the notion of a chat system and provides an overview of the differentexisting systems, their features and architectures. After having given the general informationabout what already exists, the section will focus on the architectures’ possibilities, namely,Client-Server, Peer-to-Peer (P2P). For each one of them, we list the advantages and disadvan-tages.
This gives us a deeper insight on the possibilities we have to build a Chat system and willhelp us make reasonable choices during the Design part.
3.2.1 Existing Chat Systems
Instant messaging is a real-time text-based communication between people who use devices ableto connect to networks, such as computers, phones, etc.
3.2.1.1 Windows Live Messenger
This instant messaging client was created by Microsoft in 1999 and is now used by about 330millions users per month [45]. The protocol used by Windows Live Messenger consists in sendingmessages between a client and a server. For instance if a contact signs out, the server sends aparticular message to the client, which will mark the contact as offline. This network relies ondifferent types of servers to handle the communications. They are detailed in Table 3.2.
3.2.1.2 Facebook Chat
More than 500 million persons use the Facebook chat, which was created in April 2008. Thechat service is directly available in the browser, at the bottom of Facebook pages. In orderto receive messages from a user, the client pulls update from the server, the Web layer takescare of these web requests. Chat loggers are servers which store conversations between the pageloads. Presence servers receive periodic updates from channel clusters. In each cluster we findan array that keeps available users. This system is illustrated in Figure 3.6.
7To calculate the mobile position through the GSM signal, Android uses a map where each antenna is linkedto its specific location. The map is created by continuously retrieving information from Android users which areusing a GPS and WiFi equipped mobile
21
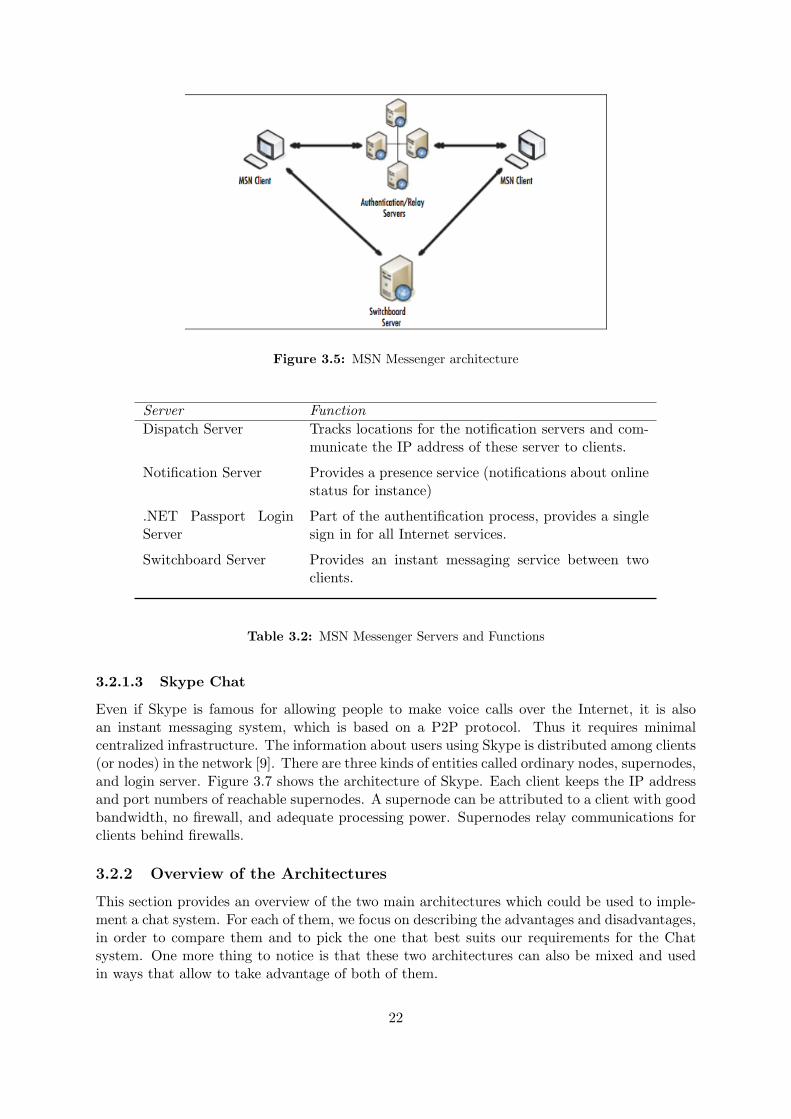
Figure 3.5: MSN Messenger architecture
Server FunctionDispatch Server Tracks locations for the notification servers and com-
municate the IP address of these server to clients.
Notification Server Provides a presence service (notifications about onlinestatus for instance)
.NET Passport LoginServer
Part of the authentification process, provides a singlesign in for all Internet services.
Switchboard Server Provides an instant messaging service between twoclients.
Table 3.2: MSN Messenger Servers and Functions
3.2.1.3 Skype Chat
Even if Skype is famous for allowing people to make voice calls over the Internet, it is alsoan instant messaging system, which is based on a P2P protocol. Thus it requires minimalcentralized infrastructure. The information about users using Skype is distributed among clients(or nodes) in the network [9]. There are three kinds of entities called ordinary nodes, supernodes,and login server. Figure 3.7 shows the architecture of Skype. Each client keeps the IP addressand port numbers of reachable supernodes. A supernode can be attributed to a client with goodbandwidth, no firewall, and adequate processing power. Supernodes relay communications forclients behind firewalls.
3.2.2 Overview of the Architectures
This section provides an overview of the two main architectures which could be used to imple-ment a chat system. For each of them, we focus on describing the advantages and disadvantages,in order to compare them and to pick the one that best suits our requirements for the Chatsystem. One more thing to notice is that these two architectures can also be mixed and usedin ways that allow to take advantage of both of them.
22
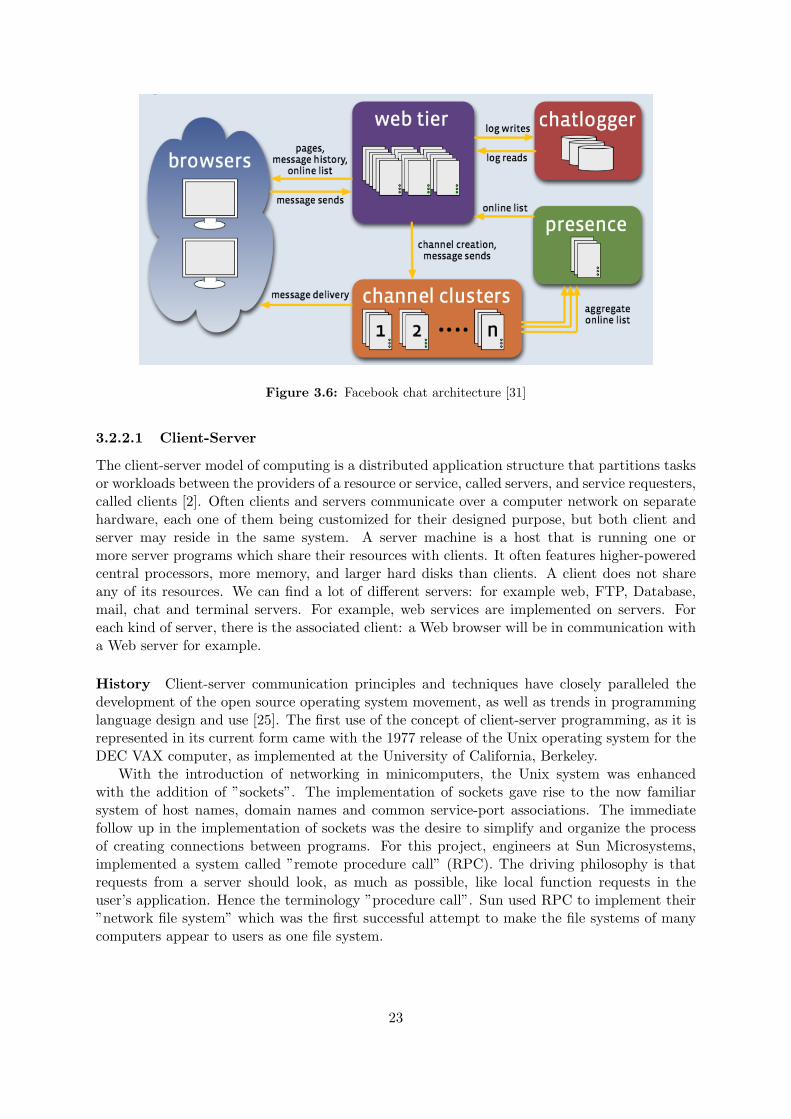
Figure 3.6: Facebook chat architecture [31]
3.2.2.1 Client-Server
The client-server model of computing is a distributed application structure that partitions tasksor workloads between the providers of a resource or service, called servers, and service requesters,called clients [2]. Often clients and servers communicate over a computer network on separatehardware, each one of them being customized for their designed purpose, but both client andserver may reside in the same system. A server machine is a host that is running one ormore server programs which share their resources with clients. It often features higher-poweredcentral processors, more memory, and larger hard disks than clients. A client does not shareany of its resources. We can find a lot of different servers: for example web, FTP, Database,mail, chat and terminal servers. For example, web services are implemented on servers. Foreach kind of server, there is the associated client: a Web browser will be in communication witha Web server for example.
History Client-server communication principles and techniques have closely paralleled thedevelopment of the open source operating system movement, as well as trends in programminglanguage design and use [25]. The first use of the concept of client-server programming, as it isrepresented in its current form came with the 1977 release of the Unix operating system for theDEC VAX computer, as implemented at the University of California, Berkeley.
With the introduction of networking in minicomputers, the Unix system was enhancedwith the addition of ”sockets”. The implementation of sockets gave rise to the now familiarsystem of host names, domain names and common service-port associations. The immediatefollow up in the implementation of sockets was the desire to simplify and organize the processof creating connections between programs. For this project, engineers at Sun Microsystems,implemented a system called ”remote procedure call” (RPC). The driving philosophy is thatrequests from a server should look, as much as possible, like local function requests in theuser’s application. Hence the terminology ”procedure call”. Sun used RPC to implement their”network file system” which was the first successful attempt to make the file systems of manycomputers appear to users as one file system.
23
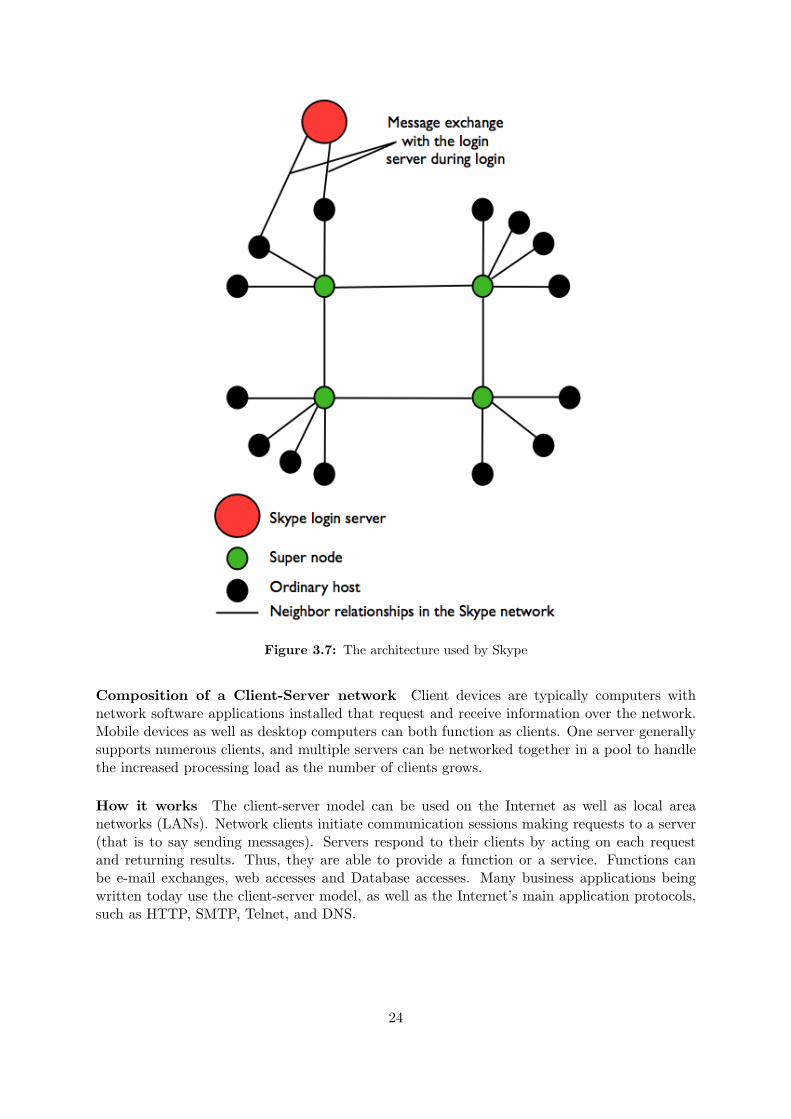
Figure 3.7: The architecture used by Skype
Composition of a Client-Server network Client devices are typically computers withnetwork software applications installed that request and receive information over the network.Mobile devices as well as desktop computers can both function as clients. One server generallysupports numerous clients, and multiple servers can be networked together in a pool to handlethe increased processing load as the number of clients grows.
How it works The client-server model can be used on the Internet as well as local areanetworks (LANs). Network clients initiate communication sessions making requests to a server(that is to say sending messages). Servers respond to their clients by acting on each requestand returning results. Thus, they are able to provide a function or a service. Functions canbe e-mail exchanges, web accesses and Database accesses. Many business applications beingwritten today use the client-server model, as well as the Internet’s main application protocols,such as HTTP, SMTP, Telnet, and DNS.
24
Advantages and Disadvantages
Advantages
1. Because a client-server architecture enables the roles and responsibilities of a computingsystem to be distributed among several independent computers that are known to eachother only through a network we have an additional advantage to use this architecture:greater ease of maintenance. For example, it is possible to replace, repair, upgrade, or evenrelocate a server while its clients remain both unaware and unaffected by that change.
2. Since data storage is centralized, updates to that data are easy to administrate.
3. Client-server networks generally offer advantages in keeping data secure. In fact all data isstored on the servers, which generally have far greater security controls than most clients.Servers can better control access and resources, to guarantee that only those clients withthe appropriate permissions may access and change data.
Disadvantages
1. As the number of simultaneous client’s requests to a given server increases, the server canbecome overloaded.
2. The client-server paradigm lacks robustness. With this model, if clients’ requests can notbe fullfiled, resources are not available anymore. More precisely, clients could not accessto the data from the server. If it is a mail server, persons running clients will not be ableto access to their mail anymore.
3.2.2.2 Peer-to-Peer
P2P is a communication model in which each part has the same capabilities (and responsibilities)and all of them can initiate a communication session [44]. It uses distributed resources (i.e.computing power, networking resources) to perform a task (like content delivery, collaborationor e-commerce) in a decentralized manner.
It differs from the client-server and the master-slave model. In some cases, P2P communica-tions are implemented by giving each communication node both server and client capabilities.P2P provide opportunities for real-time communication and ad-hoc collaboration. It is usuallyused as a file sharing mechanism too, and it allows files to be swapped directly between user’scomputers using the same networking program instead of having the file first stored on a server.This means that when you use P2P services, people are actually connecting directly to yourcomputer to retrieve files, and not to a server which would act as a “middle man” [3]. This typeof sharing became very popular with the famous Napster service as well as Gnutella, Grokster,KaZaA, etc. It was used to share copyrighted files. Movie productors and record labels showedtheir concern by suing some P2P users.
In recent years the P2P abbreviation has taken another meaning: People-to-People. Thus ithas become a marketing abbreviation for selling P2P software and for creating businesses thatcan help individuals on the Internet to meet one another or to share some common interests[36].
Composition of a Peer-to-Peer network A P2P network is made of ”peers”. Each peeris an equal partner. All client versions of Windows, Mac and Linux can function as nodes in aP2P network and allow their files to be shared thanks to an additional software [4].
25
How it works Generally speaking, the user must first download and execute a P2P net-working program [44]. After launching the program, the user enters the IP address of anothercomputer belonging to the network (typically, the Web page where the user got the downloadwill list several IP addresses as places to begin). When the computer finds other network mem-bers online, it will connect to them. Users can choose how many member’s connections to seekat one time.
Advantages and Disadvantages
Advantages
• First, it does not depend on a centralized server. There is no central decision point and itis dynamic in the sense that there is an unpredictable set of participants. Thus, we avoidthe loss of our system in case of a breakdown of one or several servers (no single point offailure).
• A P2P system is self organizing, that is to say there is no permanent infrastructure andno centralized administration.
• It can share load by using computer resources (memory and CPU).
• It is possible to avoid the expenses involved in maintaining a centralized server. Moreover,it can provide anonymity in case it is needed.
Disadvantages
• The system is not centralized, making administration difficult.
• The security could be an issue, as a malicious client can try to be a part of the network.There is no filter by default to avoid a specific client to join the network. Maybe amechanism for the identification should be implemented.
• Data updates may need to be distributed and applied to each peer in the network, whichis both time-consuming and error-prone, as there can be thousands or even millions ofpeers.
3.2.3 Peer-To-Peer system middlewares
Middleware is a term that is difficult to define. A popular definition given by Bernstein [10]defines middleware as programming interfaces and protocols that sit ”in the middle”, in a layerabove the operating system and networking software and below industry specific applications.A middleware provides services that can be used to rapidly develop and deploy distributedapplications. CORBA, J2EE, JMS and COM are some popular middleware solutions. Theseexisting middleware solutions were not designed for P2P computing. The infrastructure pro-vided by the existing middlewares can be used for synchronous/asynchronous communicationbetween peers, but they do not support P2P specific concerns like overlay network management,message multicast and resource discovery. P2P middlewares address these concerns which werenot supported in the older middlewares, and provide services which can be used in the P2Pdomain. They can be developed using existing lower-level middleware solutions like SOAP orCORBA.
26
P2P middlewares provide software components that can be used for rapidly developing P2Papplications. P2P applications developed using P2P middlewares built upon tested componentsand services and hence tend to be more reliable and bug-free. Current middlewares have differ-ent levels of support and use different approaches, for developing P2P applications [38].
We have focused ourselves on few middlewares to select the one which fits the best.
3.2.3.1 XMPP (eXtensible Messaging and Presence Protocol)
XMPP (also known as Jabber) is a technology for real-time communication. XMPP is an opentechnology for streaming XML over a network [1]. It is well-known and it is intended for instantmessaging but it can be used for developing other type of P2P applications [38]. The connectingpeers are able to receive presence information about other peers. Thanks to XMPP, we canhave a state of presence for each contact and we can chat in real-time. We can talk with severalpersons at the same time too. We are able to use voice and video (thanks to Jingle). XMPPis an open standard and the authentication is ensured by SASL. The connection is secured byTLS between clients and servers and the encryption uses GPG or E2E (see Section sec:security).Extensibility is one of the greatest strengths of XMPP.
Peers in Jabber networks can be uniquely identified by a Jabber Identifier (JID). A JIDis of the form [peername@]domain[/resource]. The domain name represents the Jabber serverto which the peer connects. Jabber enables any two peers on the Internet to exchange XMLdocuments containing communication messages (message document), resource availability infor-mation (presence document) or query/response messages ( Info/Query (IQ) documents). Thestructure of these XML documents is defined by Jabber. All the XML documents can be ex-tended to include extra information within a tag. IQ(Info/Query) documents provide a simplerequest/response framework within Jabber. It allows peers to pass XML-formatted queries andresponses back and forth. A query tag can be used to extend IQ documents.One of the drawbacks of XMPP is that it uses a hybrid P2P architecture. The Jabber serveris used for authenticating peers and resolving JID to a physical network address. But peerscan exchange data directly by establishing a connection which is brokered using Jabber servers[38]. XMPP is decentralized: it is similar to the e-mail network. That is to say anyone couldimplement their own Jabber server. There are tens of thousands of Jabber servers running onthe Internet today. The most famous service using XMPP is Google Talk. It is used by clientssuch as Trillian, Pidgin or Adium (for Mac OS X)
3.2.3.2 Pastry
Pastry is a decentralized object location and routing sub-system for P2P applications. It isself-organizing. Pastry provides an API which can be used to develop P2P applications. Eachnode in the pastry network is assigned a unique node id.
When presented with a message and an ID, Pastry efficiently routes the message to a peerwith the node id that is numerically closest to the key, among all currently live pastry nodes.The expected number of routing steps is O(log2 N ) where N is the number of peers in thenetwork. Eventual delivery of a message is guaranteed in Pastry. It chooses a route whichis likely to be the best respect to proximity metrics [38]. To support the routing procedure,each pastry node maintains its routing state consisting of three tables providing informationabout nearby and numerically close nodes. Pastry has the ability to take into account networklocality when routing messages: a message is not only sent to the numerically closest nodeId tothe message key, it also chooses the physically shortest way to go there.
27
New nodes joining a Pastry network send a join message with a key to the network through aboot strap node obtained through external means. The join message is routed to the numericallyclosest node. All the nodes in the route path of the message respond with their state tables(used for routing messages) and the information is used to populate the state tables of the newnode.[27] Pastry cannot be used to multicast messages on the overlay to search for an objectmatching a search criterion.[38]
3.2.3.3 Other P2P Middlewares
There are other P2P system Middlewares that we could use. To quote few of them: JXTA,SpeakEasy and Chedar.
1. JXTA (content-management application domain): JXTA is a specification for developingP2P applications. A JXTA specification does not guarantee interoperability among differ-ent JXTA implementations. It is based on 6 different protocols. They use XML schemato describe the format of the exchanged messages between peers to perform a service. Ituses TLS for security.
2. SpeakEasy (or ObjE): SpeakEasy is a technical framework for developing P2P applicationswhich support ad-hoc collaboration. In SpeakEasy any entity that can be accessed overa network (eg, printer, file, URL) is cast as a component. It contains a security layer.
3. Chedar (CHEap Distributed ARchitecture): Chedar is totally decentralized and can beused as a basis for P2P applications. It combines four different topology management al-gorithms and provides functionality to monitor how the P2P network is self-organizing.[8]
These systems have been developed for general purpose applications and they do not provideany specific features dedicated to a chat module.
3.2.4 Pure Peer-To-Peer XMPP Middleware: Smack API and the XMPPextensions
Based on the fact that we will maybe need XMPP for the implementation of our chat module,we decided to search for appropriate tools to implement it. To do so, we focuses our researchon three main points:
• These tools have to be Java based as the Android implementation is so.
• They have to be compatible with Android or at least possible to make it compatible.
• They have to provide serverless functionality as we want our chat to be based on P2P.
3.2.4.1 XMPP Java based tools
Throughout all the research, we found out that people all around the Internet tried to implementtheir own Java tools to use XMPP. Indeed, as XMPP is a technology used to create a lot ofchat clients for the well-known server such as Google Talk, programmers tend to provide a lot ofXMPP tools. Nevertheless our attention was attracted by the work of Ignite Realtime [18]. Thiscommunity aims at providing tools for the users and the developers of their open source RealTime Communication projects. Among others, they implemented a tool called OpenFire whichis used to set up servers for Real Time Collaboration using XMPP. Not only do they provide thiskind of software, they also provide their APIs to implement clients for them. Among them, the
28
Smack API which is an Open Source XMPP client library for instant messaging and presence.And the main characteristic that attracted us was that this API is pure Java. This API differsin many ways from the other APIs that we managed to find. Indeed, the fact that it comesfrom a strong programmers community makes it evolutive and effective. For example, duringthe whole implementation process, we experienced some troubles with the multicast that wewill describe later on, and so we asked for some help to one of the programmer and he hadno problems helping us enjoyed by the fact that we wanted to implement his work on newtechnologies.
3.2.4.2 Overview of the Smack API
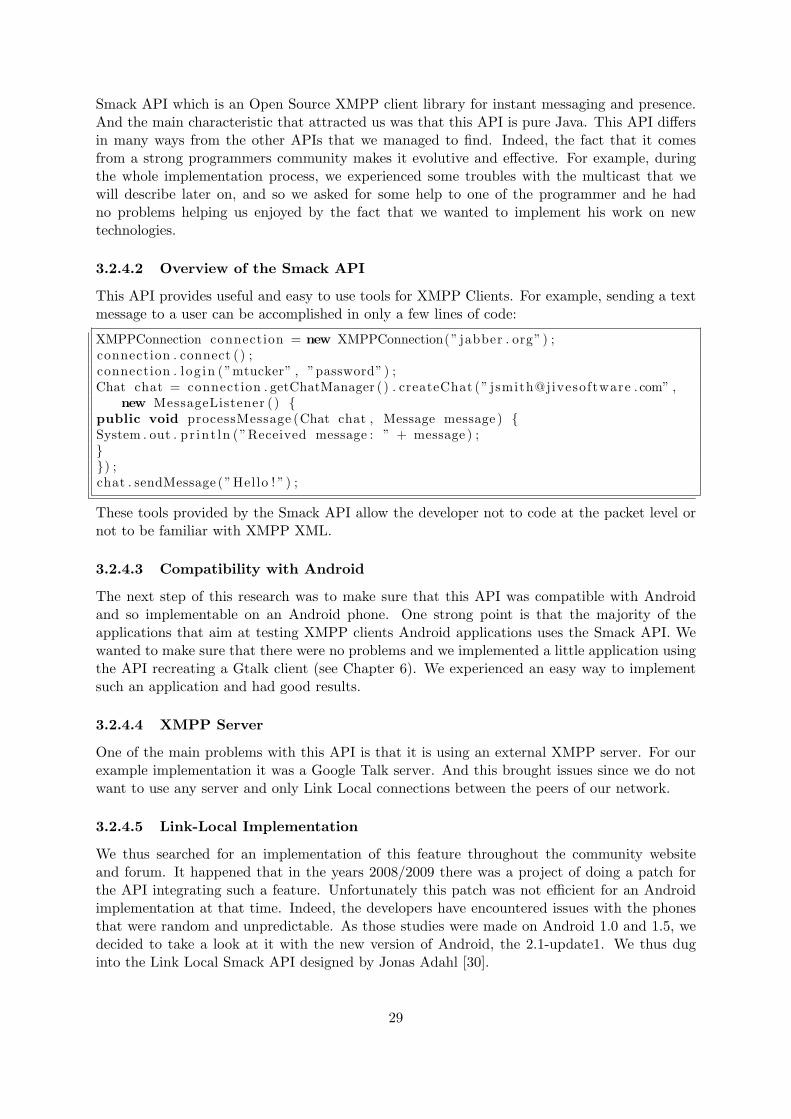
This API provides useful and easy to use tools for XMPP Clients. For example, sending a textmessage to a user can be accomplished in only a few lines of code:
XMPPConnection connection = new XMPPConnection(” jabber . org”) ;connection . connect ( ) ;connection . log in (”mtucker” , ”password”) ;Chat chat = connection . getChatManager ( ) . createChat (” jsmith@jivesoftware . com” ,
new MessageListener ( ) {public void processMessage (Chat chat , Message message ) {System . out . pr int ln (”Received message : ” + message ) ;}}) ;chat . sendMessage (”Hello ! ” ) ;
These tools provided by the Smack API allow the developer not to code at the packet level ornot to be familiar with XMPP XML.
3.2.4.3 Compatibility with Android
The next step of this research was to make sure that this API was compatible with Androidand so implementable on an Android phone. One strong point is that the majority of theapplications that aim at testing XMPP clients Android applications uses the Smack API. Wewanted to make sure that there were no problems and we implemented a little application usingthe API recreating a Gtalk client (see Chapter 6). We experienced an easy way to implementsuch an application and had good results.
3.2.4.4 XMPP Server
One of the main problems with this API is that it is using an external XMPP server. For ourexample implementation it was a Google Talk server. And this brought issues since we do notwant to use any server and only Link Local connections between the peers of our network.
3.2.4.5 Link-Local Implementation
We thus searched for an implementation of this feature throughout the community websiteand forum. It happened that in the years 2008/2009 there was a project of doing a patch forthe API integrating such a feature. Unfortunately this patch was not efficient for an Androidimplementation at that time. Indeed, the developers have encountered issues with the phonesthat were random and unpredictable. As those studies were made on Android 1.0 and 1.5, wedecided to take a look at it with the new version of Android, the 2.1-update1. We thus duginto the Link Local Smack API designed by Jonas Adahl [30].
29

3.2.4.6 XEP-0174 Extension for XMPP - Serverless Messenging
Among all the possible extensions available for XMPP, listed on the XMPP webpage ([22]), thenumber XEP-0174 called Serverless Messaging provides the possibility to start direct XMPPclient-to-client interactions, without the need of a server for the authentication of the partici-pants. The previously cited API aims at adding this feature to the actual Smack API. It usesthe principles of the zero-configuration networking. It is called Zeroconf [15], namely, it at-tempts to create a usable Internet protocol (IP) small/local network without manual operatorintervention or any special configuration servers.
Zeroconf, main technologies This paragraph briefly presents the main Zeroconf technolo-gies that allow a user to automatically connect computers, networked printers, and other networkdevices without being expected to know all the set-up parameters. Here are listed its three maintechnologies:
• Assignment of IP addresses for networked devices (link-local address autoconfiguration).
it makes that sure all the devices have got an IP address that is unique over the localnetwork.
• Multicast Domain Name System services (mDNS).
It provides automatic resolution and distribution of computer hostnames in a small-/local network where no conventional DNS server has been installed (e.g. a printer servicecould be named “printer.local“).
• Automatic location of network services.
A service will advertise itself over the whole local network (e.g. the printer servicewill advertise itself on the networks as ”printer-local“).
Without Zeroconf, one must previously set up special services, like Dynamic Host Con-figuration Protocol (DHCP) and DNS, or set up each computer’s network settings manually.The XMPP Serverless messaging extension is typically restricted to a local network (or ad-hocwide-area network), because of how zero-configuration networking works.
How ServerLess Messaging XMPP works In this paragraph we attempt to describehow the serverless mechanism works, and we will do it thanks to an example, inspired by theXEP-0174 documentation. We have two hosts, A and B. We want to know how A can start aconnection with B on an ad-hoc basis. First of all, A has to advertise itself (as a service) asa serverless address in order for B to dynamically find it. A does this by running a daemonsupporting both:
• DNS-based Service Discovery (”DNS-SD”, defined in DNS-Based Service Discovery [14]).
• Multicast DNS (”mDNS” as defined in Multicast DNS [39]).
By running this deamon the client A obtains the publication of its service via mDNS and thestart of a listener to get incoming connections from B (or others) directed to A. On the otherside, B can receive these multicasted messages and reply back.
30

3.2.4.7 Multicast DNS (mDNS)
Multicast DNS [39] is a way of using standard DNS programming in smallnetworks where no DNS server is available. It has been provided by theparticipants of the IETF (Internet Engineering Task Force) ZeroConf Net-work and DNSExt working groups. While this requirement could have beenmet by designing an entirely new protocol, they chose to adapt the DNSprotocol. In this way, programmers would not have to implement theirapplication in different ways if they want it to work in large configurednetworks and small ZeroConf ones. It also allows the application currentlyreleased to work with mDNS in ZeroConf networks without any changes.
What is Multicast ? Multicast is a way of distributing informationfrom a sender to a group of receivers. The receiver that is interested in themessages sent to that group just joins it. Those subscriptions to groupsallow the switches and routers to establish a route between the sender andthe receivers. In multicast, each packet is issued only once and then isrouted to all machines within the multicast group without any content beingduplicated on a physical line. Thus the network copies the data [43].
A multicast group consists of a set of machines. It is fully dynamic andopen, that is to say that a station can join or leave the group at any time,there is no limitation of sources, a station can even send a packet in a groupwithout joining.
The Internet Protocol (IP) uses addresses from 224.0.0.0 to239.255.255.255 for multicast. The 28 least significant bits represent thegroup address. Multicast addresses 224.0.0.1 to 224.0.0.255 are local andreserved for the operation of network protocols. When a machine wants tosend a packet to a multicast group, it sends the packet to the IP addressthat identifies the group (for instance 224.1.5.6). The reception is performedby a router subscribed to the group and then the packet is duplicated andsent.
mDNS Names Multicast DNS specifies a special DNS top-level domain”.local.” for link local domains. The names in these domains are meaningfulonly on the link where they originate. The DNS request for names endingwith ”.local.” must be sent to the mDNS multicast address 224.0.0.251. TheDNS request for other names may also be sent to this address if no DNSserver is available. This allows computers in a local network to be able tocommunicate with each other even when disconnected from the internet.
mDNS queries There exist three types of multicast DNS queries. One-shot queries made byconventional DNS clients, one-shot queries accumulating multiple responses made by multicastaware DNS clients, and continuous ongoing multicast DNS queries made by IP network browsersoftware. Multicast DNS clients have to send multicast DNS queries from UDP port 5353 (whichis assigned to mDNS), and listen to multicast DNS replies sent from the same UDP destinationport, at the mDNS multicast address 224.0.0.251.
One-shot mDNS queries The basic mDNS client can simply send DNS request blindlyto the address 224.0.0.251:5353. When a client queries a name that falls into the reserved mDNS
31

domains, instead of using a unicast DNS server, the query is sent to 224.0.0.251:5353. Thesesimple rules are enough to implement a minimal mDNS client. This kind of clients will typicallytake into consideration only the first DNS response that they will receive, which in some casescan be insufficient.
One-shot mDNS queries accumulating multiple responses For certain tasks, it canbe useful for mDNS clients to wait for multiple replies to a single mDNS query. This kind ofclients have to be aware that receiving a reply does not indicate that it might not receivesother. And while simple mDNS clients will retransmit their queries until they receive oneresponse, more complex clients could retransmit their queries until they receive a satisfyingcollection of replies. When such clients retransmit a query for which they have already receivedresponses, they must indicate to responders which have already replied, that their replies havebeen received, in order to improve the network efficiency.
Continuous mDNS querying When using one shot querying, the transaction startswhen the query is issued by the client, and ends when the desired responses have been received.But in certain systems, such as a software displaying a list of printers in a network, it can beuseful to have a mechanism which would be aware of the incoming and outgoing devices in orderto insure to the user a reliable list of available printers. Such kind of software should use theTime To Live (TTL) value included in the replies, which indicate the time for which a responseis valid. Before the TTL for a reply has expired, the software should reissue a query in orderto check if the device which replied before is still alive.
Multiple questions per query It is possible for mDNS client to embed multiple ques-tions in a single query. The result of that is exactly the same than issuing several questions inmultiple queries, but it improves the efficiency of the network.
Questions requesting unicast responses Responding to question with multicast hasthe benefit that all the participants of the network are able to see the response. However, insome case, it may be unnecessary that all the participants receive a response. The first bit inthe class field of a DNS question can be set in order to ask for a unicast response from therepliers. The unicast responses can be useful for a incoming client in the network, since it mayask for a lot responses that all of the others participant may already be aware of, and wouldflood the network for useless purpose. However, if a responder sends a respond that has not besent for a long time (according to TTL), it may choose to multicast this response anyway.
Responding Response can be issued by responder when responding to a question from aquerier, or when a responder has an announcement that it considers useful for the other par-ticipants of the network. When responding to a multicast question, a random delay is insertedfor responding, in order to avoid that all the responders replies at the same time, which wouldlead to a collision in the network. When a responder responds to a multiple question query andhas multiple responses to deliver, it should aggregate as many as it can to send them in a singlemulticast DNS response packet, in order to improve the network efficiency.
3.2.4.8 JmDNS
JmDNS is a Java implementation of mDNS. The project was created in 2002 by Arthur VanHoff and was originally called JRendezVous.
32
Java, as a high level language, is not the most appropriate one for low level networking, butis really convenient for service registration and discovery. JmDNS provides a pure Java andeasy to use mDNS implementation that runs on most of the Java virtual machines.
3.2.5 XMPP security considerations
The following information come from the XMPP standards foundation [34] and Wikipedia.
Authentication and Encryption XMPP networks use:
• TLS (Transport Layer Security) for channel encryption. TLS is a cryptographic protocolthat provides confidentiality and integrity of exchanged data. It uses symmetric cryptog-raphy for privacy and a keyed message authentication code for message reliability.
• SASL (Simple Authentication and Security Layer) for authentification. SASL is a frame-work for authentication and authorization. It decouples authentication mechanisms fromapplication protocols, allowing any authentication mechanism supported by SASL to beused from any application protocol capable of using SASL. Authentication mechanismscan also provide a layer of data integrity that can provide services for data security andconfidentiality of data.
• DNS (Domain Name System) for validation of server hostnames. DNS allows to a establisha correspondence between an IP address and a domain name and more generally to findinformation from a domain name.
These 3 different technologies allow to ensure the identity of sending entities and to encryptXML streams. The use of TLS and SASL for the XML stream have to be negotiated to securecommunication between serverless entities. Sometimes an entity can accept an unencryptedand unauthenticated channel and in this case the client has to warn the user that the channelis neither authenticated nor encrypted.
33
Chapter 4
Experiments
In this section we describe the experiments we have carried out, before starting the architec-ture design of our system. The aims of these experiments are the following: (i) to give us abetter understanding on some characteristics of the wireless signals (namely, the signal strengthfluctuations over short and long term), which will be useful for our Geolocation system; (ii) tohave a quick glance on what is possible to gather, in term of network data, with the AndroidOS on a mobile. On the results of these experiments we eventually base or refine some of ourfinal design decisions.
4.1 Wireless Received Signal Strength fluctuations
One thing we have noticed, during our review of Geolocation methodologies in section 3.1.1.3,is that the RSS values may suffer high fluctuations, due to several different causes. One ofthem is the presence of fixed or mobile objects, as well as people, covering/uncovering the lineof sight (LOS) between the transmitter and the receiver, thus absorbing a part of the signalpower. Another cause is the presence of other signals overlapping the frequency range of thestandard WLAN IEEE 802.11 [28], thus interfering with it. Actually, even the presence ofdifferent transmitters carrying the same wireless signals may create a background noise whichmay interfere with the final RSS value.
Why we carry out this experiment Given the above mentioned problems, with this exper-iment we want to measure, in a university-like indoor environment, how strong and frequent thefluctuations of the RSS values are. We do this to be able, once obtained the measurements, tostudy the RSS variation ranges over time, the minimum and maximum values in which we couldassume the variation will take place, and to look for possible patterns, like peaks or generalRSS degradation/improvement in particular time of the day.
Deployment As we are interested in the global wireless RSS signal fluctuations, it seems fairto assume that the same variations will affect in similar ways all kind of wireless devices. Thus,using a laptop equipped with an internal wireless network card, a workstation with a wire-less antenna, or a WiFi equipped smartphone, should provide similar patterns and fluctuationranges. We carried out the experiment from our grouproom, which is the only place where wehave access to workstations that can run for a long time.
We used both a laptop and a workstation, equipped with the network cards provided inTable 4.1:
34
Installed on Brand Network Controller No. Antennas
Laptop Intel Intel Corporation PRO/Wireless 3945ABG[Golan] Network Connection (rev 02)
1(internal)
Workstation D-Link Texas Instruments ACX 111 54Mbps WirelessInterface
1(external)
Workstation SMC Atheros Communications Inc. AR5008 WirelessNetwork Adapter (rev 01)
3(external)
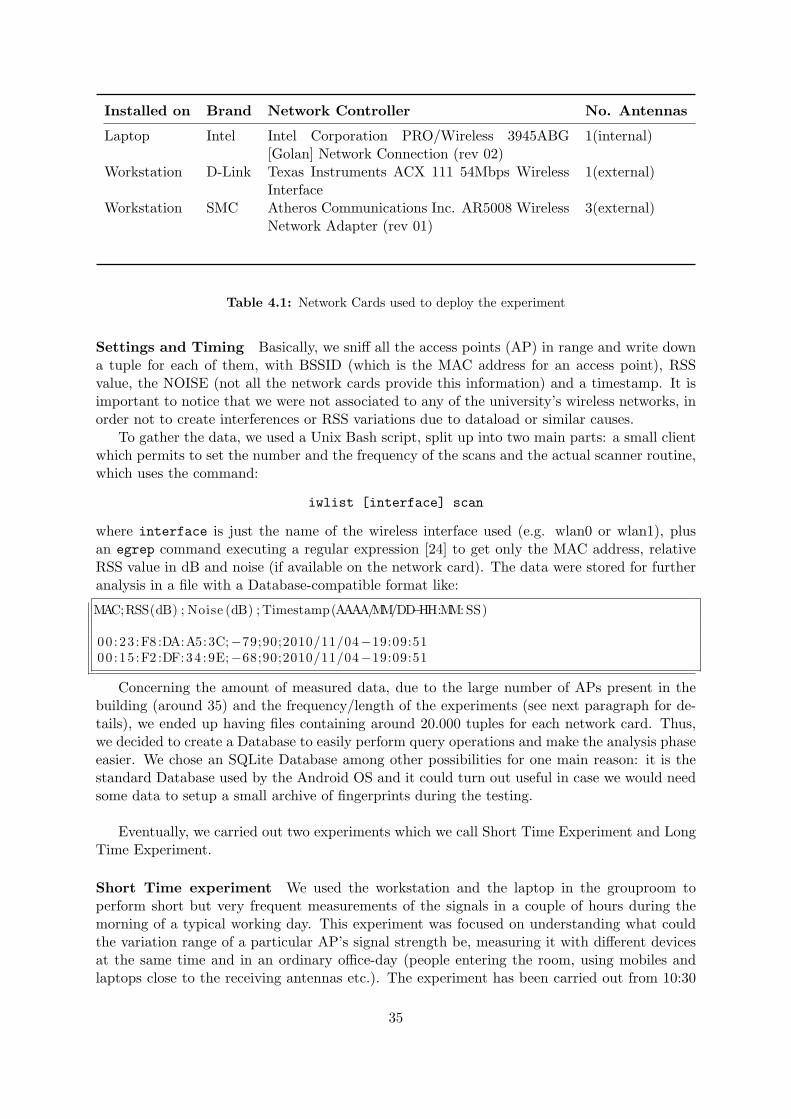
Table 4.1: Network Cards used to deploy the experiment
Settings and Timing Basically, we sniff all the access points (AP) in range and write downa tuple for each of them, with BSSID (which is the MAC address for an access point), RSSvalue, the NOISE (not all the network cards provide this information) and a timestamp. It isimportant to notice that we were not associated to any of the university’s wireless networks, inorder not to create interferences or RSS variations due to dataload or similar causes.
To gather the data, we used a Unix Bash script, split up into two main parts: a small clientwhich permits to set the number and the frequency of the scans and the actual scanner routine,which uses the command:
iwlist [interface] scan
where interface is just the name of the wireless interface used (e.g. wlan0 or wlan1), plusan egrep command executing a regular expression [24] to get only the MAC address, relativeRSS value in dB and noise (if available on the network card). The data were stored for furtheranalysis in a file with a Database-compatible format like:
MAC;RSS(dB) ; Noise (dB) ; Timestamp(AAAA/MM/DD−HH:MM: SS)
00 :23 :F8 :DA:A5:3C;−79;90;2010/11/04−19:09:5100 :15 :F2 :DF:34 : 9E;−68;90;2010/11/04−19:09:51
Concerning the amount of measured data, due to the large number of APs present in thebuilding (around 35) and the frequency/length of the experiments (see next paragraph for de-tails), we ended up having files containing around 20.000 tuples for each network card. Thus,we decided to create a Database to easily perform query operations and make the analysis phaseeasier. We chose an SQLite Database among other possibilities for one main reason: it is thestandard Database used by the Android OS and it could turn out useful in case we would needsome data to setup a small archive of fingerprints during the testing.
Eventually, we carried out two experiments which we call Short Time Experiment and LongTime Experiment.
Short Time experiment We used the workstation and the laptop in the grouproom toperform short but very frequent measurements of the signals in a couple of hours during themorning of a typical working day. This experiment was focused on understanding what couldthe variation range of a particular AP’s signal strength be, measuring it with different devicesat the same time and in an ordinary office-day (people entering the room, using mobiles andlaptops close to the receiving antennas etc.). The experiment has been carried out from 10:30
35
AM to 12:30 AM, sniffing the wireless channel every 10 seconds; all of the available networkcards have been used.
Long Time experiment We wanted to measure the fluctuations over a week, looking forpossible patterns due to the crowding of the building in the early morning or emptying of thesame in the afternoon/evening. We used only the workstation in the grouproom, equippedwith two PCI network cards: the Dlink and SMC ones. We carried out measurements every 2minutes for 8 days.
Results and graphs The number of APs sniffed was quite large, sometimes more than 40,and the value of the average RSS measured over 2 hours, was often strangely equal for groupsof 5-6 APs. For example, 5 different MAC addresses, supposingly bounded to 5 different APsin different rooms, were retrieving the same average power regardless their position. This leadus to discover that the wireless network in our department uses a particular infrastructure fromCisco, which has affected the experiments throughout their time. We briefly introduce thesystem and its characteristics below in this section.
After all, we decided to analyze the data coming from the three strongest sources that wecall AP1, AP2 and AP31. This data selection has actually good reasons to stand:
• in an office/university environment, it is likely that the wireless system in the buildinghas been set up in a manner where only two or three main APs can be sniffed from asingle room (this is obviously caused by the optimization of the ratio between coveredarea versus the number of APs needed).
• the minimum RSS gap between the third average strongest received signals (measured onall the 3 network cards), and the 4th, is at least 10dB, while the average gaps betweenthe 1st and the 2nd or the 2nd and the 3rd goes in average from 1-2dB to a max of 9dB(measured on the laptop). Thus, we are very interested in understanding their behaviourwhich will be probably be the same in other places in the building.
We describe the obtained results in two separated paragraphs for the short and the long timeexperiments, but right before, we introduce the Cisco infrastructure of our university.
The Cisco Wireless Control System (WCS) in our department . The WCS [16] isa centralized management system which groups all the information and activities related to aWireless network deployed on a large scale building or campus area. The WCS system relieson Cisco proprietary hardware, in our case, the Wireless System Module (WISM) [17]; this isa controller on which can be attached hundreds of Cisco wireless switches and routers2. TheWCS actually aims to carry out an efficient Wireless network with minimum administratorsintervention. It creates a self-optimizing WLAN, that means the network will automaticallyreact to different workload situations, catch interference sources and optimize the coverage areaand connection quality, operating on the endpoints APs.
Among the different self-optimizing features offered by WCS, two of them have directlyaffected our experiment: the MAC splitting technology and the RSS automatic leveling. Bothof these features are Cisco proprietary systems and, especially for the MAC splitting, it hasbeen hard to find more information than a brief overview in the Cisco documentation. Hence,we mainly describe here the effects they have produced on the experiments.
1only AP1 and AP2 have been used in the Short time Experiment2in our department the Cisco Aironet lightweight access points are in use
36
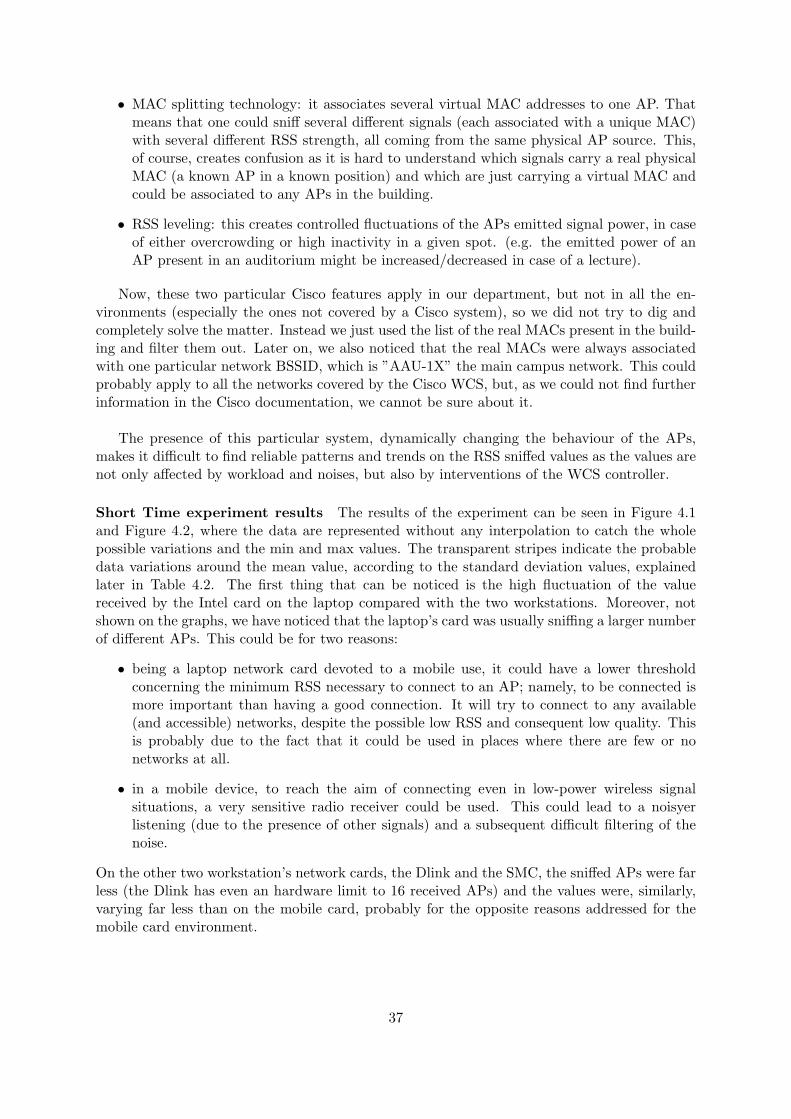
• MAC splitting technology: it associates several virtual MAC addresses to one AP. Thatmeans that one could sniff several different signals (each associated with a unique MAC)with several different RSS strength, all coming from the same physical AP source. This,of course, creates confusion as it is hard to understand which signals carry a real physicalMAC (a known AP in a known position) and which are just carrying a virtual MAC andcould be associated to any APs in the building.
• RSS leveling: this creates controlled fluctuations of the APs emitted signal power, in caseof either overcrowding or high inactivity in a given spot. (e.g. the emitted power of anAP present in an auditorium might be increased/decreased in case of a lecture).
Now, these two particular Cisco features apply in our department, but not in all the en-vironments (especially the ones not covered by a Cisco system), so we did not try to dig andcompletely solve the matter. Instead we just used the list of the real MACs present in the build-ing and filter them out. Later on, we also noticed that the real MACs were always associatedwith one particular network BSSID, which is ”AAU-1X” the main campus network. This couldprobably apply to all the networks covered by the Cisco WCS, but, as we could not find furtherinformation in the Cisco documentation, we cannot be sure about it.
The presence of this particular system, dynamically changing the behaviour of the APs,makes it difficult to find reliable patterns and trends on the RSS sniffed values as the values arenot only affected by workload and noises, but also by interventions of the WCS controller.
Short Time experiment results The results of the experiment can be seen in Figure 4.1and Figure 4.2, where the data are represented without any interpolation to catch the wholepossible variations and the min and max values. The transparent stripes indicate the probabledata variations around the mean value, according to the standard deviation values, explainedlater in Table 4.2. The first thing that can be noticed is the high fluctuation of the valuereceived by the Intel card on the laptop compared with the two workstations. Moreover, notshown on the graphs, we have noticed that the laptop’s card was usually sniffing a larger numberof different APs. This could be for two reasons:
• being a laptop network card devoted to a mobile use, it could have a lower thresholdconcerning the minimum RSS necessary to connect to an AP; namely, to be connected ismore important than having a good connection. It will try to connect to any available(and accessible) networks, despite the possible low RSS and consequent low quality. Thisis probably due to the fact that it could be used in places where there are few or nonetworks at all.
• in a mobile device, to reach the aim of connecting even in low-power wireless signalsituations, a very sensitive radio receiver could be used. This could lead to a noisyerlistening (due to the presence of other signals) and a subsequent difficult filtering of thenoise.
On the other two workstation’s network cards, the Dlink and the SMC, the sniffed APs were farless (the Dlink has even an hardware limit to 16 received APs) and the values were, similarly,varying far less than on the mobile card, probably for the opposite reasons addressed for themobile card environment.
37
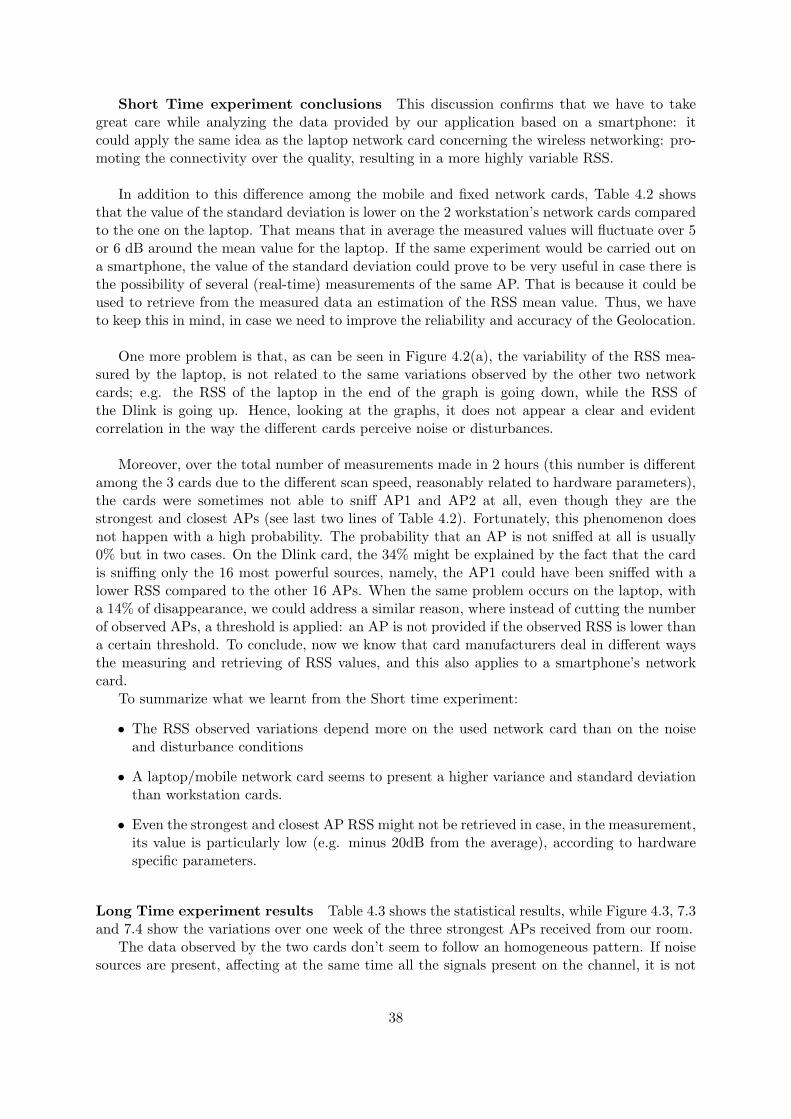
Short Time experiment conclusions This discussion confirms that we have to takegreat care while analyzing the data provided by our application based on a smartphone: itcould apply the same idea as the laptop network card concerning the wireless networking: pro-moting the connectivity over the quality, resulting in a more highly variable RSS.
In addition to this difference among the mobile and fixed network cards, Table 4.2 showsthat the value of the standard deviation is lower on the 2 workstation’s network cards comparedto the one on the laptop. That means that in average the measured values will fluctuate over 5or 6 dB around the mean value for the laptop. If the same experiment would be carried out ona smartphone, the value of the standard deviation could prove to be very useful in case there isthe possibility of several (real-time) measurements of the same AP. That is because it could beused to retrieve from the measured data an estimation of the RSS mean value. Thus, we haveto keep this in mind, in case we need to improve the reliability and accuracy of the Geolocation.
One more problem is that, as can be seen in Figure 4.2(a), the variability of the RSS mea-sured by the laptop, is not related to the same variations observed by the other two networkcards; e.g. the RSS of the laptop in the end of the graph is going down, while the RSS ofthe Dlink is going up. Hence, looking at the graphs, it does not appear a clear and evidentcorrelation in the way the different cards perceive noise or disturbances.
Moreover, over the total number of measurements made in 2 hours (this number is differentamong the 3 cards due to the different scan speed, reasonably related to hardware parameters),the cards were sometimes not able to sniff AP1 and AP2 at all, even though they are thestrongest and closest APs (see last two lines of Table 4.2). Fortunately, this phenomenon doesnot happen with a high probability. The probability that an AP is not sniffed at all is usually0% but in two cases. On the Dlink card, the 34% might be explained by the fact that the cardis sniffing only the 16 most powerful sources, namely, the AP1 could have been sniffed with alower RSS compared to the other 16 APs. When the same problem occurs on the laptop, witha 14% of disappearance, we could address a similar reason, where instead of cutting the numberof observed APs, a threshold is applied: an AP is not provided if the observed RSS is lower thana certain threshold. To conclude, now we know that card manufacturers deal in different waysthe measuring and retrieving of RSS values, and this also applies to a smartphone’s networkcard.
To summarize what we learnt from the Short time experiment:
• The RSS observed variations depend more on the used network card than on the noiseand disturbance conditions
• A laptop/mobile network card seems to present a higher variance and standard deviationthan workstation cards.
• Even the strongest and closest AP RSS might not be retrieved in case, in the measurement,its value is particularly low (e.g. minus 20dB from the average), according to hardwarespecific parameters.
Long Time experiment results Table 4.3 shows the statistical results, while Figure 4.3, 7.3and 7.4 show the variations over one week of the three strongest APs received from our room.
The data observed by the two cards don’t seem to follow an homogeneous pattern. If noisesources are present, affecting at the same time all the signals present on the channel, it is not
38
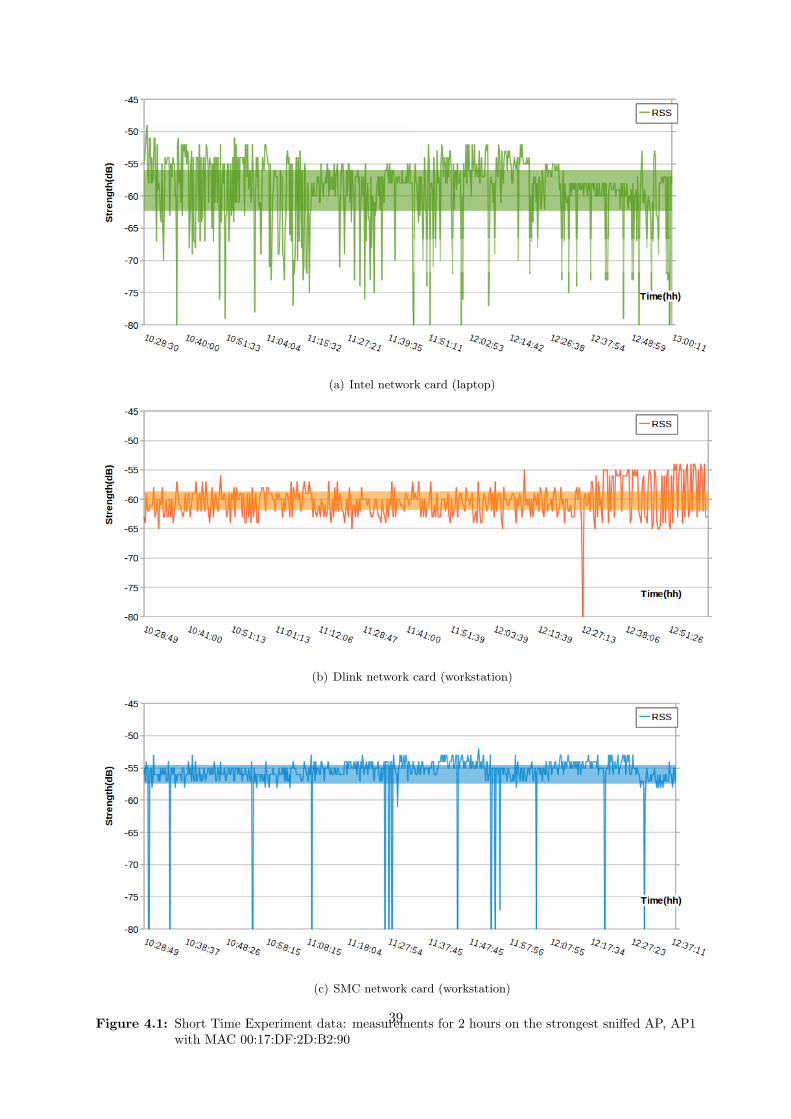
(a) Intel network card (laptop)
(b) Dlink network card (workstation)
(c) SMC network card (workstation)
Figure 4.1: Short Time Experiment data: measurements for 2 hours on the strongest sniffed AP, AP1with MAC 00:17:DF:2D:B2:90
39

(a) Intel network card (laptop)
(b) Dlink network card (workstation)
(c) SMC network card (workstation)
Figure 4.2: Short Time Experiment data: measurements for 2 hours on the second strongest AP, AP2with MAC 00:1C:0E:42:D0:00
40
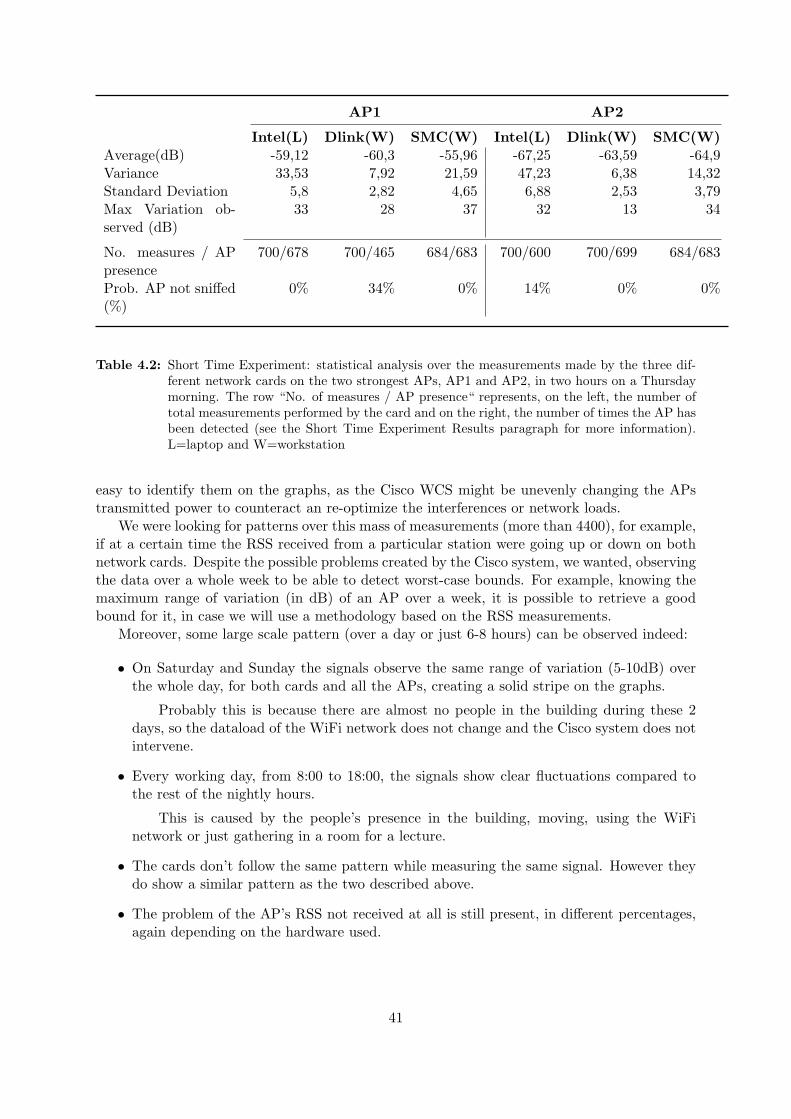
AP1 AP2
Intel(L) Dlink(W) SMC(W) Intel(L) Dlink(W) SMC(W)Average(dB) -59,12 -60,3 -55,96 -67,25 -63,59 -64,9Variance 33,53 7,92 21,59 47,23 6,38 14,32Standard Deviation 5,8 2,82 4,65 6,88 2,53 3,79Max Variation ob-served (dB)
33 28 37 32 13 34
No. measures / APpresence
700/678 700/465 684/683 700/600 700/699 684/683
Prob. AP not sniffed(%)
0% 34% 0% 14% 0% 0%
Table 4.2: Short Time Experiment: statistical analysis over the measurements made by the three dif-ferent network cards on the two strongest APs, AP1 and AP2, in two hours on a Thursdaymorning. The row “No. of measures / AP presence“ represents, on the left, the number oftotal measurements performed by the card and on the right, the number of times the AP hasbeen detected (see the Short Time Experiment Results paragraph for more information).L=laptop and W=workstation
easy to identify them on the graphs, as the Cisco WCS might be unevenly changing the APstransmitted power to counteract an re-optimize the interferences or network loads.
We were looking for patterns over this mass of measurements (more than 4400), for example,if at a certain time the RSS received from a particular station were going up or down on bothnetwork cards. Despite the possible problems created by the Cisco system, we wanted, observingthe data over a whole week to be able to detect worst-case bounds. For example, knowing themaximum range of variation (in dB) of an AP over a week, it is possible to retrieve a goodbound for it, in case we will use a methodology based on the RSS measurements.
Moreover, some large scale pattern (over a day or just 6-8 hours) can be observed indeed:
• On Saturday and Sunday the signals observe the same range of variation (5-10dB) overthe whole day, for both cards and all the APs, creating a solid stripe on the graphs.
Probably this is because there are almost no people in the building during these 2days, so the dataload of the WiFi network does not change and the Cisco system does notintervene.
• Every working day, from 8:00 to 18:00, the signals show clear fluctuations compared tothe rest of the nightly hours.
This is caused by the people’s presence in the building, moving, using the WiFinetwork or just gathering in a room for a lecture.
• The cards don’t follow the same pattern while measuring the same signal. However theydo show a similar pattern as the two described above.
• The problem of the AP’s RSS not received at all is still present, in different percentages,again depending on the hardware used.
41
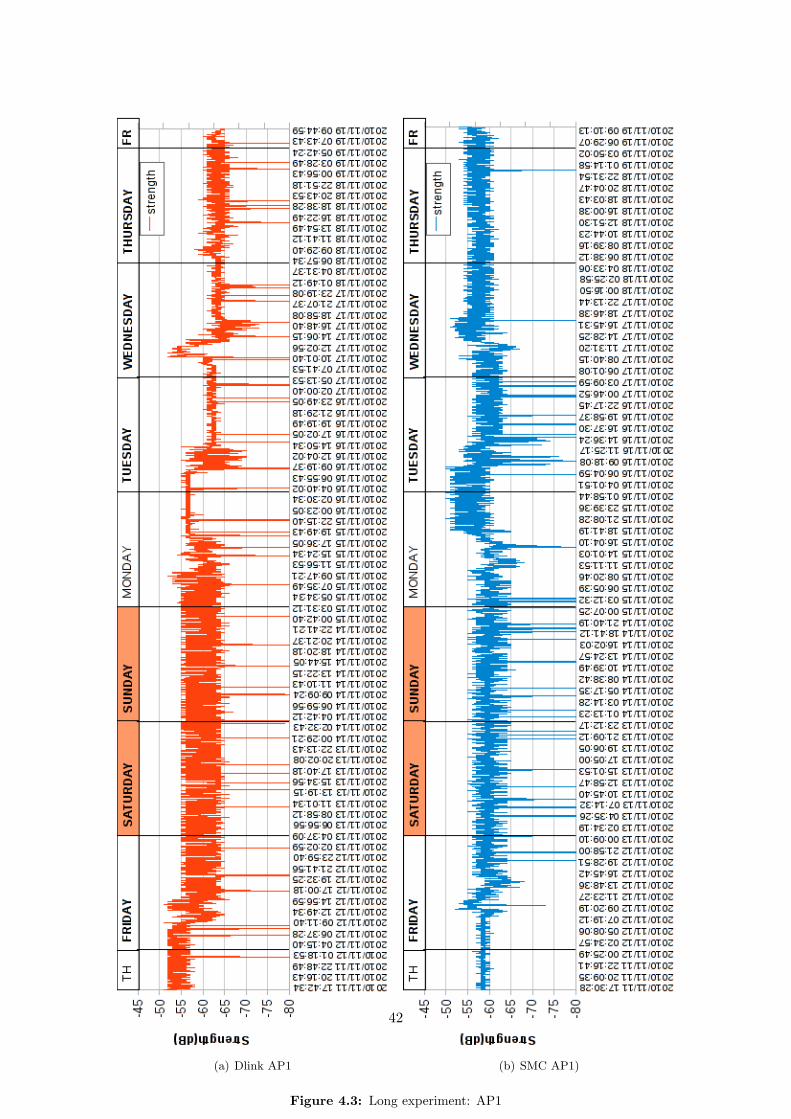
(a) Dlink AP1 (b) SMC AP1)
Figure 4.3: Long experiment: AP1
42

AP1 AP2 AP3
Dlink(W) SMC(W) Dlink(W) SMC(W) Dlink(W) SMC(W)Average(dB) -60,54 -59,13 -62,07 -63,10 -66,72 -67,57Variance 21,40 16,13 23,52 13,85 4,57 18,90Standard Deviation 4,63 4,02 4,85 3,72 2,14 4,35Max Variation ob-served (dB)
36 44 34 38 17 33
No. measures / APpresence
5397/4284 4597/4527 5397/3086 4597/4548 5397/5130 4597/4581
Prob. AP not sniffed(%)
21% 2% 43% 1% 0,5% 0%
Table 4.3: Long Time Experiment: statistical analysis over the measurements made by the two differentnetwork cards on the three strongest APs, AP1, AP2 and AP3. The row “No. of measures/ AP presence“ represents, on the left, the number of total measurements performed by thecard and on the right, the number of times the AP has been detected. W=workstation
4.1.1 Merging the Probabilistic Analysis with the Distribution graphs infor-mation
To understand which were the most probable RSS values coming out from the measurements, wedecided to graph their probability mass function; even though our data do not perfectly matchany known probability distributions, in some cases they resemble to a non balanced Gaussianbell which can be seen in Figure 4.4, while, especially in the long time experiment more thanone mean value is present (probably caused by the variations created by the Cisco system. SeeFigure 4.5), creating two or more peaks inside the bell.Connecting together the information about the standard deviation found in Table 4.2 and 4.3,and the information coming from the non balanced bell of the mass distributions, we can noticeone important thing: even though the standard deviation is in average quite low for all themeasurements (from 2 to 7dB) because the mass of data just moves around the mean value,we could still end up in the situation where a sniffed RSS is on the low side of the unbalancedbell. Namely, we get an RSS much smaller than the mean value (in Figure 4.5 can be seen anexample of this problem: the values in the bottom of both the graphs, being very distant fromthe middle of the bell). Moreover, as stated in the experiments’ conclusions, we also observeda percentage of total ”disappearance” of an AP, where even the strongest APs are sometimesnot retrieved at all in a measurement. This could be seen as a particular case of unbalancedbell, where the observed AP’s RSS value is so low that it is not retrieved at all.
These problems have to be addressed in our application, as the risk to get RSS values veryfar (in negative) from the mean value, or even disappear, could heavily influence the reliabilityand accuracy of the location system.
One possible technique to measure an RSS value as close as possible to the “real” meanvalue, could come from the observation that the bells created by the distributions are eitherquite balanced (especially in the case of the workstation’s cards), or unbalanced with the highestpoint of the bell being a high RSS and the rest of the bell fading away with smaller RSS (seeFigure 4.4). This can lead to a technique were, given several measurements made in a short
43
time, more importance will be given to the highest ones, which should be closer to the “real”mean value of the bell.
All the graphs are shown in an overview picture for both Short and Long Time experimentin the Appendix, in Figure 7.5 and 7.6, where it is easy to appreciate the similar distributionpattern followed by all the measurements.
4.1.2 Comparison with the Redpin Experiment
A similar experiment has been carried out by the earlier mentioned Redpin project (see Section3.1.1.3). They used 5 laptops in 3 different rooms of the same building, but close enough to beable to sniff the same APs. They ran the experiment for a week sniffing measurements everyminute. Their conclusion are mainly:
• The RSS of an AP varies depending on the used network card
• A short and a long term variation are observed
• Different APs have different variances
For these reasons, they came up with the Asynchronous Labeling Technique described inSection 3.1.1.3, using the accelerometer to detect the stillness or the moving of the phones andlater on averaging a large number of measurements from the same location, in order to copewith these variations. This experiment can be compared to our Long Time Experiment, theyhave a similar frequency of the scans (1 minute versus 2 minutes in our experiment) and thesame duration of one week. Concerning the Short Time Experiment, we can’t really relate totheir experiment, as the frequency we used was much higher (10 seconds). We have actuallyperformed the experiment with such a high frequency because, first of all, we noticed thatthe RSS values measured by two fast (5-10 seconds) consecutive scans were different, and wewere also addressed of this problem by Scientific Assistant R. Hansen, which is working in ourdepartment on algorithmic strategies to improve Geolocation using Fingerprinting [26].
In the following paragraphs we show the similarities and the differences among our experi-ments’ conclusion and the ones from Redpin
Similarities
• Different network cards present different variations.
• The patterns are different. From a room one could receive a pattern and from anotherroom the pattern could be different. We experienced the same with two laptop receivingthe same AP’s RSS from the same point.
• High long-term variations during the morning. We noticed the same, even with the pres-ence of the Cisco System (see Section 4.1).
Differences
• Their results are more stable than ours on long-term variations, because in our experimentsthe signals are affected by the university’s Cisco system, which rises or lowers the singleAP’s signal power depending on network load and usage.
• They do not talk about the AP disappearance problem, either they did not experience it,or they just did not notice it. In our case, it is important to take it into account, because,as in each room we usually sniff 2, 3 or 4 APs, one completely missing AP can make thedifference while performing the Geolocation.
44

Figure 4.4: Short Time Experiment, snapshot of the mass distributions of the data measured in 2hours from AP1, by the Laptop and the SMC network cards (around 1000 measurements).Vertical axis: scale of observed RSS values - Horizontal axis: number of time a particularRSS value has been observed.
Figure 4.5: Long Time Experiment, snapshot of the mass distributions of the data measured in oneweek from AP2 by the Laptop, and from AP3 by the SMC network card (around 5000measurements). Vertical axis: scale of observed RSS values - Horizontal axis: number oftime a particular RSS value has been observed.
45

• We measure short time variations even in less than a minute.
• As the RSS variance heavily depends on the Network card used, it is important to makethings clear about which network card is being used for measuring. It is not clear in theirexperiment.
4.2 The basic sniffer application on Android
Why we carry out this experiment In order to be able to implement a Geolocationapplication under Android, we had to know if some WiFi sniffing tools were available. In fact,we could have implemented our own sniffing tool but this would have been a long and hardwork.After searching for a while the Android website, we found a WifiManager that is able to detectall the APs surrounding the device. So we decided to look for some example of this tool in orderto see what information we would be able to retrieve thanks to it.The best example we found [23] was listing all the configured networks on the device. We thenmodified it a little in order to make it list all the available APs. Thanks to this simple example,we were able to see that it was possible to retrieve the MAC addresses, the RSS and the namesof the networks, as we can see in Figure 4.6.
Figure 4.6: Screenshot of the experiment
46
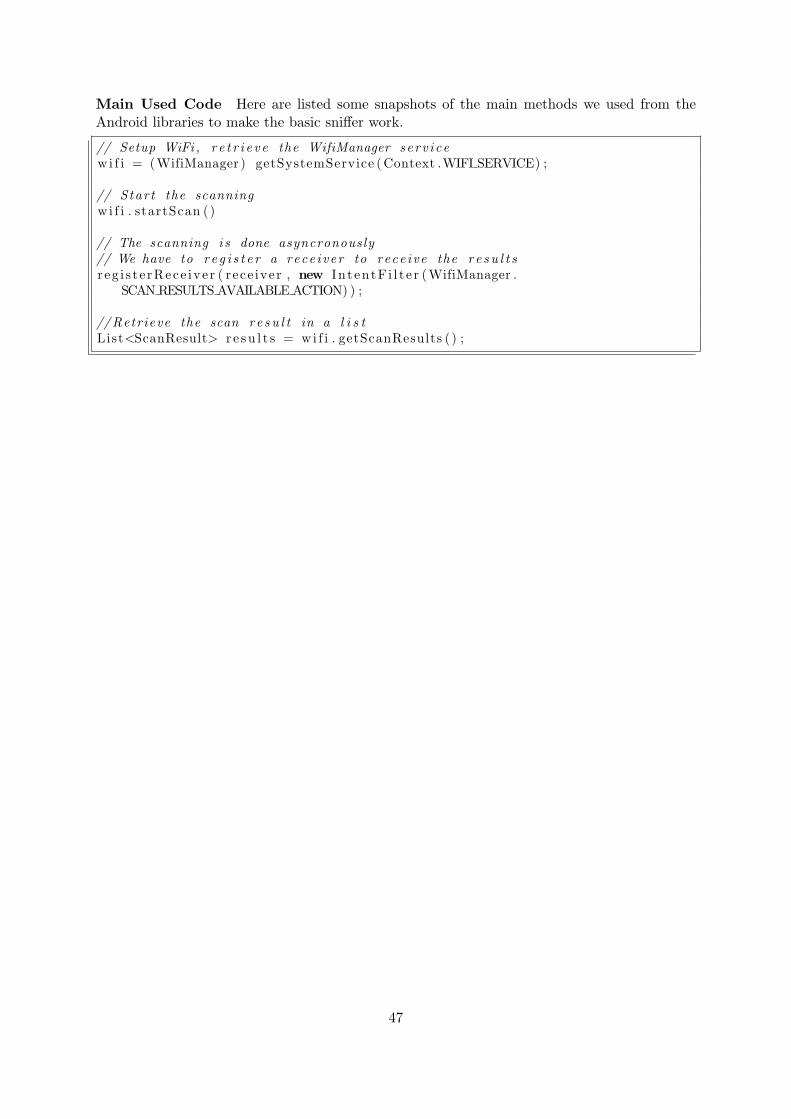
Main Used Code Here are listed some snapshots of the main methods we used from theAndroid libraries to make the basic sniffer work.
// Setup WiFi , r e t r i e v e the WifiManager serv i cew i f i = (WifiManager ) getSystemService ( Context .WIFI SERVICE) ;
// Start the scanningw i f i . startScan ()
// The scanning i s done asyncronously// We have to r e g i s t e r a rece iver to rece ive the r e s u l t sr eg i s t e rRece ive r ( rece iver , new In t entF i l t e r (WifiManager .
SCAN RESULTS AVAILABLE ACTION) ) ;
// Retrieve the scan r e s u l t in a l i s tList<ScanResult> r e s u l t s = w i f i . getScanResults ( ) ;
47

Chapter 5
Design
In this chapter we show the decisions we made based on the notions presented in the previousprerequisites Chapter 3 and on the practical experience given by the experiments reported inChapter 4. The structure of the chapter follows the same scheme as before: first, the Designchoices and reasons for the Geolocation part are presented, then, in the following section, thesame information are provided for the chat system.
5.1 Indoor Geo-positioning on a smartphone: Feasible approach
After the overview given on the broad topic of Geolocation, we can focus on the technologiesand methodologies which could fit our scenario: Indoor Geolocation on a Smartphone.
5.1.1 Feasible Technologies
First of all, concerning the technologies, we were interested in picking only the ones widelyavailable on modern smartphones. As of today (2010), smartphones from different manufactur-ers are usually equipped with GPS, WiFi, GSM and Bluetooth. That means, if we look backat Figure 3.1, we can see that all the UWB, proprietary solutions and the RF family are notattractive in our case; the remaining choices can be seen in Figure 3.3.
Moreover, we have a requirement concerning indoor positioning, that means we would liketo achieve a room-resolution location, preferably less than 10 meters. This choice curtails downthe options to actually only one family: the WiFi technology. The GSM family, even thoughit overlaps the WLAN technologies in a small zone of the diagram as we can see in Figure 5.1,is discarded because it only retrieves an accuracy of 10 meters on the border of its scope; thatmeans one would try to implement a state of the art GSM location system, integrating the mostreliable methodology, just to reach the goal of the 10 meters accuracy. Thus, we will focusour attention on the WiFi network, namely on the access points antennas carryingits signals.
5.1.2 Feasible Methodologies
Of the three main methodologies outlined in Section 3.1.1.3, two are actually the real competi-tors: Triangulation and Scene Analysis (Fingerprinting). The third solution, the Proximity,although very simple, provides an accuracy which is surely lower than the other two. This isbecause, taking into account only one antenna, it will retrieve the same position for all thepoints in its range, and sometimes antennas are placed very far from each other, definitivelymore than 10 meters.
48

Figure 5.1: Overlap zone between WLAN and GSM technologies. GSM reaches a 10 meter resolution,equivalent to the WLAN, only at the border of its scope.
Triangulation versus Scene Solution (Fingerprinting) Comparing the requirements wehave shown in Chapter 2 with the methodologies description provided in Section 3.1.1.3, weoutline the following results:
• Triangulation needs an a-priori map with the relative or absolute positions of the accesspoints.
• Fingerprinting permits to deploy the system without having a pre-specified map, though,it needs the participation of the user to train the system (see Redpin [11]). Moreover, usinga Database of the fingerprints on the phone, the users can asynchronously participate inthe deployment of the system (by collecting fingerprints in different locations), requiringno server and less administrator intervention.
• Triangulation needs to calculate the approximate distance to an access point using thereceived power of the signal (which is a source of uncertainties). Fingerprinting does not;it just compares the received values with the ones in the Database.
• Triangulation needs at least 3 access points (4 in case of floor detection) to be applied.Fingerprinting might still give a result (probably imprecise) with 2 access points.
• The experiments we made show that the RSS values can vary in average, between plus-minus 30dB on a value of 70dB, even if the device is in the same place. Retrieving adistance from these data is more difficult than just comparing these data. In both casesone needs a probabilistic model, and it seems to be a good idea to process the data aslittle as possible, as every mathematical or probabilistic approximation might deterioratethe possibility of getting the right location. In the Fingerprinting method there is onestep less: the calculation of the distance is not done, that means one less possible causeof errors (see Table 5.1)
Table 5.1 actually shows the steps needed by the two methodologies. The Triangulationwill always start with getting or making a precise map of the building, providing the exact
49

position of the antennas, either in terms of GPS or just the position relative to the buildingsize. For the Fingerprinting method, the first step concerns the creation of a Databasecontaining several measurements (fingerprints) which will be used as a base to comparethe location observed by the user. The second step is common to both: the reading ofthe RSS value from the surrounding APs. The third step is actually present only in theTriangulation, and it retrieves (applying probabilistic methods) the distance of the APgiven its RSS. The fourth and last step is, for the first methodology, the triangulationof the position using at least three known points while for the Fingerprinting it concernsthe lookup and comparison operation in the Database containing the list of fingerprintscollected in the first step.
• Fingerprinting could be implemented using a shared map between the devices and shar-ing information among them while Triangulation will usually not be in need of sharinginformation among the devices. This way, as in the Redpin project, the users could helpduring the deployment phase, requiring very few administrators’ intervention.
Phase 1 Phase 2 Phase 3 Phase 4
Triangulation Map Get RSS Estimate Distance Triangulate
Fingerprinting Create Database Get RSS - Estimation against the Database
Table 5.1: Triangulation and Fingerprinting Geolocation methodologies, the general steps needed toperform a location estimation
Even though Fingerprinting has its own drawbacks, compared to Triangulation and matchingour requirements, it seems to suit well our Geolocation system. Moreover, after having a meetingwith a scientific assistant, Rene Hansen, who is working in our department on algorithmicstrategies to improve Geolocation using Fingerprinting [26], we were able to point out somemore features favoring Fingerprinting. We report them here.
• On the question of why the Redpin project [11] uses an easy algorithm to calculate the clos-est fingerprint, while we have reviewed several different methodologies concerning prob-ability and mathematical equations, and whether it is better to use the same approachas Redpin or to focus on the more formal and known approaches, he pointed out that inthe last decade everybody was focusing on getting the best possible accuracy, hence prob-abilistic methodologies and mathematical approaches flourished in several studies. Butsometimes this approach is not worth the effort, especially in common practical applica-tions where an accuracy of 4 or 5 meters is still considered room-accuracy. Thus the focusmoved more on the real life applications and the functionalities, which do not require aparticular accuracy as far as the system accomplishes its task. Hence, it is fine to use asimple algorithm if it provides the necessary accuracy and gives good practical results.
• On the matter of why the Fingerprinting methodology is being preferred to Triangulation,he pointed out that Triangulation is usually less precise than Fingerprinting, for one mainreason: its exact calculation of the location relies on data which are not exact. Actuallythese data are estimated as distances over the RSS values received from the differentAPs. If there is no a line of sight (our case) these data are highly changeable, that meansestimated distances themselves will be highly changeable, resulting in a highly changeable
50
final location. The Fingerprinting instead, gets the same highly changeable RSS data, butit does not retrieve a distance from them, it only compares them with the other availablefingerprints in the Database. Moreover, the officer of the building will not always be ableto provide the position of all the access points in the building.
5.1.3 The Design of the Fingerprinting system
Our Fingerprinting system will be composed of 4 main components. Here we introduce themone by one and then we report the use case diagram to highlight the possible user’s interactionswith the system, and the sequence diagrams of the main activities, namely, the addition of anew fingerprint in the Database and the retrieving of the user’s position. Moreover, not listed asa stand-alone component (but just referenced as part of the GUI) there is the user’s interventionwhich plays an important role to make the system work.
• Android GUI - retrieving the results and receiving user’s inputs
• Sniffer - sniffes the available APs and their RSS, to get the current fingerprint. Thiscomponent is very similar to the one described in the experiments section (see Section4.2)
• Fingerprinting Database - to store the fingerprints for further analysis
• Algorithm - to compare current fingerprint with the Database’s entries
5.1.3.1 Android GUI and the user intervention
The simple GUI we have created shows on the mobile the options that a user have concerning theGeolocation: insert a new fingerprint and retrieve its position. As explained in the prerequisitesin Section 3.1.1.3 about the Fingerprinting methodology, we need an offline and online phase.To keep these two phases as less separate as possible (in order to make the system usable rightaway), we use the user’s intervention to build a Fingerprinting Database. The user, in orderto be able to use the system in a particular location, has to insert some fingerprints of thatlocation in the Database. This procedure is shown by the sequence diagram in Figure 5.2. Theobjects that we do not describe here as main components are just objects which are supposedto help during the sequence, and are not playing an important role. At first, the user will pressthe button in the GUI (MainActivity) concerning the insertion of a new fingerprint. Then theapplication will ask him to insert a new name for the location. After having inserted the name,a scan will be started and a new fingerprint will be created in the Database, containing thename of the location plus the list of APs and relative RSS values currently sniffed. So far, in oursystem, we do not address any ways to check the validity and the accuracy of the data providedby the user. This could be added later on with an input checking and maybe some standardizedways to input the names of the rooms, corridors, entrances etc. The second functionality, theretrieval of the user position, is shown in Figure 5.3. The user clicks on the button “Where amI” on the GUI and a sniffing procedure will start, obtaining the currentFingerprint of theuser’s location. The currentFingerprint will be given to the AlgorithmPerformer which willread all the fingerprints in the Database, compare them with the currentFingerprint (seeSection 5.1.3.4 for details about the algorithm), and give back the estimated location.
5.1.3.2 Database Design Possibilities
Need For Database As we saw before, we want to store the fingerprints in the phone. Thereare several solutions to do so. The first one would be to write all the data into a file and search
51
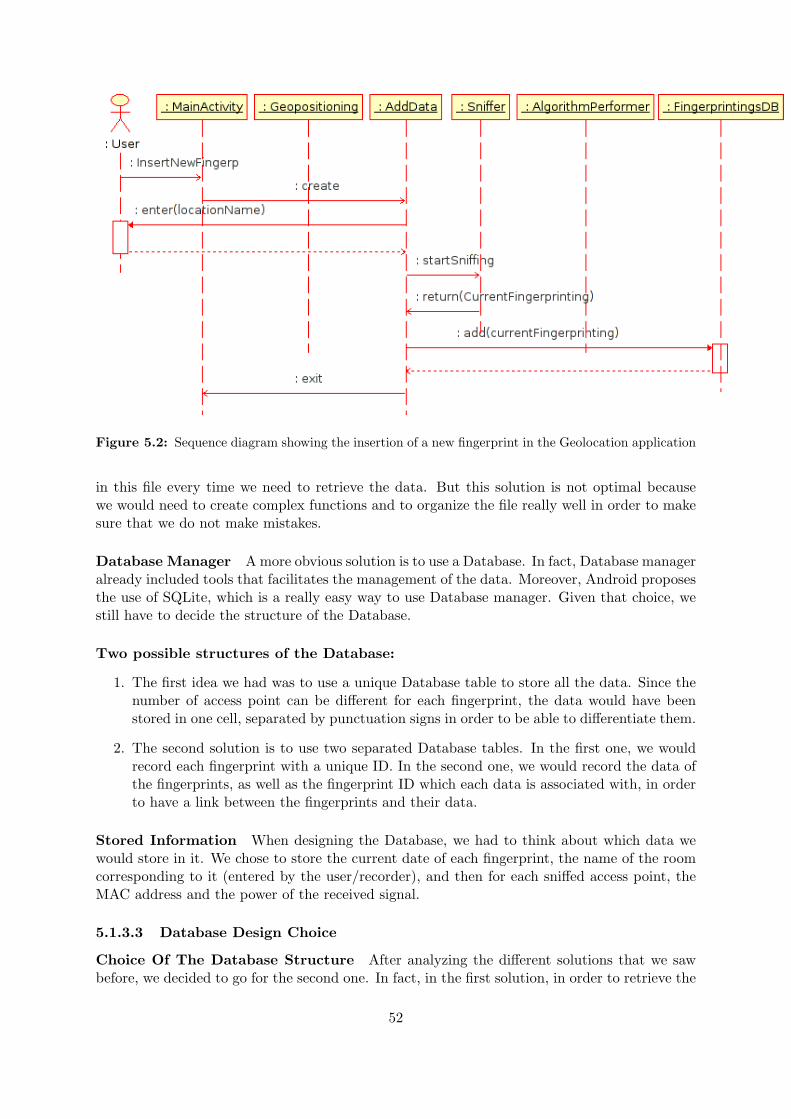
Figure 5.2: Sequence diagram showing the insertion of a new fingerprint in the Geolocation application
in this file every time we need to retrieve the data. But this solution is not optimal becausewe would need to create complex functions and to organize the file really well in order to makesure that we do not make mistakes.
Database Manager A more obvious solution is to use a Database. In fact, Database manageralready included tools that facilitates the management of the data. Moreover, Android proposesthe use of SQLite, which is a really easy way to use Database manager. Given that choice, westill have to decide the structure of the Database.
Two possible structures of the Database:
1. The first idea we had was to use a unique Database table to store all the data. Since thenumber of access point can be different for each fingerprint, the data would have beenstored in one cell, separated by punctuation signs in order to be able to differentiate them.
2. The second solution is to use two separated Database tables. In the first one, we wouldrecord each fingerprint with a unique ID. In the second one, we would record the data ofthe fingerprints, as well as the fingerprint ID which each data is associated with, in orderto have a link between the fingerprints and their data.
Stored Information When designing the Database, we had to think about which data wewould store in it. We chose to store the current date of each fingerprint, the name of the roomcorresponding to it (entered by the user/recorder), and then for each sniffed access point, theMAC address and the power of the received signal.
5.1.3.3 Database Design Choice
Choice Of The Database Structure After analyzing the different solutions that we sawbefore, we decided to go for the second one. In fact, in the first solution, in order to retrieve the
52

Figure 5.3: Sequence diagram showing the steps needed to retrieve the user’s location
data of one fingerprint, it would have been necessary to load all of them into the RAM memorybefore being able to use them while the second solution allows us to make queries for particulardata without having to retrieve the other ones.
ID Date Room
0 10/10/2010 0.1.12
1 23/10/2010 1.0.1
2 29/10/2010 Cafeteria
3 11/11/2010 1.0.5
Table 5.2: Example of the Database table used to store the fingerprints
5.1.3.4 Positioning Algorithm
Here we will describe the algorithm that we will use to determine the position of the user. Thisalgorithm has been inspired by the algorithm used in the Redpin project [11]. It compares ascan of the access points which has been performed right before, and the data of the scansstored in the Database (the fingerprints). The goal is to give points to the fingerprints in theDatabase to determine which one matches the best the current position of the user. The pointsare given by comparing the strength of the signals, and the number of sniffed access points.Here are the three main points that will compose this algorithm:
• Retrieve all the fingerprints that contain identical access points
53
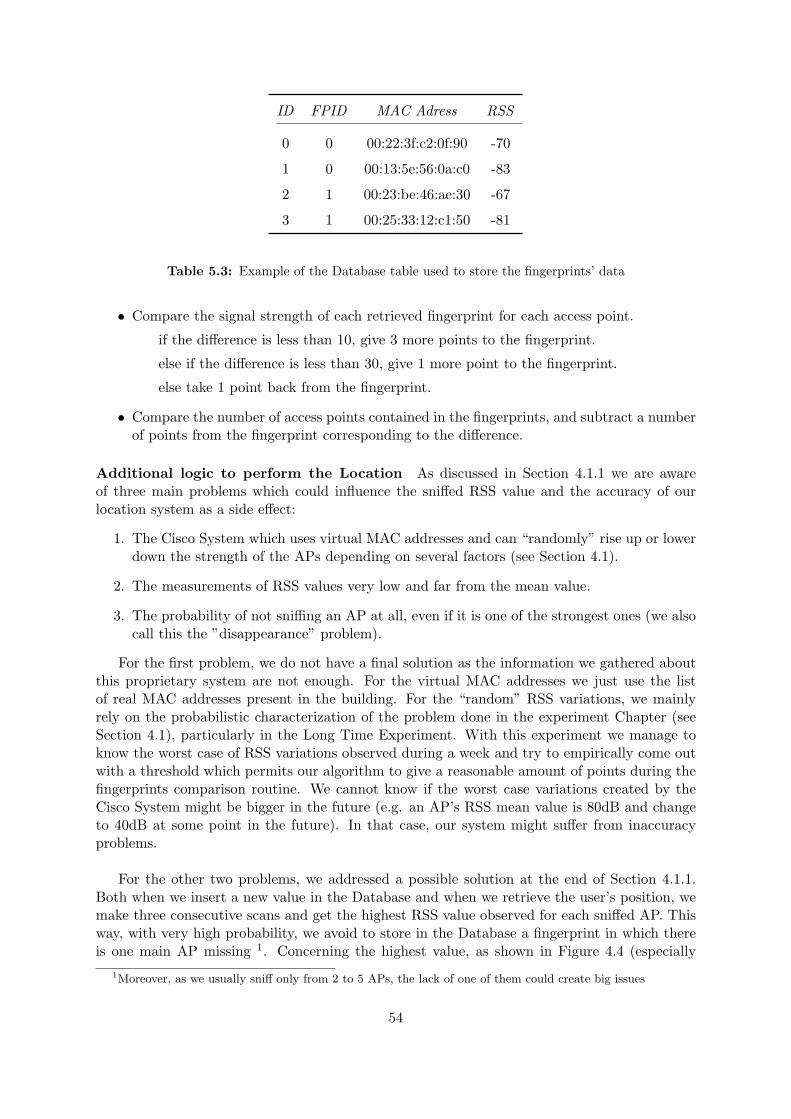
ID FPID MAC Adress RSS
0 0 00:22:3f:c2:0f:90 -70
1 0 00:13:5e:56:0a:c0 -83
2 1 00:23:be:46:ae:30 -67
3 1 00:25:33:12:c1:50 -81
Table 5.3: Example of the Database table used to store the fingerprints’ data
• Compare the signal strength of each retrieved fingerprint for each access point.
if the difference is less than 10, give 3 more points to the fingerprint.
else if the difference is less than 30, give 1 more point to the fingerprint.
else take 1 point back from the fingerprint.
• Compare the number of access points contained in the fingerprints, and subtract a numberof points from the fingerprint corresponding to the difference.
Additional logic to perform the Location As discussed in Section 4.1.1 we are awareof three main problems which could influence the sniffed RSS value and the accuracy of ourlocation system as a side effect:
1. The Cisco System which uses virtual MAC addresses and can “randomly” rise up or lowerdown the strength of the APs depending on several factors (see Section 4.1).
2. The measurements of RSS values very low and far from the mean value.
3. The probability of not sniffing an AP at all, even if it is one of the strongest ones (we alsocall this the ”disappearance” problem).
For the first problem, we do not have a final solution as the information we gathered aboutthis proprietary system are not enough. For the virtual MAC addresses we just use the listof real MAC addresses present in the building. For the “random” RSS variations, we mainlyrely on the probabilistic characterization of the problem done in the experiment Chapter (seeSection 4.1), particularly in the Long Time Experiment. With this experiment we manage toknow the worst case of RSS variations observed during a week and try to empirically come outwith a threshold which permits our algorithm to give a reasonable amount of points during thefingerprints comparison routine. We cannot know if the worst case variations created by theCisco System might be bigger in the future (e.g. an AP’s RSS mean value is 80dB and changeto 40dB at some point in the future). In that case, our system might suffer from inaccuracyproblems.
For the other two problems, we addressed a possible solution at the end of Section 4.1.1.Both when we insert a new value in the Database and when we retrieve the user’s position, wemake three consecutive scans and get the highest RSS value observed for each sniffed AP. Thisway, with very high probability, we avoid to store in the Database a fingerprint in which thereis one main AP missing 1. Concerning the highest value, as shown in Figure 4.4 (especially
1Moreover, as we usually sniff only from 2 to 5 APs, the lack of one of them could create big issues
54

concerning the Laptop results) and in the Appendix in Figure 7.5, we count on the fact thatthe distribution bell is not perfectly balanced, but is actually inclined with its mean toward thehighest RSS values. Thus, the highest value should be the closest to the ”real” mean. Thistechnique should give us good accuracy on the short term, but we cannot be sure to be ableto overcome the problems introduced by the Cisco System over the long term. For example, asshown in Figure 7.6, during the long term the Cisco System introduces different peaks whichrepresent several highest RSS values that an AP has had during the whole week.
Of course, the choice of the highest value will not be static, we will try to implement it in away that it could be changed at any time, maybe by getting an average instead of a maximum.
A possible problem: the moving of the access points One last problem we havethought about during the Design phase is what would happen if an AP is moved or replaced.This is, of course, a situation which should not happen every day, but it can affect the accuracyof the system as the Fingerprinting Database will be inconsistent after the moving.
To address some possible solutions, we directly asked by mail the Redpin project authorPhilipp Bolliger [11]. He said that the current (implemented) version of Redpin only marginallytakes this into account. The basic idea of Redpin is to train the system while using it, hencethe users will train the system over a long period of time. Should the environment change,e.g. moving APs, Redpin just creates new readings and adds these to the known fingerprintof a location. As fingerprints get bigger and bigger this way, we could think of a mechanismto automatically delete old readings, more precisely the ones that contain measurements of the”old” APs. This, however, is not implemented in Redpin yet.Another possible solution has been given to us by Rene Hansen [26]. He said that it was aknown problem and different solutions might help. One of them clusters the fingerprints in theDatabase and erases the whole cluster if some new measurements addressed by the same APsare found very different from the ones in the Database. Eventually, we decided not to dig intothis matter as our main aim is to create a working Geolocation Prototype which could be latelyrefined with these solutions.
55

5.2 Chat Design
This section provides the design decisions we made for the chat part of the application. Wefirst discuss the architecture we chose, among the two main types presented in the previousprerequisites Chapter 3. Later on in the section we explore the choice of the middlewaresproviding support for the chosen architecture. We will then figure out how to merge the differenttechnologies we decided to use in order to create an efficient application.
Figure 5.4: Use case diagram of the chat system
In this use case diagram, we can notice that there are two main activities for the chat: oneuser (either a student or a teacher) will be able to:
1. see a list of available persons connected to the network.
2. communicate with a specific user of this network by reading and writing messages.
5.2.1 Feasible Chat middlewares
1. First of all, we use XMPP instead of other P2P middlewares because it provides specifictools to develop instant messaging applications.
2. Moreover, XMPP is very widely used. There is a lot of XMPP servers running on theInternet today. Google has based its own chat system on it. Being an open sourcemiddleware, XMPP takes advantage of the huge community that works hard to make itmore and more efficient, for example by building APIs for different programming languagesincluding all sorts of extensions available with this protocol. It should indeed receive moreimprovements compared to other middlewares. This community also provides help duringthe development process, such as ours, in the form of forum threads, etc.
3. All the currently available P2P protocols have been designed with a desktop environmentin mind [21]. But we are in an embedded environment, more precisely we use phonedevices so we have to use a middleware which takes care of our resources. We need thinpeers considering they are phones. According to the table of [21] we have thin peers withXMPP compared to JXTA for example. We have generally speaking better performancefor XMPP.
4. In XMPP, the support for real-time data streaming is good, which is only average forJXTA according to [21].
56

5. We have a good interoperability with other clients using XMPP. It is not the case for allmiddlewares: for example JXTA has a poor interoperability. Moreover, thanks to the helpof the community, it can be improved.
5.2.2 Feasible technologies to set up P2P networks
To use properly our middleware and to be able to launch the chat system, we need a network.Because we do not want the presence of a server at all (see Chapter 2) we have to set up anetwork composed of peers (to create the P2P network). Each of them has the same functionand will run exactly the same program. To set up this network, we have to distinguish twodifferent cases: the first one when a peer has to create the network (because it does not existyet) and the second one when peers join the network.
The XMPP middleware could allow us to create a network from the beginning to the endbut the problem is it uses an hybrid architecture (see Chapter 3) and we do not want a server inour network (even for authentication for example). So we would prefer avoiding this situationconsidering the disadvantages already evoked. As stated in the Chapter 3, the Link Localimplementation of the Smack API respects all of our needs. We thus decided to use thismodified API made by Jonas Adahl to begin our implementation.
5.2.3 Setting up the P2P chat system using XMPP and JmDNS
In this section, we will introduce the functioning of the modified API called Link Local SmackAPI. We will go through the different steps of the two main used technologies XMPP andJmDNS.
5.2.3.1 Setting up an XMPP chat system
To begin, here is the typical way of setting up an XMPP chat client:
1. Create an XMPP connection to the XMPP Server.
2. Authenticate to the XMPP Server.
3. (Server Side) Register the presence of the client.
4. (Server Side) Maintain a list of presences of the clients.
5. a Engage a discussion with another client through the server.
b Engage a direct link discussion with another client.
The sequence diagram shown in Figure 5.5 illustrates those points.
5.2.3.2 Setting up a JmDNS presence
Then, here is the typical way of setting up a JmDNS presence service:
1. Create a presence.
2. Listen to all the presences on the network.
3. Multicast our presence on the network.
4. Maintain a list of presences in the client.
The sequence diagram shown in Figure 5.6 illustrates those points.
57

!"##$%&&'()*%&"+*&,()*-*).
/%01#+(2+3'4456'7
$%&&'()1)%1)8'1(8+)16'7-*('
(7'+)'9:
,;)8'&)*(+)'9:
<')7*'-'#7'6'&('=*6)9:
7');7'6'&('=*6)9:
>*60?+.=*6)9:
#7'6'&('=*6)'&'7
#7'6'&(',>>'>@"%>*A*'>@<'B%-'>9:
7'B%-+?@+>>*&3@B%>*A*(+)*%&
<'A7'68=*6)9:
/%01#+(2+3'4456'7
C&*)*+)'1+1(8+)
6'&>$8+)C&*)*+)*%&9:
+>>9:
"'66+3'=*6)'&'7
+>>9:
C&(%B*&3"'66+3'9:
B'66+3'
>*60?+."'66+3'9:
Figure 5.5: Client Side Sequence Diagram for the setting up of a XMPP chat connection
Figure 5.6: Client Side Sequence Diagram for the setting up of a JmDNS presence discovery
58
5.2.3.3 Bypassing the XMPP server connection
Now that we do not want to have any server in the network, the goal is to bypass the 4 firststeps of setting up an XMPP chat system using the first 3 steps of the JmDNS presence tool.When the presences are set up we use the step 5b of the XMPP set up to discuss with otherclients:
1. Create a presence (JmDNS).
2. Listen to all the presences on the network (JmDNS).
3. Multicast our presence on the network (JmDNS).
4. Maintain a list of presences in the client (JmDNS).
5. Engage a direct link discussion with another client (XMPP).
5.2.3.4 Engage a direct link discussion with another client
When a chat is engaged between two clients, they engage an xml stream between themselves toexchange messages in close to real time [29]. The messages that are received are parsed by theclient to be usable for the application. In order to engage the chat here are the steps for theengaging client:
1. Listen for Chat services on the network.
2. Create a chat with the information contained in the presence of the desired client.
3. Listen for Messages on that Chat service.
4. Exchange messages.
Here are the steps for the engaged client:
1. Listen for Chat services on the network.
2. If a new chat is created listen for Messages on that chat.
3. Exchange messages.
The sequence diagram 5.5 also illustrates this discussion process.
59
Chapter 6
Implementation
6.1 Geolocation Prototype
In this section we describe the prototype of the Geolocation application.
6.1.1 Introduction
When we finished designing the different properties of the Geolocation part, we decided toimplement a first prototype in order to adjust the parameters and the decision algorithm. Thisprototype is able to record positions during an offline phase, and determines the current positionof a user during the online phase. In order to debug this program and perform the scan, theeasiest way would have been to use the Android emulator included in the Android SDK plug-infor Eclipse. But this emulator does not allow us to use the WiFi functionalities, and becausethe cell phones that we used were not made for developers, we were not able to access the filescontaining the results of the scans. So we decided to add to this prototype an activity thatwould allow us to display the scan results and to remove some records from it.
60
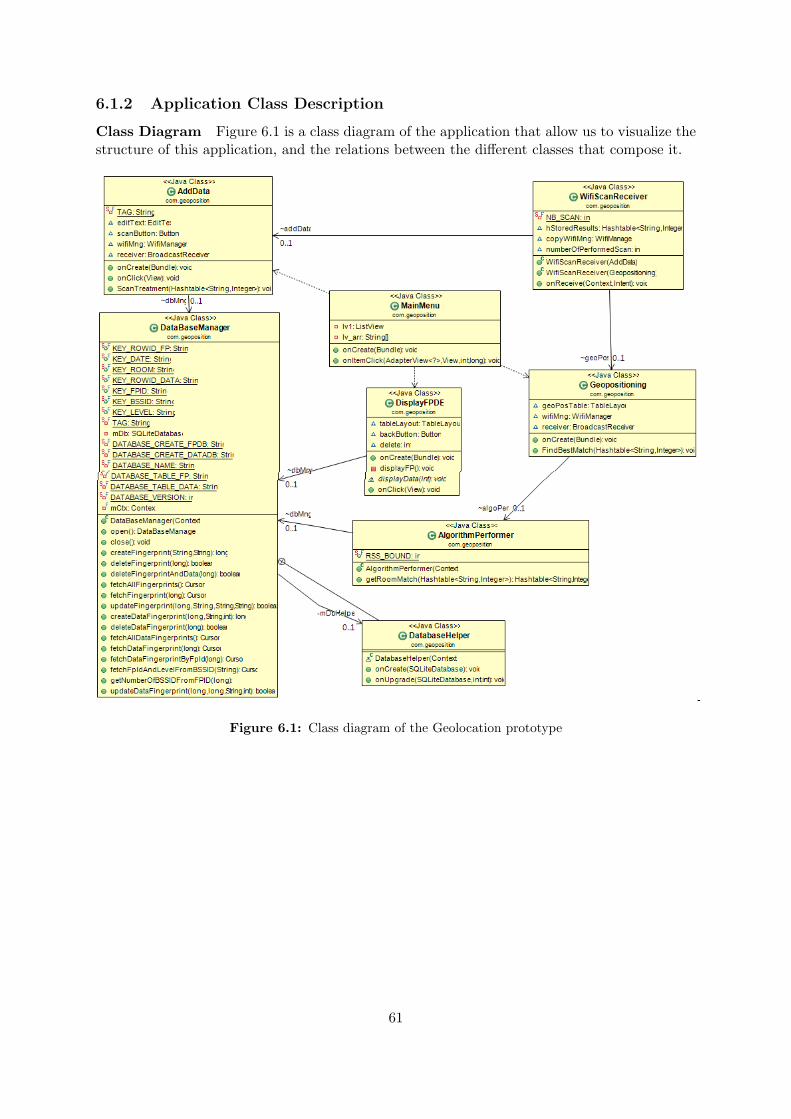
6.1.2 Application Class Description
Class Diagram Figure 6.1 is a class diagram of the application that allow us to visualize thestructure of this application, and the relations between the different classes that compose it.
Figure 6.1: Class diagram of the Geolocation prototype
61

Main Menu class This class is the entry point of the prototype. As we can see on Figure6.2, it allows the user to navigate through the different activities of the application thanks to alist.
Figure 6.2: Screenshot of the main menu of the application
Geopositioning (Geolocation) class This class is the one which performs the locationprocess. It performs a scan of the available WiFi networks and uses the AlgorithmPerformerobject to compare the current scan to the one stored in the Database. The result is given in alist of rooms that match the current position giving a specific rank . To each room is associateda grade that gives the probability of being the one in which the user is. For the final version ofthe application the user should only receive one result corresponding to the best match.
(a) Screenshot of the Geolocation ac-tivity while the application is comput-ing the position
(b) Screenshot of the Geolocation ac-tivity when giving the results
Figure 6.3: Screenshots of the Geolocation activity
62

AddData class This class is used to add fingerprints to the Database. The user has to inputa name for its current position, and click the scan button that will launch the recording process.This process is composed of scanning the available WiFi networks, and adding the results tothe Database.
Figure 6.4: Screenshot of the activity that add data to the scan
WifiScanReceiver class This class is used to receive the event corresponding to the end ofa WiFi network scan. In fact, since the scan is performed asynchronously, an object is neededto treat the end of it. This class is also used to parse the incoming data from the scan. In fact,the only data that are needed to perform the location are the BSSID (or MAC addresses) andthe RSS. This object will then only transmit these information to the other objects. In the lastimplementation of the algorithm, we also decided to perform several scans in order to preventany hardware from errors which could lead to not detecting some of the WiFi networks. Thisobject is the one which will relaunch the scan a certain amount of times. It is also in this partof the application that the parsing of the ”real MAC addresses” is performed. In fact, we sawthat the access points of the university are creating some virtual MACs that do not correspondto our APs, so we had to select only the real ones in order to avoid any issues.
scanManager class This class manages all the scan functionalities. It is used to create thescan and the tables, to add, delete or retrieve data from these tables. Several functions havebeen implemented in order to be able to retrieve different data from different arguments.
DisplayFPDB class This class has been created for debugging purposes, in order to be ableto display the scan, and to delete some of the records from it. When in ”display mode”, the clickon one of the items of the displayed list of fingerprints will show the associated data. When in”deleting mode”, the click on one of these items will delete the fingerprint and all the associateddata.
63

(a) Screenshot of the activity that displaysthe fingerprints contained in the scan, andallows to delete them
(b) Screenshot of the activity that displaysthe data of the fingerprints contained in thescan
6.1.3 Positioning Algorithm
This Section describes more deeply the positioning algorithm that is used to calculate theposition of a user. The way of attributing points to fingerprints can be seen in Section 5.1.3.4.
i n i t i a l i z e numberOfAPInScan to the number of access points detected by the scani n i t i a l i z e c l o se s tF ingerpr int to −1i n i t i a l i z e f ina lL i s tOfF ingerpr int s a hashtable of <Fingerprint , score> pa i r s
FOR each access point detected by the scan
l i s tOfF inge rpr in t s = a l l the f i ng e rp r i n t s from the database containingthe current access point
FOR each f inge rp r in t in l i s tOfF inge rpr in t s
c lo se s tF ingerpr in t = check i f the l e v e l o f the currentf i nge rp r in t i s c l o s e r than the previous one , i f yes , update
c lo se s tF ingerpr in t
attr ibutePointsToFingerprint ( f i nge rp r in t )ENDOFFOR
UPDATE close s tF ingerpr in t in f ina lL i s tOfF ingerpr int with score =current score + 1
ENDOFFOR
FOR each f inge rp r in t in f ina lL i s tOfF ingerpr int s
UPDATE f inge rp r in t with score = current score − ( absolute value of (number of access points in f i nge rp r in t − numberOfAPInScan )
ENDOFFOR
64

6.2 Peer-to-Peer Chat Prototype
6.2.1 Introduction
For the implementation part of the P2P chat system, we went through several issues. In order totarget the source of these issues, we implemented 3 main prototypes which are described in thissection. The aim of having those prototypes is to make sure that the multicast is functional onAndroid phones with the Android OS and the university network as a requirement for XMPPLink Local, then to make sure that the Link Local Smack API is fully usable and finally tomake sure that JmDNS works also on Android OS.
6.2.2 First Prototype: Multicast Issues on Android Phones and the Univer-sity network
6.2.2.1 Multicast Issues on Android Phones
When we conducted the research about the different usable tools, and chose JmDNS among themwe discovered that a lot of Android developers did not manage to make a proper applicationdue to the fact that Multicast has a lot of problems on Android. It appeared that the OS itselfand for certain cases the phones refused to use Multicast.
Why we implemented this prototype The main tool to use JmDNS is the Multicast,indeed all the services provided for that tool use a Multicast socket and Datagram Packagessent through that socket. It is thus very important that that functionality can be provided bythe Android OS. Being a Java based OS, it is probable that thes tools are usable for Android.Since the problems were mainly encountered for old Android OS (mainly 1.0 and 1.5) we wantedto see if they remained on the newest versions of Android.
Deployment This program is aimed at being really simple and only uses the basic require-ments of the multicasting under Android. We based our implementation on an example programfound on theInternet [5]. We decided to implement a little program aiming at sending and re-ceiving messages through a Multicast socket between our two evaluation phones:
• HTC Hero, firmware version: 2.1-update1, software version: 3.32.405.1.
• HTC Wildfire, firmware version: 2.1-update1, software version: 1.25.405.1.
The Multicast Lock Normally the WiFi stack filters out packets not explicitly addressedto one device. This is why Android provides a Multicast lock that allows the user to useMulticast by acquiring it as the following code shows:
WifiManager w i f i = ( WifiManager ) getSystemService ( Context .WIFI SERVICE ) ;mcLock = w i f i . createMulticastLock (”mylock”) ;mcLock . acquire ( ) ;
This basically counters the first issue of the Multicast not functioning by unlocking it. Then,we just initiate a TextEdit and a Button in order to get the message and send it. We use thefollowing code in the onClickListener of the button:
Str ing msg = et . getText () . toStr ing () ;socket . send (new DatagramPacket (msg . getBytes ( ) , 0 , msg . getBytes ( ) . length ,
InetAddress . getByName(” 224 .0 .0 .174 ”) , 5353) ) ;
65
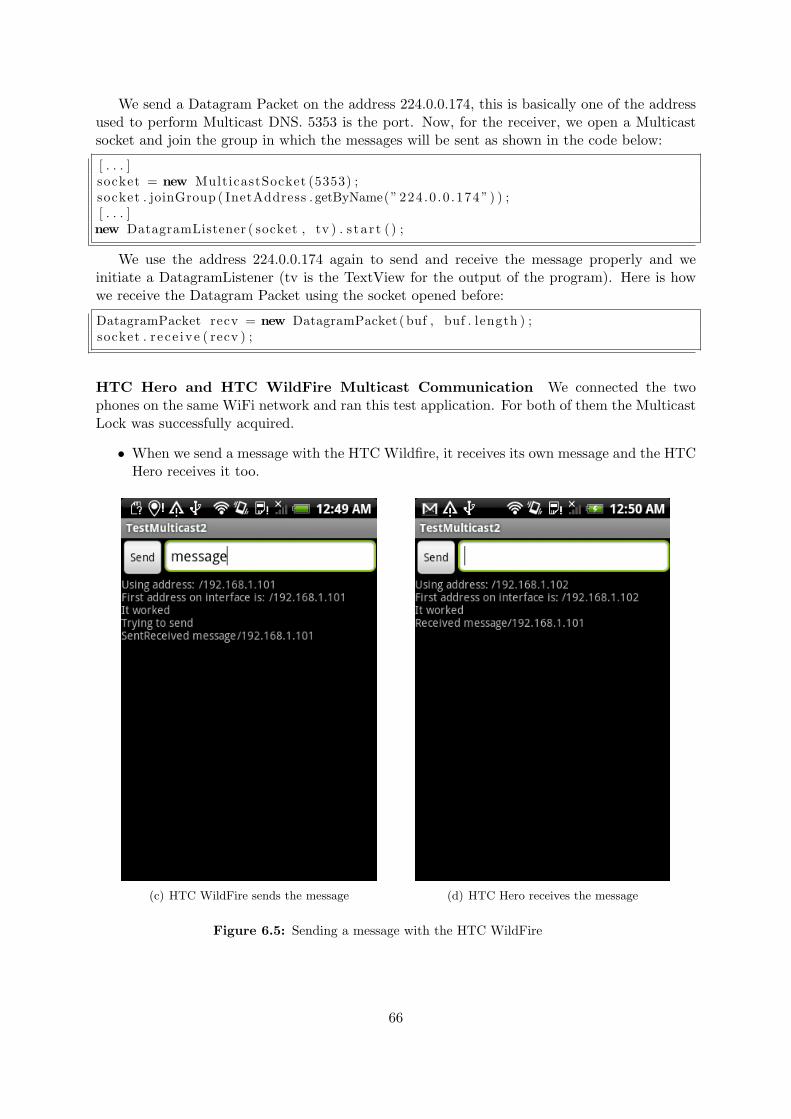
We send a Datagram Packet on the address 224.0.0.174, this is basically one of the addressused to perform Multicast DNS. 5353 is the port. Now, for the receiver, we open a Multicastsocket and join the group in which the messages will be sent as shown in the code below:
[ . . . ]socket = new MulticastSocket (5353) ;socket . joinGroup ( InetAddress . getByName(” 224 .0 .0 .174 ”) ) ;[ . . . ]new DatagramListener ( socket , tv ) . s ta r t ( ) ;
We use the address 224.0.0.174 again to send and receive the message properly and weinitiate a DatagramListener (tv is the TextView for the output of the program). Here is howwe receive the Datagram Packet using the socket opened before:
DatagramPacket recv = new DatagramPacket ( buf , buf . length ) ;socket . r ece ive ( recv ) ;
HTC Hero and HTC WildFire Multicast Communication We connected the twophones on the same WiFi network and ran this test application. For both of them the MulticastLock was successfully acquired.
• When we send a message with the HTC Wildfire, it receives its own message and the HTCHero receives it too.
(c) HTC WildFire sends the message (d) HTC Hero receives the message
Figure 6.5: Sending a message with the HTC WildFire
66

• When we send a message with the HTC Hero, it receives its own message but the HTCWildFire does not receive any message.
(a) HTC Hero sends the message (b) HTC Wildfire does not receive the message
Figure 6.6: Sending a message with the HTC Hero
In order to know if the problem was coming from the HTC Hero or the HTC Wildfire, weran an experiment with Wireshark, a network protocol analyzer [40]. This experiment showedus that the HTC Hero successfully sent its message, the problem thus seems to come from theHTC WildFire. After a lot of research, we managed to see that the problem comes from a filecalled ”wpa supplicant” in the HTC WildFire (and other phones such as the HTC Desire [35]).It is the daemon program that controls the wireless connection. For the WildFire, this wpasupplicant does not allow the reception of Multicast messages. Since JmDNS is working withservices and service discovery, in order to discover services, we need Multicast questions andanswers. This is why it is impossible to run JmDNS on HTC WildFire, and apparently withsome similar other devices.
HTC Hero and Computer Multicast Communication We connected the phone andthe computer on the same WiFi network and ran this test application on the HTC Hero. Weimplemented also a little Java program that does exactly the same thing.
• When we send a message with the computer, it receives its own message and the HTCHero receives it too
• When we send a message with the HTC Hero, it receives its own message and the computerreceives it too
67

We could thus conclude that the P2P chat that we want to implement can be done on theHTC Hero using a Java application to test it.
Peer-to-Peer chat for Android ? These experiments showed us that if such an applicationcan be built, some devices will not manage to run it and it brings a problem of consistency.Indeed, this application is aimed to be used by all the students of the university whatever phonethey are using. And it happens that if one of them has a ”non working” wpa supplicant he willnot be able to use it.
Possible solution In order to solve the problem of Multicasting there are several possibilitiesthat could be implemented. One of them would be to use an election algorithm. The principleis to isolate two entities in the network.
Election Algorithm Example: Bully Algorithm This solution is based on an electionalgorithm [33]. The goal is to elect a master that will have the role of coordinator of the ”workingphones” entity. The election requirements are:
• E1: (safety) A participant process pi has either electedi = ⊥, or electedi = p, where p isthe non-crashed process having the largest process identifier.
• E2: (liveness) All processes pi participate and will at some point in time set their electedi
variable to a value different from ⊥ or crash.
• ⊥ = undefined.
One of these algorithm is called the bully algorithm, it is based on the election of a coordinatorbased on the process ID. Indeed when the coordinator fails, an election is initiated. This is howan election is done [37]:
1. p sends an election message to all processes with higher numbers.
2. If no one responds, p wins the election and becomes coordinator.
3. If one of the higher-ups answers, it takes over. p’s job is done.
The idea is to select the process with the largest identifier as the coordinator:
1. When a process p detects that the coordinator is not responding to requests, it initiatesan election:
2. If a process receives an election message from a lower numbered process at any time, it:
a sends an OK message back.
b holds an election (unless it is already holding one).
3. A process announces its victory by sending all processes a message telling them that it isthe new coordinator.
4. If a process that has been down recovers, it holds an election.
The Figure 6.7 is an example of the bully algorithm, the process 7 being the coordinatorand having failed.
68
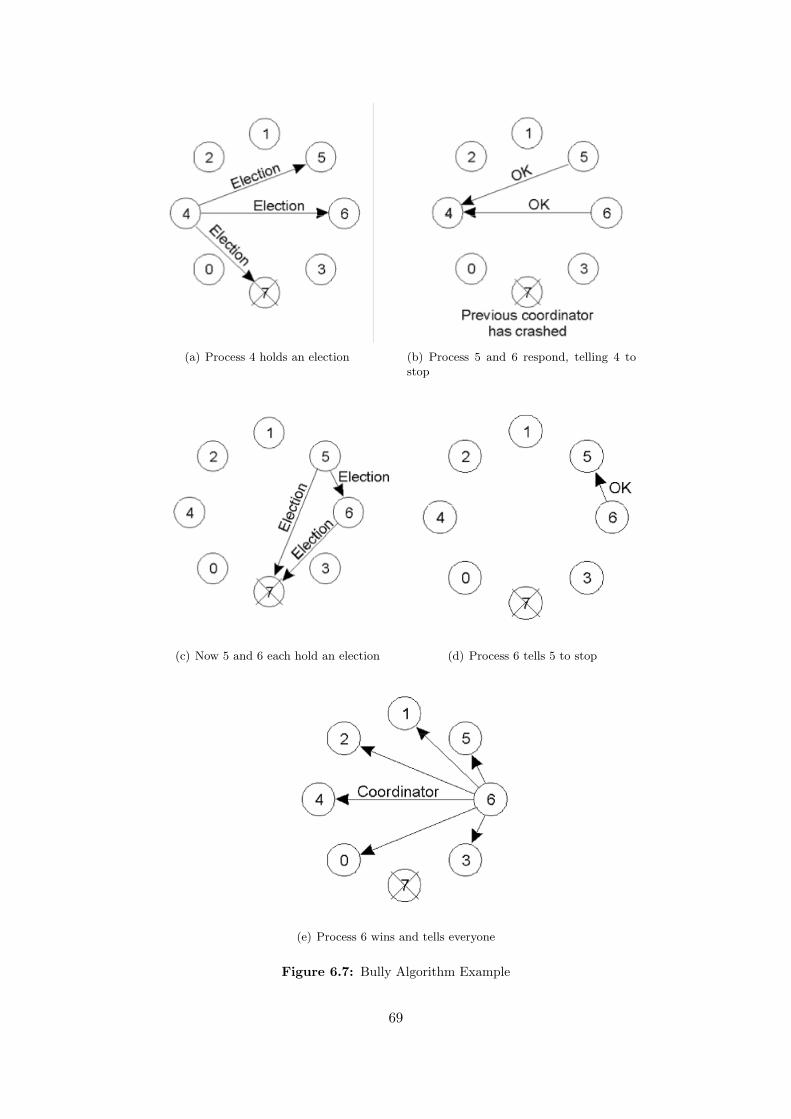
(a) Process 4 holds an election (b) Process 5 and 6 respond, telling 4 tostop
(c) Now 5 and 6 each hold an election (d) Process 6 tells 5 to stop
(e) Process 6 wins and tells everyone
Figure 6.7: Bully Algorithm Example
69
”Working Phones” Entity Inside this entity we will use the election algorithm (ring-based algorithm, bully algorithm, etc.) to elect a master. This master will be the central guideof all the ”non working” phones. Indeed, every peer, and so the master, possess a list of the”non working” phones models. We can add the field ”model” in the presence of each peer forthe master to retrieve it and check if it is in the list or not. If it is not, it will act normally andrespond to the service discovery. On the other hand if it is, we begin the process of sendinginformation. Based on the fact that a working peer knows about the presence of everyone in thenetwork, the master will send, in an unicast way, the presences to the ”non working” phones.As every peer of this entity will receive the adding and the removing of the presence of a peerfrom the ”non working” phone entity, each and everyone of them possess the list of the ”nonworking” phones on the network. Thus when the master crashes, the new elected master wouldhave all the tools to take its place.
”Non Working Phones” Entity The peers of that entity will just send their presencewhen they arrive on the network with their phone model and receive the information about thenetwork from the master of the working phones entity so a user of a ”non working” phone isable to see the presence of everyone and chat with them.
Connection between ”Non Working Phones” and the master Here are the differentsteps that should be followed by the network in order to establish a connection between the”non working” phones and the master.
• When the master is elected, it runs a TCP server in order to be able to establish apersistent connection with the ”non working” phones to send them presence modifications.
• A ”non working” phone multicasts its presence to the mDNS network, and listens for aunicast response from the master.
• The master detects that a ”non working” phone appeared in the network, and sends amessage to it to give its network address.
• The ”non working” phone receives the information from the master and establishes a TCPconnection with it as a client, in order to receive all the presence modifications that couldoccur in the network.
70
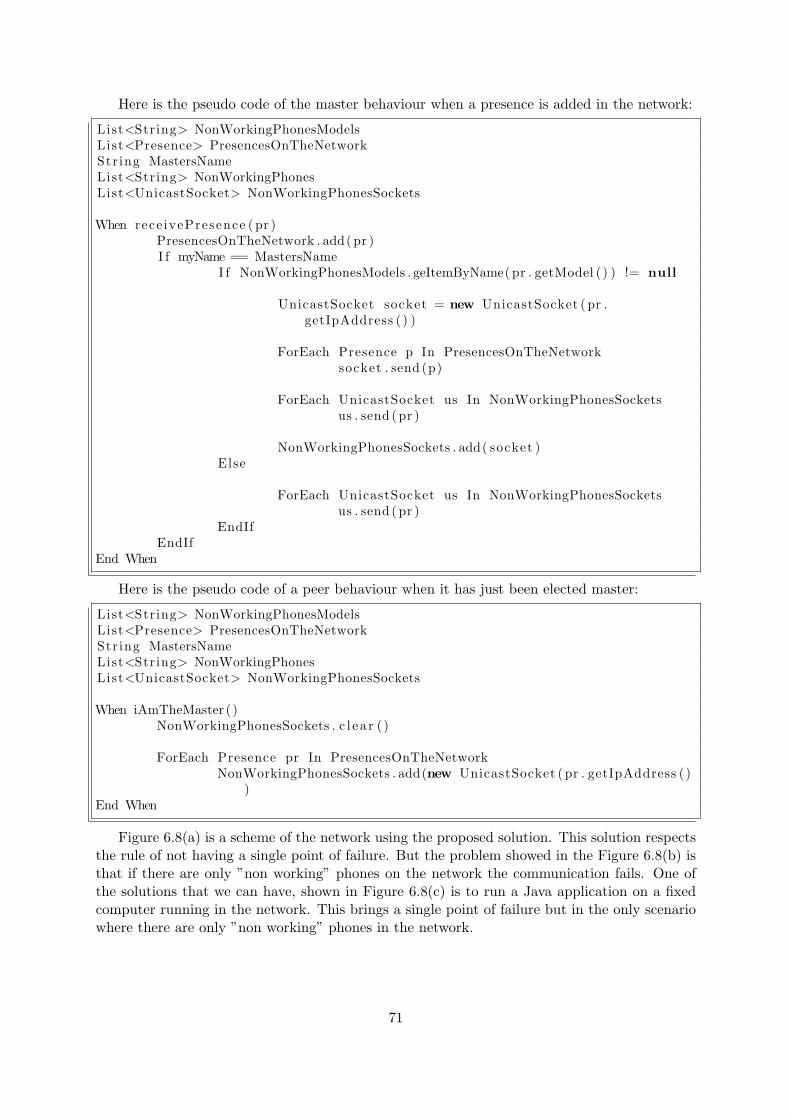
Here is the pseudo code of the master behaviour when a presence is added in the network:
List<String> NonWorkingPhonesModelsList<Presence> PresencesOnTheNetworkStr ing MastersNameList<String> NonWorkingPhonesList<UnicastSocket> NonWorkingPhonesSockets
When rece ivePresence ( pr )PresencesOnTheNetwork . add( pr )I f myName == MastersName
I f NonWorkingPhonesModels . geItemByName( pr . getModel ( ) ) != null
UnicastSocket socket = new UnicastSocket ( pr .getIpAddress ( ) )
ForEach Presence p In PresencesOnTheNetworksocket . send (p)
ForEach UnicastSocket us In NonWorkingPhonesSocketsus . send ( pr )
NonWorkingPhonesSockets . add( socket )Else
ForEach UnicastSocket us In NonWorkingPhonesSocketsus . send ( pr )
EndIfEndIf
End When
Here is the pseudo code of a peer behaviour when it has just been elected master:
List<String> NonWorkingPhonesModelsList<Presence> PresencesOnTheNetworkStr ing MastersNameList<String> NonWorkingPhonesList<UnicastSocket> NonWorkingPhonesSockets
When iAmTheMaster ( )NonWorkingPhonesSockets . c l ea r ( )
ForEach Presence pr In PresencesOnTheNetworkNonWorkingPhonesSockets . add(new UnicastSocket ( pr . getIpAddress ( )
)End When
Figure 6.8(a) is a scheme of the network using the proposed solution. This solution respectsthe rule of not having a single point of failure. But the problem showed in the Figure 6.8(b) isthat if there are only ”non working” phones on the network the communication fails. One ofthe solutions that we can have, shown in Figure 6.8(c) is to run a Java application on a fixedcomputer running in the network. This brings a single point of failure but in the only scenariowhere there are only ”non working” phones in the network.
71

(a) Election Algorithm Solution
(b) Election Algorithm Solution Failure Scenario, only”non working” phones are present in the network
(c) Election Algorithm Solution Failure Scenario: possiblesolution, a Java application running on a machine in the”working phones” entity
Figure 6.8: Election Algorithm Solution Scheme
72
6.2.2.2 Multicast Issues on the University Wireless Network
Why we carry out this experiment Not only does the Multicast needs to work on Androidphones, it also have to work on the university network for the application to be completely usableby the students inside the university.
Deployment We ran the same Multicast test Java program on two computers using thenetwork AAU-1x.
Observations We had absolutely no signs of messages received or sent on both of the appli-cations, the universitynNetwork seems to not allow the Multicast or broadcast at all.
Possible solution One of the main possible solution is to create a WiFi network like AAU-1xthat allows Multicast.
6.2.3 Second Prototype: Using the Link Local Smack API
After having chosen to use Link Local XMPP using JmDNS services, we decided to implement aprototype of the P2P chat application. As we only have one phone that could handle Multicast(HTC Hero) we also used a test application in Java.
We would like to thank Jonas Adahl who first implemented the Link Local Smack API basedon the Smack API. He has been really helpful throughout the whole programming process. Thisprototype is based on the testMDNS program provided by the Link Local Smack API.
6.2.3.1 Class Description
Class Diagram The Figure 6.9 is a class diagram of the application that allows us to visualizethe structure of this application, and the relations between the different classes composing it.
73

Fig
ure
6.9:
Cla
ssdi
agra
mof
the
Pee
r-to
-Pee
rch
atpr
otot
ype
74
Chat Module Activity This is the main activity of the prototype, it is only aimed atlaunching the different activities inside the tabs of the application.
Rooms and Chats Activities These classes are not implemented yet in the prototype, theyexist because in the future they will be used for the Chat Rooms and the different discussionsinside the Rooms as stated in the requirements.
ContactsActivity class It is the main activity of the prototype, indeed it is the activity thatinitiates all the connections and displays the different users online, thanks to their presence.We begin by acquiring the Multicast Lock to allow us to use the Multicast. Then we retrievethe IP address of our phone that will be useful later on. We then set our name for our presenceon the network and set this Link Local Presence, it can contain a lot of information such asthe name, the nickname, the email address etc. Since JmDNS is a service registration anddiscovery protocol, we create what we call a Link Local Service that will be the core of ourapplication using the presence. It initiates the JmDNS Daemon, creating the necessary toolsprovided by the library JmDNS (the Multicast socket, etc.) and running them. It also starts thepresenceDiscoverer which is used to basically discover the adding and removing of the presenceson the network. It also starts its own presence service. When the service is created, it isimportant to create Listeners in order to react whenever something happens on the network:
• Service State Listener to provide tools whenever there is a changing in the state of theservice.
• Presence Listener to react whenever a new presence is added or removed. We use a customListener for the presence in order to add them in the list of contacts available.
• We need to use a wrapper as we are using the service discovery, this wrapper is calledLink Local Service Discovery Manager.
• Chat Listener to react when there is an incoming chat or when you want to initiate a chatwith a user. It uses the class LLChat (Link Local Chat) which is provided by the APIand provides all the necessary tools to send and receive messages between users.
We then initiate the Link Local Service Listener Daemon.
Conversation Activity class This class aims at giving the Chat between two users a graph-ical interface. It is the direct link between the user and ContactActivity Chat Listener.
6.2.3.2 Presence issues
After having implemented the prototype we experienced many troubles with the presences.Indeed, the Android Application seemed to retrieve the presence of the Java application onlyonce when it is launched first. After having studied the traffic with Wireshark, we discoveredthat the Android application did not respond to the queries sent by the Java application.After having discussed with Jonal Adahl, it seemed that the problem came from the API, notcompletely efficient.
75

6.2.4 Third Prototype: JmDNS Presence
As the chat was completely functional, we decided to build a second prototype using onlyJmDNS to implement the presences between the users.
6.2.4.1 Description class
As shown on Figure 6.11 the class diagram is fairly simple, we only have one activity Con-tactsActivity and another class CustomListener. The other classes are used for the graphicalinterface.
ContactsActivity class After having created and set up the graphical interface, we initiatethe JmDNS network. To do so, we create the Multicast lock and acquire it in order to be ableto use Multicast. Then we create the JmDNS connection and register to our presence service.The third step is to add a service type listener and a service listener to our JmDNS connection.These listeners are implemented with the CustomListener class.
CustomListener class This listener aims at adding to the friends list the name of a pres-ence when it is Multicasted on the network and removing it from the list when its removal ismulticasted on the network. It also implements a resolved listener to be able to retrieve all theinformation about the service. Thanks to the library JmDNS 3.2.2 this very important featurehas been completely repaired.
Conclusions This prototype works perfectly and we can see on Figure 6.10 that the addingand removing of the presences appear in the application.
(a) Application run on the firstphone
(b) Application run on bothphones
(c) Application quit on the firstphone
Figure 6.10: Screenshots of the presence prototype
76
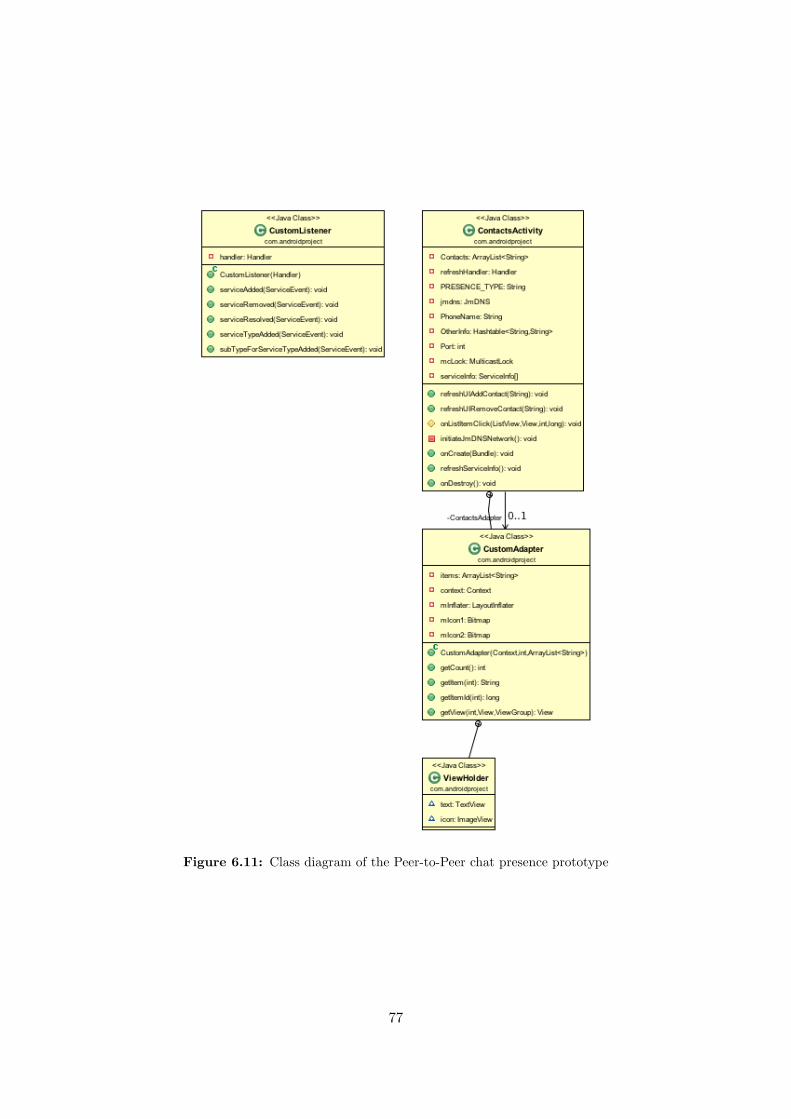
Figure 6.11: Class diagram of the Peer-to-Peer chat presence prototype
77

Chapter 7
Conclusions
We have presented a smartphone based application which provides two main features to AalborgUniversity: a way to easily communicate among students, teachers and employees, and a locationsystem for them to know their position inside the campus’ buildings. Our choices to providethese two services lead us to the use of a P2P chat system for the communications and aFingerprinting methodology based system for the Geolocation. We designed and developed thetwo systems separately, because the problems addressed were different and spanning over severaltopics, like Networking, Distributed Systems, etc. We had the opportunity to use Android OSequipped smartphones. This OS, not only does it provides the openness and free availabilityof its programming tools, but also is widely chosen by the smartphone users. In the followingSections we describe our conclusions for both the Geolocation System and the CommunicationSystem.
7.1 The Geolocation System
We first reviewed the five main categories of available technologies for the Geolocation, andfound out that actually only two of them could fit our indoor environment: the GSM and theWiFi. The WiFi has been chosen because the maximum accuracy obtainable with the GSM isonly 10 meters, and, in addition to the difficulty of achieving such a precision, it could havebeen barely enough to obtain a 10 meter room accuracy. The next step has been to reviewthe Geolocation methodologies feasible over the WiFi technology. Actually, only two were areal possibility: the Fingerprinting and the Triangulation. The Fingerprinting methodologyover the Wireless network has been chosen as it requires less a-priori requirements than for theTriangulation methodology. For example, the position of all the WiFi access points present in abuilding, the need of at least 3 access points to perform a location and the need of administrator’sintervention to deploy and set up the system are requirements affecting only the Triangulationmethodology. We designed the system in 4 main parts, a GUI, a Sniffer, a Database and anAlgorithm. All of them are deployed on the same phone in one application, in order to makeeach device stand alone, capable to run and geolocate itself without the need of any serveror other mobiles. The logic of our system has, of course, taken the greatest effort. First ofall, we tried to review and study all the problems which converge to create the main issue fora WiFi RSS-based Geolocation system: the access point’s signal strength variations. To doso, we made our own experiments and 2 prototypes of the application. Thanks to these, wewere able to have an idea of the rapidity of these changes, their behaviour, and their averagevariances. Moreover, we also ran into a problem, the Cisco WCS System, actually confined toour university environment, which adds further variations to the RSS values.
78
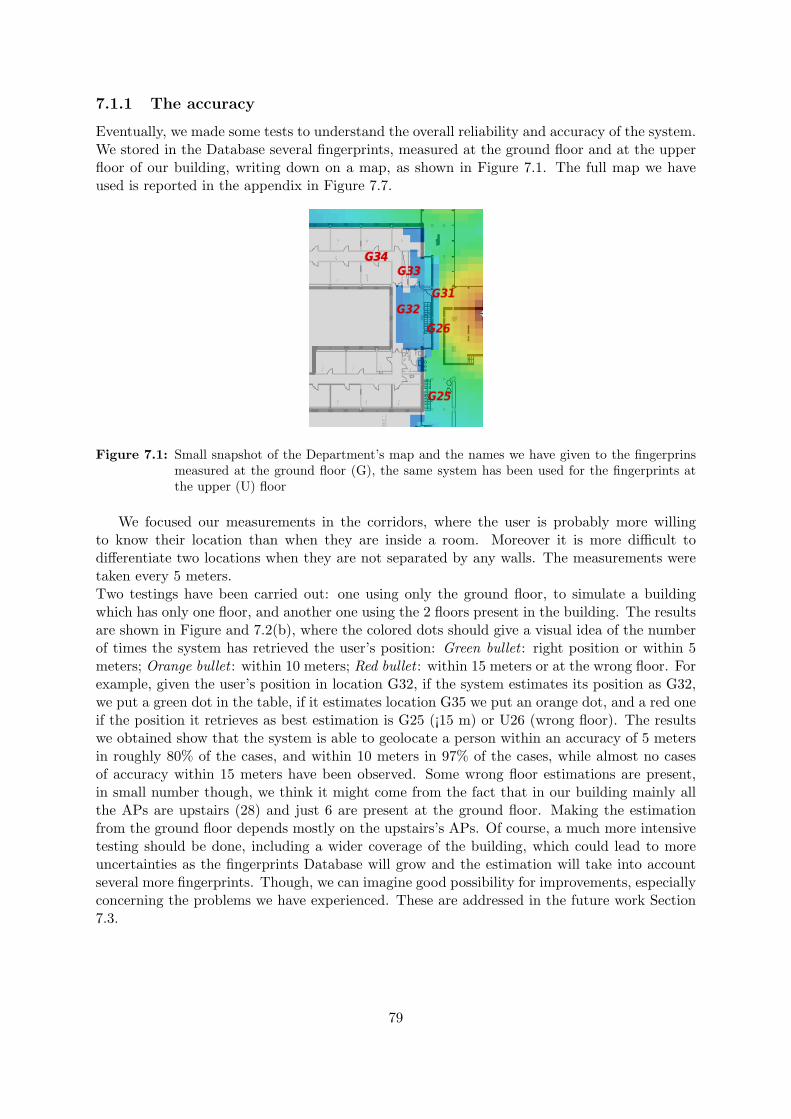
7.1.1 The accuracy
Eventually, we made some tests to understand the overall reliability and accuracy of the system.We stored in the Database several fingerprints, measured at the ground floor and at the upperfloor of our building, writing down on a map, as shown in Figure 7.1. The full map we haveused is reported in the appendix in Figure 7.7.
Figure 7.1: Small snapshot of the Department’s map and the names we have given to the fingerprinsmeasured at the ground floor (G), the same system has been used for the fingerprints atthe upper (U) floor
We focused our measurements in the corridors, where the user is probably more willingto know their location than when they are inside a room. Moreover it is more difficult todifferentiate two locations when they are not separated by any walls. The measurements weretaken every 5 meters.Two testings have been carried out: one using only the ground floor, to simulate a buildingwhich has only one floor, and another one using the 2 floors present in the building. The resultsare shown in Figure and 7.2(b), where the colored dots should give a visual idea of the numberof times the system has retrieved the user’s position: Green bullet : right position or within 5meters; Orange bullet : within 10 meters; Red bullet : within 15 meters or at the wrong floor. Forexample, given the user’s position in location G32, if the system estimates its position as G32,we put a green dot in the table, if it estimates location G35 we put an orange dot, and a red oneif the position it retrieves as best estimation is G25 (¡15 m) or U26 (wrong floor). The resultswe obtained show that the system is able to geolocate a person within an accuracy of 5 metersin roughly 80% of the cases, and within 10 meters in 97% of the cases, while almost no casesof accuracy within 15 meters have been observed. Some wrong floor estimations are present,in small number though, we think it might come from the fact that in our building mainly allthe APs are upstairs (28) and just 6 are present at the ground floor. Making the estimationfrom the ground floor depends mostly on the upstairs’s APs. Of course, a much more intensivetesting should be done, including a wider coverage of the building, which could lead to moreuncertainties as the fingerprints Database will grow and the estimation will take into accountseveral more fingerprints. Though, we can imagine good possibility for improvements, especiallyconcerning the problems we have experienced. These are addressed in the future work Section7.3.
79

(a) Accuracy of the Geolocation application consider-ing only the ground floor, 37 user’s localization wereperformed. In the Database, only fingerprints fromthe ground floor were present
(b) Accuracy of the Geolocation application whenfingerprints from both upper and ground floor arepresent in the Database. 45 user’s localization wereperformed.
Figure 7.2: Accuracy of the Geolocation System: percentage of the times the system manages to re-trieve the exact user’s location (ok) and when it does it within 5, 10 or 15 meters. Thecolored dot represents the number of times (per each stored location) the user’s locationhas been found: GREEN - in the exact place (ok) or within 5 meters, ORANGE - within10 meters, RED - within 15 meters or at the wrong floor (in both cases, out of the 10meters requirement)
7.2 The Communication System
Based on our requirements, we had two major points that we needed to take into account for ourCommunication System: the fact that it is a chat system and the fact that it has to be purelyP2P. We thus reviewed the existing chat technologies that could fit for our application. One ofthem was widely used by a lot of well known chat clients such as Google Talk, the ExtensibleMessaging and Presence Protocol (XMPP). The main problem about XMPP is that it is basedon a hybrid P2P system. Indeed, it works with an XMPP server to authenticate and then letsthe clients discuss in P2P. To bypass that authentication process, we discovered that XMPPintegrates extensions. One of them called XEP-0174 is used to implement serverless XMPPmessaging using a tool called multicast DNS which was fully implementable on Android based onthe fact that a library called JmDNS (Java multicast DNS) was available. In order to implementsuch an application our attention was drawn into an API which provides all the tools in Javato use efficiently XMPP: the Smack API. Luckily a developer from the Jivesoftware communityimplemented a patch to this API to integrate the extension XEP-0174. Unfortunately thispatched API called Link Local Smack API is not fully operational for Android phones, becauseof the fact that some phones do not allow the multicast, the implementation of this new APIhave thus been dropped. Nevertheless, we managed to implement a only presence prototypeproving that the presence should be working with the API, as the P2P communication part of
80
the API works perfectly in our first implementation. To sum things up, our communicationsystem is not fully operational for now, but all the solutions have been well thought and asshown in the future work Section 7.3, will be determinant for our application to work.
7.3 Future Work
7.3.1 Geolocation
The Geolocation part of this project enabled us to be able to locate an user in a building thanksto the WiFi access points. But this work could be improved in many ways.
Moving access points One of the improvements that could be implemented in the Geolo-cation is the correction of the problem of moving access points mentioned in Section 5.1.3.4.
Using other kind of network In order to improve the accuracy of the positioning, a possiblesolution would be to use the GSM and Bluetooth networks and to incorporate these network inour fingerprints. In fact, the more data we have, the more precise the positioning will be. Wenote that this idea comes from the Redpin [11] project.
Using BIM (Building Information Modeling) To improve our application, we could useBIM. This is the process of generating numeric data in order to model a building. It containsa lot of information, from the position of the walls to the composition of the ground. The partwhich could be interesting for us would be the modeling of the map of the building, and theposition of the elevator and stairs. In fact, this could enable the generation of a map and thedisplay the user’s position in it, and to guide the user through the building if he needs to knowthe path to a certain place. We are also aware that this kind of information is mandatory inDenmark for buildings bigger than a certain size.
7.3.2 Chat
Modifying the API After having discussed the issues we encountered during the experimentsand implementation of the chat module with the programmer of the Link Local Smack API,we discovered that it is not working yet. The point is that the link local presences are not fullyoperational. Having that said and based on the fact that our implementation with JmDNSpresences worked, we will be working on the modification of the API to make it operational forother users of the community.
Android election algorithm As stated in our possible solutions in Chapter 6, we need toimplement an election algorithm to make it work. In the future we will try to implement anelection algorithm usable for P2P networks with Android OS. Based on this implementation wewill be capable of making the application operational for every Android phone users.
7.3.3 Merge the Geolocation and Communication systems
As our prototypes are now distinct, we want to merge them into the application, not onlyas separated modules but also as evolutive tools for one another. Indeed, in order to updatethe Database of fingerprints of every user of the application, we will be working on XMPPextensions (XEP-0096) that provides File Sharing over XMPP in order to share the fingerprintson different phones and treat them in order to have efficiency on every phone.
81
Bibliography
[1] ?, About xmpp. http://xmpp.org/about/.
[2] , Client server model - what is client server network technology. http://en.wikipedia.org/wiki/Client%E2%80%93server_model/.
[3] , Peer-to-peer - definition. http://www.bleepingcomputer.com/glossary/definition125.html/.
[4] , peer-to-peer network definition from pc magazine encyclopedia (for picture napsterand bittorrent). http://www.pcmag.com/encyclopedia_term/0,2542,t=peer-to-peer+network&i=49056,00.asp/.
[5] J. Adahl, Issue 2323: Setting interface for a multicast socket fails. http://code.google.com/p/android/issues/detail?id=2323.
[6] G. Android, Locationmanager. http://developer.android.com/reference/android/location/LocationManager.html.
[7] , Obtaining user location. http://developer.android.com/guide/topics/location/obtaining-user-location.html, 2010.
[8] M. W.-N. K. Annemari Auvinen, Mikko Vapa and J. Vuori, Chedar: Peer-to-peermiddleware acm,.
[9] S. A. Baset and H. Schulzrinne, An analysis of the skype peer-to-peer internet tele-phony protocol, (2004), pp. 1067–1080.
[10] P. A. Bernstein, Middleware: A model for distributed system services. communicationsof the acm,, (1996).
[11] P. Bolliger, Redpin – adaptive, zero-configuration indoor localization through user col-laboration, in Proceedings of the First ACM International Workshop on Mobile EntityLocalization and Tracking in GPS-less Environment Computing and Communication Sys-tems, San Francisco, USA, Sept. 2008. (Best Presentation Award).
[12] P. Bolliger, K. Partridge, M. Chu, and M. Langheinrich, Improving locationfingerprinting through motion detection and asynchronous interval labeling., in LoCA,T. Choudhury, A. J. Quigley, T. Strang, and K. Suginuma, eds., vol. 5561 of LectureNotes in Computer Science, Springer, 2009, pp. 37–51.
[13] , Improving location fingerprinting through motion detection and asynchronous intervallabeling, in Fourth International Symposium on Location- and Context-Awareness (LoCA2009), 7-8 May 2009, Tokyo, Japan, A. Quigley and T. Choudhury, eds., LNCS, BerlinHeidelberg New York, 2009, Springer, Springer.
82

[14] S. Cheshire, Dns service discovery. http://www.dns-sd.org/.
[15] , Zero configuration network. http://www.zeroconf.org/.
[16] Cisco, Cisco wireless control system. http://www.cisco.com/en/US/products/ps6305/index.html/.
[17] , Cisco wireless service module. http://www.cisco.com/en/US/prod/collateral/modules/ps2706/ps6526/prod_qas0900aecd8036434e.html/.
[18] I. Community, Igniterealtime open source community. http://www.igniterealtime.org/.
[19] T. N. Company, Google: Gsm antennas mapping. http://www.nielsen.com.
[20] G. Djuknic and R. Richton, Geolocation and assisted gps, Computer, 34 (2001), pp. 123–125.
[21] J. A.-K. J. R. J. S. Erkki Harjula1, Mika Ylianttila1, Plug-and-play applicationplatform: Towards mobile peer-to-peer, (2004).
[22] T. X. S. Foundation, Available extensions for the xmpp protocol. http://xmpp.org/extensions/.
[23] M. Gargenta, Sniffer example. http://marakana.com/forums/android/examples/40.html.
[24] J. Goyvaerts, Regex, Regular Expressions Tutorial.
[25] J. Graf, History and trends in client-server software design. http://www.helium.com/items/1309939-client-server-trends-xmlrpc-rpc-sockets-soap-mashup/.
[26] R. Hansen, R. Wind, C. Jensen, and B. Thomsen, Algorithmic strategies for adapting802.11 location fingerprinting to environmental changes, 2010.
[27] N. Hatt, Middleware: A model for distributed system services. communications of theacm,, (1996).
[28] T. W. G. f. W. S. IEEE 802.11 Wireless Local Area Networks, Wireless lanstandards. http://www.ieee802.org.
[29] IETF, Extensible messaging and presence protocol (xmpp): Instant messaging and pres-ence. http://xmpp.org/rfcs/rfc3921.html#XMPP-CORE.
[30] JonasAdhal, Xep 0174 (link local) support in smack). http://issues.igniterealtime.org/secure/ViewProfile.jspa?name=jadahl.
[31] E. Letuchy, Erlang at facebook, Facebook, 2009.
[32] H. Liu, H. Darabi, P. Banerjee, and J. Liu, Survey of wireless indoor positioningtechniques and systems, IEEE Transactions on Systems, Man, and Cybernetics, Part C, 37(2007), pp. 1067–1080.
[33] B. Nielsen, Distributed mutual exclusions and elections. https://intranet.cs.aau.dk/fileadmin/user_upload/Education/Courses/2010/DS/Slides/mutex.pdf.
83
[34] P. Saint-Andre, Xep-0174: Serverless messaging. http://xmpp.org/extensions/xep-0174.html.
[35] P. Schauss, Issue 8407: Htc desire android 2.1-update1 does not receive udp broadcasts.http://code.google.com/p/android/issues/detail?id=8407.
[36] B. Schell and C. Martin, peer-to-peer - computer dictionnary definition. http://computer.yourdictionary.com/peer-to-peer/.
[37] scribd, Bully election algorithm. http://www.scribd.com/doc/6919757/BULLY-ALGORITHM.
[38] A. Singh and M. Haahr, A survey of p2p middlewares, (?).
[39] M. K. Stuart Cheshire, Dns-based service discovery. http://tools.ietf.org/html/draft-cheshire-dnsext-dns-sd/.
[40] R. Technology, Wireshark foundation. http://www.wireshark.org/.
[41] X. website, Google: Gsm antennas mapping. http://eng.xakep.ru/link/50814/.
[42] Wikipedia, Geolocalisation. http://fr.wikipedia.org/wiki/G%C3%A9olocalisation.
[43] , Multicast. http://en.wikipedia.org/wiki/Multicast.
[44] D. Wolff, What is peer-to-peer ? definition from whatis.com. http://searchnetworking.techtarget.com/definition/peer-to-peer/.
[45] www.syngress.com, Msn messenger architecture and protocol. http://www.scribd.com/doc/6915637/Msn-Messenger-Architecture.
84
Appendix
Wireless Signal Strenght variations experiment: Long time ex-periment graphs over AP2 and AP3
Wireless Signal Strenght variations experiment: Mass distribu-tion of the data in the Short Time Experiment and in the Longtime one over AP1, AP2 and AP3
Geolocation Testing and Accuracy: the department’s map andthe names given to the fingerprints
85
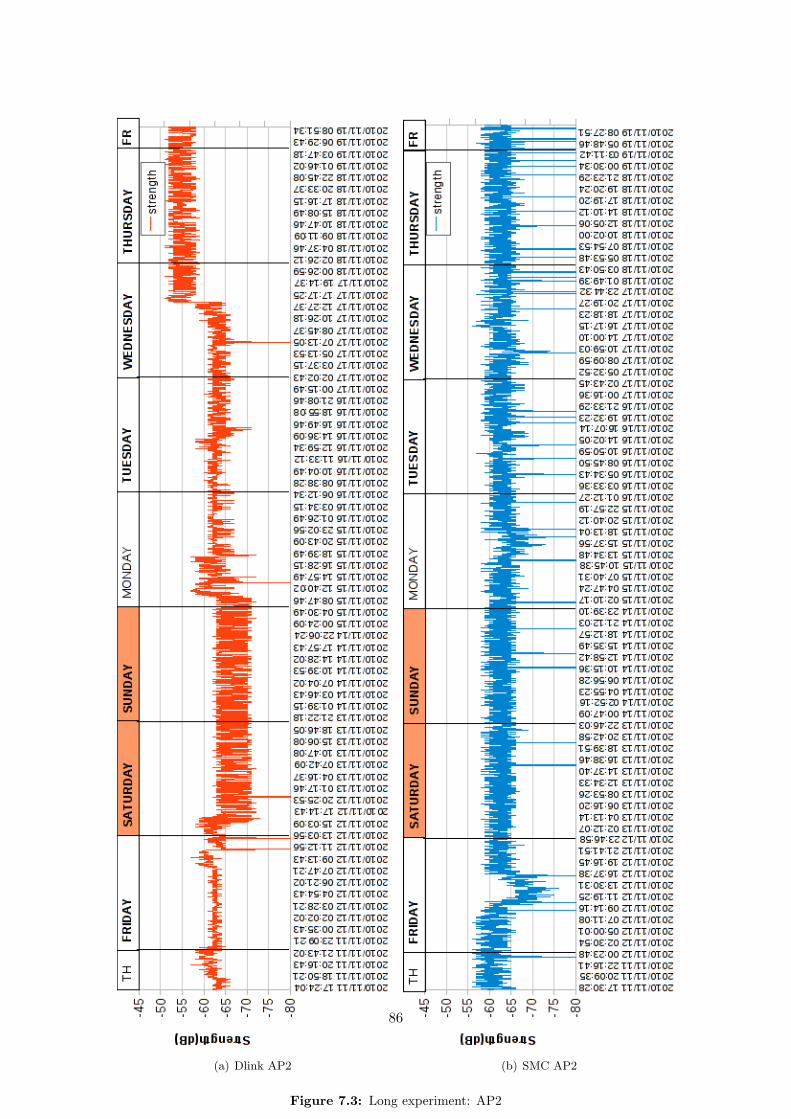
(a) Dlink AP2 (b) SMC AP2
Figure 7.3: Long experiment: AP2
86
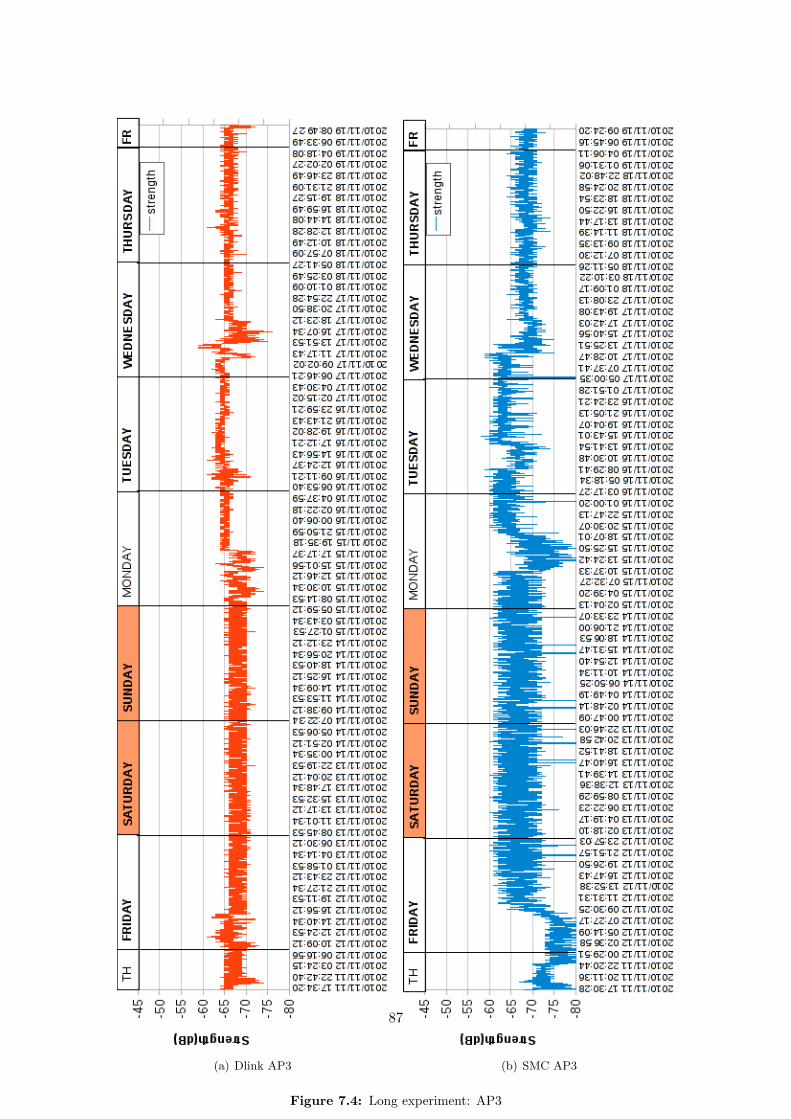
(a) Dlink AP3 (b) SMC AP3
Figure 7.4: Long experiment: AP3
87
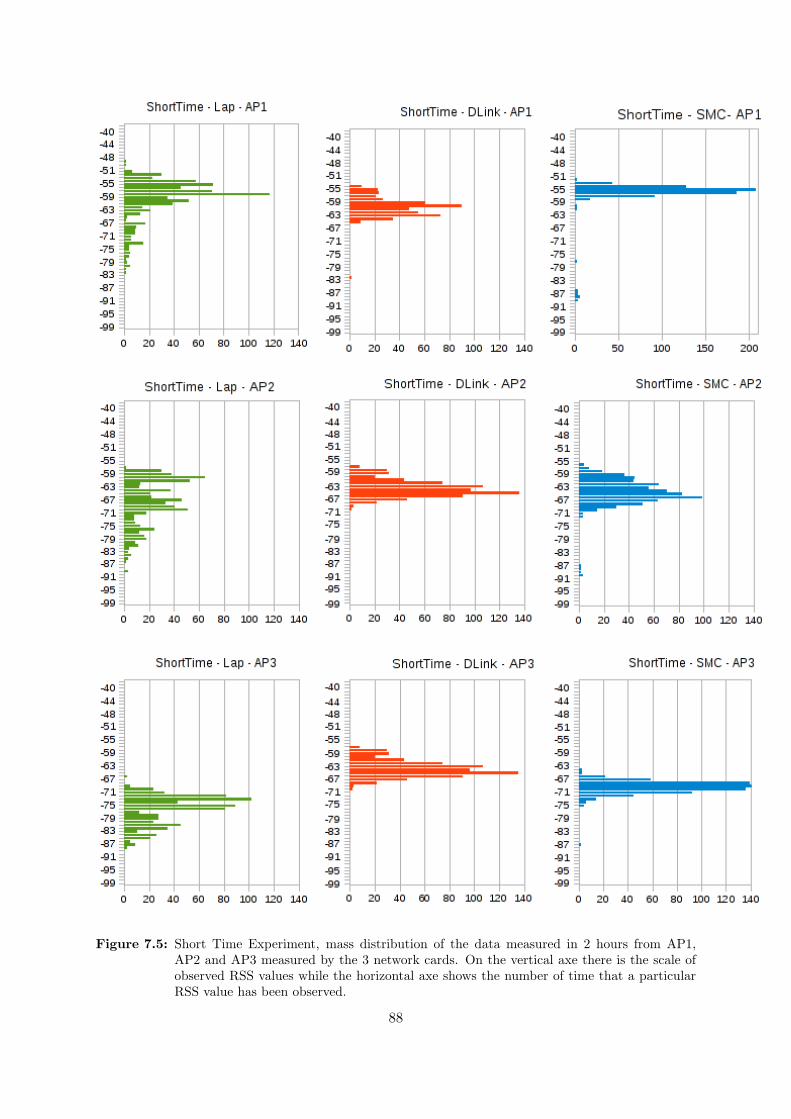
Figure 7.5: Short Time Experiment, mass distribution of the data measured in 2 hours from AP1,AP2 and AP3 measured by the 3 network cards. On the vertical axe there is the scale ofobserved RSS values while the horizontal axe shows the number of time that a particularRSS value has been observed.
88
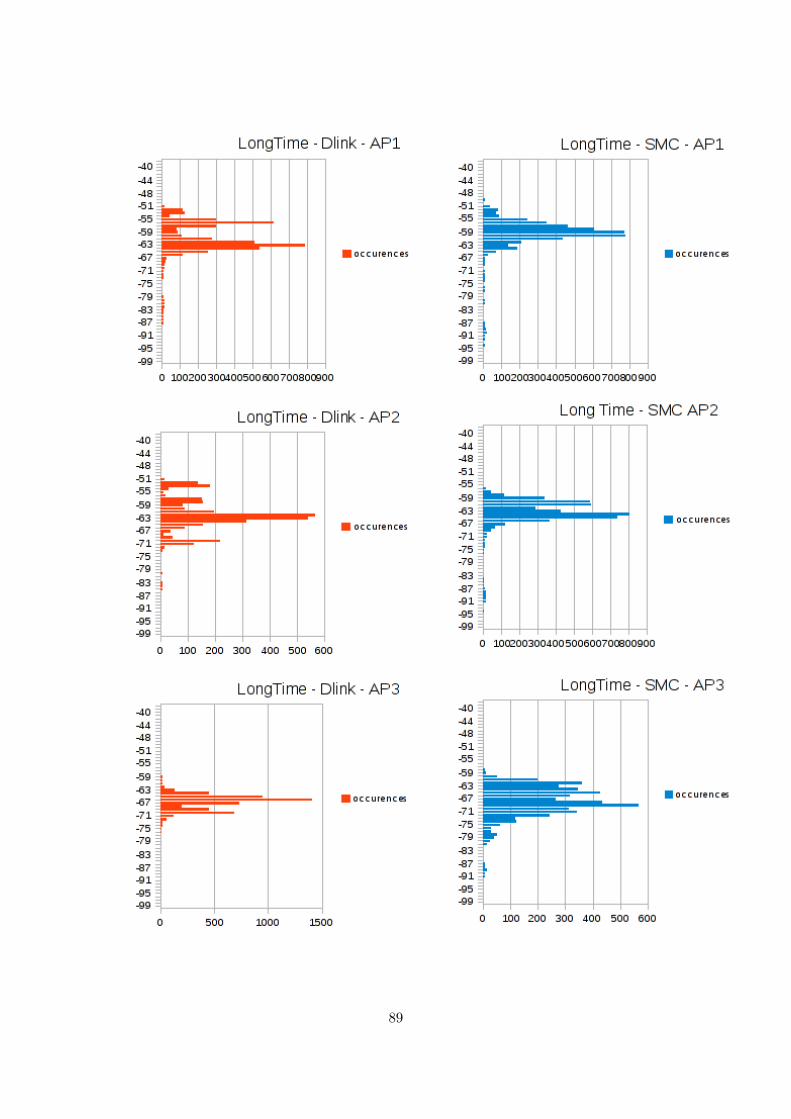
Figure 7.6: Long Time Experiment, mass distribution of the data measured in one week from AP1,AP2 and AP3 measured by the 2 worksation’s network cards. On the vertical axe there isthe scale of observed RSS values while the horizontal axe shows the number of time that aparticular RSS value has been observed.
89

Figure 7.7: A part of the department’s map we have covered with the fingerprints and the names wehave given them. The maps show the Groundfloor and the correspondent Upper floor. Wekept the names constant, changing only the U (Upper floor) and G (Groundfloor). The“SLV300-CS-APx” are the names of the APs present at the floor; the APs present at thegroundfloor are very few and not visible in this map.
90

CD-Rom
Here is a CD-Rom containing the source code of our Android application.
91