animal agriculture and watershed impairment in south
TRANSCRIPT

ANIMAL AGRICULTURE AND
SCWRC WATERSHED IMPAIRMENT REPORT IN SOUTH CAROLINA
A GIS-Based Spatial Assessment
Kang S. Lu and Jeffery S. Allen
MAY, 2002
South Carolina Water Resources Center
Strom Thurmond Institute
CLEMSON UNIVERSITY

SCWRC Report
ANIMAL AGRICULTURE AND WATERSHED IMPARMENT IN SOUTH CAROLINA
A GIS-Based Spatial Assessment
By
Kang S. Lu and Jeffery S. Allen
South Carolina Water Resources Center Strom Thurmond Institute of Government and Public Affairs
Clemson University Perimeter Rd, Clemson, SC 29634
May 2002
www.strom.clemson.edu
SCWRC Report Lu & Allen
EXECUTIVE SUMMARY
Animal agricultural pollution remains one of the most challenging watershed problems. As reduction of the pollution becomes the top priority in the Clear Water Action Plan and states are required to implement the non-degradation policy, understanding the characteristics of animal agriculture, watershed impairment and their relationships at the state level are very important for making proper decisions.
This research attempted to examine the relationship between animal agriculture and watershed impairment in South Carolina from a GIS-based spatial, empirical approach. Animal agriculture was represented by cattle, poultry and swine operations that were measured in terms of animal population, farms, facilities and units as well as their derived variables. Watershed impairment was measured in terms of priority ranks for dissolved oxygen (DO), fecal coliform (FC) bacteria, phosphorus (P), or pH problems based on the 2000 303(d) list. Multiple techniques and models, which include map overlay, spatial summary, canonical correlation, multiple regression, and Pearson correlation, were used to determine how strong the relationships are, which animals have larger impacts and where the problem areas are.
It was found that 155 out of 274 watersheds in the 11-digit hydraulic units have been impaired by DO, FC, P, or pH problems, among which fecal coliform bacteria are the most widely spread problems in South Carolina. The results of both spatial and statistical analyses indicate that there are only very weak, though statistically significant, associations between animal agriculture and the impairments in this state. This suggests that there are some non-animal agriculture factors that are major contributors of watershed impairment problems in concern. Nevertheless, cattle facilities appear to have slightly larger impacts on watershed quality than poultry farms do whereas swine operations are not a negative factor that aggravates the watershed impairment in this state. In addition, 28 maps were generated to demonstrate the distribution of watershed impairment, animal agriculture and their relationships. Some problem areas have been identified.
It is recommended that (1) state policies on animal regulations and environmental standards acknowledge the differences among impairment types, animal groups and geographic regions; (2) more efforts be made in the control and reduction of pollution from cattle feeding operations especially in the areas with higher priority ranks and larger clusters of animal facilities that have been identified in the research; and (3) more resources be used in the identification and control of non-animal agricultural factors that are the major causes of DO, FC, P and pH related impairment.
2002 Strom Thurmond Institute of Government and Public Affairs, Clemson University

SCWRC Report Lu & Allen
ACKNOWLEDGEMENTS
This research was funded jointly by U.S. Geological Survey through South Carolina Water Resources Center and by Clemson University Cooperative Extension Service. The Authors greatly appreciate the data support from the South Carolina Department of Health and Environmental Control.
2002 Strom Thurmond Institute of Government and Public Affairs, Clemson University

SCWRC Report Lu & Allen
TABLE OF CONTENTS
Page EXECUTIVE SUMMARY …………………………………………………………………… ii
ACKNOWLEDGEMENTS …………………………………………………………………… iii
LIST OF TABLES ……...………………..................................................................................…. vi
LIST OF MAPS …………………………..................................................................................…. viii
CHAPTER
I. INTRODUCTION ………………….……..……………………….............................…. 1 Environmental Impacts of Animal Agriculture …..…………….............................…. 1 Difficulties in Animal Impact Assessment …..……………...……..........................…. 2 Studies on Animal Pollution in South Carolina …..………………..........................…. 2 Objectives …...………………………......……………………….............................…. 2
II. METHODOLOGY ………………….……..……………………….............................…. 4
Data Preparation …...……………..……..……………………….............................…. 4 GIS Mapping …..……………...………..……………………….............................…. 5 Statistical Analyses ……...………….. ....……………………….............................…. 6
III. RESULTS …………………..……….……..……………………….............................…. 8
Spatial Characteristics of Animal Agriculture and Watershed Impairment …........…. 8
Distribution of animal farms, facilities, population and units ...........................…. 8 Distribution of DO, FC, P, and pH impaired watersheds ........................…. 9 Overlaps between animal facilities and impaired watersheds .………….........…. 23
Statistical Relationships between Animal Agriculture and Watershed Impairment ... 14
Descriptive summaries of animal agriculture by watershed impairments .……..… 14 Overall relationships between animal agriculture and watershed impairments .... 17 Group effects of animal agriculture on watershed impairments
by animal species ………...……………………. .……………….........…. 20 Animal effects on different watershed impairments .…………………….........…. 20
IV. DISCUSION, LIMITATION AND IMPLICATION ………………………………..... 27
Summary of Major Findings ..…………………..…..……….….............................…. 27 Causes of Weak Associations …………………..…..……….….............................…. 27 Differentiation of Animal Impacts .……………..…..……….….............................…. 28 Distribution of Problem Areas …….…..………..…..……….……………………….. 28 Limitation of the Study ….………………. …….....…………….............................…. 29 Policy Implication ….……………….......……………………….............................…. 29
2002 Strom Thurmond Institute of Government and Public Affairs, Clemson University

v SCWRC Report Allen & Lu
TABLE OF CONTENTS (Continued)
Page V. CONCLUSION ..……………..……..…………………………..……..………………… 31
APPENDICES ………………………………..……..……………………….............................…. 32
A: Tables …..….……………..……..……………………….............................…. 33 B: Maps …… ………………..……..……………………….............................…. 37
REFERENCES ……………………..……..……………………………………………………… 65
2002 Strom Thurmond Institute of Government and Public Affairs, Clemson University

SCWRC Report Lu & Allen
LIST OF TABLES
Table Page 1. Animal Population, Farms, Facilities and Units in South Carolina ..…….……… ………. 8
2. Spatial Concentration of Animal Agriculture: Top Five Watersheds in Terms of Animal Population, Farms, Facilities and Units ………………..………. 9
3. Summary of the Total Number, Area, and Animal Units for Impaired Watersheds by Impairment Types and Priority Ranks ……....…….……. ………. 11
4. Summary of Animal Population, Farms, Facilities and Units for DO Impaired Watersheds ……………………………………..…….……………. 15
5. Summary of Animal Population, Farms, Facilities and Units for FC Impaired Watersheds ……….………………………….…..…….……………. 16
6. Summary of Animal Population, Farms, Facilities and Units for P Impaired Watersheds ……….………...………....…………….…..…….……… 17
7. Summary of Animal Population, Farms, Facilities and Units for pH Impaired Watersheds ……..………...………....……………..…..…….……… 18
8. Coefficients of Pearson Correlations in Watershed Priority Ranks between Different Types of Impairments ………………..…………….…………. 19
9. Summary of R-Squares and Significance Tests of Multiple Regression Models for Watershed Impairment Priority Ranks as Functions of Cattle, Poultry and Swine Variables ………………..….….. .……... 20
10. Parameter Estimates of the Regression Model for DO Priority Rank ……………………. 21
11. Parameter Estimates of the Regression Model for FC Priority Rank ……………………. 22
12. Parameter Estimates of the Regression Model for Phosphorus Priority Rank ...…………. 23
13. Parameter Estimates of the Regression Model for pH Priority Rank ..…………………… 24
14. Parameter Estimates of the Regression Model for Occurrences of Impairments …………. 25
A.1 Variables and Measurements ………………………………………………..…………… 33
A.2 Pearson Correlations between Watershed Priority Rank and Animal Agricultural Variables …….………………………………………….…………. 34
A.3 Selected Output of SPSS for Canonical Correlation …………………………………….. 35
2002 Strom Thurmond Institute of Government and Public Affairs, Clemson University

SCWRC Report Lu & Allen
LIST OF MAPS
Map Page 1. Watershed Systems in South Carolina ………………........…............................................. . 37
2. Cattle Population, Farms, Facilities and Animal Units by Watersheds in South Carolina ………........…...........................................……... 38
3. Poultry Population, Farms, Facilities and Animal Units by Watersheds in South Carolina ..…...……..........…...........................................… 39
4. Swine Population, Farms, Facilities and Animal Units by Watersheds in South Carolina …...……..........…...........................................…. 40
5. Permitted Animal Facilities in South Carolina ………………............................................ . 41
6. Animal Units Calculated for Cattle, Poultry and Swine in South Carolina ........................... 42
7. Priority Ranks of Watershed Impairment Caused by Dissolved Oxygen, Fecal Coliform, Phosphorus and pH Problems in South Carolina ......................... . 43
8. Priority Ranked Watersheds with One or More Impairment Problems Caused by DO, FC, P or pH in South Carolina ……………….............................. . 44
9. Permitted Cattle Facilities and Impaired Watersheds with Dissolved Oxygen Problems in South Carolina ……………………...................................... . 45
10. Permitted Poultry Facilities and Impaired Watersheds with Dissolved Oxygen Problems in South Carolina …………...................................... . 46
11. Permitted Swine Facilities and Impaired Watersheds with Dissolved Oxygen Problems in South Carolina .……………………...................................... . 47
12. Permitted Animal Facilities and Impaired Watersheds with Dissolved Oxygen Problems in South Carolina ......……....................................... . 48
13. Permitted Cattle Facilities and Impaired Watersheds with Fecal Coliform Bacteria Problems in South Carolina ..…...……...................................... . 49
14. Permitted Poultry Facilities and Impaired Watersheds with Fecal Coliform Bacteria Problems in South Carolina .…...……...................................... . 50
15. Permitted Swine Facilities and Impaired Watersheds with Fecal Coliform Bacteria Problems in South Carolina .…...……...................................... . 51
16. Permitted Animal Facilities and Impaired Watersheds with Fecal Coliform Bacteria Problems in South Carolina ..…..……....................................... . 52
17. Permitted Cattle Facilities and Impaired Watersheds with Phosphorus Problems in South Carolina .…...……..……....................................... . 53
18. Permitted Poultry Facilities and Impaired Watersheds with Phosphorus Problems in South Carolina …….……............................…… . 54
2002 Strom Thurmond Institute of Government and Public Affairs, Clemson University

viii SCWRC Report Lu & Allen
LIST OF MAPS (Continued)
Map Page 19. Permitted Swine Facilities and Impaired Watersheds with
Phosphorus Problems in South Carolina ………………........................................ . 55
20. Permitted Animal Facilities and Impaired Watersheds with Phosphorus Problems in South Carolina ...……………......................................... . 56
21. Permitted Cattle Facilities and Impaired Watersheds with pH Problems in South Carolina .………...………..……........................................ . 57
22. Permitted Poultry Facilities and Impaired Watersheds with pH Problems in South Carolina .………...………..……........................................ . 58
23. Permitted Swine Facilities and Impaired Watersheds with pH Problems in South Carolina ..………………………........................................ . 59
24. Permitted Animal Facilities and Impaired Watersheds with pH Problems in South Carolina ..………………………........................................ . 60
25. Permitted Cattle Facilities and Priority Ranked Watersheds with One or More Impairment Problems Caused by DO, FC, P or pH in South Carolina .................... 61
26. Permitted Poultry Facilities and Priority Ranked Watersheds with One or More Impairment Problems Caused by DO, FC, P or pH in South Carolina ..................... 62
27. Permitted Swine Facilities and Priority Ranked Watersheds with One or More Impairment Problems Caused by DO, FC, P or pH in South Carolina .................... 63
28. Permitted Animal Facilities and Priority Ranked Watersheds with One or More Impairment Problems Caused by DO, FC, P or pH in South Carolina .................... 64
2002 Strom Thurmond Institute of Government and Public Affairs, Clemson University

SCWRC Report Lu & Allen
CHAPTER I
INTRODUCTION
Animal agriculture has been perceived as a major source of pollutants. Over the past three decades, point source pollution has been largely controlled, but non-point source pollution from animal agricultural sources remains one of the most challenging national water quality problems. To provide “fishable and swimmable water” for all Americans, the Clean Water Acton Plan (CWAP) prepared by USEPA and USDA and signed by the President has called for the enforcement of the Clean Water Act (as amended), improvement of environmental standards, and reduction of pollution from animal feeding operations. While more strict environmental policy may hinder the animal agricultural economy due to associated costs, the success of the plan depends largely on how well each state does its own job of pollution control, for more decisions are to be made at the state level as states are required to implement the non-degradation policy and take over more responsibilities from the federal government in daily operations of environmental control. It is therefore extremely important to approach impairment problems from a state perspective, to examine their relationships to animal agriculture within each unique geographic unit, and to provide reliable information for state legislatures and watershed managers to make more appropriate policy and action decisions that not only comply with the federal law but also promote the interest of each individual state.
This research relies on GIS technology to map the distribution of animal agriculture, watershed impairment and their relationships using the 11-digit hydrologic units in South Carolina; it examines the spatial relationships between animal agriculture and watershed impairments through both spatial and statistical analyses; it intends to answer some critical questions such as what pollution problems are related to animals, how much animal agriculture has contributed to watershed impairment, which animals have relative significant impacts, and where the pollution problems exist.
Environmental Impacts of Animal Agriculture Contributions of animal agriculture to stream impairment consist of the pollution from animal wastes, the point source pollution from animal facilities or the non-point source pollution from the application of wastes and chemicals to fields. The pollution is characterized by excessive nutrients, harmful pathogens and undesired odors from animal wastes. The first two are closely related to watershed impairment problems. Although animal wastes or manure are useful for crop growing, excessive nutrients (nitrogen, phosphorus, carbon, potash, etc.) contained in the animal wastes that are washed into streams from animal facilities and sprayed fields may cause overgrowth of algae and changes in aquatic bioactivities that may deplete dissolved oxygen (DO) and alter pH values of waterbodies. The eutrofication phenomenon changes the living conditions of aquatic life and thus is a threat to aquatic species. Animal wastes also carry numerous pathogens which can be indicated by the presence of fecal coliform (FC) bacteria. Once released to waterbodies, these bacteria can cause human diseases and thus prohibit human recreational use of waterbodies. However, it is not an easy task to quantitatively evaluate the impact of animal agriculture on watershed quality in a geographic area as large as a state due to the complexity of natural and human systems involved.
2002 Strom Thurmond Institute of Government and Public Affairs, Clemson University

2 SCWRC Report Lu & Allen
Difficult ties in Animal Impact Assessment First, there are many natural and human factors that affect the movement and change of nutrients and pathogens in the geographically differentiated environment. Although laboratory tests can provide information about chemical compositions or types and amount of bacteria of specific animal wastes, it is hard to know what happens after animal wastes are released to waterbodies or applied in the fields. Experimental stations may be able to monitor conditions of streams adjacent to a few animal facilities, but it is difficult to determine the exact extents of a specific pollution in large areas.
Second, nutrients and pathogens come from multiple sources including human wastes, urban runoff, and other agricultural activities in addition to animal wastes. It is thus extremely difficult to determine exactly which sources have been involved and how much they have contributed individually.
Third, disparities and variations in natural environments also impose some obstacles for sampling and measuring watershed impairment on a consistent basis. Measurements taken at different time of the day, or season, or before or after a storm differ significantly. The same amount of nutrients may be considered excessive in one area but normal in another.
All these uncertainties increase the risk in our decision-making in pollution control, especially when social and economic costs are considered. Failure to recognize the geographic differences in animal agriculture and associated pollution is one of the main reasons why we have failed to effectively control the non-point source pollution over the past three decades. Animal agriculture pollution is a geographical phenomenon and thus needs to be addressed from a spatial approach, particularly at the regional or state level.
Studies of Animal Pollution in South Carolina Although there have been many studies dealing with animal pollution issues in South Carolina, few have taken a spatial, empirical approach. Most studies, like those conducted by Warner and his colleagues (1998), have discussed the animal agricultural pollution in general terms without spatial consideration. The South Carolina Department of Health and Environmental Control (1997, 2000) have committed to update the 303(d) list that contains information about the status of impaired waterbodies in the state, but have made little effort in establishing the linkage between impaired waterbodies and animal feeding activities. Without adequate understanding of their relationships, effective control and management of animal related pollution is still in question.
To fill this gap, Allen, Lu and Blacklocke (1998) have attempted to address the relationships between animal agriculture and DO and FC related watershed impairments in the state from a GIS based spatial approach, but their research has been criticized for the use of 8-digit hydrologic units as the spatial units of analysis and for the map-based qualitative assessment. While the maps based on these units are too coarse to truthfully represent reality, the conclusions based on the later approach without quantitative statistical analysis is less convincing. There is a need for reexamination of the relationships between watershed impairment and animal agriculture using finer geographic units and quantitative statistical analysis.
Objectives This research revisited the animal agriculture-watershed impairment relationships from a spatial and empirical approach. There are four specific objectives to be obtained:
• Map the watersheds impaired by DO, FC, P and pH problems in relation to animal agriculture as represented by cattle, poultry and swine in South Carolina in the 11-digit hydrologic units.
2002 Strom Thurmond Institute of Government and Public Affairs, Clemson University

3 SCWRC Report Lu & Allen
• Examine the relationship between watershed impairment and animal agriculture using descriptive summary, canonical correlation, multiple regression, and Pearson correlation.
• Identify the animal related factors that have significant impacts on the watershed impairment in concern.
• Identify the problems areas that should be targeted for watershed management actions. It was expected that this research would generate more detailed and accurate maps due to the use of much finer spatial units. It is also believed that compared to animal farm data aggregated at the zip code level, permitted animal facilities as a point coverage better spatially represent the distribution and concentration of animal agriculture in the state. The new releases of 1997 Census of Agriculture and the South Carolina 303(d) 2000 list also allow the researchers to update the previous study and provide new information. As new spatial data of watershed impairments have become available, it is possible to include phosphorus (P) and pH impairments in addition to dissolved oxygen and fecal coliform bacteria for a relatively comprehensive analysis. Turkey was also included in the poultry category due to their importance in the northern part of the state. Most importantly, a series of statistical analyses were designed to quantitatively examine the relationships between animal agriculture and watershed impairments in South Carolina.
2002 Strom Thurmond Institute of Government and Public Affairs, Clemson University

SCWRC Report Lu & Allen
CHAPTER II
METHODOLOGY
Data Preparation Data were collected mainly for two purposes: mapping and analysis. The database built for this project mainly consists of three sets of source data related to watershed impairment, animal agriculture, and base map ancillary data.
Watershed Impairment Data
Watershed impairment in South Carolina was measured by dissolved phosphorus, fecal coliform bacteria, dissolved oxygen, and pH. These indicators were chosen mainly because they are among those closely related to animal wastes and prioritized for watershed management actions. Nitrogen was not used because non-point source nitrogen loads are significantly heavier from the atmosphere than from manure and fertilizer according to recent work completed by the U. S. Geological Survey’s National Water Quality Assessment Program (Allen et al., 1998).
The data source for these indicators is the list of 303(d) 2000 from the South Carolina Department of Health and Environment Committee (SCDHEC, 2000). SCDHEC utilized a point system for prioritizing the waterbodies on the South Carolina §303(d) list for aquatic life and human health use impairment based on the severity of the water quality impairment and the impaired use of the waterbody. The process involved an evaluation of each water body for all of the following factors: potential impacts to endangered species, the severity of the pollution, the uses of the waterbodies, public support and, for waterbodies impaired by fecal coliform bacteria, the potential for primary contact recreation (swimming). Each impaired waterbody was given a priority ranking of 1, 2, or 3. The smaller the rank number is, the more serious the impairment is, and the higher the priority is for watershed management actions. It must be noted that priority rank is not exactly the same as impairment severity. The two terms were used interchangeably in this research because the former was treated as the normalization of the latter that minimized the differences and inconsistency of raw observation data. The 11-digit hydrologiccodes attached in the list were used to relate the table to watershed coverage. To be consistent with the ranking system, the unranked waterbodies were assigned priority 4 for statistical analysis.
Animal Agriculture Data
Animal agriculture is represented by cattle (cow and beef), poultry (chickens and turkeys) and swine. Each was measured by nine variables, including animal population, animal farm counts, feeding facilities and animal units. The source data for the first three were extracted from the 1997 Census of Agriculture (USDA/NASS, 2000) and Animal Facility Permits in South Carolina (SCDEC, 2000). The 1997 Census of Agriculture is the most recent census available. In order to minimize the spatial error associated with data aggregation, this research used data aggregated at the smallest units, zip codes. It should be pointed out that counts of animal farms in the inventory are available from various sources but the animal population data at the zip code level can be obtained only through a special request. Permitted animal facilities were collected as a point feature with an attribute table attached. They were already in the GIS compatible format and so ready for analysis. Compared to those data extracted from the Census of Agriculture, facility data are much more accurate spatially and thus less error is expected during data processing.
2002 Strom Thurmond Institute of Government and Public Affairs, Clemson University

5 SCWRC Report Lu & Allen
Watershed Boundary Data
Watershed boundaries and other spatial data were also collected for GIS mapping and statistical analysis. The most important is the coverage of South Carolina 11-digit hydrologic units downloaded from the USGS web site. They were used as the units of study for both mapping and statistical analysis. All other spatial data were aggregated into these units during preprocessing. Zip code coverage was obtained from ESRI Data set (ESRI, 2000) and utilized as an intermediate spatial feature to relate the census data before all animal data were reaggregated into watershed units. Most ancillary data needed for base maps were the in-house data provided by the Spatial Analysis Lab, Strom Thurmond Institute of Government and Public Affairs, Clemson University.
Three main tasks were accomplished during the data preparation process. The first one was to convert all text files or irregular tables into the format that can be linked to geographic features. The second was to reaggregate impairment and animal data into watershed units. And the last was to derive new variable data sets from existing coverages for conducting statistical analysis.
GIS Mapping and Spatial Analysis As in the previous project (Allen et al., 1999), this research took a watershed approach rather than a stream approach to mapping of water quality impairment caused by DO, FC, P and pH problems. The 11-digit hydrological units were used instead of the 8-digit units in order to improve spatial accuracy of the maps. There are four reasons for doing so. First, although the priority rank of each impaired waterbody was based on the observations from a site or sites along a stream, original point data do not contain complete information about where certain impairment starts upstream and where it ends downstream. Mapping impairment by streams, therefore, does not necessarily result in a better spatial accuracy. In fact the 11-digit hydrologic units are sufficient to show the spatial patterns of watersheds impairments at the state level. Second, from the perspective of watershed management, watersheds define the boundaries of possible sources of pollutants. It will help watershed managers to determine the causes of certain impairments by looking beyond a specific impaired stream. Third, for better visual effect, watersheds are polygons and thus, if shaded, more conspicuous than linear streams in maps. Finally, for the purpose of geostatistical analysis, it is easier or logically sounder to aggregate data onto watersheds than onto the stream segments.
The choropleth technique was used to map four types of the impairments. If there was one occurrence of impairment or one impaired site within a watershed, the whole watershed was considered impaired and assigned the value of the priority rank for that site. In the case that multiple sites were impaired, only the highest rank or most sever one was chosen as the representation for that watershed. It is admitted that this data aggregation resulted in loss of information and introduction of error, but the error was expected to be small as finer units of watersheds were used. In addition, the total number of impairment types were calculated for each individual watershed and mapped out accordingly to indicate where multiple impairment problems occur.
Mapping animal agriculture is straightforward once animal data have been aggregated for each watershed. It was intended to map only the most important indicators of animal agriculture, that is, animal population, farms, facilities and animal units for each animal group although other derived features such as various densities were also available in digital formats. They were also presented in choropleth maps in the 11-digit hydrologic units.
Differing from the previous mapping study, this research used permitted animal facilities to overlay with impaired watershed maps in order to show the spatial association between animal agriculture and polluted streams. Since animal feeding facilities are where animal agricultural activities take place and certain pollutants originate, the overlay maps should provide better visual presentation of the relations between the distribution and clusters of animal facilities and watershed impairments. For each type of impairment, three maps were generated for cattle, poultry, and swine respectively with each dot representing a facility
2002 Strom Thurmond Institute of Government and Public Affairs, Clemson University

6 SCWRC Report Lu & Allen
site. A smaller size of dot was used for poultry facilitates than for cattle and swine facilities because of the abundance of poultry facilities. Even so, there are still many symbols stacked together too closely to be distinguished from one another. It is therefore not recommended to count the facilities based on these maps. But it is the coexistence of the facility clusters and impaired watersheds that help to reveal the association between animal agriculture and watershed quality.
ArcView 3.2 (ESRI) was used to facilitate spatial analysis and map-making process in this project. Avenue scripts were written for data summary, aggregation and clustering calculation.
Statistical Analysis While the power of maps gives the most intuitive images, statistical analysis generates quantitative comparisons. GIS is a tool that facilitates the integration of the two. This mapping research relies on four statistical methods to qualitatively examine the relationships between animal agriculture and watershed impairments from different perspectives.
Selection of Statistical Models
The four types of statistical methods that were selected include descriptive summary, canonical correlation, multiple regression and Pearson correlation. Canonical correlation was used to describe the overall relationship between two sets of variables: impairment variables and animal variables. Multiple regressions were performed to examine the relationships between each individual impairment and individual animal groups or individual variables. The former emphasizes the main effect of each animal group (cattle, poultry or swine) as a whole on the degree of watershed impairment caused by DO, FC, P and pH problems respectively; the later in conjunction with simple correlation focuses on the individual effect of each predictor variable. The main purpose of these analyses is to know: (1) whether these four types of impairments are associated with animal agricultural factors; (2) how strong the associations are; and (3) which independent variables are significant contributors. The data set was prepared in ArcView GIS (ESRI) but statistical analyses were performed using SPSS (PC).
Dependent and Independent Variables
In canonical correlation and regression analysis, watershed impairments, measured in terms of priority ranks, are treated as dependent variables, which include DOPRANK for DO impairment, FCPRANK for FC impairment, PPRANK for P impairment, and PHPRANK for pH impairment. The suffix PRANK in the variable names stands for priority ranks. They are ordinal in nature with values ranging from 1 to 4 as described previously. The total number of impairment problems (DOFCPPHF) was also used as the dependent variables for regressions analysis. A complete list of variables and their measurements can be found from Appendix A (Table A.1).
Although there are many variables involved in watershed impairment, four factors are important in selecting independent variables. First, since this research focused on animal impacts, natural environmental variables and other human factors were intentionally excluded. Second, variables that affect the types and amount of animal wastes were included. These include number of animal populations, facilities, and farms as well as animal units. Third, variables that better reflect or measure spatial effects of animal agriculture were given priority over others because this is a GIS based spatial analysis. Densities and clusters of animal facilities and farms and their proximities to streams within each watershed, for example, fall into this category for they affect the concentration and movement of animal wastes in space and those of watershed impairment. Fourth, availability and quality of spatial data should be a limitation rather than a consideration in variable selection. Limited items in source data sets for
2002 Strom Thurmond Institute of Government and Public Affairs, Clemson University

7 SCWRC Report Lu & Allen
deriving desired variables or undesired units of measurements are two major data constraints to the selection of independent variables for statistical analysis.
In total, 35 independent variables were used as measures of animal agriculture. Each animal group, with a prefix CTL, PRY and SWN for cattle, poultry and swine respectively in the relevant variable names, has a set of nine variables. They were measured in terms of the total numbers (with suffix N in the variable names) and the average densities (D) of animal population (POP), animal farms (FRM), animal facilities (FCY), and animal weights (UNT) as well as the degree of facility clustering (_CLUS). A similar set of variables with prefix ALL_ was chosen as combined measures of animal agriculture when appropriate. Added to the list are FCY_BLDG (number of building facilities), FCY_FLDN (number of field facilities), and D2S_FCYN (facility’s proximity to streams). Units of densities for animal population, farms, facilities and animal units are counts per square mile. Facility clustering was measured in terms of number of facilities in the largest cluster defined by a 5-mile radius within each watershed. Proximity to streams was measured as the total number of facilities within a half-mile buffer from the nearest stream.
Due to the use of the aforementioned coding system, values of priority ranks are expected to decrease as values of animal variables increase if they are closely correlated with each other. In this case, regression or correlation coefficients should be negative. In another word, the nature of impact of an animal variable on watershed quality is the same as the sign of its coefficient. When the sign is negative, the variable has negative impact and vise versa. It can be said that in the latter situation, the variable has no negative impact. This rule will be used for interpreting the results of statistical analyses.
2002 Strom Thurmond Institute of Government and Public Affairs, Clemson University

SCWRC Report Lu & Allen
CHAPTER III
RESULTS
Spatial Characteristics of Animal Agriculture and Watershed Impairment Four sets comprising a total of 28 maps were generated in this project to provide information about spatial characteristics of watershed delineation, animal agriculture, watershed impairment, and their overlapping relationships in South Carolina. They can be found in Appendix B. This section reports the results of a map-based spatial analysis complemented by a series of summary tables.
Distribution of Animal Facilities, Farms, Population and Units
There are four major characteristics of animal agriculture in South Carolina. First of all, animal agriculture has demonstrated three distinctive spatial patterns in distribution as shown in Map 2 through Map 6. While cattle agriculture shows a relatively high concentration in the western part of the state, swine operations lean strongly towards the coastal plain region, leaving poultry farms most in the mid-state sand hill areas. Although these spatial disparities of domestic animals have been identified in our previous study (Allen et al. 1998), they become much more discernible when animal populations, farms, facilities and animal units are mapped using the 11-digit hydrologic units. There is no need to explain why animal agriculture is differentiated in space, but knowledge of the characteristics of these spatial differentiations is helpful to our understanding of its relation to watershed impairment. If animals are accountable for watershed impairment and their impacts vary with species, the distribution of impaired watersheds should resemble these patterns in space.
According to Map 5, poultry facilities are dominant in numbers and spatial extent covered. Table 1 shows that 86.71% of the animal facilities permitted in the state are poultry facilities. Although it is difficult to compare poultry with cattle and swine in other items, poultry population accounted for 51.34% of total animal units in the state, followed by cattle (39.27%) and swine (9.39%). The composite map of animal units (Map 6) shows that poultry and cattle are the two most dominate animals in terms of total animal units. Since per animal unit poultry generate more nutrients than any other animals (Boering et al, 1999), poultry should be the major sources of nutrients related to animal agriculture in South Carolina. However, the impact of poultry operations on watershed quality is not necessarily the largest among those of all animal groups.
Table 1. Animal Population, Farms, Facilities, and Animal Units in South Carolina
Population Farms Facilities Animal Units
Sub Total
% State Total
Sub Total
% State Total
Sub Total
% State Total
Sub Total
% State Total
Cattle 362299 1.07% 10511 79.73% 1164 5.89% 507214 39.27% Poultry Swine
33158548 303233
98.03% 0.90%
1308 1365
9.92% 10.35%
17129 1462
86.71% 7.40%
663167 121293
51.34% 9.39%
Total 33824080 100.00% 13184 100.00% 19755 100.00% 1291674 100.00%
2002 Strom Thurmond Institute of Government and Public Affairs, Clemson University

9 SCWRC Report Lu & Allen
The advantage of the use of facility permits has become obvious in terms of illustrating locations and concentration of animal feeding operations at the state, regional, or local level. Five large clusters of animal facilities are identifiable statewide though degrees of clustering of animal agriculture differ from one group to another. Table 2 provides a summary of four animal agricultural indicators for the top five watersheds in South Carolina. Five watersheds account less than two percent of the total number of watersheds but more than 25% in total facilities and animal units, with cattle leading in the former category (43.56%) while swine in the latter (39.36%). One may speculate that if there is a close association between watershed impairment and swine or cattle operations, the relatively high spatial concentration may be an important factor.
To be more specific, the Lower Saluda, the Upper Edisto, and the Lower Tugaloo are the top three regions in terms of animal units and thus most suspect to animal related impairments. It was also noticed that for each type of animal agriculture, maximum values of animal population, farms, facility and animal units do not necessarily coexist in the same watersheds (Map 2 through Map 4) because the use of different classifications, differences in data aggregation, and variations in the capacities of facilities or farms. However, they share a similar spatial trend state wise.
Table 2. Spatial Concentration of Animal Agriculture: Top Five Watersheds in Terms of Animal Population, Farms, Facilities, and Animal Units
Population Farms Facilities Animal Units
Sub % State Sub % State Sub % State Sub % State Total Total Total Total Total Total Total Total
Cattle 105646 29.16% 1201 11.43% 507 43.56% 147905 29.16% Poultry 10164193 30.65% 147 11.24% 4699 27.43% 203285 30.65% Swine 119348 39.36% 128 9.38% 436 29.82% 47740 39.36%
Distribution of DO, FC, P, and pH Impaired Watersheds
The distribution of watersheds with DO, FC, P or pH problems shown in Map7 and Map8 can also be characterized in five aspects. First, There are 155 watersheds in the 11-digit hydrologic units that have encountered at least one of the four impairment problems caused by DO, FC, P or pH (Map 8). They account for 56.6% of the total number and 64.7% of the total area of all 274 watersheds in the state. No attempts have been made to compare types, extents and severities of watershed impairments between South Carolina and other states. However, the percentages are high with many animal-feeding facilities must falling within these impaired watersheds. So, people tend to blame animal agriculture for watershed impairment even though it may not be the primary contributor.
Second, Map 7 shows clearly that the fecal coliform bacteria are the most widely spread problems among the four discussed here. According to Table 3, more than half (147 or 53.56%) of the watersheds in South Carolina have encountered FC bacteria problems. These watersheds account for 60.8% of the total area. There are also more watersheds that are ranked priority II and I for the FC impairment than for any other problems, indicating that fecal coliform bacteria impairment is also more severe than others in the state. Due to their incomparable extent, severity, and nature, fecal coliform bacteria problems should be targeted with top priority for further research and statewide management actions. Phosphorus impairment, on the other hand, affects only 11 (4.0%)watersheds, the least among the four, and no watershed has been ranked as priority I. The rarity of this problem is one reason why phosphorus was excluded in the previous study. Map 7 also shows that there are more watersheds subject to dissolved oxygen impairment (39) than pH problems (18).
2002 Strom Thurmond Institute of Government and Public Affairs, Clemson University

10 SCWRC Report Lu & Allen
Third, although there are a few impaired watersheds that are isolated from one another, each type of impairment demonstrates a certain degree of spatial contiguity in distribution, most within the same larger or parent watersheds. This suggests that the adjacent watersheds within an impaired contiguous area may be polluted by the same source or sources. Identification and control of original sources of pollutants in the upstream watersheds are particularly important to reduction of spatial externalities and effective management of whole watershed systems.
Fourth, there are substantial overlaps between FC impairment and the other three types of impairments but, very little among the other three. Out of 68 watersheds impaired by DO, P, or pH, 57 (83.82%) are also polluted by the fecal coliform bacteria problems, leaving only 11 impaired watersheds FC free. One may say that watersheds with DO, P or pH are most likely to have the FC problem, but not vise versa, for there are 90 watersheds impaired by FC bacteria alone. This suggests that causes accountable for the FC impairment are more possibly not related to those liable for DO, P or pH problems. Note that there are only three watersheds that have both phosphorus and DO problems. They account for less than 8% of all 39 DO impaired watersheds. Since phosphorus is the only ranked nutrient, it is possible that the DO impairment resulted from other nutrients or other factors than excessive phosphorus. Although one-third of pH-impaired watersheds have phosphorus problems, other nutrients or non-nutrient factors may be the main cause of pH related impairment. Statistical correlation among these four problems will be discussed later.
Finally, several areas with multiple impairment problems are identifiable from Map 7. These include two watersheds, one in the Saluda River Basin and the other in the Wateree River Basin that have been ranked for all four problems. There are eight and twenty other watersheds ranked for three and two respectively. From the prospective of watershed management, areas with multiple and sever impairment problems should be targeted first for immediate management actions.
Overlaps between Animal Facilities and Impaired Watersheds
The majority of maps (Map 9 through Map 28) were generated to show the overlaps between permitted animal facilities and impairment watersheds. Table 4 - 8 provides comprehensive summaries of animal population, farms, facilities and anima units by types of impairment and priority ranks. It is assumed that any deviation between clusters of animal facilities and areas of impairment concentration would be a rejection of the hypothesis that there is a close association between animal agriculture and watershed impairment.
Animal Facilities and DO Impaired Watersheds Map 9 shows that there is a substantial overlap between cattle facilities and DO impaired watersheds. The latter possesses 36.34% of total cattle facilities, far exceeding their share in the total number (14.23%) and area (20.71%) of watersheds in the state. This is also the highest among all animal groups. Although their share (23.20%) in the state’s total cattle animal units is not so impressive, it is higher than that of any other animal group. The average of animal units of cattle in the DO ranked watersheds is also the highest among all animal groups. This indicates that cattle may have a larger impact on DO related impairment than any other animals. More than 85% of these facilities are located in 16 ranked watersheds with priority II, particularly in two watersheds in the Saluda River Basin on the head of Lake Murray. These two watersheds alone account for 27.92% of the total cattle facilities and 13.77% of total cattle animal units. One may assume that cattle wastes are one of the major sources of DO impairment at least in these two watersheds.
Unlike cattle facilities, most of the large poultry facility clusters appear to locate in the gaps between DO ranked watersheds as shown in Map 10. All DO ranked watersheds account for only 10.34% of the state’s total, which is smaller than their shares in total number and area. The mean animal units of DO ranked watersheds are also lower than those of unranked watersheds. In addition, most of them are spread over the second and third ranked watersheds. All these suggest that there is, if any, only a weak
2002 Strom Thurmond Institute of Government and Public Affairs, Clemson University

11 SCWRC Report Lu & Allen
association between poultry and DO impairment. However, as in the case of cattle facilities, the aforementioned two watersheds account for nearly 40% of the poultry facilities in ranked watersheds (but only 3.7% of the state total). Their share in the total poultry animal units is 7.69%, ranking them top four and eight respectively in all watersheds. Therefore, there is a possibility that local DO problems were caused by concentrated poultry facilities.
Table 3. Summary of the Total Number, Area and Animal Units of Impaired Watersheds by Impairment Types and Priority Ranks
Type of Priority Number Area (in mi2) Animal Units Impairment Rank Subtotal % of Total Subtotal % of Total Subtotal % of Total
DO I 2 0.73% 230 0.74% 19027 1.47% II 16 5.84% 2401 7.71% 135262 10.47% III 21 7.66% 3818 12.26% 71309 5.52%
Ranked 39 14.23% 6449 20.71% 225598 17.46% Unranked 235 85.77% 24695 79.29% 1066076 82.53%
FC I 8 2.92% 1307 4.20% 37241 2.88% II 44 16.06% 6153 19.76% 309902 23.99% III 95 34.67% 11477 36.85% 463043 35.85%
Ranked 147 53.65% 18937 60.81% 810186 62.72% Unranked 127 46.35% 12207 39.20% 481488 37.28%
P I 0 0.00% 0 0.00% 0 0.00% II 7 2.55% 1018 3.27% 80440 6.23% III 4 1.46% 763 2.45% 28148 2.18%
Ranked 11 4.01% 1781 5.72% 108588 8.41% Unranked 263 95.99% 29363 94.28% 1183086 91.59%
PH I 1 0.36% 103 0.33% 19027 1.47% II 6 2.19% 991 3.18% 78036 6.04% III 11 4.01% 2019 6.48% 45801 3.55%
Ranked 18 6.56% 3113 9.99% 142864 11.06% Unranked 256 93.43% 28031 90.01% 1148810 88.94% Ranked Subtotal 155 56.57% 20144 64.68% 836766 64.80%
State Unranked Subtotal 119 43.43% 11000 35.32% 454908 35.23%
Total 274 100% 31144 100% 1291674 100%
The overlap between swine facilities and DO impaired watersheds is very minimal. As shown in Map 10, most swine facilities are located away from the DO impaired watersheds; only 19.77% of swine facilities are inside of them. They account for 17.32% of total swine animal units in the state. Although these ratios are slightly higher than those for poultry facilities, the averaged animal units in DO ranked watersheds are about one fourth of that for poultry and nearly one sixth of that for cattle. Overall, no close relationship is expected between DO priority ranks and swine operations. The largest cluster among the ranked watersheds is located in the northeastern area (watershed 03040402050), which ranks the third in total number of swine facilities, the fourth in total swine animal units, and the third in management priority. The impact of swine wastes is most likely to be felt in this area, but state wide, swine feeding operations do not appear to be a factor that contributes significantly to the DO impairment.
2002 Strom Thurmond Institute of Government and Public Affairs, Clemson University

12 SCWRC Report Lu & Allen
Animal Facilities and FC Impaired Watersheds Due to the fact that FC impairment is more widespread than other impairments, the FC ranked watersheds have more animal feeding facilities than any other impaired watersheds do. Map 13 shows that the majority of cattle facilities fall into FC impaired watersheds. In fact, FC ranked watersheds account for more than 73% of total cattle population, farms, and animal units in the state, far exceeding their shares in the total number (53.65%) and area (60.81%) and those of other individual animal groups (Table 5). More than half of cattle facilities are located in 44 watersheds ranked priority II, which include South Carolina’s two largest clusters of cattle facilities in the Saluda River Basin. It appears very likely that cattle wastes may have contributed to the FC impairment, especially in the above two watersheds, but not so in the coastal areas around Hilton Head, Charleston and Myrtle Beach where there are a number of impaired watersheds without any cattle feeding facilities.
Map 14 shows that most of poultry facilities are located in the unranked (50.09%) and the third ranked (33.53%) watersheds. The shares of FC ranked watersheds in the total number of poultry facilities and animal units are less than those in the total area of watersheds. This suggests that poultry’s impact on FC impairment may not be very significant. Poultry operations are probably not responsible for the fecal coliform bacteria problems in either aforementioned coastal areas or the middle part of the Upstate. However, poultry leads all animal groups in the averaged animal units in FC ranked watersheds. One cannot assume that there is no association between poultry operations and FC impairment. On the contrary, poultry wastes may be one of the major sources of FC bacteria in the watersheds around Lake Murray and along the upper reach of Lynches River where several large clusters of poultry facilities coexist with the FC ranked watersheds.
Overlap between swine facilities and FC impairment is not notable on Map 14. Most swine facilities tend to fill the gaps between FC ranked watersheds. Table 3 shows that FC ranked watersheds account for only 37.73% of the state’s swine facilities, three quarters of which are located within the third ranked watersheds. This figure is even smaller for swine population and animal units. There is a tendency that the higher the value of priority rank, the larger the average number of facilities becomes. This strongly suggests that swine feeding operations are not a major factor contributing to FC impairment in South Carolina. The most impressive concentration of swine facilities was found in the Little Pee Dee area, but impaired watersheds are only ranked priority III.
Animal Facilities and Phosphorus Impaired Watersheds Cattle facilities are expected to have some effects on phosphorus impairment because the largest cluster of cattle facilities is situated in one of a few P impaired watersheds as clearly shown in Map 17. Eleven ranked watersheds (4%) in this category account for more than a quarter (22.76%) of the total number of cattle facilities and this figure is four times their share (5.72%) of the state total in area covered. On the other hand, average cattle animal units of P ranked watersheds are more than three times those of unranked watersheds. This small but strong spatial correlation suggests that cattle wastes may have caused phosphorus problems in a few watersheds in South Carolina. The correlation is expected to become stronger in watershed number 030509150 right above Lake Murray in the Saluda River Basin, which ranks second in priority but first in number of cattle facilities. Cattle may also be related to P impairment in the Lower Catawba River System.
Although all but two P impaired watersheds have some poultry facilities, most (94.66%) of poultry facilities are located in unimpaired watersheds as in the case of DO impairment (Map 18). In addition, most of poultry facilities are located bellow the impaired watersheds or in different watershed systems. There are notable differences in shares between the number of poultry facilities and the area covered, but the averaged animal units of ranked watersheds are about 60% higher than those of unranked watersheds, suggesting that there is possibly a weak association between poultry operations and P impairment. Two upstream watersheds adjacent to Lake Murray are areas of problems most probably related to poultry agriculture.
2002 Strom Thurmond Institute of Government and Public Affairs, Clemson University

13 SCWRC Report Lu & Allen
Map 19 clearly shows that all P impaired watersheds but one are distributed in the upper part of the state while swine facilities are concentrated in the lower coastal plain. This spatial disparity suggests that there is no significant association between swine operations and phosphorus impairment in South Carolina. In fact, there are only 2.53% of swine facilities located within the P impaired watersheds. As a result, a positive correlation is possible between number of swine facilities and P priority ranks. As in many other cases described before, a small cluster of swine facilities was found in a ranked watershed above Lake Murray and most likely to have some negative impact. Overall, animal impacts on watersheds in terms of P impairment are at best a local issue because of the very few watersheds involved.
Animal Facilities and pH Impaired Watersheds There are many similarities for the spatial relationship between cattle facilities and pH impaired watersheds when compared to the previous three cases (Map 21). Eighteen ranked watersheds for pH impairment account for 27.41% of all cattle facilities, nearly three times their share in the total area covered. The latter suggests that cattle operations may have a significant contribution to pH related problems. A few more small cattle facility clusters were found in the impaired areas and there are a few more watersheds impaired by pH problems than those impaired by excessive phosphorus. In particular, cattle agriculture is presumed to have more serious impact on the sub-watersheds around Lake Murray.
Map 22 appears to be a little more complicated. Still, most large poultry facility clusters are not located in the ranked watersheds. Table 6 shows that 91.48% of poultry facilities are distributed in the unranked watersheds. The pH ranked watersheds have almost the same shares in numbers of facilities and animal units, but both are smaller than the area covered. This indicates that overall correlation between poultry agriculture and pH impairment, if any, is very weak state wide even though this is not the case in two problematic areas, the Saluda River and Little Lynches River watersheds.
Although pH impairment has a larger geographic extent, its intrusion in the Low Country areas is not far enough to reach the large swine facility clusters. The overlap between these two features is not extensive, as shown in Map 23. There are 109 swine facilities permitted in the pH impaired watersheds, accounting for only 7.46% of the state total. This suggests that swine production is not an important factor that affects watershed quality in terms of pH impairment, at least in a non-catastrophic environment.
Animal Facilities and Occurrence of Impairments To summarize the overall spatial coincidence between animal agriculture and watershed impairment, Maps 24-27 provide the overlay between all animal facilities and maps of occurrences of impairments related to DO, FC, P and pH. There are three things that are clearly shown in these maps.
First, most animal facilities are located in the unranked watersheds; only small clusters of animal facilities are located directly in the areas with all four types of impairments. This suggests qualitatively that if animal facilities are a factor that affects watershed impairment, their contributions are relatively small.
Second, cattle facilities appear to have the closest spatial association with watershed impairments because their largest cluster coincides with one of the two watersheds impaired by four causes. On the other hand, swine facilities, especially their large clusters, seem to stay away from the ranked watersheds, especially the areas with two or more problems. In other words, cattle rather than swine are more likely to be responsible for some watershed impairments, leaving poultry somewhere in between.
Finally, sub-watersheds in the Lower Saluda Basin, particularly the one right above Lake Murray, are impaired by all four pollutants and also have large clusters of cattle and poultry facilities (as well as some swine facilities). These are areas in which more research needs to be done at a local or smaller scale and mitigation measures should be taken.
2002 Strom Thurmond Institute of Government and Public Affairs, Clemson University

14 SCWRC Report Lu & Allen
Statistical Relationships between Animal Agriculture and Watershed Impairment
Descriptive Summaries of Animal Agriculture by Watershed Impairments
This research generated a series of tables that reflect the descriptive relationships between indicators of animal agriculture and watershed impairments in South Carolina. To complement the previous spatial analysis based only on the animal facilities, Tables 4 through 7 give the means, sub total and percentage of animal population, farms, facilities and units of cattle, poultry and swine by types of watershed impairments to complement the previous map-based analysis. Although the values and changes of population, farms and animal units across priority ranks may not necessarily be the same as those of animal facilities, they share similar spatial characteristics state wide.
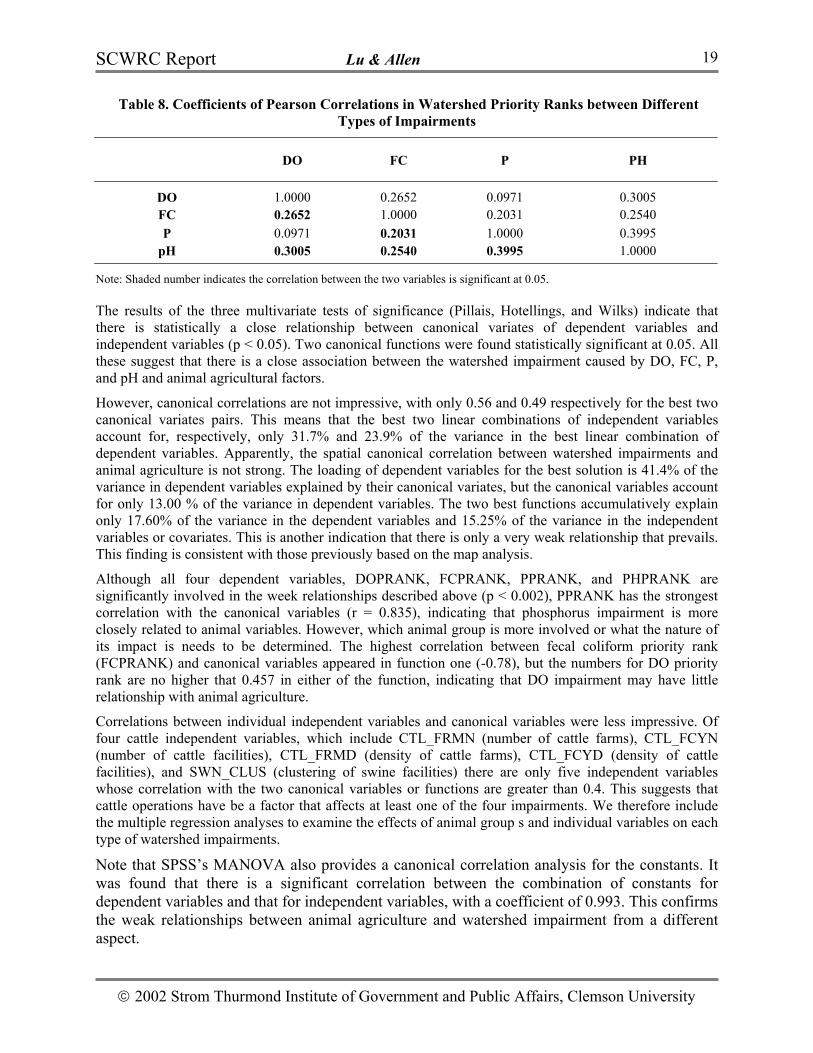
Table 8 provides the coefficients of the Pearson correlations between different types of impairments. Table A.2 in Appendix A provides a summary of the Pearson simple bivariate correlation analysis for all variables involved. The results indicate that all correlations in priority rank scores between different types of impairments are statistically significant (p<0.05) except for that between DO and P impairments. However, most correlation coefficients are very small, with the largest r less than 0.4 found between P and pH priority ranks, that is, the overlap between any two variables is statistically no more than 1.6%. This also indicates that areas with P impairment are more likely to have pH problems but not DO problems.
Bivariate correlations between animal variables and watershed priority ranks can be found in Appendix A. It was noted that simple correlation between each individual animal variable and watershed priority rank is very weak though statistically significant at α = 0.05. There is only one variable (Cattle farm count) whose coefficient with FC priority rank (r = 0.38) is greater than 0.3. There are more variables representing cattle agriculture that were found closely and negatively correlated with the priority ranks of the four impairments. These include four variables that were found significant in all cases. This suggests that cattle may have more impact than other animals. There are more significant variables in the swine category than in the poultry category, but the positive signs of simple coefficients suggest that swine may not have a negative impact on watershed quality. The poultry and other group each have two variables that were found closely related with two or three impairments, but the nature of those impacts are difficult to determine because they have different coefficient signs. This will be discussed later.
Data was screened using various methods before the final models were selected. Twelve of the 35 five independent variables were found to have collinearity problems with other variables during testing runs and thus excluded in the final analyses. As a result, each animal group was represented by seven variables instead of nine. Two general (combined) variables, number of building facilities (FCY_BLDG) and proximity to streams (D2S_HFML), were included in the second round test run, but D2S_HFML was found not statistically significant in all models while FCY_BLDG was not significant on eight of the nine occasions. Most importantly, due to its relative high correlations with animal units of poultry (r = 0.802) and number of poultry facilities (r = 0.675), including FCY_BLDG in the model suppressed the effects of other variables and resulted in coefficients difficult to interpret. These two variables thus were excluded in the final canonical and regression models.
Overall Relationship between Animal Agriculture and Watershed Impairments Canonical correlation analysis was performed in SPSS (MANOVA) using priority ranks of DO, FC, P and pH impairments as the dependent variables and 23 animal related variables as covariates (independent variables) to examine the overall relationship between watershed impairment and animal agriculture in terms of the correlation between the best linear combination of dependent variables and the best linear combination of the independent variables. The selected output of the canonical analysis from SPSS can be found in Table A.3 (Appendix A).
2002 Strom Thurmond Institute of Government and Public Affairs, Clemson University

15 SCWRC Report Lu & Allen
Table 4. Summary of Animal Population, Farms, Facilities and Units for DO* Impaired Watersheds
I
Ranked Priority Rank
II III Ranked Subtotal
Unranked Subtotal
State Total
Cattle Population Mean 3943 3406 1032 2155 1184 1322 Sub total 7885 54500 21677 84062 278237 362299
% of Total 2.18% 15.04% 5.98% 23.20% 76.80% 100% Farms Mean 33 46 41 42 38 38
Sub total 65 728 864 1657 8854 10511 % of Total 0.62% 6.93% 8.22% 15.77% 84.23% 100%
Facilities Mean 14 23 2 11 3 4 Sub total 27 361 35 423 741 1164
% of Total 2.32% 31.01% 3.01% 36.34% 63.66% 100% Animal Units Mean 5520 4769 1445 3018 1658 1851
Sub total 11039 76300 30347 117686 389528 507214 % of Total 2.18% 15.04% 5.98% 23.20% 76.80% 100%
Poultry Population Mean 199711 172058 56819 111424 122609 121017 Sub total 399422 2752933 1193190 4345545 28813003 33158548
% of Total 1.20% 8.30% 3.60% 13.11% 86.89% 100% Farms Mean 9 7 6 6 5 6
Sub total 17 105 123 245 1063 1308 % of Total 1.09% 6.76% 7.92% 18.73% 81.27% 100.00%
Facilities Mean 98 54 35 46 65 69 Sub total 195 861 731 1787 15342 17129
% of Total 1.03% 4.55% 3.86% 10.43% 89.57% 100.00% Animal Units Mean 3994 3441 1136 2228 2452 2738
Sub total 7988 55058 23864 86910 576257 663167 % of Total 1.20% 8.30% 3.60% 13.11% 86.89% 100%
Swine Population Mean 0 610 2035 1346 1067 1107 Sub total 0 9761 42743 52504 250731 303235
% of Total 0.00% 3.22% 14.10% 17.31% 82.69% 100% Farms Mean 7 8 7 8 5 5
Sub total 14 124 156 294 1071 1365 % of Total 1.03% 9.08% 11.43% 21.54% 78.46% 100%
Facilities Mean 0 5 10 7 5 5 Sub total 0 73 216 289 1173 1462
% of Total 0.00% 4.99% 14.77% 19.77% 80.23% 100% Animal Units Mean 0 244 814 539 427 443
Sub total 0 3905 17097 21002 100291 121293 % of Total 0.00% 3.22% 14.10% 17.32% 82.68% 100%
Number of Watersheds N 2 16 21 39 235 274 % 0.73% 5.84% 7.66% 14.23% 85.77% 100%
Area in Miles2 Area 230 2401 3818 6449 24695 31144 % 0.74% 7.71% 12.26% 20.71% 79.29% 100%
Total Animal Units Units 19027 135262 71309 225598 1066076 1291674 % 1.47% 10.47% 5.52% 17.46% 82.54% 100%
Note: * DO = Dissolved Oxygen
2002 Strom Thurmond Institute of Government and Public Affairs, Clemson University

16 SCWRC Report Lu & Allen
Table 5. Summary of Animal Population, Farms, Facilities and Units for FC* Impaired Watersheds
Ranked Unranked StatePriority Rank Ranked Subtotal Total I II III Subtotal
Cattle Population Mean 3111 2950 1272 1874 683 1322 Sub total 24891 129813 120830 275534 86765 362299
% of Total 6.87% 35.83% 33.35% 76.05% 23.95% 100% Farms Mean 66 71 43 53 22 38
Sub total 529 3110 4113 7752 2759 10511 % of Total 5.03% 29.59% 39.13% 73.75% 26.25% 100%
Facilities Mean 4 13 3 6 2 4 Sub total 29 586 250 865 299 1164
% of Total 2.49% 50.34% 21.48% 74.31% 25.69% 100% Animal Units Mean 4356 4130 1781 2624 956 1851
Sub total 34847 181739 169159 385745 121469 507214 % of Total 6.87% 35.83% 33.35% 76.05% 23.95% 100%
Poultry Population Mean 13409 136682 139069 131515 108864 121017 Sub total 107269 6013990 13211512 19332771 13825777 33158548
% of Total 0.32% 18.14% 39.84% 58.30% 41.70% 100% Farms Mean 6 7 5 6 3 5
Sub total 49 324 491 864 444 1308 % of Total 3.75% 24.77% 37.54% 66.06% 33.94% 100%
Facilities Mean 4 63 60 58 68 63 Sub total 29 2776 5744 8549 8580 17129
% of Total 0.17% 16.21% 33.53% 49.91% 50.09% 100% Animal Units Mean 268 2734 2781 2630 2177 2420
Sub total 2146 120278 264230 386654 276513 663167 % of Total 0.32% 18.14% 39.84% 58.30% 41.70% 100%
Swine Population Mean 78 448 780 643 1644 1107 Sub total 621 19712 74136 94469 208766 303235
% of Total 0.20% 6.50% 24.45% 31.15% 68.85% 100% Farms Mean 4 5 5 5 5 5
Sub total 35 227 515 777 588 1365 % of Total 2.56% 16.63% 37.73% 56.92% 43.08% 100%
Facilities Mean 1 3 4 4 7 5 Sub total 5 114 426 545 917 1462
% of Total 0.34% 7.80% 29.14% 37.28% 62.72% 100% Animal Units Mean 31 179 312 257 658 443
Sub total 248 7884 29654 37786 83507 121293 % of Total 0.20% 6.50% 24.45% 31.15% 68.85% 100%
Number of Watersheds N 8 44 95 147 127 274 % 2.92% 16.06% 34.67% 53.65% 46.35% 100%
Area in Miles2 Area 1307 6153 11477 18937 12207 31144 % 4.20% 19.76% 36.85% 60.81% 39.19% 100%
Total Animal Units Units 37241 309902 463043 810186 481488 1291674 % 2.88% 23.99% 35.85% 62.72% 37.28% 100%
Note: * FC = Fecal Coliform
2002 Strom Thurmond Institute of Government and Public Affairs, Clemson University

17 SCWRC Report Lu & Allen
Table 6. Summary of Animal Population, Farms, Facilities and Units for Phosphorus Impaired Watersheds
I
Ranked Priority Rank
II III Ranked Subtotal
Unranked Subtotal
State Total
Cattle Population Mean 0 3968 4212 4057 1208 1322 Sub total 0 27775 16849 44624 317675 362299
% of Total 0% 7.67% 4.65% 12.32% 87.68% 100% Farms Mean 0 86 95 90 36 38
Sub total 0 605 381 986 9525 10511 % of Total 0% 5.76% 3.62% 9.38% 90.62% 100%
Facilities Mean 0 31 12 24 3 4 Sub total 0 217 48 265 899 1164
% of Total 0% 18.64% 4.12% 22.76% 77.23% 100% Animal Units Mean 0 5555 5897 5679 1691 1851
Sub total 0 38885 23589 62474 444740 507214 % of Total 0% 7.67% 4.65% 12.32% 87.68% 100%
Poultry Population Mean 0 263805 56299 188348 118200 121017 Sub total 0 1846636 225197 2071833 31086715 33158548
% of Total 0.00% 5.57% 0.68% 6.25% 93.75% 100% Farms Mean 0 8 8 8 5 5
Sub total 0 58 33 91 1217 1308 % of Total 0.00% 4.43% 2.52% 6.96% 93.04% 100%
Facilities Mean 0 104 47 83 62 63 Sub total 0 726 189 915 16214 17129
% of Total 0.00% 4.24% 1.10% 5.34% 94.66% 100% Animal Units Mean 0 5276 1126 3767 2364 2420
Sub total 0 36932 4504 41436 621731 663167 % of Total 0.00% 5.57% 0.68% 6.25% 93.75% 100%
Swine Population Mean 0 1651 34 1603 1109 1107 Sub total 0 11556 137 11693 291542 303235
% of Total 0.00% 3.81% 0.05% 3.86% 96.14% 100% Farms Mean 0 6 2 4 5 5
Sub total 0 39 8 47 1318 1365 % of Total 0.00% 2.86% 0.59% 3.44% 96.56% 100%
Facilities Mean 0 5 1 3 5 5 Sub total 0 35 2 37 1425 1462
% of Total 0.00% 2.39% 0.14% 2.53% 97.47% 100% Animal Units Mean 0 660 14 425 443 443
Sub total 0 4623 55 4678 116615 121293 % of Total 0.00% 3.81% 0.05% 3.86% 96.14% 100%
Number of Watersheds N 0 7 4 11 263 274 % 0.00% 2.55% 1.46% 4.01% 95.99% 100%
Area in Miles2 Area 0 1018 763 1781 29363 31145 % 0.00% 3.27% 2.45% 5.72% 94.28% 100%
Total Animal Units Units 0 80440 28148 108588 1183086 1291674 % 0.00% 6.23% 2.18% 8.41% 91.59% 100%
2002 Strom Thurmond Institute of Government and Public Affairs, Clemson University

18 SCWRC Report Lu & Allen
Table 7. Summary of Animal Population, Farms, Facilities and Units for pH Impaired Watersheds
Ranked Unranked StatePriority Rank Ranked Subtotal Total I II III Subtotal
Cattle Population Mean 7885 5215 1543 3120 1196 1322 Sub total 7885 31289 16977 56151 306148 362299
% of Total 2.18% 8.64% 4.69% 15.51% 84.50% 100% Farms Mean 52 63 56 58 37 38
Sub total 52 377 619 1048 9463 10511 % of Total 0.49% 3.59% 5.89% 9.97% 90.03% 100%
Facilities Mean 27 41 4 18 3 4 Sub total 27 243 49 319 845 1164
% of Total 2.32% 20.88% 4.21% 27.41% 72.59% 100% Animal Units Mean 11039 7301 2161 4367 1674 1851
Sub total 11039 43805 23768 78612 428602 507214 % of Total 2.18% 8.64% 4.69% 15.51% 84.50% 100%
Poultry Population Mean 399422 253633 77249 153942 118702 121017 Sub total 399422 1521798 849739 2770959 30387589 33158548
% of Total 1.20% 4.59% 2.56% 8.36% 91.64% 100.00% Farms Mean 12 8 9 9 5 5
Sub total 12 49 95 156 1152 1308 % of Total 0.92% 3.75% 7.26% 11.93% 88.07% 100%
Facilities Mean 195 129 45 81 61 63 Sub total 195 772 493 1460 15669 17129
% of Total 1.14% 4.51% 2.88% 8.52% 91.48% 100.00% Animal Units Mean 7988 5073 1545 3079 2374 2420
Sub total 7988 30435 16995 55418 607749 663167 % of Total 1.20% 4.59% 2.56% 8.36% 91.64% 100%
Swine Population Mean 0 1582 1145 1227 1098 1107 Sub total 0 9489 12596 22085 281150 303235
% of Total 0.00% 3.13% 4.15% 7.28% 92.72% 100% Farms Mean 8 8 9 9 5 5
Sub total 8 46 100 154 1211 1365 % of Total 0.59% 3.37% 7.33% 11.28% 88.72% 100%
Facilities Mean 0 4 8 6 5 5 Sub total 0 26 83 109 1353 1462
% of Total 0.00% 1.78% 5.68% 7.46% 92.54% 100% Animal Units Mean 0 633 458 491 439 443
Sub total 0 3796 5039 8835 112458 121293 % of Total 0.00% 3.13% 4.15% 7.28% 92.72% 100%
Number of Watersheds N 1 6 11 18 256 274 % 0.36% 2.19% 4.01% 6.56% 93.43% 99.99%
Area in Miles2 Area 103 991 2019 3113 28031 31144 % 0.33% 3.18% 6.48% 9.99% 90.01% 100%
Total Animal Units Units 19027 78036 45801 142864 1148810 1291674 % 1.47% 6.04% 3.55% 11.06% 88.94% 100%
2002 Strom Thurmond Institute of Government and Public Affairs, Clemson University
19 SCWRC Report Lu & Allen
Table 8. Coefficients of Pearson Correlations in Watershed Priority Ranks between Different Types of Impairments
DO FC P PH
DO FC P
pH
1.0000 0.2652 0.0971 0.3005
0.2652 1.0000 0.2031 0.2540
0.0971 0.2031 1.0000 0.3995
0.3005 0.2540 0.3995 1.0000
Note: Shaded number indicates the correlation between the two variables is significant at 0.05.
The results of the three multivariate tests of significance (Pillais, Hotellings, and Wilks) indicate that there is statistically a close relationship between canonical variates of dependent variables and independent variables (p < 0.05). Two canonical functions were found statistically significant at 0.05. All these suggest that there is a close association between the watershed impairment caused by DO, FC, P, and pH and animal agricultural factors.
However, canonical correlations are not impressive, with only 0.56 and 0.49 respectively for the best two canonical variates pairs. This means that the best two linear combinations of independent variables account for, respectively, only 31.7% and 23.9% of the variance in the best linear combination of dependent variables. Apparently, the spatial canonical correlation between watershed impairments and animal agriculture is not strong. The loading of dependent variables for the best solution is 41.4% of the variance in dependent variables explained by their canonical variates, but the canonical variables account for only 13.00 % of the variance in dependent variables. The two best functions accumulatively explain only 17.60% of the variance in the dependent variables and 15.25% of the variance in the independent variables or covariates. This is another indication that there is only a very weak relationship that prevails. This finding is consistent with those previously based on the map analysis.
Although all four dependent variables, DOPRANK, FCPRANK, PPRANK, and PHPRANK are significantly involved in the week relationships described above (p < 0.002), PPRANK has the strongest correlation with the canonical variables (r = 0.835), indicating that phosphorus impairment is more closely related to animal variables. However, which animal group is more involved or what the nature of its impact is needs to be determined. The highest correlation between fecal coliform priority rank (FCPRANK) and canonical variables appeared in function one (-0.78), but the numbers for DO priority rank are no higher that 0.457 in either of the function, indicating that DO impairment may have little relationship with animal agriculture.
Correlations between individual independent variables and canonical variables were less impressive. Of four cattle independent variables, which include CTL_FRMN (number of cattle farms), CTL_FCYN (number of cattle facilities), CTL_FRMD (density of cattle farms), CTL_FCYD (density of cattle facilities), and SWN_CLUS (clustering of swine facilities) there are only five independent variables whose correlation with the two canonical variables or functions are greater than 0.4. This suggests that cattle operations have be a factor that affects at least one of the four impairments. We therefore include the multiple regression analyses to examine the effects of animal group s and individual variables on each type of watershed impairments.
Note that SPSS’s MANOVA also provides a canonical correlation analysis for the constants. It was found that there is a significant correlation between the combination of constants for dependent variables and that for independent variables, with a coefficient of 0.993. This confirms the weak relationships between animal agriculture and watershed impairment from a different aspect.
2002 Strom Thurmond Institute of Government and Public Affairs, Clemson University

20 SCWRC Report Lu & Allen
Group Effects of Animal Agriculture on Watershed Impairments by Animal Species
Multiple regression analysis was performed for each type of impairment and each animal group to examine differences in animals’ effects between animal groups and between impairment types. Unlike the full model, each of the 12 partial models used only seven independent variables representing each animal group. As a result, all but three partial models were found statistically significant at the significance level of 0.05. Similar to the findings from the canonical analysis, the association between each animal group and each type of watershed impairments is very weak, for no regression model can explain more than 15.10% of the variance in the priority ranks as shown in Table 9.
Table 9. Summary of R-Squares and Significant Tests of Regression Models for Watershed Impairment Priority Ranks as Functions of Cattle, Poultry and Swine Variables
Priority Rank R2
Cattle
Sig.
Poultry
R2 Sig. R2
Swine
Sig.
Combined
R2 Sig.
DO 0.0904 0.001 0.0460 0.081 0.0442 0.096 0.148 0.004 FC 0.1510 0.000 0.1398 0.000 0.0645 0.012 0.223 0.000 P
PH 0.1212 0.1050
0.000 0.000
0.0327 0.0514
0.257 0.048
0.0975 0.0799
0.000 0.002
0.254 0.213
0.000 0.000
In terms of R2, the effects of cattle are stronger than any other animal group in all impairment categories, with the largest R2 found for FC and the smallest on DO. Poultry are not statistically related to either phosphorus or DO priority ranks but have a slightly stronger effect on FC impairment (R2 = 0.1398). Swine, on the other hand, show the closest association with P impairment (R2 = 0.09750) but are not associated with DO impairment. These results are in agreement with what has been revealed from previous spatial analysis except for the close relationships between swine variables and P impairment and pH impairment, which will be discussed later.
It should be emphasized that due to the weak correlations between priority ranks of each type of impairment and individual independent variables or individual animal groups, the independent variables with relatively large simple correlation coefficients or animal groups with relatively high R-squares are not necessarily significant in the full model.
Animal Effects on Different Watershed Impairments
Sixteen multiple regression models were built to examine: (1) the main effect of all animal variables as a whole on each type of watershed impairments; (2) the group effect of cattle, poultry, and swine respectively on each type of impairment; (3) the individual effects of animal variables on each type of impairment. Table 9 provides a summary for the effectiveness of those models and Tables 10 through 15 list the parameter estimates of them.
Four regression models built for DO, PC, P and pH priority ranks using all 21 animal related variables were all found statistically significant as shown in Table 9, which suggests that there are close relationships between animal agriculture and the four types of watershed impairments in South Carolina.
However, the relationships are weak as indicated by the small values of R-square. All animal variables explained no more than 25.4% of the variances in watershed priority rank scores. This
2002 Strom Thurmond Institute of Government and Public Affairs, Clemson University

21 SCWRC Report Lu & Allen
is not surprising because both map-based analysis and canonical correlation have already revealed the similar relationships qualitatively. Table 9 shows that animal variables have generated a slightly better prediction for phosphorus impairment than any other impairment. This does not necessarily mean that that all animal variables have negative effects on priority rank scores. It was noticed that the sum of R-squares of three partial models developed for the P impairment using group (cattle, poultry, and swine) variables only is smaller than that of the full model (0.1212 + 0.0327 + 0.0975 = 0.2514 < 0.2540). This is an indication that there exist some suppressing variables that have helped improve prediction. Nevertheless, animal agriculture is less accountable for DO impairment.
DO Impairment and Animal Agriculture A regression analysis was performed using DOPRANK as a function of 21 animal variables to examine the possible relationship between DO impairment and animal agriculture. The regression model was found statistically significant (F = 2.084, df = 23, 273, p < 0.05), indicating that there is an association between DO impairment and animal agricultural variables. However, this association is very weak, as animal variables altogether accounted for only 14.8% of the variance in the priority rank scores of DO impairment. The R-square of the model is the smallest among those of all full models.
Table 10. Parameter Estimates of Regression Model for DO Priority Rank
Unstandardized Standardized Variable Name Coefficients Coefficients t Sig.
B Std. Error Beta
(Constant) 3.8239 0.0654 58.5091 0.0000 CTL_FRMN 0.0022 0.0018 0.1748 1.1730 0.2419 CTL_FCYN -0.0199 0.0068 -0.5780 -2.9091 0.0039 CTL_AUNT 0.0000 0.0000 0.1958 0.8555 0.3931 CTL_FRMD 0.1099 0.2057 0.0620 0.5341 0.5937 CTL_FCYD 0.8004 1.1905 0.1290 0.6723 0.5020 CTL_UNTD -0.0029 0.0037 -0.1636 -0.7910 0.4297 CTL_CLUS 0.0053 0.0028 0.2086 1.9070 0.0577 PRY_FRMN -0.0333 0.0174 -0.3188 -1.9078 0.0576 PRY_FCYN 0.0003 0.0004 0.0749 0.6439 0.5202 PRY_AUNT 0.0000 0.0000 0.2168 1.0300 0.3040 PRY_FRMD 1.1605 1.0936 0.1337 1.0611 0.2896 PRY_FCYD 0.0256 0.0367 0.0846 0.6961 0.4870 PRY_UNTD -0.0008 0.0017 -0.1013 -0.4844 0.6285 PRY_CLUS -0.0002 0.0002 -0.0903 -0.7873 0.4318
SWN_FRMN -0.0093 0.0124 -0.0849 -0.7523 0.4526 SWN_FCYN -0.0058 0.0095 -0.1403 -0.6030 0.5470 SWN_AUNT 0.0001 0.0001 0.1560 0.7230 0.4703 SWN_FRMD -0.7168 1.2982 -0.0530 -0.5522 0.5813 SWN_FCYD 0.5700 0.9722 0.0987 0.5863 0.5582 SWN_UNTD -0.0010 0.0102 -0.0164 -0.0972 0.9226 SWN_CLUS -0.0012 0.0039 -0.0383 -0.3157 0.7525
2002 Strom Thurmond Institute of Government and Public Affairs, Clemson University

22 SCWRC Report Lu & Allen
There is only one independent variable, number of cattle facilities (CTL_FCYN), which was found responsible for the weakest relationship at the significance level of 0.05. This is clearly shown in Map 14 that only cattle facilities have substantial overlaps with DO impaired watersheds. The negative sign of its regression coefficient indicates that increase in cattle facilities may aggravate the DO impairment. Note that poultry and swine variables had no effect in the model, but the constant term of the model was found significantly different from zero, as in all other regression models used in this research. In other words, DO priority ranks can be predicted fairly well with a constant, which suggests that the effects of animal variables are very weak.
FC Impairment and Animal Agriculture The weak relationship also prevails between FC impairment ranks and animal agriculture, F = 3.435, p < 0.05, and R2 = 0.223. All animal variables as a whole accounted for only 23.3% of the variance in FC priority ranks, though the R-square of the model is the second largest found in the research.
Table 11. Parameter Estimates of Regression Model for FC Priority Rank
Unstandardized Standardized Variable Name Coefficients Coefficients t Sig.
B Std. Error Beta
(Constant) 3.4582 0.0898 38.5307 0.0000 CTL_FRMN -0.0021 0.0025 -0.1159 -0.8140 0.4164 CTL_FCYN -0.0001 0.0094 -0.0013 -0.0067 0.9946 CTL_AUNT 0.0000 0.0000 0.0005 0.0024 0.9981 CTL_FRMD -0.3517 0.2825 -0.1381 -1.2450 0.2143 CTL_FCYD -0.7613 1.6349 -0.0854 -0.4657 0.6419 CTL_UNTD 0.0005 0.0051 0.0186 0.0939 0.9253 CTL_CLUS 0.0010 0.0038 0.0270 0.2581 0.7965 PRY_FRMN -0.0548 0.0239 -0.3654 -2.2890 0.0229 PRY_FCYN 0.0001 0.0006 0.0243 0.2188 0.8270 PRY_AUNT 0.0000 0.0000 0.0771 0.3834 0.7018 PRY_FRMD 1.5584 1.5018 0.1249 1.0376 0.3004 PRY_FCYD 0.0231 0.0505 0.0531 0.4575 0.6477 PRY_UNTD 0.0000 0.0023 -0.0034 -0.0171 0.9864 PRY_CLUS 0.0003 0.0003 0.1327 1.2117 0.2268
SWN_FRMN 0.0040 0.0170 0.0252 0.2339 0.8153 SWN_FCYN -0.0096 0.0131 -0.1626 -0.7315 0.4651 SWN_AUNT 0.0001 0.0001 0.2377 1.1533 0.2499 SWN_FRMD 0.0130 1.7828 0.0007 0.0073 0.9942 SWN_FCYD 0.4004 1.3352 0.0482 0.2999 0.7645 SWN_UNTD -0.0165 0.0140 -0.1901 -1.1798 0.2392 SWN_CLUS 0.0102 0.0054 0.2216 1.9145 0.0567
The number of poultry farms (PRY_FRMN) is the only variable accountable for the weak relationship. Its negative regression coefficient indicates that the more poultry farms a watershed has, the more probable it becomes impaired with fecal coliform bacteria. It is easy to understand that swine operations are not a negative factor because the maps have shown no significant
2002 Strom Thurmond Institute of Government and Public Affairs, Clemson University

23 SCWRC Report Lu & Allen
overlaps between swine facilities and FC impaired watersheds and eight of nine swine variables are positively correlated with FC priority ranks. It is notable that all cattle variables except for one were individually correlated with FC priority ranks, but none of them were found to have a greater effect than the number of poultry farms. The only explanation is that poultry farms are the most widely spread animal farms whereas fecal coliform bacteria are the most widely spread impairment in South Carolina. Nonetheless, the overall weak relationship and few significant independent variables suggest that animal agriculture is far from one of the major sources of fecal coliform bacteria in South Carolina.
Phosphorus Impairment and Animal Agriculture Statistical results indicate that the 21 animal variables provided a slightly better explanation for Phosphorus priority rank scores than for any other impairment (F = 4.076, p < 0.05, R2 = 0.254). The R-square of the regression model is the highest among all regression models yet very small in an absolute sense. The finding is in congruence with that based on aforementioned canonical analysis. However, it would be wrong to conclude that animal agriculture is a more important contributor to the phosphorus pollution than to others because there are variables that do not have negative effects and variables that are suppressors.
Table 12. Parameter Estimates of Regression Model for Phosphorus Priority Rank
Unstandardized Standardized Variable Name Coefficients Coefficients t Sig.
B Std. Error Beta
(Constant) 3.9686 0.0357 111.0482 0.0000 CTL_FRMN -0.0022 0.0010 -0.2976 -2.1338 0.0338 CTL_FCYN -0.0160 0.0037 -0.7970 -4.2859 0.0000 CTL_AUNT 0.0000 0.0000 0.4682 2.1858 0.0298 CTL_FRMD 0.0659 0.1125 0.0637 0.5858 0.5585 CTL_FCYD 1.0847 0.6510 0.2993 1.6662 0.0969 CTL_UNTD -0.0022 0.0020 -0.2077 -1.0731 0.2843 CTL_CLUS 0.0024 0.0015 0.1609 1.5721 0.1172 PRY_FRMN 0.0003 0.0095 0.0051 0.0323 0.9742 PRY_FCYN 0.0002 0.0002 0.0986 0.9056 0.3660 PRY_AUNT 0.0000 0.0000 0.0697 0.3539 0.7237 PRY_FRMD 0.3100 0.5980 0.0612 0.5185 0.6046 PRY_FCYD 0.0203 0.0201 0.1151 1.0115 0.3127 PRY_UNTD -0.0003 0.0009 -0.0593 -0.3028 0.7623 PRY_CLUS -0.0003 0.0001 -0.2450 -2.2829 0.0233
SWN_FRMN 0.0037 0.0068 0.0578 0.5475 0.5845 SWN_FCYN -0.0086 0.0052 -0.3603 -1.6543 0.0993 SWN_AUNT 0.0002 0.0000 0.7585 3.7553 0.0002 SWN_FRMD 0.1359 0.7099 0.0172 0.1915 0.8483 SWN_FCYD 1.4968 0.5316 0.4439 2.8156 0.0053 SWN_UNTD -0.0322 0.0056 -0.9136 -5.7876 0.0000 SWN_CLUS 0.0008 0.0021 0.0446 0.3932 0.6945
2002 Strom Thurmond Institute of Government and Public Affairs, Clemson University

24 SCWRC Report Lu & Allen
Table 13. Parameter Estimates of Regression Model for pH Priority Rank
Unstandardized Standardized Variable Name Coefficients Coefficients t Sig.
B Std. Error Beta
(Constant) 3.9929 0.0426 93.7588 0.0000 CTL_FRMN 0.0012 0.0012 0.1445 1.0091 0.3139 CTL_FCYN -0.0184 0.0045 -0.7858 -4.1166 0.0001 CTL_AUNT 0.0000 0.0000 0.3932 1.7881 0.0750 CTL_FRMD -0.0091 0.1341 -0.0076 -0.0682 0.9457 CTL_FCYD 1.0720 0.7757 0.2548 1.3819 0.1682 CTL_UNTD -0.0039 0.0024 -0.3196 -1.6083 0.1090 CTL_CLUS 0.0035 0.0018 0.2029 1.9308 0.0546 PRY_FRMN -0.0234 0.0114 -0.3312 -2.0628 0.0402 PRY_FCYN 0.0000 0.0003 -0.0131 -0.1174 0.9066 PRY_AUNT 0.0000 0.0000 0.3306 1.6345 0.1034 PRY_FRMD 0.6100 0.7126 0.1036 0.8560 0.3928 PRY_FCYD 0.0121 0.0239 0.0590 0.5053 0.6138 PRY_UNTD -0.0004 0.0011 -0.0721 -0.3590 0.7199 PRY_CLUS -0.0002 0.0001 -0.1660 -1.5070 0.1331
SWN_FRMN -0.0073 0.0080 -0.0983 -0.9072 0.3652 SWN_FCYN -0.0099 0.0062 -0.3575 -1.5994 0.1110 SWN_AUNT 0.0002 0.0001 0.6365 3.0700 0.0024 SWN_FRMD -0.1235 0.8459 -0.0135 -0.1460 0.8840 SWN_FCYD 1.5956 0.6335 0.4076 2.5187 0.0124 SWN_UNTD -0.0281 0.0066 -0.6856 -4.2307 0.0000 SWN_CLUS 0.0008 0.0025 0.0377 0.3239 0.7463
There are a total of seven significant independent variables in this model, the most in terms of numbers among all regression models. Three of them, which include number of cattle farms (CTL_FRMN), number of cattle facilities (CTL_FCYN), and concentration of poultry facilities (FRY_CLUS) have negative effects on P priority rank scores whereas swine animal units (SWN_AUNT) and swine facility density all have positive regression coefficients. Three other responsible independent variables, which include cattle animal units (CTL_AUNT), number of swine facilities (SWN_FCYN), and swine animal unit density (SWN_UNTD), were found to be suppressors because their regression beta weights and Pearson correlation coefficients have different signs. These suppressor variables may not be necessarily correlated individually with the dependent variable or have the same coefficient signs for both simple correction or beta weights but they help to increase the prediction power of the regression model. This explains why the R-square of the full model is greater than the sum of those of the partial models developed respectively for cattle, poultry and swine. Despite this complexity, cattle operations, not swine operations, are most likely to have an adverse impact on watershed quality in terms of phosphorus impairment.
pH Impairment and Animal Agriculture The results shown in Table 6 indicate that there is close relationships between pH priority ranks and animal variables, F = 3.084, p > 0.05, and R2 = 0.221. Similarly, the relationship is very weak in terms of the variance in the priority rank scores that have been explained, which is only 21.3%. Even so, one
2002 Strom Thurmond Institute of Government and Public Affairs, Clemson University

25 SCWRC Report Lu & Allen
cannot say that animal agriculture is responsible for 21.3% of pH impairment because, as in the case of Phosphorus impairment, swine variables have no negative effects and two suppressor variables cause confusion.
Five independent variables were found responsible for this weak relationship. Of them, the number of cattle facilities (CTL_FCYN) and number of poultry farms (PRY_FRMN) have negative regression coefficients, indicating that cattle and poultry operations may have contributed to the pH related impairment. On the other hand, two swine variables, including swine animal units (SWN_AUNT) and swine facility density (SWN_FCYD), have positive beta weights, suggesting that swine operations are not a factor that has aggravated pH impairment problems. Swine animal unit density (SWN_UNTD), which is positively correlated with pH priority ranks, was found to have a negative beta weight, indicating that it is a suppressor.
Table 14. Parameter Estimates of Regression Model for Occurrences of Impairments
Unstandardized Standardized Variable Name Coefficients Coefficients t Sig.
B Std. Error Beta
(Constant) 0.5462 0.0942 5.7959 0.0000 CTL_FRMN -0.0001 0.0027 -0.0075 -0.0523 0.9583 CTL_FCYN 0.0198 0.0099 0.3847 2.0099 0.0455 CTL_AUNT 0.0000 0.0000 -0.0759 -0.3442 0.7310 CTL_FRMD 0.2457 0.2966 0.0927 0.8284 0.4082 CTL_FCYD -1.1120 1.7165 -0.1197 -0.6478 0.5177 CTL_UNTD -0.0002 0.0053 -0.0074 -0.0373 0.9703 CTL_CLUS -0.0028 0.0040 -0.0727 -0.6904 0.4905 PRY_FRMN 0.0613 0.0251 0.3923 2.4376 0.0155 PRY_FCYN -0.0003 0.0006 -0.0522 -0.4661 0.6415 PRY_AUNT 0.0000 0.0000 -0.2076 -1.0239 0.3068 PRY_FRMD -1.8170 1.5768 -0.1399 -1.1523 0.2503 PRY_FCYD -0.0544 0.0530 -0.1202 -1.0263 0.3058 PRY_UNTD 0.0016 0.0024 0.1371 0.6804 0.4969 PRY_CLUS -0.0001 0.0003 -0.0304 -0.2751 0.7834
SWN_FRMN 0.0131 0.0178 0.0799 0.7355 0.4627 SWN_FCYN 0.0176 0.0138 0.2873 1.2819 0.2010 SWN_AUNT -0.0004 0.0001 -0.5810 -2.7951 0.0056 SWN_FRMD -0.4327 1.8718 -0.0214 -0.2312 0.8174 SWN_FCYD -2.8181 1.4018 -0.3262 -2.0103 0.0455 SWN_UNTD 0.0466 0.0147 0.5160 3.1761 0.0017 SWN_CLUS 0.0015 0.0056 0.0309 0.2645 0.7916
Impairment Occurrences and Animal Agriculture An additional regression analysis was performed using the occurrences of impairments as the dependent variable. The results indicate that there is a close relationship between the number of types of impairments and animal variables, F = 3.179 and p < 0.05. The relationship was also found to be very
2002 Strom Thurmond Institute of Government and Public Affairs, Clemson University

26 SCWRC Report Lu & Allen
weak, for all 21 animal variables explained only 20.9% of the variance in occurrences of types of impairments in question.
Five independent variables that are accountable for pH impairments were also found to be the significant contributors to the weak relationship. Since a different coding system was used in this case, the positive sign of a regression coefficient means the negative impact. The results indicate that as the numbers of cattle facilities and poultry farms increase, the chances for a watershed to be polluted by multiple sources will also increase, but this is not the case as swine animal units and facility density increase. Statistically, swine factors are not the causes of watershed impairments in South Carolina.
2002 Strom Thurmond Institute of Government and Public Affairs, Clemson University

27 SCWRC Report Lu & Allen
CHAPTER IV
DISCUTION, LIMITATION AND IMPLICATION
Summary of Major Findings There are five major findings from this research. First, there is an association between animal agriculture and DO, FC, P, and pH impairment in South Carolina even though the strength of the relationship varies with the type of impairment involved and animal groups, and geographic areas or watersheds.
Second, the overall associations, no matter in terms of spatial overlaps, canonical correlation, multiple regression or Pearson correlation, are all very weak. This suggests that animal agriculture in the state is not the major source of watershed impairment.
Third, it appears that cattle have slightly larger impacts whereas swine do not show any significant overlap with any types of impairments nor are they statistically associated with any of them. They are not an important factor that would aggravate the impairments in the state of South Carolina. Numbers of cattle facilities and poultry farms may be indicators of impaired watersheds while swine factors may be indicators of unimpaired watersheds.
Fourth, Fecal coliform bacteria are a pollution indicator that was the most widely spread in space and impaired 147 of 274 watersheds. The scarcity of P impairments implies that DO and pH impairment may have been caused by other nutrients and factors that may not be associated with animal agriculture.
Finally, there are several watersheds that have been identified as problem areas with relative higher priority ranks and larger clusters of animal facilities.
Causes of Weak Associations The results of map analysis, simple correlation, canonical correlation, and multiple regression all indicate that animal agriculture has some statistically significant effects on watershed impairment as measured by DO, FC, P or pH priority ranks. This may have resulted from animal regulations over the last three decades. There are also other explanations for these weak relationships.
First, there are multiple causes of DO, FC, P, and pH related pollutions other than animal manures. According Boering et al (1999), animal manure, for example, accounts for only 5% of nitrogen found in the streams in the area around the Gulf of Mexico. Both nutrients and fecal coliform can come from many other sources or human activities including industrial wastes, human wastes, urban runoff, chemical fertilizers of agriculture, golf courses, wildlife, and natural environments. It is possible that animal agricultural share in the amount of variances in watershed priority ranks will become smaller even if all other factors are taken into considerations in the regression models.
Second, the incomplete data sets may not reveal the entire picture of the relationships between animal agriculture and watershed impairment. For example, the research used only phosphorus impairment data for analysis and other types nutrients such as nitrogen and potash were not included because they were not ranked as impairment problems in South Carolina. Research shows that a unit liveweight of cattle, poultry or swine generate more nitrogen than phosphorous in manure. A unit liveweight of cattle or swine also produces more potash than phosphorus. The nitrogen to phosphorus ratio may be changed in other areas unimpaired by phosphorus problems where close associations exist between nutrients and DO.
2002 Strom Thurmond Institute of Government and Public Affairs, Clemson University

28 SCWRC Report Lu & Allen
Third, due to the complexity of environmental systems and factors involved, the relationships between animal variables and watershed impairments are nonlinear. Both canonical correlation and multiple regression models used in this research are basically linear models and thus may not be appropriate for representing the reality that is chaotic in nature. Nevertheless, the analysis presented indicates that animal agriculture is not the major cause of watershed impairment in South Carolina.
Differentiation of Animal Impacts Cattle agriculture appears to have a closer spatial correlation with the four impairment problems based on the spatial and statistical analyses. This can be explained in the following ways. First of all, cattle have the highest average animal units per facility and per farm among the three animal groups. Per facility or farm wastes are also high and correspondingly so are the pollutants. In addition, cattle have the highest degree of concentrations in facilities and the cumulative impact is relative large. Furthermore, most cattle facilities, especially those that coexist with impaired watersheds, are located in the west and northwest regions where slope is relatively steeper than the coastal areas. Animal wastes from cattle facilities or animal manure that were applied to the fields may be more easily washed into streams by runoff.
It is surprising that the number of poultry farms, not the number of poultry facilities or animal units, was found to be a better indicator of watershed impairment on several occasions. This may be because the capacity of each poultry facility is relative small though the total number is large. The average animal units per facility are very small compared to those for cattle. Poultry farms, on the other hand, which include only those whose annual sale of animal products are greater than one thousand dollars, are relatively large. The wastes generated per farm are more than those per facility. However, several watersheds with the largest clusters of poultry facilities are not impaired by any of the four problems, suggesting that larger facilities may have better waste management plans or measures.
There are also three factors that help to explain why swine operations are not a negative factor in watershed impairment. First, swine population is the smallest among three animal groups, so are the equivalent total animal units. Everything else being equal, the impact of the swine population should be the smallest. Next, most swine are raised within facilities which are often better equipped for waste management. Implementation of animal facility permitting systems also has had some positive effect. Lastly, most swine operations are located in the interior areas of the flat coastal plain region where soil erosion and runoff are relatively low, though the areas are prone to storm surges.
It is noted that animal population or animal units were not found to be a significant variable in canonical correlation or in the regression models. This is different from what was expected because animal wastes, which are a function of animal population or animal weights, are the real sources of pollutants. If the finding correctly reflects the reality, continuing growth of animal populations or animal the agricultural economy should not be considered a threat to the environment. Efforts in controlling animal related pollution should focus on aspects of animal waste operations.
Distribution of Problem Areas From the maps generated in this research, one can identify the problem areas such as watersheds impaired DO, FC, P or pH problems, watersheds with serious impairment, watersheds with multiple pollution problems, watersheds with pollution probably caused by animal operations, or areas with any combinations. What is worth further discussing is those closely related to animal agriculture.
At the 5-digit level, impairment problems prevail in the Saluda-Wateree-Santee system whereas no serious animal-related pollution problems in the Savanna River system. At the 8-digit level, three major concentration areas can be found in the Saluda, Lower Catawba-Wateree and Lake Marion watersheds.
2002 Strom Thurmond Institute of Government and Public Affairs, Clemson University

29 SCWRC Report Lu & Allen
They are not the largest agricultural areas in terms of either animal operations or crop production. This leaves researchers to speculate about the true causes of watershed impairment in these areas. Industries such as old textile mills along the Saluda and Wateree rivers, upstream urban centers such as Greenville, Spartanburg, Greenwood, Rock Hill, Charlotte and Columbia, and intensive recreational uses of streams flowing into Lake Murray, Lake Marion and Lake Moultrie, may have more impact on water quality in the areas than does animal agriculture. A map with human population overlaid on the FC impaired watersheds indicates that there is strong spatial correlation between the two.
However, animal agriculture is likely responsible for a few regional or local watershed impairments, particularly in the watershed right above Lake Murray. This watershed has the largest cluster of cattle facilities and cattle units, the top 8 largest clusters of poultry facilities and the top 15 swine animal units. All together these make the watershed rank third in total animal units in the state. Furthermore, this watershed has one of the largest areas of cropland in upstate South Carolina where animal wastes are commonly applied to the crop fields for fertilization. It is assumed that large amounts of excessive nutrients and bacteria carrying wastes have been washed into waterbodies mainly through the surface flow and therefore contribute to multiple pollution problems. More regional or local scale research is needed for identifying and isolating the true causes.
Limitation of the Study Although the research has provided spatial and qualitative analyses with better data, it cannot for certain determine the exact cause-effect relationships. The non-linearity or chaotic nature of complex human and natural systems cannot be fully represented by any statistical or mathematic models. One single pollution event may cause serious problems in other geographic areas and may vary over regions and over time. This is extremely difficult to integrate into a statistical model.
Due to the inconsistency in scales and units of spatial data, data has to be aggregated in the watershed units for mapping and statistical analyses. This process introduces errors and adds some uncertainties to the findings. Original data from the census of agriculture are also notorious for errors and thus its reliability is questionable. Animal facility permits, which were collected for purposes other than the analysis presented here, are relatively good at providing locations but do not have items that can be used for a comprehensive analysis.
It is admitted that no study would be considered complete if variables representing other human systems and natural systems are excluded in the research. The relationships revealed in this research may have been different if other variables were taken into equations. As for animal agriculture, variables such as size of farms, facility capacities and others were not considered. Certain spatial variables that reflect spatial patterns of each feature and its relationships with other locations and other features were either not available or not included; and interaction terms were not included. Time and financial resources also limited the amount of variables included in the study.
Policy Implication The findings of this research have several important policy implications in environmental protection and watershed management. First, because there is a statistical relationship between animal agriculture and watershed impairment, animal agricultural factors should be taken into consideration in policy-making at the state level. This makes it necessary to continue regulate animal facilities and agricultural practices for better environmental quality. Although the relationship is very weak, certain regulations and best management practices will always be necessary to protect rivers and streams.
Second, since there is only a very weak relationship between animal agriculture and watershed impairment, it would be wise to continue searching for and target the more important causes of watershed pollution. Animal variables as a whole explained at maximum about 25% of the variance in priority rank scores. This not only indicates that animal agriculture is not the major factor that affects water quality but
2002 Strom Thurmond Institute of Government and Public Affairs, Clemson University

30 SCWRC Report Lu & Allen
also strongly suggests that other factors may be primary causes of the impairment problems. For more effective watershed management with limited resources, state agencies should make more effort in identifying and controlling other human activities that are most likely contributing to watershed impairment.
Third, fecal coliform impairment is the most serious one among all four types of impairments studied in many aspects and thus should be a priority for management actions. More than half of the watersheds in the state have FC problems; there are more watersheds with the top and second rank for FC than any other impairment. Furthermore, FC impairment is the one that most threatens human use of water. It also ranked second next to phosphorus in terms of total variance explained by animal variables. Phosphorus impairment appears to be a local or regional problem. Phosphorus, the only nutrient ranked and studied, may need to be targeted for environmental control related to animal agriculture. DO and pH are secondary or indirect impacts of excessive nutrients released to the waterbodies. Their true causes should be identified before proper action is taken.
Fourth, it suggests, that more attention may need to be paid to cattle than to swine if animal groups are to be differentiated for regulatory management targeting. Although it is difficult to differentiate the effects of animal agriculture between animal groups and across impairment types because of weak relationships, cattle was found to a slightly higher contributor of the current impairments. In contrast, swine are not accountable for the observed problems in South Carolina. Nonetheless, it should be emphasized that, as in North Carolina, most swine facilities are located in the coastal regions that are prone to natural disasters such hurricanes. While cattle livestock should be targeted for possible action in pollution mitigation, strategic disaster management plans may need to be implemented for swine facility operations to ensure environmental protection.
Finally, it appears appropriate to have spatially differentiated watershed management plans if a similar polity is not possible. Although the 303(d) list for 2000 has prioritized the watersheds for individual impairment, areas with multiple problems, higher priority ranks, and more severe pollution should be targeted first. These areas are identifiable from the maps generated in the project and additional information about them can also be easily extracted from the GIS database. As for an animal agriculture-oriented watershed management plan, watersheds in the Saluda River Basin above Lake Murray should be the focus of management efforts and future research because that is where multiple impairment problems are overlapped and different animal facilities are highly clustered.
2002 Strom Thurmond Institute of Government and Public Affairs, Clemson University

31 SCWRC Report Lu & Allen
CHARPTER V
CONCLUSION
The relationship between watershed impairment and animal agriculture is very complicated in nature because so many factors are involved and constantly changing over time and space. This research has attempted to examine the relationship from a spatial, macro, and empirical approach with a hope of generating information useful for policymaking at the state level.
It was found that 155 out of 274 watersheds in the 11-digit hydraulic units have been impaired by DO, FC, P, or pH problems, among which fecal coliform bacteria are the most widely spread problems in South Carolina. The results of both spatial and statistical analyses indicate that there are only very weak, though statistically significant, associations between animal agriculture and the impairments in this state. This suggests that there are some non-animal agriculture factors that are major contributors of watershed impairment problems in concern. Nevertheless, cattle facilities appear to have slightly larger impact on watershed quality than poultry farms do whereas swine operations are not a negative factor that aggravates the watershed impairment in this state. In addition, 28 maps were generated to demonstrate the distribution of watershed impairment, animal agriculture and their relationships. Some problem areas have been identified.
The findings may not truthfully reflect the reality due to data constraints, inappropriate variables, or simplified models, but it would be unwise to ignore the impact of animal agriculture or relax any existing regulation due to the nature of the problem. So would it be disastrous to target animal agriculture as the sole cause of DO, FC, P and pH problems, for other factors account for 75- 85% of the variances in priority rank scores and are left out of the equation. To fully understand the causes of watershed impairments, scientists should not only continue to search for better animal agriculture variables and conduct analyses using finer spatial units, but also attempt to incorporate all possible factors (natural, human, and animal) into models and take catastrophic events into consideration in their future research. In particular, watersheds with higher impairment priority ranks and larger clusters of animal facilities should be chosen as study areas for a smaller scale of research.
It is recommended that state policies on animal regulations and environmental standards acknowledge the differences among impairment types, animal groups and geographic regions. More efforts should be made in control and reduction of pollution from cattle feeding operations especially in the areas with higher priority ranks and larger clusters of animal facilities. Limited resources should focus on identification and control of non-animal agricultural factors that are major causes of the four impairment problems in South Carolina. We may not be immune from all negative environmental impacts due to incompatible activities, but we can avoid the worst scenarios with informed and wise decisions.
2002 Strom Thurmond Institute of Government and Public Affairs, Clemson University

SCWRC Report
ANIMAL AGRICULTURE AND WATERSHED IMPAIRMENT IN SOUTH CAROLINA
A GIS-Based Spatial Assessment
APPENDICES
TABLES AND MAPS
By
Kang S. Lu and Jeffery S. Allen
South Carolina Water Resources Center Strom Thurmond Institute of Government and Public Affairs
Clemson University Perimeter Rd, Clemson, SC 29634
May 2002
www.strom.clemson.edu
SCWRC Report Lu & Allen
APPENDICES
TABLES AND MAPS
2002 Strom Thurmond Institute of Government and Public Affairs, Clemson University

33 SCWRC Report Lu & Allen
Appendix A: Tables
Table A.1 Variables and Measurements
Variable Name Variables Type Units of Measurements
Impairment DOPRANK Priority Rank for DO Impairment Ordinal 1 - 4 FCPRANK Priority Rank for FC Impairment Ordinal 1 - 4 PPRANK Priority Rank for P Impairment Ordinal 1 - 4
PHPRANK Priority Rank for pH Impairment Ordinal 1 - 4 DOFCPPHF Occurrence of Impairment Problems Continuous 0 - 4
Cattle CTL_POPN Cattle Population Continuous Head Counts CTL_FRMN Cattle Farms Continuous Counts CTL_FCYN Cattle Facilities Continuous Counts CTL_AUNT Cattle Animal Units Continuous Total Counts CTL_POPD CTL_FRMD CTL_FCYD CTL_UNTD
Cattle Population Density Cattle Farm Density
Cattle Facility Density Cattle Animal Unit Density
Continuous Continuous Continuous Continuous
Counts/Mile2
Counts/Mile2
Counts/Mile2
Counts/Mile2
CTL_CLUS Cattle Facility Cluster Continuous Counts Poultry PRY_POPN
PRY_FRMN PRY_FCYN PRY_AUNT PRY_POPD PRY_FRMD PRY_FCYD PRY_UNTD PRY_CLUS
Poultry Population Poultry Farms
Poultry Facilities Poultry Animal Units
Poultry Population Density Poultry Farm Density
Poultry Facility Density Poultry Animal Unit Density
Poultry Facility Cluster
Continuous Continuous Continuous Continuous Continuous Continuous Continuous Continuous Continuous
Head Counts Counts Counts
Total Counts Counts/Mile2
Counts/Mile2
Counts/Mile2
Counts/Mile2
Counts Swine SWN_POPN
SWN_FRMN SWN_FCYN SWN_AUNT SWN_POPD SWN_FRMD SWN_FCYD SWN_UNTD SWN_CLUS
Swine Population Swine Farms
Swine Facilities Swine Animal Units
Swine Population Density Swine Farm Density
Swine Facility Density Swine Animal Unit Density
Swine Facility Cluster
Continuous Continuous Continuous Continuous Continuous Continuous Continuous Continuous Continuous
Head Counts Counts Counts
Total Counts Counts/Mile2
Counts/Mile2
Counts/Mile2
Counts/Mile2
Counts All Animals FCY_SUMN
ALL_FCYN ALL_AUNT ALL_FCYD ALL_UNTD FCY_BLDG FCY_FLDN F2S_HFML
Total Animal Facilities Total Animal Farms Total Animal Units
Animal Facility Density Animal Unit Density
Building Animal Facilities Field Animal Facilities
Animal Facilities within ½ Miles from Streams
Continuous Continuous Continuous Continuous Continuous Continuous Continuous Continuous
Counts Counts Counts
Counts/Mile2
Counts/Mile2
Counts Counts Counts
2002 Strom Thurmond Institute of Government and Public Affairs, Clemson University

34 SCWRC Report Lu & Allen
Appendix A: Tables (Continued)
Table A.2 Pearson Correlations between Watershed Priority Ranks and Animal Variables
DOFCPPHF DOPRANK FCPRANK PPRANK PHPRANK
Cattle CTL_POPN CTL_FRMN CTL_FCYN CTL_AUNT CTL_POPD CTL_FRMD CTL_FCYD CTL_UNTD CTL_CLUS
0.2016 0.2932 0.2444 0.2016 0.1003 0.1478 0.1400 0.1003 0.1426
-0.1308 -0.0346 -0.2241 -0.1308 -0.0716 0.0981 -0.1437 -0.0716 -0.0906
-0.2163 -0.3802 -0.1671 -0.2163 -0.1626 -0.2906 -0.1231 -0.1626 -0.1067
-0.1426 -0.2117 -0.2649 -0.1426 -0.0561 -0.0922 -0.1530 -0.0561 -0.1358
-0.1739 -0.1077 -0.2844 -0.1739 -0.1216 -0.0023 -0.2041 -0.1216 -0.1522
Poultry PRY_POPN PRY_FRMN PRY_FCYN PRY_AUNT PRY_POPD PRY_FRMD PRY_FCYD PRY_UNTD PRY_CLUS
0.0318 0.2545 -0.0198 0.0318 -0.0515 0.0300 -0.1225 -0.0515 -0.0529
-0.0144 -0.1183 0.0265 -0.0144 0.0527 0.0363 0.0841 0.0527 0.0196
-0.0068 -0.2394 0.0441 -0.0068 0.0618 -0.0441 0.1288 0.0618 0.0923
-0.0566 -0.1247 -0.0359 -0.0566 0.0001 0.0014 0.0293 0.0001 -0.0539
-0.0545 -0.1787 -0.0598 -0.0545 0.0032 -0.0410 0.0118 0.0032 -0.0705
Swine
Other
SWN_POPN SWN_FRMN SWN_FCYN SWN_AUNT SWN_POPD SWN_FRMD SWN_FCYD SWN_UNTD SWN_CLUS
FCY_SUMN ALL_FCYN ALL_AUNT ALL_FCYD ALL_UNTD FCY_BLDG FCY_FLDN F2S_HFML
-0.0690 0.1628 -0.0508 -0.0690 -0.0385 0.0320 -0.0934 -0.0385 -0.0224
0.0010 0.0010 0.1197 -0.1197 -0.0102 0.0388 -0.0010 0.0010
0.0055 -0.1844 -0.0214 0.0055 0.0355 -0.0975 0.0239 0.0355 -0.0488
0.0009 0.0009 -0.0791 0.0781 0.0221 -0.0154 0.0018 0.0009
0.1428 -0.0361 0.1377 0.1428 0.1510 0.0643 0.1748 0.1511 0.1887
0.0372 0.0372 -0.0996 0.1310 0.0078 0.0086 0.0382 0.0372
-0.0103 0.0076 0.0187 -0.0103 -0.1138 0.0478 0.0188 -0.1138 0.0114
-0.0594 -0.0594 -0.1167 0.0227 -0.0349 -0.0725 -0.0579 -0.0594
-0.0075 -0.1546 0.0025 -0.0075 -0.0687 -0.0884 0.0280 -0.0686 -0.0304
-0.0854 -0.0854 -0.1317 0.0034 -0.0526 -0.1104 -0.0828 -0.0854
Note: Bold font indicates the correlation between the two variables is significant at 0.05.
2002 Strom Thurmond Institute of Government and Public Affairs, Clemson University

- - - - - - - - - - - - - - - - - - - - - - - - - - - - - - - - - - - - -
- - - - - - - - - - - - - - - - - - - - - - - - - - - - - - - - - - - - -
- - - - - - - - - - - - - - - - - - - - - - - - - - - - - - - - - - - - -
- - - - - - - - - - - - - - - - - - - - - - - - - - - - - - - - - - - - -
35 SCWRC Report Lu & Allen
Appendix A: Tables (Continued)
Table A.3 Selected Output of SPSS for Canonical Correlation
Eigenvalues and Canonical Correlations
Root No. Eigenvalue Pct. Cum. Pct. Canon Cor. Sq. Cor
1 .455 48.807 48.807 .559 .313 2 .313 33.523 82.330 .488 .238 3 .136 14.531 96.861 .346 .119 4 .029 3.139 100.000 .169 .028
Variance in dependent variables explained by canonical variables
CAN. VAR. Pct Var DE Cum Pct DE Pct Var CO Cum Pct CO
1 41.556 41.556 13.003 13.003 2 19.274 60.830 4.593 17.596
Variance in covariates explained by canonical variables
CAN. VAR. Pct Var DE Cum Pct DE Pct Var CO Cum Pct CO
1 1.912 1.912 6.110 6.110 2 2.179 4.091 9.144 15.254
Correlations between DEPENDENT and canonical variables Function No.
Variable 1 2
DOPRANK .457 .307 FCPRANK .393 -.785 PPRANK .835 -.142 PHPRANK .776 .200
Correlations between COVARIATES and canonical variables CAN. VAR.
Covariate 1 2
CTL_FRMN -.396 .704 CTL_FCYN -.638 -.019 CTL_AUNT -.385 .217 CTL_POPD -.214 .181 CTL_FRMD -.110 .698 CTL_FCYD -.410 -.001 CTL_CLUS -.325 .051 PRY_FRMN -.367 .266 PRY_FCYN -.067 -.097 PRY_AUNT -.112 -.025 PRY_FRMD -.022 .093 PRY_FCYD .099 -.175 PRY_UNTD .036 -.070 PRY_CLUS -.090 -.202 SWN_POPN .009 -.282 SWN_FRMN -.197 -.221 SWN_FCYN .036 -.299 SWN_POPD -.139 -.287 SWN_FRMD -.047 -.300 SWN_FCYD .082 -.310 SWN_CLUS -.001 -.449
2002 Strom Thurmond Institute of Government and Public Affairs, Clemson University

SCWRC Report Lu & Allen
Appendix B: Maps
2002 Strom Thurmond Institute of Government and Public Affairs, Clemson University

37 SCWRC Report Lu & Allen
Map 1. Watershed Systems in South Carolina.
2002 Strom Thurmond Institute of Government and Public Affairs, Clemson University

38 SCWRC Report Lu & Allen
Map 2. Cattle Population, Farms, Facilities and Animal Units by Watersheds in South Carolina.
2002 Strom Thurmond Institute of Government and Public Affairs, Clemson University

39 SCWRC Report Lu & Allen
Map 3. Poultry Population, Farms, Facilities and Animal Units by Watersheds in South Carolina.
2002 Strom Thurmond Institute of Government and Public Affairs, Clemson University

40 SCWRC Report Lu & Allen
Map 4. Swine Population, Farms, Facilities and Animal Units by Watersheds in South Carolina.
2002 Strom Thurmond Institute of Government and Public Affairs, Clemson University

41 SCWRC Report Lu & Allen
Map 5. Permitted Animal Facilities in South Carolina.
2002 Strom Thurmond Institute of Government and Public Affairs, Clemson University

42 SCWRC Report Lu & Allen
Map 6. Animal Weight Units Calculated for Cattle, Poultry and Swine Population in South Carolina.
2002 Strom Thurmond Institute of Government and Public Affairs, Clemson University

43 SCWRC Report Lu & Allen
Map 7. Priority Ranked Watersheds with DO, FC, P or pH Impairment Problems in South Carolina.
2002 Strom Thurmond Institute of Government and Public Affairs, Clemson University

44 SCWRC Report Lu & Allen
Map 8. Priority Ranked Watersheds with One or More Impairment Problems Caused by DO, FC, P or pH in South Carolina.
2002 Strom Thurmond Institute of Government and Public Affairs, Clemson University

45 SCWRC Report Lu & Allen
Map 9. Permitted Cattle Facilities and Impairment Watersheds with Dissolved Oxygen Problems in South Carolina.
2002 Strom Thurmond Institute of Government and Public Affairs, Clemson University

46 SCWRC Report Lu & Allen
Map 10. Permitted Poultry Facilities and Impairment Watersheds with Dissolved Oxygen Problems in South Carolina.
2002 Strom Thurmond Institute of Government and Public Affairs, Clemson University

47 SCWRC Report Lu & Allen
Map 11. Permitted Swine Facilities and Impairment Watersheds with Dissolved Oxygen Problems in South Carolina.
2002 Strom Thurmond Institute of Government and Public Affairs, Clemson University

48 SCWRC Report Lu & Allen
Map 12. Permitted Animal Facilities and Impairment Watersheds with Dissolved Oxygen Problems in South Carolina.
2002 Strom Thurmond Institute of Government and Public Affairs, Clemson University

49 SCWRC Report Lu & Allen
Map 13. Permitted Cattle Facilities and Impairment Watersheds with Fecal Coliform Bacteria Problems in South Carolina.
2002 Strom Thurmond Institute of Government and Public Affairs, Clemson University

50 SCWRC Report Lu & Allen
Map 14. Permitted Poultry Facilities and Impairment Watersheds with Fecal Coliform Bacteria Problems in South Carolina.
2002 Strom Thurmond Institute of Government and Public Affairs, Clemson University

51 SCWRC Report Lu & Allen
Map 15. Permitted Swine Facilities and Impairment Watersheds with Fecal Coliform Bacteria Problems in South Carolina.
2002 Strom Thurmond Institute of Government and Public Affairs, Clemson University

52 SCWRC Report Lu & Allen
Map 16. Permitted Animal Facilities and Impairment Watersheds with Fecal Coliform Bacteria Problems in South Carolina.
2002 Strom Thurmond Institute of Government and Public Affairs, Clemson University

53 SCWRC Report Lu & Allen
Map 17. Permitted Cattle Facilities and Impairment Watersheds with Phosphorus Problems in South Carolina.
2002 Strom Thurmond Institute of Government and Public Affairs, Clemson University

54 SCWRC Report Lu & Allen
Map 18. Permitted Poultry Facilities and Impairment Watersheds with Phosphorus Problems in South Carolina.
2002 Strom Thurmond Institute of Government and Public Affairs, Clemson University

55 SCWRC Report Lu & Allen
Map 19. Permitted Swine Facilities and Impairment Watersheds with Phosphorus Problems in South Carolina.
2002 Strom Thurmond Institute of Government and Public Affairs, Clemson University

56 SCWRC Report Lu & Allen
Map 20. Permitted Animal Facilities and Impairment Watersheds with Phosphorus Problems in South Carolina.
2002 Strom Thurmond Institute of Government and Public Affairs, Clemson University

57 SCWRC Report Lu & Allen
Map 21. Permitted Cattle Facilities and Impairment Watersheds with pH Problems in South Carolina.
2002 Strom Thurmond Institute of Government and Public Affairs, Clemson University

58 SCWRC Report Lu & Allen
Map 22. Permitted Poultry Facilities and Impairment Watersheds with pH Problems in South Carolina.
2002 Strom Thurmond Institute of Government and Public Affairs, Clemson University

59 SCWRC Report Lu & Allen
Map 23. Permitted Swine Facilities and Impairment Watersheds with pH Problems in South Carolina.
2002 Strom Thurmond Institute of Government and Public Affairs, Clemson University

60 SCWRC Report Lu & Allen
Map 24. Permitted Animal Facilities and Impairment Watersheds with pH Problems in South Carolina.
2002 Strom Thurmond Institute of Government and Public Affairs, Clemson University

61 SCWRC Report Lu & Allen
Map 25. Permitted Cattle Facilities and Priority Ranked Watersheds with One or More Impairment Problems Caused by DO, FC, P or pH in South Carolina.
2002 Strom Thurmond Institute of Government and Public Affairs, Clemson University

62 SCWRC Report Lu & Allen
Map 26. Permitted Poultry Facilities and Priority Ranked Watersheds with One or More Impairment Problems Caused by DO, FC, P or pH in South Carolina.
2002 Strom Thurmond Institute of Government and Public Affairs, Clemson University

63 SCWRC Report Lu & Allen
Map 27. Permitted Swine Facilities and Priority Ranked Watersheds with One or More Impairment Problems Caused by DO, FC, P or pH in South Carolina.
2002 Strom Thurmond Institute of Government and Public Affairs, Clemson University

64 SCWRC Report Lu & Allen
Map 28. Permitted Animal Facilities and Priority Ranked Watersheds with One or More Impairment Problems Caused by DO, FC, P or pH in South Carolina.
2002 Strom Thurmond Institute of Government and Public Affairs, Clemson University

Jeffery S. Allen & Kang S. Lu
65 SCWRC Report Lu & Allen
REFERENCES
Allen, J., K. S. Lu, and S. Blacklocke. 1998. Spatial Relationships of Polluted Streams, Animal Agriculture, and Human Population in South Carolina Watersheds. In Animal Agriculture in South Carolina: A fact book 29-40. M. L. Warner, Eds. Clemsonin South Carolina: Clemson University.
Michaud, P. 1991. A Citizen's Guide to Understanding and Monitoring Lakes and Streams. Envirovision – Environmental Consulting Service, Olympia, Washington. Available at: www.ecy.wa.gov/programs/wq/plants/management/joysmanual/streamdo.html. Accessed on October 10, 2001.
South Carolina Department of Health and Environmental Control. 2000. State of South Carolina Section 303(d) List for 2000: Priority-ranked waterbodies targeted fro water quality management actions. South Carolina Department of Health and Environmental Control.
Tabachnick, B. B., and L. S. Fidell (1996). Using Multivariate Statistics. 3ird ed. New York, New York: HarperCollins College Publishers.
USDA/NASS. 2000. 1997 Census of Agriculture. USDA-National Agricultural Statistics Service. Available at: www.nass.usda.gov/census/. Accessed on October 10, 2001.
Boering, O. C. et al (1999). Evaluation of the Costs And Benefits of The Methods For Reducing Nutrient Load To The Golf Of Mexico. Accessed on October 11, 2001. Available at: www.nos.noaa.gov/For Employees/Archives/Hypoxiat6.pdf.
2002 Strom Thurmond Institute of Government and Public Affairs, Clemson University