jsna 2015 sensory impairment (final) · jsna 2015 chapter sensory impairment 1 jsna 2015 sensory...
TRANSCRIPT
JSNA 2015 Chapter Sensory Impairment 1
JSNA 2015 Sensory Impairment (final)
Lead author: Tanvi Barreto
Introduction
The term ‘sensory impairment’ or ‘sensory loss’ are umbrella terms used to describe
loss of the distance senses i.e. sight and hearing. The term ‘sensory Impairment’
encompasses
visual impairment - including blind and partially sighted
hearing loss including those who are profoundly deaf (born deaf), deafened
(became deaf but born hearing) and have a hearing loss
Deaf – born deaf and using BSL
dual sensory impairment (deaf and blindness).
Sensory impairments may, like physical impairments, be congenital or acquired at any
age. They are often more prevalent in older age. Most sensory impairments develop
gradually. This chapter will focus on sensory impairments in adults aged 18 and over.
Almost two million people in the UK are living with sight loss, approximately one
person in thirty. Sight loss affects people of all ages, but its occurrence increases
markedly with age. 1 in 5 people aged 75 and over are living with sight loss. 1 in 2
people aged 90 and over are living with sight loss. Nearly two-thirds of people living
with sight loss are women. People from black and minority ethnic communities are at
greater risk of some of the leading causes of sight loss. As many as three quarters of
people with learning disabilities are estimated to have either refractive error or to be
blind or partially sighted.
The number of people in the UK with sight loss is set to increase in the future. In
addition, there is a growing incidence in key underlying causes of sight loss, such as
obesity and diabetes. It is predicted that by 2020 the number of people with sight loss
will rise to over 2,250,000. By 2050, the numbers of people with sight loss in the UK
will double to nearly four million1.
RNIB (2010) suggest that the annual cost of sight loss in the UK amounted to a
minimum of £6.5 billion in direct health care and indirect costs, such as reduced
employment.
There are estimated to be about 9 million people with hearing loss in England, and 11
million in the UK. The prevalence of hearing loss increases exponentially with age.
Around one in five adults has a hearing loss. The most common cause of hearing loss
is age, and the average NHS hearing aid user is aged 742. Many people with hearing
loss therefore have more than one long-term condition.
1 RNIB. Key Information and Statistics. http://www.rnib.org.uk/knowledge-and-research-hub/key-information-and-statistics (accessed
October 2015) 2 Davis A, Smith P, Ferguson M, Stephens D, Gianopoulos I.Acceptability, benefit and costs of early screening for hearing disability: a
study of potential screening tests and models. Health Technol Assess 2007;11(42)
2
In England’s Action Plan on Hearing Loss, The Department of Health notes that hearing
loss results in high personal, societal and economic costs. Hearing care costs the NHS in
England £450 million per year. These costs are set to increase given the rising number
and proportion of older people who will have a hearing loss in the future. Unemployment
rates for people with hearing loss are much higher compared to the national average.
Those with severe hearing loss who do not use hearing aids have unemployment rates
nearly double of those who do. It is estimated that by 2020, older people will account for
approximately a third of the working age population and around three-quarters will have
some kind of disability before the age of 683.
About 900,000 people have severe or profound deafness. Severely or profoundly deaf
people cannot hear well enough to use a voice telephone, even with equipment to make
it louder.This means they need to rely on telecommunication assistance such as Next
Generation Text Relay4. A high proportion of severely or profoundly deaf people have
other disabilities as well.
Among those under 60, 45% have additional disabilities. These are more likely to be
physical disabilities. Among severely or profoundly deaf people over 60 years old, 77%
have some additional disability. For 45%, this means significant dexterity or sight
difficulties, or both.5
Deaf-blindness is sometimes known as dual sensory impairment or multi-sensory
impairment and is more than a combination of visual and hearing impairments. It is
important to stress that many deaf-blind people may not be totally deaf and totally blind.
Many of the UK's 23,000 deaf-blind people have some remaining hearing and vision.
Some though, have nearly complete loss of both senses. The largest group of deaf-blind
people have developed hearing and vision problems as they get older.6
Causes of sensory impairment
The largest cause of sensory impairment is the ageing process with over 65s more likely
to have some level of sensory loss.
Visual impairment
The term ‘visual impairment’ is used to refer to anyone who is blind or partially sighted. The four major UK blinding conditions are: cataract, Age-related Macular Degeneration (AMD), glaucoma and diabetes.
3 Department of Health. Action Plan on Hearing Loss. https://www.england.nhs.uk/wp-content/uploads/2015/03/act-plan-hearing-loss-
upd.pdf (accessed February 2016) 4 Action on hearing loss. Health Matters.
http://www.actiononhearingloss.org.uk/~/media/Documents/Policy%20research%20and%20influencing/Research/Hearing_Matters_2015/Hearing%20Matters%20Report.ashx (accessed February 2016) 5 Statistics on Deafness, Deafsign, http://deafsign.com/ds/
6SENSE https://www.sense.org.uk/content/about-deafblindness
3
In the UK, up to 26% of sight loss in people over 75 is caused by cataracts. Risk factors, in addition to age, include being of African or Caribbean origin, diet low in antioxidants and smoking. Smoking increases the risk threshold of developing the most common form of cataracts7. Smokers are also up to four times more likely than non-smokers to develop AMD and smokers with a genetic predisposition to AMD are eight times more likely to get the condition. Smokers do not respond as well to AMD treatment as non-smokers. Passive smoking also increases the risk of AMD8. AMD is a degenerative retinal eye disease which causes progressive loss of central
vision. There are 2 types. Dry AMD is most common, develops slowly and is not
treatable. Wet AMD causes more rapid sight loss, but can be remediated if detected
early. Key risk factors include: smoking; vitamin and nutrient deficiency; high blood
pressure and cholesterol levels, and high fat intake.
Glaucoma causes a gradual degeneration of the cells in the optic nerve. Sight is lost
slowly, usually from the periphery at the onset. The main form of intervention is to control
eye pressure and in doing so prevent or limit damage to the optic nerve and thus
preserve vision. Risk factors include age; African or Caribbean descent; diabetes; Asian
descent (acute glaucoma), and a documented family history.
Diabetic retinopathy affects the blood vessels in the retina causing blockages, failures
and leaks which impair vision over time. Early diagnosis and treatment have high
success rates. It is the leading cause of sight loss for people of working age in the UK.
A literature review indicated that people with a learning disability were between 8.5 and
200 times (depending on the source material) more likely to have sight impairment than
the general population9. Routine sight tests should be promoted in this group. Additional
sight tests are recommended for people with Down’s Syndrome10.
It is estimated that 2% of people over 75 have both dementia and visual impairment.
They have an increased risk of falls, with a wider impact on their ability to live
independently and on their quality of life.11 Up to two thirds of people experience some
changes to their vision after a stroke12.
Adults of working age with sight impairment are more likely to have mental health
problems, and report a reduced quality of like and of social functioning generally. Older
people with sight loss are more likely to experience depression.
7 RNIB (2008) UK Vision Strategy. London: RNIB
8 Macula society. http://www.macularsociety.org/ (accessed November 2015)
9 Warburg M. Visual impairment in adult people with intellectual disability: literature review. J Intellect Disabil Res 2001;45:424-38
10 The International Association for the Scientific Study of Intellectual Disability (2002) Health Guidelines for Adults with an Intellectual
Disability (WWW) http://www.iassid.org/pdf/healthguidelines-2002.pdf (accessed October 2015) 11
Thomas Pocklington Trust (2005) Dementia and blindness 12
RNIB. Stroke and sight loss. http://www.rnib.org.uk/eye-health-sight-loss-and-other-conditions/stroke-and-sight-loss (accessed November 2015)

4
Early intervention has been identified as a key element in preventing vision loss at a local
and international level. For those people with vision loss, research has highlighted the
need for accessible information, rehabilitation services and equipment, which can
maximise independence. These services are critical in ensuring that people with vision
loss are able to interact with the built environment, maintain physical and physiological
health, and participate socially and economically in their community.
Other causes of visual impairment are diabetes, infection, genetics, injury.
Hearing impairment
There are three main types of hearing loss, sensorineural, conductive and mixed.
Most people will have sensorineural hearing loss (90%), with 8% of people having a
conductive hearing loss and a minority having mixed hearing loss13.
Adult hearing loss is a major public health challenge and the 6th leading cause of years
lived with disability in England14.
Age-related hearing loss (ARHL)15 is a type of sensorineural hearing loss and by far the
most common cause of hearing loss in England. It is associated with a gradual,
progressive and bilateral hearing loss, which at first affects higher frequencies – making
it difficult to understand speech. ARHL is one of four leading long-term conditions
experienced by older people16.
Other causes of hearing loss are infection, physical trauma, genetics, exposure to loud
noise. Maternal infection and other congenital causes are causes of deaf blindness.
Communication is an essential element of good quality of life at all ages, and it becomes
fundamental to maintaining independence and inclusion as people age17. Unsupported
hearing significantly increases the risk of depression18, social isolation19, loneliness20,
functional decline21, early exit from the workforce22 and reduced quality of life23.
13 Screening for Hearing Loss in Adults Ages 50 Years and Older: A Review of the Evidence for the U.S. Preventive Services Task Force 14 Vos, T et al (2015), Global, regional, and national incidence, prevalence, and years lived with disability for 301 acute and chronic diseases and injuries in 188 countries 1990-2013: a systematic analysis for the Global Burden of Disease Study 2013. The Lancet 15 presbycusis 16 Liu, XZ and Yan, D. 2007. Ageing and hearing loss. Journal of Pathology. 211:188-197 17 Vos, T et al (2015), Global, regional, and national incidence, prevalence, and years lived with disability for 301 acute and chronic diseases and injuries in 188 countries 1990-2013: a systematic analysis for the Global Burden of Disease Study 2013. The Lancet 18 World Health Organization, 2002, Active Ageing: A Policy Framework. Geneva, Switzerland: World Health Organization; Lin FR. 2014, Hearing Loss and Healthy Aging: Workshop Summary. Washington, D.C.: National Academies Press 19 Acar, B. et al. 2011. Effects of hearing aids on cognitive functions and depressive signs in elderly people. Archives of Gerontology and Geriatrics, 52(3), pp. 250-252. 20 Hidalgo, J. L. et al. 2009. Functional status of elderly people with hearing loss. Archives of Gerontology and Geriatrics, 49(1), pp. 88-92 21 Cacioppo JT, Hawkley LC, Norman GJ, Berntson GG. Social isolation. Ann N Y Acad Sci. 2011;1231:17-22 22 Lin, F. R. et al. 2011. Hearing Loss and Incident Dementia. Archives of Neurology, 68(2), pp. 214-22 & Lin, F. R. et al. 2011 Hearing loss and cognition in the Baltimore Longitudinal Study of Aging. Neuropsychology. 2011; 25(6):763-770. 23Liu, XZ and Yan, D. 2007. Ageing and hearing loss. Journal of Pathology. 211:188-197 Helvik, A. 2012. Hearing loss and risk of
early retirement. The Hunt study. European Journal of Public Health, 23(4), pp. 617-622
5
National and Local strategies
The UK Vision strategy (2013-18) is a cross-sector initiative, uniting all those in the UK who want to take action on issues relating to vision. It seeks to achieve three outcomes:
1. Everyone in the UK looks after their eyes and their sight 2. Everyone with an eye condition receives timely treatment and, if permanent sight loss occurs, early and appropriate support 3. A society in which people with sight loss can fully participate.
Ealing has a Local Vision Strategy and Action Plan informed by the views and experiences of people with sight loss and the organisations that work with them. The priority areas in the vision strategy are:
Health and wellbeing
Involvement of people
Prevention
Joined up services and data
Social Inclusion and Independence
Visually Impaired people with complex needs
The Action Plan on Hearing Loss produced by NHS England and the Department of Health (2015 and beyond) sets out a case for action to tackle the rising prevalence and personal, social and economic costs of uncorrected hearing loss and the variation in access and quality of services experienced by people with hearing loss. Aligned with NHS England’s Five Year Forward View, it proposes addressing this growing challenge by promoting prevention of hearing loss, improving both the commissioning and integration of services, providing innovative models of care and ensuring that people of all ages with hearing loss are actively supported and empowered to lead the lives they want for themselves and their families in the best possible health. This would also lead to reduced inequalities in access to services and the outcomes achieved.
Ethnicity and Sensory Impairment The Access Economics research confirms that ethnicity is a major factor in relation to eye disease. The Black population has a higher risk than the White population of developing AMD at an earlier age, but a lower risk of developing it after the age of 70. The Black population also has a much higher relative risk of developing glaucoma and cataracts. Asian people are at a higher risk of developing cataracts than the Black and White populations and also at a higher risk of developing diabetic eye disease than the White population. The White population is more likely to experience sight loss due to refractive error, compared to the Black population24. Observational studies from different countries have shown that populations of East Asian origin have a higher frequency of primary angle-closure glaucoma compared with those of European or African descent25.
24
RNIB (2009) Cost Oversight. The cost of eye disease and sight loss in the UK today and in the future. 25
Current Opinion on Ophthalmology, Aril 2006 Vol 17/2 Yip et al
6
It is likely that, due to lack of awareness of the registration process and the benefits of registration, people from BME communities are under-represented amongst those who register blind (Severely Sight Impaired) or partially sighted (Sight Impaired). Poorer access to services is likely to contribute towards higher risk burdens resulting in health inequalities across minority ethnic and lower socio-economic groups. British Asians appear to show higher risk of cataract and develop it an average 10 years earlier than their White counterparts26. There are no accurate figures available for levels of hearing loss in Black and minority ethnic groups. However, there is evidence to suggest that some minority ethnic groups may experience higher levels of hearing loss. This is especially true of recent immigrants from regions with greater levels of poverty, poor healthcare and low levels of immunisation against diseases such as rubella27.
Level of Need in Ealing
Demographics (age group, gender, ethnicity)
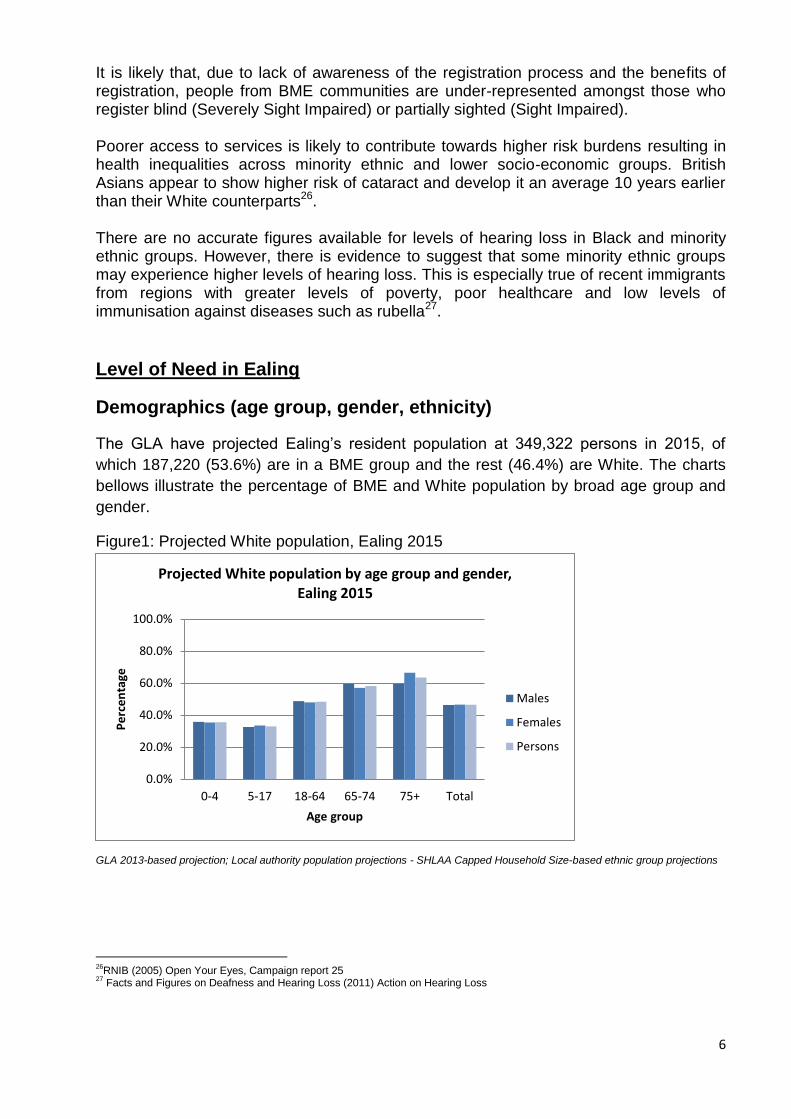
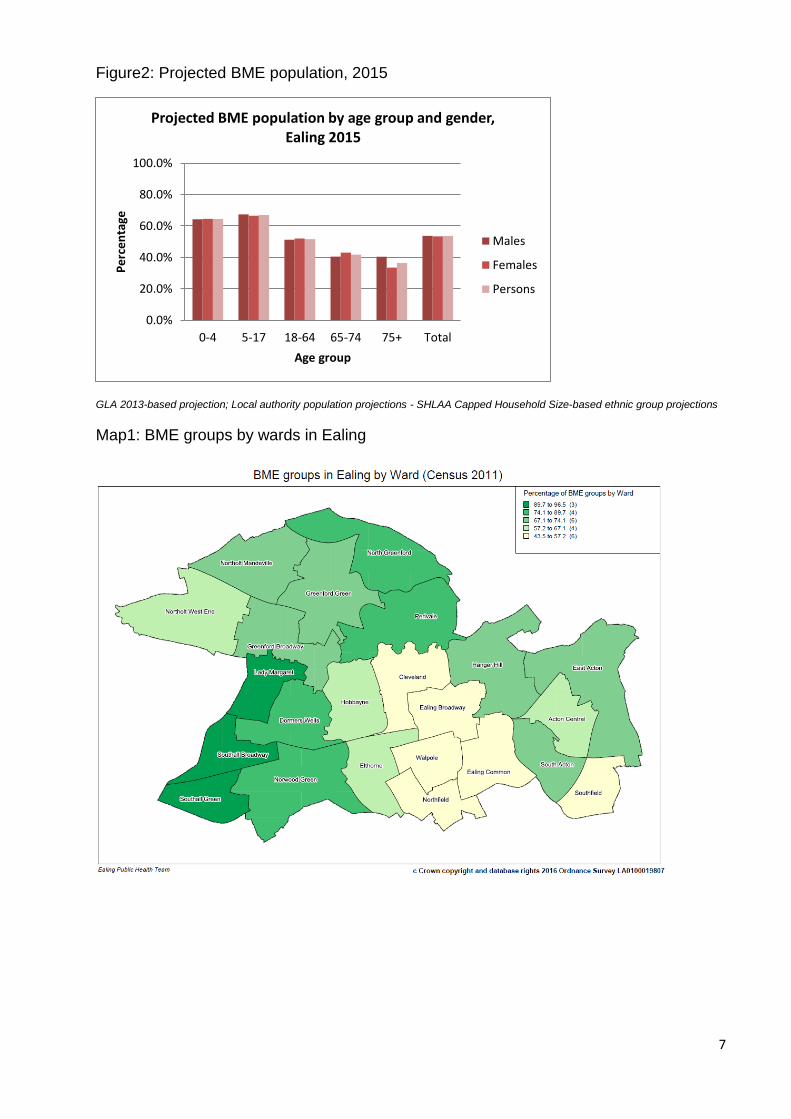
The GLA have projected Ealing’s resident population at 349,322 persons in 2015, of
which 187,220 (53.6%) are in a BME group and the rest (46.4%) are White. The charts
bellows illustrate the percentage of BME and White population by broad age group and
gender.
Figure1: Projected White population, Ealing 2015
GLA 2013-based projection; Local authority population projections - SHLAA Capped Household Size-based ethnic group projections
26
RNIB (2005) Open Your Eyes, Campaign report 25 27
Facts and Figures on Deafness and Hearing Loss (2011) Action on Hearing Loss
0.0%
20.0%
40.0%
60.0%
80.0%
100.0%
0-4 5-17 18-64 65-74 75+ Total
Pe
rce
nta
ge
Age group
Projected White population by age group and gender, Ealing 2015
Males
Females
Persons
7
Figure2: Projected BME population, 2015
GLA 2013-based projection; Local authority population projections - SHLAA Capped Household Size-based ethnic group projections
Map1: BME groups by wards in Ealing
0.0%
20.0%
40.0%
60.0%
80.0%
100.0%
0-4 5-17 18-64 65-74 75+ Total
Pe
rce
nta
ge
Age group
Projected BME population by age group and gender, Ealing 2015
Males
Females
Persons

8
Registered population over 50 (QoF)
The over 50s GP registered population is shown as a proportion of all registrations (all
ages) in the chart below. Ealing’s average proportion is 25.4% (102,246 out of 408,265).
The GP Practice range is from 38% the highest to 11% the lowest. More than half of the
practices (47 out of 77) rank above or are equal to the Ealing average.
Figure 3: Percentage of patients aged over 50 by GP Practice, 2013/14
Source: Department of Health, 2011-12 GP Patient Survey
Figure 3 shows the variation between practices in the number of people registered who are 50 and over amongst practices in Ealing. We know that sensory impairments increase with age and hence this could indicate varying caseloads between practices.
Visual Impairment Table1: Projected Visual impairment in older population between 2014 and 2030
Visual impairment 2014 2015 2020 2025 2030
Ealing: People aged 65-74 predicted to have a moderate or severe visual impairment
1,182 1,210 1,383 1,501 1,691
London: People aged 65-74 predicted to have a moderate or severe visual impairment
29,176 29,786 32,710 35,498 41,552
England: People aged 65-74 predicted to have a moderate or severe visual impairment
288,607 295,322 312,883 316,764 357,515
Ealing: People aged 75 and over predicted to have a moderate or severe visual impairment
2,257 2,306 2,542 2,988 3,447
London: People aged 75 and over predicted to have a moderate or severe visual impairment
56,408 57,325 62,694 73,544 82,708

9
England: People aged 75 and over predicted to have a moderate or severe visual impairment
542,773 553,536 630,726 762,612 850,801
Ealing: People aged 75 and over predicted to have registrable eye conditions
1,165 1,190 1,312 1,542 1,779
London: People aged 75 and over predicted to have registrable eye conditions
29,114 29,587 32,358 37,958 42,688
England: People aged 75 and over predicted to have registrable eye conditions
280,141 285,696 325,536 393,606 439,123
Source: POPPI, 2015
The above figures are taken from 'The number of people in the UK with a visual impairment: the use of
research evidence and official statistics to estimate and describe the size of the visually impaired
population', Nigel Charles, RNIB, July 2006. The overall prevalence of all causes of visual impairment in
those aged 65-74 years and over with visual acuity (VA) of less than 6/18 (moderate or severe) is 5.6%,
and 12.4% for those aged over 75. VA of less than 6/18 is largely used as the point which approximates to
the statutory threshold for qualifying as registered severely sight impaired (blind) or registered sight
impaired (partially sighted). Of those aged 75 and over, approximately half have cataracts or refractive
error (i.e. correctable sight loss) and if these are excluded, the prevalence estimate of those with
'registrable' eye conditions is 6.4% in this age group. A small proportion has both cataracts and some
other registrable cause of vision impairment and these are included within this figure. Age related
macular degeneration is the most common cause of registerable sight loss in older people. The
prevalence rates have been applied to ONS population projections of the 65 and over population to give
estimated numbers of people predicted to have visual impairment to 2030.
Registered blind and partially sighted
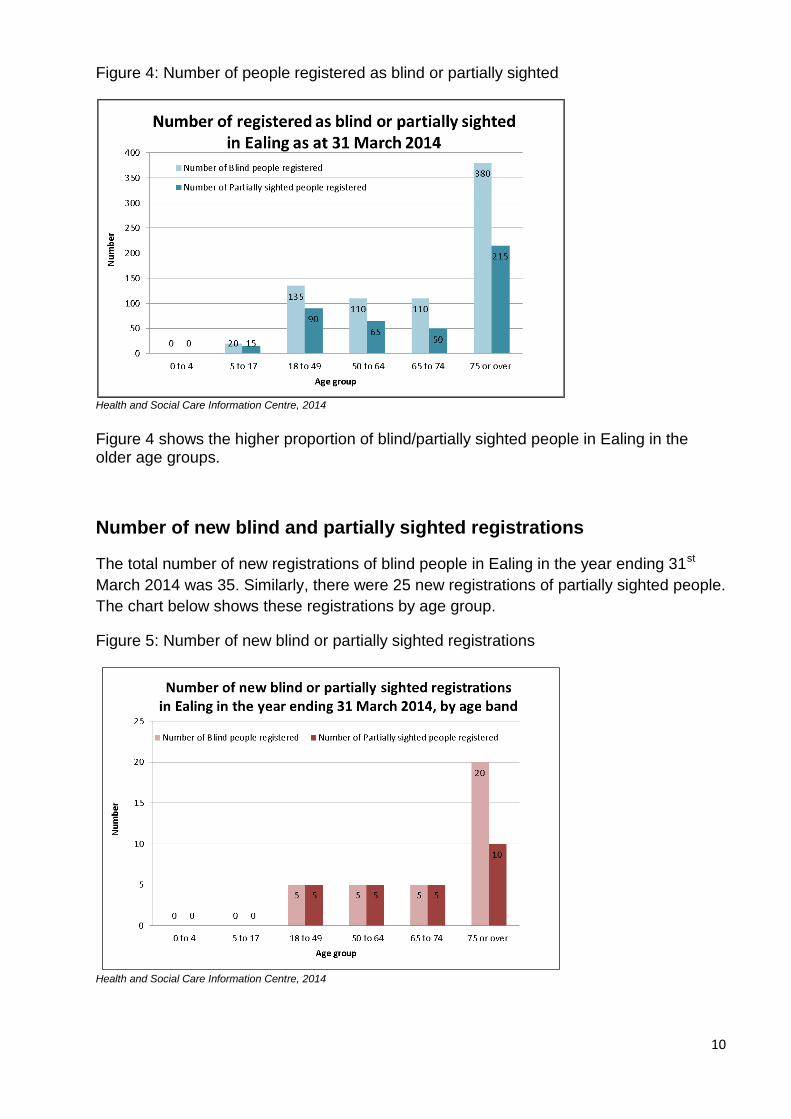
There were a total of 755 registrations of blind persons and 440 registrations of partially
sighted persons in Ealing as at 31st March 2014. The chart below illustrates the
registrations of blind and partially sighted people by age group. Sight loss is more
prevalent in older age groups; however there is a high number of registrations of blind
people in the age group 18-49.
These figures are lower than the estimates of blind/partially sighted people in Ealing,
which could indicate underreporting in certain areas.
10
Figure 4: Number of people registered as blind or partially sighted
Health and Social Care Information Centre, 2014
Figure 4 shows the higher proportion of blind/partially sighted people in Ealing in the older age groups.
Number of new blind and partially sighted registrations
The total number of new registrations of blind people in Ealing in the year ending 31st
March 2014 was 35. Similarly, there were 25 new registrations of partially sighted people.
The chart below shows these registrations by age group.
Figure 5: Number of new blind or partially sighted registrations
Health and Social Care Information Centre, 2014
11
Number of people registered partially sighted or blind with an
additional disability
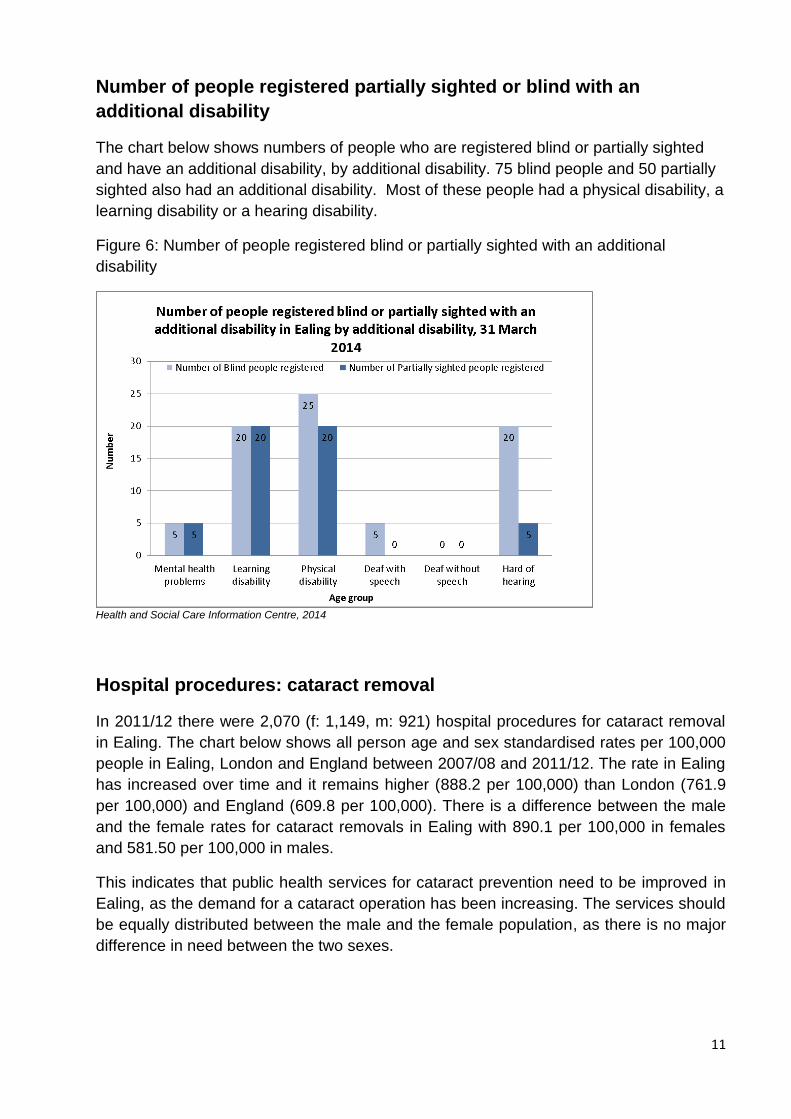
The chart below shows numbers of people who are registered blind or partially sighted
and have an additional disability, by additional disability. 75 blind people and 50 partially
sighted also had an additional disability. Most of these people had a physical disability, a
learning disability or a hearing disability.
Figure 6: Number of people registered blind or partially sighted with an additional
disability
Health and Social Care Information Centre, 2014
Hospital procedures: cataract removal
In 2011/12 there were 2,070 (f: 1,149, m: 921) hospital procedures for cataract removal
in Ealing. The chart below shows all person age and sex standardised rates per 100,000
people in Ealing, London and England between 2007/08 and 2011/12. The rate in Ealing
has increased over time and it remains higher (888.2 per 100,000) than London (761.9
per 100,000) and England (609.8 per 100,000). There is a difference between the male
and the female rates for cataract removals in Ealing with 890.1 per 100,000 in females
and 581.50 per 100,000 in males.
This indicates that public health services for cataract prevention need to be improved in
Ealing, as the demand for a cataract operation has been increasing. The services should
be equally distributed between the male and the female population, as there is no major
difference in need between the two sexes.

12
Figure 7: Trends in hospital admissions for continuous inpatient spells with cataract
removal
Data source: Health and Social Care Information Centre
Hearing Impairment
Table2: The table below shows the impact different levels of hearing loss can have on
people.
The impact of different decibel levels of hearing loss28
Better ear average hearing
level in decibels of hearing
loss (dB HL)
Hearing in a quiet
environment
Hearing in a noisy
environment
20-34 dBHL Does not have problems
hearing what is said
May have real difficulty
following/ taking part in a
conversation
35-49 dBHL May have difficulty hearing a
normal voice
Has difficulty hearing and
taking part in conversation
50-64 dBHL Can hear loud speech Has great difficulty hearing
and taking part in
conversation
65-79 dBHL Can hear loud speech
directly in one’s ear
Has very great difficulty
hearing and taking part in
conversation
28
These impacts are taken from the Global Burden of Disease Expert Group – see Stevens G, Flaxman S, Brunskill E et al. Global and regional hearing impairment prevalence: an analysis of 42 studies in 29 countries. Eur J Public Health 2013;23:146-52.

13
80-94 dBHL Has great difficulty hearing Cannot hear any speech
The table below is based on the combined prevalence from two studies: Adrian Davis
(Ed.), Hearing in Adults (1995), Whurr Publishers Limited, and Adrian Davis et al, Health
Technology Assessments 11(42):1-294 (October 2007).
Table 2: % of people aged 65 yrs and over predicted to have moderate/severe or
profound hearing impairment, Ealing
Age range % males - moderate or severe
% females - moderate or severe
% males - profound % females - profound
65-74 22.69 15.79 0.43 0.78
75-84 60.63 63.43 0.41 0.8
85+ 85.05 84.8 3.45 4.73
Source: POPPI, year?
Table 3: Number of people aged 65 yrs and over predicted to have moderate or severe
hearing impairment, projected till 2030
Moderate or severe hearing impairment by age group
2014 2015 2020 2025 2030
Ealing: People aged 65-74 predicted to have a moderate or severe hearing impairment
4,022 4,099 4,707 5,092 5,792
Ealing: People aged 75-84 predicted to have a moderate or severe hearing impairment
8,208 8,332 8,764 10,193 11,747
Ealing: People aged 85 and over predicted to have a moderate or severe hearing impairment
4,245 4,330 5,349 6,623 7,557
Ealing: Total population aged 65 and over predicted to have a moderate or severe hearing impairment
16,474 16,760 18,821 21,907 25,096
Source: POPPI, 2015
Table 4: Number of people aged 65 yrs and over predicted to have profound hearing
impairment, projected till 2030
Source: POPPI, year, 2015
Profound hearing impairment by age group
2014 2015 2020 2025 2030
Ealing: People aged 65-74 predicted to have a profound hearing impairment
130 132 152 164 185
Ealing: People aged 75-84 predicted to have a profound hearing impairment
83 84 88 102 118
Ealing: People aged 85 and over predicted to have a profound hearing impairment
213 217 266 327 372
Ealing: Total population aged 65 and over predicted to have a profound hearing impairment
426 433 506 592 675
14
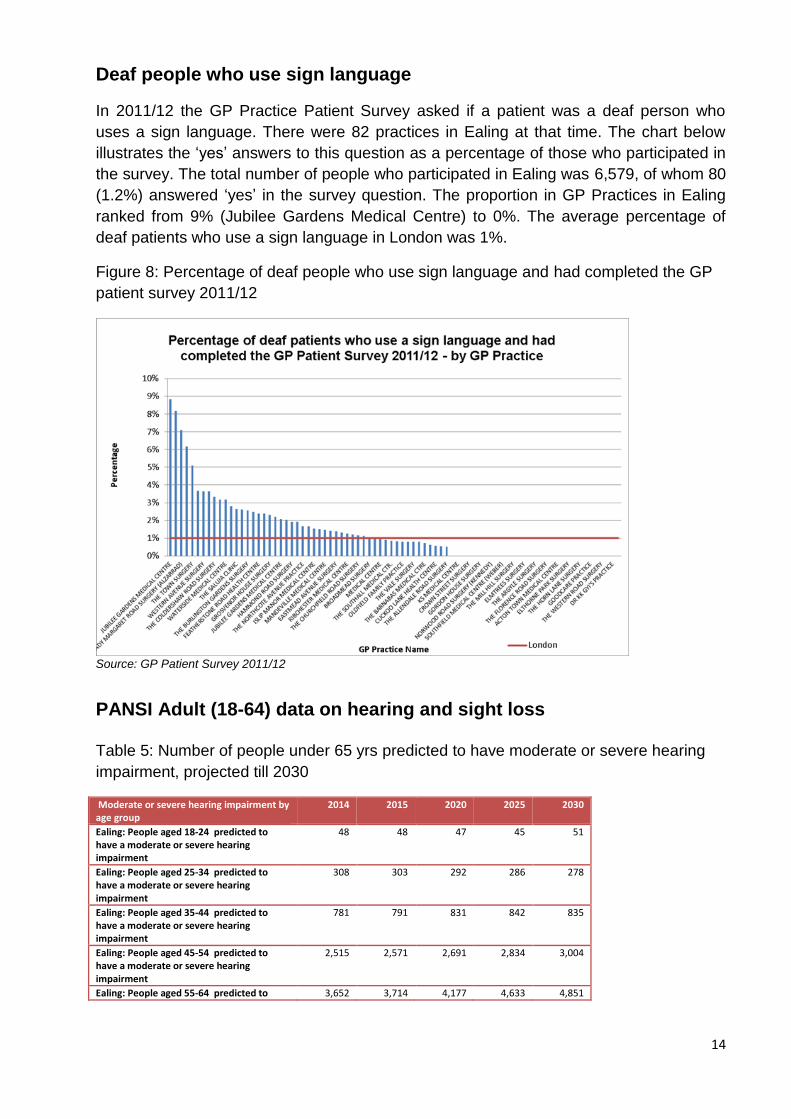
Deaf people who use sign language
In 2011/12 the GP Practice Patient Survey asked if a patient was a deaf person who
uses a sign language. There were 82 practices in Ealing at that time. The chart below
illustrates the ‘yes’ answers to this question as a percentage of those who participated in
the survey. The total number of people who participated in Ealing was 6,579, of whom 80
(1.2%) answered ‘yes’ in the survey question. The proportion in GP Practices in Ealing
ranked from 9% (Jubilee Gardens Medical Centre) to 0%. The average percentage of
deaf patients who use a sign language in London was 1%.
Figure 8: Percentage of deaf people who use sign language and had completed the GP
patient survey 2011/12
Source: GP Patient Survey 2011/12
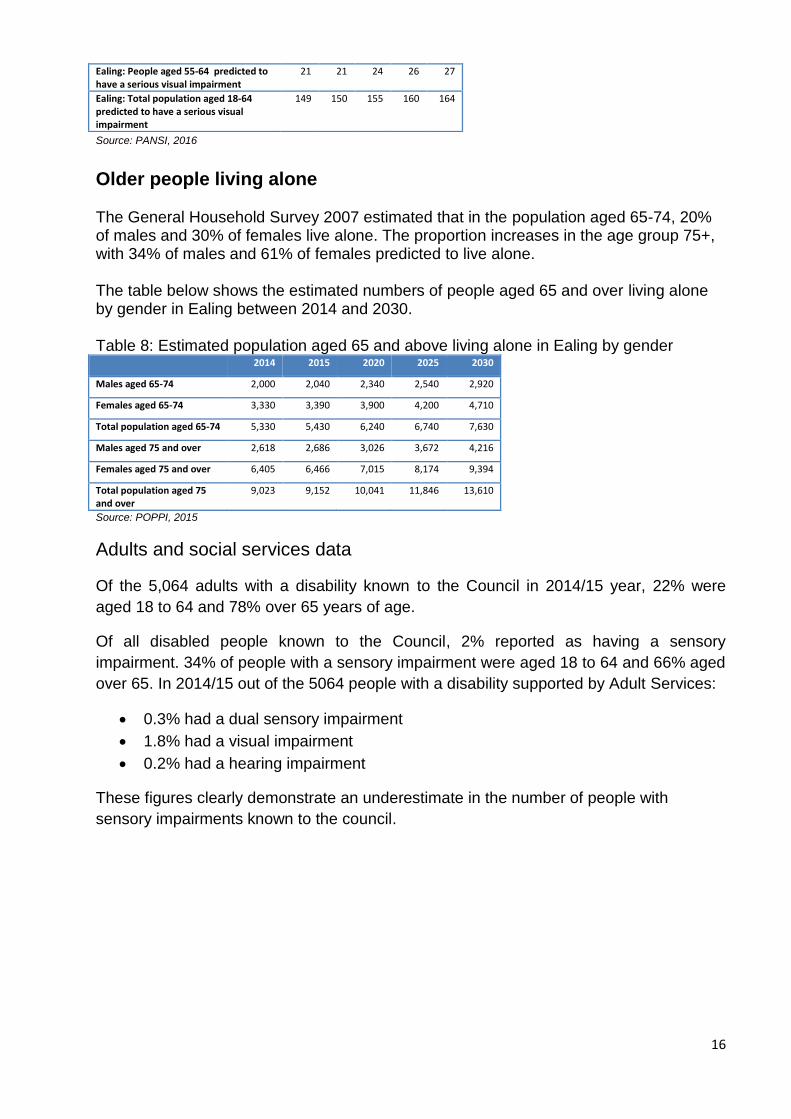
PANSI Adult (18-64) data on hearing and sight loss Table 5: Number of people under 65 yrs predicted to have moderate or severe hearing
impairment, projected till 2030
Moderate or severe hearing impairment by age group
2014 2015 2020 2025 2030
Ealing: People aged 18-24 predicted to have a moderate or severe hearing impairment
48 48 47 45 51
Ealing: People aged 25-34 predicted to have a moderate or severe hearing impairment
308 303 292 286 278
Ealing: People aged 35-44 predicted to have a moderate or severe hearing impairment
781 791 831 842 835
Ealing: People aged 45-54 predicted to have a moderate or severe hearing impairment
2,515 2,571 2,691 2,834 3,004
Ealing: People aged 55-64 predicted to 3,652 3,714 4,177 4,633 4,851

15
have a moderate or severe hearing impairment
Ealing: Total population aged 18-64 predicted to have a moderate or severe hearing impairment
7,304 7,426 8,039 8,640 9,018
Ealing: People aged 18-24 predicted to have a profound hearing impairment
0 0 0 0 0
Ealing: People aged 25-34 predicted to have a profound hearing impairment
0 0 0 0 0
Ealing: People aged 35-44 predicted to have a profound hearing impairment
0 0 0 0 0
Ealing: People aged 45-54 predicted to have a profound hearing impairment
20 20 21 21 22
Ealing: People aged 55-64 predicted to have a profound hearing impairment
40 41 46 50 53
Ealing: Total population aged 18-64 predicted to have a profound hearing impairment
60 61 67 72 75
Source: PANSI, 2016 The table below is based on the prevalence of visual impairment in the UK, A review of the literature, by Tate, Smeeth, Evans, Fletcher, Owen and Rudnicka, RNIB, 2005. They report that most studies have been done in the older population and there is a scarcity of data in younger adult age groups in the UK. A review by Nissen et al of epidemiological studies performed in Western Europe North America and Australia covering the age group 20 to 59 years found the prevalence of blindness was 0.08 and of visual acuity 6/24 to 6/48 was 0.07%. These figures agree well with the prevalence of registrations in a similar age range and we conclude that registration data provide reasonably accurate estimates of the prevalence of serious vision impairment in the younger adult age groups". The RNIB suggest a lower figure of 1 in 500 as an estimated basis of people who would be registerable. The Tate study also argues as do others that estimates of less than severe visual impairment are unreliable with a high degree of variance reported in self report studies. A mean of the three figures 0.065% has been used as an estimate of the numbers of people with a severe visual impairment."
Table 6 below is based on the combined prevalence from two studies: Adrian Davis (Ed.), Hearing in Adults (1995), Whurr Publishers Limited, and Adrian Davis et al, Health Technology Assessments 11(42):1-294 (October 2007). Rates for moderate or severe and profound hearing loss, are as follows: Table 6:% of people under 65 yrs and over predicted to have moderate/severe or profound hearing impairment, Ealing
Age range
% males - moderate or severe
% females - moderate or severe
% males - profound
% females - profound
18-19 0 0 0 0
20-24 0.18 0.24 0 0
25-34 0 0.95 0 0
35-44 0.78 2.09 0 0
45-54 7.15 4.13 0 0.09
55-64 14.81 8.09 0.12 0.13
Table 7: Number of people under 65 yrs predicted to have a serious vision impairment,
projected till 2030
Number of people under 65 predicted to have a serious vision impairment
2014 2015 2020 2025 2030
Ealing: People aged 18-24 predicted to have a serious visual impairment
20 19 19 19 21
Ealing: People aged 25-34 predicted to have a serious visual impairment
43 43 43 43 42
Ealing: People aged 35-44 predicted to have a serious visual impairment
36 37 39 40 40
Ealing: People aged 45-54 predicted to have a serious visual impairment
29 30 31 32 34
16
Source: PANSI, 2016
Older people living alone The General Household Survey 2007 estimated that in the population aged 65-74, 20% of males and 30% of females live alone. The proportion increases in the age group 75+, with 34% of males and 61% of females predicted to live alone. The table below shows the estimated numbers of people aged 65 and over living alone by gender in Ealing between 2014 and 2030. Table 8: Estimated population aged 65 and above living alone in Ealing by gender 2014 2015 2020 2025 2030
Males aged 65-74 2,000 2,040 2,340 2,540 2,920
Females aged 65-74 3,330 3,390 3,900 4,200 4,710
Total population aged 65-74 5,330 5,430 6,240 6,740 7,630
Males aged 75 and over 2,618 2,686 3,026 3,672 4,216
Females aged 75 and over 6,405 6,466 7,015 8,174 9,394
Total population aged 75 and over
9,023 9,152 10,041 11,846 13,610
Source: POPPI, 2015
Adults and social services data
Of the 5,064 adults with a disability known to the Council in 2014/15 year, 22% were
aged 18 to 64 and 78% over 65 years of age.
Of all disabled people known to the Council, 2% reported as having a sensory
impairment. 34% of people with a sensory impairment were aged 18 to 64 and 66% aged
over 65. In 2014/15 out of the 5064 people with a disability supported by Adult Services:
0.3% had a dual sensory impairment
1.8% had a visual impairment
0.2% had a hearing impairment
These figures clearly demonstrate an underestimate in the number of people with
sensory impairments known to the council.
Ealing: People aged 55-64 predicted to have a serious visual impairment
21 21 24 26 27
Ealing: Total population aged 18-64 predicted to have a serious visual impairment
149 150 155 160 164

17
Table 9: Benefit claimants - disability living allowance by disabling condition
Condition Ealing London England
Blindness 360 8,710 59,240
Deafness 230 6,350 38,120
ONS, May 2015
Public Health Outcomes Framework
Indicators from the Public Health Outcomes Framework (PHOF) linked to sensory
impairments taken from indicator set on premature mortality:
4.12i Preventable sight loss – age related macular degeneration 4.12ii Preventable sight loss – glaucoma 4.12iii Preventable sight loss – diabetic eye disease 4.12iv Preventable sight loss – sight loss certifications
Figure 9: Preventable sight loss – Age Related Macular Degeneration (AMD)
Source: PHE: Public Health Outcomes Framework
18
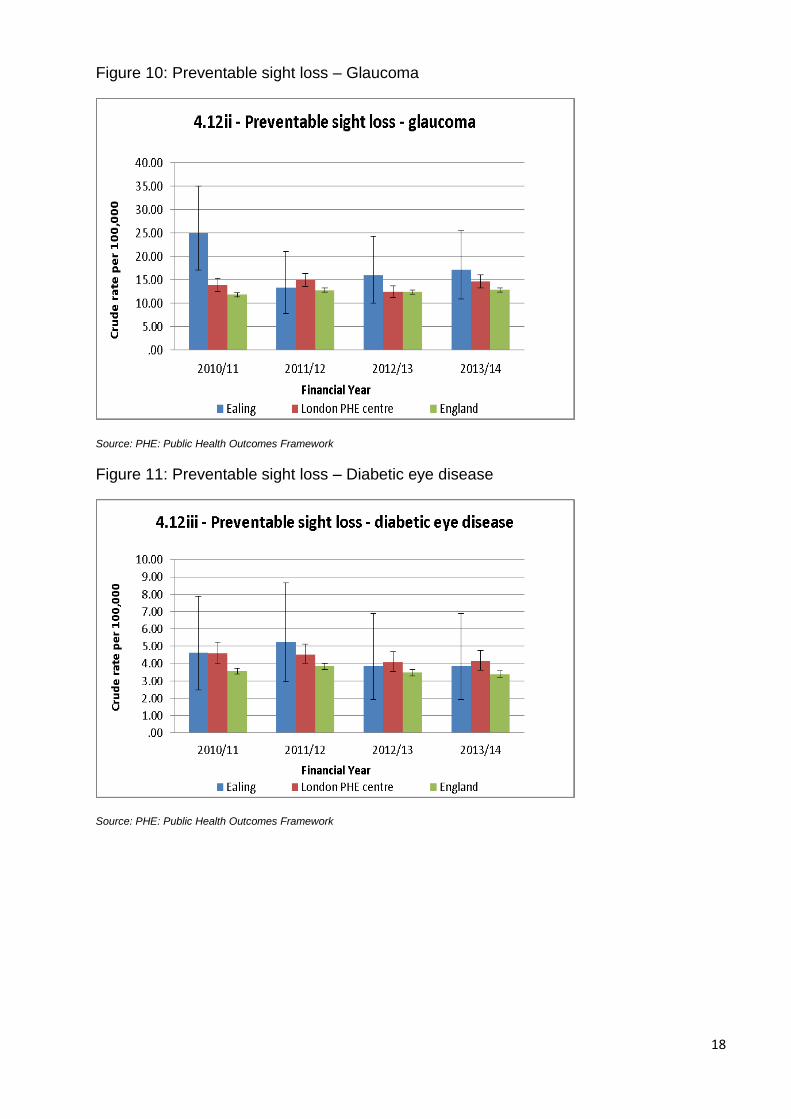
Figure 10: Preventable sight loss – Glaucoma
Source: PHE: Public Health Outcomes Framework
Figure 11: Preventable sight loss – Diabetic eye disease
Source: PHE: Public Health Outcomes Framework

19
Figure 12: Preventable sight loss – sight loss certifications
Source: PHE: Public Health Outcomes Framework
The crude rates of preventable sight loss due to Age Related Macular Degeneration
(AMD), Glaucoma and Diabetic eye disease in Ealing are not significantly different from
the London and England average.
Evidence of what works
Visual impairment
Lifestyle factors
1) Stopping Smoking
Stopping smoking can halt or reverse damage to the eyes, depending on the severity and type of disease. In the case of AMD, smokers are at least twice as likely to develop it and former smokers have only a slightly increased risk compared with people who never smoked. A British study of people aged 75 or older, found that those who had quit smoking for 20 years or more had the same risk of developing AMD as non-smokers29. Another study found that the benefit for stopping smoking is seen after 10 years with reductions in risk, although risks do not return to that of non-smokers till 20 years after stopping smoking30.
This is supported by the findings of the 2010 US Surgeon General’s Report. Since there
is also a dose-response relationship between smoking and AMD, quitting smoking early
29
Evans JR, Fletcher AE, Wormald RP. 28,000 cases of age related macular degeneration causing visual loss in people aged 75 years and above in the United Kingdom may be attributable to smoking. Br J Ophthalmol. 2005 May;89(5):550-3 30
British Journal of Opthamology. J R Evans, A E Fletcher, R P L Wormald2005;89:550–553. doi: 10.1136/bjo.2004.049726

20
in life is important. Stopping smoking reduces the risk, over time, of developing or
exacerbating AMD31.
More recent data is not available. A US study found that, compared with men who
continued to smoke, those who had quit 20 years or more before entry into the study
had an approximately 21% reduced risk of cataract32.
A Swedish study found that the greater the number of cigarettes smoked, the longer it
took after quitting to reduce the risk of cataract development to that of a non-smoker33.
2) Diabetes Control
In the Diabetes Control and Complications Trial (DCCT), it was found that 6.5 years of
intensive therapy for patients with type 1 diabetes aimed at achieving glycaemia as close
to the nondiabetic range as safely possible, as compared with conventional therapy at
the time, was associated with a 76% reduction in the onset of retinopathy and a 52%
reduction in disease progression34.
The Eye Clinic Liaison Officer
Having an Eye Clinic Liaison Officer or ECLO (also known as Sight Loss Adviser or
Vision Support Officer) is one of the most effective ways of supporting patients in the eye
clinic. ECLOs are key in helping patients understand the impact of their diagnosis and
providing them with emotional and practical support for their next steps. Research
conducted to evidence the cost effectiveness of providing an early intervention ECLO
support service found that an investment of £1 in an ECLO service can net a return of
£10.57 to health and social care expenditure budgets35.
Good practice guidance: The RNIB, supported by the Association of Directors of Adult
Social Services (ADASS), have produced good practice benchmarks for services for
people who have a sight impairment which are as follows36:
Emotional support e.g. peer support and counselling
Methods of referral e.g. eye care liaison officers
Information and advice e.g. regarding access to work, technology, information prescriptions and advocacy
Assessments which are timely, meet additional needs, are holistic and for older people, a single assessment of health and social care needs
31
U.S. Department of Health and Human Services. How Tobacco Smoke Causes Disease: The Biology and Behavioral Basis for Smoking-Attributable Disease: A Report of the Surgeon General. Atlanta, GA: U.S. Department of Health and Human Services, Centers for Disease Control and Prevention, National Center for Chronic Disease Prevention and Health Promotion, Office on Smoking and Health, 2010. 32
Lindblad BE, Håkansson N, Wolk A. Smoking Cessation and the Risk of Cataract: A Prospective Cohort Study of Cataract Extraction Among Men. JAMA Ophthalmol. 2014 Jan 2. 33
Lindblad BE, Håkansson N, Svensson H et al. Intensity of Smoking and Smoking Cessation in Relation to Risk of Cataract Extraction: A Prospective Study of Women. Am J Epidemiol. 2005 Jul 1;162(1):73-9. 34
The DCCT/EDIC Research Group. N Engl J Med 2015; 372:1722-1733April 30, 2015DOI: 10.1056/NEJMoa1409463 35
RNIB.The benefits of ECLOs 36
ADASS (2002) Progress in Sight: national standards of social care for visually impaired adults London: ADASS
21
Equipment e.g. provision of equipment to support activities of daily living, communication and mobility, Access to Work
Training (in proper use of aids and equipment)
User involvement
Dealing with complaints
Inter-agency working
The Thomas Pocklington Trust, a leading provider of housing, care and support services for people with sight loss in the UK, has also identified priorities in their research including support in the home for small household tasks and the importance of lighting.
Prevention of sight loss and promoting good visual health
There is evidence that suggests that over 50 per cent of sight loss is due to preventable or treatable causes; in older people this percentage is estimated to be between 50 and 70%. The evidence from the Department of Health commissioning toolkit for community-based eye care services suggests the following factors can promote good visual health
An awareness of the impact of a healthy lifestyle on eye health
An understanding of the risk factors for sight-threatening conditions by people in the risk groups
Regular sight tests
Effective eye care services that are accessible to all parts of the population
Effective services in other areas that have an impact upon, or will be affected by, visual health and vision services
Deaf/hearing impairment
There is evidence to support:
Hearing aids and ongoing support improves quality of life by reducing the psychological and social effects of hearing loss37
Cochlear implants for profoundly deaf people who do not benefit from hearing aids38
There is some evidence to support:
Screening programmes in people over 65 which lead to early detection and cost benefits39
Hearing therapists to support aids and communication strategies 40
37
Chisolm, T. et al. 2007. A Systematic Review of Health-Related Quality of Life and Hearing Aids: Final Report of the American
Academy of Audiology Task Force on the Health-Related Quality of Life Benefits of Amplification in Adults. Journal of the American Audiology, 18(2), pp. 151-183; Davis, A. et al., 2007. Acceptability, benefit and costs of early screening for hearing disability: a study of potential screening tests and models. Health technology assessment, 11(42) pp. 75-78; Acar, B. et al. 2011. Effects of hearing aids on cognitive functions and depressive signs in elderly people. Archives of Gerontology and Geriatrics, 52(3), pp. 250-252. 38
The Ear Foundation (2011) (WWW) http://www.earfoundation.org.uk/hearing-technologies/cochlearimplants 39
Action on hearing loss (2011) (WWW) http://www.actiononhearingloss.org.uk/news-and-events/allregions/news/rnid-calls-for-a-national-hearing-screening-programme.aspx 40
Deafness research (2009) (WWW) Sudden sensorineural hearing loss
22
Use of cognitive behaviour therapy (CBT) to treat distressing tinnitus
Lip-reading classes to improve communication skills and help people deal with hearing loss41
Assistive technology can increase independence and safety (hearing aid
compatible telephones, flashing doorbells, smoke detection and alarm
clocks)42
Implementation of the reasonable adjustments required by the 2010 Equality
Act and Equality Duty does reduce discrimination (e.g. access to
communication support)43
Screening people over 85 in care homes identifies significant hearing
impairment not previously identified or remediated
Action on Hearing Loss produced a report44, setting out eight standards covering the needs of deaf people in the community, day and residential settings
The British Deaf Association45 have created a checklist of actions in conjunction with Deaf BSL users, Sign Language Interpreters (who have a pivotal role in health interactions) and healthcare professionals Each commitment requires action to overcome the disadvantages that Deaf people using BSL face when accessing health services. The five commitments are: 1. Ensure access for Deaf people to information and services at first points of contact. 2. Promote equal access in health settings, particularly in reception areas. 3. Ensure accurate diagnosis and appropriate treatment. 4. Provide clear and accessible information about treatment and management of health. 5. Engage and involve local Deaf communities on a regular basis.
Current Interventions & Assets
There are a range of services commissioned by both the NHS and local authorities to meet the needs of people with a sensory loss.
Visual impairment/Sight loss
In primary care settings, local optometrists can provide enhanced services for people with visual impairments. Local GP services can encourage patients to take up regular eye examinations and refer people to eye clinics as required. North West London launched a Diabetic Eye Screening Programme in 2015 http://www.nwldesp.co.uk/
http://www.deafnessresearch.org.uk/factsheets/sudden-sensorineural-hearing-loss.pdf 41
Action on hearing loss (2011) 42
Action on hearing loss (2011) Annual survey 2010 43
Action on hearing loss (2011) A research report on hearing loss in the workplace (WWW) 44
RNID (1999) Best Practice Standards: Social Services for Deaf and Hard of Hearing People 45
British Deaf Association. Improving Access for British Sign Language Users.
http://www.cydraddoldebhawliaudynol.wales.nhs.uk/sitesplus/documents/1120/BDA%20Improving%20Access%20for%20British%20Sign%20Language%20Users%20Checklist%20for%20Health%20Boards%20and%20NHS%20Trusts%2020131.pdf (accessed February 2016)
23
Community Services
The Practice provides a community ophthalmology service for Ealing Patients. The
service was originally commissioned in March 2012 with the following objectives
Improve quality of care within primary and community settings
Reduce the waiting time
Provide services closer to patients’ homes
Improve access to advice and information and increase knowledge and awareness of the management of Eye conditions
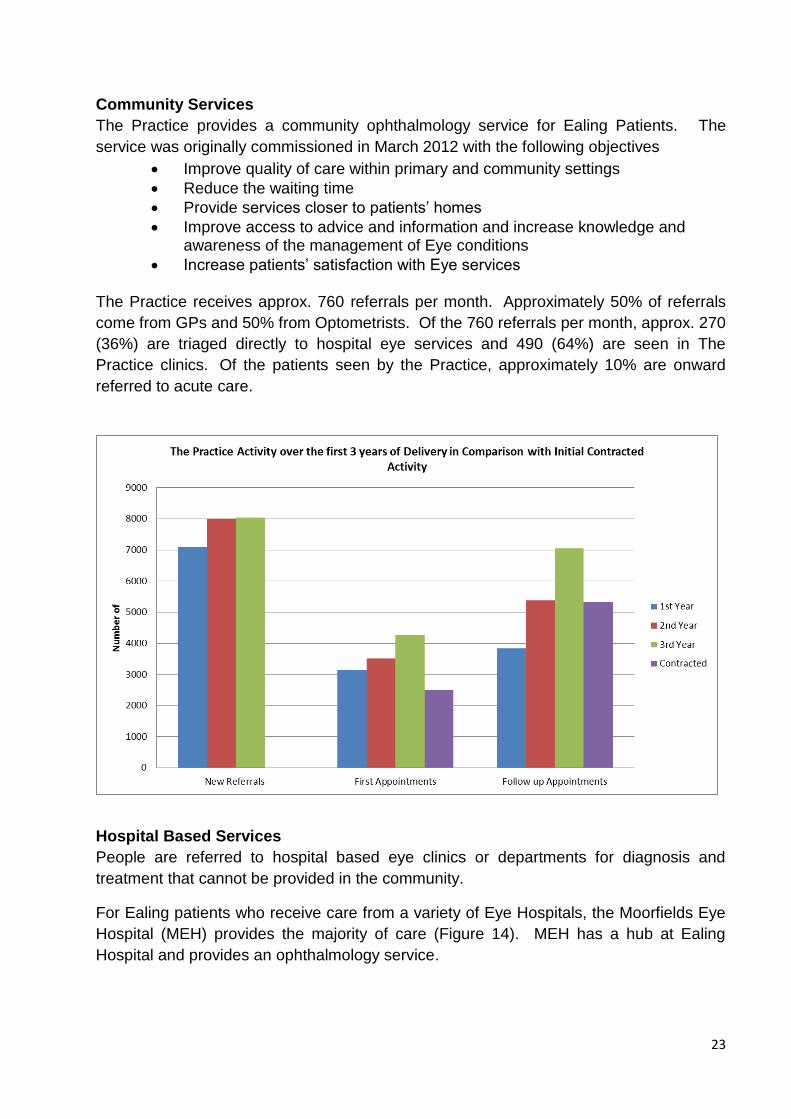
Increase patients’ satisfaction with Eye services The Practice receives approx. 760 referrals per month. Approximately 50% of referrals
come from GPs and 50% from Optometrists. Of the 760 referrals per month, approx. 270
(36%) are triaged directly to hospital eye services and 490 (64%) are seen in The
Practice clinics. Of the patients seen by the Practice, approximately 10% are onward
referred to acute care.
Hospital Based Services
People are referred to hospital based eye clinics or departments for diagnosis and
treatment that cannot be provided in the community.
For Ealing patients who receive care from a variety of Eye Hospitals, the Moorfields Eye
Hospital (MEH) provides the majority of care (Figure 14). MEH has a hub at Ealing
Hospital and provides an ophthalmology service.

24
Figure 14. Proportional Cost by Provider for Ealing Patient Care
Specialities include:
Cataract
Glaucoma
Medical retina
General ophthalmology
Strabismus (adult and children)
Uveitis
Eye Hospitals across providers are experiencing significant pressures due to increases in activity for age related conditions such as Cataracts, Glaucoma and macular degeneration.

25
Figure 15: Ophthalmology Hospital Outpatient Activity, Ealing CCG, 2014-15
As can be seen in the figure above majority of the ophthalmology hospital outpatient
activity in adults in Ealing is at Moorefield’s Hospital as follow up appointments.
Cataracts Cataracts are the most common cause of vision loss in people over 40 years old. In
Ealing, 42% of patients having this surgery are over 75 years of age. We expect the
demand for cataract interventions to increase in line with an aging demographic.
Over the last 16 months there has been a noticeable increase in cataract procedures for
Ealing (Figure 16) Cataracts are attributable for 20% of the total ophthalmic activity and
56% of inpatient activity (cataracts procedures are done as a day case.) This poses a
significant cost pressure in the coming financial period if this trend continues.
26
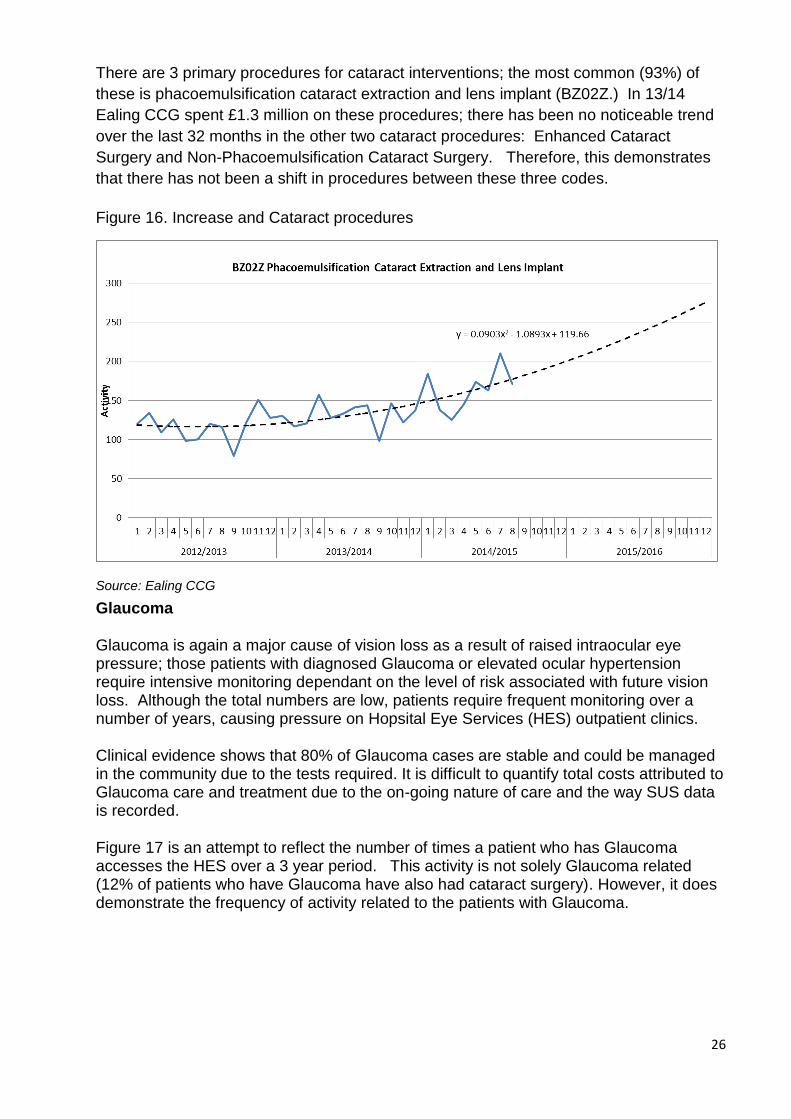
There are 3 primary procedures for cataract interventions; the most common (93%) of
these is phacoemulsification cataract extraction and lens implant (BZ02Z.) In 13/14
Ealing CCG spent £1.3 million on these procedures; there has been no noticeable trend
over the last 32 months in the other two cataract procedures: Enhanced Cataract
Surgery and Non-Phacoemulsification Cataract Surgery. Therefore, this demonstrates
that there has not been a shift in procedures between these three codes.
Figure 16. Increase and Cataract procedures
Source: Ealing CCG
Glaucoma
Glaucoma is again a major cause of vision loss as a result of raised intraocular eye pressure; those patients with diagnosed Glaucoma or elevated ocular hypertension require intensive monitoring dependant on the level of risk associated with future vision loss. Although the total numbers are low, patients require frequent monitoring over a number of years, causing pressure on Hopsital Eye Services (HES) outpatient clinics.
Clinical evidence shows that 80% of Glaucoma cases are stable and could be managed in the community due to the tests required. It is difficult to quantify total costs attributed to Glaucoma care and treatment due to the on-going nature of care and the way SUS data is recorded.
Figure 17 is an attempt to reflect the number of times a patient who has Glaucoma accesses the HES over a 3 year period. This activity is not solely Glaucoma related (12% of patients who have Glaucoma have also had cataract surgery). However, it does demonstrate the frequency of activity related to the patients with Glaucoma.

27
Figure 17 Glaucoma frequency of HES attendance of patients with a primary diagnosis of Glaucoma
Source: Ealing CCG
Services for people with a visual impairment team
The services for people with a visual impairment team (SVIP) work with people of all ages with a visual impairment who live in the borough, primarily those who are registered as blind or partially sighted. We also provide a service to people with a significant sight loss that meet the criteria for registration. SVIP also offers a service to those with a dual sensory loss (Deaf Blind). The team is made up of a senior practitioner, rehabilitation officers and assistants.
SVIP have good links with health and voluntary organisations, which complement our specialist services. It is important that these links are maintained and strengthened to provide a rounded and joined up service.
Services may include:
full specialist visual impairment assessment
training in orientation and mobility, daily living, communications and managing low vision
specialist equipment to aid independence, which has been identified from an assessment
group work
emotional support
welfare rights advice
specialist education advice
supported employment
all aspects of registration
Access to support is most often triggered by a Certificate of Vision Impairment issued by an ophthalmologist when treatment or correction of the sight loss is not possible. The CVI is sent to the local authority which is responsible for contacting the person and invites them to be

28
registered (as sight impaired or severely sight impaired) and / or have their needs for support assessed.
Local organisations Ealing Association for the Blind (EAB) offers a range of support to people affected by sight loss. Ealing Social Club for the blind (ESCB) provides social support and informative talks.
Ealing talking newspapers (ETN) is where volunteers record articles from the weekly local paper for the blind and visually impaired persons.
Hearing Impairment
Ealing has an adult service dedicated to providing a comprehensive hearing healthcare service for people in and around the London Borough of Ealing. Ealing CCG has extended choice of provider for adult hearing care and this means it is available in community settings as well as hospital. Monitor, the NHS regulator, found 7 out of 10 people wanted a choice of hearing care provider, but only 1 in 10 were given one46.
Local organisations
deafPlus provides services for deaf and hard of hearing people living in the borough of Ealing.
Environmental aids
Hearing Aids
Interpretation and lip reading support
Other organisations
Next Generation Text Relay
This is the only national telephone relay service, which enables deaf, deaf blind, deafened, hard of hearing and speech-impaired people to communicate with hearing people. It is run and funded by BT.
Service user feedback
The Ealing Vision Strategy Group Consultation took place at the end of 2013. Over 50
registered blind or partially sighted Ealing residents attended the event to provide
feedback on services and their experiences relating to the following areas:
Promoting eye health and preventing sight loss
Diagnosis and treatment
46
https://www.gov.uk/government/uploads/system/uploads/attachment_data/file/409273/Adult_hearing_services_-_Monitor_s_report.pdf

29
Follow up services and support
Independent Living
Please see Appendix 1 below, for a summary report from the consultation.
An event was organised in 2014 in Ealing which aimed to explore the experiences, good
and bad, of local residents who suffer hearing loss problems. The event was designed to
gather feedback on their use of the local GPs, Hospitals, Dentists and Social Care
Services, and to identify any gaps in these services. In addition, the intention was to
develop ideas for improving the experiences of people with hearing loss, deaf and
deafblind in Ealing.
Full findings from the event can be found here47. A follow up event with commissioners
has been planned for mid-October 2015 with London Borough of Ealing Commissioners
and Ealing CCG on how to take forward issues raised and involve the deaf and hearing
loss community in planning and monitoring service experience
Identified Gaps
Lack of public awareness campaigns in Ealing focused on visual impairments and
sight loss. Evidence shows that health campaigns that highlight the risk between
sight loss and smoking increase the number of people who quit. In addition,
control of diabetes and Diabetic retinopathy screening can help limit the
development of diabetic complications.
Lack of awareness about hearing loss and the impact unsupported hearing loss
can have on individuals and the community
Ealing council has not signed up to the British Sign Language Charter
Lack of understanding amongst staff across council and NHS about the needs of
people with sensory impairments
Issues with accessing services amongst people with sensory impairments
Poor communication arrangements across all NHS services and council (not just
social care as such but all council services) - for e.g. Significant issues around
pharmacists/hospital /GPs on lack of explanation to people who are blind on
taking medication safely
Recommendations for Commissioners
Develop Public Health messages and campaigns to promote eye and hearing health
o Public health to provide Making every contact count training to opticians so that they are able to advice patients about healthy lifestyles and the links to eye health
47
Healthwatch Ealing. “Talk to Healthwatch Ealing”. Community Event for Hearing Loss, Deaf and Deafblind Residents of Ealing - Event Report September 2014 (accessed October 2015)
30
o Integrate eye health messages into smoking cessation activity to create a more compelling case for quitting in particular targeting more deprived areas in the borough. Evidence shows that people living in socio-economic deprivation are more likely to smoke and are also less likely to access primary eye care services and are therefore at a greater risk of avoidable sight loss
o Raise awareness on the risk factors, signs and symptoms of undiagnosed diabetes and referral for treatment of care targeting BME groups at a higher risk of diabetes in particular South Asian Communities
o Raise awareness about hearing loss – especially in older age – and the benefits of hearing care and support. This can reduce the risk of social isolation and loneliness.
Ensure GPs and other health and social care teams are aware of hearing loss and range of local services. In particular, choice of provider and how to complain about services – e.g. lack of follow-up care and support.
Social services team in the council to review process for maintaining disability registers to ensure that it accurately captures everyone with a sensory impairment
Work to raise awareness of deaf and blind residents amongst staff across the council, NHS and other providers, to enable them to work with and understand the needs of people with sensory impairments. (A couple of training sessions have taken place in 2015/16 with social workers and the adaptation teams but should be rolled out more widely)
The council to review the communication skills of front line contact centre staff and consider signing up to the BSL charter
The Care Act 2014 requires that Deafblind people are able to access specifically trained one-to-one support workers, if they are assessed as requiring one. To address this, the council should continue to assess the need for specialist input to assessment, care planning, including staff suitably qualified to carry out complex assessments
Ensure that teams across the council take into account reasonable adjustments that need to be made to support people with sensory impairments. For e.g. Adjustments made to houses for people with visual impairment
Develop an information strategy to consider what more can be done to improve accessibility and reduce digital exclusion – allow access to information and advice service to people with sensory impairments and develop staff knowledge of how to provide information in a range of accessible formats
o Ensure that health and social care information is accessible and aligned with the NHS England ‘ accessible information standard’
31
APPENDIX 1:
Ealing Vision Strategy consultation feedback report
Date: 6 December 2013 Prepared by: Phil Ambler, Thomas Pocklington Trust
Background
On 21 November 2013, a consultation event was held in Ealing to discuss issues relating
to services used by people in the borough who are blind or partially sighted.
Just over 50 people attended on the day, the vast majority of whom were blind or partially
sighted, and were split across six different groups. Whilst there was a mix of different
ethnic backgrounds, there was limited representation for people under the age of 50 and
no children were present.
The following report provides a breakdown of responses. The raw data can be viewed on
request.
Due to the numbers attending and make up of the group, the issues raised may not be
fully representative of the borough as a whole and should be viewed with that in mind.
However, each point should be reviewed and considered as to whether further action or
research needs to be taken.
Theme 1: Promoting eye health and preventing sight loss
1.1 There was a large discussion around engagement with GPs and their awareness judging by the majority of comments on this theme. This is likely due to the high proportion of those attending who have been living with sight loss for many years.
1.2 There was a strong sense that GPs need improved awareness on sight loss and how to best meet the needs of a patient who is blind or partially sighted.
1.3 Recommendations were made about provision of disability awareness training to GPs and reception staff.
1.4 More was felt needed to be done to promote awareness of sight loss to the general public. A lack of available information about eye health in Ealing was cited and the need to promote amongst specific communities (note – communities not identified).
1.5 A suggestion was made to use Ealing Health Trainers to spot issues early to help improve prevention.
Theme 2: Diagnosis and treatment
2.1 It was felt that good information is provided at point of diagnosis and this is followed up with good written information.
2.2 One group reported that waiting times were good whilst other groups reported long waiting times of on average of up to four hours.
2.3 Communication between services was indicated as being poor leading from the optometrist to the eye clinic, then on to the sensory service team. Time between diagnosis and treatment/support was cited as a concern.

32
2.4 People reported that accessing hospital was difficult with transport being highlighted as an issue by one group. A suggestion was made of providing community services to address this need.
Theme 3: Follow on services and support
3.1 The local voluntary sector was recognised as providing good levels of support.
3.2 Several concerns were raised about the considerable length of time some people had to wait for rehabilitation services to be provided.
3.3 There was a positive comment about changes made whereby patients can now access services themselves, which previously required social worker’s ‘permission’.
3.4 One group advised that the eye clinic liaison officer (ECLO) service works well. (Note: current ECLO has resigned, but the post is still in place)
3.5 Having everything in one building at Ealing Council was commended as good practice.
3.6 Some people are unaware of what follow on services and support is available for them and there is no clear path to services.
3.7 People said there is a lack of mobility training, difficulties getting the right equipment and support in using it.
3.8 People would welcome more social activities for both younger and older age groups as this is felt to be lacking in Ealing.
Theme 4: Independent living
4.1 Shopping in stores such as Morrisons and Sainsburys was thought to be good in terms of accessibility, especially where some stores now have lifts. Ealing Broadway shopping centre was felt to be generally accessible.
4.2 Ealing Broadway itself, particularly around the station, was felt to be very inaccessible for blind and partially sighted people, with one table describing it as a ‘death trap’.
4.3 The condition of pavements across the borough was raised as an issue with blind and partially sighted residents at risk of tripping and falling, where there were uneven surfaces and potholes, especially in icy conditions. It was noted that there is good tactile paving in Ealing.
4.4 Overhanging trees and ‘obstacles’ at head height were mentioned as issues.
4.5 Housing was seen to be an issue for some groups. Housing associations are seen to have no experience of sight loss issues. More work could be done in considering adaptable changes which can be made in houses, such as improved lighting for example.
4.6 There were several issues reported about buses and bus drivers. In particular, reference was made to bus drivers pulling up too far away from the kerb or opening doors opposite obstacles such as trees or lampposts, which people walk in to. Bus drivers did not always lower the ramp.
4.7 Whilst some people felt that Dial-a-ride provides a good service, others felt that it was unreliable.

33
4.8 Taxis were a problem for some. It was said that some taxis did not take Taxi Cards and some taxis had problems with taking guide dogs.
4.9 One group highlighted issues around lack of provision in the area for activities for young people in Ealing who are blind or partially sighted.