animated commercials’ effects on low-effort routes to persuasion
TRANSCRIPT

ANIMATED COMMERCIALS’ EFFECTS ON LOW-EFFORT ROUTES TO
PERSUASION: CLASSICAL CONDITIONING APPROACH
By
CHANG HYUN JIN
A DISSERTATION PRESENTED TO THE GRADUATE SCHOOL OF THE UNIVERSITY OF FLORIDA IN PARTIAL FULFILLMENT
OF THE REQUIREMENTS FOR THE DEGREE OF DOCTOR OF PHILOSOPHY
UNIVERSITY OF FLORIDA
2006

Copyright 2006
by
ChangHyun Jin

I dedicate this dissertation to my parents, Jeong-Ho Jin, Pan-Soon Kang who have made me what I am.

iv
ACKNOWLEDGMENTS
It was a long way to be Dr. Jin. It was a great opportunity to start a new challenge in
my life. It was not the end but just the beginning to pursue the endless knowledge. To be
continued to open a new door of advertising area…
I would like to express extreme gratitude to my committee chair, Dr. Jon D. Morris.
His guideline, interest, and selfless donation of time are what made this dissertation
possible. Dr. Jorge Villegas has been particularly helpful and supportive in his capacity
as my cochair, research partner, and informal mentor. Their teaching, guidance, support,
and friendship, during my doctoral studies and throughout the writing of this dissertation,
were invaluable. I am also grateful to Dr. Marilyn Roberts, Dr. Chan-Hoan Cho and Dr.
Ronald W. Ward, for help from the idea development through the completion of this
dissertation.
In the process of writing my dissertation, I was very nostalgic. Yearning for my
home and my family always enabled me complete the otherwise impossible dream of
attaining this degree. I would like to express my heartfelt thanks to my parents, Jeong-Ho
Jin and Pan-Soon Kang, for giving me continuous support and motivation throughout the
completion of this dissertation. I could not have completed this study without the devoted
and unconditional love of my parents, sisters, and brothers-in-law. I would also like to
take this opportunity to thank Korean Communication Gators at the University of Florida,
especially JangYul Kim and ChongMoo Woo, for their stimulating academic discussions
and friendship throughout this Ph.D. experience.

v
TABLE OF CONTENTS page
ACKNOWLEDGMENTS ................................................................................................. iv
LIST OF TABLES........................................................................................................... viii
LIST OF FIGURES .............................................................................................................x
ABSTRACT....................................................................................................................... xi
CHAPTER
1 INTRODUCTION .......................................................................................................1
2 LITERATURE REVIEW ............................................................................................4
2.1 Historical Review of Animation .........................................................................4 2.2 Animation and Peripheral Processing Routes .....................................................5 2.3 Classical Conditioning ........................................................................................7 2.4 The Role of Contingency Awareness ……………………………....................11 2.5 The Influence of Involvement on Awareness ....................................................12 2.6 ELM and Involvement Issues.............................................................................13 2.7 Stimuli in FCB Grid Model ...............................................................................19 2.8 The Animated Commercials as a New Creative Platform .................................21 2.9 The Relationship between Animated Ads and Human Behavior ......................23 2.10 The Effect of Motion on Consumer Behavior..................................................26 2.11 Tripartite Attitudinal Dimensions ...................................................................27
2.11.1 Cognition …………………… ............................................................27 2.11.2 Affection ………………………………….........................................29 2.11.3 AdSAM: A Pictorial Non-Verbal Measure ……………………….. ..31 2.11.4 Conation ………………………..........................................................32
2.12 Summary and Hypotheses................................................................................33 2.12.1 Experiment 1 ………...........................................................................34 2.12.2 The Hierarchy of Communication Effects in Ads ...............................41 2.12.3 Experiment 2 ……………………………….......................................42 2.12.4 The Hierarchy of Communication Effects in C.C ...............................46
3 METHODOLOGY .....................................................................................................49
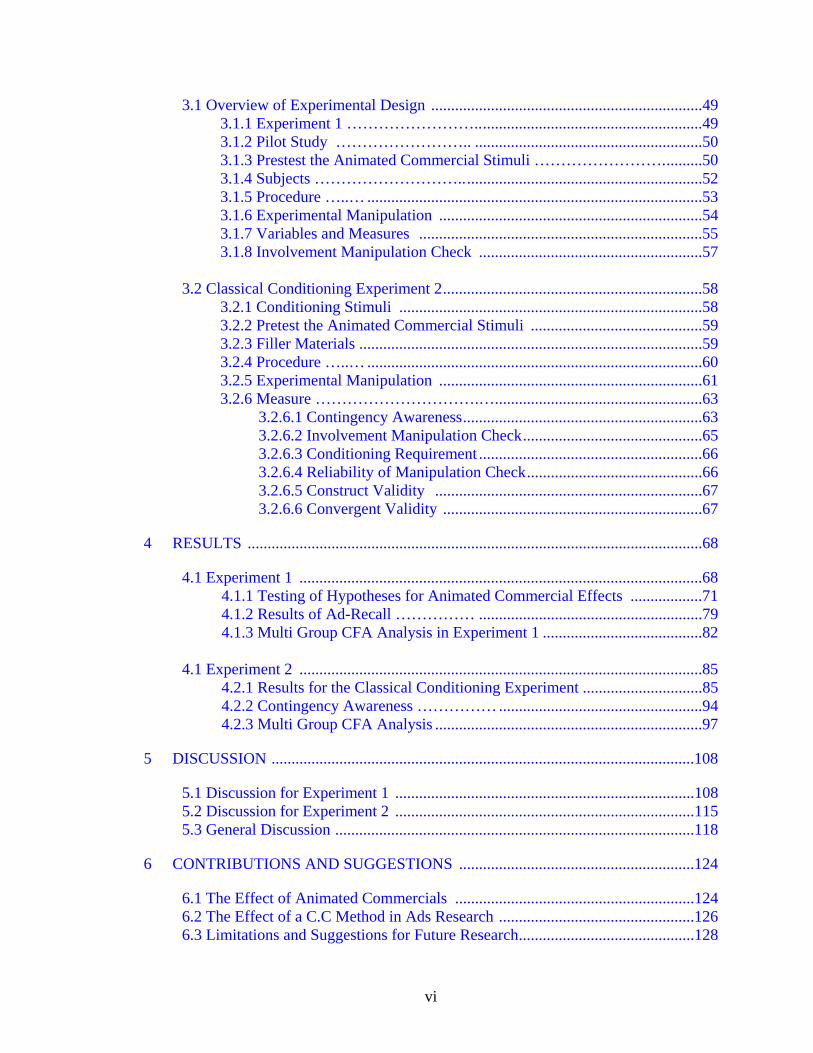
vi
3.1 Overview of Experimental Design ....................................................................49 3.1.1 Experiment 1 …………………….........................................................49 3.1.2 Pilot Study …………………….. .........................................................50 3.1.3 Prestest the Animated Commercial Stimuli ……………………..........50 3.1.4 Subjects ……………………….............................................................52 3.1.5 Procedure …..… ....................................................................................53 3.1.6 Experimental Manipulation ..................................................................54 3.1.7 Variables and Measures .......................................................................55 3.1.8 Involvement Manipulation Check ........................................................57
3.2 Classical Conditioning Experiment 2.................................................................58
3.2.1 Conditioning Stimuli ............................................................................58 3.2.2 Pretest the Animated Commercial Stimuli ...........................................59 3.2.3 Filler Materials ......................................................................................59 3.2.4 Procedure …..… ....................................................................................60 3.2.5 Experimental Manipulation ..................................................................61 3.2.6 Measure ………………………….…....................................................63
3.2.6.1 Contingency Awareness............................................................63 3.2.6.2 Involvement Manipulation Check.............................................65 3.2.6.3 Conditioning Requirement ........................................................66 3.2.6.4 Reliability of Manipulation Check............................................66 3.2.6.5 Construct Validity ...................................................................67 3.2.6.6 Convergent Validity .................................................................67
4 RESULTS ..................................................................................................................68
4.1 Experiment 1 .....................................................................................................68 4.1.1 Testing of Hypotheses for Animated Commercial Effects ..................71 4.1.2 Results of Ad-Recall …………… ........................................................79 4.1.3 Multi Group CFA Analysis in Experiment 1 ........................................82
4.1 Experiment 2 .....................................................................................................85
4.2.1 Results for the Classical Conditioning Experiment ..............................85 4.2.2 Contingency Awareness …………… ...................................................94 4.2.3 Multi Group CFA Analysis ...................................................................97
5 DISCUSSION ..........................................................................................................108
5.1 Discussion for Experiment 1 ...........................................................................108 5.2 Discussion for Experiment 2 ...........................................................................115 5.3 General Discussion ..........................................................................................118
6 CONTRIBUTIONS AND SUGGESTIONS ...........................................................124
6.1 The Effect of Animated Commercials ............................................................124 6.2 The Effect of a C.C Method in Ads Research .................................................126 6.3 Limitations and Suggestions for Future Research............................................128

vii
APPENDIX
A MULTI GROUP CFA ANALYSIS EQS PROGRAM ...........................................132
B QUESTIONNARE ...................................................................................................134
C ANIMATION SNAPSHOTS ..................................................................................145
LIST OF REFERENCES.................................................................................................147
BIOGRAPHICAL SKETCH ...........................................................................................167
viii
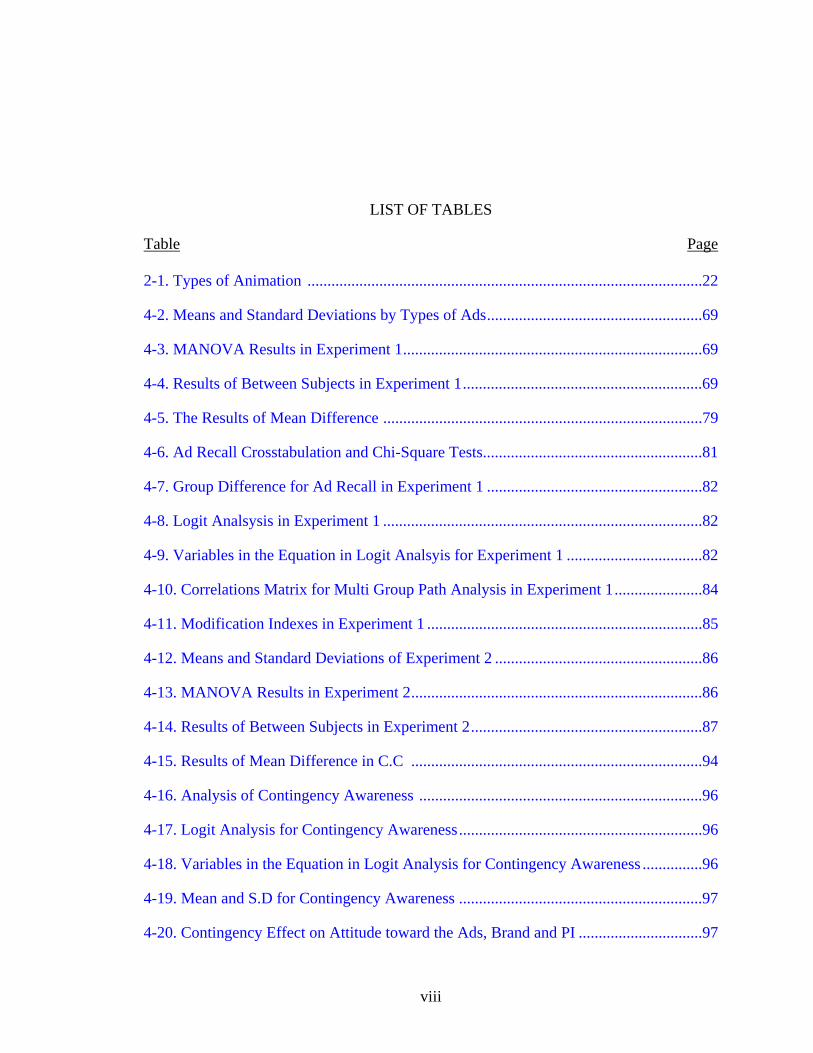
LIST OF TABLES
Table Page 2-1. Types of Animation ...................................................................................................22
4-2. Means and Standard Deviations by Types of Ads......................................................69
4-3. MANOVA Results in Experiment 1...........................................................................69
4-4. Results of Between Subjects in Experiment 1............................................................69
4-5. The Results of Mean Difference ................................................................................79
4-6. Ad Recall Crosstabulation and Chi-Square Tests.......................................................81
4-7. Group Difference for Ad Recall in Experiment 1 ......................................................82
4-8. Logit Analsysis in Experiment 1 ................................................................................82
4-9. Variables in the Equation in Logit Analsyis for Experiment 1 ..................................82
4-10. Correlations Matrix for Multi Group Path Analysis in Experiment 1......................84
4-11. Modification Indexes in Experiment 1 .....................................................................85
4-12. Means and Standard Deviations of Experiment 2 ....................................................86
4-13. MANOVA Results in Experiment 2.........................................................................86
4-14. Results of Between Subjects in Experiment 2..........................................................87
4-15. Results of Mean Difference in C.C .........................................................................94
4-16. Analysis of Contingency Awareness .......................................................................96
4-17. Logit Analysis for Contingency Awareness.............................................................96
4-18. Variables in the Equation in Logit Analysis for Contingency Awareness ...............96
4-19. Mean and S.D for Contingency Awareness .............................................................97
4-20. Contingency Effect on Attitude toward the Ads, Brand and PI ...............................97
ix
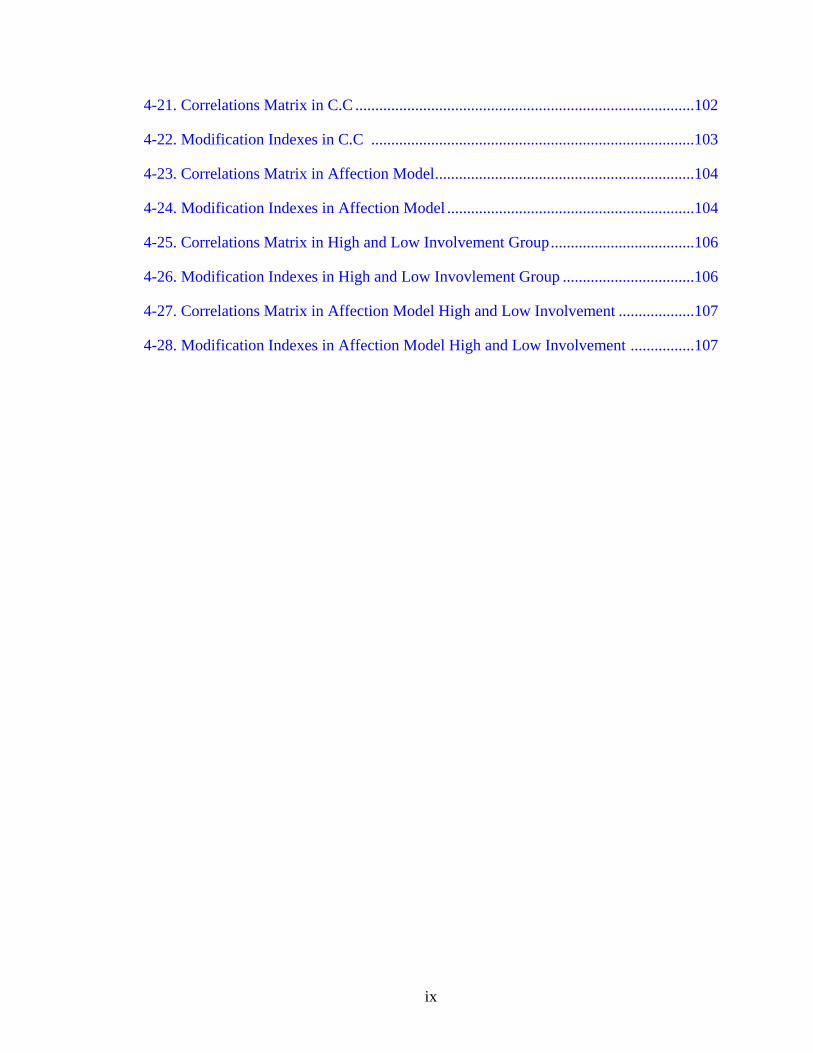
4-21. Correlations Matrix in C.C .....................................................................................102
4-22. Modification Indexes in C.C .................................................................................103
4-23. Correlations Matrix in Affection Model.................................................................104
4-24. Modification Indexes in Affection Model ..............................................................104
4-25. Correlations Matrix in High and Low Involvement Group....................................106
4-26. Modification Indexes in High and Low Invovlement Group .................................106
4-27. Correlations Matrix in Affection Model High and Low Involvement ...................107
4-28. Modification Indexes in Affection Model High and Low Involvement ................107
x
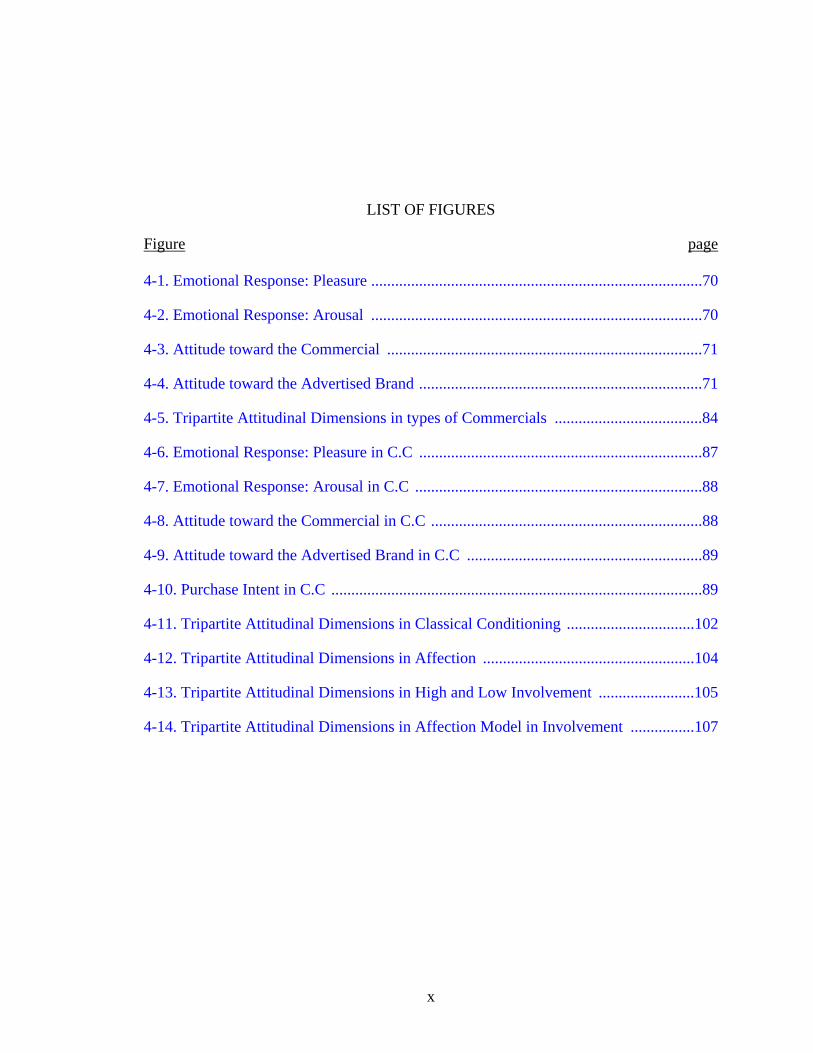
LIST OF FIGURES
Figure page 4-1. Emotional Response: Pleasure ...................................................................................70
4-2. Emotional Response: Arousal ...................................................................................70
4-3. Attitude toward the Commercial ...............................................................................71
4-4. Attitude toward the Advertised Brand .......................................................................71
4-5. Tripartite Attitudinal Dimensions in types of Commercials .....................................84
4-6. Emotional Response: Pleasure in C.C .......................................................................87
4-7. Emotional Response: Arousal in C.C ........................................................................88
4-8. Attitude toward the Commercial in C.C ....................................................................88
4-9. Attitude toward the Advertised Brand in C.C ...........................................................89
4-10. Purchase Intent in C.C .............................................................................................89
4-11. Tripartite Attitudinal Dimensions in Classical Conditioning ................................102
4-12. Tripartite Attitudinal Dimensions in Affection .....................................................104
4-13. Tripartite Attitudinal Dimensions in High and Low Involvement ........................105
4-14. Tripartite Attitudinal Dimensions in Affection Model in Involvement ................107
xi
Abstract of Dissertation Presented to the Graduate School of the University of Florida in Partial Fulfillment of the Requirements for the Degree of Doctor of Philosophy
ANIMATED COMMERCIALS’ EFFECTS ON LOW-EFFORT ROUTES TO PERSUASION: CLASSICAL CONDITIONING APPROACH
By
ChangHyun Jin
December 2006
Chair: Jon D. Morris Cochair: Jorge Villegas Major Department: Journalism and Communications
The motivation of the study was to examine the effects of animation and its
relationship to human cognitive and affective processes by categorizing the different
types of animation and live action featured in television commercials. This study also
assessed the impact of animation in commercials through a series of classical
conditioning experiments. A 3 (types of commercials (clay, cartoon and real human based
commercials) x 2 (degree of involvement: high versus low) between-subjects factorial
design was employed on dependent variables in the first experiment.
A 2 (experimental vs. control group) x 2 (high versus low involvement with the
product) between subjects factorial design was performed on two different conditions on
linear combinations of all dependent variables in the second experiment. In this
experiment, advertised products have been treated as a conditioned stimulus while the
different types of animation have been treated as potential unconditioned stimuli.
xii
This study significantly contributes to our understanding of the relationship
between animated commercials and human cognitive and affective processing. Animated
commercials can more effectively provide visual demonstrations and recall testimonies
for products. Also implication from this study is that animated ads should take into
account the influence of lower-level peripheral processing routes on viewer persuasion.
This study demonstrated that awareness leads to favorable perception of the ad
about the target attribute and favorable brand attitudes. The experiment in this study re-
examined the degree to which awareness of the CS/US contingency plays a role in
classical conditioning. The result of this study was that awareness is enhanced by
involvement. In addition, involvement influences attitude formation through classical
conditioning procedures with affect and belief formation acting as mediators. The study
demonstrated benefits of the effective animated advertising stimuli. Through evidence for
classical conditioning experiment, it can be provided the opportunity to better understand
how classical conditioning can be used as a framework for affecting attitude toward the
brand. The study confirmed that the classical conditioning method would be more
effectively working under the low level personal relevant involvement toward the stimuli.
Understanding the relationship between animated commercials and how they
stimulates viewers or effect their emotional responses and behavioral expectations,
provides valuable information to practitioners who designs animation ads when they
create effective animated commercials. Animation has become an important design tool
in recent graphic interfaces because they motivate consumer actions and draw viewers’
attention to specific product features.
1
CHAPTER 1 INTRODUCTION
Animation has become the new creative advertising trend in today’s entertainment
industry. As a character-based business, animation can expand the design of
advertisements by applying digital content to different media, such as the Internet, mobile
phone technology, and television. However, little research has been conducted on
animated ad and animated characters as spokespersons that identifies whether or not they
prove more effective at building consumer awareness about a product or service (Bush.,
Hair, & Bush 1983; Callcott & Lee 1994; Van Auken & Lonial 1985). Some research
suggests that animated commercials can effectively provide visual demonstrations and
verbal testimonies for a wide variety of products (Callcott & Lee 1994), while studies on
motion (Detenber & Reeves 1996; Detenber, Simons, & Bennett 1998; Sundar & Sriran
Kalyanaranman 2004) have focused on the relationship between size and speed and
emotional response, as well as explored animated objects on the Internet.
The classical conditioning paradigm (Pavlov, 1927) has been widely applied to
the field of consumer behavior. Many researchers have studied its implications on
consumer behavior, and it has been adopted as a process relevant to advertising (Allen &
Janiszewski 1989; Allen & Madden 1985; Bierley, MacSweeney, & Vannieuwkerk 1985;
Gorn 1982; Janiszewski & Warlop 1993; Nord & Peter 1980; Priluck & Till 1998, 2004;
Rossiter & Percy 1980; Shimp et al. 1991). Classical conditioning suggests that positive
attitudes towards an advertised product (conditioned stimulus) might develop through a
product’s association in a commercial with other positive stimuli (unconditioned stimuli).

2
Attractive colors, pleasant music, and humor are examples of potential unconditioned
stimuli used in commercials (Gorn 1982, p.94). Bierley at al. (1985) reported that
generalization of the conditioned response to other, similar stimuli is typically found in
classical conditioning experiments (p. 317). Thus, a classical conditioning paradigm
could be of use when discussing animated commercials as a new form of stimuli.
Purpose and Design of Study Given the little previous research on animation, this remains a relatively new
genre in advertising design. This study aims to examine the effects of animation and its
relationship to human cognitive and affective processes by categorizing the different
types of animation featured in television commercials. Furthermore, the motivation of
this paper is to gain a better understanding of how animation and the animated
advertisement influence cognition, affection, and conation responses.
Psychological studies on advertising and emotional responses typically identify
the form and content of advertisements as critical factors in research. The majority of
research on the effects of advertising note that it does influence cognitive and affective
processes, but limited research exists on the cognitive and affective results of animated
ads. In addition, previous research focused primarily on content analysis, and some
studies attempted to examine the effects of animation on consumers. Combining these
focuses would yield a tripartite study on the animated ad and its relationship to consumer
attitudes. This study will begin with a closer look at each of these variables to better
explain this paper’s hypothesis regarding the relationship between animated commercials
and how they stimulate viewers or affect their emotional responses and behavioral
expectations.

3
In this experiment, advertised products (products selected electronic products and
soft drink goods, or different brands of electronic products and domestic goods) have
been treated as conditioned stimuli while the different types of animation have been
treated as potential unconditioned stimuli. This study will assess the impact of animation
in commercials through a series of classical conditioning experiments.

4
CHAPTER 2 LITERATURE REVIEW
2.1 Historical Review of Animation
Theatrical cartoons appeared on television as early as 1930 and animated cartoons
emerged by the early 1940s because of production costs. In this period, animation was
frequently seen on TV as a non-commercial, experiment medium. By that time, producers
were trying to exercise a great deal of creative control on the animated genre (Cohen
1992). By the end of 2004, the world animation market was valued at US $24 million
(NASSCOM 2002 Report).
Roncarelli (2001) estimated the total value of global commercial computer
animation production at $25.4 billion in 1999, and the industry continues to exhibit
relatively strong growth. This growth has occurred in advertising, movies, broadcasting,
design engineering, games, location-based entertainment, and the Internet. Simon (2006)
stressed that “animation offers advertising clients a powerful tool: The opportunity to
showcase a product or service via a detailed virtual tour on the Internet.” (p. 25) For
instance, FCB and the production company Perceptual Engineering recently merged live
action and animation in a mental health awareness campaign highlighting the issues
surrounding depression. This blended approach was seen as an effective way of getting
inside people’s heads (Simon 2006, p.28).
Animation, which offers entertainment as a form of visual art, has evolved into a
character-based business with the potential to expand its base by offering digital content
to media such as the Internet and mobile phones. In addition, the animation market has
5
potential benefits, including the production of animated TV shows and movies, video title
sales, and merchandise sales featuring animated characters. The advent of advanced
technology in the 21st century has led to more developed computer graphics that allow
animation to extend into computer games, TV commercials, and blockbuster films.
Originally, animation terminology referred to its medium as a means of creating a
complete re-presentation of reality because animation can create the true nature of what
we are seeing in movies and TV because of its ability to fill the gaps when reality simply
doesn’t look real enough. Animation is the process of linking a series of slightly different
drawings together to simulate movement (Wilson 2005). Animation can be recognized as
it means to be produced the world beyond all imagination. Many advertising practitioners
have recognized animation as a new advertising design tool and a form of visual art in the
current entertainment industry. Clay animation referred as the animation of figures
created by plasticine, clay, or other malleable materials (Frierson 1994; Furniss 1998).
And now clay animation very often appears in movies and commercials, as well.
Regarding the current entertainment industry, use of clay animation on movie has been
rapidly increasing. For instance, boxofficemojo.com reported that the movie “Shrek
(2001) and Shrek 2(2004) had grossed over total amount of 1.405.074.876 (i.e., sherk 1
$484,409,218 and Sherk two $920,665,658).”
2.2 Animation and Peripheral Processing Routes
After the creation of the Elaboration Likelihood Model (Petty & Cacioppo 1986),
many researchers explored the central and peripheral processes of persuasive
communications. The specific product information provided in advertisements typically
follows a central processing route, since the viewer puts more effort into hearing the
6
features and benefits of a product. Different types of affective stimuli (e.g., background
music, pleasant visual scenes, characters, and images) in an advertisement follow a
peripheral processing route, as these elements require less cognitive effort on the
viewer’s part. Because animated stimuli rely heavily on these more aesthetic factors,
research on animated ads should note the influence of lower-level peripheral processing
routes on viewer persuasion.
Central processing involves comprehending and learning the arguments in a
persuasive message, the generation of cognitive responses while listening to the message,
and the combination or integration of this (and other) information into an attitudinal
judgment. In contrast, peripheral processing focuses on the rewards or punishments
associated with a message and the attractiveness or credibility of the source. The
peripheral route also refers to simple affective mechanisms of attitude change, such as
classical or operant conditioning (Fishbein & Middlestadt 1995, p.255).
A variety of processes are supposed to influence attitudes without the necessity of
comprehensive or analytical thought about the attitude object. These processes also
operate when motivation or the ability to think is lacking. It is possible that the lowest
level of elaborative thinking would correspond to processes that represent “mere
associations” between the attitude object and some other positive or negative cognitive
element. Other relatively low-thought processes involve simple inferences about the
attitude object, but often on the basis of information peripheral to the qualities of the
attitude object (Wegener & Carlston 2005, p.534).
Hoyer and MacInnis (2001) noted that people tend to view commercials
passively, since the information provided requires less motivation to process. Thus, given
7
their emphasis on attractive or likable characters and motion, humor, and pleasant music,
it is critical to analyze how animated commercials affect consumer attitudes via
peripheral processing routes. It is also important to apply the classical conditioning
mechanism to studies on animated ads and examine the role of animated stimuli on
consumer-attitude formation.
2.3 Classical Conditioning
Classical conditioning has long been employed in the study of consumer behavior
(Bierley, MacSweeney,& Vannieuwkerk 1985; McSweeney & Bierley 1984; Nord &
Peter 1980) and as a means of interpreting the effects of advertising, such as attitude
changes (Janiszewski & Warlop 1993; Priluck & Till 1998, 2004; Rossiter & Percy
1980). Classical conditioning is considered a prime method of persuasion (Petty &
Cacioppo 1996), as considerable research has demonstrated its effectiveness (Allen &
Janiszewski 1989; Allen & Madden 1985; Gorn 1982; Kim, Allen, & Kardes 1996;
Stuart, Shimp, & Engle 1987; Shimp, Stuart, & Engle 1991) as well as its ubiquity in
advertising and promotion (Eagly & Chaiken 1993; Shimp 1991).
In a classical conditioning paradigm (Pavlov 1927), a conditioned stimulus (CS)
and a motivationally significant unconditioned stimulus (US) are paired. As a result of
this pairing, the original CS elicits a response, which is the conditioned response (CR),
that it did not elicit prior to the association with the US. Conditioned responses are
expressions of non-declarative forms of memory. While they can be conscious
themselves, such responses are elicited without consciously accessing any memory
content (Clark & Squire 1998).
8
In advertising research, classical conditioning is an effective method for
developing favorable attitudes toward a brand that are retained long enough to be
accessible at the time of purchase (Priluck & Till 1998, p.28). The use of favorable
images to condition consumer responses to brand names is established in previous
marketing literature. Speed and Thompson (2000) argued that classical conditioning
research in advertising suggests that the size of the conditioned response will depend on
(a) respondents’ attitudes toward the unconditioned stimulus, or the advertisement
(Mitchell & Olsen 1981; Shimp 1981); (b) respondents’ prior attitudes toward the
conditioned stimulus, or the brand being advertised (Stuart, Shimp, & Engle 1987); and
(c) respondents’ perceptions of congruence between the unconditioned and conditioned
stimulus, or the advertisement and the brand being advertised (Mitchell, Kahn, &
Knasko 1995; Shimp 1991). Hence, the purpose of this study is to generate attitudes
toward brands featured in animated ads through classical conditioning procedures.
Classical conditioning is also a means of influencing consumer attitudes without
invoking much cognitive processing effort. According to Pavlov’s study, food acted as an
unconditioned stimulus (US), and the dog’s salivation response to the food was the
unconditioned response (UR). A stimulus is considered “unconditioned” because it
automatically elicits an involuntary response. In other words, the dogs could not help but
salivate when they saw the meat powder. In contrast, a conditioned stimulus (CS) does
not automatically elicit an involuntary response alone. Thus, until Pavlov paired the food
with the bell, the bell alone was not capable of making the dogs salivate. Repeatedly
pairing the conditioned stimulus (the bell) with the unconditioned stimulus (the meat
powder) automatically elicited the involuntary unconditioned response (salivation).
9
However, over time salivation became a conditioned response (CR) to the sounding of
the bell alone. In another illustration of this phenomenon, many cat owners have noticed
that their cats usually come running at the sound of the can opener being used. This
behavior occurs because the noise of the can opener has been repeatedly paired with
regular feedings (Hoyer & MacInnis 2001).
Mitchell and Olsen (1981) also found that the same conditioning effect appears to
determine attitudes when nonverbal information is presented in advertisements. Thus,
advertisements that associate a brand with a nonverbal affective cue transfer the affect to
the brand itself over time. This involves spontaneous communication; syncretic cognition
is altered by changing the affect associated with the product through the use of emotional
cues in the advertisement. Moreover, electronic media may be especially adept at
classical conditioning strategies that produce syncretic cognition, since electronic media
abound in spontaneous nonverbal emotional cues (Chaudhuri & Buck 1995, p. 112).
Positive attitudes toward an ad become associated with the brand itself and
eventually become part of the brand. This result can take place in the total absence of
analytic cognition or beliefs, since product information was kept at a minimal level in the
experiment. Chaudhuri and Buck (1995) argued that classical conditioning strategies in
advertising commonly use spontaneous nonverbal cues, such as music, which generate
syncretic cognition. Some of these spontaneous nonverbal cues, such as music and sound
effects, are available only in electronic media. We suggest that this is a second reason
why, relative to print media, electronic media emphasize syncretic cognition. Moreover,
it has been found that music in television commercials has a distracting effect during
analytic cognitive situations (Park & Young 1986). Therefore, the lack of cues like music

10
in print media may encourage analytic cognitive responses, at least in comparison to
electronic media (Chaudhuri & Buck 1995, p.113)
Gorn’s (1982) study examined the impact of music in advertising on consumer-
choice behaviors through the application of a classical conditioning model. Classical
conditioning suggests that positive attitudes towards an advertised product (conditioned
stimulus) might develop through the product’s association with other stimuli that
consumers relate to positively (unconditioned stimuli). Attractive colors, pleasant music,
and humor act as the potential unconditioned stimuli in commercials (Gorn 1982, p.94).
Previous research on product preferences asserts that the background features
used in commercials were only related to product preferences when minimal product
information was presented. The impact of advertised product information on beliefs and
attitudes would typically be interpreted within an information-processing framework. It is
suggested here that a classical conditioning model could account for the potential impact
of background features on product attitudes. In fact, classical conditioning could explain
the effect of many variables on changes in consumer attitudes. For example, the effect of
communication may be related to a viewer’s association of the attitude object with a
positive attitude toward the communicator.
Many have emphasized that such hedonic associative mechanisms seem to work
through the principle of higher-order classical conditioning wherein an unconditioned
stimulus (some component of advertising copy) that elicits an unconditioned response
(positive pleasurable emotions) is repeatedly paired with a conditioned stimulus (the
brand name) until the conditioned stimulus alone elicits the unconditioned response
(favorable emotions toward the brand) (Fishbein & Ajzen 1975; Petty, Cacioppo, &
11
Schuman 1983; Shimp 1981). In the case of arousal, an emotional appeal might associate
the product with a desired state of vitality and liveliness while avoiding the extremes of
sluggishness or over-stimulation (Holbrook & O’Shaughnessy 1984, p.55).
In marketing, classical conditioning is often mentioned and generally accepted as
a process relevant to advertising (Engel, Blackwell, & Minard 2001). However, little
empirical research exists on whether or not consumer preferences for products can
actually be classically conditioned. In psychology, where classical conditioning has been
investigated more extensively, there is insufficient evidence to support that attitudes can
be classically conditioned (Brewer 1974; Fishbein & Ajzen 1975). In addition, the limited
popularity of classical conditioning may be due to several difficulties associated with
typical conditioning experiments. Shimp (1991) mentioned that effective conditioning
should involve awareness of the relationship between the conditioned and unconditioned
stimuli. Studies on classical conditioning are important to discovering the role of
awareness in classical conditioning, and by noting that effective conditioning can occur
through direct affect transfer or through cognitive belief information.
2.4 The Role of Contingency Awareness
Priluck and Till (2004) defined contingency awareness as “the state of the
individual’s learning that the conditioned stimulus (CS) precedes the unconditioned
stimulus (US) as he or she is exposed to classical conditioning trials” (p.299). Allen and
Janiszewski (1989) referred to contingency awareness as repeated exposure to a CS/US
combination that results in subjects learning that the presence of a particular US is
contingent upon the presence of a specific CS (p.32).
12
Until recently, psychologists and consumer researchers have attempted to
investigate the role of contingency awareness. Eagly and Chaiken (1993) argued that
information-based explanations of the effects of classical conditioning procedures on
attitudes were based primarily on the assumption that awareness of the CS/US
contingency was necessary for conditioning effects to occur (p.410). Contingency
awareness could be a consequence of conditioning as well as the product of a deliberate
cognitive process (Eagly & Chaiken 1993, p.410).
Kim et al. (1996) found that awareness leads to positive beliefs about the target
attribute and favorable brand attitudes, suggesting a dual mediation model in which
awareness plays a central role. They suggest that the acquisition of both affect and beliefs
in attitude formation could be fostered by awareness. According to Shimp (1991),
awareness exists when subjects realize that a CS and a US have a temporal relationship in
an experimental sequencing. Many studies on awareness argue that it is a requirement for
effective attitude formation via the conditioning process (Allen & Janiszewski 1989;
Shimp et al.1991). Researchers who study classical conditioning assert that cognitive
factors explain classical conditioning when human subjects are used. These researchers
also investigated whether or not conditioning can occur in humans without awareness.
The experiment in this study examines the degree to which awareness of the CS/US
contingency plays a role in classical conditioning.
2.5 The Influence of Involvement on Awareness
Involvement issues have been studied in consumer behavior fields (Greenwald &
Leavitt 1984; Homer & Kahle 1990; Laczniak, Muehling, & Grossbart 1989;
Zaichkowsky 1985). Macinnis and Park (1991) found that certain executional cues (e.g.,

13
pictures, source characteristics, music, and message sidedness) may influence central-
route (message based) and peripheral (non-message based) processing of both high-and
low-involvement consumers. Individuals who are highly involved with a stimulus have a
greater tendency to pay attention to the stimulus (Celsi & Olson 1988; Greenwald &
Leavitt 1984; Lord & Burnkrant1993), and higher levels of attention to the stimuli in a
conditioning experiment may result in contingency awareness.
Gorn’s (1982) study suggests that individuals who are highly involved with
objects are less likely to respond to music as the unconditioned stimulus than to the
information provided regarding the product. People who are highly involved with objects
are more likely to develop favorable attitudes when exposed to conditioning procedures
in the absence of product information. Gorn also found that involvement alone may or
may not be strong enough to lead to awareness.
Priluck and Till (2004) pointed out that awareness is the central variable through
which attitudes are conditioned, and awareness is enhanced by involvement. In addition,
involvement influences attitude formation through classical conditioning procedures with
affect and belief formation acting as mediators (p.330). In information-processing theory,
motivation and processing ability interact to heighten processing levels (MacInnis &
Jaworski 1989), leading to awareness and positive consumer attitudes. Certain cues
acting as affective stimuli may influence consumers’ brand attitudes, thus enhancing
message processing (Petty & Cacioppo 1986).
2.6 ELM and Involvement Issues
In the (ELM) elaboration likelihood model, Petty and Cacioppo (1986) identified
or classified the type of central cognitive processing involved in consumer product
14
evaluation, that attitude formation or change results from a consumer’s careful attempts
to comprehend and evaluate the brand-relevant content of an ad and to integrate this new
information with their prior knowledge into a coherent and reasoned opinion about the
brand. On the other hand, peripheral processing is described as happening when
consumers use peripheral factors, such as their feelings about quality of the ad, the source
of the ad, or their current mood state, as cues to help them decide how they feel about the
advertised brand (Mackenzie & Spreng 1992, p.519).
Some scholars noted that attitudes based on direct behavioral experience have
necessarily evolved from a thoughtful elaboration of self-generated information that is
likely to be clear, involving, and accessible. By contrast, attitudes based on indirect
experience (i.e., information from others) are less likely to have been extensively
elaborated upon and, thus, are probably less clear, involving, or accessible than those
based on direct experience (Mackenzie & Spreng 1992, p.678).
The ELM predicts change in attitude toward an advertised brand where an attitude
refers to a global evaluation of the brand. One is the central route, along which the
consumer changes his attitude on the basis of elaboration on arguments. The other is the
peripheral route, along which the consumer may change their attitude on the basis of a
variety of processes-through, for instance, heuristic inferencing of brand quality from
message elements, through association of message elements with the brand, or through
mere exposure to the brand.
According to Garder (1985), the consumer’s processing “set” during exposure to
the advertisement possibly mediates the effects of Aad on brand attitudes. An individual’s
motivation and ability to process message information influence express themselves over
15
neural processing routes, which are the elaboration likelihood model versus peripheral
processing (Cacioppo and Petty 1985; Garder 1985).
In connection with consumer psychology, influencing brand attitudes, peripheral
cues such as attitude toward the ad, source credibility or attractiveness and others may
also influence the degree of central processing (Mackenzie & Spreng 1992, p.519).
According to Mackenzie and Spreng (1992), “when applied to an advertising
context the ELM suggests that, as a consumer’s motivation to centrally process brand-
relevant aspects of advertisement increases, the impact of central processing on brand
attitudes should increase, the impact of peripheral processing on brand attitudes should
decrease, and the impact of brand attitudes on purchase intentions should increase.”
(p.519)
The term “involvement” has been used to identify the process by which
motivation moderates the link between ad exposure, processing, and the attitude-
formation process (Krugman 1965). Krugman (1965) proposed that television is a low
involvement medium, producing its effects by repetition, as opposed to a high
involvement medium like print, which produces relatively enduring changes in beliefs.
Petty and Cacioppo (1986) termed these effects as peripheral and central routes to
persuasion, respectively. In contrast to Krugman’s characterization of television as a low
involvement medium, McLuhan (1964) argued that due to its barrage of visual and
auditory images television is a higher involvement medium than print media. Chaudhuri
& Buck (1995) addressed the question of how these diametrically opposed views of
involvement of television versus print be reconciled.
16
Batra and Ray (1983) defined involvement as the depth and quality of cognitive
processing, while Mitchell (1979) defined it as an individual level, internal state variable
whose motivational properties are evoked by a particular stimulus or situation. In
addition, Johnson and Eagly (1989) defined involvement as a motivational state induced
by an association between an activated attitude and the self-concept (p. 290). Johnson and
Eagly (1989) went on to classify three different types of involvement, which include
value-relevant, impression-relevant, and outcome-relevant involvement.
First, value-relevant involvement refers to the psychological state created by the
activation of attitudes that are linked to important values (Johnson & Eagly 1989, p. 290).
Impression-relevant involvement characterizes the persuasion settings that make salient
to subjects the self-presentational consequences of their post-message positions (Johnson
& Eagly 1989, p. 292). Finally, outcome-relevant involvement makes salient to message
to recipients the relevance of an issue to their goals or desired outcomes (Johnson &
Eagly 1989, p. 292).
Levin, Nichols, and Johnson (2000) suggest that outcome-relevant involvement
generally leads to relatively objective, unbiased message processing; value-relevant
involvement leads to biased or reduced message processing; and impression-relevant
involvement leads to social information processing. These classifications should help
researchers and practitioners better understand how to motivate the type of processing
that best suits their needs and why persuasion attempts often fail (p.190).
Zinkhan and Muderrisoglu (1985) noted that the higher a person’s involvement in
and familiarity with a product and the higher their ability to cognitively differentiate
between the product’s features, the higher the recall would be of the
17
contents/characteristics in the product’s advertisement (p. 356). One definition of
involvement identifies it as a psychological/internal state of commitment (Mitchell 1979,
1981) that is activated by a certain stimulus in a given situation (Cohen 1983). If
activation of this internal state is high (possibly caused by a greater degree of attention to
a particular stimulus), then subsequent memory performance and recall should also be
high (Zinkhan & Muderrisoglu 1985, p.356). Therefore, high involvement conditions due
to comprehension and elaboration should also lead to a better recall of message
characteristics (Zinkhan & Muderrisoglu 1985, p.356).
Greenwald and Leavitt (1984) identified four distinct levels of involvement: pre-
attention, focal attention, comprehension, and elaboration. The lowest level, pre-
attention, uses little attentional capacity. This level is akin to hearing an advertisement on
the radio and yielding little to no awareness or interest and absolutely no retention of the
message. As attentional capacity increases and a person engages in more complex
message analyses, the level of involvement increases to focal attention where attends to
superficial message features such as sensory information. The next involvement level is
comprehension, where the message begins to provide a context within which the recipient
can search for relevance. The highest level, elaboration, is analogous to the unique
processing that occurs in encoding self-relevant information.
According to the ELM, people are likely to process information differently
depending on their level of involvement with the message. Attitudes are affected by the
central processing route under high-involvement conditions, or when people make a
cognitive effort to evaluate statements. Attitudes are affected by the peripheral processing
route in low-involvement conditions, as when people have to make a greater effort to
18
understand the specific elements of a message. It can be postulated that attitudes appear
to be affected by the use of peripheral cues--such as creative or aesthetic elements in an
ad--under low-involvement conditions rather than high-involvement conditions (Petty,
Cacioppo, & Schumann 1983).
Celsi and Olson (1988) suggested that the defining characteristic of product
involvement is the perceived personal relevance that a brand offers consumers. This
relevance is enhanced when consumers link a product’s image or attributes to its potential
helpfulness in achieving their own personal goals and serving their personal values.
Taking this link to its logical conclusion, product involvement should be stronger when a
consumer perceives a strong association between the product’s image and attributes and
the consumer’s own personal goals and values (Celsi & Olson, 1988). Involvement with a
product can also differ within an individual consumer depending upon situational factors.
Celsi and Olson (1988) posit that a consumer’s associations with a product are
stored in memory until “activated” by a situation. They suggest that this activation is
highly dependent upon individual situational factors which are highly “experiential and
phenomenological” in nature, but which can serve as a powerful trigger that turns the
latent memory associations into active thoughts. The activation of these personally
relevant thoughts has been called “felt involvement” (Celsi & Olson 1988). Once this
activation occurs, consumers become motivated to act upon their associations with a
product either through cognitive reactions such as attention or comprehension of product
advertising messages, or even overt behaviors, such as searching for, or purchasing, a
product (McGrath & Mahood 2004, p.43).
19
Recent work by Zaichkowsky (1985, 1986, 1994) has provided researchers with a
tool, known as the Personal Involvement Inventory (PII), to measure and compare
involvement levels for different classes of products. Zaichkowsky’s typology was
employed in this study. Studies of product involvement’s influence on dependent
measures of advertising effectiveness (i.e., attitudes, recall, etc.) have generally found
that high-involvement products score higher than low-involvement products (Gardner et
al. 1985; Thorson & Page 1988; Hitchon & Thorson 1995). Thorson and Page (1988)
reported that people who are highly involvement with the product have higher scores of
brand recall, a favorable attitude toward the ad, brand and purchase intention.
2.7 Stimuli in FCB Grid Model
The purpose of this study is to examine the role of animation in tripartite
attitudinal dimensions (e.g., cognition, affection, and conation). For this study, emotional
responses will be defined as pleasure, arousal, and dominance, to be defined in section 2-
11-3. This paper assumes that different responses will be elicited under different product
categories, like cognitive and affective product categories, as suggested by the FCB
(Foote, Cone, and Belding) Grid.
Generally, involvement can be defined as an individual’s degree of concern,
recognition, or personal relativity to a particular object. Therefore, involvement varies
depending on the individual, as well as a given situation. Ratchford (1987) and Vaughn
(1980, 86) classified products into either high-involvement or low-involvement
categories for the sake of convenience, though involvement standards are not so clearly
divided.
20
The FCB grid model completed by Vaughn (1980) integrated product
involvement with the thinking and feeling dimensions of consumer theory. In this model,
involvement was regarded as the degree of consumer concern, and the relationship
between consumer activity analysis and product classification was systematized
(Krugman 1965; Ratchford 1987; Weinberger & Spotts 1989). According to the theory of
social judgment by Sheriff (1965), when there is a high degree of involvement, message
receivers broaden the latitude of rejection, which narrows the range of reception. In the
case of low-involvement products, the receiver accepts the broad range of the message
and only rejects inconsistent messages. Thus, this study will assume that people respond
differently to ads that fall under high- and low-product involvement categories as it
examines consumer responses to animated advertising.
Vaughn’s (1980, 86) FCB grid captures cognitive and affective responses to
products with its think/feel axis. The grid’s other axis represents product involvement.
The FCB grid's four quadrants are informative (think/high involvement), affective
(feel/high involvement), habitual (think/low involvement), and satisfaction (feel/low
involvement). Think is associated with a utilitarian motive and, consequently, with
cognitive information processing, while feel implies ego-gratification, social-acceptance,
sensory-pleasure motives, and attendant affective processing (Ratchford 1987). This
suggests that one would find more objective information in ads for products occupying
the think cells. This expectation was confirmed by Weinberger and Sports (1989).
Ratchford (1987) has provided evidence for the reliability of product classification based
on the FCB grid quadrants (Putrevu & Lord 1994, p.79).
21
2.8 The Animated Commercial as a New Creative Platform
The animation process results in motion pictures that are created by recording a
series of still images-drawings, objects, or people in various positions of incremental
movement, which when played back no longer appear individually as static but as
combined to produce the illusion of unbroken motion (http://encarta.msn.com;
contributed by Furniss 2006).
Some researchers emphasize that animation is a highly effective design tool for
capturing viewer interest and attention. Animation is usually classified into different
categories (Frierson 1994; Furniss 1998), including CGI (Computer Graphic Image)
animation, clay animation (claymation), cartoon animation, film animation, drawn
animation, pixilation, puppet animation, and silhouette animation. There are thirteen
different types of animated commercials, which fall into several functional categories:
explanation, demonstration, big model, slice of life, fiction, documentary, comparison,
image building, symbol, spectacular, production, commercial, and humor.
The most common type of animation is drawn on cells and is 2-D. It is a
traditional design technique. Advanced technology can create a new style animation. The
three-dimensional animation of clay animation is created. In current entertainment
industry, clay animation and computer generated animation have become the most
popular type of animation in film and television commercials.
Clay animation, computer generated animation, puppet animation are the most
popular animation types in today’s animation industry. As explained in Table 2-1, clay
animation employs figures made of plasticine, a material that has an oil base to keep it
22
flexible. Puppet animation uses three-dimensional figures that are moved incrementally
for each frame of film. Pixilation is animation made by using humans or other live
subjects filmed incrementally in various fixed poses; when the movements are played
back, the subjects move in an unnatural or somewhat surreal way. Due to advanced
pixilation technology, the illusion of motion is created through a succession of computer-
generated still images (http://encarta.msn.com; contributed by Furniss 2006). Cartooning
is referred as a series of drawings made on paper in preparation for and in the same size
as a painting, tapestry, mosaic, or piece of stained glass (http://encarta.msn.com;
contributed by Kunzle 2006). Currently, animated cartoons have become tools to
influence people’s opinions on politics and society.
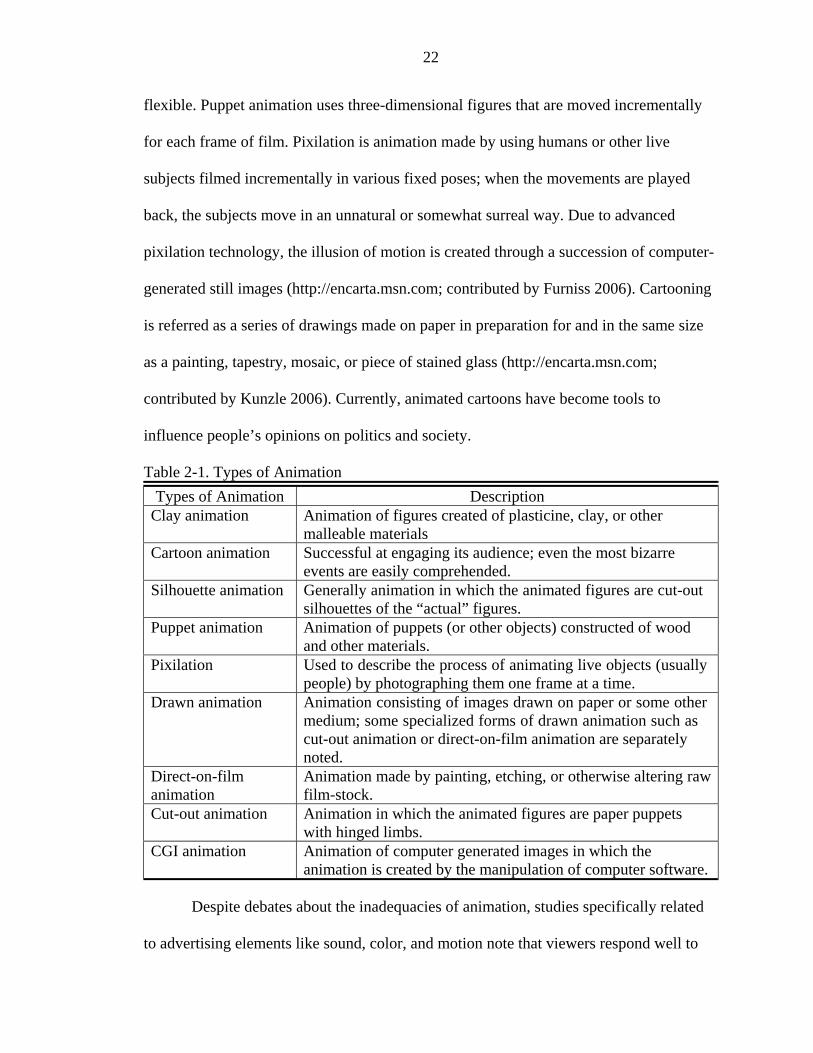
Table 2-1. Types of Animation Types of Animation Description
Clay animation Animation of figures created of plasticine, clay, or other malleable materials
Cartoon animation Successful at engaging its audience; even the most bizarre events are easily comprehended.
Silhouette animation Generally animation in which the animated figures are cut-out silhouettes of the “actual” figures.
Puppet animation Animation of puppets (or other objects) constructed of wood and other materials.
Pixilation Used to describe the process of animating live objects (usually people) by photographing them one frame at a time.
Drawn animation Animation consisting of images drawn on paper or some other medium; some specialized forms of drawn animation such as cut-out animation or direct-on-film animation are separately noted.
Direct-on-film animation
Animation made by painting, etching, or otherwise altering rawfilm-stock.
Cut-out animation Animation in which the animated figures are paper puppets with hinged limbs.
CGI animation Animation of computer generated images in which the animation is created by the manipulation of computer software.
Despite debates about the inadequacies of animation, studies specifically related
to advertising elements like sound, color, and motion note that viewers respond well to

23
such features. Furthermore, new technologies have expanded and reinvented the concept
of advertising design and animation. While previous studies concentrated on children’s
attitudes toward animated commercials and products (Hoy, Young, & Mowen 1986) or
the effectiveness of animated spokespersons (Neeley & Schumann 2004), animated ads
warrant further study because they have become an increasingly popular design genre
that appeals to consumers of all ages.
2.9 The Relationship between Animated Ads and Human Behavior
Brand familiarity is the primary focus in consumer behavior studies. First, a
consumer’s familiarity with a product or brand influences such concepts as consumer
adaptation, self-image, compliance, and identification. Similar studies should focus on
the relationships between brand familiarity, consumer confidence in brand evaluations,
consumer attitudes toward brands, and purchase intentions. In terms of brand preference,
brand choice, and consumption, consumers create meaning to strengthen their identities
through brand preferences. The term “match-up hypothesis” defines the fit between a
celebrity and an endorsed product and suggests that different types of endorsers and
celebrities influence consumer attitudes.
A consumer’s familiarity with a product or brand influences such concepts as
consumer adaptation, self-image, compliance, and identification. Building on previous
research, Laroche, Kim, and Zhou (1996) examined the relationships among brand
familiarity, consumer confidence in brand evaluations, consumer attitudes toward brands,
and purchase intention. The empirical results from structural equation modeling show
that consumer familiarity with a brand influences confidence in that brand, which in turn

24
affects intentions to buy the brand. These causal relationships are tested in a multiple-
brand context.
Zinkhan and Muderrisoglu (1985) defined familiarity is a variable which
describes the nature of the cognitive structure a person develops toward a product. As
such, familiarity should be viewed as a variable affecting the hypothetical construct of
involvement levels (p.356). Zinkhan and Muderrisoglu (1985) also noted that the term
“familiarity” has usually been operationalized in the past as frequency of use (Raju &
Reilly 1979), knowledge about the product class (Lastovika 1979), and previous
experience (Russo & Johnson, 1980). Marks and Olson (1981) argued that familiarity
referred to a cognitive representation of past experiences stored in memory. Furthermore,
the representation is organized in memory as a product-related cognitive structure or
schema (Zinkhan & Muderrisoglu 1985, p.356).
If an individual receives a persuasive message about a product/ brand for which
the individual has a well-developed memory structure, then that individual will be able to
activate more concepts from memory to use in interpreting the attended stimuli. This may
also mean that the individual might exhibit higher activation potential (Cohen 1981) to
process the external information. On the other hand, an individual unfamiliar with a
product will have less-developed memory structures of the external stimuli with a fewer
number of existing cues in memory, resulting in a less-elaborate encoding, and thus with
poorer recall of the product and message features (Zinkhan & Muderrisoglu 1985, p.356).
When an individual is familiar with an object and thus has a higher developed
memory structure about it, he/she is more likely to have a greater involvement with the
stimulus object. If involvement is a psychological and internal state whose activation is
25
triggered by a particular stimulus, then the more an individual knows, the higher his/her
involvement (Zinkhan & Muderrisoglu 1985, p.356). Zajonc and Markus (1982) suggest
this phenomenon demonstrates that some preferences are caused by affective factors
without the participation of cognitive processes.
Affective factors play an important role in the development and maintenance of
preference. Preferences are primarily based on behavioral phenomena. A preference for
X over Y is a tendency of the organism to approach X more often and more vigorously
than they approach Y (Zajonc & Markus 1982, p.123). A preference for an object can be
radically changed with experience while its properties remain constant (Zajonc & Markus
1982, p.124). Zajonc and Markus (1982) asserted that under some circumstances
affective responses, including preference judgments, may be fairly independent of
cognition (p.125). Advertisements are typically viewed as intervening variables that
mediate the effects of message content on brand preferences, buying intentions, or
purchases (Holbrook & O’Shaughnessy 1984, p.48).
The term “preference” links consumer convictions, values, awareness, and
intentions. Questions of personal identity and collective identity are ranked highly on the
agenda of today’s postindustrial societies (Giddens 1991). Through brand preference,
choice, and consumption, consumers create meaning and try to define or strengthen their
identities (Belk 1988; Bhattacharya, & Sen 2003; Elliott & Wattanasuwan 1998; Fournier
1998; McCracken 1986). Zajonc and Markus (1982) suggest this phenomenon
demonstrates that some preferences are caused by affective factors without the
participation of cognitive processes.
26
For the terms of fittingness, Till and Busler (2000) identify the origin of the
match-up hypothesis in advertising research which examines the differential impact that
different types of endorsers (often celebrities) have on an endorsed brand. Early research
found that the effectiveness of celebrity endorsements varies by product (Friedman &
Friedman, 1979). A study by Kanungo and Pang (1973) paired male and female models
(non-celebrities) with different types of products and found that the effect of the models
varied depending on the product each model endorsed. Kanungo and Pang (1973)
explained their findings in terms of the “fittingness” of the model for the product. The fit
between the celebrity and the product was defined by the term “match-up hypothesis”
(Kahle & Homer, 1985; Kamins, 1990; Lynch & Schuler, 1994; Solomon, Ashmore, &
Longo, 1992). Though beauty is functional and accessible, it also gives consumers a
sense of fittingness, belonging, and familiarity that can be extended to brand names.
2.10 The Effect of Motion on Consumer Behavior
Animation has become an important design tool in recent graphic interfaces
because it motivates consumer actions and draws viewer attention to specific product
features. As Lee, Kippel, and Tappe (2003) have noted:
Motion can be an effective tool to focus users’ attention and to support the parsing of
complex information in graphical user interfaces. Despite the ubiquitous use of
motion in animated displays, its effectiveness has been marginal at best. The
ineffectiveness of many animated displays may be due to a mismatch between the
attributes of motion and the nature of the task at hand (p.12).
With the development of new digital devices and more sophisticated computer
software, animation is becoming more common in television commercials and banner
ads. Although the effectiveness of animated commercials has been doubted by many
27
researchers (Lee, Klippel, & Tappe 2003; Tversky, Morrison, & Betrancourt 2002),
animations can motivate consumer action and increase brand recognition and recall. The
animated genre will also appeal more to our increasingly visual culture. Empirical studies
on motion in advertisements have explored its psychological effects (Detenber,
Benjamin, Simons, & Bennett 1998), stressing that motion could influence human
cognitive processing and increase viewer attention to ads (Kipper, 1986; Reeves et al.,
1985).
2.11 Tripartite Attitudinal Dimensions: Cognition, Affection, and Conation
2.11.1 Cognition: Belief and Knowledge
The goal of this paper is to examine the role of animation in tripartite attitudinal
dimensions (e.g., cognition, affection, and conation). Many scholars (Breckler 1984; Katz
& Stotland 1959; Krech & Crutchfield 1948; Ray et al. 1973) have summarized previous
hierarchical models and the tripartite attitudinal dimensions common to each: a) a
cognitive component (attention, awareness, comprehension, beliefs and opinions, and
learning); b) an affective component (evaluation, attitude, feeling, conviction, and
yielding); and c) a conative component (intention, behavior, and action). The cognitive
component is defined as consumer knowledge and beliefs.
Fishbein (1963) noted that the cognitive component refers to beliefs about the
nature of the object and its relation to other objects, while the action component refers to
beliefs about what should be done with respect to the object (p.259). Fishbein and Raven
demonstrated that valid and reliable measures of belief could be obtained by having the
subject judge the concept on a series of bipolar probabilistic scales (e.g., probable-
improbable, likely-unlikely, possible-impossible, etc.). It is this definition of belief— the
28
position of the object or concept on the probability dimension—that will be used
throughout this paper. Both the cognitive and action components of attitude can be
viewed as beliefs about the object. Belief refers to the component parts of the object and
the characteristics, qualities, or attributes of the object and the object’s relation with other
objects or concepts (p.258). As Fishbein and Ajzen (1972, 1975) pointed out, the term
“attitude” has generally been used to refer to beliefs, attitudes, intentions, and behavior.
Behavior is determined by intentions, intentions are determined by attitudes (toward
behavior) and subjective norms, and attitudes are determined by beliefs and their
evaluative aspects.
Buck (1988) defines cognition simply as knowledge: “a more or less complex and
organized internal representation of reality, acquired by means of the individual's
cognitive skills and through experience with reality” (p. 6). Knowledge by acquaintance
is always syncretic, or a holistic synthesis of information. In contrast, analytic cognition
consists of knowledge by description, which results from the interpretation of sensory
data and involves judgments about phenomena (Chaudhuri & Buck 1995, p.110).
Consumer beliefs can reflect subjective experiences as well as specific events or
situations (Wyer & Albarracín 2005). Eagly and Chaiken (1993) defined beliefs as the
associations or links that people establish between the attitude object and various
attributes (p.103). Therefore, the terms of consumer beliefs can be predicted by applying
the laws of objective probability (Wyer & Albarracín 2005).
The affective component is typically labeled as pleasure, arousal, and dominance,
while the conative, or behavioral component, is a predisposition toward action (Traindis,
1971), intentions, and behavioral expectations. The behavioral component is thought to
29
result from the attitudinal and affective components and is an action intending to harm or
benefit others, either verbally or physically.
2.11.2 Affection
The direction of the behavioral flow between cognition and emotion goes both
ways. Although emotion is always a response to meaning, it can also influence
subsequent thoughts and emotions. Cognition, which is causal, also continues into the
response state, an idea that is disturbing to those who follow the Aristotelian dictum that
a concept, A (e.g., an appraisal), cannot also be B (part of an emotion) (Lazarus 1991,
p.824). Affect is clearly one component of attitude and a force in persuasion. The
affective component influences feelings or emotions toward an object. Emotion is a
reaction to meaning, and if the meaning is changed there will also be a change in the
subsequent emotion (Lazarus 1991, p.830). Holbrook (1978) contrasts two different
types of meaning as “logical, objectively verifiable descriptions of tangible product
features” versus “emotional, subjective impressions of intangible aspects of the product”
(p.547). Both types of meaning are contained in virtually any communication; only their
relative balance varies. This balance may be assessed by content analysis as one basis for
predicting or explaining advertising effects (Holbrook 1977). Emotional appeals aimed at
establishing positive feelings of dominance appear to be closely aligned with the
intrinsically motivating nature of effectance or competence (White 1959). The attendant
feelings of mastery and self-fulfillment are viewed as autotelic, or desirable for their own
sake (Holbrook & O’Shaughnessy 1984, p.55).
Detenber, Simons, and Bennett (1998) adopt a three-dimensional view of emotion
(Lang 1995; Osgood, Suci, & Tannenbaum 1957; Russell & Mehrabian 1977) popularly
30
cited as arousal, hedonic valence, and dominance. Typically, emotion research
characterizes the valence dimension as a continuous range of affective response
extending from pleasant or positive valence at one pole, to unpleasant or negative valence
at the other. The autonomic arousal dimension is characterized by a continuous response
ranging from energized, excited, and alert to calm, drowsy, or peaceful. These two
dimensions, valence and arousal, account for most of the explained variance in emotional
responses as researched by Greenwald, Cook, and Lang (1989). Their study was designed
to explore the relationship between image motion and emotional responses to pictures.
Specifically, the study focused on whether or not image motion had a positive effect on
emotional arousal as indexed by self-reports.
According to Plutchik (1980), eight primary emotions can provide a better
understanding of many aspects of behavior. For example, primary emotions are relevant
to both biological survival behaviors and social adaptations, and equally influence
animals, humans, children, adults, sane, and disturbed individuals. These emotions are
found (in some form) at all evolutionary levels and have direct relationships to other
facets of an individual’s psychology, including personality, Freudian ego, defense
mechanisms, and clinical symptoms. According to Plutchik (1980), emotion is a
functional system that has survival value for the individual and for the species. Emotions
are at the center of life, guiding behavior in a way that has functional value.
Feelings are not treated as antecedent states as they have been in many of the
extant models of advertising effects (Gardner 1985). Edell and Burke’s (1989) study
asserted that “if feelings are activated by nonverbal elements of the ad, they are generated
by the ad itself and can occur very quickly. Most models of advertising effects have kept

31
the cognitive system of processing advertising separate from the affective system,”
(p.431).
Emotions can play a fundamental role in the purchase or consumption of an entire
product category if the product plays an emotional role in the consumer’s life. An
emotional tone can draw attention to a message, make it memorable, or illustrate the
benefit in action. Extensive and appropriate theme-advertising appears to imbue some
brands with a subjective vividness, or authenticity that objectively comparable
competitors lack. The brand name is consistently presented in conjunction with the
evocation of an emotion and, in time, comes to evoke the emotion itself (Zeitlin &
Westwood 1986, p.34)
2.11.3 AdSAM: A Pictorial Nonverbal Measure
AdSAM was used in this study in order to measure affective response. The
measure consists of a graphic character arrayed along three different PDA scales: a)
pleasure (measures the positive/negative aspect of the feeling), b) arousal (measures the
level of intensity or involvement in the feeling), and c) dominance (measures the degree
of empowerment the respondent feels).
Many traditional methodologies focused on measuring the rational component of
consumer response. In contrast, AdSAM® is usually used to measure emotional
responses to a variety of stimuli, including product concepts, advertising (concept and/or
finished ad), product attributes, product benefits, brands, logos, tag lines, packaging,
music, etc. (Morris 1995, p.63).
The Self-Assessment Manikin (SAM) (Lang 1984) and the attitudinal Self-
Assessment ADSAM® (Morris and Kim 2005) consist of a graphic character used to

32
represent the three dimensions of PAD. AdSAM® depicts each PAD dimension with a
graphic character arrayed along a continuous nine-point scale. The first row of figures is
the pleasure scale, ranging from pleasant to unpleasant. The second row is the arousal
scale ranging from controlled to controlling. SAM visually represents Mehrabian and
Russell’s three PAD dimensions and was designed as an alternative to cumbersome
verbal self-report measures (Lang 1980). AdSAM® is a version of SAM used in
marketing consumer studies (Morris 1995).
Initially, SAM was compared to PAD by using the catalog of situations employed
by Mehrabian and Russell (1974) to standardize the PAD dimensions. The results
indicated that SAM “generated a similar pattern of scale values for these situations as was
obtained for the semantic differential (pleasure +.937, Arousal +.938, and Dominance
+,.660)” (Lang 1980, p.123). SAM presents a promising solution to the problems
associated with measuring emotional responses to advertising (Morris & Waine 1993,
p.177).
An illustrative typology of emotional content is based on combining the
positive/negative bipolarity with the three dimensions found in Mehrabian and Russell’s
(1974, 1980) research on the PAD (pleasure, arousal, dominance) framework with
parallels in Osgood, Suci, and Tannenbaum’s (1975) studies on the semantic differential
(evaluation, activity, potency) (Holbrook & O’Shaughnessy 1984, p.53).
2.11.4 Conation: Intentions and Behavioral Expectations
Conation response is defined as behavioral intent, such as consumer actions. The
semantic differential is used to measure conation response. Cognition refers to the
process of coming to know and understand; the process of encoding, storing, processing,
33
and retrieving information. It is generally associated with the question of “what” (e.g.,
“what happened,” “what is going on now,” “what is the meaning of that information”).
Conation refers to the connection of knowledge and affect to behavior and is associated
with the issue of “why.” It is the personal, intentional, deliberate, goal-oriented, or
striving component of motivation; the proactive (as opposed to reactive or habitual)
aspect of behavior (Baumeister, Bratslavsky, Muraven, & Tice 1998). It is closely
associated with the concept of volition, defined as the use of will, or the freedom to make
choices about what to do (Kane, 1985; Mischel 1996). It is absolutely critical if an
individual is successfully engaged in self-direction and self-regulation.
Bagozzi (1992) proposes that conation is necessary to explain how knowledge
and emotion are translated into behavior in human beings. He suggests that one reason
why researchers in the areas of cognition and attitudes have not demonstrated a strong
ability to predict behavior is because the construct of conation has been omitted. At the
beginning of modern psychology, both emotion and conation were considered central to
its study; however, interest in these topics declined as overt behavior and cognition
received more attention (Amsel 1992; Ford 1987). While goals associated with these
latter paradigms are deeply enmeshed in our schools today (e.g., basic skills, critical
thinking), Barell (1995) proposes that helping students develop the conative attitudes and
skills associated with self-direction and personal efficacy is one of the most critical tasks
presently facing parents and educators.
2.12 Summary and Hypotheses
Two experiments were conducted in this study. The first experiment was to
assess the impact of animation in commercials through a series of classical conditioning
34
experiments. A 3 (types of commercials (clay, cartoon and live action formatted
commercials) x 2 (degree of involvement: high versus low) between-subjects factorial
design was employed on dependent variables in the first experiment. Experiment 1 tests
the hypotheses that animated commercials can better yield cognitive and affective results
as compared to live-action formatted commercial, and that animated advertisements
positively drive viewers to cognition, affection, and conation responses in low product
involvement.
In the second experiment, a 2 (conditioning experimental vs. control group) x 2
(high versus low involvement with the product) between subjects factorial design was
performed on two different conditions on linear combinations of all dependent variables
in the second experiment. The traditional classical conditioning paradigm suggests that
positive attitudes toward an advertised product (CS) might develop through its
association in a commercial with other stimuli that are reacted to positively (US).
Therefore, Experiment 2 anticipates that animation (US) in commercials can led to
attitudes toward the animated commercial, advertised brands, and increased purchase
behavior.
2.12.1 Experiment 1
Hoy, Young, and Mowen (1986) reported that subjects exposed to an animated
host-selling commercial had a greater positive attitude change toward the advertised
product than the subject who viewed a non-host-selling commercial. This result could be
attributed to the introduction of animated commercials, which may be closely associated
with viewer affection and product recognition. Rossiter and Percy (1980) and Gorn
(1982) emphasize that attractively designed ads affect consumer attitudes about
35
consequence through visual demonstrations and verbal testimonies. Neeley and
Schumann (2004) found that animated characters affect the subject’s attention to an ad’s
character and product recognition, and can instill positive attitudes toward the product.
However, they did find that the relation between animated spokespersons, intention, and
product choice is uncertain. Given the previous literature related to the use of animated
stimuli in advertisement, it can be said that animated stimuli can instill positive attitudes
toward the product. However, the studies comparing animated commercials to live-action
commercial were limited.
Mitchell (1979) defined involvement as an individual experience whose
motivational properties are evoked by a particular stimulus or situation. The degree of
involvement could affect to consumer attitude formation when they are exposited to any
kind of ad components in commercials. According to the ELM, people have high
motivation to process advertising messages with high personal relevance, and high
product category involvement. In high product involvement, people are more likely to
make a cognitive effort to evaluate the product.
Attitude formation or change results from a consumer’s careful attempts to
comprehend and evaluate the brand-relevant content of an ad. And then the consumers
are likely to integrate this new information with their prior knowledge into a coherent and
reasoned opinion about the brand (Mackenzie and Spreng 1992, p.519). That is,
consumers’ attitudes are based on a careful and effortful analysis of the true merits or
central issues contained within the message (Hoyer MacInnis 2001, p.133). When
consumers are highly involved with the product, they are trying to seek the more
information in order to evaluate the commercial. According to source credibility theory,
36
people are less likely to anticipate what will be said and hence are less likely to take steps
to avoid information inconsistent with their own frames of reference. Information
received from a real life source may also seem like story-telling, which somehow makes
it more real. This factor in turn may make the information more persuasive (Hoyer
MacInnis 2001, p.390). Given that people are more likely to make a cognitive effort to
evaluate the product in high product involvement situations, it can be logically posited
that perception of reality is also salient. Thus, live action commercial would be a more
effective and credible source when consumers form their attitude as compared to using
animation as the persuasion tool.
Clay animation is made by using three-dimension technique such as stop motion
capture whereas cartoon animation is produced by using the traditional two-dimension
technique (Frierson 1994; Furniss 1998). It can be assumed that clay animated
commercials has more evocable character and image than those of cartoon animated
commercials. Thus, subjects who are highly involved with the product may be more
likely to pay attention to clay animation in advertising because clay animation contains
motion and a more powerful visual image than cartoon animation based advertising. The
above findings led to the following hypotheses:
H1: All other things being equal, when subjects who are highly involved with a product
H1-1) are exposed to live action formatted commercial they will exhibit: a) higher
levels of pleasure; b) higher levels of arousal; c) more favorable attitudes toward
the ad; d) more favorable attitudes toward brand; and e) higher purchase intention
than those subjects exposed to clay and cartoon commercials.
H1-2) are exposed to clay animated commercial, subjects will exhibit; a) higher
levels of pleasure; and b) higher levels of arousal; c) more favorable ad attitudes;
37
d) more favorable brand attitudes; and e) higher purchase intention than those
exposed to cartoon commercial.
As reviewed in the previous literature, animated characters and motion in
commercials may influence viewer attention to the advertisement as well as change
consumer attitudes toward the advertised brand. Phillips and Lee (2005) suggest that
animation on the Web increases character-linking and perceived entertainment levels. In
light of the previous research on animation, Web advertising could provide information
on the development of effective advertising tools. Animated ads can increase positive
affection and consumer attitudes toward both ad and brand. Animated commercials are
also closely related to advertising recall and a high arousal levels. Many researchers
assert that animation can motivate consumers to action and increase brand recognition
and recall (Lee, Klippel, & Tappe 2003; Tversky, Morrison, & Betrancourt 2002).
Detenber, Simons, and Bennett’s study (1998) stressed that motion in advertisements
could affect human cognitive processing and is closely related to human emotion. Image
motion in advertising could be affected to some kinds of emotion such as arousal and
pleasure. Also image motion can be evoked consumer arousal. Other research reported
that motion in ads can increase the subject’s attention level (Reeves et al. 1985; Kipper
1986).
Zaichkowsky (1985) argued that involvement studies on consumer behavior
generally used the resulting behavior as indicators of involvement level. She also argued
that it is important to accurately measure the differences between personal associations
with ads, brand purchase intentions, and consumer decision making. MacInnis and Park
(1991) examined the impact of two dimensions of music—its fit within the advertised
38
message and its ties to past emotion-laden experiences (indexicality)—on low- and high-
involvement in consumer ad processing. They found that personal, relevant involvement
could be influenced by the advertisement’s executional cues such as music, source
characteristics, and message sidedness. Such executional cues create, affect, or stimulate
inferences that generate the basis for low-involvement consumer brand attitudes, whereas
high-involvement consumers are thought to ignore such peripheral cues in forming brand
attitudes, focusing instead on the advertised message and their reaction to it (MacInnis &
Park 1991; Petty, Cacioppo, & Schumann 1983). Regarding the literature-related
involvement, the degree of involvement could affect to subjects’ perception of animated
commercials.
According to the ELM, people modestly involved with the product have low
motivation to process advertising component due to low personal relevance and low need
for cognition (Cho 1999). Also, affective stimuli (e.g., background music, pleasant visual
scenes, characters, and images) in an advertisement follow a peripheral processing route,
as these elements require less cognitive effort on the viewer’s part. The advanced
technology and development of human resource allow clay animation to have more
evocable character and image than those of cartoon animation. Clay animation in
advertising is associated with the influence of lower-level peripheral processing routes on
viewer persuasion because animated stimuli heavily rely on viewer aesthetic factors.
Thus, the following hypotheses are logical extension of these findings:
H2: All other things being equal, when subjects who are low involved with a product
H2-1) are exposed to clay animated commercial, the subjects will exhibit; a)
higher levels of pleasure; b) higher levels of arousal; c) favorable animated
39
commercial attitudes; d) favorable brand attitudes; and e) higher purchase
intentions than those exposed to live action formatted commercial.
H2-2) are exposed to clay animated commercial, the subjects will exhibit a)
higher levels of pleasure, b) higher levels of arousal, c) more favorable animated
attitudes, d) more favorable brand attitudes, and e) higher purchase intentions than
those exposed to cartoon commercial.
Zinkhan and Muderrisoglu (1985) noted that the higher a person’s involvement in
and familiarity with a product and the higher their ability to cognitively differentiate
between the product’s features, the higher the recall of the contents/characteristics in the
product’s advertisement (p. 356). If activation of this internal state is high (possibly
caused by a greater degree of attention to a particular stimulus), then subsequent memory
performance and recall should also be high (Zinkhan & Muderrisoglu 1985, p.356).
Therefore, high involvement conditions due to comprehension and elaboration should
also lead to a better recall of message characteristics (Zinkhan & Muderrisoglu 1985,
p.356).
Thorson and Page (1988) found that commercials for brands with high product
involvement generated significantly higher scores for the dependent measures of brand
name recall, brand attitudes, attitudes toward the ad, attitudes toward purchasing, and
purchase intentions (McGrath & Mahood 2004, p.43). Individuals who are highly
involved with a stimulus have a greater tendency to pay attention to the stimulus (Celsi &
Olson 1988), so the higher levels of attention to the stimuli in this experiment may result
in ad recall. In addition, Gorn’s (1982) study suggests that individuals who are highly
involved with objects are less likely to respond to music as affective stimuli than to the
information provided regarding the product.
40
Therefore, it can be postulated that the higher the individual’s attention to
animated stimuli, the higher the ad recall of the contents and components in the
commercials. Clay animation ads are produced by incorporating visualization and
appropriate motion in commercials. Using image motion in commercials could increase
viewer attention to commercials due to the fact that clay animations are produced by
using a style of image motion and movement based reality.
Given the literature related to animation stimuli with aesthetic factors, people who
are exposed to clay animated commercial are more likely to experience a higher ad recall
than to live action and cartoon commercials. This theoretical linkage postulates the
following hypothesis:
H3: All other things being equal, regardless of product involvement, when
subjects are exposed to clay animated commercial, the subjects will exhibit
increased ad recall than those exposed to cartoon based and live action formatted
commercials.
In the hypothesis 4 it is assumed that the role of product involvement could act as
moderator of the effects of types of commercials on consumer responses. As reported in
literature related to the role of involvement on consume behavior, the degree of
involvement with the product is highly correlated with dependent variables such attitude
toward the ad, brand and purchase behavior. Therefore, the following hypothesis is
posited:
H4: There is a two-way interaction between three different types of commercials
and degree of involvement will exist on; a) pleasure; b) arousal; c) attitude toward
the animated commercial; d) attitude toward the brand; and e) purchase intention
respectively.
41
2.12.2 The Hierarchy of Communication Effects in Advertising Many consumer behavior models were developed following the introduction of
Lavidge and Steiner’s (1961) Hierarchy of Effects model. This model posited a
sequential hierarchy of events in which consumer purchase behaviors occurred, including
awareness, knowledge, liking, preference, and conviction (Vaughn 1979, p.28). In
addition, Lavidge and Steiner (1961) asserted that cognition includes awareness and
knowledge, affect includes liking and preferences, and conation includes conviction and
purchase. Holbrook and Batra (1987) pointed out that cognition has generally been
viewed as a system of beliefs structured into some kind of semantic network, that
behavior has typically been regarded as synonymous with buying responses, and that
affect has been treated as a unidimensional bipolar continuum (p.405).
As summarized in his historical tripartite classification, Krugman’s model (i.e.,
cognition-affection-conation) could be used in low-involvement situations (1965). Zajonc
and Markus model (e.g., affect-conation-cognition sequence, 1982) suggested that
preferences do not require a cognitive basis, but instead are mainly based on affect. Ray
et al.’s sequence (i.e., conation-affect-cognition, 1973) explained that consumer purchase
behaviors are followed by attitude formation to reinforce consumer choices, and finally
selective learning to further support purchase decisions (Yoo et al. 2004).
Vaughn (1979) explained the tripartite classification (Feeling-Learn-Do) by
dividing economic, responsive, psychological, and social elements into the FCB model.
Vaughn focused on four consumer types: a) the rational consumer who follows the
economic model by consciously considering functional cost-utility information in
purchase decisions; b) the habitual consumer who follows the responsive model by
42
thoughtlessly buying through rote, stimulus-response learning; c) the unpredictable
consumer who follows the psychological model by compulsive buying under the
influence of unconscious and indirect emotions; and d) the compliant consumer who
follows the social model by continually adjusting purchases to satisfy cultural and group
needs for the sake of conformity (p.28).
Thus, the tripartite attitudinal dimensions can be applied to three different types of
commercials. Furthermore, this model would provide a better understanding of consumer
purchase behaviors when consumers are exposed to three different types of commercial
stimuli. Therefore, this study will first seek an answer to the following research question:
RQ1) Will different values for the Tripartite Attitudinal Dimensions model be
found in the three different types of commercials?
In the second experiment, animation as stimuli could be extended to examining
the classical conditioning mechanism because animation is considered as affective stimuli
in that it can generate a positive affective attitude in the consumer.
2.12.3 Experiment 2
The impact of product information in commercials on beliefs and attitudes would
typically be interpreted within an information processing framework. It is suggested here
that a classical conditioning framework could account for the potential impact of
background features, such as animation, on product attitudes.
Shapiro and MacInnis (1992) identify that classical conditioning involves
exposing subjects to a positive or negative stimulus paired with a US such as music
(Gorn 1992), a drama series (Allen & Madden 1985), or visual imagery (Rossiter &
Percy 1980; Stuart et al. 1987), along with a neutral paired with a stimulus (e.g., the ad or
brand). Classical conditioning asserts that a stimulus paired with a positive or negative
43
conditioned stimulus (CS) such as the ad and brand could generate positive or negative
affective responses toward the CS.
Gorn (1982) suggests that the simplest association between CS (e.g., product) and
US (e.g., music) will affect product preferences as measured by product choices. He also
suggests that the background features of commercials positively affect consumer product
choices. Applying the previous literature and stimulus to present studies on the animation
advertising genre is important to our understanding of advertising’s effect on consumers.
Animation as stimuli could be extended to examining the classical conditioning
mechanism because animation is like other design tools, such as music and visual
imagery, in that it can generate a positive affective attitude in the consumer. Furthermore,
the created positive affection could be associated with the advertised product through
classical conditioning. Brewer (1974) posited that classical conditioning is the repeated
pairing of a CS with a US, causing the CS to elicit a CR in an unconscious automatic
fashion. Gorn (1982) suggested that the communication effect may be due to some extent
to the association of the attitude object with positive emotions attached to the
communicator. This study focuses on animated commercials as stimuli in classical
conditioning mechanisms by establishing its place in the ongoing debate over the
affective and cognitive processes.
Hoyer and MacInnis (2001) observed that motivation is influenced by the extent
to which the ad, brand, product category, or other characteristic is personally relevant to
consumers. Thus, a key factor affecting motivation is the extent to which something is
personally relevant, or has direct implications and significance in one’s life (p.60).
Involvement with an advertised message has a considerable impact on how brand
44
attitudes are formed or changed (Laczniak, Muehling, & Grossbart 1989, p.28). Personal
relevance involvement is a mechanism used to explain and predict consumer’s behavior
because involvement plays an important role in advertising processing. Thus, the
literature reported above led to the following hypotheses:
H5: When all subjects are exposed to a classical conditioning procedure in which
a target brand (CS) is systematically paired with an animated stimulus (US);
subjects with high product involvement will exhibit; a) higher levels of pleasure
and b) arousal; c) more favorable attitudes toward the ad and d) target brand, and
e) higher purchase intention in conditioning experimental group than in the
control group. In addition, subjects with low product involvement will exhibit; f)
higher levels of pleasure and g) arousal; h) more favorable attitudes toward the ad
and i) target brand, and j) higher purchase intention in conditioning experimental
group compared to the control group.
Kim et al. (1998) argued that the selected US provoked positive affects while
communication resulted in no product beliefs. Since a conditioning effect can be directly
transferred in the absence of product beliefs, the subsequent selection of the US allows
one to infer that the resultant conditioning effect is due exclusively to direct affect
transfer.
Gorn, Goldberg, and Basu (1993) found that under high-source awareness there
was no difference in speaker evaluations between subjects in a good mood and those in a
bad mood. A study on subjects in good or bad moods suggested that it was only the
former who were able to correct for the bias in their evaluations when made more aware
of the source of their mood. Gorn, Jacobs, and Mana (1987) emphasize that the role of
awareness in conditioning is the critical issue in classical conditioning mechanisms.
Given psychological and consumer behavior literature, Pavlovian conditioning can affect
45
the behavior of adult humans without their awareness of any experimental hypothesis,
without their awareness of the relationship between the conditional and the unconditioned
stimuli, and without their cooperation (Gorn, Jacobs, & Mana1987, p.415).
Contingency awareness exists when experimental subjects knows that the CS and
US have been related temporally in an experiment’s sequencing (Shimp 1991, p.160).
Allen and Janiszewski’s (1989) study reported that subjects were identified as exhibiting
contingency awareness when they knew that certain Norwegian words (US) were more
likely than others to be followed by positive feedback (US). Shimp (1991) argued that
contingency awareness may be necessary for a conditioned effect to materialize (p.160).
Another study argued that high levels of contingency awareness play a role in attitude
formation and classical conditioning (Stuart et al. 1987). Therefore, the role of awareness
in classical conditioning is examined here by using animation as the stimuli-as explained
in the following hypotheses.
H6: Subjects with high product involvement will exhibit an increased likelihood
of recognizing the contingency than subjects in a control group. This mean that
those who are exposed to a classical conditioning procedure in which a target
brand (CS) is systematically paired with an affective animation stimulus (US)
have a greater perception of contingency awareness than subjects in a control
group.
H6-1: Contingency awareness will mediate the relationship between classical
conditioning procedures and attitudes toward the ad, target brand (CS), and
purchase intention.
H7: In the animation stimulus, subjects exposed to the target brand (CS) paired
with the animation stimulus (US), and who are aware of the contingency
relationship between the target brand (CS) and animation stimulus (US) will
develop more favorable attitudes toward the target brand than subjects who are
unaware of the contingency relationship.
46
2.12.4 The Hierarchy of Communication Effects in Advertising After introduction of the Lavidge and Steiner’s (1961) Hierarchy of effects model,
many consumer behavior models have been developed until now. The model assumed
that consumer purchase behavior of a product occurred via a sequential hierarchy of
events from awareness through knowledge, liking, preference, and conviction (Vaughn
1979, p.28). In addition, Lavidge and Steiner (1961) mentioned that cognition includes
awareness and knowledge, affect includes liking and preferences and conation includes
conviction and purchase. This model suggested that advertising researchers have
developed different hierarchical models for various consumer decision making situations,
but agree hierarchy of effects model (Yoo et al. 2004). Holbrook and Batra (1987)
pointed that cognition has generally been viewed as a system of beliefs structured into
some kind of semantic network as well as behavior has usually been regarded as
synonymous with buying responses. Finally, affect has typically been treated as a
unidimentional bipolar continuum (p.405).
Ajzen and Fishbein (1980) the three –component view of attitude classified as
cognitive (e.g., perceptual responses and verbal statement of belief), affective (e.g.,
sympathetic nervous responses and verbal statements of affect), and behavioral or
conative (e.g., overt actions and verbal statements concerning behavior) (p.20).
Ray et al (1973) summarize previous hierarchical models by suggesting that three
components are common to each: a cognitive component (attention, awareness,
comprehension, and learning), an affective component (evaluation, attitude, feeling,
conviction, and yeilding) and a conative component (intention, behavior, action).
47
Baker and Churchill (1977) have categorized attitudes toward advertising into
three parts: a) the cognitive component, which consists of the knowledge or belief an
individual has toward the object; b) the affective component, which consists of the
feeling an individual has toward the object; and c) the conative component, which
includes the action or the inclination of a possible action the individual has toward the
object.
Generally, the cognitive component in the hierarchy of communication effects
includes knowledge about individual features or attributes and their respective weights
(or value) in addition to a brand name as well as the presence of an imagery-based
prototype or an exemplar along with brand name knowledge. Affect has typically been
assumed to be stable and strong enough to influence the behavioral intention which
carries a commitment on the part of the attitude holder (Park & Mittal 1985, p.220).
Affect, which is generated from aspects of the reference object such as an attractive
model, a jingle in the commercial, or a product package, would then be attached to the
brand name through a classical conditioning approach (Park & Mittal 1985, p.221).
Hilgard (1980) mentioned that the persistence with which cognition, affection,
and conation were recognized as major classifications of mental events suggests that
there may be a natural utility to the classificatory scheme (p.115-116). He also noted that
hot cognition refers to thoughts and decisions that have high affective or conative
importance to the person (p.115). There are three absolutely irreducible faculties of the
mind, namely knowledge, feeling, and desire (cited in Hilgard 1980, p. 109).
Vaughn (1979) was trying to explain the tripartite classification (Feeling-Learn-
Do) in dividing economic, responsive, psychological and social in FCB model. His point
48
of view was focused on four consumer types, first, a rational consumer who consciously
considers functional cost-utility information in a purchase decision in economic model. A
habitual consumer conditioned to thoughtlessly buy through rote stimulus-response
learning could be defined in responsive model. An unpredictable consumer who buys
compulsively under the influence of unconscious through and indirect emotions could be
defined in psychological model. A compliant consumer who continually adjusts
purchases to satisfy cultural and group needs for conformity could be defined in social
model (p.28).
The several alternatives to the original Lavidge and Steiner model (1961) suggest
that advertising researchers have developed different hierarchical models for various
consumer decision making situations, but agree on the importance of the three basic
tenets of the hierarchy of effects model. However, many alternative models attempt to
explain consumer purchase behavior and many researchers have tried to develop the
tripartite attitudinal dimensions (i.e., cognition, affection, and conation). Therefore, this
study will seek an answer to the following research question:
RQ2: The tripartite attitudinal model can be explained in a classical conditioning
experiment when using animated commercial stimuli. Thus, the tripartite
attitudinal dimensions can be applied in classical conditioning research, and the
model would provide a better understanding of consumer cognitive, affective and
purchase behavior when consumers are exposed to animated commercial stimuli.
Will different values of the tripartite attitudinal model exist between experiments
and control groups and two different product involvement groups?

49
CHAPTER 3 METHODOLOGY
3.1 Overview of Experimental Design
Two experiments were conducted to examine the effects of animation in
advertising design on linear combination of all dependent variables, as well as the role of
animation on emotional response. The first experiment investigated the relationship
between exposure to animated commercials and responses to subsequent ads (e.g.,
emotional responses, attitudes toward the ads, brand, purchase intention, and ad recall).
An experimental design was used to determine if there was a significant difference in
cognition, affection, and conation. The experiment measured five sub-categories for two
different animated commercials and live action commercial: a) emotional responses, b)
attitudes toward the commercial, c) attitudes toward the brand, d) purchase intention, and
e) advertising recall. The second experiment assessed the impact on consumer attitude
formation in advertising using a classical conditioning mechanism. The classical
conditioning has long been employed in the study of consumer behavior and as a means
of interpreting the effects of advertising, such as attitude changes. Classical conditioning
is a prime method of persuasion, and the study will demonstrate its effectiveness when
using animated stimuli.
3.1.1 Experiment 1
To examine the effects of animated and non-animated commercials on dependent
variables, this experiment used a between-subjects factorial design: a 3 (cartoon-based
animation, clay animation, and live action commercial) x 2 (product involvement: high
50
versus low). A MANOVA was used to examine differences between the animated and
non-animated commercials on linear combinations of all dependent variables, and a
between subject designed ANOVA was performed on each dependent variable.
3.1.2 Pilot Study
A pilot study was conducted for this experiment to check the validity of animated
commercials. Commercials were classified into animated and non-animated types by
three advertising professionals and scholars in the advertising field. Specifically, the
animated commercials were categorized as either cartoon-based or clay animation. The
purpose of a pilot study was to classify cartoon, clay animation and live action formatted
commercials. Based the definition of product of clay animation and cartoon, they selected
each commercial from among several. All animated characters were made by using clay
animation in commercials. Also the same criteria were applied to the selection of cartoon
based commercials. Live action formatted commercial was selected from among them
produced without mixing with any cartoon and other animated types. In order to
maximize animation commercial exposure, the original language was translated to
English and then superimposed on each commercial. The commercials being used in this
study were taken from those of several countries (e.g., America, England, Germany,
Japan, and Korea) for which control of extraneous variables regarding brand
predisposition and of pre-exposure of the U.S. respondents was possible. Thus, several
different animated commercials were selected for pretest.
3.1.3 Pretesting the Animated Stimuli and Materials
A pretest was conducted to ensure that the directions and questions were clear and
unambiguous, and to prepare for unexpected situations (e.g., video quality and space), as
51
well as to check the reliability dimension of independent and dependent variables
selected for this study. This pretest was administered to about 30 undergraduate students.
The pretest’s objective was to ensure the subject’s perception of different animated
characters as affective stimuli in commercials. Affect items were adapted from Gorn
(1982) and Allen &Madden (1985). The pretest for edited several animations was
conducted by using a four-item affect scale and seven-point semantic differential scale
(e.g., pleasant vs. unpleasant, like very much vs. dislike very much, left me with a good
feeling vs. left me with a bad feeling, and interesting vs. boring).
The results of pretest led to the selection of animated stimuli for the actual
experiment. Playing scenes of human and animal mixed characters made by clay had a
mean of 5.1. Playing scenes of fruit character by clay had a mean of 5.0. Playing scenes
of animal character made by cartoon had a mean of 4.5. Playing scenes of human
character made by cartoon also had a mean of 4.8. Playing scenes of personified human
character had a mean of 4.8.
After the pretest, a list of unfamiliar words used in the questionnaire was
compiled in order to make the directions of the experiment clear. The pretest also ensured
that video and sound quality were reasonable. The TV commercials were fixed at 15
seconds for each sample, since exposure time could be an important issue due to the fact
that advertisements contain various components to alert subjects mentally and psychically.
Thus, the pretest involved fixing the time schedule in the experiment to avoid subject bias.
To examine the effects of animated commercials on affective responses, three
different versions of a television commercial for an existing electronic product and soft
drink were edited by a professional designer. Several television commercials were
52
specially selected for use as stimulus materials in the experiment. In order to maximize
the animation commercial exposure, the original language was translated into English if
necessary and then superimposed on each commercial. The commercials being used in
this study were taken from those of five countries for which control extraneous variables
regarding brand predisposition and of pre-exposure of the U.S. respondents was possible.
Each commercial contains the brand name, company logo and animated characters
playing scenes. Five15-second commercials and three additional 15-20 second
commercials were selected. To avoid specific subject bias and increase the
generalizability of the study, each commercial was edited to 15 seconds using a media
editor.
Commercials were divided into two major categories: animated (subdivided into
cartoon-based and clay animation commercials) and non-animated (e.g., live action
formatted commercials). Snap shots of animated stimuli are in appendix C.
3.1.4 Subjects
Subjects were undergraduate students enrolled in introductory advertising and
public relations courses. All subjects signed an informed consent form prior to their
participation in the experiment. Six hundred twenty undergraduate students at a large
southern university participated in this study. As an accessible and large population,
students were considered appropriate subjects for this study’s goals, which examined the
causal relationship between exposure to animated commercials and ad attitudes.
3.1.5 Procedure

53
Upon arrival at the scheduled time, subjects were given a packet entitled
“Advertising research.” After each subject received a packet, an investigator asked them
to write down their name and 8-digit student identification numbers on the first page of
the questionnaire. Before the real experiment, investigators explained the procedure and
all subjects read the goal of the experiment. Subjects were instructed when to begin,
when to stop, and when to turn the page. The subjects were told that the experiment
involved working with an advertising agency to conduct a survey on foreign commercials,
because the advertising company was considering creating English versions of
commercials to launch products in the U.S. Subjects were also told that the advertising
agency values student opinions and their responses could help to promote or stop the
conversion of the foreign commercials into English versions. The subjects were then
divided into three groups to measure the different commercial formats. That is,
participants assigned to each group were exposed to three different commercials
(between factors) separately. The commercials were presented with an overhead projector
and each commercial lasted 15 seconds.
After explaining the directions for the experiment, the investigator showed each
subject group three different animated television commercials (e.g., clay animated
commercial for first group, cartoon for second group and live action for third group).
After watching each commercial, subjects were asked to fill out the second page of the
questionnaire, which included emotional response scales. Subjects were given a limited
amount of time after viewing each commercial to mark their belief of brand, attribution
of commercials and brand, and purchase intent on a self-reporting questionnaire. Ad
54
recall was measured on the last page. After completing this stage, subjects filled out the
rest of the questionnaire.
3.1.6 Product Involvement Manipulation for Experiment 1
After filling consent form on the first page, subjects were asked to read the
following statement carefully and assume that it was their current situation:
To successfully launch a new product named Juice the company will conduct a promotion at a grocery store. This company is trying to penetrate the juice market. When buying this product, you would receive a book of coupons good for a year from a grocery store. Subjects were asked how much relevance the product has to them before the
actual experiment. If they chose the number below zero (-2 , -1 and 0), then go to the
second page. The second page described the blank page. However, if they chose the
number over zero (1 and 2), then go to the third page. Investigator asked them to read the
following statement:
For participants highly involved with this product. Please pay careful attention to the video presentation. After watching the commercials related to the Juice, please carefully answer each question. Investigators will choose someone who makes the best response to the questions after collecting data. Then the investigators will pick the name from the group pool to win a prize.
For participants highly involved with the Juice brand, investigators encouraged
them to pay careful attention to the video presentation. After watching the commercials
related to Juice, subjects were asked to carefully answer each question. They were also
told that after collecting data the investigators would chose the subject with the best
response to win a prize.
55
3.1.7 Variables and Measures
The measurement tools used in this study are based on the literature review
related to the tripartite attitudinal dimensions (e.g., cognition, affection, and conation).
The research also used previously-developed scales, modified when necessary, to
measure the variables in the study. Specific scale items can be found in Appendix B.
To measure cognition response (e.g., belief), a seven-point Likert type scale
developed by marketing researchers was used. Measurement tools used in the copy-
testing firm and consumer research area were employed to gauge belief (Breckler 1984;
Katz & Stotland 1959; Krech & Crutchfield 1948; Ray et al. 1973).
Affective responses: Pleasure, arousal, and dominance: To measure emotional
response, AdSAM® was used in this study. The measure consists of three different
scales: a) pleasure (measures the positive/negative aspect of the feeling), b) arousal
(measures the level of intensity or involvement in the feeling), and c) dominance
(measures the degree of empowerment the respondent feels). AdSAM® (Morris 1995) is
a graphic character that represents the three dimensions of PAD. Initially, SAM was
compared to verbal PAD by using the catalog of situations employed by Mehrabian and
Russell (1974) to standardize the three PAD dimensions. The results indicated that SAM
“generated a similar pattern of scale values for these situations as was obtained for the
semantic differential” (Lang 1980). AdSAM® is in appendix B.
Attitudes toward advertising (Aa): The research used previously developed
scales, modified when necessary, to measure the variables in the study. These semantic
differential scales measured attitude toward the ads and were selected from various prior
research studies (Biehal, Stephens, & Curlo 1992). The questions asked subjects to

56
evaluate ads (using a semantic differential scale), along with five measures identified by
the labels “unfavorable/favorable,” “bad/good,” “dislike/like,” and “negative/positive.”
Attitude toward the brand (Ab): Attitudes toward the brand were assessed
utilizing a four-item, seven-point semantic differential scale (bad/good,
unfavorable/favorable, negative/positive, and dislike/like). This attitude to the brand
measure was used in prior research by MacInnis and Park (1991). The author reported
that 87.5% of brand attitudes can be accounted for using the scale in factor. Excellent
reliability of the scale was also obtained (Cronbach alpha=.95). The brand attitude scale
was computed by averaging the summated items.
Conation responses as purchase intent (PI): Purchase intent was measured
using Haley and Case’s (1979) Verbal Purchase Intent Scale. The scale is a single-item
Likert-type scale. Validity for this scale was established by Gormly (1974) as well as
Gruber (1970). Also, Haley and Case (1979) report the verbal purchase intent scale had a
high factor loading on the product evaluation factor with a coefficient alpha of 0.88. The
scale’s significant reliability (test-retest) was also reported by Kassarjian and Nakanishi
(1967) and Hughes (1967).
Ad recall: Ad recall was measured by asking subjects to recall the names and
brands that they could remember from the commercials with descriptions. For ad recall,
subjects were instructed to write down everything they could remember about the ads
themselves, such as ad description, the displayed product name, characters, storyline, and
theme, as well as any feelings toward the ad. Ad recall scores can be calculated by
counting the number of ad components correctly recalled (Edell & Keller 1989; Jin 2003).
57
Ad recall measure was very similar to Brand recall measurement. Brand recall
was measured by the number of times the brand was mentioned in the subject’s responses
to the open-ended questions. Ad content playback was measured by counting the number
of words used to answer the second open-ended questions (Stout & Leckenby 1988, p.55).
Walker and Dubitsky (1994) found that liking relates to other copy-testing measures such
as related recall, brand preference, and persuasion. One possible explanation for how
liking works has to do with the rational, cognitive processing of advertising messages. A
well-liked advertisement can affect information processing by creating positive arousal
and activation (Kroebel-riel 1979), improving the recall of the advertised material, and
producing more positive judgments toward the message (Aaker & Myers 1987; Youn et
al. 2001, p.7). Favorable feelings influence memory by maintaining positive feelings at
the time of stimulus encoding, influencing how the information was organized in memory,
and highlighting specific features that are retrievable later (Zajonc 1980; Lingle &
Ostrom 1981; Zinkhan, Locander, & Leigh 1986; Youn et al. 2001, p.7).
3.1.8 Involvement Manipulation Check
The manipulation check measure consisted of six items adapted from
Zaichkowsky (1985) to determine the extent to which the participants paid attention to a
product offered via slide presentation and the stimuli. Subjects were asked how much
relevance the product had to them before the actual experiment. And investigator told
subjects to checkmark to the number what thoughts and feelings went through their mind
about the product after watching the commercial. The items used in this study consisted
of “useless/useful,” “uninterested/interested,” “worthless/valuable,” “unwanted/wanted,”
and “irrelevant/relevant.” Excellent reliability of the scale was obtained (Cronbach alpha

58
= .90). A t-test indicated that the intended manipulation was successful. The high product
involvement participants reported a mean of 5.6 compared to a mean of 3.3 for the low
product involvement participants. This difference was found to be significant (t = 26.5, p
< .001).
3.2 Classical Conditioning Experiment 2
For Experiment 2, classical conditioning was carried out with electronics (e.g.,
MP3 player) and beverage (e.g., orange juice) products. The primary procedure replicated
the classical conditioning procedure suggested by Gorn (1982), Allen and Madden (1985)
and Rossiter and Percy (1980).
In the belief-based approach following an earlier classical conditioning procedure,
the favorable emotional consequence of the belief serves as an unconditioned stimulus
(US) which is paired with the product, a conditioned stimulus (CS). As conditioning
proceeds, the product alone becomes increasingly capable of eliciting a favorable
emotional reaction and a favorable product attitude. Stimuli (e.g., visual imagery) with
favorable emotional consequences can be paired with a product allowing for an increase
in the consumer’s overall evaluation of the product and brand attitude. Given that visual
content is closely related to the evaluation of a product, animated commercials as stimuli
would be an effective marketing or persuasion tool as the affect-producing,
unconditioned stimulus.
3.2.1 Selection of Conditioned Stimulus
Based on classification of product suggested by Ratchford (1987) and Vaughn
(1980, 86), the products required thinking and economical consideration were included
notebooks, digital cameras, MP3 players, televisions, mobile phones, DVD players, and
59
refrigerators. The products required feeling and affective consideration were included
consumption products such as toilet papers, confectionaries, soft drinks, and cosmetics.
3.2.2 Pretesting for the Unconditioned Stimulus
The pretest adopted previous classical conditioning experimental procedure
(Allen and Madden 1985; Gorn 1982), therefore, it was necessary to find material that
would elicit both pleasant and unpleasant feelings. Thirty undergraduate students
participated in a pretest in which they rated 13 slides from animated commercials
(potential USs) on a four item affect scale (pleasant vs. unpleasant, like very much vs.
dislike very much, left me with a good feeling vs. left me with a bad feeling, and
interesting vs. boring). In addition, four fictitious brands (e.g., foreign products) of
packaged goods were pretested as possible CSs. Participants were asked to indicate their
perceptions of how similar the brands were to other brands in the same category and to
rate each brand on a three-item scale (good/ bad, like/dislike, and pleasant/unpleasant).
Pairs of terms or phrases anchored either end of a seven-point scale. Of note were the
scores on the item “left me with a good feeling/bad feeling”. Producing good feelings
and/or bad feelings is, of course, a necessary part of an effective conditioning experiment.
3.2.3 Filler Material
To detract participants’ attention from the focal CS-US pairing, filler animations
were employed as is essential when conducting classical conditioning experiments. An
alternative explanation for the results obtained in a classical conditioning study is demand
artifact (Kellaris & Cox 1989). Using filler animation stimuli decreases hypothesis
guessing and reduces the possibility of demand artifact interpretation of the results (Kim
et al. 1996; Stuart et al. 1987). The filler material used for the study consisted of three
60
fictitious and three real brands (a television, a mobile phone, a notebook, cosmetics, a
soft drink, and a sports drink), and various USs that generated no affect and conveyed no
systematic meaning. This study also chose two target products: an MP3 player as the
high-involvement product and orange juice as the low-involvement product.
3.2.4 Procedure
The second experiment examined the role of animated stimuli on consumer-
attitude formation by using a classical conditioning mechanism. The experiment
procedure and questionnaire were developed based on the respondent feedback regarding
treatment stimuli and the clarity of the questions. The experiment was conducted in
groups of approximately 331 subjects that met after regular class time. Subjects were
divided into equal groups by randomly assigning a classroom to either the experimental
group or the control group. Upon arrival at the scheduled time, subjects were given a
packet entitled “TV Commercials Study.” After all the subjects received the packet, the
investigator asked them to write down their name and their student identification numbers
on the first page of the questionnaire. They entered a room that had been set up for a slide
presentation where they received a booklet with instructions and questions. Investigators
explained the instructions and the participants were instructed on when to begin, when to
stop, and when to turn the page. Once they read the instructions, the investigator turned
off the lights and showed the slides. After the presentation, the subjects were instructed to
read each question carefully and then respond to the questions in the booklet.
Though the number of CS/US contingency pairings is a variable of interest in
conditioning work (Stuart, Shimp, & Engle 1987), our intent was not to vary repetition.
This study was chosen to pair (in the treatment condition) the CS and US three times.
61
Priluck and Till (1998) used six pairings in their experiment because they felt more
pairings would generate a more valuable initial conditioning effect than the use of one or
three pairings would, but with more pairings comes the risk of subject boredom. Three
pairings were ideal due to the nature of animation, which is both motion and story. Three
pairings also allowed for an even distribution of the three affectively positive animations
within the sequence of motions. The treatment subjects were exposed to three pairings of
pleasant scenes with target products and 3 sets of filler brands with 3 neutral scenes each.
Filler brands were included to disguise the nature of the study and prevent hypothesis
guessing.
In the control condition, participants were exposed to the same stimuli as the
conditioning group. However, the selection of stimuli presentation was randomized, and
there was no systematic pairing of CS and US. Rescorla (1967) emphasized that a
random group was needed to test for the effects of conditioning. By comparing different
groups, the results can be inferred that the animation effects were due to conditioning.
3.2.5 Experimental Manipulation for Experiment 2
In the classical conditioning experiment, the product involvement manipulation is
similar to the first experiment. After filling consent form on the first page, subjects were
asked to read the following statement carefully and assume that it was their current
situation:
To successfully launch a new product named Juice the company will conduct a promotion at a grocery store. This company is trying to penetrate the juice market. When buying this product, you would receive a book of coupons good for a year from a grocery store.
62
Subjects were asked how much relevance the product has to them before the
actual experiment. If they chose the number below zero (-2, -1 and 0), then go to the
second page. The second page described the blank page. However, if they chose the
number over zero (1 and 2), then go to the third page. Investigator asked them to read the
following statement:
For participants highly involved with this product. Please pay careful attention to the video presentation. After watching the commercials related to the Juice, please carefully answer each question. Investigators will choose someone who makes the best response to the questions after collecting data. Then the investigators will pick the name from the group pool to win a prize.
For participants highly involved with the Juice brand, investigators encouraged
them to pay careful attention to the video presentation. After watching the commercials
related to Juice, subjects were asked to carefully answer each question. They were also
told that after collecting data the investigators would chose the subject with the best
response to win a prize.
Participants were exposed to a positive conditioning procedure in which the test
brand was paired with favorable stimuli on the second repetition. Proper classical
conditioning control procedures required that both the conditioning treatment and
conditioning control groups be exposed the same number of times to both the US and CS,
with only the conditioning treatment exposed to the CS/US contingency pairing.
Participants in both the conditioning treatment and conditioning control groups were
exposed to a video presentation in which the stimuli appeared interspersed among filler
video clips.
63
The control group saw randomized video clips and the order of the video clips
was used as a randomized selection of stimuli presentation. It was important that there
was no systematic pairing of CS and US in this group.
3.2.6 Measure
3.2.6.1 Contingency Awareness
The contingency awareness measurement tools used previously developed scales,
modified when necessary, to measure the variables in the study. The contingency
awareness measure was used in prior research by Riluck and Till (2004) and Allen and
Madden (1985). Its purpose was to determine whether participants became demand aware
in the experiment. To determine contingency awareness, participants were asked to
indicate which product (the TV, digital camera, computer, MP3 player, orange juice and
milk) and which brand (SENS and Gator orange juice) was always shown before or with
the animation with motion of the pleasant scenery and the video clip. Participants were
then asked how certain they were of each of their responses and ranked their certainty on
a 5-point scale ranging from absolutely certain to absolutely uncertain. Contingency
aware participants were those who chose the correct product and brand and who were
absolutely or somewhat certain of their responses. This operational definition matched
the construct definition for awareness, which is the knowledge that the CS precedes the
US.
The measures used to assess inferential belief formation were included as a
means to investigate whether the participants formed beliefs about the CS (SENS and
Gator orange juice) based on the US (affective animation with motion). If there was no
difference in the salient beliefs between the conditioning and control group, this study

64
could assume that belief was not a factor in attitude formation. As suggested by Kim,
Lim and Bhargava (1998) and Homer and Yoon (1992), participants estimated the
likelihood that an MP3 player and soft drink possessed various attributes on four 7-point
probability scales. Thus, the following extended measures were included: (1) sounds and
tastes good, (2) is of good quality, (3) provides many different additional devices and
ingredients, and (4) is reliable. Furthermore, beliefs about one of the filler brands was
included to distract participants’ attention from the focal brand and decrease their
hypothesis guessing.
The measures were used to assess the participants’ affective response to the US.
The Self-Assessment Manikin (SAM) (Lang 1984) and the additional Self-Assessment
AdSAM® (Morris 1995) consist of a graphic character used to represent the three
dimensions of PAD. AdSAM® measured affective response was used to represent the
three dimensions of PAD (e.g., pleasure, arousal and dominance). The measure consists
of a graphic character arrayed along three different scales that include pleasure, arousal,
and dominance. AdSAM® is in appendix B.
The study was measured the attitude toward the target brands (MP3 player for
high involvement and fruit juice for low involvement) to gauge attitudes toward the
animated commercials. The scales were adopted from Biehal, Stephens & Curlo (1992).
The questionnaire asked subjects to evaluate ads using a semantic differential scale along
with four measures anchored by the labels “unfavorable/favorable,” “bad/good,”
“dislike/like,” and “unpleasant/pleasant.”
Attitude toward the brands (e.g., MP3 player and orange juice) were selected from
a prior study (Holbrook & Batra 1987; Homer &Yoon 1992). Subjects were also asked

65
to evaluate the brands (using 7-points and a four-item measure), along with seven items
anchored by the labels “good/bad,” “like very much/dislike very much,”
“attractive/unattractive,” and “interesting/boring.”
To measure purchase intention, subjects were asked the question: “All things
considered, if you are planning to purchase the brand on one of your next trips to a store,
what are the chances that you would purchase the brand if it is available?” The purchase
intention measure scales used were suggested by Bake (1999) as well as MacInnis and
Stayman (1993). Each of the items was standardized and summed to represent the
attribution of the product, attitude toward the ads, and brand and purchase behavior.
Excellent reliability of each scale was also obtained (Cronbach alpha = .90).
3.2.6.2 Involvement manipulation check
The product involvement manipulation check used in the first experiment also
was employed to the second experiment. The manipulation check measure consisted of
six items adapted from Zaichkowsky (1985) to determine the extent to which the
participants paid attention to a product offered via slide presentation and the stimuli.
Subjects were asked how much relevance the product had to them before the actual
experiment. And investigator told them to checkmark to the number what thoughts and
feelings went through their mind about the product after watching the commercial. The
items used in this study consisted of “useless/useful,” “uninterested/interested,”
“worthless/valuable,” “unwanted/wanted,” and “irrelevant/relevant.” Excellent reliability
of the scale was also obtained (Cronbach alpha = .93). A t-test indicated that the intended
manipulation could be successful. High product involvement participants with the
66
product reported a mean of 5.1 compared to a mean of 2.8 for the low product
involvement participants. This difference was found to be significant (t =23.4, p < .001).
3.2.6.3 Conditioning requirement
To test the hypotheses in this study, participants first had to be successfully
conditioned, as was evidenced by how the conditioning treatment fostered a more
favorable attitude toward the ads and target brand than the conditioning control (Priluck
and Till 2004).
Participants in the conditioning treatment who were exposed to the animated
stimuli reported significantly more favorable attitudes toward the ads than those in the
conditioning control group. More specifically, the low-involvement product group in the
conditioning treatment had a mean of 5.0 compared to a mean of 3.4 for the conditioning
control group. This difference was statistically significant (t = 11.59, p <.001) and
indicates that this conditioning procedure successfully altered attitudes toward the
animated commercials.
Participants in the conditioning treatment group who were exposed to the
animated stimuli reported significantly more favorable attitudes toward the ads than those
in the conditioning control group. Specifically, the conditioning treatment group had a
mean of 5.2 compared to a mean of 3.6 for the conditioning control. This difference was
statistically significant (t = 10.6, p <.001) and indicated that this conditioning procedure
successfully altered attitudes toward the target brand.
3.2.6.4 Reliability of manipulations checks
In order to determine the validity a manipulation, reliable manipulation checks are
a prerequisite (Perdue & Summers 1986). Nunally (1978) emphasized that the reliability
67
of a measure refers to the extent to which random error is absent. Reliability of the
manipulation checks was assessed by calculating Cronbach’s alpha, which is to determine
internal consistency, the upper bound of reliability and coefficient beta, which is to
determine unidimensionality and the lower bound of reliability for each index (John &
Roedder 1981). Results indicated that the manipulation check measures had acceptable
levels of internal consistency and unidimensionality. And all alpha and beta coefficient
were over .80.
3.2.6.5 Construct validity
Nunnally (1978) suggested that an important first step in assessing the construct
validity of a manipulation is to assess the extent to which it appears to look like it
manipulates what it should manipulate. Also it is normally referred to as face validity.
The three advertising practitioners and expert judges mentioned above indicated that the
manipulation appeared to capture the different levels of animated characters and degree
of product involvement.
3.2.6.6 Convergent validity
In addition to face validity, Perdue & Summers (1986) argued that a successful
manipulation should possess convergent validity, which refers to the degree to which
convergence exists between a construct and its manipulation. A successful manipulation
can be assessed via manipulation checks that reflect the dimensions of the latent construct
under study. In this situation, if the proposed two-group manipulation had convergent
validity, subjects in the experimental group were expected to exhibit higher levels of
attention to the animated commercials and would process the ad for a reason different
from subjects assigned to the control group.
68
CHAPTER 4 RESULTS
4.1 Experiment 1
Descriptive statistics of dependent variables (e.g., cognitive attitude, pleasure,
arousal, dominance as affective attitude, and conative attitude) were tabled by type of
commercials such as clay, cartoon, and live action formatted commercial stimuli.
Structural equation modeling was used to compare three-group path coefficients followed
by a multi-group confirmatory factor analysis with a chi-square test. The multi group
CFA analysis was conducted to examine the statistical different across two different
groups.
Data were analyzed using a MANOVA on four dependent variables: emotional
response, attitude toward the ads, and brand and purchase intention. A 3 (types of
commercials: clay, cartoon and live action formatted commercials) x 2 (degree of
involvement: high versus low) between-subjects factorial design was employed on linear
combination of all dependent variables. Where necessary, a series of t-tests followed to
examine the mean difference on two different groups and logit regression was conducted
to test the specific hypotheses because a recall was coded as dichotomous variables
(yes=1 and 0=no).
A score for each dependent variable was calculated by averaging the ratings
across the multiple items used to measure that construct since the inter-item correlations
for each of the scales, as measured by Cronbach’s alpha, were large (ad attitude, .97;
brand attitude, .95; and purchase intent, .94). Ad recall was not included in this analysis
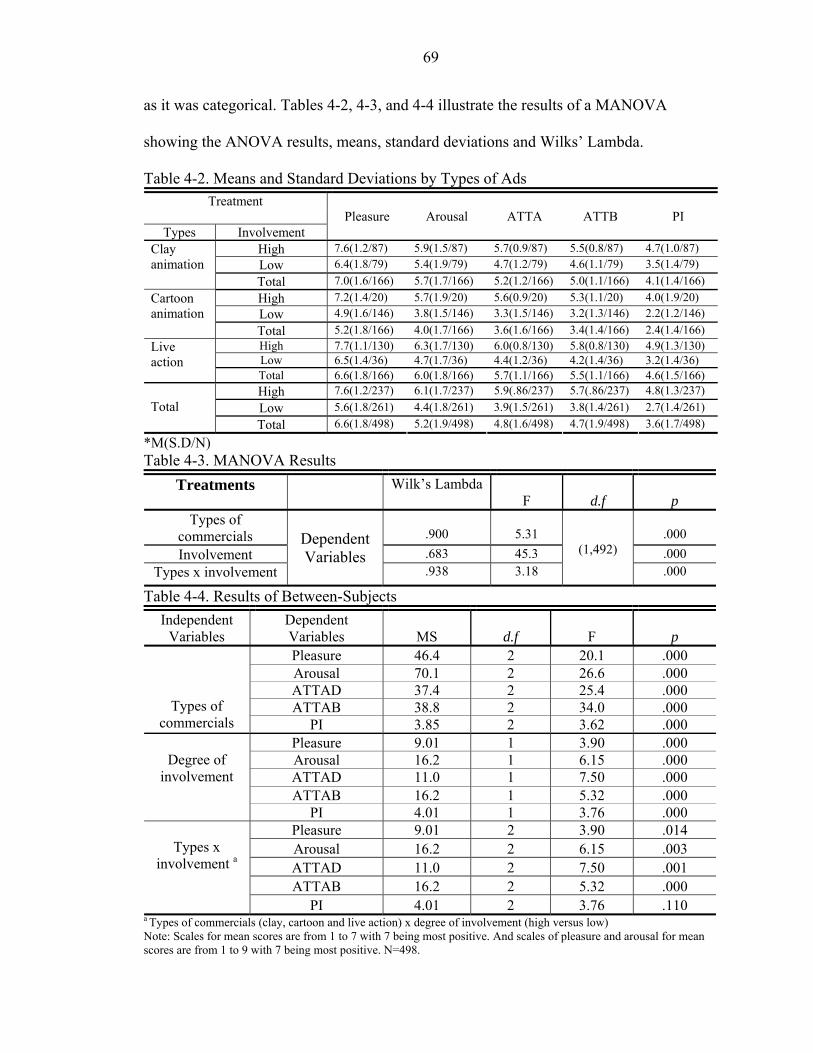
69
as it was categorical. Tables 4-2, 4-3, and 4-4 illustrate the results of a MANOVA
showing the ANOVA results, means, standard deviations and Wilks’ Lambda.
Table 4-2. Means and Standard Deviations by Types of Ads Treatment
Types Involvement Pleasure Arousal ATTA ATTB PI
High 7.6(1.2/87) 5.9(1.5/87) 5.7(0.9/87) 5.5(0.8/87) 4.7(1.0/87) Low 6.4(1.8/79) 5.4(1.9/79) 4.7(1.2/79) 4.6(1.1/79) 3.5(1.4/79)
Clay animation
Total 7.0(1.6/166) 5.7(1.7/166) 5.2(1.2/166) 5.0(1.1/166) 4.1(1.4/166) High 7.2(1.4/20) 5.7(1.9/20) 5.6(0.9/20) 5.3(1.1/20) 4.0(1.9/20) Low 4.9(1.6/146) 3.8(1.5/146) 3.3(1.5/146) 3.2(1.3/146) 2.2(1.2/146)
Cartoon animation
Total 5.2(1.8/166) 4.0(1.7/166) 3.6(1.6/166) 3.4(1.4/166) 2.4(1.4/166) High 7.7(1.1/130) 6.3(1.7/130) 6.0(0.8/130) 5.8(0.8/130) 4.9(1.3/130) Low 6.5(1.4/36) 4.7(1.7/36) 4.4(1.2/36) 4.2(1.4/36) 3.2(1.4/36)
Live action
Total 6.6(1.8/166) 6.0(1.8/166) 5.7(1.1/166) 5.5(1.1/166) 4.6(1.5/166) High 7.6(1.2/237) 6.1(1.7/237) 5.9(.86/237) 5.7(.86/237) 4.8(1.3/237) Low 5.6(1.8/261) 4.4(1.8/261) 3.9(1.5/261) 3.8(1.4/261) 2.7(1.4/261)
Total
Total 6.6(1.8/498) 5.2(1.9/498) 4.8(1.6/498) 4.7(1.9/498) 3.6(1.7/498)
*M(S.D/N) Table 4-3. MANOVA Results
Treatments Wilk’s Lambda F
d.f
p
Types of commercials
.900
5.31
.000
Involvement .683 45.3 .000 Types x involvement
Dependent Variables
.938 3.18
(1,492)
.000
Table 4-4. Results of Between-Subjects Independent
Variables Dependent Variables
MS
d.f
F
p
Pleasure 46.4 2 20.1 .000 Arousal 70.1 2 26.6 .000 ATTAD 37.4 2 25.4 .000 ATTAB 38.8 2 34.0 .000
Types of commercials PI 3.85 2 3.62 .000
Pleasure 9.01 1 3.90 .000 Arousal 16.2 1 6.15 .000 ATTAD 11.0 1 7.50 .000 ATTAB 16.2 1 5.32 .000
Degree of
involvement
PI 4.01 1 3.76 .000 Pleasure 9.01 2 3.90 .014 Arousal 16.2 2 6.15 .003 ATTAD 11.0 2 7.50 .001 ATTAB 16.2 2 5.32 .000
Types x
involvement a
PI 4.01 2 3.76 .110 a Types of commercials (clay, cartoon and live action) x degree of involvement (high versus low) Note: Scales for mean scores are from 1 to 7 with 7 being most positive. And scales of pleasure and arousal for mean scores are from 1 to 9 with 7 being most positive. N=498.
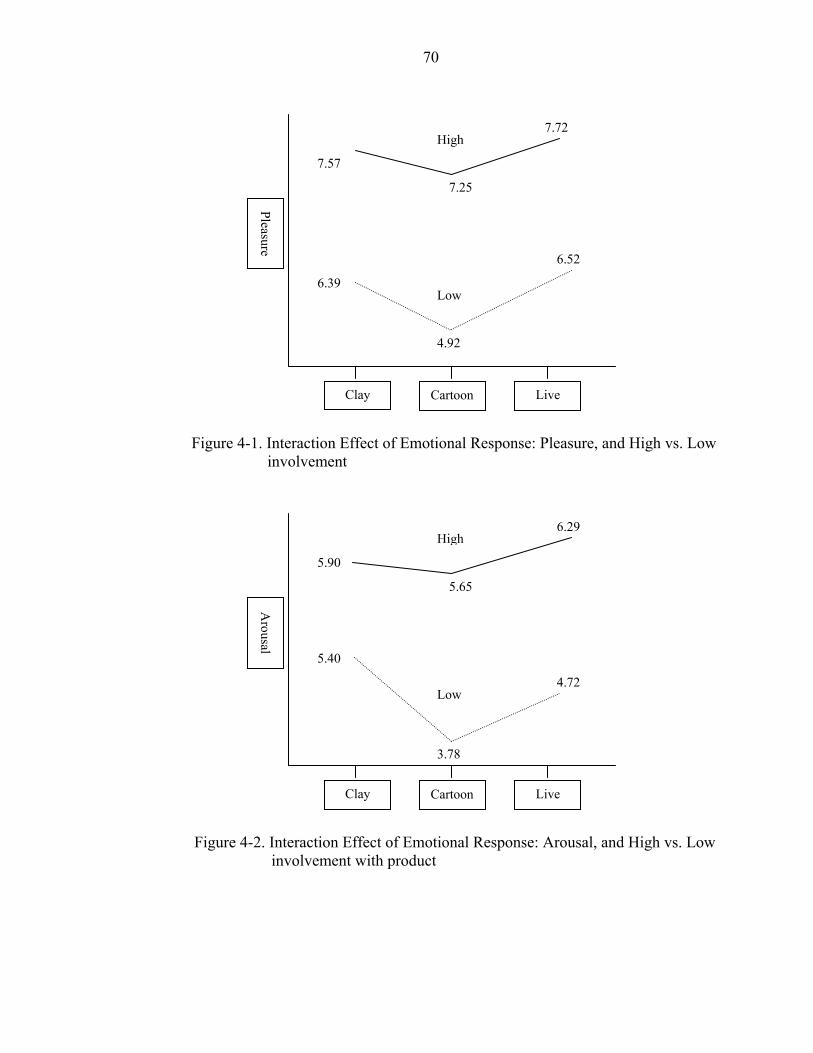
70
Figure 4-1. Interaction Effect of Emotional Response: Pleasure, and High vs. Low involvement
Figure 4-2. Interaction Effect of Emotional Response: Arousal, and High vs. Low involvement with product
Clay
Pleasure
7.57
6.39
6.52
7.72
Low
High
Cartoon Live
7.25
4.92
Clay
Arousal
5.90
5.40
4.72
6.29
Low
High
Cartoon Live
5.65
3.78
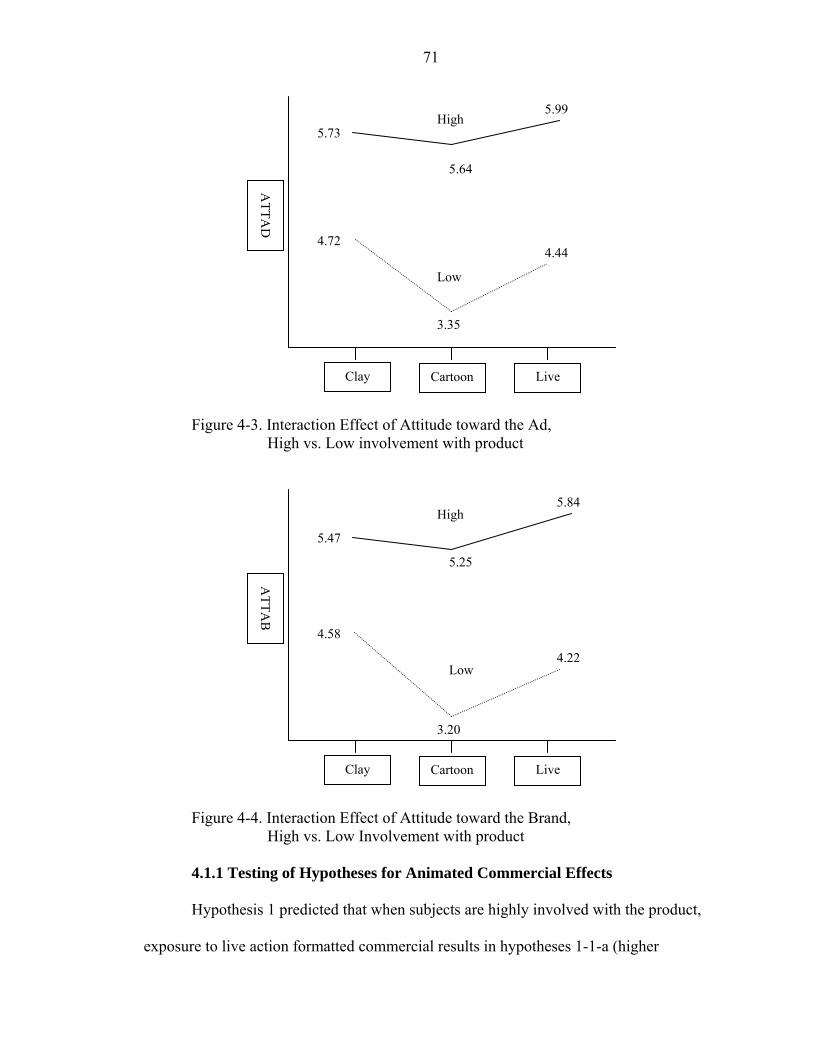
71
Figure 4-3. Interaction Effect of Attitude toward the Ad, High vs. Low involvement with product
Figure 4-4. Interaction Effect of Attitude toward the Brand, High vs. Low Involvement with product 4.1.1 Testing of Hypotheses for Animated Commercial Effects
Hypothesis 1 predicted that when subjects are highly involved with the product,
exposure to live action formatted commercial results in hypotheses 1-1-a (higher
Clay
ATTA
D
5.73
4.724.44
5.99
Low
High
Cartoon Live
5.64
3.35
Clay
ATTA
B
5.47
4.58
4.22
5.84
Low
High
Cartoon Live
5.25
3.20
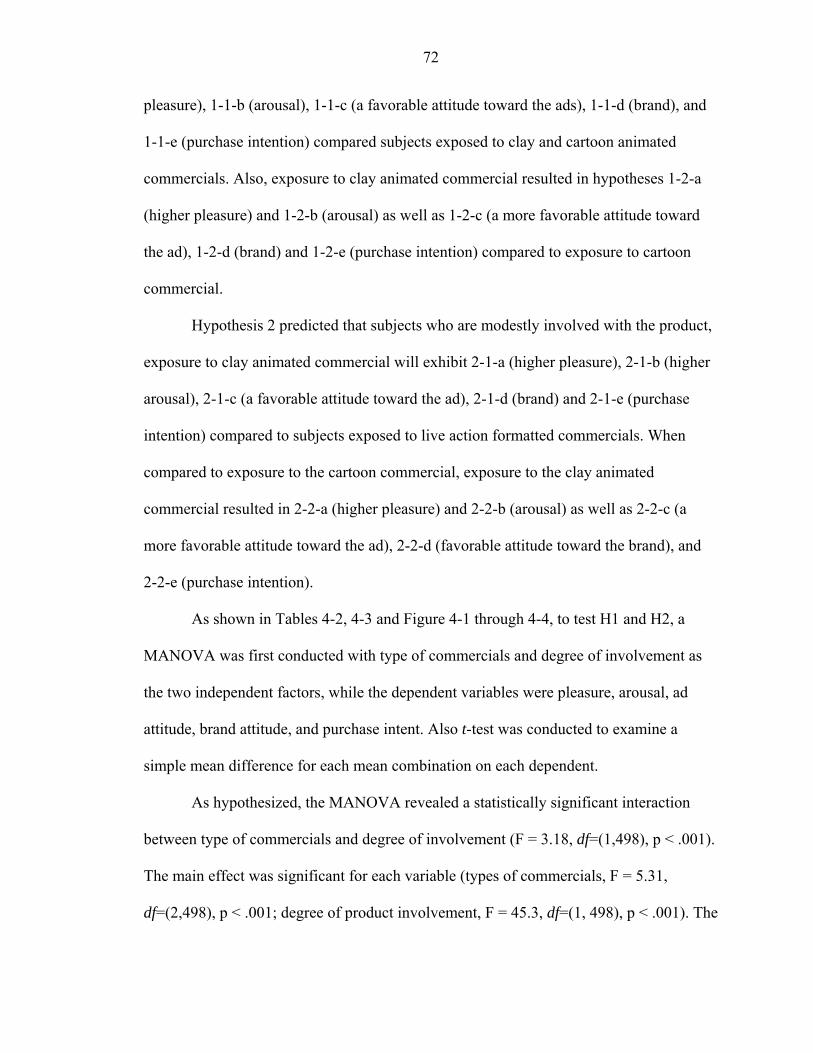
72
pleasure), 1-1-b (arousal), 1-1-c (a favorable attitude toward the ads), 1-1-d (brand), and
1-1-e (purchase intention) compared subjects exposed to clay and cartoon animated
commercials. Also, exposure to clay animated commercial resulted in hypotheses 1-2-a
(higher pleasure) and 1-2-b (arousal) as well as 1-2-c (a more favorable attitude toward
the ad), 1-2-d (brand) and 1-2-e (purchase intention) compared to exposure to cartoon
commercial.
Hypothesis 2 predicted that subjects who are modestly involved with the product,
exposure to clay animated commercial will exhibit 2-1-a (higher pleasure), 2-1-b (higher
arousal), 2-1-c (a favorable attitude toward the ad), 2-1-d (brand) and 2-1-e (purchase
intention) compared to subjects exposed to live action formatted commercials. When
compared to exposure to the cartoon commercial, exposure to the clay animated
commercial resulted in 2-2-a (higher pleasure) and 2-2-b (arousal) as well as 2-2-c (a
more favorable attitude toward the ad), 2-2-d (favorable attitude toward the brand), and
2-2-e (purchase intention).
As shown in Tables 4-2, 4-3 and Figure 4-1 through 4-4, to test H1 and H2, a
MANOVA was first conducted with type of commercials and degree of involvement as
the two independent factors, while the dependent variables were pleasure, arousal, ad
attitude, brand attitude, and purchase intent. Also t-test was conducted to examine a
simple mean difference for each mean combination on each dependent.
As hypothesized, the MANOVA revealed a statistically significant interaction
between type of commercials and degree of involvement (F = 3.18, df=(1,498), p < .001).
The main effect was significant for each variable (types of commercials, F = 5.31,
df=(2,498), p < .001; degree of product involvement, F = 45.3, df=(1, 498), p < .001). The
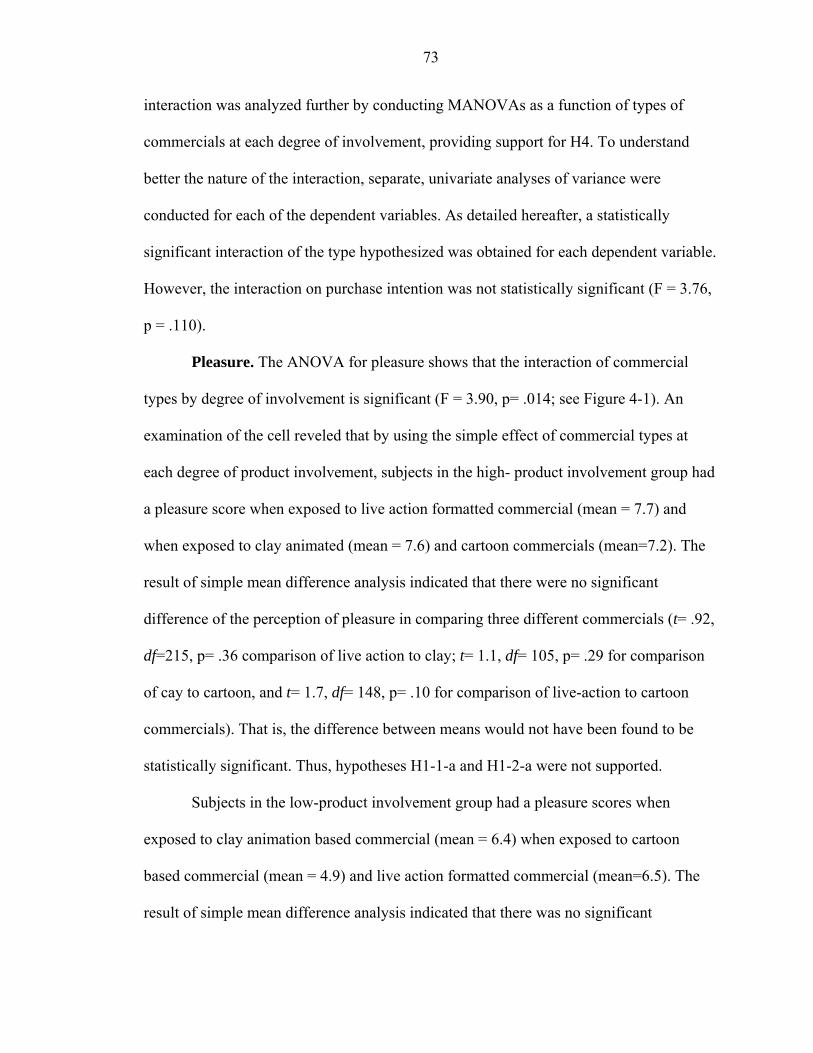
73
interaction was analyzed further by conducting MANOVAs as a function of types of
commercials at each degree of involvement, providing support for H4. To understand
better the nature of the interaction, separate, univariate analyses of variance were
conducted for each of the dependent variables. As detailed hereafter, a statistically
significant interaction of the type hypothesized was obtained for each dependent variable.
However, the interaction on purchase intention was not statistically significant (F = 3.76,
p = .110).
Pleasure. The ANOVA for pleasure shows that the interaction of commercial
types by degree of involvement is significant (F = 3.90, p= .014; see Figure 4-1). An
examination of the cell reveled that by using the simple effect of commercial types at
each degree of product involvement, subjects in the high- product involvement group had
a pleasure score when exposed to live action formatted commercial (mean = 7.7) and
when exposed to clay animated (mean = 7.6) and cartoon commercials (mean=7.2). The
result of simple mean difference analysis indicated that there were no significant
difference of the perception of pleasure in comparing three different commercials (t= .92,
df=215, p= .36 comparison of live action to clay; t= 1.1, df= 105, p= .29 for comparison
of cay to cartoon, and t= 1.7, df= 148, p= .10 for comparison of live-action to cartoon
commercials). That is, the difference between means would not have been found to be
statistically significant. Thus, hypotheses H1-1-a and H1-2-a were not supported.
Subjects in the low-product involvement group had a pleasure scores when
exposed to clay animation based commercial (mean = 6.4) when exposed to cartoon
based commercial (mean = 4.9) and live action formatted commercial (mean=6.5). The
result of simple mean difference analysis indicated that there was no significant
74
difference of the perception of pleasure in comparing clay to live action formatted
commercial (t= .40, df=113, p= .69 for clay vs. live action). That is, the difference
between means would not have been found to be statistically significant. Thus,
hypotheses H2-1-a was not supported. The result of simple mean difference analysis
indicated that there were significant differences of the perception of pleasure in
comparing clay to cartoon and live action to cartoon commercials (t= 6.2, df=223, p<.05
comparison of clay to cartoon, and t= 5.4, df=180, p<.05 for live action vs. cartoon
commercials). Consequently, the mean difference is statistically significant from 0. Thus,
hypotheses H2-2-a was supported.
Arousal. The ANOVA for arousal shows that the interaction of commercial types
by degree of involvement is significant (F = 6.15, p < .003; see Figure 4-2). An
examination of the cell means suggests that by using the simple effect of commercial
types at each degree of involvement, subjects in the high-involvement product group had
arousal score when exposed to live action formatted commercial (mean = 6.3) when
exposed to clay animated (mean = 5.9) and cartoon commercials (mean =5.7). The result
of simple mean difference analysis indicated that there was no differences of the
perception of arousal in comparing three different commercials (t= 1.7, df=215, p= .08
for comparison of live action to clay, t= .62, df=105, p= .54 for clay vs. cartoon, and t=
1.6, df=148, p= .12 for live action vs. cartoon commercials). That is, the difference
between means would not have been found to be statistically significant. Thus,
hypotheses H1-1-b and H1-2-b were not supported.
Subjects in the low product involvement had arousal score when exposed to clay
animated commercial (mean = 5.4) when exposed to live action (mean = 4.7) and cartoon
75
commercials (mean = 3.8). The result of simple mean difference analysis indicated that
there were no significant difference of the perception of arousal in comparing clay to live
action formatted commercial (t= 1.9, df=113, p=.06 for clay vs. live action). That is, the
difference between means would not have been found to be statistically significant. Thus,
hypothesis H2-1-b was not supported. However, the result of simple mean difference
analysis indicated that there were differences of the perception of arousal in comparing
clay to cartoon and live action to cartoon (t= 7.1, df=223, p<.05 for clay vs. cartoon, and
t= 3.3, df= 180, p<.05 for live action vs. cartoon commercials). Consequently, the mean
difference is statistically significant from 0. Thus, hypothesis H2-2-b was supported.
Ad attitude. The ANOVA for attitude toward the ads shows that the interaction
of commercial types by degree of involvement is significant (F = 7.50, p < .001; see
Figure 4-3). An examination of the cell indicated that by using the simple effect of
commercial types at each degree of involvement, subjects in the high product
involvement had the perception of commercials when exposed to live action formatted
commercial (mean = 6.0) when exposed to clay animated and cartoon animated
commercials (mean = 5.7 and 5.6). The result of simple mean difference analysis
indicated that there was a difference of the perception of commercials in comparing live
action to clay animation (t= 2.2, df=215, p<.05 for live action vs. clay animation).
Consequently, the mean difference is statistically significant from 0. Thus, hypothesis
H1-1-c was supported. However, comparison of the perception of clay animated to
cartoon animated commercials and live action to cartoon based commercials were not
significant (t= .41, df=105, p=.69 for clay vs. cartoon and t= 1.8, df=148, p=.07 for live

76
action vs. cartoon). That is, the difference between means would not have been found to
be statistically significant. Thus, hypotheses H1-2-c was not supported.
Subjects in the low product involvement had a perception of animated
commercial score when exposed to clay animated commercial (mean = 4.7) when
exposed to live action (mean = 4.4) and cartoon commercials (mean = 3.3). The result of
simple mean difference analysis indicated that there were differences of the perception of
commercials in comparing clay to cartoon and live action to cartoon (t= 7.0, df=223,
p<.05 for clay vs. cartoon, and t= 4.2, df=180, p<.05 for live action vs. cartoon
commercials). Consequently, the mean difference is statistically significant from 0. Thus,
hypothesis H2-1-c and d were supported. However, there was a difference of the
perception of arousal in comparing clay animation to live action formatted commercial
(t=.98, df=113, p=.33 for clay vs. live action). That is, the difference between means
would not have been found to be statistically significant. Thus, hypothesis H2-2-c was
not supported.
Brand attitude. The ANOVA for brand attitude shows that the interaction of
commercial types by degree of involvement is significant (F = 5.32, p < .001; see Figure
4-4). An examination of the cell indicated that by using the simple effect of commercial
types at each degree of involvement, subjects in the high-involvement group had the
perception of advertised brand when exposed to live action commercial (mean = 5.8)
when exposed to the clay animated (mean = 5.5) and cartoon commercials (mean = 5.3).
The result of simple mean difference analysis indicated that there were significant
differences of the perception of advertised brand in commercials in comparing live action
to clay and live action to cartoon based commercial (t= 3.4, df=215, p<.05 for live action
77
vs. clay and t= 2.9, df=148, p<.05 for live action vs. cartoon). Consequently, the mean
difference is statistically significant from 0. Thus, hypothesis H1-1-d was supported.
However, there was no difference of the perception of advertised brand in commercial in
comparing clay to cartoon animation based commercial (t= .97, df=105, p=.34 for clay
vs.cartoon). That is, the difference between means would not have been found to be
statistically significant. Thus, hypothesis H1-2-d was not supported.
Subjects in the low product involvement had the perception of advertised brand in
commercials when exposed to the clay animated commercial (mean = 4.6) when exposed
to live action (mean = 4.2) and cartoon commercials (mean=3.2). The result of simple
mean difference analysis indicated that there were significant differences of the
perception of advertised brand in commercials in comparing clay to live action and
cartoon to live action based commercial (t= 8.1, df=223, p<.05 for clay vs. cartoon and t=
4.5, df=180, p<.05 for live action vs. cartoon). Consequently, the mean difference is
statistically significant from 0. Thus, hypothesis H2-1-d was supported. However, there
was no significant difference of the perception of advertised brand in commercial in
comparing clay animation to cartoon animation based commercials (t=1.6, df=113, p=.12
for clay vs.cartoon). Regarding t-test, hypothesis H2-2-d was not supported.
Purchase intent. The analysis of variance shows that the interaction of
commercial types by degree of involvement is not statistically significant (F = 3.76 p
>.110). However, the main effect of types of commercials and degree of involvement is
statistically significant on dependent variables (F [2, 492] = 3.62, p < .001 for types of
commercials and F [1, 492] = 3.76, p < .001 for degree of product involvement).
78
An examination of the cell revealed that by using the simple effect of commercial
types at each degree of involvement, subjects in the high product involvement group had
the purchase intention score when exposed to live action commercial (mean = 4.9) when
exposed to the clay animated (mean = 4.7) and cartoon commercials (mean = 4.0). The
result of simple mean difference analysis indicated that there was no significant
differences of the purchase intention in comparing live action to clay (t= 1.5, df=215,
p=.15 for live action vs clay). That is, the difference between means would not have been
found to be statistically significant. Thus, hypothesis H1-1-e was not supported. However,
there were significant differences of the purchase intention in comparing clay to cartoon
animation based commercial and cartoon to live action (t= 2.1, df=105, p<.05 for clay
vs.cartoon and t= 2.7, df=148, p<.05 for live action vs. cartoon). Consequently, the mean
difference is statistically significant from 0. Thus, hypothesis H1-2-e was supported.
Subjects in the low product involvement had purchase intention scores when
exposed to the clay animated commercial (mean = 3.5) when exposed to live action
(mean = 3.2) and cartoon commercials (mean=2.2). The result of simple mean different
analysis indicated that there were no a significant difference of the purchase intention in
comparing clay to live action (t= .88, df=113, p=.38 for clay vs. live action). That is, the
difference between means would not have been found to be statistically significant. Thus,
hypothesis H2-1-e was not supported. However, there was a significant difference of the
purchase intention in comparing clay to cartoon and cartoon to live action (t= 7.6, df=223,
p<.05 for clay vs.cartoon and t= 4.8, df=180, p<.05 for live action vs. cartoon).
Consequently, the mean difference is statistically significant from 0. Thus, hypothesis

79
H2-2-e was supported. As shown in Table 4-5, the results of the simple mean different
test on three different commercial types are described.
Table 4-5. The Results of the Mean difference test in High vs. Low Product Involvement Comparing Mean in the High Product Involvement
Pleasure Arousal ATTAD ATTAB PI Live vs. Clay animation
7.7 ≠ 7.6 t= .92, p=.36
6.3 ≠ 5.9 t= 1.8, p=.08
6.0 > 5.7 t= 2.2, p<.05
5.8 > 5.5 t= 3.4, p<.05
4.9 ≠ 4.7 t= 1.5, p=.15
Live action vs. Cartoon
7.7 ≠ 7.3 t= 1.7, p=.09
6.3 ≠ 5.7 t= 1.6, p=.12
6.0 > 5.6 t= 1.8, p<.05
5.8 > 5.3 t= 2.9, p<.05
4.9 > 4.0 t= 2.7, p<.05
Clay vs.cartoon animation
7.6 ≠ 7.3 t= 1.1, p=.29
5.9 ≠ 5.7 t= .62, p=.54
5.7 ≠ 5.6 t= .41, p=.69
5.5 ≠ 5.3 t= .97, p=.34
4.7 > 4.0 t= 2.1,p<.05
Comparing Mean in the Low Product Involvement Pleasure Arousal ATTAD ATTAB PI Clay animation vs. Live action
6.4 ≠ 6.5 t= 4.0, p=.69
5.4 > 4.7 t= 1.9, p=.06
4.7 ≠ 4.4 t= .98, p=.33
4.6 ≠ 4.2 t= 1.6, p=.12
3.5 ≠ 3.2 t= .88, p=.38
Live action vs. Cartoon
6.5 > 4.9 t= 5.4, p<.05
4.7 > 3.8 t= 3.3, p<.05
4.4>3.3 t= 4.2, p<.05
4.2 > 3.2 t= 4.5, p<.05
3.2 > 2.2 t= 4.8, p<.05
Clay vs.cartoon animation
6.4 > 4.9 t= 6.2, p<.05
5.4 > 3.8 t= 7.1, p<.05
4.7 > 3.3 t= 7.0, p<.05
4.6 > 3.2 t= 8.1, p<.05
3.5 > 2.2 t= 7.6, p<.05
Note: ≠ is not significant
4.1.2 Results for Ad-Recall
H3 predicted that regardless of level of product involvement subjects are exposed
to clay animated commercial, subjects will exhibit increased ad recall compared to those
exposed to cartoon based or live action commercials.
As seen in the table 4-6 through 4-9, ad recall was measured by asking subjects to
describe the names in the ads as they remembered them from the commercials. In order to
accurate measure ad recall, measuring ad recall was conducted without showing
participants the commercials again. For unaided ad recall measure, subjects were
instructed to write down everything they could remember about the ads themselves such
as a description of the ad, displayed product names, characters, story lines, theme, their
cognition, and feelings. Ad recall scores were calculated by counting the number of ad
components correctly recalled (Edell & Keller 1989; Jin 2003).
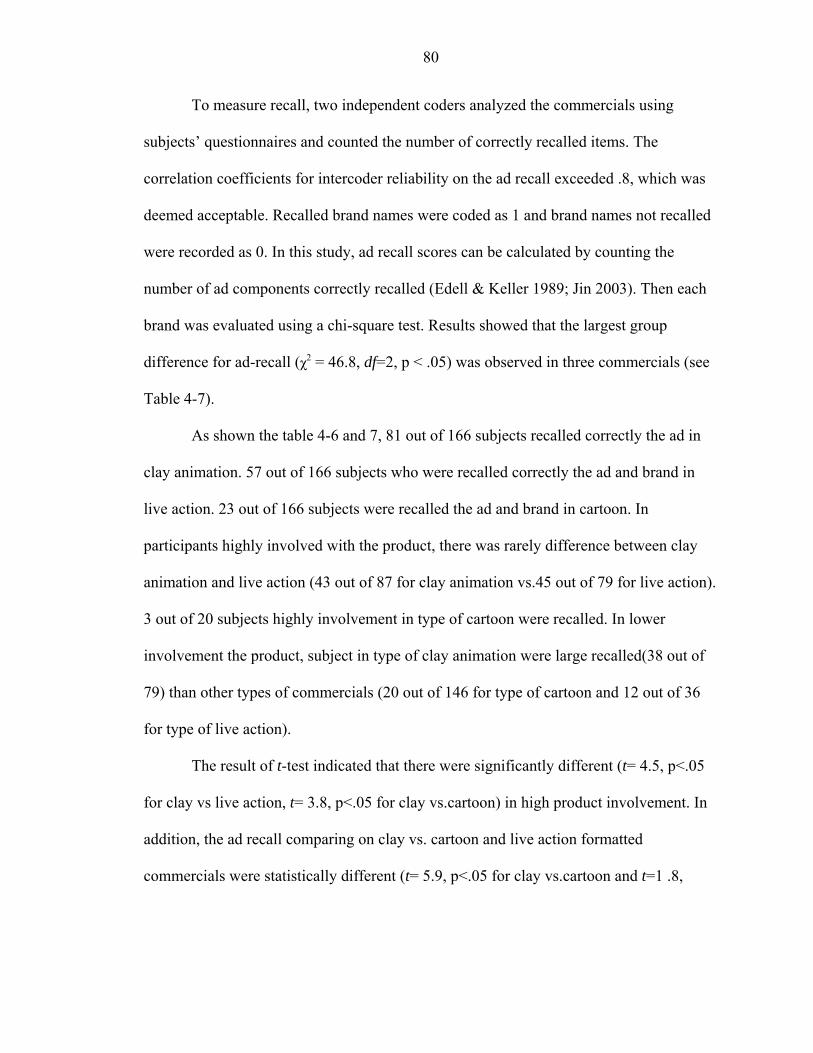
80
To measure recall, two independent coders analyzed the commercials using
subjects’ questionnaires and counted the number of correctly recalled items. The
correlation coefficients for intercoder reliability on the ad recall exceeded .8, which was
deemed acceptable. Recalled brand names were coded as 1 and brand names not recalled
were recorded as 0. In this study, ad recall scores can be calculated by counting the
number of ad components correctly recalled (Edell & Keller 1989; Jin 2003). Then each
brand was evaluated using a chi-square test. Results showed that the largest group
difference for ad-recall (χ2 = 46.8, df=2, p < .05) was observed in three commercials (see
Table 4-7).
As shown the table 4-6 and 7, 81 out of 166 subjects recalled correctly the ad in
clay animation. 57 out of 166 subjects who were recalled correctly the ad and brand in
live action. 23 out of 166 subjects were recalled the ad and brand in cartoon. In
participants highly involved with the product, there was rarely difference between clay
animation and live action (43 out of 87 for clay animation vs.45 out of 79 for live action).
3 out of 20 subjects highly involvement in type of cartoon were recalled. In lower
involvement the product, subject in type of clay animation were large recalled(38 out of
79) than other types of commercials (20 out of 146 for type of cartoon and 12 out of 36
for type of live action).
The result of t-test indicated that there were significantly different (t= 4.5, p<.05
for clay vs live action, t= 3.8, p<.05 for clay vs.cartoon) in high product involvement. In
addition, the ad recall comparing on clay vs. cartoon and live action formatted
commercials were statistically different (t= 5.9, p<.05 for clay vs.cartoon and t=1 .8,
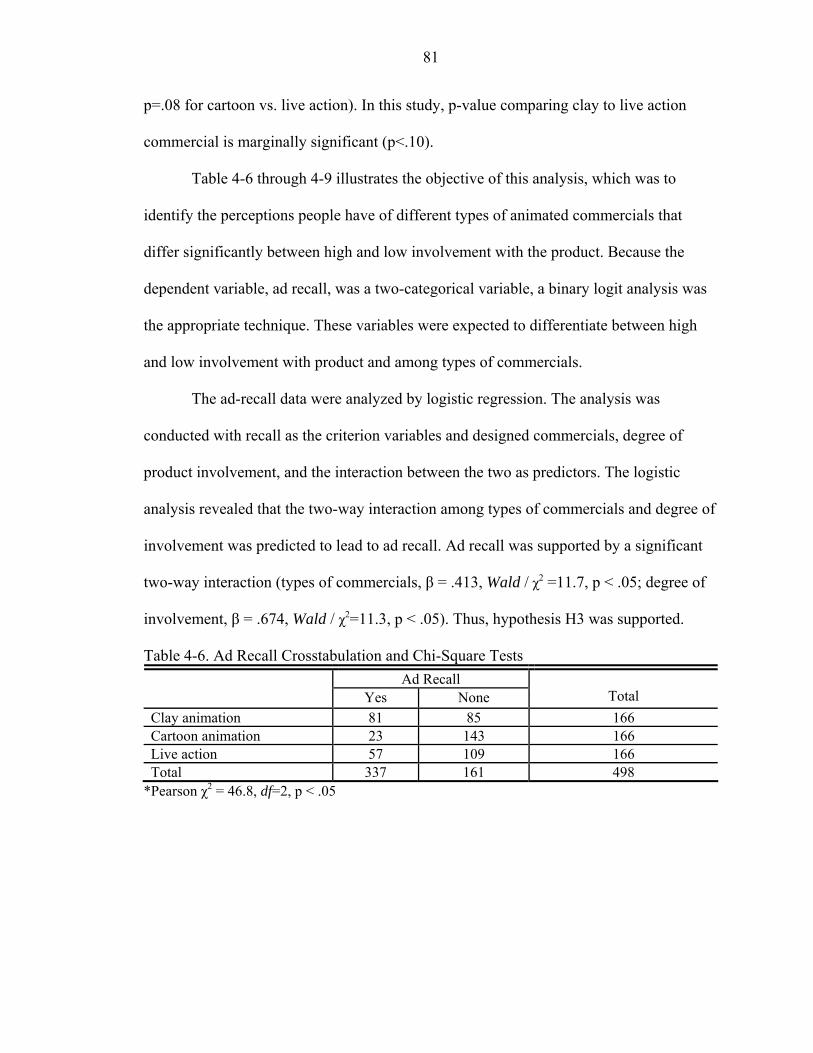
81
p=.08 for cartoon vs. live action). In this study, p-value comparing clay to live action
commercial is marginally significant (p<.10).
Table 4-6 through 4-9 illustrates the objective of this analysis, which was to
identify the perceptions people have of different types of animated commercials that
differ significantly between high and low involvement with the product. Because the
dependent variable, ad recall, was a two-categorical variable, a binary logit analysis was
the appropriate technique. These variables were expected to differentiate between high
and low involvement with product and among types of commercials.
The ad-recall data were analyzed by logistic regression. The analysis was
conducted with recall as the criterion variables and designed commercials, degree of
product involvement, and the interaction between the two as predictors. The logistic
analysis revealed that the two-way interaction among types of commercials and degree of
involvement was predicted to lead to ad recall. Ad recall was supported by a significant
two-way interaction (types of commercials, β = .413, Wald / χ2 =11.7, p < .05; degree of
involvement, β = .674, Wald / χ2=11.3, p < .05). Thus, hypothesis H3 was supported.
Table 4-6. Ad Recall Crosstabulation and Chi-Square Tests Ad Recall
Yes None
Total Clay animation 81 85 166 Cartoon animation 23 143 166 Live action 57 109 166 Total 337 161 498
*Pearson χ2 = 46.8, df=2, p < .05
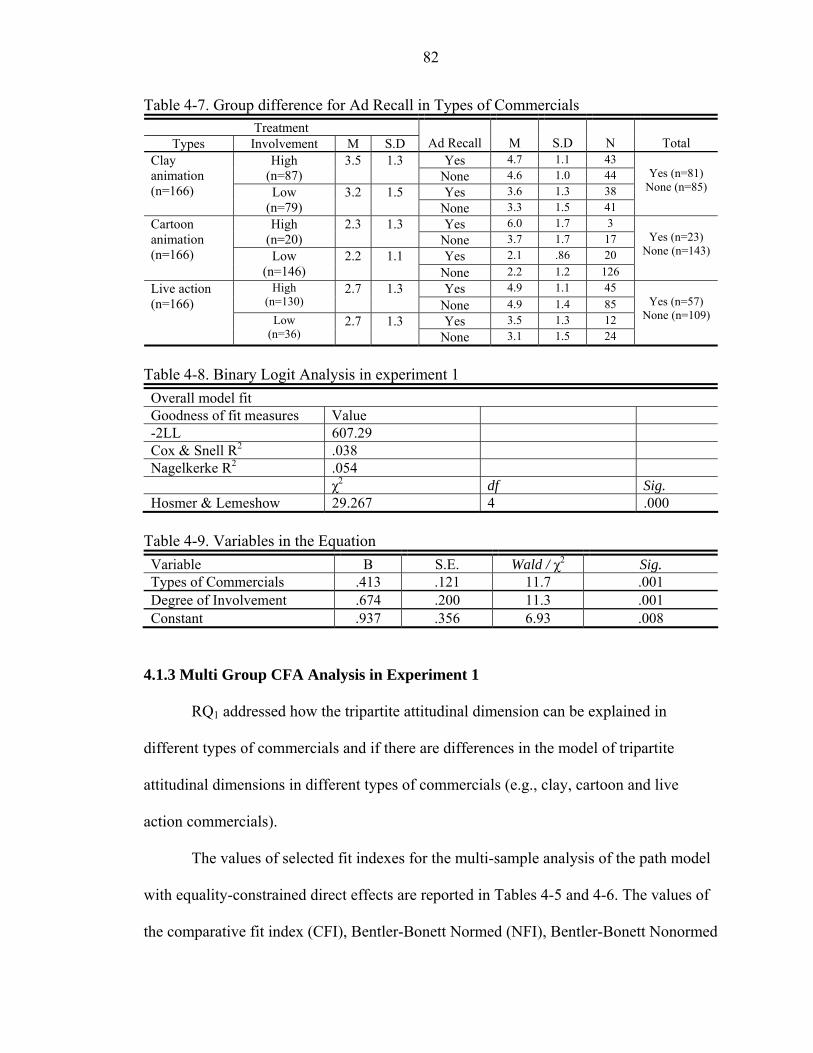
82
Table 4-7. Group difference for Ad Recall in Types of Commercials Treatment
Types Involvement M S.D
Ad Recall
M
S.D
N
Total Yes 4.7 1.1 43 High
(n=87) 3.5 1.3
None 4.6 1.0 44 Yes 3.6 1.3 38
Clay animation (n=166) Low
(n=79) 3.2 1.5
None 3.3 1.5 41
Yes (n=81)
None (n=85)
Yes 6.0 1.7 3 High (n=20)
2.3 1.3 None 3.7 1.7 17 Yes 2.1 .86 20
Cartoon animation (n=166) Low
(n=146) 2.2 1.1
None 2.2 1.2 126
Yes (n=23)
None (n=143)
Yes 4.9 1.1 45 High (n=130)
2.7 1.3 None 4.9 1.4 85 Yes 3.5 1.3 12
Live action (n=166)
Low (n=36)
2.7 1.3 None 3.1 1.5 24
Yes (n=57)
None (n=109)
Table 4-8. Binary Logit Analysis in experiment 1 Overall model fit Goodness of fit measures Value -2LL 607.29 Cox & Snell R2 .038 Nagelkerke R2 .054 χ2 df Sig. Hosmer & Lemeshow 29.267 4 .000
Table 4-9. Variables in the Equation Variable B S.E. Wald / χ2 Sig. Types of Commercials .413 .121 11.7 .001 Degree of Involvement .674 .200 11.3 .001 Constant .937 .356 6.93 .008
4.1.3 Multi Group CFA Analysis in Experiment 1
RQ1 addressed how the tripartite attitudinal dimension can be explained in
different types of commercials and if there are differences in the model of tripartite
attitudinal dimensions in different types of commercials (e.g., clay, cartoon and live
action commercials).
The values of selected fit indexes for the multi-sample analysis of the path model
with equality-constrained direct effects are reported in Tables 4-5 and 4-6. The values of
the comparative fit index (CFI), Bentler-Bonett Normed (NFI), Bentler-Bonett Nonormed
83
(NNFI) are over .96 and standardized RMR (SRMR), and root-mean-square error of
approximation (RMSEA) were satisfied by this criteria (below .05 and .08) respectively.
It can be said that this model fit is acceptable because the result would satisfy the criteria.
Table 4-10 and 4-11 and Figure 4-5 show the unstandardized and standardized
solutions. Generally, the unstandardized path coefficients are appropriate for between
group comparisons while standardized path coefficients are generally used to compare
paths within groups. The basic rationale for a multiple group path analysis is the same
whether the model is recursive or nonrecursive. Statistical significance of a modification
index thus indicates a group difference on that parameter. Values of modification indexes
for this analysis are reported in tables 4-8 and 4-9 and they indicate that there is no
significant group difference on each path (p>.05). Within three samples, all paths (e.g.,
cognition on affection and conation, affection on conation) are statistically significant (p
< .05). However, the unstandardized path coefficients of cognition on affection in cartoon
commercial (γ = .713) is highly scored compared to other commercials (γ = .629 for live
action and γ = .548 for clay animated commercial). The unstandardized path coefficients
of cognition on conation in clay animated commercial (γ = .657) is highly scored
compared to other commercials (γ = .571 for live action formatted and γ = .408 for
cartoon animated commercial). The unstandardized path coefficients of affection on
conation in live action formatted commercial (β = .336) is highly scored compared to
other commercials (β = .304 for clay animated and β = .303 for cartoon commercial).
In clay animation model, the standardized path coefficient of cognition to
affection was γ = .462, of cognition to conation was γ = .417, and of affection to conation
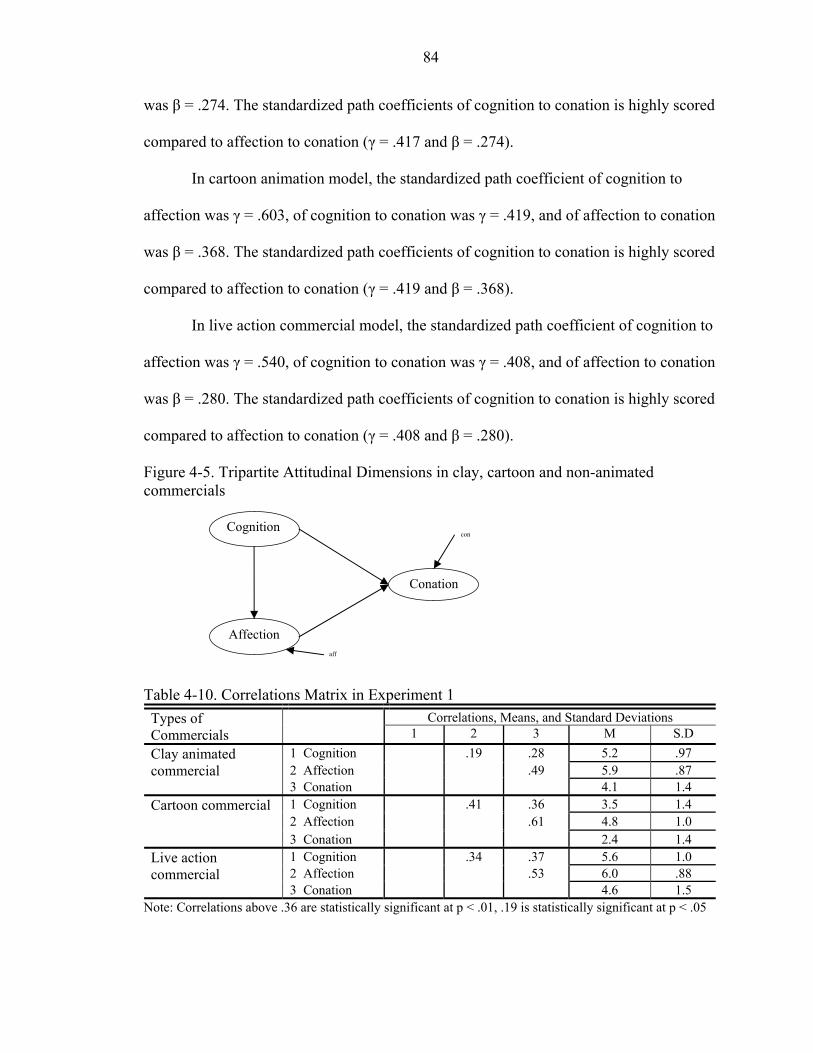
84
was β = .274. The standardized path coefficients of cognition to conation is highly scored
compared to affection to conation (γ = .417 and β = .274).
In cartoon animation model, the standardized path coefficient of cognition to
affection was γ = .603, of cognition to conation was γ = .419, and of affection to conation
was β = .368. The standardized path coefficients of cognition to conation is highly scored
compared to affection to conation (γ = .419 and β = .368).
In live action commercial model, the standardized path coefficient of cognition to
affection was γ = .540, of cognition to conation was γ = .408, and of affection to conation
was β = .280. The standardized path coefficients of cognition to conation is highly scored
compared to affection to conation (γ = .408 and β = .280).
Figure 4-5. Tripartite Attitudinal Dimensions in clay, cartoon and non-animated commercials
Table 4-10. Correlations Matrix in Experiment 1
Correlations, Means, and Standard Deviations Types of Commercials 1 2 3 M S.D
1 Cognition .19 .28 5.2 .97 2 Affection .49 5.9 .87
Clay animated commercial
3 Conation 4.1 1.4 1 Cognition .41 .36 3.5 1.4 2 Affection .61 4.8 1.0
Cartoon commercial
3 Conation 2.4 1.4 1 Cognition .34 .37 5.6 1.0 2 Affection .53 6.0 .88
Live action commercial
3 Conation 4.6 1.5 Note: Correlations above .36 are statistically significant at p < .01, .19 is statistically significant at p < .05
Cognition
Conation
Affection
con
aff

85
Table 4-11. Modification indexes for equality-constrained direct effects Path coefficients from
separate sample analyses a Modification
Index χ2
Direct Effect Clay 1. Clay vs. Cartoon
1. Cognition Affection .548 (.462)* 0.37 2. Cognition Conation .657 (.417)* 2.60 3. Affection Conation .304 (.274)* 0.84
Cartoon 2. Cartoon vs. Live action 1. Cognition Affection .713 (.603)* 0.23 2. Cognition Conation .408 (.419)* 1.83 3. Affection Conation .303 (.368)* 0.40
Live action 3. Live action vs. Clay 1. Cognition Affection .629 (.540)* 0.17 2. Cognition Conation .571 (.408)* 0.05 3. Affection Conation .336 (.280)* 0.00
Note. Goodness of Fit: 1. χ2 : 77.7(df:69), χ2/df(1.12), CFI;.99,NFI;.96, NNFI;.98, SRMR;.050, RMSEA;.028 2. χ2 : 74.2(df:66), χ2/df(1.12), CFI;.99,NFI;.97, NNFI;.99, SRMR;.053, RMSEA;.027 3. χ2 : 70.7(df:62), χ2/df(1.13), CFI;.99,NFI;.96, NNFI;.99, SRMR;.054, RMSEA;.029 a Unstandardized (standardized), * p ≤ .05
4.2 Experiment 2
4.2.1 Results for the Conditioning Experiment
Box’s test checked the assumption of equality of covariance matrices. For these
data, p was 0.05, thus the homogeneity assumption was violated, but only marginally. In
the low-product categories, data was analyzed using a MANOVA on the dependent
variables, attitude toward the commercial, attitude toward the brand, and purchase
intention. The study conducted a 2 (experimental vs. control group) x 2 (high and low
product involvement) between subjects factorial design with two levels for each of the
two independent variables, experimental vs. control group and level of product
involvement (high vs. low). A MANOVA was used to examine differences between the
two different conditions on linear combinations of all dependent variables, and a between
subject designed ANOVA was performed on each dependent variable. Where necessary,
a series of t-tests followed to examine the mean difference on two different groups and
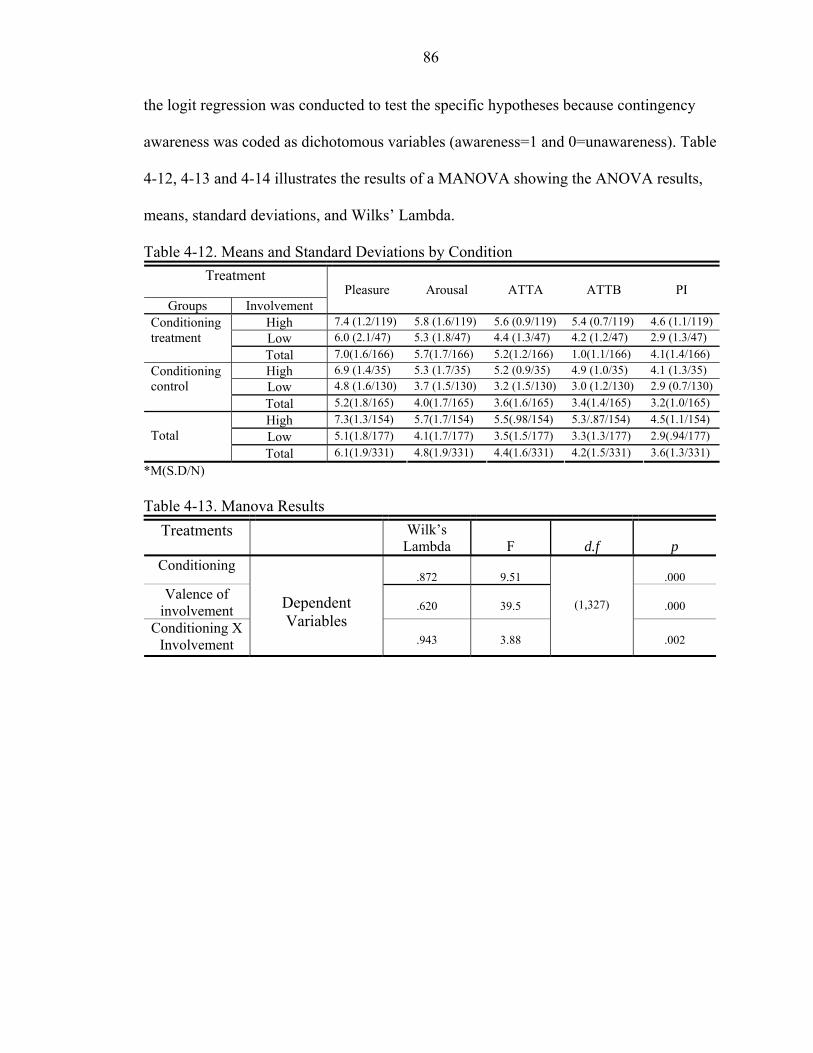
86
the logit regression was conducted to test the specific hypotheses because contingency
awareness was coded as dichotomous variables (awareness=1 and 0=unawareness). Table
4-12, 4-13 and 4-14 illustrates the results of a MANOVA showing the ANOVA results,
means, standard deviations, and Wilks’ Lambda.
Table 4-12. Means and Standard Deviations by Condition Treatment
Groups Involvement Pleasure Arousal ATTA ATTB PI
High 7.4 (1.2/119) 5.8 (1.6/119) 5.6 (0.9/119) 5.4 (0.7/119) 4.6 (1.1/119)Low 6.0 (2.1/47) 5.3 (1.8/47) 4.4 (1.3/47) 4.2 (1.2/47) 2.9 (1.3/47)
Conditioning treatment
Total 7.0(1.6/166) 5.7(1.7/166) 5.2(1.2/166) 1.0(1.1/166) 4.1(1.4/166)High 6.9 (1.4/35) 5.3 (1.7/35) 5.2 (0.9/35) 4.9 (1.0/35) 4.1 (1.3/35) Low 4.8 (1.6/130) 3.7 (1.5/130) 3.2 (1.5/130) 3.0 (1.2/130) 2.9 (0.7/130)
Conditioning control
Total 5.2(1.8/165) 4.0(1.7/165) 3.6(1.6/165) 3.4(1.4/165) 3.2(1.0/165)High 7.3(1.3/154) 5.7(1.7/154) 5.5(.98/154) 5.3/.87/154) 4.5(1.1/154)Low 5.1(1.8/177) 4.1(1.7/177) 3.5(1.5/177) 3.3(1.3/177) 2.9(.94/177)
Total
Total 6.1(1.9/331) 4.8(1.9/331) 4.4(1.6/331) 4.2(1.5/331) 3.6(1.3/331)*M(S.D/N) Table 4-13. Manova Results
Treatments Wilk’s Lambda
F
d.f
p
Conditioning .872
9.51
.000
Valence of involvement
.620
39.5
.000
Conditioning X Involvement
Dependent Variables
.943
3.88
(1,327)
.002
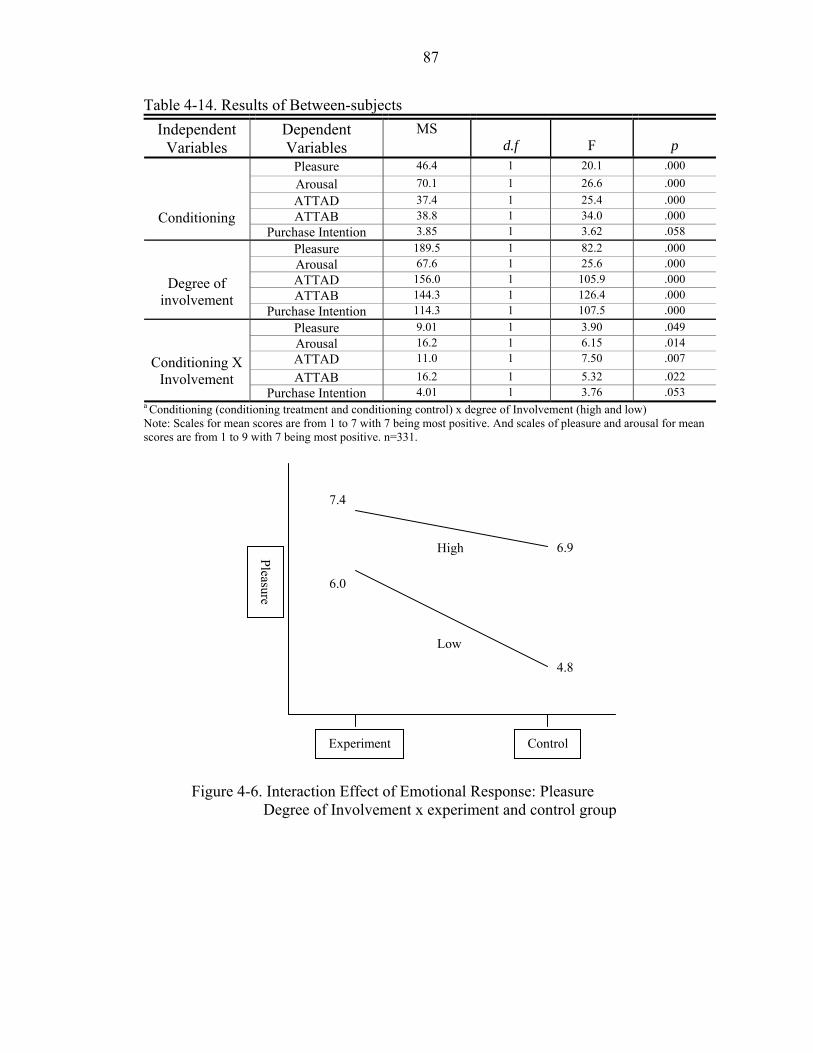
87
Table 4-14. Results of Between-subjects Independent
Variables Dependent Variables
MS d.f
F
p
Pleasure 46.4 1 20.1 .000 Arousal 70.1 1 26.6 .000 ATTAD 37.4 1 25.4 .000 ATTAB 38.8 1 34.0 .000
Conditioning Purchase Intention 3.85 1 3.62 .058
Pleasure 189.5 1 82.2 .000 Arousal 67.6 1 25.6 .000 ATTAD 156.0 1 105.9 .000 ATTAB 144.3 1 126.4 .000
Degree of involvement
Purchase Intention 114.3 1 107.5 .000 Pleasure 9.01 1 3.90 .049 Arousal 16.2 1 6.15 .014 ATTAD 11.0 1 7.50 .007
ATTAB 16.2 1 5.32 .022
Conditioning X Involvement
Purchase Intention 4.01 1 3.76 .053 a Conditioning (conditioning treatment and conditioning control) x degree of Involvement (high and low) Note: Scales for mean scores are from 1 to 7 with 7 being most positive. And scales of pleasure and arousal for mean scores are from 1 to 9 with 7 being most positive. n=331.
Figure 4-6. Interaction Effect of Emotional Response: Pleasure Degree of Involvement x experiment and control group
Experiment
Pleasure
7.4
6.0
Low
High
Control
6.9
4.8
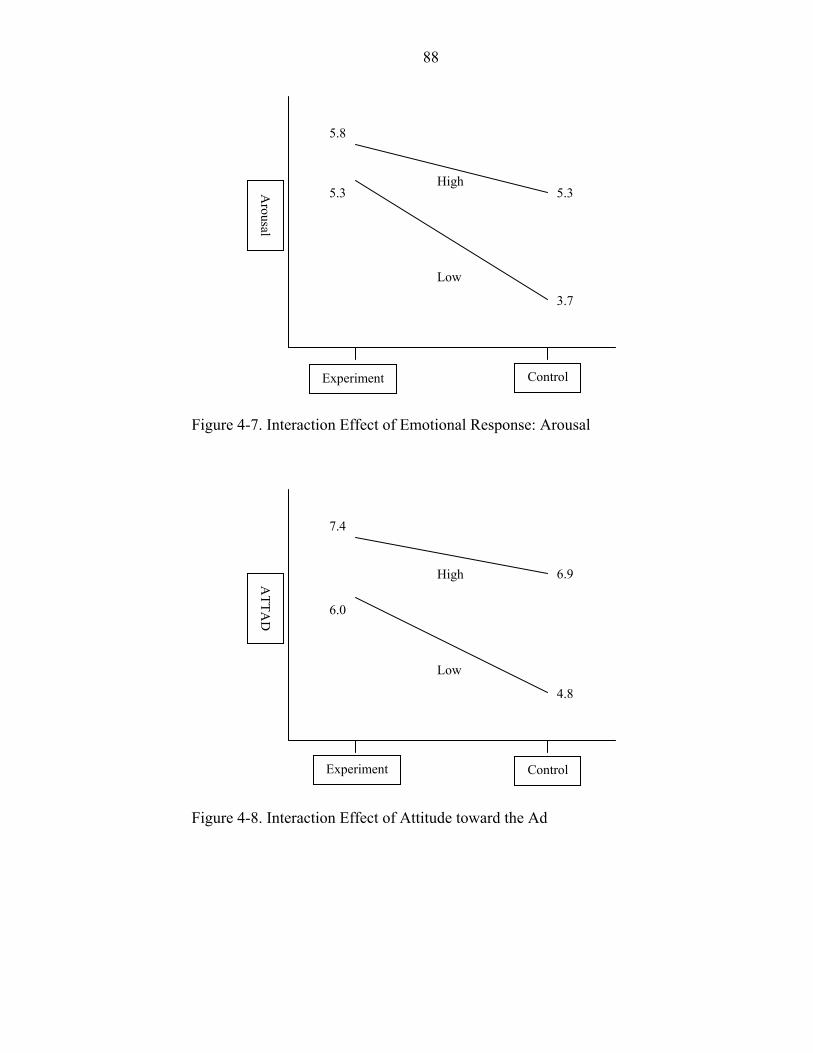
88
Figure 4-7. Interaction Effect of Emotional Response: Arousal
Figure 4-8. Interaction Effect of Attitude toward the Ad
ATTA
D
7.4
6.0
Low
High
Control
6.9
4.8
Arousal
5.8
5.3
Low
High
Control
5.3
3.7
Experiment
Experiment
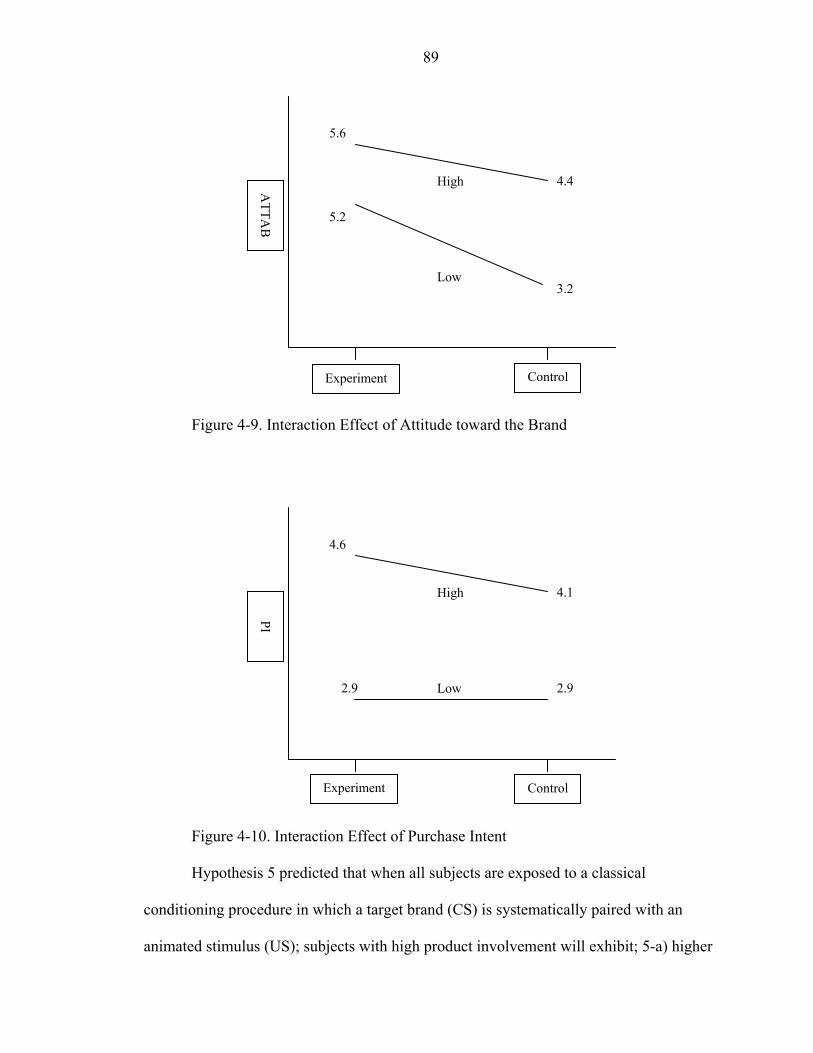
89
Figure 4-9. Interaction Effect of Attitude toward the Brand
Figure 4-10. Interaction Effect of Purchase Intent
Hypothesis 5 predicted that when all subjects are exposed to a classical
conditioning procedure in which a target brand (CS) is systematically paired with an
animated stimulus (US); subjects with high product involvement will exhibit; 5-a) higher
ATTA
B
5.6
5.2
Low
High
Control
4.4
3.2
PI 4.6
2.9 Low
High
Control
4.1
2.9
Experiment
Experiment
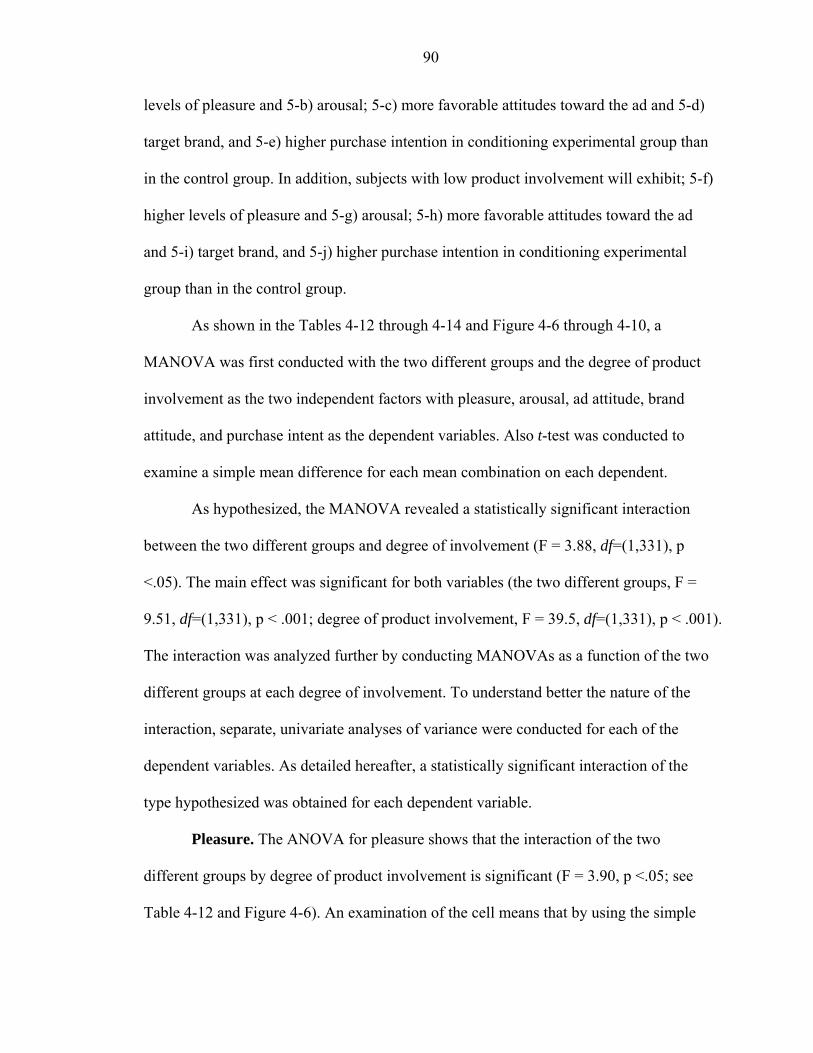
90
levels of pleasure and 5-b) arousal; 5-c) more favorable attitudes toward the ad and 5-d)
target brand, and 5-e) higher purchase intention in conditioning experimental group than
in the control group. In addition, subjects with low product involvement will exhibit; 5-f)
higher levels of pleasure and 5-g) arousal; 5-h) more favorable attitudes toward the ad
and 5-i) target brand, and 5-j) higher purchase intention in conditioning experimental
group than in the control group.
As shown in the Tables 4-12 through 4-14 and Figure 4-6 through 4-10, a
MANOVA was first conducted with the two different groups and the degree of product
involvement as the two independent factors with pleasure, arousal, ad attitude, brand
attitude, and purchase intent as the dependent variables. Also t-test was conducted to
examine a simple mean difference for each mean combination on each dependent.
As hypothesized, the MANOVA revealed a statistically significant interaction
between the two different groups and degree of involvement (F = 3.88, df=(1,331), p
<.05). The main effect was significant for both variables (the two different groups, F =
9.51, df=(1,331), p < .001; degree of product involvement, F = 39.5, df=(1,331), p < .001).
The interaction was analyzed further by conducting MANOVAs as a function of the two
different groups at each degree of involvement. To understand better the nature of the
interaction, separate, univariate analyses of variance were conducted for each of the
dependent variables. As detailed hereafter, a statistically significant interaction of the
type hypothesized was obtained for each dependent variable.
Pleasure. The ANOVA for pleasure shows that the interaction of the two
different groups by degree of product involvement is significant (F = 3.90, p <.05; see
Table 4-12 and Figure 4-6). An examination of the cell means that by using the simple
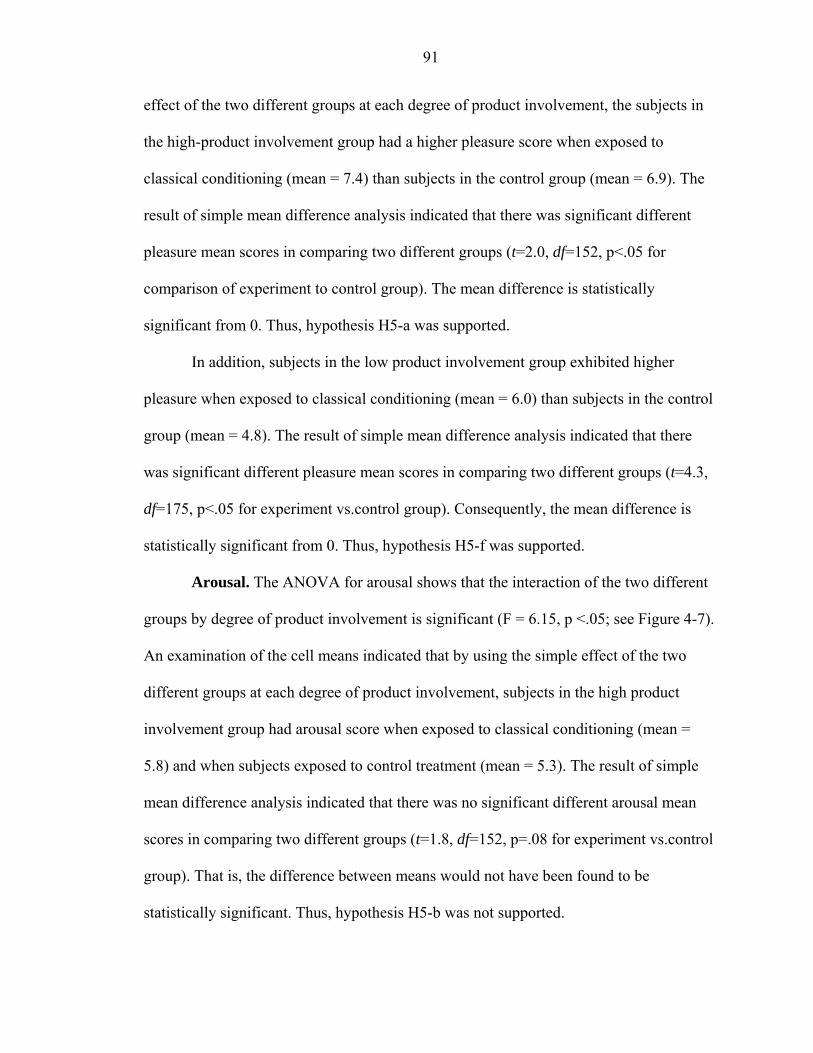
91
effect of the two different groups at each degree of product involvement, the subjects in
the high-product involvement group had a higher pleasure score when exposed to
classical conditioning (mean = 7.4) than subjects in the control group (mean = 6.9). The
result of simple mean difference analysis indicated that there was significant different
pleasure mean scores in comparing two different groups (t=2.0, df=152, p<.05 for
comparison of experiment to control group). The mean difference is statistically
significant from 0. Thus, hypothesis H5-a was supported.
In addition, subjects in the low product involvement group exhibited higher
pleasure when exposed to classical conditioning (mean = 6.0) than subjects in the control
group (mean = 4.8). The result of simple mean difference analysis indicated that there
was significant different pleasure mean scores in comparing two different groups (t=4.3,
df=175, p<.05 for experiment vs.control group). Consequently, the mean difference is
statistically significant from 0. Thus, hypothesis H5-f was supported.
Arousal. The ANOVA for arousal shows that the interaction of the two different
groups by degree of product involvement is significant (F = 6.15, p <.05; see Figure 4-7).
An examination of the cell means indicated that by using the simple effect of the two
different groups at each degree of product involvement, subjects in the high product
involvement group had arousal score when exposed to classical conditioning (mean =
5.8) and when subjects exposed to control treatment (mean = 5.3). The result of simple
mean difference analysis indicated that there was no significant different arousal mean
scores in comparing two different groups (t=1.8, df=152, p=.08 for experiment vs.control
group). That is, the difference between means would not have been found to be
statistically significant. Thus, hypothesis H5-b was not supported.
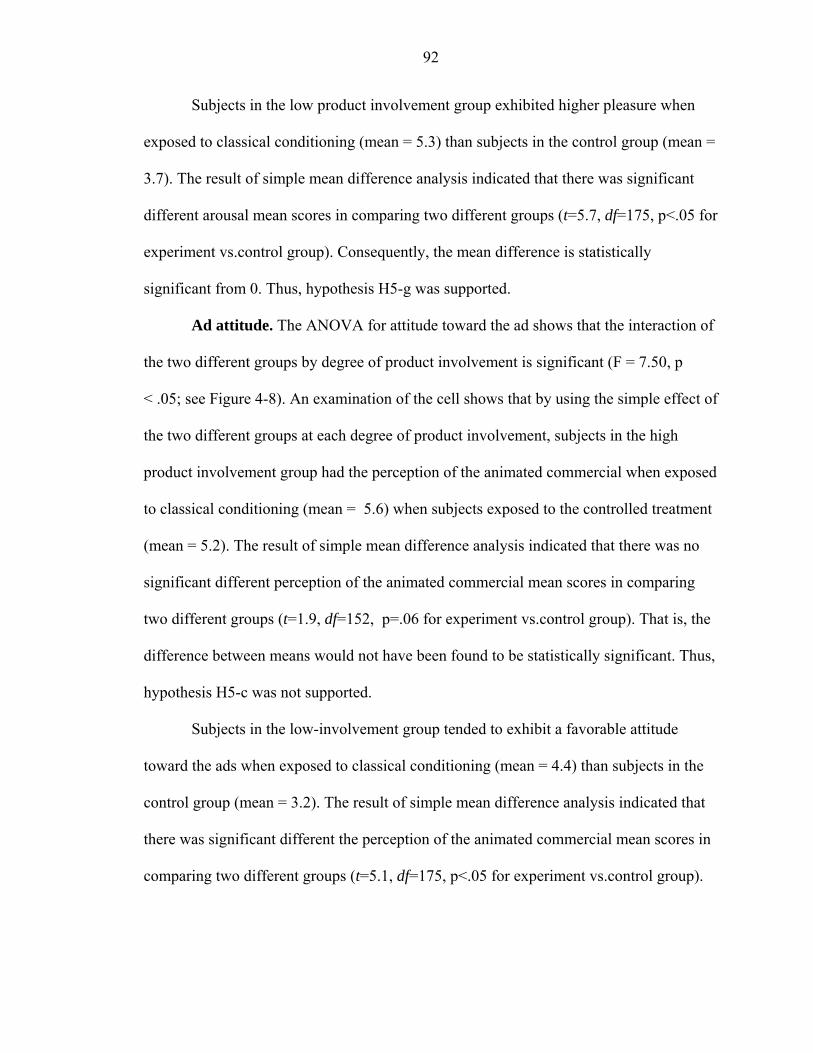
92
Subjects in the low product involvement group exhibited higher pleasure when
exposed to classical conditioning (mean = 5.3) than subjects in the control group (mean =
3.7). The result of simple mean difference analysis indicated that there was significant
different arousal mean scores in comparing two different groups (t=5.7, df=175, p<.05 for
experiment vs.control group). Consequently, the mean difference is statistically
significant from 0. Thus, hypothesis H5-g was supported.
Ad attitude. The ANOVA for attitude toward the ad shows that the interaction of
the two different groups by degree of product involvement is significant (F = 7.50, p
< .05; see Figure 4-8). An examination of the cell shows that by using the simple effect of
the two different groups at each degree of product involvement, subjects in the high
product involvement group had the perception of the animated commercial when exposed
to classical conditioning (mean = 5.6) when subjects exposed to the controlled treatment
(mean = 5.2). The result of simple mean difference analysis indicated that there was no
significant different perception of the animated commercial mean scores in comparing
two different groups (t=1.9, df=152, p=.06 for experiment vs.control group). That is, the
difference between means would not have been found to be statistically significant. Thus,
hypothesis H5-c was not supported.
Subjects in the low-involvement group tended to exhibit a favorable attitude
toward the ads when exposed to classical conditioning (mean = 4.4) than subjects in the
control group (mean = 3.2). The result of simple mean difference analysis indicated that
there was significant different the perception of the animated commercial mean scores in
comparing two different groups (t=5.1, df=175, p<.05 for experiment vs.control group).
93
Consequently, the mean difference is statistically significant from 0. Thus hypothesis H5-
h was supported.
Brand attitude. The ANOVA for brand attitude shows that the interaction of two
different groups by degree of involvement is significant (F = 5.32, p < .05; see Figure 4-
9). An examination of the cell means that by using the simple effect of the two different
groups at each degree of product involvement, the subjects in the high product
involvement group had a more favorable attitude toward the brand when exposed to
classical conditioning (mean = 5.4) than subjects in the control group (mean = 4.9). The
result of simple mean difference analysis indicated that there was significant different
perception of the advertised brand mean scores in comparing two different groups (t=3.0,
df=152, p<.05 for experiment vs.control group). Thus, hypothesis H5-d was supported.
For low product involvement, subjects in the low product involvement group
tended to exhibit a favorable attitude toward the ads when exposed to classical
conditioning (mean = 4.2) compared to subjects in the control group (mean = 3.0). The
result of simple mean difference analysis indicated that there was significant different the
perception of the advertised brand mean scores in comparing two different groups (t=5.3,
df=175, p<.05 for experiment vs.control group). Consequently, the mean difference is
statistically significant from 0. Thus, hypothesis H5-i was supported.
Purchase intent. The analysis of variance shows that the interaction of
commercial types by degree of product involvement was not statistical significant (F =
3.76 p=.053; see Figure 4-10). An examination of the cell means that by using the simple
effect of the two different groups at each degree of involvement, subjects in the high
product involvement group had a more favorable purchase intention when exposed to
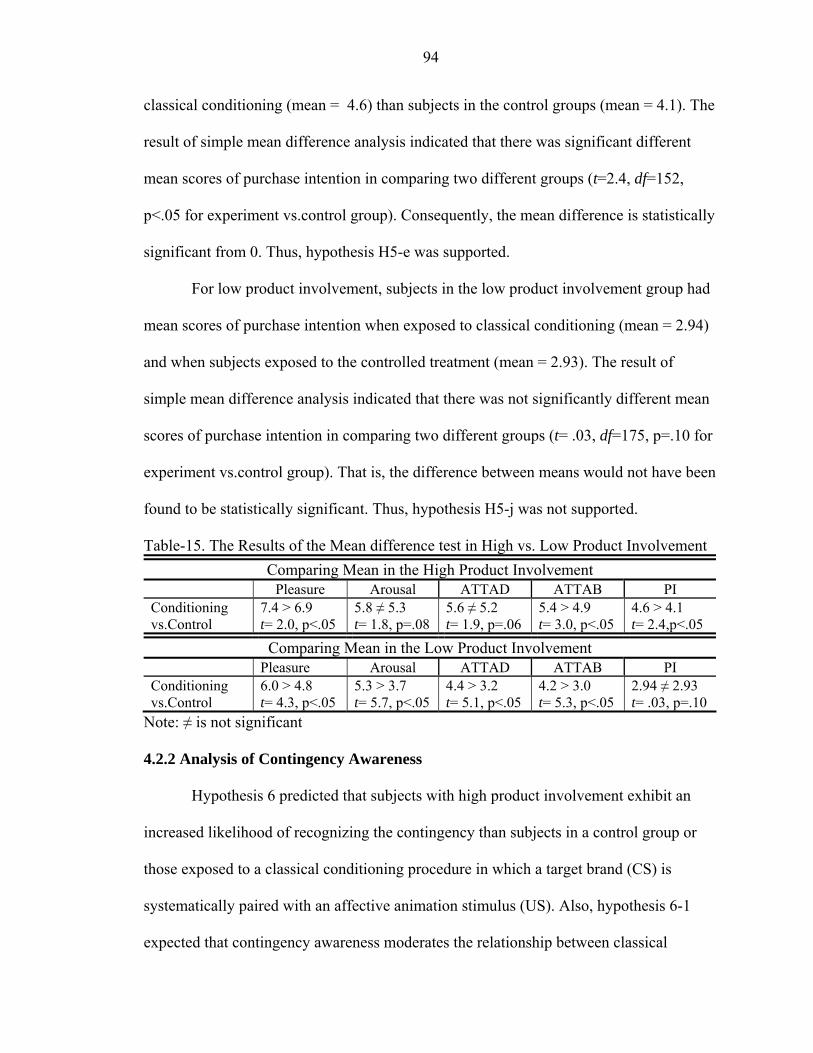
94
classical conditioning (mean = 4.6) than subjects in the control groups (mean = 4.1). The
result of simple mean difference analysis indicated that there was significant different
mean scores of purchase intention in comparing two different groups (t=2.4, df=152,
p<.05 for experiment vs.control group). Consequently, the mean difference is statistically
significant from 0. Thus, hypothesis H5-e was supported.
For low product involvement, subjects in the low product involvement group had
mean scores of purchase intention when exposed to classical conditioning (mean = 2.94)
and when subjects exposed to the controlled treatment (mean = 2.93). The result of
simple mean difference analysis indicated that there was not significantly different mean
scores of purchase intention in comparing two different groups (t= .03, df=175, p=.10 for
experiment vs.control group). That is, the difference between means would not have been
found to be statistically significant. Thus, hypothesis H5-j was not supported.
Table-15. The Results of the Mean difference test in High vs. Low Product Involvement Comparing Mean in the High Product Involvement
Pleasure Arousal ATTAD ATTAB PI Conditioning vs.Control
7.4 > 6.9 t= 2.0, p<.05
5.8 ≠ 5.3 t= 1.8, p=.08
5.6 ≠ 5.2 t= 1.9, p=.06
5.4 > 4.9 t= 3.0, p<.05
4.6 > 4.1 t= 2.4,p<.05
Comparing Mean in the Low Product Involvement Pleasure Arousal ATTAD ATTAB PI Conditioning vs.Control
6.0 > 4.8 t= 4.3, p<.05
5.3 > 3.7 t= 5.7, p<.05
4.4 > 3.2 t= 5.1, p<.05
4.2 > 3.0 t= 5.3, p<.05
2.94 ≠ 2.93 t= .03, p=.10
Note: ≠ is not significant
4.2.2 Analysis of Contingency Awareness
Hypothesis 6 predicted that subjects with high product involvement exhibit an
increased likelihood of recognizing the contingency than subjects in a control group or
those exposed to a classical conditioning procedure in which a target brand (CS) is
systematically paired with an affective animation stimulus (US). Also, hypothesis 6-1
expected that contingency awareness moderates the relationship between classical
95
conditioning procedures and attitudes toward the ad, target brand (CS), and purchase
intention.
The objective of this analysis was to identify perceptions people have of animated
commercials that differ significantly between high and low product involvement and
between two groups. Because the dependent variable, contingency awareness, was a two-
categorical variable, a binary logit analysis was the appropriate technique. These
variables were expected to differentiate between high and low product involvement and
between groups. Contingency awareness was coded 0 f it was corrected and 1if it was not
corrected.
As shown Table 4-16, 4-17 and 4-18, the contingency awareness data were
analyzed by logistic regression. The analysis was conducted with degree of involvement,
and the interaction between the two as predictors. The logistic analysis revealed that the
two-way interaction between two different groups and the degree of product involvement
was predicted to lead to contingency awareness in this study. Contingency awareness was
supported by a significant two-way interaction (β = 2.12, Wald / χ2= 33.8, p < .05 for two
groups; β = .729, Wald / χ2= 5.08, p < .05 for degree of product involvement). The t-test
indicted that three were a significant group difference between comparing classical vs.
controlled treatment in the high product involvement group (χ2= 2.6, p<.05) and in the
low product involvement group (χ2= 6.8, p<.05). Thus, hypotheses 6 and 6-1 were
supported.
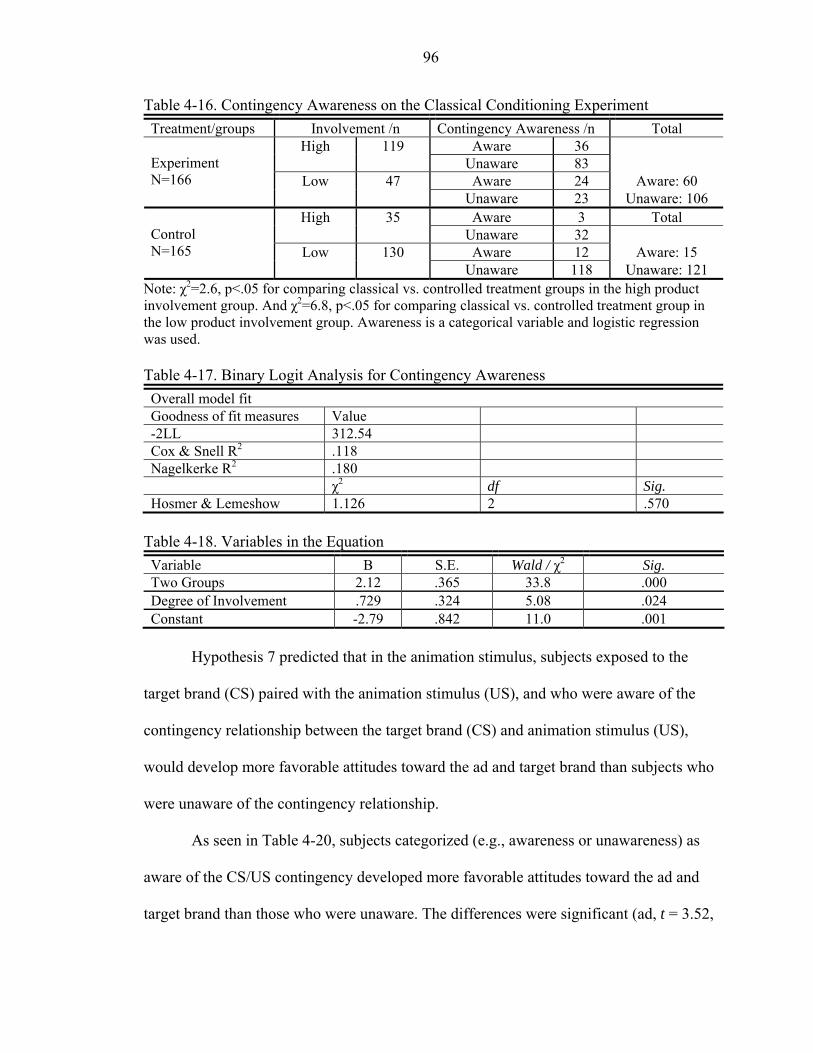
96
Table 4-16. Contingency Awareness on the Classical Conditioning Experiment Treatment/groups Involvement /n Contingency Awareness /n Total
Aware 36 High 119 Unaware 83 Aware 24 Aware: 60
Experiment N=166 Low 47
Unaware 23 Unaware: 106 Aware 3 Total High 35
Unaware 32 Aware 12 Aware: 15
Control N=165 Low 130
Unaware 118 Unaware: 121 Note: χ2=2.6, p<.05 for comparing classical vs. controlled treatment groups in the high product involvement group. And χ2=6.8, p<.05 for comparing classical vs. controlled treatment group in the low product involvement group. Awareness is a categorical variable and logistic regression was used. Table 4-17. Binary Logit Analysis for Contingency Awareness Overall model fit Goodness of fit measures Value -2LL 312.54 Cox & Snell R2 .118 Nagelkerke R2 .180 χ2 df Sig. Hosmer & Lemeshow 1.126 2 .570
Table 4-18. Variables in the Equation Variable B S.E. Wald / χ2 Sig. Two Groups 2.12 .365 33.8 .000 Degree of Involvement .729 .324 5.08 .024 Constant -2.79 .842 11.0 .001
Hypothesis 7 predicted that in the animation stimulus, subjects exposed to the
target brand (CS) paired with the animation stimulus (US), and who were aware of the
contingency relationship between the target brand (CS) and animation stimulus (US),
would develop more favorable attitudes toward the ad and target brand than subjects who
were unaware of the contingency relationship.
As seen in Table 4-20, subjects categorized (e.g., awareness or unawareness) as
aware of the CS/US contingency developed more favorable attitudes toward the ad and
target brand than those who were unaware. The differences were significant (ad, t = 3.52,
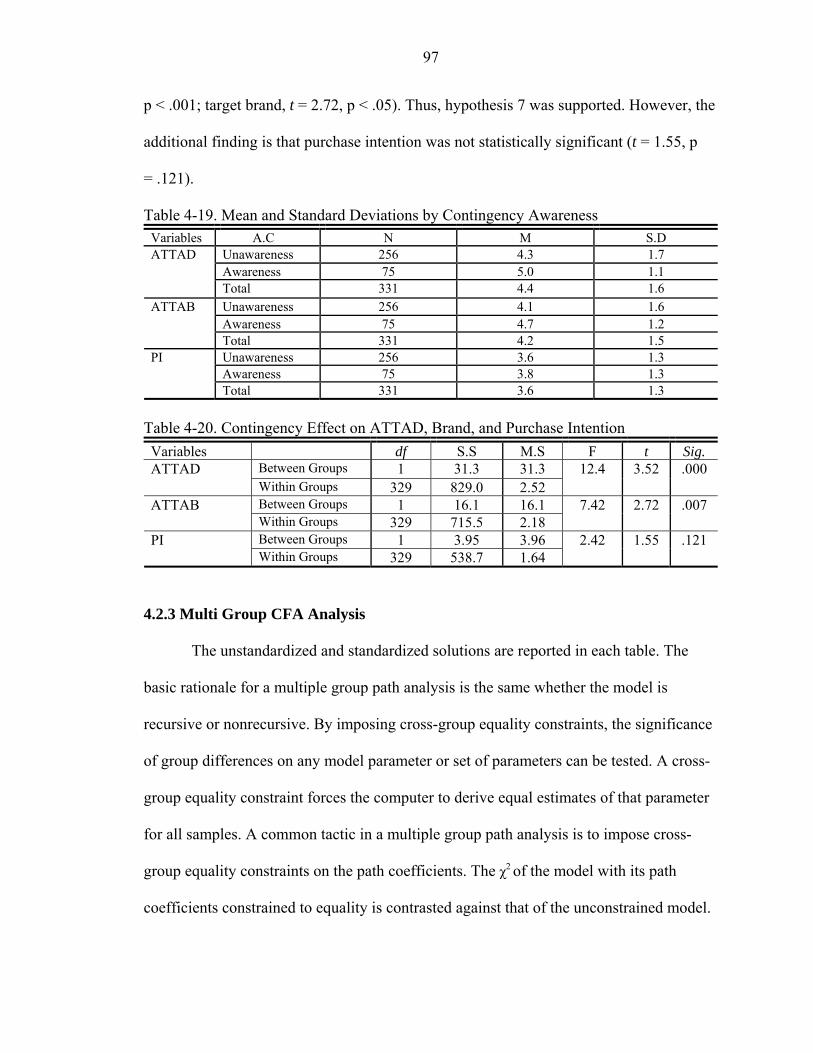
97
p < .001; target brand, t = 2.72, p < .05). Thus, hypothesis 7 was supported. However, the
additional finding is that purchase intention was not statistically significant (t = 1.55, p
= .121).
Table 4-19. Mean and Standard Deviations by Contingency Awareness Variables A.C N M S.D
Unawareness 256 4.3 1.7 Awareness 75 5.0 1.1
ATTAD
Total 331 4.4 1.6 Unawareness 256 4.1 1.6 Awareness 75 4.7 1.2
ATTAB
Total 331 4.2 1.5 Unawareness 256 3.6 1.3 Awareness 75 3.8 1.3
PI
Total 331 3.6 1.3 Table 4-20. Contingency Effect on ATTAD, Brand, and Purchase Intention Variables df S.S M.S F t Sig.
Between Groups 1 31.3 31.3 ATTAD Within Groups 329 829.0 2.52
12.4 3.52 .000
Between Groups 1 16.1 16.1 ATTAB Within Groups 329 715.5 2.18
7.42 2.72 .007
Between Groups 1 3.95 3.96 PI Within Groups 329 538.7 1.64
2.42 1.55 .121
4.2.3 Multi Group CFA Analysis
The unstandardized and standardized solutions are reported in each table. The
basic rationale for a multiple group path analysis is the same whether the model is
recursive or nonrecursive. By imposing cross-group equality constraints, the significance
of group differences on any model parameter or set of parameters can be tested. A cross-
group equality constraint forces the computer to derive equal estimates of that parameter
for all samples. A common tactic in a multiple group path analysis is to impose cross-
group equality constraints on the path coefficients. The χ2 of the model with its path
coefficients constrained to equality is contrasted against that of the unconstrained model.
98
If the relative fit of the constrained model is much worse than that of the unconstrained
model, the direct effects differ across the groups (Kline1998, p.183).
To check whether these indexes of overall model fit were causing more specific
effects, modification indexes were included and univariate Lagrange multipleiers were
derived to test group differences on each of the three or nine path coefficients. When a
model is analyzed across multiple groups with equality constraints, values of
modification indexes estimate the amount by which the overall χ2 would decrease if the
associated parameter was estimated freely in each sample. Statistical significance of a
modification index thus indicates a group difference on that parameter. Values of
modification indexes for this analysis are reported in each table and they indicate a
significant group difference on the cognition conation path and another that falls just
short of significance (p = .005) on the affection conation path. To investigate group
differences further, each of the seven path coefficients were derived separately within
each group in subsequent runs with a model-fitting program; these values are also
reported in the table18. Based on modification indexes, we can deduce that animated
stimuli plays a larger role for the experiment group than for the control group (Kline1998,
p.184).
A multiple group analysis can be conducted with either recursive or nonrecursive
path models. The simplest way to conduct a multi-sample path analysis is to estimate the
model separately for each group and then compare the unstandardized solutions. A more
formal way is to use a model-fitting program that imposes equality constraints on
parameter estimates across the groups. A common practice is to impose cross-group
equality constraints only on the path coefficients; values of other parameters (e.g.,
99
variances of the exogenous variables) are freely estimated with each sample. Tests of the
significance for each constrained parameter indicate whether the fit of the constrained
model is worse than the fit of the model without that constraint. If so, then a significant
group difference on that parameter is indicated. If several such results are found, then
whatever variable is represented by group membership may moderate the effects
represented in the path model (Kline1998, p.184).
RQ2 asked if the tripartite attitudinal model could be explained in classical
conditioning when using animated commercial stimuli, and if there were different values
of the tripartite attitudinal model between experiment and control groups. The tripartite
attitudinal dimensions could be applied in classical conditioning research and lead to
understandings about consumer purchase behavior when consumers are exposed to
animated commercial stimuli. Will different values of the tripartite attitudinal model be
existed in between experiments and control groups and two different product
involvement groups?
The study was attempted to test the hypothesis by using multi-group analyses.
The multi-group exploratory procedure, EQS 5,7b for Windows (Bentler 1994), was
performed for a simultaneous estimation of the measurement and structural model and
because it allowed for analyzing several relationships simultaneously. Multi-group
analyses follow the steps suggested by Kline (1998) before comparing the measurement
model and structural model in each group. Then, the two-step approach was employed to
test each measurement model. Covariance matrices for each group were submitted to a
model fitting program for a multi-group CFA.
100
Assumption check. Before constructing the measurement and structural models,
several underlying assumptions for SEM were checked. The Skewness and Kurosis
values ± 2.58 (Hair et al. ,1998), variance inflation of factors (VIF) of four predictor
variables less than 10.0, tolerance scores of the variables larger than .10, Eigenvalues
larger than .01, and condition indexes less than 100 were verified. Thus, the assumptions
were within acceptable boundaries.
For both groups, the psychometric properties (e.g., discriminant validity and
reliability) of measures were examined before a comparison of coefficients of each path
(Morris et al., 2002). Anderson and Gerbing (1988) suggested that all measurement
models should be examined by applying discriminant validity and convergent validity
before construct measurement and the structural model. In addition, the procedure
described by Fornell and Larker (1981) was used to assess the discriminant validity of the
measures. The average variance extracted ranged from .73 to .92 and the squared
correlation ranged from 0.11 to .50. As an indication of discriminant validity, the average
variance extracted for each construct was found to be higher than the squared correlation
between that construct and any other construct. Thus, the discriminant validity was
established in this model. An average variance extracted above .50 was appropriate to
suggest convergent validity. Therefore, the convergent validity was established for two
groups in this study.
Lagrange multiplier (LM) tests were used to improve significance by adding the
correlated errors terms (error covariances) and to decrease significance in fit by applying
a theoretical structural model (Bentler 1994). The two-step approach was used to test the

101
measurement model before estimating the structural relations between the variables
(Anderson and Gerbing 1988).
The values of selected fit indexes for the multisample analysis of the path model
with equality-constrainted direct effects are reported in Tables 4-20 and 4-21. The values
of the comparative fit index (CFI), Bentler-Bonett Normed (NFI), Bentler-Bonett
Nonormed (NNFI) were over .96; standardized RMR (SRMR) and root-mean-square
error of approximation (RMSEA) were satisfied with criteria (below .05 and .08)
respectively. Thus, it can be said that this model fit was acceptable.
The unstandardized and standardized solutions are reported in Tables 4-21 and 4-
22 as well as in Figure 4-11. Generally, the unstandardized path coefficients are
appropriate for between group comparisons. Also standardized path coefficients are
generally used to compare paths within groups. The basic rationale for a multiple group
path analysis is the same whether the model is recursive or nonrecursive. Statistical
significance of a modification index thus indicates a group difference on that parameter.
Values of modification indexes for this analysis are reported in Table 4-22 and they
indicate a significant group difference on cognition conation (p < .05) as well as on
affection conation (p < .05). Consequently, the hierarchical effect communication
model can be explained in a classical conditioning procedure when explaining consumer
attitude formation.
Within the two samples, all paths (e.g., cognition on affection and conation,
affection on conation) are statistically significant (p < .05). In addition, the
unstandardized path coefficients of cognition on affection in the classical conditioning
procedure (γ = .548) were lower than for the control group (γ = .721). The unstandardized
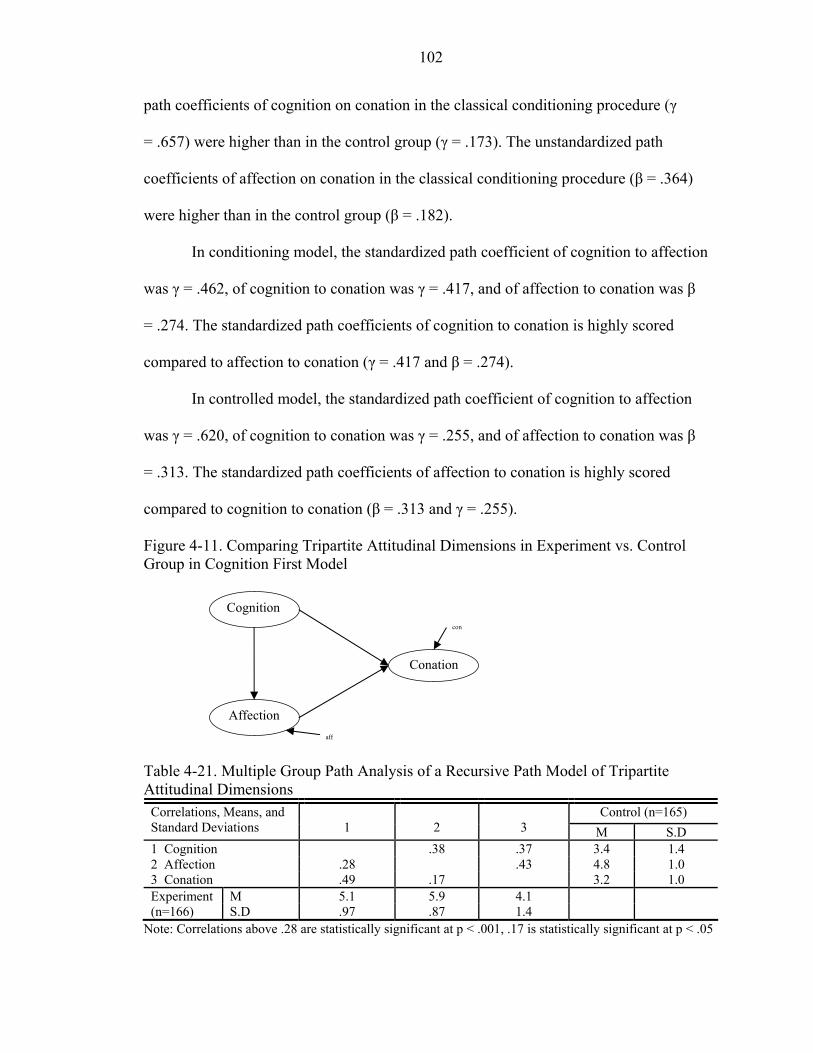
102
path coefficients of cognition on conation in the classical conditioning procedure (γ
= .657) were higher than in the control group (γ = .173). The unstandardized path
coefficients of affection on conation in the classical conditioning procedure (β = .364)
were higher than in the control group (β = .182).
In conditioning model, the standardized path coefficient of cognition to affection
was γ = .462, of cognition to conation was γ = .417, and of affection to conation was β
= .274. The standardized path coefficients of cognition to conation is highly scored
compared to affection to conation (γ = .417 and β = .274).
In controlled model, the standardized path coefficient of cognition to affection
was γ = .620, of cognition to conation was γ = .255, and of affection to conation was β
= .313. The standardized path coefficients of affection to conation is highly scored
compared to cognition to conation (β = .313 and γ = .255).
Figure 4-11. Comparing Tripartite Attitudinal Dimensions in Experiment vs. Control Group in Cognition First Model
Table 4-21. Multiple Group Path Analysis of a Recursive Path Model of Tripartite Attitudinal Dimensions
Control (n=165) Correlations, Means, and Standard Deviations
1
2
3 M S.D
1 Cognition .38 .37 3.4 1.4 2 Affection .28 .43 4.8 1.0 3 Conation .49 .17 3.2 1.0 Experiment M 5.1 5.9 4.1 (n=166) S.D .97 .87 1.4
Note: Correlations above .28 are statistically significant at p < .001, .17 is statistically significant at p < .05
Cognition
Conation
Affection
con
aff
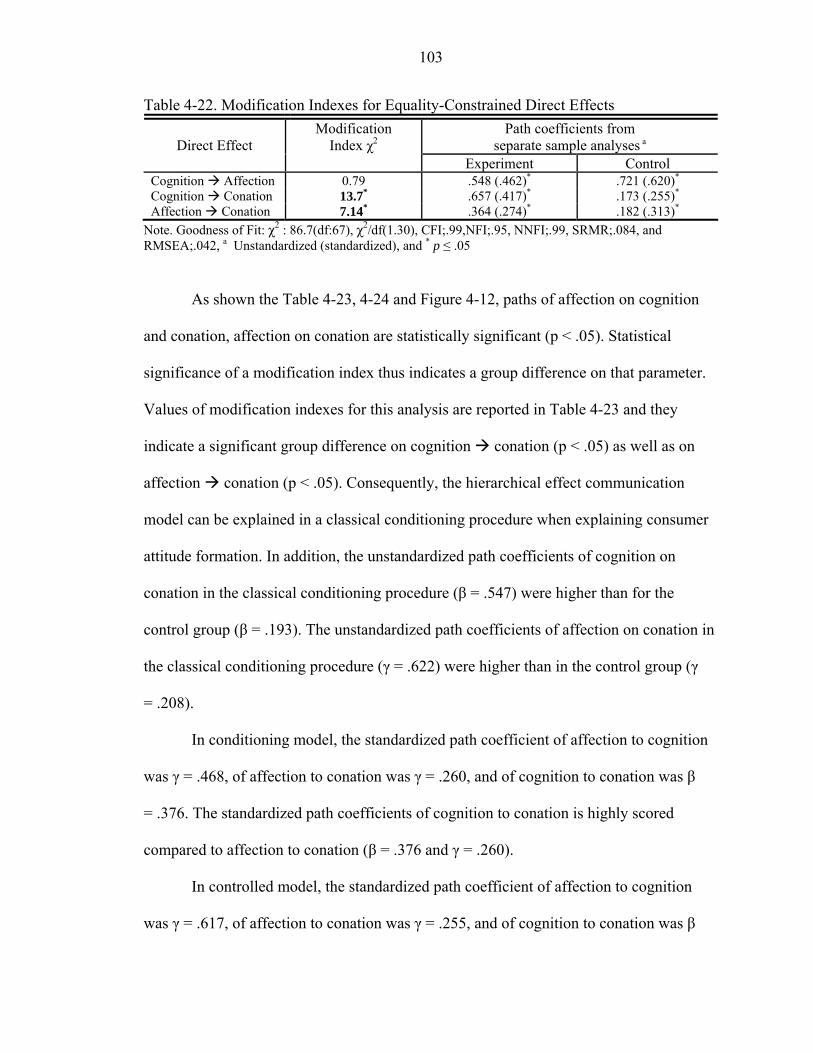
103
Table 4-22. Modification Indexes for Equality-Constrained Direct Effects Path coefficients from
separate sample analyses a
Direct Effect Modification
Index χ2 Experiment Control
Cognition Affection 0.79 .548 (.462)* .721 (.620)* Cognition Conation 13.7* .657 (.417)* .173 (.255)* Affection Conation 7.14* .364 (.274)* .182 (.313)*
Note. Goodness of Fit: χ2 : 86.7(df:67), χ2/df(1.30), CFI;.99,NFI;.95, NNFI;.99, SRMR;.084, and RMSEA;.042, a Unstandardized (standardized), and * p ≤ .05
As shown the Table 4-23, 4-24 and Figure 4-12, paths of affection on cognition
and conation, affection on conation are statistically significant (p < .05). Statistical
significance of a modification index thus indicates a group difference on that parameter.
Values of modification indexes for this analysis are reported in Table 4-23 and they
indicate a significant group difference on cognition conation (p < .05) as well as on
affection conation (p < .05). Consequently, the hierarchical effect communication
model can be explained in a classical conditioning procedure when explaining consumer
attitude formation. In addition, the unstandardized path coefficients of cognition on
conation in the classical conditioning procedure (β = .547) were higher than for the
control group (β = .193). The unstandardized path coefficients of affection on conation in
the classical conditioning procedure (γ = .622) were higher than in the control group (γ
= .208).
In conditioning model, the standardized path coefficient of affection to cognition
was γ = .468, of affection to conation was γ = .260, and of cognition to conation was β
= .376. The standardized path coefficients of cognition to conation is highly scored
compared to affection to conation (β = .376 and γ = .260).
In controlled model, the standardized path coefficient of affection to cognition
was γ = .617, of affection to conation was γ = .255, and of cognition to conation was β
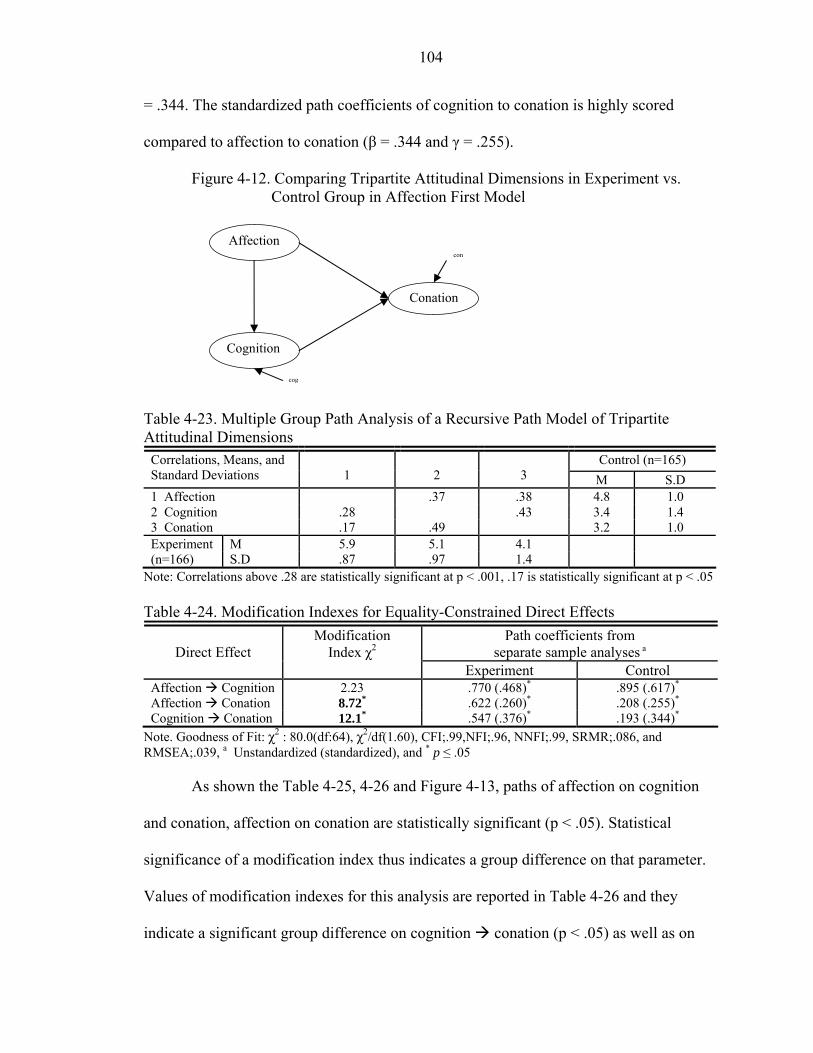
104
= .344. The standardized path coefficients of cognition to conation is highly scored
compared to affection to conation (β = .344 and γ = .255).
Figure 4-12. Comparing Tripartite Attitudinal Dimensions in Experiment vs. Control Group in Affection First Model
Table 4-23. Multiple Group Path Analysis of a Recursive Path Model of Tripartite Attitudinal Dimensions
Control (n=165) Correlations, Means, and Standard Deviations
1
2
3 M S.D
1 Affection .37 .38 4.8 1.0 2 Cognition .28 .43 3.4 1.4 3 Conation .17 .49 3.2 1.0 Experiment M 5.9 5.1 4.1 (n=166) S.D .87 .97 1.4
Note: Correlations above .28 are statistically significant at p < .001, .17 is statistically significant at p < .05 Table 4-24. Modification Indexes for Equality-Constrained Direct Effects
Path coefficients from separate sample analyses a
Direct Effect
Modification Index χ2
Experiment Control Affection Cognition 2.23 .770 (.468)* .895 (.617)* Affection Conation 8.72* .622 (.260)* .208 (.255)* Cognition Conation 12.1* .547 (.376)* .193 (.344)*
Note. Goodness of Fit: χ2 : 80.0(df:64), χ2/df(1.60), CFI;.99,NFI;.96, NNFI;.99, SRMR;.086, and RMSEA;.039, a Unstandardized (standardized), and * p ≤ .05
As shown the Table 4-25, 4-26 and Figure 4-13, paths of affection on cognition
and conation, affection on conation are statistically significant (p < .05). Statistical
significance of a modification index thus indicates a group difference on that parameter.
Values of modification indexes for this analysis are reported in Table 4-26 and they
indicate a significant group difference on cognition conation (p < .05) as well as on
Affection
Conation
Cognition
cog
con
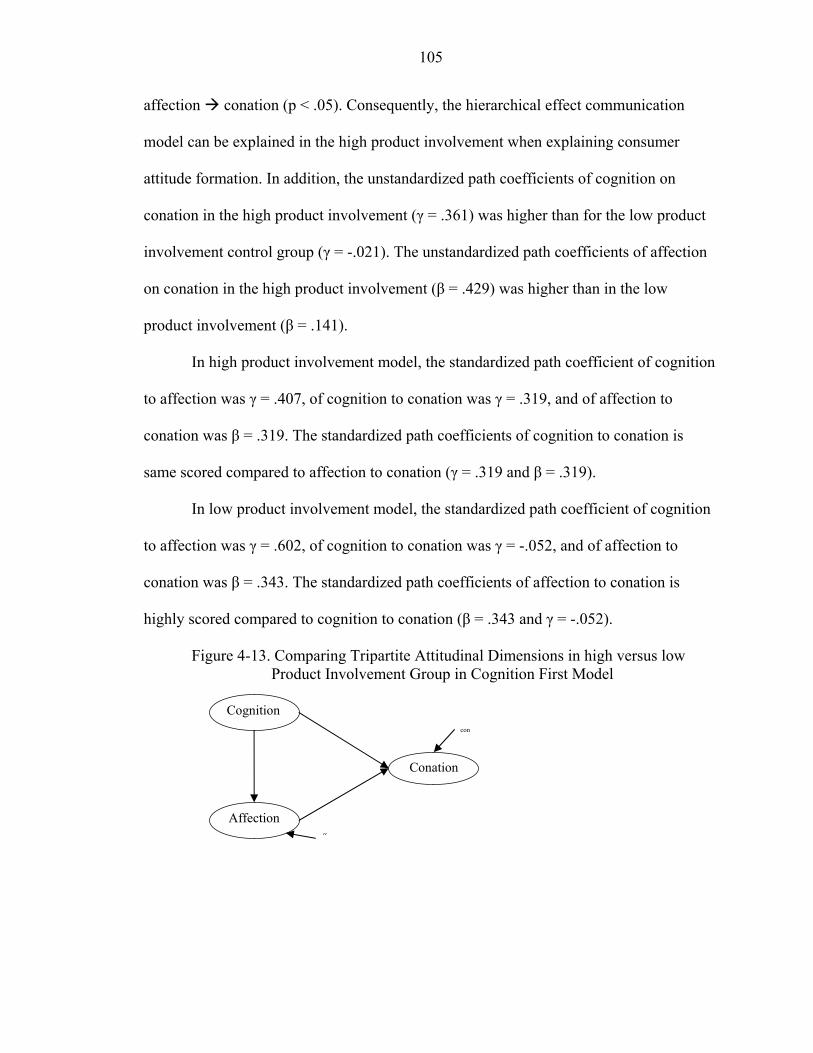
105
affection conation (p < .05). Consequently, the hierarchical effect communication
model can be explained in the high product involvement when explaining consumer
attitude formation. In addition, the unstandardized path coefficients of cognition on
conation in the high product involvement (γ = .361) was higher than for the low product
involvement control group (γ = -.021). The unstandardized path coefficients of affection
on conation in the high product involvement (β = .429) was higher than in the low
product involvement (β = .141).
In high product involvement model, the standardized path coefficient of cognition
to affection was γ = .407, of cognition to conation was γ = .319, and of affection to
conation was β = .319. The standardized path coefficients of cognition to conation is
same scored compared to affection to conation (γ = .319 and β = .319).
In low product involvement model, the standardized path coefficient of cognition
to affection was γ = .602, of cognition to conation was γ = -.052, and of affection to
conation was β = .343. The standardized path coefficients of affection to conation is
highly scored compared to cognition to conation (β = .343 and γ = -.052).
Figure 4-13. Comparing Tripartite Attitudinal Dimensions in high versus low Product Involvement Group in Cognition First Model
Cognition
Conation
Affection
con
aff
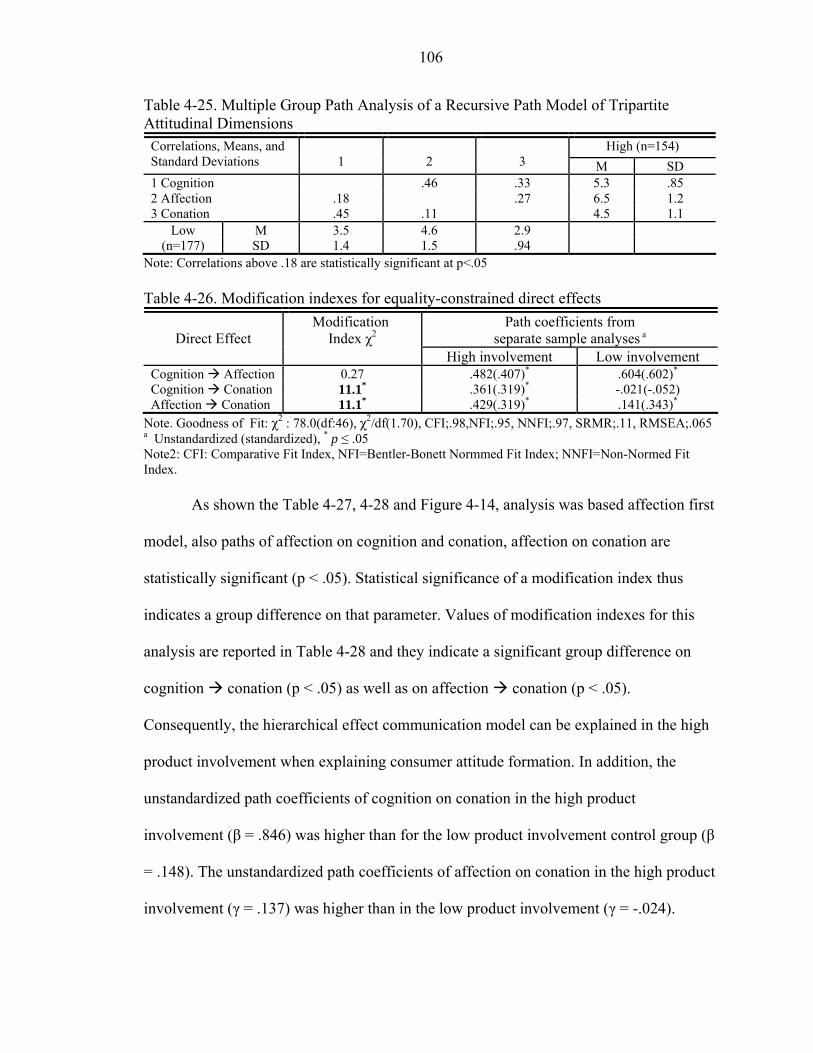
106
Table 4-25. Multiple Group Path Analysis of a Recursive Path Model of Tripartite Attitudinal Dimensions
High (n=154) Correlations, Means, and Standard Deviations
1
2
3 M SD
1 Cognition .46 .33 5.3 .85 2 Affection .18 .27 6.5 1.2 3 Conation .45 .11 4.5 1.1
Low M 3.5 4.6 2.9 (n=177) SD 1.4 1.5 .94
Note: Correlations above .18 are statistically significant at p<.05 Table 4-26. Modification indexes for equality-constrained direct effects
Path coefficients from separate sample analyses a
Direct Effect
Modification Index χ2
High involvement Low involvement Cognition Affection 0.27 .482(.407)* .604(.602)* Cognition Conation 11.1* .361(.319)* -.021(-.052) Affection Conation 11.1* .429(.319)* .141(.343)*
Note. Goodness of Fit: χ2 : 78.0(df:46), χ2/df(1.70), CFI;.98,NFI;.95, NNFI;.97, SRMR;.11, RMSEA;.065 a Unstandardized (standardized), * p ≤ .05 Note2: CFI: Comparative Fit Index, NFI=Bentler-Bonett Normmed Fit Index; NNFI=Non-Normed Fit Index.
As shown the Table 4-27, 4-28 and Figure 4-14, analysis was based affection first
model, also paths of affection on cognition and conation, affection on conation are
statistically significant (p < .05). Statistical significance of a modification index thus
indicates a group difference on that parameter. Values of modification indexes for this
analysis are reported in Table 4-28 and they indicate a significant group difference on
cognition conation (p < .05) as well as on affection conation (p < .05).
Consequently, the hierarchical effect communication model can be explained in the high
product involvement when explaining consumer attitude formation. In addition, the
unstandardized path coefficients of cognition on conation in the high product
involvement (β = .846) was higher than for the low product involvement control group (β
= .148). The unstandardized path coefficients of affection on conation in the high product
involvement (γ = .137) was higher than in the low product involvement (γ = -.024).

107
In high product involvement model, the standardized path coefficient of affection
to cognition was γ = .500, of affection to conation was γ = .090, and of cognition to
conation was β = .597. The standardized path coefficients of cognition to conation is
highly scored compared to affection to conation (β = .597 and γ = .090).
In low product involvement model, the standardized path coefficient of affection
to cognition was γ = .602, of affection to conation was γ = -.052, and of cognition to
conation was β = .343. The standardized path coefficients of cognition to conation is
highly scored compared to affection to conation (β = .343 and γ = -.052).
Figure 4-14. Comparing Tripartite Attitudinal Dimensions in high and low Product Involvement Group in Affection First Model
Table 4-27. Multiple Group Path Analysis of a Recursive Path Model of Tripartite Attitudinal Dimensions
High (n=154) Correlations, Means, and Standard Deviations
1
2
3 M SD
1 Affection .33 .46 6.5 1.2 2 Cognition .45 .27 5.3 .85 3 Conation .18 .11 4.5 1.1
Low M 4.6 3.5 2.9 (n=177) SD 1.5 1.4 .94
Note: Correlations above .18 are statistically significant at p<.05 Table 4-28. Modification indexes for equality-constrained direct effects
Path coefficients from separate sample analyses a
Direct Effect
Modification Index χ2
High involvement Low involvement Affection Cognition 2.45 .541(.500) .650(.602)* Affection Conation 11.3* .137(.090)* -.024(-.052) Cognition Conation 14.0* .846(.597)* .148(.343)*
Note. Goodness of Fit: χ2 : 99.6(df:47), χ2/df(2.11), CFI;.97,NFI;.93, NNFI;.94, SRMR;.12, RMSEA;.082 a Unstandardized (standardized) / * p ≤ .05
Affection
Conation
Cognition
con
cog
108
CHAPTER 5 DISCUSSION
5-1 Discussion of Experiment 1
The first experiment examined the relationship between exposure to animated
stimuli and responses to subsequent ad (e.g., emotional responses, attitudes toward the
ads, brand, purchase intention, and ad recall). An experimental design was used to
determine if there were significant group differences in cognition, affection, and conation.
The experiment measured four sub-categories—dependent variables; attitude toward the
advertising, brand attitude, purchaser intention, and advertising recall,—for clay and
cartoon animated commercials as well as live action based commercial.
Structural equation modeling tested whether the hierarchical communication
effect model in the three types of diversely formatted commercials (e.g., clay, cartoon
and live action) could be explained differently in cognitive and affective responses, and
whether the clay animation commercial drove viewers to different cognition, affection,
and conation responses.
Hypothesis 1 predicted that when subjects are highly involved with the product,
exposure to live action formatted commercial results in higher pleasure, arousal, a
favorable attitude toward the ad, brand, and purchase intention compared subjects
exposed to clay animated and cartoon commercials. Also, exposure to clay animated
commercial resulted in hypotheses higher pleasure and arousal as well as a more
favorable attitude toward the ad, brand and purchase intention compared to exposure to
cartoon commercial.
109
The results for the pleasure dimensions indicated that there were no difference
among consumer pleasure and arousal as emotional responses to three different
commercials such as live action based, clay animation and cartoon animated commercials
in high product involvement.
Product involvement should be stronger when a consumer perceives a strong
association between the product’s image and attributes, and the consumer’s own personal
goals and values (Celsi and Olsn 1988). This means that the consumers who are highly
involved with the product are more likely to obtain the satisfaction or seek personal value
from the product.
The pleasure was for the purpose of this study considered as people’s emotion
status such as joy, pride, affection, and gratitude. Also arousal was usually measured by
the level of intensity or involvement vis-à-vis these feeling. As Lazarus (1991) pointed
out that pleasure is transformed into emotional distress or satisfaction only as a result of
appraisals of their significance. Pleasure can be caused by a number of concrete, specific
physical stimuli whose capacity to product these sensory reactions is innate. The results
of this study implied that consumers who are highly involved with the product have a
tendency to seek pleasure through product information in commercials rather than
pursuing their pleasure through different advertising formats.
There were no differences among the perception of arousal to three different
commercials in high product involvement. Some scholars argued that the arousal
dimension is related to the vigor of the behavioral disposition that is currently active and
can range from a level of extreme emergency to that of calm expediency (Bradley et al.
1992, p.388). It can be interpreted that the consumer arousal system is related with
110
advertising stimuli which influence on consumer arousal as well as arousal plays as the
preposition of behavior. Consequently consumers arousal system might be more affected
by other advertising elements (e.g., background music, appeal techniques, etc.) than
evoking their arousal through different advertising formats when they are highly involved
with the product.
Regarding attitude toward the commercial, the results revealed that consumers
who are highly involved with the product had a more positive perception of commercials
when exposed to non-animated commercials (i.e., with human actors) than two different
animated commercials. Consumers, who are highly involved with the product, are more
likely to respond to live action based commercials than animated commercials.
Consumers who have a favorable perception of the ad are more likely to rely on the
reality based ads including real visual and image motion as compared to other ad formats.
Concerning attitude toward the brand, the result of this study implied that
consumer highly involved with the product are more likely to have a positive perception
of the brand when exposed to live action based commercial as compared to exposure to
other commercials. The results can be explained in that the perception of the brand in
high product involvement is closely related to reality what human can made from live
action formatted commercial. Animation in commercials allows us to create imagination,
consumer evaluation of the brand could be enhanced by considering their cognitive
processing of the product. Consumer attitude toward the brand results from their careful
attempts to comprehend and evaluate the brand-relevant content of the ads.
Purchase behavior was not differentially affected when comparing consumer
exposure to human based versus clay-animated commercials. Consumers highly involved
111
with the product have a more favorable purchase intention when exposed to live action
and clay animated commercials than when exposed to cartoon animated commercial.
Consumers simply identify with human actors more than they do with imaginary actors,
and will tend to mimic the former’s purchase behavior more.
Hypothesis 2 predicted that subjects who have lower product involvement exhibit
higher arousal, a favorable attitude toward the ad, brand and purchase intention compared
to subjects exposed to cartoon and live action commercials. However, subjects who were
exposed to live-action-based commercial exhibited higher pleasure compared to those
who exposed to clay animated and cartoon commercials. When compared to exposure to
cartoon commercial, exposure to clay animated commercial resulted in higher pleasure
and arousal as well as a more favorable attitude toward the ad, brand, and purchase
intention.
Live action based versus clay animation based commercial did not differentially
affect consumer pleasure in their product involvement. Consumers who are exposed to
live action based commercial experience higher pleasure than when exposed to cartoon
animated commercial. In addition, clay animation is better than cartoon at evoking
consumer pleasure. Consumers with low product involvement experienced higher arousal
when exposed to clay animated commercial than when exposed to live action and cartoon
commercials. This finding is associated with Gorn’s (1982) study, which found that
consumers who have low product involvement are more likely to respond to background,
characters, pleasant visual scenery and motion in commercials. Moreover, emotional
responses can be better explained in low involvement situations because individuals who
112
are highly involved with the product have tendency to respond to affective stimuli in
advertising (Gorn 1982).
The ELM model can be useful in explaining that people who are exposed to the
affective stimuli in commercials follow a peripheral processing route because these
elements requires less cognitive efforts on viewer’s part. Clay animation’s can produce a
unique style of image motion and movement, and, therefore, could be an effective design
tool to capture viewers’ attention and affected viewers’ arousal and pleasure. In low
involvement with the product, the consumer arousal system is more affected by design
components in commercials.
Comparing clay animation versus live action based commercials in consumer
attitude formation, there were no difference in attitude toward the ad, brand and purchase
intention. Consumers recognized clay animation as an effective advertising design tool
because clay animation is produced by using real image motion from human resource in
real world.
Consumers with low product involvement had a positive perception of animated
commercials when exposed to clay animated and live action commercials than when
exposed to cartoon commercial. Clay animation and live action based commercial could
be an effective advertising format for increasing consumer perception of commercial with
low product involvement. Consumers are more likely to form their reality-based attitude
in response to clay animation which captures strong image motion like the live action,
which can be made in live action commercials.
Consumers with low product involvement had a more favorable attitude toward
the brand when exposed to the clay animated and live action commercials than when
113
exposed to cartoon commercials. Clay animation and live action formatted commercial
could be an effective advertising format for increasing the consumer attribution of
commercial with low product involvement. When consumers evaluate brand, they were
more likely to consider advertising components such as the motion-based reality.
Consumers with low product involvement had a more favorable purchase
intention when exposed to the clay animated and live action commercials than when
exposed to cartoon commercials. Clay animation and live action based commercial could
be an effective advertising format for increasing the likelihood of purchase with low
product involvement.
Comparing clay animation versus live action based commercials, consumer
responses were rarely different. Furniss (2006) noted that clay animation can be better at
reproducing authentic human-like incremental movement and the illusion of unbroken
motion. Clay animation, as is a means of creating a complete re-presentation of reality
(Wilson 2005) because it can re-produce the true nature of what we are seeing on screen
Therefore, the well-designed clay animation can decrease gaps when reality simply
doesn’t look real enough.
As discussed earlier, affective stimuli (e.g., background music, pleasant visual
scenes, characters, and images) in an advertisement follow a peripheral processing route,
as these elements require less cognitive effort on the viewer’s part. Because animated
stimuli rely heavily on these more aesthetic factors, animated stimuli would be more
effective working under the lower-level peripheral processing routes on viewer
persuasion. And, consumer emotional responses, perception of animated commercial and
purchase likelihood can be maximized when using clay animated stimuli because clay
114
animation is considered as the well-liked advertising design elements. It can affect
consumer information processing by creating positive emotional responses, increasing the
memory of elements used in commercials, and creating a favorable judgment of the
advertising message.
As Hypothesis 3 predicted, when consumers exhibited increased ad recall when
they are exposed to clay animation than when exposed to live action based commercial
and cartoon based commercial with both high and low product involvement. Clay
animation more effectively works to affect to consumer memory.
Traditional involvement theory would suggest higher involvement leads to
increased memory for advertising message due to an elaborately processed ad message,
and such increased ad recall, in turn, leads to enduring consumer attitudes toward the ad
and brand (Gardner et al. 1985; Petty et al. 1983). Also some scholars argue that the high
product involvement could produce better ad recall than the low product involvement
(Briggs and Hollis 1997). However, this study suggests that ad recall is affected by
advertising styles and format. Animation in commercial had an important role in recalling
the ad. Also animated motion in advertising could be a better effective design tool to
capture consumer attention or influence consumer memory.
Given animation terminology refers to the medium as a means of creating a
complete re-presentation of reality (Wilson 2005), this finding suggest that animation
stimuli has a more powerful explanation consumer attitude formation and behavioral
action as much as real human when peoples are exposed to pleasant scenery in
commercials. In other words, evidence from this study, animation is used to fill in the
115
gaps when reality simply doesn’t look real enough. The results of this study implied that
animation has a potential benefits in current movie and advertising industry.
The implication of the results is that clay animation has more evocable character
and image than those of cartoons because cartoons are made by the traditional two-
dimension technique. Clay animation in advertising is associated with the influence of
lower-level peripheral processing routes on viewer persuasion because animated stimuli
rely heavily on viewer’s aesthetic factors (Furniss 1998). Therefore, this study suggests
that production in film emphasizes the importance of incorporating appropriate motion in
commercials. Consequently, it can be implied that better-designed animation influences
consumer emotional responses, increasing their positive attitude formation.
The implication from the results of multi-group CFA analysis is that consumer
cognitive effort processing is higher than affective effort processing on behavioral
expectations. Higher cognitive processing is closely correlated to consumer subsequent
behavior when exposed to the commercials in this study. On the other hand, affective
processing is closely related with perception of ad.
In the second experiment, the animation effect could be discussed in the results of
the classical conditioning mechanism.
5.2 Discussion of Experiment 2
The traditional classical conditioning paradigm suggests that positive attitudes
toward an advertised product (i.e., a conditioned stimulus or CS) might develop through
its association in a commercial with other stimuli that are reacted to positively (i.e., an
unconditioned stimulus or US). Therefore, Experiment 2 anticipates that the animation
(US) can drive favorable attitudes toward the brand.
116
The impact of product information in a commercial on beliefs and attitudes would
typically be interpreted within an information processing framework. It is suggested here
that a classical conditioning framework could account for the potential impact of
background features, such as animation, on product attitudes.
Hypothesis 5 predicted that, regardless of product involvement, subjects would
exhibit positive emotional responses (e.g., pleasure, arousal), and attitude formation (e.g.,
a more favorable attitude toward the ad, brand, and purchase intention) than when
exposed to classical conditioning in which a target brand (CS) is systematically paired
with an affective animation stimulus (US) compared to a control group.
The findings from the classical conditioning study implied that consumer who are
exposed to the classical conditioning procedure are more likely to have higher pleasure
and arousal levels, and a positive attitude toward the animated commercial, and the brand,
and thus a more favorable purchase intention as compared to those of conditioning
controls in both high and low product involvement when using animation as stimuli. It
can be implied that the classical conditioning mechanism would be better explained under
the peripheral processing routes and low product categories, such as soft drinks when
using animation as affective stimuli. Also, the findings could be confirmed that animation
plays an important role in a classical conditioning paradigm.
This study suggests that a favorable attitude toward the advertised brand might
develop through the product association with animation stimuli, which consumers relate
in a positive manner. Animation used in this study also acts as the potential
unconditioned stimuli in commercials.

117
Hypothesis 6 predicted that in the animation stimulus, subjects exposed to the
target brand (CS) paired with the animation stimulus (US), and who are aware of the
contingency relationship between the target brand (CS) and animation stimulus (US),
would develop more favorable attitudes toward the ads and target brand than subjects
who are unaware of this contingency relationship. The results revealed that subjects
categorized as aware of the CS/US contingency developed more favorable attitudes
toward the ad and target brand than those who were unaware.
Awareness of the CS-US relationship is a necessary condition for classical
conditioning and contingency awareness exists when experimental subjects know that CS
and US have been related temporally in an experiment’s sequencing of these two events
(Shimp 1991, p.159). Assuming attitude formation is a cognitive process, contingency
awareness is considered as a prerequisite for successful attitude change (Allen and
Janiszewski 1989; Priluck and Till 2004; Shimp et al. 1991). Consistent with the above,
the findings of Allen and Janiszewski (1989) emphasize that classical conditioning
mechanism theory would agree that contingency awareness acts as a mediator in the
conditioning process. The findings of this study suggest that the role of awareness
become more important when subjects develop a positive attitude toward the animated
commercial and the target brand via their cognitive efforts. Also, a high level of
awareness occurs when subjects are highly involved with the product. The findings of
this study suggest that successful attitude formation via classical conditioning occurs
when participants are highly involved with the product. Such subjects are, thus, more
likely to generate attitude toward the animated commercial and the target brand.
118
The results of multi group CFA analysis in involvement and classical
conditioning suggest that animation in advertising would be effective working under a
classical conditioning mechanism. Also animation stimuli had an important role in high
product involvement. Consequently, the hierarchical effect communication model can be
explained in the classical conditioning procedure when explaining consumer attitude
formation. This finding from the results’ view of the animated commercial hierarchy is
implicitly a causal relationship from cognition to affect, and affect to conation in classical
and high product involvement groups.
The implication from the results of multi-group CFA analysis is that consumer
cognitive effort processing is higher than affective effort processing on behavioral
expectations in classical conditioning experiments. However, consumer affective
processing is higher than cognitive processing on behavioral expectations in conditioning
control group. Higher cognitive processing is closely correlated to consumer’s
subsequent behavior when exposed to systematic paring with stimuli and the brand in
experiment group. On the other hand, in the conditioning control group, affective effort is
an important factor in evaluating the animated ad and brand.
5.3 General Discussion
As discussed earlier, the motivation of the study was to examine the effects of
animation and its relationship to human cognitive and affective processes by categorizing
and using different type of animation featured in television commercials. This study
assessed the impact of animation in commercials through a series of classical
conditioning experiments.
119
People who have low product involvement are more likely to have a higher
arousal to animated commercials as well as a more favorable attitude toward the
animated commercial, and the advertised brand, and an increased purchase intention.
However, people who are highly involved with the product develop a less favorable
perception of animated commercials than live action based commercial. In addition, ad
recall was ranked in clay animation commercial compared to other two different types of
commercials in the first experiment. The results of multi-group CFA analysis revealed
that there was no significant group difference on each path regarding values of
modification indexes. The implication from this analysis is that the variation of cognition
and affection through conation as purchase behavior is rarely different across three
different commercial types when using animation as stimuli. This study suggests that
animation in commercials plays an important role in consumer attitude formation as
much as real human do when people are forming their attitude toward ad, brand and
behavior. The advertising format might affect consumer perception of an intangible asset
such as attitude toward the advertising and brand. Their purchase behaviors, however, are
affected by other factors such as product quality, and prior experience.
This study described the relationship between animated commercials and human
cognitive and affective processing through two different experiments. Given animated
commercials can more effectively provide visual demonstrations and recall testimonies
for products, this study confirmed that animated ads should take into account the
influence of lower-level peripheral processing routes on viewer persuasion.
Through evidence from the classical conditioning experiment, it can be confirmed
that the classical conditioning method would be more effective working under the
120
paradigm of low level personal relevance involvement toward the stimuli. This study
demonstrated that awareness leads to favorable perception of the ad about target
attributes and favorable brand attitudes. The experiment in this study re-established that
awareness is enhanced by involvement. In addition, involvement influences attitude
formation through classical conditioning procedures, with affect and belief formation
acting as mediators.
This paper suggests that the animation in commercials can influence consumer
perception of the brand and purchase behavior. It is argued that the positive emotions
they generate become associated with the advertised product through classical
conditioning. Animated commercials can aid viewers to stimulate or affect their
emotional responses and behavioral expectations. The use of animation in movie and
commercials is rapidly increasing in recent graphic interfaces because they motivate
consumer actions and draw viewer attention to specific product features.
Consumers tend to view commercials passively, since the information provided
induces less motivation to process (Hoyer and MacInnis 2001). The findings of this study
increase the possibility of interpreting how animated commercials affect consumer
attitudes via peripheral processing routes when using attractive or likable characters
combined with motion, humor, and pleasant music in low product involvement categories
(e.g., soft drinks, etc.). The results are associated with previous research on the classical
conditioning mechanism. The study suggests that animation plays an important role in the
classical conditioning mechanism in explaining the effectiveness of animated
commercials as well as to interpret consumer-attitude formation.

121
The results of multi-group CFA analysis comparing conditioning and control
group revealed that there was a significant group difference on each path regarding
values of modification indexes. The implication from this analysis is that consumer
intensified cognition and affection could have an influence on conation as purchase
behavior when using animation as stimuli. The implication from the results is that the
formed cognition from the advertised brand and intensified affect from specified
components of commercials could drive the inclination of a possible action that
consumers make take regarding the brand.
The subsequent purchase behavior would be driven from the intensified cognition
and affection when consumer develop a strong and stable affection based on specific
feature-based information from a reliable source and cognition generated from the
analogical evaluation process when consumer are highly involved with the product (Park
and Mittal 1985, p.222). In this study, the analysis of involvement groups, divided into
high and low, implied that the model could be effectively working within the high
product involvement group. Enhanced cognition and affection then leads to increase
likelihood of purchase behavior.
This study suggests that the well-established animation used in commercials can
increase positive affection and consumer attitudes toward both ad and brand. Animation
in commercials is also closely related to advertising recall and a high arousal levels. This
study confirmed that animation can motivate consumers toward action and increase
consumer memory related to the ad and brand (e.g., recall). Image motion produced by
clay could affect human cognitive processing and evoked some kinds of positive emotion
such as arousal. Animation in ads can increase the subject’s attention level. Clay

122
animation is a different animation style compared with the traditional hand drawn
cartoons. Clay animation has been very popular in current entertainment industry as well
as current television commercials due to its high-end graphics appeal and humor.
Therefore, it is not surprising that using animation in commercials has increased since
animation can exceed human imagination.
Imagery is used to retrieve information from memory in a variety of
circumstances, but primarily when three conditions are met: 1) the information to be
remembered has s subtle visual property; 2) the property has not been explicitly
considered previously; and 3) the property cannot easily be deduced from other stored
information (Kosslyn 1990, p.74). Also people used imagery to help produce descriptions,
to help understand descriptions, as part of mental practice, and to induce emotional or
motivational states (Kosslyn 1990, p.75). This discussion could be applied within this
study in explaining the relationship between animated stimuli and consumer behavior.
Thus, imagery stored in memory can drive subsequent behavior, and even help to recall
specific objects (e.g., components of ad). Imagery sorted in memory influence consumer
cognitive processing and the evoked positive emotion. Kossylan (1990) pointed out that
mental imagery can act as a bridge to explore between perception and mental activity. As
such, it is considered as the cognitive faculty “closet to the neurology” because so much
is now known about the neural mechanisms of perception (p. 94). Kossylan (1990)
discussion is parallel with Paivio’s (1971) opinion who noted that memory can be
improved if one visualizes the materials and then encodes the images into memory.
In sum, well-designed animation in commercials is associated with the influence
of consumer cognitive and affective processing on viewer persuasion because animated

123
stimuli are based on the incorporating visualization and appropriate motion in
commercials. Consequently, it can be implied that the better-designed animation could
provide a better understating of how animation influences the relationship between
consumer cognitive and affective processes and subsequent consumer behavior.
124
CHAPTER 6 CONTRIBUTION AND SUGGESTIONS
6.1 The Effect of Animation in Commercials
This study significantly contributes to our understanding of the relationship
between animated commercials and human cognitive and affective processing. The other
benefit of an animation study is the comparison between animated ads and live action
formatted commercials by categorizing the types of animation. Thus, the results obtained
elucidate the high level of consumer arousal and ad recall associated with animated
commercials. The high level of arousal could be transformed into positive brand
evaluation and attitude toward the ad and brand. This study exhibits merits by
demonstrating what effective animated advertising stimuli is and by categorizing
animated commercial types as a guideline for more animated advertisements.
Animation has become the new creative advertising trend in today’s entertainment
industry. As a character-based business, animation can expand the design of
advertisement by applying digital content to different media, such as the Internet, mobile
phone technology, and television. Animated commercials can more effectively provide
visual demonstrations and recall testimonies for products. Furthermore, implications
derived from this study illuminate how animated ads should take into account the
influence of lower-level peripheral processing routes on viewer persuasion.
Understanding the relationship between animated commercials and how they
stimulate viewers or effect their emotional responses and behavioral expectations
provides valuable information to practitioners who design animated ads when they create
125
effective animated commercials. Animation has become an important design tool in
recent graphic interfaces because they motivate consumer actions and draw viewers’
attention to specific product features.
From a practical perspective, the findings provide advertiser and animation
designers a useful information when they are creating a new animated characters in
commercials. Understanding the relationship between exposure of animated commercials
and viewers’ perception of animated ads, brand and behavioral action crossings cognitive
and affect responses is very valuable asset for advertising practitioners and scholars.
Animation designers believe that image motion should be generated from real
world. Developed of quality human resources can be enhanced animation image motion
as well as characters. The better-designed animation could provide a better understating
of how animation influences the relationship between consumer cognitive and affective
processes and subsequent consumer behavior.
Image motion produced by clay plays an important role in human cognitive
processing and evoked some kinds of positive emotion such as arousal. The use the
better-designed animation in ads can increase the subject’s attention level. Clay
animation is a different animation style compared with the traditional hand drawn
cartoons. Clay animation has the potential benefits in current entertainment and
advertising industries due to its high-end graphics appeal and humor. Therefore, it is not
surprising that using animation in commercials has increased since animation can exceed
human imagination.
126
6.2 The Effective Classical Conditioning Mechanism in Advertising Research
Classical conditioning suggests that positive attitudes towards an advertised
product (CS) might develop through a product’s association in a commercial with other
positive stimuli (US). Through this study, the classical conditioning paradigm was shown
to be a useful method and mechanism when using animated commercials as a new form
of stimuli. This study shows how attitudes toward brands featured in animated ads are
generated through classical conditioning procedures.
Furthermore, this study on classical conditioning is important in terms of
discerning the role of awareness in classical conditioning by recognizing that effective
conditioning can occur through direct affect transfer or through cognitive belief
information. Contingency awareness could be a consequence of conditioning as well as
the product of a deliberate cognitive process (Eagly & Chaiken 1993, p.410). This study
demonstrated that awareness leads to a favorable perception of the ad about the target
attribute and favorable brand attitudes. The experiments in this study re-examined the
degree to which awareness of the CS/US contingency plays a role in classical
conditioning.
Individuals who are highly involved with a stimulus exhibit a greater tendency to
pay attention to the stimulus, have higher levels of attention to the stimulus in a
conditioning experiment, and may gain contingency awareness. Individuals who are
highly involved with the product are less likely to respond to animation as the
unconditioned stimulus than to the information about the product. People who are highly
involved with the product are more likely to develop favorable attitudes when exposed to
127
conditioning procedures in the absence of product information. Awareness is enhanced
by involvement and involvement influences attitude formation through classical
conditioning procedures with affect and belief formation acting as mediators.
Generally, classical conditioning is a prime method of persuasion. Many studies
have demonstrated its effectiveness and its ubiquity in advertising research. This study
confirmed that the classical conditioning would appropriate method to measure the
effectiveness of a new product. Also, through evidence for classical conditioning
experiment, this can provide an opportunity to better understand how classical
conditioning could account for the potential impact of animated stimuli on product
attitudes. The study asserts that a new brand paired with an affective conditioned stimuli
(CS: target brand) could generate affective responses toward the CS.
Contingency awareness is a consequence of conditioning as well as the product of
a deliberate cognitive process (Eagly and Chaiken 1993). The Implication from this study
is that awareness of the CS/US contingency could drive more favorable attitudes toward
the ad and target brand. Certain cues acting as affective stimuli could develop consumers’
perception of the ad and attributions of the brand, thus enhancing message processing.
Animation as affective stimuli helps subjects to pay attention to the stimulus and higher
levels of attention to the stimuli in a conditioning experiment may result in awareness of
the CS/US contingency.
The implication from the hierarchical communication model is that consumer
intensified cognition and affection could have an influence on purchase behavior when
using animation as stimuli in conditioning experiment. This study suggests that the
formed cognition from the advertised brand and intensified affect from specified

128
components of commercials could drive the inclination of a possible action that
consumers take regarding the brand. Also, this study suggests that better-designed
animation in advertising would effective advertising design tool when explaining
consumer attitude formation such human cognition, affection and conation responses in a
classical conditioning procedure.
6.3 Limitations and Suggestions for Future Research This study did not cover familiarity and preference or fittingness. First of all, a
consumer’s familiarity with a product or brand influences such concepts as consumer
adaptation, self-image, compliance, and identification. A similar topic must focus on the
relationships among brand familiarity, consumer confidence in brand evaluations,
consumer attitudes toward brands, and purchase intention. For brand preference issues,
brand choice, and consumption, consumers create meaning and strengthen their identities
through brand preference. Given the fit between the celebrity and the product as defined
by the term “match-up hypothesis,” different types of endorsers and celebrities affect
consumer attitude. Future studies on animated commercials should include all of these
issues.
There is also concern about the subjects, exclusively college students who might
respond to animated commercials and react differently than people in other consumer
segments. Therefore, it would be valuable to replicate the current study with a larger and
more representative sample. Although this study was trying to optimize classical
conditioning experiment by employing the basic principles of experimental design,
classroom as well as video and audio issues were limited. Another concern is novelty
effect in this study. Generally, people are likely to process stimuli when they are
129
surprising and they pay more attention to advertising and others that are novel or different
as well as novel ads and stimuli attract consumer’s attention. Thus, this study suggests
that the novelty effect should be considered in the similar study when using novel ads and
stimuli.
The product involvement manipulation used in this study asked participants about
their interest in the target product, which may have highlighted the importance of the task,
therefore creating more relevance in the part minds to normal interest levels. Study
related involvement issues in advertising research emphasize that involvement
contributes to cognitive attitude formation. This study suggests that advertisers should
consider methods and advertising design tools to generate attention to their advertisement.
Given that individual involvement is highly related with perception of advertising
effectiveness (e.g., recall), advertisers also should consider the specific elements of a
message and the components of advertisement to capture viewers.
In this study, issues involving animated commercial types are limited to two types
of animated commercials, clay animation and cartoon commercials. Several animation
types appear everywhere in the current entertainment industry.
Computer generated animation in the animation industry has become a significant
increase due to the growing importance of new technologies. Furniss (2006) argued that
computer animated special effects and techniques to enhance live-action images have
become a dominant characteristic of contemporary motion pictures, especially in the
action, sciences fiction, and television commercials (http://encarta.msn.com). Also the
trend already is employed in a production of animation in commercials.
130
Although animation types could be classified in this study, the rate of computer
generated animation is now increasing due to advancements in technology, which allows
for easily designing and developing computer graphics. Future studies on animation in
commercials should include more types of animation.
This study was focused on types of animation to compare animated commercials
to live commercials in order to examine the relationship between affective stimuli and
consumer attitude formation (e.g., cognitive, affective and conative) when viewing
animated commercials. This study suggests that the further exploration of animation in
advertising should research the relation between types of animated characters and
consumers attitude formation (e.g., consumer’s emotional response, cognitive processing
and purchase behavior).
Given animation is regarded as affective stimuli; the degree of individual
difference could affect consumer cognitive processing and emotional response to
animated advertisements. Literature related to individual differences points out that
specific individual characteristics, which including the reflections of an individual’s
inherent personality, background, consumer’s knowledge, and abilities, influence how
each consumer processes advertising messages. The results of the study indicate that the
further exploration of animation should focus on such individual differences. Further
study should consider that individually different variables play an influential role in
determining how people respond to animated stimuli.
Consumer responses to animation in advertising were explained using classical
conditioning mechanism in this study. Generally, animation acts as affective stimuli (US).
Also animation may have the potential to generate positive belief and affection. This
131
study was conducted a classical conditioning experiment in low-involvement product
category. Thus, this study suggests that the further exploration of the classical
conditioning procedures should conduct under high-involvement product category. The
further study of the classical conditioning should examine whether the classical
conditioning will be occurred under high-product involvement categories (e.g., electronic
products, etc.)

132
APPENDIX A MULTI GROUP ANALYSIS EQS PROGRAM
/TITLE Multi group analysis EQS program by EQS 6 for Windows /SPECIFICATIONS DATA='c:\eqs61\pda\juice_ex_trip.ess'; VARIABLES=10; CASES=166; GROUPS=2; METHOD=ML; ANALYSIS=COVARIANCE; MATRIX=RAW; /LABELS V1=SAMP; V2=SAMA; V3=SAMD; V4=COG1; V5=COG2; V6=COG3; V7=COG4; V8=PI1; V9=PI2; V10=PI3; F1= Affection; F2=Cognition; F3=Conation; /EQUATIONS V1 = *F1 + E1; V2 = *F1 + E2; V3 = *F1 + E3; V4 = 1F2 + E4; V5 = *F2 + E5; V6 = *F2 + E6; V7 = *F2 + E7; V8 = 1F3 + E8; V9 = *F3 + E9; V10 = *F3 + E10; F2 = *F1 + D2; F3 = *F1 + *F2 + D3; /VARIANCES F1 = *; E1 = *; E2 = *; E3 = *; E4 = *; E5 = *; E6 = *; E7 = 1; E8 = *; E9 = *; E10 = *; D2 = *; D3 = *; /COVARIANCES E1,E4=*; E4,E5=*; E7,E10=*; E7,E8=*; E7,E9=*; E3,E9=*; E8,E9=*; E5,E10=*; /PRINT EIS; FIT=ALL; TABLE=EQUATION; /END /TITLE
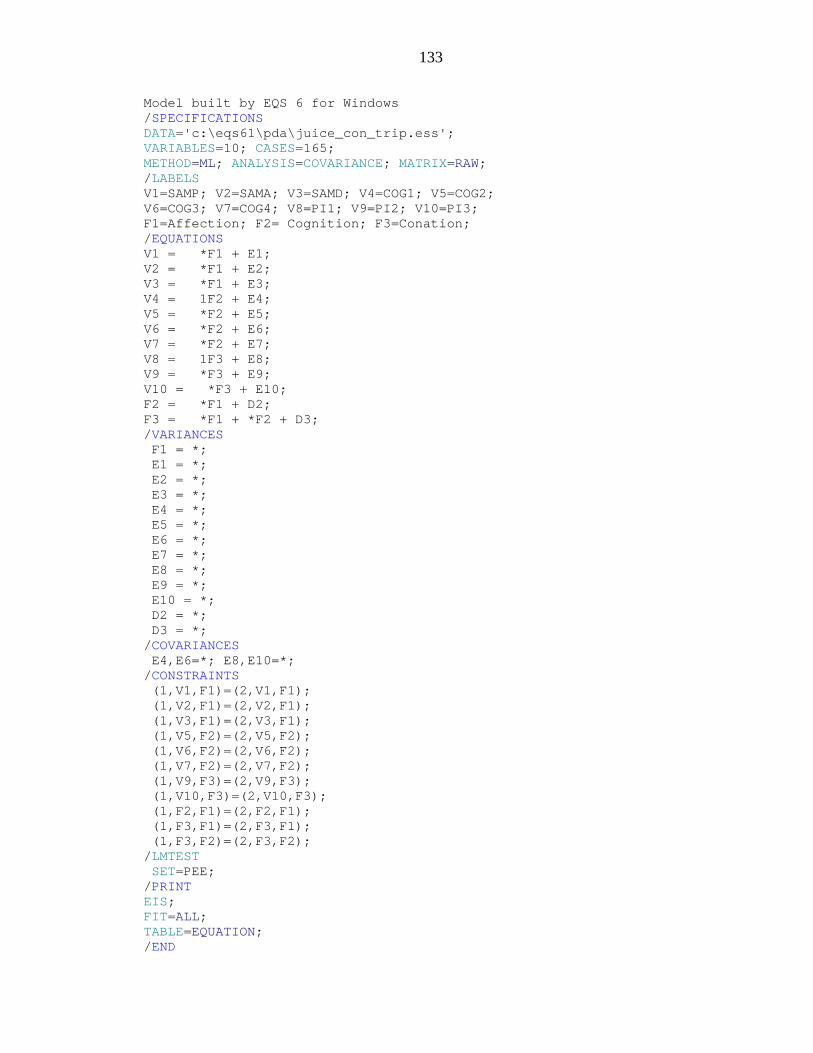
133
Model built by EQS 6 for Windows /SPECIFICATIONS DATA='c:\eqs61\pda\juice_con_trip.ess'; VARIABLES=10; CASES=165; METHOD=ML; ANALYSIS=COVARIANCE; MATRIX=RAW; /LABELS V1=SAMP; V2=SAMA; V3=SAMD; V4=COG1; V5=COG2; V6=COG3; V7=COG4; V8=PI1; V9=PI2; V10=PI3; F1=Affection; F2= Cognition; F3=Conation; /EQUATIONS V1 = *F1 + E1; V2 = *F1 + E2; V3 = *F1 + E3; V4 = 1F2 + E4; V5 = *F2 + E5; V6 = *F2 + E6; V7 = *F2 + E7; V8 = 1F3 + E8; V9 = *F3 + E9; V10 = *F3 + E10; F2 = *F1 + D2; F3 = *F1 + *F2 + D3; /VARIANCES F1 = *; E1 = *; E2 = *; E3 = *; E4 = *; E5 = *; E6 = *; E7 = *; E8 = *; E9 = *; E10 = *; D2 = *; D3 = *; /COVARIANCES E4,E6=*; E8,E10=*; /CONSTRAINTS (1,V1,F1)=(2,V1,F1); (1,V2,F1)=(2,V2,F1); (1,V3,F1)=(2,V3,F1); (1,V5,F2)=(2,V5,F2); (1,V6,F2)=(2,V6,F2); (1,V7,F2)=(2,V7,F2); (1,V9,F3)=(2,V9,F3); (1,V10,F3)=(2,V10,F3); (1,F2,F1)=(2,F2,F1); (1,F3,F1)=(2,F3,F1); (1,F3,F2)=(2,F3,F2); /LMTEST SET=PEE; /PRINT EIS; FIT=ALL; TABLE=EQUATION; /END
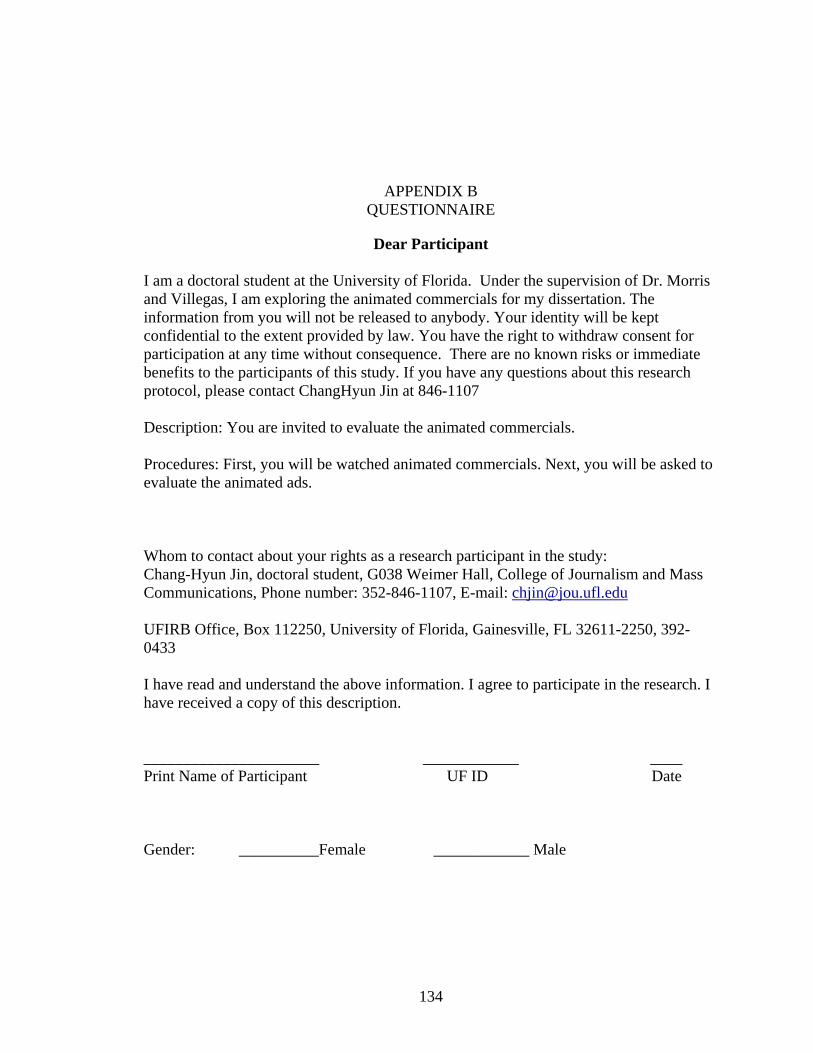
134
APPENDIX B QUESTIONNAIRE
Dear Participant I am a doctoral student at the University of Florida. Under the supervision of Dr. Morris and Villegas, I am exploring the animated commercials for my dissertation. The information from you will not be released to anybody. Your identity will be kept confidential to the extent provided by law. You have the right to withdraw consent for participation at any time without consequence. There are no known risks or immediate benefits to the participants of this study. If you have any questions about this research protocol, please contact ChangHyun Jin at 846-1107 Description: You are invited to evaluate the animated commercials. Procedures: First, you will be watched animated commercials. Next, you will be asked to evaluate the animated ads. Whom to contact about your rights as a research participant in the study: Chang-Hyun Jin, doctoral student, G038 Weimer Hall, College of Journalism and Mass Communications, Phone number: 352-846-1107, E-mail: [email protected] UFIRB Office, Box 112250, University of Florida, Gainesville, FL 32611-2250, 392-0433 I have read and understand the above information. I agree to participate in the research. I have received a copy of this description. ______________________ ____________ ____ Print Name of Participant UF ID Date Gender: __________Female ____________ Male
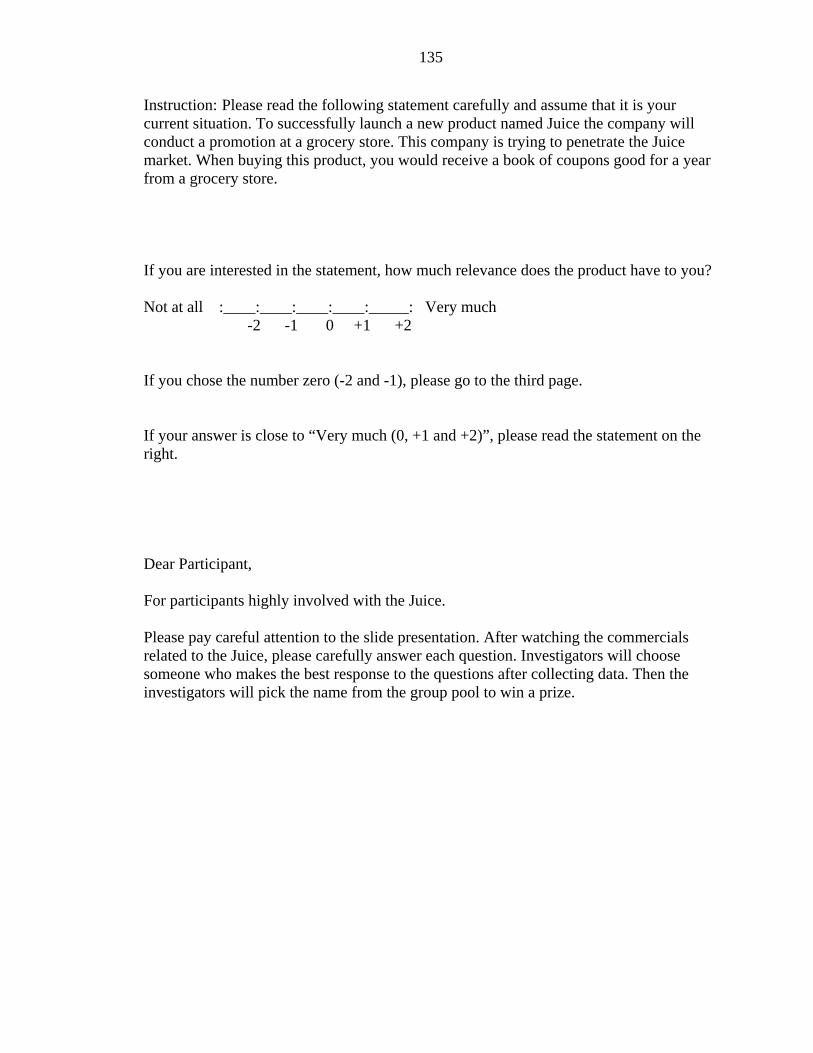
135
Instruction: Please read the following statement carefully and assume that it is your current situation. To successfully launch a new product named Juice the company will conduct a promotion at a grocery store. This company is trying to penetrate the Juice market. When buying this product, you would receive a book of coupons good for a year from a grocery store. If you are interested in the statement, how much relevance does the product have to you? Not at all :____:____:____:____:_____: Very much -2 -1 0 +1 +2 If you chose the number zero (-2 and -1), please go to the third page. If your answer is close to “Very much (0, +1 and +2)”, please read the statement on the right. Dear Participant, For participants highly involved with the Juice. Please pay careful attention to the slide presentation. After watching the commercials related to the Juice, please carefully answer each question. Investigators will choose someone who makes the best response to the questions after collecting data. Then the investigators will pick the name from the group pool to win a prize.
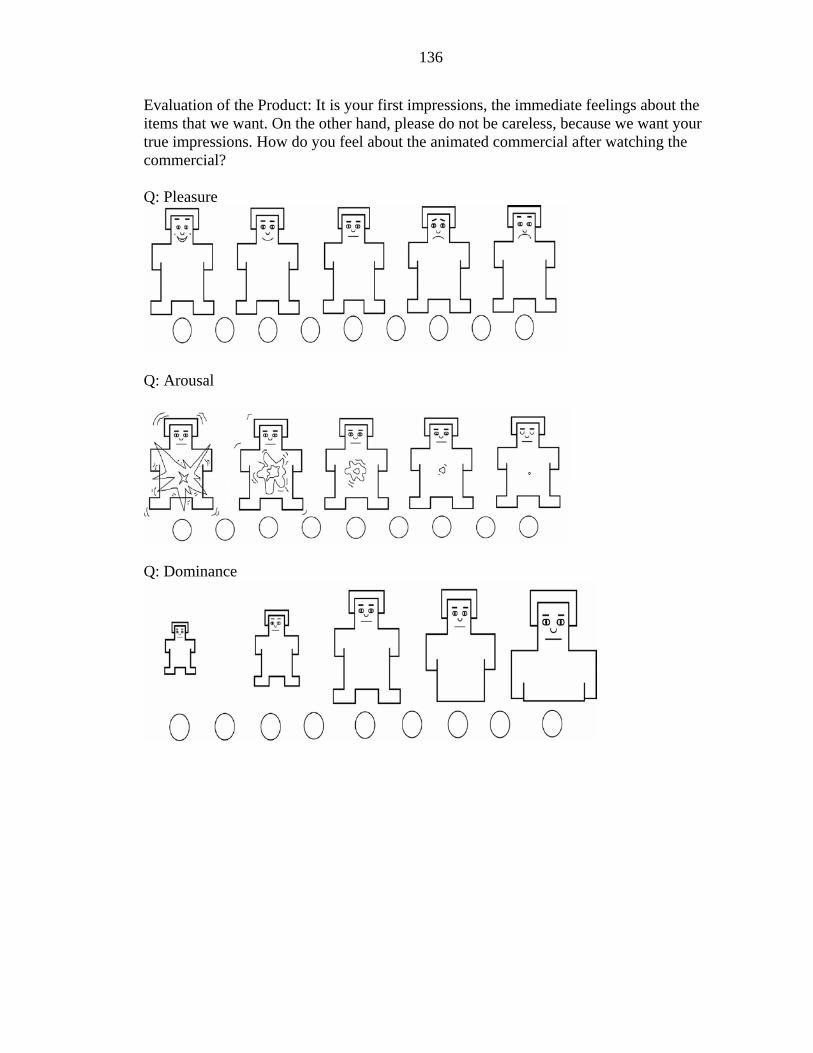
136
Evaluation of the Product: It is your first impressions, the immediate feelings about the items that we want. On the other hand, please do not be careless, because we want your true impressions. How do you feel about the animated commercial after watching the commercial? Q: Pleasure
Q: Arousal
Q: Dominance

137
Q: Product Involvement: Work at fairly high speed through this questionnaire. Do not worry or puzzle over individual items. It is your first impressions, the immediate feelings about the items that we want. On the other hand, please do not be careless, because we want your true impressions. Please place a checkmark to the number what thoughts and feelings went through your mind about the product after watching the commercial Useless :____:____:____:____:____:____:____: Useful -3 -2 -1 0 +1 +2 +3 Uninterested:____:____:____:____:____:____:____: Interested -3 -2 -1 0 +1 +2 +3 Worthless :____:____:____:____:____:____:____: Valuable -3 -2 -1 0 +1 +2 +3 Unwanted :____:____:____:____:____:____:____: Wanted -3 -2 -1 0 +1 +2 +3 Irrelevant :____:____:____:____:____:____:____: Relevant -3 -2 -1 0 +1 +2 +3 Q1. Attribution of the brand Please place a checkmark to the number that best represents your answer about how certain you are of each your responses after watching the commercial. 1-1). I believe that the product in the slide presentation could be of good quality. Strongly ______:______:______:______:______:______:______ Strongly Disagree -3 -2 -1 0 +1 +2 +3 Agree 1-2). I believe that the product in the slide presentation is reliable. Strongly ______:______:______:______:______:______:______ Strongly Disagree -3 -2 -1 0 +1 +2 +3 Agree 1-3). I believe that the product in the slide presentation could provide rich nutrients compared to other similar products. Strongly ______:______:______:______:______:______:______ Strongly Disagree -3 -2 -1 0 +1 +2 +3 Agree 1-4). I believe that the taste of the product in the slide presentation is good. Strongly ______:______:______:______:______:______:______ Strongly Disagree -3 -2 -1 0 +1 +2 +3 Agree
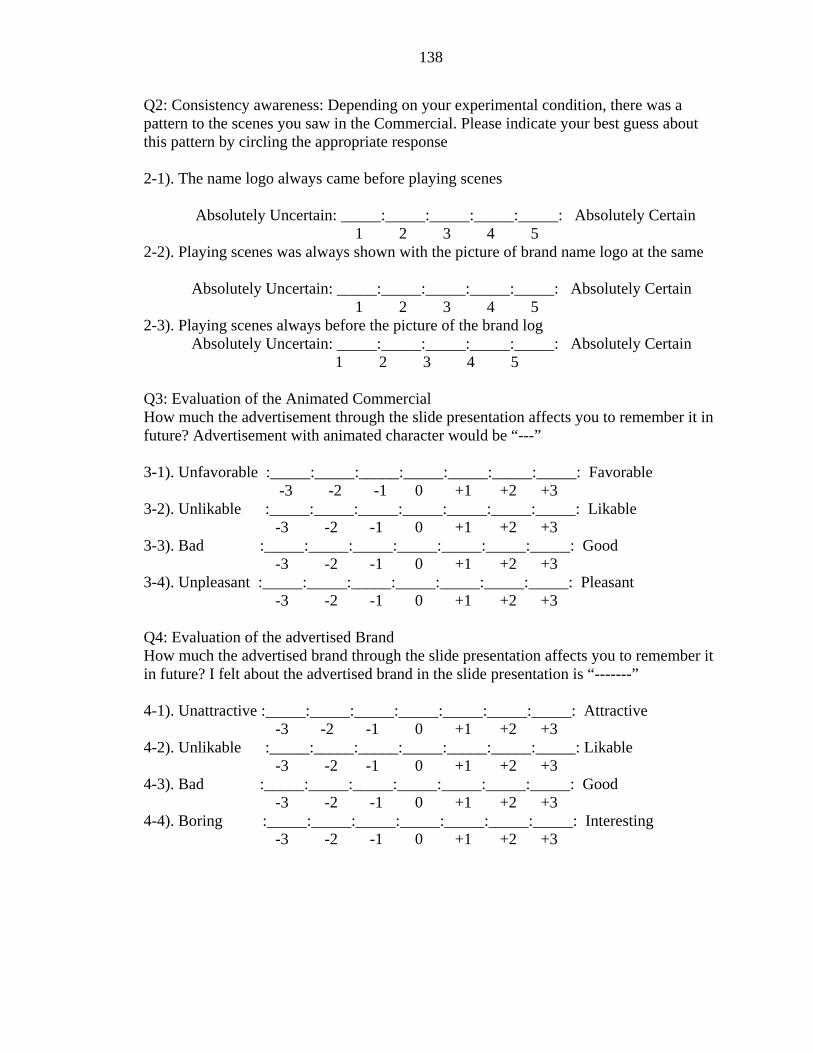
138
Q2: Consistency awareness: Depending on your experimental condition, there was a pattern to the scenes you saw in the Commercial. Please indicate your best guess about this pattern by circling the appropriate response 2-1). The name logo always came before playing scenes Absolutely Uncertain: _____:_____:_____:_____:_____: Absolutely Certain
1 2 3 4 5 2-2). Playing scenes was always shown with the picture of brand name logo at the same
Absolutely Uncertain: _____:_____:_____:_____:_____: Absolutely Certain 1 2 3 4 5
2-3). Playing scenes always before the picture of the brand log Absolutely Uncertain: _____:_____:_____:_____:_____: Absolutely Certain
1 2 3 4 5 Q3: Evaluation of the Animated Commercial How much the advertisement through the slide presentation affects you to remember it in future? Advertisement with animated character would be “---” 3-1). Unfavorable :_____:_____:_____:_____:_____:_____:_____: Favorable -3 -2 -1 0 +1 +2 +3 3-2). Unlikable :_____:_____:_____:_____:_____:_____:_____: Likable -3 -2 -1 0 +1 +2 +3 3-3). Bad :_____:_____:_____:_____:_____:_____:_____: Good -3 -2 -1 0 +1 +2 +3 3-4). Unpleasant :_____:_____:_____:_____:_____:_____:_____: Pleasant -3 -2 -1 0 +1 +2 +3 Q4: Evaluation of the advertised Brand How much the advertised brand through the slide presentation affects you to remember it in future? I felt about the advertised brand in the slide presentation is “-------” 4-1). Unattractive :_____:_____:_____:_____:_____:_____:_____: Attractive -3 -2 -1 0 +1 +2 +3 4-2). Unlikable :_____:_____:_____:_____:_____:_____:_____: Likable -3 -2 -1 0 +1 +2 +3 4-3). Bad :_____:_____:_____:_____:_____:_____:_____: Good -3 -2 -1 0 +1 +2 +3 4-4). Boring :_____:_____:_____:_____:_____:_____:_____: Interesting -3 -2 -1 0 +1 +2 +3
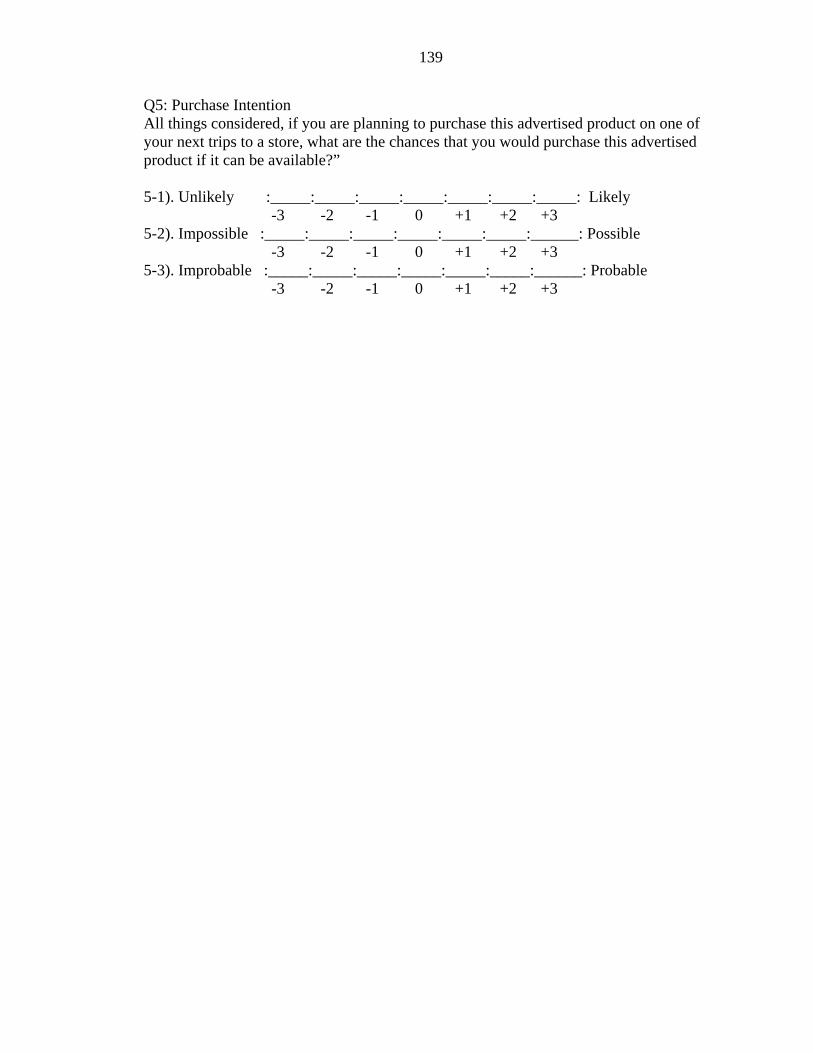
139
Q5: Purchase Intention All things considered, if you are planning to purchase this advertised product on one of your next trips to a store, what are the chances that you would purchase this advertised product if it can be available?” 5-1). Unlikely :_____:_____:_____:_____:_____:_____:_____: Likely -3 -2 -1 0 +1 +2 +3 5-2). Impossible :_____:_____:_____:_____:_____:_____:______: Possible -3 -2 -1 0 +1 +2 +3 5-3). Improbable :_____:_____:_____:_____:_____:_____:______: Probable -3 -2 -1 0 +1 +2 +3
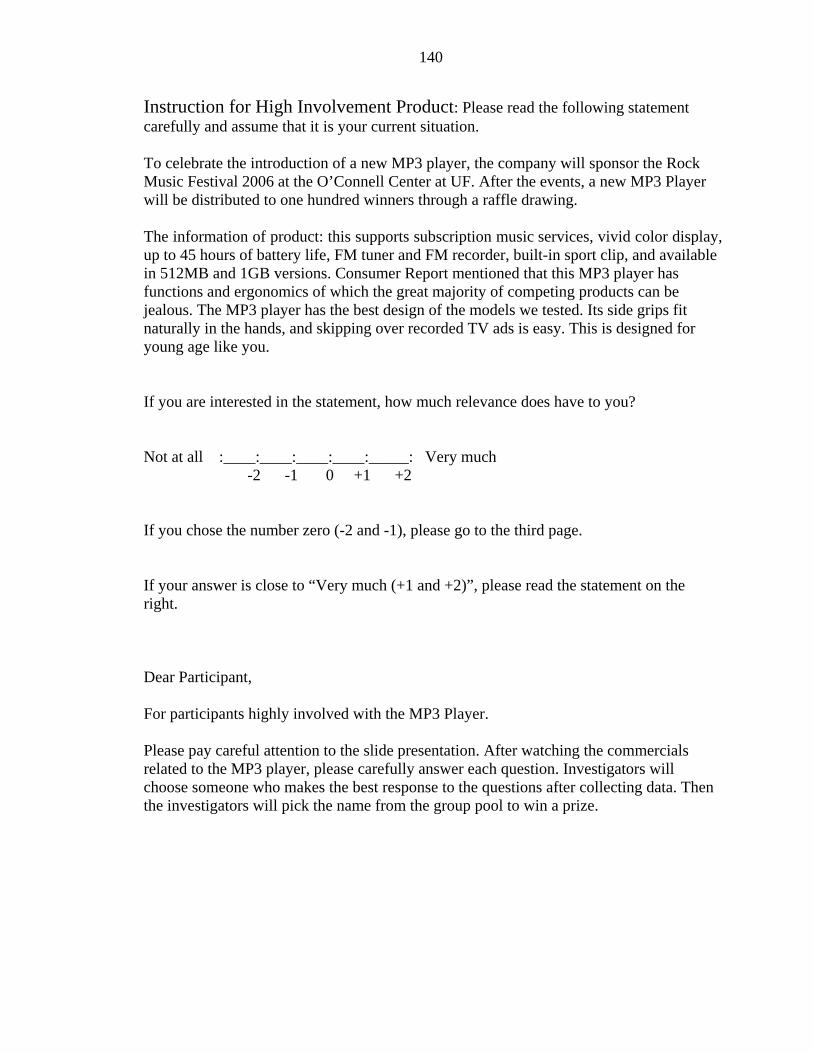
140
Instruction for High Involvement Product: Please read the following statement carefully and assume that it is your current situation. To celebrate the introduction of a new MP3 player, the company will sponsor the Rock Music Festival 2006 at the O’Connell Center at UF. After the events, a new MP3 Player will be distributed to one hundred winners through a raffle drawing. The information of product: this supports subscription music services, vivid color display, up to 45 hours of battery life, FM tuner and FM recorder, built-in sport clip, and available in 512MB and 1GB versions. Consumer Report mentioned that this MP3 player has functions and ergonomics of which the great majority of competing products can be jealous. The MP3 player has the best design of the models we tested. Its side grips fit naturally in the hands, and skipping over recorded TV ads is easy. This is designed for young age like you. If you are interested in the statement, how much relevance does have to you? Not at all :____:____:____:____:_____: Very much -2 -1 0 +1 +2 If you chose the number zero (-2 and -1), please go to the third page. If your answer is close to “Very much (+1 and +2)”, please read the statement on the right. Dear Participant, For participants highly involved with the MP3 Player. Please pay careful attention to the slide presentation. After watching the commercials related to the MP3 player, please carefully answer each question. Investigators will choose someone who makes the best response to the questions after collecting data. Then the investigators will pick the name from the group pool to win a prize.

141
Evaluation of MP3 Player
It is your first impressions, the immediate feelings about the items that we want. On the other hand, please do not be careless, because we want your true impressions. How do you feel about the animated commercial after watching the MP3 Player commercial? Q: Pleasure
Q: Arousal
Q: Dominance

142
Q: Product Involvement Work at fairly high speed through this questionnaire. Do not worry or puzzle over individual items. It is your first impressions, the immediate feelings about the items that we want. On the other hand, please do not be careless, because we want your true impressions. Please place a checkmark to the number what thoughts and feelings went through your mind about the product after watching the commercial Useless :____:____:____:____:____:____:____: Useful -3 -2 -1 0 +1 +2 +3 Uninterested:____:____:____:____:____:____:____: Interested -3 -2 -1 0 +1 +2 +3 Worthless :____:____:____:____:____:____:____: Valuable -3 -2 -1 0 +1 +2 +3 Unwanted :____:____:____:____:____:____:____: Wanted -3 -2 -1 0 +1 +2 +3 Irrelevant :____:____:____:____:____:____:____: Relevant -3 -2 -1 0 +1 +2 +3 Q6. Evaluation of the (MP3 Player) Animated Commercial Please place a checkmark to the number that best represents your answer about how certain you are of each your responses after watching the MP3 player commercial. 6-1). I believe that the product in the slide presentation could be of good quality. Strongly ______:______:______:______:______:______:______ Strongly Disagree -3 -2 -1 0 +1 +2 +3 Agree 6-2). I believe that the product in the slide presentation is reliable. Strongly ______:______:______:______:______:______:______ Strongly Disagree -3 -2 -1 0 +1 +2 +3 Agree 6-3). I believe that the product in the slide presentation could provide many different additional devices compared other similar products. Strongly ______:______:______:______:______:______:______ Strongly Disagree -3 -2 -1 0 +1 +2 +3 Agree 6-4). I believe that the sound of the product in slide presentation could be excellent. Strongly ______:______:______:______:______:______:______ Strongly Disagree -3 -2 -1 0 +1 +2 +3 Agree
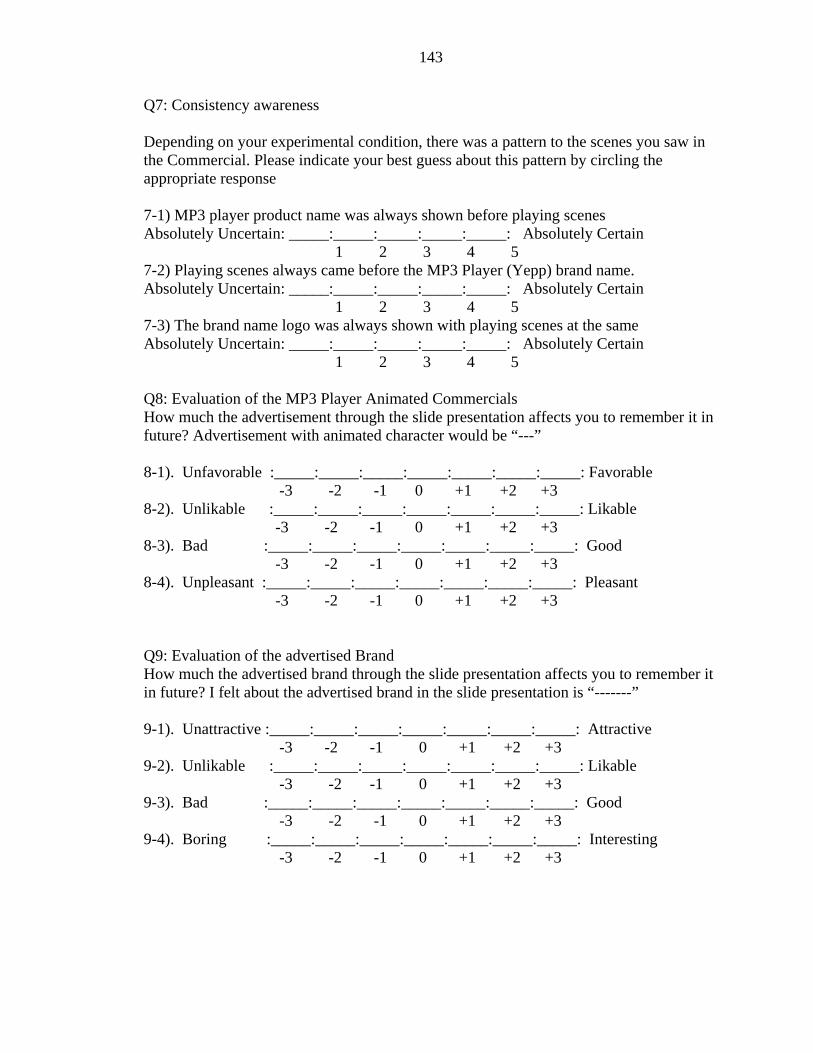
143
Q7: Consistency awareness Depending on your experimental condition, there was a pattern to the scenes you saw in the Commercial. Please indicate your best guess about this pattern by circling the appropriate response 7-1) MP3 player product name was always shown before playing scenes Absolutely Uncertain: _____:_____:_____:_____:_____: Absolutely Certain
1 2 3 4 5 7-2) Playing scenes always came before the MP3 Player (Yepp) brand name. Absolutely Uncertain: _____:_____:_____:_____:_____: Absolutely Certain
1 2 3 4 5 7-3) The brand name logo was always shown with playing scenes at the same Absolutely Uncertain: _____:_____:_____:_____:_____: Absolutely Certain
1 2 3 4 5 Q8: Evaluation of the MP3 Player Animated Commercials How much the advertisement through the slide presentation affects you to remember it in future? Advertisement with animated character would be “---” 8-1). Unfavorable :_____:_____:_____:_____:_____:_____:_____: Favorable -3 -2 -1 0 +1 +2 +3 8-2). Unlikable :_____:_____:_____:_____:_____:_____:_____: Likable -3 -2 -1 0 +1 +2 +3 8-3). Bad :_____:_____:_____:_____:_____:_____:_____: Good -3 -2 -1 0 +1 +2 +3 8-4). Unpleasant :_____:_____:_____:_____:_____:_____:_____: Pleasant -3 -2 -1 0 +1 +2 +3 Q9: Evaluation of the advertised Brand How much the advertised brand through the slide presentation affects you to remember it in future? I felt about the advertised brand in the slide presentation is “-------” 9-1). Unattractive :_____:_____:_____:_____:_____:_____:_____: Attractive -3 -2 -1 0 +1 +2 +3 9-2). Unlikable :_____:_____:_____:_____:_____:_____:_____: Likable -3 -2 -1 0 +1 +2 +3 9-3). Bad :_____:_____:_____:_____:_____:_____:_____: Good -3 -2 -1 0 +1 +2 +3 9-4). Boring :_____:_____:_____:_____:_____:_____:_____: Interesting -3 -2 -1 0 +1 +2 +3

144
Q10: Purchase Intention All things considered, if you are planning to purchase this advertised product on one of your next trips to a store, what are the chances that you would purchase this advertised product if it can be available?” 10-1). Unlikely :_____:_____:_____:_____:_____:_____:_____: Likely -3 -2 -1 0 +1 +2 +3 10-2). Impossible :_____:_____:_____:_____:_____:_____:______: Possible -3 -2 -1 0 +1 +2 +3 10-3). Improbable :_____:_____:_____:_____:_____:_____:______: Probable -3 -2 -1 0 +1 +2 +3 Q11: Recall Mesurement Based on your memory, please write down about the ads you have seen (e.g., displayed product name, character (human and animal), and description of the ads, story line, theme, company logo name or anything you can remember). (e.g., you can describe anything what your feeling, thinking and imagination when you are thing about the animated commercials that you watched) Thank you!

145
APPENDIX C ANIMATION STIMULI
Sample_1
Sample_2
Sample_3
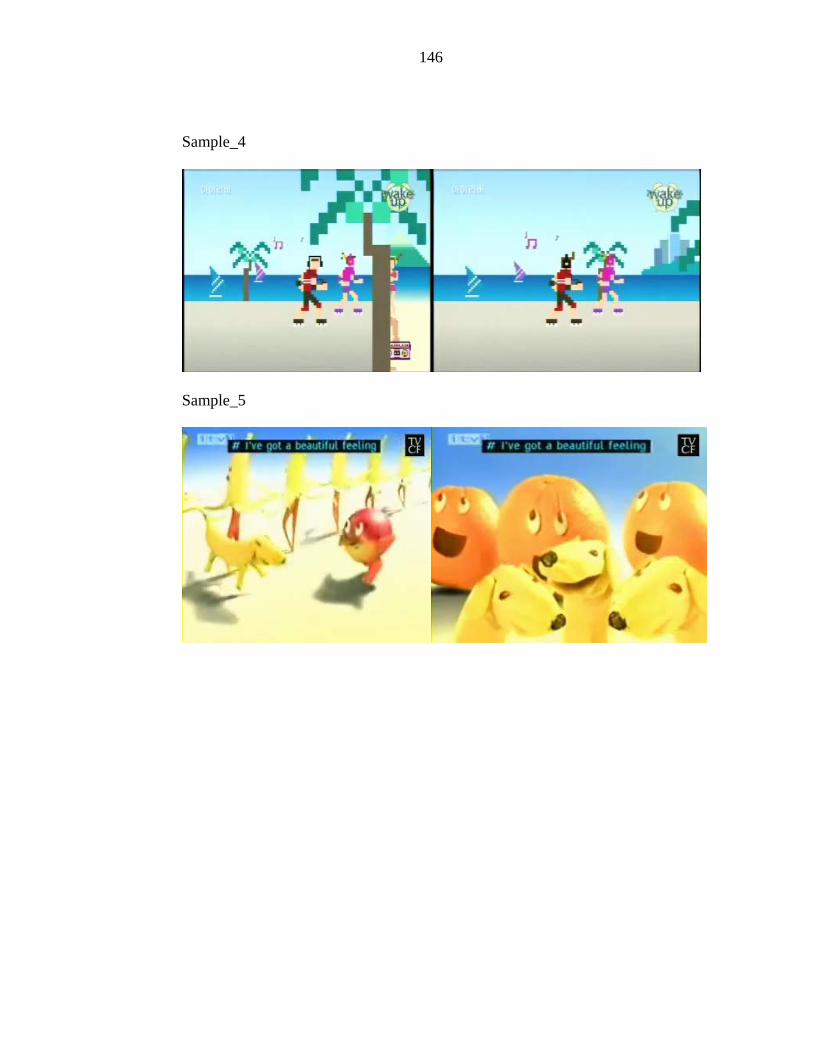
146
Sample_4
Sample_5

147
LIST OF REFERENCES
Allen, Chris T., and Chris A. Janiszewski. (1989), “Assessing the Role of Contingency Awareness in Attitudinal Conditioning with Implications for Advertising Research,” Journal of Marketing Research, 26 (February), 30-43.
Allen, Chris T., and Terence A. Shimp. (1990), “On Using Classical Conditioning Methods for Researching the Impact of Ad-Evoked Feelings,” in Emotion in Advertising: Theoretical and Practical Explorations, Stuart J. Agres et al. (ed.). Westport, CT: Quorum Books, 19-34.
Allen, Chris T., and Thomas J. Madden. (1985), “A Closer Look at Classical Conditioning,” Journal of Consumer Research, 12 (December), 301-315.
Amsel, A. (1992), “Confessions of a Neobehaviorist,” Integrative Physiological and Behavioral Science, 27(4), 336-346.
Arenson Sidney J., Peter, B. Lannon., Offermann R Lannon., and Kafton, Amy (1982). “The Validity of Attitude Change by Classical Conditioning,” Journal of Social Psychology, 117, 243-8.
Arnheim, Rudolf. (1958), Film as art, London: Faber and Faber Ltd.
Bagozzi, Richard P. (1992), “The Self-Regulation of Attitudes, Intentions, and Behavior,” Social Psychology Quarterly, 55(2), 178-204.
Bagozzi, Richard P., and Robert E. Burnkrant (1979), “Attitude Organization and the Attitude-Behavior Relationship,” Journal of Personality and Social Psychology, 37 (6), 913-929.
Bagozzi, Richard P., and Robert E. Burnkrant (1985), “Attitude Organization and the Attitude-Behavior Relation: A Reply to Dillon and Kumar,” Journal of Personality and Social Psychology, 49 (1), 47-57.
Baker, Michael J. and Gilbert A. Churchill, Jr. (1977), “The Impact of Physically Attractive Models on Advertising Evaluations,” Journal of Marketing Research, Vol. XIV (November), 538-555.
Baker, William. E. (1999), “When can Affective Conditioning and Mere Exposure Directly Influence Brand Choice?” Journal of Advertising, 28(4), 31-47.

148
Baker, William,E.,and Robert, J. Lutz. (1988), “The Relevance-Accessibility Model of Advertising Effectiveness” in Nonverbal Communication in Advertising, S.Hecker and D.W.Stewart (ed.). Lexington,MA:Lexingtons Books,59-84.
Barry, Thomas E. and Daniel J. Howard (1990), “A Review and Critique of the Hierarchy of Effects in Advertising,” International Journal of Advertising, 9 (2), 121-135.
Barell, John. (1995), “Critical issue: Working toward student self-direction and personal efficacy as educational goals,” Oak Brook, Illinois: North Central Regional Educational Laboratory. http://www.ncrel.org/ncrel/sdrs/areas/issues/students/learning/lr200.htm, last accessed March 12, 2006.
Baumeister, R., Bratslavsky, E., Muraven, M., and Tice, D. (1998), “Ego depletion: Is the active self a limited resource?” Journal of Personality and Social Psychology, 74(5), 1252-1265.
Bhattacharya, C.B. and Sen, S. (2003), “Consumer-company identification: a framework for understanding consumers’ relationships with companies,” Journal of Marketing, 67, 76-88.
Biehal, Gabriel, Debra Stephens, and Eleonora Curlo (1992), “Attitude toward the Ad and Brand Choice,” Journal of Advertising, 21 (3), 19-36.
Bierley Calvin., Frances K. McSweeney, and Renee Vannieuwkerk. (1985), “Classical Conditioning of Preferences for Stimuli,” Journal of Consumer Research, 12 (3), 316-323.
Booth-Butterfield, S. and Welbourne, J. (2002), “The Elaboration Likelihood Model: Its Impact on Persuasion Theory and Research” in Dillard J. and Pfau M. (ed.). Handbook on Persuasion. Beverly Hills, CA: Sage.
Bouton, Mark E (1993), “Context, Time and Memory Retrieval in the Interference Paradigms of Pavlovian Learning,” Psychological Bulletin, 114 (1), 80-99.
Box Office Mojo. (2006), “Shrek,” http://www.boxofficemojo.com/movies/?id=shrek.htm, last accessed June 20,2006
Bradley, Margret M., Mark K. Greenwald., Margret C. Petry, and Peter J. Lang (1992), “Remembering Pictures: Pleasure and Arousal in Memory,” Journal of Experimental Psychology, 18(2), 379-390.
Breckler, S. J. (1984), “Empirical validation of affect, behavior, and cognition as distinct components of attitude,” Journal of Personality and Social Psychology, 47, 1191-1205.
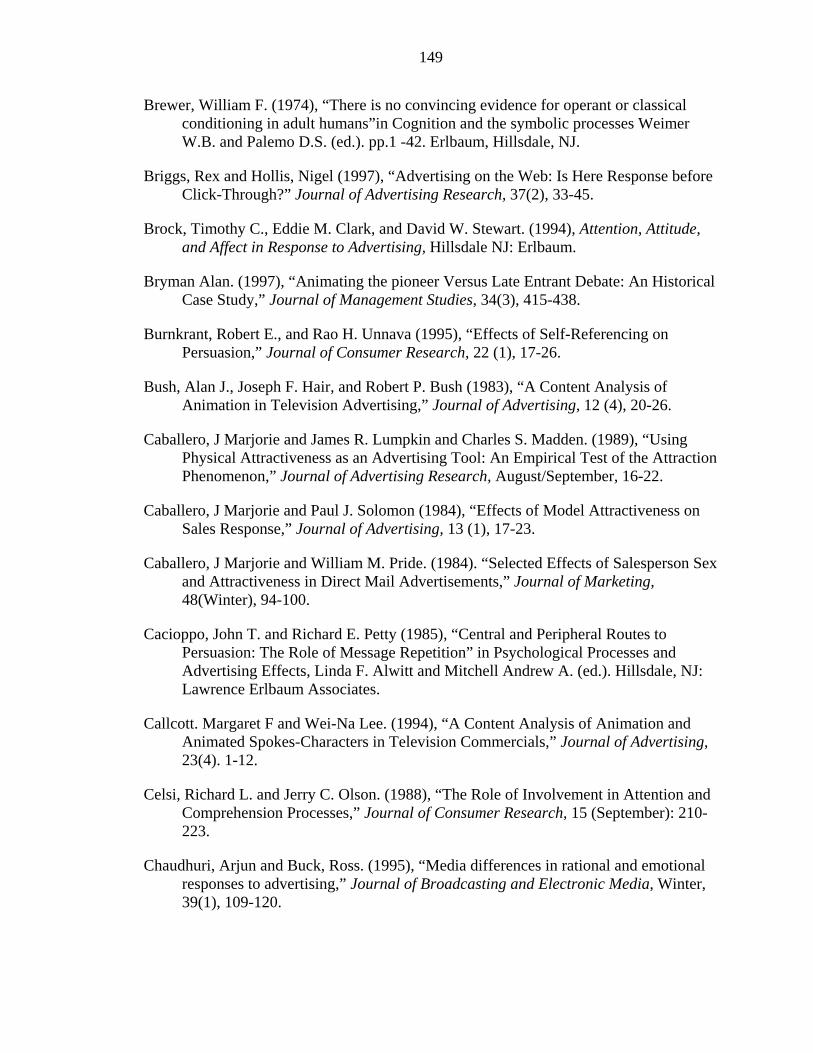
149
Brewer, William F. (1974), “There is no convincing evidence for operant or classical conditioning in adult humans”in Cognition and the symbolic processes Weimer W.B. and Palemo D.S. (ed.). pp.1 -42. Erlbaum, Hillsdale, NJ.
Briggs, Rex and Hollis, Nigel (1997), “Advertising on the Web: Is Here Response before Click-Through?” Journal of Advertising Research, 37(2), 33-45.
Brock, Timothy C., Eddie M. Clark, and David W. Stewart. (1994), Attention, Attitude, and Affect in Response to Advertising, Hillsdale NJ: Erlbaum.
Bryman Alan. (1997), “Animating the pioneer Versus Late Entrant Debate: An Historical Case Study,” Journal of Management Studies, 34(3), 415-438.
Burnkrant, Robert E., and Rao H. Unnava (1995), “Effects of Self-Referencing on Persuasion,” Journal of Consumer Research, 22 (1), 17-26.
Bush, Alan J., Joseph F. Hair, and Robert P. Bush (1983), “A Content Analysis of Animation in Television Advertising,” Journal of Advertising, 12 (4), 20-26.
Caballero, J Marjorie and James R. Lumpkin and Charles S. Madden. (1989), “Using Physical Attractiveness as an Advertising Tool: An Empirical Test of the Attraction Phenomenon,” Journal of Advertising Research, August/September, 16-22.
Caballero, J Marjorie and Paul J. Solomon (1984), “Effects of Model Attractiveness on Sales Response,” Journal of Advertising, 13 (1), 17-23.
Caballero, J Marjorie and William M. Pride. (1984). “Selected Effects of Salesperson Sex and Attractiveness in Direct Mail Advertisements,” Journal of Marketing, 48(Winter), 94-100.
Cacioppo, John T. and Richard E. Petty (1985), “Central and Peripheral Routes to Persuasion: The Role of Message Repetition” in Psychological Processes and Advertising Effects, Linda F. Alwitt and Mitchell Andrew A. (ed.). Hillsdale, NJ: Lawrence Erlbaum Associates.
Callcott. Margaret F and Wei-Na Lee. (1994), “A Content Analysis of Animation and Animated Spokes-Characters in Television Commercials,” Journal of Advertising, 23(4). 1-12.
Celsi, Richard L. and Jerry C. Olson. (1988), “The Role of Involvement in Attention and Comprehension Processes,” Journal of Consumer Research, 15 (September): 210-223.
Chaudhuri, Arjun and Buck, Ross. (1995), “Media differences in rational and emotional responses to advertising,” Journal of Broadcasting and Electronic Media, Winter, 39(1), 109-120.

150
Cho, Chang-Hoan (1999), “How Advertising Works on the WWW: Modified Elaboration Likelihood Model,” Journal of Current Issues and Research in Advertising, 21 (Spring), 33-50.
Cho, Chang-Hoan (2003), “The Effectiveness of Banner Advertisements: Involvement
and Click-Through,” J & MC Quarterly, 80(3), 623-645. Clark, Eddie. M., and Brock, Timothy. C. (1994), “Warning location, attitudes, and
cognitive responding” in Clark, E. M., Brock, T. C. and Stewart D. W. (ed.). Attention, attitude and affect in response to advertising (pp. 287-300). Hillsdale, NJ: Erlbaum.
Clark, Robert E., and Larry R. Squire.(1998), “Classical Conditioning and Brain
Systems: The Role of Awareness,” Science, 280, 77-81. Cobb, Cathy J. and Wayne D. Hoyer (1985), “The Influence of Advertising at the
Moment of Brand Choice,” Journal of Advertising, 14 (4), 5-12. Cohen Karl (1992), “The Development of Animated TV Commercials in the 1940s,”
Animation Journal, Fall, 34-61.
Cook, Thomas D. and Brian R. Flay (1978), “The Temporal Persistence of Experimentally Induced Attitude Change: An Evaluative Review” in L. Berkowitz, (ed.). Advances in Experimental Social Psychology, Vol. 11, New York: Academic Press, 2-57.
Coulter, Collier and Campbell (1976), “Long-Term Retention of Early Pavlovian Fear Conditioning in Infant Rats,” Journal of Experimental Psychology: Animal Behavior Processes, 2 (1), 48-56.
Darley, William K. and Jeen-Su Lim (1993), “Assessing Demand Artifacts in Consumer Research: An Alternative Perspective,” Journal of Consumer Research, 20 (December), 489-95.
Debevec, Kathleen and Easwar Iyer (1986), “The Influence of Spokespersons in Altering a Product’s Gender Image: Implications for Advertising Effectiveness,” Journal of Advertising, 15 (4), 12-20.
Detenber, Benjamin H and Reeves, Byron (1996) “A Bio-Informational Theory of Emotion: Motion and Image Size Effects on Viewers,” Journal of Communication, 46(3), 66-84.
Detenber, Benjamin. H., Simons, R. F., and Bennett, Jr., G. G. (1998), “Roll ‘em!: The Effects of Picture Motion on Emotional Responses,” Journal of Broadcasting and Electronic Media, 42(1), 113-127.
151
Dillon, William R. and Ajith Kumar (1985), “Attitude Organization and the Attitude-Behavior Relation: A Critique of Bagozzi and Burnkrant's Reanalysis of Fishbein and Ajzen,” Journal of Personality and Social Psychology, 49 (1), 33-46.
Donagan, Alan. (1987), Choice, the Essential Element in Human Action, London: Routledge and Kegan Paul.
Edell, Julie A. (1988). “Nonverbal Effects in Ads: A Review and Synthesis” in Nonverbal Communication in Advertising (ed.). Hecker S. and Stewart, D.W. Lexington, MA: Lexington Books, 11-27.
Edell, Julie and Kevin Lane, Keller (1989), “The Information Processing of Coordinated Media Campaigns,” Journal of Marketing Research, 26(2), 149-163.
Edell, Julie A. and Marian Chapman Burke. (1987), “The Power of Feelings in Understanding Advertising Effects,” Journal of Consumer Research, (14) December, 421-433.
Edell, Jullie A. and Richard Staelin (1983), “The Information Processing of Pictures in Print Advertisement,” Journal of Consumer Research, 10(June), 45-61.
Elliot, R. and Wattanasuwan, K. (1998), “Brands as symbolic resources for the construction of identity,” International Journal of Advertising, 17, 131-144.
Fishbein, Martin. (1963), “An Investigation of the relationships between beliefs about an object and the Attitude toward the object,” Human relations, 16, 233-240.
Fishbein, Martin., and Ajzen, Icek. (1975), Belief, Attitude, Intention, and Behavior: An Introduction to Theory and Research. Reading, MA: Addison-Wesley.
Fishbein, Martin., and Susan Middlestadt. (1995), “Non-cognitive Effects on Attitude Formation and Change: Fact or Artifact?” Journal of Consumer Psychology, 4(2), 181-202.
Ford, J. Brain. (1987). “Whither Volition?” American Psychologist, (November) 1030-1032.
Fournier, Susan. (1998), “Consumers and their Brands: Developing Relationship Theory in Consumer Research,” Journal of Consumer Research, 24 (4), 343-73.
Friedman, Hershey and Linda Friedman. (1979), “Endorser Effectiveness by Product Type,” Journal of Advertising Research, 19(5), 63-71.
Frierson Michael.(1994), Clay Animation: New York, Twayne Publishers.
Furniss Ruth Maureen, (1998), Art in Motion: Animation Aesthetics, Sydney: John Libbey and Company.
152
Furniss Ruth Maureen, (2006), “Animation,”http://encarta.msn.com/text_761567360_0/Animation.html, last accessed June 12, 2006.
Gardner, Meryl Paula.(1985), “Mood States and Consumer Behavior: A Critical Review”, Journal of Consumer Research, (12) December, 281-289.
Gardner, Meryl P., Andrew A. Mitchell, and J. Edward Russo (1985), “Low Involvement Strategies for Processing Advertisements,” Journal of Advertising, 14 (2), 4-12.
Garnham, A. (1981), “Mental models as Representations of Text,” Memory and Cognition, 9, 560-565.
Garretson A. Judith and Ronald W. Niedrich. (2004), “Spokes-Characters; Creating Character Trust and Positive Brand Attitudes,” Journal of Advertising, 33(2), Summer, 25-36.
Giannetti, D Louis. (1976), Understanding movies (2nd ed.). Englewood Cliffs, NJ: Prentice-Hall.
Giddens, Anthony. (1991), Modernity and self-identity, Cambridge: Polity Press.
Glenberg, A. M., Meyer, M., and Lindem, K. (1987), “Mental models contribute to foregrounding during text comprehension,” Journal of Memory and Language, 26, 69-83.
Goldstein, E. Bruce. (1989), Sensation and perception,(3rd ed.). Belmont, CA: Wadsworth.
Gormley, Richard. (1974), “A Note on Seven Brand Rating Scales and Subsequent Purchase,” Journal of the Market Research Society, 16(1), pp.242-244.
Gorn, Gerald J. (1982), “The Effects of Music in Advertising on Choice Behavior: A Classical Conditioning Approach,” Journal of Marketing, 46 (Winter), 94-101.
Gorn, Gerald J., Marvin E. Goldberg and Kunal Basu (1993), “Mood, Awareness, and Product Evaluation,” Journal of Consumer Psychology, 2(3), 237-256.
Gorn, Gerald. J., Jacobs, W. J. and Mana, M. J. (1987), “Observations on awareness and conditioning” in M. Wallendorf and P. F. Anderson (ed.). Advances in consumer research, 19, 415-416.
Greenwald, A. G. (1968), Cognitive Learning, Cognitive Response to Persuasion, and Attitude Change. In A. G. Greenwald, T. C. Brock, and T. M. Ostrom (Eds.), Psychological Foundations of Attitudes (pp. 147-170). New York: Academic Press.
153
Greenwald, M. K., Cook, E. W., and Lang, P. J. (1989). “Affective Judgment and Psychophysiological Response: Dimensional co-variation in the Evaluation of Pictorial Stimuli,” Journal of Psychophyslology, 3, 51-64.
Greenwald, Anthony. G., and Banaji, M. R. (1995), “Implicit Social Cognition: Attitudes, Self-Eesteem, and Stereotypes,” Psychological Review, 102, 4-27.
Greenwald, Anthony G. and Clark Leavitt. (1984), “Audience Involvement in Advertising: Four Levels,” Journal of Consumer Research, 11 (June): 581-592.
Greenwald, A. G., McGhee, D. E., and Schwartz, J. K. L. (1998), “Measuring individual differences in implicit cognition: The Implicit Association Test,” Journal of Personality and Social Psychology, 74, 1464-1480.
Gresham, Larry G. and Terence A. Shimp, (1985), “Attitude toward the Advertisement and Brand Attitudes: A Classical Conditioning Perspective,” Journal of Advertising, 14 (1), 10-17.
Gruber, Alin.(1970), “Purchase intent and purchase probability,” Journal of Advertising Research, 10(1), pp.23-27
Haley, R.I. and Case P.B. (1979), “Testing Thirteen Attitude Scales for Agreement and Brand Discrimination,” Journal of Marketing, 43 (Fall), 20-32.
Haugtvedt, Curtis P. (1989), “Persistence and Resistance of Communication-Induced Attitude Changes,” in Proceedings of the Society of Consumer Psychology, David Schumann, ed., Knoxville: University of Tennessee, 111-113.
Haugtvedt, Curtis P.and Richard E. Petty (1992), “Personality and Persuasion: Need for Cognition Moderates the Persistence and Resistance of Attitude Changes,” Journal of Personality and Social Psychology, 63 (2), 308-319.
Haugtvedt, Curtis P., David W. Schumann, Wendy L. Schneier, and Wendy L. Warren (1994), “Advertising Repetition and Variation Strategies: Implications for Understanding Attitude Strength,” Journal of Consumer Research, 21 (June), 176-189.
Heath Robert. (2001), “Low Involvement Processing-a new model of brand communication,” Journal of Marketing Communications, 7, 27-33.
Hershberger, W. (1987), “Of course there can be an empirical science of volitional action,” American Psychologist, 42, 1032-1033.
Hilgard, E. (1980). “The trilogy of mind: Cognition, affection, and conation,” Journal of the History of the Behavioral Sciences, 16, 107-117.
154
Hitchon, Jacqueline C. and Esther Thorson (1995), “Effects of Emotion and Product Involvement on the Experience of Repeated Commercial Viewing,” Journal of Broadcasting and Electronic Media, 39 (Summer), 377-390.
Holbrook, B. Morris. (1977), “Comparing Multiattribute Attitude Models by Optimal Scaling,” Journal of Consumer Research, 4 (December), 165-171.
Holbrook, B. Morris. (1978), “Beyond Attitude Structure: Toward the Informational Determinants of Attitude,” Journal of Marketing Research, 15, 545-556.
Holbrook, Morris B. and Rajeev Batra (1987), “Assessing the Role of Emotions as Mediators of Consumer Responses to Advertising,” Journal of Consumer Research, 14, (December), 404-420.
Holbrook, Morris B. and John O’Shaughnessy. (1984), “The Role of Emotion in Advertising”, Psychology and Marketing, (1), 45-64.
Homer, Pamela M. and Lynn R. Kahle.(1990), “Source Expertise, Time of Source Identification and Involvement in Persuasion: An Elaborative Processing Perspective,” Journal of Advertising, 19 (1): 30-39.
Homer, P.M., S.G. Yoon (1992), “Message Framing and the Interrelationships among Ad-Based Feelings, Affect, and Cognition,” Journal of Advertising, 21(1), 19-33.
Howell, David C. (1992), Statistical Methods for Psychology, Third Edition, Boston, MA: PWS-Kent Publishing Company.
Hoy, Maiea Grubbs., Clifford E. Young and John C. Mowen. (1986) “Animated Host-Selling Advertisements: Their Impact on Young Children’s Recognition, Attitudes, and Behavior,” Journal of Public Policy and Marketing, 5(1) 171-184.
Hoyer D.Wayne and Deborah J. MacInnis (2001), Consumer Behavior (2ed), Boston: Houghton Mifflin Company.
Hughes, G. D.(1967), “Selecting Scales to Measure Attitude Change,” Journal of Marketing Research, 4, pp. 85-87.
Huitt, W. (1999), “Success in the Information Age: A Paradigm Shift, Educational Psychology Interactive,” Valdosta, GA: Valdosta State University. http://chiron.valdosta.edu/whuitt/col/context/infoage.html, last accessed March 2, 2006.
Janiszewski, Chris (1988), “Preconscious Processing Effects: The Independence of Attitude Formation and Conscious Thought,” Journal of Consumer Research, 15 (September), 199-209.

155
Janiszewski, C., and Warlop, L. (1993), “The Influence of Classical Conditioning Procedures on Subsequent Attention to the Conditioned Brand,” Journal of Consumer Research, 20, 171-189.
John, George and Deborah L. Roedder (1981), “Reliability Assessment: Coefficients Alpha and Beta,” in the Changing Marketing Environment: New Theories and Applications. Kenneth Bernhardt et al. (ed.). Chicago, IL: American Marketing Association 154-157.
Johnson, B. T., and Eagly, A. H. (1989), “The Effects of Involvement on Persuasion: A meta-analysis,” Psychological Bulletin, 106, 290–314.
Johnson, B. T., and Eagly, A. H. (1990), “Involvement and Persuasion: Types, Traditions, and the Evidence,” Psychological Bulletin, 107, 375–384.
Johnson, H. H., and Scileppi, J. A. (1969), “Effects of ego-involvement conditions on attitude change to high and low credibility communicators,” Journal of Personality and Social Psychology, 13, 31–36.
Kahle, Lynn R. and Pamela Homer. (1985), “Physical Attractiveness of the Celebrity Endorser: A Social Adaptation Perspective,” Journal of Consumer Research, 11 (March), 954-961.
Kamins, Michael A. (1990), “An Investigation into the “Match-Up” Hypothesis in Celebrity Advertising: When Beauty May Be Only Skin Deep,” Journal of Advertising, 19 (1), 4-13.
Kane, R. (1985), “Free will and Values,” Albany: State University of New York Press.
Kanungo, Rabindra N (1968), “Brand awareness: effects of fittingness, meaningfulness, and product utility,” Journal of Applied Psychology, 52(4), 290-295.
Kanungo, Rabindra N., and Sam Pang (1973), “Effects of Human Models on Perceived Product Quality,” Journal of Applied Psychology, 57 (2), 172-178.
Kassarjian, Harold; Masao Nakanishi.(1967), “A Study of Selected Opinion Measurement Techniques,” Journal of Marketing Research, 4, pp.148-153.
Katz, D., and Stotland, E. (1959), “A preliminary statement to a theory of attitude structure and change”in Koch S. (ed.). Psychology: A study of a science. Vol 3. Formulations of the person and the social context (pp. 423-475). New York: McGraw-Hill.
Kelman, C Herbert. (1961), “Processes of Opinion Change,” Public Opinion Quarterly, 25 (1), 57-78.
156
Kim, John., Chris T. Allen, and Frank Kardes (1996), “An Investigation of the Mediational Mechanisms Underlying Attitudinal Conditioning,” Journal of Marketing Research, 33 (August), 318-328.
Kim, John., Jeen-Su Lim, and Mukesh Bhargava. (1998). “The Role of Affect in Attitude Formation: A Classical Conditioning Approach,” Journal of the Academy of Marketing Science, 26 (2): 142-152.
Kipper, Philip. (1986), “Television Camera Movement as a Source of Perceptual Information,” Journal of Broadcasting and Electronic Media, 30, 295-307.
Kosslyn,Stephen. M (1990), “Mental Imagery,” in Visual Cognition and Action: An Invitation to Cognitive Science,” Daniel N Osherson., Stephen M. Kosslyn., and John M. Hollerbach. Vol 2 (2nd ed.) Cambridge MA: MIT Press, 73-97.
Kover, Arthur J. and Joseph Abruzzo. (1993), “The Rossiter-Percy Grid And Emotional Response to Advertising: An Initial Evaluation”, Journal of Advertising Research, (6) November-December, 21-27.
Krech, D., and Crutchfield, R. S (1948), Theory and Problems in Social Psychology. New York: McGraw-Hill.
Krugman, Herbert E. (1965), “The impact of Television Advertising: Learning without Involvement,” Public Opinion Quarterly, 29, 349-356.
Krugman, Herbert E. (1971), “Brain Wave Measures of Media Involvement,” Journal of advertising Research, 11(1), 7-9.
Krugman, Herbert E. (1977), “Memory without Recall, Exposure without Perception,” Journal of advertising Research, 17(4), 7-12.
Kunzle, David (2006), “Cartoon,”http://encarta.msn.com/text_761560666_0/Cartoon.html, last accessed June 12, 2006.
Laczniak, Russell N. and Darrel D. Muehling (1990), “Delayed Effects of Advertising Moderated by Involvement,” Journal of Business Research, 20 (May), 263-277.
Laczniak, Russell N., Darrel D. Muehling, and Sanford Grossbart. (1989), “Manipulating Message Involvement in Advertising Research,” Journal of Advertising, 18(2), 28-38.
Laroche, Michel., Kim, Chankon., and Zhou, Lianxi.(1996), “Brand Familiarity and Confidence as Determinants of Purchase Intention: An Empirical Test in a Multiple Brand Context,” Journal of Business Research, 37 (October/November), 115-120.
157
Lang, Peter J. (1980). “Behavioral Treatment and Bio-behavioral Assessment Computer Applications” in Joseph B. Sidowski., James H. Johnson and Thomas A. Thomas (ed.). Technology in Mental Health Care Delivery Systems (pp.119-137), Norwood, NJ: Ablex.
Lang, Peter. J. (1995), “The Emotion Probe: Studies of Motivation and Attention,” American Psychologist, 50, 371-385.
Laurent, G. and Jean-Noel Kapferer (1985), “Measuring Consumer Involvement Profiles,” Journal of Marketing Research, 22 (February), 41-53.
Lavidge, Robert J. and Gary A. Steiner (1961), “A Model for Predictive Measurements of Advertising Effectiveness,” Journal of Marketing, 25 (4), 59-62.
Lazarus, Richard S. (1991), Emotion and Adaptation, New York: Oxford University Press.
Lazarus, Richard S. (1991), “Progress on a Cognitive-Motivational-Relational Theory of Emotion,” American Psychologist, (46) August, 819-833.
Lee, U. Paul. Alexander Klippel, and Heike Tappe. (2003), “The effect of motion in graphical user interfaces. In A. Butz, A. Krüger, P. Olivier (Eds.), Smart Grapics Third International Symposium, SG 2003, Heidelberg, Germany, July2-4, 2003, Proceedings, pp. 12–21, Lecture Notes in Computer Science.
Levin, Kenneth. D., Nichols, D. R., and Johnson, Blair. T. (2000), “Involvement and Persuasion: Attitude functions for the motivated processor” in Maio G. R. and Olson J. M. (ed.). Why we evaluate: Functions of attitudes (pp. 163-194). Mahwah, NJ: Erlbaum.
Little, Arlene H., Lewis P. Lipsitt, and Carolyn Rovee-Collier (1984), “Classical Conditioning and Retention of the Infant’s Eyelid Response: Effects of Age and Interstimulus Interval,” Journal of Experimental Child Psychology, 37, 512-524.
Lohtia, Ritu., Naveen Donthu., and Edmund k. Hershberger.(2003), “The Impact of Content and Design Elements on Banner Advertising Click-through Rates,” Journal of Advertising Research, 43(4): 410-419.
Lord, Kenneth R. and Robert E. Burnkrant. (1993), “Attention Versus Distraction: The Interactive Effect of Program Involvement and Attentional Devices on Commercial Processing,” Journal of Advertising, 22 (March): 47-60.
Lutz,Richard,J.(1985), “Affective and Cognitive Antecedents of Attitude Toward the Ad: A Conceptual Framework” in psychological Processes and Advertising Effects: Theory Research and Application, Alwitt L.F. and Michaell Andrew.A (ed.). Hillsdale, NJ: : Lawerence Erlbraum Associates, 45-63.
158
Lynch, James and Drue Schuler (1994), “The Match-up Effect of Spokesperson and Product Congruency: A Schema Theory Interpretation,” Psychology and Marketing, 11 (5), 417-445.
Machleit, Karen A. and R. Dale Wilson (1988), “Emotional Feelings and Attitude toward the Advertisement: The Roles of Brand Familiarity and Repetition,” Journal of Advertising, 17 (3), 27-35.
MacInnis, Deborah and Bernard J. Jaworski (1989), “Information Processing from Advertisements: Toward an Integrative Framework,” Journal of Marketing, 53 (October), 1-23.
MacInnis, Deborah and Douglas M. Stayman. (1993), “Focal and Emotional Integration: Constructs, Measures, and Preliminary Evidence,” Journal of Advertising, 17(4), December, 51-66.
MacInnis, Deborah and Whan Park. (1991). “The Differential Role of Characteristics of Music on High- and Low- Involvement Consumers’ Processing of Ads,” Journal of Consumer Research, 18(2), 161-173.
Mackenzie, Scott B., Richards J. Lutz and George E. Belch. (1986), “The Role of Attitude toward the Ad as a Mediator of Advertising Effectiveness: A test of Competing Explanations,” Journal of Marketing Research, 130-143.
Martindale, Colin (1991), Cognitive Psychology: A Neural Network Approach, Pacific Grove, CA: Brooks/Cole.
Mazur, James E. (1990), Learning and Behavior, Englewood Cliffs, NJ: Prentice Hall. McGrath M.John and Chad, Mahood (2004), The Impact of Arousing Programming and Product Involvement on Advertising effectiveness,” Journal of Current Issues and Research in Advertising, 26(2),41-52.
McCracken, Grant (1986), “Culture and Consumption: A Theoretical Account of the Structure and Movement of the Cultural Meaning of Consumer Goods,” Journal of Consumer Research, 13 (June), 71-84.
McLuhan, Marshall. (1964), Understanding Media: The Extensions of Man. New York: Mcgraw-Hill.
McSweeney, Francis K. and Calvin Bierley (1984), “Recent Developments in Classical Conditioning,” Journal of Consumer Research, 11 (September), 619-631.
Mehrabian, Albert. (1980), “Basic Dimensions for a General Psychological Theory,” OG7H Publishers, Cambridge Massachusetts.
Mehrabian, A., and Russell, J.A. (1974), “A Verbal Measure of Information Rate for Studies in Environmental Psychology,” Environment and Behavior, 6, 233-252.
159
Middlestadt, Susan E. (1990), “The Effect of Background and Ambient Color on Product Attitudes and Beliefs” in Advances in Consumer Research, Vol. 17, Marvin E. Goldberg et al. (ed.). Provo, UT: Association for Consumer Research, 244-49.
Miller, A. (1991). “Personality Types, Learning Styles and Educational Goals,” Educational Psychology, 11(3-4), 217-238.
Miniard, Paul W., Sunil Bhatla, Kenneth R. Lord, Peter R. Dickson, and H. Rao Unnava (1991), “Picture-Based Persuasion Processes and the Moderating Role of Involvement,” Journal of Consumer Research, 18 (June), 92-107.
Mischel, W. (1996), From good intentions to willpower. In P. Gollwitzer and J. Bargh (Eds.), The psychology of action (pp. 197-218). New York: Guilford Press.
Misra, Sasi and Subhash Jain (1971), “Effect of Fittingness, Goods and Type of Slogan on Brand Awareness,” Journal of Applied Psychology, 55(6), 580-5.
Mitchell, Andrew A. (1983), “The Effects of Visual and Emotional Advertising: An Information Processing Approach” in Advertising and Consumer Psychology, Larry Percy and Arch G. Woodside (ed.). Lexington MA: D.C. Heath, 197-217.
Mitchell,Andrew, A. (1986). “The effect of Verbal and Visual Components of advertisements on Brand Attitudes and Attitude toward the Advertisement,” Journal of Consumer Research, 13(June), 12-24.
Mitchell, Andrew A.(1993), “Attitude Toward the Advertisement Effects Over Time and in Attitude Change Situations” in Advertising Exposure, Memory and Choice, Mitchell A. Andrew (ed.). Hillsdale, NJ: Lawrence Erlbaum Associates, 209-238.
Mitchell, Andrew A. and Jerry C. Olson (1981), “Are Product Attribute Beliefs the Only Mediator of Advertising Effects on Brand Attitude?” Journal of Marketing Research, 18 (August), 318-32.
Mitchell, D.J., Kahn, B.E., and Knasko, S.C. (1995), “There’s something in the air: Effects of congruent and incongruent ambient odor on consumer decision-making,” Journal of Consumer Research, 22(September), 229 238.
Mittal, Banwari (1987), “A Framework for Relating Consumer Involvement to Lateral Brain Functioning” in Advances in Consumer Research, Vol. XIV, Melanie Wallendorf and Paul Anderson (ed.). Provo, UT: Association for Consumer Research, 41-45.
Mittal, Banwari and Myung S. Lee (1989), “A Causal Model of Consumer Involvement,” Journal of Economic Psychology, 10 (November), 363-389.
160
Moore, Danny L., and Hutchinson, J. Wesley.(1983), “The Effects of Ad Affect on Advertising Effectiveness” in Advances in Consumer Research, 10, Richard P. Bagozzi and Alice M. Tybout (ed.). Ann Arbor, MI: Association for Consumer Research.
Moore, Danny L., and Hutchinson, J. Wesley. (1985), “The Influence of Affective Reactions to Advertising: Direct and Indirect Mechanisms of Attitude Change” in Psychological Processes and Advertising Effects: Theory, Research and Application, Linda F. Alwitt and Mitchell A. Andrew (ed.). Hillsdale, NJ: Lawrence Erlbaum Associates, 65-87.
Morris, Jon D (1995). “Observations: SAM: The Self-Assessment Manikin; An Efficient Cross-Cultural Measurement of Emotional Response,” Journal of Advertising Research, November/December, 63-68.
Morris, Jon D., and James, S. McMullen. (1994), “Measuring Multiple Emotional Response to a Single Television Commercial,” Advances in Consumer Research, 21, 175-180.
Morris, Jon D., and Mary Anne Boone. (1995), “The Effects of Music on Emotional Response, Brand Attitude, and Purchase Intent in an Emotional Advertising Condition,” Advances Consumer Research, 25, 518-526.
Morris, Jon D., and C. Waine. (1993). “Managing the Creative Effort: Pre-Production and Post-Production Measures of Emotional Response,” In the Proceedings of the 1993 Conference of the American Academy of Advertising, American Academy of Advertising, 1993.
Movshon, J.A. (1990), “Visual processing of moving images,” In Images and Understanding, ed. M. Weston-Smith, H. B. Barlow and C. Blakemore. New York: Cambridge University Press.
Muehling, Darrel D. and Russell N. Laczniak (1988), “Advertising’s Immediate and Delayed Influence on Brand Attitudes: Considerations Across Message-Involvement Levels,” Journal of Advertising Research, 17 (4), 23-34.
NASSCOM 2002 Report (2002). The Nasscom-McKinsey Study 2002. http://www.nasscom.org/artdisplay.asp?Art_id=1225, last accessed June 2, 2006.
Neeley, M Sabrina and David W. Schumann. (2004), “Using animated spokes-characters in advertising to young children: Does increasing attention to advertising necessarily lead to product preference?” Journal of Advertising, 33(3), 7-22.
Nord, Walter R., and Peter, J. Paul. (1980), “A Behavior Modification Perspective on Marketing,” Journal of Marketing, 44(Spring), 36-47.
Nunnally, Jum C. (1978), Psychometric Theory, New York: McGraw-Hill.

161
O’Malley, Michael. (1981), “Feeling without Thinking? Reply to Zajonc,” The journal of Psychology, 108, 11-15.
Osgood, Charles E. (1969), “On the whys and wherefores of E, P, and A,” Journal of Personality and Social Psychology, 12, 194-199.
Osgood, Charles E, George, J Suci and Percy, H Tannenbaum. (1957), “The measurement of Meaning,” Urbana: University of Illinois Press.
Ostrom, T. M., and Brock, T. C. (1968). “A cognitive model of attitudinal involvement” in R. P. Abelson, E. Aronson, W. J. McGuire, T. M. Newcomb, M. J. Rosenberg, and P. H. Tannenbaum (ed.). Theories of cognitive consistency: A sourcebook (pp. 373–383). Chicago: Rand- McNally.
Page, Monte M. (1969), “Social Psychology of a Classical Conditioning of Attitudes Experiment,” Journal of Personality and Social Psychology, 11 (February), 177-86.
Paivio, Allan. (1971). Imagery and Verbal Processes, NewYork: Holt, Rinehart and Winston.
Park, C. Wham and Banwari Mittal (1985), “A theory of Involvement in Consumer Behavior: Problems and Issues,” in Research in Consumer Behavior, Vol. 1, Jagdish N. Sheth, ed. Greenwich, CT: JAI Press, 201-231.
Park, C. Whan and S. Mark Young (1986), “Consumer Response to Television Commercials: The Impact of Involvement and Background Music on Brand Attitude Formation,” Journal of Marketing Research, 23 (February), 11-24.
Pavlov, Ivan P. (1927), Conditioned Reflexes, Oxford: Oxford University Press.
Pavlov, Ivan P. (1928), Lectures on the Conditioned Reflex, translated by W. Horsely Gantt, New York: International Publishers.
Perdue, Barbara C. and John O. Summers. (1986), “Checking the success of manipulations in marketing experiments,” Journal of Marketing Research, 23(4), pp.1-14.
Petty, Richard E. and John T. Cacioppo. (1986), “The Elaboration Likelihood Model of Persuasion,” in Leonard Berkowitz (ed.), Advances in Experimental Social Psychology, 19, 124-181.
Petty, Richard E., John T, Cacioppo., and David Schumann. (1983), “Central and Peripheral Routes to Advertising Effectiveness: The Moderating Role of Involvement,” Journal of Consumer Research, 10 (September): 135-146.
Petty, Richard E., Rao Unnava and Alan Strathman (1991), “Theories of Attitude Change,” in Handbook of Consumer Behavior, eds. Thomas S. Robertson and Harold H. Kassarjian, New York: Prentice Hall, 241-280.

162
Pitt, Leyland F. and Russell Abratt (1988), “Music in Advertisements for Unmentionable Products-A Classical Conditioning Experiment,” International Journal of Advertising, 7, 130-137.
Plummer, Joseph and Rebecca Holman. (1981), “Communicating to the heart and/or mind”, paper presented to American Psychological Association, August.
Plutchik, Robert. (1980). “Emotion: A Psychoevolutionary Synthesis,” New York: Harper and Row.
Preston, Ivan L. and Esther Thorson (1984), “The Expanded Association Model: Keeping the Hierarchy Concept Alive,” Journal of Advertising Research, 24, 59-65.
Priluck, Grossman, Randi and Brian D. Till, (1998), “The Persistence of Classically Conditioned Brand Attitudes,” Journal of Advertising, 27(1), 23-31.
Priluck, Randi and Brian D. Till, (2004), “The Role of Contingency Awareness, Involvement, and Need for Cognition in Attitude Formation,” Journal of the Academy of Marketing Science, 32 (Summer 2004), pp. 329–44.
Putrevu, Sanjay and Lord, Kenneth R. (1994), Comparative and Noncomparative Advertising: Attitudinal Effects under Cognitive and Affective Involvement Conditions, Journal of Advertising, 23 (June), 77-90.
Ratchford, T. Brian (1987), “New Insights about The FCB Grid,” Journal of advertising Research, August/September, 24-38.
Ray, Michael L., Alan G. Sawyer, Michael L. Rothschild, Roger M. Heeler, Edward C. Strong, and Jerome B. Reed (1973), “Marketing Communication and the Hierarchy of Effects” in New Models for Mass Communication Research, Peter Clarke (ed.). Beverly Hills, CA: Sage Publishing, 147-176.
Reeves Byron and Clifford Nass. (1996), The Media Equation: How people treat computers, television, and new media like real people and places, Stanford, CA: CSLI Publications and Cambridge University Press.
Reeves, Thorson., Rothschild, McDonald., Hirsch, J., and Goldstein, R. (1985), “Attention to television: Intrastimulus effects of movement and scene changes on alpha variation over time,” International Journal of Neuroscience, 25, 241-255.
Rescorla, Robert A. (1988), “Pavlovian Conditioning: It’s Not What You Think It Is,” American Psychologist, 43 (March), 151-160.
Reyes, Robert M., Thompson, William C., and Bower, Gordon H. (1980), “Judgmental biases resulting from differing availabilities of arguments,” Journal of Personality and Social Psychology, 39(1), 2-12.
163
Rieber, Lioyd. (1991), “Animation, Incidental Learning, and Continuing Motivation,” Journal of Educational Psychology, 83, 318-328.
Rokeach, Milton. (1973), The nature of human values. New York: Free Press.
Roncarelli Robi. (2001), Market Outlook: Animation Industry Barrels Along,” Computer Graphics World, April, p.22.
Rossiter, John R., Larry Percy and Robert J. Donovan (1991), “A better Advertising Planning Grid,” Journal of Advertising Research, 31(5), 11-21.
Rossiter, John. R., and Larry. Percy. (1980), “Attitude Change through Visual Imaging in Advertising,” Journal of Advertising, 9(2), 10-16.
Rossiter,John, R.,and Larry, Percy. (1978), “Visual Imaging Ability as a Mediator of Advertising Response” in Keith H. Hunt (ed.). Advances in Consumer Research, Vol. (5). Ann Arbor: Association for Consumer Research, 621-628.
Russell, James A., and Mehrabian, A. (1977), “Evidence for a Three-Factor Theory of Emotions,” Journal of Research in Personality, 11, 273-294.
Russell, James A. (1989), “Measures of Emotion” in Robert, Plutchik and Henry. Kellerman. (ed.), Emotion: Theory, Research, and Experience, volume 4, the Measurement of Emotions (pp.83-111). San Diego, CA: Academic Press.
Shapiro Stewart and Deborah J. MacInnis. (1992), “Mapping the Relationship between Preattentive Processing and Attitudes” in Advances in Consumer Research, Vol. 19, John F. Sherry, Jr. and Brian Sternthal (ed.). Chicago, IL: Association for Consumer Research, 505-513.
Sherif, Carolyn,W. (1965), “Attitude and Attitude Change; the Social Judgment Involvement approach,” Philadelphia: Saunders.
Sherif, Carolyn W., Muzafer Sherif, and Roger E. Nebergall. (1965), “Attitude and attitude change: The social judgment-involvement approach,” Philadelphia: Saunders.
Sherif, Muzafer., and Cantril, Hadley. (1947), “The psychology of ego-involvements: Social attitudes and identifications,” New York: Wiley.
Shimp, Terence A. (1991), “The Role of Subject Awareness in Classical Conditioning: A Case of Opposing Ontologies and Conflicting Evidence” in Wallendorf, M., and Anderson P. F. (ed.). Advances in consumer research, 18, 158-163.
Shimp, Terence A. (1991), “Neo-Pavlovian Conditioning and Its Implications for Consumer Theory and Research” in Handbook of Consumer Behavior, Thomas S. Robertson and Harold H. Kassarjian (ed.). New York: Prentice Hall.
164
Shimp, Terence A., Eva M. Hyatt, and David J. Snyder (1991), “A Critical Appraisal of Demand Artifacts in Consumer Research,” Journal of Consumer Research, 18 (December), 273-283.
Shimp, Terence A., Elnora W. Stuart, and Randall W. Engle (1991), “A Program of Classical Conditioning Experiments Testing Variations in the Conditioned Stimulus and Context,” Journal of Consumer Research, 18 (June), 1-12.
Simon, Hendery. (2006), “Something from Nothing,” AdMedia, 21(1), 25-31.
Smith, Ruth A. (1991), “The Effects of Visual and Verbal Advertising Information on Consumers' Inferences,” Journal of Advertising, 20 (December), 13-24.
Solomon, Michael R., Richard D. Ashmore, and Laura C. Longo (1992), “The Beauty Match-Up Hypothesis: Congruence between Types of Beauty and Product Images in Advertising,” Journal of Advertising, 21 (December), 23-34.
Speed Richard and Peter Thompson. (2000). “Determinants of Sports Sponsorship Response,” Journal of the Academy of Marketing Science, 28(2), 226-238.
Stuart, Elnora W., Terence A. Shimp, and Randall W. Engle. (1990), “Classical Conditioning of Negative Attitudes,” Advances in Consumer Research, 17, 536-540.
Stuart, Elnora W., Terence A. Shimp and Randall W. Engle (1987), “Classical Conditioning of Consumer Attitudes: Four Experiments in an Advertising Context,” Journal of Consumer Research, 14 (December), 334-351.
Sundar.S Shyam., and Sriran Kalyanaranman, (2004), “Arousal, Memory, and Impression-Formation Effects of Animation Speed in Web Advertising,” Journal of Advertising, 33(1), 7-17.
Testa, Thomas J. (1974), “Causal Relationships and the Acquisition of Avoidance Responses,” Psychological Review, 81 (6), 491-505.
Thorson, Esther and Thomas J. Page, Jr. (1988), “Effect of Product Involvement and Emotional Commercials on Consumers’ Recall and Attitudes,” In Sidney. Hecker and David W. Srewart (Eds.), Nonverbal Communication in Advertising (pp.111-126), Lexington, MA: Lexington Press.
Till, Brian D, and Michael Busler. (2000), “The Match-Up Hypothesis: Physical Attractiveness, Expertise, and The Role of Fit on Brand Attitude, Purchase Intent and Brand Beliefs,” Journal Of Advertising, 29(3),1-13.
Triandis, Harry. C. (1971). Attitude and attitude change. New York: Wiley.
165
Tsal, Yehoshua (1985), “Effects of Verbal and Visual Information on Brand Attitudes,” Advances in Consumer Research Volume 12, Elizabeth C. Hirschman and Morris B. Holbrook (Eds.), Provo, UT: Association for Consumer Research, 265-267.
Tsal, Yehoshua (1985), “On the Relationship between Cognitive and Affective Processes: A Critque of Zajonc and Markus,” Journal of Consumer Research, 12, December, 358-362.
Van Auken, Stuart and Subhash.C. Lonial. (1985), “Children’s Perceptions of Characters: Human versus Animate Assessing Implications for Children’s Advertising”, Journal of Advertising, 14(2),13-61.
Vaugan, Richad. (1980), “How Advertising Works: A Planning Model,” Journal of advertising Research, 20(4), 27-33.
Vaugan, Richad. (1986), “How Advertising Works: A Planning Model Revised,” Journal of advertising Research, 26(1), 57-66.
Watts, William A. and Lewis E. Holt (1979), “Persistence of Opinion Change Induced Under Conditions of Forewarning and Distraction,” Journal of Personality and Social Psychology, 37 (5), 778-789.
Wegener Duane T. and Donal E. Carlston. (2005), “Cognitive processes in attitude formation and change” in Albarracin D., B. Johnson, and M. Zanna (ed.). The handbook of attitudes and attitude change (pp. 493-542). Mahwah, NJ: Erlbaum.
Weinberger, Marc G. and Spotts, Harlan E. (1989), “Humor in U.S. Versus U.K. TV Commercials: A Comparison, Journal of Advertising,18, p.39-45.
Weinstein, Sidney., Valentine Appel., and Curt Weinstein (1980), “Brain-Activity Responses to Magazine and Television Advertising,” Journal of advertising Research, 20(3), 57-63.
White, R.W.(1959), “Motivation Reconsidered: The Concept of Competence,” Psychological Review, 66, 297-333.
Willson, Karina. (2005), “Animation,” http://www.mediaknowall.com/animation.html, last accessed May 12, 2006.
Wyer, Robet.S. (1970), “The Prediction of Evaluations of Social Occupations as a Function the Favorableness, Relevance and Probability Associated with Attributes of these Occupations,” Sociometry,(33), 79-66.
Wyer, Robert.S., and Albarracín, Dolores. (2004), “Belief Structure” in the Handbook of Attitudes, Albarracín, D., Johnson, B.T., and Zanna, M.P. (ed.). Mahwah, N.J. Lawrence Erlbaum Assoc Inc.

166
Wyer, Robert. S., and Radvansky, Gabriel. A. (1999), “The Comprehension and Validation of Social Information,” Psychological Review, 106, 89-118.
Yoo, Chan Yun., Kihan Kim and Patricia A. Stout.(2004), “Assessing the Effects of Animation in Online Banner Advertising: Hierarchy of Effects,” Journal of Interactive Advertising,4(2),http://www.jiad.org/vol4/no2/yoo/index.htm, last accessed May 12, 2006.
Zaichkowsky, Judith Lynne (1985), “Measuring the Involvement Construct,” Journal of Consumer Research, 12 (December), 342-352.
Zaichkowsky, Judith Lynne (1986), “Conceptualizing Involvement,” Journal of Advertising, 15 (2), 4-14.
Zajonc, Robert B., Paula Pietromonaco, and John Bargh (1982), “Independence and Interaction of Affect and Cognition” in Affect and Cognition, Margaret S. Clark and Susan T. Fiske. (ed.). Hillsdale, NJ: Lawrence Erlbaum Associates, 211-27.
Zajonc, Robert B. and Hazel Markus (1982), “Affective and Cognitive Factors in Preferences,” Journal of Consumer Research, 9 (September), 123-131.
Zeitlin M. David and Richard A. Westwood. (1986). “Measuring Emotional Response,” Journal of Advertising Research, 26 (October/November), 34-44.
Zellner, Debra A., Paul Rozin, Michael Aron and Carol Kulish (1983), “Conditioned Enhancement of Human’s Liking for Flavor by Pairing with Sweetness,” Learning and Motivation, 14, 338-350.
Zettl, Herbert. (1990), “Sight, Sound, Motion: Applied Media Aesthetics,” (2ed). Belmont, California: Wadsworth Publishing Company.
Zinkhan, George M. and Aydin Muderrisoglu. (1985), “Involvement, familiarity, cognitive differentiation, and advertising recall: a test of convergent and discriminant validity: in E.C. Hirschman and M.B. Holbrook (eds.). Advances in Consumer Research, 12, pp.356-361. Provo, Utah: Association for Consumer Research.

167
BIOGRAPHICAL SKETCH
ChangHyun Jin received his Bachelor of Arts degree in creative writing at
ChuGye Art for University and his master’s degree in advertising at Hankuk University
of Foreign Studies (Seoul, South Korea). He worked in an advertising agency as an
advertising manager and he was a data analyst at the research company, specializing in
marketing research and public opinion.
After that, he came to the United States and completed a master’s degree
specializing in advertising at the University of Texas at Austin. In fall of 2003, he entered
a Ph.D. program in the College of Journalism and Communications at the University of
Florida. He is trying to open a new door of advertising research and teaching.