animation and gaming (1)
Post on 21-Oct-2014
1.329 views
DESCRIPTION
TRANSCRIPT
www.deloitte.com/in
Animation. Broadcasting. Gaming.On the Cusp of Growth
Contents
Message 3
About ASSOCHAM 5
Animation and Gaming 6 Introduction 6 Global Animation and Gaming Industry 6 Indian Animation and Gaming Industry 8
Animation 9 Introduction 9 Animation Entertainment 9 Entertainment VFX 16 Custom Content Development 17
Gaming 20 Global Gaming Industry 20 Indian Gaming Industry 20
Indian Animation & Gaming Industry: Future Outlook 23
Television 24 Introduction 24 Television – Revenue Streams 24 Television Channels in India 27 Television Genres in India – From Generic to Niche 27 Policy Framework 30 Future Outlook 31
Radio 32 Introduction 32 Key Growth Drivers & Constraints 33 Future Outlook 34
2
Message
The three focus segments of this paper: Animation, Gaming and Broadcasting all have the potential to see near future as inflection points in their growth.
Animation and Gaming reminds me of the transformation the IT-ITES Industry brought to the Indian economy and populace some years back. The Indian animation industry is well-geared to start grabbing a larger share of the increasing outsourcing pie. As the economy moves out of tough times, there is hope that animation houses in India would take the initiative to develop the in-pipeline high budget high quality movies and animation content and showcase their capabilities. Players are also expected to leverage the incoming 3G technology and develop end-to-end mobile games (IPs). Promoting gaming / animation as a career in India and working with the Government for higher dissemination of related professional education hold the key.
As of now, Television, as evident from Indian and global experiences, does not have a real substitute for either the audience or the advertiser. However, with the unprecedented growth of channels in India, only the players who invest in understanding the consumer and target pre-determined segments with innovative content and programming are slated to emerge winners, leaving the others behind. Digitization will be the most rapidly growing trend in this industry – Players need to understand the implications and adapt themselves to
this growing phenomenon. It will be really interesting to see if the industry witnesses any consolidation in the coming 12-18 months. Another key thing that I am really awaiting is the reaction of the content providers in the industry to the oncoming 3G Wave.
The future of radio in this country is primarily dependent upon change in the regulations and the mode of the much-awaited Phase 3 Licensing. The real potential of the medium which lies in its local reach and interactivity can never be realized unless radio broadcasting players find it commercially feasible to operate in small towns and cities, with the freedom to broadcast multiple genres.
Our media spends are abysmally low (USD 4 per capita) compared to our neighbours, China (USD 27 per capita). There is enough demand in the Indian economy and populace to propel the media industry to show a > 15% growth per annum and slowly bridge this yawning gap.
I acknowledge the contribution of Sandip Biswas, Director, Deloitte Touche Tohmatsu India Private Limited to this report.
P N SudarshanSenior Director, Deloitte in India
P N SudarshanSenior Director, Deloitte in India
Animation. Broadcasting. Gaming. On the Cusp of Growth | 3
Message
The Indian Media and Entertainment (M&E) industry stood at USD 12.9 billion in 2009 registering a 1.4 per cent growth over last year. Over the next five years, the industry is projected to grow at a compound annual growth rate (CAGR) of 13 per cent to reach the size of USD 24.04 billion by 2014. Additionally, the gaming segment is expected to be the fastest growing sector in the M&E industry. The sector showed a 22 per cent growth in 2009 and is expected to grow at a CAGR of 32 per cent to reach USD 705.2 million by 2014, while the animation segment is expected to record a CAGR of 18.7 per cent in the next five years.
We are pleased to organise the fourth edition of Global Summit on Entertainment& Media: FOCUS 2010 with the Official Support from the Ministry of Information & Broadcasting, the major Film Trade Associations and active participation from the Industry.
This White Paper, jointly prepared by ASSOCHAM and Deloitte Touche Tohmatsu India Private Limited, mainly deals with Animation, Broadcasting and Gaming and also the future roadmap for the Industry.
I sincerely hope that FOCUS 2010 will be beneficial to the stakeholders in further promoting this Industry.
(D S Rawat)Secretary General, ASSOCHAM
D S RawatSecretary General, ASSOCHAM
4
About ASSOCHAM
The Associated Chambers of Commerce and Industry of India (ASSOCHAM), India's premier apex chamber covers a membership of over 300,000 companies and professionals across the country. It was established in 1920 by promoter chambers (Bombay Chamber of Commerce & Industry, Cochin Chamber of commerce & Industry, India Merchants Chamber, Mumbai, The Madras Chamber of Commerce & Industry, PHD Chamber of Commerce & Industry) representing all regions of India.
As an apex industry body, ASSOCHAM represents the interests of industry and trade, interfaces with Government on policy issues and interacts with counterpart international organizations to promote bilateral economic issues. ASSOCHAM is represented on all national and local bodies and is, thus, able to pro-actively convey industry viewpoints, as also communicate and debate issues relating to public-private partnerships for economic development.
ASSOCHAM members represent the following sectors: • Trade(NationalandInternational)• Industry(DomesticandInternational)• Professionals(e.g.CAs,lawyers,consultants)• TradeandIndustryAssociationsandotherChambers
of Commerce
ASSOCHAM operates through 90 Expert Committees that provide an interactive platform to Members for interaction and aid formulating Policy recommendations so as to facilitate Economic, Industrial and Social Growth.
These encompass areas such as: Domestic & International Trade, Commerce, Industry, Services, Agriculture, Education, Food Processing, IT & BPO, Economic Affairs, TQM, Energy, Environment, Capital Market, Banking & Finance, Direct & Indirect Taxation, WTO & IPR, Infrastructure, Pharma, Health, Biotechnology & Nanotechnology , Tourism and Telecom.
Leading Corporates like Aditya Birla Management Corporation Ltd., Boeing, DLF, IBM, Reliance Communications, Reliance Industries, TATA, Northrop Grumman, Cable & Wireless, Warburg Pincus, SREI Infocom, Ernst & Young, Huawei Telecommunications, ZTE Telecom, Qualcomm, Centurion Bank of Punjab Limited, Diageo India Pvt. Ltd., DSP Merrill Lynch, Geojit Financial Services Ltd., GMR Infrastructure Ltd, ITC Limited, Jet Airways (India) Private Limited, Kotak Mahindra Asset Management Co. Ltd, Microsoft, Spice Communications Pvt. Ltd., Videocon Ltd., Vodafone are some of the Esteemed Members of ASSOCHAM.
About ASSOCHAM please log on www.assocham.org
Animation. Broadcasting. Gaming. On the Cusp of Growth | 5
Animation and Gaming
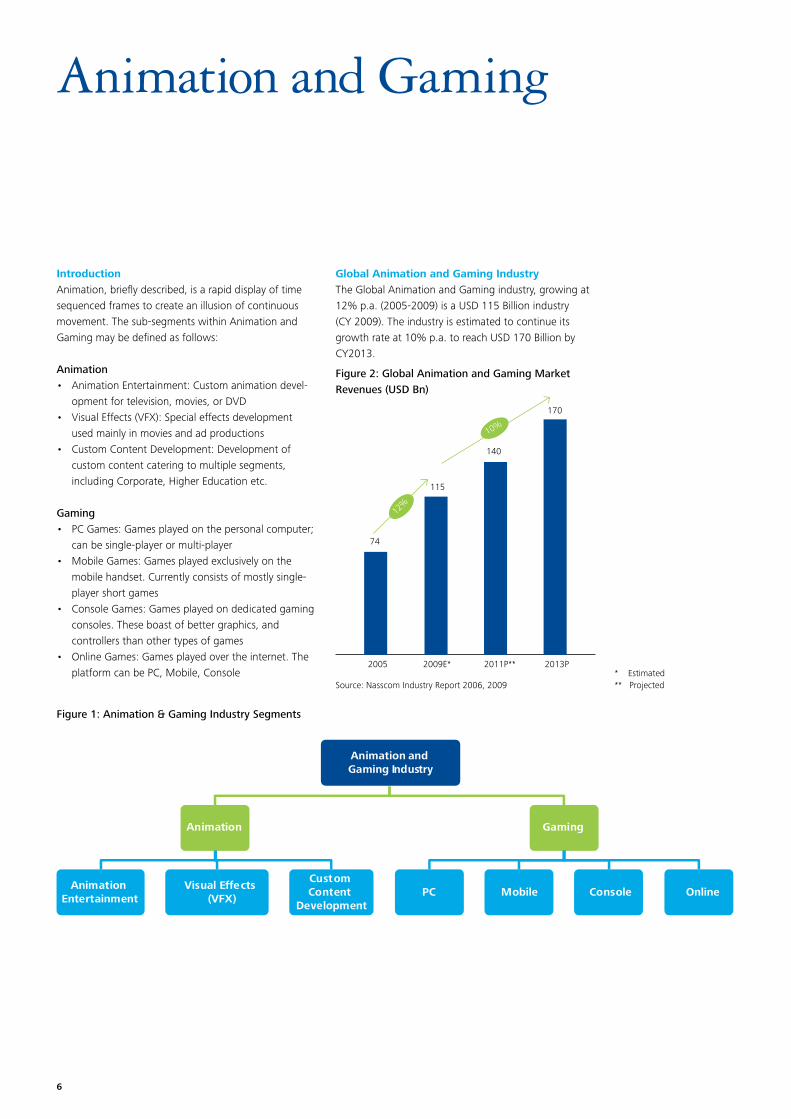
IntroductionAnimation, briefly described, is a rapid display of time sequenced frames to create an illusion of continuous movement. The sub-segments within Animation and Gaming may be defined as follows:
Animation• AnimationEntertainment:Customanimationdevel-
opment for television, movies, or DVD• VisualEffects(VFX):Specialeffectsdevelopment
used mainly in movies and ad productions• CustomContentDevelopment:Developmentof
custom content catering to multiple segments, including Corporate, Higher Education etc.
Gaming• PCGames:Gamesplayedonthepersonalcomputer;
can be single-player or multi-player• MobileGames:Gamesplayedexclusivelyonthe
mobile handset. Currently consists of mostly single-player short games
• ConsoleGames:Gamesplayedondedicatedgamingconsoles. These boast of better graphics, and controllers than other types of games
• OnlineGames:Gamesplayedovertheinternet.Theplatform can be PC, Mobile, Console
Global Animation and Gaming IndustryThe Global Animation and Gaming industry, growing at 12% p.a. (2005-2009) is a USD 115 Billion industry (CY 2009). The industry is estimated to continue its growth rate at 10% p.a. to reach USD 170 Billion by CY2013.
Figure 1: Animation & Gaming Industry Segments
Animation and Gaming Industry
Animation
Animation Entertainment
Visual Effects (VFX)
Custom Content
Development
Gaming
PC Mobile Console Online
Figure 2: Global Animation and Gaming Market Revenues (USD Bn)
115
140
170
74
2005 2011P**2009E* 2013P
Source: Nasscom Industry Report 2006, 2009
12%
10%
* Estimated** Projected
6
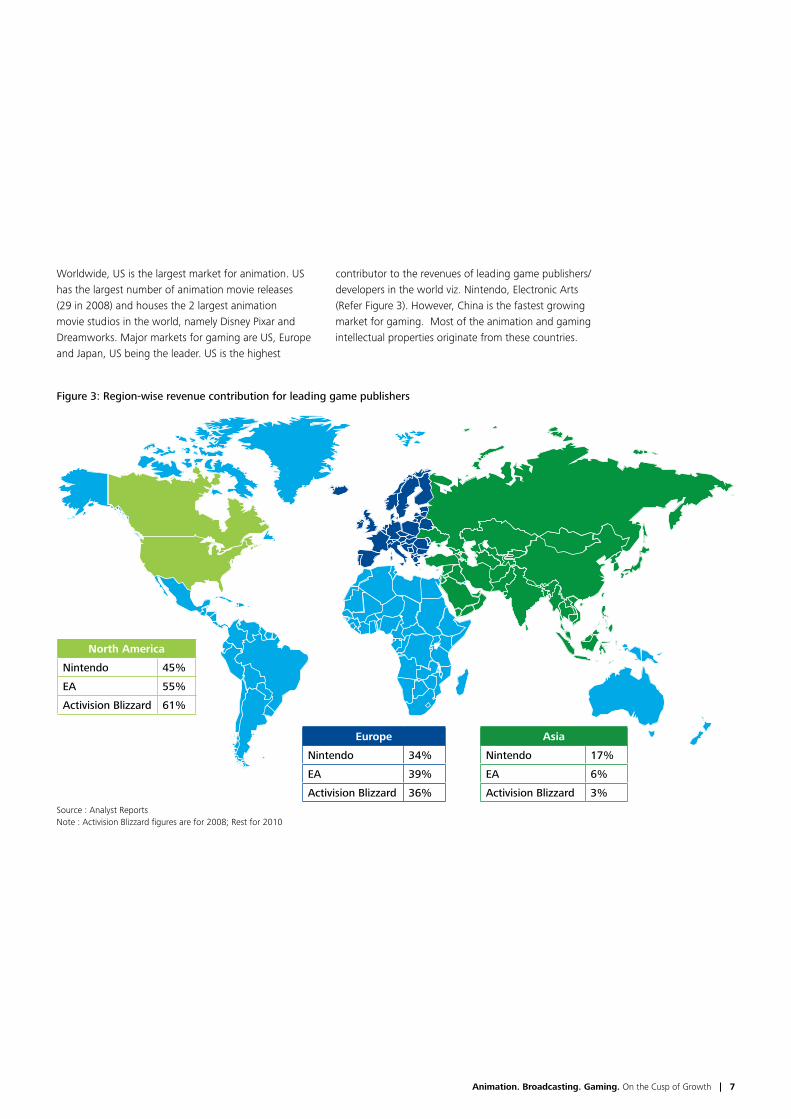
Worldwide, US is the largest market for animation. US has the largest number of animation movie releases (29 in 2008) and houses the 2 largest animation movie studios in the world, namely Disney Pixar and Dreamworks. Major markets for gaming are US, Europe and Japan, US being the leader. US is the highest
contributor to the revenues of leading game publishers/ developers in the world viz. Nintendo, Electronic Arts (Refer Figure 3). However, China is the fastest growing market for gaming. Most of the animation and gaming intellectual properties originate from these countries.
Figure 3: Region-wise revenue contribution for leading game publishers
Source : Analyst ReportsNote:ActivisionBlizzardfiguresarefor2008;Restfor2010
North America
Nintendo 45%
EA 55%
Activision Blizzard 61%
Europe
Nintendo 34%
EA 39%
Activision Blizzard 36%
Asia
Nintendo 17%
EA 6%
Activision Blizzard 3%
Animation. Broadcasting. Gaming. On the Cusp of Growth | 7
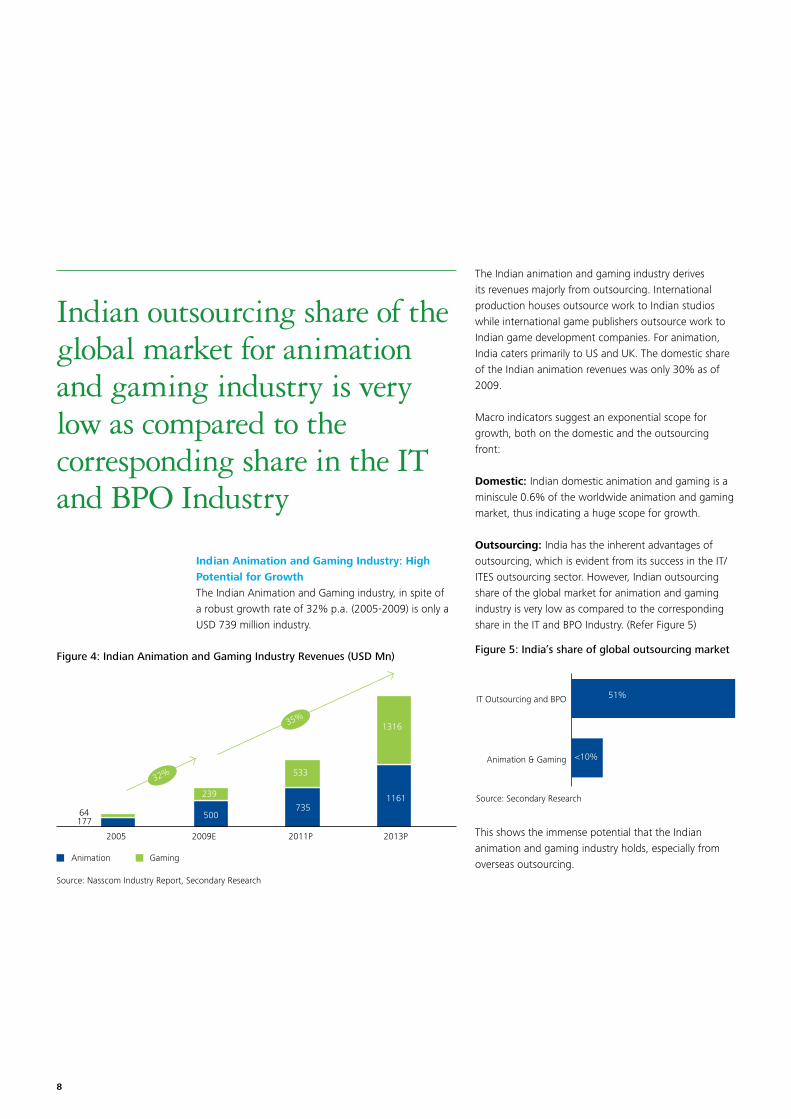
Indian Animation and Gaming Industry: High Potential for GrowthThe Indian Animation and Gaming industry, in spite of a robust growth rate of 32% p.a. (2005-2009) is only a USD 739 million industry.
The Indian animation and gaming industry derives its revenues majorly from outsourcing. International production houses outsource work to Indian studios while international game publishers outsource work to Indian game development companies. For animation, India caters primarily to US and UK. The domestic share of the Indian animation revenues was only 30% as of 2009.
Macro indicators suggest an exponential scope for growth, both on the domestic and the outsourcing front:
Domestic: Indian domestic animation and gaming is a miniscule 0.6% of the worldwide animation and gaming market, thus indicating a huge scope for growth.
Outsourcing: India has the inherent advantages of outsourcing, which is evident from its success in the IT/ ITES outsourcing sector. However, Indian outsourcing share of the global market for animation and gaming industry is very low as compared to the corresponding share in the IT and BPO Industry. (Refer Figure 5)
This shows the immense potential that the Indian animation and gaming industry holds, especially from overseas outsourcing.
Figure 4: Indian Animation and Gaming Industry Revenues (USD Mn)Figure 5: India’s share of global outsourcing market
Indian outsourcing share of the global market for animation and gaming industry is very low as compared to the corresponding share in the IT and BPO Industry
Source: Nasscom Industry Report, Secondary Research
17764
2005 2009E 2011P 2013P
32%
35%
500735
1161 Source: Secondary Research
51%
<10%
IT Outsourcing and BPO
Animation & Gaming
Animation Gaming
239
533
1316
8
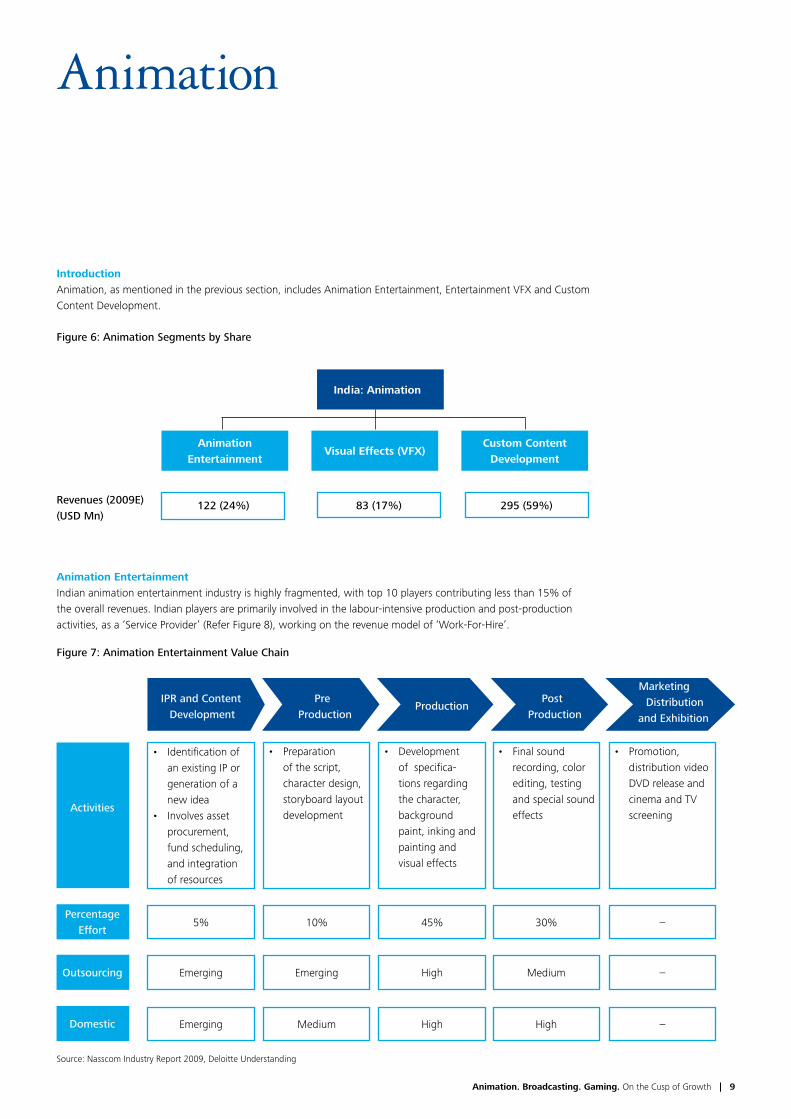
IntroductionAnimation, as mentioned in the previous section, includes Animation Entertainment, Entertainment VFX and Custom Content Development.
Animation EntertainmentIndian animation entertainment industry is highly fragmented, with top 10 players contributing less than 15% of the overall revenues. Indian players are primarily involved in the labour-intensive production and post-production activities, as a ‘Service Provider’ (Refer Figure 8), working on the revenue model of ‘Work-For-Hire’.
Figure 6: Animation Segments by Share
Revenues (2009E) (USD Mn)
122 (24%) 83 (17%) 295 (59%)
Figure 7: Animation Entertainment Value Chain
India: Animation
Animation Entertainment
Visual Effects (VFX)Custom Content
Development
ProductionIPR and Content
DevelopmentPre
ProductionPost
Production
Marketing Distribution
and Exhibition
Activities
Percentage Effort
Outsourcing
Domestic
Source: Nasscom Industry Report 2009, Deloitte Understanding
• Identificationofan existing IP or generation of a new idea
• Involvesassetprocurement, fund scheduling, and integration of resources
• Preparationof the script, character design, storyboard layout development
• Developmentof specifica-tions regarding the character, background paint, inking and painting and visual effects
• Finalsoundrecording, color editing, testing and special sound effects
• Promotion,distribution video DVD release and cinema and TV screening
5% 10% 45% 30% –
Emerging Emerging High Medium –
Emerging Medium High High –
Animation
Animation. Broadcasting. Gaming. On the Cusp of Growth | 9

Content Development and pre-production activities are nascent in India, both for the domestic and the outsourcing market.
Figure 8 : Animation Entertainment Service Models
Content Creation Service Provider
Integrated Studio – Offshore Facility
Co-Production
Integrated Studio Owned Content
IPR and Content Development
Pre Production ProductionPost
Production
Marketing Distribution and
Exhibition
Source: Animation & Gaming Report, Secondary Research
10
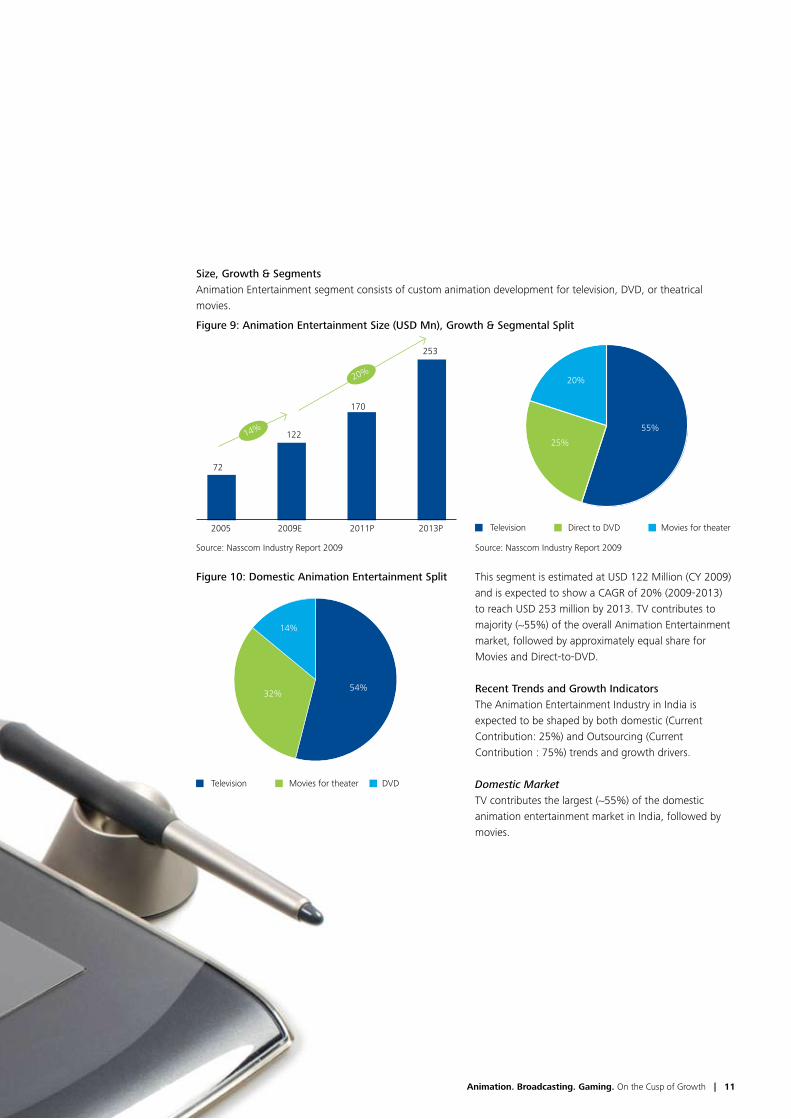
Size, Growth & SegmentsAnimation Entertainment segment consists of custom animation development for television, DVD, or theatrical movies.
This segment is estimated at USD 122 Million (CY 2009) and is expected to show a CAGR of 20% (2009-2013) to reach USD 253 million by 2013. TV contributes to majority (~55%) of the overall Animation Entertainment market, followed by approximately equal share for Movies and Direct-to-DVD.
Recent Trends and Growth IndicatorsThe Animation Entertainment Industry in India is expected to be shaped by both domestic (Current Contribution: 25%) and Outsourcing (Current Contribution : 75%) trends and growth drivers.
Domestic MarketTV contributes the largest (~55%) of the domestic animation entertainment market in India, followed by movies.
Figure 9: Animation Entertainment Size (USD Mn), Growth & Segmental Split
Television Direct to DVD Movies for theater
55%
25%
20%
Source: Nasscom Industry Report 2009
2005
72
122
170
253
2009E 2011P 2013P
14%
20%
Source: Nasscom Industry Report 2009
Figure 10: Domestic Animation Entertainment Split
Television Movies for theater DVD
54%32%
14%
Animation. Broadcasting. Gaming. On the Cusp of Growth | 11
Both demand and supply drivers are expected to shape up the domestic animation entertainment market in India:
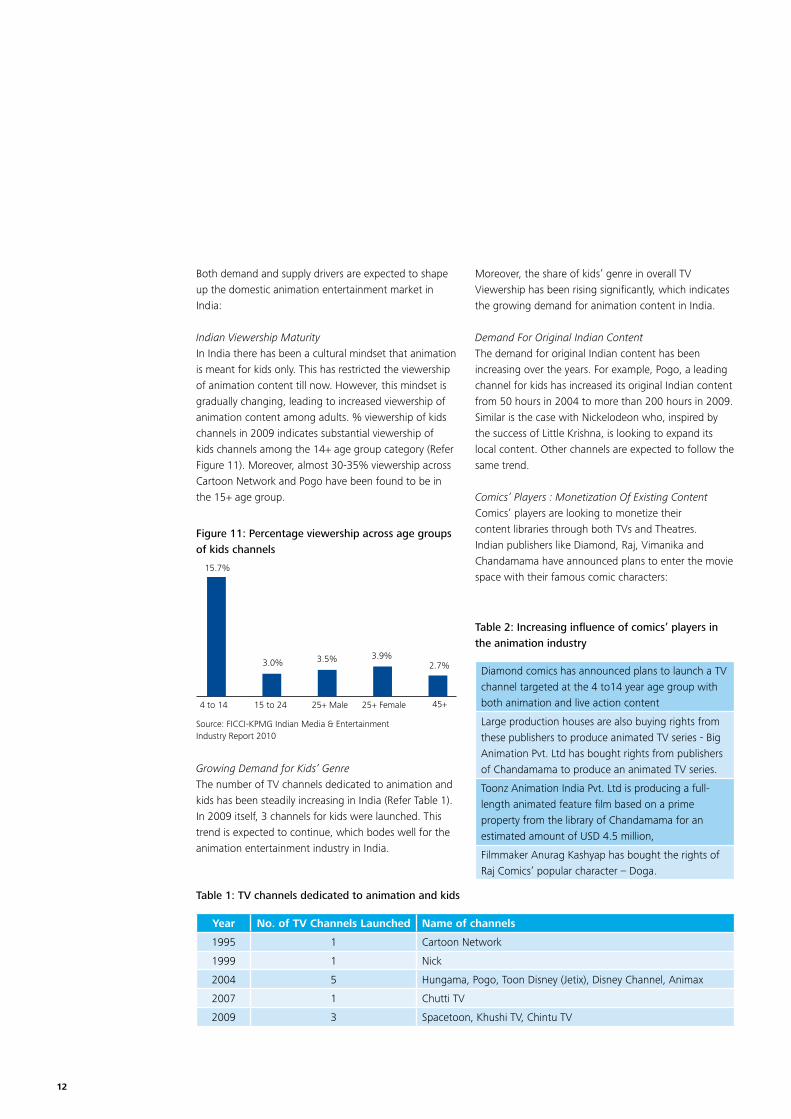
Indian Viewership MaturityIn India there has been a cultural mindset that animation is meant for kids only. This has restricted the viewership of animation content till now. However, this mindset is gradually changing, leading to increased viewership of animation content among adults. % viewership of kids channels in 2009 indicates substantial viewership of kids channels among the 14+ age group category (Refer Figure 11). Moreover, almost 30-35% viewership across Cartoon Network and Pogo have been found to be in the 15+ age group.
Growing Demand for Kids’ GenreThe number of TV channels dedicated to animation and kids has been steadily increasing in India (Refer Table 1). In 2009 itself, 3 channels for kids were launched. This trend is expected to continue, which bodes well for the animation entertainment industry in India.
Moreover, the share of kids’ genre in overall TV Viewership has been rising significantly, which indicates the growing demand for animation content in India.
Demand For Original Indian ContentThe demand for original Indian content has been increasing over the years. For example, Pogo, a leading channel for kids has increased its original Indian content from 50 hours in 2004 to more than 200 hours in 2009. Similar is the case with Nickelodeon who, inspired by the success of Little Krishna, is looking to expand its local content. Other channels are expected to follow the same trend.
Comics’ Players : Monetization Of Existing ContentComics’ players are looking to monetize their content libraries through both TVs and Theatres. Indian publishers like Diamond, Raj, Vimanika and Chandamama have announced plans to enter the movie space with their famous comic characters:
Year No. of TV Channels Launched Name of channels
1995 1 Cartoon Network
1999 1 Nick
2004 5 Hungama, Pogo, Toon Disney (Jetix), Disney Channel, Animax
2007 1 Chutti TV
2009 3 Spacetoon, Khushi TV, Chintu TV
Table 1: TV channels dedicated to animation and kids
Diamond comics has announced plans to launch a TV channel targeted at the 4 to14 year age group with both animation and live action content
Large production houses are also buying rights from these publishers to produce animated TV series - Big Animation Pvt. Ltd has bought rights from publishers of Chandamama to produce an animated TV series.
Toonz Animation India Pvt. Ltd is producing a full-length animated feature film based on a prime property from the library of Chandamama for an estimated amount of USD 4.5 million,
Filmmaker Anurag Kashyap has bought the rights of Raj Comics’ popular character – Doga.
Table 2: Increasing influence of comics’ players in the animation industry
Figure 11: Percentage viewership across age groups of kids channels
4 to 14
15.7%
3.0% 3.5% 3.9%2.7%
15 to 24 25+ Male 25+ Female 45+
Source: FICCI-KPMG Indian Media & Entertainment Industry Report 2010
12
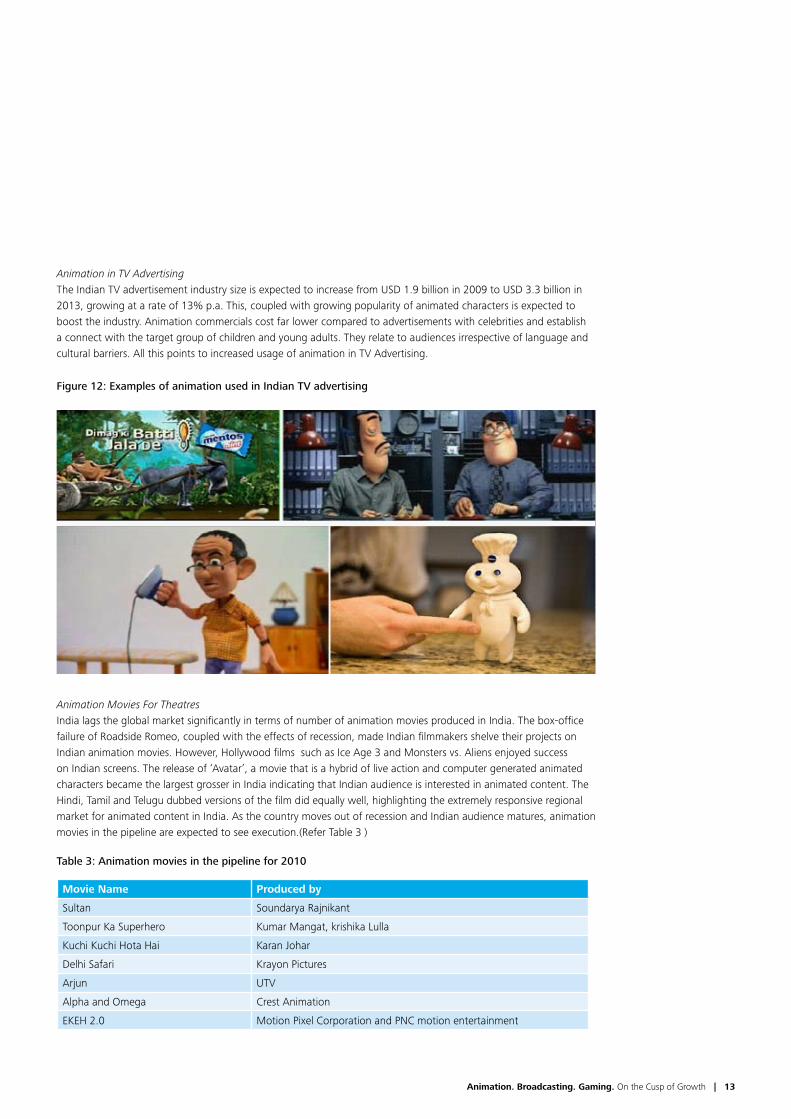
Animation in TV AdvertisingThe Indian TV advertisement industry size is expected to increase from USD 1.9 billion in 2009 to USD 3.3 billion in 2013, growing at a rate of 13% p.a. This, coupled with growing popularity of animated characters is expected to boost the industry. Animation commercials cost far lower compared to advertisements with celebrities and establish a connect with the target group of children and young adults. They relate to audiences irrespective of language and cultural barriers. All this points to increased usage of animation in TV Advertising.
Animation Movies For TheatresIndia lags the global market significantly in terms of number of animation movies produced in India. The box-office failure of Roadside Romeo, coupled with the effects of recession, made Indian filmmakers shelve their projects on Indian animation movies. However, Hollywood films such as Ice Age 3 and Monsters vs. Aliens enjoyed success on Indian screens. The release of ‘Avatar’, a movie that is a hybrid of live action and computer generated animated characters became the largest grosser in India indicating that Indian audience is interested in animated content. The Hindi, Tamil and Telugu dubbed versions of the film did equally well, highlighting the extremely responsive regional market for animated content in India. As the country moves out of recession and Indian audience matures, animation movies in the pipeline are expected to see execution.(Refer Table 3 )
Figure 12: Examples of animation used in Indian TV advertising
Movie Name Produced by
Sultan Soundarya Rajnikant
Toonpur Ka Superhero Kumar Mangat, krishika Lulla
Kuchi Kuchi Hota Hai Karan Johar
Delhi Safari Krayon Pictures
Arjun UTV
Alpha and Omega Crest Animation
EKEH 2.0 Motion Pixel Corporation and PNC motion entertainment
Table 3: Animation movies in the pipeline for 2010
Animation. Broadcasting. Gaming. On the Cusp of Growth | 13
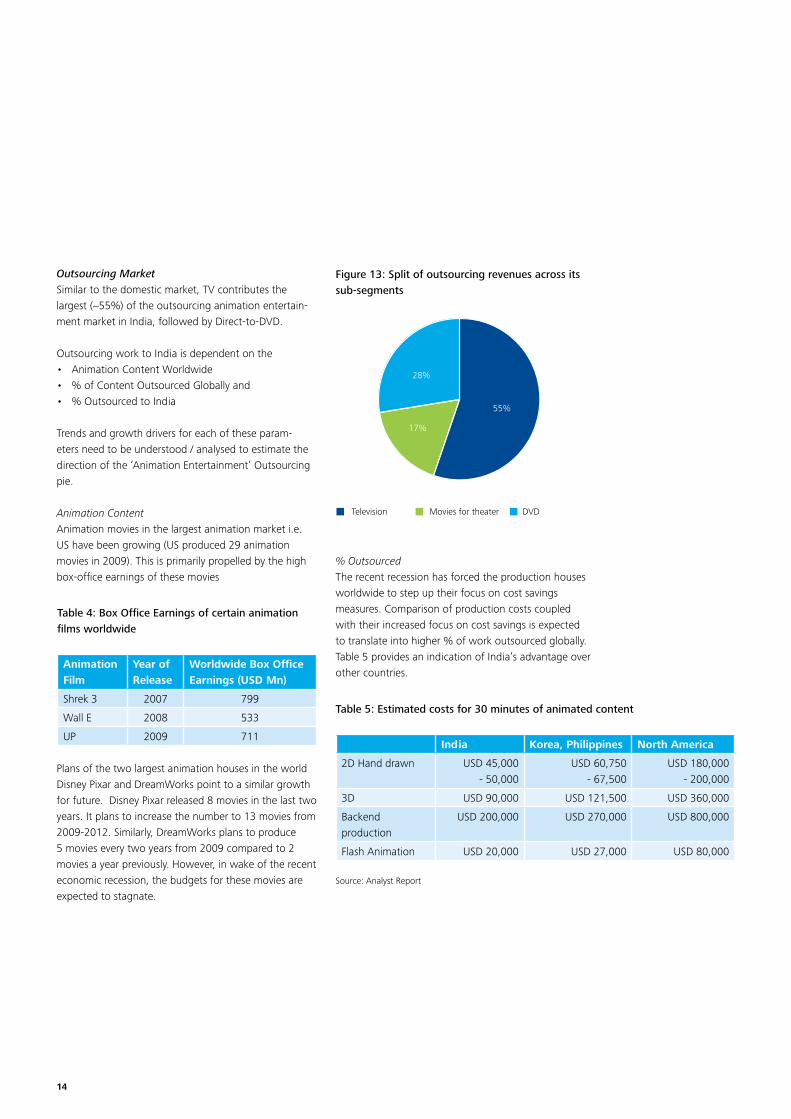
Outsourcing MarketSimilar to the domestic market, TV contributes the largest (~55%) of the outsourcing animation entertain-ment market in India, followed by Direct-to-DVD.
Outsourcing work to India is dependent on the • AnimationContentWorldwide• %ofContentOutsourcedGloballyand• %OutsourcedtoIndia
Trends and growth drivers for each of these param-eters need to be understood / analysed to estimate the direction of the ‘Animation Entertainment’ Outsourcing pie.
Animation ContentAnimation movies in the largest animation market i.e. US have been growing (US produced 29 animation movies in 2009). This is primarily propelled by the high box-office earnings of these movies
Plans of the two largest animation houses in the world Disney Pixar and DreamWorks point to a similar growth for future. Disney Pixar released 8 movies in the last two years. It plans to increase the number to 13 movies from 2009-2012. Similarly, DreamWorks plans to produce 5 movies every two years from 2009 compared to 2 movies a year previously. However, in wake of the recent economic recession, the budgets for these movies are expected to stagnate.
% OutsourcedThe recent recession has forced the production houses worldwide to step up their focus on cost savings measures. Comparison of production costs coupled with their increased focus on cost savings is expected to translate into higher % of work outsourced globally. Table 5 provides an indication of India’s advantage over other countries.
Figure 13: Split of outsourcing revenues across its sub-segments
Table 4: Box Office Earnings of certain animation films worldwide
Animation Film
Year of Release
Worldwide Box Office Earnings (USD Mn)
Shrek 3 2007 799
Wall E 2008 533
UP 2009 711
Table 5: Estimated costs for 30 minutes of animated content
India Korea, Philippines North America
2D Hand drawn USD 45,000 - 50,000
USD 60,750 - 67,500
USD 180,000 - 200,000
3D USD 90,000 USD 121,500 USD 360,000
Backend production
USD 200,000 USD 270,000 USD 800,000
Flash Animation USD 20,000 USD 27,000 USD 80,000
Source: Analyst Report
Television Movies for theater DVD
55%
28%
17%
14

% Outsourced to IndiaAnimation Services outsourced to India is not only a function of the cost but also depends on the capability of the Indian players and its recognition world-wide. Indian animation players are surely moving up the value chain with their experience and are gradually getting recognized as well. This is evident from the large no. of recent co-production deals:
Table 6: Co-production deals in India
DQ Entertainment: 30+ global Co-productions deals with many leading companies like BBC UK, American Greetings Properties, M6 etc.
Sanraa Media: Deal with UK based Endemol for the co-production of animated series – The 99
Toonz Animation: Co-production deal with Spectra Animation of Canada to co-produce 52 episodes of a Malayalam animated TV serial ‘Paddy’s Pages’
Improved capability and perception of the Indian players is encouraging for the outsourcing pie of the animation services in India.
Indian Animation Entertainment Industry: Overall OutlookIndian Animation Entertainment Industry is expected to witness a significant growth, both in terms of revenue and participation in the value chain. The Indian animation industry started by doing work for foreign companies. Increasingly, it is developing characters, lines and voices of its own. Studios are looking at new business models, including partnerships, to produce films and shows. Sometimes, the partnership may just be an investment. In return, they get to own a big chunk of merchandising rights. Some are even nego-tiating distribution rights. This ensures flow of money even if there is no cash flow in the short term. Today, global companies are looking at India for co-production.
As the industry gains expertise and tries to move up the value chain, it faces a few daunting challenges, which it needs to overcome to come close to realizing its potential:
Skilled ManpowerSimilar to IT Services, skilled manpower is the basic requirement for producing quality animated content. As per Nasscom Industry Report 2009, manpower require-ment for animation in India is expected to grow from 17,500 in 2009 to 29,500 by 2012. However, lack of employable resources poses a large constraint, which is primarily due to the following reasons: Low awareness of animation as a career and non-existence of a stand-ardized and quality curriculum across the handful of institutes in India.
Animation. Broadcasting. Gaming. On the Cusp of Growth | 15
Lack of Government SupportIndian Government has been providing support to the IT and IT Enabled Services industry in India, thus leading to its growth. Indian animation players lack any such Government support either through tax rebates or grants. Moreover, competing outsourcing destinations e.g.Canada, UK have signed tax treaties with the US.
Tight Budgets Indian animation movie is a low budget INR 10-12 crore movie, primarily meant to hedge the involved financial risks. In doing so, the quality takes a beating and the movie fails to compete with a USD 100-200 Mn Hollywood Production. As production houses grow bigger and financially stronger, the budgets are expected to improve.
IP ProtectionPiracy of DVD-based videos is rampant in India, which eats into the revenues for the producers and distribu-tors. Weak IP Regulation and ineffective enforcement discourage animation players in India to produce their own IP. Moreover, it also discourages International Players, who are generally very protective of their IPs, to outsource to India.
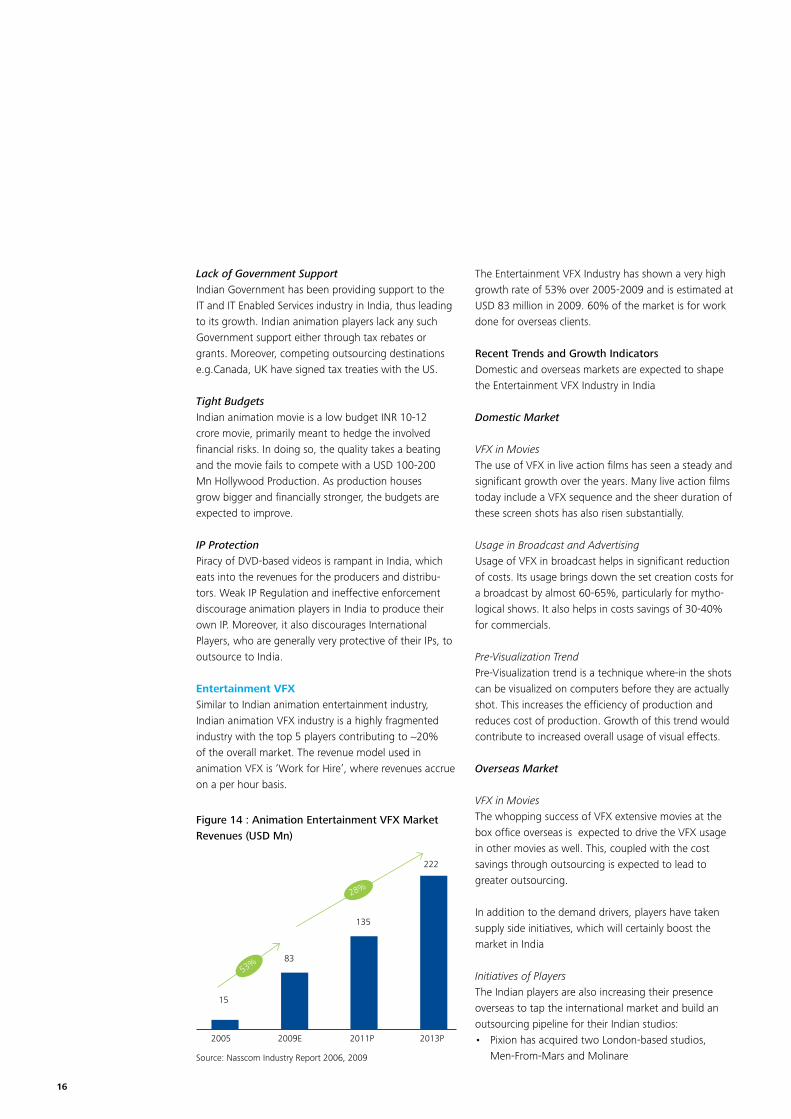
Entertainment VFXSimilar to Indian animation entertainment industry, Indian animation VFX industry is a highly fragmented industry with the top 5 players contributing to ~20% of the overall market. The revenue model used in animation VFX is ‘Work for Hire’, where revenues accrue on a per hour basis.
The Entertainment VFX Industry has shown a very high growth rate of 53% over 2005-2009 and is estimated at USD 83 million in 2009. 60% of the market is for work done for overseas clients.
Recent Trends and Growth IndicatorsDomestic and overseas markets are expected to shape the Entertainment VFX Industry in India
Domestic Market
VFX in MoviesThe use of VFX in live action films has seen a steady and significant growth over the years. Many live action films today include a VFX sequence and the sheer duration of these screen shots has also risen substantially.
Usage in Broadcast and AdvertisingUsage of VFX in broadcast helps in significant reduction of costs. Its usage brings down the set creation costs for a broadcast by almost 60-65%, particularly for mytho-logical shows. It also helps in costs savings of 30-40% for commercials.
Pre-Visualization TrendPre-Visualization trend is a technique where-in the shots can be visualized on computers before they are actually shot. This increases the efficiency of production and reduces cost of production. Growth of this trend would contribute to increased overall usage of visual effects.
Overseas Market
VFX in MoviesThe whopping success of VFX extensive movies at the box office overseas is expected to drive the VFX usage in other movies as well. This, coupled with the cost savings through outsourcing is expected to lead to greater outsourcing.
In addition to the demand drivers, players have taken supply side initiatives, which will certainly boost the market in India
Initiatives of PlayersThe Indian players are also increasing their presence overseas to tap the international market and build an outsourcing pipeline for their Indian studios:• PixionhasacquiredtwoLondon-basedstudios,
Men-From-Mars and Molinare
Figure 14 : Animation Entertainment VFX Market Revenues (USD Mn)
2005
15
83
135
222
2009E 2011P 2013P
53%
28%
Source: Nasscom Industry Report 2006, 2009
16
• PixionalsoplanstoacquireastudioinLosAngeles• TataElxsihaslaunchedanewfacilityofVisual
Computing Labs (VCL) in Los Angeles
Indian Entertainment VFX Industry: Overall OutlookIndian Entertainment VFX Industry, similar to the Indian Animation Entertainment industry is on the cusp of significant growth, both on the domestic and outsourcing front. However, as the Indian industry players take initiatives to boost their presence on the global map, they face similar challenges : Lack of Skilled Manpower, low budgets for VFX in a movie and no Government support / incentives.
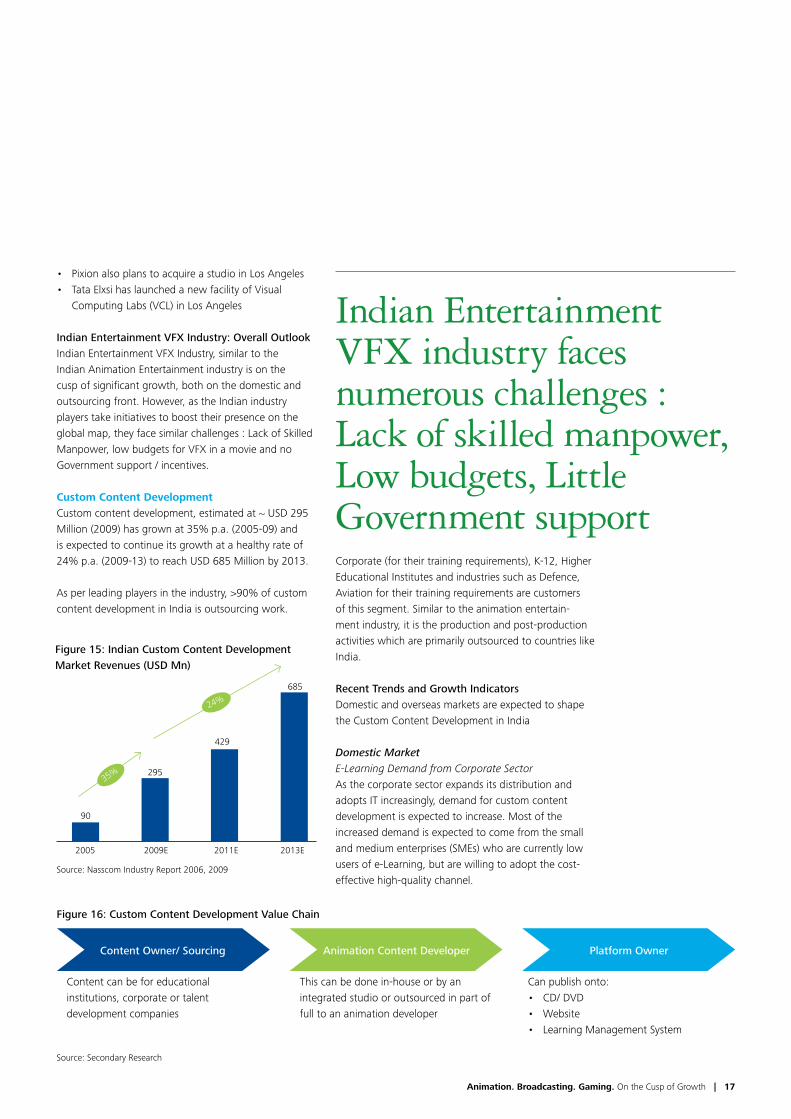
Custom Content DevelopmentCustom content development, estimated at ~ USD 295 Million (2009) has grown at 35% p.a. (2005-09) and is expected to continue its growth at a healthy rate of 24% p.a. (2009-13) to reach USD 685 Million by 2013.
As per leading players in the industry, >90% of custom content development in India is outsourcing work.
Corporate (for their training requirements), K-12, Higher Educational Institutes and industries such as Defence, Aviation for their training requirements are customers of this segment. Similar to the animation entertain-ment industry, it is the production and post-production activities which are primarily outsourced to countries like India.
Recent Trends and Growth IndicatorsDomestic and overseas markets are expected to shape the Custom Content Development in India
Domestic MarketE-Learning Demand from Corporate SectorAs the corporate sector expands its distribution and adopts IT increasingly, demand for custom content development is expected to increase. Most of the increased demand is expected to come from the small and medium enterprises (SMEs) who are currently low users of e-Learning, but are willing to adopt the cost-effective high-quality channel.
Figure 16: Custom Content Development Value Chain
Indian Entertainment VFX industry faces numerous challenges : Lack of skilled manpower, Low budgets, Little Government support
Figure 15: Indian Custom Content Development Market Revenues (USD Mn)
2005
90
685
429
295
2009E 2011E 2013E
35%
24%
Source: Nasscom Industry Report 2006, 2009
Content Owner/ Sourcing Animation Content Developer Platform Owner
Content can be for educational institutions, corporate or talent development companies
This can be done in-house or by an integrated studio or outsourced in part of full to an animation developer
Can publish onto:• CD/DVD• Website• LearningManagementSystem
Source: Secondary Research
Animation. Broadcasting. Gaming. On the Cusp of Growth | 17
Demand From Higher EducationCompared to the US where > 90% of the institutes leverage e-Learning, current adoption of e-Learning by higher education institutes in India is very poor. This has large scope for growth and can only go up, given the current status.
Overseas MarketMajor markets for e-Learning globally are the US and select European nations across both educational institu-tions and Corporate Sector for training purposes.
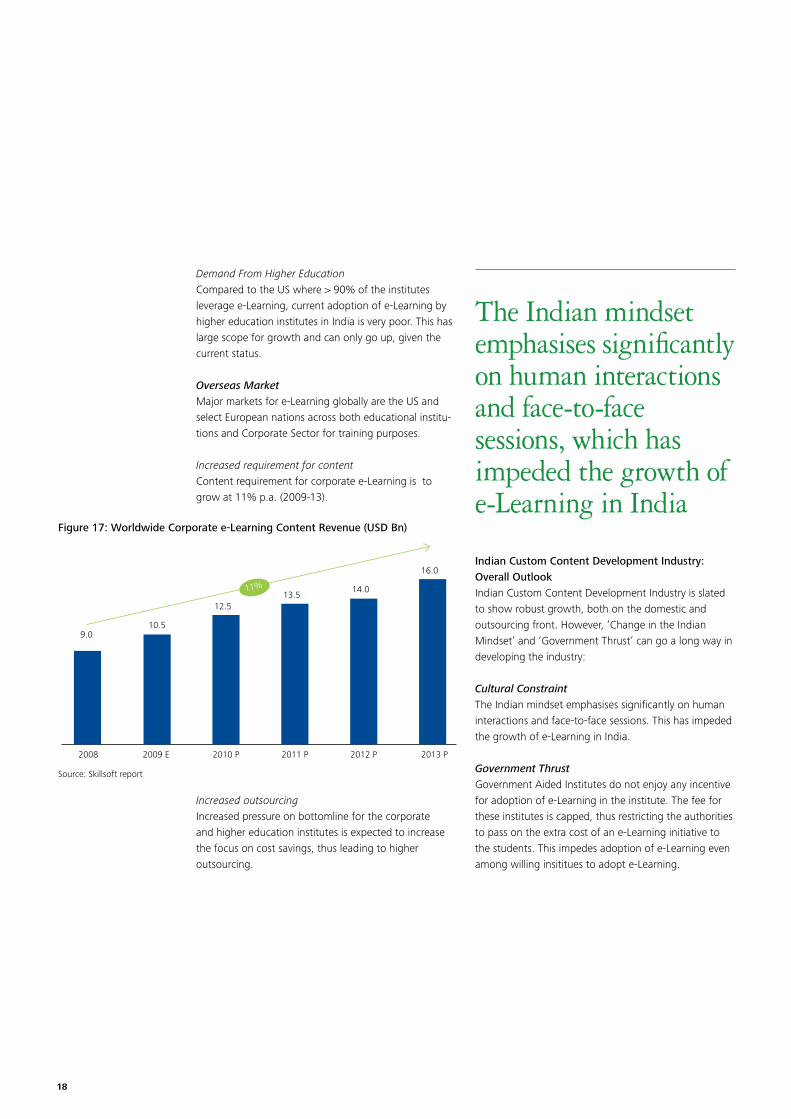
Increased requirement for contentContent requirement for corporate e-Learning is to grow at 11% p.a. (2009-13).
Increased outsourcingIncreased pressure on bottomline for the corporate and higher education institutes is expected to increase the focus on cost savings, thus leading to higher outsourcing.
Indian Custom Content Development Industry: Overall OutlookIndian Custom Content Development Industry is slated to show robust growth, both on the domestic and outsourcing front. However, ‘Change in the Indian Mindset’ and ‘Government Thrust’ can go a long way in developing the industry:
Cultural Constraint The Indian mindset emphasises significantly on human interactions and face-to-face sessions. This has impeded the growth of e-Learning in India.
Government ThrustGovernment Aided Institutes do not enjoy any incentive for adoption of e-Learning in the institute. The fee for these institutes is capped, thus restricting the authorities to pass on the extra cost of an e-Learning initiative to the students. This impedes adoption of e-Learning even among willing insititues to adopt e-Learning.
Figure 17: Worldwide Corporate e-Learning Content Revenue (USD Bn)
11%
Source: Skillsoft report
2008
9.010.5
2009 E
12.5
2010 P
13.5
2011 P
14.0
2012 P
16.0
2013 P
The Indian mindset emphasises significantly on human interactions and face-to-face sessions, which has impeded the growth of e-Learning in India
18

Animation. Broadcasting. Gaming. On the Cusp of Growth | 19

Global Gaming IndustryThe global gaming industry has been growing at ~21% p.a. (2005-2009) to reach ~ USD 40 billion (CY2009). This growth is expected to reduce to 10% p.a. and is expected to reach USD 59 billion by 2013.
Key segments for gaming are Console Gaming, PC Gaming, Mobile Gaming and Online Gaming. North America, Western Europe and Japan lead the gaming market. However, China is the fastest growing market especially for online gaming.
Indian Gaming Industry OverviewThe Indian gaming market is estimated at ~ USD 239 million (CY 2009) and expected to grow rapidly to reach ~ USD 1.3 billion by 2013, showing a CAGR of ~53%.Consumer market in India comprises revenues from:
• PCGaming: Sale of CD-based gaming software• MobileGaming:Sale of software through mobile
downloads
• ConsoleGaming:Sale of hardware e.g. gaming consoles
• OnlineGaming:Advertising and subscription of online games
Gaming services market in India comprises:• Outsourcingdevelopmentservices• AncillaryservicessuchasvoiceandemailBPO
support, porting, testing, etc.
Gaming industry in India is a fragmented industry, with players present across the value chain. It is the development and post development activities (Refer Figure 21) which are outsourced. Concept creation, feasibility testing and pre-production are still limited to only the online and mobile platforms in India, that too done only by a handful of players.
Gaming
Figure 20: Gaming Value ChainSource: Nasscom Industry Report 2006, 2009
10%
Figure 18: Global Gaming Market (USD Bn)
2005 2009E 2011P 2013P
59
49
40
19
21%
Concept creation & feasibility testing
Pre Production
Development
Post
production
& testing
Gold
release
Final
Testing /
Porting
Consumer
•Involvesconcept creation
•Publishervalidates the concept and identifies the market opportunity
•Creationofstory board 3-D Pre-production, character drawing
•Gameenginedecision (for console, PC and online)
•Programming
•3-DArtassetbuilding: This includes character modeling, se design & modeling texturing
•Involvesfinal sound recording, color testing and special sound effects
•Thefinalbuild is delivered to the publisher
•Gamemadecompatible with various graphic cards/ mobile handsets (for mobile games)
Figure 21: Presence of Indian Gaming Players Across the Value Chain
Console
Mobile
PC
Online
Concept Creation & Feasibility Testing
Pre Production Development
Post & TestingProduction
Final Testing / Porting
Note: For Mobile, PC, and Online Games, concept creation and feasibility testing and pre-production are done only for domestic clients while the other steps are done for both domestic and overseas clients. For Console Games, all stages except content creation are done only for overseas clients
Limited Presence
Moderate Presence
No Presence
Source: Nasscom Industry Report 2009
Figure 19: Indian Gaming Consumer and Services Market (USD Mn)
Source: Nasscom Industry Report Secondary Research
3529
21%
53%
2005 2009E 2011P 2013P
158380
988
80
150
328
Consumer Services
20
• Integratedcompaniesthathavepresenceinthecomplete gaming value-chain – from conceiving a gaming idea, publishing it, developing the complete game and distributing it across geographies are again limited to a few companies, that too only for mobile gaming.
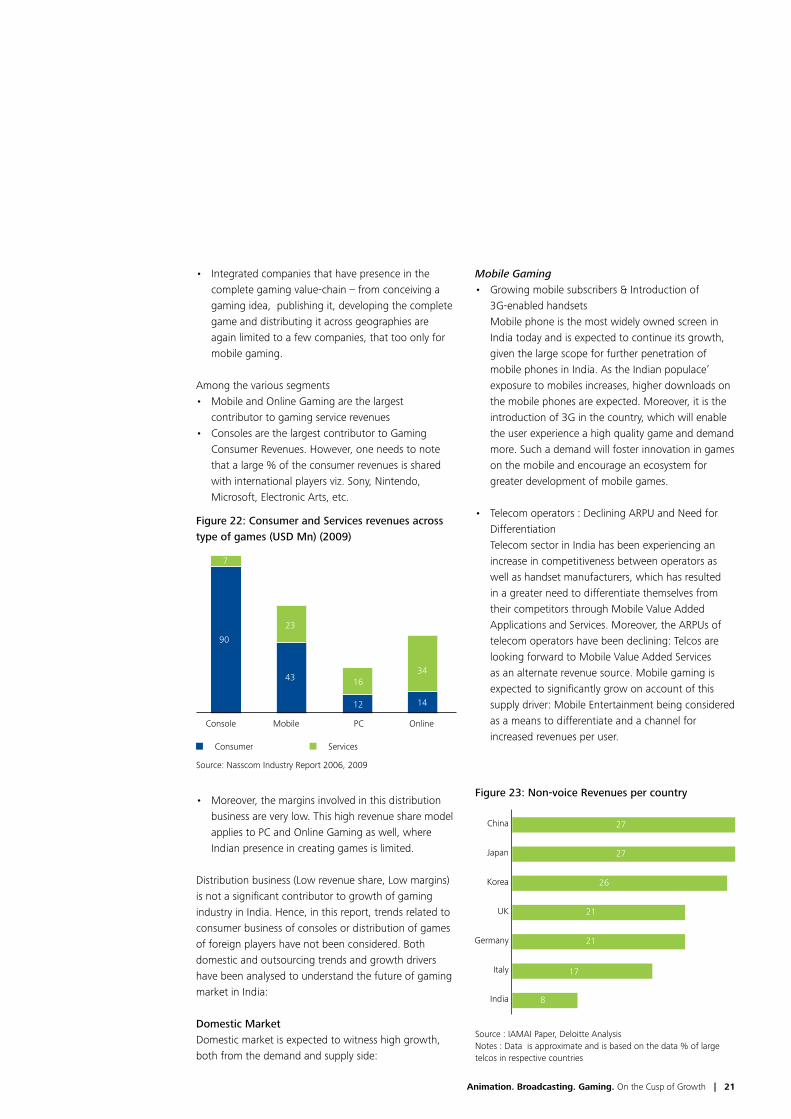
Among the various segments• MobileandOnlineGamingarethelargest
contributor to gaming service revenues• ConsolesarethelargestcontributortoGaming
Consumer Revenues. However, one needs to note that a large % of the consumer revenues is shared with international players viz. Sony, Nintendo, Microsoft, Electronic Arts, etc.
• Moreover,themarginsinvolvedinthisdistributionbusiness are very low. This high revenue share model applies to PC and Online Gaming as well, where Indian presence in creating games is limited.
Distribution business (Low revenue share, Low margins) is not a significant contributor to growth of gaming industry in India. Hence, in this report, trends related to consumer business of consoles or distribution of games of foreign players have not been considered. Both domestic and outsourcing trends and growth drivers have been analysed to understand the future of gaming market in India:
Domestic MarketDomestic market is expected to witness high growth, both from the demand and supply side:
Mobile Gaming• Growingmobilesubscribers&Introductionof
3G-enabled handsets Mobile phone is the most widely owned screen in
India today and is expected to continue its growth, given the large scope for further penetration of mobile phones in India. As the Indian populace’ exposure to mobiles increases, higher downloads on the mobile phones are expected. Moreover, it is the introduction of 3G in the country, which will enable the user experience a high quality game and demand more. Such a demand will foster innovation in games on the mobile and encourage an ecosystem for greater development of mobile games.
• Telecomoperators:DecliningARPUandNeedforDifferentiation
Telecom sector in India has been experiencing an increase in competitiveness between operators as well as handset manufacturers, which has resulted in a greater need to differentiate themselves from their competitors through Mobile Value Added Applications and Services. Moreover, the ARPUs of telecom operators have been declining: Telcos are looking forward to Mobile Value Added Services as an alternate revenue source. Mobile gaming is expected to significantly grow on account of this supply driver: Mobile Entertainment being considered as a means to differentiate and a channel for increased revenues per user.
Figure 22: Consumer and Services revenues across type of games (USD Mn) (2009)
Consumer Services
Source: Nasscom Industry Report 2006, 2009
Console Mobile PC Online
90
43
12 14
3416
23
7
China
Japan
Korea
UK
Germany
Italy
India
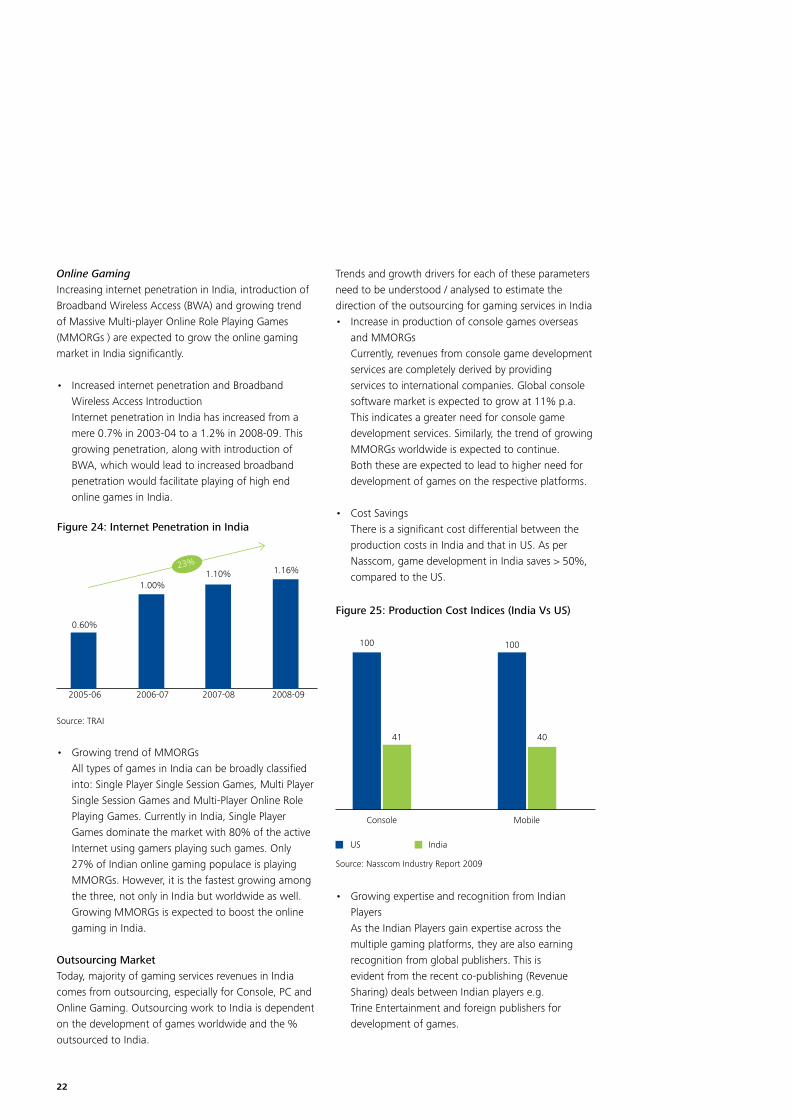
Figure 23: Non-voice Revenues per country
8
27
27
26
21
21
17
Source : IAMAI Paper, Deloitte AnalysisNotes : Data is approximate and is based on the data % of large telcos in respective countries
Animation. Broadcasting. Gaming. On the Cusp of Growth | 21
Online GamingIncreasing internet penetration in India, introduction of Broadband Wireless Access (BWA) and growing trend of Massive Multi-player Online Role Playing Games (MMORGs ) are expected to grow the online gaming market in India significantly.
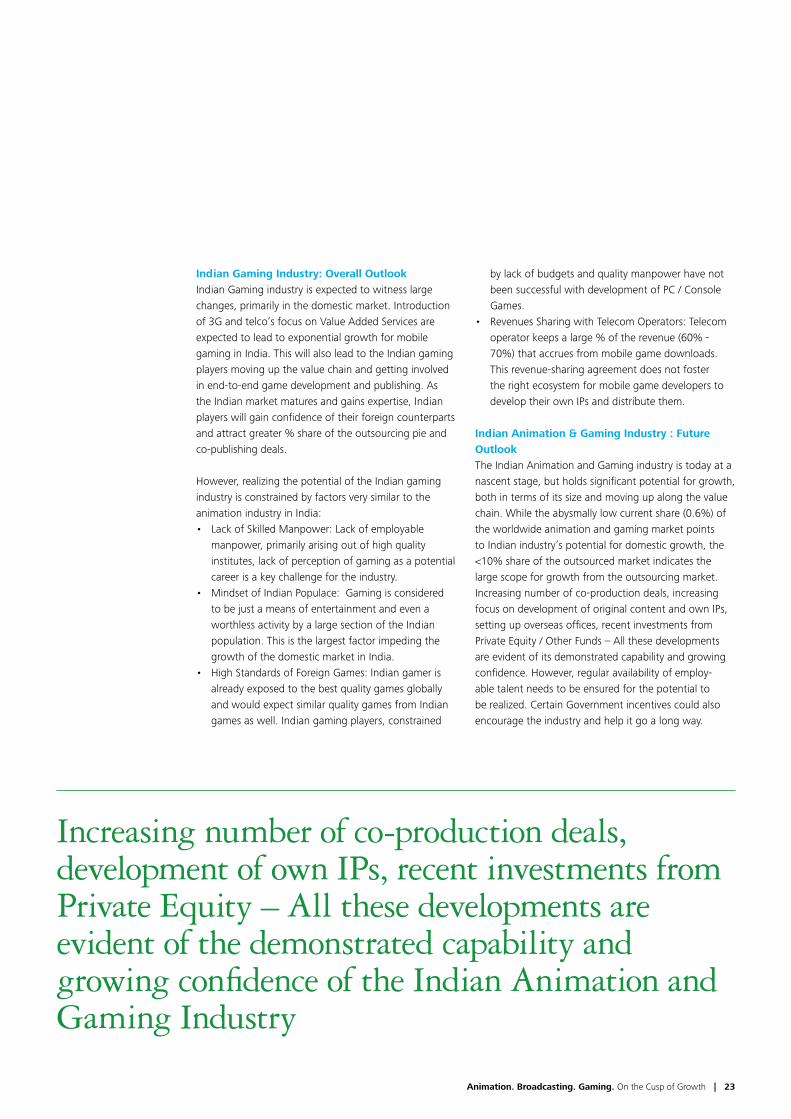
• IncreasedinternetpenetrationandBroadbandWireless Access Introduction
Internet penetration in India has increased from a mere 0.7% in 2003-04 to a 1.2% in 2008-09. This growing penetration, along with introduction of BWA, which would lead to increased broadband penetration would facilitate playing of high end online games in India.
• GrowingtrendofMMORGs All types of games in India can be broadly classified
into: Single Player Single Session Games, Multi Player Single Session Games and Multi-Player Online Role Playing Games. Currently in India, Single Player Games dominate the market with 80% of the active Internet using gamers playing such games. Only 27% of Indian online gaming populace is playing MMORGs. However, it is the fastest growing among the three, not only in India but worldwide as well. Growing MMORGs is expected to boost the online gaming in India.
Outsourcing MarketToday, majority of gaming services revenues in India comes from outsourcing, especially for Console, PC and Online Gaming. Outsourcing work to India is dependent on the development of games worldwide and the % outsourced to India.
Trends and growth drivers for each of these parameters need to be understood / analysed to estimate the direction of the outsourcing for gaming services in India• Increaseinproductionofconsolegamesoverseas
and MMORGs Currently, revenues from console game development
services are completely derived by providing services to international companies. Global console software market is expected to grow at 11% p.a. This indicates a greater need for console game development services. Similarly, the trend of growing MMORGs worldwide is expected to continue. Both these are expected to lead to higher need for development of games on the respective platforms.
• CostSavings There is a significant cost differential between the
production costs in India and that in US. As per Nasscom, game development in India saves > 50%, compared to the US.
• GrowingexpertiseandrecognitionfromIndianPlayers
As the Indian Players gain expertise across the multiple gaming platforms, they are also earning recognition from global publishers. This is evident from the recent co-publishing (Revenue Sharing) deals between Indian players e.g. Trine Entertainment and foreign publishers for development of games.
Figure 24: Internet Penetration in India
0.60%
2005-06
Source: TRAI
2006-07 2007-08 2008-09
1.00%1.10% 1.16%23%
Figure 25: Production Cost Indices (India Vs US)
100
Console
Source: Nasscom Industry Report 2009
Mobile
41 40
100
US India
22
Indian Gaming Industry: Overall OutlookIndian Gaming industry is expected to witness large changes, primarily in the domestic market. Introduction of 3G and telco’s focus on Value Added Services are expected to lead to exponential growth for mobile gaming in India. This will also lead to the Indian gaming players moving up the value chain and getting involved in end-to-end game development and publishing. As the Indian market matures and gains expertise, Indian players will gain confidence of their foreign counterparts and attract greater % share of the outsourcing pie and co-publishing deals.
However, realizing the potential of the Indian gaming industry is constrained by factors very similar to the animation industry in India:• LackofSkilledManpower:Lackofemployable
manpower, primarily arising out of high quality institutes, lack of perception of gaming as a potential career is a key challenge for the industry.
• MindsetofIndianPopulace:Gamingisconsideredto be just a means of entertainment and even a worthless activity by a large section of the Indian population. This is the largest factor impeding the growth of the domestic market in India.
• HighStandardsofForeignGames:Indiangamerisalready exposed to the best quality games globally and would expect similar quality games from Indian games as well. Indian gaming players, constrained
by lack of budgets and quality manpower have not been successful with development of PC / Console Games.
• RevenuesSharingwithTelecomOperators:Telecomoperator keeps a large % of the revenue (60% - 70%) that accrues from mobile game downloads. This revenue-sharing agreement does not foster the right ecosystem for mobile game developers to develop their own IPs and distribute them.
Indian Animation & Gaming Industry : Future OutlookThe Indian Animation and Gaming industry is today at a nascent stage, but holds significant potential for growth, both in terms of its size and moving up along the value chain. While the abysmally low current share (0.6%) of the worldwide animation and gaming market points to Indian industry’s potential for domestic growth, the <10% share of the outsourced market indicates the large scope for growth from the outsourcing market. Increasing number of co-production deals, increasing focus on development of original content and own IPs, setting up overseas offices, recent investments from Private Equity / Other Funds – All these developments are evident of its demonstrated capability and growing confidence. However, regular availability of employ-able talent needs to be ensured for the potential to be realized. Certain Government incentives could also encourage the industry and help it go a long way.
Increasing number of co-production deals, development of own IPs, recent investments from Private Equity – All these developments are evident of the demonstrated capability and growing confidence of the Indian Animation and Gaming Industry
Animation. Broadcasting. Gaming. On the Cusp of Growth | 23
Television
IntroductionTelevision plays a significant role in dissemination of information and is equipped with an innate power to influence people, their beliefs and their opinions. A global Deloitte study on ‘Media democracy’ in 2009 across over 2000 respondents offers some interesting insights about the popularity of television in current times. TV remains a favorite media source for most consumers – 72% of the respondents rank ‘watching TV’ as their top media source. 84% respondents consider ‘advertising on TV’ as the most influential media source to impact their buying decisions. Online TV matters to a minority of viewers, though the share of such viewers has gradually increased as compared to 2008.
Indian entertainment today has a far more global audience across South Asia, the Middle East, and Africa. The large base of expatriates ensures that Indian TV channels and films are a premier medium of entertainment. Indian films and TV channels have been able to attract audience beyond expatriates in the US and the UK – an audience that enjoys and identifies more with the contemporary Indian culture.
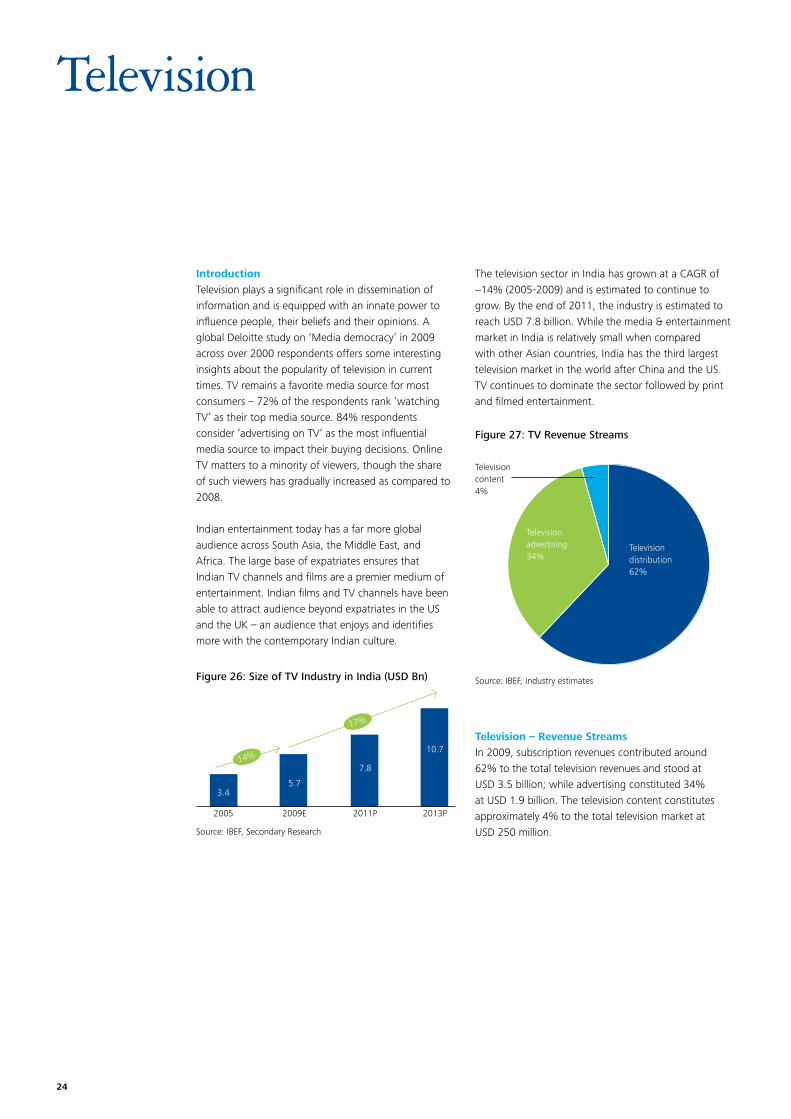
The television sector in India has grown at a CAGR of ~14% (2005-2009) and is estimated to continue to grow. By the end of 2011, the industry is estimated to reach USD 7.8 billion. While the media & entertainment market in India is relatively small when compared with other Asian countries, India has the third largest television market in the world after China and the US. TV continues to dominate the sector followed by print and filmed entertainment.
Figure 26: Size of TV Industry in India (USD Bn)
Figure 27: TV Revenue Streams
Television – Revenue StreamsIn 2009, subscription revenues contributed around 62% to the total television revenues and stood at USD3.5billion;whileadvertisingconstituted34%at USD 1.9 billion. The television content constitutes approximately 4% to the total television market at USD 250 million.
Television distribution62%
Television advertising34%
Television content 4%
Source: IBEF, Industry estimates
2005 2009E 2011P 2013P
3.45.7
7.8
10.7
17%
14%
Source: IBEF, Secondary Research
24
i. Television DistributionIndia’s television distribution industry is the world’s second largest with over 105 million cable and satellite (C&S) homes in 20091. New digital mediums are emerging – DTH, Digital Cable and IPTV. DTH is being instrumental in the growth of television industry in India. There are multiple organized players that are providing satellite signals directly to the homes. There are 22 million digital homes – 18 million out of these are on
the DTH platform. DTH is an upcoming segment even in rural India, increasing its share among all DTH homes to 64% in 2010 as compared to 34% in 2008. Digitization is expected to speed up, not only in Direct-to-home but also in the hitherto-analog cable segment. An industry report by IDFC suggests that total digital homes are expected to increase four times to 86 million by 2015 – which would potentially address the ‘under-reporting’ of revenues earned by local cable operators. DTH would
1 Television distribution report 2009, IDFC
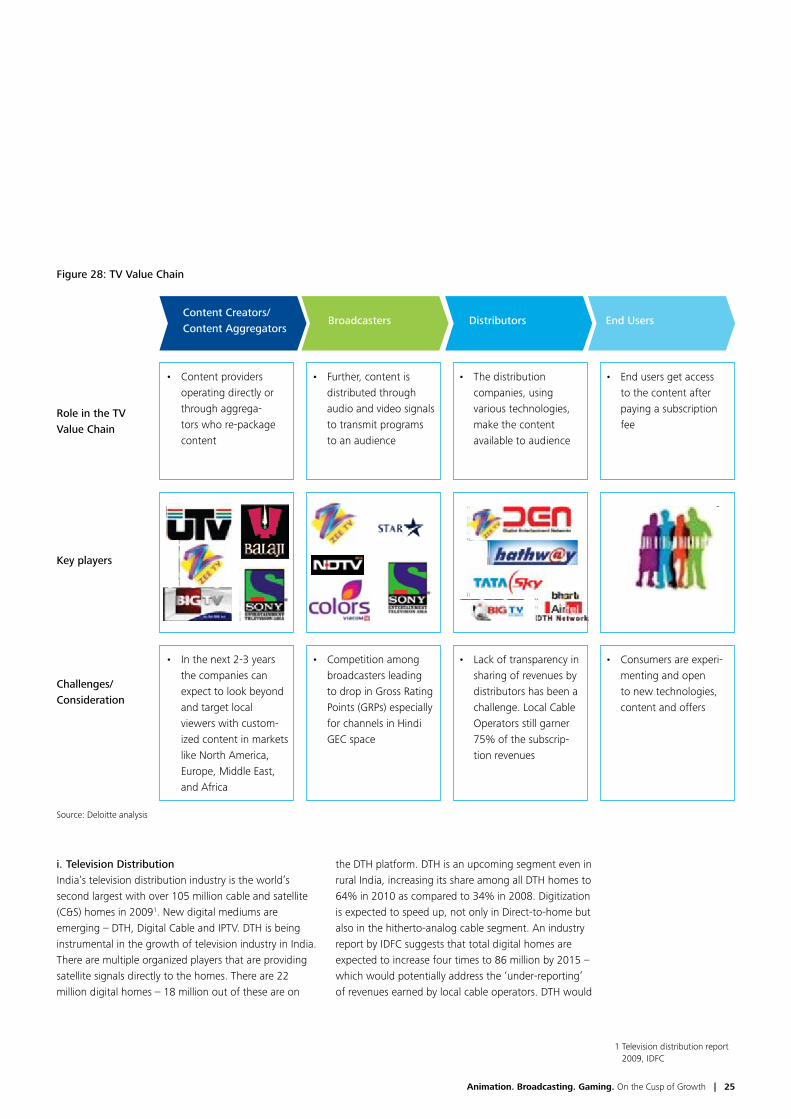
Figure 28: TV Value Chain
Role in the TV Value Chain
Key players
Challenges/Consideration
• Contentprovidersoperating directly or through aggrega-tors who re-package content
• Inthenext2-3yearsthe companies can expect to look beyond and target local viewers with custom-ized content in markets like North America, Europe, Middle East, and Africa
• Further,contentisdistributed through audio and video signals to transmit programs to an audience
• Competitionamongbroadcasters leading to drop in Gross Rating Points (GRPs) especially for channels in Hindi GEC space
• Thedistributioncompanies, using various technologies, make the content available to audience
• Lackoftransparencyinsharing of revenues by distributors has been a challenge. Local Cable Operators still garner 75% of the subscrip-tion revenues
• Endusersgetaccessto the content after paying a subscription fee
• Consumersareexperi-menting and open to new technologies, content and offers
Source: Deloitte analysis
Content Creators/ Content Aggregators
Broadcasters Distributors End Users
Animation. Broadcasting. Gaming. On the Cusp of Growth | 25
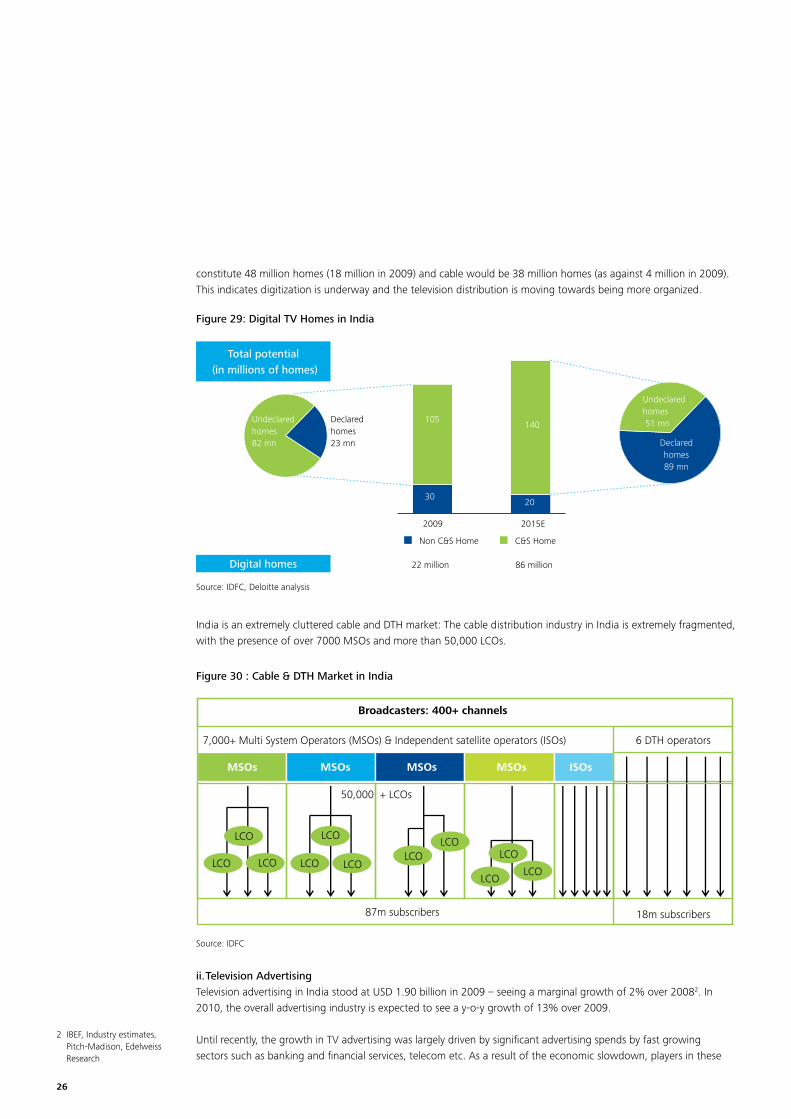
constitute 48 million homes (18 million in 2009) and cable would be 38 million homes (as against 4 million in 2009). This indicates digitization is underway and the television distribution is moving towards being more organized.
Figure 29: Digital TV Homes in India
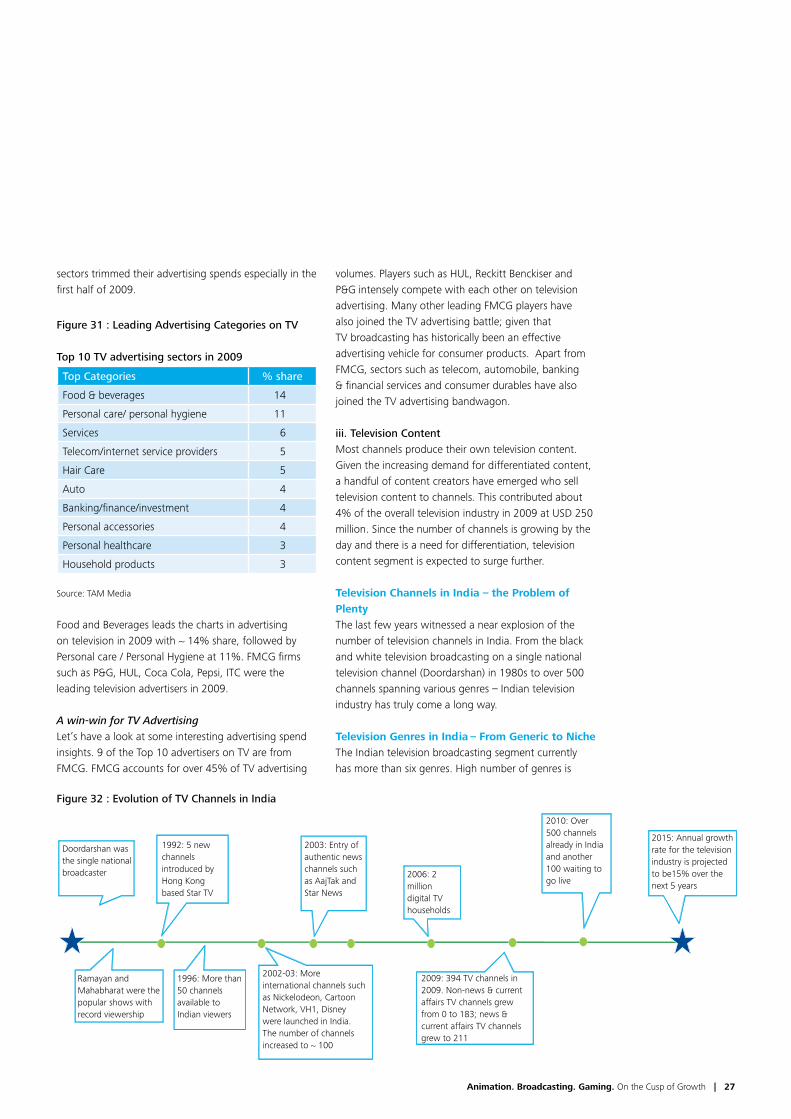
India is an extremely cluttered cable and DTH market: The cable distribution industry in India is extremely fragmented, with the presence of over 7000 MSOs and more than 50,000 LCOs.
ii. Television AdvertisingTelevision advertising in India stood at USD 1.90 billion in 2009 – seeing a marginal growth of 2% over 20082. In 2010, the overall advertising industry is expected to see a y-o-y growth of 13% over 2009.
Until recently, the growth in TV advertising was largely driven by significant advertising spends by fast growing sectors such as banking and financial services, telecom etc. As a result of the economic slowdown, players in these
2 IBEF, Industry estimates, Pitch-Madison, Edelweiss Research
Total potential (in millions of homes)
Digital homes
Source: IDFC, Deloitte analysis
Undeclared homes82 mn
Undeclared homes 51 mn
Declared homes89 mn
Declared homes23 mn
Non C&S Home C&S Home
22 million 86 million
2009 2015E
105140
3020
Figure 30 : Cable & DTH Market in India
Source: IDFC
26
sectors trimmed their advertising spends especially in the first half of 2009.
Figure 31 : Leading Advertising Categories on TV
Top 10 TV advertising sectors in 2009
Top Categories % share
Food & beverages 14
Personal care/ personal hygiene 11
Services 6
Telecom/internet service providers 5
Hair Care 5
Auto 4
Banking/finance/investment 4
Personal accessories 4
Personal healthcare 3
Household products 3
Source: TAM Media
Food and Beverages leads the charts in advertising on television in 2009 with ~ 14% share, followed by Personal care / Personal Hygiene at 11%. FMCG firms such as P&G, HUL, Coca Cola, Pepsi, ITC were the leading television advertisers in 2009.
A win-win for TV AdvertisingLet’s have a look at some interesting advertising spend insights. 9 of the Top 10 advertisers on TV are from FMCG. FMCG accounts for over 45% of TV advertising
volumes. Players such as HUL, Reckitt Benckiser and P&G intensely compete with each other on television advertising. Many other leading FMCG players have alsojoinedtheTVadvertisingbattle;giventhatTV broadcasting has historically been an effective advertising vehicle for consumer products. Apart from FMCG, sectors such as telecom, automobile, banking & financial services and consumer durables have also joined the TV advertising bandwagon.
iii. Television ContentMost channels produce their own television content. Given the increasing demand for differentiated content, a handful of content creators have emerged who sell television content to channels. This contributed about 4% of the overall television industry in 2009 at USD 250 million. Since the number of channels is growing by the day and there is a need for differentiation, television content segment is expected to surge further.
Television Channels in India – the Problem of PlentyThe last few years witnessed a near explosion of the number of television channels in India. From the black and white television broadcasting on a single national television channel (Doordarshan) in 1980s to over 500 channels spanning various genres – Indian television industry has truly come a long way.
Television Genres in India – From Generic to NicheThe Indian television broadcasting segment currently has more than six genres. High number of genres is
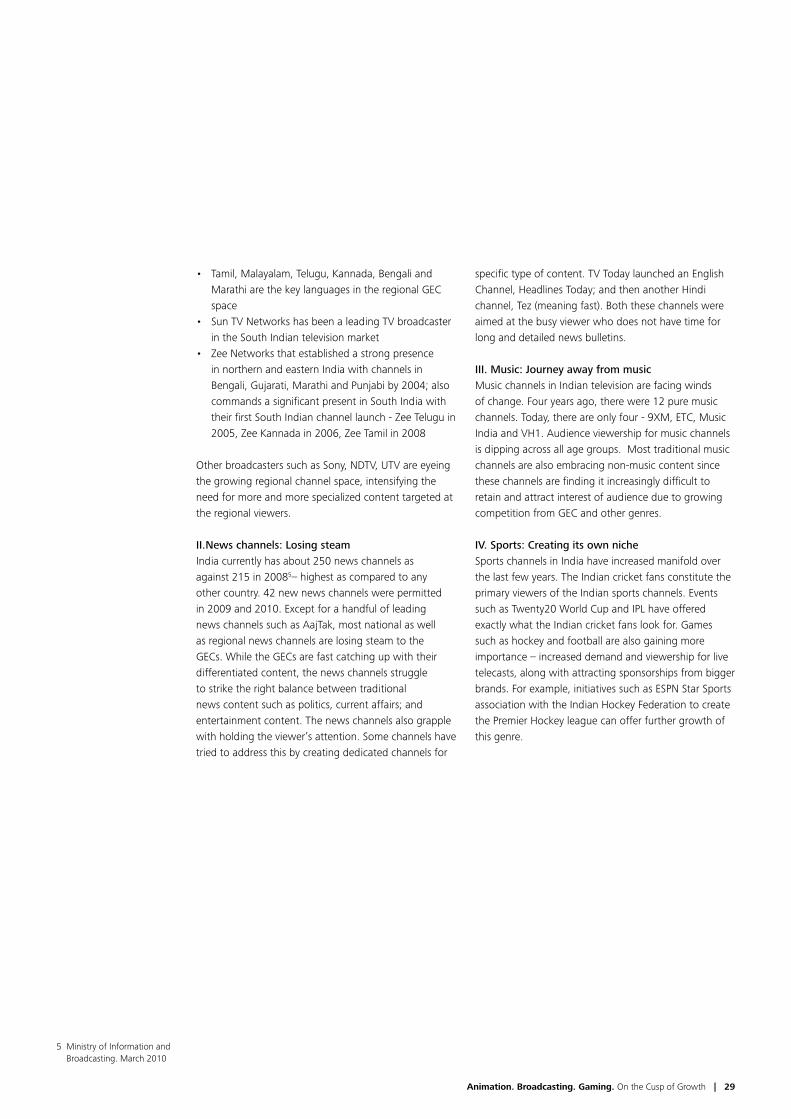
Figure 32 : Evolution of TV Channels in India
Doordarshan was the single national broadcaster
Ramayan and Mahabharat were the popular shows with record viewership
1996: More than 50 channels available to Indian viewers
2002-03: More international channels such as Nickelodeon, Cartoon Network, VH1, Disney were launched in India. The number of channels increased to ~ 100
2009: 394 TV channels in 2009. Non-news & current affairs TV channels grew from0to183;news¤t affairs TV channels grew to 211
1992: 5 new channels introduced by Hong Kong based Star TV
2003: Entry of authentic news channels such as AajTak and Star News
2010: Over 500 channels already in India and another 100 waiting to go live
2015: Annual growth rate for the television industry is projected to be15% over the next 5 years
2006: 2 million digital TV households
Animation. Broadcasting. Gaming. On the Cusp of Growth | 27

primarily driven by the growing need for more and more differentiated and niche content. Since the viewers today have far greater choice in terms of content, varied national and regional channels have emerged across genres.
I. GEC (General Entertainment Channels)
a. National GEC: Cutthroat and competitive2009 was a roller-coaster ride when it comes to the top hindi GEC slot. While Star TV was at the top till the first half of the year, Colors occupied the top position and got the highest gross ratings points (GRPs) of 325 in September 2009. This was also the highest among all Hindi GECs in a span of over a year – 50 GRPs ahead of its closest competitor Star TV and 70 GRPs over Zee TV. Differentiated content such as its flagship drama ‘Balika Vadhu’ and ‘Utaran’, second season of stunt-based reality show Fear Factor-Khataron Ke Khiladi and BigBoss;coupledwithmeticulousdistributionstrategyworked wonders for Colors.
Here are some key highlights of emerging changes in the Hindi GEC space in the last calendar year:• Increasingpopularityofrealityshowsandfiction
addressing social and realistic issues• Advertisementratesnose-divingintheIPLmonth• ChannelssuchasColors,Imaginegoingglobalas
they also strongly race for the top slot in the highly competitive TV broadcasting battlefield
• LeadingGECsacquiringbroadcastingrightsfornewmovies for sprucing up the ratings and adding to their viewer base, by reducing the gap between theatre release and time-to-market through television
b. Regional GECs: Gaining rigorRegional GECs are almost matching their strength with the national GECs and have emerged as a key focus area for most players. The number of regional channels has increased from 114 in 2008 to 135 in 20093. While the share of advertising on genres such as Hindi News, Hindi GECs and Hindi Movies almost remained constant, it increased for regional GEC from 22% in 2008 to 24% in 20094. High demand for regional content by viewers settled outside India, low cost of production (relatively low talent cost, no carriage and placement fee, low acquisition cost), affordable local advertisement reaching the right audience are some factors contributing to the success of regional channels.
Regionalization has caught the eyes of most established broadcasters, catering to specific interests of the viewers:
Figure 33: Viewership across TV Genres in India
Source: TAM Media
Regional GECs are almost matching the strength of their national counterparts, and have emerged as a key focus area for most players
3 ‘Going native’, article published in Financial Times in Oct 2010
4 TAM Media
28
• Tamil,Malayalam,Telugu,Kannada,BengaliandMarathi are the key languages in the regional GEC space
• SunTVNetworkshasbeenaleadingTVbroadcasterin the South Indian television market
• ZeeNetworksthatestablishedastrongpresencein northern and eastern India with channels in Bengali,Gujarati,MarathiandPunjabiby2004;alsocommands a significant present in South India with their first South Indian channel launch - Zee Telugu in 2005, Zee Kannada in 2006, Zee Tamil in 2008
Other broadcasters such as Sony, NDTV, UTV are eyeing the growing regional channel space, intensifying the need for more and more specialized content targeted at the regional viewers.
II. News channels: Losing steamIndia currently has about 250 news channels as against 215 in 20085– highest as compared to any other country. 42 new news channels were permitted in 2009 and 2010. Except for a handful of leading news channels such as AajTak, most national as well as regional news channels are losing steam to the GECs. While the GECs are fast catching up with their differentiated content, the news channels struggle to strike the right balance between traditional newscontentsuchaspolitics,currentaffairs;andentertainment content. The news channels also grapple with holding the viewer’s attention. Some channels have tried to address this by creating dedicated channels for
specific type of content. TV Today launched an English Channel,HeadlinesToday;andthenanotherHindichannel, Tez (meaning fast). Both these channels were aimed at the busy viewer who does not have time for long and detailed news bulletins.
III. Music: Journey away from musicMusic channels in Indian television are facing winds of change. Four years ago, there were 12 pure music channels. Today, there are only four - 9XM, ETC, Music India and VH1. Audience viewership for music channels is dipping across all age groups. Most traditional music channels are also embracing non-music content since these channels are finding it increasingly difficult to retain and attract interest of audience due to growing competition from GEC and other genres.
IV. Sports: Creating its own nicheSports channels in India have increased manifold over the last few years. The Indian cricket fans constitute the primary viewers of the Indian sports channels. Events such as Twenty20 World Cup and IPL have offered exactly what the Indian cricket fans look for. Games such as hockey and football are also gaining more importance – increased demand and viewership for live telecasts, along with attracting sponsorships from bigger brands. For example, initiatives such as ESPN Star Sports association with the Indian Hockey Federation to create the Premier Hockey league can offer further growth of this genre.
5 Ministry of Information and Broadcasting. March 2010
Animation. Broadcasting. Gaming. On the Cusp of Growth | 29
V. Kids: It will be more quality nowTiny-tots are migrating from other genres of channels to the specific genre of cartoon channels for them. The channels are responding well enough by incorporating increasingly vivid and superior content. While Cartoon Network continues to hold the fort in the all-India kids segment, the channel has seen a 3% dip over the previous year to end 2009 with a 24% market share4. Channel Pogo too has managed to retain the number 2 slot in this space. The channel has seen a rise in its market share from 20% in 2008 to 22% in 20094. This genre has tremendous potential to grow given that the target audience for the ‘kids’ channels is not only kids, but also some viewers from the adult segments.A host of new channels were launched across the
GEC as well as non-GEC genres over the last 2 years. In the GEC genre, Colors, NDTV Imagine, 9X and few others were launched, while channels such as Discovery Science, UTV Movies were introduced in the non-GEC genre. Since the Ministry of Broadcasting decided to temporarily suspend the issuance of new licenses to newchannelsduetothelackofspectrumin2009;theincrease in number of new channels in 2010 and 2011 is expected to be driven only by players already holding the licenses and are yet to launch the channels.
Policy FrameworkTRAI was designated as the regulator for broadcasting and cable services in 2004. While much is still uncertain about the broadcasting guidelines for the newly
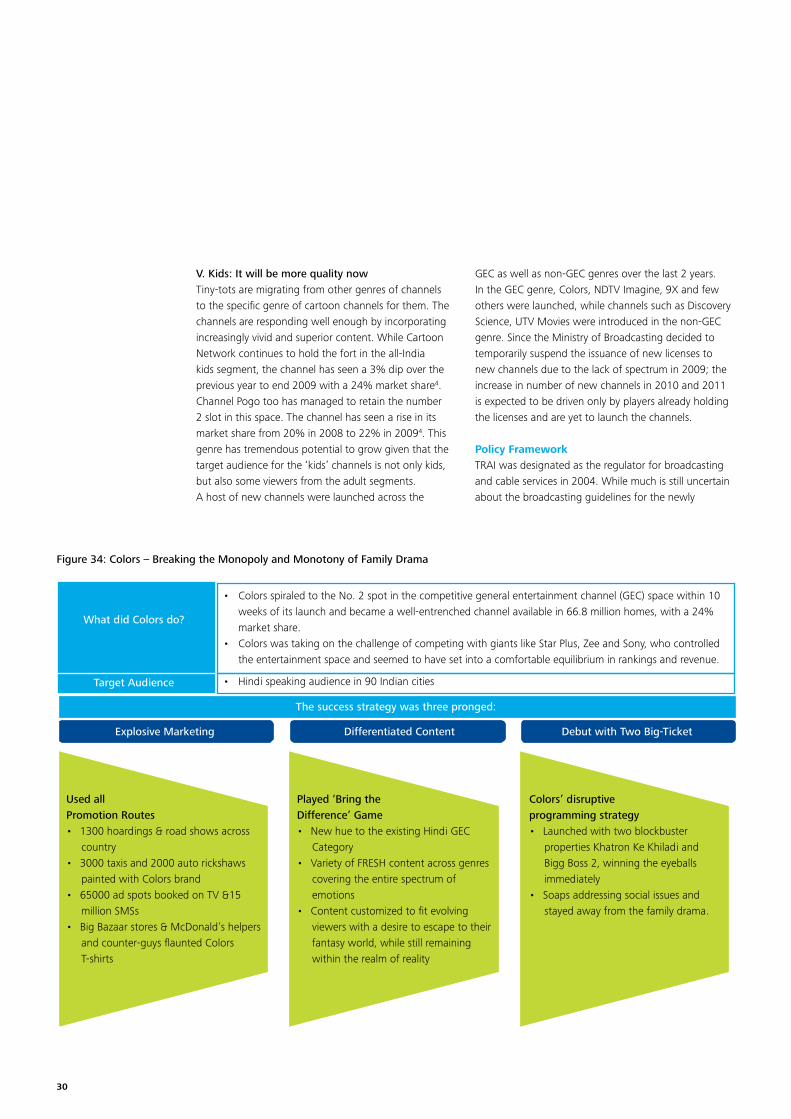
Figure 34: Colors – Breaking the Monopoly and Monotony of Family Drama
What did Colors do?
Target Audience
The success strategy was three pronged:
Explosive Marketing Differentiated Content Debut with Two Big-Ticket
• ColorsspiraledtotheNo.2spotinthecompetitivegeneralentertainmentchannel(GEC)spacewithin10weeks of its launch and became a well-entrenched channel available in 66.8 million homes, with a 24% market share.
• ColorswastakingonthechallengeofcompetingwithgiantslikeStarPlus,ZeeandSony,whocontrolledthe entertainment space and seemed to have set into a comfortable equilibrium in rankings and revenue.
• Hindispeakingaudiencein90Indiancities
Used all Promotion Routes• 1300hoardings&roadshowsacross
country• 3000taxisand2000autorickshaws
painted with Colors brand• 65000adspotsbookedonTV&15
million SMSs• BigBazaarstores&McDonald’shelpers
and counter-guys flaunted Colors T-shirts
Played ‘Bring the Difference’ Game• NewhuetotheexistingHindiGEC
Category• VarietyofFRESHcontentacrossgenres
covering the entire spectrum of emotions
• Contentcustomizedtofitevolvingviewers with a desire to escape to their fantasy world, while still remaining within the realm of reality
Colors’ disruptive programming strategy • Launchedwithtwoblockbuster
properties Khatron Ke Khiladi and Bigg Boss 2, winning the eyeballs immediately
• Soapsaddressingsocialissuesandstayed away from the family drama.
30
emerging distribution segments, one thing can be stated with certainty: we have moved into a new era of digital transmission of television content. The Government of India mandated digital conditional access systems (CAS) and rollout of DTH TV licenses highlights the regulator’s focus on speeding up the digitization process. The Headend-in-the-Sky (HITS) policy and a concessional customs duty of 5% on importing digital headend equipment is expected to give drive the digitization process even faster.
FDI policy across various distribution segments:• CableNetwork:Foreigninvestmentandportfolio
investments are permitted up to 49% • Direct-to-Home:Foreigninvestmentandportfolio
investments are permitted up to 49%. Within the limit of 49%, FDI will not exceed 20%
• Headendinthesky(HITS):Foreigninvestmentandportfolio investments are permitted up to 74%
Since more and more telecom companies are entering the broadcasting space, FDI ceilings would need to be rationalized to facilitate the anticipated convergence.
Future OutlookThe television industry is truly transforming. Increasing pay TV penetration, multiple channels in each genre racing against each other for TRPs, expanding yet fragmented local as well overseas viewership of Indian channels, demand for more specific content – clearly sets the stage for the next level of growth and transition for players across the television value chain. Content creators and broadcasters need to be cognizant of the ever increasing demand for differentiated content. While on one hand, new digital content distribution platforms areemerging;ontheotherhand,newformatsofentertainment - computers, mobiles and other handheld devices are gaining importance. Monetization of content through these new media platforms is going to be a key focus area for the content owners. Some key trends and challenges that lie ahead are:
• Digital.Digital.Digital:‘Digital’isalreadythebuzzword today – digital content, digital production, digital distribution, digital platforms… It is imperative for players across the value chain to be digitally adept to fully garner these opportunities
• Spiralingproductioncosts:Managingproductioncosts is one of the key challenges for content producers. With the almost waning economic slowdown, the talent costs are rising again to the levels they were prior to the pre-recession times
• FallingARPUs:ThehighlycompetitiveDTHmarketis experiencing lower ARPUs, while also moving neck to neck with local cable operators (LCOs) and multi system operators (MSOs). Most players are experiencing and are likely to witness for few more years, a squeezing bottom-line growth. High cost of customer acquisition further intensifies the pressure
• Evolvingviewerinterests:Theviewertodayisnotonly looking for new-fangled content but is also very quality conscious. From new movie broadcasts to the IPL craze, from series such as ‘Balika Vadhu’ addressing social issues to reality shows with more and more celebrity appearances – the need for differentiated and fresh content is on an all time high. Regional viewers, both in India and overseas, are also gaining importance
• Fragmentedviewership:Increasingnumberofchannels has fragmented the TV audience. The only way to garner a significant market share within the viewership is through differentiated content. This would require a deep understanding of the consumer segments and their media consumption habits
Players across the television value chain need a sound action plan to address some of these challenges and harness the opportunities in a growing and high potential sector. While there isn’t any one-size-fits-all approach to realize the true potential of this sector, there are some areas that the players may need to focus more on and prioritize. It would be important, for instance,toaddressthedemandforregionalcontent;to work closely with the regulator in developing transparent and more accurate techniques to measure viewership;toinfluencetheregulatorforanincreasedimpetusondigitization;toinfluencestakeholdersacrossthevaluechainforcontrollingproductioncosts;andtoenhance value delivered to the end-customer both in terms of varied content experience (by content creators / broadcasters) and effective customer-service (by distributors).
Animation. Broadcasting. Gaming. On the Cusp of Growth | 31
Radio
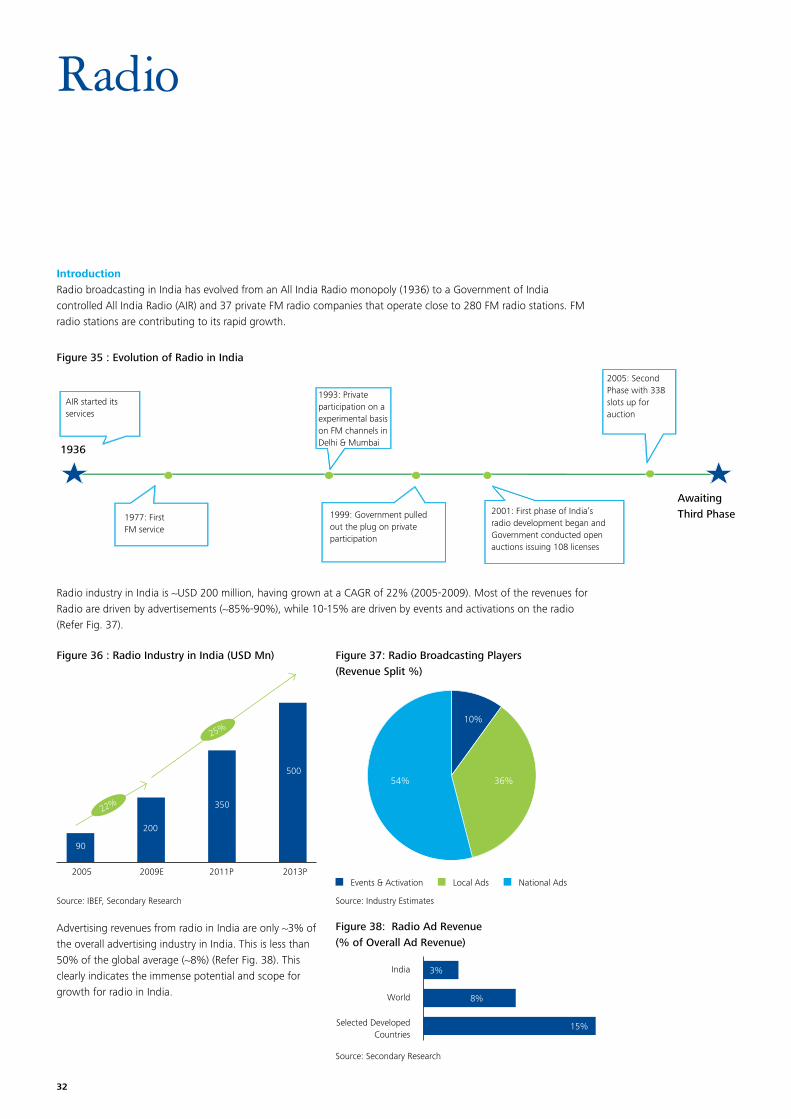
IntroductionRadio broadcasting in India has evolved from an All India Radio monopoly (1936) to a Government of India controlled All India Radio (AIR) and 37 private FM radio companies that operate close to 280 FM radio stations. FM radio stations are contributing to its rapid growth.
Radio industry in India is ~USD 200 million, having grown at a CAGR of 22% (2005-2009). Most of the revenues for Radio are driven by advertisements (~85%-90%), while 10-15% are driven by events and activations on the radio (Refer Fig. 37).
Advertising revenues from radio in India are only ~3% of the overall advertising industry in India. This is less than 50% of the global average (~8%) (Refer Fig. 38). This clearly indicates the immense potential and scope for growth for radio in India.
Figure 35 : Evolution of Radio in India
Figure 37: Radio Broadcasting Players (Revenue Split %)
Figure 38: Radio Ad Revenue (% of Overall Ad Revenue)
1936
AIR started its services
1977: First FM service
1993: Private participation on a experimental basis on FM channels in Delhi & Mumbai
1999: Government pulled out the plug on private participation
2001: First phase of India’s radio development began and Government conducted open auctions issuing 108 licenses
2005: Second Phase with 338 slots up for auction
Awaiting Third Phase
Figure 36 : Radio Industry in India (USD Mn)
22%
25%
2005 2009E 2011P 2013P
90
200
350
500
Source: IBEF, Secondary Research
10%
36%54%
Events & Activation Local Ads National Ads
Source: Industry Estimates
India
World
Selected Developed Countries
15%
Source: Secondary Research
3%
8%
32

Key Growth Drivers & ConstraintsUniqueness of radio, its utility on the move and the 3rd Phase of Licensing are expected to drive its growth in India:
Unique value propositionRadio is a unique medium compared to other advertising media. It is a local medium and can deliver locally relevant content. It is a highly interactive medium and can be used most effectively for promotional campaigns. This value proposition of the radio is expected to be increasingly realized and leveraged by advertisers.
High utility on the move Radio finds high utility by people on the move, whether it be inside the car or inside a public transport (via mobile phones). India is a rapidly growing car market (Refer Fig. 39), which will increase both the number of radio listeners and the time spent listening to radio.
Moreover, the growth of mobiles (Refer Fig. 40) bodes well for the radio industry. According to Radio Audience Measurement data, 49 % listeners access radio from their mobile phones. With the availability of low cost FM
enabled mobile phones, the radio audience is bound to increase.
3rd phase of licensingA significant number of licenses are expected in the 3rd phase of licensing: 3 in Top 8 Metros, 22 in other top 30 cities and > 600 licenses in smaller cities are expected to be made available.
While radio, based on both international comparison and the prevailing drivers in India, carries the potential to grow at a significant rate, current financial viability and regulatory restrictions pose large constraints for the industry.
• Typeofcontent:FMradiostationsarepermittedtoplay music only. This has kept the private industry deprived of leveraging other potential genres such as news, emerging sports genre in India and other niche content genres. Globally, radio stations have the freedom to broadcast channels across genres like news, sports, fashion, talk shows, religion, weather, cookery e.g. Walt Disney has more than 3000 radio channels, each dedicated to everything from weather to cookery. In the US, radio listeners spend almost 50% of their radio listening time on news or talk channels.
Figure 39: Passenger Vehicle Sales India (2009) (‘000 Units)
13%
2005 2006 2007 2008 2009 2010
1061
11431380
15491552
1950
Source: SIAM
Figure 40: FM Enabled Mobile Phone Growth
2007
165.0
37%
59%
65%261.0
392.0
2008 2009
Mobile Subscribers (Mn) % of FM Enabled Handsets
Source: TRAI, Business Press, IDC India 2010
Animation. Broadcasting. Gaming. On the Cusp of Growth | 33
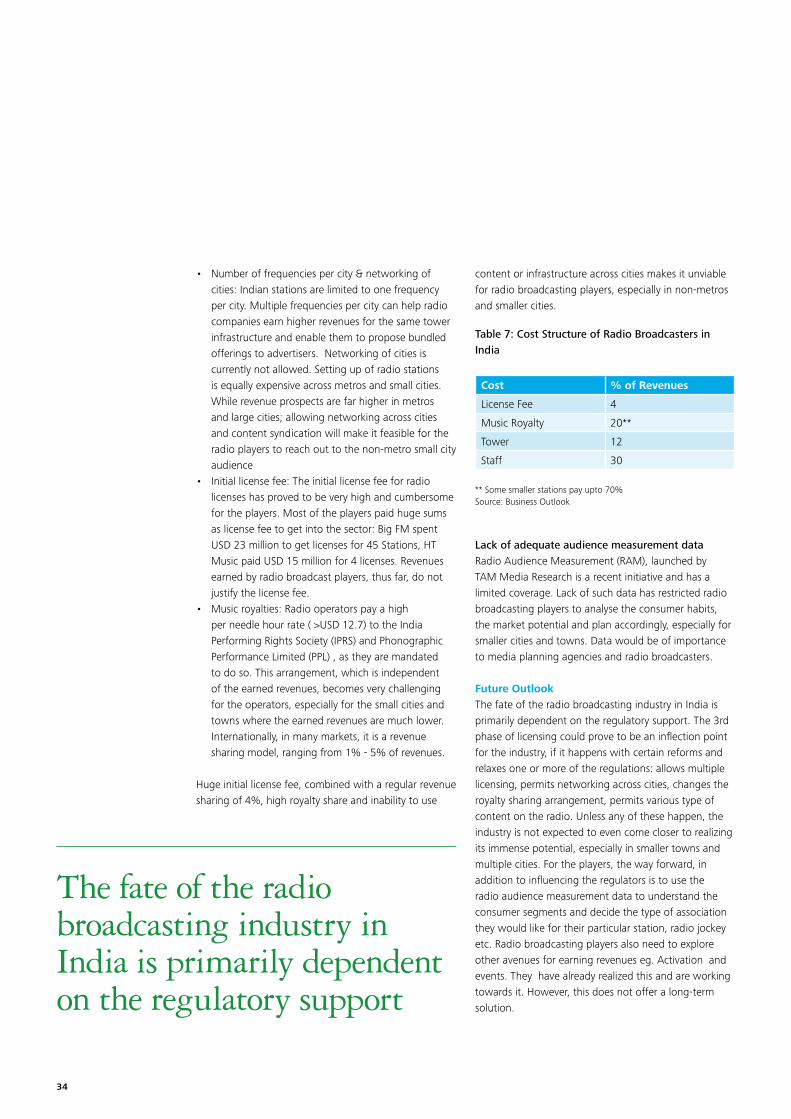
• Numberoffrequenciespercity&networkingofcities: Indian stations are limited to one frequency per city. Multiple frequencies per city can help radio companies earn higher revenues for the same tower infrastructure and enable them to propose bundled offerings to advertisers. Networking of cities is currently not allowed. Setting up of radio stations is equally expensive across metros and small cities. While revenue prospects are far higher in metros andlargecities;allowingnetworkingacrosscitiesand content syndication will make it feasible for the radio players to reach out to the non-metro small city audience
• Initiallicensefee:Theinitiallicensefeeforradiolicenses has proved to be very high and cumbersome for the players. Most of the players paid huge sums as license fee to get into the sector: Big FM spent USD 23 million to get licenses for 45 Stations, HT Music paid USD 15 million for 4 licenses. Revenues earned by radio broadcast players, thus far, do not justify the license fee.
• Musicroyalties:Radiooperatorspayahighper needle hour rate ( >USD 12.7) to the India Performing Rights Society (IPRS) and Phonographic Performance Limited (PPL) , as they are mandated to do so. This arrangement, which is independent of the earned revenues, becomes very challenging for the operators, especially for the small cities and towns where the earned revenues are much lower. Internationally, in many markets, it is a revenue sharing model, ranging from 1% - 5% of revenues.
Huge initial license fee, combined with a regular revenue sharing of 4%, high royalty share and inability to use
content or infrastructure across cities makes it unviable for radio broadcasting players, especially in non-metros and smaller cities.
Table 7: Cost Structure of Radio Broadcasters in India
Cost % of Revenues
License Fee 4
Music Royalty 20**
Tower 12
Staff 30
** Some smaller stations pay upto 70%Source: Business Outlook
Lack of adequate audience measurement dataRadio Audience Measurement (RAM), launched by TAM Media Research is a recent initiative and has a limited coverage. Lack of such data has restricted radio broadcasting players to analyse the consumer habits, the market potential and plan accordingly, especially for smaller cities and towns. Data would be of importance to media planning agencies and radio broadcasters.
Future OutlookThe fate of the radio broadcasting industry in India is primarily dependent on the regulatory support. The 3rd phase of licensing could prove to be an inflection point for the industry, if it happens with certain reforms and relaxes one or more of the regulations: allows multiple licensing, permits networking across cities, changes the royalty sharing arrangement, permits various type of content on the radio. Unless any of these happen, the industry is not expected to even come closer to realizing its immense potential, especially in smaller towns and multiple cities. For the players, the way forward, in addition to influencing the regulators is to use the radio audience measurement data to understand the consumer segments and decide the type of association they would like for their particular station, radio jockey etc. Radio broadcasting players also need to explore other avenues for earning revenues eg. Activation and events. They have already realized this and are working towards it. However, this does not offer a long-term solution.
The fate of the radio broadcasting industry in India is primarily dependent on the regulatory support
34

Animation, Gaming and Broadcasting all have the potential to see near future as inflection points in their growth story
Deloitte refers to one or more of Deloitte Touche Tohmatsu Limited, a UK private company limited by guarantee, and its network of member firms, each of which is a legally separate and independent entity. Please see www.deloitte.com/about for a detailed description of the legal structure of Deloitte Touche Tohmatsu Limited and its member firms.
This material prepared by Deloitte Touche Tohmatsu India Private Limited (DTTIPL) is intended to provide general information on a particular subject or subjects and is not an exhaustive treatment of such subject(s) and accordingly is not intended to constitute professional advice or services. The information is not intended to be relied upon as the sole basis for any decision which may affect you or your business. Before making any decision or taking any action that might affect your personal finances or business, you should consult a qualified professional adviser.
None of DTTIPL, Deloitte Touche Tohmatsu Limited, its member firms, or its and their affiliates shall be responsible for any loss whatsoever sustained by any person who relies on this material.
©2010 Deloitte Touche Tohmatsu India Private Limited. Member of Deloitte Touche Tohmatsu Limited