animations to illustrate the effect of uncertainty in crack orientation view these slides in...
TRANSCRIPT

Animations to illustrate the effect of uncertainty in crack orientation
View these slides in SlideShow mode of PowerPoint (not OpenOffice).
Press Shift-F5 to get into slideshow mode.
Copyright [email protected]
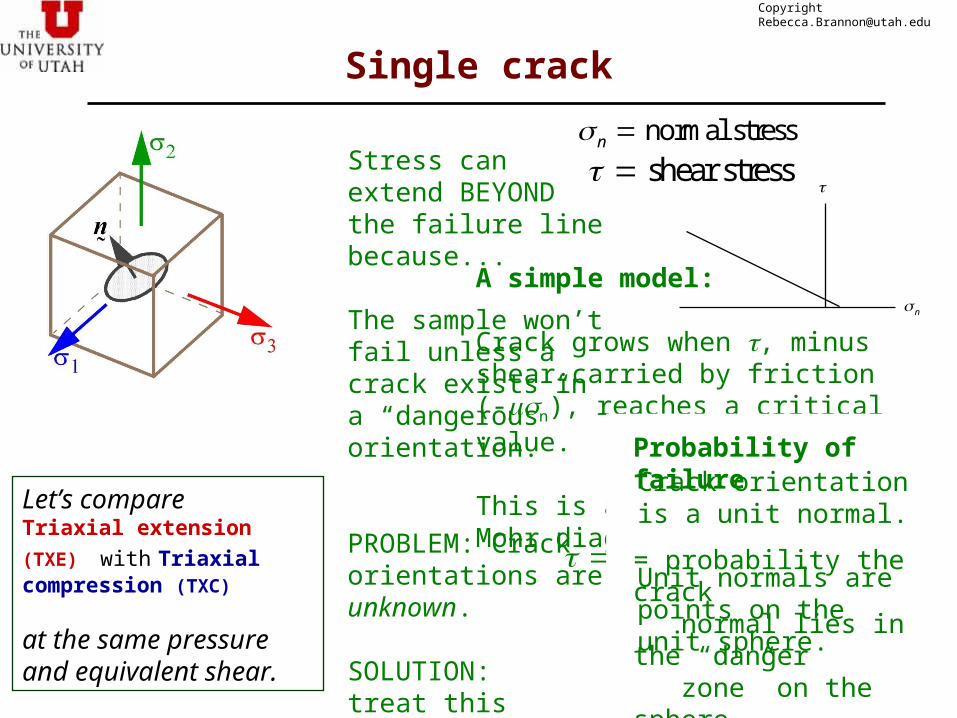
Single crack
Pro
ba
bili
ty o
f fa
ilure
radius of Mohr’s circle
n
TXE
TXC
Stress can extend BEYOND the failure line because...
The sample won’t fail unless a crack exists in a “dangerous” orientation.
PROBLEM: Crack orientations are unknown.
SOLUTION: treat this problem probabilistically.
TXETXC
A simple model:
Crack grows when , minus shear carried by friction (-n), reaches a critical value.
This is a straight line in Mohr diagram:
cn
K
a
n
Let’s compareTriaxial extension (TXE) with Triaxial compression (TXC)
at the same pressure and equivalent shear.
normal stressn shear stress
Probability of failure
= probability the crack normal lies in the “danger zone” on the sphere
= area fraction of danger zones
Crack orientation is a unit normal.
Unit normals are points on the unit sphere.
Copyright [email protected]
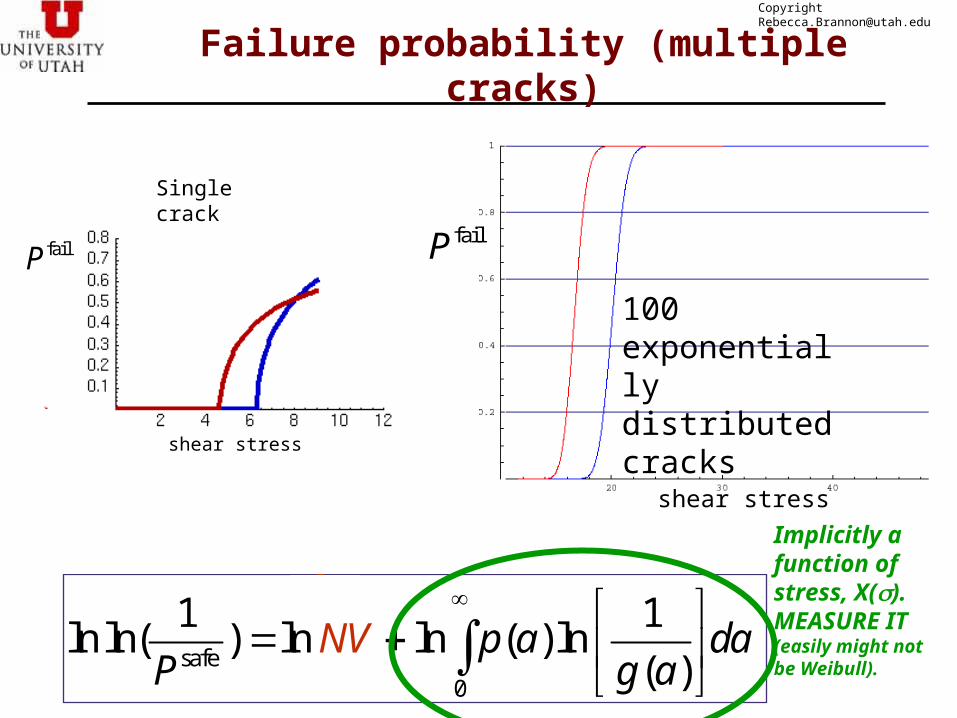
Failure probability (multiple cracks)
Let g(a) = probability that a single crack of size “a” is safe.
safe1 2Two cracks, two sizes: ( ) ( )P g a g a
safe 2Two cracks, one size: ( )P g a
1 2safe1 2Multiple cracks, multiple sizes: ( ) ( ) ...n nP g a g a
safe1 1 2 2ln( ) ln( ( )) ln( ( )) ...P n g a n g a
safe tot1 1 2 2ln( ) ( ln[ ( )] ln[ ( )] ...)P n p g a p g a
safe tot
0
ln( ) ( ) ln[ ( )]P p a a dn g a
Upper bound
safe0
1 1ln ln( ) ln ln ( ) ln
( )NV p a da
P g a
shear stress
100 exponentially distributed cracks
failP
Singlecrack
shear stress
failP
Implicitly a function of stress, X().MEASURE IT(easily might not be Weibull).
Copyright [email protected]
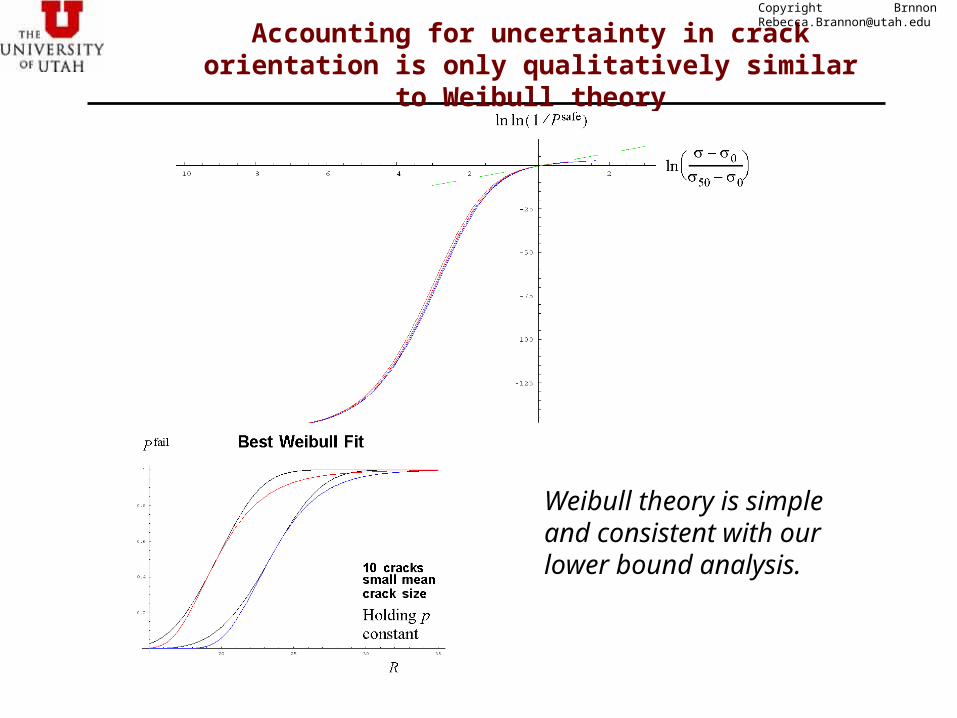
Accounting for uncertainty in crack orientation is only qualitatively similar to Weibull theory
Weibull theory is simple and consistent with our lower bound analysis.
BrnnonCopyright [email protected]

Does Weibull theory give the correct sample size dependence?
l1
l nn ln ln ln(2) lns
V
Vm
P
V Vsm
alle
r sam
ple
V V
larg
er s
ampl
e
ln
V V
Basel
ine
1ln ln ln ln(2)
sP
Copyright [email protected]
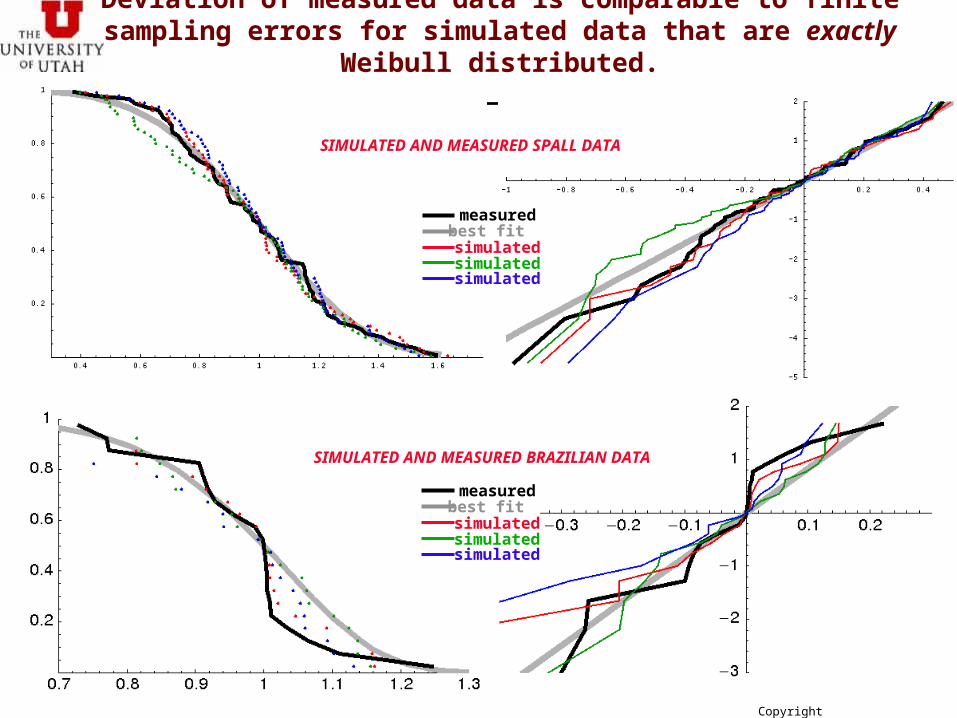
SIMULATED AND MEASURED SPALL DATA
SIMULATED AND MEASURED BRAZILIAN DATA
Deviation of measured data is comparable to finite sampling errors for simulated data that are exactly Weibull distributed.
measuredbest fitsimulatedsimulatedsimulated
measuredbest fitsimulatedsimulatedsimulated
Copyright [email protected]

EVIDENCE OF SIZE EFFECTS
Sample-to-Sample variability in strength at large scales.
SIGNIFICANT size effects – not negligible.
Copyright [email protected]
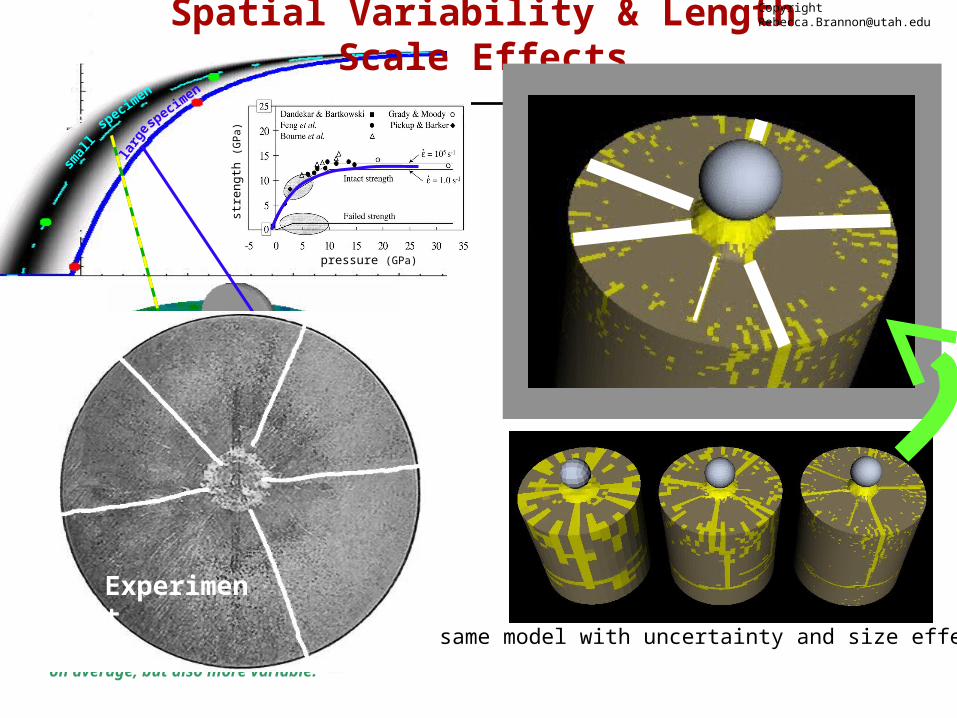
specimen
larg
especim
en
smal
l
pressure (GPa)
stre
ngth
(GP
a)
Initial state:Small elements are stronger on average, but also more variable.
conventional damage model
same model with uncertainty and size effects
Spatial Variability & Length Scale Effects
small small elements
elements
LARGE LARGE elementselements
Experiment
Copyright [email protected]