ankara 2019 2
TRANSCRIPT

1
2
Ankara 2019
Photo Credit:
Man in White Apron: Ozan Toptaş
Suggested citation: Turkish Red Crescent and World Food Programme.
(2019). Refugees In Turkey: Livelihoods Survey Findings. Ankara, Turkey.
3
Contents Executive Summary ...................................................................................................................................... 4
Introduction .................................................................................................................................................. 6
Background ............................................................................................................................................... 6
Objective ................................................................................................................................................... 7
Methodology ............................................................................................................................................. 7
Limitations ................................................................................................................................................ 9
Findings ....................................................................................................................................................... 10
1. Profile of Respondents ........................................................................................................................ 10
1.1 Demographics ............................................................................................................................. 10
1.2 Literacy and education ................................................................................................................ 11
1.3 Training ....................................................................................................................................... 14
1.4 Language skills ............................................................................................................................ 16
2. Refugee Employment .......................................................................................................................... 20
2.1 Employment ................................................................................................................................ 20
2.2 Sector .......................................................................................................................................... 25
2.3 Contract type .............................................................................................................................. 31
2.3.1 Regularity ............................................................................................................................ 31
2.3.2 Working hours ..................................................................................................................... 32
2.4 Income ........................................................................................................................................ 33
2.5 Unemployment ........................................................................................................................... 35
2.6 Job mobility ................................................................................................................................. 37
3. Improving Refugees’ Self-reliance ...................................................................................................... 38
3.1 Barriers to employment .............................................................................................................. 38
3.2 Dependency ................................................................................................................................ 39
3.3 Requested support ...................................................................................................................... 40
Discussion and Conclusion ......................................................................................................................... 41

4
Executive Summary
WFP and TRC developed the Livelihoods Survey
to provide additional evidence to inform the
design of the transition from basic needs
assistance to more sustainable livelihoods
opportunities for refugees in Turkey. The survey
sample is drawn from the ESSN applicant pool
and aims to assess the potential for refugee
integration into Turkish labour markets, as well
as to identify key constraints.
The survey was conducted among ESSN
beneficiaries and ineligible applicants from 19
provinces in Turkey. The provinces were grouped
into three geographical regions: West Turkey,
Central Anatolia and South Turkey. In order to
have representative data at the provincial level,
a sample size of 284 surveys in each province
was set and a total of 5,332 surveys were
conducted.1 This survey is representative of
ESSN applicants within the 19 provinces included
in the survey. This is equivalent to a total of
413,025 households, including approximately
2.4 million people. Data collection took place in
the period June-November 2018.
The results show that 84 percent of refugee
households had at least one person who is
working. Only 3 percent of the refugees were
working with a work permit, indicating that the
vast majority were working informally with
limited job security. Those with a work permit
tended to be concentrated in the Central region
of the country, with 17 percent of refugees in
Konya reportedly working with a work permit.
Prior to coming to Turkey, the majority of
refugees reported that they were working
regularly, including 30 percent who were self-
employed. Seventeen percent of refugees
reported being unemployed in in their country of
origin before arrival in Turkey, almost the same
195 percent confidence level, 5.8 percent margin of error and 50 percent assumed prevalence
as the unemployment rate in Turkey among
respondents. However, the results also indicate
that the labour market conditions and refugees’
participation in the labour market in their
country of origin and in Turkey were very
different in terms of formality of work,
employment conditions, types of work, and
wages.
According to the survey findings, 20 percent of
the refugees in Turkey were working in unskilled
services, followed by textile (19 percent),
construction (12 percent), and artisanship (10
percent). The sectors where refugees were least
employed were shoemaking (6 percent),
commercial services and handyman jobs (both 5
percent). These national percentages vary by
province, with almost half of refugees in Istanbul
working in the textile industry, versus almost a
quarter working in agriculture in Mersin.
The data demonstrates that unemployment is
relatively high among refugees with no formal
education, but also those with higher levels of
education. Of the 18 percent of refugees
classified as educated (i.e. had graduated from
university or high school), one-fifth were
unemployed. Similarly, the one-fifth of those
without any formal education were
unemployed. Organisations working on refugee
livelihoods may therefore consider providing
support to educated refugees to access degree
accreditation, which could help them to find
work in their sectors of expertise.
The survey asked respondents about the
regularity of their work. Regular work was
defined as having a contract and pre-determined
working hours. Results demonstrated that over
half of refugees (54 percent) were working
irregularly; this figure is 80 percent among those
195 percent confidence level, 5.8 percent margin of error and 50 percent assumed prevalence.
5
providing unskilled services. Job regularity is the
highest in the textile sector; 79 percent of
refugees working in textiles have regular work.
As noted, only 3 percent of working refugees
have a formal work permit, providing job
security, minimum wage and social security. The
largely informal and unreliable nature of refugee
work in Turkey may hamper refugee integration
into the host community. Therefore policies to
encourage employers to provide work permits
for refugees could increase refugee self-reliance
and integration. 2
Refugees with irregular work earned an average
of 1,058 TRY per month. Those with regular
employment earned an average of 1,312 TRY per
month. The textile industry provided the highest
income among the sectors (1,332 TRY); this is
logical, as it also has the highest proportion of
refugees in regular work. Unskilled services and
agriculture provided the lowest income, at 768
TRY and 756 TRY respectively.
Among the unemployed, 55 percent of men and
39 percent of women are looking for jobs. The
vast majority of those not looking for jobs
explained that this was due to disability (among
men) and childcare responsibilities (among
women). These factors must be carefully
considered during programme design and
development of targeting strategies.
When asked about training courses, only 1 in 10
people had previously attended a training. The
trainee profile is mostly unemployed females,
indicating that others in the household may be
busy at work. The bulk of trainings attended
were offered by the Government, and were
mostly Turkish language courses. In general,
Turkish language abilities remain low. Four out
of five refugees had beginner level, and only 3
percent had advanced level.
2 https://www.igamder.org/wp-content/uploads/2017/01/Challenges-and-opportunities-of-refugee-integration-in-turkey-full-report.pdf
The data indicates that language skills influence
employability. While 50 percent of the refugees
with beginner level Turkish were employed full-
time, this increased to 60 percent among the
refugees with intermediate or advanced Turkish.
In terms of monthly income, refugees with
advanced Turkish made an average of 70 TRY
more per month than refugees with
intermediate level of Turkish skills (1,280 TRY
and 1,211 TRY respectively). Respondents with
beginner level Turkish earned 1,015 TRY average
monthly income.
When refugees were asked what kind of support
they required to find a job, 60 percent cited
Turkish language training, and almost 50 percent
cited vocational training or soft skills training,
such as interview skills and CV writing.
The overarching findings of the livelihoods
survey indicate that successful policy and
programme interventions must be evidence
based and well targeted. The majority of
refugees in Turkey come from less educated and
less skilled backgrounds, however there is large
regional variation. Livelihoods programmes must
first seek to understand regional and contextual
factors determining job opportunities, and align
interventions accordingly. These interventions
must then be targeted at the right individuals,
considering previous work experience, levels of
specialisation and education. It is therefore
essential that the international community and
the Turkish Government collaborate to share
information and design interventions. This
collaboration will ensure maximum use of
limited resources, working toward the joint
objective of encouraging refugees to become
more self-reliant.
2 https://www.igamder.org/wp-content/uploads/2017/01/Challenges-and-opportunities-of-refugee-integration-in-turkey-full-report.pdf
6
Introduction
Background
Turkey has the largest refugee population of any country in the world, with 3.6 million Syrians registered
under Temporary Protection and approximately 370,000 registered refugees under International
Protection from other countries such as Iran, Afghanistan, Iraq and Somalia. The majority of refugees
remain in the southeast of Turkey. Over 545,000 refugees are also living in Istanbul, making it the largest
refugee-hosting city in Turkey. Substantial populations are also found in Şanlıurfa, Hatay, Gaziantep and
in other cities outside of the southeast such as Bursa, Izmir and Konya. The Government of Turkey has
demonstrated leadership and generosity in providing for the needs of these populations. Since June 2011,
a Temporary Protection regime has granted Syrians access to basic services such as healthcare, education
and social services. Refugees of other nationalities can benefit from International Protection status and
have access to the same services. Since November 2016, refugees under Temporary Protection and
International Protection have been supported to meet their basic needs under the Emergency Social
Safety Net (ESSN). The programme is implemented in partnership by the World Food Programme (WFP),
the Turkish Red Crescent (TRC) and the Ministry of Family, Labour and Social Services (MoFLSS), and is
funded by the European Commission Humanitarian Aid (ECHO). The ESSN provides cash-based transfers
of 120 Turkish liras (USD 21) per person per month with quarterly top-ups adjusted for family size. As of
June 2019, the total number of ESSN beneficiaries reached 1,646,888.
Given the protracted nature of the refugee crisis, the response in Turkey is transitioning from supporting
basic needs toward more sustainable solutions that focus on supporting refugee livelihoods. The majority
of refugees are already working, however they are primarily working informally with unreliable access to
work and low wages. The focus is therefore evolving towards skills development and increasing the
employability of refugees, with the aim of increasing self-reliance and as well as improved integration into
the labour market. The Regulation on Work Permit of Refugees under Temporary Protection was issued
in the Official Journal 2016/8375 in January 2016, giving Syrian refugees the right to access work permits
under certain conditions and with some restrictions. As per the Turkish Act on Fees No. 492, the fee for
temporary work permits (up to one year) was 537.50 TRY, and decreased to 200.00 TRY for Syrians under
Temporary Protection (SuTP) in December 2017. The regulation remained the same for refugees under
International Protection.
However, despite the positive regulatory environment, diverse economy, and investments by the
Government of Turkey and donors in refugee livelihoods, a number of challenges remain for refugees’
integration into the labour market, particularly the formal economy. As of 28 February 2019, just 38,289
work permits had been issued to SuTP since the work permit regulation was introduced three years earlier,
and 32,111 permits had been issued to Syrians with residence permits. In Turkey the language barrier is
one of the main challenges Syrian (and other) refugees face in accessing formal employment. Other
challenges include the high participation of refugees in the informal economy; the informality of the
refugees working in the formal sector; skills and education gaps; high unemployment rates in Turkey; as
well as the quota restricting the number of refugees that can be employed as a proportion of all workers.
A 2015 World Bank study found that lack of access to work permits for SuTP, especially before January
2016, created a positive supply shock on informal labour and increased competition for low-skilled Turkish
7
workers in the informal economy. This caused around six native workers to be displaced for every ten
refugees.3 As the rates of unemployment in the formal sector have increased to 14.5 percent in January
2019, this creates additional competition for jobs in the informal sector, which already accounts for 33
percent of the Turkish economy by official estimates.4 Within this context, as the international community
and Government shift towards a focus on refugees’ integration in the labour market, it is essential that
reliable evidence is used to design interventions, maximising effectiveness and minimising harm.
Objective
WFP and TRC developed the Livelihoods Survey to provide additional evidence to inform the design of the
transition from basic needs assistance to more sustainable livelihoods opportunities for refugees in
Turkey. The survey sample is drawn from the ESSN applicant pool and aims to assess the potential for
refugee integration into Turkish labour markets, as well as to identify key constraints. As such, the
objectives of the survey were to:
- Establish a more detailed understanding of the education, skills and employment profile of
refugees in Turkey;
- Gain insight into the labour market integration of refugees, including understanding catalysts,
barriers and the additional support needed to enhance employment opportunities;
- Provide necessary evidence for the transition strategy and future of the ESSN programme, which
will focus on increasing the employability and self-reliance of beneficiaries;
- Highlight information that can feed into a broader profiling of employment activities for refugees.
This information allows for more accurate and evidence-based decision making in relation to livelihoods
programming for refugees in Turkey.
Methodology
The survey was conducted among ESSN applicants, including both beneficiaries and ineligible applicants,
from 19 provinces in Turkey (see Map 1). The provinces were grouped into three geographical regions:
West Turkey, Central Anatolia and South Turkey. In order to have representative data at the provincial
level, a sample size of 284 surveys in each province was set.5 This survey is representative of ESSN
applicants within the 19 provinces included in the survey. This is equivalent to a total of 413,025
households, including approximately 2.4 million people. Data collection took place through the TRC Call
Centre in the period June-November 2018.
The provinces of Bitlis, Muş and Van were included among the surveyed provinces, despite the low
number of refugees in these locations among ESSN applicants. Including these provinces aimed to capture
the employment patterns of Afghans in Turkey, to compare with results for Syrians and Iraqis populated
in the other provinces. Data from these provinces also provide interesting insights as they are on the route
3 Del Carpio, Ximena Vanessa; Wagner, Mathis Christoph. 2015. The impact of Syrian refugees on the Turkish labor market: The impact of Syrians refugees on the Turkish labor market (English). Policy Research working paper; no. WPS 7402. Washington, D.C.: World Bank Group. http://documents.worldbank.org/curated/en/505471468194980180/The-impact-of-Syrians-refugees-on-the-Turkish-labor-market 4 Labor Statistics, January 2019. TurkStat. Informal employment rate excluding agriculture is 23 percent. 595 percent confidence level, 5.8 percent margin of error and 50 percent assumed prevalence

8
taken by Afghan refugees who are attempting to go to Europe through Turkey.6 Due to the low numbers,
however, it was not possible to meet the minimum sample size. Consequently, data from Bitlis, Mus, and
Van is not representative and will not be presented at province level (this data does however feed into
the overall statistics). Except for these three provinces, data collectors were able to reach or exceed the
minimum required sample sizes in the other 16 provinces. The margin of error is below 5.5 percent.
Map 1 Overview of grouping of provinces into three regions, West, Central and South7
To examine differences in results at the regional level, the 19 provinces were divided into three regions
according to their geographical location and similarities in a number of characteristics. For instance, while
the South Turkey region is populated densely by Syrian refugees, the Iraqi population is largely located in
Central Anatolia.8 The West Turkey region differs from the other two areas given the high level of
industrial opportunities, which has attracted refugees to these provinces.9
The MoFLSS’s cumulative ESSN applicant list was used as the sampling frame. Two-stage stratified sampling was used. The first stage was geographic sampling, with the selection of provinces explained above. The second stage was household level sampling. After determining the minimum required sample size for households within each province, the ratio of ESSN beneficiaries to non-beneficiaries was used to determine the quota within each province. Households were randomly selected using R (statistical software) from the beneficiary or non-beneficiary list within each province. The individual respondent within each household was selected based on the availability of the primary breadwinner. In cases where the primary breadwinner was not available, the person who answered the phone provided information on behalf of the primary breadwinner. If the person was not able to provide information on behalf of the primary breadwinner, the survey was conducted with him/her and information about their education, skills and employment conditions were collected. It should therefore be noted that the survey results refer to the (primary) breadwinner within surveyed households. For simplicity, the term 'refugees' is used
6 Ahmet İçduygu & Sibel Karadağ (2018) Afghan migration through Turkey to Europe: seeking refuge, forming diaspora, and becoming citizens, Turkish Studies, 19:3, 482-502, DOI: 10.1080/14683849.2018.1454317 7 The Western region consists of Bursa, Kocaeli, Istanbul and Izmir, the Central region of Ankara, Kayseri, Konya, Samsun, Bitlis, Mus and Van; the Southern region of Adana, Gaziantep, Hatay, Kilis, Kahramanmaras, Mardin, Mersin and Şanlıurfa 8 http://www.goc.gov.tr/icerik3/gecici-koruma_363_378_4713 9 http://www3.kalkinma.gov.tr/DocObjects/Download/8141/1.pdf

9
throughout the report, but the data describes the primary breadwinner within each household, i.e. ”84 percent of refugees are working” means that the primary breadwinner is working within 84 percent of ESSN applicant households in the 19 provinces surveyed. Trained TRC enumerators collected the survey data through phone interviews from the Gaziantep-based TRC call centre. All selected households were called on their officially registered phone number under the ESSN programme. The non-response rate was 50 percent. Throughout the data collection period, the data quality was checked frequently by TRC’s M&E unit and when potential mistakes were found the household was called again to check the information. Population weights were calculated for both national level analysis and for analysis at province level. The
weights for analysis at national level were calculated using the latest application figures retrieved from
MoFLSS and crosschecked with the ESSN application dataset. For the province level analysis, weights were
calculated according to the ratio of beneficiaries and non-beneficiaries in each province.10 WFP’s VAM
unit and TRC’s M&E unit used SPSS to conduct the final analysis. The results have been triangulated with
other sources of information on livelihoods among refugees in Turkey, though a limited number of larger
studies are available.11
Limitations
While most of the enumerators were fluent in Arabic, there was a lack of enumerators speaking other
languages of ESSN beneficiaries such as Farsi and Pashto. As only two enumerators speak languages other
than Arabic, this resulted in a very low representation of non-Arabic speaking households: 44 Afghan, 45
Iranians and 20 from other countries. Given that the majority of the ESSN applicant pool is Arabic speaking,
this is however aligned with the lack of representation of non-Arabic speaking refugees in the ESSN pool.
As the study is not nationwide, it only represents data from the 19 selected provinces. The data is
therefore representative of ESSN applicants in the surveyed provinces, not of all refugees in Turkey.
However, for simplicity, in this report the term refugees or respondents will be used to describe all results.
Furthermore, the design of the ESSN programme creates a fluctuation in beneficiary and non-beneficiary
numbers in the ESSN pool on monthly basis in every province. Hence, the ratio of ESSN beneficiaries to
non-beneficiaries in each province varies every month.
Livelihood opportunities depend on the seasonality of the employment. For instance, the number of
workers in seasonal work such as agriculture and animal husbandry can vary each season which can create
differences between the results in the summer months and the results from provinces surveyed in the
winter months.
10 More information on the constructed weights can be found in Annex A 11 Studies include Altındağ et. al, İçduygu and Diker, UNHCR-UNDP Joint Secretariat, and Kumar et al.

10
Findings
1. Profile of Respondents
1.1 Demographics
Ninety percent of refugees living in Turkey reside in the 19 provinces covered in the Livelihoods Survey.
The majority of refugee12 households were male-headed (82 percent). Among the respondents, slightly
more ESSN beneficiary households were female-headed compared to non-beneficiary households (19
percent vs. 17 percent). Geographically, the Southern provinces had more female-headed households (20
percent) compared to 14 percent in Central Turkey. This is mainly driven by Hatay and Mersin, where
nearly 30 percent of households were headed by females, in comparison to Konya where only 9 percent
of households were female-headed.
More than half of the surveyed households were ESSN beneficiaries (57 percent), and the remaining 43
percent were non-ESSN beneficiaries. Central and South Turkey had a similar proportion of beneficiaries,
around 59 percent compared to 53 percent in the Western provinces.
The average age of respondents was 36 years old, the majority being 25-40 years old followed by 41-59
year olds. Only 2 percent were aged 60 or above. Respondents in the Southern provinces tended to be
slightly older than in the Western and Central provinces (aged 37 on average compared to 35).
Figure 2 Age of respondent
The average household consisted of six members, composed of two able bodied working age members,
three dependents (children under 15, elderly and/or disabled) and one 15-17-year-old (categorised
separately from dependents, as many are already working). Beneficiary and non-beneficiary households
varied in terms of household size and number of dependents, where beneficiary households tended to be
larger (seven members vs. five members in non-beneficiary households) and had twice as many
dependents (four compared with two in non-beneficiary households). This is in line with expectations as
the ESSN targeting criteria prioritises larger households with more dependents.
Overall, 95.6 percent of the surveyed households were Syrian, 3.7 percent Iraqi, 0.4 percent Afghan, 0.1
percent Iranian and 0.2 percent were other nationalities. In the Southern and Western provinces nearly
12 The data is not representative of all people under temporary/international protection in Turkey, but only for refugees from 19 selected provinces and with affiliation to the ESSN Programme. For simplicity, they will be referred to as either refugees or respondents throughout the report. For details on sampling, refer to the methodology.
11
all refugees were Syrian, while 83 percent of the Iraqi refugees were located in the Central region,
especially around Samsun and Ankara. Of the surveyed Iraqis, 81 percent were under International
Protection while 19 percent had humanitarian residence.
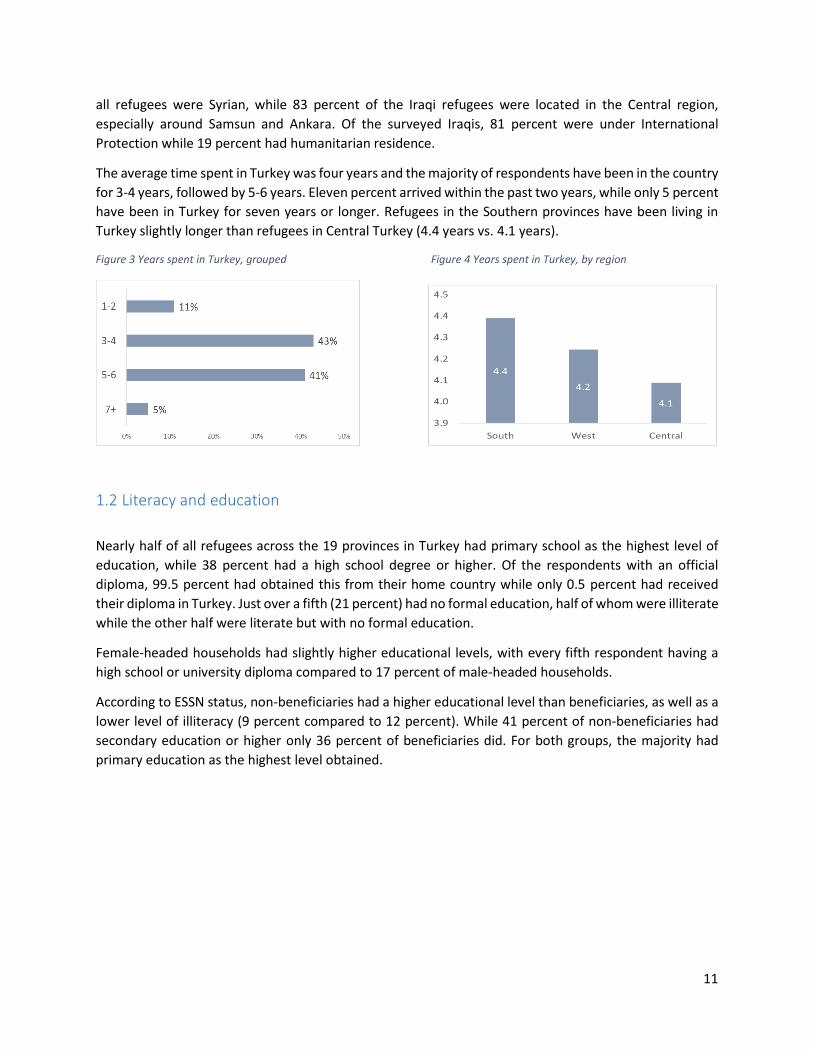
The average time spent in Turkey was four years and the majority of respondents have been in the country
for 3-4 years, followed by 5-6 years. Eleven percent arrived within the past two years, while only 5 percent
have been in Turkey for seven years or longer. Refugees in the Southern provinces have been living in
Turkey slightly longer than refugees in Central Turkey (4.4 years vs. 4.1 years).
Figure 3 Years spent in Turkey, grouped Figure 4 Years spent in Turkey, by region
1.2 Literacy and education
Nearly half of all refugees across the 19 provinces in Turkey had primary school as the highest level of
education, while 38 percent had a high school degree or higher. Of the respondents with an official
diploma, 99.5 percent had obtained this from their home country while only 0.5 percent had received
their diploma in Turkey. Just over a fifth (21 percent) had no formal education, half of whom were illiterate
while the other half were literate but with no formal education.
Female-headed households had slightly higher educational levels, with every fifth respondent having a
high school or university diploma compared to 17 percent of male-headed households.
According to ESSN status, non-beneficiaries had a higher educational level than beneficiaries, as well as a
lower level of illiteracy (9 percent compared to 12 percent). While 41 percent of non-beneficiaries had
secondary education or higher only 36 percent of beneficiaries did. For both groups, the majority had
primary education as the highest level obtained.

12
Figure 5 Highest education obtained, overall and by beneficiary status
Regional analysis shows that while the share of refugees without formal education was similar across the
three regions, refugees in the South had both the largest rate of illiteracy and also the highest share of
individuals with higher degrees. Conversely, the Western region had relatively few illiterate respondents
but also few respondents with a high school degree or higher level of education.
Figure 6 Highest education level obtained, by region
At 39 percent, Şanlıurfa had the highest share of people without formal education followed by Ankara (30
percent), Adana and Istanbul (both 23 percent). Şanlıurfa and Adana had particularly high shares of
illiterate refugees at 17 percent and 11 percent, respectively. In Samsun, Mersin and Kayseri, only around
9 percent did not have formal education which is the lowest level throughout the surveyed provinces.

13
Figure 7 Highest education level obtained, by province
The highest educational level among respondents was found in Samsun, where every third refugee had
either a high school or university degree. Furthermore, Hatay, Kocaeli and Mersin had high educational
levels with around 27 percent having degrees at high school or university levels. Gaziantep and Izmir had
relatively few refugees with higher education (around 12 percent).
14
1.3 Training
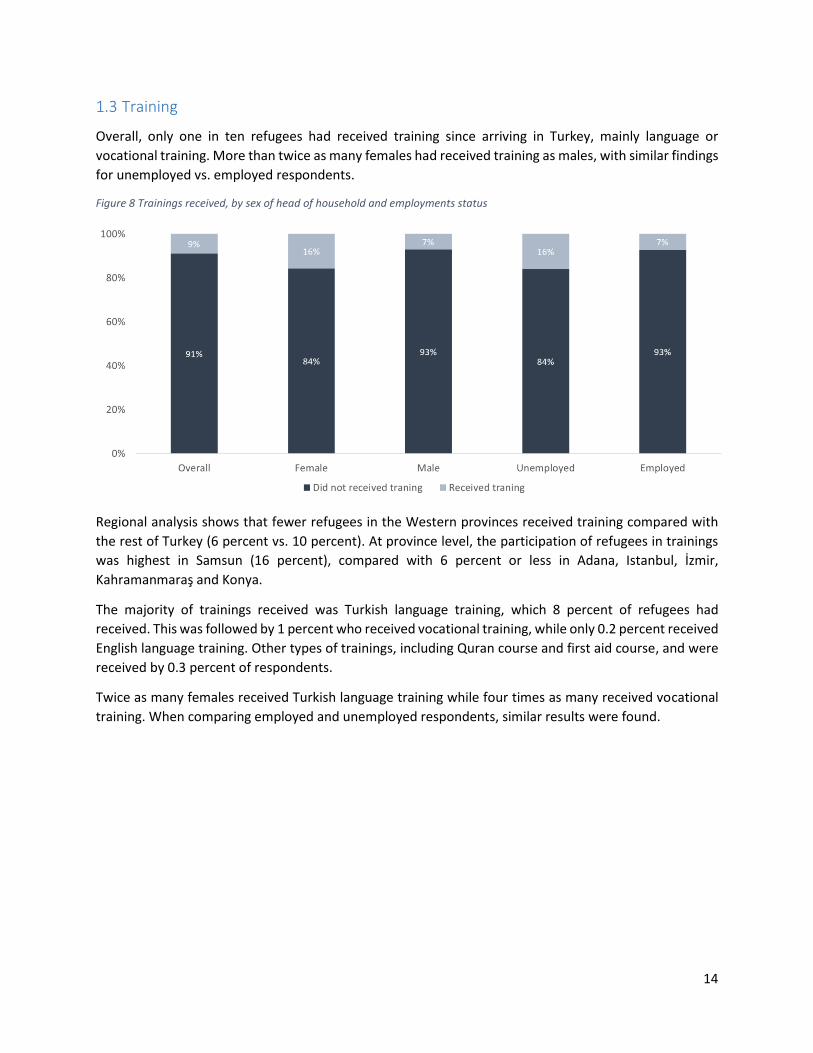
Overall, only one in ten refugees had received training since arriving in Turkey, mainly language or
vocational training. More than twice as many females had received training as males, with similar findings
for unemployed vs. employed respondents.
Figure 8 Trainings received, by sex of head of household and employments status
Regional analysis shows that fewer refugees in the Western provinces received training compared with
the rest of Turkey (6 percent vs. 10 percent). At province level, the participation of refugees in trainings
was highest in Samsun (16 percent), compared with 6 percent or less in Adana, Istanbul, İzmir,
Kahramanmaraş and Konya.
The majority of trainings received was Turkish language training, which 8 percent of refugees had
received. This was followed by 1 percent who received vocational training, while only 0.2 percent received
English language training. Other types of trainings, including Quran course and first aid course, and were
received by 0.3 percent of respondents.
Twice as many females received Turkish language training while four times as many received vocational
training. When comparing employed and unemployed respondents, similar results were found.

15
Figure 9 Type of training, by sex of head of household and employment status
Of the 9 percent who received training among the respondents, it was stated that the main provider was
the Turkish Government (59 percent). Nineteen percent of respondents stated that the trainings were
provided by NGOs, followed by TRC Community Centres which accounted for 8 percent. Though online
trainings could be an efficient way of reaching a wider audience in a cost-effective way, it only accounted
for 0.3 percent of training providers and was thereby the least used source of training.
At regional level, in the Western part of Turkey, 62 percent of respondents attended trainings provided
by the Turkish Government. In Central Turkey, NGOs and TRC Community Centres had a relatively larger
role; here combined, they provided one third of all trainings the survey respondents received. In the
Southern provinces, 19 percent of respondents who attended a training stated that the training was
provided by NGOs.
Figure 10 Training providers
16
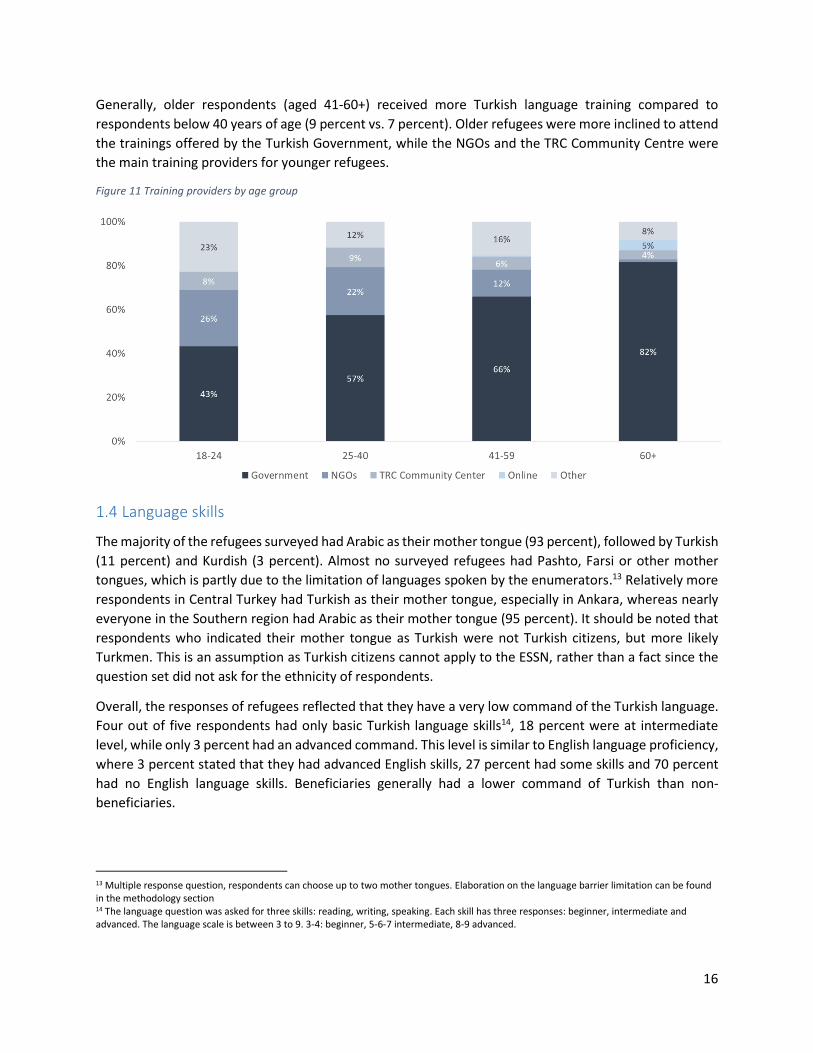
Generally, older respondents (aged 41-60+) received more Turkish language training compared to
respondents below 40 years of age (9 percent vs. 7 percent). Older refugees were more inclined to attend
the trainings offered by the Turkish Government, while the NGOs and the TRC Community Centre were
the main training providers for younger refugees.
Figure 11 Training providers by age group
1.4 Language skills
The majority of the refugees surveyed had Arabic as their mother tongue (93 percent), followed by Turkish
(11 percent) and Kurdish (3 percent). Almost no surveyed refugees had Pashto, Farsi or other mother
tongues, which is partly due to the limitation of languages spoken by the enumerators.13 Relatively more
respondents in Central Turkey had Turkish as their mother tongue, especially in Ankara, whereas nearly
everyone in the Southern region had Arabic as their mother tongue (95 percent). It should be noted that
respondents who indicated their mother tongue as Turkish were not Turkish citizens, but more likely
Turkmen. This is an assumption as Turkish citizens cannot apply to the ESSN, rather than a fact since the
question set did not ask for the ethnicity of respondents.
Overall, the responses of refugees reflected that they have a very low command of the Turkish language.
Four out of five respondents had only basic Turkish language skills14, 18 percent were at intermediate
level, while only 3 percent had an advanced command. This level is similar to English language proficiency,
where 3 percent stated that they had advanced English skills, 27 percent had some skills and 70 percent
had no English language skills. Beneficiaries generally had a lower command of Turkish than non-
beneficiaries.
13 Multiple response question, respondents can choose up to two mother tongues. Elaboration on the language barrier limitation can be found in the methodology section 14 The language question was asked for three skills: reading, writing, speaking. Each skill has three responses: beginner, intermediate and advanced. The language scale is between 3 to 9. 3-4: beginner, 5-6-7 intermediate, 8-9 advanced.

17
Figure 12 Turkish language skills, overall and by ESSN status
When comparing the level of speaking, reading and writing reported by the respondents, the command
of spoken Turkish was highest, 9 percent being at advanced level compared with only 3 percent for reading
and writing. Likewise, while 60 percent had beginner level spoken Turkish, while this share was 86 percent
for reading and writing.
When comparing the command of Turkish according to educational level, there was a clear correlation
between higher education levels and a better command of Turkish. Where nearly all illiterate respondents
had only basic command of Turkish and none had advanced command, 42 percent of respondents with a
university degree had intermediate command or higher. As the analysis shows, this cannot be linked to
respondents with higher education having received more language training, rather this indicates that
higher education levels provide a better foundation to learn and advance Turkish language skills.
Figure 13 Turkish language skills by educational level

18
The analysis by age group shows that younger refugees had better command of Turkish. In particular, for
advanced level Turkish: 5 percent of 18-24-year-olds reached this level compared with 1.5 percent of
refugees aged above 40. This finding is particularly interesting considering that significantly fewer 18-24-
year-olds received language training compared with the older respondents (7.1 percent compared with
9.1 percent). This could however be explained by the fact that young refugees had the advantage of
starting to learn the language at an earlier age.
Figure 14 Turkish language skills, by age group and Turkish language training
Refugees in the Southern provinces tended to have a very low command of Turkish, with 83 percent at
beginner level and only 1 percent at advanced level. In comparison, 5 percent in the Central region had
an advanced command of Turkish while 71 percent were beginners. At province level, refugees in Mardin
had a particularly low command of Turkish, with 94 percent having only basic skills and no one being at
advanced level. One reason to explain this finding is that refugees can communicate in Arabic with host
communities in Southern provinces, such as in Mardin and Hatay.
The results also show that the longer the refugees had lived in Turkey, the better the language skills got.
However, the improvement showed advances from beginner to intermediate level, and very few managed
to advance further. Though there was a significant positive relationship between the duration of time in
Turkey and Turkish language skills, it is noteworthy that after having lived in Turkey for seven or more
years, 73 percent of refugees still only had basic command of Turkish.

19
Figure 15 Turkish language skills by length of stay in Turkey
When comparing respondents who received Turkish language training with respondents who did not, the
ones who received training had a significantly better command of Turkish. Nearly half of all refugees who
received training had intermediate or advanced levels of Turkish, compared to only 18 percent of those
who did not receive language training. Hence, providing language training may be an effective method of
improving the language skills for refugees in Turkey, in particular to progress to intermediate and
advanced levels. It should also be noted that there may be differences in interest and aptitude for learning
languages between those who opt to complete a Turkish language course and those who do not.
Figure 16 Turkish language training's influence of language level

20
2. Refugee Employment
2.1 Employment
On average, refugees had eight years of work experience before entering Turkey. Females had significantly
less experience than males (five years vs. nine years).
Before arriving in Turkey, the majority of refugees were working as salaried workers15 while 17 percent
was unemployed, excluding the 3 percent who were under the working age in Syria.
Figure 17 Employment status before arriving in Turkey
Eight-four percent of refugees in the surveyed provinces of Turkey were employed (defined as at least
four days of formal or informal work in the previous month). Only 3 percent of refugees were working
with a work permit (2.7 percent of all refugees, or 3.3 percent of employed refugees). This leaves 16
percent unemployed. This 16 percent consisted of both unemployed people who are looking for a job and
unemployed people who are not looking for a job. The proportion of the former was 52 percent, while the
latter accounted for 48 percent of the unemployed. Hence, slightly fewer refugees were unemployed in
Turkey compared to their employment status in their country of origin. With an unemployment rate of 32
percent, females were more than twice as likely to be unemployed than males.
15 Salaried worker: a full-time employee who receives regular salary on monthly basis.

21
Figure 18 Unemployment rate, overall and by sex of head of household
Males tended to be more active in searching for a job (55 percent vs. 39 percent for females). The main
reason for females not actively searching for a job was childcare obligations (55 percent), while inability
to work was the main reason for males (71 percent).
Figure 19 Employment status specified by sex of head of household
Younger respondents were more likely to be employed than older respondents, with the rate of
unemployment almost double when the breadwinner was aged 41-59 (23 percent), and more than double
again when the breadwinner was 60 years or older. Among the latter group, more than half were
unemployed (52 percent). Moreover, the data shows that younger individuals were slightly more likely to
have work permits, though the percentage remains low across all groups.

22
Figure 20 Employment status by age group
The unemployment rate tended to increase with higher education levels. Refugees with a university
degree had the highest unemployment rate (24 percent), followed by refugees with a high school diploma.
The lowest unemployment rate was among refugees with primary and secondary level education.
Hence, both having a higher education level and no formal education (literate or illiterate) had a negative
impact on employment. Despite the negative association, still 82 percent of illiterate respondents were
currently employed – thus education does not pose a very significant barrier to employment.
Figure 21 Employment status by education level
23
However, literacy is found to have a positive impact on getting a regular job, as only 38 percent of illiterate
refugees had a regular job compared with 54 percent of refugees with a university degree. The share of
refugees with a regular job was also higher for literate individuals. Therefore, while this group and
refugees with university level education had the highest unemployment rate, they also had the highest
job regularity. Comparing refugees with higher education16 to the rest, this group was less likely to be
employed (78 percent vs. 85 percent) but more likely to be working in a regular job (50 percent vs. 46
percent). This means that even though it is harder for a refugee with higher education to find a job, when
they do, it is more likely to be a regular job.
Furthermore, there is a direct relationship between educational level and having a work permit. An
average of only one percent of refugees without formal education were working with a permit; this figure
was three percent for those with primary and secondary school education, and rose to four percent for
those with high school and university degrees. It is worth noting that the work permit holders were all
non-beneficiaries; the ESSN targets the most vulnerable refugees and therefore excludes people who have
job security, as demonstrated by formal employment.
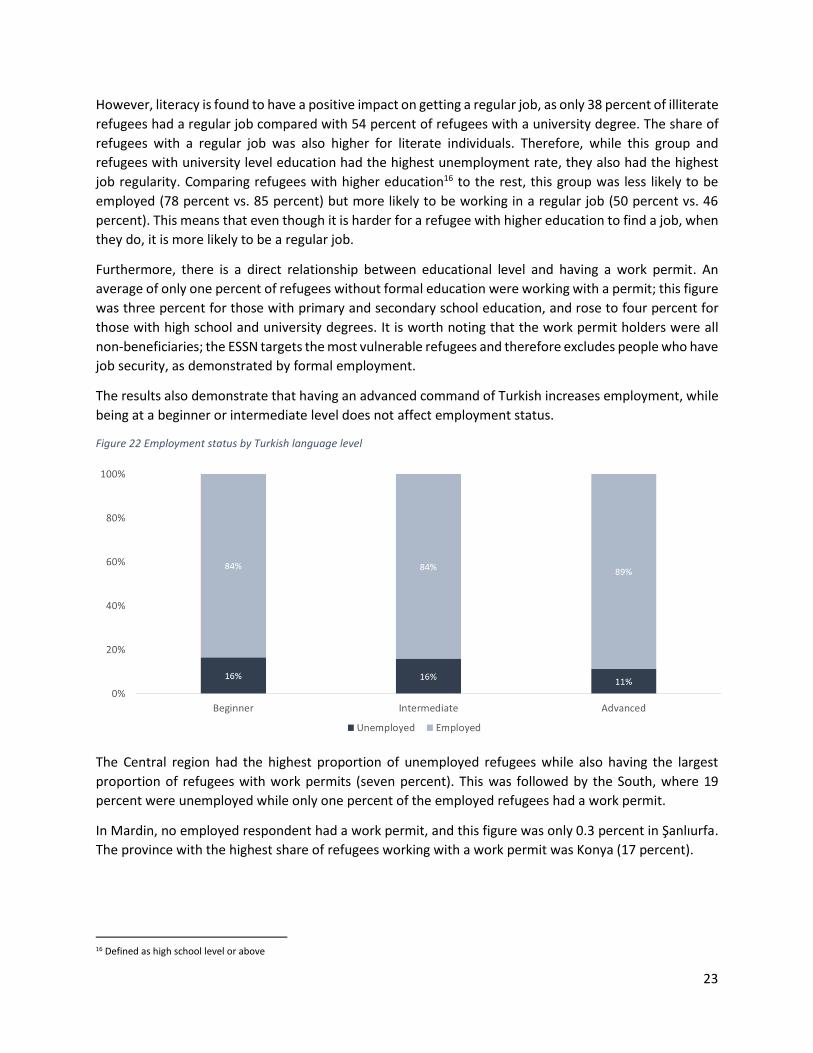
The results also demonstrate that having an advanced command of Turkish increases employment, while
being at a beginner or intermediate level does not affect employment status.
Figure 22 Employment status by Turkish language level
The Central region had the highest proportion of unemployed refugees while also having the largest
proportion of refugees with work permits (seven percent). This was followed by the South, where 19
percent were unemployed while only one percent of the employed refugees had a work permit.
In Mardin, no employed respondent had a work permit, and this figure was only 0.3 percent in Şanlıurfa.
The province with the highest share of refugees working with a work permit was Konya (17 percent).
16 Defined as high school level or above

24
Figure 23 Employment status by region
The unemployment rate varied highly across the surveyed provinces. More than half of the refugees in
Samsun and every third in Kayseri and Hatay were unemployed, which is very high relative to the average
unemployment rate of 16 percent. In comparison, İzmir had an unemployment rate of only four percent
for refugees. The unemployment rates were similar to the Turkish unemployment rates, even though the
refugees are working informally. This means that unemployed refugees and Turkish citizens are living
together and competing for similar work in the South Eastern regions.17 This has implications related to
social cohesion, which makes livelihoods interventions even more important.18
17 The average unemployment rate of the Turkish population in the Southern provinces included in this study is 17.83 percent. This figure is 25.1 percent for Mardin-Batman-Siirt-Şırnak, 18.8 percent in Şanlıurfa-Diyarbakır, 14.4 percent in Hatay-Kahramanmaraş-Osmaniye, 13 percent in Gaziantep-Adıyaman-Kilis, and 11.4 percent in Adana-Mersin. Labor Force Statistics, January 2019, TurkStat: https://biruni.tuik.gov.tr/medas/. 18 https://www.igamder.org/wp-content/uploads/2017/01/Challenges-and-opportunities-of-refugee-integration-in-turkey-full-report.pdf
25
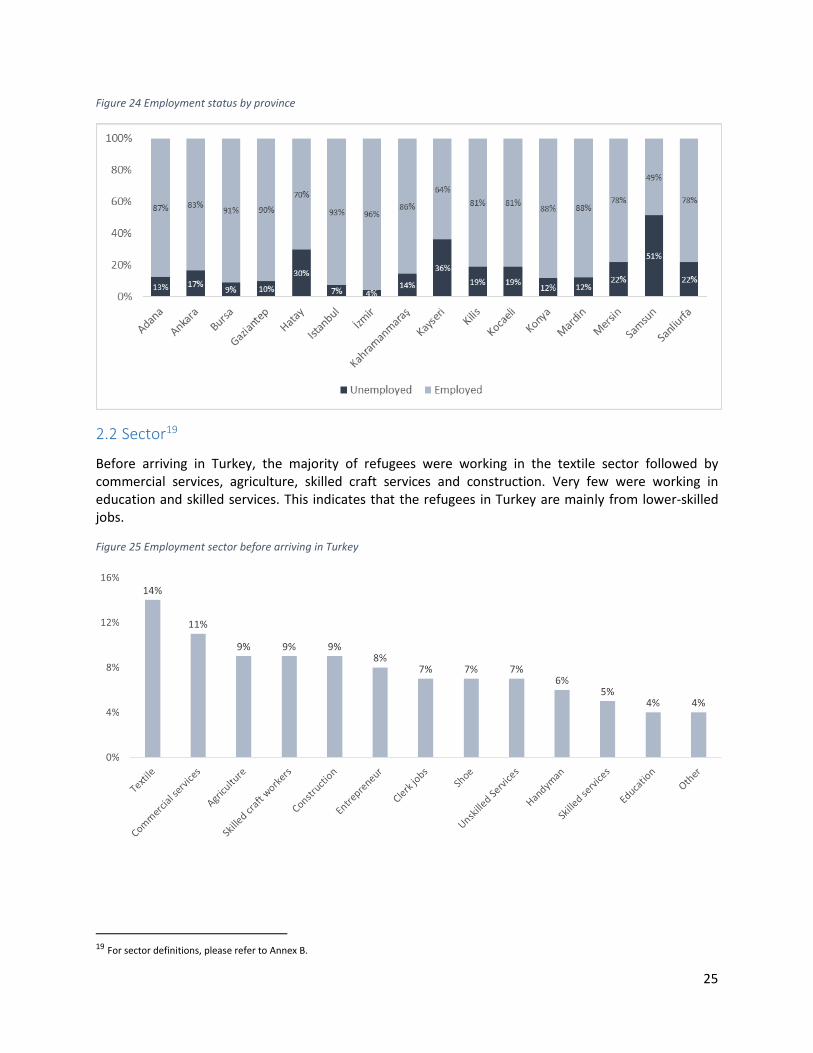
Figure 24 Employment status by province
2.2 Sector19
Before arriving in Turkey, the majority of refugees were working in the textile sector followed by commercial services, agriculture, skilled craft services and construction. Very few were working in education and skilled services. This indicates that the refugees in Turkey are mainly from lower-skilled jobs.
Figure 25 Employment sector before arriving in Turkey
19 For sector definitions, please refer to Annex B.

26
The majority of refugees in Turkey were employed in unskilled services (20 percent) or the textile sector
(19 percent), 12 percent worked in construction and ten percent worked as skilled craft workers or
artisans.
A higher proportion of females were employed in the textile industry; it employed almost a third of all
female workers. This is followed by 16 percent in unskilled services and ten percent in the agricultural
sector. A higher proportion of males were working in unskilled services and construction, while a slightly
smaller proportion of males were working in agriculture.
The majority of full-time jobs were found in the textile industry (28 percent) followed by the skilled craft
works and unskilled services (both 13 percent). Only very few jobs in agriculture were full-time (three
percent) or regular (one percent), and jobs in the construction sector also tended to be irregular and on a
part-time basis.
Figure 26 Employment sector, overall and by sex of head of household
More of the younger respondents were working in the textile industry and as skilled craft workers,
whereas older people were more involved in agriculture and shoe-related work. Jobs in the construction
sector were mostly occupied by the 25-40-year-olds, while the 41-59-year-olds had a higher share of jobs
in the commercial sector.

27
Figure 27 Employment sector by age group
In the Western region of Turkey, more than every third refugee worked in the textile industry, compared
to only 11 percent in the South and seven percent in the Central part of Turkey. In Istanbul, nearly half of
all refugees worked in the textile industry (45 percent). The share of refugees working in skilled crafts and
construction was relatively high in Central Turkey, whereas unskilled services and agriculture employed
24 percent and 14 percent respectively in the South. Şanlıurfa had a particularly high share of refugees
working in unskilled services (40 percent), while nearly one in four worked in agriculture in Mersin.
Figure 48 Employment sector by region
Illiterate respondents were more likely to be working in unskilled services, textile, agriculture,
construction and shoe-related work. The majority of highly educated refugees worked in unskilled services
followed by the textile industry and construction. The largest differences between higher and less
educated refugees were found within the textile, educational, entrepreneur, clerk and shoe-related
industries. The refugees working in the educational sector, in clerk jobs, and as entrepreneurs were almost
28
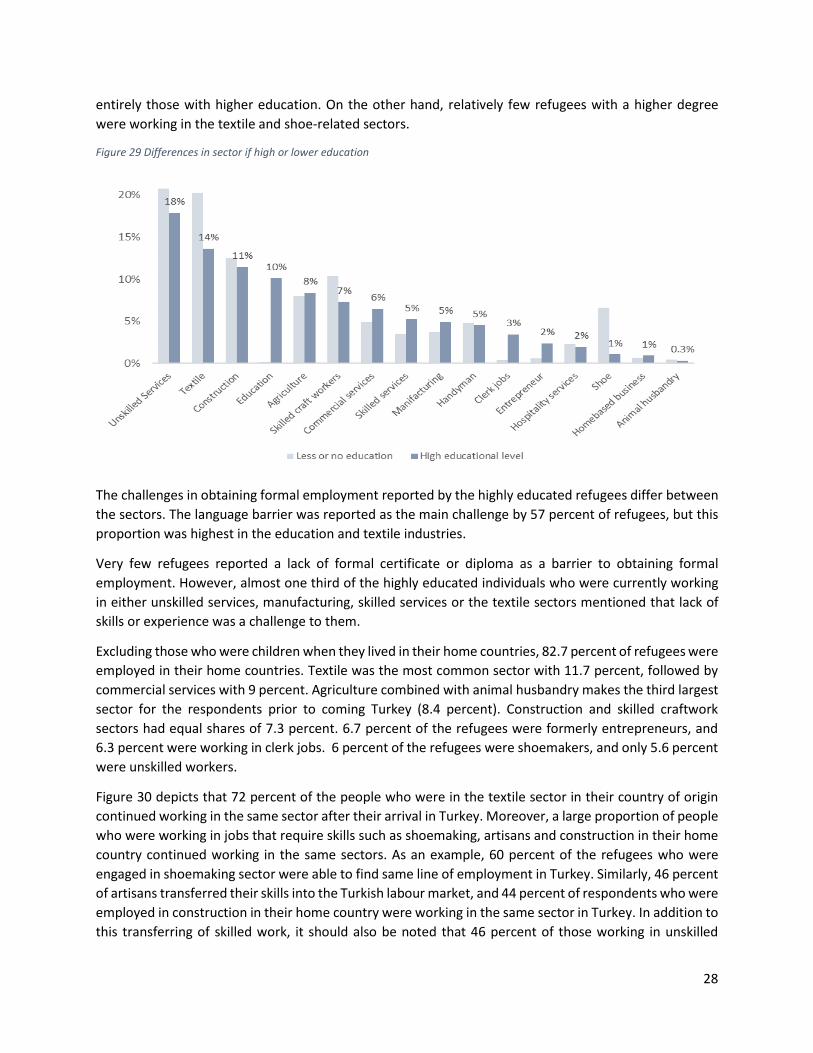
entirely those with higher education. On the other hand, relatively few refugees with a higher degree
were working in the textile and shoe-related sectors.
Figure 29 Differences in sector if high or lower education
The challenges in obtaining formal employment reported by the highly educated refugees differ between
the sectors. The language barrier was reported as the main challenge by 57 percent of refugees, but this
proportion was highest in the education and textile industries.
Very few refugees reported a lack of formal certificate or diploma as a barrier to obtaining formal
employment. However, almost one third of the highly educated individuals who were currently working
in either unskilled services, manufacturing, skilled services or the textile sectors mentioned that lack of
skills or experience was a challenge to them.
Excluding those who were children when they lived in their home countries, 82.7 percent of refugees were
employed in their home countries. Textile was the most common sector with 11.7 percent, followed by
commercial services with 9 percent. Agriculture combined with animal husbandry makes the third largest
sector for the respondents prior to coming Turkey (8.4 percent). Construction and skilled craftwork
sectors had equal shares of 7.3 percent. 6.7 percent of the refugees were formerly entrepreneurs, and
6.3 percent were working in clerk jobs. 6 percent of the refugees were shoemakers, and only 5.6 percent
were unskilled workers.
Figure 30 depicts that 72 percent of the people who were in the textile sector in their country of origin
continued working in the same sector after their arrival in Turkey. Moreover, a large proportion of people
who were working in jobs that require skills such as shoemaking, artisans and construction in their home
country continued working in the same sectors. As an example, 60 percent of the refugees who were
engaged in shoemaking sector were able to find same line of employment in Turkey. Similarly, 46 percent
of artisans transferred their skills into the Turkish labour market, and 44 percent of respondents who were
employed in construction in their home country were working in the same sector in Turkey. In addition to
this transferring of skilled work, it should also be noted that 46 percent of those working in unskilled

29
services prior to arriving to Turkey, worked in unskilled services in Turkey. However, this sector
consistency may be largely driven by the fact that one in every five refugees works in unskilled services
now, as this comprises the bulk of the labour market demand in Turkey.
On the other hand, many refugees were not able to transfer their skills to Turkey. For instance, commercial
services were the second largest sector employing refugees in their country of origin. 23 percent of those
previously working in commercial services reported now working in unskilled services. In comparison to
other sectors, a relatively high proportion of people who were previously working in agriculture,
entrepreneurship, and clerical jobs were not able to find employment in Turkey.

30
Figure 30 Change in the Sectors Before and After Arriving in Turkey
Sector at home country TextileCommercial
servicesAgriculture Construction
Skilled craft
workers / artisansEntrepreneur
Clerk
JobsShoe
Unskilled
ServicesHandyman
Skilled
servicesEducation Manifacturing
Animal
Husbandry
Hospitality
services
Not
Working
# of people
in previous
sector
Textile 72.0% 1.1% .9% 2.8% 3.1% .1% 0.0% .6% 7.5% 1.0% 1.1% 0.0% 2.4% .1% 1.6% 5.4% 606
Commercial services 9.6% 11.2% 3.6% 10.9% 7.5% 1.2% .2% 2.7% 23.6% 2.3% .8% .4% 4.7% .2% 3.9% 16.4% 468
Agriculture 4.4% 2.8% 30.8% 9.3% 2.9% .2% 0.0% 0.0% 18.5% .4% .9% 0.0% 3.6% .6% 1.6% 23.6% 377
Construction 2.3% 1.0% 8.5% 43.9% 4.4% .1% .6% .3% 23.4% 2.8% 1.4% 0.0% .8% .3% .4% 9.8% 374
Skilled craft workers / artisans 2.6% 4.1% 3.8% 8.0% 45.9% .3% 0.0% .8% 15.3% 3.6% .2% 0.0% 2.7% .7% 1.0% 11.0% 371
Entrepreneur 11.5% 9.0% 6.9% 10.8% 7.7% 2.6% 2.7% 2.3% 11.1% 2.1% 3.9% .8% 4.8% .1% 1.3% 22.0% 342
Clerk Jobs 7.0% 5.2% 3.6% 9.3% 5.2% 1.6% 4.7% 1.0% 14.8% 4.2% 3.6% 2.4% 4.0% .6% 1.4% 31.3% 318
Shoe 3.1% 3.8% 1.5% 4.7% 2.0% .6% .9% 59.6% 9.9% .2% 2.6% 0.0% 1.8% .9% .9% 6.6% 311
Unskilled Services 9.9% .6% 5.8% 8.5% 6.0% .2% 0.0% 1.4% 46.1% 1.6% .6% 0.0% 2.2% 1.4% 1.1% 14.8% 295
Handyman 7.3% 6.4% 1.9% 7.2% 6.4% .2% 0.0% .7% 13.3% 38.3% 1.0% 0.0% 3.2% .2% 1.9% 11.8% 253
Skilled services 5.3% 3.7% .7% 9.9% 4.8% 1.3% 1.0% 2.4% 17.7% 2.1% 34.8% 1.9% 1.3% .0% 1.1% 11.3% 194
Education 2.9% 4.6% 3.7% 6.6% 3.2% .7% 2.6% 0.0% 11.7% 3.7% 2.2% 31.0% 3.2% 0.0% 2.5% 20.8% 154
Manifacturing 11.3% 5.6% 3.1% 10.9% 12.7% 0.0% .7% 0.0% 15.1% 6.5% 3.0% 0.0% 11.4% 0.0% 1.3% 18.5% 91
Animal Husbandry 5.6% 3.5% 24.8% 2.0% 4.7% 0.0% 0.0% 0.0% 33.0% 0.0% 0.0% 0.0% 0.0% 4.0% 0.0% 22.4% 55
Hospitality services 9.1% 1.3% 4.9% 7.5% 3.0% 0.0% 0.0% 1.5% 33.9% 0.0% .4% 0.0% 3.8% 0.0% 14.0% 20.5% 37
Not Working 17.5% 4.1% 8.5% 8.0% 7.2% .7% .4% 2.6% 14.2% 2.8% 3.5% 1.4% 4.0% 0.0% 2.7% 20.8% 1070
Current Sector

31
2.3 Contract type
2.3.1 Regularity
In this analysis, a regular job is defined as a job with a fixed salary and working hours, in comparison to an
irregular job, without established working days, hours or salary – this varies depending on demand. In this
way, irregular workers have very little job security and may have months with little or no income, often
during the winter.
Overall, 47 percent of refugees were working in regular jobs compared with 53 percent working in
irregular jobs. Of the regular workers, the majority were hired as salaried workers on a regular basis while
few were self-employed. The majority of irregular workers were hired as daily workers or independent
workers. Groups that had more job irregularity, and were therefore more likely to be vulnerable and
dependent on seasonal external assistance, include ESSN beneficiaries, older individuals, illiterate
individuals and refugees with only basic command of the Turkish language.
According to sector, the textile industry had the highest share of refugees employed in regular positions
(79 percent). Also, the majority of refugees working in skilled crafts, as handymen, in shoe-related work
and commercial services were hired on regular basis. On the other hand, very few refugees working in the
agricultural sector were hired as a regular worker (eight percent). Moreover, the large majority of
refugees working in the construction sector and in unskilled services were working on an irregular basis.
Figure 31 Regularity of work by sector
Refugees living in the Western region were more than twice as likely to be hired as regular workers than
in the Southern region. In the Central region, slightly more than half of refugees were working in a regular
job. Mersin and Samsun have the highest shares of refugees in irregular jobs, at 93 percent and 89 percent
respectively, followed by Şanlıurfa (78 percent), leaving these refugees very vulnerable to labour market
volatility.
32
2.3.2 Working hours
On average refugees were working 18 days a month, with slightly more than half working full-time (52
percent)20. Refugees that work only part-time are expected to be more vulnerable and dependent on
external assistance than refugees working on full-time basis, due to the lower salary. The population
groups mainly working on a part-time basis only were ESSN beneficiaries and those with only basic
command of Turkish.
Irregular workers worked an average of 16 days per month compared with 22 days for regular workers,
while only 30 percent of irregular workers were working full-time compared with 77 percent of regular
workers.
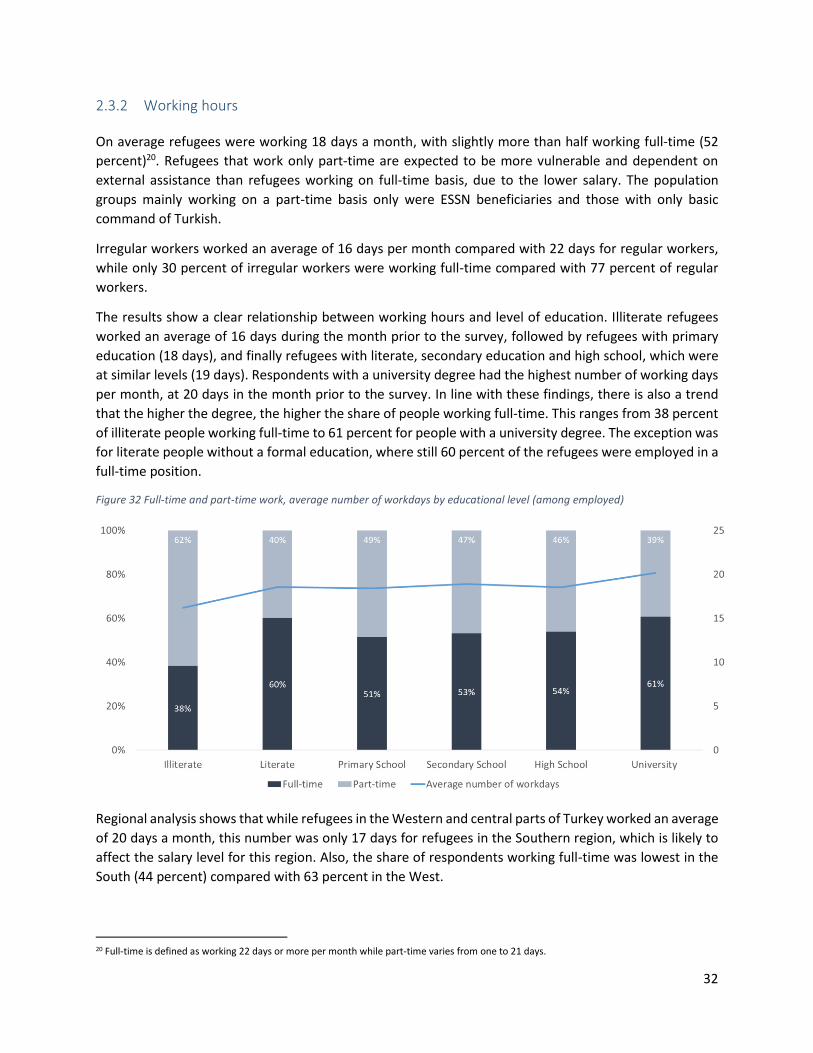
The results show a clear relationship between working hours and level of education. Illiterate refugees
worked an average of 16 days during the month prior to the survey, followed by refugees with primary
education (18 days), and finally refugees with literate, secondary education and high school, which were
at similar levels (19 days). Respondents with a university degree had the highest number of working days
per month, at 20 days in the month prior to the survey. In line with these findings, there is also a trend
that the higher the degree, the higher the share of people working full-time. This ranges from 38 percent
of illiterate people working full-time to 61 percent for people with a university degree. The exception was
for literate people without a formal education, where still 60 percent of the refugees were employed in a
full-time position.
Figure 32 Full-time and part-time work, average number of workdays by educational level (among employed)
Regional analysis shows that while refugees in the Western and central parts of Turkey worked an average
of 20 days a month, this number was only 17 days for refugees in the Southern region, which is likely to
affect the salary level for this region. Also, the share of respondents working full-time was lowest in the
South (44 percent) compared with 63 percent in the West.
20 Full-time is defined as working 22 days or more per month while part-time varies from one to 21 days.

33
At province level, Şanlıurfa had the lowest number of working days at only 13 days in the average month,
compared to 23 days in Bursa. Less than one third of the workers in Şanlıurfa, Mardin, and Samsun worked
full-time in the month prior to being surveyed. Moreover, Şanlıurfa has a very high share of respondents
working five days or less (38 percent).
2.4 Income
The average monthly salary for refugees in the 19 surveyed provinces in Turkey was TRY 1058. Analysis
confirms that refugees working part-time earned significantly less than refugees working full-time (TRY
739 vs. TRY 1351) and that irregular workers earned significantly less than regular workers (TRY 837 vs.
TRY 1312). Population groups with lower average salary levels were females (TRY 1025 compared to 1064
for males), ESSN beneficiaries (TRY 1024 compared to 1102 for non-beneficiaries), illiterate (TRY 899
compared to 1076 for literate) and older individuals (TRY 778 compared to 1099 for 24-40-year-olds).
Refugees working in the textile industry had the highest average monthly salary (TRY 1322) followed by
skilled craft workers/artisans (TRY 1256) and commercial services (TRY 1240). This is relevant since the
textile industry such a large employer in the Western region, where living costs are also higher.
Interestingly, the respondents were able to earn a relatively high income from shoe-related work (TRY
1227), comprising the fourth highest average income. The lowest salary levels were found in the
agricultural sector (TRY 756) and unskilled services (TRY 768).
Figure 33 Monthly income (TRY), average and by sector
However, the income level by sector was highly correlated with the proportion of refugees employed in a
part-time or full-time position. The average work days the month prior to the survey was 14 days for the
agricultural sector compared with 21 days in the textile industry. This indicates that the salary level was
not necessarily lower in agriculture and unskilled services, however, the work was more irregular and
fewer people were employed on a full-time basis. The only sector that showed less correlation is the
construction sector where the salary level was higher than the agricultural sector and unskilled services,
despite only every fourth refugee working full-time.
34
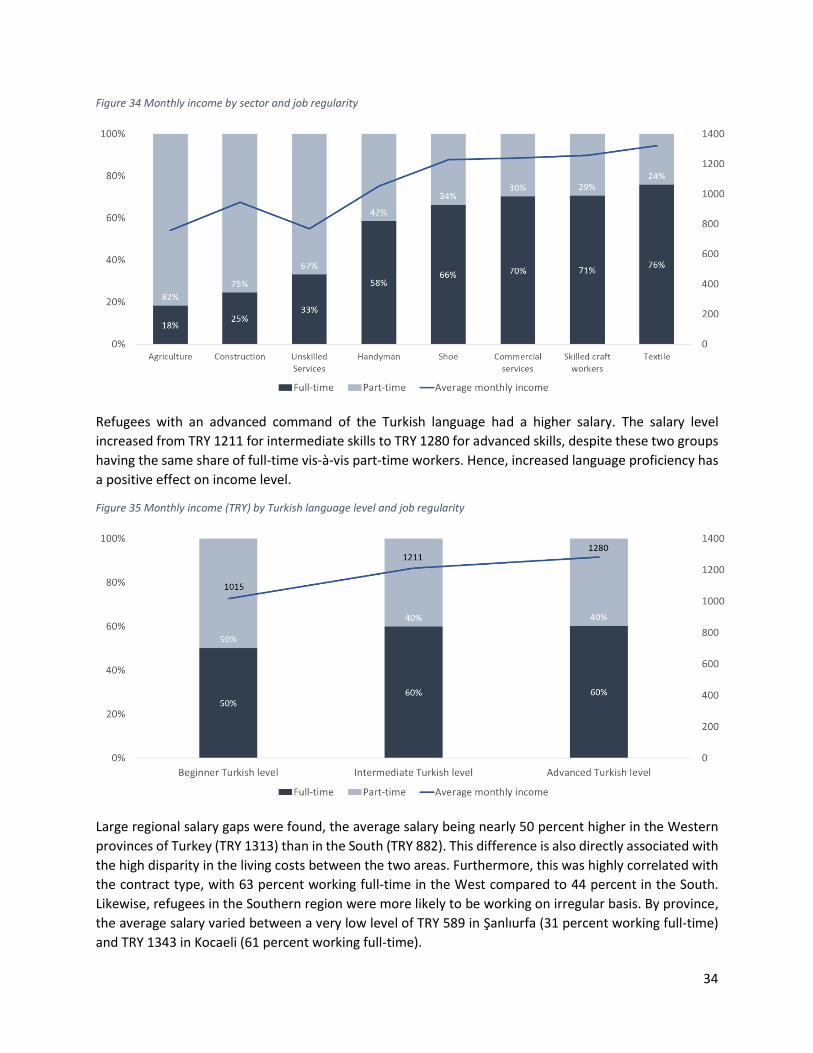
Figure 34 Monthly income by sector and job regularity
Refugees with an advanced command of the Turkish language had a higher salary. The salary level
increased from TRY 1211 for intermediate skills to TRY 1280 for advanced skills, despite these two groups
having the same share of full-time vis-à-vis part-time workers. Hence, increased language proficiency has
a positive effect on income level.
Figure 35 Monthly income (TRY) by Turkish language level and job regularity
Large regional salary gaps were found, the average salary being nearly 50 percent higher in the Western
provinces of Turkey (TRY 1313) than in the South (TRY 882). This difference is also directly associated with
the high disparity in the living costs between the two areas. Furthermore, this was highly correlated with
the contract type, with 63 percent working full-time in the West compared to 44 percent in the South.
Likewise, refugees in the Southern region were more likely to be working on irregular basis. By province,
the average salary varied between a very low level of TRY 589 in Şanlıurfa (31 percent working full-time)
and TRY 1343 in Kocaeli (61 percent working full-time).

35
Figure 36 Monthly income (TRY) by region and job regularity
2.5 Unemployment
Of the 16 percent unemployed respondents, 56 percent of them had actively looked for a job during the
past 12 months. According to age groups, the 25-40-year-olds were the most active in searching for jobs,
followed by the 18-24-year-olds. Older refugees of 60+ were the least active in searching for jobs.
Figure 57 Unemployment and active job search by age group
Moreover, unemployed refugees with advanced command of Turkish were more than three times as likely
to search for a job than those at beginner’s level. This finding can comprise one of the reasons why
refugees with advanced Turkish language skills also had a higher employment rate.
36
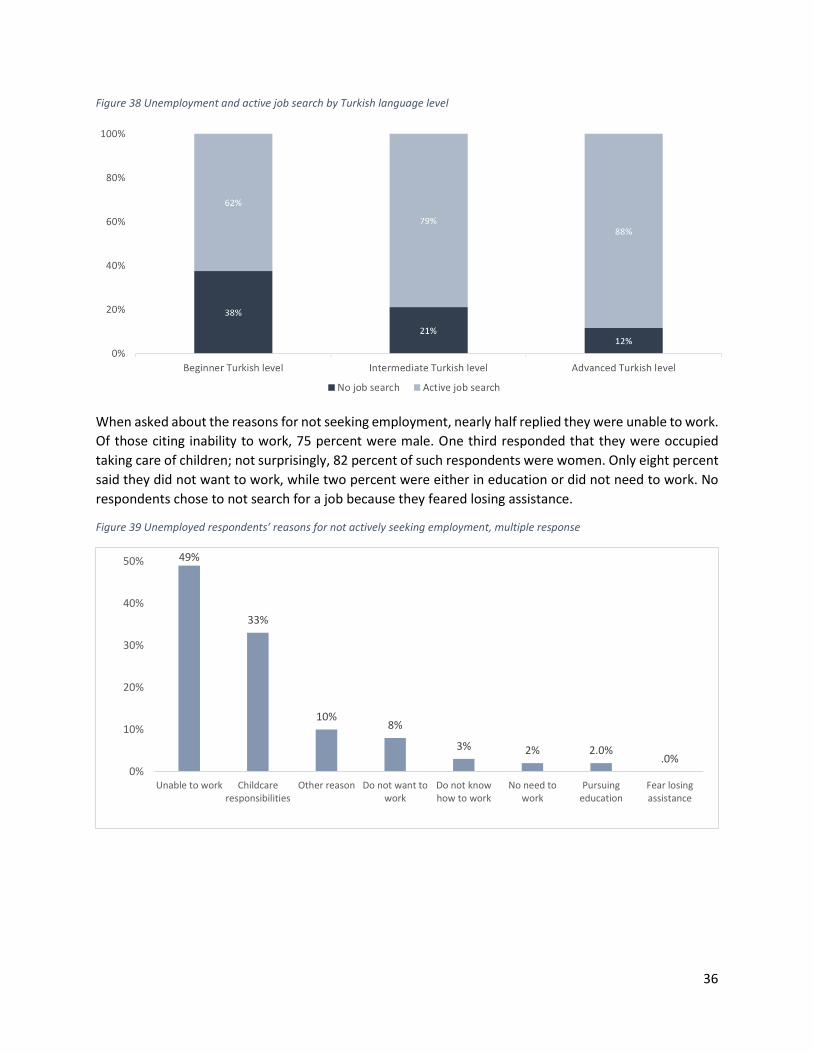
Figure 38 Unemployment and active job search by Turkish language level
When asked about the reasons for not seeking employment, nearly half replied they were unable to work.
Of those citing inability to work, 75 percent were male. One third responded that they were occupied
taking care of children; not surprisingly, 82 percent of such respondents were women. Only eight percent
said they did not want to work, while two percent were either in education or did not need to work. No
respondents chose to not search for a job because they feared losing assistance.
Figure 39 Unemployed respondents’ reasons for not actively seeking employment, multiple response
49%
33%
10%8%
3% 2% 2.0%.0%
0%
10%
20%
30%
40%
50%
Unable to work Childcareresponsibilities
Other reason Do not want towork
Do not knowhow to work
No need towork
Pursuingeducation
Fear losingassistance

37
2.6 Job mobility21
While only every fourth respondent has previously changed city for a job, 59 percent were willing to move
in the future, indicating an increased mobility. Males, non-beneficiaries, younger individuals and refugees
living in the Southern provinces had a higher level of mobility.
Figure 40 Mobility for employment opportunities
Moreover, there was a strong correlation between higher education and increased mobility. Overall
refugees with a university degree were twice as willing to move for a job in the future compared to
illiterate individuals.
Figure 41 Mobility by educational level
21 Questions on job mobility was only added at a later stage and therefore has a lower sample size (2559) that is not representative at province level
38
Of the refugees not willing to move, the majority (83 percent) answered that adapting to the city and
lifestyle could make them change their decision.
3. Improving Refugees’ Self-reliance
3.1 Barriers to employment
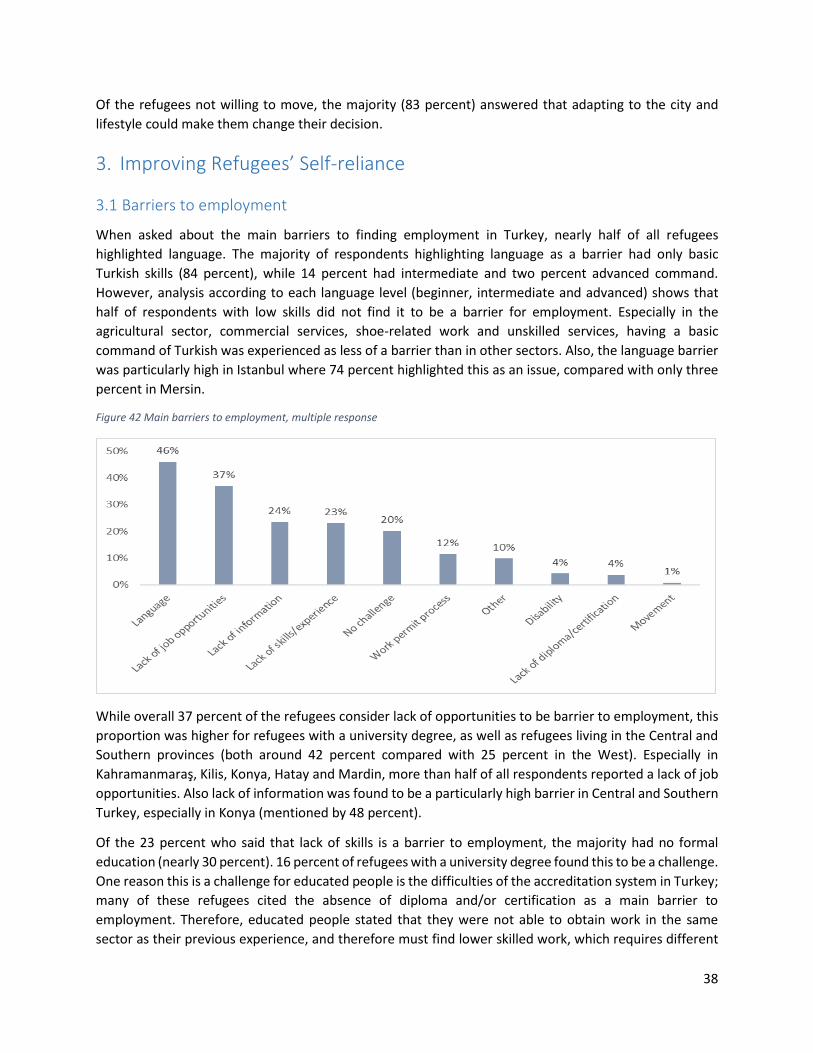
When asked about the main barriers to finding employment in Turkey, nearly half of all refugees
highlighted language. The majority of respondents highlighting language as a barrier had only basic
Turkish skills (84 percent), while 14 percent had intermediate and two percent advanced command.
However, analysis according to each language level (beginner, intermediate and advanced) shows that
half of respondents with low skills did not find it to be a barrier for employment. Especially in the
agricultural sector, commercial services, shoe-related work and unskilled services, having a basic
command of Turkish was experienced as less of a barrier than in other sectors. Also, the language barrier
was particularly high in Istanbul where 74 percent highlighted this as an issue, compared with only three
percent in Mersin.
Figure 42 Main barriers to employment, multiple response
While overall 37 percent of the refugees consider lack of opportunities to be barrier to employment, this
proportion was higher for refugees with a university degree, as well as refugees living in the Central and
Southern provinces (both around 42 percent compared with 25 percent in the West). Especially in
Kahramanmaraş, Kilis, Konya, Hatay and Mardin, more than half of all respondents reported a lack of job
opportunities. Also lack of information was found to be a particularly high barrier in Central and Southern
Turkey, especially in Konya (mentioned by 48 percent).
Of the 23 percent who said that lack of skills is a barrier to employment, the majority had no formal
education (nearly 30 percent). 16 percent of refugees with a university degree found this to be a challenge.
One reason this is a challenge for educated people is the difficulties of the accreditation system in Turkey;
many of these refugees cited the absence of diploma and/or certification as a main barrier to
employment. Therefore, educated people stated that they were not able to obtain work in the same
sector as their previous experience, and therefore must find lower skilled work, which requires different

39
skills. As a result, educated people reported lack of skills corresponding to the employment opportunities
available to them.
While only three percent of the employed refugees had a work permit, only 12 percent indicated this as
a challenge and mainly in the Central parts of Turkey (21 percent compared with eight percent in the
South). Especially in Konya, İzmir and Kayseri, around one in four said that a lack of work permit is a
challenge to them.
Only four percent said that they lack official diploma or certificate is a barrier; this highlights that the main
focus in trying to improve employment opportunities for refugees in Turkey should be to improve Turkish
language skills and support job creation, rather than providing additional formal education.
3.2 Dependency
Analysis shows that only six percent of the refugees perceived themselves as being self-sufficient, 28
percent felt somewhat dependent and 66 percent felt fully dependent on external assistance. Women-
headed households, ESSN beneficiaries, irregular workers and older people (60+) felt more dependent on
external assistance.
Figure 63 Dependency on external assistance
In total, 71 percent of the respondents in the South felt dependent on external assistance compared to
69 percent in central Turkey and 56 percent in the Western region. Especially, Mardin showed very high
perception of dependency, with almost everyone feeling fully dependent on external assistance (95
percent). This level of dependency relates to low average income in Mardin. Furthermore, the external
assistance in Mardin was also very limited compared to other provinces such as Gaziantep, Istanbul, and
Ankara. Similarly, in Mersin and Hatay, this share was very high (90 percent and 87 percent respectively).
The provinces with the lowest perception of dependency were İzmir and Bursa.

40
Figure 44 Dependency on external assistance by province
3.3 Requested support
Turkish language training was the most frequently requested support needed to find employment,
highlighted by 60 percent of the respondents. This share was higher in the Western part of Turkey (66
percent compared with 52 percent in Central Turkey), and the request was particularly high in Mardin (79
percent) followed by Bursa, Kilis and Şanlıurfa (all 74 percent). In Kayseri and Kahramanmaraş, only 26
percent and 35 percent respectively highlighted needing language training to enhance their employment
opportunities. The request was relatively high from refugees who were already employed and refugees
who had been in Turkey for four years or less.
Figure 45 Support needed to find employment, multiple response
58% 62%49%
59%
87%
58%45%
72% 68%58%
73%81%
95% 90%
63% 60%
35% 32%
38%31%
12%
33%46%
28%27%
32%
19%18%
4% 10%
31% 36%
8% 6%13% 10% 9% 9% 5% 9% 7% 6% 4%
0%
20%
40%
60%
80%
100%
Dependent Somewhat Dependent Self-sufficient

41
Nearly every second refugee reported needing support for developing new, job-related skills or vocational
training in order to find employment. The request was higher in Kilis (69 percent) followed by Ankara,
İzmir and Şanlıurfa, where two of every three refugees requested this. Opposite this, the need for further
formal education was very low in Samsun (five percent). Especially refugees in İzmir and Konya highlighted
a need for more information on how to find a job, while also having the highest need for support for work
permits (68 percent and 59 percent respectively). Request for support in accessing financial services was
generally low across provinces except for in Hatay (15 percent).
Discussion and Conclusion
The livelihoods survey aimed to understand the refugees’ participation in the Turkish labour market, and
to identify key facilitating factors and limitations. The data presented in this report is representative of all
ESSN applicants within each province of the survey, and therefore provides insight into the capacities and
constraints of over 400,000 refugee households in Turkey.
The data demonstrates that 84 percent of refugee households included a working member, but only 3
percent had a work permit. On average, refugees worked 18 days per month, and slightly over half worked
full-time. There was large regional variation in terms of sectors, regularity of work, and wages. These three
tend to be linked. For example, the textile industry has much higher regularity of work; 79 percent of
those in the textile industry were employed in regular positions. As a result, the sector had higher average
wages; 1,332 TRY per month versus 1,058 TRY on average. On the other hand, only eight percent of those
employed in the agricultural sector were hired as a regular worker, and the average wage was only 756
TRY per month. This means that in the Western region, where one-third of refugees worked in the textile
industry, the work was more regular and wages were higher. In the South, where much of the agricultural
work is concentrated (for example, in Mersin one in four refugees worked in agriculture), average monthly
wages were only 882 TRY per month. Given this variation, any programmes intending to facilitate refugee
integration into the labour market must understand the livelihoods context within each specific region,
including opportunities and required skills.
The analysis demonstrates that almost one in ten refugees (9 percent) had received trainings. However, this proportion was much higher among women and the unemployed (16 percent for both). This suggests that others within the household, usually the primary breadwinner, are already busy at work and therefore unable to attend trainings. To encourage refugees to invest in the skills that will allow them to become more self-reliant, organisations must compensate for the opportunity cost of attending trainings. This compensation must be regular and sufficient to cover foregone income. If not, the trainings risk not reaching the right individuals within the household, and having limited effect on refugee self-reliance.
It is no surprise that those with better Turkish language skills tended to be younger, had higher levels of
education, and had been in Turkey for longer. Unemployed refugees with advanced command of Turkish
were much more likely to be searching for a job than those at beginner’s level, indicating that speaking
Turkish is empowering and can facilitate the job search. Perhaps as a result, the data also shows that those
with a better command of Turkish were more likely to be employed, and also had slightly higher salaries.
When asked about main barriers to employment, nearly half of all respondent highlighted language, and
60 percent requested Turkish language training in order to find employment. However, there are clear
regional differences here. For example, language was cited as a main barrier by 74 percent of refugees in

42
Istanbul, versus only three percent in Mersin. A much higher share of those in the Western region
requested language training, in comparison to those in other regions. Therefore, while Turkish language
training should be a key activity to support the integration of refugees into the labour market,
programme and policy makers must carefully consider contextual and regional differences when
choosing where to allocate language-training resources.
One in five (21 percent) refugees had no formal education, and an additional 42 percent had primary school as the highest level of completed education. Before coming to Turkey, the majority of refugees were working in textiles, commercial services and agriculture. Thus, in general, the refugee population in Turkey comes from a less educated and lower skilled background. The majority currently work in unskilled services, textiles and construction. There is consistency in sectors among those who brought specific skills with them to Turkey. For example, 72 percent who were previously in textiles are still working in textiles, and 60 percent who worked in shoe making before arrival still make shoes. Therefore, bringing a specialized artisanal know-how has facilitated finding work for refugees. Nevertheless, white collar skills were not able to be transferred to employment opportunities in Turkey. This indicates that one required service could be job matching – identifying refugees who are already skilled but unemployed, and matching with current available vacancies. Another key need is training unskilled refugees (both lower and higher educated) and providing them with a vocational skill in line with the demand of the labour market.
While 16 percent overall were unemployed, this figure was double among women. However, only 39
percent were looking for work, primarily citing childcare responsibilities as the main barrier. Among
unemployed men, just above half (55 percent) were looking for work. Among those men who are not
looking for work, the primary reason was that they are unable to work. This data supports the fact that
childcare and disability must be key factors considered within the targeting of livelihoods programming.
It also provides considerations for those who may be prioritised for continued unconditional assistance.
The livelihoods survey data shows that those with no education or higher education were less likely to be working. The highest rates of employment were found in the middle group, those who had completed primary or secondary school. Despite this, those who are literate and those with university degrees had higher rates of full-time work, indicating that more stable jobs are found at both ends of the spectrum. In addition, despite higher rates of unemployment among those with university degrees (24 percent, versus 16 percent average), a higher proportion had formal work permits (9 percent, versus 3 percent average). This indicates that it may be easier for those with higher levels of education to engage in the formal labour market. It is unlikely that there will be any large scale formal employment of refugees in Turkey, therefore efforts to link refugees to the formal labour market should be well targeted.
The overarching findings of the livelihoods survey indicate that successful policy and programme
interventions must be evidence based and well targeted. The majority of refugees in Turkey come from
less educated and less skilled backgrounds, however there is large regional variation. Livelihoods
programmes must first seek to understand regional and contextual factors determining job opportunities,
and align interventions accordingly. These interventions must then be targeted at the right individuals,
considering previous work experience, levels of specialisation and education levels. It is therefore
essential that relevant data is made available to those seeking to design livelihoods interventions.
Sharing of information will increase the available evidence base, ensuring that interventions are directed
to the areas and individuals where impact will be highest. The humanitarian community and the Turkish
Government are encouraged to continue to collaborate to ensure maximum use of limited resources,
working toward the joint objective of encouraging refugees to become more self-reliant.
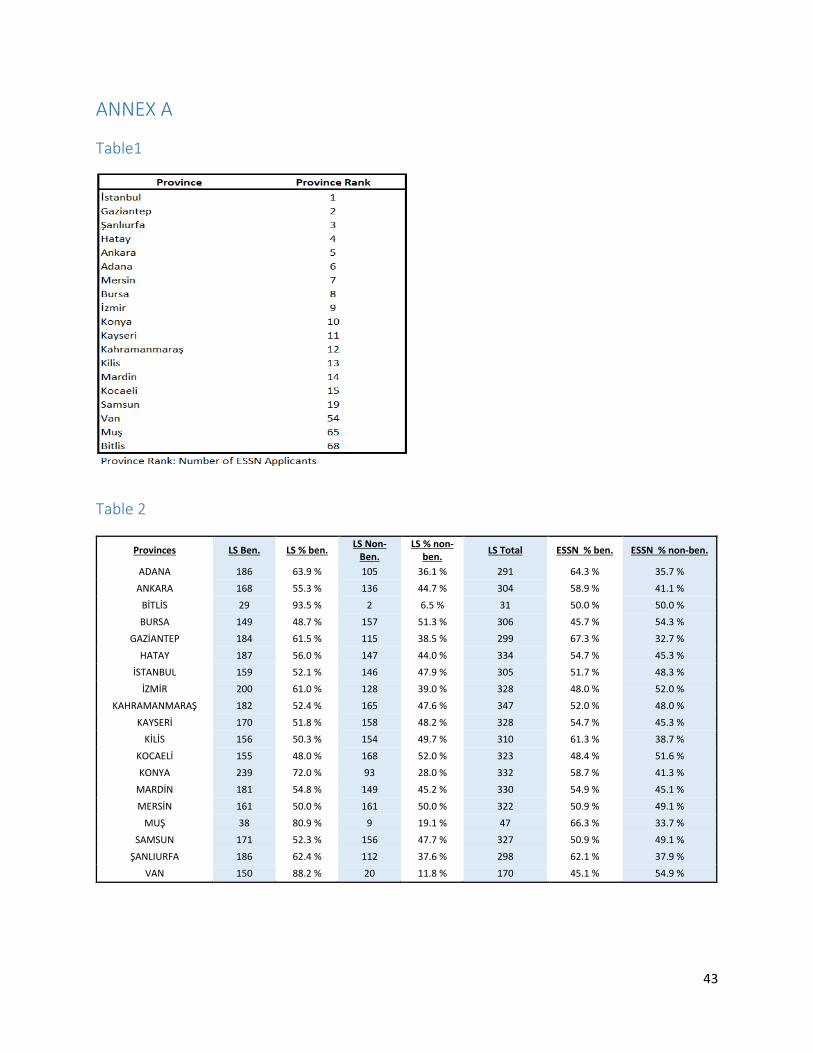
43
ANNEX A
Table1
Table 2
Provinces LS Ben. LS % ben. LS Non-
Ben. LS % non-
ben. LS Total ESSN % ben. ESSN % non-ben.
ADANA 186 63.9 % 105 36.1 % 291 64.3 % 35.7 %
ANKARA 168 55.3 % 136 44.7 % 304 58.9 % 41.1 %
BİTLİS 29 93.5 % 2 6.5 % 31 50.0 % 50.0 %
BURSA 149 48.7 % 157 51.3 % 306 45.7 % 54.3 %
GAZİANTEP 184 61.5 % 115 38.5 % 299 67.3 % 32.7 %
HATAY 187 56.0 % 147 44.0 % 334 54.7 % 45.3 %
İSTANBUL 159 52.1 % 146 47.9 % 305 51.7 % 48.3 %
İZMİR 200 61.0 % 128 39.0 % 328 48.0 % 52.0 %
KAHRAMANMARAŞ 182 52.4 % 165 47.6 % 347 52.0 % 48.0 %
KAYSERİ 170 51.8 % 158 48.2 % 328 54.7 % 45.3 %
KİLİS 156 50.3 % 154 49.7 % 310 61.3 % 38.7 %
KOCAELİ 155 48.0 % 168 52.0 % 323 48.4 % 51.6 %
KONYA 239 72.0 % 93 28.0 % 332 58.7 % 41.3 %
MARDİN 181 54.8 % 149 45.2 % 330 54.9 % 45.1 %
MERSİN 161 50.0 % 161 50.0 % 322 50.9 % 49.1 %
MUŞ 38 80.9 % 9 19.1 % 47 66.3 % 33.7 %
SAMSUN 171 52.3 % 156 47.7 % 327 50.9 % 49.1 %
ŞANLIURFA 186 62.4 % 112 37.6 % 298 62.1 % 37.9 %
VAN 150 88.2 % 20 11.8 % 170 45.1 % 54.9 %

44
Annex B: Occupations Recoding
Below is the detailed explanation for the occupation categories for the 2018 Livelihoods Survey. Each
response is categorised into an occupation grouping in order to better analyse the data and have reliable
findings in terms of employability, sectors, salaries, working days and working habit of the refugees.
The employment categorisation is identified according to the International Labour Organization’s (ILO)
report on occupational grouping. ILO’s grouping depends on the skills of the employees; in Turkey the
majority of the refugees are identified as low skilled and middle skilled. Initial analysis of the responses
showed clear repetition among the replies, demonstrating that the ILO grouping was aligned with the
data.
According to the answers received during the Livelihoods Survey, 17 occupation categories were
identified. This categorization is conducted according to the similarity of the occupations and their
thematic groupings.
1) Agriculture: All occupations related to soil, including gardening, fruit gathering, micro-gardening,
green house activities.
2) Construction: All work conducted in a construction site; the interviewee is working in a
construction site; construction worker, plasterer, mason, or daily worker in a construction site.
3) Manufacturing: Person doing a specific task in a production/assembly line in a factory setting. The
individual does not produce the goods from scratch, but takes part in the production.
4) Textile: Working in a sweatshop, textile atelier, or any setting where clothes, garments, shoes are
manufactured. The outputs should be related to the textile sector.
5) Handyman: Some tools might be involved, but sophisticated machinery is not involved. Examples
for handyman include repairman, mechanics, plumber, blacksmith, electrician etc.
6) Skilled Craft Workers/Artisans: Machinery is involved. These are occupations considered more
sophisticated and requiring more training than handymen.
7) Skilled Services: Occupations require some level of skills, including soft skills, previous training,
worked as a foreman; hairdresser, interpreter, marketing, photographer, house workers, cook,
sous-chef, etc. Bakers were also included in this category because it requires some level of soft
skills.
8) Hospitality Services: This is still the service sector, but requires involvement in the hospitality
industry. This includes supporting others, engaging in with the customer, face-to-face
engagement with the customer (all kind of waiters), tour guides etc.
9) Commercial services/Tertiary Sector: Occupations related to tertiary/service sector. People who
produce an end product to be sold with the commercial objectives; salesperson, driver, car wash,
grocery store employees, security workers, etc.
10) Education: Anything related to education: school teachers, Arabic language teachers, etc.
11) Unskilled Services: This often requires physical effort; anything to do with physical effort or
manual labour is categorized under unskilled services, except construction which has its own
category because of the high amount of data in construction. Home cleaning, paper collectors,
porters (hamal), water distributors, street vendors.
45
12) Clerical Occupations: People with high skilled employment back in Syria. This category is to
understand the skilled work in Syria which did not necessarily transfer to employment in Turkey.
This excludes marketing.
13) Animal Husbandry: This category is separate from agriculture category in order to differentiate
the data between agriculture and husbandry. The aim is to understand the effect of the
seasonality in agriculture; workers in dairy farms, shepherds etc.
14) Home-Based Business: Home based work such as hairdressing in the neighbourhood, home based
knitting, handicraft at home; anything produced at home and sold at home.
15) Entrepreneurship: People who are engaged in entrepreneurship, who own their own business,
who create jobs, etc.
16) Shoemaking: People who are engaged in shoe manufacturing. This category was separated from
manufacturing because a great number of respondents identified their line of work as shoe
manufacturing, allowing for an independent category.

46