annali del dipartimento di metodi e modelli per … · the mena region is among the least dynamic...
TRANSCRIPT

3
SAPIENZA UNIVERSITÀ DI ROMA
ANNALI DEL DIPARTIMENTO DI METODI E MODELLI PER L’ECONOMIA IL TERRITORIO E LA FINANZA
2017
ISSN: 2385-0825

2
Direttore Responsabile - Director Alessandra De Rose Direttore Scientifico - Editor in Chief Roberta Gemmiti Curatore del numero - Managing Editor Ersilia Incelli Comitato Scientifico - Editorial Board Maria Giuseppina Bruno, Adriana Conti Puorger, Francesca Gargiulo, Roberta Gemmiti, Cristina Giudici, Ersilia Incelli, Antonella Leoncini Bartoli, Isabella Santini, Marco Teodori.
3
SAPIENZA UNIVERSITÀ DI ROMA
ANNALI DEL DIPARTIMENTO DI METODI E MODELLI PER L’ECONOMIA IL TERRITORIO E LA FINANZA
2017
ISSN: 2385-0825

Copyright © 2017
Sapienza Università Editrice Piazzale Aldo Moro 5 – 00185 Roma
www.editricesapienza.it [email protected]
Iscrizione Registro Operatori Comunicazione n. 11420
ISSN: 2385-0825
Pubblicato a novembre 2017
Quest’opera è distribuita con licenza Creative Commons 3.0 diffusa in modalità open access.

59
Souria Hammache*, Ghani Chebini*
THE IMPACT OF COUNTRY RISK ON FDI IN THE MENA REGION: PANEL DATA ANALYSIS ON OPEC AND NON-OPEC COUNTRIES Abstract. The rise in country risk, particularly political risk, has severely influenced the inflow of FDI into the Middle East and North Africa (MENA) region, in fact several studies have shown the inverse relationship between country risk and FDI flows. However, these studies do not focus on the particularities and specificities of the countries of the MENA region. In this article we investigate whether country risk similarly impacts FDI in OPEC member countries and non-OPEC countries and whether the determinants of FDI are similar or rather different in the two classified member countries. A panel data analysis is applied to both OPEC and non-OPEC countries. Our study suggests that several factors determine FDI in the MENA region, in particular, GDP, political stability and economic freedom. Up to
the present day when political risk impacts FDI in OPEC countries, institutional quality as well as economic freedom seem to impact non-OPEC member countries.
Key words: country risk, FDI, FDI inflows, instability, MENA, political risk.
1. Introduction
The economies of the region of the Middle East and North Africa (MENA) have always been characterized by economic instability and social inequality. Despite reforms (mainly privatization and the opening of markets) introduced in the 1980s and 1990s, as yet social exclusion issues have not been solved. The unfair distribution of wealth has generated a feeling of economic exclusion and social injustice which also fed the episodes of violence and demonstrations at the time of the Arab uprising (which began around 2010). In this context the MENA region economies have been severely impacted. The MENA region is among the least dynamic regions in the world in terms of FDI attractiveness. Indeed, in 2015 while North Africa drew an equivalent of $500 billion FDI inflows and Europe $430 billion, the MENA region on the contrary attracted only
$93 billion FDI inflows. Furthermore, according to the A.T. Kearney FDI confidence index, investors are generally more pessimistic about the economies of both the Middle East and North Africa (MENA) and Sub-Saharan Africa. In order to benefit from the advantages of FDI, several countries in the MENA region started to adopt attractiveness policies, such as economic liberalization, tax
* Mouloud Mammeri University of Tizi Ouzou, Algeria.

60
exemptions and financial subsidies. However, despite the legitimate efforts, these countries have not managed to attract a significant share of FDI compared to the rest of the world (Sekkat, 2004). Makdissi et al.,(2005) showed that the weak performance of the MENA region is due to the low level of world scale integration and the region’s institutional inefficiency. In addition to this, the rise of political instability in recent years has negatively influenced the perception of foreign investors toward the economies of this region.
The objective of this article is to discuss the impact of rising country risk on FDI in the region, through a panel data analysis carried out on OPEC and non-OPEC countries. Thus, the aim is to estimate the impact of country risk in OPEC countries, which are well endowed with oil, and in non-OPEC countries which are less endowed with energy resources.
2. Theoretical studies of the impact of country risk in the MENA region:
literature review MENA is not an attractive FDI region compared to other parts of the world. Makdissi et al., (2005) showed that the poor performance of the Middle East and North Africa is due to certain economic features which characterize the whole region (the low level of global integration, inefficient institutions, etc). Onyeiwu (2003) used fixed-effect panel regressions to study the impact of institutional and economic factors on FDI in the MENA region over the period 1975-1999, concluding that holistic institutional fundamentals lead to greater attractiveness for FDI flows. An interesting study by Shirazi et al., (2008) provides empirical evidence on the importance of the manufacturing sectors and services in Gulf countries. An analysis of panel data for fifteen countries in the region covering the period 1980-2003 provides evidence of the heterogeneous nature of the MENA region. The results show that FDI in non-Gulf Cooperation Council (GCC) countries is linked to the expansion of the manufacturing sector, while for the GCC countries there is a strong association between inward FDI and the services sector. These results have policy implications since FDI drivers in the manufacturing sector are different from those in the service sector. Jabri et al.,’s (2013) study of FDI determinants in MENA countries during the period 1970 -2010, shows that economic openness and the growth rate increase incoming FDI. Moreover, instability and exchange rates volatility seem to have a negative effect on inward FDI, in turn discouraging foreign investment. Chan and Gemayel (2004) analyzed the role of risk and risk instability on FDI
flows. They concluded that the stability of risk is associated with a high flow of FDI into the MENA region. After comparing the role of risk in the MENA countries with a dataset of developed countries, they also concluded that the role of risk in attracting FDI is greater in developing countries than in developed countries. Mina (2007) studied the determinants of FDI in the six Gulf Cooperation Council (GCC) countries and found that for these countries' oil reserves and oil prices were negatively associated with FDI. Their study also found a positive role played by institutional quality and the measures taken which open up trade and infrastructure.

61
3. Overview of FDI inflows in the world and in the MENA region Comparing the MENA region with other regions of the world we notice the low
attractiveness of this region in terms of FDI inward flows. As we can see, in figure 1, Europe and North America are pioneers in terms of FDI attractiveness in the world. East Asia also performs well in terms of FDI attraction especially in 2015 (compared to 2013 and 2014). North America continues to remain a popular destination for global FDI. As regards the number of FDI projects, it could be argued that this core cluster has been joined by South-East Asia, whose share of global FDI projects rose to 11.6% in 2015. Figure 1. FDI inflows in the world 2013 - 2015.
Source: UNCTAD database. The MENA region has had a decline in foreign investment in recent years mainly due to the deterioration of the environment and the rise of political risks due to the instability of governments. Indeed, the report published in 2014 by the United Nations Conference based in Geneva on Trade and Development (UNCTAD) shows that FDI flows to the MENA dropped to $59.73 billion in 2013, the fifth decline since 2009 and a return to the level that this region recorded in 2005 (see figure 2). Figure 2. The evolution of FDI in the MENA region millions US $.
Source: UNCTAD database.
- 20 000,0
-
20 000,0
40 000,0
60 000,0
80 000,0
100 000,0
120 000,0
1990
1991
1992
1993
1994
1995
1996
1997
1998
1999
2000
2001
2002
2003
2004
2005
2006
2007
2008
2009
2010
2011
2012
2013
2014
2015
2016
North Africa inflows FDI Middel East inflows FDI

62
Likewise Figure 3 on shows how some countries were more affected than others. In fact, there is clear evidence that foreign direct investment increased in some countries, but fell drastically in others, for example in Libya, Kuwait, Iran, Iraq and Algeria. We can also see that Saudi Arabia remained the most attractive country in the region followed by the United Arab Emirates in 2014, but this latter country was able to dethrone Saudi Arabia and has today become the most attractive country in MENA. Indeed, the fall of prices in the oil market weakened Saudi Arabia’s economy which seemed to affect foreign investment in the country. It is also important to note that in recent years FDI flows are unevenly distributed, in fact of the entire region, only five large countries receive 70%, Saudi Arabia, Turkey, Abu Dhabi, Dubai, Egypt and Morocco.
In addition, according to UNCTAD, FDI in North Africa decreased by 15%, that is by $11.5 billion in 2014. The continuing unrest in Libya has negatively influenced the
potential of the region as a host for FDI investors. In 2015, as we can see in figure 3, Yemen, Bahrain and Algeria had negative performances in their FDI inflows. Those countries are considered the less attractive countries in the region by investors.
Figure 3. The evolution of FDI in MENA countries.
Source: UNCTAD database.
4. Country risk in the MENA region The MENA region continues to contain some of the highest-risk countries in the
world, with heightened political risk and elevated levels of political violence (for example, Iraq, Syria and Yemen) spilling over to neighbours, and undermining trade and tourism. The rally in oil prices should reduce some economic risk metrics, particularly sovereign non-payment risk, but weak government spending continues to weigh on growth and consumption and increases payment delays.
In the region’s wealthier countries, such as the Gulf Cooperation Council (GCC) states, economic pressure persists. Saudi Arabia is expected to face some challenges in implementing much-needed economic reforms, although it has not yet experienced significant changes in its political risk ratings. In general, risks stemming from continuous conflicts in the region will maintain the commitment to military and
-4000
-2000
0
2000
4000
6000
8000
10000
12000
14000
16000
18000
FDI 2013
FDI 2014
FDI 2015

63
security spending for the GCC, despite the still subdued level of government revenues. In turn this will increase the urgency of increasing new sources of financing. The increase in oil prices will offset some of the economic drag from lower oil export volumes, but not eliminate them, while the increasing debt levels suggests investors should carefully assess counterparty risk (see Aon’s guide to political risk, 2017). Figure 4. Economic freedom Index in MENA countries in 2017.
Source: Heritage Foundation, 2017.
The Economic Freedom index is released by the US-based Heritage Foundation. It indicates the level of economic freedom in a particular country. As we can notice in figure 4, the United Arab Emirates ranked top position in the Middle East and eighth globally (72,6), according to 2017 data. Iran, Lebanon and Egypt registered economic freedom scores below 60. These economies are considered ‘mostly unfree’. The United Arab Emirates and Qatar are the region’s two ‘mostly free’ economies. The majority of the Middle East/North Africa region’s 14 economies graded by the Index continue to be rated only ‘moderately free’ or ‘mostly unfree’ with the Algerian economy categorized as ‘repressed’. Structural and institutional problems abound throughout the region, and private-sector growth continues to lag far behind the levels needed to provide adequate economic opportunities for the growing population.
5. Research methodology One method of estimation is to apply Ordinary Least Square (OLS) by assuming the
data set across countries are homogenous and consequently treat the data as a pool. Pooled OLS assumes that all countries have the same intercept (β0) and ignores any possible individual characteristics between countries (Sedik, 2012). The simple form of panel data can be explained by inserting the unobserved individual effect as follows:
Yit = β0 +Σβ Xit + αit + ε it (1)
0 10 20 30 40 50 60 70 80
Algéria
Bahrain
Egypt
Iran
Kowait
Lebanon
Morocco
Qatar
Saudi.A
Tunisia
UAE
Eco-Free
64
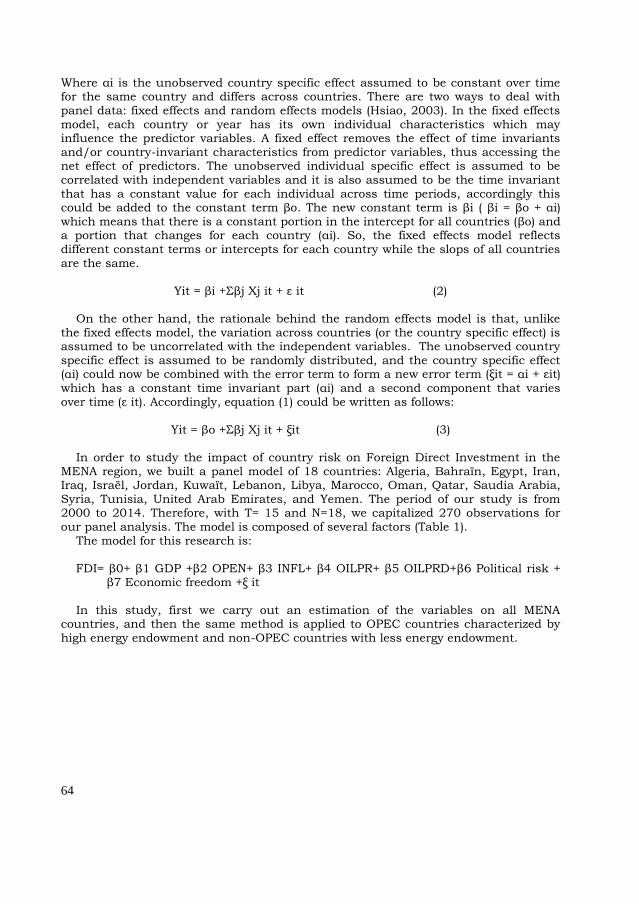
Where αi is the unobserved country specific effect assumed to be constant over time for the same country and differs across countries. There are two ways to deal with panel data: fixed effects and random effects models (Hsiao, 2003). In the fixed effects model, each country or year has its own individual characteristics which may influence the predictor variables. A fixed effect removes the effect of time invariants and/or country-invariant characteristics from predictor variables, thus accessing the net effect of predictors. The unobserved individual specific effect is assumed to be correlated with independent variables and it is also assumed to be the time invariant that has a constant value for each individual across time periods, accordingly this could be added to the constant term βo. The new constant term is βi ( βi = βo + αi) which means that there is a constant portion in the intercept for all countries (βo) and a portion that changes for each country (αi). So, the fixed effects model reflects different constant terms or intercepts for each country while the slops of all countries
are the same.
Yit = βi +Σβj Xj it + ε it (2)
On the other hand, the rationale behind the random effects model is that, unlike the fixed effects model, the variation across countries (or the country specific effect) is assumed to be uncorrelated with the independent variables. The unobserved country specific effect is assumed to be randomly distributed, and the country specific effect (αi) could now be combined with the error term to form a new error term (ξit = αi + εit) which has a constant time invariant part (αi) and a second component that varies over time (ε it). Accordingly, equation (1) could be written as follows:
Yit = βo +Σβj Xj it + ξit (3)
In order to study the impact of country risk on Foreign Direct Investment in the MENA region, we built a panel model of 18 countries: Algeria, Bahraïn, Egypt, Iran, Iraq, Israël, Jordan, Kuwaït, Lebanon, Libya, Marocco, Oman, Qatar, Saudia Arabia, Syria, Tunisia, United Arab Emirates, and Yemen. The period of our study is from 2000 to 2014. Therefore, with T= 15 and N=18, we capitalized 270 observations for our panel analysis. The model is composed of several factors (Table 1). The model for this research is: FDI= β0+ β1 GDP +β2 OPEN+ β3 INFL+ β4 OILPR+ β5 OILPRD+β6 Political risk +
β7 Economic freedom +ξ it
In this study, first we carry out an estimation of the variables on all MENA countries, and then the same method is applied to OPEC countries characterized by high energy endowment and non-OPEC countries with less energy endowment.
65
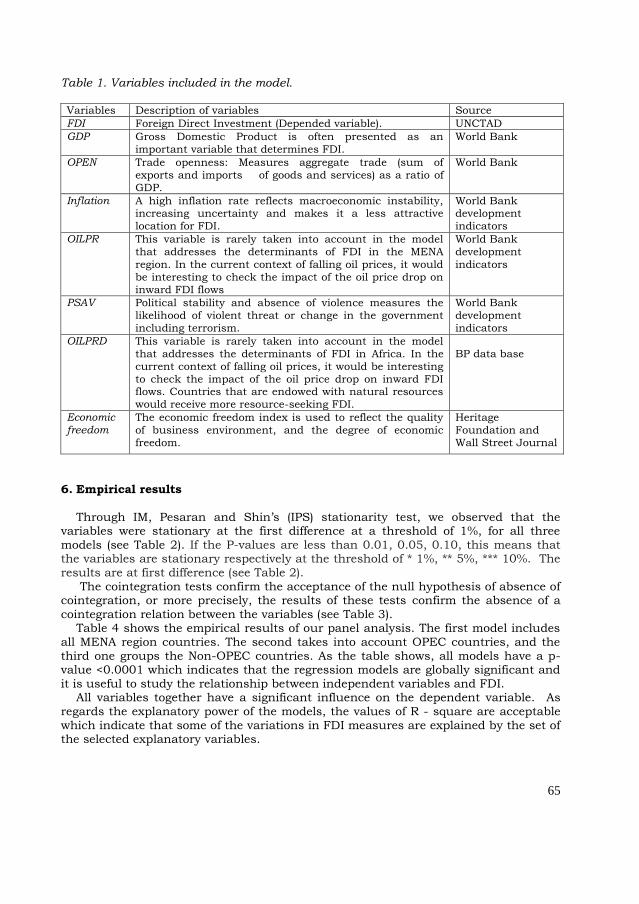
Table 1. Variables included in the model. Variables Description of variables Source
FDI Foreign Direct Investment (Depended variable). UNCTAD
GDP Gross Domestic Product is often presented as an
important variable that determines FDI.
World Bank
OPEN
Trade openness: Measures aggregate trade (sum of
exports and imports of goods and services) as a ratio of
GDP.
World Bank
Inflation A high inflation rate reflects macroeconomic instability, increasing uncertainty and makes it a less attractive
location for FDI.
World Bank development
indicators
OILPR This variable is rarely taken into account in the model
that addresses the determinants of FDI in the MENA
region. In the current context of falling oil prices, it would
be interesting to check the impact of the oil price drop on
inward FDI flows
World Bank
development
indicators
PSAV Political stability and absence of violence measures the
likelihood of violent threat or change in the government
including terrorism.
World Bank
development
indicators
OILPRD This variable is rarely taken into account in the model
that addresses the determinants of FDI in Africa. In the
current context of falling oil prices, it would be interesting
to check the impact of the oil price drop on inward FDI flows. Countries that are endowed with natural resources
would receive more resource-seeking FDI.
BP data base
Economic
freedom The economic freedom index is used to reflect the quality
of business environment, and the degree of economic
freedom.
Heritage
Foundation and
Wall Street Journal
6. Empirical results
Through IM, Pesaran and Shin’s (IPS) stationarity test, we observed that the
variables were stationary at the first difference at a threshold of 1%, for all three models (see Table 2). If the P-values are less than 0.01, 0.05, 0.10, this means that the variables are stationary respectively at the threshold of * 1%, ** 5%, *** 10%. The results are at first difference (see Table 2).
The cointegration tests confirm the acceptance of the null hypothesis of absence of cointegration, or more precisely, the results of these tests confirm the absence of a
cointegration relation between the variables (see Table 3). Table 4 shows the empirical results of our panel analysis. The first model includes
all MENA region countries. The second takes into account OPEC countries, and the third one groups the Non-OPEC countries. As the table shows, all models have a p-value <0.0001 which indicates that the regression models are globally significant and it is useful to study the relationship between independent variables and FDI.
All variables together have a significant influence on the dependent variable. As regards the explanatory power of the models, the values of R - square are acceptable which indicate that some of the variations in FDI measures are explained by the set of the selected explanatory variables.

66
Table 2. Stationarity results, Im, Pesaran and Shin (IPS) Test.
At level At first difference
Modèle 1
(All
countries)
Modèle 2
(OPEC
countries)
Modèle 3
(Non -OPEC
countries)
Modèle 1
(All
countries)
Modèle 2
(OPEC
countries)
Modèle 3
(Non-
OPEC
countries)
FDI (-0.85751) 0.1956
(-0.0063) 0.4975
(-1.1443) 0.1262
(-3.6501) 0.0013*
(-1.8781) 0.0302**
(-2.2728) 0.0015*
GDP (3.84836)
0.9999
(2.0000)
0.9793
(3.3413)
0.9996
(-5.6030)
0.0000*
(-5.2633)
0.0000*
(-2.7016)
0.0034*
OPEN (1.46405)
0.9284
(1.5347)
0.9376
(0.5474)
07080
(-6.2164)
0.0000*
(-3.4410)
0.0000*
(-5.0698)
0.0000*
INFL (-1.29575)
0.0975
(-0.9105)
0.1813
(-09898)
0.1611
(-7.0800)
0.0000*
(-4.7124)
0.0000*
(-4.8943)
0.0000*
OILPR (2.03454)
0.9791
(1.2892)
0.9013
(1.5164)
0.9353
(-7.6985)
0.0000*
(-4.6701)
0.0000*
(-5.5110)
0.0000*
OILPRD (2.66458) 0.9961
(1.7883) 0.9631
(1.3370) 0.9094
(-5.1493) 0.0000*
(-3.7188) 0.0001*
(-3.6987) 0.0001*
Political risk (-2.63984)
0.0041
(-2.1464)
0.0159
(-1.6220)
0.05254
(-7.6564)
0.0000*
(-4.2556)
0.0000*
(-6.3211)
0.0000*
Economic freedom
(1.60765)
0.0540
(-0.7042)
0.2406
(-1.5169)
0.0646
(-5.3725)
0.0000*
(-2.3971)
0.0008*
(-4.2975)
0.0000*
Table 3. The cointegration tests result (Pedroni test).
Statistic Prob. Statistic Prob.
Panel v-Statistic -1.617987 0.9472 -0.882877 0.8113
Panel rho-Statistic 2.600343 0.9953 2.16855 0.9849
Panel PP-Statistic 3.335266 0.9996 1.47943 0.9305
Panel ADF-Statistic 2.704435 0.9966 1.79242 0.9635
Alternative hypothesis: individual AR coefs. (between-dimension)
Statistic Prob.
Group rho-Statistic 2.565562 0.9948
Group PP-Statistic -0.442526 0.3291
The redundant fixed effects test confirms the existence of specific effect in the three models. A Hausman test specifies that for the MENA countries model, the fixed effect model is more appropriate, likewise for the non- OPEC model. The random effect is more appropriate for the OPEC countries model, as the p value of the Hausman test is more than 0.05. The models regrouping the OPEC countries and the non-OPEC countries, show similarities and differences with the general model. First, oil production is not significant and negatively correlated with FDI in all MENA countries, especially with the OPEC countries. This result contradicts Dunning’ s (1980) assumption which claims that the factor endowment attracts FDI, consequently well-endowed oil countries attract more FDI. However, the observation above confirms studies by Rogmans (2011) and van der Ploeg (2011) who had similar results, in which the factor endowment of oil does not explain the flow of FDI in the region, particularly in OPEC countries well-endowed in energy.

67
Table 4. Empirical results. Variables Model 1
(All countries)
Fixed effect
Model 2
(OPEC countries)
Random effect
Model 3
(Non-OPEC countries)
Fixed effect
Constant -1.370008
(-0.449180)**
-3.89E+09
(-1.359208)**
-2.93E+09
(-1.066983)**
GDP 0.007863 (1.951144)***
0.006549 (1.065311)**
0.023082 (8.535515)***
OPEN 0.323490
(0.247663)**
1.570716
(0.823134)**
1.631649
(0.755568)
INFL 6.241995
(1.337788)
2.301956
(0.338424)
3.095739
(0.549562)
OILPR 2.585934
(2.409313)**
2.224998
(1.552947)**
-1.358338
(-0.606897)
OILPRD -1.564790
(-1.053790)
-5.834719
(-0.299713)
3.077520
(3.698004)***
Political stability 2.456473 (1.870607)**
4.797858 (0.847749)
1.289365 (0.6000)
Economic freedom 1.816514
(0.476890)
5.378571
(1.476329)
0.251561
(1.892889)***
R-square 52% 33% 59%
Adjusted R squared 47% 29% 53%
N-Observations 270 120 150
Prob (F-statistic)
0.0000 (11.03176)
0.0000 (8.083583)
0.0000 (9.654979)
Hausman test 0.0094 0.1357 0.0111
Redudant fixes Test Cross-section F(P-value)
0.0000 0.0224 0.0001
⁎ denotes significant at 10%; ⁎⁎ significant at 5% and ⁎⁎⁎ significant at 1%; t student is in
parentheses.
Oil prices are found to be significant for the first two models, which explain part of the variation of FDI. The correlation seems to be positive, increased 1 Unit oil prices led to an increase of 2.58 IDE units, throughout the MENA region, and an increase of 2.22 units in OPEC countries. Foreign investors are likely to focus their investment in the oil sector especially when prices are high, because it increases their profitability. Not surprisingly, the ‘oil price’ variable is not significant for non-member countries of OPEC. However, it is necessary to mention that this result should be confirmed with further studies, taking only the oil sector into account. Indeed, FDI in this study regroup all sectors combined. GDP has a positive and significant impact on FDI inflows into MENA countries. The variable is significant for all models. This proves that a country with an important GDP seems to attract more FDI. Trade openness is positively correlated significantly to FDI in models 1 and 2. Inflation is not significant in all three models, which means that it does not influence the FDI in the region. The variation in IDE cannot be explained by inflation variation. Political stability is significant and positively associated with FDI in Model 1. Surprisingly, political stability is not significant in OPEC and non-OPEC countries. This contradictory result could be explained by the fact that foreign investors accept that the MENA region is an unstable region and take the necessary precautions to protect their investments. Thus, investors consider that they will be paid depending

68
on the risk incurred by a significant profitability. That is to say that the political risk for foreign investors becomes a factor inherent in the MENA region. Another plausible explanation is that investors may not be concerned about political instability as long as it is below a certain threshold. For OPEC countries, it is possible that the result is due to the presence of the oil sector. Indeed, because of the strategic importance of the sector, foreign companies choose to invest in this region despite the significant political risk. Regarding economic freedom, the results show that the variable is significant and positively related to FDI only in Model 3. Economic freedom significantly affects FDI in non-OPEC countries. The variable is, however, not significant for the other two models, meaning it has no influence on FDI.
7. Conclusion
The objective of this article is to identify the impact and influence of country risk on FDI in the MENA region. Indeed, the growing instability in the region makes these countries very fragile, which further deteriorates their economies by sending negative signals to foreign investors who do not hesitate to turn to more stable economies. Our study shows that several factors determine FDI in MENA countries ranging from GDP, political stability to economic freedom. In this study, we confirm that, at the moment when political risk impacts FDI in OPEC countries, institutional quality as well as economic freedom seem to impact non-OPEC member countries. It is therefore important for the countries of the MENA region to activate concrete measures which can improve their attractiveness and circumvent the negative consequences generated by the rise of various detrimental risks. References AON (2017), Guide to political risk, terrorism and political violence, Risk Maps. CHAN K. K., GEMAYEL R. E. (2004), Risk instability and the pattern of Foreign Direct
Investment in the Middle East and North Africa region, IMF Working paper n.139. DUNNING J. H. (1980), Towards an eclectic theory of international production,
Journal of International Business Studies 11, 1. HERITAGE FOUNDATION (2017), Economic freedom report: trade and prosperity at
risk. HSIAO C. (2003), Foreign Direct Investment and economic growth: the importance of
institutions and urbanization, Economic Development and Cultural Change 51, 4, pp. 883-896.
JABRI J., GUESMI K., ABID I. (2013), Determinants of Foreign Direct Investment in MENA region: panel co-integration analysis, Journal of Applied Business Research 29, 4.
MAKDISI S., FATTAH Z., LIMAM I. (2005), The determinants of economic growth in the MENA region. Working Paper, pp.1-50.
MINA W. (2007), The location determinants of FDI in the GCC countries, Journal of Multinational Financial Management 17, 4, pp. 336-348.

69
ONYEIWE S. (2003), Analysis of FDI flows to developing countries: is the MENA region different? Paper presented at ERF 10th Annual Conference Marrakech Morocco, December, pp.1-22.
RUGMAN T. (2011), The determinants of Foreign Direct Investment in the Middle East North Africa Region, PhD thesis, Nyenrode Business University.
SEDIK M. W. (2012), The impact of country risk and new institutional economics on Foreign Direct Investment. a panel data analysis for Middle East and North Africa Region (1999-2010), German University, Cairo, June.
SEKKAT K. (2004), FDI inflows to the MENA region: an empirical assessment of their determinants and impact on development, Research n°FEM21-15, FEMISE.
SHIRAZI A., RODRIGUES G., KARNIK A. (2008), Determinants of Foreign Direct Investment in MENA countries: an empirical analysis, First International Business Conference, University of Wollongong, Dubai.
UNCTAD (2014), Trade and Development Report. UNCTAD (2014), World Investment Report. UNCTAD (2015), World Investment Report. UNCTAD (2016), World Investment Report. VAN DER PLOEG F. (2011), Do natural resources attract FDI? Evidence from non-
stationary sector level data, DNB, Working Paper 266, Netherlands.