annex 1: statement of the resources director · · 2017-06-15in devising dg fisma's new...
TRANSCRIPT

fisma_aar_2016_annexes_final Page 1 of 102
ANNEXES
ANNEX 1: Statement of the Resources Director
“I declare that in accordance with the Commission’s communication on clarification of the
responsibilities of the key actors in the domain of internal audit and internal control in the
Commission1, I have reported my advice and recommendations to the Director-General on the
overall state of internal control in the DG.
I hereby certify that the information provided in Section 2 of the present AAR and in its annexes is,
to the best of my knowledge, accurate and complete.”
Brussels, 28/03/2017
[signed]
Pamela BRUMTER-CORET
1 Communication to the Commission: Clarification of the responsibilities of the key actors in the domain of
internal audit and internal control in the Commission; SEC(2003)59 of 21.01.2003.
Ref. Ares(2017)1702768 - 30/03/2017
fisma_aar_2016_annexes_final Page 2 of 102
ANNEX 2: Reporting – Human Resources, Better Regulation, Information Management and External
Communication
Human resource management
Objective: The DG effectively deploys its resources in support of the delivery of
the Commission's priorities and core business, has a competent and engaged
workforce, which is driven by an effective and gender-balanced management
and which can deploy its full potential within supportive and healthy working
conditions.
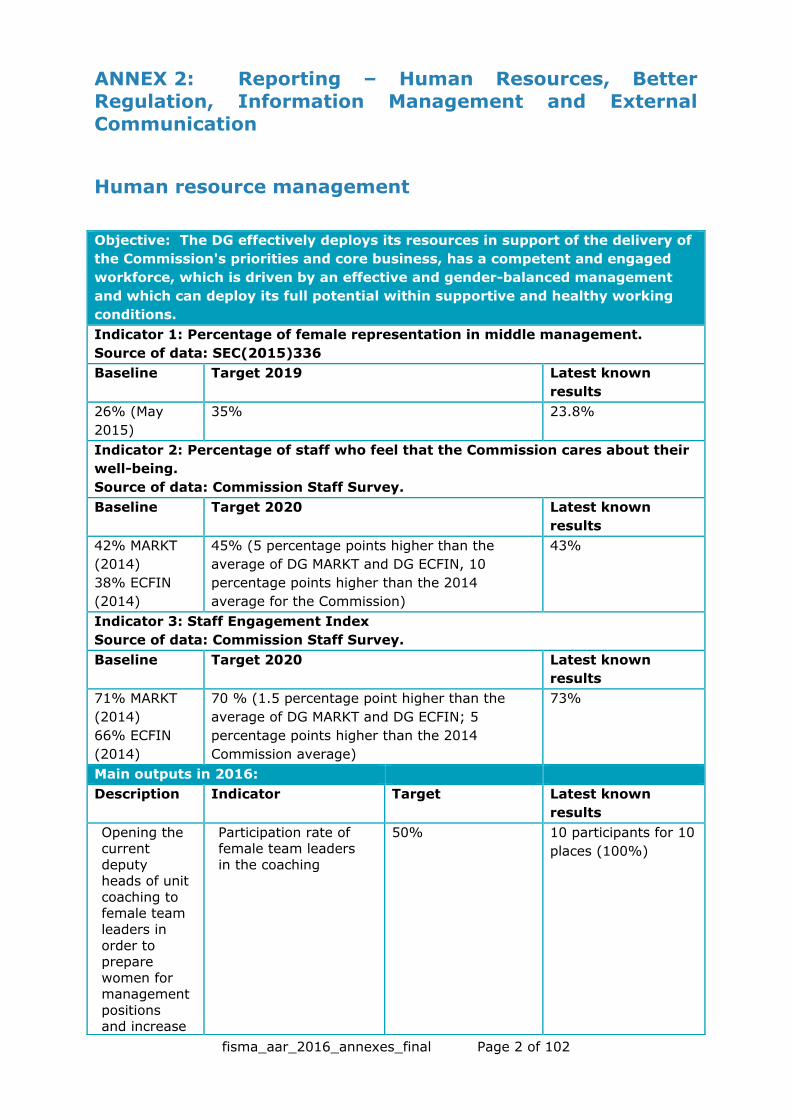
Indicator 1: Percentage of female representation in middle management.
Source of data: SEC(2015)336
Baseline Target 2019 Latest known
results
26% (May
2015)
35% 23.8%
Indicator 2: Percentage of staff who feel that the Commission cares about their
well-being.
Source of data: Commission Staff Survey.
Baseline Target 2020 Latest known
results
42% MARKT
(2014)
38% ECFIN
(2014)
45% (5 percentage points higher than the
average of DG MARKT and DG ECFIN, 10
percentage points higher than the 2014
average for the Commission)
43%
Indicator 3: Staff Engagement Index
Source of data: Commission Staff Survey.
Baseline Target 2020 Latest known
results
71% MARKT
(2014)
66% ECFIN
(2014)
70 % (1.5 percentage point higher than the
average of DG MARKT and DG ECFIN; 5
percentage points higher than the 2014
Commission average)
73%
Main outputs in 2016:
Description Indicator Target Latest known
results
Opening the current
deputy heads of unit
coaching to female team
leaders in
order to prepare
women for management
positions and increase
Participation rate of female team leaders
in the coaching
50% 10 participants for 10
places (100%)

fisma_aar_2016_annexes_final Page 3 of 102
the pool of female
applicants for middle
management positions in
DG FISMA.
Survey on
equal opportunities
for AD women to
serve as the basis for
designing further
actions in
this field.
Expected response
rate of the surveyed population
40% 32 AD women replied
(46.4% of all AD
women)
Meeting between the
Head of the HR unit and
female
managers in DG FISMA to
learn about their
experiences and provide
better support for
women
interested in management
positions.
Meeting between Head of HR unit and
female managers
1 meeting Postponed to 6
February 2017
Coaching for women ADs
on project
team leadership,
with a view to helping
them to acquire
management experience.
Number of participants in
coaching
At least 5 women Workshop "Lead My
Project Team"
Postponed for 13-14
February (6 women
registered so far)
Survey on well-being to
serve as the basis for
designing further
actions in
this field.
Response rate
30% 173 respondents
(45.5% of the
surveyed population)
Social activities
(Easter Egg Hunt, yearly
party) to
Number of participants
Easter Egg hunt – 50
children
The Egg hunt was not
organised in 2016 as
no suitable date for
all participants could

fisma_aar_2016_annexes_final Page 4 of 102
foster further staff
integration.
be found around
Easter.
Lunchtime fit at work
activities and
information
sessions on well-being
topics.
Participation rate
50% of available places
Nutrition: 28 places,
46% participation
rate
Stretching 1st
session: 14 places,
100% participation
rate
Stretching 2nd
session, 10 places
70% participation
rate
An AST workshop
and regular activities for
AST staff.
Participation rate
AST workshop - 50% of all
assistants Activities for ASTs
– 50% of available
places
Workshop: 51 ASTs
(54.8% of all
assistants)
7 breakfasts: total
participants 115 =
16,4 average for 25
places available
(65.6%)
Knowledge hours during
which units
and staff members
will present their field of
activities to all staff.
Number of sessions
15 per year
20 Knowledge Hours
organised in 2016
Mini coaching
sessions offered by
Directors to interested
staff.
Number of participants
15 participants
26 participants in
2016
Active staff participation
in devising DG FISMA's
new working methods.
Number of all-staff meetings
4 per year
4
fisma_aar_2016_annexes_final Page 5 of 102
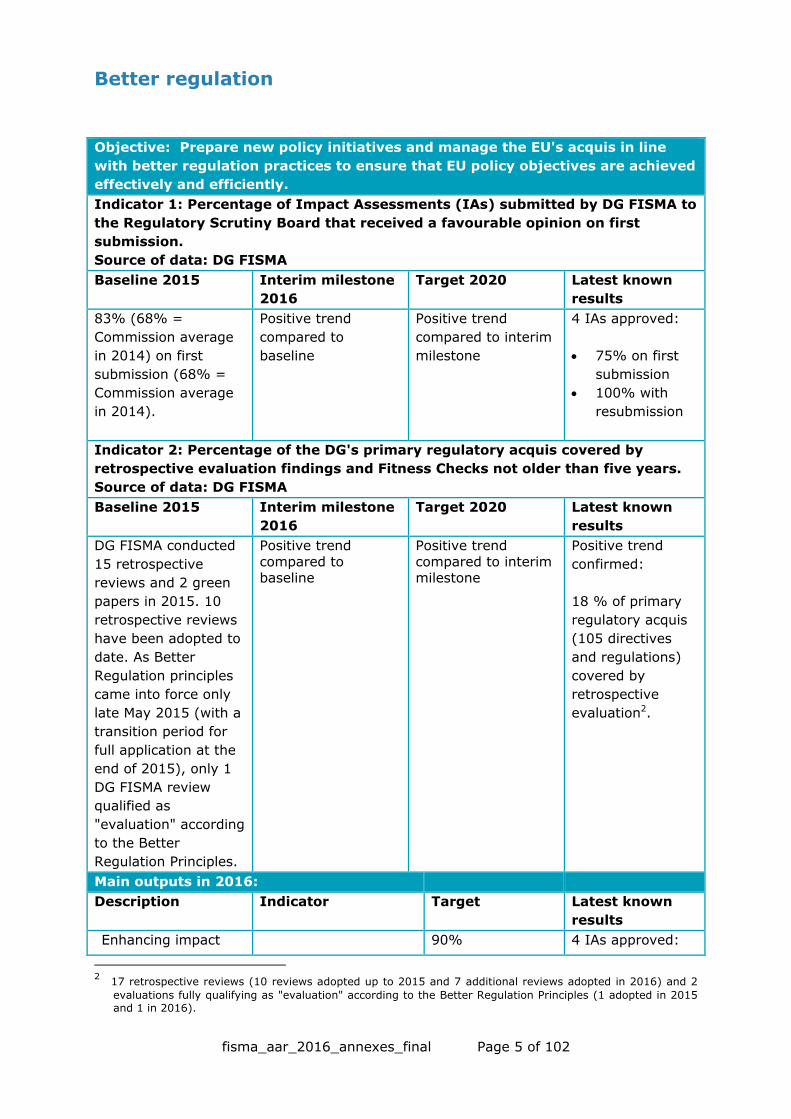
Better regulation
Objective: Prepare new policy initiatives and manage the EU's acquis in line
with better regulation practices to ensure that EU policy objectives are achieved
effectively and efficiently.
Indicator 1: Percentage of Impact Assessments (IAs) submitted by DG FISMA to
the Regulatory Scrutiny Board that received a favourable opinion on first
submission.
Source of data: DG FISMA
Baseline 2015
Interim milestone
2016
Target 2020
Latest known
results
83% (68% =
Commission average
in 2014) on first
submission (68% =
Commission average
in 2014).
Positive trend
compared to
baseline
Positive trend
compared to interim
milestone
4 IAs approved:
75% on first
submission
100% with
resubmission
Indicator 2: Percentage of the DG's primary regulatory acquis covered by
retrospective evaluation findings and Fitness Checks not older than five years.
Source of data: DG FISMA
Baseline 2015
Interim milestone
2016
Target 2020
Latest known
results
DG FISMA conducted
15 retrospective
reviews and 2 green
papers in 2015. 10
retrospective reviews
have been adopted to
date. As Better
Regulation principles
came into force only
late May 2015 (with a
transition period for
full application at the
end of 2015), only 1
DG FISMA review
qualified as
"evaluation" according
to the Better
Regulation Principles.
Positive trend
compared to baseline
Positive trend
compared to interim milestone
Positive trend
confirmed:
18 % of primary
regulatory acquis
(105 directives
and regulations)
covered by
retrospective
evaluation2.
Main outputs in 2016:
Description Indicator Target Latest known
results
Enhancing impact 90% 4 IAs approved:
2 17 retrospective reviews (10 reviews adopted up to 2015 and 7 additional reviews adopted in 2016) and 2
evaluations fully qualifying as "evaluation" according to the Better Regulation Principles (1 adopted in 2015
and 1 in 2016).

fisma_aar_2016_annexes_final Page 6 of 102
assessments' compliance with
Better Regulation Principles.
Percentage of impact
assessments that will
be submitted to the
Regulatory Scrutiny
Board and receive a
favourable opinion on
first submission.
75% on first
submission
100% with
resubmission
Enhancing retrospective
reviews/evaluations' compliance with
Better Regulation
Principles.
Percentage increase of
retrospective reviews/evaluations
that follow the
Better Regulation principles since
2015.
100% DG FISMA
adopted in 2016 1
additional
evaluation within
the meaning of
Better Regulation
principles which
constitutes an
increase of 100%
compared to 2015
baseline (1
evaluation).

fisma_aar_2016_annexes_final Page 7 of 102
Information management aspects
3 The percentage of HAN files shared with other DGs is 0,23%.
Objective: Information and knowledge in the DG is shared and reusable by
other DGs. Important documents are registered, filed and retrievable.
Indicator 1: Percentage of registered documents that are not filed (ratio)
Source of data: Hermes-Ares-Nomcom (HAN) statistics
Baseline 2014 Target Latest known results
1% 1% 0.93%
Indicator 2: Percentage of HAN files readable/accessible by all units in DG
FISMA
Source of data: HAN statistics
Baseline 2014 Target Latest known results
99% 99% 96,5%(excluding restricted
files with personal data)3
Indicator 3: Percentage of briefings managed in accordance with a uniform
business process and using a common tool
Source of data: BASIS (Briefings And Speeches Information System) – Re:
Briefings at DG and DDG level only
Baseline 2014 Target Latest known results
2015: 100% 100% every year 100%
Main outputs in 2016:
Description Indicator Target Latest known results
Increase
of ARES quality
files.
Number of units visited
by Document
Management Officer
(DMO)
Checking of sample files
in units
22
(out of
22
units)
21 out of 21 (new
organigram in 2016)
Review of filing
plans by Heads of Units (based on a
report containing the list of files, the
corresponding file
managers, number of files, file creation
date).
Number of Heads of
Units having reviewed
their filing plan
22
(out of
22
units)
21 (organigram 2016)

fisma_aar_2016_annexes_final Page 8 of 102
External communication activities
Objective 1: Citizens perceive that the EU is working to improve their lives and
engage with the EU. They feel that their concerns are taken into consideration
in European decision making and they know about their rights in the EU.
Indicator 1: Percentage of EU citizens having a positive image of the EU.
Source of data: Standard Eurobarometer (DG COMM budget).
Baseline November
2014
Target 2020
Latest known results
Total "Positive": 39%
Neutral: 37%
Total "Negative": 22%
Positive image
of the EU ≥ 50%
Standard
Eurobarometer 86
(Autumn 2016)
Total positive: 35%
Neutral: 38%
Total negative: 25%
Objective 2: Higher user satisfaction with DG FISMA's main information
channels, i.e. its website, Finance Newsletter and social media accounts.
Indicator 1: Percentage of users who "totally agree" or "tend to agree" with the
statement "The website / Finance Newsletter / social media accounts improve
my understanding of what the EU is doing on banking and finance."
Source of data: Online surveys.
Baseline
Target 2020
Latest known results
Online survey to be
conducted in 2016 to
establish baseline.
+10% (as compared to 2016
baseline).
90.39% "totally agree"
or "tend to agree"
(2016, baseline)
Main outputs in 2016:
Objective (definition): To ensure high visibility for two of DG FISMA's main
policy deliverables, i.e. Capital Markets Union and retail finance, particularly for
media and stakeholders.
Description Indicator Target Latest
known
results
Capital Markets Union
communications plan:
targeted communication
actions around each CMU-
related deliverable
Number of mentions of
#CapitalMarketsUnion
(measured in Engagor).
1,500
mentions in
2016
1,607
mentions in
2016
Retail finance
communications plan,
including ongoing
#MyMoneyEU social media
campaign (to end on
18.3.2016), a webchat and
a Eurobarometer survey.
Number of mentions of
#MyMoneyEU (measured in
Engagor).
2,000
mentions by
18.3.2016
3,373
mentions by
18.03.2016
Annual communication spending (based on estimated commitments).

fisma_aar_2016_annexes_final Page 9 of 102
Baseline (Year -1):
Target: (Year n):
Latest known
results
EUR 86,000
(excluding
Eurobarometer and
conferences)
EUR 250,000 (EUR 106,000 for
Eurobarometer on retail financial services;
remaining budget for other ad hoc
communication actions on main policy
deliverables and web support for digital
transformation; excluding conferences)
EUR 246,624.69
fisma_aar_2016_annexes_final Page 10 of 102
ANNEX 3: Draft annual accounts and financial reports

fisma_aar_2016_annexes_final Page 11 of 102
fisma_aar_2016_annexes_final Page 12 of 102

fisma_aar_2016_annexes_final Page 13 of 102

fisma_aar_2016_annexes_final Page 14 of 102

fisma_aar_2016_annexes_final Page 15 of 102
It should be noted that the balance sheet and statement of financial performance presented in Annex 3 to this
Annual Activity Report, represent only the assets, liabilities, expenses and revenues that are under the control
of this Directorate General. Significant amounts such as own resource revenues and cash held in Commission
bank accounts are not included in this Directorate General's accounts since they are managed centrally by DG
Budget, on whose balance sheet and statement of financial performance they appear. Furthermore, since the
accumulated result of the Commission is not split amongst the various Directorates General, it can be seen that
the balance sheet presented here is not in equilibrium.
Additionally, the figures included in tables 4 and 5 are provisional since they are, at this date, still subject to
audit by the Court of Auditors. It is thus possible that amounts included in these tables may have to be
adjusted following this audit.
The Accounting situation presented in the Balance Sheet and Statement of Financial Performance does not
include the accruals and deferrals calculated centrally by the services of the Accounting Officer.

fisma_aar_2016_annexes_final Page 16 of 102
It should be noted that the balance sheet and statement of financial performance presented in Annex 3 to this
Annual Activity Report, represent only the assets, liabilities, expenses and revenues that are under the control
of this Directorate General. Significant amounts such as own resource revenues and cash held in Commission
bank accounts are not included in this Directorate General's accounts since they are managed centrally by DG
Budget, on whose balance sheet and statement of financial performance they appear. Furthermore, since the
accumulated result of the Commission is not split amongst the various Directorates General, it can be seen that
the balance sheet presented here is not in equilibrium.
Additionally, the figures included in tables 4 and 5 are provisional since they are, at this date, still subject to
audit by the Court of Auditors. It is thus possible that amounts included in these tables may have to be
adjusted following this audit.
The Accounting situation presented in the Balance Sheet and Statement of Financial Performance does not
include the accruals and deferrals calculated centrally by the services of the Accounting Officer.

fisma_aar_2016_annexes_final Page 17 of 102
fisma_aar_2016_annexes_final Page 18 of 102

fisma_aar_2016_annexes_final Page 19 of 102

fisma_aar_2016_annexes_final Page 20 of 102

fisma_aar_2016_annexes_final Page 21 of 102

fisma_aar_2016_annexes_final Page 22 of 102
fisma_aar_2016_annexes_final Page 23 of 102

fisma_aar_2016_annexes_final Page 24 of 102

fisma_aar_2016_annexes_final Page 25 of 102

fisma_aar_2016_annexes_final Page 26 of 102

fisma_aar_2016_annexes_final Page 27 of 102
ANNEX 4: Materiality criteria
The materiality criteria is the benchmark against which DG FISMA identifies in
qualitative and quantitative terms the overall impact of a weakness and judge
whether it is material enough to have an impact on the assurance.
Even if the amount at risk is under the materiality threshold, a reservation may still be made on qualitative grounds.
Qualitative assessment of materiality:
To assess the significance of a weakness, DG FISMA considers the following factors in
qualitative terms:
- the nature and scope of the weakness;
- the duration of the weakness;
- the existence of compensatory measures (mitigating controls which reduce the impact of the weakness);
- the reputational impact of the weakness;
- the existence of effective corrective actions to correct the weaknesses (action
plans and financial corrections) which have had a measurable impact.
Quantitative assessment of materiality:
As regards legality and regularity, the weakness is considered material if the estimated
error rate (referring to authorised financial operations that do not comply with the
applicable contractual or regulatory provisions) exceeds the materiality threshold of 2% of total annual expenditure.
Quantitative and qualitative indicators are provided by:
ex-post checks by the Financial Resources and Internal Control Unit on a sample
of all open commitments and payments processed in 2016;
the register of annual exceptions and non-compliance events. Weaknesses having
a significant impact (which would qualify as a material error) are assessed on the basis of:
o any significant reputational risk for the DG and the Commission;
o repetitive or systemic errors/errors that have gone uncorrected;
o whether they would lead to a failure in identifying any major risk with a financial or policy impact, and/or establishing an adequate action plan to
mitigate those risks.
other errors detected ex-post in the course of standard control or reporting
activities, and which have been notified to the Internal Control Coordinator;
control indicators applicable to the direct procurement and grants management.

fisma_aar_2016_annexes_final Page 28 of 102
ANNEX 5: Internal Control Template(s) for budget implementation (ICTs)
Name the type of expenditure to which the ICT applies4 (grants direct management / procurement direct management /
shared management / indirect entrusted management / Financial Instruments / Non-Expenditure Items5). The generic
ICTs for the above expenditure types are published on BUDGweb.
Grants direct management
Stage 1 — Programming, evaluation and selection of proposals
A — Preparation, adoption and publication of the annual work programme and calls for proposals
Main control objectives: Ensuring that the annual work programme (AWP) and calls for proposals are adequate in facilitating the selection of the most promising projects for meeting the policy or programme objectives (effectiveness); compliance (legality and
regularity); prevention of fraud (anti-fraud strategy)
Main risks It may happen (again)
that … Mitigating controls
How to determine coverage, frequency and
depth
How to estimate the costs and benefits of
controls Control indicators
The annual work
programme and the subsequent call for
proposals do not adequately reflect the
policy objectives, priorities and/or the
essential eligibility, selection and award
criteria are not adequate
to ensure evaluation of the proposals.
Explicit allocation of
responsibility to individual officials
(reflected in task distribution);
hierarchical validation within the authorising
and operational departments;
inter-service consultation
including all relevant services;
adoption by the
If risk materialises, all
grants awarded during the year under this work
programme or call would be irregular.
Possible impact: 100 % of
budget involved and significant reputational
consequences
Coverage/frequency:
100 %
Costs:
Estimated cost of staff involved in preparation
and validation of annual work programme and call
for proposals
Benefits: The (average annual)
total budgetary amount
of the annual work programmes or calls with
significant errors
Effectiveness:
Budget amount of the work programmes
concerned (€)
For grants awarded following the call for
proposals: value of proposals received as a
percentage of budget
available (%)
4 One ICT is required per type of expenditure managed by the DG. As regards cost benefit indicators for the external aid policy area, the aid delivery methods
(procurement and grants, contribution agreements, budget support etc.), the management modes or distinct internal control systems or alternatively the different cooperation instruments could be used, as long as the relevant indicators are reported accordingly in the AAR.
5 For specific types of expenditure that do not fit in the categories mentioned (e.g. Budget support) use the same template and name it accordingly.
fisma_aar_2016_annexes_final Page 29 of 102
Main risks It may happen (again)
that …
Mitigating controls How to determine
coverage, frequency and
depth
How to estimate the costs and benefits of
controls
Control indicators
Call for proposals is
published prior to
adoption of the AWP.
Commission
Depth:
N/A
detected and corrected or
with irregularities
detected
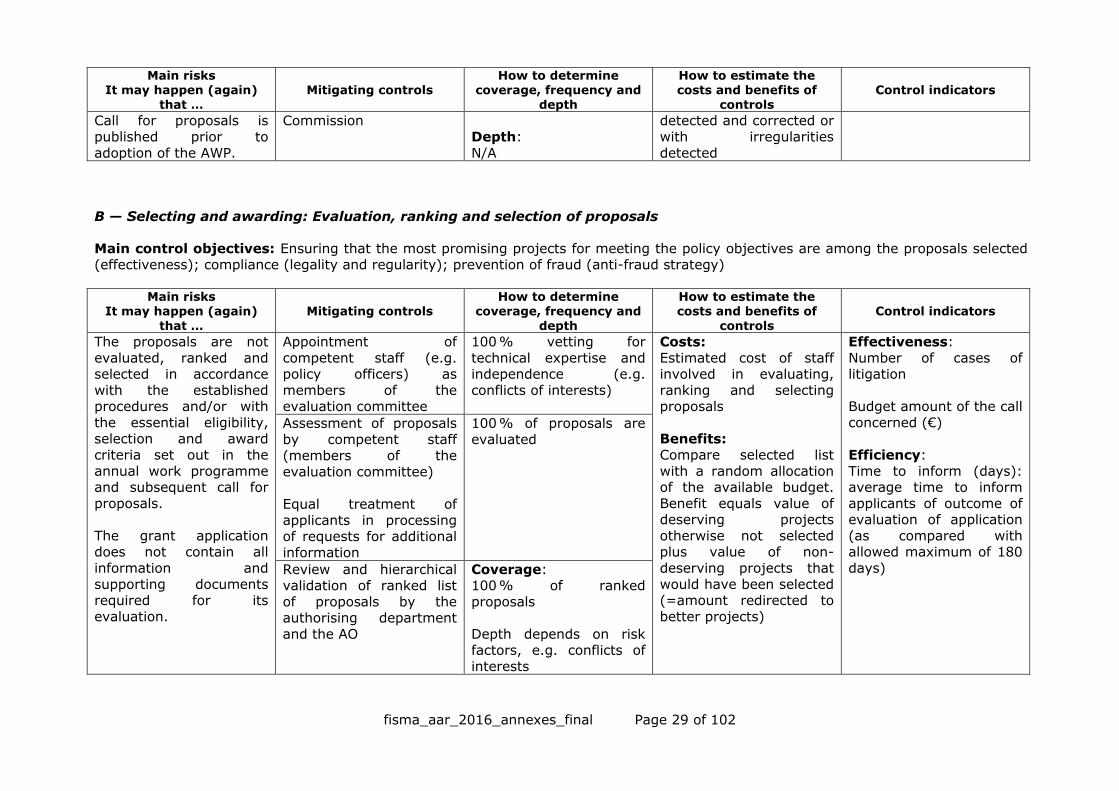
B — Selecting and awarding: Evaluation, ranking and selection of proposals
Main control objectives: Ensuring that the most promising projects for meeting the policy objectives are among the proposals selected (effectiveness); compliance (legality and regularity); prevention of fraud (anti-fraud strategy)
Main risks It may happen (again)
that …
Mitigating controls How to determine
coverage, frequency and
depth
How to estimate the costs and benefits of
controls
Control indicators
The proposals are not
evaluated, ranked and selected in accordance
with the established procedures and/or with
the essential eligibility,
selection and award criteria set out in the
annual work programme and subsequent call for
proposals.
The grant application does not contain all
information and
supporting documents required for its
evaluation.
Appointment of
competent staff (e.g. policy officers) as
members of the evaluation committee
100 % vetting for
technical expertise and independence (e.g.
conflicts of interests)
Costs:
Estimated cost of staff involved in evaluating,
ranking and selecting proposals
Benefits: Compare selected list
with a random allocation of the available budget.
Benefit equals value of deserving projects
otherwise not selected plus value of non-
deserving projects that
would have been selected (=amount redirected to
better projects)
Effectiveness:
Number of cases of litigation
Budget amount of the call
concerned (€)
Efficiency:
Time to inform (days): average time to inform
applicants of outcome of evaluation of application
(as compared with allowed maximum of 180
days)
Assessment of proposals
by competent staff (members of the
evaluation committee)
Equal treatment of
applicants in processing of requests for additional
information
100 % of proposals are
evaluated
Review and hierarchical validation of ranked list
of proposals by the authorising department
and the AO
Coverage: 100 % of ranked
proposals
Depth depends on risk factors, e.g. conflicts of
interests
fisma_aar_2016_annexes_final Page 30 of 102
Main risks It may happen (again)
that …
Mitigating controls How to determine
coverage, frequency and
depth
How to estimate the costs and benefits of
controls
Control indicators
Redress procedure 100 % of contested
decisions are examined
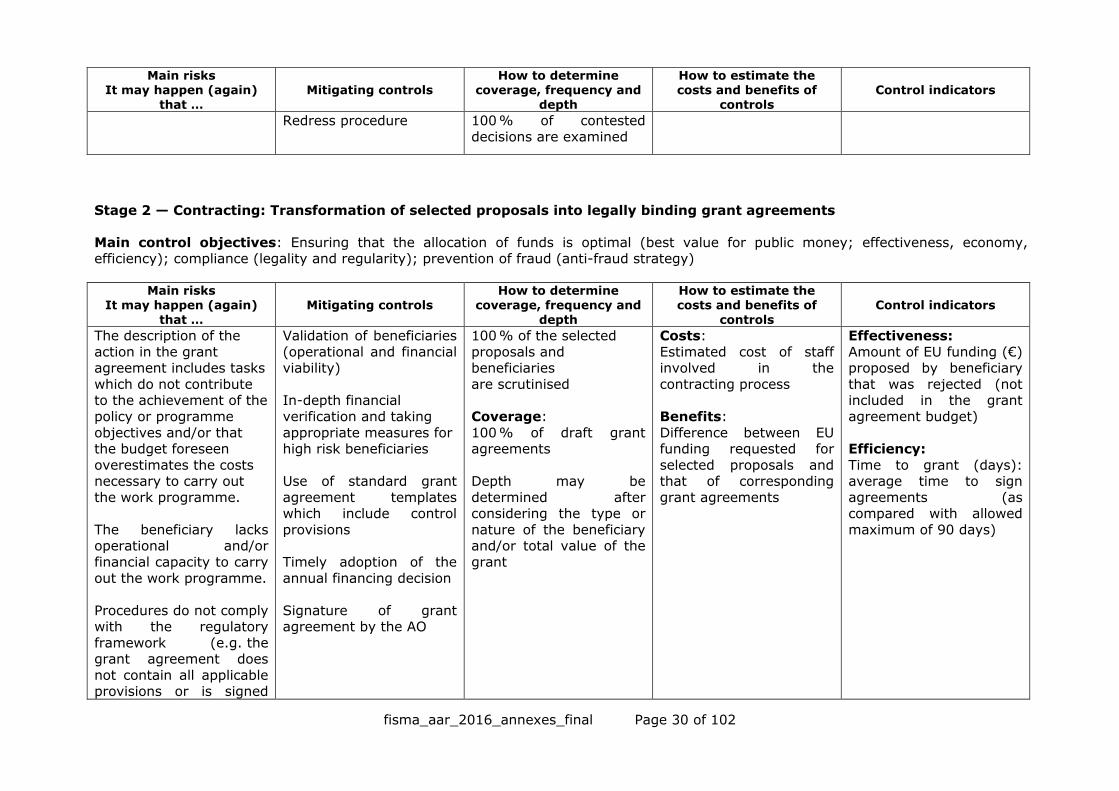
Stage 2 — Contracting: Transformation of selected proposals into legally binding grant agreements
Main control objectives: Ensuring that the allocation of funds is optimal (best value for public money; effectiveness, economy, efficiency); compliance (legality and regularity); prevention of fraud (anti-fraud strategy)
Main risks It may happen (again)
that …
Mitigating controls How to determine
coverage, frequency and
depth
How to estimate the costs and benefits of
controls
Control indicators
The description of the
action in the grant agreement includes tasks
which do not contribute to the achievement of the
policy or programme
objectives and/or that the budget foreseen
overestimates the costs necessary to carry out
the work programme.
The beneficiary lacks operational and/or
financial capacity to carry
out the work programme.
Procedures do not comply with the regulatory
framework (e.g. the grant agreement does
not contain all applicable provisions or is signed
Validation of beneficiaries
(operational and financial viability)
In-depth financial
verification and taking
appropriate measures for high risk beneficiaries
Use of standard grant
agreement templates which include control
provisions
Timely adoption of the
annual financing decision
Signature of grant agreement by the AO
100 % of the selected
proposals and beneficiaries
are scrutinised
Coverage:
100 % of draft grant agreements
Depth may be
determined after considering the type or
nature of the beneficiary and/or total value of the
grant
Costs:
Estimated cost of staff involved in the
contracting process
Benefits:
Difference between EU funding requested for
selected proposals and that of corresponding
grant agreements
Effectiveness:
Amount of EU funding (€) proposed by beneficiary
that was rejected (not included in the grant
agreement budget)
Efficiency:
Time to grant (days): average time to sign
agreements (as compared with allowed
maximum of 90 days)

fisma_aar_2016_annexes_final Page 31 of 102
Main risks It may happen (again)
that …
Mitigating controls How to determine
coverage, frequency and
depth
How to estimate the costs and benefits of
controls
Control indicators
late).
Stage 3 — Monitoring the execution (this stage covers the monitoring of the operational, financial and reporting aspects relating to the project and grant agreement)
Main control objectives: Ensuring that the operational results (deliverables) of the projects are of good value and meet the objectives
and conditions (effectiveness and efficiency); ensuring that the related financial operations comply with regulatory and contractual provisions (legality and regularity); prevention of fraud (anti-fraud strategy); ensuring appropriate accounting of the operations (reliability
of reporting, safeguarding of assets and information)
Main risks It may happen (again)
that … Mitigating controls
How to determine coverage, frequency and
depth
How to estimate the costs and benefits of
controls Control indicators
The work programme of the beneficiary is not,
totally or partially, carried
out in accordance with
the provisions of the grant
agreement and/or the amounts paid exceed
those due in accordance with the applicable
contractual and regulatory provisions.
Changes to grant agreements are not
properly documented or authorised.
Payments to beneficiaries
are made late.
Operational and financial checks in accordance
with the financial circuits
Operation authorised by
the AO
100 % of transactions are controlled and authorised
Costs: Estimated cost of staff
involved in actual management of grants
Benefits: Amount of costs claimed
by beneficiary, but rejected by DG
Effectiveness: Number or % of grants
with cost claim errors
Amount (€) of cost items
rejected (total ineligible costs)
Value of cost claims
items adjusted as percentage of total cost
claim value
Number of potential fraud
cases
Efficiency: Time-to-payment
On-the-spot verifications
Verification results validated with beneficiary
100 % of beneficiaries
(once every two years)
Depth:
Depends on risk criteria
If needed: application of suspension/interruption
of payments, penalties
If needed: beneficiary or
grant referred to OLAF
Depth: Depends on results of ex-
ante controls

fisma_aar_2016_annexes_final Page 32 of 102
Stage 4 — Ex-post controls
A — Reviews, audits and monitoring
Main control objectives: Mesuring the effectiveness of ex-ante controls by ex-post controls; detecting and correcting any error or fraud
remaining undetected after implementation of ex-ante controls (legality and regularity; anti-fraud strategy); addressing systemic weaknesses in the ex-ante controls, based on analysis of the findings (sound financial management); ensuring appropriate accounting of
recoveries to be made (reliability of reporting, safeguarding of assets and information)
Main risks
It may happen (again) that …
Mitigating controls
How to determine
coverage, frequency and depth
How to estimate the
costs and benefits of controls
Control indicators
The ex-ante controls (as such) fail to prevent,
detect and correct erroneous payments or
attempted fraud.
Desk reviews of a representative sample of
transactions to determine effectiveness of ex-ante
controls and consider
findings for improving them
If needed: beneficiary or grant referred to OLAF
(Random) sample sufficiently representative
to draw valid management conclusions
Costs: Estimated cost of staff
involved in desk reviews
Benefits:
Budget value of errors detected during desk
reviews
Effectiveness: Amount of errors
concerned (€)
Number of transactions
with errors
B — Implementing results from ex-post audits/controls
Main control objectives: Ensuring that the results from the ex-post controls lead to effective recoveries (legality and regularity; anti-
fraud strategy); ensuring appropriate accounting of recoveries made (reliability of reporting)
Main risks It may happen (again)
that … Mitigating controls
How to determine coverage, frequency and
depth
How to estimate the costs and benefits of
controls Control indicators
Errors, irregularities and cases of fraud detected
are not addressed (in
time).
Lessons learned from the implementation of audit
Systematic documentation of
audit/control results to be
implemented
Financial operational
validation of recovery in
Coverage: 100 % of final ex-post
control results with a
financial impact
Depth: Consider ‘extending’ the
Costs: Estimated cost of staff
involved in implementing
audit results
Benefits:
Budget value of actually
Effectiveness: Value of ex-post checks
results pending
implementation (€)
fisma_aar_2016_annexes_final Page 33 of 102
Main risks It may happen (again)
that …
Mitigating controls How to determine
coverage, frequency and
depth
How to estimate the costs and benefits of
controls
Control indicators
results are not exploited
to reinforce the control
systems.
accordance with financial
circuits
Authorisation by the AO
findings of systemic
errors into corrections of
non-audited grants by the same beneficiary
corrected errors detected
by ex-post controls

fisma_aar_2016_annexes_final Page 34 of 102
Procurement direct management
Stage 1: Procurement
A – Planning
Main control objectives: Effectiveness, efficiency and economy; compliance (legality and regularity); ensuring efficient and effective organisation of the procurement procedure in order to obtain timely and relevant deliverables, while allocating
adequate resources to manage procurement procedures and complying with the established rules regulating the awarding of public contracts.
Main risks
It may happen (again) that …
Mitigating controls How to determine
coverage, frequency and depth
How to estimate the costs and benefits of
controls Control indicators
The needs are not well defined (operationally
and economically) and
the decision to procure was inappropriate to
meet the operational objectives.
Services are discontinued
due to late contracting (poor planning and
organisation of
procurement process).
Other suitable/similar solutions already exist or
the objectives can be achieved alternatively at
lower/no cost.
Financing decisions/list of studies to be procured
are discussed and agreed by management/group
responsible for assessing
the needs for studies.
100 % of forecast procurements (open
procedures) are justified
in a note to the AOSD.
All key procurement procedures (generally
with a value (€) at or above the Directive
threshold) are discussed by management/group
responsible for assessing
the needs for studies.
Costs:
Estimated cost of staff involved
Benefits:
Amount of unjustified purchases rejected
Costs of litigation saved if discontinuation of service
is avoided.
Amount saved from procuring expensive
contracts when results/data are already
available/can be obtained
otherwise.
Effectiveness: Number of projected calls
for tenders cancelled; number of contract
discontinued due to lack of use (poor planning).
Efficiency: Average cost per tender.
Central financial unit verifies timing and
planning of different procurement procedures
100 % of forecast
procurements
B- Needs assessment and definition of needs
Main control objectives: Ensuring adequate needs analysis to demonstrate that public procurement is the most appropriate (effective, efficient and economical) way of meeting the DG’s objectives and operational needs and carried out in
accordance with the established rules on awarding public contracts; compliance (legality and regularity).

fisma_aar_2016_annexes_final Page 35 of 102
Main risks
It may happen (again) that …
Mitigating controls How to determine
coverage, frequency and depth
How to estimate the costs and benefits of
controls Control indicators
The best offer(s) are not
submitted due to poor tender specifications.
Failing to identify
relevant selection and award criteria to ensure
either adequate capacity
from contractors and satisfactory offers
An offer is biased due to
rigged/unbalanced specifications
Operational verification to
supervise drawing-up of technical specifications
Verification by the
Resources Unit (with expertise in
procurement) of accuracy/completeness
and clarity of tender
documents
100 % of tender
specifications are scrutinised.
Costs:
Estimated cost of staff involved
Benefits: Limit the risks of
litigation or cancellation of a tender.
Amount of contracts for
which the approval and supervisory control
detected material error.
Effectiveness: Number of procedures
where only one or no offers were received;
number of requests for clarification regarding
tender specifications.
Efficiency:
Estimated average cost of a procurement
procedure.
AOSD’s final supervision and approval of
specifications (two different AOSDs for
amounts of € 60 000 or more)
100 % of tenders above a
financial threshold
(e.g. € 60 000) are reviewed by the AOSD
and receive a second verification.
Depth:
Risk-based (depends on sensitivity of file).
C — Selection of the offer and evaluation
Main control objectives: Ensuring that the offers are free from any fraud risks (fraud prevention and detection), comply
with the E-E-E (effectiveness, efficiency and economy) principles and are evaluated in accordance with the established rules
on impartial evaluation; compliance (legality and regularity)
Main risks
It may happen (again) that …
Mitigating controls
How to determine
coverage, frequency and depth
How to estimate the
costs and benefits of controls
Control indicators

fisma_aar_2016_annexes_final Page 36 of 102
Main risks It may happen (again)
that …
Mitigating controls How to determine
coverage, frequency and
depth
How to estimate the costs and benefits of
controls
Control indicators
The most economically
advantageous offer is not selected, due to a biased,
inaccurate or ‘unfair’ evaluation process.
There is a conflict of
interests between
evaluators and tenderers/candidates.
There is an
overdependence on a limited pool of tenderers
given the low number of economic operators able
to provide the DG with
specialised input.
There is corruption or collusion, bids are
manipulated or submitted by phantom
service-providers.
Formal evaluation
process: appointment of the Opening and
evaluation committees
composed of at least three persons
representing at least two organisational entities of
the service.
The award decision file identifying the proposed
contractor is reviewed
(before the AOSD’s signature) by the central
Resources Unit, which checks for any red flags
(two ex-ante verifications if necessary).
100 % of offers analysed.
Depth:
In terms of justification of the draft award
decision
Costs: Estimated costs involved
Benefits:
Compliance with FR; difference between most
onerous and selected
offers.
Potential irregularities/ inefficiencies prevented
(amount of procurement for which significant
concerns are raised)
Effectiveness:
Number of ‘valid’ complaints or of litigation
cases filed; number of fraudulent
cases detected; number of companies
excluded from participation in public
procurement/awarding.
Efficiency:
Cost of successful tenders (i.e. average cost
of ‘most economically advantageous tender’
procedure) (or average cost).
Average cost of a tendering procedure.
Opening and evaluation committees’ declarations
of absence of conflict of
interests
All members of opening
and evaluation committees
Costs: estimated cost of
staff involved.
Benefits: amount of contracts for which the
control prevented the risk of litigation or fraud.
Exclusion criteria documented
100 % checked.
Depth: required documents provided are
consistent
Costs: estimated cost of
staff involved.
Benefits:
Avoid contracting with excluded economic
operators

fisma_aar_2016_annexes_final Page 37 of 102
Main risks It may happen (again)
that …
Mitigating controls How to determine
coverage, frequency and
depth
How to estimate the costs and benefits of
controls
Control indicators
Standstill period –
opportunity for unsuccessful tenderers to
put forward concerns on the award decision.
100 % when conditions
are fulfilled
Costs:
Estimated cost of staff
involved.
Benefits: Amount of procurements
successfully challenged during standstill period.
Stage 2: Financial transactions
Main control objectives: Ensuring that the contract is implemented in compliance with the signed contracts
Main risks It may happen (again)
that …
Mitigating controls How to determine
coverage, frequency and
depth
How to estimate the costs and benefits of
controls
Control indicators
The planned products/services/works
are not, totally or partially provided in
accordance with the technical description and
requirements in the
contract and/or the amounts paid exceed
those due in accordance with the applicable
contractual and regulatory provisions.
Business is interrupted
because contractor fails
(on time) to deliver results (e.g. to be used
for impact assessments).
Operational and financial
checks: checklist-based
verification requiring two actors for both
operational and financial level (in accordance with
established financial circuits)
Authorisation by AOSD
For riskier operations, a second ex-ante in-depth
verification before payment (checklist and
ABAC signatures)
A financial initiating agent (contracts officer)
checks that the planning
100 % contracts
controlled.
Riskier operations subject to in-depth controls. The
depth depends on the
amount and potential impact of late or no
delivery on the DG’s operations.
Costs: Estimated cost of staff
involved.
Benefits:
Amount of irregularities, errors and overpayments
prevented by the controls
Effectiveness: Number/amount of
liquidated damages; number of transactions
‘refused for correction’
Efficiency:
Average cost per payment and recovery
order made
Average time (days) to payment/number of late
payments/rate of late
interest payments
fisma_aar_2016_annexes_final Page 38 of 102
Main risks It may happen (again)
that …
Mitigating controls How to determine
coverage, frequency and
depth
How to estimate the costs and benefits of
controls
Control indicators
of deliverables is
respected.
Stage 3: Supervisory measures
Main control objectives: Ensuring that any weakness in the procedures (tender and financial transactions) is detected and corrected
Main risks
It may happen (again) that …
Mitigating controls
How to determine
coverage, frequency and depth
How to estimate the
costs and benefits of controls
Control indicators
An error, non-compliance with regulatory and
contractual provisions, including technical
specifications, or fraud is
not prevented, detected or corrected by ex-ante
control prior to payment.
Ex-post publication
(possible reaction from tenderer/potential
tenderer, e.g. whistleblowing)
100 % of contracts (contract award notices
or Financial Transparency Register – FTS)
Costs: Estimated cost of staff
involved
Benefits: Amounts detected
associated with fraud and
error
Deterrents and systematic weaknesses
corrected.
Effectiveness:
Amount associated with
errors detected ex-post (relating to fraud,
irregularity and error)
System improvements made
Efficiency:
Costs of ex-post reviews
as compared with ‘benefits’
Desk reviews of a
representative sample of transactions to determine
effectiveness of ex-ante controls and consider
findings for improving them
Random and/or
judgmental sampling.
Depth: Look for any systemic
problem in procurement procedure and financial
circuits

fisma_aar_2016_annexes_final Page 39 of 102
Indirect entrusted management Union contribution to the European Supervisory Authorities (ESAs)6
The authorising officer by delegation of DG FISMA does not entrust ESAs with budget implementation tasks. However, as ESAs do not have a separate budget line in the Union budget nomenclature and their budget appears among other DG FISMA budget lines, DG FISMA
is responsible for transferring the Union contribution (as determined by the budgetary authority) to the ESAs’ administrative and operational budget.
Stage 1 — Establishment (or prolongation) of the mandate to the entrusted entity (‘delegation act’/‘contribution
agreement’/etc.) — N/A
Main control objectives: Ensuring that the legal framework for the management of the relevant funds is fully compliant and regular
(legality and regularity), delegated to an appropriate entity (best value for public money, economy, efficiency), without any conflicts of
interests (anti-fraud strategy)
Main risks
It may happen (again)
that …
Mitigating controls
How to determine
coverage frequency
and depth
How to estimate the
costs and benefits of
controls
Possible control indicators
N/A
Stage 2 — Ex-ante (re)assessment of the entrusted entity’s financial and control framework (towards ‘budget autonomy’; ‘financial rules’) — N/A
Main control objectives: Ensuring that the entrusted entity is fully prepared to start/continue implementing the delegated funds autonomously with respect to all five ICOs.
Main risks
It may happen (again) that …
Mitigating controls
How to determine
coverage, frequency and depth
How to estimate the
costs and benefits of controls
Possible control indicators
N/A
6 ICT not applicable to the fully self-financed agency – the Single Resolution Board
fisma_aar_2016_annexes_final Page 40 of 102
Stage 3 — Operations: monitoring, supervision, reporting (‘representation’/‘control with or around the entity’)
Main control objectives: Ensuring that the Commission is informed fully and in time of any relevant management issues encountered
by the entrusted entity, in order to be able to mitigate any potential financial and/or reputational impacts (legality and regularity, sound financial management, true and fair view reporting, anti-fraud strategy)
Main risks
It may happen (again) that …
Mitigating controls
How to determine
coverage, frequency and depth
How to estimate the
costs and benefits of controls
Possible control
indicators
Due to insufficient
cooperation, supervision and reporting
arrangements, the Commission is not
informed (in time) of
relevant management issues encountered by the
entrusted entity and/or does not react (in time)
to issues by mitigating them or entering a
reservation; this may reflect negatively on the
Commission’s governance
reputation and quality of accountability reporting.
Monitoring or
supervision of entrusted entity (e.g. review of
management reports, representation and
intervention on the
board, scrutiny of annual report, etc.).
If appropriate/needed:
- reinforced monitoring
of operational and/or financial aspects of the
entity;
- potential escalation of
any major governance-
related issues with entrusted entities;
- referral to OLAF
Coverage:
100 % of entities are monitored/ supervised
Frequency:
Before every board
meeting and on receipt of
key management reports/documents
In the event of operational and/or
financial issues, measures are reinforced.
Depth:
Depends on the riskiness
of the identified issues, if
any
Costs:
Estimated cost of staff involved in actual (regular
or reinforced) monitoring of entrusted entities
Benefits:
Total budget amount entrusted to entity,
possibly at 100 %, if significant errors would
otherwise not be detected
Effectiveness:
Quality of management reports received;
number of issues under reinforced monitoring;
number of IAS and ECA
findings of serious control failures;
budget amount of errors concerned
Efficiency:
Cost/benefit ratio;
average supervision cost per entrusted entity
Stage 4 — Commission contribution: payment or suspension/interruption and recovery of unused contribution
Main control objectives: Ensuring that the Commission assesses fully the management situation at the entrusted entity, before either
paying out the (next) contribution for its operational and/or operating budget or deciding to suspend/interrupt the (next) contribution (legality and regularity, sound financial management, anti-fraud strategy)
Main risks
It may happen (again) that …
Mitigating controls
How to determine
coverage, frequency and depth
How to estimate the
costs and benefits of controls
Possible control
indicators

fisma_aar_2016_annexes_final Page 41 of 102
N/A
The costs of staff involved in financial circuits for the contribution payments/recoveries to/from the entrusted entities are identical to those applied for the execution of the DG’s budget. Please refer to the ICT (direct procurement management — financial transactions).
Stage 5 — Audit and evaluation, discharge for decentralised agencies — N/A
Main control objectives: Ensuring that assurance-building information on the entrusted entity’s activities is also provided through independent sources, which may confirm or contradict the management reporting received from the entrusted entity itself (on the five
ICOs).
Main risks It may happen (again)
that …
Mitigating controls How to determine
coverage, frequency
and depth
How to estimate the costs and benefits of
controls
Possible control
indicators
N/A
fisma_aar_2016_annexes_final Page 42 of 102
ANNEX 6: Implementation through national or international public-sector bodies and bodies governed
by private law with a public sector mission (if applicable)
Not applicable

fisma_aar_2016_annexes_final Page 43 of 102
ANNEX 7: EAMR of the Union Delegations (if applicable)
Not applicable

fisma_aar_2016_annexes_final Page 44 of 102
ANNEX 8: Decentralised agencies (if applicable)
For 2016, the total budgeted Union contribution allocated to the European supervisory
authorities (ESAs) was €33 138 4007 including the recovery of surplus (€248 000) from the 2014 contribution (as assigned revenues). In addition, €375 642 was made available
to the ESAs as recovery of the surplus from national authorities’ contributions in 2014.
In the course of the year, the actual Union contribution to the EBA was reduced by
€606 441 due to reduced budgetary needs of the EBA resulting from the significant drop in the value of the pound sterling against the euro.
Agency Policy
concerned Paid by DG FISMA in 2016 (€)
European Banking Authority (EBA) Financial services
14 243 212
European Insurance and Occupational
Pensions Authority (EIOPA)
8 461 389
European Securities and Markets
Authority (ESMA)
10 203 000
Single Resolution Board (SRB) Financial stability
Fully self-financed agency
7 Commission Decision C(2016) 201.

fisma_aar_2016_annexes_final Page 45 of 102
ANNEX 9: Evaluations and other studies finalised or cancelled during the year
Annex 9 - Evaluations and other studies finalised or cancelled during the year.xlsx

fisma_aar_2016_annexes_final Page 46 of 102
ANNEX 10: Specific annexes related to "Financial Management"
Cost-efficiency indicators
(see narrative of paragraph 2.1.1)
Overall indicators
Stage Indicators (annual
indicators) - description
Year
2014
Year
2015
Year
2016
Overall indicator
Overall cost of control (%)
Total cost of controls of all
processes / total expenditure
executed during the year (the
payments made)
4,7% 4% 3%
Financial
transactions
Related cost of control for all
transactions (payments, RO)
/ amount paid (%)
3,4% 3% 2%
Related cost for all
transactions (payments,
RO)/ amount paid and
recoveries
- 2% 1,9%
Related cost of control/n° of
payments and recoveries € 3 400 € 3 450 € 3 480
Supervisory
measures
Related cost of control of supervisory measures /
value of transactions checked (%)
- 0,006% 0,003%
Total costs of control of
supervisory measures - € 5 300 € 1 650
Grant indicators
Stage Indicators (annual
indicators) - description
Year
2014
Year
2015
Year
2016
Overall indicator
Overall cost of control (%)
Total cost of controls of grants'
processes / total expenditure
executed during the year
(payments made)
0,4% 0,7% 0,4%
All controls for the
programming,
evaluation and
selection of
proposals
Cost of evaluation and
selection procedure/ value
contracted (%)
Cost of programming +
evaluating + selecting grants /
value of grants contracted
0,1% 0,2% 0,1%

fisma_aar_2016_annexes_final Page 47 of 102
From legal
commitment up to
payment included
Cost of control from
contracting and monitoring
the execution up to payment
included/ amount paid (%)
0,3% 0,5% 0,3%
Ex-post
Cost of control ex-post
audits/ value of grants
audited
Total cost related to ex-post
audits / grants audited
N/A N/A N/A
Procurement indicators
Stage Indicators (annual indicators) -
description
Year
2015
Year
2016
Overall indicator
Overall cost of control (%)
Total cost of controls/ total expenditure
executed during the year (payments
made)
4,5% 3,5 %
Procurement stage
up to selection and
evaluation and
final award
Cost of controls of the evaluation,
selection procedure, commitments/
value of commitments made (%)
Cost of planning, assessment and
definition of needs, selection and
evaluation of the offers and final
award/value of commitments made
0,9% 0,8%
Sub-stages indicators
Year
2014 Year 2015 Year 2016
Planning
Cost of control of
planning / n° of call for
tenders
€3 790 €3 800 €3 900
Needs assessment
& definition of
needs
Cost of control of needs
assessment &
definition / n° of call
for tenders
€10 500 €10 750 €11 250
Selection of the
offer, evaluation &
award
Cost of control of
selection of the offer &
evaluation/ n° of call
for tenders
€9 600 €12 400 €12 300
Indirect management indicators
Stage Indicators (annual
indicators) - description
Year
2014
Year
2015
Year
2016
fisma_aar_2016_annexes_final Page 48 of 102
Cost-effectiveness indicators
(see narrative of paragraph 2.1.1)
Overall indicator
Overall supervision cost
(%)
Staff FTE * standard staff
cost/annual subsidies paid to
ESAs
0,3% 0,3% 0,3
Overall indicators
Stage Indicators (annual
indicators) - description
Year
2014
Year
2015
Year
2016
Financial
transactions
Amount of liquidated damages €20 126 0 0
Supervisory controls
Amount associated with errors
detected ex-post (related to
fraud, irregularity and error)
0 0 0
Procurement indicators
Stage Indicators (annual
indicators) - description
Year
2014
Year
2015
Year
2016
Planning
Number of projected calls for
tenders cancelled; number of
contracts discontinued due to a
lack of use (poor planning)
2 2
1
Needs assessment
and definition of
needs
Number of requests for
clarification regarding the tender
specifications
(average questions per
procurement procedure)
1 1 1,9
Needs assessment
and definition of
needs
Number of procedures where
only one or no offers were
received
5 4 2
fisma_aar_2016_annexes_final Page 49 of 102
Selection of the offer
and evaluation
Number of ‘valid’ complaints’ or
litigation cases filed 0 0 0
Selection of the offer
and evaluation
Number of fraudulent cases
detected/Number of companies
excluded from participating in
procurement
procedures/awarding
0 0 0

fisma_aar_2016_annexes_final Page 50 of 102
Implementation of 2016 Management Plan's objectives and targets
(see narrative of paragraph 2.1.3)
Objective 1: Effective and reliable internal control system giving the necessary
guarantees concerning the legality and the regularity of the underlying
transactions
Description Indicator Target Latest
known result
Execution of the annual
voted budget, and in compliance with the legal
requirements applying to
transactions.
% of payments executed
within the contractual time limits
90% 99,62%
% of budget commitment appropriations made
(administrative and operational lines)
95% 96,97%
% of payments appropriations made
(administrative and operational lines)
95% 94,9%
Objective 2: Effective and reliable internal control system in line with sound
financial management. Main outputs in 2016
Description Indicator Target Latest
known result
Procurement procedures are
carried out in compliance
with the principles and rules
governing public
procurement at the EC and
according to sound financial
management.
Number of legal
proceedings following
complaints in procurement
procedures
0 (zero) 0 (zero)
Objective 3: Effective and reliable internal control system giving the necessary
guarantees concerning the legality and the regularity of the underlying
transactions
Description Indicator Target Latest
known result
Review and update of the
existing anti-fraud strategy
of DG FISMA (DG MARKT
AFS, Dec. 2013).
Reassessment of DG FISMA fraud risks and fraud
awareness after the implementation of the
action plan of the AFS of DG
FISMA
Adoption of an
updated anti-fraud
strategy
The anti-
fraud
strategy has
been
reviewed in
2016 and
will be
adopted
early 2017

fisma_aar_2016_annexes_final Page 51 of 102
ANNEX 11: Specific annexes related to "Assessment of the effectiveness of the internal control
systems"
Not applicable.

fisma_aar_2016_annexes_final Page 52 of 102
ANNEX 12: Performance tables
General objective 1: A New Boost for Jobs, Growth and Investment.
Impact indicator: Employment rate population aged 20-64
Source of the data: Eurostat
Baseline
Target
Latest known value
2014 2020
Europe 2020 target
2015
69.2% At least 75% 70.1%
Planned evaluations: None planned.
Specific objective 1.1: Companies raise more equity in
public and private capital markets.
Related to spending
programme(s) No
Result indicator: Public equity: new equity issuance year-on-year growth.
Source of data: European Central Bank, Data Warehouse.
Baseline
Interim
Milestones
Target
Latest known results
2014 Average 2015 2016 2020 2016
0,4% 0,45% 0,5% 0,55% 0,65%
While the policy progress made in 2016
is reassuring, it cannot be made
accountable for the marked
improvement in some of the key
performance indicators. Favourable third
factors such as the persist low interest
rate environment, changes to risk
sentiment and buoyant equity prices
boosted equity issuance and market
funding above trend. It remains to be
seen whether this improvement in the
indicators can persist in less favourable
external circumstances or whether
implementation of policy proposals can
enhance further the measurable
performance.
Planned evaluations: None planned.
Result indicator: Private equity activity, gross annual flows.
Source of data: EVCA - gross annual flows (for private equity data)
http://www.investeurope.eu/media/386098/Yearbook-2015-Europe-Country-tables-
Public-version-FINAL.xlsx
Baseline
Interim Milestones Target
Latest known
results
End 2014 2015 2016 2017 2016
EUR 44.6bn 1.9% 2% 2.1% (in line with
European
Commission's
economic forecast for
No data available

fisma_aar_2016_annexes_final Page 53 of 102
the EU).
Planned evaluations: None planned.
Result indicator: Number of prospectuses approved for equity and/or admissions to
trading/amount of capital raised under these prospectuses.
Source of data: Report from the European Securities Markets Authority (ESMA) on
prospectuses as per Art 43 of the Prospectus Directive.
Baseline Target Latest known
results
2014 2019: The Prospectus Regulation will enter into force
in 2017-18. Therefore, DG FISMA will be able to
monitor its effects as of 2019.
3,765 The result of reduced administrative burdens in the
revised Prospectus legislation should lead to an
increase in the number of approved prospectuses.
DG FISMA will be
able to monitor
its effects as of
2019.
Planned evaluations: None planned.
Main outputs in 2016:
Policy–related outputs
Description Lead
service
Indicator Target date Latest known
results
2015 /FISMA/043,
COM/2015/583
Prospectus regulation
The regulation should
reduce the cost of
prospectuses considerably,
in particular for frequent
issuers and SMEs not listed
on regulated markets.
Together with a greater
level of harmonisation of
rules, this should give
companies incentive to raise
more money publicly.
FISMA.DD
G.C.3
Start of
trilogues
Q3 2016 Completed:
Political agreement
reached on the reform package
in December
2016.
2016/FISMA/012
Possible AIFMD third
country passport
This initiative is expected to
increase investment in the
real economy of the EU.
Marketing and distributing
non-EU alternative
investment funds in the
internal market may provide
greater choice for investors
and should exert downwards
pressure on the level of fund
fees prevalent in the EU.
FISMA.DD
G.C.4
Adoption
by the
Commissi
on
09/2016 Postponed to Q4
2017
This initiative is
still being
analysed and
needs further
discussions.

fisma_aar_2016_annexes_final Page 54 of 102
Specific objective 1.2: Debt funding for the corporate
sector, in particular for SMEs, is more diversified.
Related to spending
programme(s) No
Result indicator: Share of market funding in total outstanding debt.
Source of data: ECB Statistical Data Warehouse.
Baseline Interim Milestones Target Latest known results
2014
Average
2015 2016 2017 2018 2019 2016
16.3% 16.6% 16.9% 17.2% 17.5% 17.8% 18.3%
While the policy progress
made in 2016 is
reassuring, it cannot be
made accountable for the
marked improvement in
some of the key
performance indicators.
Favourable third factors
such as the persist low
interest rate environment,
changes to risk sentiment
and buoyant equity prices
boosted equity issuance
and market funding above
trend. It remains to be
seen whether this
improvement in the
indicators can persist in
less favourable external
circumstances or whether
implementation of policy
proposals can enhance
further the measurable
performance.
Planned evaluations: None planned.
Result indicator: Public debt: New issuance in debt securities, year-on-year growth.
Source of data: European Central Bank data – Statistical Data Warehouse.
Baseline
Interim Milestones Target
Latest
known
results
2014 Average 2015 2016 2017 2018 2019 2016
8.6% 5% 5% 5% 5% 5% 6.27%
Planned evaluations: None planned.
Result indicator: Financing gap to SMEs, i.e. difference between the need for external
funds and the availability of funds.
Source of data: European Commission / European Central Bank SAFE Survey (data
coverage limited to the euro area).
Baseline Interim Milestones Target Latest
known
results
End 2014 2015 2016 2017 2018 2019 2016
13% <13% <13% <13% <13% <13% 3%

fisma_aar_2016_annexes_final Page 55 of 102
Planned evaluations: None planned.
Main outputs in 2016:
Policy–related outputs
Description Lead
service
Indica
tor
Target
date
Latest known
results
2015 /FISMA/043,
COM/2015/583
Prospectus regulation
Cheaper and better access
to capital markets for SMEs
should help them diversify
their financing so that they
are less dependent on bank
financing.
FISMA.DD
G.C.3
Start of
trilogues
Q3 2016 Completed:
Political agreement reached on the reform
package in December
2016.
2015 /FISMA/064;
COM/2015/0472
Package containing
Regulation on simple,
transparent and
standardised (STS)
securitisation and
Regulation amending
Capital Requirements
Regulation as regards
securitisation
The initiative is intended to
revive a sustainable
securitisation market that
will improve the financing of
the EU economy, weakening
the link between bank
deleveraging and credit
tightening in the short run
and creating a more
balanced and stable funding
structure of the EU economy
in the long run. This should
diversify the debt funding
for the corporate sector,
including for SMEs.
FISMA.DD
G.01
FISMA.DDG.D.1
Final
adoptio
n by co-
legislators
Q3 2016 Trilogues started in
January 2017.
2016/FISMA/012
Possible AIFMD third
country passport
This initiative is expected to
increase investment in the
real economy of the EU.
Marketing and distributing
non-EU alternative
investment funds in the
FISMA.DD
G.C.4
Adoptio
n by
the
Commi
ssion
09/2016 Postponed to Q4 2017
This initiative is still
being analysed and
needs further
discussions.

fisma_aar_2016_annexes_final Page 56 of 102
internal market m079y
provide greater choice for
investors and should exert
downwards pressure on the
level of fund fees prevalent
in the EU.
Specific objective 1.3: Access to funding for SMEs is less
fragmented.
Related to spending
programme(s) No
Result indicator: Dispersion in bank loan rejection rate: best performing versus worst
performing Member State.
Source of data: European Commission / European Central Bank SAFE Survey (data
coverage limited to the euro area).
Baseline
Interim Milestones Target
Latest known
results
End 2014 2017 2019 2016
39
percentage
points
<39 percentage
points
<39 percentage points
(The dispersion in
bank loan rejection
rate should decrease,
i.e. access to funding
by SMEs should
become more equal).
20%
The unprecedented
policies of the European Central Bank
have flushed the market with liquidity
and therefore had a substantially more
positive impact on the financial market in
general and lending in
particular.
Planned evaluations: None planned.
Main outputs in 2016:
Policy–related outputs
Description Lead
service
Indicat
or
Target
date
Latest known
results
2015/FISMA/002+
Delegated and
Implementing Act(s) on MiFID II
This initiative includes the
specification of the
minimum requirements for
registration as an SME
growth market. In order to
ensure that transparency
rules are applied effectively,
the delegated acts specify
what constitutes a
reasonable commercial
basis on which trading
FISMA.DDG.
C.3
Adoptio
n by the
Commission
Q1 2016 Multiple MiFID II
DAs and IAs (2
DA, 18 RTS and 1 ITS) adopted,
although the Q1 target date was
missed.

fisma_aar_2016_annexes_final Page 57 of 102
venues must make data
available.
2015 /FISMA/043,
COM/2015/583 Prospectus regulation
A greater level of harmonisation of prospectus
rules will result in more equal access to finance for
SMEs across the European
Union.
FISMA.DDG.
C.3
Start of
trilogues
Q3 2016
Completed:
Political agreement
reached on the reform package in
December 2016.
Specific objective 1.4: Banks, insurance companies and
pension funds have greater incentive to invest in and
lend to the real economy in a sustainable way, including
investing in long-term European projects.
Related to spending
programme(s) No
Result indicator: Insurance companies' investments in infrastructure.
Source of data: European Insurance and Occupational Pensions Authority (EIOPA) as of
mid-2016.
Baseline Interim
Milestone
Target Latest
known
results Mid-2015
Before the adoption of a
Solvency II amendment on
infrastructure.
2018 2019
No quantitative data
available at this point.
EIOPA can provide data as
of mid-2016.
A first increase. A general increase in
insurance companies'
investment in
infrastructure by
2019.
No
quantitative
data available
before the
adoption of a
Solvency II
amendment
on
infrastructure
planned in
2017.
Planned evaluations: The 2018 review of the standard formula will allow an interim
assessment of the effect of the 2015 amendment.
Result indicator: Insurance companies' investments in STS securitisation products.
Source of data: European Insurance and Occupational Pensions Authority (EIOPA) as of
mid-2016.
Baseline Interim
Milestone
Target Latest
known
results End 2015
Before the adoption of a
Solvency II amendment on
securitisation.
2018 2019
No quantitative data
available at this point.
EIOPA can provide data as
A first increase. An increase in
insurance companies'
investments in STS
No
quantitative
data available

fisma_aar_2016_annexes_final Page 58 of 102
of mid-2016. securitisation
products.
before the
adoption of a
Solvency II
amendment
on
securitisation
planned in
2017.
Planned evaluations: The 2018 review of the standard formula will allow an interim
assessment of the effect of the 2016 amendment.
Result indicator: Total assets under management by pension funds.
Source of data: EIOPA Pensions Database; OECD.
Baseline Interim Milestone Target Latest
known
results
2016
Entry into force of
IORP II.
2019 2020 2016
According to EIOPA,
in 2014 the assets
of the occupational
pension fund sector
in the EU totalled
EUR 3.2 trillion.
Increase from the baseline,
one year after the
transposition deadline.
Growth in pension
assets (especially
for the lower
ranking countries
in terms of
pension assets).
The first
increase
expected in
2019
Planned evaluations: Review of the IORP II Directive and EIOPA annual reports.
Result indicator: Annual change to the share of total loans to non-financial
counterparties to GDP (percentage point difference).
Source of data: European Central Bank Statistical Data Warehouse.
Baseline
Interim Milestones Target
Latest
known
results
End 2008-2012 2015 2016 2017 2018 2019 2016
Pre-crisis period was
marked by excessive credit
growth as compared with
GDP from 164% in 2006-Q2
to 208% in 2009-Q2. Banks
have then substantially
deleveraged until now,
reaching 166% in 2015-Q2.
Annual change within the limits
of +/- 5% points.
Annual
change
within the
limits of
+/- 5%
points.
3.9%
Planned evaluations: None planned.
Result indicator: Percentage of non-performing bank loans to all loans.
Source of data: European Banking Authority (EBA) risk assessment studies; ECB
(Gross non-performing debt instruments).
Baseline Interim Milestones Target Latest
known
results
2014 2015 2016 2017 2018 2019 Q3 2016
6.14% <7% <7% 5.28%
fisma_aar_2016_annexes_final Page 59 of 102
(NPL
ratio
below
7%
threshol
ds)
Planned evaluations: None planned.
Result indicator: Maturity of corporate loans granted by banks/maturity of corporate
bonds bought by financial institutions (to capture the long-term investment aspect).
Source of data: European Central Bank data for bank credit (outstanding amount of
NFC loans with maturity over 1 year divided by the total lending to NFCs); financial
accounts for market-based funding.
Baseline
Interim Milestones Target
Latest
known
results
End 2014 2015 2016 2017 2018 2019 2016
For bank lending
to corporates:
74.8%
For corporate
issuance:
94.84%
For bank lending to corporates:
>74,8%
For corporate issuance:
>90%
For bank lending
to corporates:
>74,8%
For corporate
issuance: >90%
(The total value of
long-term loans
granted by banks
(maturity > 1
year) to short-
term loans
(maturity
<1 year) of loans
granted by banks
and the maturity
of bonds bought
by financial
institutions should
increase. The
total amount of
bonds issued by
non-financial
corporates having
a maturity longer
than 1 year to the
total amount of
bonds issued by
non-financial
corporates having
a maturity longer
than 1 year should
increase.)
For bank
lending to
corporates:
76.8%
For
corporate
issuance:
95.2%
Planned evaluations: None planned.

fisma_aar_2016_annexes_final Page 60 of 102
Main outputs in 2016:
Policy–related outputs
Description Lead
service
Indicator Target date Latest known
results
2015/FISMA/064;
COM/2015/0472
Package containing
Regulation on simple,
transparent and
standardised (STS)
securitisation and
Regulation amending
Capital Requirements
Regulation as regards
securitisation
Securitisation facilitates
access to a broad range of
investors, thereby
increasing liquidity and
freeing up capital from the
banks for new lending to the
economy.
FISMA.DDG.01
FISMA.DDG.D.1
Final adoption
by co-legislators
Q3 2016 Trilogues started in January 2017.
2016/FISMA/051
Revised calibrations for
corporate infrastructure
investments by insurance
and reinsurance
undertakings under
Solvency II
European insurers manage
around EUR 10 trillion in
assets of which only about
0.25% is currently invested
in infrastructure. The
insurance industry has
indicated that this level of
investment can be doubled
through appropriate
regulatory treatment.
The investment and growth
objective of the CMU Action
Plan will be supported
through additional
investments by insurers in
infrastructure assets. In
September 2015, the
Commission adopted
amendments to the
FISMA.DD
G.D.4
Adoption
by the Commissi
on and
positive outcome
of EP and Council
scrutiny
Q2 2016 Postponed to
Q2 2017.
The Impact
Assessment was
rejected by the Regulatory
Scrutiny Board.

fisma_aar_2016_annexes_final Page 61 of 102
Solvency II Delegated Act to
cover the adapted treatment
of qualifying infrastructure
projects. The Commission
has issued a request for
further technical advice to
EIOPA on infrastructure
corporates.
2016/FISMA/017
Revised calibrations for
securitisation
investments by insurance
and reinsurance
undertakings under
Solvency II
European insurers are large
institutional and long-term
investors that manage
around EUR 10 trillion in
assets. The adaptation of
the Solvency II Delegated
Act to cater for tailored
calibrations within the
standard formula for this
new asset class – STS
securitisation – will give
insurers incentive to invest
in these products, thereby
helping them to diversify
and increasing the yield of
their investment portfolios,
in particular in a low interest
rate environment. The
development of a simple,
transparent and
standardised securitisation
market is a building block of
the Capital Markets Union
and contributes to
sustainable growth and job
creation.
FISMA.DD
G.D.4
Adoption
by the
Commission and
positive outcome
of EP and Council
scrutiny
Q3/Q4 2016,
Postponed to Q3
2017
(only possible once EP and
Council achieve agreement in
trilogues on the STS
Securitisation Regulation)
2015/FISMA/030
Possible initiative on an
integrated covered bond
framework
The use of covered bonds
reduces the cost of funding
for banks and thus increases
lending to the real economy.
FISMA.DD
G.D.2
Adoption
by the Commissi
on
Q4 2016
Postponed to Q4
2017
A Public
Consultation was organized from
Sep 2015 till Jan 2016
A study was

fisma_aar_2016_annexes_final Page 62 of 102
launched in
September 2016 in order to define
if legislative changes are
needed.
2014/MARKT;
COM/2014/043
Banking Structural
Reform (BSR)
Banks, insurance companies
and pension funds have
greater incentive to invest in
and lend to the real
economy in a sustainable
way, including investing in
long-term European
projects.
FISMA.DD
G.D.2
Final
adoption by co-
legislators
Q4 2016 No tangible
adoption prospect.
Negotiations in European
Parliament are
not progressing.
2011/MARKT/002;
COM/2014/0167
Institutions for
Occupational Retirement
Provisions (IORPs II)
This initiative strengthens
governance requirements
for IORPs which increases
their readiness to diversify
their investments.
Furthermore, the
Commission proposal on
IORP2 removes national
investment restrictions on
IORPs and introduces
flexible investment rules
that aim for the long-term.
The investment rules
accommodate low carbon
and climate resilient
infrastructure projects. The
proposal also clarifies cross-
border procedures including
the cross-border transfer of
pension funds, making it
easier for IORPs to carry out
cross-border activity.
FISMA.DD
G.D.4
Final
adoption by co-
legislators
12/2016 Completed:
Political agreement by
co-legislators on 15 June 2016,
endorsed by both Council and EP.
Specific objective 1.5: Barriers to the free movement of
capital are identified and eliminated.
Related to spending
programme(s) No
Result indicator: Ratio between number of barriers to free movement of capital
fisma_aar_2016_annexes_final Page 63 of 102
identified and number of barriers lifted or alleviated OR voluntary commitments to
eliminate or alleviate barriers obtained from Member States.
Source of data: EC/Member States Expert Group on removing barriers to Free
Movement of Capital.
Baseline
2015
Interim Milestone Target
2019
Latest known
results End
2016
The Economic and
Financial Committee
endorsed the idea of
setting up a
collaborative process
between the
Commission and the
Member States in order
to map and tackle
remaining barriers to
free movement of
capital. The group has
started its work in
October 2015 and the
baseline scenario will be
provided as soon as the
mapping of existing
barriers is completed.
Complete inventory of
barriers.
The target is
to lift or
alleviate as
many barriers
as possible.
The target
cannot be
quantified
until the
mapping
exercise is
completed.
The removal
off such
barriers is
expected to
have a
positive effect
on the free
movement of
capital
between
Member
States.
The
Commission
adopted a
Report on
national
barriers to
capital flows on
27 February
2017. It
contains a
mapping of
barriers and
recommendatio
ns for actions.
Planned evaluations: None planned.
Main outputs in 2016:
Policy–related outputs
Description Lead
service
Indicator Target date Latest known
results
2015 /FISMA/043,
COM/2015/583
Prospectus regulation
Remaining fragmentation in
the prospectus requirements
represents a barrier to the
free movement of capital as
it entails legal uncertainty
and/or considerable costs in
accessing capital markets in
other Member States.
FISMA.DD
G.C.3
Start of
trilogues
Q3 2016
Completed:
Political agreement
reached on the reform package
in December 2016.
2016/FISMA/001
Report on barriers to free
FISMA.DD
G.B.1
Adoption
by the
Commissi
Q4 2016 Planned
adoption Q1
2017

fisma_aar_2016_annexes_final Page 64 of 102
movement of capital
The report, which is part of
the CMU Action Plan, will list
the barriers to be addressed
through national actions as
a priority and will be
followed by a roadmap
explaining how, when and
by whom they should be
dismantled.
The report will build on the
work done with national
experts designated by
Member States at the
request of the EFC
secretariat. This group of
Member States has been
tasked with mapping
national barriers which
prevent a fully integrated
and well-functioning Capital
Markets Union, identifying
the most damaging ones
and finding the most
efficient ways to remove
them. It follows a
collaborative approach
aimed at encouraging
Member States to remove
existing barriers on a
voluntary basis, based on
methods such as mutual
evaluation, performance
checks and peer reviews.
on
Specific objective 1.6: An increased cross-border
investment flow.
Related to spending
programme(s) No
Result indicator: Average of inward and outward intra-EU foreign direct investment
(FDI) flows divided by GDP.
Source of data: Eurostat: Balance of Payments, European Union direct investments
[bop_fdi6] and GDP and main components (output, expenditure and income)
[nama_10_gdp].
Baseline
Interim
Milestone
Target
Latest known
results
2013 2016 2018: A higher index indicates
higher new cross-border direct
investment during the period in
relation to the size of the
economy as measured by GDP. If
2015

fisma_aar_2016_annexes_final Page 65 of 102
this index increases over time,
intra-EU direct investment is
becoming more integrated.
2% Stable increase. Stable increase. 2.72%
Planned evaluations: None planned.
Result indicator: Intra-EU portfolio investment (equity and debt) flows divided by GDP.
Source of data: Eurostat: European Union and euro area balance of payments -
quarterly data (BPM6) [bop_eu6_q] and GDP and main components (output,
expenditure and income) [nama_10_gdp].
Baseline Interim
Milestone
Target Latest known
results
2014 2016 2019: A higher index indicates
higher new cross-border portfolio
(equity and debt) investment
during the period in relation to
the size of the economy as
measured by GDP. If this index
increases over time, intra-EU
portfolio investment is becoming
more integrated.
2015
4% Stable increase. Stable increase. 3.26%
Planned evaluations: None planned.
Main outputs in 2016:
Policy–related outputs
Description Lead
service
Indicato
r
Target
date
Latest known
results
2015/FISMA/153
Review European
Venture Capital (EuVECA)
and European Social
Entrepreneurship
(EuSEF) Fund regulations
Through changes to these
Regulations we will be able
to increase cross-border
investment in these funds
and thereby enhance
financing possibilities for
these normally small
entities.
FISMA.DDG.C.4
Adoption by the
Commission
07/2016
Completed:
Adopted by the
Commission 14/7/2016
2015/FISMA/064;
COM/2015/0472
Package containing
Regulation on simple,
transparent and
standardised (STS)
securitisation and
Regulation amending
FISMA.DDG.01
FISMA.DDG.D.1
Final adoption
by co-legislators
Q3 2016 Trilogues started in January 2017.

fisma_aar_2016_annexes_final Page 66 of 102
Capital Requirements
Regulation as regards
securitisation
The initiative is intended to
revive a sustainable
securitisation market that
will improve the financing of
the EU economy, weakening
the link between bank
deleveraging and credit
tightening in the short run
and creating a more
balanced and stable funding
structure of the EU economy
in the long run. This should
increase the cross-border
investment flow.
2015 /FISMA/043,
COM/2015/583
Prospectus regulation
A greater level of
harmonisation of rules and
greater transparency will
make it easier for investors
to invest in transferable
securities which come with a
prospectus as it will be
easier to compare these
investment opportunities.
FISMA.DDG.C.3
Start of trilogues
Q3 2016
Completed:
Political
agreement
reached on the reform package in
December 2016.

fisma_aar_2016_annexes_final Page 67 of 102
General objective 2: A Deeper and Fairer Internal Market with a Strengthened
Industrial Base.
Impact indicator: Composite indicator of financial integration in Europe (FINTEC) Explanation: The FINTEC indicator is a scale-free measure normalized to always lie
between 0 and 1; 0 means no cross-border integration, 1 means full integration; for the price-based part 1 would mean total absence of any price differentials for comparable
money market instruments; for the volume-based part, full integration would mean lack
of any home bias on the side of investors. Source of the data: European Central Bank
Baseline Target Latest known
results
2014 2019 2015
0.5/0.3
The first entry is the price-based, the
second the volume-based indicator value
Increase 0.33/0.5
Planned evaluations: ECB annual report.8
Specific objective 2.1: Banks and non-banks compete to
provide cheap, safe and reliable payment systems and
funding to consumers.
Related to spending
programme(s) No
Result indicator: Number of payment cards issued; number of point of sale (POS)
terminals; number of ATMs.
Source of data: ECB Payment Statistics Report.
[An increase in the number of payment cards that have been issued, the number of POS
terminals and the number of ATMs, means that consumers are increasingly using safer
and more reliable payment systems. The Payment Services Directive focuses on
electronic payments, which are more cost-efficient than cash and which also stimulate
consumption and economic growth. Consumers will benefit from better protected against
fraud and other abuses and payment incidents, with improved security measures in
place. As regards losses that consumers may face, the new rules streamline and further
harmonise the liability rules in case of unauthorised transactions, ensuring enhanced
protection of the legitimate interests of payment users.]
Baseline Target Latest known
results
2011
The 2013 Study on the Impact of the
Payment Services Directive uses 2011
ECB statistics
2020 review of PSD2 ECB data
warehouse
September 2016
737,705 million cards issued;
9,011 million POS terminals in
operation;
437 thousands of ATM terminals.
Increase in the number
of cards issued;
significant increase in
the number of POS
terminals, maintaining
or increasing the
The total number
of non-cash
payments in the
EU increased by
8.5% to 112.1
billion in 2015
8 Work is underway to replicate this data in-house.
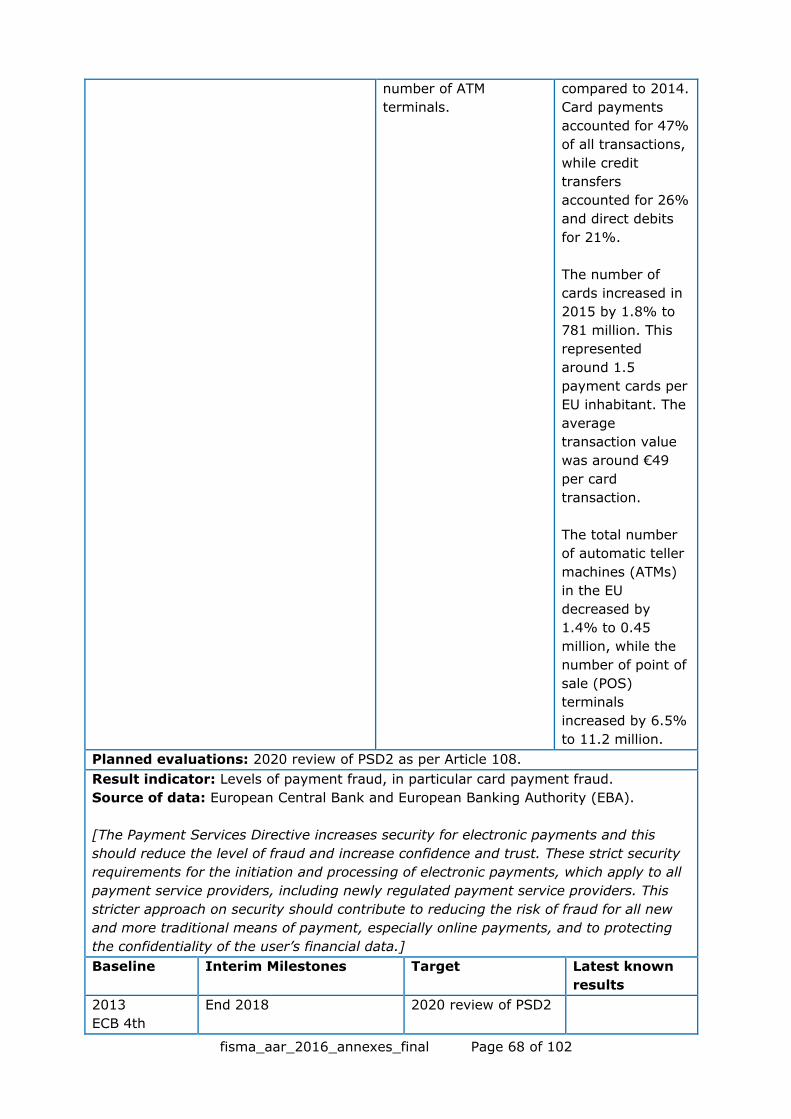
fisma_aar_2016_annexes_final Page 68 of 102
number of ATM
terminals.
compared to 2014.
Card payments
accounted for 47%
of all transactions,
while credit
transfers
accounted for 26%
and direct debits
for 21%.
The number of
cards increased in
2015 by 1.8% to
781 million. This
represented
around 1.5
payment cards per
EU inhabitant. The
average
transaction value
was around €49
per card
transaction.
The total number
of automatic teller
machines (ATMs)
in the EU
decreased by
1.4% to 0.45
million, while the
number of point of
sale (POS)
terminals
increased by 6.5%
to 11.2 million.
Planned evaluations: 2020 review of PSD2 as per Article 108.
Result indicator: Levels of payment fraud, in particular card payment fraud.
Source of data: European Central Bank and European Banking Authority (EBA).
[The Payment Services Directive increases security for electronic payments and this
should reduce the level of fraud and increase confidence and trust. These strict security
requirements for the initiation and processing of electronic payments, which apply to all
payment service providers, including newly regulated payment service providers. This
stricter approach on security should contribute to reducing the risk of fraud for all new
and more traditional means of payment, especially online payments, and to protecting
the confidentiality of the user’s financial data.]
Baseline
Interim Milestones Target
Latest known
results
2013
ECB 4th
End 2018
2020 review of PSD2

fisma_aar_2016_annexes_final Page 69 of 102
Report on
Card Fraud
1.44 billion
EUR (the
amount of
card fraud in
value).
Stable decrease in card
fraud.
New PSD2 payment security
measures shall enter into
force by the end of 2018.
More comprehensive
payment fraud statistics
across all payment
instruments should become
available at that time.
Significant decrease
in card fraud as PSD2
increases security of
payments and, to the
extent new fraud
statistics cover pre-
2018 fraud levels for
other payment
instruments,
decrease in these
figures, too.
No new data
available at the
EU level. The EU
fraud rate in
2013 at 0.035%
of the
transaction value
remained slightly
below the
average for the
world in 2013
(0.037%) and
three times
below US level
(0.099%).
Planned evaluations: 2020 review of PSD2 as per Article 108.
Result indicator: Number of cyber breaches in the financial sector.
Source of data: Symantec.
DG FISMA will promote intelligence sharing and testing so that market operators gain
higher resilience to withstand cyber attacks.
Baseline Interim Milestones Target Latest known
results
2015
Internet
Security
Threat Report
by Symantec.
2017 Internet Security
Threat Report by Symantec.
2019 Internet
Security Threat
Report by Symantec.
80 million
identities
exposed in the
financial
sector in
2014.
Decrease in cyber breaches. Significant decrease
in cyber breaches.
No new data
available
Planned evaluations: None planned.
Result indicator: Number of bank accounts.
Source of data: Commission's review report Payment Accounts Directive.
Baseline Interim
Milestones
Target Latest known
results
2012 2019 2020 The Commission is tackling
financial exclusion in the EU by
providing every citizen with the
right of access to a basic bank
account anywhere in the EU
regardless of their residence and
financial situation. The target
was not quantified.
2014
According to a Stable decrease. Significant decrease in the According to the
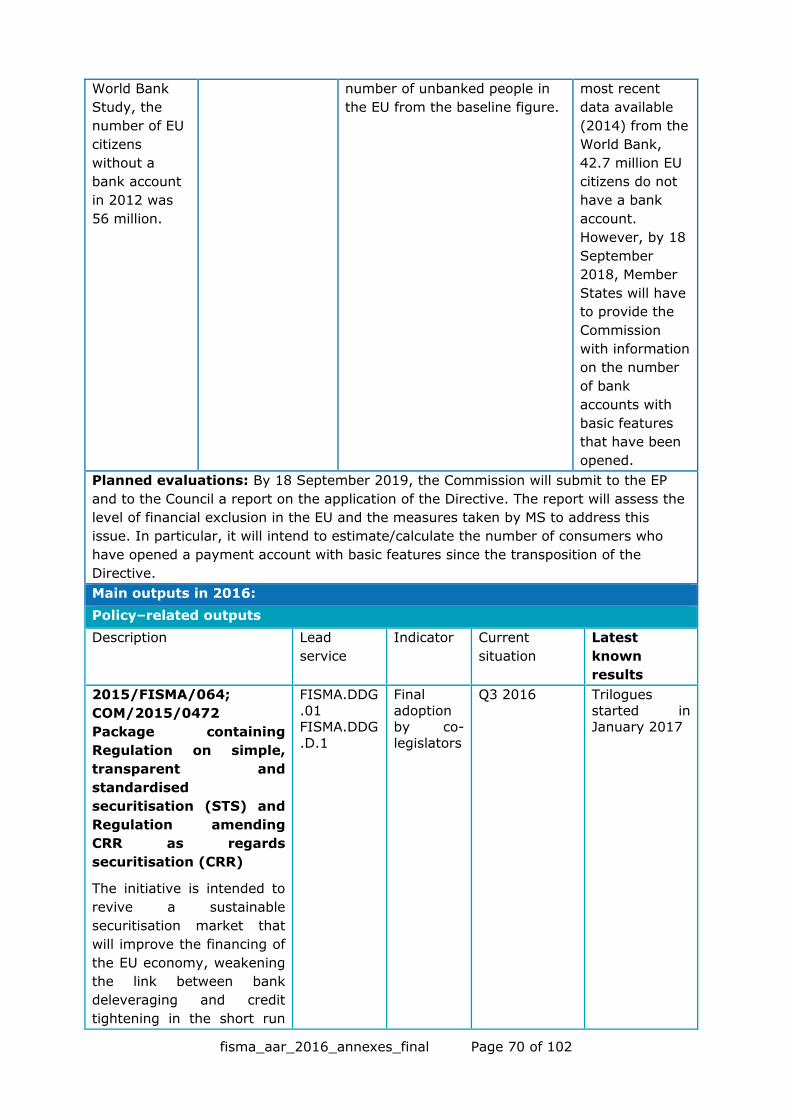
fisma_aar_2016_annexes_final Page 70 of 102
World Bank
Study, the
number of EU
citizens
without a
bank account
in 2012 was
56 million.
number of unbanked people in
the EU from the baseline figure.
most recent
data available
(2014) from the
World Bank,
42.7 million EU
citizens do not
have a bank
account.
However, by 18
September
2018, Member
States will have
to provide the
Commission
with information
on the number
of bank
accounts with
basic features
that have been
opened.
Planned evaluations: By 18 September 2019, the Commission will submit to the EP
and to the Council a report on the application of the Directive. The report will assess the
level of financial exclusion in the EU and the measures taken by MS to address this
issue. In particular, it will intend to estimate/calculate the number of consumers who
have opened a payment account with basic features since the transposition of the
Directive.
Main outputs in 2016:
Policy–related outputs
Description Lead
service
Indicator Current
situation
Latest
known
results
2015/FISMA/064;
COM/2015/0472
Package containing
Regulation on simple,
transparent and
standardised
securitisation (STS) and
Regulation amending
CRR as regards
securitisation (CRR)
The initiative is intended to
revive a sustainable
securitisation market that
will improve the financing of
the EU economy, weakening
the link between bank
deleveraging and credit
tightening in the short run
FISMA.DDG
.01 FISMA.DDG
.D.1
Final
adoption by co-
legislators
Q3 2016 Trilogues
started in January 2017

fisma_aar_2016_annexes_final Page 71 of 102
and creating a more
balanced and stable funding
structure of the EU economy
in the long run. This should
allow banks and non-banks
to compete to provide
cheap, safe and reliable
funding to consumers.
2016/FISMA/013
Action Plan on Retail
Financial Services
The Action Plan will present,
based on the Green Paper
on retail financial services
(COM(2015) 630 final),
actions which aim tackling
the remaining obstacles to a
fully integrated retail
financial services market
across the EU, harnessing
the potentials of digitization
in the retail financial
services area.
FISMA.DDG
.D.3
Adoption
by the
Commission of a
follow-up action
plan
Possible
follow-up actions
(legislativ
e or not)
Q3 2016
Q4 2016
Planned
adoption Q1
2017 (Action Plan)
Specific objective 2.2: Strengthened legal and investor
protection for intra-EU investors and a financial system that
is less reliant on external credit ratings, with greater
diversity in the credit rating industry.
Related to
spending
programme(s) No
Result indicator: Number of outstanding intra-EU bilateral investment treaties (BITs).
Source of data: UNCTAD.
Baseline Target Latest
known
results
2015 2019 2016
There are currently 196 outstanding
BITs amongst EU Member States.
The target is to reach 0
outstanding BITs by 2019 (i.e. to
terminate all outstanding BITs).
However, this will largely depend
on a forthcoming CJEU judgement
regarding the compatibility of
BITs with EU Law as well as on
subsequent compliance by
Member States.
Intra-EU BITs confer rights on a
bilateral basis to investors from
some Member States only, a
lower number of (or no) Intra-EU
BITs would therefore improve the
Various MS
have
initiated the
termination
process, but
none of the
outstanding
BITs has
been
formally
terminated
within the
reporting
period.

fisma_aar_2016_annexes_final Page 72 of 102
equality between intra-EU
investors.
Planned evaluations: None planned.
Result indicator: Number of open EU Pilot and ongoing infringement procedures
against Member States concerning intra EU-BITs.
Source of data: EU PILOT/ NIF Database.
Baseline Target Latest
known
results
2015 2019 2016
There are currently 21 EU Pilot cases
open and 5 infringement
procedures.
Closure of all Pilots and
infringements procedures against
26 MS for compliance (pre or post
CJEU judgement).
Five
Reasoned
Opinions
were
adopted in
Sept. 2016.
A
Commission
decision on
referral of
these 5 MS
to the CJEU
is pending.
The 21 Pilots
are still
open.
Planned evaluations: None planned.
Result indicator: Investor confidence index: EU Financial services indicator.
Source of data: European Commission.
Baseline Interim
Milestones
Target Latest known results
Average in
the period
2013-2014
2015 2016 2017 2016
13 > 10 on average as
long as the EU is not
in economic
recession.
> 10 on
average as
long as the EU
is not in
economic
recession.
17.2
Investor confidence has
substantially improved thanks to
the accommodative monetary
policies across the EU and
resulting better economic data.
Planned evaluations: None planned.
Result indicator: Number of new entrants in credit rating market.
There has been a small but stable increase in the number of new entrants in the CRA
market also during the year 2015. Since the entry into force of CRA3 Regulation in
2013, the increasing number of new entrants has remained stable over the period 2013-
2015. DG FISMA expects this increasing rate to remain stable also in 2016 as the impact
of CRA3 regulation on the competition in the credit ratings market has not shown its
effects yet (as noted by ESMA in its Technical Advice on competition, choice and conflicts
of interest in the credit rating industry). This expectation is based on the fact that

fisma_aar_2016_annexes_final Page 73 of 102
smaller CRAs and new entrants are gradually starting to rate new asset classes
Source of data:
ESMA: list of registered and certified credit rating agencies published at
https://www.esma.europa.eu/page/List-registered-and-certified-CRAs
Baseline Interim Milestones Target Latest known
results
2015 2017 2018 2019 2020 2016
32 CRAs
currently
registered or
certified with
ESMA.
Assess number of new
entrants in the market.
Increase the number
of registered and
certified CRAs to
promote competitive
process.
The EU credit rating
market consists of 40
registered and 4
certified CRAs.
Although new firms
have entered the EU
credit market, most of
the small CRAs rate a
limited set of asset
classes and have
limited cross-border
activities and
geographical scope
Result indicator: Market shares for the three largest Credit Rating Agencies.
The indicator monitors the impact of the measures introduced in the CRA 3, with a
particular focus on the provisions contained in Article 8c and 8d on double ratings and
the provisions on improving governance and transparency in the market to assess
whether these market shares are being reduced and the other smaller CRAs improve
their position in the ratings market.
Source of data: ESMA: Credit Rating Agencies’ market share calculations for the
purposes of Article 8d of the CRA Regulation .
Planned evaluations: None planned.
Baseline
Interim
Milestones
Target
Latest known
results
2014 2017 2019 2020 2015
Standard & Poor's
Group: 39.69%
Moody's Group:
34.53%
Fitch Ratings:
16.22%
Total: 90.44%
Assess market
shares and
remaining
relevant barriers
to entry.
Substantial reduction
of potential barriers
to entry for smaller
CRAs by 2020.
Create market
conditions that would
allow them to
increase their market
shares, at least in
specific sectors.
Standard & Poor's
Group: 45.00%
Moody's Group:
31.29%
Fitch Ratings: 16.56%
Total: 92.85%
Planned evaluations: None planned.
Result indicator: Qualitative assessment of the regulatory references to the
mechanistic use of credit ratings included in EU legislative acts.

fisma_aar_2016_annexes_final Page 74 of 102
Source of data:
ESMA Technical Advice on reducing sole and mechanistic reliance on external credit
ratings (ESMA/2015/1471). Joint consultation on draft RTS on risk-mitigation techniques
for OTC-derivatives contracts not cleared by a CCP (JC/CP/2014/03).
Baseline Interim Milestones Target Latest
known
results
2015 2017 2018 2020 2016
A number of EU
legislative acts
contain references to
credit ratings. This
includes CRR and
CRD IV, Solvency II
(Delegated Act),
UCITIS and AIFMD
(for investment
funds), EMIR and its
Regulatory Technical
Standards (for
CCPs). A qualitative
assessment as
regards those
references which
incentivise sole and
mechanistic reliance
on credit ratings will
be carried out and a
baseline figure
cannot therefore be
provided.
Carry out more
In depth
evaluation of
potential
alternatives to
ratings.
Identify
references
which are most
likely to induce
sole and
mechanistic
reliance and for
which deletion
is considered
more
important.
Elimination
of all
regulatory
references
which
incentivise
sole and
mechanistic
reliance
and for
which
alternatives
were
identified
(Art 5c CRA
Regulation)
.
Currently no
feasible
alternatives
that could
entirely
replace
external credit
ratings. Whilst
mitigating
rules seem to
be in place to
avoid sole and
mechanistic
reliance on
external
ratings,
supervisors
should
continue to
promote the
mitigation of
mechanistic
reliance on
credit ratings
and the Com
will continue
monitoring the
impact of
these
requirements.
Planned evaluations: None planned.
Main outputs in 2016:
Policy–related outputs
Description Lead
service
Indicator Target date
Latest
known
results
2015/FISMA/003+
Delegated & Implementing Acts
on MAR
By further specifying the
Regulation on Market Abuse that
prohibits market manipulation and
FISMA.DDG.C.3
Adoption by the
Commission
Q1 2016 7 RTS and
5 ITS
adopted in
Q1 as
expected
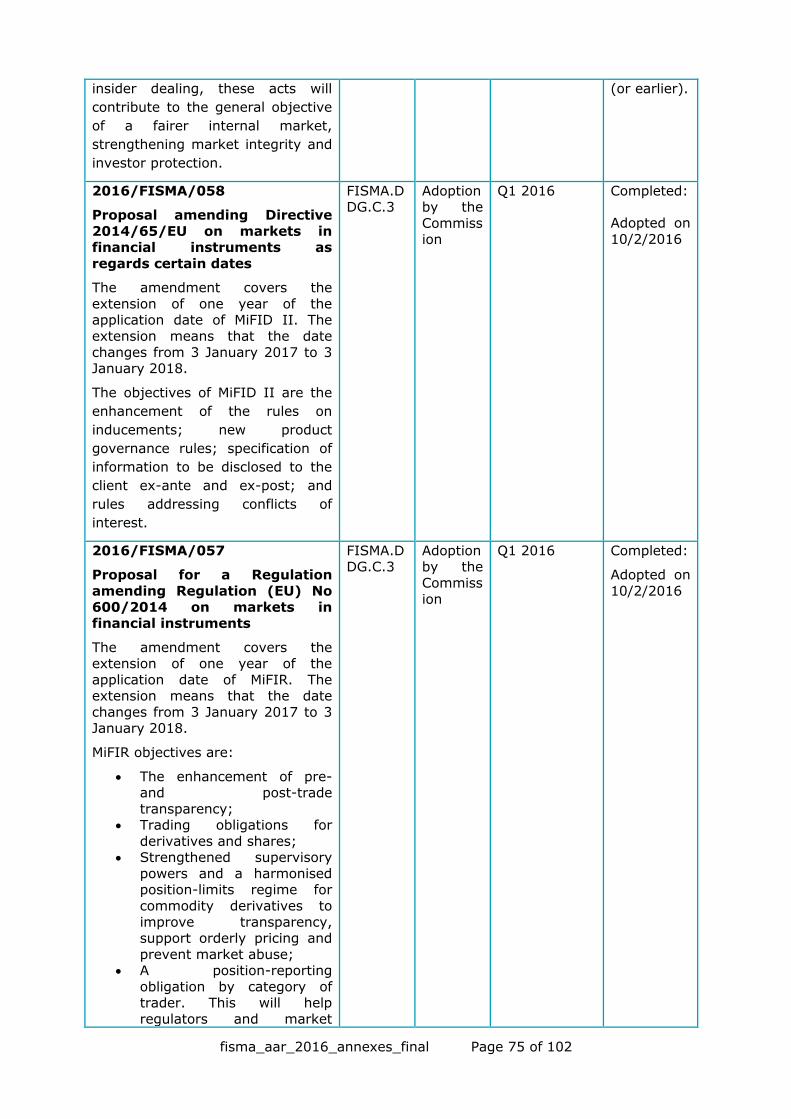
fisma_aar_2016_annexes_final Page 75 of 102
insider dealing, these acts will
contribute to the general objective
of a fairer internal market,
strengthening market integrity and
investor protection.
(or earlier).
2016/FISMA/058
Proposal amending Directive
2014/65/EU on markets in financial instruments as
regards certain dates
The amendment covers the
extension of one year of the application date of MiFID II. The
extension means that the date
changes from 3 January 2017 to 3 January 2018.
The objectives of MiFID II are the
enhancement of the rules on
inducements; new product
governance rules; specification of
information to be disclosed to the
client ex-ante and ex-post; and
rules addressing conflicts of
interest.
FISMA.DDG.C.3
Adoption by the
Commission
Q1 2016
Completed:
Adopted on
10/2/2016
2016/FISMA/057
Proposal for a Regulation
amending Regulation (EU) No
600/2014 on markets in financial instruments
The amendment covers the extension of one year of the
application date of MiFIR. The extension means that the date
changes from 3 January 2017 to 3 January 2018.
MiFIR objectives are:
The enhancement of pre- and post-trade
transparency; Trading obligations for
derivatives and shares; Strengthened supervisory
powers and a harmonised position-limits regime for
commodity derivatives to
improve transparency, support orderly pricing and
prevent market abuse; A position-reporting
obligation by category of trader. This will help
regulators and market
FISMA.DDG.C.3
Adoption by the
Commiss
ion
Q1 2016
Completed:
Adopted on
10/2/2016

fisma_aar_2016_annexes_final Page 76 of 102
participants to have better
information on the functioning of these
markets; The improvement of
conditions for competition in
the trading and clearing of financial instruments as well
as the smooth application of these provisions;
The introduction of trading controls for algorithmic
trading activities.
2015/FISMA/002+
Delegated and Implementing Act(s) on MiFID II
This initiative includes the specification of the minimum
requirements for registration as an SME growth market. In order to
ensure that transparency rules are
applied effectively, the delegated acts specify what constitutes a
reasonable commercial basis on which trading venues must make
data available.
FISMA.D
DG.C.3
Adoption
by the Commiss
ion
Q1 2016 Multiple
MiFID II DAs and
IAs (2 DA, 18 RTS and
1 ITS) adopted,
although
the Q1 target date
was missed.
2015/FISMA/025+ Delegated and Implementing
Act(s) on MiFIR
These acts set out criteria and
factors to be taken into account by European Securities Markets
Authority (ESMA) or national
competent authorities when intending to use their product
intervention powers. These powers could be used in case of significant
investor protection concerns or threats to the orderly functioning
and integrity of financial or commodity markets or to the
stability of the whole or part of the
financial system of the Union or respectively of at least one Member
State. They also clarify the circumstances under which ESMA
can use its position management powers.
FISMA.DDG.C.3
Adoption by the
Commission
Q1 2016 The majority of
the MiFIR DAs (1 DA,
13 RTS) adopted,
although in
all cases the Q1
target date was
missed.
2013 / MARKT/011,
COM/2013/0641 Benchmarks Regulation
The Regulation improves the governance of benchmark
administration and should
contribute to the use of appropriate
FISMA.D
DG.C.3
Final
adoption by co-
legislators
06/2016 Completed:
Adopted by co-
legislators on

fisma_aar_2016_annexes_final Page 77 of 102
benchmarks in financial instruments and contracts.
08/06/2016
2016/FISMA/009
Review of the operation of the
ESAs
FISMA.DDG.01
Adoption by the
Commiss
ion
Q2 2016
Postponed until 2017
The
founding regulations
of the European
Supervisory Authorities
("ESAs") mandate
that a
general review of
the operation
of the ESAs takes place
in 2017.
2015 /FISMA/043, COM/2015/583
Prospectus regulation A greater level of harmonisation of
rules and greater transparency will
strengthen investor protection.
FISMA.DDG.C.3
Start of trilogues
Q3 2016
Completed:
Political
agreement reached on
the reform
package in December
2016.
Specific objective 2.3: Financial and non-financial
reporting by companies, as well as audit, is of a high
quality.
Related to spending
programme(s) No
Result indicator: Number of Countries using IFRS.
In 2005 the EU took a significant step and made the use of IFRS obligatory for the
consolidated financial statements of EU companies which are listed on the EU’s stock
markets (Regulation 1606/2002). The EU is the largest jurisdiction applying IFRS.
In relation to listed companies, the Commission’s work extends beyond the EU’s borders
and goes towards promoting the use of IFRS as the worldwide financial reporting
language so enhancing the efficiency and transparency of capital markets throughout
the globe.
Source of data: IASB http://www.ifrs.org/Use-around-the-world/Documents/2016-
pocket-guide.pdf
Baseline Target Latest known
results
2015 2020 2016
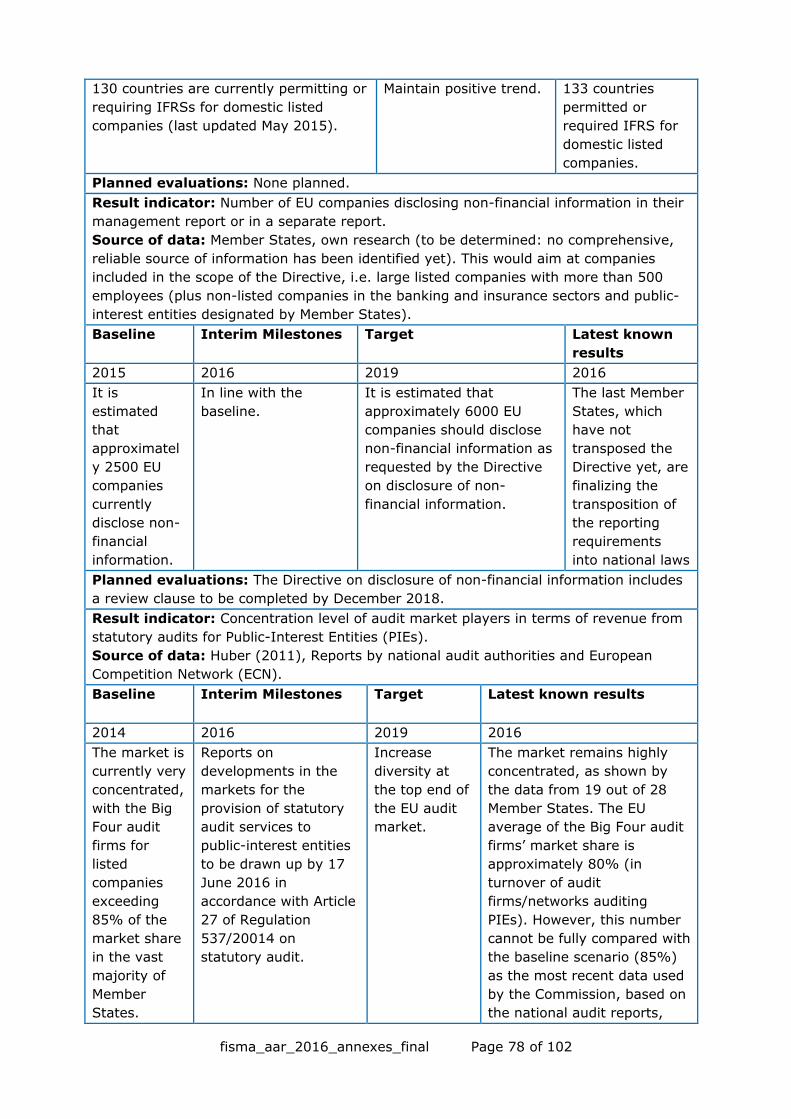
fisma_aar_2016_annexes_final Page 78 of 102
130 countries are currently permitting or
requiring IFRSs for domestic listed
companies (last updated May 2015).
Maintain positive trend. 133 countries
permitted or
required IFRS for
domestic listed
companies.
Planned evaluations: None planned.
Result indicator: Number of EU companies disclosing non-financial information in their
management report or in a separate report.
Source of data: Member States, own research (to be determined: no comprehensive,
reliable source of information has been identified yet). This would aim at companies
included in the scope of the Directive, i.e. large listed companies with more than 500
employees (plus non-listed companies in the banking and insurance sectors and public-
interest entities designated by Member States).
Baseline Interim Milestones Target Latest known
results
2015 2016 2019 2016
It is
estimated
that
approximatel
y 2500 EU
companies
currently
disclose non-
financial
information.
In line with the
baseline.
It is estimated that
approximately 6000 EU
companies should disclose
non-financial information as
requested by the Directive
on disclosure of non-
financial information.
The last Member
States, which
have not
transposed the
Directive yet, are
finalizing the
transposition of
the reporting
requirements
into national laws
Planned evaluations: The Directive on disclosure of non-financial information includes
a review clause to be completed by December 2018.
Result indicator: Concentration level of audit market players in terms of revenue from
statutory audits for Public-Interest Entities (PIEs).
Source of data: Huber (2011), Reports by national audit authorities and European
Competition Network (ECN).
Baseline
Interim Milestones Target Latest known results
2014 2016 2019 2016
The market is
currently very
concentrated,
with the Big
Four audit
firms for
listed
companies
exceeding
85% of the
market share
in the vast
majority of
Member
States.
Reports on
developments in the
markets for the
provision of statutory
audit services to
public-interest entities
to be drawn up by 17
June 2016 in
accordance with Article
27 of Regulation
537/20014 on
statutory audit.
Increase
diversity at
the top end of
the EU audit
market.
The market remains highly
concentrated, as shown by
the data from 19 out of 28
Member States. The EU
average of the Big Four audit
firms’ market share is
approximately 80% (in
turnover of audit
firms/networks auditing
PIEs). However, this number
cannot be fully compared with
the baseline scenario (85%)
as the most recent data used
by the Commission, based on
the national audit reports,
fisma_aar_2016_annexes_final Page 79 of 102
refers to the turnover of audit
firms/networks auditing PIEs
and excludes data from 9
Member States. Furthermore
the top 10 biggest audit firms
in the EU (including the "big
four") represent on average
90% of the total EU PIEs
audit market.
A Commission report on the
monitoring of the EU market
for statutory audits of PIEs
(pursuant to Article 27 of the
2014 Audit Regulation and
based on reports by the
national audit authorities) is
under preparation to be
adopted in 2017.
Planned evaluations: None planned.
Result indicator: Outcome of the quality assurance review of Public Interest Entities
(qualitative description of types of deficiencies and Mitigation/remedies/follow-up).
This indicator will rely on information available to all competent authorities, i.e. results
of inspections carried out by national oversights authorities, which should be reported to
the Commission according to Art. 27 Monitoring market quality and competition of
Regulation 537/20014.
Source of data: IFIAR- International Forum of Independent Audit Regulators; Reports
by national audit authorities and European Competition Network (ECN).
Baseline Interim Milestones Target Latest known results
2014 2016 2020
Inspection
reports
indicated
persistent
shortcomings
in audit
quality and
that
deficiencies in
audit
performance
occur too
often.
Reports on
developments in the
markets for the
provision of statutory
audit services to public-
interest entities to be
drawn up by 17 June
2016 in accordance with
Article 27 of Regulation
537/20014 on statutory
audit.
Reduction in
identified
deficiencies.
Main Findings:
- Lack of sufficient evidence
of having carried out certain
activities;
- Failures in documentation;
- Failures in internal quality
control system;
Follow-up/remedies:
- Sanctions have been issued
in very few limited cases.
- Recommendations to the
firms are the most used tool
to correct mistakes
Planned evaluations: None planned.
Main outputs in 2016:
Policy–related outputs
Description Lead service Indicator Target date Latest known
results
2015/FISMA+/107 FISMA.DDG. Adoption 04/2016 Completed:

fisma_aar_2016_annexes_final Page 80 of 102
Corporate Tax
Transparency
This initiative will contribute
to the achievement of
Specific Objective 2.4 by
exploring whether and how,
by enhancing transparency
with respect to the way
companies manage taxable
profits per jurisdiction and
the related amounts of
corporate income tax paid,
more intense scrutiny by
investors and the public at
large could contribute to the
reduction of tax avoidance by
companies.
B.3 by the
Commiss
ion
Adopted
12/4/2016
2015/FISMA/230
Non-binding guidelines on
methodology for reporting
non-financial information
by certain undertakings
and groups
The non-binding guidelines
on non-financial information
will facilitate the disclosure of
relevant and useful
environmental and social
information by EU companies
concerned, and in particular
by smaller and less
experienced companies.
Thus, this will facilitate the
practical application of the
Directive on disclosure of
non-financial information as
of financial year 2017.
FISMA.DDG.
B.3
Adoption by the
Commiss
ion
11/2016 Planned for Q2 2017
This initiative is still being
analysed.
Main expenditure
outputs
Related to spending programme: Union
programme to support specific activities in the
field of financial reporting and auditing for the
period 2014-2020
Description Lead service Indicator Target date Latest known
results
2015/FISMA/105
Prolongation of the Union
programme to support
specific activities carried
out by the European
Financial Reporting
FISMA.DDG.
B.3
Adoption
by the
Commiss
ion
03/2016
Completed:
Adopted
13/4/2016

fisma_aar_2016_annexes_final Page 81 of 102
Advisory Group (EFRAG)
in the field of financial
reporting for the period
2017-2020
Amending regulation to the
Financing Regulation (EU) No
258/2014 establishing a
Union Programme to support
specific activities in the field
of financial reporting and
auditing for the period of
2014-2020. EFRAG plays a
key role in providing input to
the development of the IFRS
by the IASB and provides the
European Commission with
endorsement advice on new
or amended financial
reporting standards.
Specific objective 2.4: Consumers have access to safe
and reliable insurance, pension and UCITS products and
services, both nationally and across borders.
Related to spending
programme(s) No
Insurance
Result indicator: The gross written premiums over the GDP.
Source of data: EIOPA combined with national statistics.
Baseline
Interim
Milestones
Target
Latest known results
End 2013 2018 2019
According to
the OECD,
insurance
penetration in
the EU (15
countries) in
2013 was
8.2%
A first increase. General increase. A first increase
expected in 2018
Planned evaluations: None planned.
Pension
Result indicator: The number of consumers investing in personal retirement products
across the EU.
Source of data: EIOPA Pensions Database; OECD.
Baseline Interim
Milestones
Target Latest known results
End 2015 2018 2019
Current Interim results General increase in the Interim results available

fisma_aar_2016_annexes_final Page 82 of 102
situation. after
implementation of
the CMU Action
Plan.
number of EU citizens
taking up personal
pension products.
Beyond 2019: should a
private pensions
initiative be developed,
the number of persons
investing in a pan-
European pension
product.
after full
implementation of the
CMU Action Plan.
Planned evaluations: CMU Action Plan, EIOPA annual reports.
UCITS
Result indicator: Share of "true" cross-border UCITS funds (i.e. funds sold in at least 5
Member States) with respect to total number of UCITS funds sold in the EU.
Source of data: Morningstar
Baseline
Target
Latest known
results
2015 2018
While the UCITS framework has been an
overwhelming success story, market
fragmentation (as evidenced by the large
number of individual funds) is an apparent
issue, triggering higher costs and less choice
for investors. The EC will seek to tackle those
factors that hold back cross-border
competition, thereby increasing the number
of UCITS distributed on a "true" cross-border
basis (i.e. measured as UCITS being sold in
at least 5 different MS).
2016
17.72% Stable increase in the share of true cross-
border UCITS funds.
18.7%
Planned evaluations:
Main outputs in 2016:
Policy–related outputs
Description Lead service Indicator Target date Latest known
results
2016/FISMA/013
Possible initiative on
Retail Financial Services
The Action Plan will present,
based on the Green Paper on
retail financial services
(COM(2015) 630 final),
actions which aim tackling
the remaining obstacles to a
fully integrated retail financial
services market across the
EU, harnessing the potentials
of digitization in the retail
FISMA.DDG.
D.3
Adoption
by the
Commission of a
follow-up action plan
Possible follow-up
actions (legislative
or not)
Q3 2016
Q4 2016
Planned
adoption Q1
2017 (Action Plan)

fisma_aar_2016_annexes_final Page 83 of 102
financial services area..
2016/FISMA/005
Regulation establishing a
multi-annual funding of
non-financial industry
interest groups for the
period 2017-2020.
The promotion of end-
user/consumer views in the
context of policy making will
contribute to policies that
integrate the interests of end-
users/consumers and give
them incentive to participate
in the economy.
FISMA.DDG.D.3
Adoption by the
Commission
Q4 2016 Completed:
Adopted
15/6/2016
2016/FISMA/030
Revision of material and
geographic scope of the
Motor Insurance Directive
with the aim to focus only
on traffic related accidents
Following the Vnuk ruling C-
162/13 that extended the
scope of the Motor Insurance
Directive to cover any motor
vehicle under almost any
circumstances, this revision
aims at protecting consumers
(policyholders) of MTPL
insurances across the EU
from the exposure to possibly
having to contribute to
compensations of accidents
that are not traffic related.
FISMA.DDG.D.4
Adoption by the
Commission
Positive
outcome of
the negotiation
s between the EP and
Council
Q2 2016 Postponed to Q2 2017
This initiative is still being
analysed.
Specific objective 2.5: The financial regulatory
framework is evaluated, appropriately implemented and
enforced across the EU.
Related to spending
programme(s) No
Result indicator: Transposition deficit: Percentage of national implementing measures
notified within the regulatory deadline.
Source of data: NIF Database.
Baseline
Interim Milestones Target
Latest
known
results
2015 2017 2018 2020 2016
Only ~30%
of the total
number of
50% 70% Reach between 80 and 100%
(all implementing measures
are notified).
39%

fisma_aar_2016_annexes_final Page 84 of 102
national
implementing
measures are
notified
within the
regulatory
deadline.
Planned evaluations: None planned.
Result indicator: Average time needed to deal with complaints.
Source of data: CHAP Database.
Baseline Interim Milestones Target Latest known
results
2015 2017 2018 2019 2020 2016
The average
time needed
to reach a
decision on a
complaint
(either
closure or
sending of a
letter of
formal notice)
is currently
5.4 months.
Maintain average <12
months
The target is to
maintain an
average time of
<12 months to
reach a decision (as
per Secretariat-
General
Benchmark).
The average time to
close a complaint (with
full closure; transfer to
EU Pilot or NIF is not
included) in 2016 was
13.6 months. This high
number corresponds
to the clean-up done
this year as many old
cases were closed.
The complaints that
were opened and
closed in 2016 had an
average 4.7 months to
close
Planned evaluations: None planned.
Result indicator: Share of infringements for non-communication of transposition of
Directives dealt with within the benchmark.
Source of data: NIF Database.
Baseline
Interim
Milestones
Target Latest known results
2015 201
7
201
8
2019 2016
Non-Communication
cases are considered to
be beyond benchmark
when more than 12
months elapses since a
letter of formal notice is
sent and the case is not
yet closed or sent to
CJEU.
Currently 12% of cases
are considered to be
dealt with within
benchmark.
30% 40% The target is
to reach 50%
of cases dealt
with within
the
benchmark.
56%
FISMA has put in place new
arrangements to speed up the
treatment of non-
communication cases and
reduce the backlog (eg cross-
Units teams, regular
performance reviews, and a
new framework contract to
outsource the completeness
assessment).
At the same time, the results
can also be partly explained by
the nature of the infringement

fisma_aar_2016_annexes_final Page 85 of 102
at stake. While a large number
(117) of new non-
communication cases was
opened in 2016, they could be
dealt with very quickly as
transposition measures were
missing altogether, and
therefore no completeness
assessment was necessary.
Further to the notification of
the national measures, the
handling of the case requires a
more time-consuming
assessment.
Planned evaluations: None planned.
Result indicator: Number of infringements for non-conformity closed within
benchmarks.
Source of data: NIF Database.
Baseline Interim
Milestones
Target Latest known results
2015 2017 2018 2020 2016
No specific benchmark is set
for the non-conformity
assessment. However, a
three-year benchmark is set
for all Article 258 TFEU
infringements. There are
currently 14 cases still open
>3 years since their
registration.
10 5 No cases
open
three
years
after their
registratio
n by
2020.
15 cases in December 2016;
2 cases eventually closed in
February 2017
Compared to the baseline
(14 cases) no substantial
progress appears to be
achieved in 2016 (13 cases
after taking out the 2
already closed in February
2017). This is due to
various reasons. In a
majority of cases the
Commission decided to
pursue infringement
procedures. Some cases are
however likely to be closed
during the course of 2017.
Planned evaluations: None planned.
Main outputs in 2016:
Policy–related outputs
Description Lead service Indicator Target date Latest known
results
2016/FISMA/019
EU Regulatory
Framework for Financial
Services - Report on the
main findings and next
steps resulting from the
FISMA.DDG.B.2
Adoption by the
Commission
Q4 2016 Completed:
Adopted on 23
November 2016

fisma_aar_2016_annexes_final Page 86 of 102
Call for Evidence
This initiative will contribute
to the achievement of the
objective by gathering
feedback from stakeholders
and gauging the cumulative
impact and interaction of
current financial rules.
Through the consultation,
the Commission is seeking
to identify possible
inconsistencies, incoherence
and gaps in financial rules,
as well as unnecessary
regulatory burdens and
factors negatively affecting
long-term investment and
growth.
2016/FISMA/009
Review of the operation
of the ESAs
FISMA.DDG.
01
Adoption
by the
Commiss
ion
Q2 2016
Postponed until
2017
The founding
regulations of
the European
Supervisory
Authorities
("ESAs")
mandate that a
general review
of the operation
of the ESAs
takes place in
2017
Specific objective 2.6: Financial institutions can absorb
losses and liquidity shocks, financial market
infrastructures are stable and function effectively, and
structural and cyclical macro-prudential risks are
proactively addressed.
Related to spending
programme(s) No
Insurance companies
Result indicator: The proportion of the insurance sector, in terms of assets, which
comply with the solvency capital requirements.
Source of data: Solvency II reporting / EIOPA.
Baseline
Interim Milestones Target
Latest
known
results Early 2016 2017 2019
First set of
data based on
End of the transitional period to comply with
the solvency capital requirement (Art.
Near 100%
compliance.
No data
available

fisma_aar_2016_annexes_final Page 87 of 102
Solvency II
available.
308b(14)) of Directive 2009/138/EC). yet
Planned evaluations: The 2018 review of the standard formula will allow an interim
assessment of the effect of the 2015 amendment.
Banks
Result indicator: Average CET1 capital levels in EU banks.
Explanation: The amount of CET1 capital held by banks should be above the minimum
regulatory capital, but this cannot be guaranteed in the crisis situations where the levels
of CET 1 may go below the minimum requirements. The effectiveness of supervisors also
means that banks should hold extra CET1 capital to cover additional risks (Pillar 2
buffer) in order to cover banks risks not covered by the minimum regulatory
requirements. However, a fast increase in the capital ratios, unless new equity is raised
in the markets, in short term may reduce lending to the economy in the short-term and
thus is not desirable.
Source of data: Semi-annual EBA Basel III monitoring reports.
Baseline
Interim Milestones Target
Latest known results
2016 2017 2018 2019 End 2015
End 2011:
6.9%
End 2012:
8.4
>8.125% >8.75 % >9.375
%
>10% 12.4%
European banks, under the
strong pressure from
European and national
supervision, are strongly
increasing their capital
positions.
Planned evaluations: None planned.
Result indicator: Average leverage ratio in EU banks.
Complemented by the capital ratios, the leverage ratio provides a better picture of bank
resilience to crisis events. The target will have to be reviewed at the end of 2016 on the
basis of the analysis made by the European Commission.
Source of data: Semi-annual the EBA Basel III monitoring reports.
Baseline
Interim Milestone Target
2019
Latest
known
results
2016 2017 2018
End 2011:
2.9%
End 2012:
2.9%
>3% >3% >3% >3% 4.7% (end
2015)
Planned evaluations: None planned.
Result indicator: Average TLAC in G-SIBs.
The Financial Stability Board (FSB) on 9 November 2016 issued the final Total Loss-
Absorbing Capacity (TLAC) standard for global systemically important banks (G-SIBs).
The TLAC standard has been designed so that failing G-SIBs will have sufficient loss-
absorbing and recapitalisation capacity available in resolution for authorities to
implement an orderly resolution that minimises impacts on financial stability, maintains
the continuity of critical functions, and avoids exposing public funds to loss.
Source of data: Semi-annual EBA Basel III monitoring reports.
fisma_aar_2016_annexes_final Page 88 of 102
Baseline
Interim Milestone Target
Latest known results
End 2014 2019 20209
Unknown > 16% >18% FSB TLAC Impact Assessment
November 2015: 29 G-SIBs
had an average eligible
external TLAC ratio of 13.1%
RWA and 7.2% of the
exposure measure (EM) of
the Basel III leverage ratio
(refer to Case 1 of the BCBS
QIS)
Planned evaluations: None planned.
Result indicator: Probability of simultaneous default by two or more large and complex
banking groups.
Source of data: ESRB Risk Dashboard: Daily, EU (changing composition), Simultaneous
default of two or more large banks, Probability - RDF.D.D0.Z0Z.4F.EC.DFTLB.PR
Baseline Interim Milestones Target
Latest
known
results Range 2010-
2014
2015 2016 2019
7% <5% in normal
times
<20% in stress
times
<5% in normal times
<20% in stress times
<5% in
normal times
<20% in
stress times
2.53%
Planned evaluations: None planned.
Financial market infrastructures
Result indicator: Percentage of settlement fails (weighted average by settlement
volume).
Source of data: European Securities Markets Authority (ESMA) will report on the
number of settlement fails (legal requirement in CSDR).
Baseline Target Latest known
results 2012 2020
1.09%. Source of this baseline is the
European CDS Association. After the
technical standards enter into force and
the reporting elements are applicable
(estimated: in 2018) there will be a legal
obligation to report on this indicator.
Downward trend in
settlement fails.
No data available
yet.
Planned evaluations: None planned.
Macro-prudential measures
Result indicator: Number of notifications of macro-prudential measures, both in and
outside EU Law, with material effects, implemented by Competent Authorities (micro-
prudential authorities of the MS)/Designated Authorities (macroprudential authorities of
the MS).
9 This will be progress towards a 2022 FSB target.

fisma_aar_2016_annexes_final Page 89 of 102
Source of data: ESRB
Baseline
Target
Latest known
results
2015 September 2019 2016 December
179 measures notified to the ESRB. All mandatory
measures notified to
the ESRB and
implemented
effectively; all
measures requiring
mandatory recognition
notified and
implemented
effectively. A positive
trend versus the
baseline of measures
implemented, as
warranted by the
evolution of macro-
prudential risks.
332 measures
notified to the
ESRB (of which
207 economically
significant
measures)
Planned evaluations: None planned.
Main outputs in 2016:
Policy–related outputs
Description Lead service Indicator Target date Latest known
results
2013/MARKT/011,
COM/2013/0641
Benchmarks Regulation
Major benchmarks such as
Libor or Euribor are being
used in financial
instruments and contracts
worth hundreds of billion
euros. Their manipulation
could result in the
frustration of many
contracts and a loss of
trust in the related
financial instruments.
FISMA.DDG.
C.3
Final
adoption
by co-
legislators
06/2016 Completed:
Adopted by co-
legislators on
08/06/2016
2015/FISMA/042
International
agreement on access to
data held in trade
repositories
The G20 committed to
addressing "legal barriers
to the reporting of OTC
derivatives contracts to
trade repositories and to
the cross-border access of
FISMA.DDG.
C.2
Adoption
by the
Commissi
on
Q2/2016 Postponed to
02/2018
No country has
expressed
interest in
concluding an
agreement with
the EU (too
burdensome).

fisma_aar_2016_annexes_final Page 90 of 102
authorities to trade
repository data, as well as
to improve the usability of
that data." An
international agreement
will enable direct access to
trade repositories by 3rd
country authorities.
2016/FISMA/004
Possible initiative
resulting from the
EMIR review
The Commission is
mandated to review
regulation 648/2012, to
produce appropriate
legislative proposals. EMIR
aims to improve the
stability, transparency and
efficiency of derivatives
markets. The EMIR review
is assessing what, if any,
measures are needed to
contribute to achieve those
goals.
FISMA.DDG.
C.2
Adoption
by the
Commission
12/2016 Postponed to Q2
2017
Item delayed due
to the need to analyse the
information received in the
context of the call for evidence.
COM /2013/0615
Money Market Funds
Regulation (MMFs)
The proposed regulation
introduces rules that will
make the MMFs more
resilient to future financial
crisis and at the same time
secure their financing role
for the economy. The
absence of EU rules
relating to Money Market
Funds is a critical gap that
could negatively affect
financial stability.
FISMA.DDG.
C.4
Council
General Agreemen
t (Dependin
g on the timeline /
completion of the
trilogues)
12/2016 Completed:
Trilogues were successfully
concluded on 8 December.
Publication in OJ foreseen for
April.
2015/FISMA/003+
Delegated &
Implementing Acts on
MAR
By further specifying the
Regulation on Market
Abuse that prohibits
market manipulation and
insider dealing, these acts
FISMA.DDG.C.3
Adoption by the
Commission
Q1 2016 7 RTS and 5 ITS
adopted in Q1 as
expected (or
earlier).
fisma_aar_2016_annexes_final Page 91 of 102
will contribute to the
general objective of a
fairer internal market,
strengthening market
integrity and investor
protection.
2015 / FISMA / 154, COM/2015/ 648
Extension of exemptions for
commodity dealers The CRD / CRR impose
prudential capital
requirements and large
exposure limits on
investment firms but
exempt "commodity
dealers". Commodity
dealers can be specialised
investment firms that
provide investment
services or deal with
derivative contracts
exclusively in relation to
commodities or ancillary
services to energy and
commodity producing
companies. The overall
investment firms review
currently undertaken by
the Commission is the
most appropriate project
to define a proportionate
prudential treatment for
the broad and diverse
spectrum of "commodity
dealers". However the
investment review and
possible legislative
proposals will not be ready
by the end of current
exemption period of
"commodity dealers" by
end 2017. To provide
legal certainty and
regulatory stability the
Commission proposes to
extend the current
exemption for commodity
dealers until end 2020 by
when a proportionate
effective prudential
FISMA.DDG.D.1
Final adoption
by co-legislators
Q2 2016 Completed:
Adopted by co-
legislators: 29/06/2016

fisma_aar_2016_annexes_final Page 92 of 102
framework can be
expected to be in place.
2015/FISMA/079 Review of the Single
Supervisory Mechanism The SSM regulation lists a
number of issues to assess
the effectiveness of the SSM supervision and its
implications for the smooth functioning of the single
market. An effective and common supervisory
function will contribute to a financial system that is
safe and resilient and
where financial institutions can absorb losses and
liquidity risks. The report constitutes a key
deliverable for DG FISMA in 2016.
FISMA.DDG.D.1
Adoption by the
Commission
Q3 2016 Postponed to Q2 2017
This initiative is still being
analysed.
2016/FISMA/014 Possible legislative
proposal amending CRR to incorporate
modifications to the BASEL framework
The Basel Committee has adopted/is considering
certain changes to the
Basel framework (e.g. Net Stable Funding Ratio,
Leverage Ratio). The Commission will need to
decide whether to incorporate those changes
in the CRR. Furthermore, the CRR mandates various
reviews which may lead to
targeted changes to the CRR.
Net-stable-funding ratio ensures that banks have
adequate level of stable funding and thus it
reduces liquidity shocks. Leverage ratio ensures the
minimum amount of loss
absorbing capacity in any bank notwithstanding their
riskiness.
FISMA.DDG.D.1
Adoption by the
Commission
Q4 2016 Completed: Adopted on
23/11/2016
2014/MARKT; COM/2014/043
Banking Structural
Reform (BSR) The BSR is complementing
FISMA.DDG.D.2
Final adoption
by co-
legislators
Q4 2016 No tangible adoption
prospect.
Negotiations in European

fisma_aar_2016_annexes_final Page 93 of 102
the CRD/CRR framework
to deal more specifically with risks stemming from
trading activities. It broadens supervisory
powers to ensure that
large banks can withstand financial stress.
Parliament are
not progressing.
2015/FISMA/084
2016/FISMA/072 Review of the EU
macro-prudential
framework – possible report to Council/EP
preceding legislative proposal
The review of the ESRB and the wider macro-
prudential framework is provided for in the
respective legislative texts
and has been addressed in the President’s mandate
letter to Commissioner Hill and the Five Presidents'
Report.
The objective is to review
the macro-prudential legislative framework in a
way allowing authorities in
charge to better address systemic risk to financial
stability (review of the macro-prudential
instruments; the governance structure and
the ECB/SSM's role in macro-prudential
oversight).
FISMA.DDG.
E.3
Adoption
by the Commissi
on
Q4 2016
Postponed to Q3
2017
Political
developments caused the delay
of starting the public
consultations of the macro-
prudential review.
2015/FISMA/245
Delegated and Implementing
Regulations concerning CRDIV/CRR on the
identification
methodology for global systemically important
institutions (G-SIIs) and uniform format and
dates for the disclosure by G-SIIs
The framework as such forms part of the higher
own funds requirements
for G-SIIs under CRD IV in order to compensate for
the higher risk that G-SIIs
FISMA.DDG.
E.3
Adoption
by the Commissi
on
Q1 2016 Completed:
Adopted
17/5/2016

fisma_aar_2016_annexes_final Page 94 of 102
represent for the financial
system and the potential impact of their failure on
taxpayers.
2015/FISMA/240
Delegated Regulation concerning Directive
2014/59/EU – Exclusion from bail-in
(Article 44 (11) of the BRRD)
The details in this
Delegated Regulation will ensure that the general
BRRD criteria for exclusions will be applied
by the national resolution authorities and the Single
Resolution Board (SRB) in a consistent manner. This
will increase legal certainty
and predictability for investors and resolution
authorities in future resolution cases.
FISMA.DDG.
E.4
Adoption
by the Commissi
on
02/2016 Completed:
Adopted 4/2/2016
2015/FISMA/206
Delegated Act pursuant
to Article 2 (2) and Article 104 (4) of
Directive 2014/0059/EU (BRRD)
The continuity of critical functions and core
business lines is essential to safeguard financial
stability and to preserve
the real economy. BRRD allows resolution
authorities to exclude certain liabilities from bail
in, and pass the losses on to other creditors, if it is
strictly necessary and proportionate to achieve
the continuity of critical
functions and core business lines. These
functions should be identified by the resolution
authority in the resolution plans. BRRD requires the
Commission to specify the criteria for resolution
authorities to determine
these "critical functions" and "core business lines".
This will ensure legal
FISMA.DDG.
E.4
Adoption
by the
Commission
02/2016 Completed:
Adopted
2/2/2016

fisma_aar_2016_annexes_final Page 95 of 102
certainty and predictability
for investors, contribute to financial stability and
ensure a level playing field within the EU.
2015/FISMA/157 PLAN/2017/804
Delegated Act pursuant to Article 65(5) of
Regulation (EU) No 806/2014 of SRMR
The Single Resolution
Mechanism gives to the Single Resolution Board
planning and crisis management powers and a
Single Resolution Fund in order to ensure the
continuity of critical functions in the banking
sector, preserve financial
stability and protect public funds. This delegated act
will ensure that the Single Resolution Board has the
budgetary independence to operate its functions
without relying on public resources.
FISMA.DDG.E.RTF
Adoption by the
Commission
05/2016
Planned adoption Q3/2017
This initiative is
still being analysed.
2015/FISMA/095 Delegated Act I
pursuant to Article 76 (4) of Directive
2014/0059/EU (BRRD)
The initiative is specifying
rules and definitions to be
applied by the Resolution Authority to the following
classes of arrangements, in case of a partial
property transfer of assets, rights and liabilities of an
institution under resolution or in the event of forced
contractual modifications:
security arrangements; set-off arrangements;
netting arrangements; structured financing
arrangements, including securitisations and
instruments used in issuances of covered
bonds. The aim of this
protection is to prevent, when a partial transfer or
FISMA.DDG.E.4
Adoption by the
Commission
03/2016 Completed:
Adopted
18/3/2016

fisma_aar_2016_annexes_final Page 96 of 102
a contractual modification
has been done, the splitting of assets rights
and liabilities which are linked by virtue of certain
arrangements, when such
linkage is justified by a lawful objective.
2016/FISMA/006
TLAC implementation and MREL review
In view of the fact that
both MREL and TLAC aim at achieving the same
policy objective which is to ensure that banks hold a
sufficient amount of bail-in-able liabilities that
would allow for smooth and quick absorption of
losses and bank
recapitalisation, this initiative aims at
combining the review of MREL (in accordance with
the mandate given to the Commission under Article
45(18) of the BRRD) with the implementation of the
international TLAC
standard.
FISMA.DDG.
E.4
Adoption
by the Commissi
on
By Q4 2016 Completed:
Adopted on 23/11/2016
2015/FISMA/029 Legislation on the
recovery and resolution of central
counterparties
A proposal on the recovery and resolution of central
counterparties (CCPs) was signalled in the
Commission 2015 work programme. This followed
the adoption of a comprehensive EU
recovery and resolution
framework for banks and investment firms. The
Commission proposal for a Regulation sets out
provisions similar to those in the framework
applicable to banks and investment firms to
facilitate orderly recovery
and resolution, adapting them to the specific
features of CCPs’ business
FISMA.DDG.E.4
Adoption by the
Commission
Q3/Q4 2016
Completed:
Adopted on
28/11/2016

fisma_aar_2016_annexes_final Page 97 of 102
models and the risks they
incur, including by determining how losses
would be shared in scenarios where CCPs’
existing pre-funded
resources required under EMIR are exhausted.
fisma_aar_2016_annexes_final Page 98 of 102
General objective 3: A Deeper and Fairer Economic and Monetary Union.
Impact indicator: Composite Indicator of Systemic Stress (CISS) Explanation: CISS measures the state of instability in the euro area financial system. It
comprises 15 mostly market-based financial stress measures split into five categories: financial intermediaries sector, money markets, equity markets, bond markets and
foreign exchange markets. It is unit-free and constrained to lie within the interval (0, 1).
Source of the data: European Central Bank
Baseline Target Latest known
results
(Average range 2010-2014) 2020 2016
0.25 in normal times
0.8 in a crisis mode
Stable trend 0.05
Planned evaluations: None planned.
Specific objective 3.1: The market exit of a non-major
financial institution has a limited economic impact in
the euro area.
Related to spending
programme(s) No
Result indicator: Correlation between sovereign and banking CDS. Synthetic CDS
series will be used for the euro area.
Source of data: Data available from Bloomberg: Markit Itraxx senior financial 5-year
CDS; Markit Itraxx 5-year SovX for Western Europe. Data on exit events to be provided
by SRB, ESAs.
Baseline Interim Milestones Target
Latest
known
results End 2014 2015 2016 2020
0.8 0.7 0.6 0.6
The
correlation
between
bank risk and
sovereign
risk should
decline, i.e.
bank risks
should
decouple
from
sovereign
risks.
0.514
Planned evaluations: None planned.
Result indicator: The Single Resolution Fund is built and becomes operational
according to plan.
Source of data: SRB. If available, data will also be sourced from MS not participating in
the Banking Union.
Baseline Interim Milestones Target
Latest known
results
End 2014 2016 2017 2018 2016
Tentatively
EUR 6.8bn
EUR 6.8bn EUR 13.6bn EUR 20.4bn
Operational as of
By 1 January
2024, the
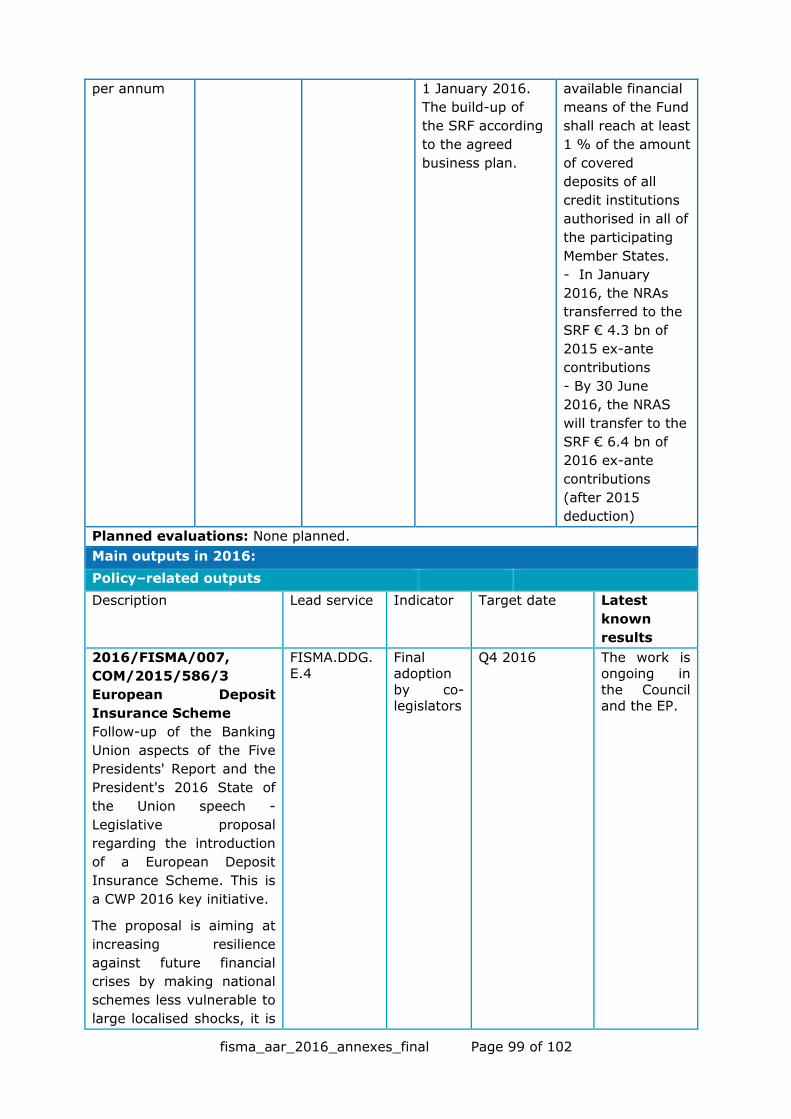
fisma_aar_2016_annexes_final Page 99 of 102
per annum 1 January 2016.
The build-up of
the SRF according
to the agreed
business plan.
available financial
means of the Fund
shall reach at least
1 % of the amount
of covered
deposits of all
credit institutions
authorised in all of
the participating
Member States.
- In January
2016, the NRAs
transferred to the
SRF € 4.3 bn of
2015 ex-ante
contributions
- By 30 June
2016, the NRAS
will transfer to the
SRF € 6.4 bn of
2016 ex-ante
contributions
(after 2015
deduction)
Planned evaluations: None planned.
Main outputs in 2016:
Policy–related outputs
Description Lead service Indicator Target date Latest
known
results
2016/FISMA/007,
COM/2015/586/3
European Deposit
Insurance Scheme
Follow-up of the Banking
Union aspects of the Five
Presidents' Report and the
President's 2016 State of
the Union speech -
Legislative proposal
regarding the introduction
of a European Deposit
Insurance Scheme. This is
a CWP 2016 key initiative.
The proposal is aiming at
increasing resilience
against future financial
crises by making national
schemes less vulnerable to
large localised shocks, it is
FISMA.DDG.E.4
Final adoption
by co-legislators
Q4 2016 The work is ongoing in
the Council and the EP.

fisma_aar_2016_annexes_final Page 100 of 102
also contributing to
severing the link between
banks and their home
sovereign.
Specific objective 3.2: Risk in the banking sector is
reduced.
Related to spending
programme(s) No
Result indicator: Banks' contribution to overall systemic risk.
Source of data: ECB Statistical Data Warehouse
(RDE.D.D0.Z0Z.DE.EC.SRCB_COVAR.5P. More details:
http://sdw.ecb.europa.eu/reports.do?node=1000003357
Baseline Target Latest known
results
2015 2020 2016
The average was approximately 5% Not in excess of 5% Close to 0%
(based on
financial
intermediation -
original series is
discontinued)
Planned evaluations: None planned.
Result indicator: Average TLAC in G-SIBs.
The Financial Stability Board (FSB) on 9 November 2016 issued the final Total Loss-
Absorbing Capacity (TLAC) standard for global systemically important banks (G-SIBs).
The TLAC standard has been designed so that failing G-SIBs will have sufficient loss-
absorbing and recapitalisation capacity available in resolution for authorities to
implement an orderly resolution that minimises impacts on financial stability, maintains
the continuity of critical functions, and avoids exposing public funds to loss.
Source of data: Semi-annual EBA Basel III monitoring reports.
Baseline Interim Milestone Target Latest known results
End 2014 2019 202010 End 2015
Unknown > 16% >18% FSB TLAC Impact
Assessment November
2015: 29 G-SIBs had an
average eligible external
TLAC ratio of 13.1% RWA
and 7.2% of the exposure
measure (EM) of the Basel
III leverage ratio (refer to
Case 1 of the BCBS QIS)
Planned evaluations: None planned.
Result indicator: Average CET1 capital levels in EU banks.
Source of data: Semi-annual EBA Basel III monitoring reports.
Baseline
Interim Milestones Target Latest
known
results
10 This will be progress towards a 2022 FSB target.

fisma_aar_2016_annexes_final Page 101 of 102
2016 2017 2018 2019 End 2015
End 2011:
6.9%
End 2012:
8.4
>8.125% >8.75 % >9.375% >10% 12.4%
Planned evaluations: None planned.
Result indicator: Average leverage ratio in EU banks.
Complemented by the capital ratios, the leverage ratio provides a better picture of bank
resilience to crisis events. The target will have to be reviewed at the end of 2016 on the
basis of the analysis made by the European Commission.
Source of data: Semi-annual the EBA Basel III monitoring reports.
Baseline Interim Milestone Target Latest
known
results
2016 2017 2018 2019 End 2015
End 2011:
2.9%
End 2012:
2.9%
>3% >3% >3% >3% 4.7%
Planned evaluations: None planned.
Main outputs in 2016:
Policy–related outputs
Description Lead service Indicator Target date Latest
known results
2016/FISMA/006
TLAC implementation
and MREL review
In view of the fact that
both MREL and TLAC aim
at achieving the same
policy objective which is to
ensure that banks hold a
sufficient amount of bail-
in-able liabilities that
would allow for smooth
and quick absorption of
losses and bank
recapitalisation, the
proposal is combining the
review of MREL (in
accordance with the
mandate given to the
Commission under Article
45(18) of the BRRD) with
the implementation of the
international TLAC
standard.
FISMA.DDG.E.4
Adoption by the
Commission
By Q4 2016
Completed:
Adopted on
22/11/2016
2016/FISMA/014
Possible legislative
FISMA.DDG. Adoption by the
Q4 2016 Completed:

fisma_aar_2016_annexes_final Page 102 of 102
proposal amending CRR
to incorporate
modifications to the
BASEL framework
The Basel Committee has
adopted/is considering
certain changes to the
Basel framework (e.g. Net
Stable Funding Ratio,
Leverage Ratio). The
Commission will need to
decide whether to
incorporate those changes
in the CRR. Furthermore,
the CRR mandates various
reviews which may lead to
targeted changes to the
CRR.
Net-stable-funding ratio
ensures that banks have
adequate level of stable
funding and thus it
reduces liquidity shocks.
Leverage ratio ensures the
minimum amount of loss
absorbing capacity in any
bank notwithstanding their
riskiness.
D.1 Commissi
on
Adopted on
23/11/2016