annex 6.2.3 hvdc converter/hvac substation flood risk ... · hvdc converter/hvac substation flood...
TRANSCRIPT
Environmental Statement
Volume 6 – Onshore
Annex 6.2.3
HVDC converter/HVAC substation Flood Risk Assessment
PINS Document Reference: 7.6.2.3
APFP Regulation 5(2)(a)
January 2015

sdf
i
SMart Wind Limited
Hornsea Offshore Wind Farm
Project Two – Environmental Statement
Volume 6 - Onshore
Annex 6.2.3 – HVDC converter/HVAC substation Flood Risk Assessment
SMart Wind Limited
11th Floor
140 London Wall
London
EC2Y 5DN
Tel 0207 7765500
Email [email protected]
Copyright © 2015.
All pre-existing rights reserved.
Liability
This report has been prepared by RPS, with all reasonable skill, care and diligence within the terms of their contracts with SMart Wind Ltd or their subcontractor to RPS placed under RPS’ contract with SMart Wind Ltd as the case maybe.
Document release and authorisation record
PINS document reference 7.6.2.3
Report number UK06-050700-REP-0019
Date January 2015
Company name SMart Wind Limited
sdf
ii
Table of Contents
1 Introduction .......................................................................................................................... 1
1.1 Background ........................................................................................................... 1
1.2 Project Scope ....................................................................................................... 1
1.3 Report Structure ................................................................................................... 1
2 Information Sources ............................................................................................................. 2
3 Hydrological Review ............................................................................................................ 3
3.1 Introduction ........................................................................................................... 3
3.2 Existing Site .......................................................................................................... 3
3.3 Proposed Development ........................................................................................ 3
3.4 Flood Risk Assessment ........................................................................................ 3
3.5 Surface Water (Pluvial) flooding ........................................................................... 5
3.6 Reservoir Failure Assessment .............................................................................. 5
3.7 Sewer/Water Main Failure Assessment ................................................................ 5
3.8 Historic Flooding ................................................................................................... 5
3.9 Flood Documentation ............................................................................................ 5
4 Flood Risk Management ...................................................................................................... 6
4.1 Site Vulnerability ................................................................................................... 6
4.2 Sequential Test ..................................................................................................... 6
4.3 Existing and Planned Flood Defence Measures ................................................... 6
4.4 Assessment of Surface Water and Drainage ........................................................ 7
4.5 Drainage Strategy ................................................................................................. 8
5 Summary and Conclusions ................................................................................................ 11
5.1 Summary ............................................................................................................ 11
5.2 Flood Risk ........................................................................................................... 11
5.3 Conclusion .......................................................................................................... 11
References ............................................................................................................................... 12
Table of Figures
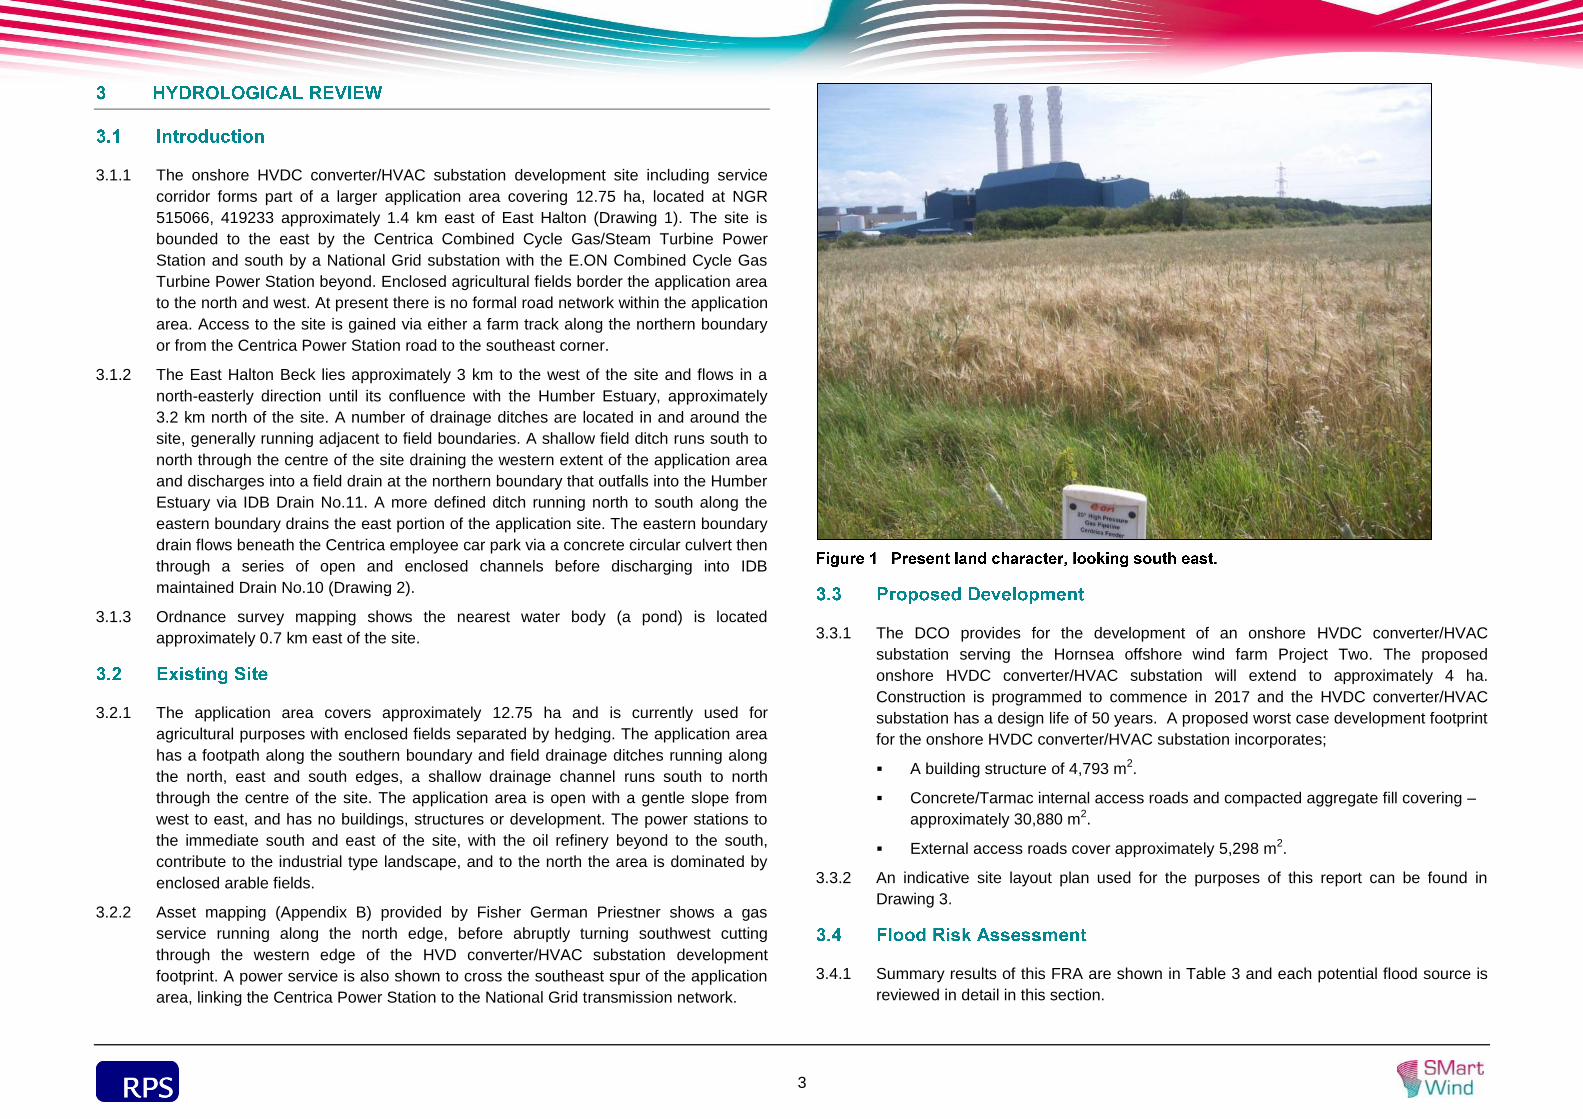
Figure 1 Present land character, looking south east. .......................................................... 3
Table of Tables
Table 1 Information sources consulted during preparation of the report. ............................2
Table 2 EA rainfall and river flow climate change allowances. ............................................2
Table 3 Potential risk posed by flooding sources to the built development. ........................4
Table 4 Flood risk vulnerability and flood zone ‘compatibility’ as identified in Table 3 of the Planning Practice Guidance ID7 to the NPPF. .......................................................6
Table 5 Runoff characteristics. ............................................................................................9
Table of Appendices of Annex 6.2.3
Appendix A Environment Agency and Drainage Board Information
Appendix B Asset Plan
Appendix C WinDes Calculations
Appendix D Jacobs Drainage Strategy
Table of Drawings
Drawing 1 Site Location Plan ................................................................................................ 14
Drawing 2 Surface Water Drainage Plan .............................................................................. 15
Drawing 3 Proposed Site Layout ........................................................................................... 16
Drawing 4 EA Flood Zone Map ............................................................................................. 17
Drawing 5 Environment Agency Flood Hazard Map: Year 2115 Scenario 0.1% (1 in 1000) . 18
Drawing 6 North Lincolnshire SFRA Map .............................................................................. 19
sdf
iii
Glossary
Term Definition
Drainage Board (DB)
Drainage Boards are an integral part of water level management in the UK. Each IDB is a local public authority established in areas of special drainage need in England and Wales. They have permissive powers to manage water levels within their respective drainage districts. They undertake works to reduce flood risk to people and property and manage water levels to meet local needs.
Exception Test
The Exception Test ensures that development is permitted in flood risk areas only in exceptional circumstances and when strict qualifying conditions have been met. It is carried out if the Sequential Test demonstrates that a development cannot be located in areas of low flood risk.
Flood Zone 1 This zone comprises land assessed as having a less than 1 in 1,000 annual probability of river or sea flooding (<0.1%).
Flood Zone 2
This zone comprises land assessed as having between a 1 in 100 and 1 in 1,000 annual probability of river (1%-0.1%), or between a 1 in 200 and 1 in 1,000 annual probability of sea flooding (0.5% - 0.1%) in any year.
Flood Zone 3 This zone comprises land assessed as having between a 1 in 100 or greater annual probability of river (>1%), or a 1 in 200 or greater annual probability of sea flooding (>0.5%).
Geology The scientific study of the origin, history and structure of the earth.
Ground conditions An assessment of the history and chemical and physical characteristics of the soil conditions at a site.
Groundwater All water which is below the surface of the ground in the saturated zone and in direct contact with the ground or subsoil.
Groundwater Directive
Directive 2006/118/EC of the European Parliament and of the Council of 12 December 2006 on the protection of groundwater against pollution and deterioration.
Hydrology The study of the movement, distribution, and quality of water.
Hydrogeology The branch of geology dealing with the waters below the earth’s surface and with the geological aspects of surface waters.
Term Definition
Lead Local Flood Authority
Lead Local Flood Authorities have responsibility for developing a Local Flood Risk Management Strategy for their area covering local sources of flooding. The local strategy produced must be consistent with the national strategy. It will set out the local organisations with responsibility for flood risk in the area, partnership arrangements to ensure co-ordination between these, an assessment of the flood risk and plans and actions for managing the risk.
Main River The name of a water course for which the Environment Agency has permissive powers in relation to their management.
Ordinary Watercourse
The name of a water course for which the local Drainage Board or Lead Local Flood Authority has permissive powers in relation to their management or owned and maintained by private land owners.
Sequential Test A Sequential Test aims to steer new development to areas with the lowest probability of flooding by recommending that development is not allocated if there are reasonably available sites appropriate to the proposed development in areas with a lower probability of flooding.
Source Protection Zones
Source Protection Zones are defined by the Environment Agency for groundwater sources such as wells, boreholes and springs used for public water supply. The zones indicate the level of sensitivity to contamination from activities that might cause pollution.
Treated Effluent Water that has received primary, secondary or advanced treatment to reduce its pollution or health hazards and is subsequently released from a wastewater facility after treatment.
Undefended Flood Zone
Environmental Agency mapped river and sea flood water extents ignoring the presence of flood defences.
Unproductive Strata Drift or bedrock strata which are generally unable to support abstractions greater than10 m3.d-1 and are unlikely to provide significant baseflow. Formerly ‘non-aquifers’.
Water Framework Directive (WFD)
Directive 2000/60/EC of the European Parliament and of the Council of 23 October 2000 establishing a framework for Community action in the field of water policy.
sdf
iv
Acronyms
Acronym Full term
BGS British Geological Survey
Ciria Construction Industry Research and Information Association
DB Drainage Board (specifically North East Lindsey Drainage Board and Lindsey March Drainage Board)
DECC Department of Energy and Climate Change
DEFRA Department for Environment Food and Rural Affairs
DMRB Design Manual for Roads and Bridges
EA Environment Agency
EMP Environmental Management Plan
FRA Flood Risk Assessment
HDD Trenchless Technique (e.g. Horizontal Directional Drilling)
HFRMS Humber Flood Risk Management Strategy
HVAC High Voltage Alternating Current
HVDC High Voltage Direct Current
LPA Local Planning Authority
LLFA Lead Local Flood Authority
l.s-1 Litres per Second (unit volume over time)
l.s-1.ha-1 Litres per Second per Hectare (unit volume, time and area)
LM DB Lindsey Marsh Drainage Board
m AOD Metres Above Ordnance Datum (unit height)
mg.l-1 Milligrams per Litre (unit concentration)
NEL DB North East Lindsey Drainage Board
NPPF National Planning Policy Framework
NPS National Planning Statement
NSIP Nationally Significant Infrastructure Project
Acronym Full term
PPG Planning Practice Guidance
RQO River Quality Objective
SFRA Strategic Flood Risk Assessment
SuDS Sustainable Drainage Systems
TT Trenchless techniques (HDD, thrust boring, auger boring, pipe ramming)
WFD Water Framework Directive
sdf
1
At the request of SMart Wind Limited, RPS Planning and Development Ltd (RPS) has 1.1.1
carried out this site-specific Flood Risk Assessment (FRA) in accordance with the
guidance in the Overarching National Policy Statement for Energy (NPS) EN-1 Section
5.7, the National Planning Policy Framework (NPPF) and associated Planning
Practice Guidance ID7: Flood Risk and Coastal Change, which covers the
requirements in respect of Nationally Significant Infrastructure Projects.
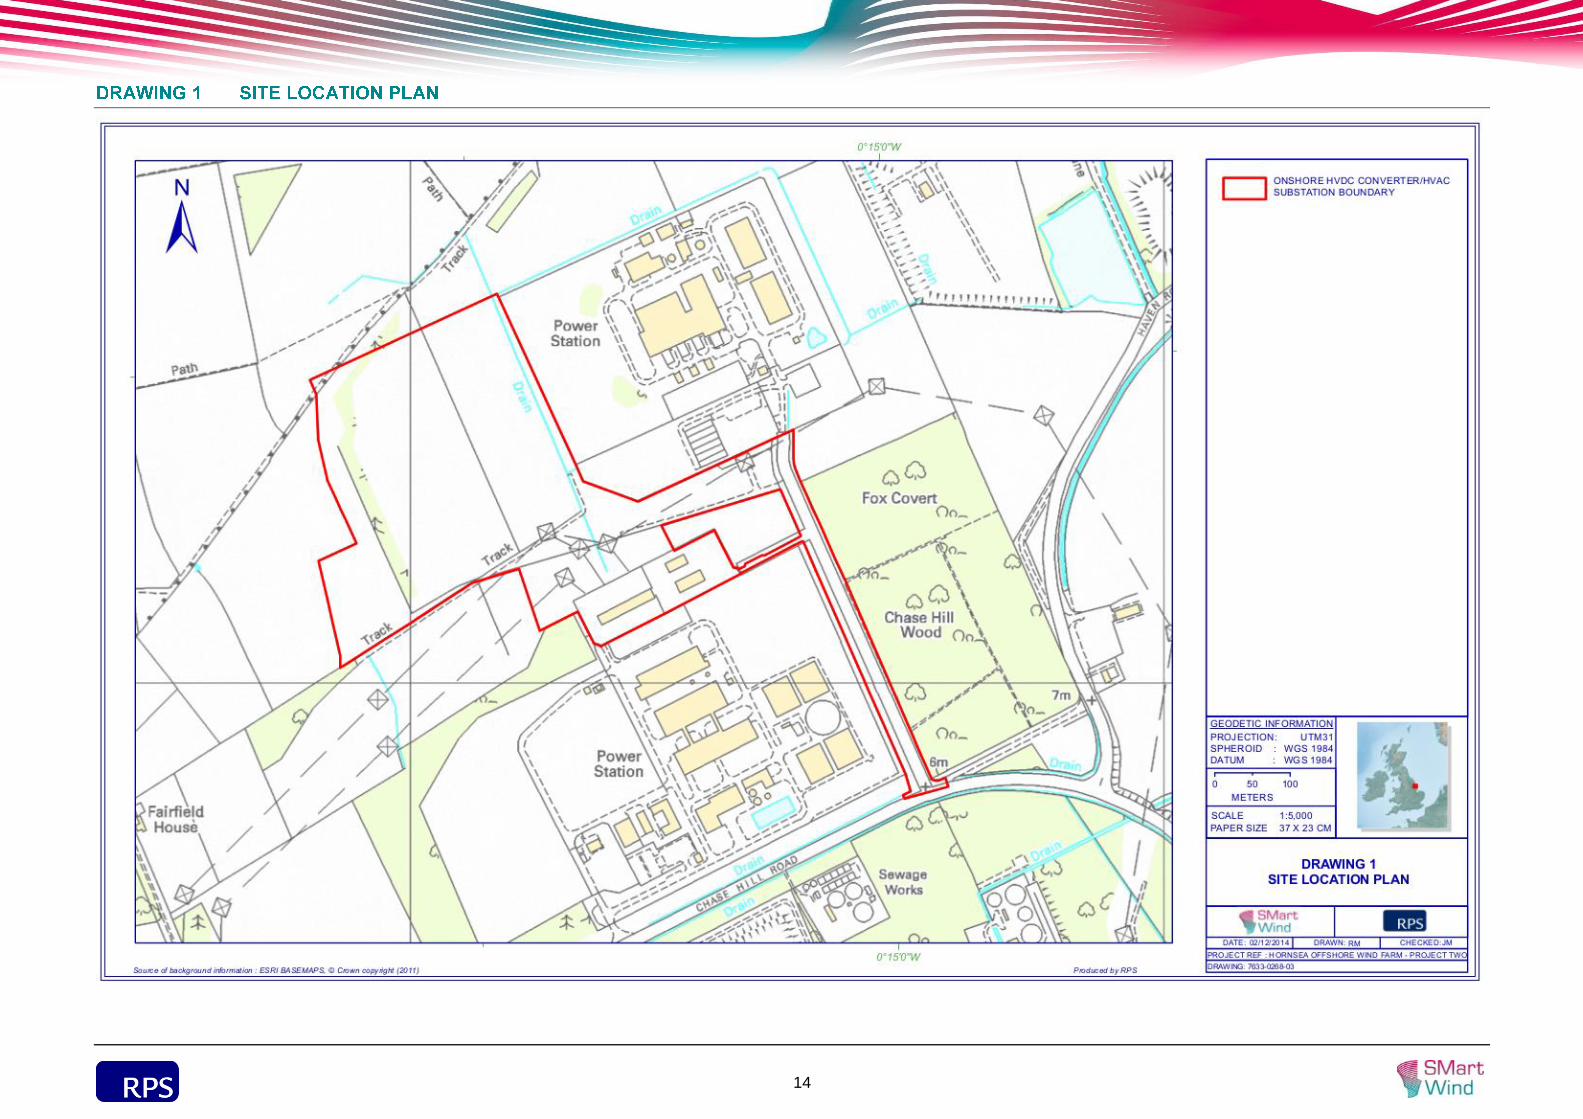
It covers the development of an onshore HVDC converter/HVAC substation on a 1.1.2
broadly rectangular shaped parcel of land 4 ha in area located in the northern part of
the parish of North Killingholme and to the east of the village of East Halton. The site
is immediately north of the E.ON Killingholme Power Station and National Grid’s
Killingholme high voltage substation. The site is to the west of the Centrica
Killingholme Power Station, at NGR: 515066, 419233 (Drawing 1).
This FRA supports the Development Consent Order (DCO) application for the 1.1.3
Hornsea offshore wind farm Project Two under the Planning Act 2008. It also forms
part of the Hornsea Project Two Environmental Statement Volume 3.
Developments that are designed without regard to flood risk may endanger lives, 1.1.4
damage property, cause disruption to the wider community, damage the environment,
be difficult to insure and require additional expense on remedial works. Industry
guidance on development and flood risk identifies several key aims for a development
to ensure that it is sustainable in flood risk terms. These aims are as follows:
The development should not be at a significant risk of flooding and should not be
susceptible to damage due to flooding;
The development should not be exposed to flood risk such that the health, safety
and welfare of the users of the development, or the population elsewhere is
threatened;
Normal operation of the development should not be susceptible to disruption as a
result of flooding;
Safe access to and from the development should be possible during flood events;
The development should not increase flood risk elsewhere;
The development should not prevent safe maintenance of watercourses or
maintenance and operation of flood defences;
The development should not be associated with an onerous or difficult operation
and maintenance regime to manage flood risk. The responsibility for any
operation and maintenance required should be clearly defined;
Future users of the development should be made aware of any flood risk issues
relating to the development;
The development design should be such that future users will not have difficulty
obtaining insurance or mortgage finance, or in selling all or part of the
development, as a result of flood risk issues;
The development should not lead to degradation of the environment; and
The development should meet all of the above criteria for its entire lifetime,
including consideration of the potential effects of climate change.
The FRA is undertaken with due consideration of these sustainability aims. 1.1.5
The key objectives of the FRA are: 1.1.6
To assess the flood risk to the proposed development and to demonstrate the
feasibility of appropriately designing the development such that any residual flood
risk to the development and its users would be acceptable;
To assess the potential impact of the proposed development on flood risk
elsewhere and to demonstrate the feasibility of appropriately designing the
development such that the development would not increase flood risk elsewhere;
and
To satisfy the requirements of the NPS, the NPPF, Planning Practice Guidance
ID7 – Flood Risk and Coastal Change, the Planning Act 2008 and DCO
application guidance insofar as they require FRAs to be submitted in support of
DCO applications.
In order to achieve the aims outlined above a staged approach has been adopted in 1.2.1
undertaking this FRA in accordance with current best practice. First, a screening
study has been undertaken to identify whether there are any potential sources of
flooding at the site, which may warrant further consideration. Second, any potential
flooding issues identified in the screening study have been considered in this FRA.
The aim of the FRA is to review all available information and provide a qualitative
assessment of the flood risk to the site and the impact of the site on flood risk
elsewhere.
This FRA has the following structure: 1.3.1
Section 2 identifies the sources of information that have been consulted in
preparation of the report;
Section 3 is a hydrological review of the site and of the modelling works
undertaken and undertakes a flood risk assessment of the development site;
Section 4 describes the flood risk management measures that should be applied
to the site; and
Section 5 provides a summary and conclusion to the report.
sdf
2
Data Source Notes
Site setting and hydrology
OS Mapping 1: 50 000 Sheet 113: Grimsby, Louth & Market Rasen.
SFRA Mapping.
Area information, rivers and other watercourses, general site environs, built environment, catchment Information.
Geology, hydrogeology
BGS Sheet 81 Patrington. Site and area geology, groundwater vulnerability.
Environment Agency (EA)
EA data holdings – Flood Risk Officer.
Current flood risk, local flood defences, flood levels, supplementary geology and groundwater information.
Drainage Board Engineer, North East Lindsey Drainage Board.
Current flood risk, local flood defences, flood levels, supplementary geology and groundwater information.
Local Planning Authority (LPA)
North Lincolnshire Council. Strategic FRA; and
Flood Zoning.
Sewerage/Water Company
Fisher German Priestner Asset Mapping.
No water assets within the immediate vicinity of the site.
Planning Guidance
NPS EN-1 Section 5.7 NPS EN-1(5.7.6) refers applicants to this Practice Guide.
NPPF and associated Planning Practice Guidance ID7 – Flood Risk and Coastal Change.
Flood zoning for the site as used by the EA in England.
UK Climate Projections (UKCP09).
Yorkshire and Humber Key findings estimate a change in winter mean precipitation of 20%.
Previous reports North East Lincolnshire Council (NELC) and North Lincolnshire Council (NLC) SFRA.
North East Lincolnshire Council and North Lincolnshire Council, Strategic Flood Risk Assessment Review, November 2011.
UK Climate Projections (UKCP09) provides information designed to help those 2.1.1
needing to plan adaptations to a changing climate. Climate change over the next few
decades is predicted to result in milder wetter winters and hotter drier summers in the
UK with an increased frequency of heavy, intense precipitation leading to increased
peak river flows. Based on a UKCP high emissions scenario for Yorkshire and
Humber, winter mean precipitation could be 20% higher than current levels in 2080.
This could have a major impact on the potential for future flooding.
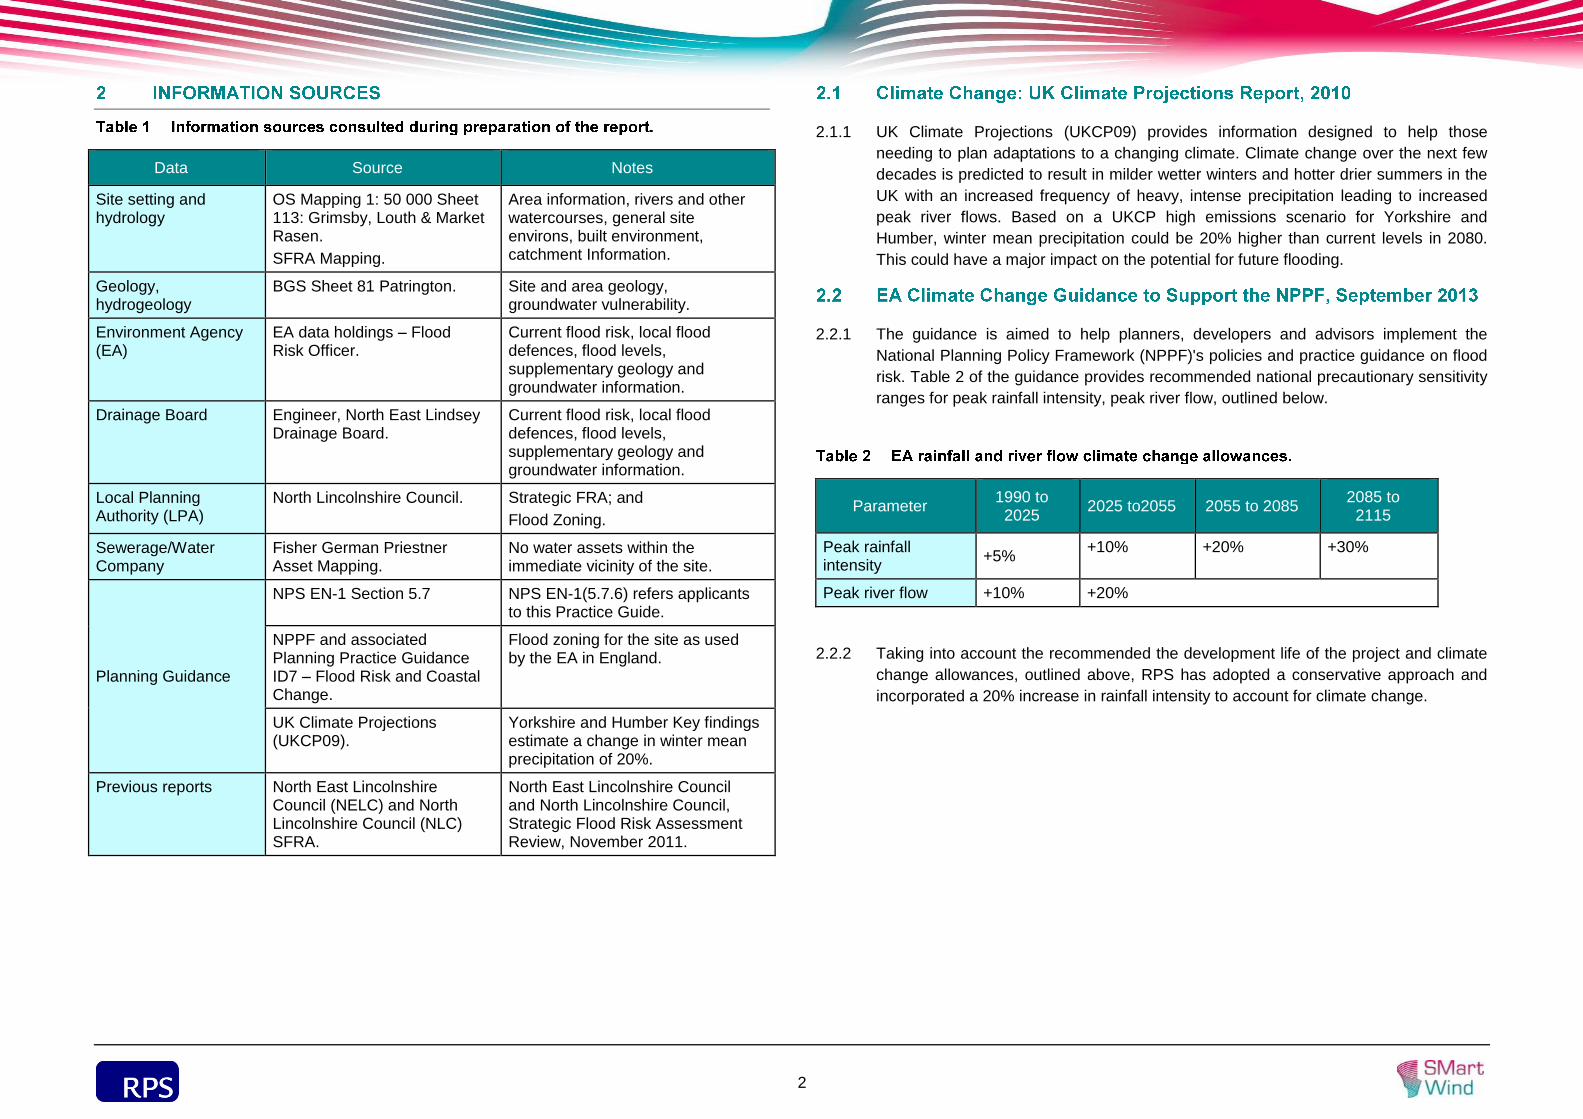
The guidance is aimed to help planners, developers and advisors implement the 2.2.1
National Planning Policy Framework (NPPF)'s policies and practice guidance on flood
risk. Table 2 of the guidance provides recommended national precautionary sensitivity
ranges for peak rainfall intensity, peak river flow, outlined below.
Parameter 1990 to
2025 2025 to2055 2055 to 2085
2085 to 2115
Peak rainfall intensity
+5% +10% +20% +30%
Peak river flow +10% +20%
Taking into account the recommended the development life of the project and climate 2.2.2
change allowances, outlined above, RPS has adopted a conservative approach and
incorporated a 20% increase in rainfall intensity to account for climate change.
sdf
3
The onshore HVDC converter/HVAC substation development site including service 3.1.1
corridor forms part of a larger application area covering 12.75 ha, located at NGR
515066, 419233 approximately 1.4 km east of East Halton (Drawing 1). The site is
bounded to the east by the Centrica Combined Cycle Gas/Steam Turbine Power
Station and south by a National Grid substation with the E.ON Combined Cycle Gas
Turbine Power Station beyond. Enclosed agricultural fields border the application area
to the north and west. At present there is no formal road network within the application
area. Access to the site is gained via either a farm track along the northern boundary
or from the Centrica Power Station road to the southeast corner.
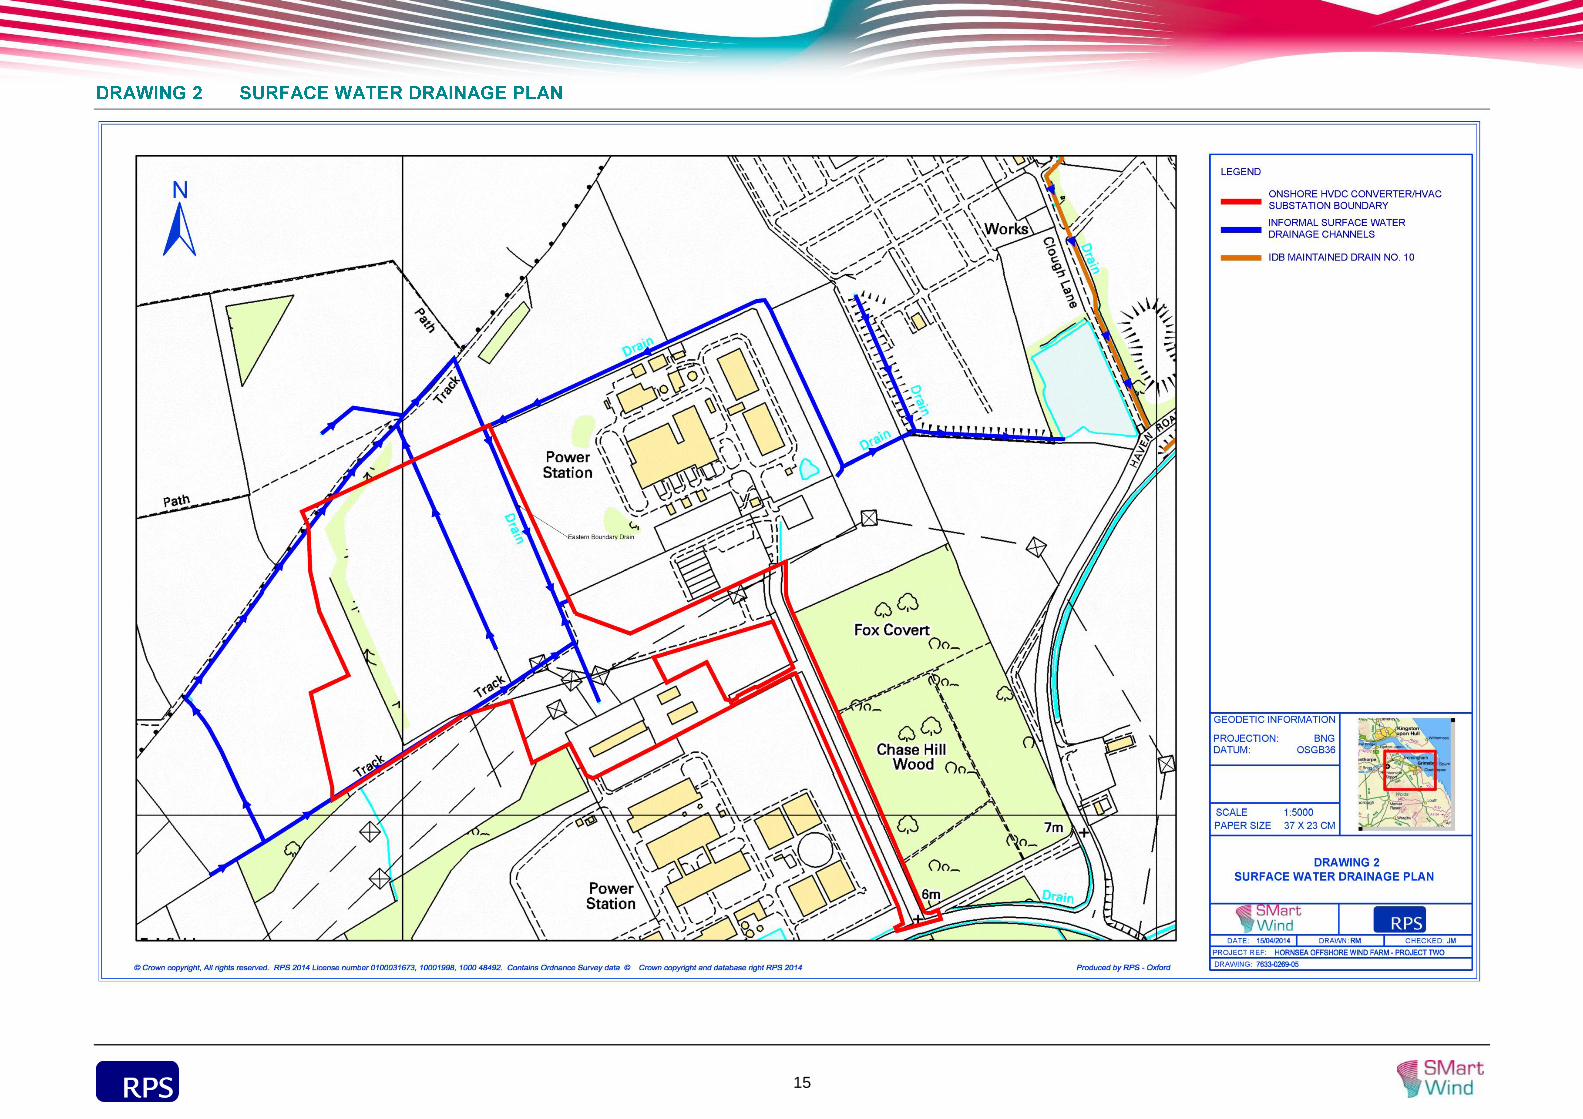
The East Halton Beck lies approximately 3 km to the west of the site and flows in a 3.1.2
north-easterly direction until its confluence with the Humber Estuary, approximately
3.2 km north of the site. A number of drainage ditches are located in and around the
site, generally running adjacent to field boundaries. A shallow field ditch runs south to
north through the centre of the site draining the western extent of the application area
and discharges into a field drain at the northern boundary that outfalls into the Humber
Estuary via IDB Drain No.11. A more defined ditch running north to south along the
eastern boundary drains the east portion of the application site. The eastern boundary
drain flows beneath the Centrica employee car park via a concrete circular culvert then
through a series of open and enclosed channels before discharging into IDB
maintained Drain No.10 (Drawing 2).
Ordnance survey mapping shows the nearest water body (a pond) is located 3.1.3
approximately 0.7 km east of the site.
The application area covers approximately 12.75 ha and is currently used for 3.2.1
agricultural purposes with enclosed fields separated by hedging. The application area
has a footpath along the southern boundary and field drainage ditches running along
the north, east and south edges, a shallow drainage channel runs south to north
through the centre of the site. The application area is open with a gentle slope from
west to east, and has no buildings, structures or development. The power stations to
the immediate south and east of the site, with the oil refinery beyond to the south,
contribute to the industrial type landscape, and to the north the area is dominated by
enclosed arable fields.
Asset mapping (Appendix B) provided by Fisher German Priestner shows a gas 3.2.2
service running along the north edge, before abruptly turning southwest cutting
through the western edge of the HVD converter/HVAC substation development
footprint. A power service is also shown to cross the southeast spur of the application
area, linking the Centrica Power Station to the National Grid transmission network.
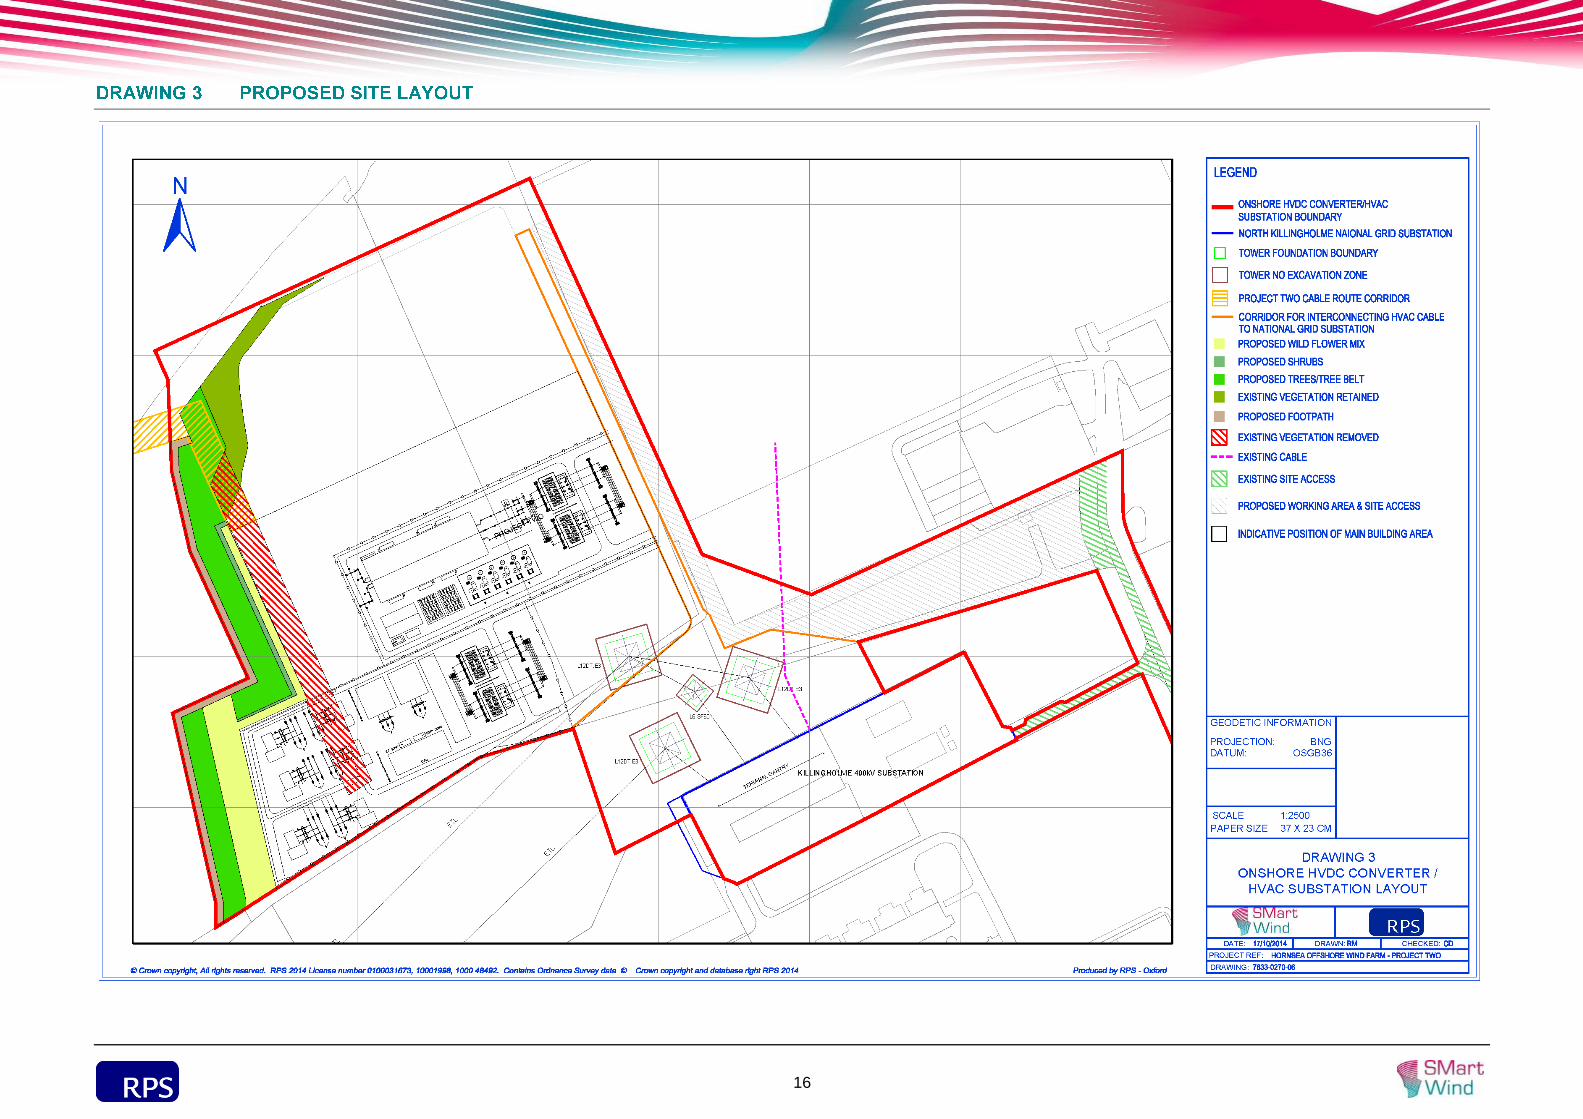
The DCO provides for the development of an onshore HVDC converter/HVAC 3.3.1
substation serving the Hornsea offshore wind farm Project Two. The proposed
onshore HVDC converter/HVAC substation will extend to approximately 4 ha.
Construction is programmed to commence in 2017 and the HVDC converter/HVAC
substation has a design life of 50 years. A proposed worst case development footprint
for the onshore HVDC converter/HVAC substation incorporates;
A building structure of 4,793 m2.
Concrete/Tarmac internal access roads and compacted aggregate fill covering –
approximately 30,880 m2.
External access roads cover approximately 5,298 m2.
An indicative site layout plan used for the purposes of this report can be found in 3.3.2
Drawing 3.
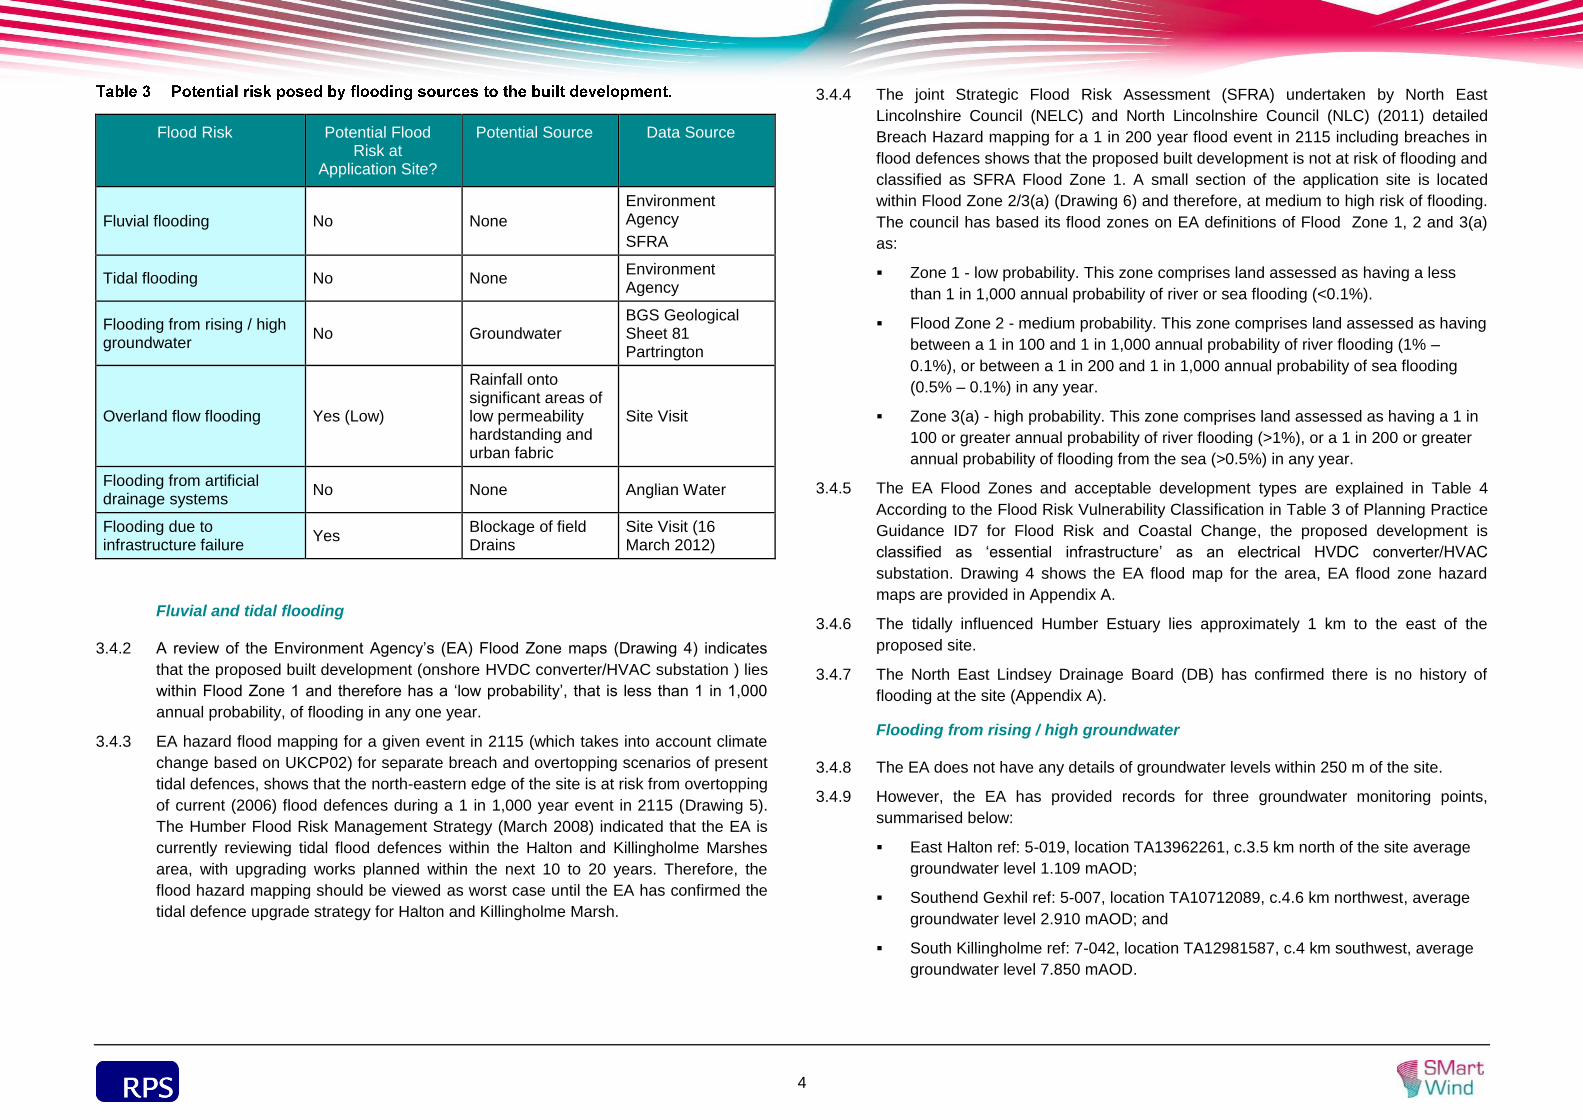
Summary results of this FRA are shown in Table 3 and each potential flood source is 3.4.1
reviewed in detail in this section.
sdf
4
Flood Risk Potential Flood Risk at
Application Site?
Potential Source Data Source
Fluvial flooding No None
Environment Agency
SFRA
Tidal flooding No None Environment Agency
Flooding from rising / high groundwater
No Groundwater BGS Geological Sheet 81 Partrington
Overland flow flooding Yes (Low)
Rainfall onto significant areas of low permeability hardstanding and urban fabric
Site Visit
Flooding from artificial drainage systems
No None Anglian Water
Flooding due to infrastructure failure
Yes Blockage of field Drains
Site Visit (16 March 2012)
Fluvial and tidal flooding
A review of the Environment Agency’s (EA) Flood Zone maps (Drawing 4) indicates 3.4.2
that the proposed built development (onshore HVDC converter/HVAC substation ) lies
within Flood Zone 1 and therefore has a ‘low probability’, that is less than 1 in 1,000
annual probability, of flooding in any one year.
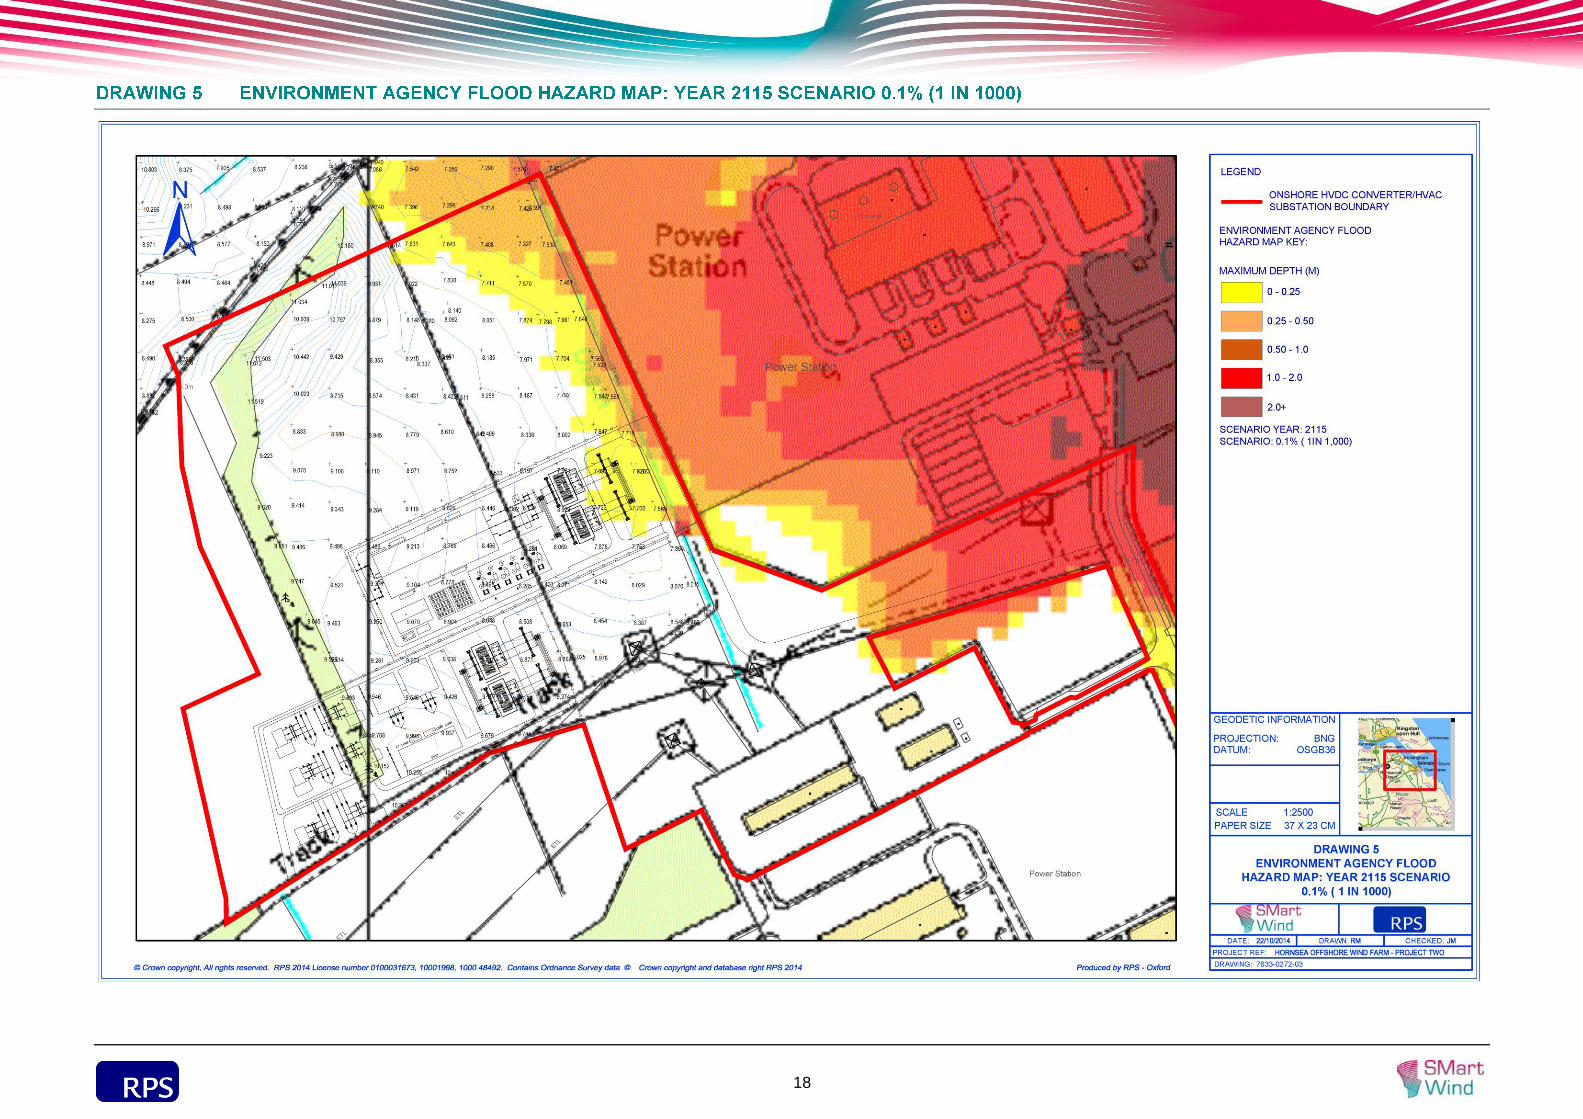
EA hazard flood mapping for a given event in 2115 (which takes into account climate 3.4.3
change based on UKCP02) for separate breach and overtopping scenarios of present
tidal defences, shows that the north-eastern edge of the site is at risk from overtopping
of current (2006) flood defences during a 1 in 1,000 year event in 2115 (Drawing 5).
The Humber Flood Risk Management Strategy (March 2008) indicated that the EA is
currently reviewing tidal flood defences within the Halton and Killingholme Marshes
area, with upgrading works planned within the next 10 to 20 years. Therefore, the
flood hazard mapping should be viewed as worst case until the EA has confirmed the
tidal defence upgrade strategy for Halton and Killingholme Marsh.
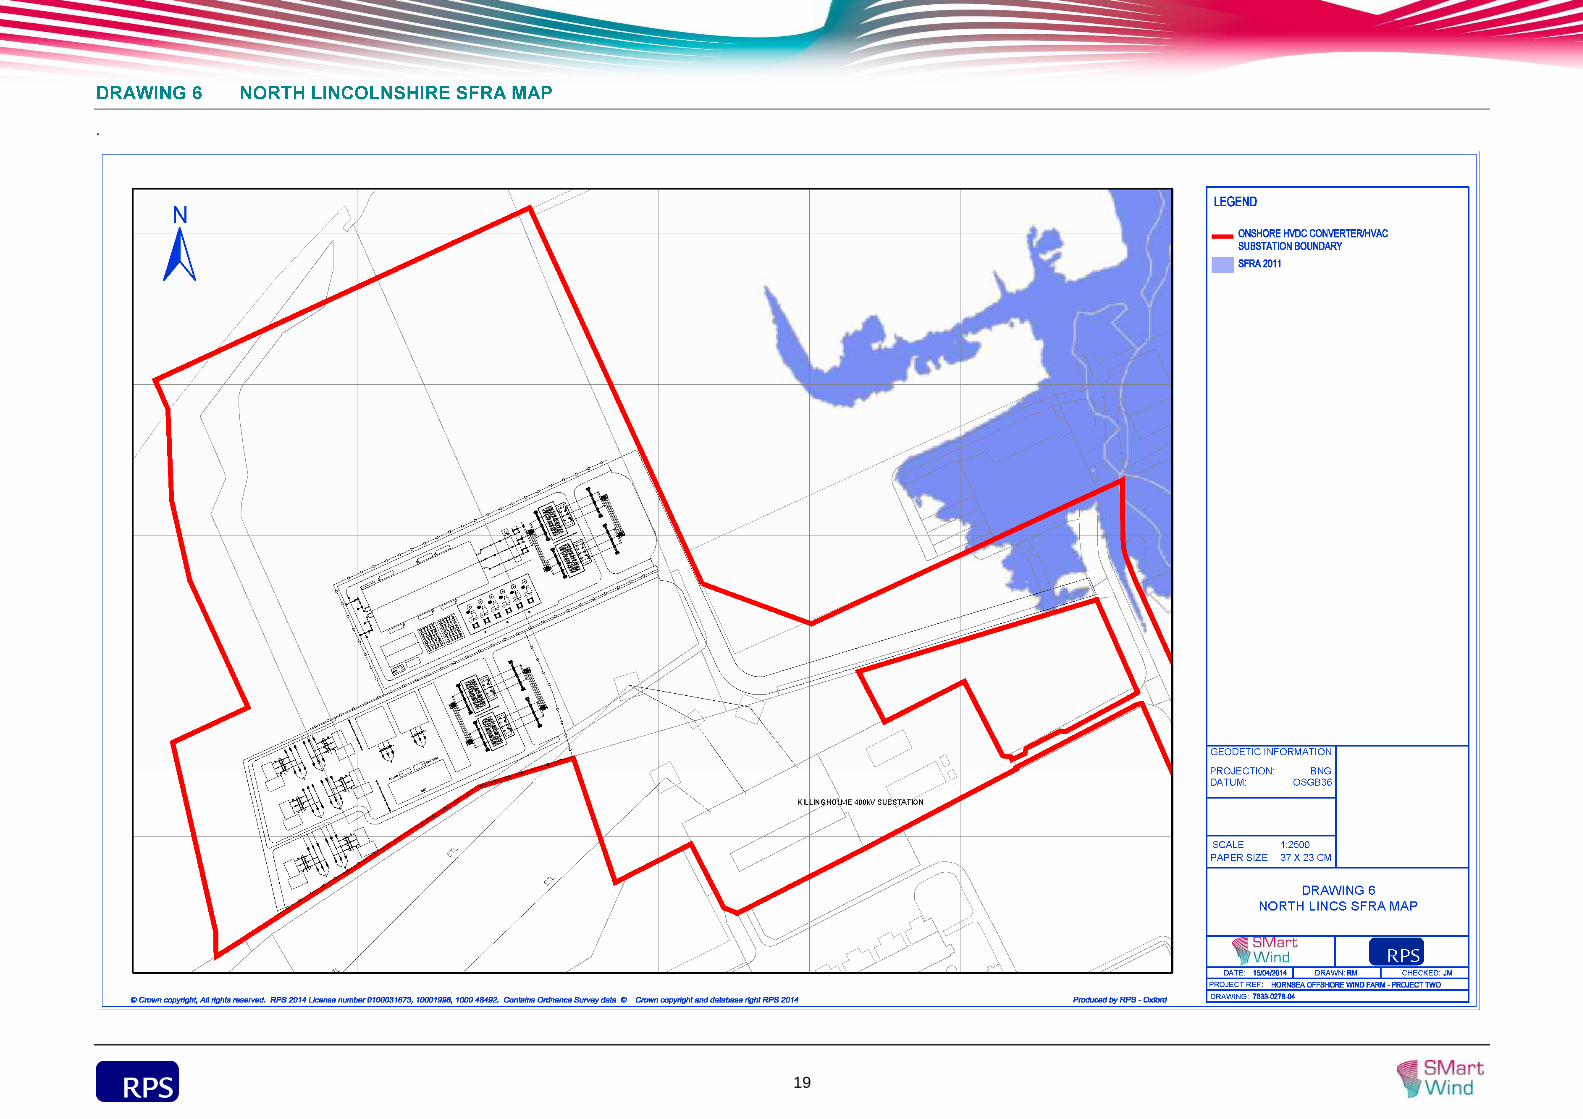
The joint Strategic Flood Risk Assessment (SFRA) undertaken by North East 3.4.4
Lincolnshire Council (NELC) and North Lincolnshire Council (NLC) (2011) detailed
Breach Hazard mapping for a 1 in 200 year flood event in 2115 including breaches in
flood defences shows that the proposed built development is not at risk of flooding and
classified as SFRA Flood Zone 1. A small section of the application site is located
within Flood Zone 2/3(a) (Drawing 6) and therefore, at medium to high risk of flooding.
The council has based its flood zones on EA definitions of Flood Zone 1, 2 and 3(a)
as:
Zone 1 - low probability. This zone comprises land assessed as having a less
than 1 in 1,000 annual probability of river or sea flooding (<0.1%).
Flood Zone 2 - medium probability. This zone comprises land assessed as having
between a 1 in 100 and 1 in 1,000 annual probability of river flooding (1% –
0.1%), or between a 1 in 200 and 1 in 1,000 annual probability of sea flooding
(0.5% – 0.1%) in any year.
Zone 3(a) - high probability. This zone comprises land assessed as having a 1 in
100 or greater annual probability of river flooding (>1%), or a 1 in 200 or greater
annual probability of flooding from the sea (>0.5%) in any year.
The EA Flood Zones and acceptable development types are explained in Table 4 3.4.5
According to the Flood Risk Vulnerability Classification in Table 3 of Planning Practice
Guidance ID7 for Flood Risk and Coastal Change, the proposed development is
classified as ‘essential infrastructure’ as an electrical HVDC converter/HVAC
substation. Drawing 4 shows the EA flood map for the area, EA flood zone hazard
maps are provided in Appendix A.
The tidally influenced Humber Estuary lies approximately 1 km to the east of the 3.4.6
proposed site.
The North East Lindsey Drainage Board (DB) has confirmed there is no history of 3.4.7
flooding at the site (Appendix A).
Flooding from rising / high groundwater
The EA does not have any details of groundwater levels within 250 m of the site. 3.4.8
However, the EA has provided records for three groundwater monitoring points, 3.4.9
summarised below:
East Halton ref: 5-019, location TA13962261, c.3.5 km north of the site average
groundwater level 1.109 mAOD;
Southend Gexhil ref: 5-007, location TA10712089, c.4.6 km northwest, average
groundwater level 2.910 mAOD; and
South Killingholme ref: 7-042, location TA12981587, c.4 km southwest, average
groundwater level 7.850 mAOD.

sdf
5
BGS mapping (sheet 81, Partington) shows that the site is underlain by Glacial Till 3.4.10
comprising soft to stiff clay with localised granular units and is classified by the EA as
a non–aquifer. The superficial deposits overlay Burnham Chalk which has been
designated as a Principal Aquifer.
Given the cohesive nature of the superficial deposits directly underlying the site the 3.4.11
potential for flooding due to a rising groundwater table is considered to be negligible.
Source Protection Zones
EA mapping shows the site is not located within a groundwater Source Protection 3.4.12
Zone (SPZ).
Surface water or pluvial flooding is defined as flooding caused by rainfall generated 3.5.1
overland flow, before the runoff enters a watercourse or sewer. In such events
sewerage and drainage systems and surface watercourses may be overwhelmed.
The site is located within a flat lying and primarily agricultural landscape. The majority 3.5.2
of surface runoff will either infiltrate into exposed permeable natural surfaces soils, or
given the flat nature of the surrounding topography pluvial flooding will be localised at
the point of origin with low mobility.
EA surface water flood mapping indicates that the majority of the site is at ‘very low’ 3.5.3
risk, defined as areas with an annual probability of flooding of less than 1 in 1,000
(0.1%).Reservoir Failure Assessment
EA mapping shows that the site is not at risk of reservoir flooding. 3.5.4
Asset mapping provided by Fisher German Priestner informed by Anglian Water 3.6.1
indicates that there are no active water assets within the application boundary.
However, a decommissioned 12” Anglian Water main runs through the northwest
corner of the application area and c.200 m from the proposed development footprint
(Appendix B).
The EA (Appendix A) and NELC and NLC SFRA (2011) mapping indicates that the 3.7.1
site has not been affected by historical flooding.
As part of the NELC and NLC joint SFRA (November 2011), the two councils have 3.8.1
undertaken an assessment of flood risk so that they can prepare Core Strategies and
other documentation to inform their respective Local Development Frameworks
(LDFs). The 2011 SFRA document is an update of the previous RYE SFRA report and
takes account of changes made following the introduction of PPS25, superseding
Planning Policy Guidance 25 (PPG25).
The SFRA review notes that; “the main sources of flood risk within the SFRA study 3.8.2
area are the Humber Estuary and the rivers draining into it, particularly the Ancholme
and the Trent but also a number of smaller ones including the Waithe Beck, Freshney,
East Halton Beck, the Bottesford Beck and the various canals and drains east of the
Trent by the Isle of Axholme. Flooding can also arise from smaller drains and from
blockages in culverts, while groundwater levels can rise following heavy rain leading to
ponding if the water cannot get away….”
The EA’s Humber Flood Risk Management Strategy, March 2008 notes that an area of 3.8.3
Halton and Killingholme Marshes lie within the proposed South Humber Bank (SHB)
development site which has been allocated for estuary related industry or commercial
activities. Most of the properties at flood risk fall into this SHB allocated area, including
wharf facilities and a major petro-chemical plant. There is also a significant area of
high-grade agricultural land. The local authorities have prepared a Strategic Flood
Risk Assessment, to inform their planning decisions and the future development of the
area. The land drainage is designed to cater for these developments and releases
surface water into the estuary through a combination of pumped and gravity systems.
The Humber Flood Risk Management Strategy (2008) notes that the EA will continue 3.8.4
to protect most of the Halton and Killingholme Marsh area and plan to work with the
local and regional authorities, property owners and developers to make sure flood risk
is taken into account at all stages of the planning process. The EA will also work with
the local planning authorities to avoid any permanent buildings being located
immediately behind the defences. The EA also aims to improve the defences that
protect existing development, but plan to stop maintaining those that protect currently
undeveloped areas.
The Humber Strategy Risk Management Strategy (2008) also indicates that the Halton 3.8.5
and Killingholme Marsh area is protected by tidal defences with a 1 in 50 to 1 in 150
year event standard, with a remaining life of 5 to 15 years.
The EA notes that the foreshore flood defences are being eroded away, which is 3.8.6
weakening the defences along the whole frontage, particularly at Halton Marshes. It is
highlighted that if these defences are not repaired they are likely to fail within the next
five years. The EA is currently planning to improve the standard of protection in 10 to
20 years, although there is no set date for when works will occur and the timing will
depend on the rate of sea level rise.

sdf
6
Applying the Flood Risk Vulnerability Classification (2 of the Planning Practice 4.1.1
Guidance ID7 to the NPPF), an electricity HVDC converter/HVAC substation is
classified as ‘Essential infrastructure’. Table 3 of the Planning Practice Guidance ID7
to the NPPF (Table 4 of this report) states that ‘Essential Infrastructure’ uses are
appropriate within Flood Zone 1 and 2, and also in Flood Zone 3.
Flood Risk Vulnerability classification (see Table 3 of Planning
Practice Guidance)
Essential Infrastructure
Highly Vulnerable
More Vulnerable
Less Vulnerable
Water Compatible
Zone 1 Yes Yes Yes Yes Yes
Zone 2 Yes Exception test required
Yes Yes Yes
Zone 3a Exception test required
No Exception test required
Yes Yes
Zone 3b Functional Floodplain
Exception test required
No No No Yes
Key: Yes: Development is appropriate, No: Development should not be permitted.
The Sequential Test is designed to demonstrate that there are no reasonably available 4.2.1
sites in areas with a lower probability of flooding that would be appropriate for this type
of development. The Exception Test must be passed for certain types of development.
Local Planning Authorities allocating land in Local Development Plans (LDPs) for 4.2.2
development should apply the Sequential Test to demonstrate that there are no
reasonably available sites in areas with a lower probability of flooding that would be
appropriate to the type of development or land use proposed. A sequential approach
should be used in areas known to be at risk from other forms of flooding.
In areas at risk of river or sea flooding, preference should be given to locating new 4.2.3
development in Flood Zone 1. If there is no reasonably available site in Flood Zone 1,
the flood vulnerability of the proposed development can be taken into account in
locating development in Flood Zone 2 and then Flood Zone 3. Within each Flood Zone
new development should be directed to sites at the lowest probability of flooding from
all sources as indicated by the Strategic Flood Risk Assessment (SFRA).
The Sequential Test therefore seeks the allocation of land for development in flood 4.2.4
areas of least risk where practicable (i.e. preferentially steer towards Zone 1).
Developers should also have regard to the Sequential Test when evaluating sites
where LDPs have not been subject to SFRA and/or the Sequential Test and where it is
necessary to demonstrate that there are no alternative sites with a lower probability of
flooding for the given end use.
EA (Appendix A) and North East and North Lincolnshire Council SFRA (2011) flood 4.2.5
mapping shows that the built development is located within Flood Zone 1 and has
therefore passed the Sequential Test requirement of locating development within ‘low’
flood risk zones.
As the proposed built development is located within Flood Zone 1 and has passed the 4.2.6
Sequential Test there is no need to undertake an Exceptions Test.
RPS discussed the issue of the access track within the onshore HVDC 4.2.7
converter/HVAC substation site with the Planning Department of North Lincolnshire
Council on the 25 November 2012 who indicated that as long as the built development
was located within Flood Zone 1, the development should pass the Sequential Test.
Furthermore, an emergency evacuation plan will be in place to ensure any site staff
can safely exit the site prior to or during an extreme flood event. However with a lead
time of several days for a tidal flood event procedure will be put in place to ensure no
site staff are present during an extreme event.
The EA website confirms that there are EA maintained flood defences located along 4.3.1
the River Humber providing a standard of flood protection from flood events with
between a 1 in 50 and 1 in 150 year chance of occurring in any year. There are no EA
maintained flood defences along East Halton Beck.
The SFRA shows that the onshore HVDC converter/HVAC substation site is located 4.3.2
within SFRA compartment 1T3 which is
sdf
7
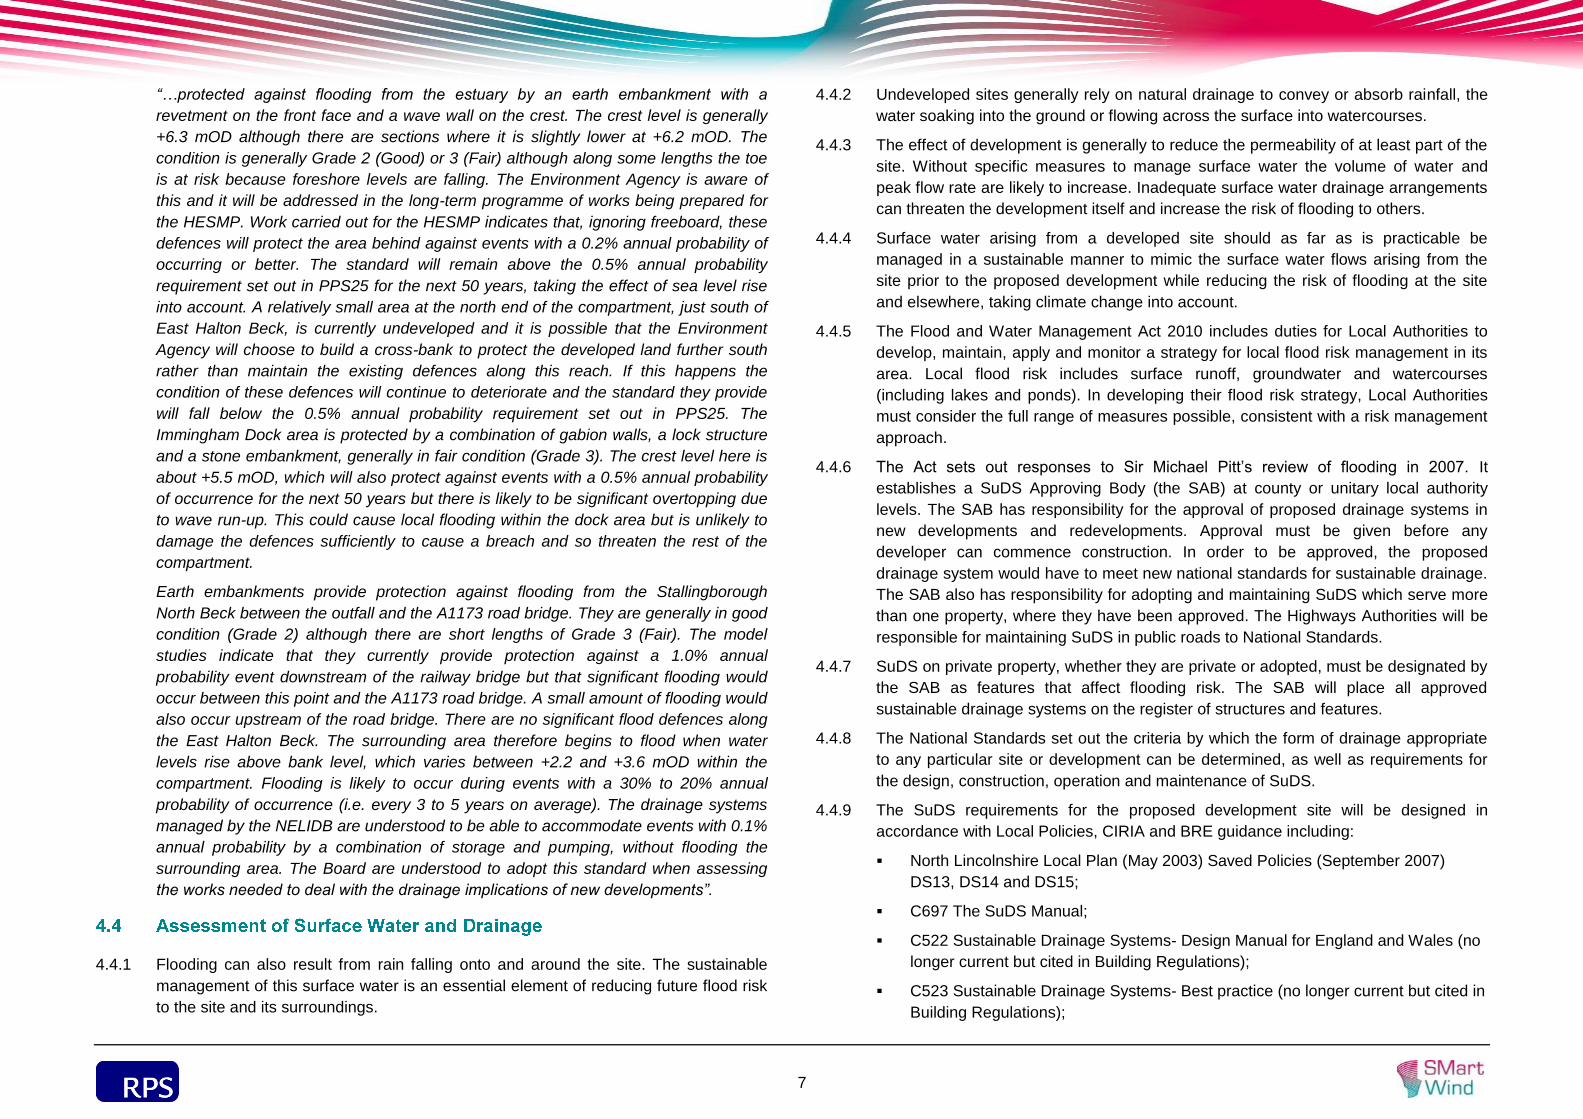
“…protected against flooding from the estuary by an earth embankment with a
revetment on the front face and a wave wall on the crest. The crest level is generally
+6.3 mOD although there are sections where it is slightly lower at +6.2 mOD. The
condition is generally Grade 2 (Good) or 3 (Fair) although along some lengths the toe
is at risk because foreshore levels are falling. The Environment Agency is aware of
this and it will be addressed in the long-term programme of works being prepared for
the HESMP. Work carried out for the HESMP indicates that, ignoring freeboard, these
defences will protect the area behind against events with a 0.2% annual probability of
occurring or better. The standard will remain above the 0.5% annual probability
requirement set out in PPS25 for the next 50 years, taking the effect of sea level rise
into account. A relatively small area at the north end of the compartment, just south of
East Halton Beck, is currently undeveloped and it is possible that the Environment
Agency will choose to build a cross-bank to protect the developed land further south
rather than maintain the existing defences along this reach. If this happens the
condition of these defences will continue to deteriorate and the standard they provide
will fall below the 0.5% annual probability requirement set out in PPS25. The
Immingham Dock area is protected by a combination of gabion walls, a lock structure
and a stone embankment, generally in fair condition (Grade 3). The crest level here is
about +5.5 mOD, which will also protect against events with a 0.5% annual probability
of occurrence for the next 50 years but there is likely to be significant overtopping due
to wave run-up. This could cause local flooding within the dock area but is unlikely to
damage the defences sufficiently to cause a breach and so threaten the rest of the
compartment.
Earth embankments provide protection against flooding from the Stallingborough
North Beck between the outfall and the A1173 road bridge. They are generally in good
condition (Grade 2) although there are short lengths of Grade 3 (Fair). The model
studies indicate that they currently provide protection against a 1.0% annual
probability event downstream of the railway bridge but that significant flooding would
occur between this point and the A1173 road bridge. A small amount of flooding would
also occur upstream of the road bridge. There are no significant flood defences along
the East Halton Beck. The surrounding area therefore begins to flood when water
levels rise above bank level, which varies between +2.2 and +3.6 mOD within the
compartment. Flooding is likely to occur during events with a 30% to 20% annual
probability of occurrence (i.e. every 3 to 5 years on average). The drainage systems
managed by the NELIDB are understood to be able to accommodate events with 0.1%
annual probability by a combination of storage and pumping, without flooding the
surrounding area. The Board are understood to adopt this standard when assessing
the works needed to deal with the drainage implications of new developments”.
Flooding can also result from rain falling onto and around the site. The sustainable 4.4.1
management of this surface water is an essential element of reducing future flood risk
to the site and its surroundings.
Undeveloped sites generally rely on natural drainage to convey or absorb rainfall, the 4.4.2
water soaking into the ground or flowing across the surface into watercourses.
The effect of development is generally to reduce the permeability of at least part of the 4.4.3
site. Without specific measures to manage surface water the volume of water and
peak flow rate are likely to increase. Inadequate surface water drainage arrangements
can threaten the development itself and increase the risk of flooding to others.
Surface water arising from a developed site should as far as is practicable be 4.4.4
managed in a sustainable manner to mimic the surface water flows arising from the
site prior to the proposed development while reducing the risk of flooding at the site
and elsewhere, taking climate change into account.
The Flood and Water Management Act 2010 includes duties for Local Authorities to 4.4.5
develop, maintain, apply and monitor a strategy for local flood risk management in its
area. Local flood risk includes surface runoff, groundwater and watercourses
(including lakes and ponds). In developing their flood risk strategy, Local Authorities
must consider the full range of measures possible, consistent with a risk management
approach.
The Act sets out responses to Sir Michael Pitt’s review of flooding in 2007. It 4.4.6
establishes a SuDS Approving Body (the SAB) at county or unitary local authority
levels. The SAB has responsibility for the approval of proposed drainage systems in
new developments and redevelopments. Approval must be given before any
developer can commence construction. In order to be approved, the proposed
drainage system would have to meet new national standards for sustainable drainage.
The SAB also has responsibility for adopting and maintaining SuDS which serve more
than one property, where they have been approved. The Highways Authorities will be
responsible for maintaining SuDS in public roads to National Standards.
SuDS on private property, whether they are private or adopted, must be designated by 4.4.7
the SAB as features that affect flooding risk. The SAB will place all approved
sustainable drainage systems on the register of structures and features.
The National Standards set out the criteria by which the form of drainage appropriate 4.4.8
to any particular site or development can be determined, as well as requirements for
the design, construction, operation and maintenance of SuDS.
The SuDS requirements for the proposed development site will be designed in 4.4.9
accordance with Local Policies, CIRIA and BRE guidance including:
North Lincolnshire Local Plan (May 2003) Saved Policies (September 2007)
DS13, DS14 and DS15;
C697 The SuDS Manual;
C522 Sustainable Drainage Systems- Design Manual for England and Wales (no
longer current but cited in Building Regulations);
C523 Sustainable Drainage Systems- Best practice (no longer current but cited in
Building Regulations);

sdf
8
C156 Infiltration Drainage – Manual of Good practice; and
BRE365 Soakaway design.
Surface Water Drainage
The alteration of natural surface water flow patterns through developments can lead to 4.5.1
problems elsewhere in the catchment, particularly flooding downstream. For example,
replacing vegetated areas with roofs, roads and other paved areas can increase both
the total and the peak flow of surface water runoff from the development site.
Existing Drainage System
Asset mapping provided by Fisher German Priestner shows that there is no formal 4.5.2
drainage beneath the site.
Information provided by North East Lindsey DB (Appendix A) indicates that the site 4.5.3
drains into a number of field drains that convey flow into the NELDB maintained
drainage system that discharges into the Humber Estuary via North Killingholme Drain
(Drawing 2).
Current Runoff Rate
The current land use (as noted in Section 3.2) is enclosed agricultural land. The 4.5.4
existing predevelopment 1 in 1 year runoff rate is estimated as 13.2 l/s or 3.3 l/s/ha
(Table 5).
Proposed Runoff Rate
The proposed land use (as noted in Section 3.3) is a HVDC converter/HVAC 4.5.5
substation with an operational life of 50 years. The development of the site will result
in an increase in impermeable surfaces, with the introduction of building structures and
concrete hardstand associated with onsite equipment and access roads (Drawing 3).
Runoff Calculations
An assessment of the current runoff rates has been undertaken, in order to determine 4.5.6
the surface water attenuation requirements for the built development and access road.
The rates of runoff have been determined using the current ‘industry best practice’ 4.5.7
guidelines as outlined in the Interim Code of Practice for SuDS. The recommended
methodology for sites up to 50 hectares in area is the Institute of Hydrology Report
124 method (IoH 124). Defra and the EA recommend the IoH 124 method in their
guidelines for Preliminary Rainfall Runoff Management for Developments.
The runoff for the site has been calculated using ICP SuDS within WinDes design 4.5.8
software. This is based on the IoH 124 method which is suitable for all catchments up
to 200 ha. For catchments smaller than 50 ha the equivalent runoff from a 50 ha site
must be calculated using IH124, it is then possible to pro-rata this value to give the
runoff for the smaller site. Interim Code of Practice (ICP) SuDS calculation
automatically carries out the pro rata conversion reducing the possibility of human
error. The calculations are included in Appendix C.
The following parameters have been incorporated into the runoff calculations: 4.5.9
Pre Development Catchment Area: approximately 4 ha (assume 100% permeable
or 0.00 in WinDes which takes into account 25% natural loss via evaporation and
evapotranspiration);
Post Development Catchment Area: approximately 4 ha (assume 0% permeable
or 0.75 in WinDes, which takes into account 25% natural loss via evaporation and
evapotranspiration);
Average Annual Rainfall (SAAR): 618mm/year (FEH CD-ROM 3);
Soil: 0.450; and
Region No: 5.
The North East Lindsey DB has stated that as surface water runoff will enter DB 4.5.10
maintained channels, an improvement to discharge rates would be required , with
attenuation needed to ensure that post-development surface water flow rates do not
exceed the 1 in 1 year runoff rate (Appendix A). Pre and post development runoff rate
results are presented in Table 5
NPS (EN-1) paragraphs 5.7.20 and 5.7.21 state: 4.5.11
“Site layout and surface water drainage systems should cope with events that exceed
the design capacity of the system, so that excess water can be safely stored on or
conveyed from the site without adverse impacts”.
“The surface water drainage arrangements for any project should be such that the
volumes and peak flow rates of surface water leaving the site are no greater than the
rates prior to the proposed project, unless specific off-site arrangements are made and
result in the same net effect”.
The Planning Practice Guidance ID7 on Flood Risk notes that: 4.5.12
“Local authorities and developers should seek opportunities to reduce the overall level
of flood risk in the area and beyond. This can be achieved, for instance, through the
layout and form of development, including green infrastructure and the appropriate
application of sustainable drainage systems, through safeguarding land for flood risk
management, or where appropriate, through designing off-site works required to
protect and support development in ways that benefit the area more generally.”

sdf
9
Table 5 presented below illustrates that following the construction of the proposed 4.5.13
development that there will be an increase in surface water runoff from the site due to
the increase in low permeable areas.
Annual Probability
(Return Period, years)
Current (1 in 1 year)
Runoff (l/s)
Current (1 in 1 year ) Runoff l/s/ha
Proposed (Unmitigated)
Runoff (l/s)
Proposed
Unmitigated runoff
l/s/ha
Unmitigated Increase in Runoff (l/s)
100% (1) 13.2 3.3 37.9 9.5 24.7
3.33% (30) 36.5 9.1 77.8 19.5 41.3
1% (100) 54.1 13.5 92.7 23.2 38.6
1% + Climate Change
64.9 16.2 111.2 27.8 46.3
Note: 20% allowance added to rainfall data to account for long-term climate change for the development life (UKCP09 mean winter precipitation estimate for Yorkshire and Humber)
Sustainable Drainage Options
NPS EN-1 (2011), NPPF and associated Planning Practice Guidance ID7, Ciria C697 4.5.14
SuDS Manual (2007) and North Lincolnshire Local Plan (May 2010) Policies DS13,
DS14 and DS15 promotes sustainable water management through the use of SuDS.
A hierarchy of techniques is identified:
i) Prevention – the use of good site design and housekeeping measures on
individual sites to prevent runoff and pollution (e.g. minimise areas of hard
standing).
ii) Source Control – control of runoff at or very near its source (such as the use of
rainwater harvesting).
iii) Site Control – management of water from several sub-catchments (including
routing water from roofs and car parks to one/several large soakaways for the
whole site).
iv) Regional Control – management of runoff from several sites, typically in a
detention pond or wetland.
The implementation of SuDS as opposed to conventional drainage systems, provides 4.5.15
several benefits by:
Reducing peak flows to watercourses or sewers and potentially reducing the risk
of flooding downstream;
Reducing the volumes and frequency of water flowing directly to watercourses or
sewers from developed sites;
Improving water quality over conventional surface water sewers by removing
pollutants from diffuse pollutant sources;
Reducing potable water demand through rainwater harvesting;
Improving amenity through the provision of public open spaces and wildlife
habitat; and
Replicating natural drainage patterns, including the recharge of groundwater so
that base flows are maintained.
Attenuation Requirements Assuming No Infiltration Losses
The attenuation volume required to restrict the surface water runoff for a 1 in 100 year 4.5.16
rainfall event plus climate change (+ 20%) assuming no infiltration losses to the
ground to the 1 in 1 year rate (e.g. through the use of a lined pond or tank) has been
determined using the industry standard Micro Drainage WinDes software suite
incorporating the following parameters:
Catchment Area: approximately 4 ha;
Cv (proportion of rainfall forming surface water runoff): assume a factor of 75%
for the development in summer, and 84% in winter (weighted average based on
proposed land use);
1 in 1 year runoff rate: 13.2 l/s; and
Assuming no infiltration losses.
The system was modelled within WinDes as a tank/pond with controlled discharge via 4.5.17
an orifice outflow control. The WinDes calculation sheets are included within Appendix
C.
The attenuation volume required to restrict runoff to the 1 in 1 year (100% annual 4.5.18
probability) current runoff rate of 13.2 l/s from a 1 in 100 year storm event plus 20% for
climate change has been determined to be approximately 3,384 m3 for the site.
Attenuation Requirements Assuming Infiltration Losses
The attenuation volume required to restrict the surface water runoff rate to the 4.5.19
predevelopment or 1 in 1 year runoff rate for a 1 in 100 year rainfall event plus climate
change (+ 20%) assuming infiltration losses to the ground (e.g., through the use of a
soakaway or infiltration basin) has been determined using the industry standard Micro
Drainage WinDes software suite incorporating the following parameters:

sdf
10
Catchment Area: approximately 4 ha;
Cv (proportion of rainfall forming surface water runoff): assume a factor of 75%
for the development in summer, and 84% in winter (weighted average based on
proposed land use);
1 in 1 year runoff rate: 13.2 l/s;
Infiltration rate through the base of infiltration feature: 0.0001m/hour (WinDes text
book infiltration values for Clay).
The system was modelled within WinDes as an infiltration basin with controlled 4.5.20
discharge via an orifice outflow control. The calculation sheets are included within
Appendix C.
The attenuation volume required to restrict runoff to the 1 in 1 year (100% annual 4.5.21
probability) current runoff rate of 13.2 l/s has been determined to be approximately
3,382 m3 for the site. This is close to the value assuming low infiltration losses owing
to the nature of underlying cohesive clay geology.
Should an infiltration system be proposed, it is recommended prior to construction of 4.5.22
the drainage system that a series of infiltration/soakaway tests are carried out on site
to BRE Digest 365 Guidelines to confirm the assumptions made in the calculations.
A surface water drainage assessment has been undertaken by Jacobs (Appendix D), 4.5.23
which indicates that the ‘worst case’ 3,384 m3 of storm water can be attenuated within
the site development footprint. The proposed measures incorporate a 0.76 m deep
excavation beneath 70% of the proposed gravelled area with a void ration of 30%,
discharging at the 1 in 1 year runoff rate to existing drainage infrastructure.
sdf
11
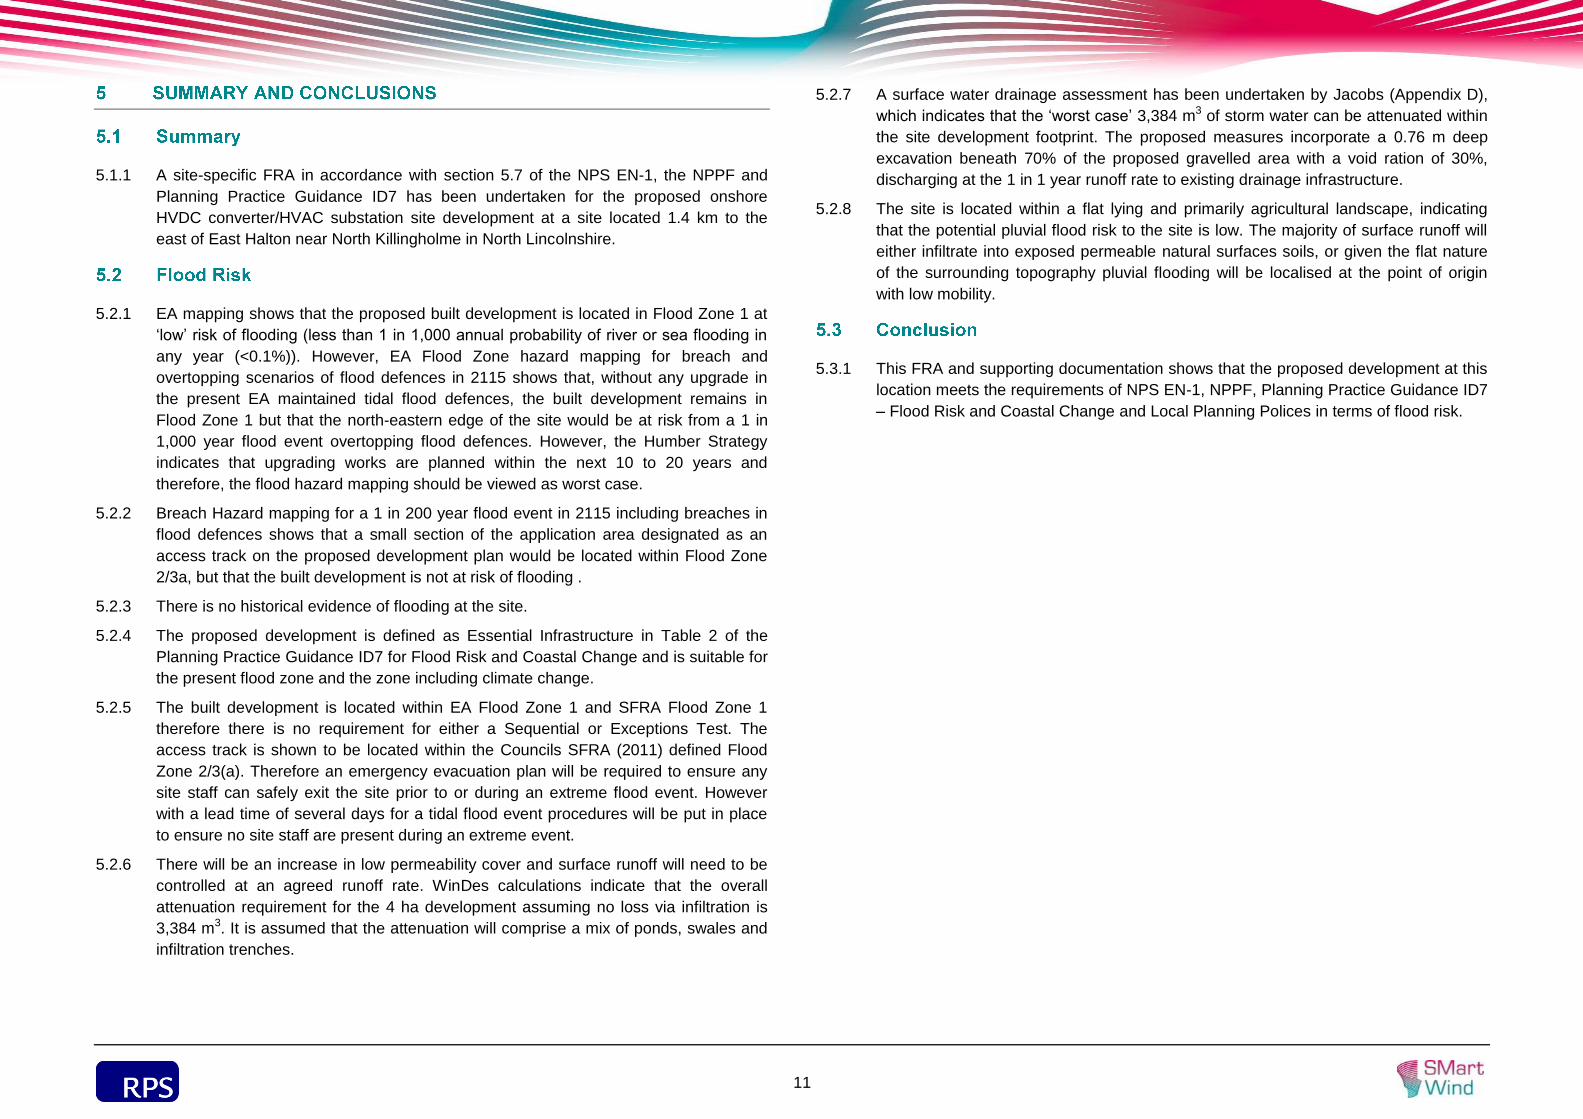
A site-specific FRA in accordance with section 5.7 of the NPS EN-1, the NPPF and 5.1.1
Planning Practice Guidance ID7 has been undertaken for the proposed onshore
HVDC converter/HVAC substation site development at a site located 1.4 km to the
east of East Halton near North Killingholme in North Lincolnshire.
EA mapping shows that the proposed built development is located in Flood Zone 1 at 5.2.1
‘low’ risk of flooding (less than 1 in 1,000 annual probability of river or sea flooding in
any year (<0.1%)). However, EA Flood Zone hazard mapping for breach and
overtopping scenarios of flood defences in 2115 shows that, without any upgrade in
the present EA maintained tidal flood defences, the built development remains in
Flood Zone 1 but that the north-eastern edge of the site would be at risk from a 1 in
1,000 year flood event overtopping flood defences. However, the Humber Strategy
indicates that upgrading works are planned within the next 10 to 20 years and
therefore, the flood hazard mapping should be viewed as worst case.
Breach Hazard mapping for a 1 in 200 year flood event in 2115 including breaches in 5.2.2
flood defences shows that a small section of the application area designated as an
access track on the proposed development plan would be located within Flood Zone
2/3a, but that the built development is not at risk of flooding .
There is no historical evidence of flooding at the site. 5.2.3
The proposed development is defined as Essential Infrastructure in Table 2 of the 5.2.4
Planning Practice Guidance ID7 for Flood Risk and Coastal Change and is suitable for
the present flood zone and the zone including climate change.
The built development is located within EA Flood Zone 1 and SFRA Flood Zone 1 5.2.5
therefore there is no requirement for either a Sequential or Exceptions Test. The
access track is shown to be located within the Councils SFRA (2011) defined Flood
Zone 2/3(a). Therefore an emergency evacuation plan will be required to ensure any
site staff can safely exit the site prior to or during an extreme flood event. However
with a lead time of several days for a tidal flood event procedures will be put in place
to ensure no site staff are present during an extreme event.
There will be an increase in low permeability cover and surface runoff will need to be 5.2.6
controlled at an agreed runoff rate. WinDes calculations indicate that the overall
attenuation requirement for the 4 ha development assuming no loss via infiltration is
3,384 m3. It is assumed that the attenuation will comprise a mix of ponds, swales and
infiltration trenches.
A surface water drainage assessment has been undertaken by Jacobs (Appendix D), 5.2.7
which indicates that the ‘worst case’ 3,384 m3 of storm water can be attenuated within
the site development footprint. The proposed measures incorporate a 0.76 m deep
excavation beneath 70% of the proposed gravelled area with a void ration of 30%,
discharging at the 1 in 1 year runoff rate to existing drainage infrastructure.
The site is located within a flat lying and primarily agricultural landscape, indicating 5.2.8
that the potential pluvial flood risk to the site is low. The majority of surface runoff will
either infiltrate into exposed permeable natural surfaces soils, or given the flat nature
of the surrounding topography pluvial flooding will be localised at the point of origin
with low mobility.
This FRA and supporting documentation shows that the proposed development at this 5.3.1
location meets the requirements of NPS EN-1, NPPF, Planning Practice Guidance ID7
– Flood Risk and Coastal Change and Local Planning Polices in terms of flood risk.

sdf
12
BRE Digest365 Soakaway design, 2003.
Centre of Ecology and Hydrology (1999). Flood Estimation Handbook. CD Rom.
CIRIA (2007) Report C697 (2007) The SuDS manual. Construction Industries Research
Association;
CIRIA (2004) Funders Report CP/102 Development and Flood Risk – Guidance for the
Construction Industry
CIRIA (2000) Report C522 Sustainable Drainage Systems- Design Manual for England and
Wales.
CIRIA (2001) Report C523 Sustainable Drainage Systems- Best practice.
CIRIA (1996) Report C156 Infiltration Drainage – Manual of Good practice.
Department for Communities and Local Government (March 2012) National Planning Policy
Framework;
Department for Communities and Local Government (March 2014) Planning Practice Guidance
(http://planningguidance.planningportal.gov.uk/) [Accessed March 2014 and April 2014];
Defra/Environment Agency (2004) Preliminary Rainfall Runoff Management for Developments.
Technical Report W5-074A/TR/1/Revision B.
Envirocheck Report, 36400891_1_1, October 2011.
http://ukclimateprojections.defra.gov.uk/22357 (September 2012)
Flood and Water Management Act 2010.
Humber Flood Risk Management Strategy, March 2008.
Institute of Geological Sciences (1977), Hydrogeological Map of England and Wales (Scale
1;250,000).
Institute of Hydrology (1994) Flood Estimates for Small Catchments. Report no 124.
Jacobs, December 2014. Hornsea Offshore Wind Farm - Project Two, Smart Wind Ltd, Surface
Water Drainage Assessment, VP00869-E-CC-RP-E4-0001 | C.
Land Drainage Act 1991.
Localism Act 2011, November 2011.
North Lincolnshire Council Local Plan, Adopted Plan May 2003.
North East Lincolnshire and North Lincolnshire (November 2011) Strategic Flood Risk
Assessment.
Office of the Deputy Prime Minister National SuDS Working Group (July 2004) Interim Code of
Practice for Sustainable Drainage Systems
Soil Survey of England and Wales (1983). Soils Map of England and Wales (Scale 1:250,000).
UK Climate Projections science report: Climate change projections, Version 3, updated
December 2010.
Water Resources Act 1991.

sdf
13
sdf
14
sdf
15
sdf
16

sdf
17
sdf
18
sdf
19
.

sdf
20

APPENDIX A

file:///Q|/DLE2290%20-%20Hornsea/Geo%20Environmental/Reports/FL...nce/IDB/Re%20FW%20Environmental%20Information%20Request%202.htm
Tel: 0113 220 6190
Date: 19th October 2011
Dear Sir/Madam,
FLOOD INFORMATION REQUEST: Parcel of Land in North Killingholme NRG: 515190, 419260.
We are currently conducting a Flood Risk Assessment for a proposed development at North Killingholme , 515190, 419260 (see attached plan).
To undertake this study RPS wish to obtain the following information:
§ Flood zone outlines for the site (electronic MapInfo Version if possible)
§ Any existing river levels/modelled levels for nearby watercourses, for the 100 year, 100 year with climate change, 200 year, 200 year with climate change, 1000 year, and 1000 year with climate change flood events;
§ Details of any flooding due to drainage problems associated with the site, including flood levels, flood extents and any available anecdotal information;
file:///Q|/DLE2290%20-%20Hornsea/Geo%20Environment...FW%20Environmental%20Information%20Request%202.htm (5 of 8) [21/02/2012 15:31:37]
file:///Q|/DLE2290%20-%20Hornsea/Geo%20Environmental/Reports/FL...nce/IDB/Re%20FW%20Environmental%20Information%20Request%202.htm
§ Records of any surface and groundwater discharges, abstractions and pollution incidents within 250m of the site;
§ Details of any recorded groundwater levels in the area, and groundwater vulnerability of the area;
§ Details of flood alleviation and defences in this area;
§ Details of any groundwater flooding issues in the area, including flood levels, flood extents and any available anecdotal information;
§ Details of aquifer designation, soil classification, and Source Protection Zones in this area;
§ Any other relevant flooding related data that you might hold in relation to this site.
Please would you inform me of any data costs that may be incurred as soon as possible.
Should you have any queries please do not hesitate to contact me.
Yours sincerely
for RPS
file:///Q|/DLE2290%20-%20Hornsea/Geo%20Environment...FW%20Environmental%20Information%20Request%202.htm (6 of 8) [21/02/2012 15:31:37]

file:///Q|/DLE2290%20-%20Hornsea/Geo%20Environmental/Reports/FL...nce/IDB/Re%20FW%20Environmental%20Information%20Request%202.htm
This e-mail message and any attached file is the property of the sender and is sent in confidence to the addressee only.
Internet communications are not secure and RPS is not responsible for their abuse by third parties, any alteration or corruption in transmission or for any loss or damage caused by a virus or by any other means.
RPS Planning and Development Limited, company number: 02947164 ( England ). Registered office: Centurion Court , 85 Milton Park Abingdon Oxfordshire OX14 4RY.
RPS Group Plc web link: http://www.rpsgroup.com
This e-mail message and any attached file is the property of the sender and is sent in confidence to the addressee only.
Internet communications are not secure and RPS is not responsible for their abuse by third parties, any alteration or corruption in transmission or for any loss or damage caused by a
file:///Q|/DLE2290%20-%20Hornsea/Geo%20Environment...FW%20Environmental%20Information%20Request%202.htm (7 of 8) [21/02/2012 15:31:37]
file:///Q|/DLE2290%20-%20Hornsea/Geo%20Environmental/Reports/FL...nce/IDB/Re%20FW%20Environmental%20Information%20Request%202.htm
virus or by any other means.
RPS Planning and Development Limited, company number: 02947164 (England). Registered office: Centurion Court, 85 Milton Park Abingdon Oxfordshire OX14 4RY.
RPS Group Plc web link: http://www.rpsgroup.com
file:///Q|/DLE2290%20-%20Hornsea/Geo%20Environment...FW%20Environmental%20Information%20Request%202.htm (8 of 8) [21/02/2012 15:31:37]

Waterside House, Waterside North, Lincoln, LN2 5HA. Customer services line: 03708 506 506 Email: [email protected] www.environment-agency.gov.uk
Weekday Daytime calls cost 5p plus up to 6p per minute from BT Weekend Unlimited. Mobile and other providers’ charges may vary
Our ref: CCN/2011/29502 Your ref: Date: 24 November 2011
Request for information under the Freedom of Information Act 2000 (FOIA) / Environmental Information Regulations 2004 (EIR) Thank you for your email of 21 October 2011. Requests for information that is recorded are generally governed by the Freedom of Information Act 2000 (FOIA).The information you have requested is environmental and it is therefore exempted from the provisions of FOIA by FOIA s.39(1). We have therefore considered your request under the provisions of the Environmental Information Regulations 2004 (EIR). Product 3 information plus hazard mapping to follow. Other information
There are no current or dead licensed abstractions within 0.5km or site at TA 15190 19260. There are no groundwater discharges or abstractions, none active within 250 m of the site. We are not aware of any pollution incidents within 250m of the site. We can confirm that there are no recorded pollution incidents within 250 metres of the site.
Please find attached groundwater levels from the three closest monitoing points to your site. The groundwater is under pressure and lies within the confined chalk, but the rest water level is around 0 – 5 mAOD, averaging 2 – 3 mAOD in the area. The ground level of the site itself is 6 – 9 mAOD. There is anecdotal information that artesian levels (above ground level) have been witnesses during site investigations, this will be in extreme situations and will only occur seasonally if at all.
We have no reports of groundwater flooding in this area.
Groundwater vulnerability/aquifer designation – the bedrock (Burnham Chalk) is a principal aquifer, and so exhibits high intergranular and/or fracture permeability, supporting water supply and river base flow on a strategic scale. This lies under approximately 18-20 m depth of unproductive boulder clay strata.
Soil classification – ‘Holderness’ – this is slowly permeable seasonally waterlogged fine loamy soils and similar soils with only slight waterlogging. Seasonally wet deep loam. Source protection zones – there are none on site. The closest is 2 km to the west relating to an Anglian Water public water supply abstraction.
I hope the information is of use to you. Should you have any further queries please do not hesitate to contact me again. This information is subject to the attached notice, which we advise you read. If you are not satisfied with our response to your request for information you can contact us to ask for our decision to be reviewed. If you are still not satisfied following this, you can then make an appeal to the Information Commissioner, who is the statutory regulator for Freedom of Information. The address is: Office of the Information Commissioner, Wycliffe House, Water Lane, Wilmslow, Cheshire SK9 5AF . Tel: 01625 545700. Fax: 01625 524 510. E-mail:[email protected]. Website: http//www.informationcommissioner.gov.uk
Awarded to the Planning and Corporate Services Department of Anglian Region, Northern Area
Earlier this year we invited a cross-section of our customers who had made a request for information to tell us what they thought to our service. If you would like to see the results along with some of the improvements we have made, please let us know.

Contd…/Waterside House, Waterside North, Lincoln, LN2 5HA Customer services line: 03708 506 506 Email: [email protected] www.environment-agency.gov.uk
Weekday Daytime calls cost 5p plus up to 6p per minute from BT Weekend Unlimited. Mobile and other providers’ charges may vary
Our ref: CCN-2011-29502Your ref:
Date: 24 November 2011
Basic Flood Risk Assessment Data Request for land at North Killingholme TA 15190 19260
Thank you for your request of 21st October 2011 to use Environment Agency data, Product 3, in the development of the Flood Risk Assessment (FRA) for the above site. The information is attached.
If you have requested this information to help inform a development proposal, then you should note the detail in the attached advisory text on the use of Environment Agency Information for Flood Risk Assessments / Flood Consequence Assessments.
Flood MapThe attached map includes the current Flood Map for your area. The Flood Map indicates the area at risk of flooding, assuming no flood defences exist, for a flood event with a 0.5% chance of occurring in any year for flooding from the sea, or a 1% chance of occurring for fluvial (river) flooding. It also shows the extent of the Extreme Flood Outline which represents the extent of a flood event with a 0.1% chance of occurring in any year, or the highest recorded historic extent if greater.
The Flood Map only indicates the extent and likelihood of flooding from rivers or the sea. It should also be remembered that flooding may occur from other sources such as surface water sewers, road drainage, etc.
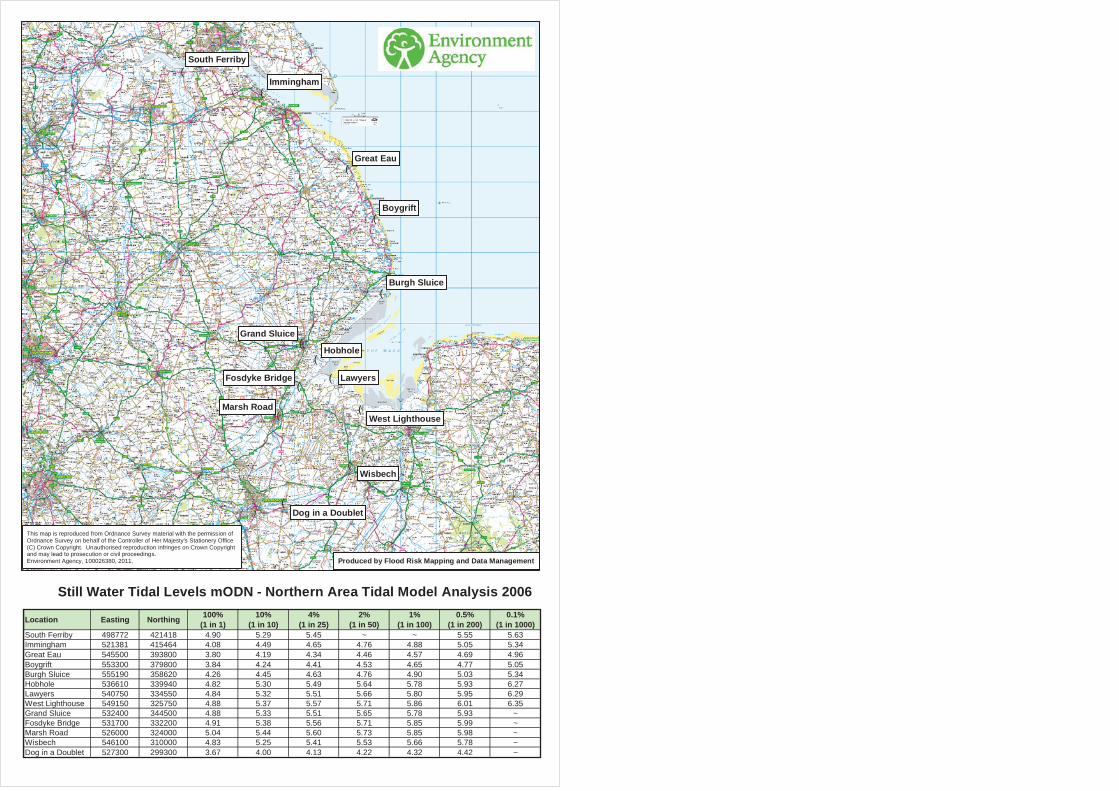
Tidal Flood LevelsPlease find attached available tidal flood levels as requested. These levels have an assessment date of 2006, which should be used in any consideration of future increases due to climate change. The levels are in metres above Ordnance Datum Newlyn (mODN) and are valid for 12 months from the date of issue.
Tidal Defence Information The tidal defences protecting this site consist of concrete floodwalls. They are in fair condition and provide protection against a flood event between a 2% chance of occurring in any year (1 in 50) and 0.67% chance of occurring in any year (1 in 150). We inspect these defences regularly to ensure that any potential defects are identified early.
2
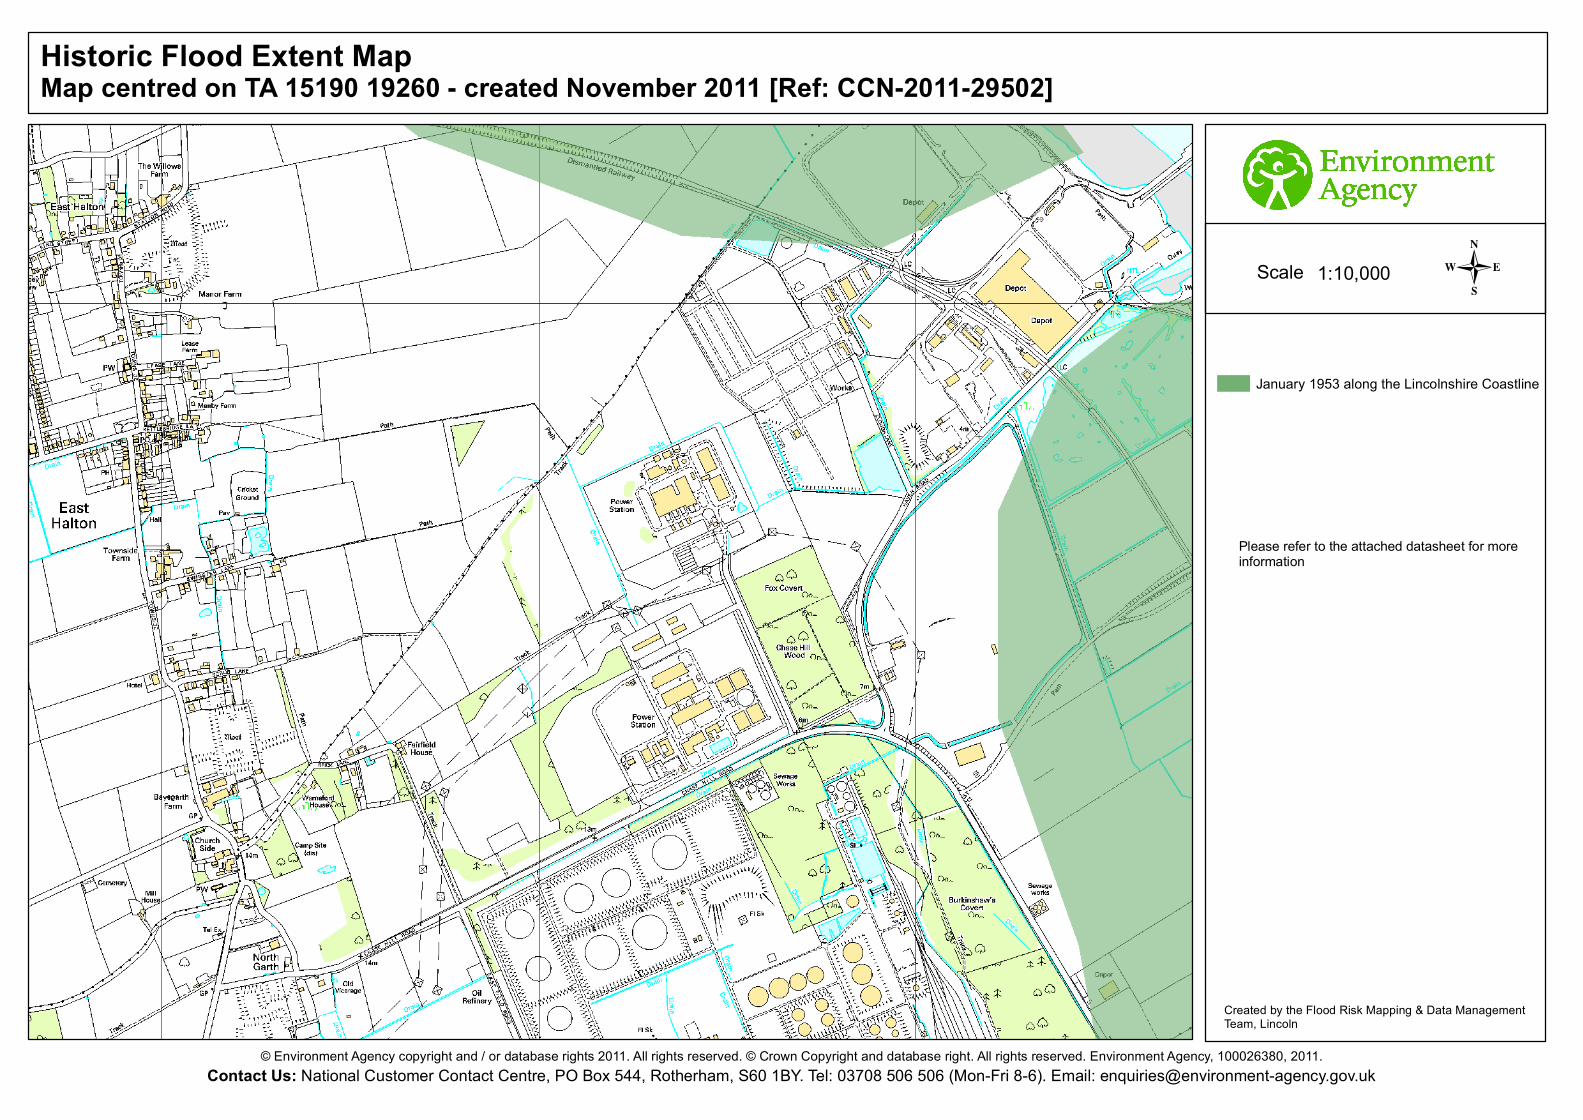
Historic Flood Extent Map A copy of the Historic Flood Extent Map for your area is enclosed. This shows the extent of previous recorded flooding in your area, notably January 1953. It is possible that other flooding may have occurred that we do not have records for, and other organisations, such as the Local Authority or Internal Drainage Boards, may have records.
Land Drainage The information provided is limited to flood risk from the sea and rivers with catchment areas greater than 3km2. The property is in an area of extensive land drainage which may pose an additional risk of flooding. Further information should be sought from the North East Lindsey Internal Drainage Board (tel: 01469 588991).
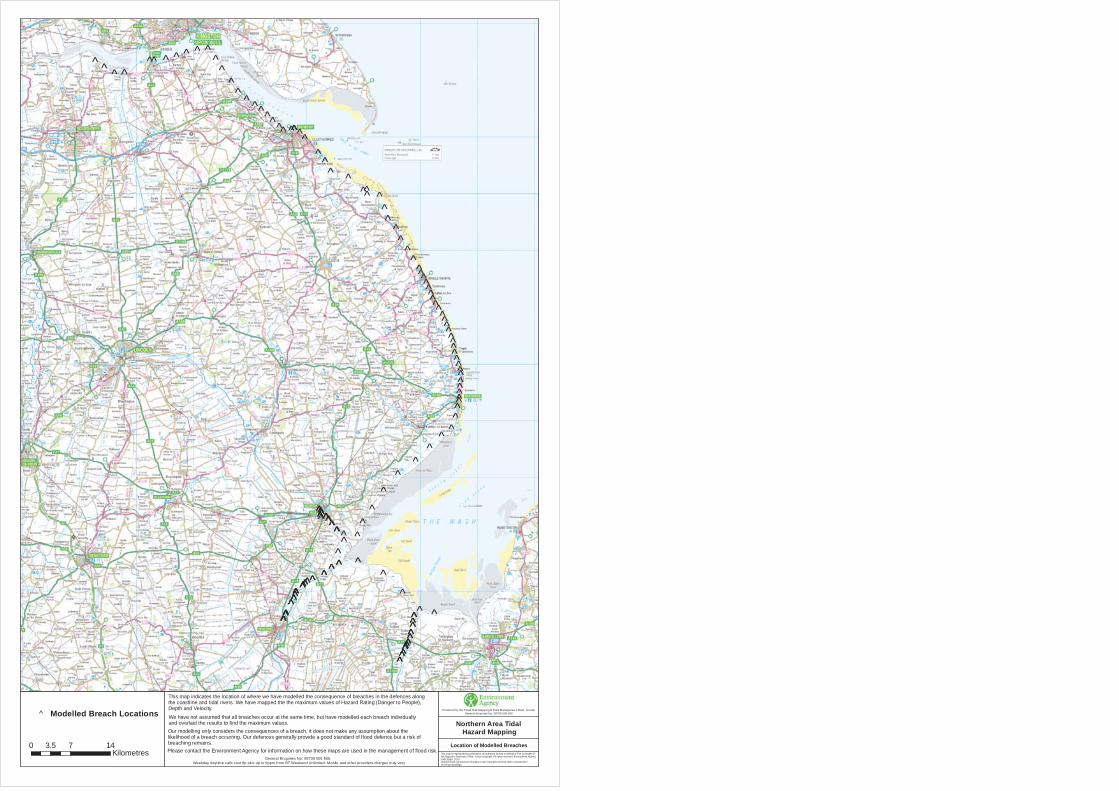
Hazard Mapping – BreachingEnclosed with this letter is a plan showing the location of the breaches we have modelled, together with two plans showing the maximum values of flood depth, velocity and hazard rating (danger to people) for the following scenarios:
Year 2115 0.5% (1 in 200) chance event Year 2115 0.1% (1 in 1000) chance event
Hazard Mapping – OvertoppingPlease find enclosed two plans showing the maximum values of flood depth, velocity and hazard rating (danger to people) resulting from simulated overtopping of defences. The plans show data for the following scenarios:
Year 2115 0.5% (1 in 200) chance event Year 2115 0.1% (1 in 1000) chance event
Your site is not affected by overtopping for the 0.1% (1 in 1000) chance event in 2006.
It is important that you read the contextual notes on the maps.
Climate Change Climate change will increase flood risk due to overtopping of defences. Please contact our Development & Flood Risk Team to discuss how this risk should be considered within your Flood Risk Assessment.
This information is provided subject to the enclosed notice, which you should read.
If you have any queries or would like to discuss the content of this letter further please contact Lisa Killick using the telephone/email details below. Please quote our CCN reference number in all correspondence where data is referenced, including the Flood Risk Assessment.

3
Enc.FRA Advisory Text Basic FRA MapHazard Maps Standard Notice

Contact Us: National Customer Contact Centre, PO Box 544, Rotherham, S60 1BY. Tel: 03708 506 506 (Mon-Fri 8-6). Email: [email protected]© Environment Agency copyright and / or database rights 2011. All rights reserved. © Crown Copyright and database right. All rights reserved. Environment Agency, 100026380, 2011.
Basic FRA Map centred on TA 15190 19260 - created November 2011 [Ref: CCN-2011-29502]
-1:10,000Scale
Main River!!!!!!!!!!!!! Raised Defences
Flood Storage AreasArea at Risk of Flooding from Rivers or The SeaExtreme Flood Outline
Dark blue shows the area that could be affected by flooding,either from rivers or the sea, if there were no flood defences. This area could be flooded: - from the sea by a flood that has a 0.5% (1 in 200) or greater chance of happening each year.- or from a river by a flood that has a 1% (1 in 100) or greaterchance of happening each year. Light blue shows the extent of the Extreme Flood Outline,which represents the extent of a flood event with a 0.1% chance of occurring in any year, or the highest recorded historic extent if greater.These two colours show the extent of the natural floodplain if there were no flood defences or certain other manmade structures and channel improvements. Sites outside the twoextents, but behind raised defences, may be affected byflooding if the defences are overtopped or fail.
Created by the Flood Risk Mapping & Data Management Team, Lincoln
!(
!(
!(
!(
!(
!(
!(
!(!(
!(!(
!(
!(
Immingham
South Ferriby
Great Eau
Lawyers
Hobhole
Boygrift
Burgh Sluice
West Lighthouse
Wisbech
Marsh Road
Grand Sluice
Dog in a Doublet
Fosdyke Bridge
Produced by Flood Risk Mapping and Data Management
This map is reproduced from Ordnance Survey material with the permission of Ordnance Survey on behalf of the Controller of Her Majesty's Stationery Office (C) Crown Copyright. Unauthorised reproduction infringes on Crown Copyright and may lead to prosecution or civil proceedings.Environment Agency, 100026380, 2011.
Still Water Tidal Levels mODN - Northern Area Tidal Model Analysis 2006
Location Easting Northing 100%(1 in 1)
10%(1 in 10)
4%(1 in 25)
2%(1 in 50)
1%(1 in 100)
0.5%(1 in 200)
0.1%(1 in 1000)
South Ferriby 498772 421418 4.90 5.29 5.45 ~ ~ 5.55 5.63Immingham 521381 415464 4.08 4.49 4.65 4.76 4.88 5.05 5.34Great Eau 545500 393800 3.80 4.19 4.34 4.46 4.57 4.69 4.96Boygrift 553300 379800 3.84 4.24 4.41 4.53 4.65 4.77 5.05Burgh Sluice 555190 358620 4.26 4.45 4.63 4.76 4.90 5.03 5.34Hobhole 536610 339940 4.82 5.30 5.49 5.64 5.78 5.93 6.27Lawyers 540750 334550 4.84 5.32 5.51 5.66 5.80 5.95 6.29West Lighthouse 549150 325750 4.88 5.37 5.57 5.71 5.86 6.01 6.35Grand Sluice 532400 344500 4.88 5.33 5.51 5.65 5.78 5.93 ~Fosdyke Bridge 531700 332200 4.91 5.38 5.56 5.71 5.85 5.99 ~Marsh Road 526000 324000 5.04 5.44 5.60 5.73 5.85 5.98 ~Wisbech 546100 310000 4.83 5.25 5.41 5.53 5.66 5.78 ~Dog in a Doublet 527300 299300 3.67 4.00 4.13 4.22 4.32 4.42 ~
Contact Us: National Customer Contact Centre, PO Box 544, Rotherham, S60 1BY. Tel: 03708 506 506 (Mon-Fri 8-6). Email: [email protected]© Environment Agency copyright and / or database rights 2011. All rights reserved. © Crown Copyright and database right. All rights reserved. Environment Agency, 100026380, 2011.
January 1953 along the Lincolnshire Coastline
Historic Flood Extent MapMap centred on TA 15190 19260 - created November 2011 [Ref: CCN-2011-29502]
-1:10,000Scale
Created by the Flood Risk Mapping & Data Management Team, Lincoln
Please refer to the attached datasheet for more information
^^
^^
^
^̂^̂̂^̂
^^
^̂^
^^
^^
^^^^^^̂^^
^^
^^^
^^^^^̂^̂^̂^̂^^̂^̂^̂^^^^̂^^^^̂^^^
^^
^^
^
^
^
^^^̂
^̂^̂̂̂
^̂̂̂^̂̂^̂
^^
^^
^
^
^ ^
^̂
^^
^^^̂
^^^^̂
^^
^^
^^
^^̂̂
^^
^̂̂
^
^
^
^^
^^^̂
^^^^̂
^^
^^
^^
^^̂̂
^^
^̂̂
^
^
^
This map is reproduced by permission of Ordnance Survey on behalf of The Controller ofHer Majesty's Stationary Office. Crown copyright.All rights reserved. Environment Agency100026380, 2010.Unauthorised reproduction infringes Crown copyright and may lead to prosecutionor civil proceedings.
Produced by the Flood Risk Mapping & Data Management Team, LincolnGeneral Enqui ries No: 08708 506 506
Northern Area TidalHazard Mapping
Location of Modelled Breaches
Modelled Breach Locations^
0 7 143.5Kilometres
We have not assumed that all breaches occur at the same time, but have modelled each breach individuallyand overlaid the results to find the maximum values.
This map indicates the location of where we have modelled the consequence of breaches in the defences alongthe coastline and tidal rivers. We have mapped the the maximum values of Hazard Rating (Danger to People),Depth and Velocity.
General Enquiries No: 08708 506 506.Weekday daytime calls cost 8p plus up to 6ppm from BT Weekend Unlimited. Mobile and other providers charges may vary
Our modelling only considers the consequences of a breach, it does not make any assumption about thelikelihood of a breach occurring. Our defences generally provide a good standard of flood defence but a risk ofbreaching remains.Please contact the Environment Agency for information on how these maps are used in the management of flood risk.
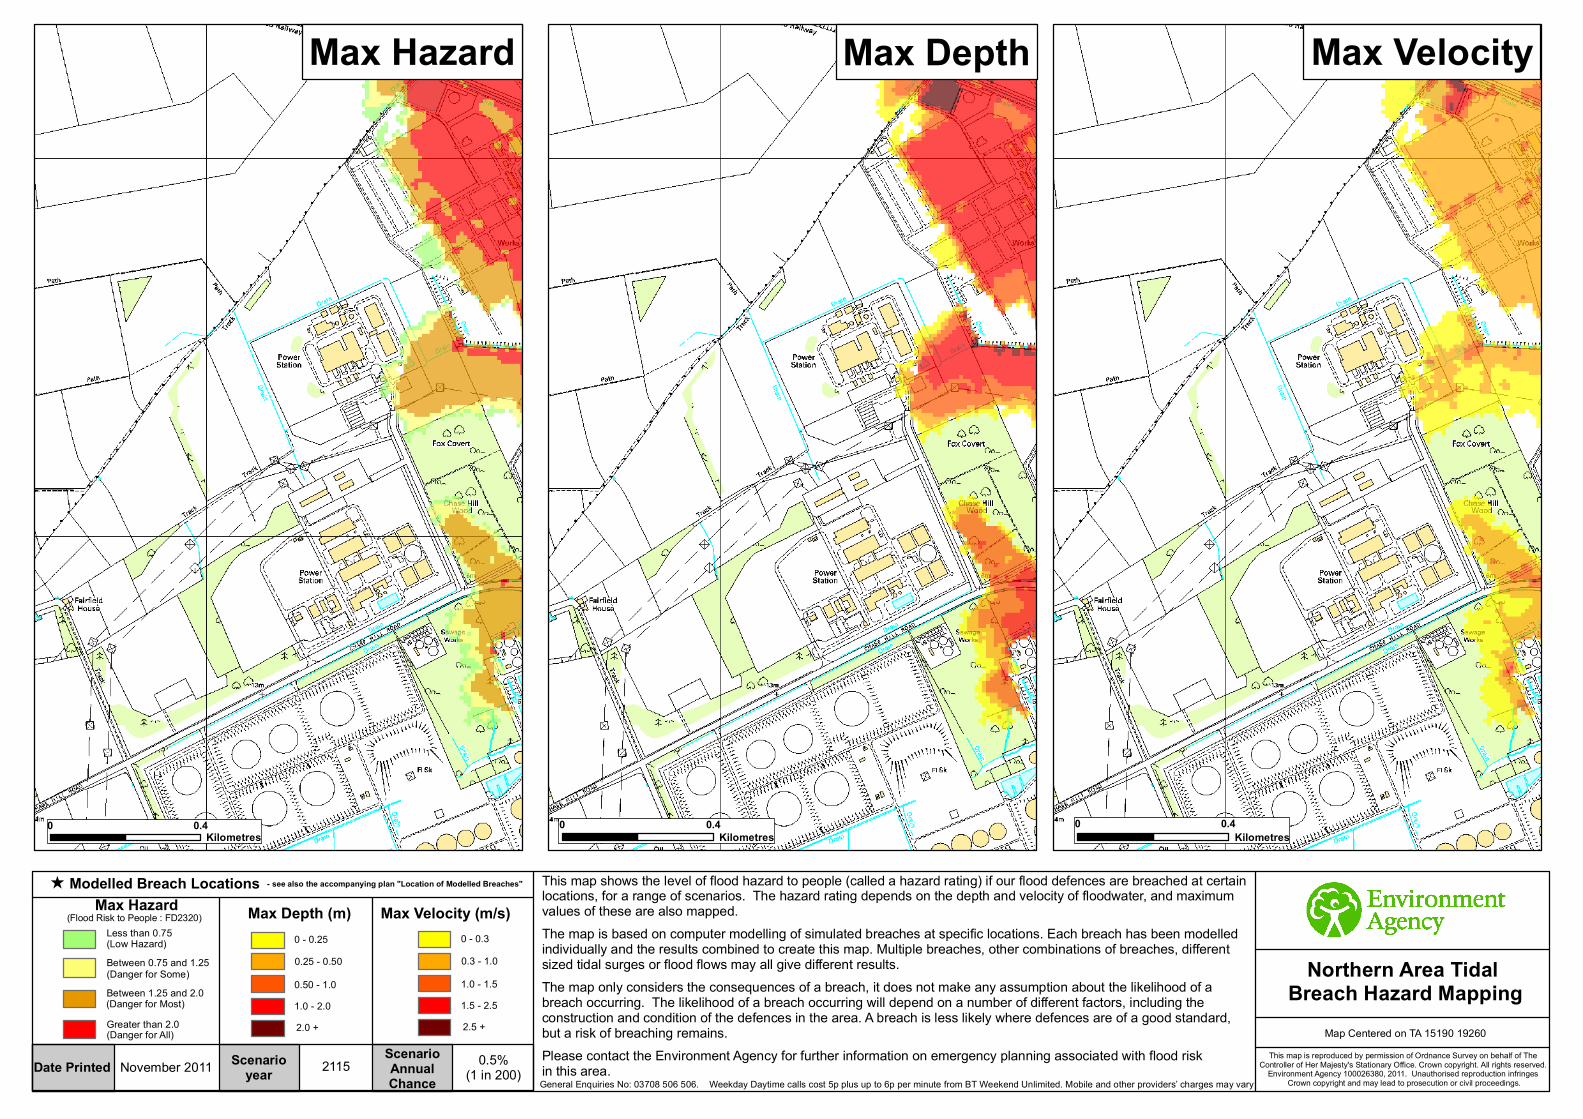
0 0.4Kilometres
0 0.4Kilometres
Max DepthMax Hazard
0 0.4Kilometres
This map is reproduced by permission of Ordnance Survey on behalf of The Controller of Her Majesty's Stationary Office. Crown copyright. All rights reserved.
Environment Agency 100026380, 2011. Unauthorised reproduction infringes Crown copyright and may lead to prosecution or civil proceedings.
ScenarioAnnualChance
ScenarioyearDate Printed
Northern Area Tidal Breach Hazard Mapping
Max Velocity
Map Centered on TA 15190 19260
2115 0.5%(1 in 200)November 2011
Modelled Breach Locations ^ - see also the accompanying plan "Location of Modelled Breaches"
General Enquiries No: 03708 506 506. Weekday Daytime calls cost 5p plus up to 6p per minute from BT Weekend Unlimited. Mobile and other providers’ charges may vary
This map shows the level of flood hazard to people (called a hazard rating) if our flood defences are breached at certain locations, for a range of scenarios. The hazard rating depends on the depth and velocity of floodwater, and maximum values of these are also mapped. The map is based on computer modelling of simulated breaches at specific locations. Each breach has been modelled individually and the results combined to create this map. Multiple breaches, other combinations of breaches, different sized tidal surges or flood flows may all give different results. The map only considers the consequences of a breach, it does not make any assumption about the likelihood of a breach occurring. The likelihood of a breach occurring will depend on a number of different factors, including the construction and condition of the defences in the area. A breach is less likely where defences are of a good standard, but a risk of breaching remains. Please contact the Environment Agency for further information on emergency planning associated with flood riskin this area.
Max HazardLess than 0.75
Between 1.25 and 2.0
Greater than 2.0(Danger for All)
(Danger for Most)
(Danger for Some)
(Low Hazard)Between 0.75 and 1.25
(Flood Risk to People : FD2320)0 - 0.250.25 - 0.500.50 - 1.01.0 - 2.02.0 +
Max Depth (m)0 - 0.30.3 - 1.01.0 - 1.51.5 - 2.52.5 +
Max Velocity (m/s)
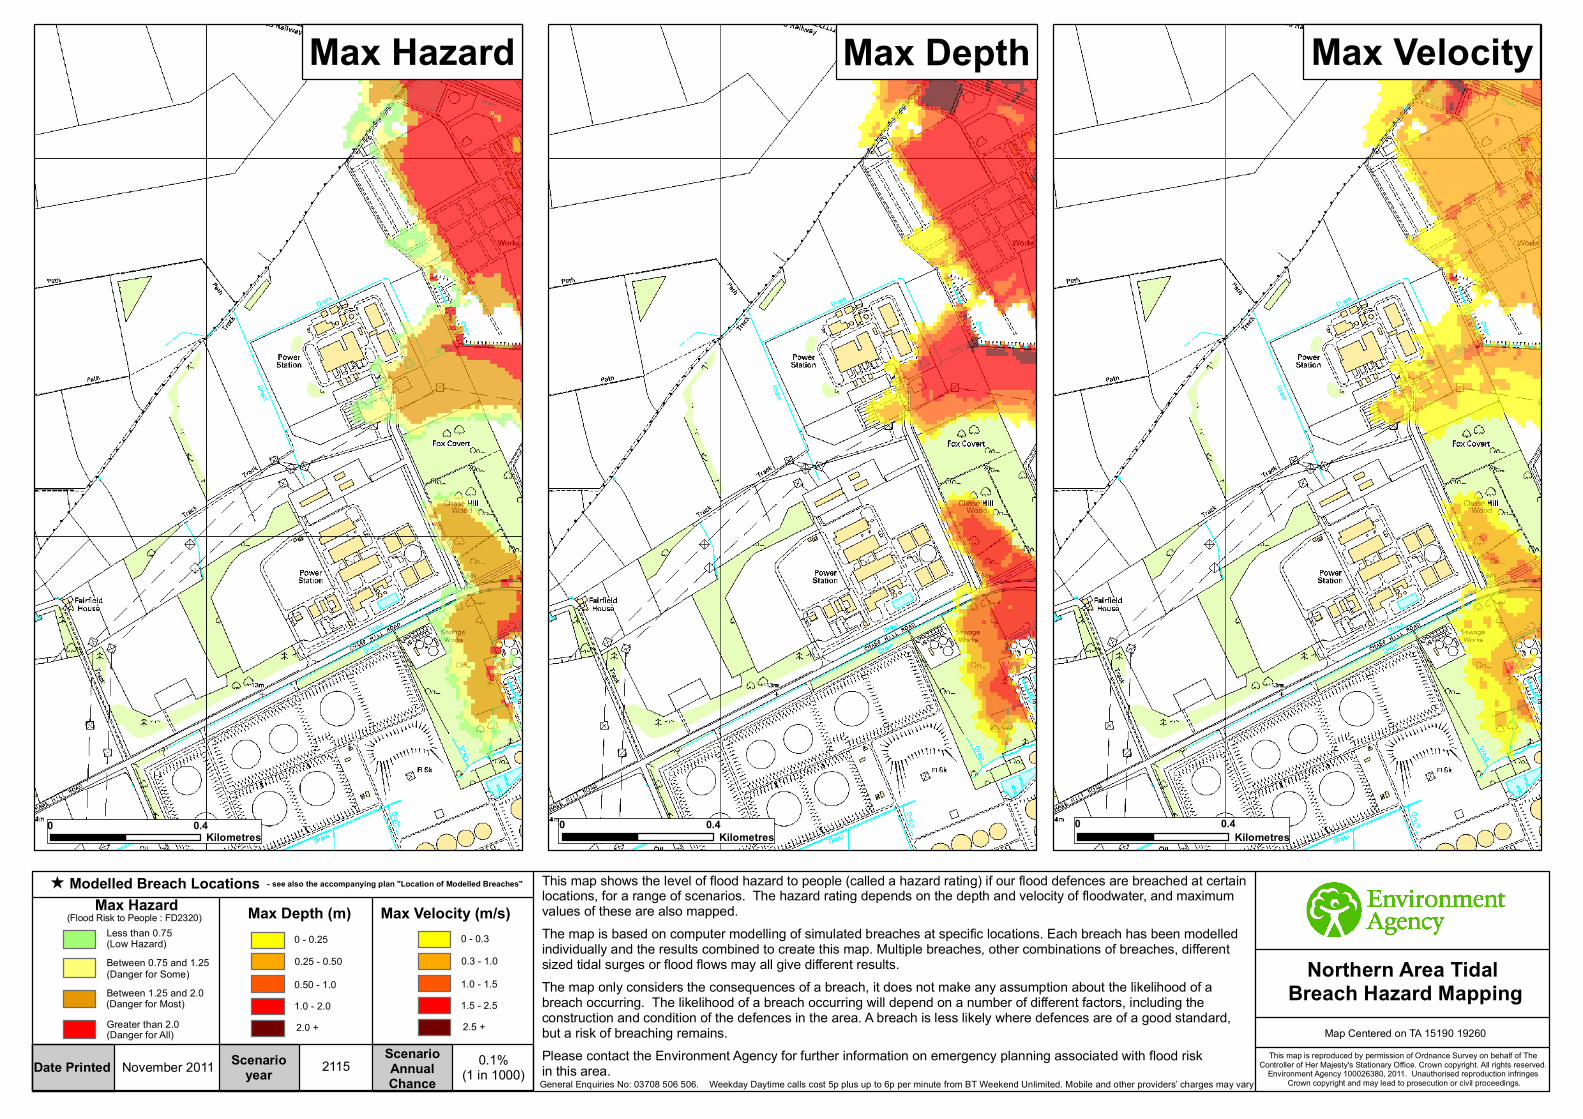
0 0.4Kilometres
0 0.4Kilometres
Max DepthMax Hazard
0 0.4Kilometres
This map is reproduced by permission of Ordnance Survey on behalf of The Controller of Her Majesty's Stationary Office. Crown copyright. All rights reserved.
Environment Agency 100026380, 2011. Unauthorised reproduction infringes Crown copyright and may lead to prosecution or civil proceedings.
ScenarioAnnualChance
ScenarioyearDate Printed
Northern Area Tidal Breach Hazard Mapping
Max Velocity
Map Centered on TA 15190 19260
2115 0.1%(1 in 1000)November 2011
Modelled Breach Locations ^ - see also the accompanying plan "Location of Modelled Breaches"
General Enquiries No: 03708 506 506. Weekday Daytime calls cost 5p plus up to 6p per minute from BT Weekend Unlimited. Mobile and other providers’ charges may vary
This map shows the level of flood hazard to people (called a hazard rating) if our flood defences are breached at certain locations, for a range of scenarios. The hazard rating depends on the depth and velocity of floodwater, and maximum values of these are also mapped. The map is based on computer modelling of simulated breaches at specific locations. Each breach has been modelled individually and the results combined to create this map. Multiple breaches, other combinations of breaches, different sized tidal surges or flood flows may all give different results. The map only considers the consequences of a breach, it does not make any assumption about the likelihood of a breach occurring. The likelihood of a breach occurring will depend on a number of different factors, including the construction and condition of the defences in the area. A breach is less likely where defences are of a good standard, but a risk of breaching remains. Please contact the Environment Agency for further information on emergency planning associated with flood riskin this area.
Max HazardLess than 0.75
Between 1.25 and 2.0
Greater than 2.0(Danger for All)
(Danger for Most)
(Danger for Some)
(Low Hazard)Between 0.75 and 1.25
(Flood Risk to People : FD2320)0 - 0.250.25 - 0.500.50 - 1.01.0 - 2.02.0 +
Max Depth (m)0 - 0.30.3 - 1.01.0 - 1.51.5 - 2.52.5 +
Max Velocity (m/s)
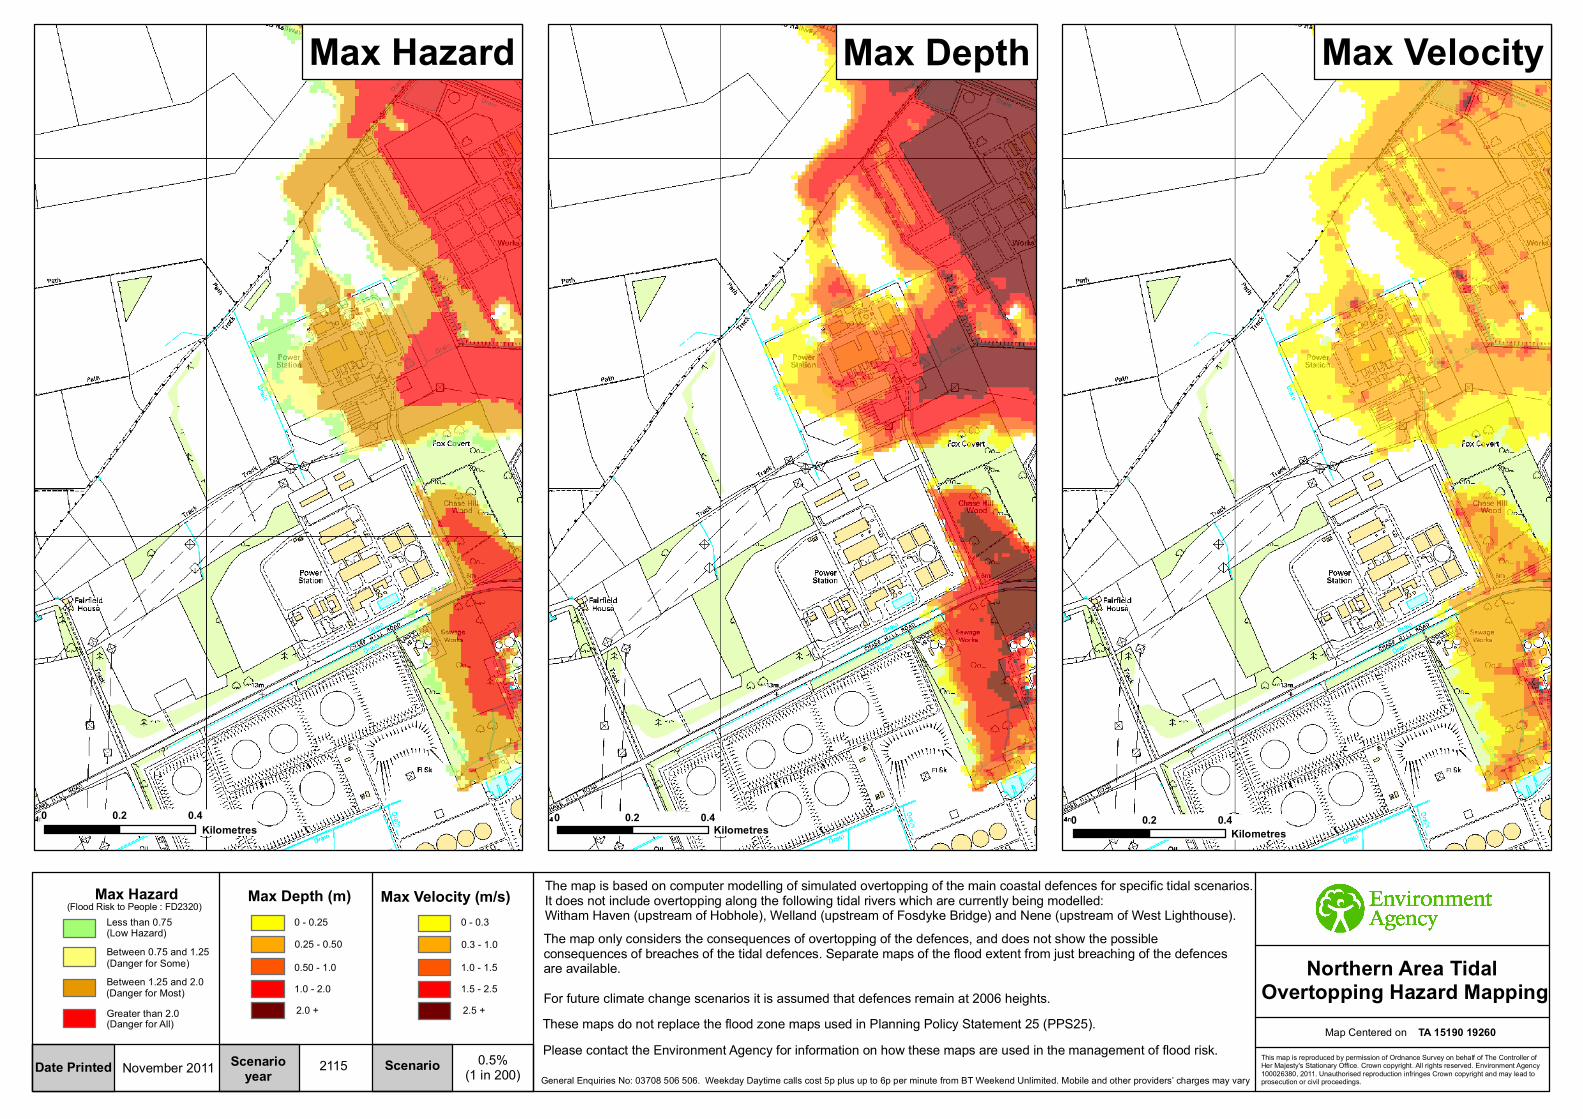
0 0.2 0.4Kilometres 0 0.2 0.4
Kilometres
Max DepthMax Hazard
0 0.2 0.4Kilometres
This map is reproduced by permission of Ordnance Survey on behalf of The Controller of Her Majesty's Stationary Office. Crown copyright. All rights reserved. Environment Agency 100026380, 2011. Unauthorised reproduction infringes Crown copyright and may lead to prosecution or civil proceedings.
ScenarioScenarioyearDate Printed
Northern Area Tidal Overtopping Hazard Mapping
Max Velocity
Map Centered on TA 15190 19260
Max HazardLess than 0.75
Between 1.25 and 2.0
Greater than 2.0
0 - 0.250.25 - 0.500.50 - 1.01.0 - 2.02.0 +
0 - 0.30.3 - 1.01.0 - 1.51.5 - 2.52.5 +
Max Depth (m) Max Velocity (m/s)
(Danger for All)
(Danger for Most)
(Danger for Some)
(Low Hazard)Between 0.75 and 1.25
(Flood Risk to People : FD2320)
2115 0.5%(1 in 200)November 2011
General Enquiries No: 03708 506 506. Weekday Daytime calls cost 5p plus up to 6p per minute from BT Weekend Unlimited. Mobile and other providers’ charges may vary
The map is based on computer modelling of simulated overtopping of the main coastal defences for specific tidal scenarios. It does not include overtopping along the following tidal rivers which are currently being modelled: Witham Haven (upstream of Hobhole), Welland (upstream of Fosdyke Bridge) and Nene (upstream of West Lighthouse).The map only considers the consequences of overtopping of the defences, and does not show the possibleconsequences of breaches of the tidal defences. Separate maps of the flood extent from just breaching of the defencesare available. For future climate change scenarios it is assumed that defences remain at 2006 heights.
Please contact the Environment Agency for information on how these maps are used in the management of flood risk.These maps do not replace the flood zone maps used in Planning Policy Statement 25 (PPS25).

0 0.2 0.4Kilometres 0 0.2 0.4
Kilometres
Max DepthMax Hazard
0 0.2 0.4Kilometres
This map is reproduced by permission of Ordnance Survey on behalf of The Controller of Her Majesty's Stationary Office. Crown copyright. All rights reserved. Environment Agency 100026380, 2011. Unauthorised reproduction infringes Crown copyright and may lead to prosecution or civil proceedings.
ScenarioScenarioyearDate Printed
Northern Area Tidal Overtopping Hazard Mapping
Max Velocity
Map Centered on TA 15190 19260
Max HazardLess than 0.75
Between 1.25 and 2.0
Greater than 2.0
0 - 0.250.25 - 0.500.50 - 1.01.0 - 2.02.0 +
0 - 0.30.3 - 1.01.0 - 1.51.5 - 2.52.5 +
Max Depth (m) Max Velocity (m/s)
(Danger for All)
(Danger for Most)
(Danger for Some)
(Low Hazard)Between 0.75 and 1.25
(Flood Risk to People : FD2320)
2115 0.1%(1 in 1000)November 2011
General Enquiries No: 03708 506 506. Weekday Daytime calls cost 5p plus up to 6p per minute from BT Weekend Unlimited. Mobile and other providers’ charges may vary
The map is based on computer modelling of simulated overtopping of the main coastal defences for specific tidal scenarios. It does not include overtopping along the following tidal rivers which are currently being modelled: Witham Haven (upstream of Hobhole), Welland (upstream of Fosdyke Bridge) and Nene (upstream of West Lighthouse).The map only considers the consequences of overtopping of the defences, and does not show the possibleconsequences of breaches of the tidal defences. Separate maps of the flood extent from just breaching of the defencesare available. For future climate change scenarios it is assumed that defences remain at 2006 heights.
Please contact the Environment Agency for information on how these maps are used in the management of flood risk.These maps do not replace the flood zone maps used in Planning Policy Statement 25 (PPS25).
Use of Environment Agency Information for Flood Risk / Flood Consequence Assessments
ImportantIf you have requested this information to help inform a development proposal, then we recommend that you undertake a formal pre-application enquiry using the form available from our website:-
http://www.environment-agency.gov.uk/research/planning/33580.aspx
Depending on the enquiry, we may also provide advice on other issues related to our responsibilities including flooding, waste, land contamination, water quality, biodiversity, navigation, pollution, water resources, foul drainage or Environmental Impact Assessment.
In England, you should refer to the Environment Agency’s Flood Risk Standing Advice and PPS25 and its associated Practice Guide for information about what flood risk assessment is needed for new development in the different flood zones. These documents can be accessed via:
http://www.environment-agency.gov.uk/research/planning/82587.aspx http://www.communities.gov.uk/publications/planningandbuilding/pps25floodrisk http://www.communities.gov.uk/publications/planningandbuilding/pps25practiceguide
You should also consult the Strategic Flood Risk Assessment produced by your local planning authority.
In Wales, you should refer to TAN15 for information about what flood consequence assessment is needed for new development in the different flood zoneshttp://new.wales.gov.uk/splash;jsessionid=8ylGTfGZthmB0t2vhp6hS1GcB1LXvZzB3Ylczf20Xn7LK3zK0nMk!981825250?orig=/topics/planning/policy/tans/tan15/
You should also consult the Strategic Flood Consequence Assessment if one has been produced by your local planning authority.
In both England and Wales you should note that:
1. Information supplied by the Environment Agency may be used to assist in producing a Flood Risk / Consequence Assessment (FRA / FCA) where one is required, but does not constitute such an assessment on its own.
2. This information covers flood risk from main rivers and the sea, and you will need to consider other potential sources of flooding, such as
98_07_SD03, Version 2
groundwater or overland runoff. The information produced by the local planning authority referred to above may assist here.
3. Where a planning application requires a FRA / FCA and this is not submitted or deficient, the Environment Agency may well raise an objection.
4. For more significant proposals in higher flood risk areas, we would be pleased to discuss details with you ahead of making any planning application, and you should also discuss the matter with your local planning authority.
98_07_SD03, Version 2
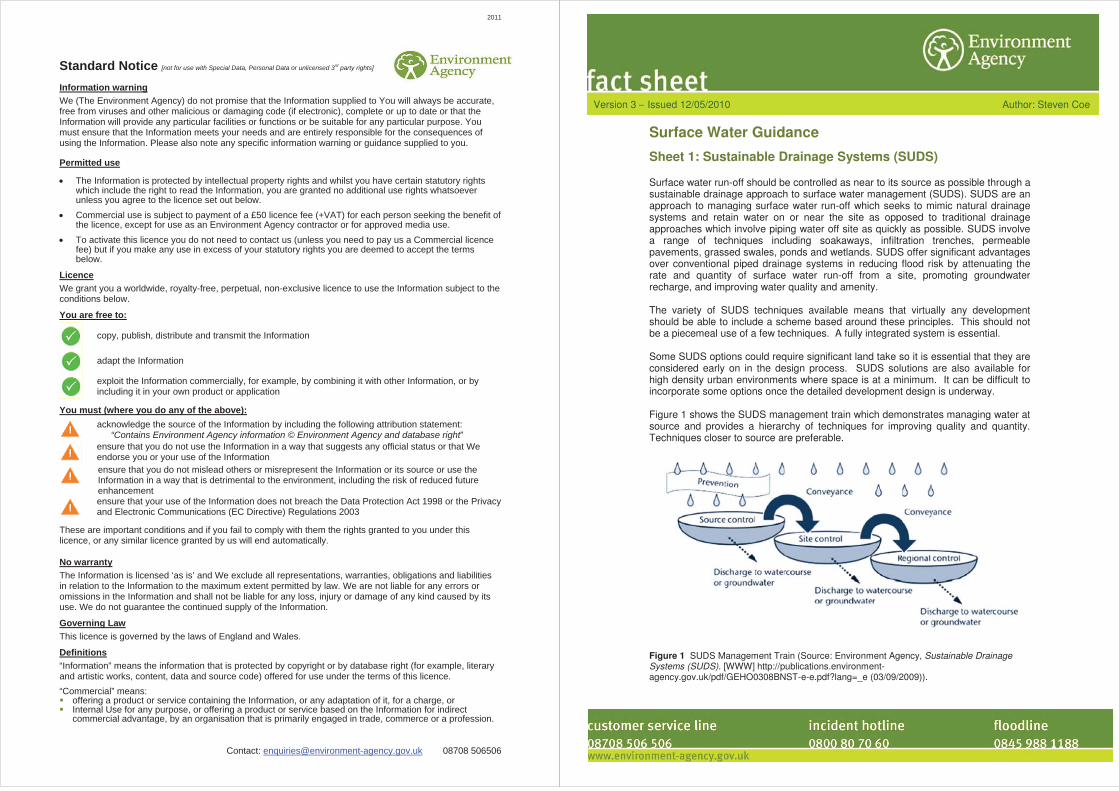
2011
Contact: [email protected] 08708 506506
Standard Notice [not for use with Special Data, Personal Data or unlicensed 3rd party rights]
Information warningWe (The Environment Agency) do not promise that the Information supplied to You will always be accurate, free from viruses and other malicious or damaging code (if electronic), complete or up to date or that the Information will provide any particular facilities or functions or be suitable for any particular purpose. You must ensure that the Information meets your needs and are entirely responsible for the consequences of using the Information. Please also note any specific information warning or guidance supplied to you.
Permitted use
The Information is protected by intellectual property rights and whilst you have certain statutory rights which include the right to read the Information, you are granted no additional use rights whatsoever unless you agree to the licence set out below.
Commercial use is subject to payment of a £50 licence fee (+VAT) for each person seeking the benefit of the licence, except for use as an Environment Agency contractor or for approved media use.
To activate this licence you do not need to contact us (unless you need to pay us a Commercial licence fee) but if you make any use in excess of your statutory rights you are deemed to accept the terms below.
LicenceWe grant you a worldwide, royalty-free, perpetual, non-exclusive licence to use the Information subject to the conditions below.
You are free to:
copy, publish, distribute and transmit the Information
adapt the Information
exploit the Information commercially, for example, by combining it with other Information, or by including it in your own product or application
You must (where you do any of the above):acknowledge the source of the Information by including the following attribution statement:
“Contains Environment Agency information © Environment Agency and database right”ensure that you do not use the Information in a way that suggests any official status or that We endorse you or your use of the Information ensure that you do not mislead others or misrepresent the Information or its source or use the Information in a way that is detrimental to the environment, including the risk of reduced future enhancement ensure that your use of the Information does not breach the Data Protection Act 1998 or the Privacy and Electronic Communications (EC Directive) Regulations 2003
These are important conditions and if you fail to comply with them the rights granted to you under this licence, or any similar licence granted by us will end automatically.
No warrantyThe Information is licensed ‘as is’ and We exclude all representations, warranties, obligations and liabilities in relation to the Information to the maximum extent permitted by law. We are not liable for any errors or omissions in the Information and shall not be liable for any loss, injury or damage of any kind caused by its use. We do not guarantee the continued supply of the Information.
Governing LawThis licence is governed by the laws of England and Wales.
Definitions“Information” means the information that is protected by copyright or by database right (for example, literary and artistic works, content, data and source code) offered for use under the terms of this licence. “Commercial” means:
offering a product or service containing the Information, or any adaptation of it, for a charge, or Internal Use for any purpose, or offering a product or service based on the Information for indirect commercial advantage, by an organisation that is primarily engaged in trade, commerce or a profession.
Surface Water Guidance
Sheet 1: Sustainable Drainage Systems (SUDS) Surface water run-off should be controlled as near to its source as possible through a sustainable drainage approach to surface water management (SUDS). SUDS are an approach to managing surface water run-off which seeks to mimic natural drainage systems and retain water on or near the site as opposed to traditional drainage approaches which involve piping water off site as quickly as possible. SUDS involve a range of techniques including soakaways, infiltration trenches, permeable pavements, grassed swales, ponds and wetlands. SUDS offer significant advantages over conventional piped drainage systems in reducing flood risk by attenuating the rate and quantity of surface water run-off from a site, promoting groundwater recharge, and improving water quality and amenity. The variety of SUDS techniques available means that virtually any development should be able to include a scheme based around these principles. This should not be a piecemeal use of a few techniques. A fully integrated system is essential. Some SUDS options could require significant land take so it is essential that they are considered early on in the design process. SUDS solutions are also available for high density urban environments where space is at a minimum. It can be difficult to incorporate some options once the detailed development design is underway. Figure 1 shows the SUDS management train which demonstrates managing water at source and provides a hierarchy of techniques for improving quality and quantity. Techniques closer to source are preferable.
Figure 1 SUDS Management Train (Source: Environment Agency, Sustainable Drainage Systems (SUDS). [WWW] http://publications.environment-agency.gov.uk/pdf/GEHO0308BNST-e-e.pdf?lang=_e (03/09/2009)).
Version 3 – Issued 12/05/2010 Author: Steven Coe

Figure 2 shows the SUDS hierarchy with the most sustainable solutions at the top of the table. These meet all 3 of the SUDS criteria.
Figure 2 SUDS Hierarchy. (Source: Environment Agency Thames Region, 2006, SUDS A Practical Guide). Further Information
• Planning Policy Statement 25: Development and Flood Risk and the accompanying Practice Guide.
• CIRIA 523 (SUDS Best Practice Manual) • CIRIA 609 (SUDS – hydraulic, structural and water quality advice) • CIRIA 697 (SUDS Manual) • CIRIA R156 (Infiltration Drainage – Manual of Good Practice) • Sustainable Drainage Systems (SUDS) – Environment Agency (see
www.environment-agency.gov.uk/suds for details) Floods and Water Management Act The Floods and Water Management Bill become legislation in April 2010. It will require developers to include sustainable drainage, where practicable, in new developments. These should be built to standards which reduce flood risk and improve water quality. The use of sustainable drainage systems will be encouraged by removing the right to connect surface water run-off to public sewers. A SUDS approving body will become responsible for approving, adopting and maintaining new sustainable drainage systems where they affect more than one property. This will generally be the local authority/county council. *Calls to 0870 numbers – Weekday Daytime calls to 0870 numbers cost 8p, plus up to 6p per minute from BT Weekend Unlimited. Mobile and other providers’ charges may vary.
Surface Water Guidance
Sheet 2: Planning Application Guidance For development on sites of 1 hectare or greater, regardless of flood zone, the potential to increase flood risk elsewhere through the addition of hard surfaces and the effect of the new development on surface water runoff should be incorporated in a Flood Risk Assessment (FRA). An application for Outline planning permission should include details of 1 workable solution for managing surface water (this may alter at the detailed application stage). Applications for Full permission should also refer to Surface Water Guidance Sheet 3 for what information will be required to discharge a condition. The following is a list of the information needed for the Environment Agency to recommend a surface water drainage condition. This is intended only as a starting point. It is critical to contact your local Development & Flood Risk team to discuss any further – particularly local – flood risk issues.
1) Demonstrate how SUDS options have been considered. Refer to the SUDS management train and hierarchy and justify the chosen method(s) of surface water disposal (see Surface Water Guidance Sheet 1).
2) Areas of permeable and impermeable land for both the existing site and the
proposed development to be used to assess the change in surface water runoff. The site characteristics such as how surface water management is functioning on the site at present should be investigated.
3) Consideration should be given to sub-catchments which may exist on the site.
Calculations for greenfield runoff rates for individual watercourses should be based on the proposed area of impermeable land within its sub-catchment. It may be possible to divert water to a different sub-catchment only if the greenfield runoff rate for that watercourse is not exceeded.
4) Establish the permitted discharge rate in accordance with the following
information: Undeveloped (Greenfield) Sites
• Written confirmation of the discharge rate as agreed by the receiving drainage body (i.e. Water Company or the Internal Drainage Board).
• For discharge into a Main River or an Ordinary Watercourse outside of the Internal Drainage Board District the discharge rate will be based on the calculated pre-development (greenfield) runoff rate for the site and for a simple control structure will be based on the QBAR rate. This should be agreed in discussions with the Environment Agency.
• See the Appendix for the methods which can be used to calculate greenfield runoff.
• If complex controls are to be used for control of discharge rates calculations for the greenfield runoff rate should be provided for the 1, 30 and 100 year return periods. The methodology in the EA/Defra
Version 3 – Issued 12/05/2010 Author: Steven Coe

document “Preliminary Rainfall Runoff Management for Development (W5-074/A/TR1) should be used as the basis for calculations.
Previously Developed (Brownfield) Sites
• Brownfield sites are strongly encouraged to discharge at the original pre-development (greenfield) rate where possible. If not, a significant reduction in the current rate of discharge should be achieved and agreed with the relevant Drainage Body.
5) If discharging into an Ordinary Watercourse outside an IDB area an
assessment of the offsite flow should be made. Further information will be required as to whether the watercourse will be able to convey the proposed discharge rate and volume if it is known to be sensitive to increased discharge or has a history of flooding problems.
6) If proposing to discharge to soakaways then percolation tests should be
submitted in accordance with BRE Digest 365 or CIRIA guidance R156.
7) An assessment of the volume of attenuation storage that would be required on site. This should be based on the 100 year critical storm duration with climate change for the site (see Annex B table B.2 of PPS 25 for appropriate climate change allowances) and the allowable discharge rate. FSR (Flood Studies Report) rainfall data should be used for storm durations less than 1 hour and FEH (Flood Estimation Handbook) rainfall data should be used for storm durations greater than 1 hour when identifying the critical storm duration. The method of attenuation should be identified and located on a plan of the site.
8) An assessment of the need for Long Term Storage. This will address the
additional volume of runoff generated by the development. See the EA/Defra document “Preliminary Rainfall Runoff Management for Development” (W5-074/A/TR1) for further information. The need for this provision will vary between sites so contact the relevant Development and Flood Risk Team for advice before commencing the assessment.
Contact can be made with the local Environment Agency Development and Flood Risk team on 08708 506 506*. It may be necessary to apply for a Flood Defence Consent for the construction of certain works which can also be discussed with the local team on the above number. Please also see www.environment-agency.gov.uk for further details. *Calls to 0870 numbers – Weekday Daytime calls to 0870 numbers cost 8p, plus up to 6p per minute from BT Weekend Unlimited. Mobile and other providers’ charges may vary. Further Information
• Planning Policy Statement 25: Development and Flood Risk and the accompanying Practice Guide.
• R&D Technical Report W5-074/A/TR/1 Revision D, Preliminary rainfall runoff management for developments.
• BRE Digest 365 (Soakaway Design) • CIRIA 523 (SUDS Best Practice Manual) • CIRIA 609 (SUDS – hydraulic, structural and water quality advice) • CIRIA 697 (SUDS Manual) • CIRIA R156 (Infiltration Drainage – Manual of Good Practice)
Appendix
Figure 1 Tools to be used for calculation of greenfield runoff criteria (Source: DEFRA / ENVIRONMENT AGENCY, 2005. Preliminary rainfall runoff management for developments R&D Technical Report W5-074/A/TR/1, Revision D. Bristol: Environment Agency).
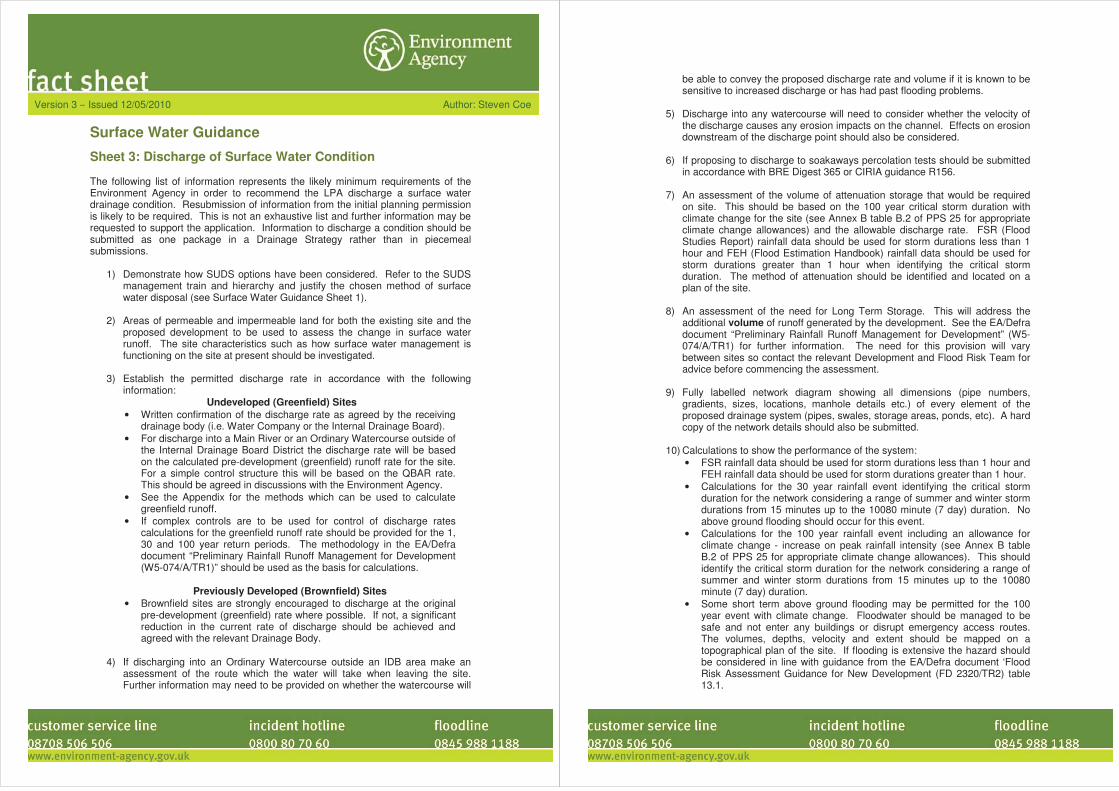
Surface Water Guidance
Sheet 3: Discharge of Surface Water Condition The following list of information represents the likely minimum requirements of the Environment Agency in order to recommend the LPA discharge a surface water drainage condition. Resubmission of information from the initial planning permission is likely to be required. This is not an exhaustive list and further information may be requested to support the application. Information to discharge a condition should be submitted as one package in a Drainage Strategy rather than in piecemeal submissions.
1) Demonstrate how SUDS options have been considered. Refer to the SUDS management train and hierarchy and justify the chosen method of surface water disposal (see Surface Water Guidance Sheet 1).
2) Areas of permeable and impermeable land for both the existing site and the
proposed development to be used to assess the change in surface water runoff. The site characteristics such as how surface water management is functioning on the site at present should be investigated.
3) Establish the permitted discharge rate in accordance with the following
information: Undeveloped (Greenfield) Sites
• Written confirmation of the discharge rate as agreed by the receiving drainage body (i.e. Water Company or the Internal Drainage Board).
• For discharge into a Main River or an Ordinary Watercourse outside of the Internal Drainage Board District the discharge rate will be based on the calculated pre-development (greenfield) runoff rate for the site. For a simple control structure this will be based on the QBAR rate. This should be agreed in discussions with the Environment Agency.
• See the Appendix for the methods which can be used to calculate greenfield runoff.
• If complex controls are to be used for control of discharge rates calculations for the greenfield runoff rate should be provided for the 1, 30 and 100 year return periods. The methodology in the EA/Defra document “Preliminary Rainfall Runoff Management for Development (W5-074/A/TR1)” should be used as the basis for calculations.
Previously Developed (Brownfield) Sites
• Brownfield sites are strongly encouraged to discharge at the original pre-development (greenfield) rate where possible. If not, a significant reduction in the current rate of discharge should be achieved and agreed with the relevant Drainage Body.
4) If discharging into an Ordinary Watercourse outside an IDB area make an
assessment of the route which the water will take when leaving the site. Further information may need to be provided on whether the watercourse will
Version 3 – Issued 12/05/2010 Author: Steven Coe
be able to convey the proposed discharge rate and volume if it is known to be sensitive to increased discharge or has had past flooding problems.
5) Discharge into any watercourse will need to consider whether the velocity of
the discharge causes any erosion impacts on the channel. Effects on erosion downstream of the discharge point should also be considered.
6) If proposing to discharge to soakaways percolation tests should be submitted
in accordance with BRE Digest 365 or CIRIA guidance R156.
7) An assessment of the volume of attenuation storage that would be required on site. This should be based on the 100 year critical storm duration with climate change for the site (see Annex B table B.2 of PPS 25 for appropriate climate change allowances) and the allowable discharge rate. FSR (Flood Studies Report) rainfall data should be used for storm durations less than 1 hour and FEH (Flood Estimation Handbook) rainfall data should be used for storm durations greater than 1 hour when identifying the critical storm duration. The method of attenuation should be identified and located on a plan of the site.
8) An assessment of the need for Long Term Storage. This will address the
additional volume of runoff generated by the development. See the EA/Defra document “Preliminary Rainfall Runoff Management for Development” (W5-074/A/TR1) for further information. The need for this provision will vary between sites so contact the relevant Development and Flood Risk Team for advice before commencing the assessment.
9) Fully labelled network diagram showing all dimensions (pipe numbers,
gradients, sizes, locations, manhole details etc.) of every element of the proposed drainage system (pipes, swales, storage areas, ponds, etc). A hard copy of the network details should also be submitted.
10) Calculations to show the performance of the system:
• FSR rainfall data should be used for storm durations less than 1 hour and FEH rainfall data should be used for storm durations greater than 1 hour.
• Calculations for the 30 year rainfall event identifying the critical storm duration for the network considering a range of summer and winter storm durations from 15 minutes up to the 10080 minute (7 day) duration. No above ground flooding should occur for this event.
• Calculations for the 100 year rainfall event including an allowance for climate change - increase on peak rainfall intensity (see Annex B table B.2 of PPS 25 for appropriate climate change allowances). This should identify the critical storm duration for the network considering a range of summer and winter storm durations from 15 minutes up to the 10080 minute (7 day) duration.
• Some short term above ground flooding may be permitted for the 100 year event with climate change. Floodwater should be managed to be safe and not enter any buildings or disrupt emergency access routes. The volumes, depths, velocity and extent should be mapped on a topographical plan of the site. If flooding is extensive the hazard should be considered in line with guidance from the EA/Defra document ‘Flood Risk Assessment Guidance for New Development (FD 2320/TR2) table 13.1.
• Details of any online or offline control structures to be used such as complex controls or vortex flow controls or attenuation ponds.
• Consideration of a surcharged outfall. The standard default setting of many surface water computer modelling programmes assumes a freely discharging outfall. Careful consideration is required and evidence provided to demonstrate that this assumption is correct. In many circumstances an outfall maybe surcharged affecting its hydraulic capacity and impacting on the surface water network. A surcharged outfall is likely to occur if discharging into a watercourse or surface water network near capacity. In these scenarios and with the absence of supporting information to the contrary it is expected the surface water calculations will assume a surcharged outfall.
• It is important that the above calculations and input data are submitted as a hard copy.
• If computer modelling software has been used suitable model files must be submitted on a CD in order to accurately assess the modelled information.
11) If any land raising is proposed on site the surface water strategy should
consider the effect this could have on runoff leaving the site and affecting third parties. The most appropriate solution(s) to prevent this will need to be assessed.
12) Details of the party/parties responsible for the long term management of
every element of the proposed drainage system.
13) Summary report to include: • The methodology applied in the calculations for the scheme. This should
include the global variables and any assumptions used. • An explanation of how the system operates. • An assessment of the route which the water will take when leaving the
site and whether the receiving watercourse or sewer network will be able to convey the proposed discharge.
In order that any pertinent – particularly local – issues are addressed, it is important that contact is made with the local Environment Agency Development and Flood Risk team to discuss your proposals. Please call 08708 506 506*. It may be necessary to apply for a Flood Defence Consent for the construction of certain works which can also be discussed with the local team on the above number. Please also see www.environment-agency.gov.uk for further details. *Calls to 0870 numbers – Weekday Daytime calls to 0870 numbers cost 8p, plus up to 6p per minute from BT Weekend Unlimited. Mobile and other providers’ charges may vary. Further Information
• Planning Policy Statement 25: Development and Flood Risk and the accompanying Practice Guide.
• R&D Technical Report W5-074/A/TR/1, Preliminary rainfall runoff management for developments – refer to the most up to date Revision.
• R&D Technical Report FD 2320/TR2, Flood Risk Assessment Guidance for New Development. • BRE Digest 365 (Soakaway Design) • CIRIA 523 (SUDS Best Practice Manual) • CIRIA 609 (SUDS – hydraulic, structural and water quality advice) • CIRIA 697 (SUDS Manual) • CIRIA R156 (Infiltration Drainage – Manual of Good Practice)
Ireland. Registered number: 453076. Registered address: Arena House, Arena Road,Sandyford, Dublin 18, Ireland. Mainstream Renewable Power Company Proprietary andConfidential Information. If you have received this message in error you should delete itfrom your system immediately and advise the sender.
Page 4 of 4
02/11/2012
HORNSEA WIND FARM
The following comments are made on behalf of the North East LindseyDrainage Board following the meeting held on the 16th October 2012,
SURFACE WATER CONTROLThe principle in attenuating flows to the existing greenfield rate isacceptable, this set against a rainfall event of 1 in 100 years with anallowance for climate change. Whilst peak flows are important to protectagainst over-spilling from the local drainage channels, volume isimportant within a system, which is affected by tide-lock.Whilst all flows from the site discharge to the Humber Estuary via theNorth Killingholme Drain there are two routes taken and therefore theoutfalls from the site must ensure that flow rates take account of thisposition.Attentuation requirements must reflect the worse case set against flowand tidal influence and be designed such that they are effectively emptiedwhen conditions allow.The volume of storage provided is not temporary and it must bedemonstrated that that they can, in the long term, be maintained so as toretain the designed requirement.In determining the storage, account must be taken as to whether anyfurther impermeable surface development may take place on the site.Once an approval is given it will be applicable only to the sitearrangement against which the storage has been designed.
CABLE CROSSINGS OF WATERCOURSESIt is proposed to use three types of cable crossings upon which I makethe following comments.
Open CutThis is acceptable subject to1 The level of the cable, or any protection, must be at least 600mmbelow the hard bed level
2 The level must be carried a distance of 3 metres each side of thechannel bank, thereafter rising to the general cable laying level.
3 During installation the flow capacity through the channel must bemaintained.
4 During installation the channel must remain free from debris orpolluting materials.
5 Banks must be maintained to the Board�s satisfaction6 The position of the crossing must be marked in an approved way7 Payment of a processing charge of £50 per crossing
Horizontal Drilling
This is an acceptable way to cross the channels subject to �1 As above2 As above3 During installation the channel must not be disturbed and remainfree from debris or any polluting material
4 The position of the crossing must be marked in an approved way.
Installing Culvert
This is not a favoured option and will only be considered when thereis a sound reason not to use alternatives. The details of such crossingswill be site specific and subject to approval. Some conditions, whichapply to the other options will equally apply, but a primary concern willbe the capacity of the culvert, its length and positioning within thechannel profile.
NoteThe crossings fall in to two categories, those that involve Board
maintained watercourse and those, which are vested with the respectivelandowners. For the former, Board consent for all crossings arenecessary, for the others the Board will issue a general conditions note,The exception to this will be if culvert crossings are to be installed in thelandowner maintained watercourses in which case the Board wouldrequire details for approval.
file:///Q|/DLE2290%20-%20Hornsea/Geo%20Environmental/Reports/FL...nce/IDB/Re%20FW%20Environmental%20Information%20Request%202.htm
Sent: 28 November 2011 14:13
Subject: Re: FW: Environmental Information Request
The nearest Board maintained drain is some 500metres to the east of the most eastern part of the site. It is the North Killingholme Drain and is maitained from the gravity outfall sluice a distance of 700metres upstream alongside Haven Road at which point it turns northwards beneath the road and is maintained over a length of 300metres passing through land owned by Cobblefret
On 28/11/2011 12:55,
Thank you for the email.
We were wondering if you have a map available that shows the IDB maintained drains within the immediate vicinity of the site?
Kind regards
file:///Q|/DLE2290%20-%20Hornsea/Geo%20Environment...FW%20Environmental%20Information%20Request%202.htm (1 of 8) [21/02/2012 15:31:37]
file:///Q|/DLE2290%20-%20Hornsea/Geo%20Environmental/Reports/FL...nce/IDB/Re%20FW%20Environmental%20Information%20Request%202.htm
Sent: 28 November 2011 11:55
Subject: Re: FW: Environmental Information Request
Further to your enquiry I respond to the points you raise. The site straddles the boundary of the Board's drainage district, the boundary itself following the north/south field boundary which bisects the site. More importantly the entire site drains into the drainage district entering a Board maintained system ultimately discharging into the Humber Estuary via the North Killingholme Drain. This is a gravity discharging system, subject to tide-lock, and as such it is highly sensetive.Control arrangements will be necessary to ensure that post-development flows do not exceed the current greenfield conditions. Due to the site location the Board possess little information as illustrated by my comments on the specific points.
file:///Q|/DLE2290%20-%20Hornsea/Geo%20Environment...FW%20Environmental%20Information%20Request%202.htm (2 of 8) [21/02/2012 15:31:37]
file:///Q|/DLE2290%20-%20Hornsea/Geo%20Environmental/Reports/FL...nce/IDB/Re%20FW%20Environmental%20Information%20Request%202.htm
* No information is available, the area being beyond that covered by flood modelling. * As mentioned the data available does not extend to this site. *The drains in immediate proximity to the site are not maintained by the Board, due to there significance in terms of the catchment served and water they convey. Any waterlogging or surface water flooding of relatively small areas of agricultural land would not necessarily be registered with the Board, and as such no record is held. * These are matters which are dealt with by the Environment Agency. * The Board hold no information on groundwater levels, and a site investigation would be needed to determine this. * The evacuation of water is effected through a gravity outfall with the main components of the drainage system maintained to a standard to ensure that surface flooding of the Killingholme Marshes is controlled. This in turn enables water from the surrounding catcment to freely discharge through the local drains. The Marsh is also protected by the Environment Agency maintained tidal defences. * The Board are not aware of any groundwater discharges affecting the area and which cause flooding. * Any data will be held by the Environment Agency. * The Killingholme Marshes has been for a number of years the subject of detailed investigation brought about as a result of development pressures, notably Able{UK] Ltd. the area having being covered by hydraulic modelling, but as mentioned this does not extend to the site under consideration.
This site has been the subject of earlier appraisals commissioned by Able, notably Entec in 2003, no doubt there findings could be made available to you.
Sorry for the delay,
Please find the original data request below and mapping
file:///Q|/DLE2290%20-%20Hornsea/Geo%20Environment...FW%20Environmental%20Information%20Request%202.htm (3 of 8) [21/02/2012 15:31:37]
file:///Q|/DLE2290%20-%20Hornsea/Geo%20Environmental/Reports/FL...nce/IDB/Re%20FW%20Environmental%20Information%20Request%202.htm
Sent: 21 October 2011 16:35 To: ' [email protected] '; Subject: Environmental Information Request
Our Ref: DLE2290
file:///Q|/DLE2290%20-%20Hornsea/Geo%20Environment...FW%20Environmental%20Information%20Request%202.htm (4 of 8) [21/02/2012 15:31:37]
Sent: 06 December 2011 13:44
Subject: Re: Environmental Information Request
Page 1 of 3
21/02/2012
Hi,
Further to your email this authority is not aware of any private water supply's in this area.
Regards
Date: 06/12/2011 01:30PM Subject: Environmental Information Request
Our Ref: DLE2290
Tel: 0113 220 6190
Date: 06th December 2011
ENVIRONMENTAL INFORMATION REQUEST: Parcel of Land in North Killingholme NRG: 515190, 419260.
We are currently conducting a Flood Risk Assessment for a proposed development at North Killingholme, 515190, 419260 (see attached plan).
To undertake this study RPS wish to obtain the following information:
Details of any flooding due to drainage problems associated with the site, including flood levels, flood extents and any available anecdotal information;
Records of any Private surface and groundwater discharges, abstractions and pollution incidents within 250m of the site;
Details of any recorded groundwater levels in the area, and groundwater vulnerability of the area;
Details of any groundwater flooding issues in the area, including flood levels, flood extents and any available anecdotal information;
Any other relevant flooding related data that you might hold in relation to this site.
Please would you inform me of any data costs that may be incurred as soon as possible.
Should you have any queries please do not hesitate to contact me.
Yours faithfully
for RPS
2012
This e-mail message and any attached file is the property of the sender and is sent in confidence to the addressee only.
Internet communications are not secure and RPS is not responsible for their abuse by third parties, any alteration or corruption in transmission or for any loss or damage caused by a virus or by any other means.
RPS Planning and Development Limited, company number: 02947164 (England). Registered office: Centurion Court, 85 Milton Park AbingdonOxfordshire OX14 4RY.
RPS Group Plc web link: http://www.rpsgroup.com
[attachment "Able Site Location Plan.pdf" removed by Steve Foster/NE/NorthLincs]
This e-mail expresses the opinion of the author and is not necessarily the view of the Council. Please be aware that anything included in an e-mail may have to be disclosed under the Freedom of Information Act and cannot be regarded as confidential. This communication is intended for the addressee(s) only. Please notify the sender if received in error. All Email is monitored and recorded. Please think before you print- North Lincolnshire Council greening the workplace.
Page 3 of 3
21/02/2012
Sent: 23 October 2012 13:22To:
Subject: Re: SMart Wind Meeting Agenda - 2.30pm, 16th October 2012Follow Up Flag: Follow upFlag Status: RedAttachments: HORNSEA WIND FARM.doc
Page 1 of 4
02/11/2012
,Further to our meeting I enclose a note which sets out the Boards position on the surface water
control and the cable crossings. As points of detail in the Environmental Statement - Volume 3, asprovided, there is a reference to drain 10 in Section 3.1.10 which should be drain 11, and in placesthe Board is named as the East Lindsey and not the North East Lindsey Drainage Board.
I am going through the legislation information provided by Stephanie and will comment on this.Regards
�SKM will be attending the meeting on Tuesday at 2.30pmChurch House, Papworth St. Agnes, Cambridge, CB23 3QZ. I propose the following Agendaitems, please let me know if there is anything additional you would like to discuss:
1. Introductions2. Project One and Two General Update,3. North East Lindsey Drainage Board Consultation Response,4. Onshore crossings of NELDB maintained waterways, crossing types and restoration,5. Flood Risk Assessment (FRA),6. The Development Consent Order (DCO) and Protective Provisions,7. AOB
I have also added the DCO text from my original invite, below which Stephanie will discuss infurther detail at the meeting. I look forward to meeting you in person on Tuesday.
In the DCO, provisions are made which disapply legislation relevant or potentially relevant toNorth East Lindsey Drainage Board. Such provisions have become normal practice in Transportand Works Act Orders and they feature too in the first development consent order to comeinto effect, the Network Rail (Ipswich Chord) Order 2012. We would add that the Order is notdisapplying the pollution legislation which would apply to the project and in particular anyrequirement for an environmental permit for discharges under the Environmental PermittingRegulations 2010.
Article 3 of the draft order disapplies section 109 (structures in, over or under a main river) ofthe Water Resources Act 1991 (WRA) which requires the consent of the Environment Agency toerect structures and carry out works in, over or under a watercourse. Article 3 also disappliesthe provisions of any byelaws made under, or having effect as if made under, paragraphs 5(byelaws for flood defence and drainage purposes), 6 (byelaws for purposes of fisheriesfunctions) or 6A (fisheries byelaws for marine or aquatic environmental purposes) of Schedule25 to the WRA which require consent or approval for the carrying out of the works. In addition,
article 3 disapplies section 23 (prohibition of obstructions, etc. in watercourses) of the LandDrainage Act 1991 which requires consent from drainage boards where watercourses will beobstructed.
We need the board�s consent to the disapplication of these statutory provisions and we areproposing protective measures in the DCO for the benefit of Internal Drainage Boards to securethat consent. They follow standard provision were included for the Environment Agency inprevious Orders and for the benefit of internal drainage boards when relevant (as exemplified inSchedule 11 to the Cambridgeshire Guided Busway Order 2005). The protective provisions areset out in schedule I to the draft DCO and broadly, they make provision for the prior approval ofplans and particulars of works, allowing such approval to be given subject to reasonablerequirements for the protection of drainage work, or the water environment. Provision is madefor the work to be carried out without unreasonable delay in accordance with the approved plansand to the reasonable satisfaction of the drainage authority. There is also provision for anofficer of the drainage authority to watch and inspect the construction work. Notice will requireto be given to the drainage authority prior to commencing works and following completion.Where the works are not carried out in accordance with the approved plans and specification thedrainage authority may require compliance with Schedule I or alternatively for the works to beremoved or altered. If not carried out within a reasonable period the drainage authority mayexecute the works themselves and recover the costs. Schedule I includes provision to protectwaters containing fish and the spawn, habitat or food of such fish from damage and prevents theinterruption of free passage of fish. In addition, provision is made for the indemnification forcosts relating to the examination and approval of plans, the inspection of the work, for damageto infrastructure and for flooding. There is also a mechanism for resolving disputes.
Other provisions of the draft DCO that are relevant or potentially relevant include:
Article 9 of the DCO allows the undertaker, in relation to the streets specified in the draft order,to break up or open the streets, or any sewers, drain or tunnel under them; to tunnel or boreunder the streets; to place and maintain apparatus in the streets; and to execute any otherincidental works.
Article 11 allows for the temporary stopping up, alteration or diversion of any street for thepurposes of carrying on the authorised project.
Article 10 states that in carrying out the street works, temporary stopping up, alteration ordiversion of streets authorised by articles 9 and 11, the provisions of the New Roads and StreetWorks Act 1991 (1991 Act) will apply in particular, section 54 which requires advance notice ofworks, section 55 which requires notice of the starting date of works, and section 59 whichallows the street authority to co-ordinate works in the interests of safety/inconvenience to roadusers. Section 60 imposes a duty on the undertaker to co-operate with the street authority andother undertakers and section 68 requires the undertaker to afford the street authorityreasonable facilities for ascertaining whether the undertaker is complying with his duties.Section 69 provides for the undertaker to allow other undertakers with apparatus in the street toprotect their apparatus and sections 76 and 77 make the undertaker liable for the cost oftemporary traffic regulation and alternative routes.
The article does however provide that the provisions of the 1991 Act apply to the stopping up,alteration or diversion or the carrying out of street works whether or not the works constitute�street works�? within the meaning of the 1991 Act. The 1991 Act defines street works as anyworks carried out in a street in pursuance of a statutory right or a street works licence whichinvolve the placing of apparatus, inspecting, maintaining, adjusting, repairing, altering, orrenewing apparatus, changing its position or removing it. Works incidental to those activities arealso included within the definition of street works.Article 12 allows for a street authority and the undertaker to enter into agreements regardingconstruction of new streets, carrying out of street works and the timing of and payment for suchworks.
Streets to be subject to street works authorised by the DCO will be identified in Schedule B andStreets to be temporarily stopped up will be identified in Schedule C.
Article 13 enables the undertaker to discharge water into any watercourse, public sewer ordrain, in connection with the construction of the authorised project provided consent has beengiven by the person who owns the watercourse, public sewer or drain, such consent is not to beunreasonably withheld. The article provides that an opening into a public sewer or drain must
Page 2 of 4
02/11/2012
be made in accordance with plans approved by the person to whom the sewer or drain belongsand that person must be given the opportunity to supervise the making of the opening. A personwho fails to respond to an application for consent or approval within 28 days of the applicationbeing made is deemed to have granted consent or given approval.
Article 27 provides that the undertaker may acquire rights over, or compulsorily acquire, landbelonging to statutory undertakers. In addition, the undertaker may extinguish the rights ofstatutory undertakers over land and may remove or reposition apparatus belonging to statutoryundertakers. The land subject to these powers is specified in the DCO.
Where a public sewer is removed under article 13, article 28 provides for compensation to theowner or occupier of premises the drains of which communicated with that sewer; or the ownerof a private sewer which communicated with that sewer.
Copies of articles 3, 9-13 and 27-28 as well as the relevant protective provisions included inschedule I and the definition of watercourse are attached for reference. Please note that theseprovisions are extracted from the current working draft of the DCO and may change. Thefull DCO will be available for our Phase 4 consultation in January.
The DCO also contains provisions for the acquisition of land and rights over land and totemporarily use land for carrying out the project all within the Order land referenced in the Bookof Reference. Rights are also provided to temporarily use land within the Order limits which willbe designated on plans accompanying the DCO for maintaining the project. As indicatedabove the full DCO with these plans and schedules will be available for our Phase 4consultation in January.
Many thanks,
please consider the environment - do you really need to print this email?
Mainstream Renewable Power Limited is a private limited company registered in
Page 3 of 4
02/11/2012

Waterside House, Waterside North, Lincoln, LN2 5HA.Customer services line: 03708 506 506Email: [email protected]
Calls to 03 numbers cost the same as calls to standard geographic numbers (i.e. numbers beginning with 01 or 02
Our ref: CCN/2013/34220 Date: 10 June 2013
RRequest for information under the Freedom of Information Act 2000 (FOIA) / Environmental Information Regulations 2004 (EIR) Thank you for your email of 22 April 2013. Requests for information that is recorded are generally governed by the Freedom of Information Act 2000 (FOIA).The information you have requested is environmental and it is therefore exempted from the provisions of FOIA by FOIA s.39(1). We have therefore considered your request under the provisions of the Environmental Information Regulations 2004 (EIR). Contaminated and Previously Used Land
Landfill Sites No operational sites.
One closed (permitted) site. EAWML 70817 Lindsey Oil Refinery
Historic sites at: Eastfield Road Butt Lane Brookfields Farm
Basic data for the closed historic sites is attached.
Excavated Land
We don’t keep records of this. We suggest the County Planners for this information.
Contaminated Land
The Local Authority are the lead regulators on Part IIA sites and so should be contacted, but we are not aware of any Part IIA sites within 250 m of this route. We recommend that the Local Authority is contacted to determine if any sites within 250 m of the proposed route are prioritised for inspection. The route
does appear to pass directly through a historic landfill site, Eastfield Road in South Killingholme, at TA 151 168.
PPart A & B Authorised Processes within 250m Centrica Killingholme Power Station SP3133LY Killingholme Power Station (Eon) SP3233LQ Lindsey Oil Refinery TP3633NH Tetney Oil Terminal LP3533LJ
We don’t keep records of Part B processes. We suggest the Local Authorities for
this information.
Nuisances
Please see attached a list of NIRS incidents along the proposed cable route. Reported Incidents
As above Existing/Previous Reports
As above Hydrology and Flooding
Points 1 – 5 Product 4 information attached Point 6 - Abstraction information attached Points 7 - 8 Product 4 information attached We have had reports of groundwater flooding in the past in Grimsby and
Laceby, but the closest is 1.5 km from the pipeline route. I can provide a bit more detail if needed, but it’s anecdotal and we don’t have any definitive levels or extents. Our records are only from when a homeowner calls in.
Points 10 – 11 Product 4 information attached Hydrogeology
Bedrock geology aquifer designation attached
Superficial geology aquifer designation
Groundwater Vulnerability (note – the above two maps have really superseded this)
Source protection zones, including safeguard zones: Safeguard zones (SgZs) are identified around sources where there are known problems with deteriorating water quality, where existing measures should be strictly enforced for particular pollutants and activities, and where there can be a focus on additional new voluntary measures. We work in partnership with water companies when designating SgZs and implementing actions (Groundwater protection: Principles and practice (GP3), Nov 2012)
Soil classification.
I hope the information is of use to you. Should you have any further queries please do not hesitate to contact me again.

This information is subject to the attached notice, which we advise you read. If you are not satisfied with our response to your request for information you can contact us to ask for our decision to be reviewed. If you are still not satisfied following this, you can then make an appeal to the Information Commissioner, who is the statutory regulator for Freedom of Information. The address is: Office of the Information Commissioner, Wycliffe House, Water Lane, Wilmslow, Cheshire SK9 5AF. Tel: 01625 545700. Fax: 01625 524 510. E-mail:[email protected]. Website: http//www.informationcommissioner.gov.uk We would be really grateful if you could spare five minutes to help us improve our service. Please click on the link below and fill in our survey – we use every piece of feedback we receive: http://www.surveyshack.com/link/ba39e
Awarded to the Environment, Planning & Engagement Department, Anglian Region, Northern Area
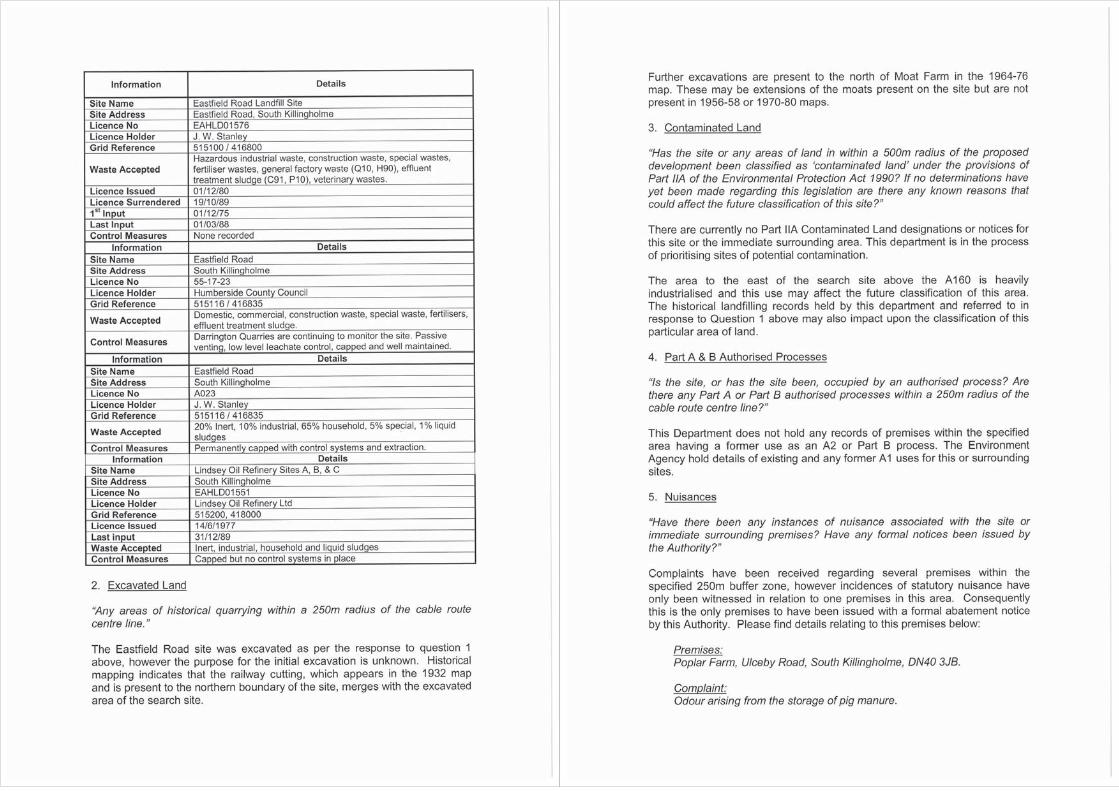
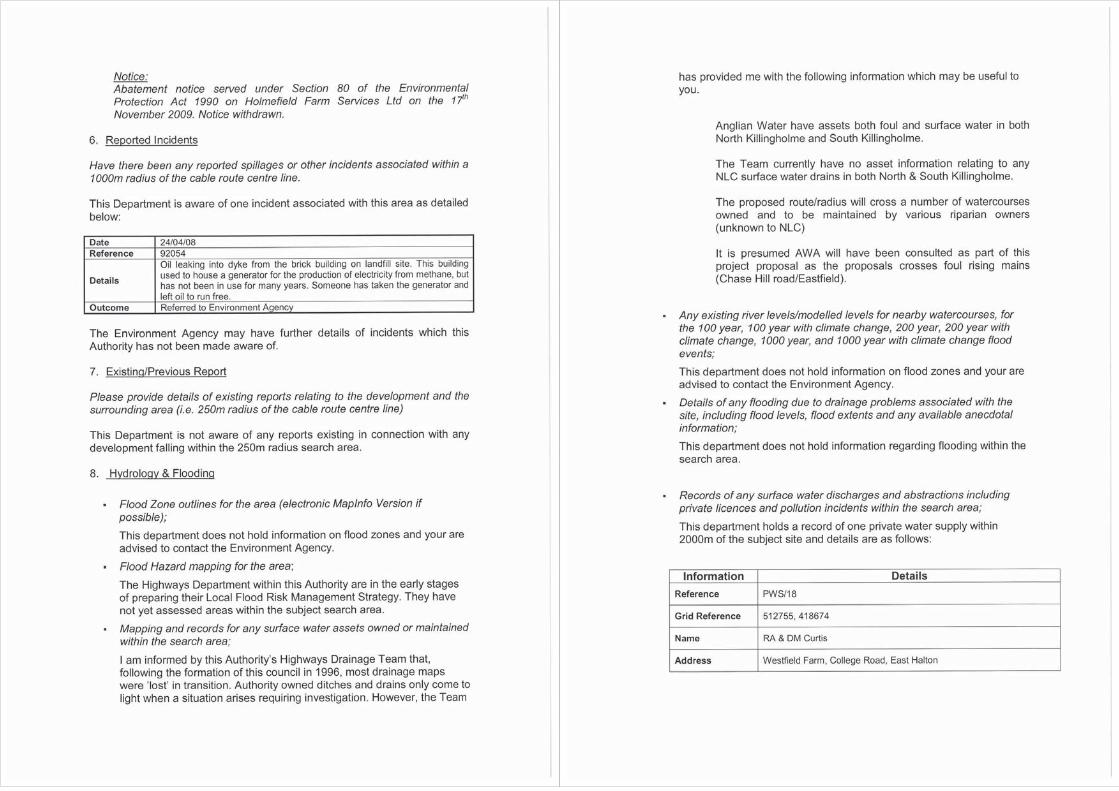


APPENDIX B
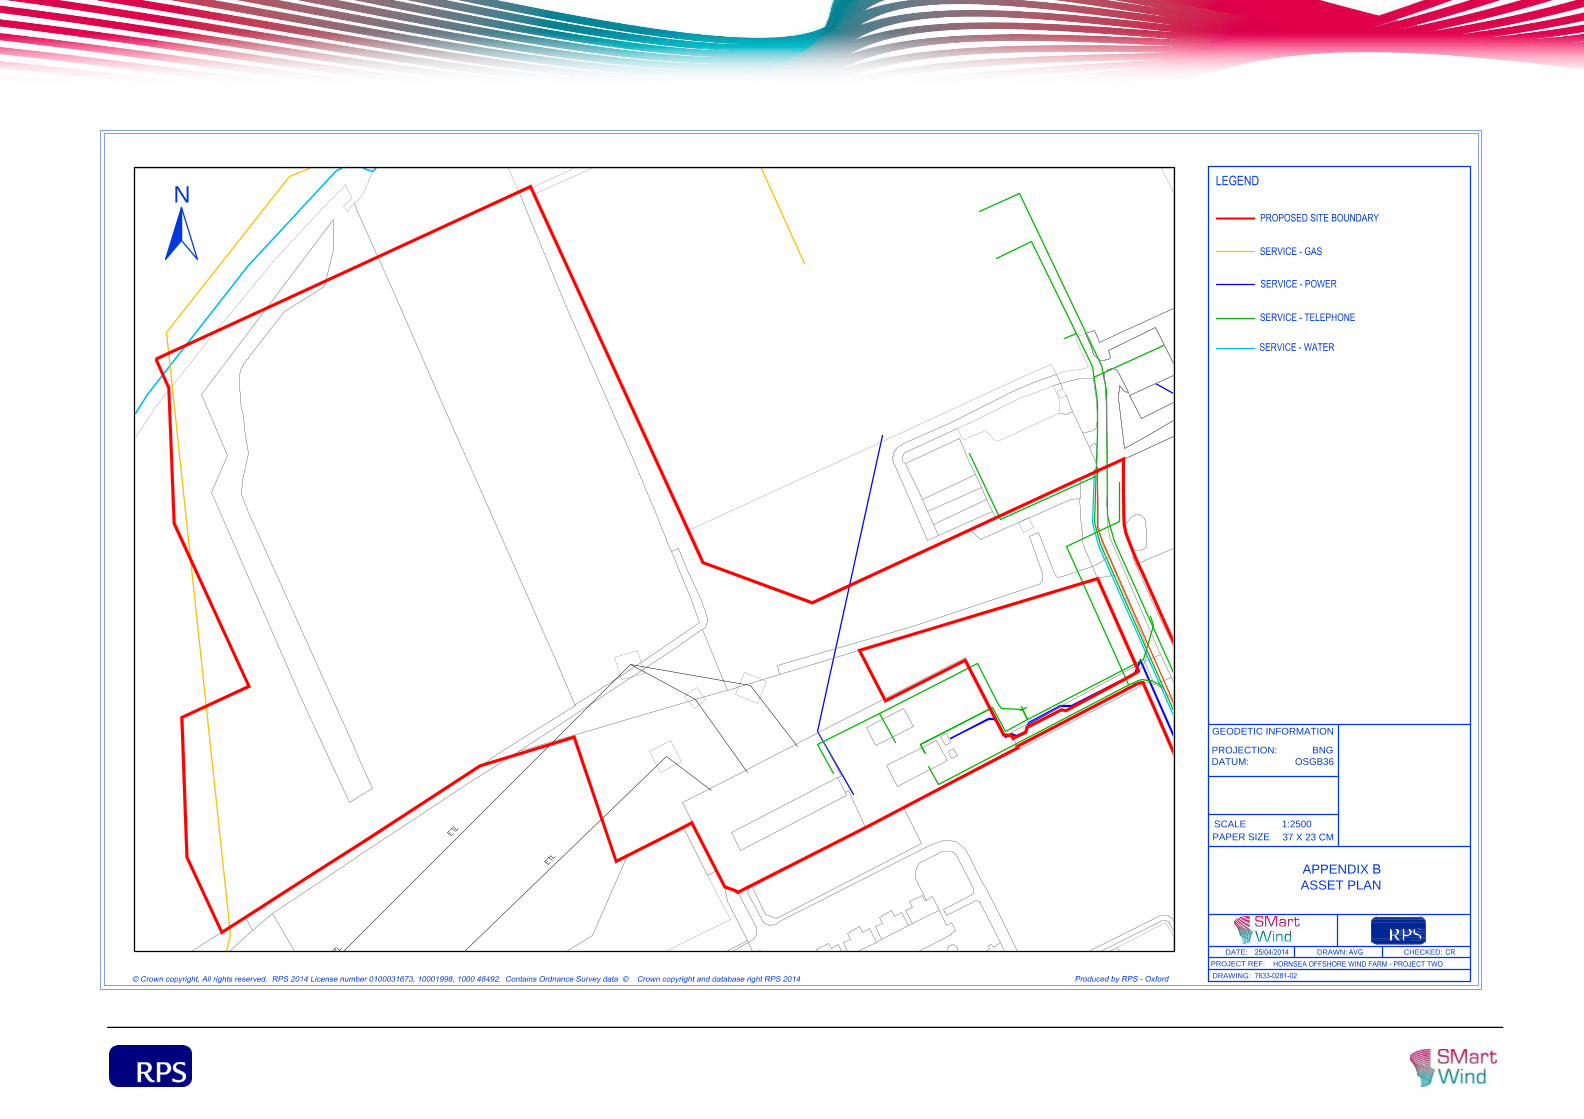
1:2500
GEODETIC INFORMATION
PROJECTION: BNG
DATUM: OSGB36
CHECKED:DRAWN:DATE:
PROJECT REF:
DRAWING:
SCALE
PAPER SIZE 37 X 23 CM
N
APPENDIX B ASSET PLAN

APPENDIX C
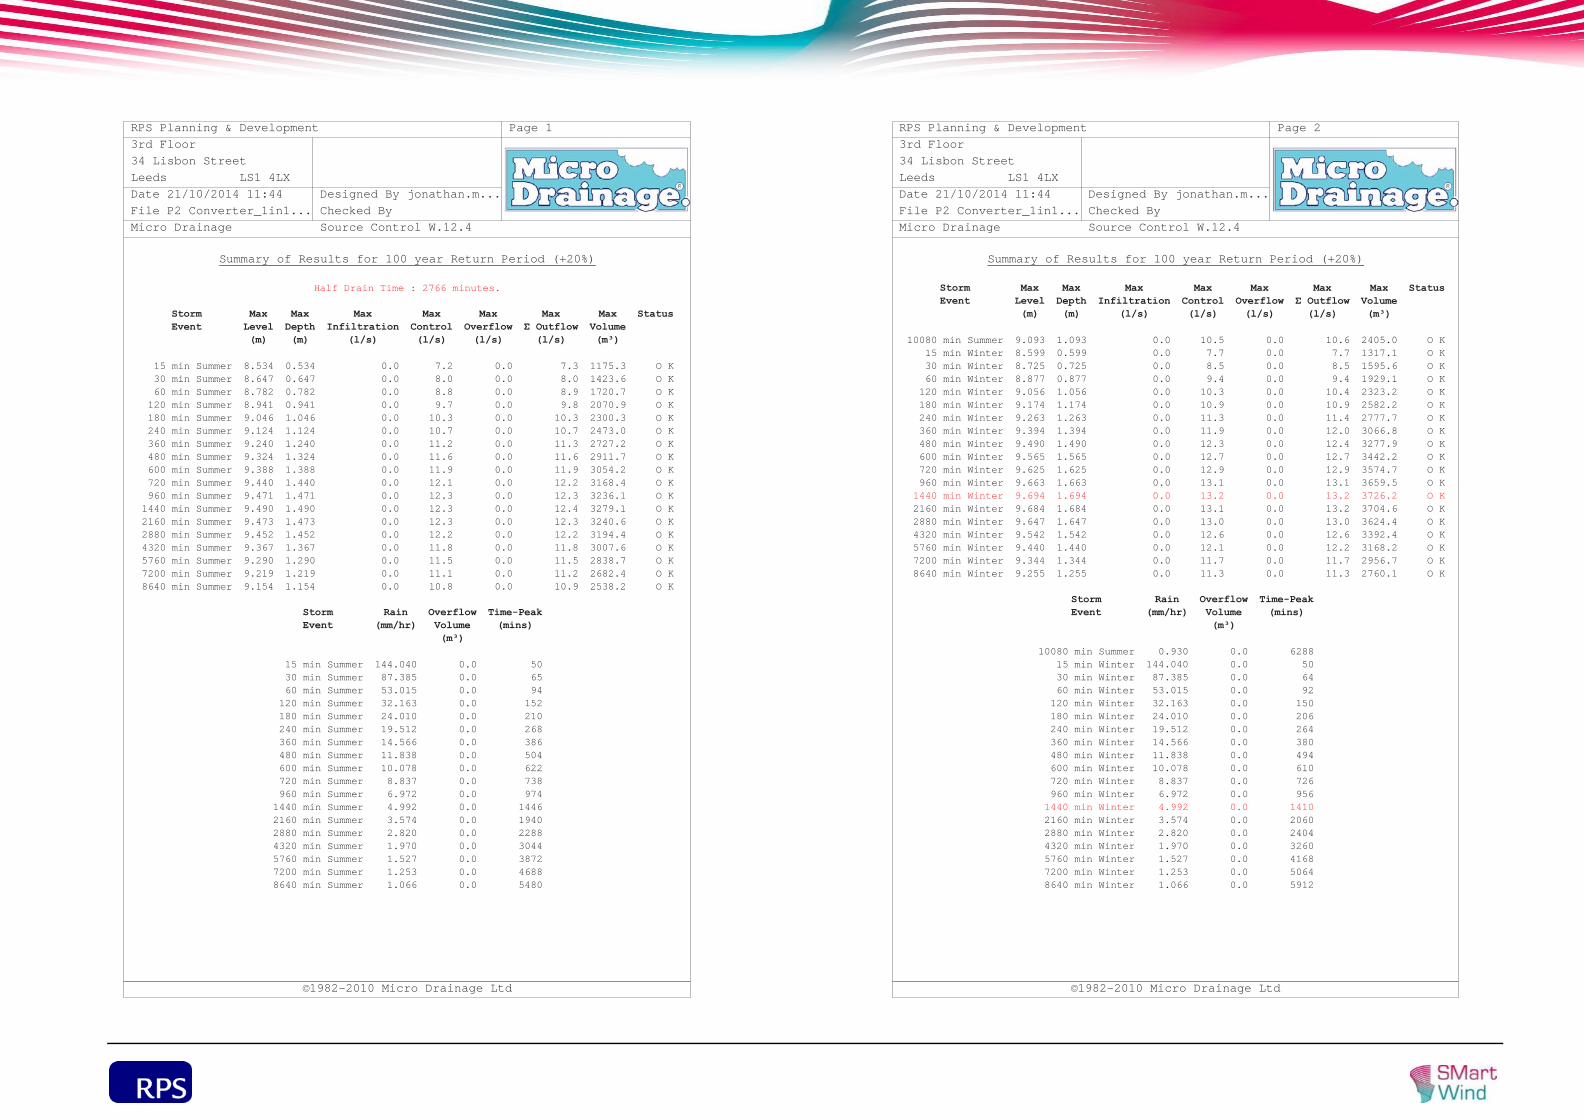
Summary of Results for 100 year Return Period (+20%)
Half Drain Time : 2766 minutes.
StormEvent
MaxLevel(m)
MaxDepth(m)
MaxInfiltration
(l/s)
MaxControl(l/s)
MaxOverflow(l/s)
MaxΣ Outflow(l/s)
MaxVolume(m³)
Status
15 min Summer 8.534 0.534 0.0 7.2 0.0 7.3 1175.3 O K30 min Summer 8.647 0.647 0.0 8.0 0.0 8.0 1423.6 O K60 min Summer 8.782 0.782 0.0 8.8 0.0 8.9 1720.7 O K120 min Summer 8.941 0.941 0.0 9.7 0.0 9.8 2070.9 O K180 min Summer 9.046 1.046 0.0 10.3 0.0 10.3 2300.3 O K240 min Summer 9.124 1.124 0.0 10.7 0.0 10.7 2473.0 O K360 min Summer 9.240 1.240 0.0 11.2 0.0 11.3 2727.2 O K480 min Summer 9.324 1.324 0.0 11.6 0.0 11.6 2911.7 O K600 min Summer 9.388 1.388 0.0 11.9 0.0 11.9 3054.2 O K720 min Summer 9.440 1.440 0.0 12.1 0.0 12.2 3168.4 O K960 min Summer 9.471 1.471 0.0 12.3 0.0 12.3 3236.1 O K1440 min Summer 9.490 1.490 0.0 12.3 0.0 12.4 3279.1 O K2160 min Summer 9.473 1.473 0.0 12.3 0.0 12.3 3240.6 O K2880 min Summer 9.452 1.452 0.0 12.2 0.0 12.2 3194.4 O K4320 min Summer 9.367 1.367 0.0 11.8 0.0 11.8 3007.6 O K5760 min Summer 9.290 1.290 0.0 11.5 0.0 11.5 2838.7 O K7200 min Summer 9.219 1.219 0.0 11.1 0.0 11.2 2682.4 O K8640 min Summer 9.154 1.154 0.0 10.8 0.0 10.9 2538.2 O K
StormEvent
Rain(mm/hr)
OverflowVolume(m³)
Time-Peak(mins)
15 min Summer 144.040 0.0 5030 min Summer 87.385 0.0 6560 min Summer 53.015 0.0 94120 min Summer 32.163 0.0 152180 min Summer 24.010 0.0 210240 min Summer 19.512 0.0 268360 min Summer 14.566 0.0 386480 min Summer 11.838 0.0 504600 min Summer 10.078 0.0 622720 min Summer 8.837 0.0 738960 min Summer 6.972 0.0 9741440 min Summer 4.992 0.0 14462160 min Summer 3.574 0.0 19402880 min Summer 2.820 0.0 22884320 min Summer 1.970 0.0 30445760 min Summer 1.527 0.0 38727200 min Summer 1.253 0.0 46888640 min Summer 1.066 0.0 5480
RPS Planning & Development3rd Floor34 Lisbon StreetLeeds LS1 4LXDate 21/10/2014 11:44File P2 Converter_1in1...Micro Drainage
Designed By jonathan.m...Checked BySource Control W.12.4
Page 1
©1982-2010 Micro Drainage Ltd
Summary of Results for 100 year Return Period (+20%)
StormEvent
MaxLevel(m)
MaxDepth(m)
MaxInfiltration
(l/s)
MaxControl(l/s)
MaxOverflow(l/s)
MaxΣ Outflow(l/s)
MaxVolume(m³)
Status
10080 min Summer 9.093 1.093 0.0 10.5 0.0 10.6 2405.0 O K15 min Winter 8.599 0.599 0.0 7.7 0.0 7.7 1317.1 O K30 min Winter 8.725 0.725 0.0 8.5 0.0 8.5 1595.6 O K60 min Winter 8.877 0.877 0.0 9.4 0.0 9.4 1929.1 O K120 min Winter 9.056 1.056 0.0 10.3 0.0 10.4 2323.2 O K180 min Winter 9.174 1.174 0.0 10.9 0.0 10.9 2582.2 O K240 min Winter 9.263 1.263 0.0 11.3 0.0 11.4 2777.7 O K360 min Winter 9.394 1.394 0.0 11.9 0.0 12.0 3066.8 O K480 min Winter 9.490 1.490 0.0 12.3 0.0 12.4 3277.9 O K600 min Winter 9.565 1.565 0.0 12.7 0.0 12.7 3442.2 O K720 min Winter 9.625 1.625 0.0 12.9 0.0 12.9 3574.7 O K960 min Winter 9.663 1.663 0.0 13.1 0.0 13.1 3659.5 O K1440 min Winter 9.694 1.694 0.0 13.2 0.0 13.2 3726.2 O K2160 min Winter 9.684 1.684 0.0 13.1 0.0 13.2 3704.6 O K2880 min Winter 9.647 1.647 0.0 13.0 0.0 13.0 3624.4 O K4320 min Winter 9.542 1.542 0.0 12.6 0.0 12.6 3392.4 O K5760 min Winter 9.440 1.440 0.0 12.1 0.0 12.2 3168.2 O K7200 min Winter 9.344 1.344 0.0 11.7 0.0 11.7 2956.7 O K8640 min Winter 9.255 1.255 0.0 11.3 0.0 11.3 2760.1 O K
StormEvent
Rain(mm/hr)
OverflowVolume(m³)
Time-Peak(mins)
10080 min Summer 0.930 0.0 628815 min Winter 144.040 0.0 5030 min Winter 87.385 0.0 6460 min Winter 53.015 0.0 92120 min Winter 32.163 0.0 150180 min Winter 24.010 0.0 206240 min Winter 19.512 0.0 264360 min Winter 14.566 0.0 380480 min Winter 11.838 0.0 494600 min Winter 10.078 0.0 610720 min Winter 8.837 0.0 726960 min Winter 6.972 0.0 9561440 min Winter 4.992 0.0 14102160 min Winter 3.574 0.0 20602880 min Winter 2.820 0.0 24044320 min Winter 1.970 0.0 32605760 min Winter 1.527 0.0 41687200 min Winter 1.253 0.0 50648640 min Winter 1.066 0.0 5912
RPS Planning & Development3rd Floor34 Lisbon StreetLeeds LS1 4LXDate 21/10/2014 11:44File P2 Converter_1in1...Micro Drainage
Designed By jonathan.m...Checked BySource Control W.12.4
Page 2
©1982-2010 Micro Drainage Ltd
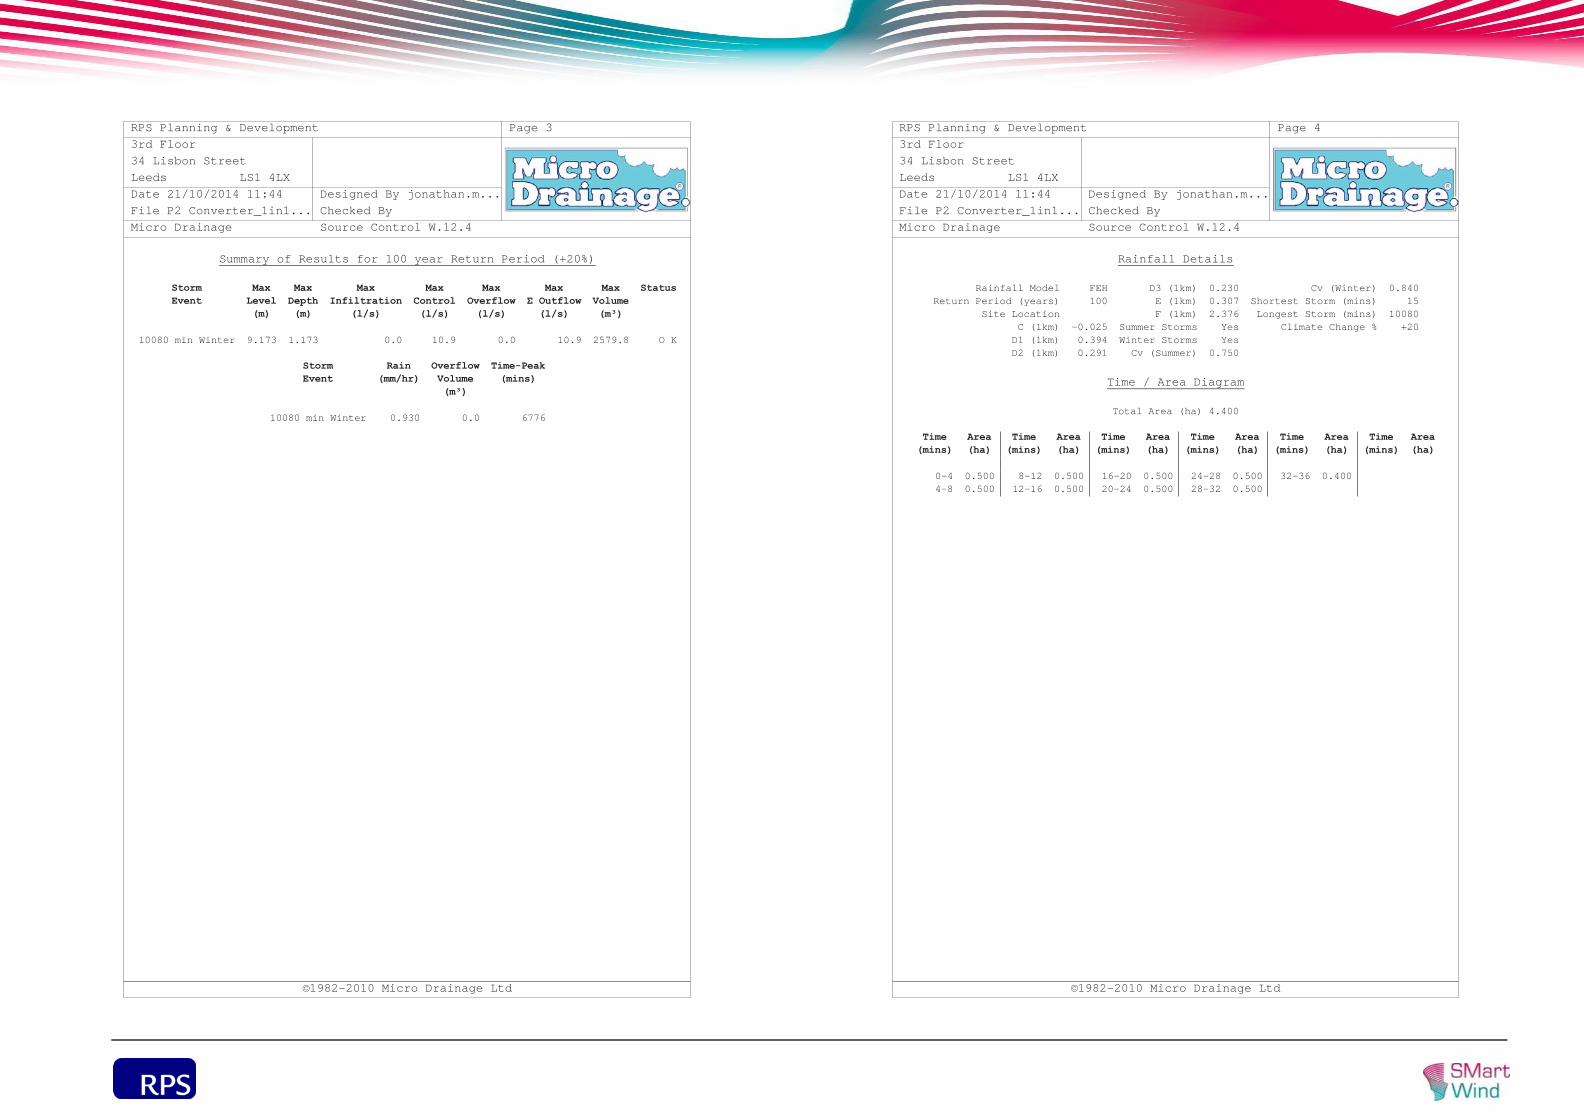
Summary of Results for 100 year Return Period (+20%)
StormEvent
MaxLevel(m)
MaxDepth(m)
MaxInfiltration
(l/s)
MaxControl(l/s)
MaxOverflow(l/s)
MaxΣ Outflow(l/s)
MaxVolume(m³)
Status
10080 min Winter 9.173 1.173 0.0 10.9 0.0 10.9 2579.8 O K
StormEvent
Rain(mm/hr)
OverflowVolume(m³)
Time-Peak(mins)
10080 min Winter 0.930 0.0 6776
RPS Planning & Development3rd Floor34 Lisbon StreetLeeds LS1 4LXDate 21/10/2014 11:44File P2 Converter_1in1...Micro Drainage
Designed By jonathan.m...Checked BySource Control W.12.4
Page 3
©1982-2010 Micro Drainage Ltd
Rainfall Details
Rainfall Model FEH D3 (1km) 0.230 Cv (Winter) 0.840Return Period (years) 100 E (1km) 0.307 Shortest Storm (mins) 15
Site Location F (1km) 2.376 Longest Storm (mins) 10080C (1km) -0.025 Summer Storms Yes Climate Change % +20D1 (1km) 0.394 Winter Storms YesD2 (1km) 0.291 Cv (Summer) 0.750
Time / Area Diagram
Total Area (ha) 4.400
Time(mins)
Area(ha)
Time(mins)
Area(ha)
Time(mins)
Area(ha)
Time(mins)
Area(ha)
Time(mins)
Area(ha)
Time(mins)
Area(ha)
0-4 0.500 8-12 0.500 16-20 0.500 24-28 0.500 32-36 0.4004-8 0.500 12-16 0.500 20-24 0.500 28-32 0.500
RPS Planning & Development3rd Floor34 Lisbon StreetLeeds LS1 4LXDate 21/10/2014 11:44File P2 Converter_1in1...Micro Drainage
Designed By jonathan.m...Checked BySource Control W.12.4
Page 4
©1982-2010 Micro Drainage Ltd
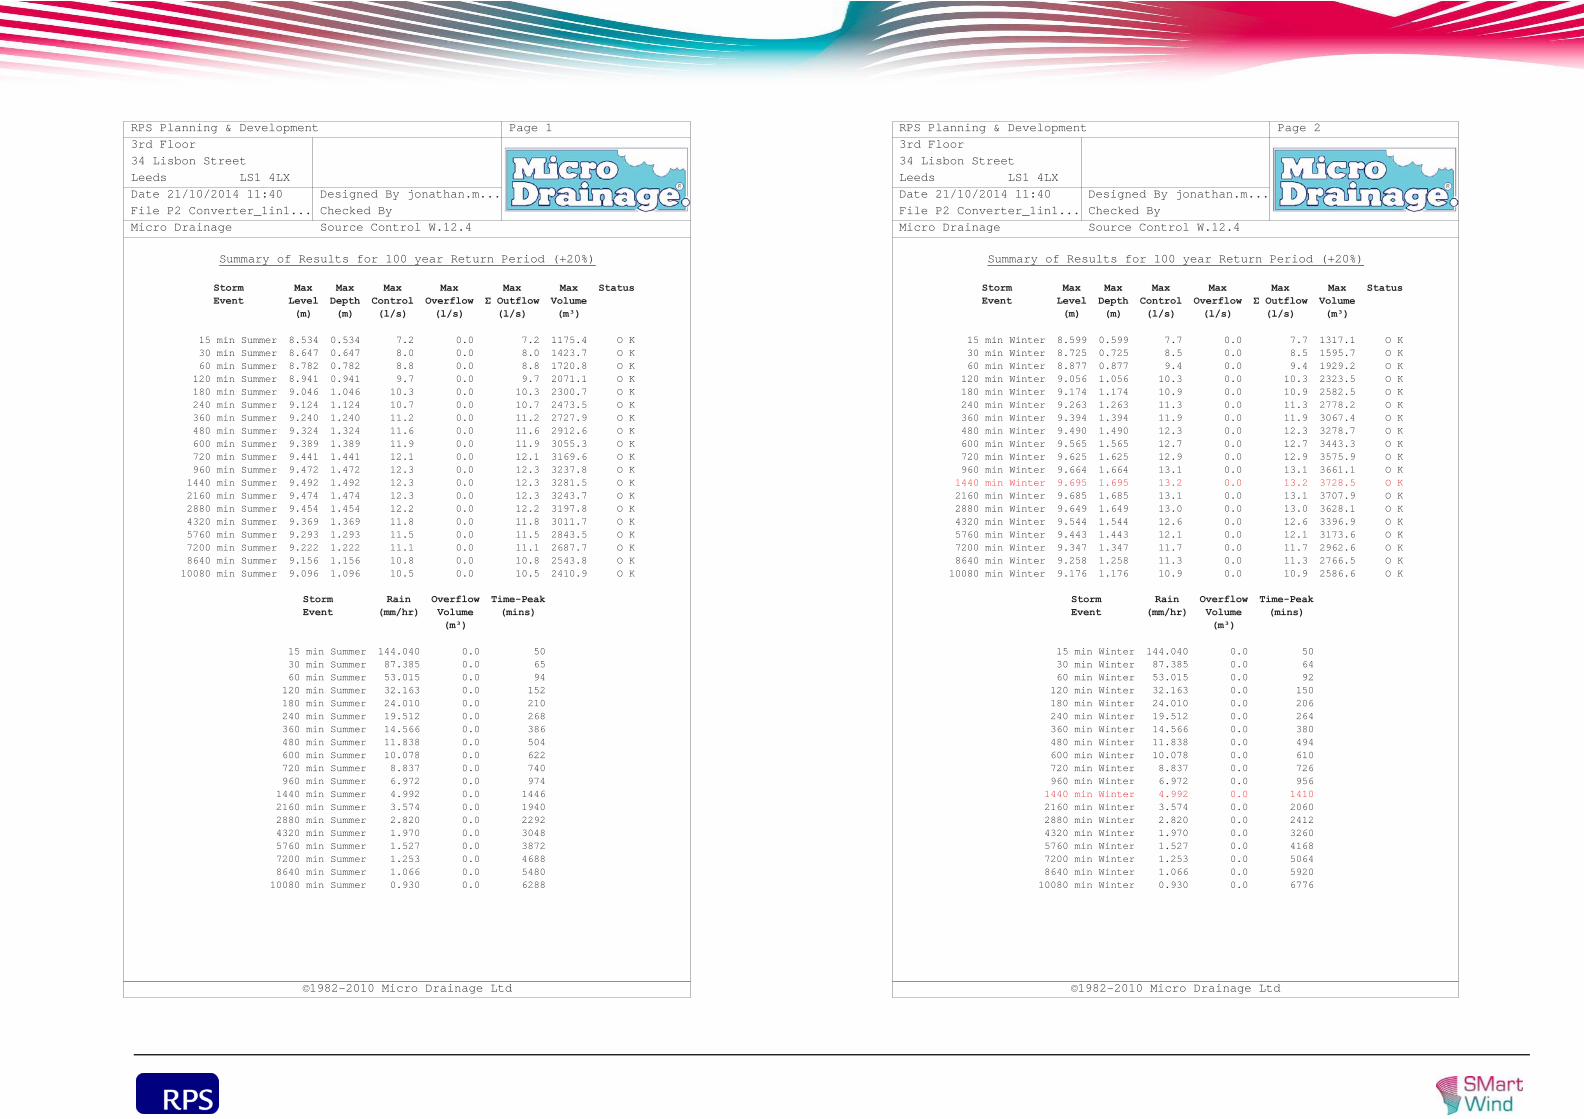
Summary of Results for 100 year Return Period (+20%)
StormEvent
MaxLevel(m)
MaxDepth(m)
MaxControl(l/s)
MaxOverflow(l/s)
MaxΣ Outflow(l/s)
MaxVolume(m³)
Status
15 min Summer 8.534 0.534 7.2 0.0 7.2 1175.4 O K30 min Summer 8.647 0.647 8.0 0.0 8.0 1423.7 O K60 min Summer 8.782 0.782 8.8 0.0 8.8 1720.8 O K120 min Summer 8.941 0.941 9.7 0.0 9.7 2071.1 O K180 min Summer 9.046 1.046 10.3 0.0 10.3 2300.7 O K240 min Summer 9.124 1.124 10.7 0.0 10.7 2473.5 O K360 min Summer 9.240 1.240 11.2 0.0 11.2 2727.9 O K480 min Summer 9.324 1.324 11.6 0.0 11.6 2912.6 O K600 min Summer 9.389 1.389 11.9 0.0 11.9 3055.3 O K720 min Summer 9.441 1.441 12.1 0.0 12.1 3169.6 O K960 min Summer 9.472 1.472 12.3 0.0 12.3 3237.8 O K1440 min Summer 9.492 1.492 12.3 0.0 12.3 3281.5 O K2160 min Summer 9.474 1.474 12.3 0.0 12.3 3243.7 O K2880 min Summer 9.454 1.454 12.2 0.0 12.2 3197.8 O K4320 min Summer 9.369 1.369 11.8 0.0 11.8 3011.7 O K5760 min Summer 9.293 1.293 11.5 0.0 11.5 2843.5 O K7200 min Summer 9.222 1.222 11.1 0.0 11.1 2687.7 O K8640 min Summer 9.156 1.156 10.8 0.0 10.8 2543.8 O K10080 min Summer 9.096 1.096 10.5 0.0 10.5 2410.9 O K
StormEvent
Rain(mm/hr)
OverflowVolume(m³)
Time-Peak(mins)
15 min Summer 144.040 0.0 5030 min Summer 87.385 0.0 6560 min Summer 53.015 0.0 94120 min Summer 32.163 0.0 152180 min Summer 24.010 0.0 210240 min Summer 19.512 0.0 268360 min Summer 14.566 0.0 386480 min Summer 11.838 0.0 504600 min Summer 10.078 0.0 622720 min Summer 8.837 0.0 740960 min Summer 6.972 0.0 9741440 min Summer 4.992 0.0 14462160 min Summer 3.574 0.0 19402880 min Summer 2.820 0.0 22924320 min Summer 1.970 0.0 30485760 min Summer 1.527 0.0 38727200 min Summer 1.253 0.0 46888640 min Summer 1.066 0.0 548010080 min Summer 0.930 0.0 6288
RPS Planning & Development3rd Floor34 Lisbon StreetLeeds LS1 4LXDate 21/10/2014 11:40File P2 Converter_1in1...Micro Drainage
Designed By jonathan.m...Checked BySource Control W.12.4
Page 1
©1982-2010 Micro Drainage Ltd
Summary of Results for 100 year Return Period (+20%)
StormEvent
MaxLevel(m)
MaxDepth(m)
MaxControl(l/s)
MaxOverflow(l/s)
MaxΣ Outflow(l/s)
MaxVolume(m³)
Status
15 min Winter 8.599 0.599 7.7 0.0 7.7 1317.1 O K30 min Winter 8.725 0.725 8.5 0.0 8.5 1595.7 O K60 min Winter 8.877 0.877 9.4 0.0 9.4 1929.2 O K120 min Winter 9.056 1.056 10.3 0.0 10.3 2323.5 O K180 min Winter 9.174 1.174 10.9 0.0 10.9 2582.5 O K240 min Winter 9.263 1.263 11.3 0.0 11.3 2778.2 O K360 min Winter 9.394 1.394 11.9 0.0 11.9 3067.4 O K480 min Winter 9.490 1.490 12.3 0.0 12.3 3278.7 O K600 min Winter 9.565 1.565 12.7 0.0 12.7 3443.3 O K720 min Winter 9.625 1.625 12.9 0.0 12.9 3575.9 O K960 min Winter 9.664 1.664 13.1 0.0 13.1 3661.1 O K1440 min Winter 9.695 1.695 13.2 0.0 13.2 3728.5 O K2160 min Winter 9.685 1.685 13.1 0.0 13.1 3707.9 O K2880 min Winter 9.649 1.649 13.0 0.0 13.0 3628.1 O K4320 min Winter 9.544 1.544 12.6 0.0 12.6 3396.9 O K5760 min Winter 9.443 1.443 12.1 0.0 12.1 3173.6 O K7200 min Winter 9.347 1.347 11.7 0.0 11.7 2962.6 O K8640 min Winter 9.258 1.258 11.3 0.0 11.3 2766.5 O K10080 min Winter 9.176 1.176 10.9 0.0 10.9 2586.6 O K
StormEvent
Rain(mm/hr)
OverflowVolume(m³)
Time-Peak(mins)
15 min Winter 144.040 0.0 5030 min Winter 87.385 0.0 6460 min Winter 53.015 0.0 92120 min Winter 32.163 0.0 150180 min Winter 24.010 0.0 206240 min Winter 19.512 0.0 264360 min Winter 14.566 0.0 380480 min Winter 11.838 0.0 494600 min Winter 10.078 0.0 610720 min Winter 8.837 0.0 726960 min Winter 6.972 0.0 9561440 min Winter 4.992 0.0 14102160 min Winter 3.574 0.0 20602880 min Winter 2.820 0.0 24124320 min Winter 1.970 0.0 32605760 min Winter 1.527 0.0 41687200 min Winter 1.253 0.0 50648640 min Winter 1.066 0.0 592010080 min Winter 0.930 0.0 6776
RPS Planning & Development3rd Floor34 Lisbon StreetLeeds LS1 4LXDate 21/10/2014 11:40File P2 Converter_1in1...Micro Drainage
Designed By jonathan.m...Checked BySource Control W.12.4
Page 2
©1982-2010 Micro Drainage Ltd
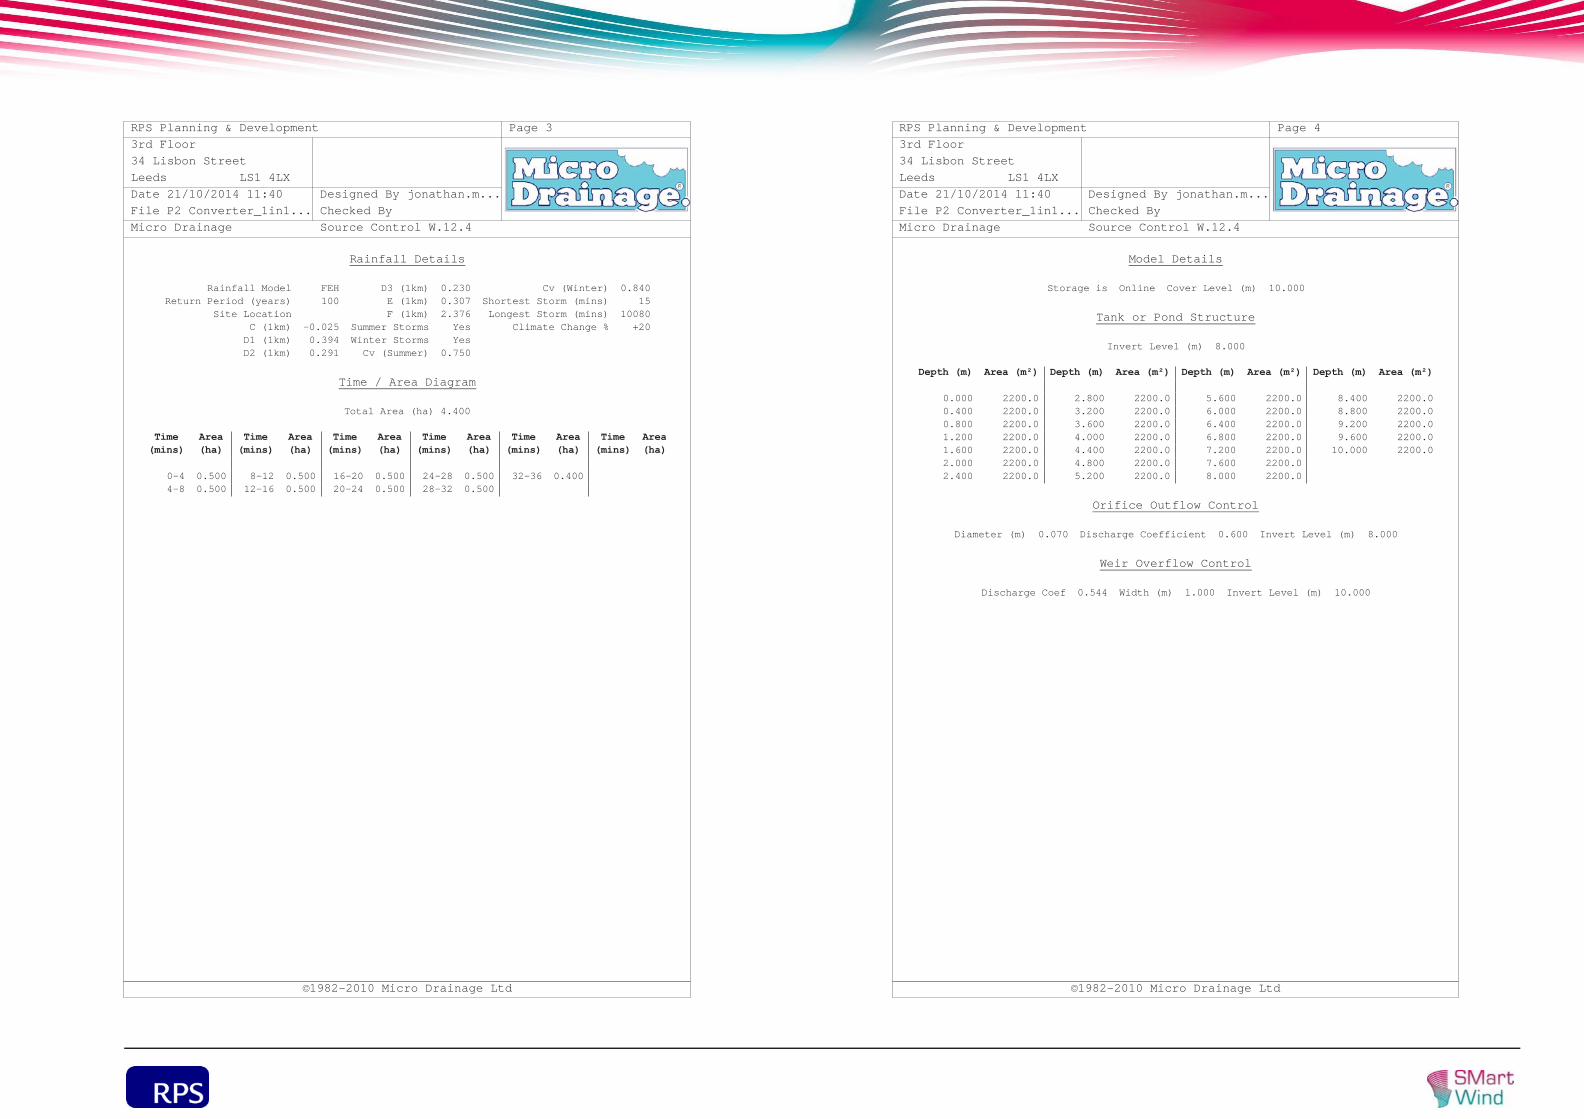
Rainfall Details
Rainfall Model FEH D3 (1km) 0.230 Cv (Winter) 0.840Return Period (years) 100 E (1km) 0.307 Shortest Storm (mins) 15
Site Location F (1km) 2.376 Longest Storm (mins) 10080C (1km) -0.025 Summer Storms Yes Climate Change % +20D1 (1km) 0.394 Winter Storms YesD2 (1km) 0.291 Cv (Summer) 0.750
Time / Area Diagram
Total Area (ha) 4.400
Time(mins)
Area(ha)
Time(mins)
Area(ha)
Time(mins)
Area(ha)
Time(mins)
Area(ha)
Time(mins)
Area(ha)
Time(mins)
Area(ha)
0-4 0.500 8-12 0.500 16-20 0.500 24-28 0.500 32-36 0.4004-8 0.500 12-16 0.500 20-24 0.500 28-32 0.500
RPS Planning & Development3rd Floor34 Lisbon StreetLeeds LS1 4LXDate 21/10/2014 11:40File P2 Converter_1in1...Micro Drainage
Designed By jonathan.m...Checked BySource Control W.12.4
Page 3
©1982-2010 Micro Drainage Ltd
Model Details
Storage is Online Cover Level (m) 10.000
Tank or Pond Structure
Invert Level (m) 8.000
Depth (m) Area (m²) Depth (m) Area (m²) Depth (m) Area (m²) Depth (m) Area (m²)
0.000 2200.0 2.800 2200.0 5.600 2200.0 8.400 2200.00.400 2200.0 3.200 2200.0 6.000 2200.0 8.800 2200.00.800 2200.0 3.600 2200.0 6.400 2200.0 9.200 2200.01.200 2200.0 4.000 2200.0 6.800 2200.0 9.600 2200.01.600 2200.0 4.400 2200.0 7.200 2200.0 10.000 2200.02.000 2200.0 4.800 2200.0 7.600 2200.02.400 2200.0 5.200 2200.0 8.000 2200.0
Orifice Outflow Control
Diameter (m) 0.070 Discharge Coefficient 0.600 Invert Level (m) 8.000
Weir Overflow Control
Discharge Coef 0.544 Width (m) 1.000 Invert Level (m) 10.000
RPS Planning & Development3rd Floor34 Lisbon StreetLeeds LS1 4LXDate 21/10/2014 11:40File P2 Converter_1in1...Micro Drainage
Designed By jonathan.m...Checked BySource Control W.12.4
Page 4
©1982-2010 Micro Drainage Ltd
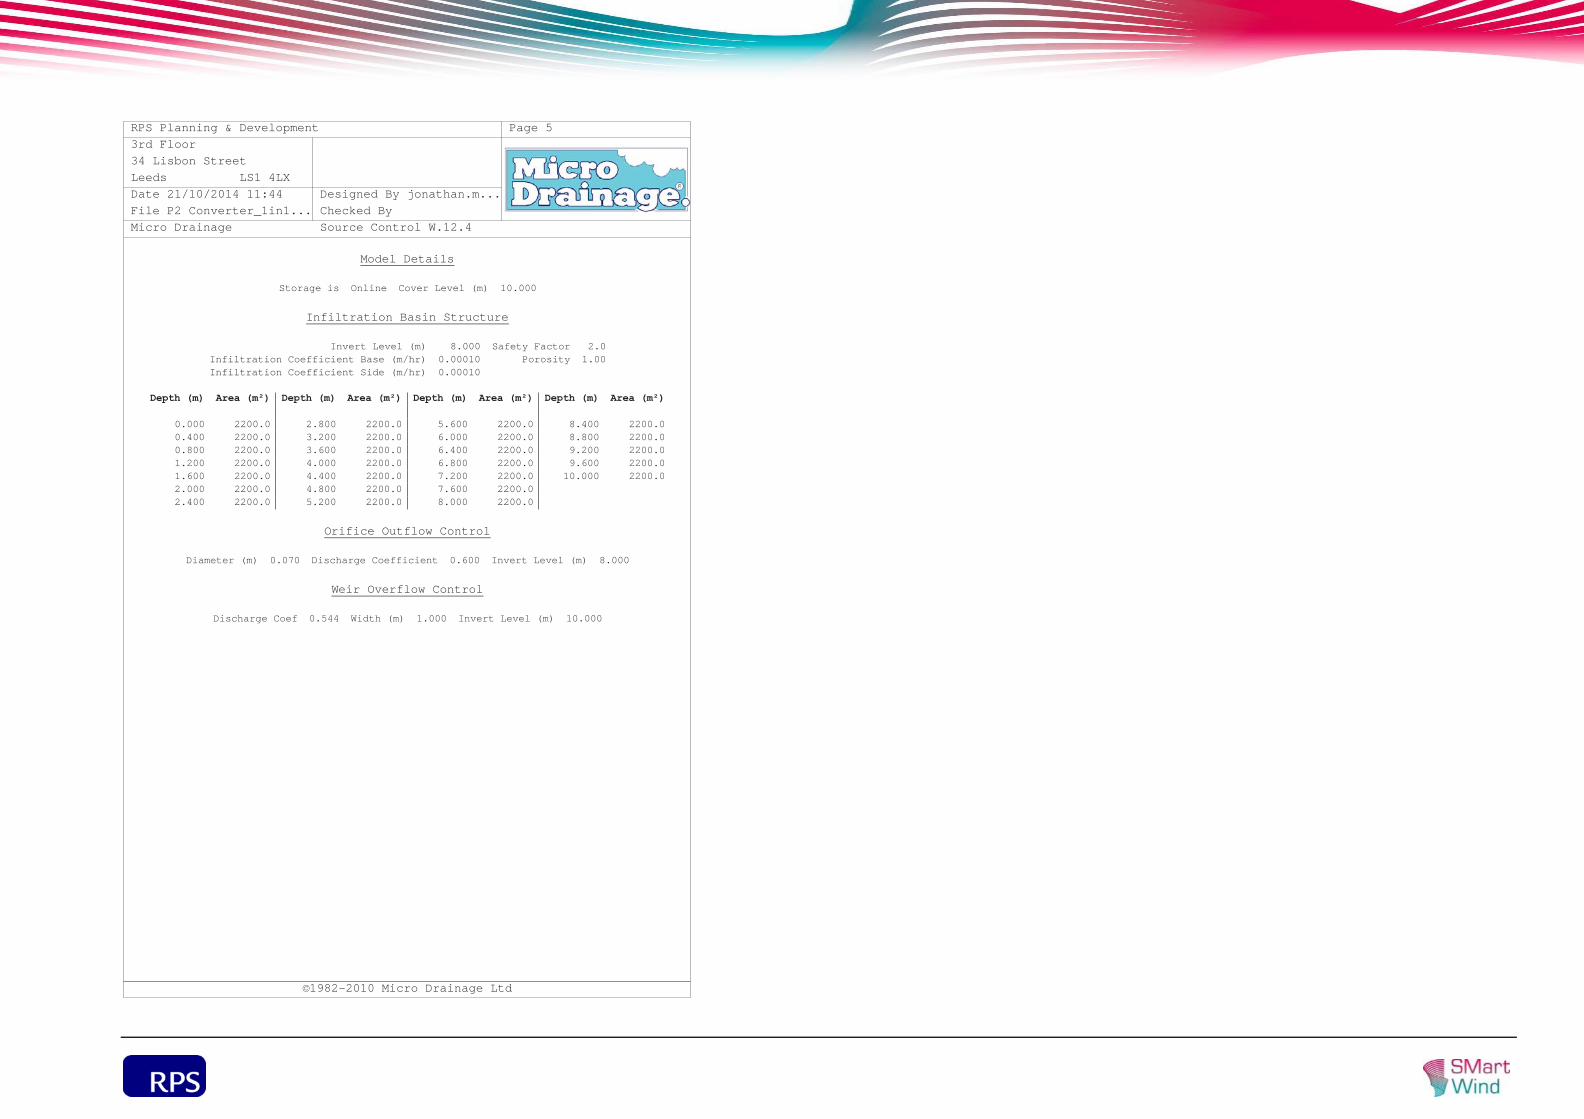
Model Details
Storage is Online Cover Level (m) 10.000
Infiltration Basin Structure
Invert Level (m) 8.000 Safety Factor 2.0Infiltration Coefficient Base (m/hr) 0.00010 Porosity 1.00Infiltration Coefficient Side (m/hr) 0.00010
Depth (m) Area (m²) Depth (m) Area (m²) Depth (m) Area (m²) Depth (m) Area (m²)
0.000 2200.0 2.800 2200.0 5.600 2200.0 8.400 2200.00.400 2200.0 3.200 2200.0 6.000 2200.0 8.800 2200.00.800 2200.0 3.600 2200.0 6.400 2200.0 9.200 2200.01.200 2200.0 4.000 2200.0 6.800 2200.0 9.600 2200.01.600 2200.0 4.400 2200.0 7.200 2200.0 10.000 2200.02.000 2200.0 4.800 2200.0 7.600 2200.02.400 2200.0 5.200 2200.0 8.000 2200.0
Orifice Outflow Control
Diameter (m) 0.070 Discharge Coefficient 0.600 Invert Level (m) 8.000
Weir Overflow Control
Discharge Coef 0.544 Width (m) 1.000 Invert Level (m) 10.000
RPS Planning & Development3rd Floor34 Lisbon StreetLeeds LS1 4LXDate 21/10/2014 11:44File P2 Converter_1in1...Micro Drainage
Designed By jonathan.m...Checked BySource Control W.12.4
Page 5
©1982-2010 Micro Drainage Ltd

APPENDIX D
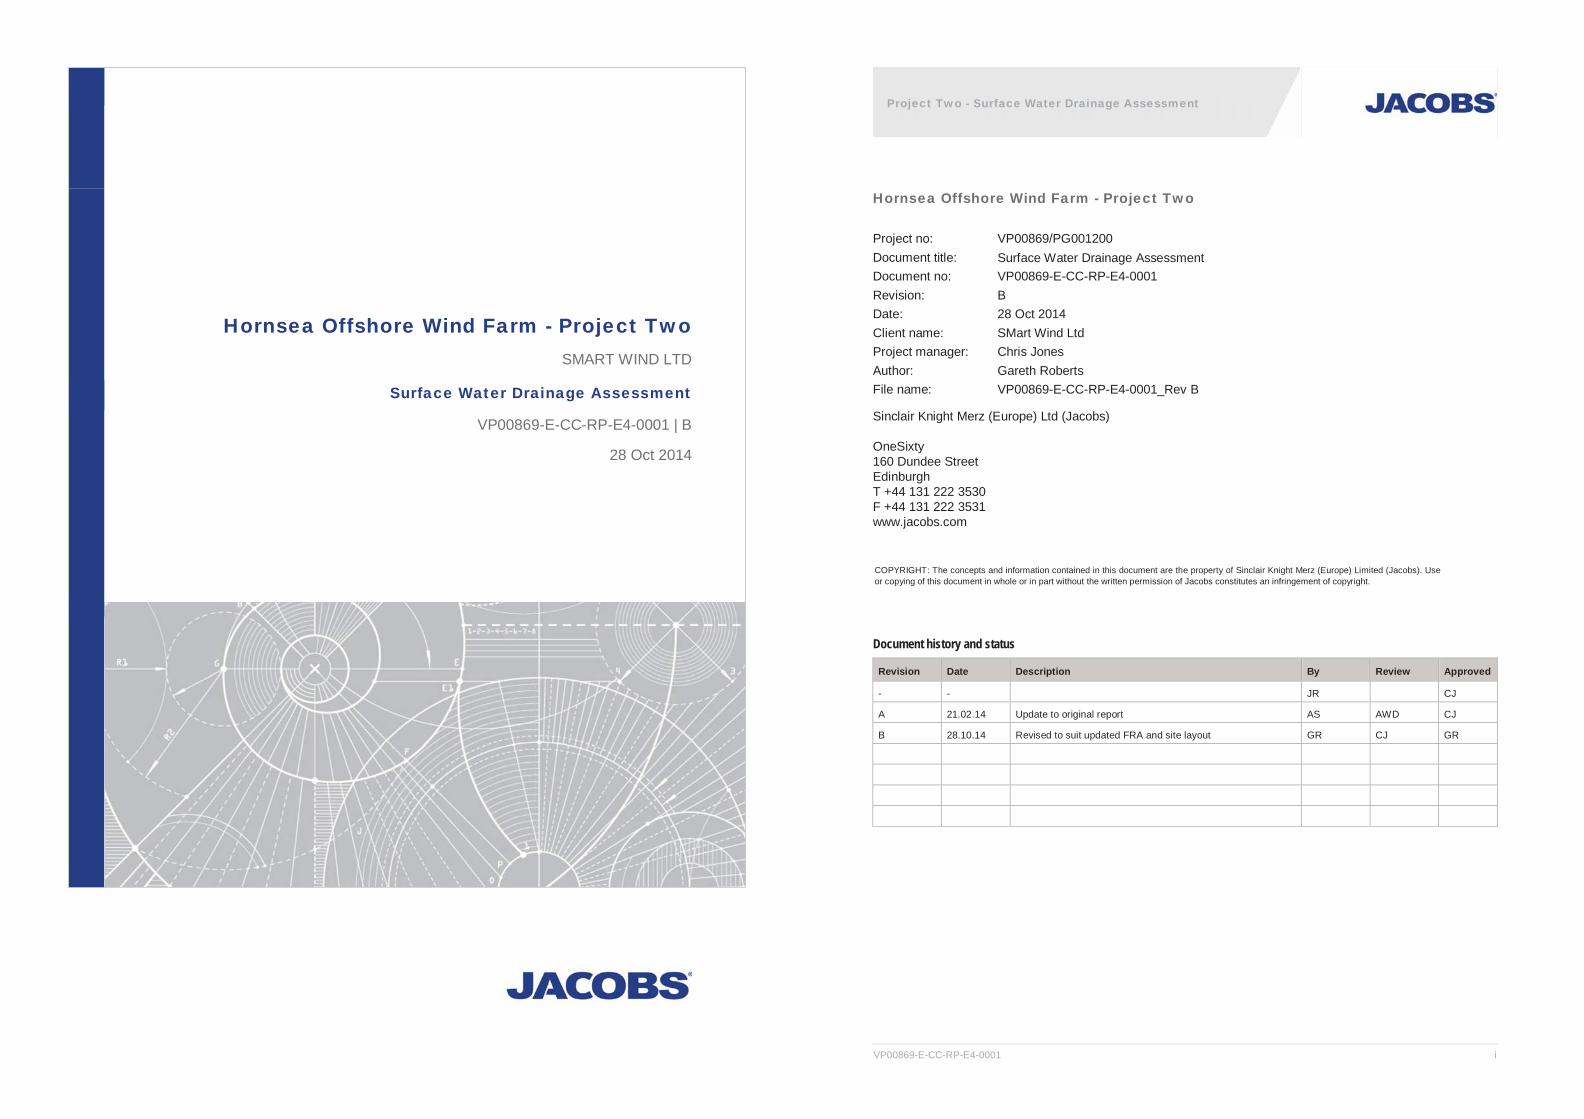
Hornsea Offshore Wind Farm - Project Two SMART WIND LTD
Surface Water Drainage Assessment
VP00869-E-CC-RP-E4-0001 | B
28 Oct 2014
Project Two - Surface Water Drainage Assessment
VP00869-E-CC-RP-E4-0001 i
Hornsea Offshore Wind Farm - Project Two
Project no: VP00869/PG001200 Document title: Surface Water Drainage Assessment Document no: VP00869-E-CC-RP-E4-0001 Revision: BDate: 28 Oct 2014 Client name: SMart Wind Ltd Project manager: Chris Jones Author: Gareth Roberts File name: VP00869-E-CC-RP-E4-0001_Rev B
Sinclair Knight Merz (Europe) Ltd (Jacobs)
OneSixty 160 Dundee Street Edinburgh T +44 131 222 3530 F +44 131 222 3531 www.jacobs.com
COPYRIGHT: The concepts and information contained in this document are the property of Sinclair Knight Merz (Europe) Limited (Jacobs). Use or copying of this document in whole or in part without the written permission of Jacobs constitutes an infringement of copyright.
Document history and status
Revision Date Description By Review Approved
- - JR CJ
A 21.02.14 Update to original report AS AWD CJ
B 28.10.14 Revised to suit updated FRA and site layout GR CJ GR
Project Two - Surface Water Drainage Assessment
VP00869-E-CC-RP-E4-0001 ii
Contents 1. Introduction ..........................................................................................................................................42. Outline Design Information Summary .................................................................................................53. Outline Design Calculations ................................................................................................................64. Outline Design Summary .....................................................................................................................8
Project Two - Surface Water Drainage Assessment
VP00869-E-CC-RP-E4-0001
Important note about your report
The sole purpose of this report and the associated services performed by Jacobs is to assess and review the Flood Risk Assessment (FRA) and produce high level surface water drainage solution in accordance with the scope of services set out in the contract between Jacobs and the Client.
In preparing this report, Jacobs has relied upon, and presumed accurate, any information (or confirmation of the absence thereof) provided by the Client and/or from other sources. Except as otherwise stated in the report, Jacobs has not attempted to verify the accuracy or completeness of any such information. If the information is subsequently determined to be false, inaccurate or incomplete then it is possible that our observations and conclusions as expressed in this report may change.
Jacobs derived the data in this report from information sourced from the Client (if any) and/or available in the public domain at the time or times outlined in this report. The passage of time, manifestation of latent conditions or impacts of future events may require further examination of the project and subsequent data analysis, and re-evaluation of the data, findings, observations and conclusions expressed in this report. Jacobs has prepared this report in accordance with the usual care and thoroughness of the consulting profession, for the sole purpose described above and by reference to applicable standards, guidelines, procedures and practices at the date of issue of this report. For the reasons outlined above, however, no other warranty or guarantee, whether expressed or implied, is made as to the data, observations and findings expressed in this report, to the extent permitted by law.
This report should be read in full and no excerpts are to be taken as representative of the findings. No responsibility is accepted by Jacobs for use of any part of this report in any other context.
This report has been prepared on behalf of, and for the exclusive use of, Jacobs’s Client, and is subject to, and issued in accordance with, the provisions of the contract between Jacobs and the Client. Jacobs accepts no liability or responsibility whatsoever for, or in respect of, any use of, or reliance upon, this report by any third party

Project Two - Surface Water Drainage Assessment
VP00869-E-CC-RP-E4-0001
1. Introduction Jacobs have been engaged by Smart Wind ltd to assist in the completion of a Flood Risk Assessment (FRA) by supplying a Surface Water Drainage Assessment for the proposed HVDC converter/HVAC substation for the proposed Offshore Wind Farm in Hornsea.
This document should be read in conjunction with Annex 6.2.3 of Smart Wind’s Environmental Statement (ES) for the Hornsea Wind Farm (Project Two). This incorporates an FRA completed by RPS for the proposed HVDC converter/HVAC substation. The FRA provides background information about the proposed scheme and sets the context for the Surface Water Drainage Assessment.
The scope of this document is to quantify and qualify the proposed Surface water management proposals in terms of drainage design. The proposals are still outline in nature however practical considerations have been applied to the proposals.
Project Two - Surface Water Drainage Assessment
VP00869-E-CC-RP-E4-0001
2. Outline Design Information Summary The following information has been determined from the FRA for the full site.
Proposed Developed Area (Project Two) 4.4 ha (buildings, access tracks/roads and compacted gravel hardstanding areas)
Redline Boundary (application area) Approx. 12.75ha
Max Ground Level (western side) 9.6 m AOD
Min Ground Level (eastern side) 7.5 m AOD
Design Storm Event 1 in 100 yr + 20%
EA Flood level Between 2.2m and 3.6 m OD
The following information has been determined from the FRA for Project Two
Catchment Area 4.4 ha
Greenfield Runoff Rate (1 year RP) 14.50 l/s
Building Structure 4,793 m2
Concrete/Tarmac internal access roads and compacted aggregate fill
33,468 m2
External access roads cover approximately 5,298 m2
Required attenuation volume 3,729 m3 - Based on a 1 in 100 year storm (+20%) discharged at the 1 in 1 year rate as outlined in the Draft DEFRA National SuDS Standards
The following information has been assumed.
Outfall Level (assumes 0.5m above eastern ground level to allow discharge into surrounding water environment. Also allows for free discharge above EA Flood Level of 7.75m AOD)
8.0 m AOD
No groundwater information is available for the site however the underlying geology is known to be firm clay. This stratum will be impermeable so infiltration has not been considered further.

Project Two - Surface Water Drainage Assessment
VP00869-E-CC-RP-E4-0001
3. Outline Design Calculations The following pages are hand calculations that have been inserted for information and reference. Section 4 provides a summary of the outcome of the calculations.
Project Two - Surface Water Drainage Assessment
VP00869-E-CC-RP-E4-0001
Calculation Sheet
1
Rev.
B
Contract
SMART WIND LTD, HORNSEA PROJECT Two Contract No VP00869
Part of Structure Date 28/10/14
CONVERTER STATION Designer G.ROBERTS
Item
11234
Calculations are undertaken to comply with the following standards NPPF/PPS25BSEN 752 Building Regulations Part H Sewers for Adoption 7th Ed.
21
The following industry standard software has been used to undertake the calculations WinDes (Microdrainage)
3 Sustainable urban drainage (SUDs) principle have been adopted by means of:12
Below ground attenuation Flow Control Device
412
WinDes Output files are appended for justification purposes for: Quick Storage Estimate Input Data Quick Storage Estimate Output Results
5 Allowance for climate change: 1
61
A 20% increase on rainfall intensities has been included to allow for the effects of climate change.
Sources of information Smart Wind, Hornsea Offshore Wind Farm, Project Two ES, Annex 6.2.3– HVDC converter/HVAC substation FRA
71234
Design Information from above source: Catchment Area (Project 2 roof & hardstanding) 4.4Ha Greenfield Runoff 14.5l/s Underlying geology is firm clay therefore infiltration is not considered Site falls east to west from 9.6M to 7.5m AOD
5 Attenuation required is 3,729m3
8 Design Assumption1234
No groundwater information exists, assumed to high and linked to drainage networkIt is assumed that the site exists is outside the flood plainDitch levels are not provided. Outfall is assumed to be 0.5m above top of ditch on eastern side of site (IL=8m AOD) EA floodmap shows a flood level of around 7.75m AOD contour for a 1 in 100 yr (river) and 1 in 200 yr (sea) event. A surcharge level of 7.75m AOD has been assumed. Therefore discharge level shown above this surcharge level.

Project Two - Surface Water Drainage Assessment
VP00869-E-CC-RP-E4-0001
4. Outline Design Summary The calculations provided within Annex 6.2.3 of the ES (HVDC converter/HVAC substation FRA) demonstrate that for Project Two the estimated surface water attenuation volume required is 3,729 m3
This attenuation may be provided as a tank, basin or pond. However, all these solutions could potentially require land take out with the site boundary. To mitigate against this whilst providing an appropriate drainage solution, the attenuation can be provided by utilising the permeable voids within the aggregate that forms the convertor station and substation. This will allow the voids within the aggregate below to provide attenuation storage for critical storm events.
To implement this, appropriate parts of the proposed gravel/aggregate areas will need to be constructed with suitably specified/graded aggregate. This aggregate can be specified to achieve a typical voids ratio of 30%. Therefore, assuming that all of the total attenuation volume (3,729 m3) is provided within this aggregate layer, the required volume of aggregate to achieve this storage is 12,430m3. Figure 1 shows the typical converter/substation layout showing the gravelled areas hatched in blue (approximately 3.25ha). Assuming that approximately 50% of this total gravelled area can be utilised for attenuation, this equates to a typical depth of attenuation storage of 0.76m.
This outline design solution will be subject to finalisation and refinement as part of the detailed design process. The incorporation of attenuation storage in basins, tanks or ponds may be incorporated as part of the final design in order to suitably control surface water to prevent a detrimental impact on the overall catchment. An alternative scenario is described below.
If only 25% of the total gravel area could be utilised for attenuation with a maximum depth of 0.76m, a secondary attenuation measure would be required. This could take the form of a large basin with flow control device. A basin could provide the additional storage volume with a final volume and size to be determined as part of the detailed design.
The final designs and details of the attenuation storage measures must therefore be determined during detailed design in order to confirm the most appropriate method for attenuating the surface water from the site with controlled discharge(s) into the local water environment. The figures and solutions quoted above provide the overall high level volumes and strategy options. The final designs must be completed to the satisfaction of all key stakeholders.
Project Two - Surface Water Drainage Assessment
VP00869-E-CC-RP-E4-0001
Figure 1 Typical Converter Station Layout (gravelled area shaded blue)