annex ix project evaluation
TRANSCRIPT

ANNEX IX
PROJECT EVALUATION

i
The Feasibility Studyon
Integrated Agricultural and Rural Developmentin
Highland Area in the Republic of Indonesia
ANNEX IX PROJECT EVALUATION
Table of Contents
Page
Chapter 1 ECONOMIC EVALUATION................................................................. IX-1
1.1 Key Assumptions for the Economic Evaluation ............................................ IX-1
1.2 Economic Benefits........................................................................................ IX-2
1.2.1 The Economic Evaluation Approach ............................................... IX-2
1.2.2 Agricultural Benefits ....................................................................... IX-2
1.3 Economic Costs ............................................................................................ IX-6
1.3.1 Initial Investment Cost .................................................................... IX-6
1.3.2 Annual Operation and Maintenance Cost......................................... IX-6
1.3.3 Replacement Cost............................................................................ IX-7
1.4 Economic Evaluation.................................................................................... IX-7
1.4.1 Annual Cost-Benefit Flow............................................................... IX-7
1.4.2 Economic Internal Rate of Return (EIRR) ....................................... IX-7
1.5 Sensitivity Analysis ...................................................................................... IX-8
Chapter 2 FINANCIAL EVALUATION OF TYPICAL FARM BUDGET ............. IX-9
2.1 Cash Flow Analysis ...................................................................................... IX-9
2.2 Financial Evaluation of Typical Farm Household Economy ........................ IX-10
Chapter 3 SOCIOECONOMIC IMPACT ............................................................. IX-12
3.1 Increase of Farmers’ Income....................................................................... IX-12
3.2 Increase of Employment Opportunities ....................................................... IX-12
3.3 Promotion of Joint Works and Activation of Rural Organizations................ IX-12
3.4 Market Road Serving for the Rural Areas.................................................... IX-13
3.5 Expansion of Women’s Role ....................................................................... IX-13
3.6 Expansion of Non-Farming Business Opportunity....................................... IX-13
3.7 Impacts from the National Perspective ........................................................ IX-13
Chapter 4 ENVIRONMENTAL IMPACTS .......................................................... IX-15
4.1 Sustainable Agriculture .............................................................................. IX-15
4.2 Improvement of Living Environment ......................................................... IX-15

ii
4.3 Increase of Farmers’ Motivation for Good-farming Practice ....................... IX-15
4.4 Prevention of Further Degradation of Environmental Resources ................. IX-15
Chapter 5 PROJECT EVALUATION ................................................................... IX-17
List of Tables
Table IX-1 Estimation of Standard Conversion Factor (SCF) for Indonesia ........ T-IX-1
Table IX-2 Financial and Economic Prices of Agricultural Inputs andOutputs in Mekarjaya Model Area.................................................... T-IX-2
Table IX-3 Financial and Economic Prices of Agricultural Inputs andOutputs in Langensari Model Area ................................................... T-IX-3
Table IX-4 Financial and Economic Prices of Agricultural Inputs andOutputs in Gekbrong Model Area..................................................... T-IX-4
Table IX-5 Financial and Economic Prices of Agricultural Inputs andOutputs in Tanjungkarya Model Area ............................................... T-IX-5
Table IX-6 Summary of Crop Budgets under Without/With-ProjectConditions of Mekarjaya Model Area ............................................... T-IX-6
Table IX-7 Summary of Crop Budgets under Without/With-ProjectConditions of Langensari Model Area .............................................. T-IX-7
Table IX-8 Summary of Crop Budgets under Without/With-ProjectConditions of Gekbrong Model Area ................................................ T-IX-8
Table IX-9 Summary of Crop Budgets under Without/With-ProjectConditions of Tanjungkarya Model Area .......................................... T-IX-9
Table IX-10 Economic Production Value and Incremental Benefit underWithout/With-Project Conditions of Mekarjaya Model Area........... T-IX-10
Table IX-11 Economic Production Value and Incremental Benefit underWithout/With-Project Condition of Langensari Model Area............ T-IX-11
Table IX-12 Economic Production Value and Incremental Benefit underWithout/With-Project Condition of Gekbrong Model Area ............. T-IX-12
Table IX-13 Economic Production Value and Incremental Benefit underWithout/With-Project Condition of Tanjungkarya Model Area........ T-IX-13
Table IX-14 Annual Disbursement Schedule of Economic Initial InvestmentCost of the Model Areas ................................................................. T-IX-14
Table IX-15 Economic Cost and Benefit Flow of Mekarjaya Model Area........... T-IX-15
Table IX-16 Economic Cost and Benefit Flow of Langensari Model Area.......... T-IX-16
Table IX-17 Economic Cost and Benefit Flow of Gekbrong Model Area............ T-IX-17
Table IX-18 Economic Cost and Benefit Flow of Tanjungkarya Model Area...... T-IX-18
Table IX-19 Economic Cost and Benefit Flow of Four (4) Priority ModelAreas.............................................................................................. T-IX-19
Table IX-20 Financial Cash Flow of Mekarjaya Model Area .............................. T-IX-20
Table IX-21 Financial Cash Flow of Langensari Model Area ............................. T-IX-21
Table IX-22 Financial Cash Flow of Gekbrong Model Area ............................... T-IX-22

iii
Table IX-23 Financial Cash Flow of Tanjungkarya Model Area ......................... T-IX-23
Table IX-24 Financial Cash Flow of 4 Priority Model Areas .............................. T-IX-24
List of Figures
Figure IX-1 General Conceptual Framework for the Economic Evaluation ofthe Project .........................................................................................F-IX-1

IX-1
CHAPTER 1 ECONOMIC EVALUATION
1.1 Key Assumptions for the Economic Evaluation
In this sub-section, some key assumptions used in the economic evaluation of the
project will be explained. These include standard conversion factor, transfer
payments, construction conversion factor, economic life time of the project and
discount factor.
(a) Standard Conversion Factor (SCF)
From the perspective of economic evaluation, it is important to distinguish traded
goods and non-traded goods. Meanwhile, international trade are, in general,
contained with tariff and other trade restrictions such as trade subsidization. As a
consequence, the price relationship between trade goods and non-traded goods are
distorted. For the evaluation of economic benefits and costs of the project, the
effect of this distortion on prices of non-traded goods at world market level is
needed to correct. To this end, a standard conversion factor (SCF) is applied to
non-traded goods. The calculation formula for SCF is as follows:
),()(
)(
TmSmMTxSxX
MXSCF
+−+−++=
where, X = total export; M = total import ; Sx = total export subsidy, Sm = total import subsidy;
Tx = total export taxes and Tm = total import taxes.
The SCFs in the years of 1994/95-1998/991/ range 0.94 to 0.98. In this project,
the SCF which is used is the average of the five-years figures, i.e. 0.96. The
calculation is shown in Table IX-1.
The SCF figure is not applied to unskilled labor service. For this kind of input,
the BAPPENAS’ conversion standard of 0.8 is applied.
(b) Transfer payments
Transfer payments such as subsidy, contract tax, duty and interest may involve in
a project. From the perspective of international economy, these transfer
payments are not directly productive, since they are simply a domestic monetary
movement. As a consequence, from the perspective of economic evaluation, the
transfer payments are not considered as the project’s costs.
1/ Data are only available for up-to the fiscal year 1998/99. Data for the year 1999/2000 are not available yet,
since the National Bureau Statistics (BPS) just starts collecting information for the fiscal year 1999/2000when this study is undergoing.

IX-2
(c) Component Conversion Factors for Economic Cost Estimation (CCF)
Individual financial element of any cost component of the project can be divided
into labour and non-labour component. Further more, each component can be
categorized into local content (L/C) and foreign content (F/C). In calculating
economic cost of any individual cost component, the following formula of
convertion factor is used:
(1) For L/C labour cost component, the BAPPENAS’ Conversion Factor of
0.80 is applied,
(2) For L/C non-labour cost component, the Standard Conversion Factor of
0.96 is applied,
(3) For F/C labour or non-labour cost component, the Conversion Factor of
1.00 is applied.
(d) The Project’s Economic Life Time
Economic life time of the project is assumed to be 30 years. During this period
of time, some components of the major construction require replacements. For
details of replacement components, schedules and costs see Annex V.
1.2 Economic Benefits
1.2.1 The Economic Evaluation Approach
In evaluating the economic benefits and costs of the project, this study employs
a with-without project condition approach. In this context, the economic
benefits are considered as incremental benefits, that is the difference between the
benefits that will be generated under the implementation of the project and the
benefits that will be obtained if the project is not implemented. For the general
conceptual framework for the economic evaluation of the project see Figure IX-
1.
1.2.2 Agricultural Benefits
(1) Input and Output Prices
(a) Financial Prices
For all inputs, actual farm gate prices obtained are used as the relevant
financial prices in this study. Meanwhile, for all outputs, except rice,
soybean and maize, financial farm gate prices are estimated by taking into
account:
• Average price at main market destination (i.e. Jakarta and Bandung) and

IX-3
• Proportion of products sold at these markets from the model areas,
• Cost of transportation to these markets from the model areas,
• Cost of product handling
Thus, for instance, farm gate price of cabbage in Mekarjaya is calculated as
follows:
Price of Mekarjaya ‘s cabbage = {(Pb x Ab) + (Pj xAj)} – {Pb (Tb +Hb) +
(Pj (Tj+Hj)};
where,
Pb : Proportion of product sold to Bandung;
Pj : Proportion of products sold to Jakarta;
Ab: Average price of cabbage in Jakarta over the period of 1997-1999;
Aj : Average price of cabbage in Jakarta over the period of 1997-1999;
Tb and Tj : Transport costs respectively to Bandung and Jakarta;
Hb and Hj : Cost of handling to Bandung and to Jakarta, respectively.
Meanwhile, financial farm gate prices of rice, soybean and maize are assumed
same as their actual farm gate prices while the study conducted.
The estimated financial farm gate prices of vegetable outputs, rice, maize,
soybean and farm inputs are presented in Tables IX-2, IX-3, IX-4 and IX-5.
(b) Economic Prices
Economic farm gate prices of agricultural inputs and outputs are estimated as
follows:
• Economic prices of chemical fertilizers and agro-chemicals are derived
from the World Bank projection of c.i.f border prices. The method is
the c.i.f prices plus handling and transportation costs to farm gate.
• Indonesia imports a large amount of rice, soybean, and maize annually
from overseas. Economic prices of rice, soybean and maize are derived
from the World Bank projection of c.i.f border price. The method is the
c.i.f price plus handling and transportation costs to farm gate.
• Farm labour is considered as unskilled labour. Applying the
BAPPENAS’ conversion factor, economic price of farm labour would be
0.8 of its current financial wage rate.
• Different from manufactured fertilizers, compost (manured fertilizer) is
not tradable internationally, but domestically. In this study, the

IX-4
economic price of compost input is assumed equal to its current farm gate
price.
• Indonesia is involved in both export and import of vegetables. But,
their magnitudes are relatively very small. Economic prices of
vegetables are then assumed to be the same as their estimated financial
farm gate prices.
Economic farm gate prices of agricultural inputs and outputs are given in
Tables IX-2, IX-3, IX-4 and IX-5.
(2) Anticipated Crop Production
(a) Proposed Land Use, Cropping Pattern and Intensity
Proposed land use, cropping pattern, annual sizes of cultivation by crop and
cropping intensity in each model area under without and with project
conditions have been estimated and discussed in Annex II.
(b) Expected Crop Yields
It is assumed that the average crop yields under without project condition will
be the same as the present one in the model areas. Meanwhile, the use of
irrigation system together with the accompanied production technology will
improve the average crop yield significantly. Crop yields under without
and with project conditions have been estimated and discussed in Annex II.
(c) Incremental Production
As both cropping intensities and yields have increased as the result of the
improvement of the production technology, there will be significant
incremental in crop productions in the model areas after the completion of the
project. The extent of these incremental crop productions has been
estimated and discussed in Annex II.
(3) Crop Budget and Incremental Net Income by Crop per Hectare Cultivation
Crop budgets under without and with project conditions have been estimated for
the major crops2. In this estimation, the unit analysis is made for one hectare of
farm operation. From this estimation, incremental profit that will be obtained
from each major crop production after the implementation of the project is then
calculated. The calculation’s result is shown in the following table.
2 See details of crop budget estimation in Tables IX-6, IX-7, IX-8 and IX-9

IX-5
Incremental Net Income (Profit) by Crop per Hectare Cultivation in the Model Areas
Model Areas (Rp 1000)CropsMekarjaya Langensari Gekbrong Tanjungkarya
A. Vegetables 1. Tomato 7,428 2,320 5,202 1,638 2. Chilli 9,875 5,260 4,662 4,804 3. Potato 8,897 7,480 8,992 3,372 4. Cabbage 1,672 760 2,537 912 5. Chinese cabbage 1,580 1,240 380 367 6. Bean vegetable 4,770 2,740 3,830 3,925 7. Red onion 3,328 3,730 3,435 3,410 8. Welsh onion 6,438 5,130 1,415 3,125 9. Carrot 4,039 1,760 2,454 69410. Sweet corn 1,140 1,300 2,512 2,498B. Food Crops 1. Paddy -5,530 0 0 790 2. Maize -1,610 0 -2,530 -2,530 3. Sweet potato -2,800 0 0 0 4. Soybean 0 0 0 0
(4) Economic Agricultural Benefits
(a) Total Benefits
In this context, the definition of agricultural benefits are defined as the
incremental net income (profit) from agricultural production between under
without and with project conditions. Based on this definition, total
agricultural benefits has been estimated and the following table presents the
calculation’s summary3.
Total Benefit
Model Areas (Rp million)CropsMekarjaya Langensari Gekbrong Tanjungkarya
Total(Rpmillion)
A. Vegetables 2,153 942 894 1,064 5,053B. Parawija -26 0 -17 0 -43C. Rice -221 0 0 -118 -339Total 1,906 942 877 946 4,671
(b) Benefit Build-up
It is expected that the project’s implementation will be started in 2001. The
implementation will be completed in 5 years, so that the full
operationalisation of the system will be by the year of 2007. Accordingly,
the project benefit is expected to be built up gradually and the benefit-
3For details see Tables IX-10 to Table IX-13.

IX-6
building-up schedule is assumed to be as follows:
Benefit Build-Up Schedule
Years of Targeted Achievement
Percentage of the TargetedBenefit Realized (%)
1St year (2003) 402nd year (2004) 603rd year (2005) 804th year (2006) 905th year (2007) 100
1.3 Economic Costs
1.3.1 Initial Investment Cost
Initial investment cost consists of four main components, namely (a) construction
cost of rural facilities, (b) training and extension cost, (c) common cost for
development, and (d) related cost. The financial initial investment cost has been
estimated and its detail estimation is provided in Annex V. Estimation of
economic initial investment cost is carried out by applying the rule of CCF which
has been explained in Section 1.3 above to the financial initial investment
component costs. The estimation result is given in the following table.
Estimated Economic Initial Investment Cost
Model Areas (Rp million)Cost ComponentsMekarjaya Langensari Gekbrong Tanjungkarya Total
1.Construction of rural facilities
2,767.0 1,490.2 1,783.4 1,750.5 7,791.1
2.Training and extension
430.4 319.1 222.6 312.6 1,284.7
3.Common cost development
1,666.3 1,164.4 1,003.8 1,545.9 5,380.4
4. Related cost 935.2 561.7 591.9 723.6 2,812.4 Total 5,799.0 3,535.4 3,601.8 4,332.5 17,268.7
The total of economic initial investment cost for the four selected model areas is
estimated at Rp. 17,269 million. Annual disbursement of this economic initial
investment cost is presented in Table IX-14.
1.3.2 Annual Operation and Maintenance Cost
Operational and maintenance cost consists of two main components, namely (a)
operational cost and (b) maintenance cost. The financial operational and
maintenance cost has been estimated and its detailed estimation is provided in
Annex V. Estimation of economic operational and maintenance cost is carried
out by applying the rule of CCF. The estimation result is given in the following
table:

IX-7
Annual Economic Operational and Maintenance Cost of the Model Areas
Model Areas O&M Cost (Rp million)1. Mekarjaya 109.22. Langensari 147.73. Gekbrong 76.54. Tanjungkarya 64.7 Total 398.1
1.3.3 Replacement Costs
Replacement cost consists of two kinds, namely (a) components to be replaced at
every 10 years and (b) components to be replaced at every 15 years. The
financial replacement cost has been estimated and its detailed estimation is
provided in Annex V. Estimation of economic replacement cost is carried out by
applying the rule of CCF. The estimation result is given in the following table:
Annual Disbursement Schedule of Economic Replacement Cost of the Model Areas
Model Areas (Rp million )Replacementinterval Mekarjaya Langensari Gekbrong Tanjungkarya1. 10 years 177.0 44.9 95.3 76.12. 25 years 888.9 375.6 613.7 58.2
1.4 Economic Evaluation
1.4.1 Annual Cost-Benefit Flow
The flow of economic cost and benefit is constructed on the basis of the project
implementation schedule. The flow is shown in Tables IX-15, IX-16, IX-17, IX-
18 and IX-19 for Mekarjaya, Langensari, Gekbrong, Tanjungkarya and the four
priority model areas, respectively.
1.4.2 Economic Internal Rate of Return (EIRR)
Based on the estimated economic benefit structure and the estimated economic
cost structure explained above, EIRR for the model areas is estimated.
Estimation results are presented in the following table.
Estimates of EIRR
Model Areas EIRR (%)1. Mekarjaya 23.32. Langensari 17.23. Gekbrong 17.24. Tanjungkarya 16.2 4 model areas 19.1
IX-8
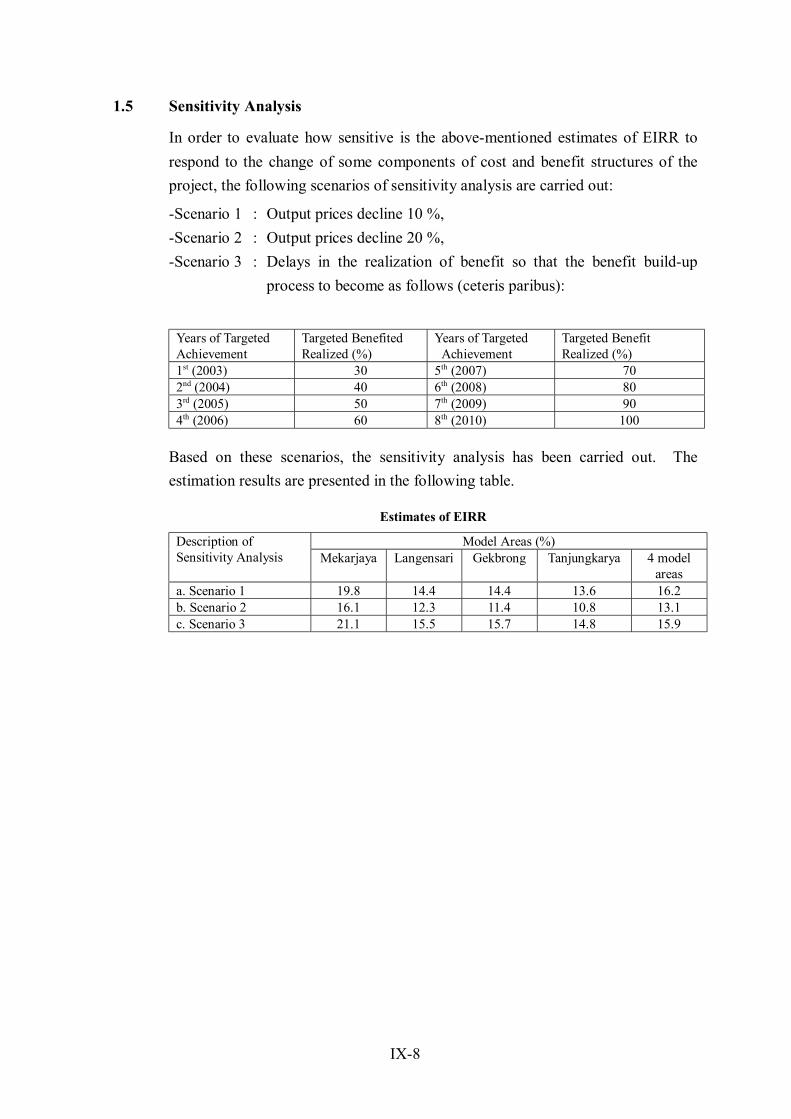
1.5 Sensitivity Analysis
In order to evaluate how sensitive is the above-mentioned estimates of EIRR to
respond to the change of some components of cost and benefit structures of the
project, the following scenarios of sensitivity analysis are carried out:
-Scenario 1 : Output prices decline 10 %,
-Scenario 2 : Output prices decline 20 %,
-Scenario 3 : Delays in the realization of benefit so that the benefit build-up
process to become as follows (ceteris paribus):
Years of TargetedAchievement
Targeted BenefitedRealized (%)
Years of Targeted Achievement
Targeted BenefitRealized (%)
1st (2003) 30 5th (2007) 702nd (2004) 40 6th (2008) 803rd (2005) 50 7th (2009) 904th (2006) 60 8th (2010) 100
Based on these scenarios, the sensitivity analysis has been carried out. The
estimation results are presented in the following table.
Estimates of EIRR
Model Areas (%)Description ofSensitivity Analysis Mekarjaya Langensari Gekbrong Tanjungkarya 4 model
areasa. Scenario 1 19.8 14.4 14.4 13.6 16.2b. Scenario 2 16.1 12.3 11.4 10.8 13.1c. Scenario 3 21.1 15.5 15.7 14.8 15.9

IX-9
CHAPTER 2 FINANCIAL EVALUATION OF TYPICAL FARM BUDGET
2.1 Cash Flow Analysis
(1) Cash Flow Analysis
The capacity to pay the project investment cost is analysed by means of the cash
flow. The analysis is made on the following conditions:
(a) The sources of the project fund are the loan and the government budget. The
loan will be used for the construction cost and training expenses, and the
government budget will be for the project administration cost.
(b) The training cost for task team and external expert cost which will be
effective for other area development are excluded in this cash flow analysis.
(c) The loan condition is :
-Interest rate: 2.4%/annum
- Repayment: Grace period of 10years and repayment to be completed
by 30 years
(d) Micro credit to farmers’ cooperatives on the basis of Rp. 1 million per ha is
assumed from the loan for initial operation fund of the cooperatives
The result of cash flow analysis is shown in Table X-24.
Amortization Rate of Capital Cost by Beneficiaries100% 40% 30% 20% 10% 0%
1 Annual Cost(1) O&M Cost Constant Constant Constant Constant Constant Constant(2) Replacement Cost Constant Constant Constant Constant Constant Constant
(3) Annual amortization (after 11 years) Constant Constant Constant Constant Constant Constant2 Increase of living standard of beneficiary
In case of the constant increasing rate
(1)
Annual increasing rate ofliving expenditure forinitial 10 years 5.3% 5.7% 5.8% 5.8% 5.9% 6.0%
(2) Increasing rate at 10th 1.59 1.65 1.66 1.67 1.67 1.68(3) Increasing rate at 11th 0% 0% 0% 0% 0% 0%
3 Annual cost per ha and percentage to net income
(1)Annual O&M andReplacement costs*1 (Rp.1000/ha) 1,920 1,920 1,920 1,920 1,920 1,920Percent to net income (%) 7.3% 7.3% 7.3% 7.3% 7.3% 7.3%
(2)Annual amortization(after 11th year) (Rp.1000/ha) 2,490 1,000 750 500 250 0Percent to net income (%) 9.4% 3.8% 2.8% 1.9% 0.9% 0.0%
(3) Total (Rp.1000/ha) 4,410 2,920 2,670 2,420 2,170 1,920Percent to net income (%) 16.7% 11.1% 10.1% 9.2% 8.2% 7.3%
Note: based on constant price*1 using average replacement cost

IX-10
The result shows that all the loan is repaid within the repayment period with the
anticipation of the living expenditure increase of 1.59 times (at the 10th year)
from the present. In case that the O, M & Replacement cost is paid by the
beneficiaries, the beneficiaries burden is Rp. 1,920 x 10 per ha or 7.3 % of net
income. Since the amortization rate is related to the Government policy, the
Government is required to determine amortisation rate in consideration of the
model development on the basis of this result.
The financial cash flow analysis for 4 model areas was made, as shown in Tables
IX-20, IX-21, IX-22, and IX-23 for Mekarjaya, Langensari, Gekbrong, and
Tanjungkarya model areas, respectively
2. 2 Financial Evaluation of Typical Farm Household Economy
Financial evaluation is made on some typical farm budgets. Typical farm
operation sizes in Mekarjaya, Langensari, Gekbrong and Tanjungkarya are,
respectively, 0.12 ha, 0.16 ha, 0.37 ha and 0.25 ha. In Mekarjaya, with the
implementation of the project, the net farm income typical farm will increase from
Rp. 460,000 per annum (under without project condition) to Rp. 2,860,000 per
annum (under with project condition), and therefore, net incremental income is Rp
2,400,000 . Meanwhile, in Langensari, by implementing the project, net farm
income of typical farm will increase from Rp. 2,310,000 per annum (under
without project condition) to Rp. 4,110,000 per annum (under with project
condition), and hence, net incremental income is Rp 1,800, 000.
In Gekbrong, the net farm income of typical farm will increase from Rp.6,120,000
per annum (under without project condition) to Rp.11,460,000 per annum (under
with project condition)., So, the net incremental income will be Rp 5,340,000.
Whereas in Tanjungkarya, net farm income of typical farm will increase from
Rp.3,320,000 per annum (under without project condition) to Rp.6,840,000 per
annum (under with project condition), so that the net incremental income is Rp
3,520,000.
The above-mentioned income increases resulting from the project are quite
significant given the current fact of serious economic problem faced by Indonesia.

IX-11
Increasing of Net Annual Income by the Project
Income of Typical Farm Size Operation in Model Areas (Rp 000)Description
Mekarjaya Tanjungkarya Gekbrong Langensari
Typical Farm Holding Size 0.12 ha 0.25 ha 0.37 ha 0.16 ha
1. Without project condition 460 3,320 6,120 2,310
2. With project condition 2,860 6,840 11,460 4,110
3. Incremental net incomeper annum
2,400 3,520 5,340 1,800
4. Increase rate (%) 622 206 187 178

IX-12
CHAPTER 3 SOCIOECONOMIC IMPACT
3.1 Increase of Farmers’ Income
The improvement of irrigation system and production technology stabilize crop
production, increase land productivity and cropping intensity. Meanwhile, the
improvement of marketing system through improvement of marketing road,
development of collection center, farmers’ cooperatives and post-harvest
technology will improve values of vegetables received by local farmers. All
these will result in much improvement of the farmers’ income and hence, living
standards. It is estimated that the increase rates of net annual income of typical
farm household are 6.2, 1.8, 1.9 and 2.1 times the without project condition, for
Mekarjaya, Langensari, Gekbrong and Tanjungkarya, respectively. In addition,
improvement of farmers’ purchasing power will activate the cash flow into the
markets and, hence promotes market activities and employment as well as income.
3.2 Increase of Employment Opportunities
Employment opportunities for unskilled laborers will be generated during the
construction period. Meanwhile, the increase in the cropping intensity will
improve employment opportunity for farmers and their family members. It is
estimated that the increases of labour requirement are 51,000 man-days, 16,500
man-days, 27,300 man-days and 26,300 man-days, respectively, in Mekarjaya,
Langensari, Gekbrong and Tanjungkarya. Furthermore, the substantial increase
in total vegetable production will increase substantially demand for transportation
services, handling labor, and farming inputs so that provided more jobs for
industrial workers.
3.3 Promotion of Joint Works and Activation of Rural Organizations
Joint works are essential in farming business as the fact that some related
activities such as maintenance of irrigation system and road and the marketing of
products require farmers to work cooperatively. This cooperation will be
facilitated by some institutions/organizations such as farmers cooperative and P3A
(farmer water user association). Accordingly, it is planned to develop and
activate various rural/agricultural institutions (i.e. P3A, farmer cooperative, rural
water drinking association, and farmer group) in the selected model areas. In
development and activation process of these institutions, NGOs (non-government
organizations) will take part. The number of institutions is targeted to be

IX-13
developed and activated, as well as the number of NGOs to be involved in the
model areas are shown in the following table.
Number of Rural/Agricultural Institutions Developed and Activated and the Number ofNGOs Involved in the Model Areas
Model Areas (Units)Institutions/OrganizationsMekarjaya Langensari Gekbrong Tanjung-karya
1.P3A 1 1 1 12.Farmer cooperative 1 1 1 13.Farmer group 8 6 3 54.Rural water drinking association
-- 1 1 --
5.NGO 4 3 2 3
3.4 Market Road Serving for the Rural Areas
Improvement of rural market road contributes to the improvement of
transportation of agricultural farm inputs and other daily consumption needs in the
rural area as well as communication with other remote areas.
3.5 Expansion of Women’s Role
To promote the active operation of farmers’ organization, various guidance
inclusive of household welfare will be provided to the farmers/ farmers’
organization. Through those guidance and training, women’s role will be
improved and their activities will be expanded. Increase of the farmers’ income
will also contribute to the improvement of women’s role and activities in not only
farm family of the study area but also other family.
3.6 Expansion of Non-Farming Business Opportunity
With the increase of the farmers’ income, the farmers’ purchasing power would
rise in the rural markets. Particularly, markets of farm inputs and equipment and
tools will be more active and hence, expand business chance to local non-farmers
indirectly.
3.7 Impacts from the National Perspective
The impacts of this upland intensified vegetable program on the national economy
could be generated indirectly through multiplier effects. The impacts could
include such matters as:
• Facilitation of the diversification of food consumption by Indonesian, from a
diet which is reliant much on rice to be a more balanced food diet consisting

IX-14
of more vegetable and other food staples.
• Succeding in the food diversification will relax the current high dependency
on rice import.
• The acceleration of development of agribusiness activities in rural areas.
• The reduction of unemployment and poverty in rural areas.

IX-15
CHAPTER 4 ENVIRONMENTAL IMPACTS
4.1 Sustainable Agriculture
With a view to utilizing and managing limited, but valuable water resources,
proper farming and effective land use systems are required. The development
procedure and system by the model development will facilitate efficient and
sustainable use of land and water resources. This may be expected to produce
sustainable benefit definitely.
4.2 Improvement of Living Environment
Under the present intensive agriculture in the model area, excess application of
agro-chemical and fertilizers has occurred. Pollution of the drainage water and
groundwater will be accelerated if condition continue without mitigation measure.
The implementation of the project farming technology will contribute to
mitigation measure. The implementation of the project farming technology will
contribute to mitigation of the living environmental issue.
4.3 Increase of Farmers’ Motivation for Good-farming Practice
This vegetable intensification program will improve farming practice with a
sufficient measure for conservation. The measure is integrated in the production
technology. In addition, the use of improved farming system includes the new
production technology involved costly investment expenditure. The farmers
could recoup this expensive investment in the form of productivity gain over a
long period of farming activities. Recognising its importance in securing
profitability of their investment on their upland farming business, the farmers
would be strongly motivated to operate their farming properly from the view point
of conservation. This motivation would be reinforced as the government would
provide these farmers with secured formal legal rights on their plots of upland
area.
4.4 Prevention of Further Degradation of Environmental Resources
The development of road network for upland provides another way for the
improvement of land resources and environment in the upland areas. This
development has the positive effect not only for income generating from farming
but also from the opening of new economic opportunities for the upland residents.

IX-16
This will relax the current population pressure on the upland agriculture and hence,
prevents a further deterioration of land resources and environment. In short, the
vegetable intensification project has a remarkable posistive effect on upland
resources and environment.

IX-17
CHAPTER 5 PROJECT EVALUATION
As previously explained, the project formulated herein is multi-dimension project.
The project deals with various aspects of rural/agricultural development of
highland areas such as production, marketing, institution/organizations, and rural
water drinking. It also concerns with the conservation/improvement of
environmental resources in upland areas which are already undergoing a
degradaging process. Hence, the project will have a remarkable impact, not only
on local and regional level, but also on national level. Shortly, the project’s
benefit will extent up to areas beyond its location.
The benefits are both direct and indirect as well as tangible and intangible. As it
has been shown, in term of direct-tangible benefit and cost structure the project is
quite beneficial from both financial and economical points of view. In addition,
farming household’s income will increase significantly as the project becomes
fully operational. This will be accompanied with a substantial increase in labour
requirement for farming activities at the local level, and hence, provides
substantial extra employment opportunity for local labouring families.
The direct consequence of both the increase of farming income and employment
opportunity will be the reduction of poverty and unemployment rates on the
concerned communities. The condition of poverty and unemployment in these
areas will become improved further as non-farming activities become expanded
there in response to the increase of local people’s purchasing power. All these
improvements will be ultimately manifested in the improvement of living standard
of local people. But, the improvement of living standard become enhanced when
the rural water drinking system is also included in the project as in the Langensari
and Gekbrong model areas.
For local people, there is more intangible direct benefit brought by the project.
This includes such as promotion of joint work, activation of rural organization and
expansion of women’s role. The promotion of joint work is of vital important in
farming business due to the fact that many related activities such as development
and maintenance of irrigation system and marketing road require farmers’
cooperation that will be facilitated by rural organizations such as P3A and
cooperatives. In addition, the project will also have some positive effects on
local environment such as promotion of sustainable agriculture, improvement of
living environment and prevention of further degradation of environmental
resources.
The project’s effect on the reduction of unemployment and poverty will also be

IX-18
extended to nearby localities, especially those areas which serve the farming input
and daily consumption needs of people from the project’s area, through the
increase of trading activities of these commodities between the two sides. From
the national perspective, the project is also beneficial since it will have the
following effects: (a) facilitation of food consumption diversification which in
turn helps relax the current dependency on rice import, (b) the acceleration of
development of agribusiness in rural areas, and (c) the reduction of unemployment
and poverty rates in rural areas.
From the preceding discussion, it can be concluded that the proposed intensive
vegetable production plan in the selected prority model areas will be remarkably
beneficial not only for local residents and the upland economy as a whole, but also
for the concerned region’s and the nation’s economy as well as for the
conservation of upland resources and environment. Given its remarkable benefit,
it is really important for the government of Indonesia to spend sufficient effort to
secure the implementation of this project in the selected priority model areas.

Tables

(Million US$)(FOB)
1994/1995 1995/1996 1996/1997 1997/1998 1998/1999
1. Total Export (X) 40,223 47,454 50,188 56,297 48,314
2. Total Import (M) 32,322 40,921 44,240 46,223 30,652
3. Import Duties (Tm) 3,900 3,029 2,579 2,990 5,945
4. Export Tax (Tx) 131 186 81 125 943
5. Standard Confersion Factor 0.98 0.96 0.97 0.97 0.96
*) Data on Import Subsidy (Sm) and Export Subsidy (Sx) are not available. It is then assumed that Sm and Sx are balanced.
Sources : (a) Economic Indicators, September 1999, Jakarta : BPS
(b) Statistical Year Book of Indonesia, 1998, Jakarta : BPS
Year
Items
Table IX-1 Estimation of Standard Conversion Factor (SCF) for Indonesia*)
T - IX - 1

Chinese Bean Welsh Sweet SweetTomato Chili Potato Cabbage cabbage vegetables Red onion onion Carrot corn Paddy Maize potato Soybean
I. Financial Input PriceA. Seeds kg 6,000,000 22,500,000 10,000 4,000,000 5,000,000 12,000 1,500 1,500 200,000 17,000 3,000 17,000 800 3,500B. Fertilizer
1. ZA kg 1,100 1,100 1,100 1,100 1,100 1,100 1,100 1,100 1,100 1,100 1,100 1,100 1,100 1,1002. Urea kg 1,200 1,200 1,200 1,200 1,200 1,200 1,200 1,200 1,200 1,200 1,200 1,200 1,200 1,2003. TSP kg 1,700 1,700 1,700 1,700 1,700 1,700 1,700 1,700 1,700 1,700 1,700 1,700 1,700 1,7004. KCl kg 2,000 2,000 2,000 2,000 2,000 2,000 2,000 2,000 2,000 2,000 2,000 2,000 2,000 2,0005. Complex kg 3,000 3,000 3,000 3,000 3,000 3,000 3,000 3,000 3,000 3,000 3,000 3,000 3,000 3,0006. Compost ton 100,000 100,000 100,000 100,000 100,000 100,000 100,000 100,000 100,000 100,000 100,000 100,000 100,000 100,000
C. Agrochemical1. Insecticide lit 55,000 55,000 55,000 55,000 55,000 55,000 55,000 55,000 55,000 55,000 55,000 55,000 55,000 55,0002. Fungicide kg 55,000 55,000 55,000 55,000 55,000 55,000 55,000 55,000 55,000 55,000 55,000 55,000 55,000 55,0003. Others 10,000 10,000 10,000 10,000 10,000 10,000 10,000 10,000 10,000 10,000 10,000 10,000 10,000 10,000
D. Labor m-d 5,800 5,800 5,800 5,800 5,800 5,800 5,800 5,800 5,800 5,800 5,800 5,800 5,800 5,800E. Tools/Equipment Rp 557 789 847 478 401 220 376 376 284 179 164 141 86 26F. Indirect Cost Rp 1,300 1,821 1,968 1,190 1,055 682 1,016 1,016 841 663 650 620 526 540
1. Water charge Rp2. Tax/duty Rp 25 25 25 25 25 25 25 25 25 25 25 25 25 253. Land fee Rp 500 500 500 500 500 500 500 500 500 500 500 500 500 5004. Interest Rp 775 1,296 1,443 665 530 157 491 491 316 138 125 95 1 15
II. Economical Input PriceA. Seeds kg 6,000,000 22,500,000 10,000 4,000,000 5,000,000 12,000 1,500 1,500 200,000 17,000 3,000 17,000 800 3,500B. Fertilizer
1. ZA kg 602 602 602 602 602 602 602 602 602 602 602 602 602 6022. Urea kg 1,183 1,183 1,183 1,183 1,183 1,183 1,183 1,183 1,183 1,183 1,183 1,183 1,183 1,1833. TSP kg 1,318 1,318 1,318 1,318 1,318 1,318 1,318 1,318 1,318 1,318 1,318 1,318 1,318 1,3184. KCl kg 1,129 1,129 1,129 1,129 1,129 1,129 1,129 1,129 1,129 1,129 1,129 1,129 1,129 1,1295. Complex kg 3,000 3,000 3,000 3,000 3,000 3,000 3,000 3,000 3,000 3,000 3,000 3,000 3,000 3,0006. Compost ton 100,000 100,000 100,000 100,000 100,000 100,000 100,000 100,000 100,000 100,000 100,000 100,000 100,000 100,000
C. Agrochemical1. Insecticide lit 42,800 42,800 42,800 42,800 42,800 42,800 42,800 42,800 42,800 42,800 42,800 42,800 42,800 42,8002. Fungicide kg 42,800 42,800 42,800 42,800 42,800 42,800 42,800 42,800 42,800 42,800 42,800 42,800 42,800 42,8003. Others 9,600 9,600 9,600 9,600 9,600 9,600 9,600 9,600 9,600 9,600 9,600 9,600 9,600 9,600
D. Labor m-d 4,560 4,560 4,560 4,560 4,560 4,560 4,560 4,560 4,560 4,560 4,560 4,560 4,560 4,560E. Tools/Equipment Rp 478 716 788 410 353 176 320 320 245 147 132 114 68 22F. Indirect Cost Rp 0 0 0 0 0 0 0 0 0 0 0 0 0 0
1. Water charge Rp2. Tax/duty Rp3. Land fee Rp4. Interest Rp
III. Financial Output Prices Rp 1,160 5,260 1,870 760 620 1,370 3,370 1,710 880 1,300 1,400 2,100 400 1,800IV. Economic Output Prices Rp 1,160 5,260 1,870 760 620 1,370 3,730 1,710 880 1,300 1,580 1,150 400 1,990
Inputs & Outputs Unit
Commodity
Table IX-2 Financial and Economical Input and Output Prices of Agricultural Inputs and Outputs in Mekarjaya Model Area
T - IX - 2

Chinese Bean Welsh Sweet SweetTomato Chili Potato Cabbage cabbage vegetables Red onion onion Carrot corn Paddy Maize potato Soybean
I. Financial Input PriceA. Seeds kg 6,000,000 22,500,000 10,000 4,000,000 5,000,000 12,000 1,500 1,500 200,000 17,000 3,000 17,000 800 3,500B. Fertilizer
1. ZA kg 1,100 1,100 1,100 1,100 1,100 1,100 1,100 1,100 1,100 1,100 1,100 1,100 1,100 1,1002. Urea kg 1,200 1,200 1,200 1,200 1,200 1,200 1,200 1,200 1,200 1,200 1,200 1,200 1,200 1,2003. TSP kg 1,700 1,700 1,700 1,700 1,700 1,700 1,700 1,700 1,700 1,700 1,700 1,700 1,700 1,7004. KCl kg 2,000 2,000 2,000 2,000 2,000 2,000 2,000 2,000 2,000 2,000 2,000 2,000 2,000 2,0005. Complex kg 3,000 3,000 3,000 3,000 3,000 3,000 3,000 3,000 3,000 3,000 3,000 3,000 3,000 3,0006. Compost ton 100,000 100,000 100,000 100,000 100,000 100,000 100,000 100,000 100,000 100,000 100,000 100,000 100,000 100,000
C. Agrochemical1. Insecticide lit 55,000 55,000 55,000 55,000 55,000 55,000 55,000 55,000 55,000 55,000 55,000 55,000 55,000 55,0002. Fungicide kg 55,000 55,000 55,000 55,000 55,000 55,000 55,000 55,000 55,000 55,000 55,000 55,000 55,000 55,0003. Others 10,000 10,000 10,000 10,000 10,000 10,000 10,000 10,000 10,000 10,000 10,000 10,000 10,000 10,000
D. Labor m-d 6,800 6,800 6,800 6,800 6,800 6,800 6,800 6,800 6,800 6,800 6,800 6,800 6,800 6,800E. Tools/Equipment Rp 632 858 902 543 444 288 426 426 329 209 182 158 101 29F. Indirect Cost Rp 1,389 1,905 2,027 1,268 1,091 773 1,070 1,070 887 683 650 620 526 540
1. Water charge Rp2. Tax/duty Rp 25 25 25 25 25 25 25 25 25 25 25 25 25 253. Land fee Rp 500 500 500 500 500 500 500 500 500 500 500 500 500 5004. Interest Rp 864 1,380 1,502 743 566 248 545 545 362 158 125 95 1 15
II. Economical Input PriceA. Seeds kg 6,000,000 22,500,000 10,000 4,000,000 5,000,000 12,000 1,500 1,500 200,000 17,000 3,000 17,000 800 3,500B. Fertilizer
1. ZA kg 602 602 602 602 602 602 602 602 602 602 602 602 602 6022. Urea kg 1,183 1,183 1,183 1,183 1,183 1,183 1,183 1,183 1,183 1,183 1,183 1,183 1,183 1,1833. TSP kg 1,318 1,318 1,318 1,318 1,318 1,318 1,318 1,318 1,318 1,318 1,318 1,318 1,318 1,3184. KCl kg 1,129 1,129 1,129 1,129 1,129 1,129 1,129 1,129 1,129 1,129 1,129 1,129 1,129 1,1295. Complex kg 3,000 3,000 3,000 3,000 3,000 3,000 3,000 3,000 3,000 3,000 3,000 3,000 3,000 3,0006. Compost ton 100,000 100,000 100,000 100,000 100,000 100,000 100,000 100,000 100,000 100,000 100,000 100,000 100,000 100,000
C. Agrochemical1. Insecticide lit 42,800 42,800 42,800 42,800 42,800 42,800 42,800 42,800 42,800 42,800 42,800 42,800 42,800 42,8002. Fungicide kg 42,800 42,800 42,800 42,800 42,800 42,800 42,800 42,800 42,800 42,800 42,800 42,800 42,800 42,8003. Others 9,600 9,600 9,600 9,600 9,600 9,600 9,600 9,600 9,600 9,600 9,600 9,600 9,600 9,600
D. Labor m-d 4,560 4,560 4,560 4,560 4,560 4,560 4,560 4,560 4,560 4,560 4,560 4,560 4,560 4,560E. Tools/Equipment Rp 511 747 810 439 367 210 340 340 262 154 132 114 68 22F. Indirect Cost Rp 0 0 0 0 0 0 0 0 0 0 0 0 0 0
1. Water charge Rp2. Tax/duty Rp3. Land fee Rp4. Interest Rp
III. Financial Output Prices Rp 1,160 5,260 1,870 760 620 1,370 3,730 1,710 880 1,300 1,400 2,100 400 1,800IV. Economic Output Prices Rp 1,160 5,260 1,870 760 620 1,370 3,730 1,710 880 1,300 1,580 1,150 400 1,990
Table IX-3 Financial and Economical Input and Output Prices of Agricultural Inputs and Outputs in Langensari Model Area
Inputs & Outputs Unit
Commodity
T - IX - 3

Chinese Bean Welsh Sweet SweetTomato Chili Potato Cabbage cabbage vegetables Red onion onion Carrot corn Paddy Maize potato Soybean
I. Financial Input PriceA. Seeds kg 6,000,000 22,500,000 10,000 4,000,000 5,000,000 12,000 1,500 1,500 200,000 17,000 3,000 17,000 800 3,500B. Fertilizer
1. ZA kg 1,100 1,100 1,100 1,100 1,100 1,100 1,100 1,100 1,100 1,100 1,100 1,100 1,100 1,1002. Urea kg 1,200 1,200 1,200 1,200 1,200 1,200 1,200 1,200 1,200 1,200 1,200 1,200 1,200 1,2003. TSP kg 1,700 1,700 1,700 1,700 1,700 1,700 1,700 1,700 1,700 1,700 1,700 1,700 1,700 1,7004. KCl kg 2,000 2,000 2,000 2,000 2,000 2,000 2,000 2,000 2,000 2,000 2,000 2,000 2,000 2,0005. Complex kg 3,000 3,000 3,000 3,000 3,000 3,000 3,000 3,000 3,000 3,000 3,000 3,000 3,000 3,0006. Compost ton 100,000 100,000 100,000 100,000 100,000 100,000 100,000 100,000 100,000 100,000 100,000 100,000 100,000 100,000
C. Agrochemical1. Insecticide lit 55,000 55,000 55,000 55,000 55,000 55,000 55,000 55,000 55,000 55,000 55,000 55,000 55,000 55,0002. Fungicide kg 55,000 55,000 55,000 55,000 55,000 55,000 55,000 55,000 55,000 55,000 55,000 55,000 55,000 55,0003. Others 10,000 10,000 10,000 10,000 10,000 10,000 10,000 10,000 10,000 10,000 10,000 10,000 10,000 10,000
D. Labor m-d 4,200 4,200 4,200 4,200 4,200 4,200 4,200 4,200 4,200 4,200 4,200 4,200 4,200 4,200E. Tools/Equipment Rp 547 781 831 471 377 233 362 362 269 158 135 115 62 21F. Indirect Cost Rp 1,394 1,910 2,032 1,273 1,096 778 1,075 1,075 892 688 655 625 531 545
1. Water charge Rp2. Tax/duty Rp 30 30 30 30 30 30 30 30 30 30 30 30 30 303. Land fee Rp 500 500 500 500 500 500 500 500 500 500 500 500 500 5004. Interest Rp 864 1,380 1,502 743 566 248 545 545 362 158 125 95 1 15
II. Economical Input PriceA. Seeds kg 6,000,000 22,500,000 10,000 4,000,000 5,000,000 12,000 1,500 1,500 200,000 17,000 3,000 17,000 800 3,500B. Fertilizer
1. ZA kg 602 602 602 602 602 602 602 602 602 602 602 602 602 6022. Urea kg 1,183 1,183 1,183 1,183 1,183 1,183 1,183 1,183 1,183 1,183 1,183 1,183 1,183 1,1833. TSP kg 1,318 1,318 1,318 1,318 1,318 1,318 1,318 1,318 1,318 1,318 1,318 1,318 1,318 1,3184. KCl kg 1,129 1,129 1,129 1,129 1,129 1,129 1,129 1,129 1,129 1,129 1,129 1,129 1,129 1,1295. Complex kg 3,000 3,000 3,000 3,000 3,000 3,000 3,000 3,000 3,000 3,000 3,000 3,000 3,000 3,0006. Compost ton 100,000 100,000 100,000 100,000 100,000 100,000 100,000 100,000 100,000 100,000 100,000 100,000 100,000 100,000
C. Agrochemical1. Insecticide lit 42,800 42,800 42,800 42,800 42,800 42,800 42,800 42,800 42,800 42,800 42,800 42,800 42,800 42,8002. Fungicide kg 42,800 42,800 42,800 42,800 42,800 42,800 42,800 42,800 42,800 42,800 42,800 42,800 42,800 42,8003. Others 9,600 9,600 9,600 9,600 9,600 9,600 9,600 9,600 9,600 9,600 9,600 9,600 9,600 9,600
D. Labor m-d 4,560 4,560 4,560 4,560 4,560 4,560 4,560 4,560 4,560 4,560 4,560 4,560 4,560 4,560E. Tools/Equipment Rp 482 718 793 415 355 197 326 326 253 150 132 114 68 22F. Indirect Cost Rp 0 0 0 0 0 0 0 0 0 0 0 0 0 0
1. Water charge Rp2. Tax/duty Rp3. Land fee Rp4. Interest Rp
III. Financial Output Prices Rp 1,160 5,260 1,870 760 620 1,370 3,730 1,710 880 1,300 1,400 2,100 400 1800IV. Economic Output Prices Rp 1,160 5,260 1,870 760 620 1,370 3,730 1,710 880 1,300 1,580 1,150 400 1,990
Table IX-4 Financial and Economical Input and Output Prices of Agricultural Inputs and Outputs in Gekbrong Model Area
Inputs & Outputs Unit
Commodity
T - IX - 4

Chinese Bean Welsh Sweet SweetTomato Chili Potato Cabbage cabbage vegetables Red onion onion Carrot corn Paddy Maize potato Soybean
I. Financial Input PriceA. Seeds kg 6,000,000 22,500,000 10,000 4,000,000 5,000,000 12,000 1,500 1,500 200,000 17,000 3,000 17,000 800 3,500B. Fertilizer
1. ZA kg 1,100 1,100 1,100 1,100 1,100 1,100 1,100 1,100 1,100 1,100 1,100 1,100 1,100 1,1002. Urea kg 1,200 1,200 1,200 1,200 1,200 1,200 1,200 1,200 1,200 1,200 1,200 1,200 1,200 1,2003. TSP kg 1,700 1,700 1,700 1,700 1,700 1,700 1,700 1,700 1,700 1,700 1,700 1,700 1,700 1,7004. KCl kg 2,000 2,000 2,000 2,000 2,000 2,000 2,000 2,000 2,000 2,000 2,000 2,000 2,000 2,0005. Complex kg 3,000 3,000 3,000 3,000 3,000 3,000 3,000 3,000 3,000 3,000 3,000 3,000 3,000 3,0006. Compost ton 100,000 100,000 100,000 100,000 100,000 100,000 100,000 100,000 100,000 100,000 100,000 100,000 100,000 100,000
C. Agrochemical1. Insecticide lit 55,000 55,000 55,000 55,000 55,000 55,000 55,000 55,000 55,000 55,000 55,000 55,000 55,000 55,0002. Fungicide kg 55,000 55,000 55,000 55,000 55,000 55,000 55,000 55,000 55,000 55,000 55,000 55,000 55,000 55,0003. Others 10,000 10,000 10,000 10,000 10,000 10,000 10,000 10,000 10,000 10,000 10,000 10,000 10,000 10,000
D. Labor m-d 6,200 6,200 6,200 6,200 6,200 6,200 6,200 6,200 6,200 6,200 6,200 6,200 6,200 6,200E. Tools/Equipment Rp 570 812 863 489 413 261 391 393 304 191 172 148 92 28F. Indirect Cost Rp
1. Water charge Rp 1,300 1,846 1,979 1,190 1,059 748 1,026 1,031 863 670 650 620 526 5402. Tax/duty Rp 25 25 25 25 25 25 25 25 25 25 25 25 25 253. Land fee Rp 500 500 500 500 500 500 500 500 500 500 500 500 500 5004. Interest Rp 775 1,321 1,454 665 534 223 501 506 338 145 125 95 1 15
II. Economical Input PriceA. Seeds kg 6,000,000 22,500,000 10,000 4,000,000 5,000,000 12,000 1,500 1,500 200,000 17,000 3,000 17,000 800 3,500B. Fertilizer
1. ZA kg 602 602 602 602 602 602 602 602 602 602 602 602 602 6022. Urea kg 1,183 1,183 1,183 1,183 1,183 1,183 1,183 1,183 1,183 1,183 1,183 1,183 1,183 1,1833. TSP kg 1,318 1,318 1,318 1,318 1,318 1,318 1,318 1,318 1,318 1,318 1,318 1,318 1,318 1,3184. KCl kg 1,129 1,129 1,129 1,129 1,129 1,129 1,129 1,129 1,129 1,129 1,129 1,129 1,129 1,1295. Complex kg 3,000 3,000 3,000 3,000 3,000 3,000 3,000 3,000 3,000 3,000 3,000 3,000 3,000 3,0006. Compost ton 100,000 100,000 100,000 100,000 100,000 100,000 100,000 100,000 100,000 100,000 100,000 100,000 100,000 100,000
C. Agrochemical1. Insecticide lit 42,800 42,800 42,800 42,800 42,800 42,800 42,800 42,800 42,800 42,800 42,800 42,800 42,800 42,8002. Fungicide kg 42,800 42,800 42,800 42,800 42,800 42,800 42,800 42,800 42,800 42,800 42,800 42,800 42,800 42,8003. Others 9,600 9,600 9,600 9,600 9,600 9,600 9,600 9,600 9,600 9,600 9,600 9,600 9,600 9,600
D. Labor m-d 4,560 4,560 4,560 4,560 4,560 4,560 4,560 4,560 4,560 4,560 4,560 4,560 4,560 4,560E. Tools/Equipment Rp 478 725 792 410 355 201 324 326 253 149 132 114 68 22F. Indirect Cost Rp 0 0 0 0 0 0 0 0 0 0 0 0 0 0
1. Water charge Rp2. Tax/duty Rp3. Land fee Rp4. Interest Rp
III. Financial Output Prices Rp 1,160 5,260 1,870 760 620 1,370 3,730 1,710 880 1,300 1,400 2,100 400 1800IV. Economic Output Prices Rp 1,160 5,260 1,870 760 620 1,370 3,730 1,710 880 1,300 1,580 1,150 400 1,990
Table IX-5 Financial and Economical Input and Output Prices of Agricultural Inputs and Outputs in Tanjungkarya Model Area
Inputs & Outputs Unit
Commodity
T - IX - 5

Without-ProjectName of Crops Gross Indirect Total of Profit
income Input Hired labor Tool/equipment Total cost production costRp.1000/ha Rp.1000/ha Rp.1000/ha Rp.1000/ha Rp.1000/ha Rp.1000/ha Rp.1000/ha Rp.1000/ha
Tomato 12,760 6,604 1,918 478 8,999 0 8,999 3,761Chili 21,040 11,622 1,755 716 14,092 0 14,092 6,948Potato 22,440 13,255 1,630 788 15,673 0 15,673 6,767Cabbage 13,680 5,655 1,651 410 7,715 0 7,715 5,965Chinese cabbage 9,300 4,732 1,518 353 6,602 0 6,602 2,698Bean vegetables 8,220 1,248 1,482 176 2,906 0 2,906 5,314Red onion 22,380 4,175 1,452 320 5,947 0 5,947 16,433Welsh onion 13,380 4,175 1,452 320 5,947 0 5,947 7,733Carrot 8,800 2,794 1,363 245 4,402 0 4,402 4,398Sweet corn 9,100 1,145 1,162 147 2,454 0 2,454 6,646Paddy 5,530 985 1,073 132 2,189 0 2,189 3,341Maize 1,610 773 978 114 1,865 0 1,865 -255 Sweet potato 2,800 8 874 68 950 0 950 1,850Soybean 0 147 193 22 362 0 362 -362
With-ProjectName of Crops Gross Indirect Total of Profit
income Input Hired labor Tool/equipment Total cost production costRp.1000/ha Rp.1000/ha Rp.1000/ha Rp.1000/ha Rp.1000/ha Rp.1000/ha Rp.1000/ha Rp.1000/ha
Tomato 20,880 7,262 1,918 511 9,691 0 9,691 11,189Chili 31,560 12,235 1,755 747 14,737 0 14,737 16,823Potato 31,790 13,686 1,630 810 16,126 0 16,126 15,664Cabbage 15,960 6,233 1,651 439 8,323 0 8,323 7,637Chinese cabbage 11,160 4,998 1,518 367 6,882 0 6,882 4,278Bean vegetables 13,700 1,924 1,482 210 3,616 0 3,616 10,084Red onion 26,110 4,557 1,452 340 6,349 0 6,349 19,761Welsh onion 20,520 4,557 1,452 340 6,349 0 6,349 14,171Carrot 13,200 3,138 1,363 262 4,763 0 4,763 8,437Sweet corn 10,400 1,297 1,162 154 2,614 0 2,614 7,786Paddy 0 985 1,073 132 2,189 0 2,189 -2,189Maize 0 773 978 114 1,865 0 1,865 -1,865Sweet potato 0 8 874 68 950 0 950 -950Soybean 0 147 193 22 362 0 362 -362
Direct production cost
Direct production cost
Table IX-6 Summary of Economic Crop Budgets under Without/With-Project Condition in Mekarjaya Model Area
T - IX - 6

Without-ProjectName of Crops Gross Indirect Total of Profit
income Input Hired labor Tool/equipment Total cost production costRp.1000/ha Rp.1000/ha Rp.1000/ha Rp.1000/ha Rp.1000/ha Rp.1000/ha Rp.1000/ha Rp.1000/ha
Tomato 23,200 7,262 1,918 511 9,691 0 9,691 13,509Chili 36,820 12,235 1,755 747 14,737 0 14,737 22,083Potato 31,790 13,686 1,630 810 16,126 0 16,126 15,664Cabbage 18,240 6,233 1,651 439 8,323 0 8,323 9,917Chinese cabbage 11,160 4,998 1,518 367 6,882 0 6,882 4,278Bean vegetables 10,960 1,924 1,482 210 3,616 0 3,616 7,344Red onion 29,840 4,557 1,452 340 6,349 0 6,349 23,491Welsh onion 20,520 4,557 1,452 340 6,349 0 6,349 14,171Carrot 17,600 3,138 1,363 262 4,763 0 4,763 12,837Sweet corn 11,700 1,297 1,162 154 2,614 0 2,614 9,086Paddy 0 985 1,073 132 2,189 0 2,189 -2,189Maize 0 773 978 114 1,865 0 1,865 -1,865Sweet potato 0 8 874 68 950 0 950 -950Soybean 0 147 193 22 362 0 362 -362
With-ProjectName of Crops Gross Indirect Total of Profit
income Input Hired labor Tool/equipment Total cost production costRp.1000/ha Rp.1000/ha Rp.1000/ha Rp.1000/ha Rp.1000/ha Rp.1000/ha Rp.1000/ha Rp.1000/ha
Tomato 25,520 7,262 1,918 511 9,691 0 9,691 15,829Chili 42,080 12,235 1,755 747 14,737 0 14,737 27,343Potato 39,270 13,686 1,630 810 16,126 0 16,126 23,144Cabbage 19,000 6,233 1,651 439 8,323 0 8,323 10,677Chinese cabbage 12,400 4,998 1,518 367 6,882 0 6,882 5,518Bean vegetables 13,700 1,924 1,482 210 3,616 0 3,616 10,084Red onion 33,570 4,557 1,452 340 6,349 0 6,349 27,221Welsh onion 25,650 4,557 1,452 340 6,349 0 6,349 19,301Carrot 19,360 3,138 1,363 262 4,763 0 4,763 14,597Sweet corn 13,000 1,297 1,162 154 2,614 0 2,614 10,386Paddy 0 985 1,073 132 2,189 0 2,189 -2,189Maize 0 773 978 114 1,865 0 1,865 -1,865Sweet potato 0 8 874 68 950 0 950 -950Soybean 0 147 193 22 362 0 362 -362
Direct production cost
Direct production cost
Table IX-7 Summary of Economic Crop Budgets under Without/With-Project Condition in Langensari Model Area
T - IX - 7

Without-ProjectName of Crops Gross Indirect Total of Profit
income Input Hired labor Tool/equipment Total cost production costRp.1000/ha Rp.1000/ha Rp.1000/ha Rp.1000/ha Rp.1000/ha Rp.1000/ha Rp.1000/ha Rp.1000/ha
Tomato 17,400 6,693 1,918 482 9,093 0 9,093 8,307Chili 42,080 11,666 1,755 718 14,139 0 14,139 27,941Potato 22,440 13,345 1,630 793 15,768 0 15,768 6,672Cabbage 15,200 5,754 1,651 415 7,820 0 7,820 7,380Chinese cabbage 10,540 4,770 1,518 355 6,642 0 6,642 3,898Bean vegetables 9,590 1,657 1,482 197 3,336 0 3,336 6,254Red onion 26,110 4,276 1,452 326 6,054 0 6,054 20,056Welsh onion 22,230 4,276 1,452 326 6,054 0 6,054 16,176Carrot 16,720 2,961 1,363 253 4,577 0 4,577 12,143Sweet corn 10,400 1,214 1,162 150 2,526 0 2,526 7,874Paddy 0 985 1,073 132 2,189 0 2,189 -2,186Maize 2,530 773 978 114 1,865 0 1,865 665Sweet potato 0 8 874 68 950 0 950 -950Soybean 0 147 193 22 362 0 362 -362
With-ProjectName of Crops Gross Indirect Total of Profit
income Input Hired labor Tool/equipment Total cost production costRp.1000/ha Rp.1000/ha Rp.1000/ha Rp.1000/ha Rp.1000/ha Rp.1000/ha Rp.1000/ha Rp.1000/ha
Tomato 23,200 7,262 1,918 511 9,691 0 9,691 13,509Chili 47,340 12,235 1,755 747 14,737 0 14,737 32,603Potato 31,790 13,686 1,630 810 16,126 0 16,126 15,664Cabbage 18,240 6,233 1,651 439 8,323 0 8,323 9,917Chinese cabbage 11,160 4,998 1,518 367 6,882 0 6,882 4,278Bean vegetables 13,700 1,924 1,482 210 3,616 0 3,616 10,084Red onion 29,840 4,557 1,452 340 6,349 0 6,349 23,491Welsh onion 23,940 4,557 1,452 340 6,349 0 6,349 17,591Carrot 19,360 3,138 1,363 262 4,763 0 4,763 14,597Sweet corn 13,000 1,297 1,162 154 2,614 0 2,614 10,386Paddy 0 985 1,073 132 2,189 0 2,189 -2,189Maize 0 773 978 114 1,865 0 1,865 -1,865Sweet potato 0 8 874 68 950 0 950 -950Soybean 0 147 193 22 362 0 362 -362
Direct production cost
Direct production cost
Table IX-8 Summary of Economic Crop Budgets under Without/With-Project Condition in Gekbrong Model Area
T - IX - 8

Without-ProjectName of Crops Gross Indirect Total of Profit
income Input Hired labor Tool/equipment Total cost production costRp.1000/ha Rp.1000/ha Rp.1000/ha Rp.1000/ha Rp.1000/ha Rp.1000/ha Rp.1000/ha Rp.1000/ha
Tomato 20,880 6,613 1,918 478 9,009 0 9,009 11,871Chili 31,560 11,801 1,755 725 14,281 0 14,281 17,279Potato 33,660 13,335 1,630 792 15,758 0 15,758 17,902Cabbage 16,720 5,654 1,651 410 7,715 0 7,715 9,005Chinese cabbage 10,540 4,757 1,518 355 6,629 0 6,629 3,911Bean vegetables 9,590 1,747 1,482 201 3,431 0 3,431 6,159Red onion 26,110 4,252 1,452 324 6,029 0 6,029 20,081Welsh onion 20,520 4,276 1,452 326 6,054 0 6,054 14,466Carrot 14,960 2,961 1,363 253 4,577 0 4,577 10,383Sweet corn 9,100 1,201 1,162 149 2,512 0 2,512 6,588Paddy 6,320 985 1,073 132 2,189 0 2,189 4,131Maize 2,530 773 978 114 1,865 0 1,865 665Sweet potato 0 8 874 68 950 0 950 -950Soybean 0 147 193 22 362 0 362 -362
With-ProjectName of Crops Gross Indirect Total of Profit
income Input Hired labor Tool/equipment Total cost production costRp.1000/ha Rp.1000/ha Rp.1000/ha Rp.1000/ha Rp.1000/ha Rp.1000/ha Rp.1000/ha Rp.1000/ha
Tomato 23,200 7,262 1,918 511 9,691 0 9,691 13,509Chili 36,820 12,235 1,755 747 14,737 0 14,737 22,083Potato 37,400 13,686 1,630 810 16,126 0 16,126 21,274Cabbage 18,240 6,233 1,651 439 8,323 0 8,323 9,917Chinese cabbage 11,160 4,998 1,518 367 6,882 0 6,882 4,278Bean vegetables 13,700 1,924 1,482 210 3,616 0 3,616 10,084Red onion 29,840 4,557 1,452 340 6,349 0 6,349 23,491Welsh onion 23,940 4,557 1,452 340 6,349 0 6,349 17,591Carrot 15,840 3,138 1,363 262 4,763 0 4,763 11,077Sweet corn 11,700 1,297 1,162 154 2,614 0 2,614 9,086Paddy 7,110 985 1,073 132 2,189 0 2,189 4,921Maize 0 773 978 114 1,865 0 1,865 -1,865Sweet potato 0 8 874 68 950 0 950 -950Soybean 0 147 193 22 362 0 362 -362
Direct production cost
Direct production cost
Table IX-9 Summary of Economic Crop Budgets under Without/With-Project Condition in Tanjungkarya Model Area
T - IX - 9

Without-Project (Unit : Rp. Million)
Production Indirect Total ProfitValue Inputs Hired labor Tool/equipment Total cost cost
VegetablesTomato 102.1 52.8 15.3 3.8 72.0 0.0 72.0 30.1Chili 210.4 116.2 17.5 7.2 140.9 0.0 140.9 69.5Potato 157.1 92.8 11.4 5.5 109.7 0.0 109.7 47.4Cabbage 68.4 28.3 8.3 2.0 38.6 0.0 38.6 29.8Chinese cabbage 27.9 14.2 4.6 1.1 19.8 0.0 19.8 8.1Bean vegetables 90.4 13.7 16.3 1.9 32.0 0.0 32.0 58.5Red onion 44.8 8.3 2.9 0.6 11.9 0.0 11.9 32.9Welsh onion 27.4 8.3 2.9 0.6 11.9 0.0 11.9 15.5Carrot 35.2 11.2 5.5 1.0 17.6 0.0 17.6 17.6Sweet corn 18.2 2.3 2.3 0.3 4.9 0.0 4.9 13.3Sub-total 781.8 348.2 87.0 24.1 459.3 0.0 459.3 322.5
Food cropsPaddy 365.0 65.0 70.8 8.7 144.5 0.0 144.5 220.5Maize 20.9 10.1 12.7 1.5 24.2 0.0 24.2 -3.3Sweet potato 44.8 0.1 14.0 1.1 15.2 0.0 15.2 29.6Soybean 0.0 0.0 0.0 0.0 0.0 0.0 0.0 0.0Sub-total 430.7 75.2 97.5 11.3 184.0 0.0 184.0 246.8
Total 1,212.50 423.4 184.5 35.4 643.2 0.0 643.2 569.3
With-project (Unit : Rp. Million)Production Indirec Total Profit
Value Inputs Hired labor Tool/equipment Total cost costVegetables
Tomato 563.8 196.1 51.8 13.8 261.7 0.0 261.7 302.1Chili 536.5 208.0 29.8 12.7 250.5 0.0 250.5 286.0Potato 858.3 369.5 44.0 21.9 435.4 0.0 435.4 422.9Cabbage 399.0 155.8 41.3 11.0 208.1 0.0 208.1 190.9Chinese cabbage 167.4 75.0 22.8 5.5 103.2 0.0 103.2 64.2Bean vegetables 506.9 71.2 54.8 7.8 133.8 0.0 133.8 373.1Red onion 522.2 91.1 29.0 6.8 127.0 0.0 127.0 395.2Welsh onion 266.8 59.2 18.9 4.4 82.5 0.0 82.5 184.2Carrot 316.8 75.3 32.7 6.3 114.3 0.0 114.3 202.5Sweet corn 72.8 9.1 8.1 1.1 18.3 0.0 18.3 54.5Sub-total 4,210.5 1,310.3 333.3 91.2 1,734.8 0.0 1,734.8 2,475.7
Food cropsPaddy 0.0 0.0 0.0 0.0 0.0 0.0 0.0 0.0Maize 0.0 0.0 0.0 0.0 0.0 0.0 0.0 0.0Sweet potato 0.0 0.0 0.0 0.0 0.0 0.0 0.0 0.0Soybean 0.0 0.0 0.0 0.0 0.0 0.0 0.0 0.0Sub-total 0.0 0.0 0.0 0.0 0.0 0.0 0.0 0.0
Total 4,210.5 1,310.3 333.3 91.2 1,734.8 0.0 1,734.8 2,475.7
IncrementalProduction Indirec Total IncrementalValue Inputs Hired labor Tool/equipment Total cost cost Benefit
VegetablesTomato 461.7 143.3 36.4 10.0 189.7 0.0 189.7 272.0Chili 326.1 91.8 12.3 5.5 109.6 0.0 109.6 216.5Potato 701.3 276.7 32.6 16.3 325.7 0.0 325.7 375.6Cabbage 330.6 127.6 33.0 8.9 169.5 0.0 169.5 161.1Chinese cabbage 139.5 60.8 18.2 4.4 83.4 0.0 83.4 56.1Bean vegetables 416.5 57.5 38.5 5.8 101.8 0.0 101.8 314.7Red onion 477.4 82.8 26.1 6.2 115.1 0.0 115.1 362.4Welsh onion 239.4 50.9 16.0 3.8 70.6 0.0 70.6 168.8Carrot 281.6 64.1 27.3 5.3 96.7 0.0 96.7 184.9Sweet corn 54.6 6.8 5.8 0.8 13.4 0.0 13.4 41.2Sub-total 3,428.7 962.2 246.3 67.1 1,275.5 0.0 1,275.5 2,153.2
Food cropsPaddy -365.0 -65.0 -70.8 -8.7 -144.5 0.0 -144.5 -220.5Maize -20.9 -10.1 -12.7 -1.5 -24.2 0.0 -24.2 3.3Sweet potato -44.8 -0.1 -14.0 -1.1 -15.2 0.0 -15.2 -29.6Soybean 0.0 0.0 0.0 0.0 0.0 0.0 0.0 0.0Sub-total -430.7 -75.2 -97.5 -11.3 -184.0 0.0 -184.0 -246.8
Total 2,988.0 887.0 148.8 55.8 1,091.5 0 1,091.5 1,906.4
Direct Production Cost
Direct Production Cost
Direct Production Cost
Table IX-10 Economic Production Value and Incremental Benefit under With/Without Conditions of Mekarjaya Model Area
T - IX - 10

Without-Project (Unit : Rp. Million)
Production Indirect Total ProfitValue Inputs Hired labor Tool/equipment Total cost cost
VegetablesTomato 603.2 188.8 49.9 13.3 252.0 0.0 252.0 351.2Chili 883.7 293.6 42.1 17.9 353.7 0.0 353.7 530.0Potato 476.9 205.3 24.5 12.1 241.9 0.0 241.9 235.0Cabbage 620.2 211.9 56.1 14.9 283.0 0.0 283.0 337.2Chinese cabbage 279.0 124.9 37.9 9.2 172.0 0.0 172.0 107.0Bean vegetables 54.8 9.6 7.4 1.1 18.1 0.0 18.1 36.7Red onion 0.0 0.0 0.0 0.0 0.0 0.0 0.0 0.0Welsh onion 41.0 9.1 2.9 0.7 12.7 0.0 12.7 28.3Carrot 0.0 0.0 0.0 0.0 0.0 0.0 0.0 0.0Sweet corn 23.4 2.6 2.3 0.3 5.2 0.0 5.2 18.2Sub-total 2,982.1 1,046.0 223.1 69.5 1,338.6 0.0 1,338.6 1,643.6
Food cropsPaddy 0.0 65 70.8 8.7 144.5 0.0 144.5 -144.5Maize 0.0 10.1 12.7 1.5 24.2 0.0 24.2 -24.2Sweet potato 0.0 0.1 14.0 1.1 15.2 0.0 15.2 -15.2Soybean 0.0 0.0 0.0 0.0 0.0 0.0 0.0 0.0Sub-total 0.0 75.2 97.5 11.3 184.0 0.0 184.0 -184.0
Total 2,982.1 1,046.0 320.7 80.7 1,522.5 0.0 1,522.5 1,459.6
With-project (Unit : Rp. Million)Production Indirec Total Profit
Value Inputs Hired labor Tool/equipment Total cost costVegetables
Tomato 765.6 217.9 57.5 15.3 290.7 0.0 290.7 474.9Chili 1,052.00 305.9 43.9 18.7 368.4 0.0 368.4 683.6Potato 706.9 246.3 29.3 14.6 290.3 0.0 290.3 416.6Cabbage 665.0 218.2 57.8 15.4 291.3 0.0 291.3 373.7Chinese cabbage 310.0 124.9 37.9 9.2 172.0 0.0 172.0 138.0Bean vegetables 274.0 38.5 29.6 4.2 72.3 0.0 72.3 201.7Red onion 0.0 0.0 0.0 0.0 0.0 0.0 0.0 0.0Welsh onion 102.6 18.2 5.8 1.4 25.4 0.0 25.4 77.2Carrot 77.4 12.6 5.5 1.0 19.1 0.0 19.1 58.4Sweet corn 52.0 5.2 4.6 0.6 10.5 0.0 10.05 41.5Sub-total 4,005.5 1,187.7 272.0 80.3 1,540.0 0.0 1,540.0 2,465.5
Food cropsPaddy 0.0 0.0 0.0 0.0 0.0 0.0 0.0 0.0Maize 0.0 0.0 0.0 0.0 0.0 0.0 0.0 0.0Sweet potato 0.0 0.0 0.0 0.0 0.0 0.0 0.0 0.0Soybean 0.0 0.0 0.0 0.0 0.0 0.0 0.0 0.0Sub-total 0.0 0.0 0.0 0.0 0.0 0.0 0.0 0.0
Total 4,005.5 1,187.7 272.0 80.3 1,540.0 0.0 1,540.0 2,465.5
IncrementalProduction Indirec Total IncrementalValue Inputs Hired labor Tool/equipment Total cost cost Benefit
VegetablesTomato 162.4 29.0 7.7 2.0 38.8 0.0 38.8 123.6Chili 168.3 12.2 1.8 0.7 14.7 0.0 14.7 153.6Potato 230.0 41.1 4.9 2.4 48.4 0.0 48.4 181.6Cabbage 44.8 6.2 1.7 0.4 8.3 0.0 8.3 36.5Chinese cabbage 31.0 0.0 0.0 0.0 0.0 0.0 0.0 31.0Bean vegetables 219.2 28.9 22.2 3.2 54.2 0.0 54.2 165.0Red onion 0.0 0.0 0.0 0.0 0.0 0.0 0.0 0.0Welsh onion 61.6 9.1 2.9 0.7 12.7 0.0 12.7 48.9Carrot 77.4 12.6 5.5 1.0 19.1 0.0 19.1 58.4Sweet corn 28.6 2.6 2.3 0.3 5.2 0.0 5.2 23.4Sub-total 1,023.4 141.7 48.9 10.8 201.4 0.0 201.4 822.0
Food cropsPaddy 0.0 -65 -70.8 -8.7 -144.5 0.0 -144.5 144.5Maize 0.0 -10.1 -12.7 -1.5 -24.2 0.0 -24.2 24.2Sweet potato 0.0 -0.1 -14 -1.1 -15.2 0.0 -15.2 15.2Soybean 0.0 0.0 0.0 0.0 0.0 0.0 0.0 0.0Sub-total 0.0 -75.2 -97.5 -11.3 -184.0 0.0 -184.0 184.0
Total 1,023.4 66.5 -48.6 -0.4 17.5 0.0 17.5 1,005.9
Direct Production Cost
Direct Production Cost
Direct Production Cost
Table IX-11 Economic Production Value and Incremental Benefit under With/Without Conditions of Langensari Model Area
T - IX - 11

Without-Project (Unit : Rp. Million)
Production Indirect Total ProfitValue Inputs Hired labor Tool/equipment Total cost cost
VegetablesTomato 452.4 174.0 49.9 12.5 236.4 0.0 236.4 216.0Chili 757.4 210.0 31.6 12.9 254.5 0.0 254.5 502.9Potato 89.8 53.4 6.5 3.2 63.1 0.0 63.1 26.7Cabbage 45.6 17.3 5.0 1.2 23.5 0.0 23.5 22.1Chinese cabbage 52.7 23.8 7.6 1.8 33.2 0.0 33.2 19.5Bean vegetables 19.2 3.3 3.0 0.4 6.7 0.0 6.7 12.5Red onion 0.0 0.0 0.0 0.0 0.0 0.0 0.0 0.0Welsh onion 44.5 8.6 2.9 0.7 12.1 0.0 12.1 32.4Carrot 66.9 11.8 5.5 1.0 18.3 0.0 18.3 48.6Sweet corn 31.2 3.6 3.5 0.5 7.6 0.0 7.6 23.6Sub-total 1,559.6 505.9 115.3 34.2 655.3 0.0 655.3 904.3
Food cropsPaddy 0.0 0.0 0.0 0.0 0.0 0.0 0.0 0.0Maize 63.3 19.3 24.5 2.8 46.6 0.0 46.6 16.6Sweet potato 0.0 0.0 0.0 0.0 0.0 0.0 0.0 0.0Soybean 0.0 0.0 0.0 0.0 0.0 0.0 0.0 0.0Sub-total 63.3 19.3 24.5 2.8 46.6 0.0 46.6 16.6
Total 1,622.9 525.2 139.8 37.0 702.0 0.0 702.0 920.9
With-project (Unit : Rp. Million)Production Indirec Total Profit
Value Inputs Hired labor Tool/equipment Total cost costVegetables
Tomato 742.4 232.4 61.4 16.3 310.1 0.0 310.1 432.3Chili 615.4 159.1 22.8 9.7 191.6 0.0 191.6 432.8Potato 317.9 136.9 16.3 8.1 161.3 0.0 161.3 156.6Cabbage 456.0 155.8 41.3 11.0 208.1 0.0 208.1 247.9Chinese cabbage 223.2 100.0 30.4 7.3 137.6 0.0 137.6 85.6Bean vegetables 150.7 21.2 16.3 2.3 39.8 0.0 39.8 110.9Red onion 0.0 0.0 0.0 0.0 0.0 0.0 0.0 0.0Welsh onion 95.8 18.2 5.8 1.4 25.4 0.0 25.4 70.4Carrot 290.4 47.1 20.5 3.9 71.4 0.0 71.4 219.0Sweet corn 65.0 6.5 5.8 0.8 13.1 0.0 13.1 51.9Sub-total 2,956.8 877.0 220.5 60.8 1,158.3 0.0 1,158.3 1,798.4
Food cropsPaddy 0.0 0.0 0.0 0.0 0.0 0.0 0.0 0.0Maize 0.0 0.0 0.0 0.0 0.0 0.0 0.0 0.0Sweet potato 0.0 0.0 0.0 0.0 0.0 0.0 0.0 0.0Soybean 0.0 0.0 0.0 0.0 0.0 0.0 0.0 0.0Sub-total 0.0 0.0 0.0 0.0 0.0 0.0 0.0 0.0
Total 2,956.8 877.0 220.5 60.8 1,158.3 0.0 1,158.3 1,798.4
IncrementalProduction Indirec Total IncrementalValue Inputs Hired labor Tool/equipment Total cost cost Benefit
VegetablesTomato 290.0 58.4 11.5 3.8 73.7 0.0 73.7 216.3Chili -142.0 -50.9 -8.8 -3.2 -62.9 0.0 -62.9 -79.1Potato 228.1 83.5 9.8 4.9 98.2 0.0 98.2 130.0Cabbage 410.4 138.6 36.3 9.7 184.6 0.0 184.6 225.8Chinese cabbage 170.5 76.1 22.8 5.6 104.4 0.0 104.4 66.1Bean vegetables 131.5 17.8 13.3 1.9 33.1 0.0 33.1 98.4Red onion 0.0 0.0 0.0 0.0 0.0 0.0 0.0 0.0Welsh onion 51.3 9.7 2.9 0.7 13.3 0.0 13.3 38.0Carrot 223.5 35.2 15.0 2.9 53.1 0.0 53.1 170.4Sweet corn 33.8 2.8 2.3 0.3 5.5 0.0 5.5 28.3Sub-total 1,397.2 371.2 105.2 26.6 503.0 0.0 503.0 894.2
Food cropsPaddy 0.0 0.0 0.0 0.0 0.0 0.0 0.0 0.0Maize -63.3 -19.3 -24.5 -2.8 -46.6 0.0 -46.6 -16.6Sweet potato 0.0 0.0 0.0 0.0 0.0 0.0 0.0 0.0Soybean 0.0 0.0 0.0 0.0 0.0 0.0 0.0 0.0Sub-total -63.3 -19.3 -24.5 -2.8 -46.6 0.0 -46.6 -16.6
Total 1,333.9 351.9 80.7 23.8 456.4 0.0 456.4 877.5
Direct Production Cost
Direct Production Cost
Direct Production Cost
Table IX-12 Economic Production Value and Incremental Benefit under With/Without Conditions of Gekbrong Model Area
T - IX - 12

Without-Project (Unit : Rp. Million)
Production Indirect Total ProfitValue Inputs Hired labor Tool/equipment Total cost cost
VegetablesTomato 355.0 112.4 32.6 8.1 153.2 0.0 153.2 201.8Chili 252.5 94.4 14.0 5.8 114.2 0.0 114.2 138.2Potato 0.0 0.0 0.0 0.0 0.0 0.0 0.0 0.0Cabbage 401.3 135.7 39.6 9.8 185.2 0.0 185.2 216.1Chinese cabbage 52.7 23.8 7.6 1.8 33.1 0.0 33.1 19.6Bean vegetables 134.3 24.5 20.7 2.8 48.0 0.0 48.0 86.2Red onion 52.2 8.5 2.9 0.6 12.1 0.0 12.1 40.2Welsh onion 0.0 0.0 0.0 0.0 0.0 0.0 0.0 0.0Carrot 29.9 5.9 2.7 0.5 9.2 0.0 9.2 20.8Sweet corn 45.50 6.0 5.8 0.7 12.6 0.0 12.6 32.9Sub-total 1,323.3 411.2 126.0 30.3 567.5 0.0 567.5 775.8
Food cropsPaddy 587.8 91.6 99.8 12.3 203.6 0.0 203.6 384.1Maize 0.0 0.0 0.0 0.0 0.0 0.0 0.0 0.0Sweet potato 0.0 0.0 0.0 0.0 0.0 0.0 0.0 0.0Soybean 0.0 0.0 0.0 0.0 0.0 0.0 0.0 0.0Sub-total 587.8 91.6 99.8 12.3 203.6 0.0 203.6 384.1
Total 1,911.1 502.8 225.8 42.5 771.1 0.0 771.1 1,140.0
With-project (Unit : Rp. Million)Production Indirec Total Profit
Value Inputs Hired labor Tool/equipment Total cost costVegetables
Tomato 812.0 254.2 67.1 17.9 339.2 0.0 339.2 472.8Chili 552.3 183.5 26.3 11.2 221.0 0.0 221.0 331.3Potato 112.2 41.1 4.9 2.4 48.4 0.0 48.4 63.8Cabbage 638.4 218.2 57.8 15.4 291.3 0.0 291.3 347.1Chinese cabbage 167.4 75.0 22.8 5.5 103.2 0.0 103.2 64.2Bean vegetables 411.0 57.7 44.5 6.3 108.5 0.0 108.5 302.5Red onion 149.2 22.8 7.3 1.7 31.7 0.0 31.7 117.5Welsh onion 0.0 0.0 0.0 0.0 0.0 0.0 0.0 0.0Carrot 95.0 18.8 8.2 1.6 28.6 0.0 28.6 66.5Sweet corn 70.2 7.8 7.0 0.9 15.7 0.0 15.7 54.5Sub-total 3,007.7 879.0 245.8 62.9 1,187.6 0.0 1,187.6 1,820.1
Food cropsPaddy 383.9 53.2 57.9 7.1 118.2 0.0 118.2 265.7Maize 0.0 0.0 0.0 0.0 0.0 0.0 0.0 0.0Sweet potato 0.0 0.0 0.0 0.0 0.0 0.0 0.0 0.0Soybean 0.0 0.0 0.0 0.0 0.0 0.0 0.0 0.0Sub-total 383.9 53.2 57.9 7.1 118.2 0.0 118.2 265.7
Total 3,391.7 932.2 303.7 70.0 1,305.8 0.0 1,305.8 2,085.8
IncrementalProduction Indirec Total IncrementalValue Inputs Hired labor Tool/equipment Total cost cost Benefit
VegetablesTomato 457.0 141.8 34.5 9.7 186.0 0.0 186.0 271.0Chili 299.8 89.1 12.3 5.4 106.8 0.0 106.8 193.0Potato 112.2 41.1 4.9 2.4 48.4 0.0 48.4 63.8Cabbage 237.1 82.5 18.2 5.5 106.1 0.0 106.1 131.0Chinese cabbage 114.7 51.2 15.2 3.7 70.1 0.0 70.1 44.6Bean vegetables 276.7 33.3 23.7 3.5 60.4 0.0 60.4 216.3Red onion 97.0 14.3 4.4 1.0 19.7 0.0 19.7 77.3Welsh onion 0.0 0.0 0.0 0.0 0.0 0.0 0.0 0.0Carrot 65.1 12.9 5.5 1.1 19.4 0.0 19.4 45.7Sweet corn 24.7 1.8 1.2 0.2 3.1 0.0 3.1 21.6Sub-total 1,684.4 467.8 119.7 32.6 620.1 0.0 620.1 1,064.3
Food cropsPaddy -203.8 -38.4 -41.8 -5.1 -85.4 0.0 -85.4 -118.4Maize 0.0 0.0 0.0 0.0 0.0 0.0 0.0 0.0Sweet potato 0.0 0.0 0.0 0.0 0.0 0.0 0.0 0.0Soybean 0.0 0.0 0.0 0.0 0.0 0.0 0.0 0.0Sub-total -203.8 -38.4 -41.8 -5.1 -85.4 0.0 -85.4 -118.4
Total 1,480.6 429.4 77.9 27.5 534.7 0.0 534.7 945.9
Direct Production Cost
Direct Production Cost
Direct Production Cost
Table IX-13 Economic Production Value and Incremental Benefit under With/Without Conditions of Tanjungkarya Model Area
T - IX - 13

Table IX-14 Annual Disbursement Schedule of Economic Initial Investment Cost of the Model Areas(Unit: Rp million)
CF TE CD RC CF TE CD RC CF TE CD RC CF TE CD RC
1 2001 276.7 129.1 488.9 203.6 149.0 95.7 341.6 114.7 178.3 66.8 294.5 131.2 175.0 93.8 453.5 145.62 2002 2,490.3 172.2 694.1 271.4 1,341.2 127.6 485 152.9 1,605.1 89.0 418.1 174.9 1575.4 125.0 643.9 194.23 2003 0.0 215.2 483.4 203.6 0.0 95.7 337.8 114.7 0.0 66.8 291.2 131.2 0.0 93.8 448.4 145.6
2,767.0 516.5 1,666.4 678.6 1,490.2 319.0 1,164.4 382.3 1,783.4 222.6 1,003.8 437.3 1750.4 312.6 1,545.8 485.4
Remarks : CF : Construction of Rural FacilitiesTE : Training and ExtentionCD : Common Cost of DevelopmentRC : Related Cost
Total
Model Areas Mekarjaya Langensari Gekbrong Tanjungkarya
YearNo
T - IX - 14

Table IX-15 Economic Cost and Benefit Flow of Mekarjaya Model Area(Unit: Rp. million)
Cost BenefitInitial Investment
Year*1 Constrt'n
of ruralfacilities
*2 Training& extension
*3 Commoncost for dev.
*4 Relatedcost
SubtotalOperation &Maintenance
Replacement Total Crop Others Total Balance AccumulatedBalance
1 2001 277 129 489 281 1,175 1,175 0 -1,175 -1,1752 2002 2,490 172 694 374 3,731 11 3,742 0 -3,742 -4,9173 2003 129 483 281 893 109 1,002 763 763 -240 -5,1574 2004 0 109 109 1,144 1,144 1,035 -4,1225 2005 0 109 109 1,525 1,525 1,416 -2,7066 2006 0 109 109 1,716 1,716 1,607 -1,0997 2007 0 109 109 1,906 1,906 1,797 6988 2008 0 109 109 1,906 1,906 1,797 2,4959 2009 0 109 109 1,906 1,906 1,797 4,292
10 2010 0 109 109 1,906 1,906 1,797 6,09011 2011 0 109 109 1,906 1,906 1,797 7,88712 2012 0 109 177 286 1,906 1,906 1,620 9,50713 2013 0 109 109 1,906 1,906 1,797 11,30414 2014 0 109 109 1,906 1,906 1,797 13,10215 2015 0 109 109 1,906 1,906 1,797 14,89916 2016 0 109 109 1,906 1,906 1,797 16,69617 2017 0 109 889 998 1,906 1,906 908 17,60418 2018 0 109 109 1,906 1,906 1,797 19,40219 2019 0 109 109 1,906 1,906 1,797 21,19920 2020 0 109 109 1,906 1,906 1,797 22,99621 2021 0 109 109 1,906 1,906 1,797 24,79322 2022 0 109 177 286 1,906 1,906 1,620 26,41423 2023 0 109 109 1,906 1,906 1,797 28,21124 2024 0 109 109 1,906 1,906 1,797 30,00825 2025 0 109 109 1,906 1,906 1,797 31,80526 2026 0 109 109 1,906 1,906 1,797 33,60327 2027 0 109 109 1,906 1,906 1,797 35,40028 2028 0 109 109 1,906 1,906 1,797 37,19729 2029 0 109 109 1,906 1,906 1,797 38,99430 2030 0 109 109 1,906 1,906 1,797 40,792
Total 2,767 430 1,666 935 5,799 3,068 1,243 10,110 50,902 0 50,902 40,792
5,799 10,110 EIRR = 23.3%Note *1: Construction of irrigation facility, marketing road and collection centers Sensibility Analysis
*2: Training of village coordinator and farmers/farmers groups including NGO Output Prices Decline: 10% 19.8%
*3 External expert, ATF, machine and equipment and training of task team Output Prices Decline: 20% 16.1%
*4 Administration cost, land acquisition and pre-arrangement Delay in benefit realization: 3years 21.1%
T - IX - 15

Table IX-16 Economic Cost and Benefit Flow of Langensari Model Area(Unit: Rp. million)
Cost BenefitInitial Investment
Year*1 Constrt'n
of ruralfacilities
*2 Training& extension
*3 Commoncost for dev.
*4 Relatedcost
SubtotalOperation &Maintenance
Replacement Total Crop Others Total Balance AccumulatedBalance
1 2001 149 96 342 168 755 755 0 -755 -7552 2002 1,341 128 485 225 2,179 15 2,193 0 -2,193 -2,9483 2003 96 338 168 602 148 750 377 377 -373 -3,3214 2004 0 148 148 565 565 417 -2,9045 2005 0 148 148 753 753 606 -2,2986 2006 0 148 148 847 847 700 -1,5997 2007 0 148 148 942 942 794 -8058 2008 0 148 148 942 942 794 -119 2009 0 148 148 942 942 794 783
10 2010 0 148 148 942 942 794 1,57711 2011 0 148 148 942 942 794 2,37112 2012 0 148 45 193 942 942 749 3,12013 2013 0 148 148 942 942 794 3,91414 2014 0 148 148 942 942 794 4,70815 2015 0 148 148 942 942 794 5,50116 2016 0 148 148 942 942 794 6,29517 2017 0 148 376 523 942 942 418 6,71418 2018 0 148 148 942 942 794 7,50719 2019 0 148 148 942 942 794 8,30120 2020 0 148 148 942 942 794 9,09521 2021 0 148 148 942 942 794 9,88922 2022 0 148 45 193 942 942 749 10,63823 2023 0 148 148 942 942 794 11,43224 2024 0 148 148 942 942 794 12,22625 2025 0 148 148 942 942 794 13,02026 2026 0 148 148 942 942 794 13,81427 2027 0 148 148 942 942 794 14,60828 2028 0 148 148 942 942 794 15,40129 2029 0 148 148 942 942 794 16,19530 2030 0 148 148 942 942 794 16,989
Total 1,490.2 319.1 1,164.4 561.7 3,535.4 4,150 465 8,151 25,140 0 25,140 16,989
3,535 8,151 EIRR = 17.2%Note *1: Construction of irrigation facility, marketing road and collection center Sensibility Analysis
*2: Training of village coordinator and farmers/farmers groups including NGO cost Output Prices Decline: 10% 14.4%
*3 External expert, ATF, machine and equipment and training of task team Output Prices Decline: 20% 12.3%
*4 Administration cost, land acquisition and pre-arrangement Delay in benefit realization: 3years 15.5%
T - IX - 16

Table IX-17 Economic Cost and Benefit Flow of Gekbrong Model Area(Unit: Rp. million)
Cost BenefitInitial Investment
Year*1 Constrt'n
of ruralfacilities
*2 Training& extension
*3 Commoncost for dev.
*4 Relatedcost
SubtotalOperation &Maintenance
Replacement Total Crop Others Total Balance AccumulatedBalance
1 2001 178 67 295 178 717 717 0 -717 -7172 2002 1,605 89 418 237 2,349 8 2,357 0 -2,357 -3,0743 2003 67 291 178 536 77 612 351 351 -261 -3,3354 2004 0 77 77 527 527 450 -2,8855 2005 0 77 77 702 702 626 -2,2596 2006 0 77 77 790 790 713 -1,5467 2007 0 77 77 878 878 801 -7458 2008 0 77 77 878 878 801 569 2009 0 77 77 878 878 801 857
10 2010 0 77 77 878 878 801 1,65811 2011 0 77 77 878 878 801 2,45912 2012 0 77 95 172 878 878 706 3,16513 2013 0 77 77 878 878 801 3,96614 2014 0 77 77 878 878 801 4,76715 2015 0 77 77 878 878 801 5,56816 2016 0 77 77 878 878 801 6,36917 2017 0 77 614 690 878 878 187 6,55618 2018 0 77 77 878 878 801 7,35719 2019 0 77 77 878 878 801 8,15820 2020 0 77 77 878 878 801 8,95921 2021 0 77 77 878 878 801 9,76022 2022 0 77 95 172 878 878 706 10,46623 2023 0 77 77 878 878 801 11,26724 2024 0 77 77 878 878 801 12,06825 2025 0 77 77 878 878 801 12,86926 2026 0 77 77 878 878 801 13,67027 2027 0 77 77 878 878 801 14,47128 2028 0 77 77 878 878 801 15,27229 2029 0 77 77 878 878 801 16,07330 2030 0 77 77 878 878 801 16,875
Total 1,783 223 1,004 592 3,602 2,150 804 6,556 23,431 0 23,431 16,875
3,602 6,556 EIRR = 17.2%Note *1: Construction of irrigation facility, marketing road and collection center Sensibility Analysis
*2: Training of village coordinator and farmers/farmers groups including NGO cost Output Prices Decline: 10% 14.4%
*3 External expert, ATF, machine and equipment and training of task team Output Prices Decline: 20% 11.4%
*4 Administration cost, land acquisition and pre-arrangement Delay in benefit realization: 3years 15.7%
T - IX - 17

Table IX-18 Economic Cost and Benefit Flow of Tanjungkarya Model Area(Unit: Rp. million)
Cost BenefitInitial Investment
Year*1 Constrt'n
of ruralfacilities
*2 Training& extension
*3 Commoncost for dev.
*4 Relatedcost
SubtotalOperation &Maintenance
Replacement Total Crop Others Total Balance AccumulatedBalance
1 2001 175 94 454 217 939 939 0 -939 -9392 2002 1,575 125 644 289 2,634 6 2,640 0 -2,640 -3,5803 2003 94 448 217 759 65 824 378 378 -446 -4,0254 2004 0 65 65 568 568 503 -3,5225 2005 0 65 65 757 757 692 -2,8306 2006 0 65 65 851 851 787 -2,0447 2007 0 65 65 946 946 881 -1,1638 2008 0 65 65 946 946 881 -2819 2009 0 65 65 946 946 881 600
10 2010 0 65 65 946 946 881 1,48111 2011 0 65 65 946 946 881 2,36212 2012 0 65 76 141 946 946 805 3,16813 2013 0 65 65 946 946 881 4,04914 2014 0 65 65 946 946 881 4,93015 2015 0 65 65 946 946 881 5,81116 2016 0 65 65 946 946 881 6,69217 2017 0 65 58 123 946 946 823 7,51518 2018 0 65 65 946 946 881 8,39719 2019 0 65 65 946 946 881 9,27820 2020 0 65 65 946 946 881 10,15921 2021 0 65 65 946 946 881 11,04022 2022 0 65 76 141 946 946 805 11,84623 2023 0 65 65 946 946 881 12,72724 2024 0 65 65 946 946 881 13,60825 2025 0 65 65 946 946 881 14,48926 2026 0 65 65 946 946 881 15,37027 2027 0 65 65 946 946 881 16,25228 2028 0 65 65 946 946 881 17,13329 2029 0 65 65 946 946 881 18,01430 2030 0 65 65 946 946 881 18,895
Total 1,750 313 1,546 724 4,333 1,817 210 6,360 25,255 0 25,255 18,895
4,333 6,360 EIRR = 16.2%Note *1: Construction of irrigation facility, marketing road and collection center Sensibility Analysis
*2: Training of village coordinator and farmers/farmers groups including NGO cost Output Prices Decline: 10% 13.6%
*3 External expert, ATF, machine and equipment and training of task team Output Prices Decline: 20% 10.8%
*4 Administration cost, land acquisition and pre-arrangement Delay in benefit realization: 3years 14.8%
T - IX - 18

Table IX-19 Economic Cost and Benefit Flow of Four (4) Priority Model Areas(Unit: Rp. million)
Cost BenefitInitial Investment
Year*1 Constrt'n
of ruralfacilities
*2 Training& extension
*3 Commoncost for dev.
*4 Relatedcost
SubtotalOperation &Maintenance
Replacement Total Crop Others Total Balance AccumulatedBalance
1 2001 779 385 1,579 844 3,587 3,587 0 -3,587 -3,5872 2002 7,012 514 2,241 1,125 10,892 40 10,932 0 -10,932 -14,5193 2003 385 1,561 844 2,790 398 3,188 1,869 1,869 -1,319 -15,8384 2004 0 398 398 2,803 2,803 2,405 -13,4335 2005 0 398 398 3,737 3,737 3,339 -10,0946 2006 0 398 398 4,204 4,204 3,806 -6,2887 2007 0 398 398 4,672 4,672 4,273 -2,0158 2008 0 398 398 4,672 4,672 4,273 2,2599 2009 0 398 398 4,672 4,672 4,273 6,532
10 2010 0 398 398 4,672 4,672 4,273 10,80611 2011 0 398 398 4,672 4,672 4,273 15,07912 2012 0 398 393 791 4,672 4,672 3,880 18,95913 2013 0 398 398 4,672 4,672 4,273 23,23314 2014 0 398 398 4,672 4,672 4,273 27,50615 2015 0 398 398 4,672 4,672 4,273 31,78016 2016 0 398 398 4,672 4,672 4,273 36,05317 2017 0 398 1,936 2,334 4,672 4,672 2,337 38,39018 2018 0 398 398 4,672 4,672 4,273 42,66419 2019 0 398 398 4,672 4,672 4,273 46,93720 2020 0 398 398 4,672 4,672 4,273 51,21121 2021 0 398 398 4,672 4,672 4,273 55,48422 2022 0 398 393 791 4,672 4,672 3,880 59,36523 2023 0 398 398 4,672 4,672 4,273 63,63824 2024 0 398 398 4,672 4,672 4,273 67,91125 2025 0 398 398 4,672 4,672 4,273 72,18526 2026 0 398 398 4,672 4,672 4,273 76,45827 2027 0 398 398 4,672 4,672 4,273 80,73228 2028 0 398 398 4,672 4,672 4,273 85,00529 2029 0 398 398 4,672 4,672 4,273 89,27930 2030 0 398 398 4,672 4,672 4,273 93,552
Total 7,791 1,285 5,380 2,812 17,269 11,188 2,723 31,180 124,732 0 124,732 93,552
17,269 31,180 EIRR = 19.1%Note *1: Construction of irrigation facility, marketing road and collection center Sensibility Analysis
*2: Training of village coordinator and farmers/farmers groups including NGO cost Output Prices Decline: 10% 16.2%
*3 External expert, ATF, machine and equipment and training of task team Output Prices Decline: 20% 13.1%
*4 Administration cost, land acquisition and pre-arrangement Delay in benefit realization: 3years 17.3%
T - IX - 19

Table IX-20 Financial Cash Flow Statement of Mekarjaya Model Area(Unit: Rp. million)
IN FLOW OUT FLOW
Loan from Foreign CountrySubsidy bygovernment
Repayment of Benefit*1 Otherincome
Total Initial Investment O&M ReplacementDisbursemen
tLoan
repayment
Farmers'living Total Balance
Accumulation
Repayment of loan
Construction& Training
Initial fundof micro-
Subtotalfor loan
repaymentmicro-credit by crops of farmers *1 Constrt'n
rural facilities*2 Training &
extensionSubtotal cost cost of micro-
creditby farmers expenses Capital Interest Total
Year 1.0 80% 10.5% 0.0% 20% 5% 2.4%1 2001 441 441 0 319 800 1,561 312 129 441 1,800 2,241 -681 -6812 2002 2,979 83 3,062 8 319 800 4,190 2,807 172 2,979 12 83 2 1,800 4,876 -686 -1,366 11 113 2003 129 129 67 92 982 800 2,071 129 129 115 92 17 1,890 2,243 -172 -1,538 84 844 2004 0 70 101 1,314 800 2,285 0 115 101 17 1,985 2,218 67 -1,472 87 875 2005 0 70 112 1,645 800 2,627 0 115 112 17 2,084 2,328 299 -1,173 87 876 2006 0 70 124 1,811 800 2,805 0 115 124 17 2,188 2,444 360 -812 87 877 2007 0 70 137 1,977 800 2,983 0 115 137 17.4 2,297 2,567 417 -396 87 878 2008 0 70 151 1,977 800 2,998 0 115 151 17 2,412 2,696 302 -94 87 879 2009 0 70 167 1,977 800 3,014 0 115 167 17 2,533 2,832 181 87 87 8710 2010 0 70 184 1,977 800 3,031 0 115 184 17 2,659 2,976 55 142 87 8711 2011 0 185 204 1,977 800 3,165 0 115 204 46 2,659 3,025 141 283 144 87 23112 2012 0 185 225 1,977 800 3,187 0 115 154 225 46 2,659 3,200 -13 270 147 84 23113 2013 0 185 249 1,977 800 3,210 0 115 249 46 2,659 3,070 141 411 151 80 23114 2014 0 185 275 1,977 800 3,237 0 115 275 46 2,659 3,096 141 551 154 77 23115 2015 0 185 304 1,977 800 3,265 0 115 304 46 2,659 3,125 141 692 158 73 23116 2016 0 185 336 1,977 800 3,297 0 115 336 46 2,659 3,157 141 833 162 69 23117 2017 0 185 371 1,977 800 3,333 0 115 925 371 46 2,659 4,117 -784 49 166 65 23118 2018 0 185 410 1,977 800 3,372 0 115 410 46 2,659 3,231 141 190 170 61 23119 2019 0 185 453 1,977 800 3,415 0 115 453 46 2,659 3,274 141 330 174 57 23120 2020 0 185 501 1,977 800 3,462 0 115 501 46 2,659 3,321 141 471 178 53 23121 2021 0 185 553 1,977 800 3,515 0 115 553 46 2,659 3,374 141 612 182 49 23122 2022 0 185 611 1,977 800 3,573 0 115 154 611 46 2,659 3,586 -13 599 186 44 23123 2023 0 185 676 1,977 800 3,637 0 115 676 46 2,659 3,496 141 740 191 40 23124 2024 0 185 747 1,977 800 3,708 0 115 747 46 2,659 3,567 141 881 196 35 23125 2025 0 185 825 1,977 800 3,786 0 115 825 46 2,659 3,646 141 1,021 200 31 23126 2026 0 185 912 1,977 800 3,873 0 115 912 46 2,659 3,732 141 1,162 205 26 23127 2027 0 185 1,007 1,977 800 3,969 0 115 1,007 46 2,659 3,828 141 1,303 210 21 23128 2028 0 185 1,113 1,977 800 4,075 0 115 1,113 46 2,659 3,934 141 1,444 215 16 23129 2029 0 185 1,230 1,977 800 4,191 0 115 1,230 46 2,659 4,051 141 1,585 220 11 23130 2030 0 185 1,359 1,977 800 4,321 0 115 1,359 46 2,659 4,180 141 1,726 225 5 231
Total 3,549 83 3,632 4,257 13,428 53,837 24,000 99,154 3,119 430 3,549 3,234 1,233 13,511 1,064 74,836 97,429 1,726 3,632 1,689 5,321Note *1: Construction of irrigation facility, marketing road and collection center
*2: Training of village coordinator and farmers/farmers groups including NGO costAmortalization rate of capital cost by beneficiaries
Irrigable area 83 ha 100% 40% 30% 20% 10% 0%Beneficiaries 400 family 1 Annual costLiving expenses 4,500 Rp./family (1) O & M cost Constant Constant Constant Constant Constant ConstantCash income excepting annual crops 2,000 Rp./family (2) Replacement cost Constant Constant Constant Constant Constant ConstantProfit of present condition 319.5 Rp. Million (3) Annual amortalization (after ii year) Constant Constant Constant Constant Constant ConstantProfit of target year 1,976.9 Rp. Million 2 Increase of Living standard of beneficiariesBuild up of benefit (year after facility construction) (1) Average loving expenses in 2010 (Rp.1000/fam 2,799 2,799 2,799 2,799 2,799 2,799
1st year (2003) 40% (2) Average loving expenses in 2001 (Rp.1001/fam 6,436 6,698 6,742 6,785 6,829 6,8722nd year (2004) 60% (3) Increaseing rate of living expenditure for intial 9.70% 10.18% 10.26% 10.34% 10.42% 10.50%3rd year (2005) 80% (4) increaase rate at 10th year 2.30 2.39 2.41 2.42 2.44 2.464th year (2006) 90% (5) Increase rate from 11 th 0% 0% 0% 0% 0% 0%5th year (2007) 100% 3 Annual cost per ha and % to net income
(1) O&M and replacement cost *1 (Rp1000/ha) 1,882 1,882 1,882 1,882 1,882.0 1,882.0O&M and replacement cost *1 (Rp1000/family) 391 391 391 391 390.5 390.5
FIRR = 19.1% Ratio to net crop income (%) 7.9% 7.9% 7.9% 7.9% 7.9% 7.9%Condition Cost: Whole costs of 1999/2000 financial price excluding price contingency (2) Annual amortization (Rp1000/ha) 2,781 1,112 834 556 278 0
Benefit: Financial incremental benefit (profit of with project - profit without project) Annual amortization (Rp1000/family) 577 231 173 115 58 0Ratio to net crop income (%) 11.7% 4.7% 3.5% 2.3% 1.2% 0.0%
(3) Total (Rp. 1000/ha) 4,663 2,994 2,716 2,438 2,160 1,882Total (Rp. 1000/family) 968 621 564 506 448 391Ratio to net crop income (%) 19.6% 12.6% 11.4% 10.2% 9.1% 7.9%Figures area shown in constant pricesReplacement cost is shown in average per year
T - IX - 20

Table IX-21 Financial Cash Flow Statement of Langensari Model Area(Unit: Rp. million)
IN FLOW OUT FLOW
Loan from Foreign Countrysubcidy bygovernment
Repaymentof
Benefit Other income Total Initial Investment O&M ReplacementDisbursemen
tLoan
repayment
Farmers'living Total Balance
Accumulation
Repayment of loan
Construction& Training
Initial fund ofmicro-credit
Subtotalfor loan
repaymentmicro-credit by crops of farmers *1 Constrt'n of
rural facilities*2 Training &
extensionSubtotal cost cost of micro-
creditby
beneficiairesexpenditure Capital Interest Subtotal
Year 1.0 80% 10.5% 0.0% 20% 3.0% 2.4%1 2001 265 265 0 1,113 1,040 2,418 170 96 265 0 2,262 2,527 -109 -1092 2002 1,654 58 1,712 5 1,113 1,040 3,870 1,526 128 1,654 16 58 1 2,262 3,991 -122 -231 6 63 2003 96 96 38 64 1,458 1,040 2,696 96 96 159 64 9 2,330 2,658 38 -193 47 474 2004 0 40 71 1,631 1,040 2,781 0 159 71 10 2,400 2,639 142 -52 50 505 2005 0 40 78 1,803 1,040 2,961 0 159 78 10 2,472 2,719 243 191 50 506 2006 0 40 86 1,890 1,040 3,056 0 159 86 10 2,546 2,801 255 446 50 507 2007 0 40 96 1,976 1,040 3,151 0 159 96 10 2,622 2,887 265 711 50 508 2008 0 40 106 1,976 1,040 3,162 0 159 106 10 2,701 2,975 186 897 50 509 2009 0 40 117 1,976 1,040 3,173 0 159 117 10 2,782 3,067 105 1,002 50 5010 2010 0 40 129 1,976 1,040 3,185 0 159 129 10 2,865 3,163 22 1,024 50 5011 2011 0 105 142 1,976 1,040 3,264 0 159 142 26 2,865 3,193 71 1,094 82 50 13212 2012 0 105 157 1,976 1,040 3,279 0 159 28 157 26 2,865 3,236 43 1,138 84 48 13213 2013 0 105 174 1,976 1,040 3,295 0 159 174 26 2,865 3,225 71 1,208 86 46 13214 2014 0 105 192 1,976 1,040 3,314 0 159 192 26 2,865 3,243 71 1,279 88 44 13215 2015 0 105 212 1,976 1,040 3,334 0 159 212 26 2,865 3,263 71 1,350 90 42 13216 2016 0 105 235 1,976 1,040 3,356 0 159 235 26 2,865 3,285 71 1,421 92 39 13217 2017 0 105 259 1,976 1,040 3,381 0 159 384 259 26 2,865 3,694 -313 1,108 95 37 13218 2018 0 105 287 1,976 1,040 3,408 0 159 287 26 2,865 3,337 71 1,179 97 35 13219 2019 0 105 317 1,976 1,040 3,438 0 159 317 26 2,865 3,367 71 1,249 99 33 13220 2020 0 105 350 1,976 1,040 3,471 0 159 350 26 2,865 3,401 71 1,320 101 30 13221 2021 0 105 387 1,976 1,040 3,508 0 159 387 26 2,865 3,437 71 1,391 104 28 13222 2022 0 105 427 1,976 1,040 3,549 0 159 28 427 26 2,865 3,506 43 1,434 106 25 13223 2023 0 105 472 1,976 1,040 3,594 0 159 472 26 2,865 3,523 71 1,505 109 23 13224 2024 0 105 522 1,976 1,040 3,643 0 159 522 26 2,865 3,572 71 1,576 112 20 13225 2025 0 105 576 1,976 1,040 3,698 0 159 576 26 2,865 3,627 71 1,647 114 17 13226 2026 0 105 637 1,976 1,040 3,758 0 159 637 26 2,865 3,688 71 1,717 117 15 13227 2027 0 105 704 1,976 1,040 3,825 0 159 704 26 2,865 3,755 71 1,788 120 12 13228 2028 0 105 778 1,976 1,040 3,899 0 159 778 26 2,865 3,828 71 1,859 123 9 13229 2029 0 105 859 1,976 1,040 3,981 0 159 859 26 2,865 3,910 71 1,930 126 6 13230 2030 0 105 950 1,976 1,040 4,071 0 159 950 26 2,865 4,000 71 2,001 129 3 132
Total 2,015 58 2,073 2,429 9,384 56,434 31,200 101,520 1,696 319 2,015 4,465 439 9,442 607 82,551 99,519 2,001 2,073 964 3,037Note *1: Construction of irrigation facility, marketing road and collection center
*2: Training of village coordinator and farmers/farmers groups including NGO costAmortization rate of capital cost by beneficiaries
Irrigable area 58 ha 100% 40% 30% 20% 10% 0%Beneficiaries 260 family 1 Annual costLiving expenses 8,700 Rp./family (1) O & M cost Constant Constant Constant Constant Constant ConstantCash income excepting annual crops 4,000 Rp./family (2) Replacement cost Constant Constant Constant Constant Constant ConstantProfit of present condition 1,113 Rp. Million (3) Annual amortization (after ii year) Constant Constant Constant Constant Constant ConstantProfit of target year 1,976 Rp. Million 2 Increase of living standard of beneficiariesBuild up of benefit (year after facility construction) (1) Average living expenses in 2001 (Rp.1000/fami 8,279 8,279 8,279 8,279 8,279 8,279
1st year (2003) 40% (2) Average living expenses in 2010 (Rp.1000/fami 10,798 11,028 11,066 11,104.13 11,142 11,1812nd year (2004) 60% (3) Increasing rate of living expenditure for initial 10 3.00% 3.24% 3.28% 3.32% 3.36% 3.40%3rd year (2005) 80% (4) Increase rate at 10th year 1.30 1.33 1.34 1.34 1.35 1.354th year (2006) 90% (5) Increase rate from 11th 0% 0% 0% 0% 0% 0%5th year (2007) 100% 3 Annual cost per ha and % to net income
(1) O&M and replacement cost *1 (Rp1000/ha) 2,992 2,992 2,992 2,992 2,992 2,992O&M and replacement cost *1 (Rp1001/family) 667 667 667 667 667 667
FIRR = 14.4% Ratio to net crop income (%) 8.8% 8.8% 8.8% 8.8% 8.8% 8.8%Condition Cost: Whole costs of 1999/2000 financial price excluding price contingency (2) Annual amortization (Rp1000/ha) 2,271 909 681 454 227 0
Benefit: Financial incremental benefit (profit of with project - profit without project) Annual amortization (Rp1000/family) 507 203 152 101 51 0Ratio to net crop income (%) 6.7% 2.7% 2.0% 1.3% 0.7% 0.0%
(3) Total (Rp. 1000/family) 5,263 3,901 3,674 3,446 3,219 2,992Total (Rp. 1001/ha) 1,174 870 819 769 718 667Ratio to net crop income (%) 15.4% 11.4% 10.8% 10.1% 9.4% 8.8%Figures area shown in constant pricesReplacement cost is shown in average per year
T - IX - 21

Table IX-22 Financial Cash Flow Statement of Gekbrong Model Area(Unit: Rp. million)
IN FLOW OUT FLOW
Loan from Foreign CountrySubsidy bygovernment
Repayment of BenefitOther
incomeTotal Initial Investment O&M Replacement
Disbursement
Loanrepayment
Farmers'living Total Balance
Accumulation
Repayment of loan
Construction& Training
Initial fundof micro-
Subtotalfor loan
repaymentmicro-credit by crops of farmers *1 Constrt'n of
rural facilities*2 Training &
extensionSubtotal cost cost of micro-
creditby
beneficiariesexpenditure Capital Interest Subtotal
Year 1.0 80% 10.5% 0.0% 20% 6.0% 2.4%1 2001 271 271 0 828 120 1,218 204 67 271 0 1,020 1,291 -72 -722 2002 1,924 50 1,974 5 828 120 2,926 1,835 89 1,924 8 50 1 1,020 3,003 -77 -149 6 63 2003 67 67 43 55 1,116 120 1,401 67 67 82 55 11 1,081 1,296 105 -44 54 544 2004 0 44 61 1,260 120 1,486 0 82 61 11 1,146 1,301 185 141 55 555 2005 0 44 67 1,404 120 1,636 0 82 67 11 1,215 1,376 261 401 55 556 2006 0 44 75 1,477 120 1,715 0 82 75 11 1,288 1,456 260 661 55 557 2007 0 44 82 1,549 120 1,795 0 82 82 11 1,365 1,541 255 916 55 558 2008 0 44 91 1,549 120 1,804 0 82 91 11 1,447 1,631 173 1,088 55 559 2009 0 44 101 1,549 120 1,814 0 82 101 11 1,534 1,728 86 1,174 55 5510 2010 0 44 111 1,549 120 1,824 0 82 111 11 1,626 1,830 -6 1,168 55 5511 2011 0 117 123 1,549 120 1,909 0 82 123 29 1,626 1,860 49 1,217 91 55 14712 2012 0 117 136 1,549 120 1,922 0 82 81 136 29 1,626 1,954 -32 1,185 94 53 14713 2013 0 117 150 1,549 120 1,936 0 82 150 29 1,626 1,887 49 1,233 96 51 14714 2014 0 117 166 1,549 120 1,952 0 82 166 29 1,626 1,903 49 1,282 98 49 14715 2015 0 117 183 1,549 120 1,969 0 82 183 29 1,626 1,920 49 1,331 100 46 14716 2016 0 117 202 1,549 120 1,988 0 82 202 29 1,626 1,940 49 1,379 103 44 14717 2017 0 117 224 1,549 120 2,010 0 82 639 224 29 1,626 2,600 -591 789 105 41 14718 2018 0 117 247 1,549 120 2,033 0 82 247 29 1,626 1,984 49 837 108 39 14719 2019 0 117 273 1,549 120 2,059 0 82 273 29 1,626 2,010 49 886 110 36 14720 2020 0 117 302 1,549 120 2,088 0 82 302 29 1,626 2,039 49 935 113 34 14721 2021 0 117 333 1,549 120 2,119 0 82 333 29 1,626 2,071 49 984 116 31 14722 2022 0 117 368 1,549 120 2,154 0 82 81 368 29 1,626 2,187 -32 951 119 28 14723 2023 0 117 407 1,549 120 2,193 0 82 407 29 1,626 2,144 49 1,000 121 25 14724 2024 0 117 450 1,549 120 2,236 0 82 450 29 1,626 2,187 49 1,049 124 22 14725 2025 0 117 497 1,549 120 2,283 0 82 497 29 1,626 2,234 49 1,097 127 19 14726 2026 0 117 549 1,549 120 2,335 0 82 549 29 1,626 2,287 49 1,146 130 16 14727 2027 0 117 607 1,549 120 2,393 0 82 607 29 1,626 2,344 49 1,195 134 13 14728 2028 0 117 670 1,549 120 2,457 0 82 670 29 1,626 2,408 49 1,244 137 10 14729 2029 0 117 741 1,549 120 2,527 0 82 741 29 1,626 2,478 49 1,292 140 7 14730 2030 0 117 819 1,549 120 2,605 0 82 819 29 1,626 2,556 49 1,341 143 3 147
Total 2,261 50 2,311 2,709 8,089 44,079 3,600 60,788 2,038 223 2,261 2,313 801 8,139 677 45,256 59,447 1,341 2,311 1,075 3,386Note *1: Construction of irrigation facility, marketing road and collection center
*2: Training of village coordinator and farmers/farmers groups including NGO costAmortization rate of capital cost by beneficiaries
Irrigable area 50 ha 100% 40% 30% 20% 10% 0%Beneficiaries 120 family 1 Annual costLiving expenses 8,500 Rp./family (1) O & M cost Constant Constant Constant Constant Constant ConstantCash income excepting annual crops 1,000 Rp./family (2) Replacement cost Constant Constant Constant Constant Constant ConstantProfit of present condition 828 Rp. Million (3) Annual amortization (after ii year) Constant Constant Constant Constant Constant ConstantProfit of target year 1,549 Rp. Million 2 Increase of living standard of beneficiariesBuild up of benefit (year after facility construction) (1) Average living expenses in 2001 (Rp.1000/family 7,896 7,896 7,896 7,896 7,896 7,896
1st year (2003) 40% (2) Average living expenses in 2010 (Rp.1000/family 12,757 13,312 13,404 13,497 13,589 13,6822nd year (2004) 60% (3) Increasing rate of living expenditure for initial 10 5.47% 5.62% 6.06% 6.14% 6.22% 6.30%3rd year (2005) 80% (4) Increase rate at 10th year 1.62 1.69 1.70 1.71 1.72 1.734th year (2006) 90% (5) Increase rate from 11th 0% 0% 0% 0% 0% 0%5th year (2007) 100% 3 Annual cost per ha and % to net income
(1) O&M and replacement cost *1 (Rp1000/ha) 2,180 2,180 2,180 2,180 2,180 2,180O&M and replacement cost *1 (Rp1001/family) 908 908 908 908 908 908
FIRR = 12.7% Ratio to net crop income (%) 7.0% 7.0% 7.0% 7.0% 7.0% 7.0%Condition Cost: Whole costs of 1999/2000 financial price excluding price contingency (2) Annual amortization (Rp1000/ha) 2,937 1,175 881 587 294 0
Benefit: Financial incremental benefit (profit of with project - profit without project) Annual amortization (Rp1000/family) 1,224 490 367 245 122 0Ratio to net crop income (%) 9.5% 3.8% 2.8% 1.9% 0.9% 0.0%
(3) Total (Rp. 1000/family) 5,117 3,355 3,061 2,768 2,474 2,180Total (Rp. 1001/ha) 2,132 1,398 1,276 1,153 1,031 908Ratio to net crop income (%) 16.5% 10.8% 9.9% 8.9% 8.0% 7.0%Figures area shown in constant pricesReplacement cost is shown in average per year
T - IX - 22

Table IX-23 Financial Cash Flow Statement of Tanjyungkarya Model Area(Unit: Rp. million)
IN FLOW OUT FLOW
Loan from Foreign CountrySubsidy bygovernment
Repayment ofBenefit by
annualOther income Total Initial investment O&M Replacement Disbursement
Loanrepayment Farmers' living Total Balance Accumulation Repayment of loan
Construction& Training
Initial fund ofmicro-credit
Subtotalfor loan
repaymentmicro-credit crops of farmers *1 Constrt'n of
rural facilities*2 Training &
extensionSubtotal cost cost of micro-
creditby farmers expenditure Capital Interest Subtotal
Year 1.0 80% 10.5% 0.0% 20% 4.0% 2.4%1 2001 304 304 0 770 1,064 2,138 211 94 304 0 1,904 2,208 -70 -702 2002 2,020 77 2,097 6 770 1,064 3,937 1,895 125 2,020 7 77 1 1,904 4,010 -73 -143 7 73 2003 94 94 46 85 1,096 1,064 2,385 94 94 72 85 12 1,980 2,242 143 -0 58 584 2004 0 48 94 1,259 1,064 2,465 0 72 94 12 2,059 2,237 228 228 60 605 2005 0 48 104 1,422 1,064 2,638 0 72 104 12 2,142 2,329 309 537 60 606 2006 0 48 115 1,504 1,064 2,731 0 72 115 12 2,227 2,426 305 842 60 607 2007 0 48 127 1,586 1,064 2,824 0 72 127 12 2,317 2,527 297 1,139 60 608 2008 0 48 140 1,586 1,064 2,838 0 72 140 12 2,409 2,633 205 1,344 60 609 2009 0 48 155 1,586 1,064 2,852 0 72 155 12 2,506 2,744 108 1,453 60 60
10 2010 0 48 171 1,586 1,064 2,869 0 72 171 12 2,606 2,860 8 1,461 60 6011 2011 0 127 189 1,586 1,064 2,966 0 72 189 32 2,606 2,898 67 1,528 99 60 15912 2012 0 127 209 1,586 1,064 2,985 0 72 53 209 32 2,606 2,971 14 1,542 101 58 15913 2013 0 127 231 1,586 1,064 3,007 0 72 231 32 2,606 2,940 67 1,610 103 55 15914 2014 0 127 255 1,586 1,064 3,032 0 72 255 32 2,606 2,964 67 1,677 106 53 15915 2015 0 127 282 1,586 1,064 3,058 0 72 282 32 2,606 2,991 67 1,744 108 50 15916 2016 0 127 312 1,586 1,064 3,088 0 72 312 32 2,606 3,021 67 1,812 111 47 15917 2017 0 127 344 1,586 1,064 3,121 0 72 54 344 32 2,606 3,107 13 1,825 114 45 15918 2018 0 127 380 1,586 1,064 3,157 0 72 380 32 2,606 3,090 67 1,892 116 42 15919 2019 0 127 420 1,586 1,064 3,197 0 72 420 32 2,606 3,129 67 1,960 119 39 15920 2020 0 127 465 1,586 1,064 3,241 0 72 465 32 2,606 3,174 67 2,027 122 36 15921 2021 0 127 513 1,586 1,064 3,290 0 72 513 32 2,606 3,222 67 2,094 125 33 15922 2022 0 127 567 1,586 1,064 3,344 0 72 53 567 32 2,606 3,329 14 2,109 128 30 15923 2023 0 127 627 1,586 1,064 3,403 0 72 627 32 2,606 3,336 67 2,176 131 27 15924 2024 0 127 693 1,586 1,064 3,469 0 72 693 32 2,606 3,402 67 2,243 134 24 15925 2025 0 127 765 1,586 1,064 3,542 0 72 765 32 2,606 3,474 67 2,311 138 21 15926 2026 0 127 846 1,586 1,064 3,622 0 72 846 32 2,606 3,555 67 2,378 141 18 15927 2027 0 127 934 1,586 1,064 3,711 0 72 934 32 2,606 3,643 67 2,445 144 14 15928 2028 0 127 1,033 1,586 1,064 3,809 0 72 1,033 32 2,606 3,742 67 2,513 148 11 15929 2029 0 127 1,141 1,586 1,064 3,917 0 72 1,141 32 2,606 3,850 67 2,580 151 7 15930 2030 0 127 1,261 1,586 1,064 4,037 0 72 1,261 32 2,606 3,970 67 2,648 155 4 159
Total 2,418 77 2,495 2,924 12,458 44,875 31,920 94,673 2,106 313 2,418 2,012 160 12,535 731 74,169 92,025 2,648 2,495 1,160 3,655Note *1: Construction of irrigation facility, marketing road and collection center
*2: Training of village coordinator and farmers/farmers groups including NGO costAmortization rate of capital cost by beneficiaries
Irrigable area 77 ha 100% 40% 30% 20% 10% 0%Beneficiaries 280 family 1 Annual costLiving expenses 6,800 Rp./family (1) O & M cost Constant Constant Constant Constant Constant ConstantCash income excepting annual crops 3,800 Rp./family (2) Replacement cost Constant Constant Constant Constant Constant ConstantProfit of present condition 770 Rp. Million (3) Annual amortization (after ii year) Constant Constant Constant Constant Constant ConstantProfit of target year 1,586 Rp. Million 2 Increase of living standard of beneficiariesBuild up of benefit (year after facility construction) (1) Average living expenses in 2001 (Rp.1000/family) 6,549 6,549 6,549 6,549 6,549 6,549
1st year (2003) 40% (2) Average living expenses in 2010 (Rp.1000/family) 8,993 9,250 9,293 9,335 9,378 9,4212nd year (2004) 60% (3) Increasing rate of living expenditure for initial 10 yr 3.59% 3.91% 3.97% 4.01% 4.08% 4.12%3rd year (2005) 80% (4) Increase rate at 10th year 1.37 1.41 1.42 1.43 1.43 1.444th year (2006) 90% (5) Increase rate from 11th 0% 0% 0% 0% 0% 0%5th year (2007) 100% 3 Annual cost per ha and % to net income
(1) O&M and replacement cost *1 (Rp1000/ha) 999 999 999 999 999 999O&M and replacement cost *1 (Rp1001/family) 275 275 275 275 275 275
FIRR = 12.5% Ratio to net crop income (%) 4.9% 4.9% 4.9% 4.9% 4.9% 4.9%Condition Cost: Whole costs of 1999/2000 financial price excluding price contingency (2) Annual amortization (Rp1000/ha) 2,059 824 618 412 206 0
Benefit: Financial incremental benefit (profit of with project - profit without project) Annual amortization (Rp1000/family) 566 227 170 113 57 0Ratio to net crop income (%) 10.0% 4.0% 3.0% 2.0% 1.0% 0.0%
(3) Total (Rp. 1000/family) 3,058 1,823 1,617 1,411 1,205 999Total (Rp. 1000/ha) 841 501 445 388 331 275Ratio to net crop income (%) 14.9% 8.9% 7.9% 6.9% 5.8% 4.9%Figures area shown in constant pricesReplacement cost is shown in average per year
T - IX - 23

Table IX-24 Financial Cash Flow of 4 Model Areas (Unit: Rp. million)
IN FLOW OUT FLOW
Loan from Foreign CountrySubsidy bygovernment
Repayment of Benefit* 5 Otherincome
Total Initial Investment O&M Re-placement DisbursementLoan
repayment Farmers' Total BalanceAccumu-
lationRepayment of loan
Construction& Training
Initial fund ofmicro-credit
Subtotal for loanrepayment
micro-credit by annualcrops
of farmers *1 Const. ofrural facilities
*2 Training &extension
Subtotal cost cost of micro-credit by farmers living expeses Capital Interest Subtotal
Year 1.0 80% 10.5% 0.0% 20% 5.0% 2.4%
1 2001 1,281 1,281 0 3,029 2,650 6,961 896 385 1,281 0 6,360 7,641 -681 -681
2 2002 8,577 268 8,845 25 3,029 2,650 14,549 8,064 514 8,577 43 268 6 6,360 15,254 -705 -1,386 31 31
3 2003 385 385 194 296 4,653 2,650 8,179 385 385 428 296 49 6,678 7,836 342 -1,043 243 243
4 2004 0 202 327 5,464 2,650 8,643 0 428 327 50 7,012 7,817 826 -217 252 252
5 2005 0 202 362 6,276 2,650 9,489 0 428 362 50 7,362 8,202 1,287 1,069 252 252
6 2006 0 202 400 6,681 2,650 9,933 0 428 400 50 7,731 8,609 1,324 2,393 252 252
7 2007 0 202 442 7,087 2,650 10,381 0 428 442 50 8,117 9,037 1,344 3,737 252 252
8 2008 0 202 488 7,087 2,650 10,427 0 428 488 50 8,523 9,489 938 4,675 252 252
9 2009 0 202 539 7,087 2,650 10,478 0 428 539 50 8,949 9,967 512 5,186 252 252
10 2010 0 202 596 7,087 2,650 10,535 0 428 596 50 9,397 10,471 64 5,250 252 252
11 2011 0 534 658 7,087 2,650 10,930 0 428 658 134 9,397 10,616 313 5,564 416 252 668
12 2012 0 534 727 7,087 2,650 10,999 0 428 316 727 134 9,397 11,001 -2 5,561 426 242 668
13 2013 0 534 804 7,087 2,650 11,075 0 428 804 134 9,397 10,762 313 5,875 436 232 668
14 2014 0 534 888 7,087 2,650 11,160 0 428 888 134 9,397 10,846 313 6,188 446 222 668
15 2015 0 534 981 7,087 2,650 11,253 0 428 981 134 9,397 10,940 313 6,502 457 211 668
16 2016 0 534 1,084 7,087 2,650 11,356 0 428 1,084 134 9,397 11,043 313 6,815 468 200 668
17 2017 0 534 1,198 7,087 2,650 11,470 0 428 2,003 1,198 134 9,397 13,159 -1,689 5,126 479 189 668
18 2018 0 534 1,324 7,087 2,650 11,596 0 428 1,324 134 9,397 11,282 313 5,440 491 177 668
19 2019 0 534 1,463 7,087 2,650 11,735 0 428 1,463 134 9,397 11,421 313 5,753 503 165 668
20 2020 0 534 1,617 7,087 2,650 11,888 0 428 1,617 134 9,397 11,575 313 6,067 515 153 668
21 2021 0 534 1,787 7,087 2,650 12,058 0 428 1,787 134 9,397 11,745 313 6,380 527 141 668
22 2022 0 534 1,974 7,087 2,650 12,246 0 428 316 1,974 134 9,397 12,248 -2 6,378 540 128 668
23 2023 0 534 2,181 7,087 2,650 12,453 0 428 2,181 134 9,397 12,140 313 6,691 553 115 668
24 2024 0 534 2,410 7,087 2,650 12,682 0 428 2,410 134 9,397 12,369 313 7,005 566 102 668
25 2025 0 534 2,664 7,087 2,650 12,935 0 428 2,664 134 9,397 12,622 313 7,318 579 89 668
26 2026 0 534 2,943 7,087 2,650 13,215 0 428 2,943 134 9,397 12,901 313 7,632 593 75 668
27 2027 0 534 3,252 7,087 2,650 13,524 0 428 3,252 134 9,397 13,210 313 7,945 608 60 668
28 2028 0 534 3,594 7,087 2,650 13,865 0 428 3,594 134 9,397 13,552 313 8,259 622 46 668
29 2029 0 534 3,971 7,087 2,650 14,243 0 428 3,971 134 9,397 13,929 313 8,572 637 31 668
30 2030 0 534 4,388 7,087 2,650 14,660 0 428 4,388 134 9,397 14,346 313 8,886 652 16 668Total 10,244 268 10,512 12,320 43,359 199,225 79,500 344,916 8,960 1,285 10,244 12,024 2,634 43,627 3,080 264,421 336,031 8,886 10,512 4,887 15,399
Note *1: Construction of irrigation facility, marketing road and collection center*2: Training of village coordinator and farmers/farmers groups including NGO cost
Amortization rate of capital cost by beneficiariesIrrigable area 268 ha 100% 40% 30% 20% 10% 0%Beneficiaries 1,060 family 1 Annual costLiving expenses 6,000 Rp./family (1) O & M cost Constant Constant Constant Constant Constant ConstantCash income excepting annual crops 2,500 Rp./family (2) Replacement cost Constant Constant Constant Constant Constant ConstantProfit of present condition 3,029 Rp. Million (3) Annual amortization (after ii year) Constant Constant Constant Constant Constant ConstantProfit of target year 7,087 Rp. Million 2 Increase of living standard of beneficiariesBuild up of benefit (year after facility construction) (1) Average living expenses in 2001 (Rp.1000/family 5,358 5,358 5,358 5,358 5,358 5,358
1st year (2003) 40% (2) Average living expenses in 2010 (Rp.1000/family 8,544 8,830 8,878 8,925 8,973 9,0202nd year (2004) 60% (3) Increasing rate of living expenditure for initial 10 y 5.32% 5.71% 5.77% 5.83% 5.90% 5.96%3rd year (2005) 80% (4) Increase rate at 10th year 1.59 1.65 1.66 1.67 1.67 1.684th year (2006) 90% (5) Increase rate from 11th 0% 0% 0% 0% 0% 0%5th year (2007) 100% 3 Annual cost per ha and % to net income
(1) O&M and replacement cost *1 (Rp1000/ha) 1,924 1,924 1,924 1,924 1,924 1,924O&M and replacement cost *1 (Rp1001/family) 487 487 487 487 487 487
FIRR = 15.2% Ratio to net crop income (%) 7.3% 7.3% 7.3% 7.3% 7.3% 7.3%Condition Cost: Whole costs of 1999/2000 financial price excluding price contingency (2) Annual amortization (Rp1000/ha) 2,492 997 748 498 249 0
Benefit: Financial incremental benefit (profit of with project - profit without project) Annual amortization (Rp1000/family) 630 252 189 126 63 0Ratio to net crop income (%) 9.4% 3.8% 2.8% 1.9% 0.9% 0.0%
(3) Total (Rp. 1000/family) 4,417 2,921 2,672 2,423 2,174 1,924Total (Rp. 1001/ha) 1,117 739 676 613 550 487Ratio to net crop income (%) 16.7% 11.0% 10.1% 9.2% 8.2% 7.3%Figures area shown in constant pricesReplacement cost is shown in average per year
T - IX - 24

Figures

Figure IX-1: General Conceptual Framework for the Economic Evaluation of the Project
Financial project cost(Civil Work & support cost
Replacement cost Operation/Maintenance Cost
Estimation of
Without-Projrct (Present Condition)With Project (Proposed Plan)
Financial CropBudget
- Unit Yield- Farm-gate price of product- Quantity/price of input
(Seed, fertilizer, chemicel, etc)- Labor requirement
(hired and family, wage rate ofhired labour)
- Water charge- Other direct cost- Indirect coat
(tax, land fee, etc.)
Crop budget by crops (Profit per ha)
Planted area by crops(Pattern/intensity ofcropping)
Annual profit
Incremental Be At Target Ye
Benefit Built-up
Financial CropBudget
- Unit Yield- Farm-gate price of product- Quantity/price of input
(Seed, fertilizer, chemicel, etc)- Labor requirement
(hired and family, wage rate ofhired labour)
- Water charge- Other direct cost- Indirect coat
F - IX - 1
Economic cost/price- Standard
convertion factor- Construction
convertion factor- Un-skill labor cost- Transportation cost
Crop budget by crops (Profit per ha)
Planted area by crops(Pattern/intensity ofcropping)
Annual profit Implementation plan
nefitar
Replacement Plan Project life
Market Road Benefit of Model Area
Cash Flow
IRR
National Discount Rate
Sensitivity Analysis
Feasible
Not-Feasible