annotation and differential analysis of alternative …...annotation and differential analysis of...
TRANSCRIPT

Annotation and differential analysis of alternative splicing using
de novo assembly of RNAseq data
Clara Benoit-Pilven Team ERABLE, LBBE, Lyon Team GENDEV, CRNL, Lyon
______
31 March 2017

Alternative SplicingIntroduction 1
exonintron
gene
transcription
pre-mRNA
mRNA
splicing
protein
translation
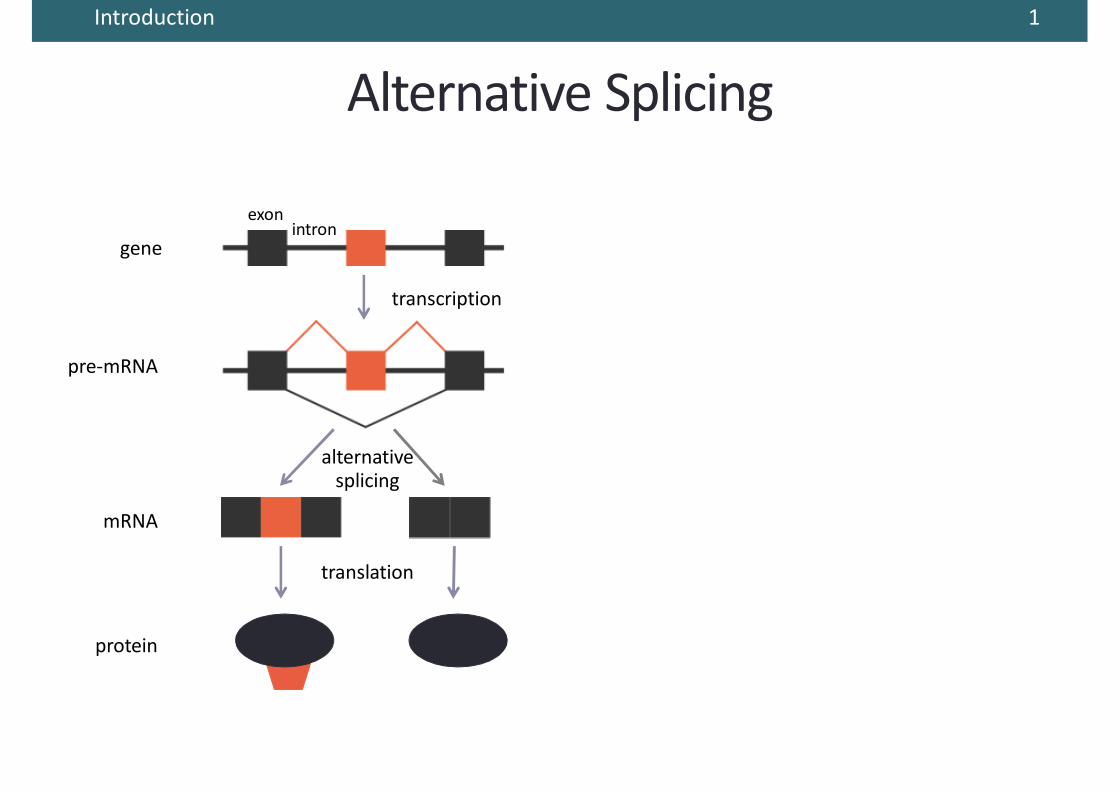
Alternative Splicing1
exonintron
gene
transcription
pre-mRNA
mRNA
alternative splicing
protein
translation
Introduction

Alternative Splicing1
exonintron
gene
transcription
pre-mRNA
mRNA
alternative splicing
protein
translation
Introduction
PrematureSTOP Codon
degradation by NMD (Nonsense Mediated Decay)

Alternative Splicing1
exonintron
gene
transcription
pre-mRNA
mRNA
alternative splicing
protein
translation
à Concerns more than 95% of multi-exons human genes
à Deregulation of AS involved in many diseases (like cancer)
Introduction
PrématureSTOP Codon
dégradation par le NMD
(Nonsense Mediated Decay)

Assembly-first and Mapping first approaches 2
adapted from Martin et Wang, Nat Rev Genet 2011
RNA-seq reads
Mapping-first approach
Align readsto the
genome
Alternative splicing event
Introduction

Assembly-first and Mapping first approaches
adapted from Martin et Wang, Nat Rev Genet 2011
RNA-seq reads
Assembly-first approach
De-novo assembly
Align readsto the
genome
Aligncontigs to
the genome
Alternative splicing event
Introduction
Mapping-first approach
2

Assembly-first and Mapping first approaches
adapted from Martin et Wang, Nat Rev Genet 2011
RNA-seq reads
Assembly-first approach
De-novo assembly
Align readsto the
genome
Aligncontigs to
the genome
Alternative splicing event
Introduction
Mapping-first approach
2
Local methods :- MISO- DEXSeq- MATS
Global methods :- Cufflinks- String-Tie- Flip-Flop- Scripture
Local methods :- KisSplice
Global methods :- Trinity- Trans-ABySS
- OASES

3
How much the predictions of these two approaches overlap ?
Introduction
INTERSECTION
Mapping-first
Assembly-first
Identify pros and cons of assembly-first and mapping-first methods

à Comparison done on alternative skipped exon (ASE) events only
Introduction
INTERSECTION
Mapping-first
Assembly-first
Identify pros and cons of assembly-first and mapping-first methods
How much the predictions of these two approaches overlap ?
3

à Comparison done on alternative skipped exon (ASE) events only
à Public dataset (ENCODE) from neuroblastoma SK-N-SH cell line with or without retinoic acid (RA) treatment
How much the predictions of these two approaches overlap ?
Sk-n-sh cell lineSK-N-SH
RA treatmentduring 2 days
Differenciated Sk-n-sh cell lineSK-N-SH RA
Introduction
INTERSECTION
Mapping-first
Assembly-first
Identify pros and cons of assembly-first and mapping-first methods
3

FasterDB RNAseq pipelineMethods 4
Mapped reads
Reads
Mapping(TopHat2)
A BS

FasterDB RNAseq pipelineMethods
Mapped reads
Splicing event
Reads
Mapping(TopHat2)
Identification and annotation of splicing events
A BS
A BS
4

FasterDB RNAseq pipelineMethods
Mapped reads
Splicing event
Reads
Mapping(TopHat2)
Identification and annotation of splicing events
A BS
A BSA BS
150
10 10
Quantification
Quantified event
4

FasterDB RNAseq pipelineMethods
Mapped reads
Splicing event
Significant event
Reads
Mapping(TopHat2)
Identification and annotation of splicing events
A BS
A BS
A BS
150 / 50
10 / 100
Condition 1 Condition 2
10 / 100
A BS
150
10 10
Quantification
Differential analysis (KissDE)
Quantified event
4

FasterDB RNAseq pipelineMethods
Mapped reads
Splicing event
Significant event
Reads
Mapping(TopHat2)
Identification and annotation of splicing events
A BS
A BS
A BS
150 / 50
10 / 100
Condition 1 Condition 2
10 / 100
A BS
150
10 10
Quantification
Differential analysis (KissDE)
Quantified event
Condition 1
Ψ1 = 10
10 + 150= 6%
Condition 2
Ψ2 = 100
100 + 50= 67%
ΔΨ = Ψ2 - Ψ1 = 61 %
4

Differential analysis with KissDEl Count regression with negative binomial distribution l Generalized linear model (GLM)
Methods 5
mean gene expression
contribution of variant i
interaction termcontribution
of condition j
Lopez-Maestre, NAR, 2016
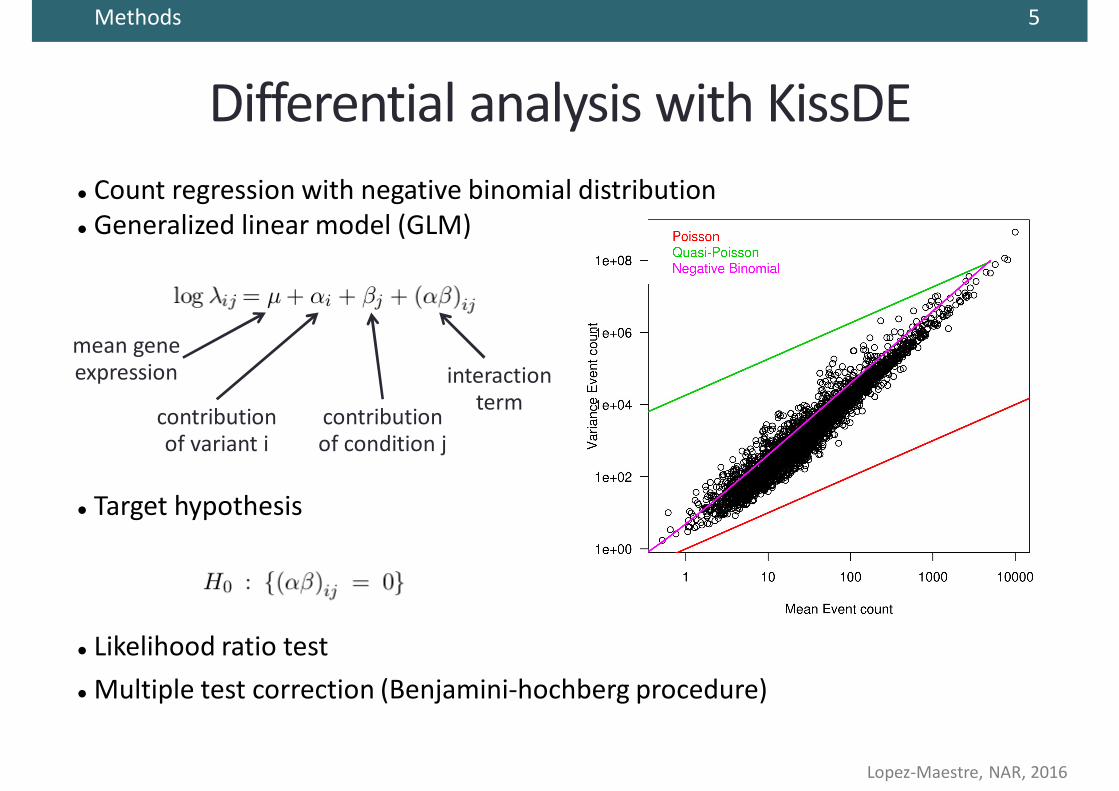
Differential analysis with KissDEl Count regression with negative binomial distribution l Generalized linear model (GLM)
l Target hypothesis
l Likelihood ratio test l Multiple test correction (Benjamini-hochberg procedure)
Methods 5
mean gene expression
contribution of variant i
interaction termcontribution
of condition j
Lopez-Maestre, NAR, 2016

Differential analysis with KissDEl Count regression with negative binomial distribution l Generalized linear model (GLM)
l Target hypothesis
l Likelihood ratio test l Multiple test correction (Benjamini-hochberg procedure)l Significant variants : P-value adjusted < 0,05 et ΔΨ ≥ 10%
Methods 5
mean gene expression
contribution of variant i
interaction termcontribution
of condition j
Lopez-Maestre, NAR, 2016

KisSplice pipelineMethods 6
Assembly, events identification and quantification (KisSplice)
Bubble in thede Bruijn Graph
Reads
http://kissplice.prabi.fr/

Assembly with KisSplice7
ATTCAATGGTAGCTATCTAT
AGTTGTATTCATAGCTATCTGTATTCATAGCTATCTATTA
CAATGGTAGCTATCTATTACTTCATAGCTATCTATTACCA
TTGTATTCAATGGTAGCTAT
Gene structure and sequence : …GTATTCA TAGCTAT…ATGG
Methods

7
ATTCAATGGTAGCTATCTAT
AGTTGTATTCATAGCTATCTGTATTCATAGCTATCTATTA
CAATGGTAGCTATCTATTACTTCATAGCTATCTATTACCA
TTGTATTCAATGGTAGCTAT
…GTATTCA TAGCTAT…ATGGGene structure and sequence :
Methods
Assembly with KisSplice

7
ATTCAATGGTAGCTATCTATATTC
TTCATCAA
CAAT...
GTATTCATAGCTATCTATTAGTAT
TATTATTC
TTCA...
List all k-mers for a chosen value of k
…GTATTCA TAGCTAT…ATGG
ATTCAATGGTAGCTATCTAT
AGTTGTATTCATAGCTATCTGTATTCATAGCTATCTATTA
CAATGGTAGCTATCTATTACTTCATAGCTATCTATTACCA
TTGTATTCAATGGTAGCTAT
Methods
Gene structure and sequence :
Assembly with KisSplice

7
Construct the de Bruijn graphfor that set of k-mers
…GTATTCA TAGCTAT…ATGG
ATTC TTCA AGCT
TCAT CATA ATAG
TAGC
TCAA CAAT AATG ATGG TGGT GGTA GTAG
TATTGTAT GCTA CTAT
Methods
Gene structure and sequence :
ATTCAATGGTAGCTATCTAT
AGTTGTATTCATAGCTATCTGTATTCATAGCTATCTATTA
CAATGGTAGCTATCTATTACTTCATAGCTATCTATTACCA
TTGTATTCAATGGTAGCTAT
ATTCAATGGTAGCTATCTATATTC
TTCATCAA
CAAT...
GTATTCATAGCTATCTATTAGTAT
TATTATTC
TTCA...
List all k-mers for a chosen value of k
Assembly with KisSplice

ATTC TTCA AGCT
TCAT CATA ATAG
TAGC
TCAA CAAT AATG ATGG TGGT GGTA GTAG
TATTGTAT GCTA CTAT
7
…GTATTCA TAGCTAT…ATGG
Methods
Gene structure and sequence :
Construct the de Bruijn graphfor that set of k-mers
ATTCAATGGTAGCTATCTAT
AGTTGTATTCATAGCTATCTGTATTCATAGCTATCTATTA
CAATGGTAGCTATCTATTACTTCATAGCTATCTATTACCA
TTGTATTCAATGGTAGCTAT
ATTCAATGGTAGCTATCTATATTC
TTCATCAA
CAAT...
GTATTCATAGCTATCTATTAGTAT
TATTATTC
TTCA...
List all k-mers for a chosen value of k
Assembly with KisSplice

7
ATTC TTCA AGCT
TCAT CATA ATAG
TAGC
TCAA CAAT AATG ATGG TGGT GGTA GTAG
TATTGTAT GCTA CTAT
…GTATTCA TAGCTAT…ATGG
Methods
Gene structure and sequence :
Construct the de Bruijn graphfor that set of k-mers
ATTCAATGGTAGCTATCTAT
AGTTGTATTCATAGCTATCTGTATTCATAGCTATCTATTA
CAATGGTAGCTATCTATTACTTCATAGCTATCTATTACCA
TTGTATTCAATGGTAGCTAT
ATTCAATGGTAGCTATCTATATTC
TTCATCAA
CAAT...
GTATTCATAGCTATCTATTAGTAT
TATTATTC
TTCA...
List all k-mers for a chosen value of k
Assembly with KisSplice

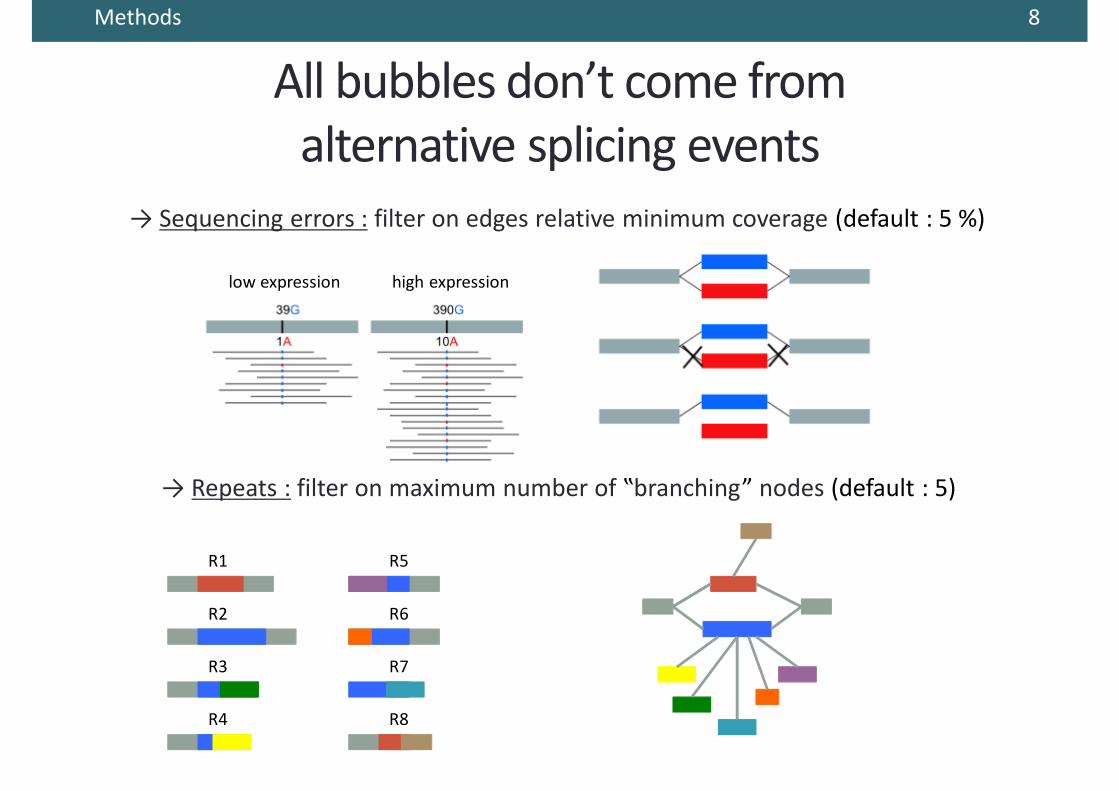
All bubbles don’t come fromalternative splicing events
8
→ Sequencing errors : filter on edges relative minimum coverage (default : 5 %)
low expression high expression
Methods

8
low expression high expression
→ Repeats : filter on maximum number of ‟branching” nodes (default : 5)
R1
R2
Methods
→ Sequencing errors : filter on edges relative minimum coverage (default : 5 %)
All bubbles don’t come fromalternative splicing events
8
R1
R2
R4
R3
R5
R6
R7
R8
Methods
→ Sequencing errors : filter on edges relative minimum coverage (default : 5 %)
→ Repeats : filter on maximum number of ‟branching” nodes (default : 5)
All bubbles don’t come fromalternative splicing events
low expression high expression

KisSplice pipelineMethods 9
Assembly, events identification and quantification (KisSplice)
Bubble in thede Bruijn Graph
Reads
A BS
Mapping (STAR)
Mapped event
http://kissplice.prabi.fr/

KisSplice pipelineMethods
Assembly, events identification and quantification (KisSplice)
Bubble in thede Bruijn Graph
Reads
A BS
Mapping (STAR)
Mapped event A BS
150
10 10
Annotated and quantified event
Event annotation (Kiss2RefGenome)
http://kissplice.prabi.fr/
9

KisSplice2RefGenomeMethods 10
Exonskipping
Number ofalignment
blocks
3
2
SS SS SS SS

KisSplice2RefGenomeMethods 10
Exonskipping
Number ofalignment
blocks
3
2
SS SS SS SS
SS SS SS
Alternativedonor
2
2
SS SS SS
Alternativeacceptor
2
2
Intronretention
1
2
SS SS
> threshold
Multipleexon skipping
>3
2
Number ofalignment
blocks
SS SS SS SSSS SS
Deletion1
2≤ threshold
Insertion2
1

KisSplice pipelineMethods
Assembly, events identification and quantification (KisSplice)
Bubble in thede Bruijn Graph
Reads
A BS
Mapping (STAR)
Mapped event
Significant eventA BS
150 / 50
10 / 100
Condition 1 Condition 2
10 / 100
A BS
150
10 10
Differential analysis (KissDE)
Annotated and quantified event
Event annotation (Kiss2RefGenome)
Condition 1
Ψ1 = 10
10 + 150= 6%
Condition 2
Ψ2 = 100
100 + 50= 67%
ΔΨ = Ψ2 - Ψ1 = 61 %
http://kissplice.prabi.fr/
11

12
Compared pipelines
Methods
http://kissplice.prabi.fr/
Strength of this comparison :
- Similar rules for annotation and quantification
- Same statistical package to carry out the differential analysis
Comparison done at 2 levels:
- Annotation - Differential analysis

13
9 91830 577 4 676
Results
KisSpliceAssembly-first
approach
FaRLineMapping-first
approach
Comparison at the annotation level

Mapping-first approach finds manyunfrequent variants
expr
essio
n of
the
min
oriso
form
Results
FaRLineonly
KisSpliceonly
common
KisSpliceAssembly-first
approach
FaRLineMapping-first
approach
10
1000
FaRLine only Common KisSplice only
9 91830 577 4 676
13

●●
●
●
●
●
●
●
●
●
●●
●
●
●
●
●
●
●
●
●
●●
●
●
●●
●
●
●●
●
●●●
●
●
●
●
●●
●
●
●
●
●
●
●●
●
●●●
●
●
●●●
●●●
●
●
●
●
●
●
●
●
●
●
●
●
●●
●
●
●●
●
●
●
●
●
●
●
●
●
●
●
●
●
●
●
●
●
●
●
●●●
●●
●●
●
●●
●
●
●●
●
●●●●●●●●●
●●●●●●
●●
●
●●●
●●
●
●
●
●●●
●
●●●
●
●
●●
●
●●
●●●●●●●●
●
●
●●
●●●●●
●●●●●●●●●
●
●●
●
●
●
●●●●
●
●●●●
●●●●●
●●
●
●
●
●
●
●
●●
●
●●●●●●●●●●
●
●●●●
●●
●●●
●
●●
●●
●
●
●
●
●●
●●●
●
●●●
10
1000
FaRLine only Common KisSplice onlyFaRLineonly
KisSpliceonly
common
expr
essio
n of
the
min
oriso
form
The overlap between methods increases whenunfrequent variants are filtered out
Results
KisSpliceAssembly-first
approach
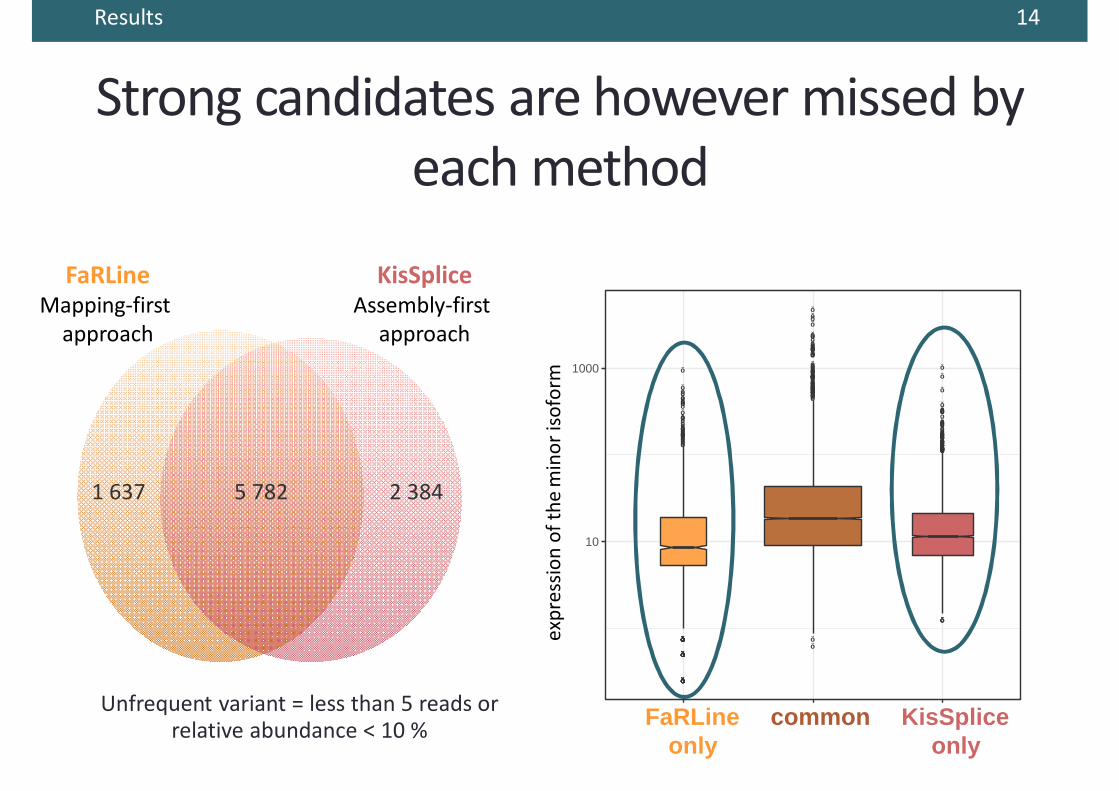
5 7821 637 2 384
FaRLineMapping-first
approach
Unfrequent variant = less than 5 reads orrelative abundance < 10 %
14
●●
●
●
●
●
●
●
●
●
●●
●
●
●
●
●
●
●
●
●
●●
●
●
●●
●
●
●●
●
●●●
●
●
●
●
●●
●
●
●
●
●
●
●●
●
●●●
●
●
●●●
●●●
●
●
●
●
●
●
●
●
●
●
●
●
●●
●
●
●●
●
●
●
●
●
●
●
●
●
●
●
●
●
●
●
●
●
●
●
●●●
●●
●●
●
●●
●
●
●●
●
●●●●●●●●●
●●●●●●
●●
●
●●●
●●
●
●
●
●●●
●
●●●
●
●
●●
●
●●
●●●●●●●●
●
●
●●
●●●●●
●●●●●●●●●
●
●●
●
●
●
●●●●
●
●●●●
●●●●●
●●
●
●
●
●
●
●
●●
●
●●●●●●●●●●
●
●●●●
●●
●●●
●
●●
●●
●
●
●
●
●●
●●●
●
●●●
10
1000
FaRLine only Common KisSplice onlyFaRLineonly
KisSpliceonly
common
expr
essio
n of
the
min
oriso
form
Strong candidates are however missed by each method
Results
KisSpliceAssembly-first
approach
FaRLineMapping-first
approach
Unfrequent variant = less than 5 reads orrelative abundance < 10 %
14
5 7821 637 2 384

Some events are systematically missed by one approach
Results
KisSpliceAssembly-first
approach
FaRLineMapping-first
approach
Repeats
Complexevents
Not annotated
Paralogs 65
1 620 338
762
15

Results
Events found only by KisSplice16
E8’
97
29 48
HIRA
→ New event
E8 E9E8’E8 E9
SK-N-SH RA
ψ = 0,28

Results
Events found only by KisSplice16
E8’
97
29 48
HIRA
→ New event
E8 E9E8’E8 E9
SK-N-SH RA
ψ = 0,28
- new alternative exon- new flanking exon- new association of exons

Results 17
Reference annotation
Incomplete annotation :exon not present in the annotation
Rich annotation :too many exons annotated
Annotations
Event

Results 17
Reference annotation
Rich annotation :too many exons annotated
Annotations
Event
How to choose the flanking exons ?
- the closest exons in the annotation- the most common flanking exons in the annotation (MISO)- all the possible flanking exons present in the annotation- all the possible flanking exons defined by the reads in the
RNAseq samples analyzed
Incomplete annotation :exon not present in the annotation

Results
Events found only by KisSplice17
E8’
97
29 48
HIRA
→ New event
E8 E9E8’E8 E9
SK-N-SH RA
ψ = 0,28
- new alternative exon- new flanking exon- new association of exons

RASA4 and RASA4B
→ Recent paralogs
Results
Events found only by KisSplice
168
329 412E18/E17
E17 E20E18
E17 E20
SK-N-SHψ = 0,69
18
E8’
97
29 48
HIRA
→ New event
E8 E9E8’E8 E9
SK-N-SH RA
ψ = 0,28
- new alternative exon- new flanking exon- new association of exons

Results
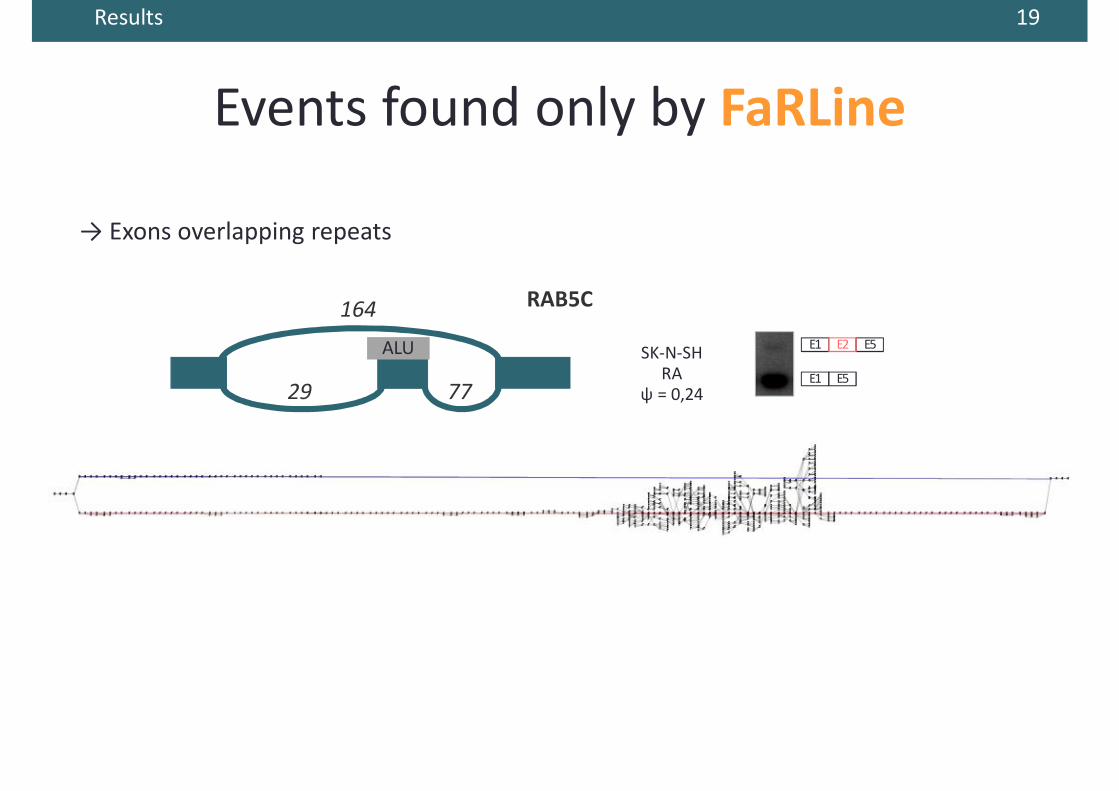
Events found only by FaRLine
→ Exons overlapping repeats
RAB5C164
29 77
ALU E1 E5E2
E1 E5
SK-N-SH RA
ψ = 0,24
19
Results
Events found only by FaRLine
→ Exons overlapping repeats
RAB5C164
29 77
ALU E1 E5E2
E1 E5
SK-N-SH RA
ψ = 0,24
19

Results
Events found only by FaRLine
→ Exons overlapping repeats
RAB5C164
29 77
ALU E1 E5E2
E1 E5
SK-N-SH RA
ψ = 0,24
19
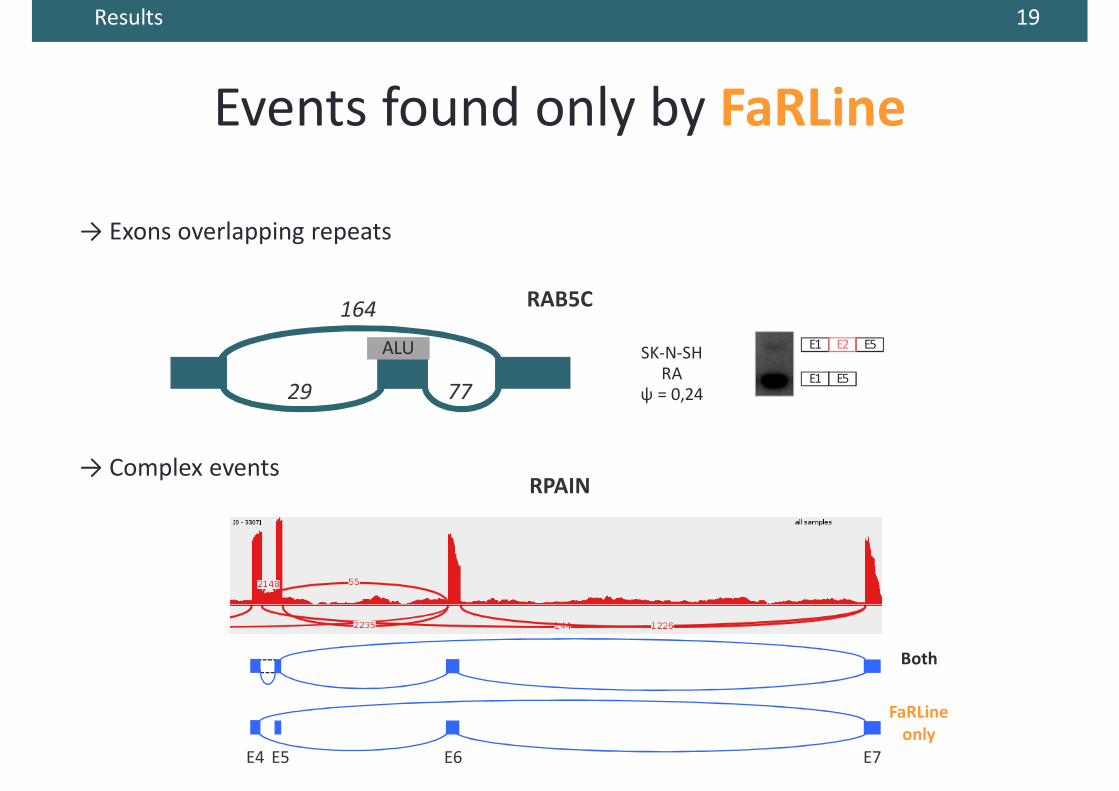
Results
RAB5C
Events found only by FaRLine
164
29 77
ALU E1 E5E2
E1 E5
SK-N-SH RA
ψ = 0,24
→ Complex eventsRPAIN
Both
FaRLineonly
E4 E5 E6 E7
19
→ Exons overlapping repeats
Results
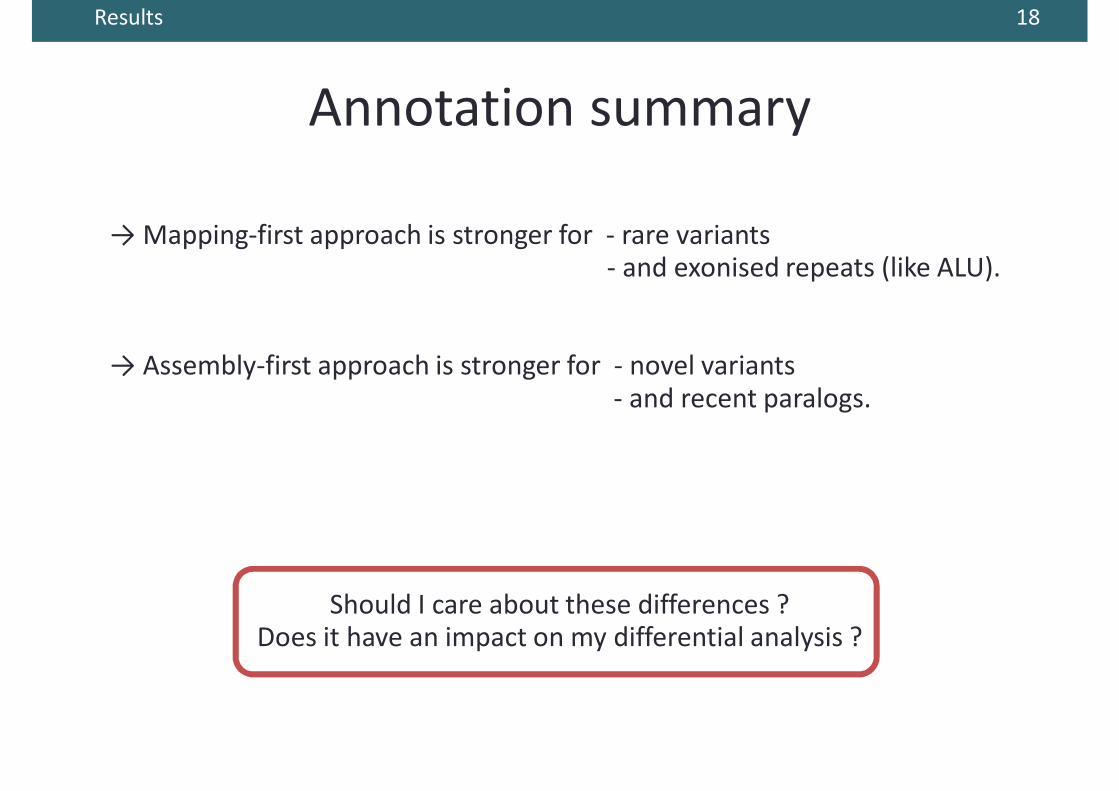
Annotation summary
18
→ Mapping-first approach is stronger for - rare variants - and exonised repeats (like ALU).
→ Assembly-first approach is stronger for - novel variants
- and recent paralogs.
Should I care about these differences ? Does it have an impact on my differential analysis ?

Results
Comparison after differential analysis
FaRLineMapping-first
approach
KisSpliceAssembly-first
approach
19
587287 522

Results
Comparison after differential analysis
FaRLineMapping-first
approach
KisSpliceAssembly-first
approach
ΔΨ (K
isSpl
ice)
ΔΨ (FaRLine)
y = −0.0061 + 0.99 ⋅ x , r2 = 0.944
−0.8
−0.4
0.0
0.4
−0.8 −0.4 0.0 0.4∆Ψ for the mapping−first method
19
587287 522
Complex events

Results
Comparison after differential analysis
FaRLineMapping-first
approach
KisSpliceAssembly-first
approach
ΔΨ (K
isSpl
ice)
ΔΨ (FaRLine)
y = −0.0061 + 0.99 ⋅ x , r2 = 0.944
−0.8
−0.4
0.0
0.4
−0.8 −0.4 0.0 0.4∆Ψ for the mapping−first method
19
587226 25261 270
Inherited fromthe annotation
Differences due to complex
events
Inherited fromthe annotation
Complex events
Results
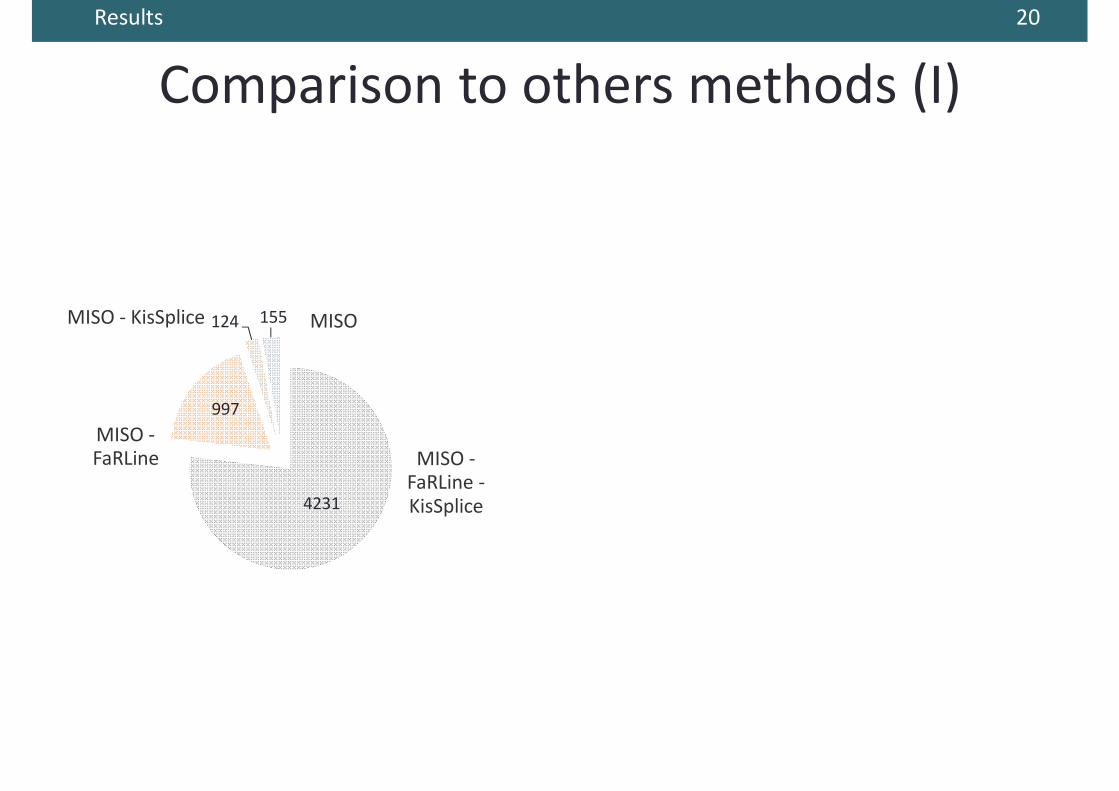
Comparison to others methods (I)
4231
997
124 155
MISO -FaRLine -KisSplice
MISO -FaRLine
MISOMISO - KisSplice
20

Results
Comparison to others methods (I)20
5 2282 191 279
FaRLine MISO
4231
997
124 155
MISO -FaRLine -KisSplice
MISO -FaRLine
MISOMISO - KisSplice

Results
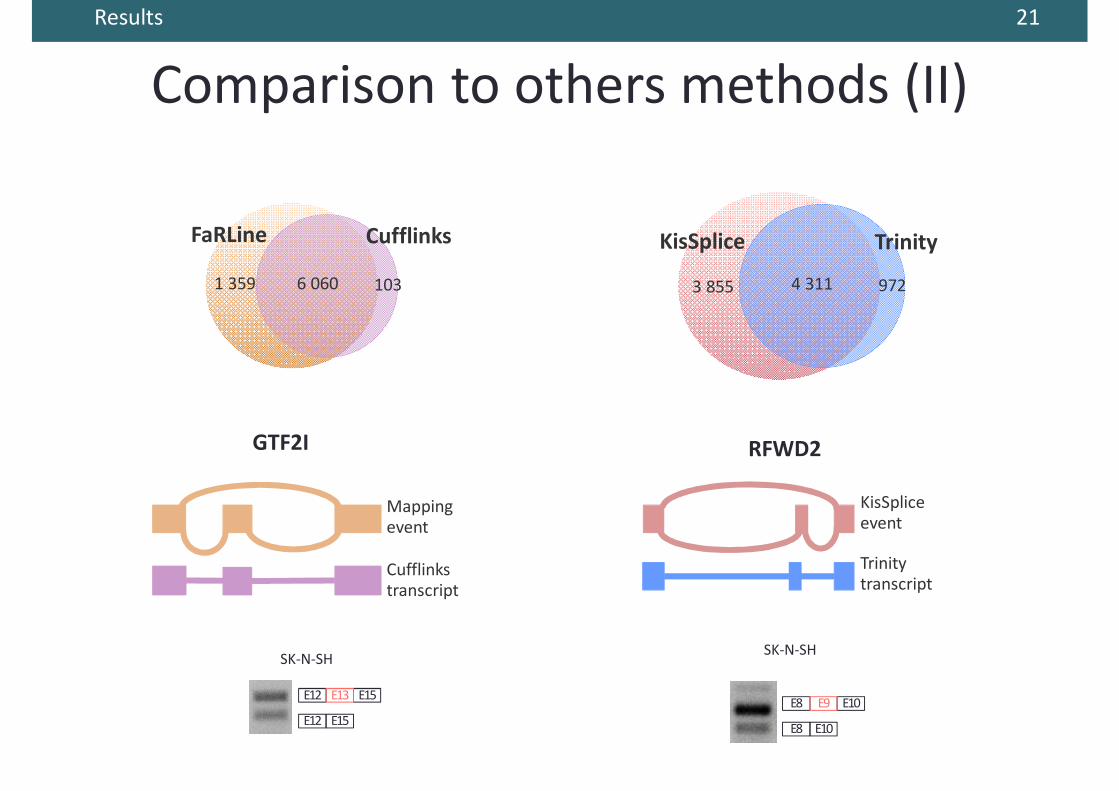
Comparison to others methods (II)
FaRLine
1 359 1036 060
Cufflinks
Mappingevent
Cufflinkstranscript
GTF2I
SK-N-SH
E12 E15E13
E12 E15
21
Results
Comparison to others methods (II)
KisSplice Trinity
3 855 9724 311
FaRLine
1 359 1036 060
Cufflinks
Mappingevent
Cufflinkstranscript
GTF2I
SK-N-SH
E12 E15E13
E12 E15
Trinitytranscript
KisSpliceevent
RFWD2
SK-N-SH
E8 E10E9
E8 E10
21

ConclusionAnnotating alternative splicing with a single approach leads to
missing a large number of candidates.These candidates cannot be neglected, since many of them are
differentially regulated across conditions.
Conclusion & perspectives 22

ConclusionAnnotating alternative splicing with a single approach leads to
missing a large number of candidates.These candidates cannot be neglected, since many of them are
differentially regulated across conditions.
We advocate for the use of a combination of both mapping-first and assembly-first approaches for annotation and differential
analysis of alternative splicing from RNA-seq data.
Conclusion & perspectives
Mapping-first
Assembly-first
UNION INTERSECTION
Mapping-first
Assembly-first
22
http://kissplice.prabi.fr/sknsh/http://biorxiv.org/content/early/2016/09/12/074807
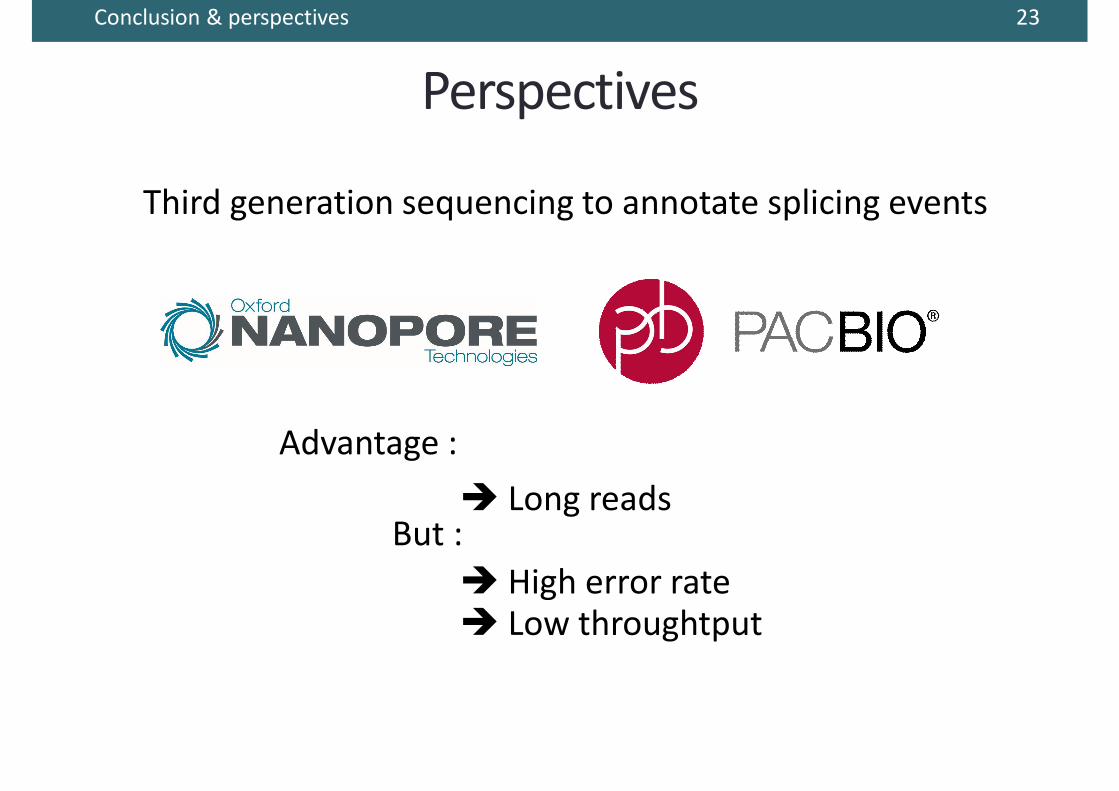
Perspectives
Third generation sequencing to annotate splicing events
Conclusion & perspectives 23
è Long reads
è High error rateè Low throughtput
Advantage :
But :

AcknowledgmentsVincent LacroixLeandro Lima
Emilie ChautardCamille Marchet
Gustavo SacomotoDidier Auboeuf Cyril Bourgeois Amandine Rey
Marie-Pierre LambertLouis DulaurierSophie Terrone
Jean-Baptiste Claude

Thank you for your attention !

Comparison all vs all
KisSplice
FaRLine
MISO
CufflinksTrinity

Readmapping(TopHat)
Eventidentification & annotation
QuantificationDifferential
analysis(KissDE)
Knownannotations
New annotations
AnnotatedES event
Exon 1 Exon 2 Exon 3Intron 1 Intron 2
Exon 1 Exon 3Intron 1 Intron 2Exon 2
Junctionreads
2 reads 1 read
2 reads
2 reads
FasterDB RNAseq pipeline
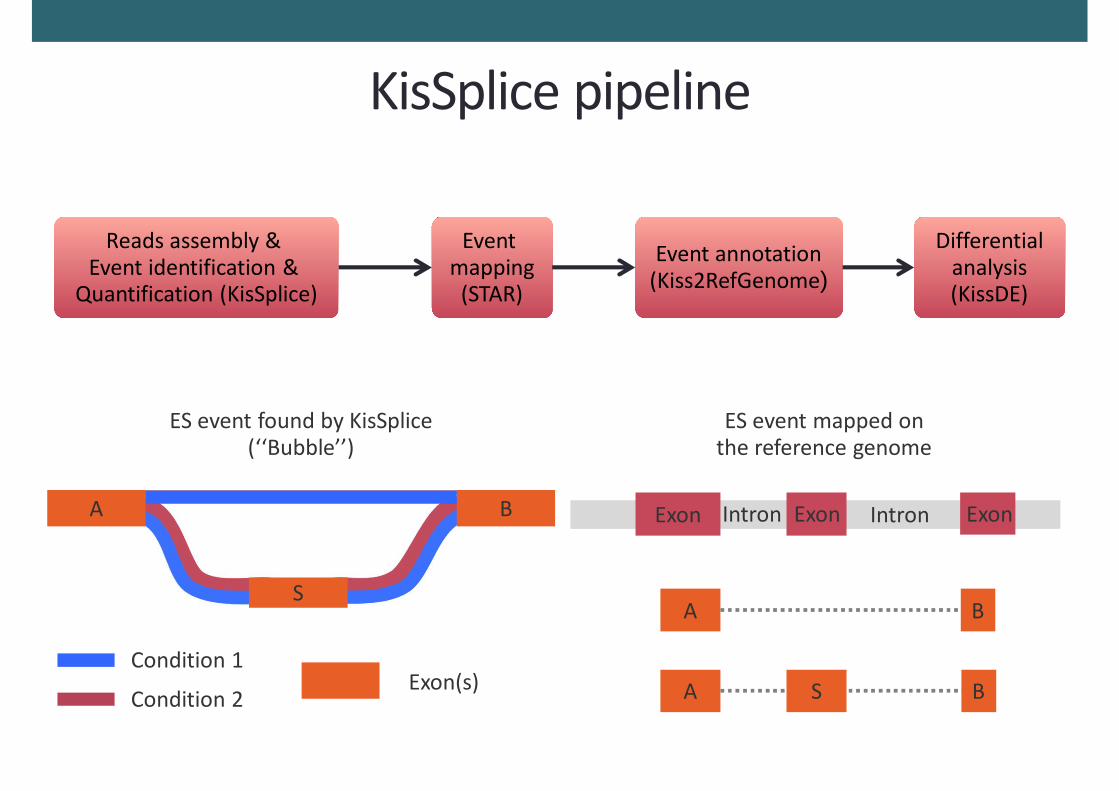
KisSplice pipeline
Reads assembly & Event identification &
Quantification (KisSplice)
Event annotation(Kiss2RefGenome)
Differentialanalysis(KissDE)
Event mapping
(STAR)
ES event found by KisSplice(‘‘Bubble’’)
BA
S
Condition 1
Condition 2Exon(s)
ES event mapped onthe reference genome
Exon Intron
A
A S
Intron Exon Exon
B
B

PSI (Ψ) : Percent Spliced In
ΔΨ = Ψ1 - Ψ2
Ψ1 =inclusion1 + exclusion1
inclusion1 Ψ2 =inclusion2 + exclusion2
inclusion2
• Quantification : exon skipping example
A S B A S B
AS1 + SB1inclusion1 = 2
AS2 + SB2inclusion2 = 2
Condition 1 Condition 2

Event containing ALU elements
àMapping-first using a reference transcriptome
à Assembly-first
àMapping-first without using a reference transcriptome
Number of skipping of ALU exon annotated
TopHat with option --transcriptome-index
KisSplice
TopHat run default option
àMapping-first using a reference transcriptome
à Assembly-first
àMapping-first without using a reference transcriptome
TopHat with option --transcriptome-index

Results 18
Complex events

Results 18
Complex events