annotation of the goat genome using next generation … · 2017-08-28 · sion with an intragenic...
TRANSCRIPT
Mobuchon et al. BMC Genomics (2015) 16:285 DOI 10.1186/s12864-015-1471-y
RESEARCH ARTICLE Open Access
Annotation of the goat genome using nextgeneration sequencing of microRNA expressedby the lactating mammary gland: comparison ofthree approachesLenha Mobuchon1,2,3, Sylvain Marthey1, Mekki Boussaha1, Sandrine Le Guillou1, Christine Leroux2,3
and Fabienne Le Provost1*
Abstract
Background: MicroRNAs (miRNA) are small endogenous non-coding RNA involved in the post-transcriptional regulationof specific mRNA targets. The first whole goat genome sequence became available in 2013, with few annotations.Our goal was to establish a list of the miRNA expressed in the mammary gland of lactating goats, thus enablingimplementation of the goat miRNA repertoire and considerably enriching annotation of the goat genome.
Results: Here, we performed high throughput RNA sequencing on 10 lactating goat mammary glands. Thebioinformatic detection of miRNA was carried out using miRDeep2 software. Three different methods were usedto predict, quantify and annotate the sequenced reads. The first was a de novo approach based on the predictionof miRNA from the goat genome only. The second approach used bovine miRNA as an external reference whereasthe last one used recently available goat miRNA. The three methods enabled the prediction and annotation ofhundreds of miRNA, more than 95% were commonly identified. Using bovine miRNA, 1,178 distinct miRNA weredetected, together with the annotation of 88 miRNA for which corresponding precursors could not be retrieved inthe goat genome, and which were not detected using the de novo approach or with the use of goat miRNA. Eachchromosomal coordinate of the precursors determined here were generated and depicted on a referencelocalisation map. Forty six goat miRNA clusters were also reported. The study revealed 263 precursors located ingoat protein-coding genes, amongst which the location of 43 precursors was conserved between human, mouseand bovine, revealing potential new gene regulations in the goat mammary gland. Using the publicly availablecattle QTL database, and cow precursors conserved in the goat and expressed in lactating mammary gland, 114precursors were located within known QTL regions for milk production and composition.
Conclusions: The results reported here represent the first major identification study on miRNA expressed in thegoat mammary gland at peak lactation. The elements generated by this study will now be used as references todecipher the regulation of miRNA expression in the goat mammary gland and to clarify their involvement in thelactation process.
Keywords: miRNA, Goat, Mammary gland, Lactation, Deep sequencing, Chromosomal location, Host genes
* Correspondence: [email protected], UMR1313 Génétique Animale et Biologie Intégrative, F-78350Jouy-en-Josas, FranceFull list of author information is available at the end of the article
© 2015 Mobuchon et al.; licensee BioMed Central. This is an Open Access article distributed under the terms of the CreativeCommons Attribution License (http://creativecommons.org/licenses/by/4.0), which permits unrestricted use, distribution, andreproduction in any medium, provided the original work is properly credited. The Creative Commons Public DomainDedication waiver (http://creativecommons.org/publicdomain/zero/1.0/) applies to the data made available in this article,unless otherwise stated.
Mobuchon et al. BMC Genomics (2015) 16:285 Page 2 of 17
BackgroundMicroRNAs (miRNA) are small non-coding RNA thatregulate targeted mRNA expression at a post-transcriptionallevel [1,2]. It is estimated that miRNA genes may accountfor 2-5% of all mammalian genes and regulate the expres-sion of up to 60% of protein-coding genes [3,4]. miRNA playa major role in a broad range of biological processes. Theyare encoded in the genome and transcribed in a polII-dependent manner [5,6] as long transcripts from which longhairpin precursors are generated (pre-miRNA, ~70 nt) andcleaved out by the microprocessor Drosha endonucleaseand cofactors [7]. The pre-miRNA are then exported to thecytosol where they are cleaved by the Dicer protein, re-leasing the loop and a duplex consisting of the mature -5pand -3p miRNA [7,8]. The miRNA are subsequently in-corporated in the miRNA-induced silencing complex(miRISC) so that they can act on their targets.Within a genome, a particular locus may carry several
miRNA genes in what is called a cluster, defined as havinga distance of less than 10 kb between each miRNA [9].The expression of clustered miRNA is highly correlated,as they are often co-expressed from a single promoter as asingle polycistronic transcript with neighbouring miRNA[10,11]. An internal coordination of clustered miRNAto regulate downstream biological networks has beensuggested [12].Approximately half of vertebrate miRNA are located in
intergenic regions, referred to as intergenic miRNA [13,14].The other half are intragenic, localized in introns and exons(about 40% and 10%, respectively) of protein-coding tran-scription units [14]. Intragenic miRNA tend to be co-expressed with their host genes [13]. Host genes and theirresident miRNA have been considered to have synergisticeffects [15,16]. Indeed, genes highly correlated in expres-sion with an intragenic miRNA gene have been found tobe more likely predicted as miRNA targets [17].In the goat, the first publicly-available whole genome
sequence (CHIR_1.0) was released in 2013 [18]. It con-sists of 30 pseudo-chromosomes (2.52 Gb) and an artifi-cial chromosome designated as U (138 Mb) [18]. Thehigh level of colinearity between goat and cattle chromo-somes enabled assembly of the goat genome using thecattle genome as a reference. The annotation of potentialgoat protein-coding genes was performed using thehomology-based annotation of proteins from cattle andhumans [18].Deep whole transcriptome sequencing, also known as
RNA sequencing (RNA-seq), coupled with the develop-ment of several computational approaches, has offered nu-merous opportunities to discover and study the occurrenceof miRNA across the genome [19,20]. Moreover, the avail-ability of whole genome sequences has enabled the rapidannotation of miRNA. In the goat, some studies have beenundertaken to determine miRNA in different tissues using
this technology. The miRNA thus detected were firstly an-notated using the sequences available in miRBase. Forexample, cattle and sheep miRNA from miRBase wereused to annotate several miRNA in the skin of cash-mere goats, and in the testis and mammary gland dur-ing both dry periods and at peak lactation [21-23]. Bothruminant and sheep genomes were also used to mapthe sequencing reads, as described by Ji et al. [19], whoidentified several miRNA in the goat mammary glandat early lactation. Furthermore, available Expressed Se-quences Tags (EST) for the goat, combined with miRNAfrom numerous species (sheep, cow, pig, dog and horse)enabled the characterisation of hundreds of miRNA in goatovaries and muscle [24,25]. Once the goat genome hadbeen released, it started to be used for miRNA identifica-tion. Dong et al. [18] also identified 487 miRNA in their as-sembly using predictions by the INFERNAL software [26]against the Rfam database. Among the 487 miRNA found,157 were located in 44 genomic clusters containing be-tween two and 46 miRNA. Comparing the miRNA se-quences from human, cattle, dog, chimpanzee, mouse andrat, they determined six goat-specific miRNA [18]. The goatgenome was also utilized for the mapping of sequencingreads from goat testis, urine and skeletal muscle, and anno-tation of the miRNA thus characterized was performedby sequence homology with sheep, cow or human miRNA[27,28]. Finally, in order to map sequencing reads to thegoat genome, miRDeep2 software combined with se-quences from miRBase were used to detect 205 knownand nine putative miRNA in goat hair follicles [29]. Al-though the goat genome has recently enabled the iden-tification of several known and putative miRNA indifferent goat tissues as described above, it is still neces-sary to implement the reference list for goat miRNA, par-ticularly in the lactating mammary gland, as much asdecipher the involvement of miRNA in lactation whichhas recently begun to be investigated in vitro or in otherspecies [30-33]. In the goat, a potential role for miR-103and miR-27a in the regulation of milk fat synthesis inmammary epithelial cells has been reported [34,35]. Des-pite these studies, the role of mammary miRNA is stillpoorly documented and greater knowledge of mammarygoat miRNA will enable elucidation of the functions ofmiRNA in this organ.Our increasing knowledge of the goat genome means
it is now relevant to determine associations of markeralleles with phenotypes of interest in this species thatare indicative of quantitative trait loci (QTL). In live-stock, the detection of QTL is a step towards identifyinggenes and causal polymorphisms for traits of importanceto agriculture and selection [36]. Most studies focusedon detecting QTL for milk production have been carriedout in cattle [37-40], and only preliminary studies havebeen performed in the goat [41], perhaps because of the

Mobuchon et al. BMC Genomics (2015) 16:285 Page 3 of 17
lack of genomic tools for this species. A clearer under-standing of miRNA and their localisation in the goat gen-ome may offer perspectives to decipher the complexity oftraits in dairy goats.The work presented was therefore intended to gen-
erate an overview of miRNA expressed in lactatinggoat mammary gland. The precise location of theirgenes in the goat genome was determined by compar-ing three approaches to predict and annotate the se-quencing reads. The localisation of miRNA precursorswas compared in human, mouse and cattle in order topredict the genomic localisation of goat miRNA whichmight suggest conserved regulation in this species.Their genomic repartition and conservation acrossthe 3 species mentioned above as well as their pos-ition relative to known bovine milk QTL, were inves-tigated. Our findings offer new data on goat miRNAand genome annotation that will enable further stud-ies in this species.
MethodsAnimals and tissue samplingAll animal manipulations were performed in strict ac-cordance with the guidelines of the Code for Methodsand Welfare Considerations in Behavioral Research withAnimals (Directive 86/609 EC) and the recommenda-tions of the CEMEAA (Ethics Committee for AnimalExperimentation in Auvergne). Every effort was made tominimize animal suffering. Ten peak-lactating Alpinegoats (48 ± 2 d post-partum), from the INRA Experi-mental Farm in Lusignan (France) were slaughtered, anddirectly after death, ~50 g of mammary gland were col-lected under sterile conditions from the secretory area con-taining lobulo-alveolar structures (acini). The samples werefrozen immediately in liquid nitrogen and stored at −80°Cuntil RNA extraction.
RNA isolationTotal RNA was extracted from ~150 mg mammary tissueusing TRIZol® Reagent (Life Technologies) and furtherpurified with the SV Total RNA Isolation system (Pro-mega) to eliminate any contaminating genomic DNA.RNA purity and concentration were estimated by spec-trophotometry (Nanodrop™, ND-1000) and using a 2100Bioanalyzer Instrument (Agilent). Samples with a RNAIntegrity Number (RIN) higher than 8, corresponding tohigh RNA quality, were used for the study.
Library preparation and sequencingLibrary preparation and sequencing was performed by theIGBMC Microarray and Sequencing Platform (Strasbourg,France). The TruSeqTM small RNA kit protocol (Illumina)was followed to generate small RNA libraries directlyfrom ~7 μg of total RNA, suitable for subsequent high
throughput sequencing. Briefly, during the first step, RNAadapters were ligated sequentially to each end of the RNA;firstly the 3′ RNA adapter (5′ TGGAATTCTCGGGTGCCAAGG 3′) which is specifically designed to target micro-RNAs and other small RNAs containing a 3′ hydroxylgroup resulting from enzymatic cleavage by Dicer or otherRNA processing enzymes, and then the 5′ RNA adapter(5′ GTTCAGAGTTCTACAGTCCGACGATC 3′). SmallRNA ligated with 3′ and 5′ RNA adapters were then re-verse transcribed and PCR amplified (30 sec at 98°C;[10 sec at 98°C, 30 sec at 60°C, 15 sec at 72°C] × 13 cycles;10 min at 72°C) to obtain cDNA. The final step was acryl-amide gel purification of the 140–150 nt amplified cDNA(corresponding to cDNA obtained from small RNA +120 nt from the adapters). The libraries were checked forquality and then quantified using the 2100 BioanalyzerInstrument (Agilent). Libraries were loaded in the flow-cell at an 8 pM concentration and clusters were generatedusing Cbot and sequenced on HiSeq 2500 (Illumina) assingle-end 50 base reads, according to the manufacturer’sinstructions. The quantity and quality of reads for eachlibrary are shown in Additional file 1: Table S1. RNA se-quencing data were deposited in the Gene ExpressionOmnibus (GEO): GSE61025.
Sequencing data processingAfter removing sequences which corresponded to thesequencing adapters, and filtering by size (17–28 nt),using Cutadapt [42] data analyses were processed usingmiRDeep2 software [43], as described by Le Guillouet al. [44] and performed on the bioinformatics platformGenotoul (http://bioinfo.genotoul.fr/). The cleaned se-quences were clustered into unique reads and thenmapped to the reference goat genome (CHIR_1.0, [18])using mapper.pl module. Putative miRNA and precur-sors were identified using the miRDeep2 core module,miRDeep2.pl (including reads corresponding to typicalproducts of miRNA biogenesis, stability of the putativepre-miRNA hairpin and homology to previously identi-fied miRNA). The miRDeep2 core algorithm needs touse known miRNA from the species under analysis, heldin a reference database such as miRBase [45]. As few goatmiRNA are reported in miRBase v21, three approacheswere used. Thus, the use of the 2 miRNA from the virusBK Polyomavirus (Bkv) (precursor: bkv-mir-B1, mature:bkv-miR-B1-5p and bkv-miR-B1-3p), the 793 bovinemiRNA (Bos taurus, bta), or the 436 goat miRNA frommiRBase v21 were compared. Three independent sets ofpotential precursors (from BK Polyomavirus, bovine andgoat) were created from the miRDeep2 prediction with amiRDeep2 score ≥0. Further, precursors from the BKPolyomavirus, bovine or goat containing known miRNAnot found in potential precursors were added to the sets.The same operation was then performed to create three
Mobuchon et al. BMC Genomics (2015) 16:285 Page 4 of 17
independent datasets containing putative miRNA and allknown miRNA from miRBase v21. The quantifier.plmiRDeep2 module was then used to map unique readsand new sets of miRNA on new sets of potential precur-sors. The quantification results produced by the quanti-fier.pl module were then filtered with a custom perlscript parse_miRDeep2_outputs.pl (https://mulcyber.-toulouse.inra.fr/projects/bioinfoutils/) to eliminate anyredundancy between known and putative miRNA.miRNA with at least ten read counts summing the tenlibraries were considered, thus putative miRNA can besubmitted to miRBase [46].
Quantitative RT-PCRNine miRNA were chosen for RT-qPCR validation; miR-29a-3p (TaqMan® ID 007600_mat, Applied Biosystems),miR-99a-5p (TaqMan® ID 006254_mat), miR-126-3p(TaqMan® ID 008451_mat), miR-140-3p (TaqMan® ID471823_mat), miR-222-3p (TaqMan® ID 000525), miR-223-3p (TaqMan® ID 002295), miR-204-5p (TaqMan® ID000508), miR-409-3p (TaqMan® ID 002332), miR-6119-5p(Custom TaqMan® small RNA Assay). Reverse transcrip-tion was achieved on 10 ng of total RNA using theTaqMan® MicroRNA Reverse Transcription (AppliedBiosystems, Foster City, CA, USA) kit following themanufacturer’s instructions. In the thermal cycler (Ste-pOne+, Applied Biosystems, Foster City, CA, USA), each15 μL RT reaction followed 30 min at 16°C, 30 min at 42°C, 5 min at 85°C. Then, 1.3 μL of miRNA-specific cDNAfrom the reaction were amplified using the TaqMan® SmallRNA Assays (Applied Biosystems, Foster City, CA, USA)following the manufacturer’s instructions. Amplificationwas performed at 95°C for 10 min, pursued by 40 cycles of95°C for 15 s and 60°C for 1 min. All miRNA levels werenormalized to the values of U6 snoRNA [47,48].
Screening for intragenic miRNA in the human, mouse,cattle and goat genomesThe chromosomal positions of miRNA in the human,mouse and cattle genomes were downloaded from miRBasev21 (http://mirbase.org/). Datasets for protein-coding geneswere downloaded from BioMart Ensembl release 78, usingthe latest version of the genome (GRch38 for human,GRCm38.p3 for mouse and UMD3.1 for cattle (http://www.ensembl.org/biomart)). The positions of mRNA andthe Coding Protein Sequence on the goat genome were ob-tained from Dong et al. [18]. Comparisons of the chromo-somal locations of miRNA and protein-coding genes wereperformed using the IntersectBed tool in BEDTools soft-ware [49] with options requiring the same strandednessand an overlap of 100% necessary to cross miRNA andgene coordinates.
Screening for miRNA in QTLAll Bovine QTL were downloaded from CattleQTLdb (Ani-malQTLdb release 22, http://www.animalgenome.org).QTL traits linked to milk lactose, fat and protein contentor yield and milk somatic cell scores, with a significanceequal to significant and/or a p-value <0.05 were extractedfrom the entire bovine QTL file. Screening for mammarymiRNA in the QTL was performed using IntersectBedwith the options used to compare the chromosomal loca-tion of miRNA and protein-coding genes.
Results and discussionComparison of strategies for miRNA sequenceidentificationNext generation sequencing (NGS) technologies coupledwith bioinformatic analysis offer a powerful method toanalyze miRNA gene expression which allows for boththe measurement of known miRNA and the identifica-tion of novel miRNA [50]. Unlike other technologies,they enable not only the discovery of novel miRNA butalso the capacity to detect weakly expressed miRNA.Here, we performed RNA-Seq on RNA isolated from
the mammary gland of lactating goats, using Illumina/Solexa NGS technologies. Bioinformatic analyses of se-quenced products were performed usingmiRDeep2 softwarewhich can identify known and putative miRNA with anaccuracy of 98.6-99.9%, as reported by Friedländer et al. [43].As in a previous study where the mammary glandmiRNomeof lactating cow was established [44], themiRDeep2 softwarewas used to determine the miRNome of lactating goat mam-mary gland. As required by the miRDeep2 algorithm, both alist of known miRNA and a whole genome sequence are ne-cessary for the species of interest in order to predict andquantify miRNA from the sequencing reads. During thisstudy, and using the whole goat genome that has recently be-come available [18], three strategies (Figure 1) were com-pared for the prediction and annotation of miRNA. The firststrategy was a de novo approach based on the use of BK Poly-omavirus, a species that is phylogenetically distant from goat,with very few known miRNA (1 precursor and its 2 miRNA)were available inmiRBase v21 and for which we checked thatcorresponding sequences could not be found in thegoat genome. Thus this strategy was unable to retrieveviral miRNA in the goat genome and only managed topredict potential precursor from it. The second strat-egy used bovine precursors from miRBase v21, becausebovine is a phylogenetically related species of the goatand has almost twice the number of goat miRNA. Fi-nally, the third strategy was based on the use of goatprecursors very recently available in miRBase v21.
Prediction of miRNAThe first step in the process was the prediction of pre-cursors from the location of mapped reads on the goat

Reads mapped on the goat genome
Potential precursors excised40,330
Potential precursors3,322
Potential precursors with a miRDeep2 score 0
and associated miRNA
Pred
iction
Potential precursors containing at least one miRNA from the reference
(with miRDeep2 score >-50)and associated miRNA
Qu
antificatio
n
and
ann
otatio
n
All miRNA from miRBase v21
De novoWith bovine
miRNA
2
1
miRDeep2.pl
793
Dataset
creation
miRDeep2 processing
quantifier.pl
Precursors of reference speciescontaining miRNA from
the reference not found in potential precursors
Bovine miRNA
Virus miRNA
1,0172,034
328656
489
35,828
1,3272,654
00
0
35,828
1,068 1,178
miRNA
use as input
software
precursor
filtering stepWith goatmiRNA
1,0672,134
278556
39
35,828
1,095
Goat miRNA
808
267
436
parse_miRDeep2_output.pl
Legend
Figure 1 Summary of the three approaches used to predict, quantify and annotate sequencing reads. Common processes and results areindicated in red for the prediction step and in blue for the quantification and annotation steps. Specific processes and results are indicated inpurple for the de novo approach, in orange and green for the approach using bovine and goat miRNA, respectively.
Mobuchon et al. BMC Genomics (2015) 16:285 Page 5 of 17
genome using miRDeep2 (Figure 1). The miRDeep2 corealgorithm scores each potential precursor excised fromthe goat genome principally for the combined compatibilityof energy stability, positions and frequencies of reads withthe Dicer processing signature [51]. The prediction resultsproduced by miRDeep2 revealed the same number of po-tential precursors (3,322) with the three strategies (Figure 1).As a result, external information did not influence eitherprecursor prediction or the associated scores.Precursors with a miRDeep2 score ≥0 were retained
as new potential precursors in this study. The three
strategies produced different numbers of potential precur-sors with a miRDeep2 score ≥0. Thus 1,327 potentialprecursors were identified using the de novo approach,while 1,017 and 1,067 potential precursors were pre-dicted using the bovine and goat miRNA-based strat-egy, respectively (Figure 1). These differences were dueto 328 and 278 potential precursors containing maturemiRNA known in bovine and goat respectively, and re-ferred to not as potential precursors but known precur-sors. Overall, we obtained 1,345 potential precursorsusing the bovine and goat approaches, of which 1,284
Mobuchon et al. BMC Genomics (2015) 16:285 Page 6 of 17
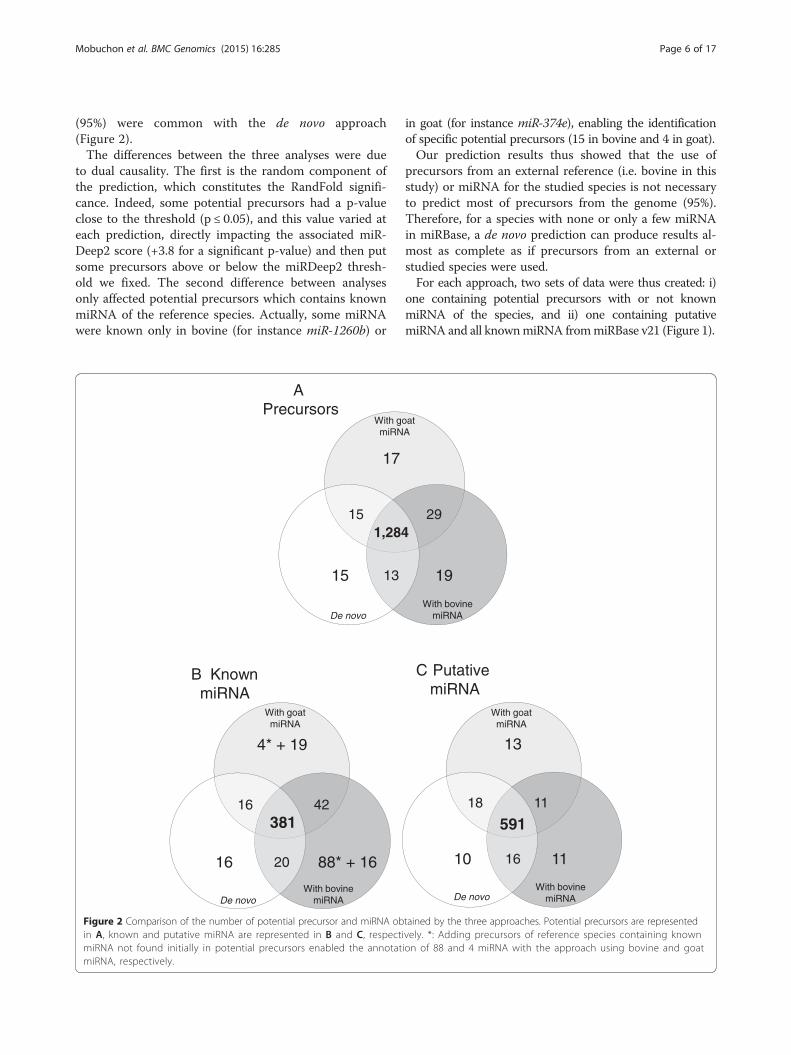
(95%) were common with the de novo approach(Figure 2).The differences between the three analyses were due
to dual causality. The first is the random component ofthe prediction, which constitutes the RandFold signifi-cance. Indeed, some potential precursors had a p-valueclose to the threshold (p ≤ 0.05), and this value varied ateach prediction, directly impacting the associated miR-Deep2 score (+3.8 for a significant p-value) and then putsome precursors above or below the miRDeep2 thresh-old we fixed. The second difference between analysesonly affected potential precursors which contains knownmiRNA of the reference species. Actually, some miRNAwere known only in bovine (for instance miR-1260b) or
381
88* + 16
4* + 19
16
42
20
16
De novo
With goatmiRNA
With bovinemiRNA
B KnownmiRNA
APrecursors
1,284
17
15 13
15
De novo
With gomiRN
Figure 2 Comparison of the number of potential precursor and miRNA obin A, known and putative miRNA are represented in B and C, respectimiRNA not found initially in potential precursors enabled the annotatmiRNA, respectively.
in goat (for instance miR-374e), enabling the identificationof specific potential precursors (15 in bovine and 4 in goat).Our prediction results thus showed that the use of
precursors from an external reference (i.e. bovine in thisstudy) or miRNA for the studied species is not necessaryto predict most of precursors from the genome (95%).Therefore, for a species with none or only a few miRNAin miRBase, a de novo prediction can produce results al-most as complete as if precursors from an external orstudied species were used.For each approach, two sets of data were thus created: i)
one containing potential precursors with or not knownmiRNA of the species, and ii) one containing putativemiRNA and all knownmiRNA frommiRBase v21 (Figure 1).
591
11
13
10
11
16
18
De novo
With goatmiRNA
With bovinemiRNA
19
29
atA
With bovinemiRNA
C PutativemiRNA
tained by the three approaches. Potential precursors are representedvely. *: Adding precursors of reference species containing knownion of 88 and 4 miRNA with the approach using bovine and goat

Mobuchon et al. BMC Genomics (2015) 16:285 Page 7 of 17
miRNA identification and quantificationUse of the quantifier.pl module and the custom scriptparse_miRDeep2_outputs.pl, as described by Le Guillouet al. [44], allowed us to map sequencing reads as wellas the set of data containing miRNA (putative andknown) on the data set containing potential precursors.Only precursors carrying miRNA with at least tencounts summing all libraries were retained reducing thenumbers of potential precursors to 913 in the de novoapproach, 924 with bovine and goat miRNA (Table 1,‘Filtered’). In addition, depending on the location ofreads relative to the position of known miRNA frommiRBase on the “potential precursors”, reads wereassigned to miRNA, and two miRNA (5p and 3p) wereretained for each precursor. This step enabled the quan-tification and annotation of 1,068, 1,178 and 1,095 dis-tinct miRNA using the de novo, bovine or goat miRNAapproaches, respectively; these included both known andputative miRNA which had not previously been describedin any species from miRBase v21. The quantifier.pl mod-ule from miRDeep2 provided secondary structures of pre-cursors containing known or putative miRNA and few
Table 1 Comparison of precursors’ annotation results using t
Potential precursors Reads mapped (%)*
Total
Filtered** :
miRNA -5p and -3p
−5p + −3p annotated
−5p annotated + −3p putative
−5p putative + −3p annotated
−5p + −3p putative
Only -5p
−5p annotated
−5p putative
Only -3p
−3p annotated
−3p putative
Known precursors Reads mapped (%)*
Total
Filtered**:
−5p + −3p known
Only -5p known
Only -3p known
−5p known + −3p annotated
−3p known + −5p annotated
Annotated miRNA correspond to miRNA annotated by homology (perfect match fumiRNA not yet described in any species. In bold, numbers correspond to the total o*Percentage of reads mapped on the set of potential precursors.**Only potential precursors with cumulative counts >10 have been retained.
examples are exposed in Additional file 2: Figure S1. Then,among the common miRNA obtained using the threemethods, 381 were known miRNA and 591 were putativemiRNA (Figure 2). As different precursors produce identi-cal miRNA, the number of miRNA annotated here wasnot the double of the number of precursors. This similarannotation of mature miRNA was not surprising regard-ing these miRNA because of the strong similarity betweensets of “potential precursors”. We also observed few puta-tive miRNA that were only found using one or other ofthe approaches, corresponding to potential precursorswith a random score ≥0 (Figure 2).In addition, using the bovine or goat miRNA method,
489 bovine or 39 goat precursors (Figure 1) were addedto the set of “potential precursors”, in which 138 and 25precursors (Table 1, category of ‘known precursors’) en-abled the supplementary quantification and annotationof 88 and 4 miRNA in bovine and goat approaches, re-spectively (Table 1, Figure 2). It appears that these miRNAcorresponded to precursors not detected as potential pre-cursors predicted by miRDeep2 at the prediction step.Therefore, the associated genome regions containing these
he three approaches
De novo Bovine Goat
75.1 74.9 74.9
1,327 1,017 1,067
913 924 924
305 299 305
172 172 172
20 20 20
14 13 14
99 94 99
298 303 305
53 59 59
245 244 243
310 322 317
60 67 66
250 255 251
0 2.9 2
1 808 267
0 138 25
0 4 8
0 55 8
0 49 8
0 17 0
0 13 1
ll length) with mature miRNA from miRBase v21. Putative miRNA correspond tof each subcategory.
Mobuchon et al. BMC Genomics (2015) 16:285 Page 8 of 17
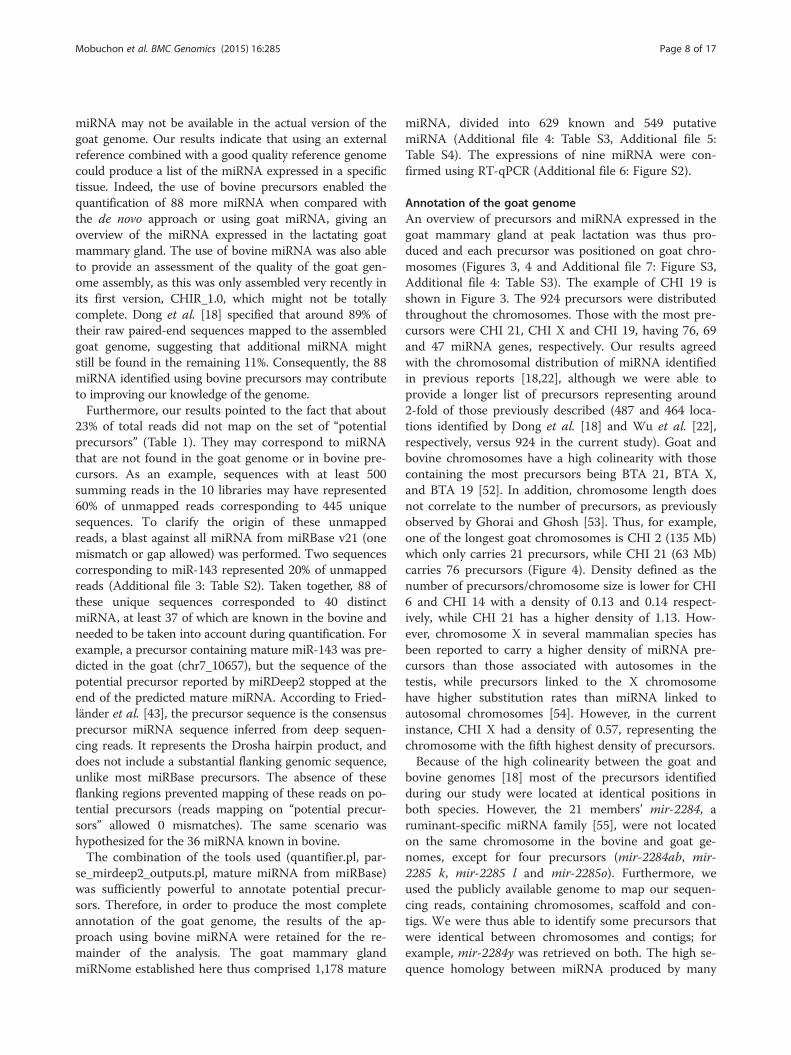
miRNA may not be available in the actual version of thegoat genome. Our results indicate that using an externalreference combined with a good quality reference genomecould produce a list of the miRNA expressed in a specifictissue. Indeed, the use of bovine precursors enabled thequantification of 88 more miRNA when compared withthe de novo approach or using goat miRNA, giving anoverview of the miRNA expressed in the lactating goatmammary gland. The use of bovine miRNA was also ableto provide an assessment of the quality of the goat gen-ome assembly, as this was only assembled very recently inits first version, CHIR_1.0, which might not be totallycomplete. Dong et al. [18] specified that around 89% oftheir raw paired-end sequences mapped to the assembledgoat genome, suggesting that additional miRNA mightstill be found in the remaining 11%. Consequently, the 88miRNA identified using bovine precursors may contributeto improving our knowledge of the genome.Furthermore, our results pointed to the fact that about
23% of total reads did not map on the set of “potentialprecursors” (Table 1). They may correspond to miRNAthat are not found in the goat genome or in bovine pre-cursors. As an example, sequences with at least 500summing reads in the 10 libraries may have represented60% of unmapped reads corresponding to 445 uniquesequences. To clarify the origin of these unmappedreads, a blast against all miRNA from miRBase v21 (onemismatch or gap allowed) was performed. Two sequencescorresponding to miR-143 represented 20% of unmappedreads (Additional file 3: Table S2). Taken together, 88 ofthese unique sequences corresponded to 40 distinctmiRNA, at least 37 of which are known in the bovine andneeded to be taken into account during quantification. Forexample, a precursor containing mature miR-143 was pre-dicted in the goat (chr7_10657), but the sequence of thepotential precursor reported by miRDeep2 stopped at theend of the predicted mature miRNA. According to Fried-länder et al. [43], the precursor sequence is the consensusprecursor miRNA sequence inferred from deep sequen-cing reads. It represents the Drosha hairpin product, anddoes not include a substantial flanking genomic sequence,unlike most miRBase precursors. The absence of theseflanking regions prevented mapping of these reads on po-tential precursors (reads mapping on “potential precur-sors” allowed 0 mismatches). The same scenario washypothesized for the 36 miRNA known in bovine.The combination of the tools used (quantifier.pl, par-
se_mirdeep2_outputs.pl, mature miRNA from miRBase)was sufficiently powerful to annotate potential precur-sors. Therefore, in order to produce the most completeannotation of the goat genome, the results of the ap-proach using bovine miRNA were retained for the re-mainder of the analysis. The goat mammary glandmiRNome established here thus comprised 1,178 mature
miRNA, divided into 629 known and 549 putativemiRNA (Additional file 4: Table S3, Additional file 5:Table S4). The expressions of nine miRNA were con-firmed using RT-qPCR (Additional file 6: Figure S2).
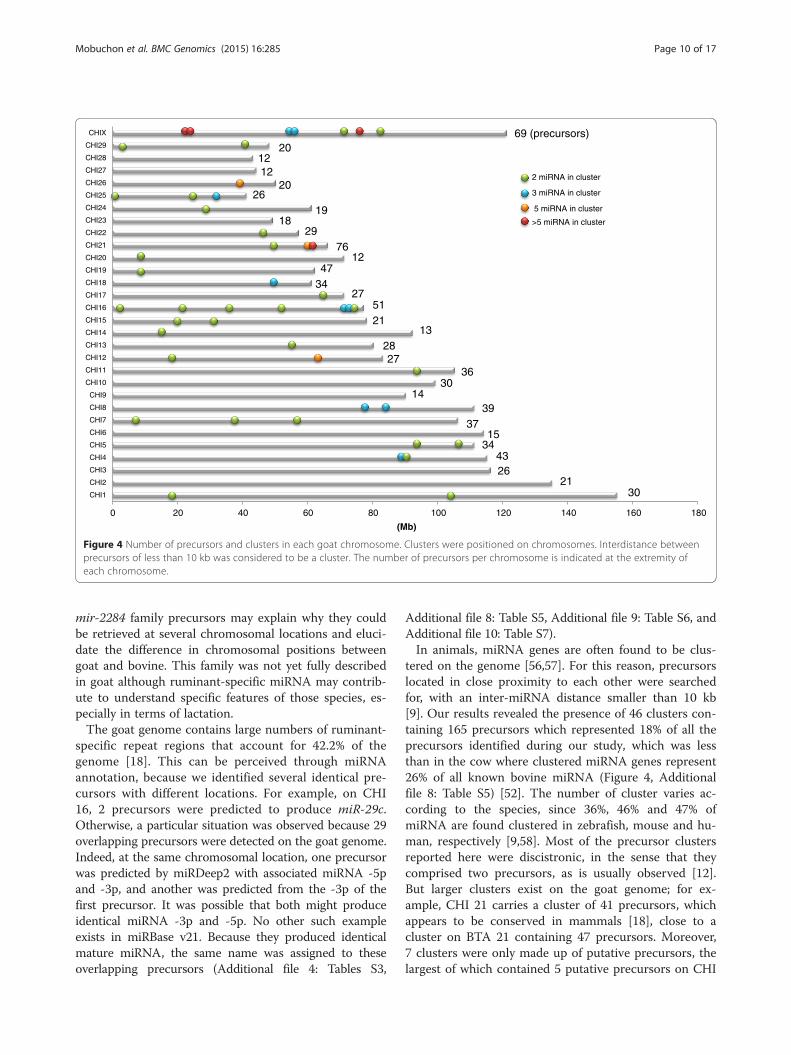
Annotation of the goat genomeAn overview of precursors and miRNA expressed in thegoat mammary gland at peak lactation was thus pro-duced and each precursor was positioned on goat chro-mosomes (Figures 3, 4 and Additional file 7: Figure S3,Additional file 4: Table S3). The example of CHI 19 isshown in Figure 3. The 924 precursors were distributedthroughout the chromosomes. Those with the most pre-cursors were CHI 21, CHI X and CHI 19, having 76, 69and 47 miRNA genes, respectively. Our results agreedwith the chromosomal distribution of miRNA identifiedin previous reports [18,22], although we were able toprovide a longer list of precursors representing around2-fold of those previously described (487 and 464 loca-tions identified by Dong et al. [18] and Wu et al. [22],respectively, versus 924 in the current study). Goat andbovine chromosomes have a high colinearity with thosecontaining the most precursors being BTA 21, BTA X,and BTA 19 [52]. In addition, chromosome length doesnot correlate to the number of precursors, as previouslyobserved by Ghorai and Ghosh [53]. Thus, for example,one of the longest goat chromosomes is CHI 2 (135 Mb)which only carries 21 precursors, while CHI 21 (63 Mb)carries 76 precursors (Figure 4). Density defined as thenumber of precursors/chromosome size is lower for CHI6 and CHI 14 with a density of 0.13 and 0.14 respect-ively, while CHI 21 has a higher density of 1.13. How-ever, chromosome X in several mammalian species hasbeen reported to carry a higher density of miRNA pre-cursors than those associated with autosomes in thetestis, while precursors linked to the X chromosomehave higher substitution rates than miRNA linked toautosomal chromosomes [54]. However, in the currentinstance, CHI X had a density of 0.57, representing thechromosome with the fifth highest density of precursors.Because of the high colinearity between the goat and
bovine genomes [18] most of the precursors identifiedduring our study were located at identical positions inboth species. However, the 21 members’ mir-2284, aruminant-specific miRNA family [55], were not locatedon the same chromosome in the bovine and goat ge-nomes, except for four precursors (mir-2284ab, mir-2285 k, mir-2285 l and mir-2285o). Furthermore, weused the publicly available genome to map our sequen-cing reads, containing chromosomes, scaffold and con-tigs. We were thus able to identify some precursors thatwere identical between chromosomes and contigs; forexample, mir-2284y was retrieved on both. The high se-quence homology between miRNA produced by many
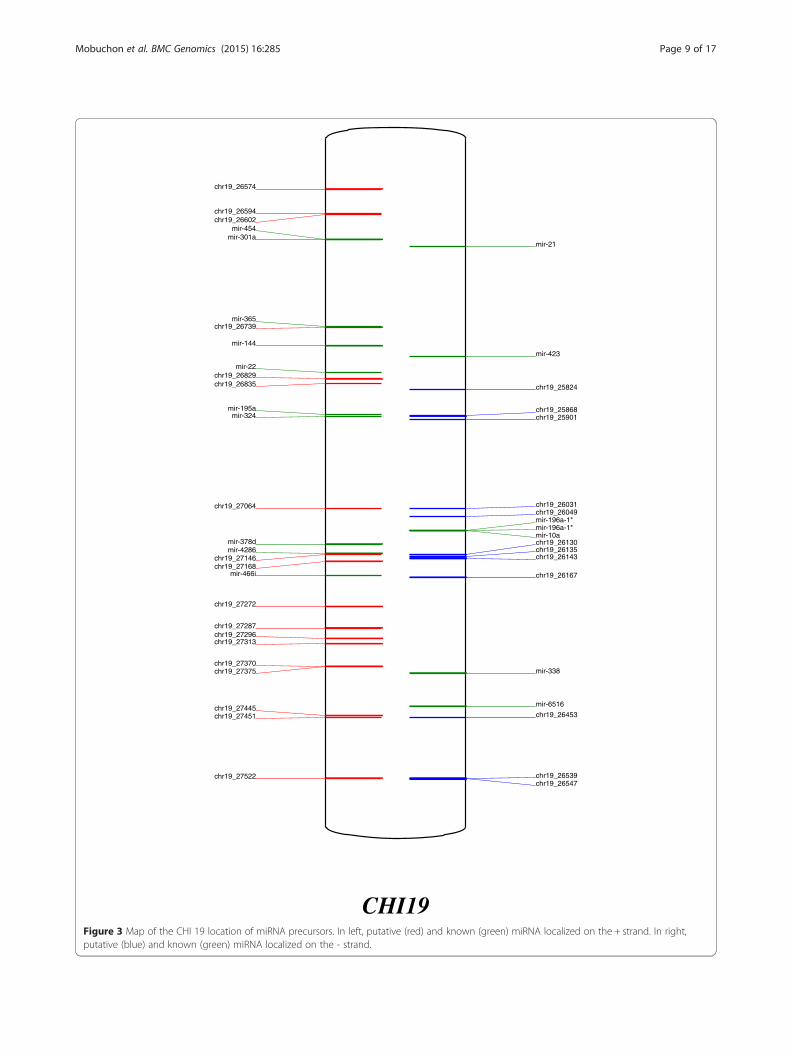
chr19_27522
chr19_27451chr19_27445
chr19_27375chr19_27370
chr19_27313chr19_27296chr19_27287
chr19_27272
mir-466ichr19_27168chr19_27146
mir-4286mir-378d
chr19_27064
mir-324mir-195a
chr19_26835chr19_26829
mir-22
mir-144
chr19_26739mir-365
mir-301amir-454
chr19_26602chr19_26594
chr19_26574
chr19_26547chr19_26539
chr19_26453
mir-6516
mir-338
chr19_26167
chr19_26143chr19_26135chr19_26130mir-10amir-196a-1*mir-196a-1*chr19_26049chr19_26031
chr19_25901chr19_25868
chr19_25824
mir-423
mir-21
CHI19Figure 3 Map of the CHI 19 location of miRNA precursors. In left, putative (red) and known (green) miRNA localized on the + strand. In right,putative (blue) and known (green) miRNA localized on the - strand.
Mobuchon et al. BMC Genomics (2015) 16:285 Page 9 of 17
0 20 40 60 80 100 120 140 160 180
CHI1
CHI2
CHI3
CHI4
CHI5
CHI6
CHI7
CHI8
CHI9
CHI10
CHI11
CHI12
CHI13
CHI14
CHI15
CHI16
CHI17
CHI18
CHI19
CHI20
CHI21
CHI22
CHI23
CHI24
CHI25
CHI26
CHI27
CHI28
CHI29
CHIX
(Mb)
2 miRNA in cluster
3 miRNA in cluster
5 miRNA in cluster
>5 miRNA in cluster
3021
2643
3415
3739
1430
3627
2813
2151
273447
1276
2918
1926
201212
2069 (precursors)
Figure 4 Number of precursors and clusters in each goat chromosome. Clusters were positioned on chromosomes. Interdistance betweenprecursors of less than 10 kb was considered to be a cluster. The number of precursors per chromosome is indicated at the extremity ofeach chromosome.
Mobuchon et al. BMC Genomics (2015) 16:285 Page 10 of 17
mir-2284 family precursors may explain why they couldbe retrieved at several chromosomal locations and eluci-date the difference in chromosomal positions betweengoat and bovine. This family was not yet fully describedin goat although ruminant-specific miRNA may contrib-ute to understand specific features of those species, es-pecially in terms of lactation.The goat genome contains large numbers of ruminant-
specific repeat regions that account for 42.2% of thegenome [18]. This can be perceived through miRNAannotation, because we identified several identical pre-cursors with different locations. For example, on CHI16, 2 precursors were predicted to produce miR-29c.Otherwise, a particular situation was observed because 29overlapping precursors were detected on the goat genome.Indeed, at the same chromosomal location, one precursorwas predicted by miRDeep2 with associated miRNA -5pand -3p, and another was predicted from the -3p of thefirst precursor. It was possible that both might produceidentical miRNA -3p and -5p. No other such exampleexists in miRBase v21. Because they produced identicalmature miRNA, the same name was assigned to theseoverlapping precursors (Additional file 4: Tables S3,
Additional file 8: Table S5, Additional file 9: Table S6, andAdditional file 10: Table S7).In animals, miRNA genes are often found to be clus-
tered on the genome [56,57]. For this reason, precursorslocated in close proximity to each other were searchedfor, with an inter-miRNA distance smaller than 10 kb[9]. Our results revealed the presence of 46 clusters con-taining 165 precursors which represented 18% of all theprecursors identified during our study, which was lessthan in the cow where clustered miRNA genes represent26% of all known bovine miRNA (Figure 4, Additionalfile 8: Table S5) [52]. The number of cluster varies ac-cording to the species, since 36%, 46% and 47% ofmiRNA are found clustered in zebrafish, mouse and hu-man, respectively [9,58]. Most of the precursor clustersreported here were discistronic, in the sense that theycomprised two precursors, as is usually observed [12].But larger clusters exist on the goat genome; for ex-ample, CHI 21 carries a cluster of 41 precursors, whichappears to be conserved in mammals [18], close to acluster on BTA 21 containing 47 precursors. Moreover,7 clusters were only made up of putative precursors, thelargest of which contained 5 putative precursors on CHI

Table 2 Intragenic miRNA precursors in human, mouse,cow and goat
Human Mouse Cow Goat
Known miRNA genes 1,881 1,193 808 924
Within protein-coding genes 1,018 694 285 263
% of known miRNA 54% 58% 35% 28%
Human, mouse and cattle precursors were downloaded from miRBase v21,and protein-coding gene locations were downloaded from BioMartEnsembl(http://www.ensembl.org/biomart). The locations of goat mRNA were obtainedfrom Dong et al. [18].
Mobuchon et al. BMC Genomics (2015) 16:285 Page 11 of 17
26. Most miRNA genes within 50 kb of each other dis-played highly correlated expression patterns, as theycould be processed from a polycistronic primary tran-script [11]. However, due to their complex maturationand degradation, Guo and Lu [59] showed that theymight also display differences in their levels of expres-sion. Furthermore, miRNA genes in a cluster may have afunctional relationship via co-regulating or coordinatedregulatory processes [60]. Clusters often contain mem-bers of different miRNA families, particularly in animalgenomes [1]. In the present case, several members of thesame family (such as the let-7 family) were identified asbeing clustered, as well as the largest miRNA gene clus-ter localized on CHI 21 which contained 16 members ofthe mir-154 family. Unrelated miRNA in the same clusterare often assumed to have similar targeting properties[56]. Further studies are necessary to clearly understandhow the expression of goat miRNA clusters is regulated.
Intragenic goat miRNA and the conservation of theirlocation among human, mouse and cowUnlike the whole genome sequences of other livestockspecies, the goat genome has not yet been very wellcharacterized. To date, almost 22,175 protein-codinggenes have been annotated, based on the bovine and hu-man genome annotation data available [18]. On theother hand, it has been estimated that up to half of allvertebrate miRNA are processed from introns ofprotein-coding genes, or from genes encoding for othernon-coding RNA [13].By investigating intragenic precursors in the goat gen-
ome, 322 precursors were found to be located in goatmRNA and CDS, representing about 35% of all the pre-cursors identified during our study. However, miRNAthat share the same strand orientation of their hostgenes have similar transcription mechanisms [1,61]. Thus,263 precursors were detected in 217 goat mRNA andCDS regions (Additional file 9: Table S6) with the sameorientation, representing about 28% of all the precursorsidentified during the study. Among the 263 goat intra-genic precursors, 68 were known and 195 were putativeprecursors. The low percentage of intragenic precursors(28%), compared with the 50% quoted in the literature,might have been due to a lack of annotation for protein-coding genes on the goat genome. Genome annotationcould therefore be improved by determining the localisa-tion of miRNA.Twenty one host genes contained 2 or more precur-
sors, such as MCM7 on CHI 25 and GABRE on CHI X,which contained a cluster of 3 precursors. As for hostgene functions, some of these are major actors in devel-opment of the mammary gland; for example, membersof the ErbB signaling pathway (ERBB2), or members ofthe Wnt signaling pathway such as RSPO2 [62,63].
Others host genes play a critical role in mammary me-tabolism, such as VLDLR (Very low density lipoproteinreceptor), SREBF2 (Sterol responsive element bindingfactor 2), or AGPAT6 (1-Acylglycerol-3-phosphate O-acyltransferase 6) (Additional file 9: Table S6).Interestingly, among the 217 host genes, the expres-
sion of 76 coding genes was confirmed in the mammarygland of the same goat using previous data from micro-arrays ([64]; GEO Series accession number GSE6380).According to these observations, only 35% of host geneswere expressed in the mammary gland at peak lactation.This low percentage is likely due to a lack of complete-ness of the microarray. The difference observed mightalso be due to the difference in detection level of thetechniques employed.Taken together, a clearer understanding of intragenic
goat miRNA may highlight potential new regulations ofmiRNA and gene expression, some of which may playcritical roles in the lactation function.Conservation of the location of miRNA/host genes
throughout a species genome may offer a useful tool forits annotation. In human, mouse and cattle, 1,018, 694,and 285 precursors, respectively, in protein-coding geneshave been detected as having the same orientation(Table 2). During the present study, a comparison of in-tragenic precursors in human, mouse and cattle with in-tragenic goat precursors revealed conservation of thelocation of 43 precursors (Figure 5, Additional file 10:Table S7). Due to the lack of annotation of goat protein-coding genes, we were not able to identify the precise lo-cation of conserved, intronic or exonic resident miRNAand compare it with conserved locations in the human,mouse or cow genomes. Godnic et al. [65] screened forintragenic precursors in the human, mouse and chickengenomes and found 27 precursors with conserved co-locations between the 3 species. Among these, 16 pre-cursors were found amongst the 43 conserved betweenhuman, mouse, cow and goat in our analysis (let-7 g,mir-101-2, mir-103, mir-107, mir-128-1, mir-1306, mir-140, mir-15b, mir-16b, mir-211, mir-218-1, mir-26a-1,mir-32, mir-33a, mir-455, let-7-2), so the location ofthese precursors appears to be highly conserved in allvertebrates. Six intragenic precursors were found on

Figure 5 Conserved intragenic precursors in human, mouse, cowand goat. Human, mouse and cattle precursors were obtained frommiRBase v21, and the locations of protein-coding genes weredownloaded from BioMartEnsembl (http://www.ensembl.org/biomart).The locations of goat mRNA were obtained from Dong et al. [18].
Mobuchon et al. BMC Genomics (2015) 16:285 Page 12 of 17
chromosome X in human, mouse, cow and goat. Chromo-some X was the only chromosome on which the locationsof host genes were conserved between species comparedusing autosomes. The location of host genes on chromo-some X appears to be markedly conserved between species(Additional file 10: Table S7). As some goat precursors werelocalized in genes coding for proteins for which theEnsembl name was not available, referred to as “deprecatedidentifiers” (Additional file 9: Table S6), the comparisonwith intragenic precursors in human, mouse and cow en-abled the characterization of seven host genes per type ofconservation (Additional file 9: Table S6). Furthermore, thelocations of 24 precursors were conserved between human,mouse and cow (Figure 5). Among these 24 intragenic pre-cursors, ten were detected in the goat during the presentstudy. These ten miRNA could also be localized in protein-coding genes in the goat, but the lack of annotation of thegoat genome probably prevented their identification. Inaddition, among these ten miRNA, mir-128-2, mir-218-2and mir-301a were found in the ARPP21 (cAMP-regulatedphosphoprotein), SLIT3 (Slit homolog 3) and SKA2 (Spin-dle and kinetochore associated complex subunit 2) genes inhuman, mouse, cow and chicken [65]. By investigating an-notated goat mRNA, transcript coding for SKA2 was foundto be annotated in the goat genome, suggesting thatmir-301a is not intragenic in goat. However, the tran-script coding for both ARPP21 and SLIT3 could not beretrieved. Furthermore, the genomes of human, mouse,cow and chicken have been well characterized by com-parison with very recently assembled goat genome.Consequently, it could be hypothesized that ARPP21and SLIT3 have not yet been described in the goat gen-ome, and the presence of conserved intragenic precursors
may indicate the location of these genes in this genome.Among the seven other conserved intragenic precursorsin human, mouse and cow, mir-1249 in the host geneKIAA0930 and mir-499 in the host gene MYH7B (Myosinheavy chain 7B cardiac muscle beta) were not retrieved ei-ther in the goat protein-coding genes available, suggestingonce again that these genes have yet to be described in thegoat genome. Using the conservation of precursor loca-tions in well-known genomes may constitute a useful toolto predict the location of protein-coding genes that havenot yet been described in newly assembled genomes suchas the goat.Evidence suggests that intragenic miRNA and host
genes might be processed from the same RNA [66], andare often co-expressed with their host genes [13,67]. Pre-vious studies indeed reported that conserved residentprecursors such as mir-26a/b might cooperate with theirhost genes, the carboxy-terminal domain RNA polymer-ase II polypeptide A small phosphatase (CTDSP) family,in the regulatory network of G1/S phase transition [68].Another example is mir-33a, which may act in concertwith its SREBF2 host genes to govern intracellular func-tion and cholesterol homeostasis in vertebrates, thusrepresenting an example of miRNA-host gene cooper-ation in regulating a metabolic pathway [69]. Evaluatingthe expression of host genes relative to that of their resi-dent precursors in the lactating mammary gland couldprovide new insights into the regulation of mammaryfunction and/or development.
Screening for miRNA in bovine quantitative trait lociResults of the QTL mapping studies that have been per-formed in livestock species are available in the animalQTL database (http://www.animalgenome.org/). Becauseno QTL mapping studies have been reported for goat inthis QTL database, bovine QTL data were used in our studyto investigate the localization of precursors expressed inmammary gland QTL. In cattle, some 2,307 QTL out of atotal of 8,305 have been reported to be associated with milktraits (Additional file 11: Table S8).Comparative mapping enables exploitation of the
whole genome sequence and its annotation available fora model species, and inference of this information toother species whose genome annotation has not beenwell characterized. In this regard, a comparative analysisof the known goat precursors identified in the presentstudy and the precursors expressed in bovine lactatingmammary gland [44] was performed, and revealed 255highly precursors conserved between these species.Out of these, 114 were located within QTL regions associ-
ated with milk traits and distributed within all bovine chro-mosomes except BTA 1, 9, 11, 12, 17, 28 and X (Table 3).Cattle QTL have very large genome coverage and thereforecould explain the anchorage of a high number of miRNA in
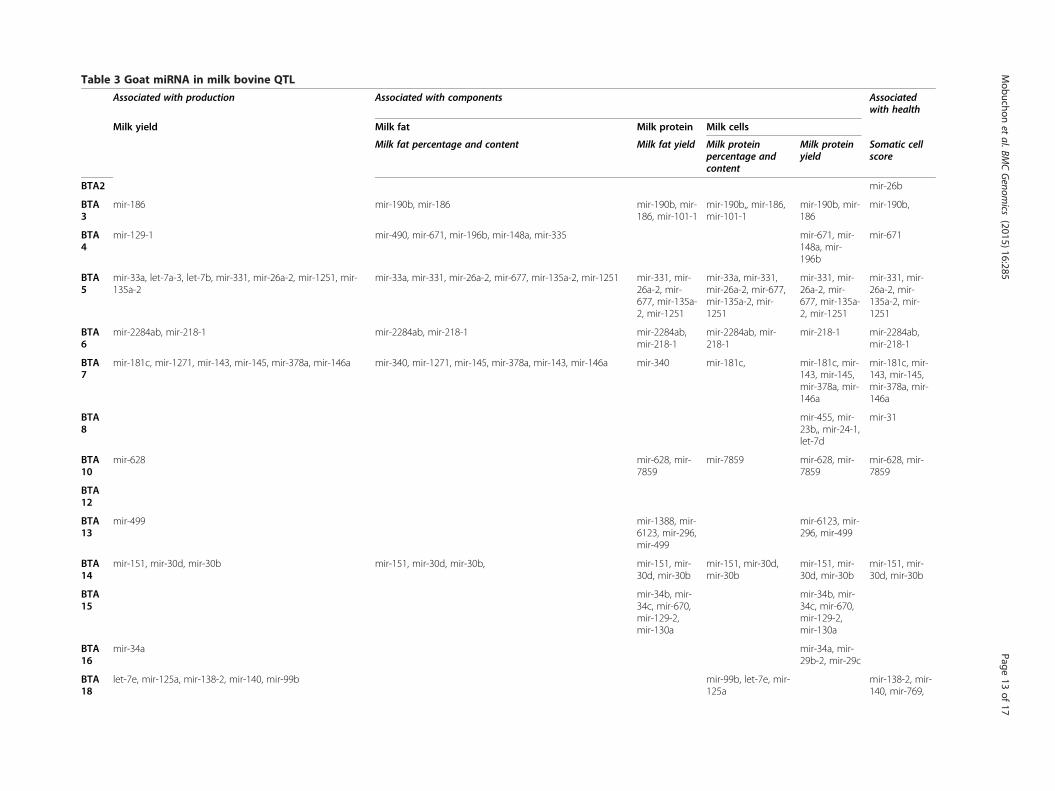
Table 3 Goat miRNA in milk bovine QTL
Associated with production Associated with components Associatedwith health
Milk yield Milk fat Milk protein Milk cells
Milk fat percentage and content Milk fat yield Milk proteinpercentage andcontent
Milk proteinyield
Somatic cellscore
BTA2 mir-26b
BTA3
mir-186 mir-190b, mir-186 mir-190b, mir-186, mir-101-1
mir-190b,, mir-186,mir-101-1
mir-190b, mir-186
mir-190b,
BTA4
mir-129-1 mir-490, mir-671, mir-196b, mir-148a, mir-335 mir-671, mir-148a, mir-196b
mir-671
BTA5
mir-33a, let-7a-3, let-7b, mir-331, mir-26a-2, mir-1251, mir-135a-2
mir-33a, mir-331, mir-26a-2, mir-677, mir-135a-2, mir-1251 mir-331, mir-26a-2, mir-677, mir-135a-2, mir-1251
mir-33a, mir-331,mir-26a-2, mir-677,mir-135a-2, mir-1251
mir-331, mir-26a-2, mir-677, mir-135a-2, mir-1251
mir-331, mir-26a-2, mir-135a-2, mir-1251
BTA6
mir-2284ab, mir-218-1 mir-2284ab, mir-218-1 mir-2284ab,mir-218-1
mir-2284ab, mir-218-1
mir-218-1 mir-2284ab,mir-218-1
BTA7
mir-181c, mir-1271, mir-143, mir-145, mir-378a, mir-146a mir-340, mir-1271, mir-145, mir-378a, mir-143, mir-146a mir-340 mir-181c, mir-181c, mir-143, mir-145,mir-378a, mir-146a
mir-181c, mir-143, mir-145,mir-378a, mir-146a
BTA8
mir-455, mir-23b,, mir-24-1,let-7d
mir-31
BTA10
mir-628 mir-628, mir-7859
mir-7859 mir-628, mir-7859
mir-628, mir-7859
BTA12
BTA13
mir-499 mir-1388, mir-6123, mir-296,mir-499
mir-6123, mir-296, mir-499
BTA14
mir-151, mir-30d, mir-30b mir-151, mir-30d, mir-30b, mir-151, mir-30d, mir-30b
mir-151, mir-30d,mir-30b
mir-151, mir-30d, mir-30b
mir-151, mir-30d, mir-30b
BTA15
mir-34b, mir-34c, mir-670,mir-129-2,mir-130a
mir-34b, mir-34c, mir-670,mir-129-2,mir-130a
BTA16
mir-34a mir-34a, mir-29b-2, mir-29c
BTA18
let-7e, mir-125a, mir-138-2, mir-140, mir-99b mir-99b, let-7e, mir-125a
mir-138-2, mir-140, mir-769,
Mobuchon
etal.BM
CGenom
ics (2015) 16:285
Page13
of17
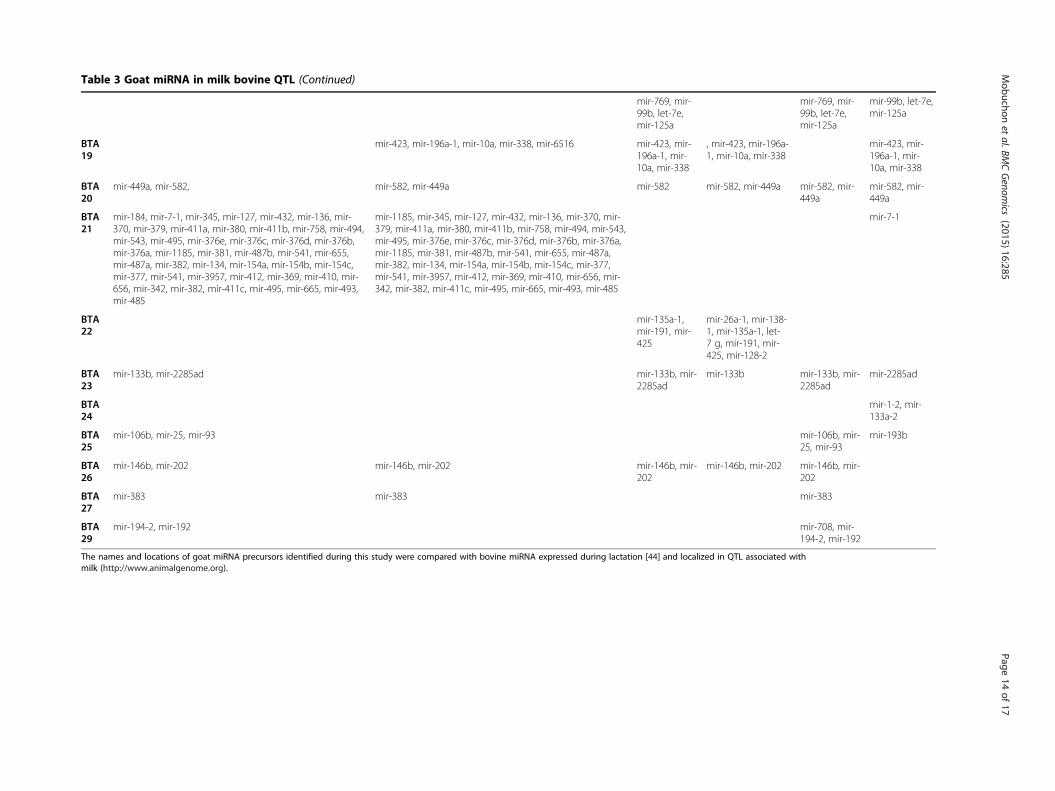
Table 3 Goat miRNA in milk bovine QTL (Continued)
mir-769, mir-99b, let-7e,mir-125a
mir-769, mir-99b, let-7e,mir-125a
mir-99b, let-7e,mir-125a
BTA19
mir-423, mir-196a-1, mir-10a, mir-338, mir-6516 mir-423, mir-196a-1, mir-10a, mir-338
, mir-423, mir-196a-1, mir-10a, mir-338
mir-423, mir-196a-1, mir-10a, mir-338
BTA20
mir-449a, mir-582, mir-582, mir-449a mir-582 mir-582, mir-449a mir-582, mir-449a
mir-582, mir-449a
BTA21
mir-184, mir-7-1, mir-345, mir-127, mir-432, mir-136, mir-370, mir-379, mir-411a, mir-380, mir-411b, mir-758, mir-494,mir-543, mir-495, mir-376e, mir-376c, mir-376d, mir-376b,mir-376a, mir-1185, mir-381, mir-487b, mir-541, mir-655,mir-487a, mir-382, mir-134, mir-154a, mir-154b, mir-154c,mir-377, mir-541, mir-3957, mir-412, mir-369, mir-410, mir-656, mir-342, mir-382, mir-411c, mir-495, mir-665, mir-493,mir-485
mir-1185, mir-345, mir-127, mir-432, mir-136, mir-370, mir-379, mir-411a, mir-380, mir-411b, mir-758, mir-494, mir-543,mir-495, mir-376e, mir-376c, mir-376d, mir-376b, mir-376a,mir-1185, mir-381, mir-487b, mir-541, mir-655, mir-487a,mir-382, mir-134, mir-154a, mir-154b, mir-154c, mir-377,mir-541, mir-3957, mir-412, mir-369, mir-410, mir-656, mir-342, mir-382, mir-411c, mir-495, mir-665, mir-493, mir-485
mir-7-1
BTA22
mir-135a-1,mir-191, mir-425
mir-26a-1, mir-138-1, mir-135a-1, let-7 g, mir-191, mir-425, mir-128-2
BTA23
mir-133b, mir-2285ad mir-133b, mir-2285ad
mir-133b mir-133b, mir-2285ad
mir-2285ad
BTA24
mir-1-2, mir-133a-2
BTA25
mir-106b, mir-25, mir-93 mir-106b, mir-25, mir-93
mir-193b
BTA26
mir-146b, mir-202 mir-146b, mir-202 mir-146b, mir-202
mir-146b, mir-202 mir-146b, mir-202
BTA27
mir-383 mir-383 mir-383
BTA29
mir-194-2, mir-192 mir-708, mir-194-2, mir-192
The names and locations of goat miRNA precursors identified during this study were compared with bovine miRNA expressed during lactation [44] and localized in QTL associated withmilk (http://www.animalgenome.org).
Mobuchon
etal.BM
CGenom
ics (2015) 16:285
Page14
of17
Mobuchon et al. BMC Genomics (2015) 16:285 Page 15 of 17
these QTL regions. The presence of miRNA clusters in theseQTL regions was also noted. Indeed, the larger cluster con-taining 42 precursors (mir-379/656 cluster) in the bovinegenome was found within a QTL region for milk fat percent-age and content on BTA 21. The mir-34b/34c cluster, con-taining mir-34b, mir-34c, mir-670, mir-129-2 and mir-130a,was also identified within QTL regions for milk fat yield andfor milk protein yield on BTA 15.Interestingly, several precursors were only found in
QTL associated with one type of trait; for example, mir-26b on BTA 2 located in a QTL associated with thesomatic cell score. On BTA 15, the 5 intraQTL precur-sors were found relative to milk fat and protein yield.Furthermore, on BTA 7, mir-340 was only found in QTLassociated with milk fat. Finally, an intragenic miRNA,mir-33a, was also localized in a QTL linked to milk fatcontent. As mentioned above, the host gene of mir-33a,SREBF2, is known to regulate the expression of severallipogenic enzymes in numerous tissues involving themammary gland, and plays a key role in controllingcholesterol homeostasis [70]. Intragenic mir-33a and thehost gene SREBF2 may act in a coordinated manner togovern lipid metabolism [69], their presence in QTL as-sociated with milk fat content possibly revealing a rolefor this cooperation in the regulation of milk fatty acidtraits. However, further investigations are needed to at-tribute different QTL to miRNA and their cooperation,because although the presence of precursors in QTL hasbeen shown, no studies have yet attempted to unravelthe role of miRNA in milk QTL traits.Although QTL regions are not well conserved between
breeds within the same species nor between differentspecies, it is well documented that syntenic regions arehighly conserved between species [71]. It is impossibleat this stage to infer any association between thesehighly conserved goat miRNA genes and milk traits.However, syntenic regions may contain highly conservedorthologous genes and this information could constitutea starting point to study association of genes or clustersof genes with particular traits. Further validation studiesshould therefore be undertaken in order to check whethermiRNA genes that are highly conserved in cattle couldalso be associated with milk traits.
ConclusionsThe present study provides a full catalogue of miRNAexpressed in the goat mammary gland at peak lactation,together with each chromosomal location. To the best ofour knowledge, this work represents a significant enrich-ment of the repertoire of goat miRNA and their locationon the genome.During this study, the bioinformatic detection of goat
miRNA was carried out using three alternative strategies.The first one was a de novo predictive approach using
the whole goat genome sequence for mapping and anno-tating sequenced reads. The second and third approachesinvolved a bovine and goat miRNA gene repertoire, re-spectively, as reference. Comparing the three approachesdemonstrated that the second produced more exhaustiveresults, but de novo prediction revealed identical resultsthat could be used as in a predictive and quantificationstrategy for species for which no or only a few miRNAhave been reported in miRBase and whose genome is notfully known.We report the identification of 924 miRNA in the goat
mammary gland, 263 of which were found to be intra-genic. Of these, the intragenic locations of 43 goat pre-cursors were found to be conserved among human, mouseand cow, suggesting a conserved regulation of their expres-sion between species regarding these intragenic miRNA.Conservation of the location of miRNA allowed us tohypothesize as to the location of genes that have not yetbeen annotated in the goat genome.Preliminary studies to compare the goat and cattle ge-
nomes showed that 114 conserved precursors expressedin the lactating mammary gland of both species were lo-calized within QTL regions associated with milk produc-tion traits. Further analyses are now required to clarifythe potential effects of mammary miRNA on milk pro-duction traits, particularly in the goat.All the goat miRNA identified during this work will be
added to miRBase and can therefore serve as a referencefor future studies.
Availability of supporting dataThe data sets supporting the results of this article areavailable in Gene Expression Omnibus (GEO) (http://www.ncbi.nlm.nih.gov/geo/) with accession number:GSE61025.
Additional files
Additional file 1: Table S1. Read counts and percentage of readpositions with an average base quality over 30.
Additional file 2: Figure S1. Structure of some randomly chosenknown and predicted precursors. In red associated miRNA.
Additional file 3: Table S2. Sequences of unmapped reads onpotential precursors.
Additional file 4: Table S3. Chromosomal location of precursors onthe goat genome.
Additional file 5: Table S4. Goat miRNA expressed in the lactatingmammary gland.
Additional file 6: Figure S2. Quantitative RT-PCR validation of NGS data.
Additional file 7: Figure S3. Map of miRNA precursors on the goatgenome CHIR_1. At the left of the chromosome, putative (red) andknown (green) precursors localized on the + strand,. At the right of thechromosome, putative (blue) and known (green) precursors localized onthe – strand.
Additional file 8: Table S5. Cluster of precursors in the goat genome.
Mobuchon et al. BMC Genomics (2015) 16:285 Page 16 of 17
Additional file 9: Table S6. Intragenic goat precursors.
Additional file 10: Table S7. Intragenic precursors conserved inhuman, mouse, cattle and goat.
Additional file 11: Table S8. Bovine QTL associated with milk.
Competing interestsThe authors declare that they have no competing interests.
Authors’ contributionsConceived and designed the experiments: LM, CL, FLP. Performed theexperiments: LM, SM Analysed the data: LM, SM, MB, SLG, CL, FLP. Wrote thepaper: LM, CL, FLP. All authors read and approved in the final manuscript.
AcknowledgementsL Mobuchon is funded by INRA and ApisGène grants under the NutriMirMaproject.
Author details1INRA, UMR1313 Génétique Animale et Biologie Intégrative, F-78350Jouy-en-Josas, France. 2INRA, UMR1213 Herbivores, F-63122 Saint GenèsChampanelle, France. 3Clermont Université, VetAgro Sup, UMR Herbivores, BP10448F-63000 Clermont-Ferrand, France.
Received: 4 March 2015 Accepted: 18 March 2015
References1. Bartel DP. MicroRNAs: genomics, biogenesis, mechanism, and function. Cell.
2004;116(2):281–97.2. Guo H, Ingolia NT, Weissman JS, Bartel DP. Mammalian microRNAs
predominantly act to decrease target mRNA levels. Nature.2010;466(7308):835–40.
3. Berezikov E, Guryev V, van de Belt J, Wienholds E, Plasterk RH, Cuppen E.Phylogenetic shadowing and computational identification of humanmicroRNA genes. Cell. 2005;120(1):21–4.
4. Friedman RC, Farh KK, Burge CB, Bartel DP. Most mammalian mRNAs areconserved targets of microRNAs. Genome Res. 2009;19(1):92–105.
5. Lee Y, Kim M, Han J, Yeom KH, Lee S, Baek SH, et al. MicroRNA genes aretranscribed by RNA polymerase II. Embo J. 2004;23(20):4051–60.
6. Ha M, Kim VN. Regulation of microRNA biogenesis. Nat Rev Mol Cell Biol.2014;15(8):509–24.
7. Winter J, Jung S, Keller S, Gregory RI, Diederichs S. Many roads to maturity:microRNA biogenesis pathways and their regulation. Nat Cell Biol.2009;11(3):228–34.
8. Han J, Lee Y, Yeom KH, Kim YK, Jin H, Kim VN. The Drosha-DGCR8 complexin primary microRNA processing. Genes Dev. 2004;18(24):3016–27.
9. Griffiths-Jones S, Saini HK, van Dongen S, Enright AJ. miRBase: tools formicroRNA genomics. Nucleic Acids Res. 2008;36(Database issue):8.
10. Ambros V. The functions of animal microRNAs. Nature. 2004;431(7006):350–5.11. Baskerville S, Bartel DP. Microarray profiling of microRNAs reveals frequent
coexpression with neighboring miRNAs and host genes. RNA.2005;11(3):241–7.
12. Yuan X, Liu C, Yang P, He S, Liao Q, Kang S, et al. Clustered microRNAs’coordination in regulating protein-protein interaction network. BMC SystBiol. 2009;3(65):1752–0509.
13. Rodriguez A, Griffiths-Jones S, Ashurst JL, Bradley A. Identification ofmammalian microRNA host genes and transcription units. Genome Res.2004;14(10A):1902–10.
14. Kim VN, Han J, Siomi MC. Biogenesis of small RNAs in animals. Nat Rev MolCell Biol. 2009;10(2):126–39.
15. Rearick D, Prakash A, McSweeny A, Shepard SS, Fedorova L, Fedorov A.Critical association of ncRNA with introns. Nucleic Acids Res.2011;39(6):2357–66.
16. Lutter D, Marr C, Krumsiek J, Lang EW, Theis FJ. Intronic microRNAs supporttheir host genes by mediating synergistic and antagonistic regulatoryeffects. BMC Genomics. 2010;11(224):1471–2164.
17. Tsang J, Zhu J, van Oudenaarden A. MicroRNA-mediated feedback andfeedforward loops are recurrent network motifs in mammals. Mol Cell.2007;26(5):753–67.
18. Dong Y, Xie M, Jiang Y, Xiao N, Du X, Zhang W, et al. Sequencing andautomated whole-genome optical mapping of the genome of a domesticgoat (Capra hircus). Nat Biotechnol. 2013;31(2):135–41.
19. Ji Z, Wang G, Xie Z, Zhang C, Wang J. Identification and characterization ofmicroRNA in the dairy goat (Capra hircus) mammary gland by solexa deep-sequencing technology. Mol Biol Rep. 2012;39(10):9361–71.
20. Metpally RP, Nasser S, Malenica I, Courtright A, Carlson E, Ghaffari L, et al.Comparison of analysis tools for miRNA high throughput sequencing usingnerve crush as a model. Front Genet. 2013;4 (20):1–13.
21. Liu Z, Xiao H, Li H, Zhao Y, Lai S, Yu X, et al. Identification of conserved andnovel microRNAs in cashmere goat skin by deep sequencing. PLoS One.2012;7(12):7: e50001.
22. Wu J, Zhu H, Song W, Li M, Liu C, Li N, et al. Identification of conservativemicroRNAs in Saanen dairy goat testis through deep sequencing. ReprodDomest Anim. 2014;49(1):32–40.
23. Li Z, Liu H, Jin X, Lo L, Liu J. Expression profiles of microRNAs from lactatingand non-lactating bovine mammary glands and identification of miRNArelated to lactation. BMC Genomics. 2012;13:731.
24. Zhang XD, Zhang YH, Ling YH, Liu Y, Cao HG, Yin ZJ, et al. Characterizationand differential expression of microRNAs in the ovaries of pregnant andnon-pregnant goats (Capra hircus). BMC Genomics. 2013;14(157):1471–2164.
25. Ling YH, Ren CH, Guo XF, Xu LN, Huang YF, Luo JC, et al. Identification andcharacterization of microRNAs in the ovaries of multiple and uniparousgoats (Capra hircus) during follicular phase. BMC Genomics.2014;15(339):1471–2164.
26. Nawrocki EP, Kolbe DL, Eddy SR. Infernal 1.0: inference of RNA alignments.Bioinformatics. 2009;25(10):1335–7.
27. Longpre KM, Kinstlinger NS, Mead EA, Wang Y, Thekkumthala AP, CarrenoKA, et al. Seasonal variation of urinary microRNA expression in male goats(Capra hircus) as assessed by next generation sequencing. Gen CompEndocrinol. 2014;20(14):00011–2.
28. Wang Y, Zhang C, Fang X, Zhao Y, Chen X, Sun J, et al. Identification andprofiling of microRNAs and their target genes from developing Caprineskeletal muscle. PLoS One. 2014;9(5):e96857.
29. Wu Z, Fu Y, Cao J, Yu M, Tang X, Zhao S. Identification of differentiallyexpressed miRNAs between white and black hair follicles by RNA-sequencing in the goat (Capra hircus). Int J Mol Sci. 2014;15(6):9531–45.
30. Le Guillou S, Sdassi N, Laubier J, Passet B, Vilotte M, Castille J, et al.Overexpression of miR-30b in the developing mouse mammary glandcauses a lactation defect and delays involution. PLoS One. 2012;7(9):e45727.
31. Li HM, Wang CM, Li QZ, Gao XJ. Mir-15a decreases bovine mammaryepithelial cell viability and lactation and regulates growth receptorexpression. Molecules. 2012;17(10):12037–48.
32. Wang J, Bian Y, Wang Z, Li D, Wang C, Li Q, et al. MicroRNA-152 regulatesDNA methyltransferase 1 and is involved in the development and lactationof mammary glands in dairy cows. PLoS One. 2014;9(7):e101358.
33. Zhang C, Zhao Y, Wang Y, Wu H, Fang X, Chen H. Deep RNA sequencingreveals that microRNAs play a key role in lactation in rats. J Nutr.2014;144(8):1142–9.
34. Lin X, Luo J, Zhang L, Wang W, Gou D. MiR-103 controls milk fat accumulationin goat (Capra hircus) mammary gland during lactation. PLoS One.2013;8(11):e79258.
35. Lin XZ, Luo J, Zhang LP, Wang W, Shi HB, Zhu JJ. mir-27a suppressestriglycerides accumulation and affects gene mRNA expression associatedwith fat metabolism in dairy goat mammary gland epithelial cells. Gene.2013;521(1):15–23.
36. Seaton G, Haley CS, Knott SA, Kearsey M, Visscher PM. QTL Express: mappingquantitative trait loci in simple and complex pedigrees. Bioinformatics.2002;18(2):339–40.
37. Zhang Q, Boichard D, Hoeschele I, Ernst C, Eggen A, Murkve B, et al. Mappingquantitative trait loci for milk production and health of dairy cattle in a largeoutbred pedigree. Genetics. 1998;149(4):1959–73.
38. Heyen DW, Weller JI, Ron M, Band M, Beever JE, Feldmesser E, et al. Agenome scan for QTL influencing milk production and health traits in dairycattle. Physiol Genomics. 1999;1(3):165–75.
39. Plante Y, Gibson JP, Nadesalingam J, Mehrabani-Yeganeh H, Lefebvre S,Vandervoort G, et al. Detection of quantitative trait loci affectingmilk productiontraits on 10 chromosomes in Holstein cattle. J Dairy Sci. 2001;84(6):1516–24.
40. Ashwell MS, Heyen DW, Sonstegard TS, Van Tassell CP, Da Y, VanRaden PM,et al. Detection of quantitative trait loci affecting milk production, health,and reproductive traits in Holstein cattle. J Dairy Sci. 2004;87(2):468–75.
Mobuchon et al. BMC Genomics (2015) 16:285 Page 17 of 17
41. Roldan DL, Rabasa AE, Saldano S, Holgado F, Poli MA, Cantet RJ. QTLdetection for milk production traits in goats using a longitudinal model. JAnim Breed Genet. 2008;125(3):187–93.
42. Martin M. Cutadapt removes adapter sequences from high-throughputsequencing reads. EMBnetjournal. 2011;17(1):10–2.
43. Friedlander MR, Mackowiak SD, Li N, Chen W, Rajewsky N. miRDeep2accurately identifies known and hundreds of novel microRNA genes inseven animal clades. Nucleic Acids Res. 2012;40(1):37–52.
44. Le Guillou S, Marthey S, Laloe D, Laubier J, Mobuchon L, Leroux C, et al.Characterisation and comparison of lactating mouse and bovine mammarygland miRNomes. PLoS One. 2014;9(3):e91938.
45. Griffiths-Jones S, Grocock RJ, van Dongen S, Bateman A, Enright AJ.miRBase: microRNA sequences, targets and gene nomenclature. NucleicAcids Res. 2006;34(Database issue):D140–4.
46. Kozomara A, Griffiths-Jones S. miRBase: annotating high confidencemicroRNAs using deep sequencing data. Nucleic Acids Res.2014;42(Database issue):25.
47. Masotti A, Caputo V, Da Sacco L, Pizzuti A, Dallapiccola B, Bottazzo GF.Quantification of small non-coding RNAs allows an accurate comparison ofmiRNA expression profiles. J Biomed Biotechnol. 2009;659028(10):1.
48. Li D, Liu H, Li Y, Yang M, Qu C, Zhang Y, et al. Identification of suitableendogenous control genes for quantitative RT-PCR analysis of miRNA inbovine solid tissues. Mol Biol Rep. 2014;41(10):6475–80.
49. Quinlan AR, Hall IM. BEDTools: a flexible suite of utilities for comparinggenomic features. Bioinformatics. 2010;26(6):841–2.
50. Hafner M, Landgraf P, Ludwig J, Rice A, Ojo T, Lin C, et al. Identification ofmicroRNAs and other small regulatory RNAs using cDNA library sequencing.Methods. 2008;44(1):3–12.
51. Friedlander MR, Chen W, Adamidi C, Maaskola J, Einspanier R, Knespel S,et al. Discovering microRNAs from deep sequencing data using miRDeep.Nat Biotechnol. 2008;26(4):407–15.
52. Romao JM, Jin W, He M, McAllister T, le Guan L. MicroRNAs in bovineadipogenesis: genomic context, expression and function. BMC Genomics.2014;15(137):1471–2164.
53. Ghorai A, Ghosh U. miRNA gene counts in chromosomes vary widely in aspecies and biogenesis of miRNA largely depends on transcription or post-transcriptional processing of coding genes. Front Genet. 2014;5(100):1–11.
54. Guo X, Su B, Zhou Z, Sha J. Rapid evolution of mammalian X-linked testismicroRNAs. BMC Genomics. 2009;10(97):1471–2164.
55. Bao H, Kommadath A, Sun X, Meng Y, Arantes AS, Plastow GS, et al.Expansion of ruminant-specific microRNAs shapes target gene expressiondivergence between ruminant and non-ruminant species. BMC Genomics.2013;14(609):1471–2164.
56. Kim VN, Nam JW. Genomics of microRNA. Trends Genet. 2006;22(3):165–73.57. Lee Y, Jeon K, Lee JT, Kim S, Kim VN. MicroRNA maturation: stepwise
processing and subcellular localization. Embo J. 2002;21(17):4663–70.58. Thatcher EJ, Bond J, Paydar I, Patton JG. Genomic organization of zebrafish
microRNAs. BMC Genomics. 2008;9(253):1471–2164.59. Guo L, Lu Z. Global expression analysis of miRNA gene cluster and family
based on isomiRs from deep sequencing data. Comput Biol Chem.2010;34(3):165–71.
60. Xu J, Wong C. A computational screen for mouse signaling pathwaystargeted by microRNA clusters. RNA. 2008;14(7):1276–83.
61. Li SC, Tang P, Lin WC. Intronic microRNA: discovery and biologicalimplications. DNA Cell Biol. 2007;26(4):195–207.
62. Normanno N, Bianco C, Strizzi L, Mancino M, Maiello MR, De Luca A, et al.The ErbB receptors and their ligands in cancer: an overview. Curr DrugTargets. 2005;6(3):243–57.
63. Gauger KJ, Shimono A, Crisi GM, Schneider SS. Loss of SFRP1 promotesductal branching in the murine mammary gland. BMC Dev Biol.2012;12(25):12–25.
64. Ollier S, Robert-Granie C, Bernard L, Chilliard Y, Leroux C. Mammarytranscriptome analysis of food-deprived lactating goats highlights genesinvolved in milk secretion and programmed cell death. J Nutr.2007;137(3):560–7.
65. Godnic I, Zorc M, Jevsinek Skok D, Calin GA, Horvat S, Dovc P, et al.Genome-wide and species-wide in silico screening for intragenic MicroRNAsin human, mouse and chicken. PLoS One. 2013;8(6):e65165.
66. Shomron N, Levy C. MicroRNA-biogenesis and Pre-mRNA splicing crosstalk.J Biomed Biotechnol. 2009:594678(10):1–6.
67. Ronchetti D, Lionetti M, Mosca L, Agnelli L, Andronache A, Fabris S, et al. Anintegrative genomic approach reveals coordinated expression of intronicmiR-335, miR-342, and miR-561 with deregulated host genes in multiplemyeloma. BMC Med Genomics. 2008;1(37):1755–8794.
68. Zhu Y, Lu Y, Zhang Q, Liu JJ, Li TJ, Yang JR, et al. MicroRNA-26a/b and theirhost genes cooperate to inhibit the G1/S transition by activating the pRbprotein. Nucleic Acids Res. 2012;40(10):4615–25.
69. Najafi-Shoushtari SH, Kristo F, Li Y, Shioda T, Cohen DE, Gerszten RE, et al.MicroRNA-33 and the SREBP host genes cooperate to control cholesterolhomeostasis. Science. 2010;328(5985):1566–9.
70. Bommer GT, MacDougald OA. Regulation of lipid homeostasis by thebifunctional SREBF2-miR33a locus. Cell Metab. 2011;13(3):241–7.
71. Guan G, Yi M, Kobayashi T, Hong Y, Nagahama Y. A syntenic regionconserved from fish to Mammalian x chromosome. Int J Evol Biol.2014;873935(10):18.
Submit your next manuscript to BioMed Centraland take full advantage of:
• Convenient online submission
• Thorough peer review
• No space constraints or color figure charges
• Immediate publication on acceptance
• Inclusion in PubMed, CAS, Scopus and Google Scholar
• Research which is freely available for redistribution
Submit your manuscript at www.biomedcentral.com/submit