annual accounts 201 - creditinfo
TRANSCRIPT

> Main Indicators 2017
Net sales:
Operating profit/loss: 183 900 000 EUR
incl. export sale:
Net profit/loss:
Assets:
Equity:
Share capital:
Cash flow:
Staff costs:
Number of employees:
742 100 000 EUR
109 100 000 EUR
171 000 000 EUR
3 087 200 000 EUR
1 698 000 000 EUR
621 600 000 EUR
63 500 000 EUR
130 200 000 EUR
5 696
> Additional Info
Financial Year:
01/01-31/12
VAT Liability:
VAT payer since:
VAT number:
Auditor:
> Growth Indicators 17/16
Net sales growth:
Operating profit growth:
-4.5 %
221.5 %
Net profit growth:
Change of number of employees:
322.2 %
-9.4 %
Ratio01/01/201731/12/2017
Liquidity and solvency
Working capital (th. EUR) 287 600.0
Current ratio (*) 2.2
Quick ratio (*) 1.9
Cash ratio (*) 0.9
Collection period (days) 61
Capital circulation
Assets turnover(*) 0.2
Capital structure
Debt ratio (*) 0.4
Efficiency
Operating margin (%) 24.8
Profit margin (%) 23.0
ROA (%) 5.7
Cash flow (th. EUR) 63 500.0
Current ratio (*)
2016
0.0 1.0 2.0 3.0 4.0 5.0
Quick ratio (*)
2016
0.0 1.0 2.0 3.0 4.0 5.0
Debt ratio (*)
2016
0.0 0.2 0.4 0.6 0.8 1.0
Operating margin (%)
2016
0.0 5.0 10.0 15.0 20.0 25.0
> Main Consolidated Ratios
Annual Accounts 2017CONSOLIDATED REPORT
01/6Report created on:æ09/03/2018
1 / 6
EXAMPLE AS
Reg. code: 00000000
Pärnu mnt 5 10148 Tallinn, Harjumaa
Tel: 6000000, Fax: 6000000
[email protected], www.example.ee
Main Sphere of Business:
Freight transport by road
00/00/2000
EE000000000
Firstname Lastname

> Consolidated Balance Sheet (EUR)
ASSETS 31/12/17 (Proportion ,%) 01/01/17 (Proportion, %) Trend,%
CURRENT ASSETS
Cash 223300000 (7.2) 159800000 (5.4) +39.7
Short term financial investments 1400000 (0.0) 0 (0.0) +100
Short-term receivables and prepayments, incl: 246700000 (8.0) 173600000 (5.9) +42.1
Trade receivables 158500000 (5.1) 88500000 (3.0) +79.1
- accounts receivable 160600000 (5.2) 90600000 (3.1) +77.3
- allowance for doubtful receivables 2100000 (0.1) 2100000 (0.1) 0
Tax prepayments and receivables 0 (0.0)
Receivables from related parties 1600000 (0.1)
Other current receivables 86600000 (2.8) 85100000 (2.9) +1.8
Inventories, incl: 65200000 (2.1) 71900000 (2.4) -9.3
Raw materials 33700000 (1.1) 25900000 (0.9) +30.1
Work in progress 28700000 (0.9) 43700000 (1.5) -34.3
Finished goods 2800000 (0.1) 2200000 (0.1) +27.3
Merchandise 100000 (0.0)
Inventory prepayments 0 (0.0)
Other inventories
Current biological assets 0 (0.0)
CURRENT ASSETS, TOTAL 536600000 (17.4) 405300000 (13.7) +32.4
NON CURRENT ASSETS
Non current financial investments, incl: 41100000 (1.3) 4600000 (0.2) +793.5
Investments in subsidiaries and associates 2000000 (0.1) 4600000 (0.2) -56.5
Financial investments 39100000 (1.3) 0 (0.0) +100
Receivables and prepayments 32900000 (1.1)
Investment property 0 (0.0)
Property, plant and equipment, incl: 2469300000 (80.0) 2473900000 (83.6) -0.2
Land (at cost) 43000000 (1.4) 43600000 (1.5) -1.4
Buildings (at cost) 1239000000 (40.1) 256600000 (8.7) +382.9
Machinery and equipment (at cost) 2061700000 (66.8) 2024900000 (68.5) +1.8
Other tangible assets (at cost) 6200000 (0.2) 5900000 (0.2) +5.1
Accumulated depreciation (-) 1484800000 (48.1) 1420600000 (48.0) +4.5
Unfinished Projects 604200000 (19.6) 953500000 (32.2) -36.6
Prepayments 610000000 (20.6)
Long term biological assets 0 (0.0)
Intangible assets, incl: 40200000 (1.3) 41100000 (1.4) -2.2
Goodwill 3500000 (0.1) 3500000 (0.1) 0
Development expenditures 800000 (0.0) 0 (0.0) +100
Concessions, patents, licenses, tradem. 35900000 (1.2) 37600000 (1.3) -4.5
Prepayments for intangible assets 0 (0.0)
Other intangible assets 0 (0.0)
NON CURRENT ASSETS, TOTAL 2550600000 (82.6) 2552500000 (86.3) -0.1
ASSETS, TOTAL 3087200000 (100.0) 2957800000 (100.0) +4.4
Creditinfo Eesti AS | Narva mnt 5, 10117 Tallinn | Tel: +372 665 9600 | Fax: +372 665 9601 | [email protected]
02/6
2 / 6
EXAMPLE ASReport created on: 09/03/2018

LIABILITIES AND EQUITY 31/12/17 (Proportion ,%) 01/01/17 (Proportion, %) Trend,%
CURRENT LIABILITIES
Current loan liabilities, incl: 35800000 (1.2) 31100000 (1.1) +15.1
Repayment of loans 11800000 (0.4)
Current bonds
Other loan commitments 16500000 (0.5)
incl finance lease obligations
Payables and prepayments, incl: 155400000 (5.0) 179000000 (6.1) -13.2
Trade creditors 84200000 (2.7) 89000000 (3.0) -5.4
Employee-related liabilities 19200000 (0.6) 17800000 (0.6) +7.9
Taxes payable 33900000 (1.1) 50200000 (1.7) -32.5
Other current payables 11500000 (0.4) 15300000 (0.5) -24.8
- incl. interest payable 0 (0.0)
Prepayments received 6600000 (0.2) 6700000 (0.2) -1.5
Government grants 0 (0.0)
Provisions 57800000 (1.9) 39700000 (1.3) +45.6
CURRENT LIABILITIES, TOTAL 249000000 (8.1) 249800000 (8.4) -0.3
NON CURRENT LIABILITIES
Non current loan commitments, total 928500000 (30.1) 932500000 (31.5) -0.4
Loans, notes and financial lease payables 926700000 (30.0) 932500000 (31.5) -0.6
Other non current loan commitments 1800000 (0.1) 0 (0.0) +100
Payables and prepayments 181000000 (5.9) 172600000 (5.8) +4.9
Non current provisions 30700000 (1.0) 31000000 (1.0) -1
Non current government grants 0 (0.0)
NON CURRENT LIABILITIES, TOTAL 1140200000 (36.9) 1136100000 (38.4) +0.4
LIABILITIES, TOTAL 1389200000 (45.0) 1385900000 (46.9) +0.2
EQUITY
Minority shareholding 900000 (0.0) 1100000 (0.0) -18.2
Majority shareholding 1697100000 (55.0) 1570800000 (53.1) +8
Issued capital 621600000 (20.1) 621600000 (21.0) 0
Unregistered equity 0 (0.0)
Share premium 259800000 (8.4) 259800000 (8.8) 0
Treasury shares 0 (0.0)
Statutory reserv capital 62100000 (2.0) 62100000 (2.1) 0
Other reserves -16600000 (0.5) 27800000 (0.9) -159.7
Unpaid capital
Other equity
Retained earnings/loss 599200000 (19.4) 559000000 (18.9) +7.2
Annual period profit/loss 171000000 (5.5) 40500000 (1.4) +322.2
EQUITY, TOTAL 1698000000 (55.0) 1571900000 (53.1) +8
LIABILITIES AND EQUITY, TOTAL 3087200000 (100.0) 2957800000 (100.0) +4.4
Creditinfo Eesti AS | Narva mnt 5, 10117 Tallinn | Tel: +372 665 9600 | Fax: +372 665 9601 | [email protected]
03/6
3 / 6
EXAMPLE ASReport created on: 09/03/2018

> Consolidated Income Statement (EUR)
SCHEME 1 201701/01/17-31/12/17 (Percentage,%)
201601/01/16-31/12/16 (Percentage,%) Trend,%
REVENUE 742100000 (100.0) 776700000 (100.0) -4.5
Other income 89600000 (12.1) 16700000 (2.2) +436.5
Changes in inventories of agricultural production 0 (0.0)
Profit/loss from biological assets 0 (0.0)
Changes in inventories of finished goods -14500000 (2.0) 28000000 (3.6) -151.8
Work performed by entity and capitalised 0 (0.0)
Raw materials and consumables used -290000000 (39.1) -326700000 (42.1) -
Other operating expense -69700000 (9.4) -89300000 (11.5) -
Employee expense, incl: -130200000 (17.5) -139600000 (18.0) -
Wages and salaries -105300000 (14.2) 0 (0.0) -
Social security costs 0 (0.0)
Pension expenses 0 (0.0)
Other employee expenses -24900000 (3.4) 0 (0.0) -
Depreciation and impairment loss reversal -143400000 (19.3) -208600000 (26.9) -
Significant impairment of current assets
Other expense 0 (0.0)
TOTAL PROFIT/LOSS 183900000 (24.8) 57200000 (7.4) +221.5
Financial income and expenses, incl: -12800000 (1.7) -1800000 (0.2) -
Profit/Loss from subsidiaries and associates
Profit/Loss from financial investments 2500000 (0.3)
Interest income 300000 (0.0)
Interest expense -14500000 (2.0) -10600000 (1.4) -
Other financial income and expenses 1400000 (0.2) 6300000 (0.8) -77.8
TOTAL PROFIT/LOSS BEFORE TAX 171100000 (23.1) 55400000 (7.1) +208.8
Income tax expense -100000 (0.0) -14900000 (1.9) -
TOTAL ANNUAL PERIOD PROFIT/LOSS, incl: 171000000 (23.0) 40500000 (5.2) +322.2
Parent company's share 170900000 (23.0) 40500000 (5.2) +322
Minority shareholder's share 100000 (0.0) 0 (0.0) +100
Other comprehensive profit/loss -44400000 (6.0) -24900000 (3.2) -
ANNUAL COMPREHENSIVE PROFIT/LOSS 126600000 (17.1) 15600000 (2.0) +711.5
Creditinfo Eesti AS | Narva mnt 5, 10117 Tallinn | Tel: +372 665 9600 | Fax: +372 665 9601 | [email protected]
04/6
4 / 6
EXAMPLE ASReport created on: 09/03/2018
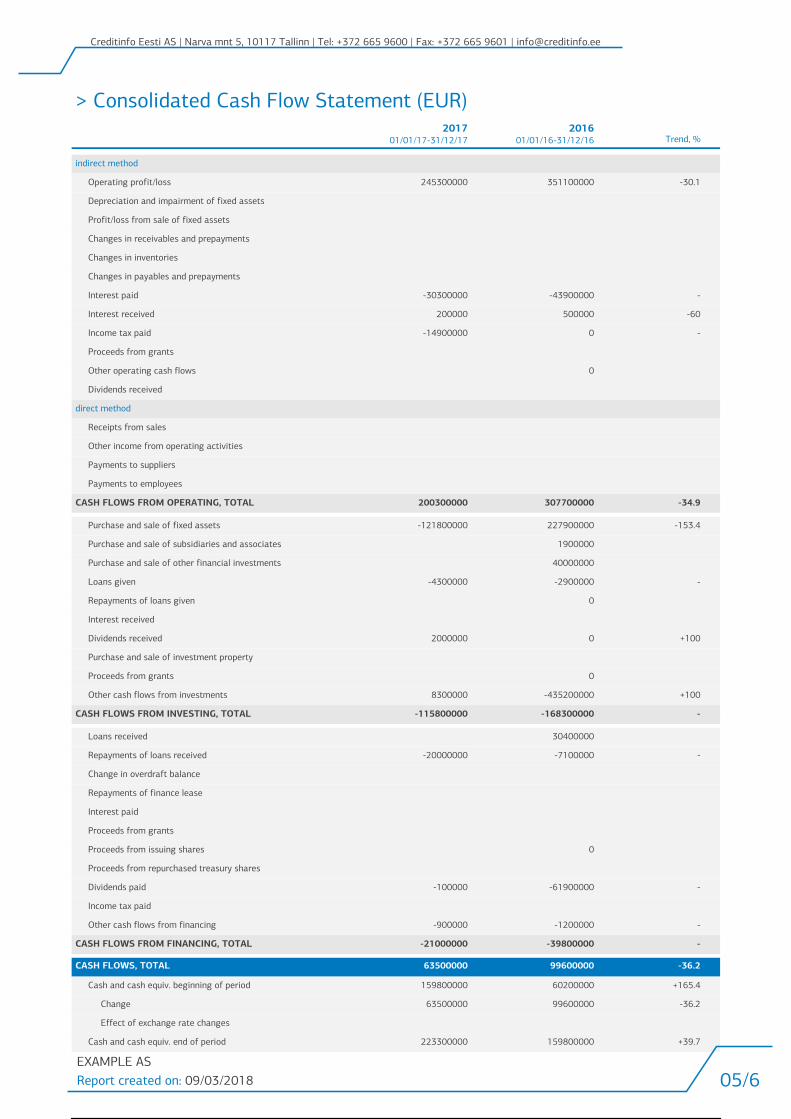
> Consolidated Cash Flow Statement (EUR)2017
01/01/17-31/12/172016
01/01/16-31/12/16 Trend, %
indirect method
Operating profit/loss 245300000 351100000 -30.1
Depreciation and impairment of fixed assets
Profit/loss from sale of fixed assets
Changes in receivables and prepayments
Changes in inventories
Changes in payables and prepayments
Interest paid -30300000 -43900000 -
Interest received 200000 500000 -60
Income tax paid -14900000 0 -
Proceeds from grants
Other operating cash flows 0
Dividends received
direct method
Receipts from sales
Other income from operating activities
Payments to suppliers
Payments to employees
CASH FLOWS FROM OPERATING, TOTAL 200300000 307700000 -34.9
Purchase and sale of fixed assets -121800000 227900000 -153.4
Purchase and sale of subsidiaries and associates 1900000
Purchase and sale of other financial investments 40000000
Loans given -4300000 -2900000 -
Repayments of loans given 0
Interest received
Dividends received 2000000 0 +100
Purchase and sale of investment property
Proceeds from grants 0
Other cash flows from investments 8300000 -435200000 +100
CASH FLOWS FROM INVESTING, TOTAL -115800000 -168300000 -
Loans received 30400000
Repayments of loans received -20000000 -7100000 -
Change in overdraft balance
Repayments of finance lease
Interest paid
Proceeds from grants
Proceeds from issuing shares 0
Proceeds from repurchased treasury shares
Dividends paid -100000 -61900000 -
Income tax paid
Other cash flows from financing -900000 -1200000 -
CASH FLOWS FROM FINANCING, TOTAL -21000000 -39800000 -
CASH FLOWS, TOTAL 63500000 99600000 -36.2
Cash and cash equiv. beginning of period 159800000 60200000 +165.4
Change 63500000 99600000 -36.2
Effect of exchange rate changes
Cash and cash equiv. end of period 223300000 159800000 +39.7
Creditinfo Eesti AS | Narva mnt 5, 10117 Tallinn | Tel: +372 665 9600 | Fax: +372 665 9601 | [email protected]
05/6
5 / 6
EXAMPLE ASReport created on: 09/03/2018

Creditinfo Eesti AS | Narva mnt 5, 10117 Tallinn | Tel: +372 665 9600 | Fax: +372 665 9601 | [email protected]
06/6
Information given in this report has been gathered from public sources. Creditinfo Eesti AS does not guarantee the reliability or the accuracy of the sources oræthe sufficiency and adequacy of the report. Creditinfo Eesti AS is not liable for any direct or indirect loss or damage caused by use of this report
Report created on:æ09/03/2018
Powered by TCPDF (www.tcpdf.org)
6 / 6