annual budget report - brownsville public utilities board€¦ · annual budget report october 1,...
TRANSCRIPT

Annual Budget Report October 1, 2015 – September 30, 2016
Front cover top, left to right:
1) Linemen working on re-wiring a recently replaced transformer bank.
2) BPUB dredger working on the Dean Porter Park Resaca to increase raw water storage.
3) Evening shot of the Robindale Wastewater Treatment Plant.
Front cover bottom:
4) BPUB’s executive team, directors, managers, and staff standing united in support of the
Strategic Business Plan.
Brownsville Public Utilities Board A Component Unit of the City of Brownsville, Texas
ANNUAL BUDGET REPORT For the period ending September 30, 2016
Prepared by Finance Department
Leandro G. García, CPA Chief Financial Officer
[email protected] HUwww.brownsville-pub.comU
1425 Robinhood Drive
Brownsville, Texas 78523-3270 Telephone: 956-983-6100

i
THIS PAGE INTENTIONALLY LEFT BLANK
ii
FISCAL YEAR 2016 TABLE OF CONTENTS
HUOVERVIEWUH UPAGE Organizational Chart ...........................................................................................................................3 Summary Letter ..................................................................................................................................7 GFOA Distinguished Budget Presentation Award ............................................................................30 Budget Program .................................................................................................................................31 Budget Preparation Process & Procedures ........................................................................................32 Budget Preparation Calendar .............................................................................................................35 Significant Policies ............................................................................................................................36 HBUDGET RECAP Total Combined Utility Requirements ...............................................................................................46 FY 2016 Uses of Funds......................................................................................................................46 FY 2016 Requirements as a Percent of Total Budget ........................................................................47 Budget Recap FY 2016 Revenues .....................................................................................................48 FY 2016 Revenues - Utility Percent By Revenue Type ...................................................................48 Operations & Maintenance Expense Recap By Type FY 2006 – FY 2016 .......................................49 Operations & Maintenance Expense Recap By Department & Type – FY 2016 ..............................50 Operations & Maintenance Expense Recap By Department FY 2012 – FY 2016 ............................52 Operations & Maintenance Expense Recap By Department FY 2016 Budget .................................53 FY 2016 Approved Budgeted Number of Positions By Division/Organization................................54 Net Position Computation of Change in Net Position and Funds Available for Capital and Reserve Funds ..................................................................................................................................61 Unit Sales Statistics............................................................................................................................62 Outstanding Debt ...............................................................................................................................63 Outstanding Principle Debt Through Maturity – Graph ....................................................................64 Debt Service .......................................................................................................................................65 Debt Service Requirements by Fiscal Year .......................................................................................66 HUREVENUES Sales & Services to Customers – Operating Revenues by System ....................................................68 Revenues by Source ...........................................................................................................................69 Revenues – Sources, Assumptions and Trends ..................................................................................70 Total Utility Combined Revenues & Requirements FY 2012 – FY 2016 .........................................74 Electric Revenues & Requirements FY 2012 – FY 2016 ..................................................................75 Water Revenues & Requirements FY 2012 – FY 2016 .....................................................................76 Wastewater Revenues & Requirements FY 2012 – FY 2016............................................................77 HUOPERATIONS & MAINTENANCE EXPENSE BUDGET Department 1110 – General Manager ................................................................................................80 Department 1120 – Internal Audit .....................................................................................................82 Department 1125 – Key Account Marketing .....................................................................................84 Department 1130 – Communications & Administrative Services .....................................................86 Department 1135 – Communications & Public Relations .................................................................88

iii
FISCAL YEAR 2016 TABLE OF CONTENTS
UPAGE Department 1140 – Organizational Development ............................................................................... 90 Department 1145 – Energy Services.................................................................................................... 92 Department 1150 – Board of Directors ................................................................................................ 94 Department 1165 – Records Management ........................................................................................... 96 Department 1410 – Environmental Services .......................................................................................98 Department 1420 – Environmental Compliance ................................................................................100 Department 1422 – Analytical Laboratory ........................................................................................102 Department 1430 – Pre-Treatment.....................................................................................................104 Department 1440 – Health & Safety ..................................................................................................106 Department 2110 – Trans, Dist, Substations & Planning ..................................................................108 Department 2120 – Substations & Relaying ......................................................................................110 Department 2130 – Electric Transmission & Distribution New Construction ..................................112 Department 2140 – Electric Transmission & Distribution Maintenance...........................................114 Department 2150 – Energy Control Center Operations .....................................................................116 Department 2210 – SCADA & Electrical Support Services .............................................................118 Department 2220 – Power Production ...............................................................................................122 Department 2310 – Electric Meter Shop ...........................................................................................124 Department 2410 – Electric Engineering ...........................................................................................126 Department 3110 – Water & Wastewater Engineering & Operations ...............................................128 Department 3120 – Water Plant I ......................................................................................................130 Department 3130 – Water Plant II .....................................................................................................132 Department 3135 – Resaca Maintenance ...........................................................................................134 Department 3140 – Raw Water Supply .............................................................................................136 Department 3145 – Water & Wastewater Plant Maintenance ...........................................................138 Department 3150 – Water & Wastewater Operations & Construction ..............................................140 Department 3210 – South Wastewater Treatment Plant ....................................................................142 Department 3220 – Robindale Wastewater Treatment Plant .............................................................144 Department 3230 – Wastewater Lift Stations ....................................................................................146 Department 3310 – Water & Wastewater Engineering .....................................................................148 Department 4105 – Operations ..........................................................................................................150 Department 4110 – Energy Risk Management ..................................................................................152 Department 4210 – NERC Compliance .............................................................................................154 Department 4220 – Fuel & Energy Supply........................................................................................156 Department 4230 – Natural Gas Utility Management .......................................................................158 Department 4310 – Operational Support Services.............................................................................160 Department 5110 – Finance ...............................................................................................................162 Department 5120 – Accounting .........................................................................................................164 Department 5130 – Purchasing ..........................................................................................................166 Department 5140 – Revenue Recovery .............................................................................................168 Department 6105 – Customer & Information Services .....................................................................170 Department 6110 – Customer Service ...............................................................................................172 Department 6115 – Collections .........................................................................................................174
iv
FISCAL YEAR 2016 TABLE OF CONTENTS
PAGE Department 6120 – Billing.................................................................................................................176 Department 6125 – Call Center .........................................................................................................178 Department 6130 – Meter Services....................................................................................................180 Department 6135 – CIS Support ........................................................................................................182 Department 6145 – Energy Efficiency & Conservation ....................................................................184 Department 6150 – Meter Reading ....................................................................................................186 Department 6160 – Cashiers ..............................................................................................................188 Department 7120 – Risk/Insurance Management ..............................................................................190 Department 7130 – Information Technology ....................................................................................192 Department 7135 – Geographic Information Systems.......................................................................194 Department 7140 – Human Resources ..............................................................................................196 Department 7145 – Talent Acquisition and Staffing .........................................................................198 Department 7150 – Fleet Management ..............................................................................................200 Department 7160 – Facility Maintenance ..........................................................................................202 Department 7170 – Warehouse ..........................................................................................................204 Department 9110 – Company-wide Expenses ...................................................................................206 Department 9150 – Prior FY Encumbered Budget ............................................................................208 HUCAPITAL BUDGET UH Five-Year Capital Improvement Plan – Summary by Funding Source .............................................210 Five-Year Capital Improvement Plan – Summary by Utility Chart ..................................................211 FY 2016 Capital Budget Summary ....................................................................................................212 FY 2016 Capital Budget by Funding Source .....................................................................................213 FY 2016 Capital Budget by System ..................................................................................................214 Five-year Capital Improvements Plan Project Summary ...................................................................215 Capital Budget Summary – Improvement Fund Projects (Fund 400) ...............................................321 Capital Budget Summary – Impact Fees Fund Projects (Fund 410) .................................................325 Capital Budget Summary – Future Debt Bond Proceeds Projects (Commercial Paper Fund 405) ...326 Capital Budget Summary – Grant Proceeds Projects (Fund 200)......................................................330 Summary Expenditure Report For All Carryover Projects – FY 2015 – Improvement Fund (Fund 400) ........................................................................................................................................331 Capital Project Listing – FY 2015 For All Carryover General & Administrative Utility Projects – Improvement Fund (Fund 400) .......................................................................................332 Capital Project Listing – FY 2015 For All Carryover Electric Utility Projects – Improvement Fund (Fund 400) ..............................................................................................................................333 Capital Project Listing – FY 2015 For All Carryover Water Utility Projects – Improvement Fund (Fund 400) ..............................................................................................................................342 Capital Project Listing – FY 2015 For All Carryover Wastewater Utility Projects – Improvement Fund (Fund 400) ..............................................................................................................................343 Capital Project Listing – FY 2015 For All Carryover Water & Wastewater Utility Projects – Improvement Fund (Fund 400) ........................................................................................................345

v
FISCAL YEAR 2016 TABLE OF CONTENTS
PAGE Summary Expenditure Report For All Carryover Projects – FY 2015 – For All Other Capital Funds ................................................................................................................................................347 Capital Project Listing – FY 2015 For All Carryover Projects – Future Debt Bond Proceeds Projects (Commercial Paper Fund 405) ...........................................................................................348 Capital Project Listing – FY 2015 For All Carryover Projects – Impact Fees Fund Projects (Fund 410) ........................................................................................................................................352 Capital Project Listing – FY 2015 For All Carryover Projects – Grant Proceeds (Fund 200) ........................................................................................................................................353 HUGRANTS UH Grant Schedule ...................................................................................................................................356 HUAPPENDICES UH Appendices Section ...........................................................................................................................360 Appendix A – Operations Expense Analysis By Account ................................................................361 Appendix B – Brownsville PUB Description, Service Territory Maps .............................................364 Appendix C – Glossary ......................................................................................................................371 Appendix D – Financial Trends Balance Sheets ..........................................................................................................382 Statements of Revenues, Expenses, and Changes in Net Position ...........................384 Revenue Capacity Average Number of Services Billed By Utility – Last Ten Years ............................386 Revenues By Utility – Last Ten Years .....................................................................388 Unit Sales By Utility – Last Ten Years ....................................................................389 Ten-Year Rate Analysis – Residential Rates ............................................................390 Debt Capacity Computation of Debt Service Coverage – Last Ten Years .......................................392 Appendix E – Demographic and Economic Information General Information Regarding the City ..................................................................394 Demographic Statistics – Last Ten Fiscal Years ......................................................401 Appendix F – Operating Information Expenses By Utility – Last Ten Years ......................................................................404 Electric Energy Sources, Water and Wastewater Statistics – Last Ten Years ..........406

- 1 -
OVERVIEW

- 2 -
BOARD OF DIRECTORS As of September 30, 2015
Edna Oceguera ........................................................................................................................................ Chair Nurith Galonsky ............................................................................................................................. Vice-Chair Rafael Vela....................................................................................................................... Secretary/Treasurer Noemi Garcia ..................................................................................................................................... Member Martin C. Arambula ........................................................................................................................... Member Rafael S. Chacon ................................................................................................................................ Member Mayor Antonio Martinez ................................................................................................. Ex-Officio Member BOARD ADMINISTRATION John S. Bruciak, P.E. ............................................................ General Manager and Chief Executive Officer Fernando Saenz, P.E. ............................................. Assistant General Manager and Chief Operating Officer Leandro G. García, CPA ............................................................................................. Chief Financial Officer
CITY OF BROWNSVILLE, TEXAS
City Hall/Market Square P.O. Box 911
Brownsville, Texas 78520 Telephone: 956-548-6000
CITY COMMISSION Antonio Martinez. ................................................................................................................................. Mayor Cesar de Leon ................................................................................................... Commissioner, At-Large "A" Rose M.Z. Gowen, M.D.................................................................................... Commissioner, At-Large "B" Ricardo Longoria, Jr. ............................................................................................... Commissioner, District 1 Jessica Tetreau-Kalifa .............................................................................................. Commissioner, District 2 Deborah Portillo ....................................................................................................... Commissioner, District 3 John L. Villarreal ..................................................................................................... Commissioner, District 4
-3-
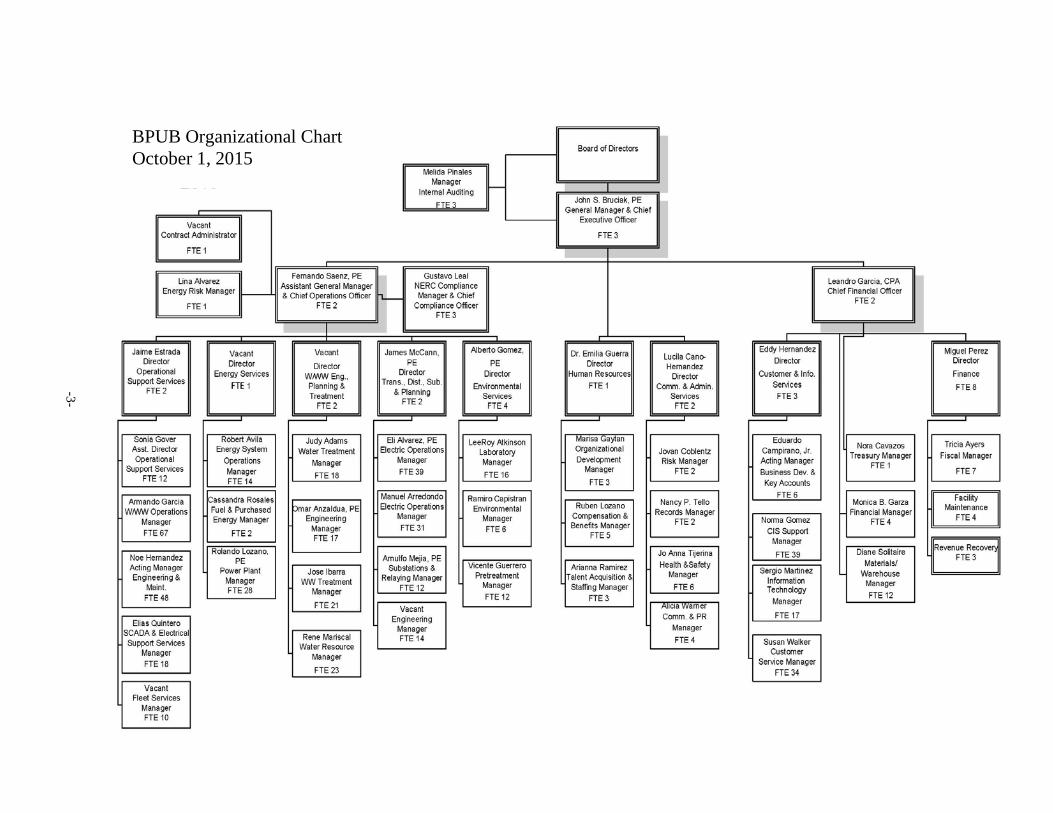
BPUB Organizational Chart October 1, 2015

- 4 -
General Manager & Chief Executive Officer
John S. Bruciak, P.E.
Assistant General Manager & UChief Operating Officer
Chief Financial Officer
Fernando Saenz, P.E. Leandro G. Garcia, CPA
Human Resources Internal Audit Communications &
Administrative Services UOP
Dr. Emilia Guerra
Director Melida Pinales
Manager Lucila Cano-Hernandez
Director
Final Approved Positions Department Department Name FY
2012
FY 2013
FY 2014
FY 2015
FY 2016
Change from FY 2015 to
FY 2016 1110 1120 1130 1135 1140 1165 1440 7120 7140 7145
General Manager Internal Audit Communications & Admin Svc Communications & Public Relations Organizational Development Records Management Health & Safety Risk/Insurance Management Human Resources Talent Acquisition and Staffing
5 3 4 3 3 0 5 2 7 0
4 3 2 3 3 2 6 2 8 0
5 3 2 4 3 2 6 2 9 0
4 3 2 4 3 2 6 2 9 0
3 3 2 4 3 2 6 2 6 3
-1 0 0 0 0 0 0 0 -3 3
TOTAL 32 33 36 35 34 -1 UNote: Changes in personnel counts from FY 2015 to FY 2016 are due to interdepartmental transfers. No new positions in 2016 O&M Budget.
- 5 -
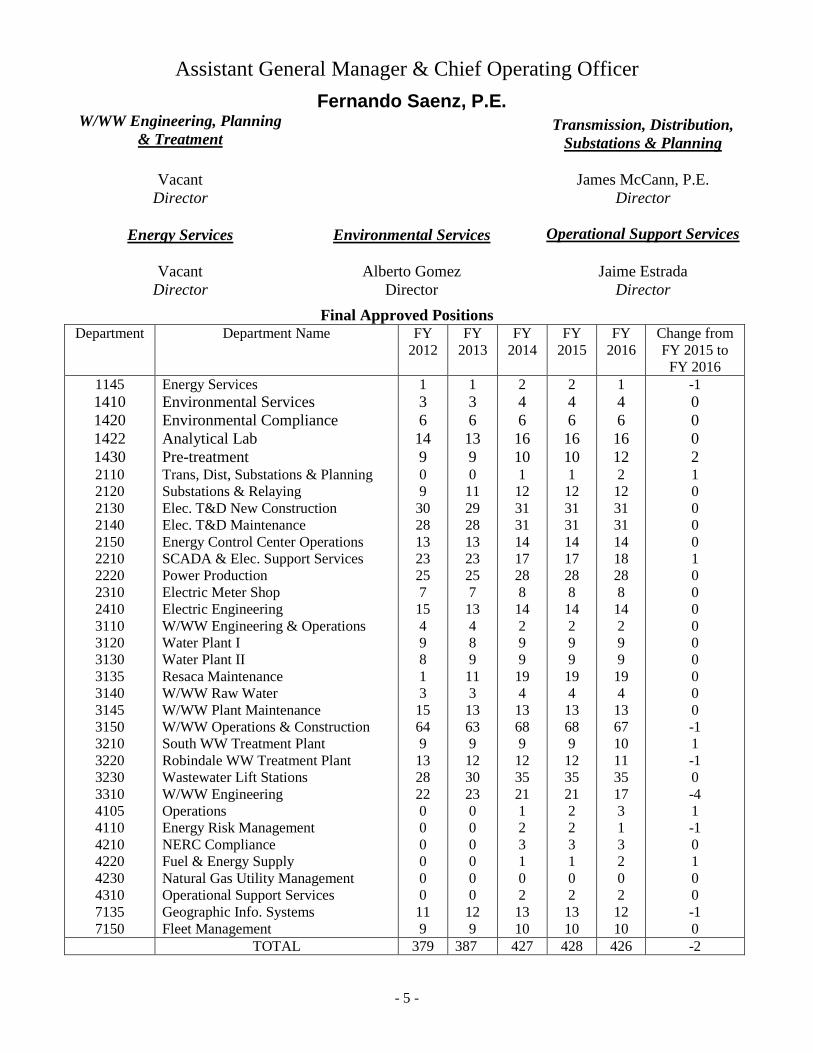
Assistant General Manager & Chief Operating Officer
Fernando Saenz, P.E. UW/WW Engineering, Planning
& Treatment
TT Transmission, Distribution,
Substations & Planning
Vacant Director
James McCann, P.E. Director
Energy Services
Environmental Services Operational Support Services UOP
Vacant
Director Alberto Gomez
Director Jaime Estrada
Director Final Approved Positions
Department Department Name FY 2012
FY 2013
FY 2014
FY 2015
FY 2016
Change from FY 2015 to
FY 2016 1145 1410 1420 1422 1430 2110 2120 2130 2140 2150 2210 2220 2310 2410 3110 3120 3130 3135 3140 3145 3150 3210 3220 3230 3310 4105 4110 4210 4220 4230 4310 7135 7150
Energy Services Environmental Services Environmental Compliance Analytical Lab Pre-treatment Trans, Dist, Substations & Planning Substations & Relaying Elec. T&D New Construction Elec. T&D Maintenance Energy Control Center Operations SCADA & Elec. Support Services Power Production Electric Meter Shop Electric Engineering W/WW Engineering & Operations Water Plant I Water Plant II Resaca Maintenance W/WW Raw Water W/WW Plant Maintenance W/WW Operations & Construction South WW Treatment Plant Robindale WW Treatment Plant Wastewater Lift Stations W/WW Engineering Operations Energy Risk Management NERC Compliance Fuel & Energy Supply Natural Gas Utility Management Operational Support Services Geographic Info. Systems Fleet Management
1 3 6 14 9 0 9
30 28 13 23 25 7
15 4 9 8 1 3
15 64 9
13 28 22 0 0 0 0 0 0
11 9
1 3 6 13 9 0
11 29 28 13 23 25 7
13 4 8 9
11 3
13 63 9
12 30 23 0 0 0 0 0 0
12 9
2 4 6 16 10 1
12 31 31 14 17 28 8
14 2 9 9
19 4
13 68 9
12 35 21 1 2 3 1 0 2
13 10
2 4 6 16 10 1
12 31 31 14 17 28 8
14 2 9 9
19 4
13 68 9
12 35 21 2 2 3 1 0 2
13 10
1 4 6 16 12 2
12 31 31 14 18 28 8
14 2 9 9
19 4
13 67 10 11 35 17 3 1 3 2 0 2
12 10
-1 0 0 0 2 1 0 0 0 0 1 0 0 0 0 0 0 0 0 0 -1 1 -1 0 -4 1 -1 0 1 0 0 -1 0
TOTAL 379 387 427 428 426 -2 U
- 6 -
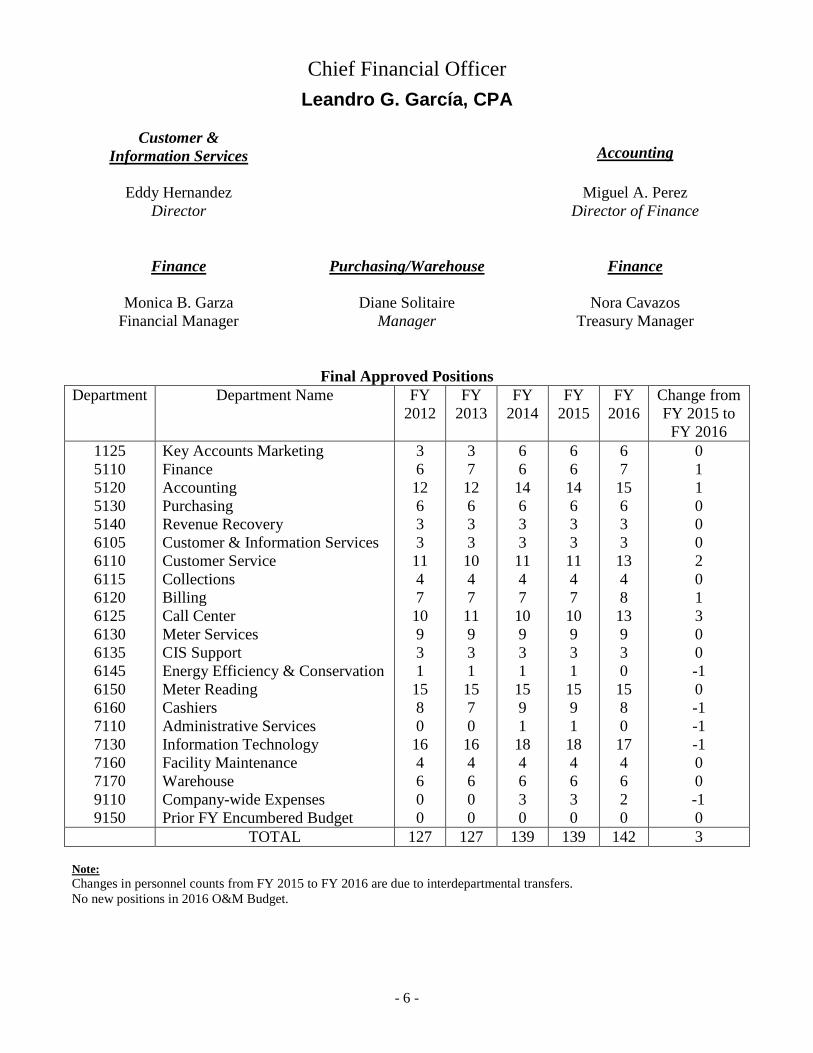
Chief Financial Officer
Leandro G. García, CPA
Customer & Information Services
U
Accounting
Eddy Hernandez Director
Miguel A. Perez Director of Finance
Finance
UPurchasing/Warehouse
Finance
Monica B. Garza Financial Manager
Diane Solitaire Manager
Nora Cavazos Treasury Manager
Final Approved Positions Department Department Name FY
2012 FY
2013 FY
2014 FY
2015 FY
2016 Change from FY 2015 to
FY 2016 1125 5110 5120 5130 5140 6105 6110 6115 6120 6125 6130 6135 6145 6150 6160 7110 7130 7160 7170 9110 9150
Key Accounts Marketing Finance Accounting Purchasing Revenue Recovery Customer & Information Services Customer Service Collections Billing Call Center Meter Services CIS Support Energy Efficiency & Conservation Meter Reading Cashiers Administrative Services Information Technology Facility Maintenance Warehouse Company-wide Expenses Prior FY Encumbered Budget
3 6 12 6 3 3 11 4 7 10 9 3 1 15 8 0 16 4 6 0 0
3 7 12 6 3 3 10 4 7 11 9 3 1 15 7 0 16 4 6 0 0
6 6 14 6 3 3 11 4 7 10 9 3 1 15 9 1 18 4 6 3 0
6 6 14 6 3 3 11 4 7 10 9 3 1 15 9 1 18 4 6 3 0
6 7 15 6 3 3 13 4 8 13 9 3 0 15 8 0 17 4 6 2 0
0 1 1 0 0 0 2 0 1 3 0 0 -1 0 -1 -1 -1 0 0
-1 0
TOTAL 127 127 139 139 142 3 Note: Changes in personnel counts from FY 2015 to FY 2016 are due to interdepartmental transfers. No new positions in 2016 O&M Budget.

- 7 -
December 1, 2015 We are pleased to present the Fiscal Year 2016 Budget of the Public Utilities Board of the City of Brownsville, Texas (Brownsville PUB). This budget funds the Brownsville PUB’s three essential utility services: Electric, Water, and Wastewater. This document is the final step in a process that begins in May and extends until the budget is finally adopted in September. It is the culmination of many weeks and months of discussion and preparation by department heads, various staff members within those departments, the Executive Team and the Board of Directors. This Budget is submitted in accordance with Brownsville PUB policy and is comprised of the Revenue Budget, Operations & Maintenance Expense (O&M) Budget, Debt Service and Capital Budget. As required by policy, the document presents a balanced budget (i.e., expenses and transfers do not exceed revenues) of $194.94 million. The budget has been prepared using the accrual basis of accounting. Revenues and expenses are subject to appropriation of the Brownsville PUB’s enterprise fund. This budget supports our mission that by 2018, Brownsville PUB will be the foundation for our community’s future by providing reliable infrastructure, competitive rates, and exceptional customer service. Despite abnormal weather patterns caused by El Nino, which brought milder temperatures and drought ending rainfall amounts, BPUB ended the fiscal year in a strong financial position. The Brownsville PUB’s FY 2016 Budget supports the Board’s strategic goals which are to have the Necessary Infrastructure to Effectively Provide Reliable and Exceptional Service at Competitive Rates; Become the Employer of Choice; to have Key Processes Meet and Exceed Process Performance Measures; to Expand and Enhance Understanding of Brownsville PUB’s Value to the Community and Communicate Board Management Decisions to Employees; have all Brownsville PUB employees Know, Understand, and “Live” the Core Values in their Daily Work Routines. All three utilities provide 24-hours-per-day/7 days-per-week/365 days-per-year operations and essential service delivery to meet our customers’ electric, water and wastewater service needs. Without reducing services, we have prioritized funding to ensure system reliability, regulatory compliance, resource sustainability, health and safety, community benefits and jobs, as well as environmental justice and stewardship. The Budget is more than a projection of revenues and expenses for the upcoming year. The Budget is the financial guide for the operation of the Brownsville PUB during the upcoming fiscal year. The adoption of this document is one of the most significant actions taken by the Board annually. The Budget establishes the financial limits used to provide utility services to the Brownsville PUB

- 8 -
customers. It serves as the ultimate guide for the General Manager & CEO and staff when planning, organizing and implementing the policies needed to provide safe, reliable service at the most economical rates possible. The Revenue, O&M, Debt Service and Capital Budgets were presented and approved by the Board on September 14, 2015. Preparing the FY 2016 Budget required that sales projections be based on the continuation of recent weather patterns and economic trends in the new fiscal year. As a result of these factors, while acknowledging BPUB’s strong financial performance in recent years, management decided to take a conservative approach to the forecasting of revenues and expenditures. The City Commission adopted a five-year rate plan in 2012 that included increases sufficient to meet projected costs and debt coverage requirements. Rates were increased effective April 1, 2013, for the electric utility. Subsequent rate increases went into effect on October 1, 2013, 2014 for all three utilities and on October 1, 2015 for electric and water only. The proposed O&M, Personnel and Capital Budgets have been thoroughly reviewed by Executive Management, Directors, Managers and Finance Staff. This group of personnel scrutinized each budget in detail with each Department Head and recommended changes, if appropriate. The approved budget has a number of key decisions the Board considered as the budget was reviewed.
• Retirement Benefits: The approved budget includes funding of $1,389,968 to increase TMRS contribution matching from 1.5 to 2.0.
• HR Strategic Initiatives: The approved budget includes $450,000 to fund HR Initiatives tied to Brownsville PUB’s 2013-2018 Strategic Plan.
• Customer Assistance: The approved budget includes $100,000 to fund internal programs that assist customers with their electric bills.
• Subaccount - Tenaska Equity Funding: The approved budget includes funding of $10.00 million for reducing debt financing in anticipation of the issuance of bonds for the purchase of a 25% share in the proposed 800-MW natural gas-fueled Tenaska-Brownsville Generation Station.
• Operating Subaccount – Fuel Adjustment: The approved budget includes $5.00 million to mitigate increases in fuel costs and provide relief to customers as part of the Fuel & Purchased Energy Charge.
• Pay As You Go (PAYGO) – CIP Funding: The approved budget includes $8.49 million to fund Capital Improvement Projects with cash.
• Subaccount – COB USACE: The approved budget includes $500,000 to fund a Resaca study underway by the United States Army Corp of Engineers.
Major wastewater collection system improvements underway include providing first time wastewater collection service to residents in the FM 511-802 Colonias Southeast of Brownsville. The associated discharge will go to Brownsville PUB’s South Wastewater Treatment Plant through an extension of the existing conventional collection system. Brownsville PUB authorized 3 construction contracts for a total amount of $25,369,744 of which $24.5 million was funded through the Texas Water Development Board’s (TWDB) Economically Distressed Areas Program (EDAP). The budget policy, budget preparation process and budget preparation calendar are presented in additional detail on pages 31 through 35.

- 9 -
FY 2016 BUDGET The Budget for FY 2016 is divided into six major sections:
1. OVERVIEW – This section includes the following information: a. Organizational Chart b. Summary Letter c. GFOA Distinguished Budget Presentation Award for FY Beginning 10/1/14 d. Budget Program e. Budget Preparation Process & Procedures f. Budget Preparation Calendar g. Significant Policies h. Total Combined Utility Requirements Chart i. FY 2016 Uses of Funds Chart j. FY 2016 Requirements as a Percent of Total Budget Chart k. Budget Recap FY 2016 Revenues l. FY 2016 Revenues - Utility Percent by Revenue Type Chart m. O&M Expenses Recap by Type FY 2006 – FY 2016 n. O&M Expenses Recap by Department & Type – FY 2016 o. O&M Expenses Recap by Department FY 2012 – FY 2016 p. O&M Expenses Recap by Department FY 2016 Budget q. FY 2016 Approved Budgeted Number of Positions by Division/Organization r. Net Position Computation of Change in Net Position and Funds Available for
Capital and Reserve Funds s. Unit Sales Statistics t. Outstanding Debt u. Outstanding Principal Debt Through Maturity - Graph v. Debt Service w. Debt Service Requirements by Fiscal Year
2. REVENUES – Contains the historical and forecasted revenues for each utility system, and
discussion about revenue sources and trends.
3. O&M EXPENSE BUDGET – Contains the Operations & Maintenance Expenses summarized by Department, and by Account. Also included is a description of each department’s major functions, accomplishments and performance measures.
4. CAPITAL BUDGET – Contains details of the funding sources and expenditures needed for
facilities extensions, plant expansions and improvements, machinery, and vehicles.
5. GRANTS – Contains details of grants, funding agencies, grant amounts, and grant period.
6. APPENDICES – Contains a description of Brownsville PUB’s Operations Expense Analysis by Account, maps of the Utility’s service territory, a glossary and statistical section.
U

- 10 -
STRATEGIC PLAN In 2008, Brownsville PUB launched the 2008-2013 Strategic Plan, which identified issues and strategies required to reach defined goals and to move the organization toward its Mission/Strategic Destination. For the past five years, the Strategic Plan has inspired stronger interdepartmental communication and cooperation, and increased employee involvement in Brownsville PUB’s planning culture. During 2012-2013, Brownsville PUB updated its Strategic Plan to identify the key issues that will influence the utility’s efforts over the next five years. The updated Strategic Plan was presented to the Board of Directors in October 2013 and was adopted by the Board on December 9, 2013. Brownsville PUB’s Strategic Plan continues to promote strategies about the workforce, internal and external communications, and business processes that continue to be important areas in which to focus the utility’s efforts. Issues identified in the updated strategic plan revolve around the Brownsville PUB infrastructure and corporate culture. The issues identified in the 2013-2018 Strategic Plan will support Brownsville PUB’s Mission Statement of being the foundation for our community’s future by providing reliable infrastructure, competitive rates, and exceptional customer service. The following table summarizes each of Brownsville PUB’s five priority issues, goals, and strategies as identified in the Strategic Plan for implementation.
THE REMAINDER OF THIS PAGE INTENTIONALLY LEFT BLANK

- 11 -
SUMMARY – ISSUES, GOALS & STRATEGIES ISSUE GOAL STRATEGIES 1 We must address
our growing infrastructure and business demands.
BPUB will have the necessary infrastructure to effectively provide reliable and exceptional service at competitive rates.
1. Optimizing and integrating the use of technology increases efficiency.
2. Environmental stewardship enables the community to conserve resources.
3. Preventative maintenance programs improve quality and reliability.
4. A business plan builds the foundation for a successful natural gas utility system.
5. Adequate infrastructure provides reliable service, supports a growing community, and is in alignment with the Greater Brownsville Infrastructure Development Plan.
2 A skilled and knowledgeable workforce must be attracted, developed, and retained.
BPUB will become the employer of choice by offering competitive salaries, benefits, and career development plans for employees.
1. Identifying and addressing employee needs retains a talented and skilled workforce.
2. A competitive compensation package supports employee recruitment and retention.
3. A competitive benefits package supports employee recruitment and retention.
4. A leading recruitment program attracts the most qualified workforce.
5. Effective HR systems increase the HR Department’s productivity in attracting, retaining, and developing the workforce.
3 We must challenge how we work to improve our processes.
Key processes meet and exceed process performance measures.
1. Creating an inventory of key processes builds the foundation for improved organizational performance.
2. Streamlining existing key processes improves efficiency and effectiveness.
3. Defining and documenting processes enhances organizational performance.
4. Implementing revised key processes enables consistency and increases work quality.
4 We must improve our communications.
BPUB will expand and enhance customer and stakeholder understanding of BPUB’s value to the community. BPUB will communicate Board and Management decisions to help employees understand the reasoning behind those decisions and create an avenue for employees to provide feedback.
1. Identifying our external audiences, methods, and messages will establish effective communications.
2. Effective and open internal communications improves employee relations and morale.
3. Making the most of every customer contact improves customer relations.
4. Sharing information with key stakeholders about issues, projects, and achievements improves their knowledge and support of BPUB.
5. Partnering and participating in community organizations and events promotes goodwill and enhances BPUB’s image.
5 A value-driven corporate culture must be developed and maintained.
All BPUB employees know, understand and incorporate the core values in their daily work routines.
1. Developing and maintaining a positive work culture and environment builds employee satisfaction and success.
2. Engaging leadership leads to sustainable cultural change.
3. Integrating our core values within our business practices drives cultural change.
- 12 -
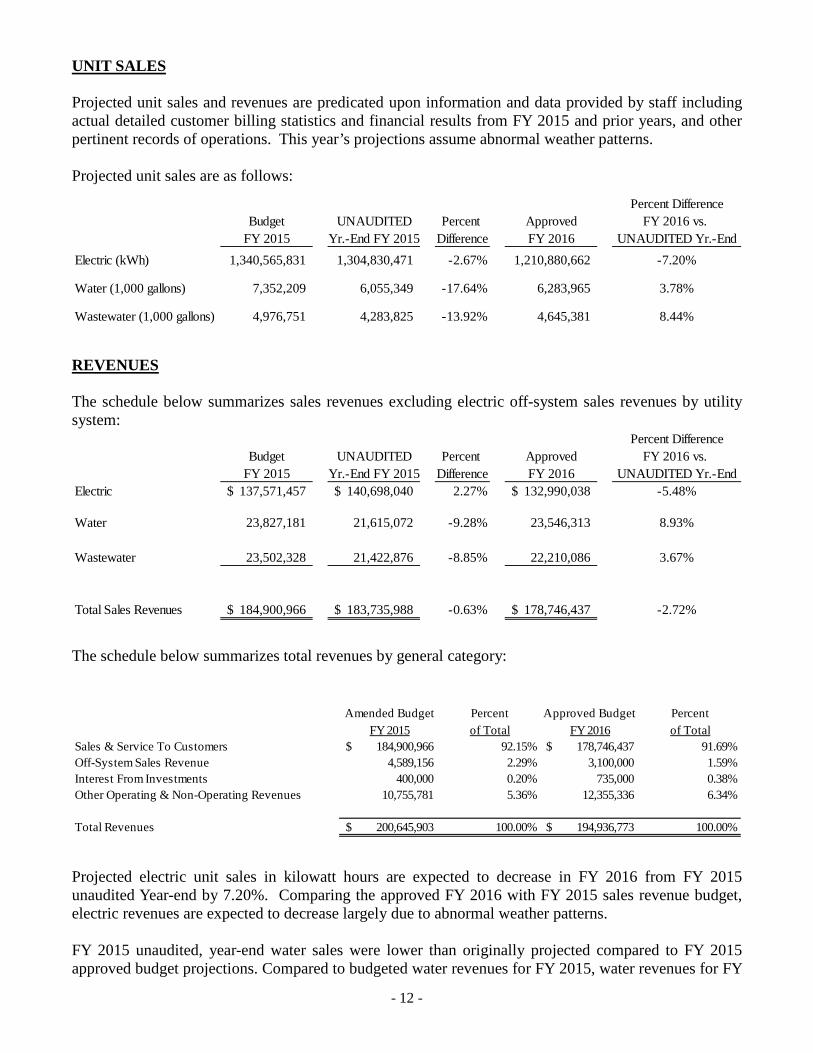
UNIT SALES Projected unit sales and revenues are predicated upon information and data provided by staff including actual detailed customer billing statistics and financial results from FY 2015 and prior years, and other pertinent records of operations. This year’s projections assume abnormal weather patterns. Projected unit sales are as follows:
Percent DifferenceBudget UNAUDITED Percent Approved FY 2016 vs.
FY 2015 Yr.-End FY 2015 Difference FY 2016 UNAUDITED Yr.-EndElectric (kWh) 1,340,565,831 1,304,830,471 -2.67% 1,210,880,662 -7.20%
Water (1,000 gallons) 7,352,209 6,055,349 -17.64% 6,283,965 3.78%
Wastewater (1,000 gallons) 4,976,751 4,283,825 -13.92% 4,645,381 8.44% U
REVENUES The schedule below summarizes sales revenues excluding electric off-system sales revenues by utility system:
Percent DifferenceBudget UNAUDITED Percent Approved FY 2016 vs.
FY 2015 Yr.-End FY 2015 Difference FY 2016 UNAUDITED Yr.-EndElectric 137,571,457$ 140,698,040$ 2.27% 132,990,038$ -5.48%
Water 23,827,181 21,615,072 -9.28% 23,546,313 8.93%
Wastewater 23,502,328 21,422,876 -8.85% 22,210,086 3.67%
Total Sales Revenues 184,900,966$ 183,735,988$ -0.63% 178,746,437$ -2.72%
The schedule below summarizes total revenues by general category:
Amended Budget Percent Approved Budget PercentFY 2015 of Total FY 2016 of Total
Sales & Service To Customers 184,900,966$ 92.15% 178,746,437$ 91.69%Off-System Sales Revenue 4,589,156 2.29% 3,100,000 1.59%Interest From Investments 400,000 0.20% 735,000 0.38%Other Operating & Non-Operating Revenues 10,755,781 5.36% 12,355,336 6.34%
Total Revenues 200,645,903$ 100.00% 194,936,773$ 100.00%
Projected electric unit sales in kilowatt hours are expected to decrease in FY 2016 from FY 2015 unaudited Year-end by 7.20%. Comparing the approved FY 2016 with FY 2015 sales revenue budget, electric revenues are expected to decrease largely due to abnormal weather patterns. FY 2015 unaudited, year-end water sales were lower than originally projected compared to FY 2015 approved budget projections. Compared to budgeted water revenues for FY 2015, water revenues for FY
- 13 -
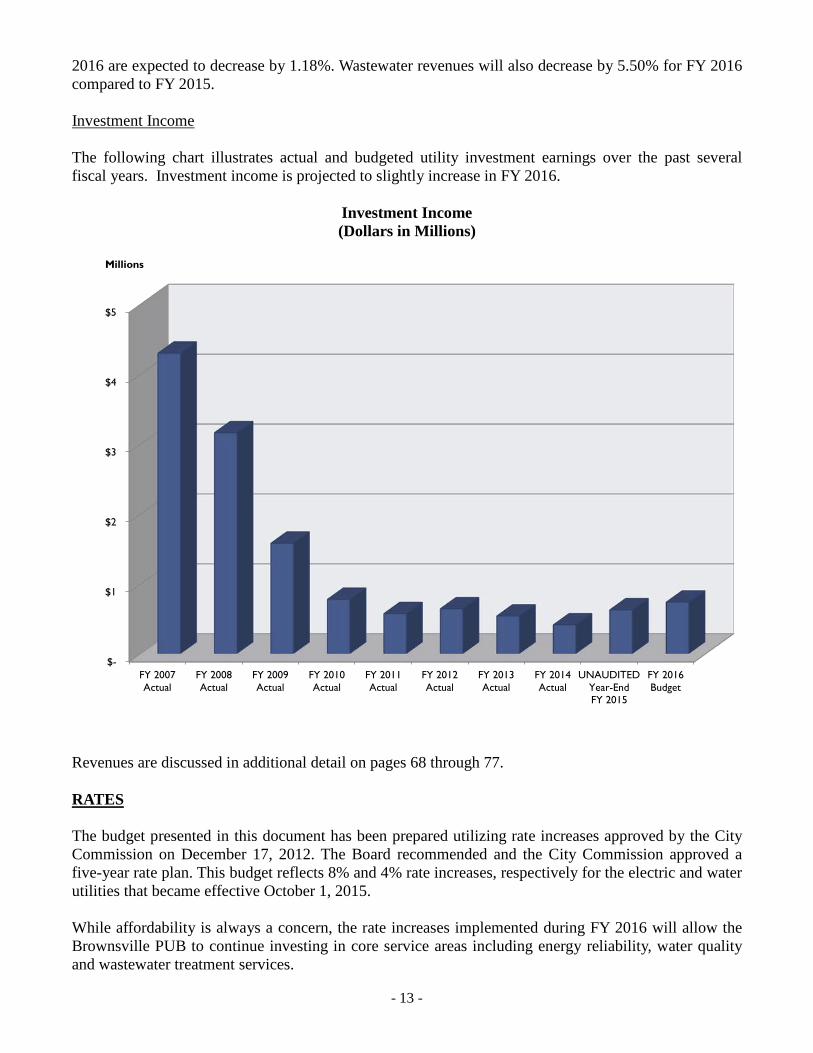
2016 are expected to decrease by 1.18%. Wastewater revenues will also decrease by 5.50% for FY 2016 compared to FY 2015. UInvestment Income The following chart illustrates actual and budgeted utility investment earnings over the past several fiscal years. Investment income is projected to slightly increase in FY 2016.
Investment Income (Dollars in Millions)
$-
$1
$2
$3
$4
$5
FY 2007Actual
FY 2008Actual
FY 2009Actual
FY 2010Actual
FY 2011Actual
FY 2012Actual
FY 2013Actual
FY 2014Actual
UNAUDITEDYear-EndFY 2015
FY 2016Budget
Millions
Revenues are discussed in additional detail on pages 68 through 77. URATES The budget presented in this document has been prepared utilizing rate increases approved by the City Commission on December 17, 2012. The Board recommended and the City Commission approved a five-year rate plan. This budget reflects 8% and 4% rate increases, respectively for the electric and water utilities that became effective October 1, 2015. While affordability is always a concern, the rate increases implemented during FY 2016 will allow the Brownsville PUB to continue investing in core service areas including energy reliability, water quality and wastewater treatment services.
- 14 -
We will compare revenues to spending on a continual basis to ensure that adequate operating requirements and reserves are maintained and improved. U
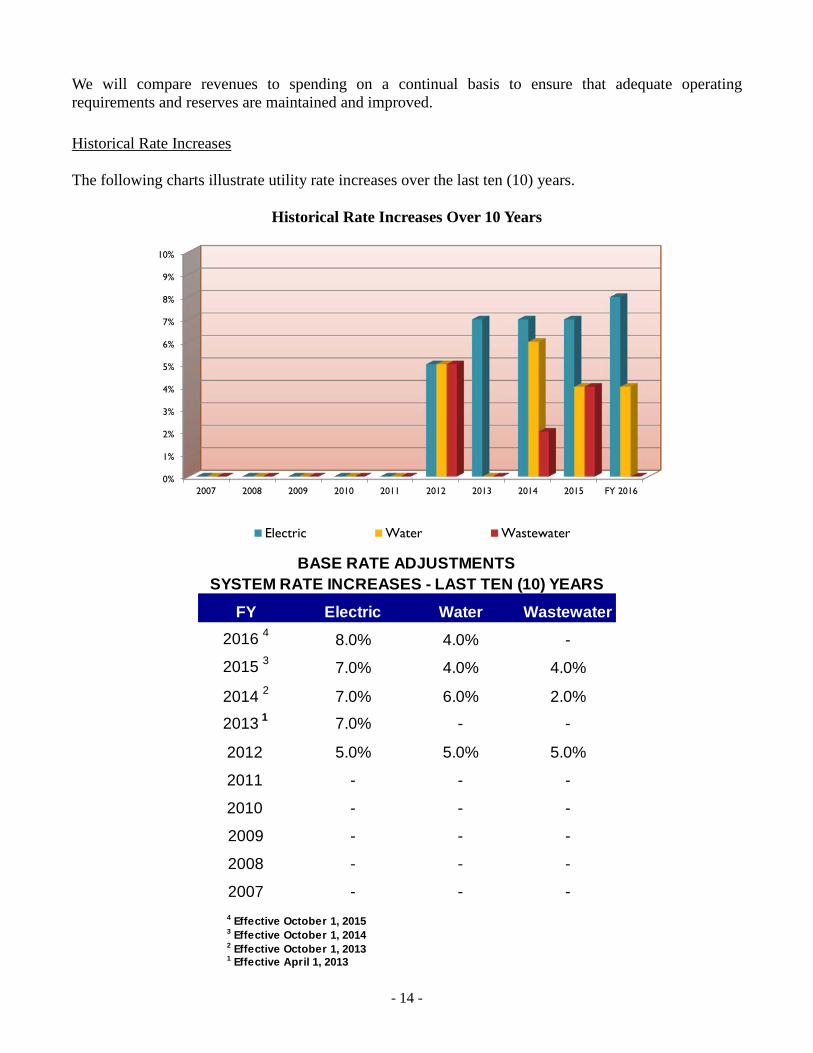
Historical Rate Increases The following charts illustrate utility rate increases over the last ten (10) years.
Historical Rate Increases Over 10 Years
0%
1%
2%
3%
4%
5%
6%
7%
8%
9%
10%
2007 2008 2009 2010 2011 2012 2013 2014 2015 FY 2016
Electric Water Wastewater
FY Electric Water Wastewater2016 4 8.0% 4.0% -
2015 3 7.0% 4.0% 4.0%
2014 2 7.0% 6.0% 2.0%
2013 1 7.0% - -
2012 5.0% 5.0% 5.0%
2011 - - -
2010 - - -
2009 - - -
2008 - - -
2007 - - -
1 Effective April 1, 2013
BASE RATE ADJUSTMENTSSYSTEM RATE INCREASES - LAST TEN (10) YEARS
3 Effective October 1, 2014 2 Effective October 1, 2013
4 Effective October 1, 2015
- 15 -
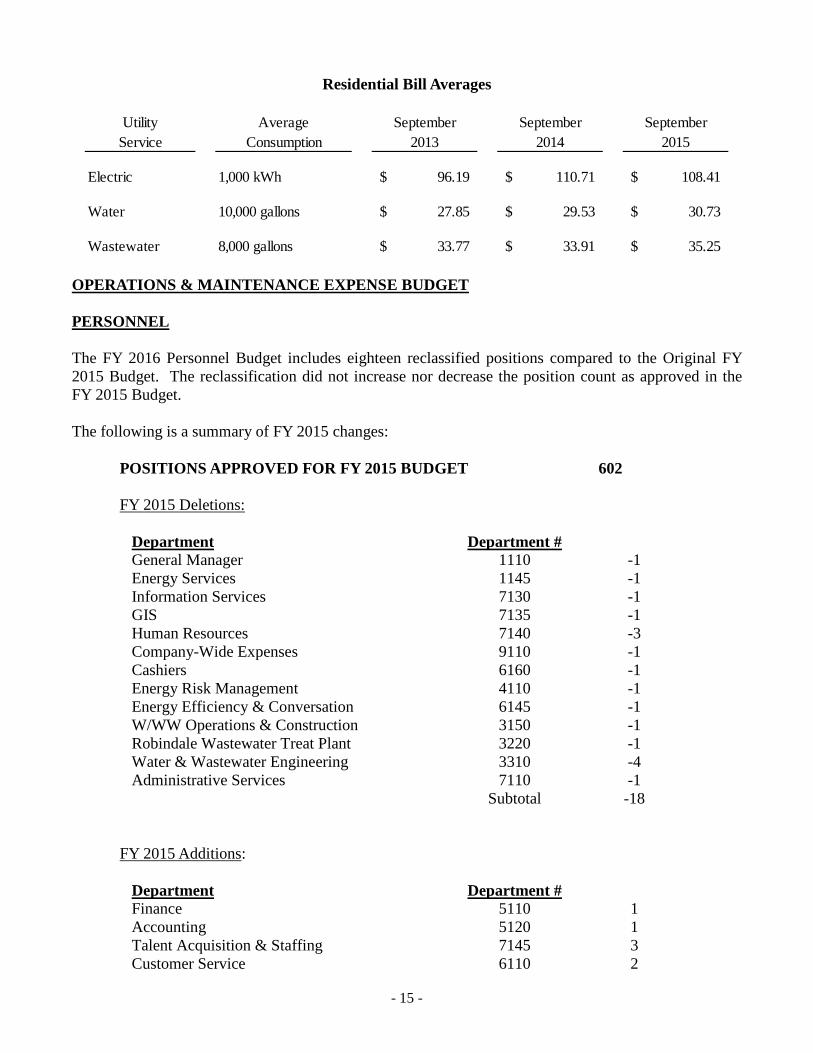
Residential Bill Averages
Utility Average September September September
Service Consumption 2013 2014 2015
Electric 1,000 kWh 96.19$ 110.71$ 108.41$
Water 10,000 gallons 27.85$ 29.53$ 30.73$
Wastewater 8,000 gallons 33.77$ 33.91$ 35.25$ OPERATIONS & MAINTENANCE EXPENSE BUDGET PERSONNEL The FY 2016 Personnel Budget includes eighteen reclassified positions compared to the Original FY 2015 Budget. The reclassification did not increase nor decrease the position count as approved in the FY 2015 Budget. The following is a summary of FY 2015 changes:
POSITIONS APPROVED FOR FY 2015 BUDGET 602 FY 2015 Deletions:
UDepartment UDepartment # General Manager 1110 -1 Energy Services 1145 -1 Information Services 7130 -1 GIS 7135 -1 Human Resources 7140 -3 Company-Wide Expenses 9110 -1 Cashiers 6160 -1 Energy Risk Management 4110 -1 Energy Efficiency & Conversation 6145 -1 W/WW Operations & Construction 3150 -1 Robindale Wastewater Treat Plant 3220 -1 Water & Wastewater Engineering 3310 -4 Administrative Services 7110 -1 Subtotal -18
FY 2015 Additions:
UDepartment UDepartment # Finance 5110 1 Accounting 5120 1 Talent Acquisition & Staffing 7145 3 Customer Service 6110 2

- 16 -
Billing 6120 1 Call Center 6125 3 Trans, Dist, Substations & Planning 2110 1 SCADA & Electrical Support Services 2210 1 Operations 4105 1 Fuel & Purchased Energy Supply 4220 1 Pre-Treatment 1430 2 South Wastewater Treat Plant 3210 1 Subtotal 18
POSITIONS FILLED FOR FY 2016 BUDGET 602 ADDITIONAL POSITIONS APPROVED 0 POSITIONS APPROVED FOR FY 2016 BUDGET 602
The number of temporary full-time employees for FY 2016 is currently at 13 as illustrated on a separate schedule on page 18. The approved Personnel Budget for FY 2015 totaled $33,193,310, a decrease of $733,322 as compared to Personnel Budget expenses for FY 2014. The approved Personnel Budget for FY 2016 totals $37,857,308, an increase of $4,663,998 or 14.05% from the Amended FY 2015 Personnel Budget. The primary increase is attributed to changes in allocation rates between O&M personnel expenses and personnel expense backcharges to capital projects. A reduction of capital projects backcharges of $3.1 million resulted in an increase in O&M personnel cost by the same amount. In addition, a change in TMRS contributions increased the personnel budget by $1.4 million.

- 17 -
NUMBER OF FULL-TIME POSITIONS
FINAL FINAL FINAL FINAL FINAL APPROVEDDEPARTMENT FY 2011 FY 2012 FY 2013 FY 2014 FY 2015 FY 2016
1110 GENERAL MANAGER 4 5 4 5 4 3 1120 INTERNAL AUDIT 3 3 3 3 3 3 1125 KEY ACCOUNT MARKETING 3 3 3 6 6 6 1130 COMMUNICATIONS & ADMINISTRATIVE SVC 3 4 2 2 2 2 1135 COMMUNICATIONS & PUBLIC RELATIONS 2 3 3 4 4 4 1140 ORGANIZATIONAL DEVELOPMENT 3 3 3 3 3 3 1145 ENERGY SERVICES 1 1 1 2 2 1 1150 BOARD OF DIRECTORS - - - - - - 1165 RECORDS MANAGEMENT - - 2 2 2 2 1410 ENVIRONMENTAL SERVICES 3 3 3 4 4 4 1440 HEALTH & SAFETY 4 5 6 6 6 6 5110 FINANCE 6 6 7 6 6 7 5120 ACCOUNTING 11 12 12 14 14 15 5130 PURCHASING 6 6 6 6 6 6 7110 ADMINISTRATIVE SERVICES - - - 1 1 - 7120 RISK/INSURANCE MANAGEMENT 1 2 2 2 2 2 7130 INFORMATION SERVICES 16 16 16 18 18 17 7135 GIS 9 11 12 13 13 12 7140 HUMAN RESOURCES 6 7 8 9 9 6 7145 TALENT ACQUISITION AND STAFFING - - - - - 3 7150 FLEET MANAGEMENT 8 9 9 10 10 10 7160 FACILITY MAINTENANCE 4 4 4 4 4 4 7170 WAREHOUSE 6 6 6 6 6 6 9110 COMPANY-WIDE EXPENSES - - - 3 3 2 TOTAL ADMINISTRATIVE 99 109 112 129 128 124
5140 REVENUE RECOVERY 2 3 3 3 3 3 6105 CUSTOMER & INFORMATION SERVICES 4 3 3 3 3 3 6110 CUSTOMER SERVICE 10 11 10 11 11 13 6115 COLLECTIONS 4 4 4 4 4 4 6120 BILLING 6 7 7 7 7 8 6125 CALL CENTER 8 10 11 10 10 13 6130 METER SERVICES 9 9 9 9 9 9 6135 CIS SUPPORT 3 3 3 3 3 3 6150 METER READING 15 15 15 15 15 15 6160 CASHIERS 8 8 7 9 9 8 TOTAL CUSTOMER SERVICE 69 73 72 74 74 79
1420 ENVIRONMENTAL COMPLIANCE 6 6 6 6 6 6 2110 TRANS, DIST, SUBSTATIONS & PLANNING - - - 1 1 2 2120 SUBSTATIONS & RELAYING 9 9 11 12 12 12 2130 ELEC TRANS & DIST NEW CONSTRUCTION 29 30 29 31 31 31 2140 ELEC TRANS & DIST MAINTENANCE 27 28 28 31 31 31 2150 ENERGY CONTROL CENTER OPERATIONS 12 13 13 14 14 14 2210 SCADA & ELECTRICAL SUPPORT SERVICES 21 23 23 17 17 18 2220 POWER PRODUCTION 23 25 25 28 28 28 2310 ELECTRIC METERS SHOP 7 7 7 8 8 8 2410 ELECTRIC ENGINEERING 15 15 13 14 14 14 4105 OPERATIONS - - - 1 2 3 4110 ENERGY RISK MANAGEMENT - - - 2 2 1 4210 NERC COMPLIANCE - - - 3 3 3 4220 FUEL & PURCHASED ENERGY SUPPLY - - - 1 1 2 4230 NATURAL GAS UTILITY MANAGEMENT - - - - - - 4310 OPERATIONAL SUPPORT SERVICES - - - 1 1 1 6145 ENERGY EFFICIENCY & CONSERVATION 1 1 1 1 1 - TOTAL ELECTRIC 150 157 156 171 172 174
1422 ANALYTICAL LAB 13 14 13 16 16 16 1430 PRE-TREATMENT 8 9 9 10 10 12 3110 W&WW ENG, PLANNING & TREATMENT 4 4 4 2 2 2 3120 WATER PLANT I 8 9 8 9 9 9 3130 WATER PLANT II 8 8 9 9 9 9 3135 RESACA MAINTENANCE - 1 11 19 19 19 3140 RAW WATER 2 3 3 4 4 4 3145 W/WW PLANT MAINTENANCE 12 15 13 13 13 13 3150 W/WW OPERATIONS & CONSTRUCTION 57 64 63 68 68 67 3210 SOUTH WASTEWATER TREAT PLANT 9 9 9 9 9 10 3220 ROBINDALE WASTEWATER TREAT PLANT 10 13 12 12 12 11 3230 WASTEWATER LIFT STATIONS 23 28 30 35 35 35 3310 WATER & WASTEWATER ENGINEERING 22 22 23 21 21 17 4310 OPERATIONAL SUPPORT SERVICES - - - 1 1 1 TOTAL WATER AND WASTEWATER 176 199 207 228 228 225
OVERALL TOTAL NO. OF POSITIONS 494 538 547 602 602 602

- 18 -
NUMBER OF TEMPORARY FULL-TIME POSITIONS
FINAL FINAL FINAL FINAL APPROVEDDEPARTMENT FY 2012 FY 2013 FY 2014 FY 2015 FY 2016
1110 GENERAL MANAGER - - 1 1 - 1125 KEY ACCOUNT MARKETING - 1 - - - 1130 COMMUNICATIONS & ADMINISTRATIVE SVC 1 - - - - 1135 COMMUNICATIONS & PUBLIC RELATIONS 2 - - - 2 1140 ORGANIZATIONAL DEVELOPMENT - - - - 1 1165 RECORDS MANAGEMENT - 1 - - 1 1440 HEALTH & SAFETY 1 - 1 1 1 5110 FINANCE - 1 - - - 5120 ACCOUNTING 2 4 - - - 5130 PURCHASING - 1 - - - 7130 INFORMATION SERVICES - 1 - - - 7135 GIS 1 1 1 1 1 7140 HUMAN RESOURCES - 1 2 2 1 7150 FLEET MANAGEMENT - 1 - - - TOTAL ADMINISTRATIVE 7 12 5 5 7
6110 CUSTOMER SERVICE - 2 4 4 1 6120 BILLING 1 - 1 1 1 6150 METER READING 3 - - - 2 6160 CASHIERS 1 2 - - - TOTAL CUSTOMER SERVICE 5 4 5 5 4
2150 ENERGY CONTROL CENTER OPERATIONS - 1 - - 1 2210 FUEL & ENERGY/SCADA 1 1 - - - 2220 POWER PLANT 3 3 - - - 2410 ELECTRIC ENGINEERING - 1 - - - TOTAL ELECTRIC 4 6 - - 1
1430 PRE-TREATMENT - 1 1 1 - 3135 RESACA MAINTENANCE - 3 - - 1 3145 W/WW PLANT MAINTENANCE - 1 - - - 3150 W/WW OPERATIONS & CONSTRUCTION 1 - - - - 3230 LIFT STATIONS - 4 - - - 3310 WATER & WASTEWATER ENGINEERING 2 - - - - TOTAL WATER AND WASTEWATER 3 9 1 1 1
OVERALL TOTAL NO. OF TEMPORARY POSITIONS 19 31 11 11 13
Note: The final count listed is as of September 30 for the given fiscal year. Employees hired on a part-time basis are not retained for the entire fiscal year. The company is flexible in hiring several positions, based on available funding.
OPERATIONS & MAINTENANCE EXPENSES The total O&M Budget for FY 2016 is $136,480,171, a decrease of $7,648,673, or -5.31% from the amended FY 2015 Budget. During FY 2015, maintenance pool funding of $600,000 was reallocated to cover unanticipated expenses.
- 19 -
The following table summarizes O&M expenses by major classifications:
Percent BudgetAmended Percent Used: Approved Variance:
Expense Budget Unaudited YTD Unaudited '15 vs Budget Approved '16 vsClassification FY 2015 FY 2015 Approved Budget '15 FY 2016 Unaudited '15Fuel & EnergyCosts 69,243,988$ 64,689,171$ 93.42% 59,000,000$ -8.79%Off-system SalesExpenses 3,763,108 2,781,118 73.90% 2,300,000 -17.30%SRWAObligations 5,738,013 5,738,013 100.00% 5,910,676 3.01%PersonnelServices 33,193,311 34,247,718 103.18% 37,857,308 10.54%Non-personnelExpenses 31,590,424 27,489,984 87.02% 31,412,187 14.27%Maintenance PoolAccount 600,000 354,732 59.12% - 0.00%Overall Total: 144,128,844$ 135,300,736$ 93.87% 136,480,171$ 0.87%
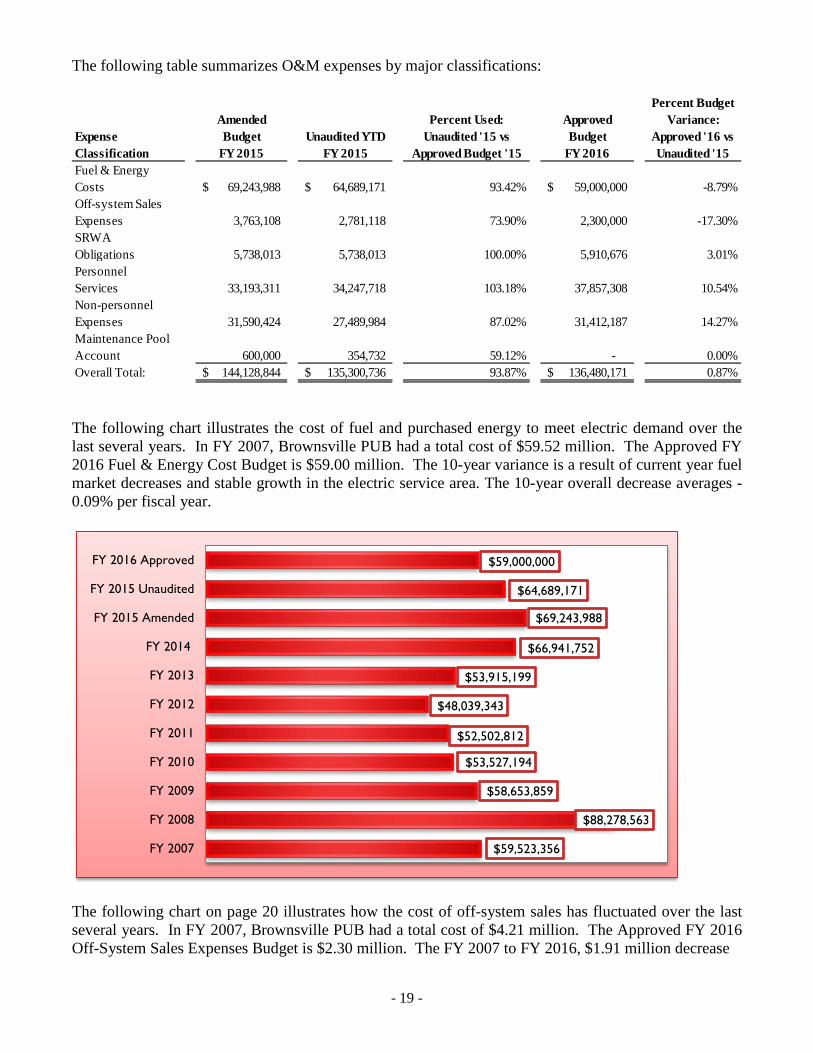
The following chart illustrates the cost of fuel and purchased energy to meet electric demand over the last several years. In FY 2007, Brownsville PUB had a total cost of $59.52 million. The Approved FY 2016 Fuel & Energy Cost Budget is $59.00 million. The 10-year variance is a result of current year fuel market decreases and stable growth in the electric service area. The 10-year overall decrease averages -0.09% per fiscal year.
$59,523,356
$88,278,563
$58,653,859
$53,527,194
$52,502,812
$48,039,343
$53,915,199
$66,941,752
$69,243,988
$64,689,171
$59,000,000
FY 2007
FY 2008
FY 2009
FY 2010
FY 2011
FY 2012
FY 2013
FY 2014
FY 2015 Amended
FY 2015 Unaudited
FY 2016 Approved
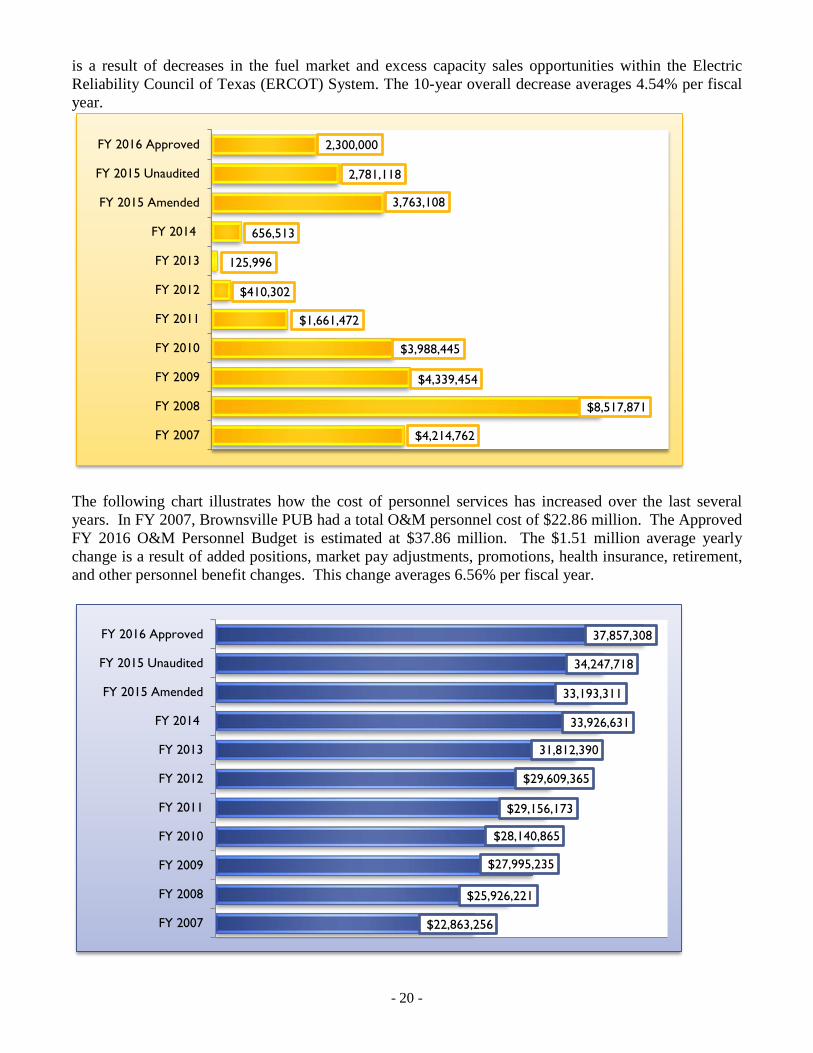
The following chart on page 20 illustrates how the cost of off-system sales has fluctuated over the last several years. In FY 2007, Brownsville PUB had a total cost of $4.21 million. The Approved FY 2016 Off-System Sales Expenses Budget is $2.30 million. The FY 2007 to FY 2016, $1.91 million decrease
- 20 -
is a result of decreases in the fuel market and excess capacity sales opportunities within the Electric Reliability Council of Texas (ERCOT) System. The 10-year overall decrease averages 4.54% per fiscal year.
$4,214,762
$8,517,871
$4,339,454
$3,988,445
$1,661,472
$410,302
125,996
656,513
3,763,108
2,781,118
2,300,000
FY 2007
FY 2008
FY 2009
FY 2010
FY 2011
FY 2012
FY 2013
FY 2014
FY 2015 Amended
FY 2015 Unaudited
FY 2016 Approved
The following chart illustrates how the cost of personnel services has increased over the last several years. In FY 2007, Brownsville PUB had a total O&M personnel cost of $22.86 million. The Approved FY 2016 O&M Personnel Budget is estimated at $37.86 million. The $1.51 million average yearly change is a result of added positions, market pay adjustments, promotions, health insurance, retirement, and other personnel benefit changes. This change averages 6.56% per fiscal year.
$22,863,256
$25,926,221
$27,995,235
$28,140,865
$29,156,173
$29,609,365
31,812,390
33,926,631
33,193,311
34,247,718
37,857,308
FY 2007
FY 2008
FY 2009
FY 2010
FY 2011
FY 2012
FY 2013
FY 2014
FY 2015 Amended
FY 2015 Unaudited
FY 2016 Approved
- 21 -
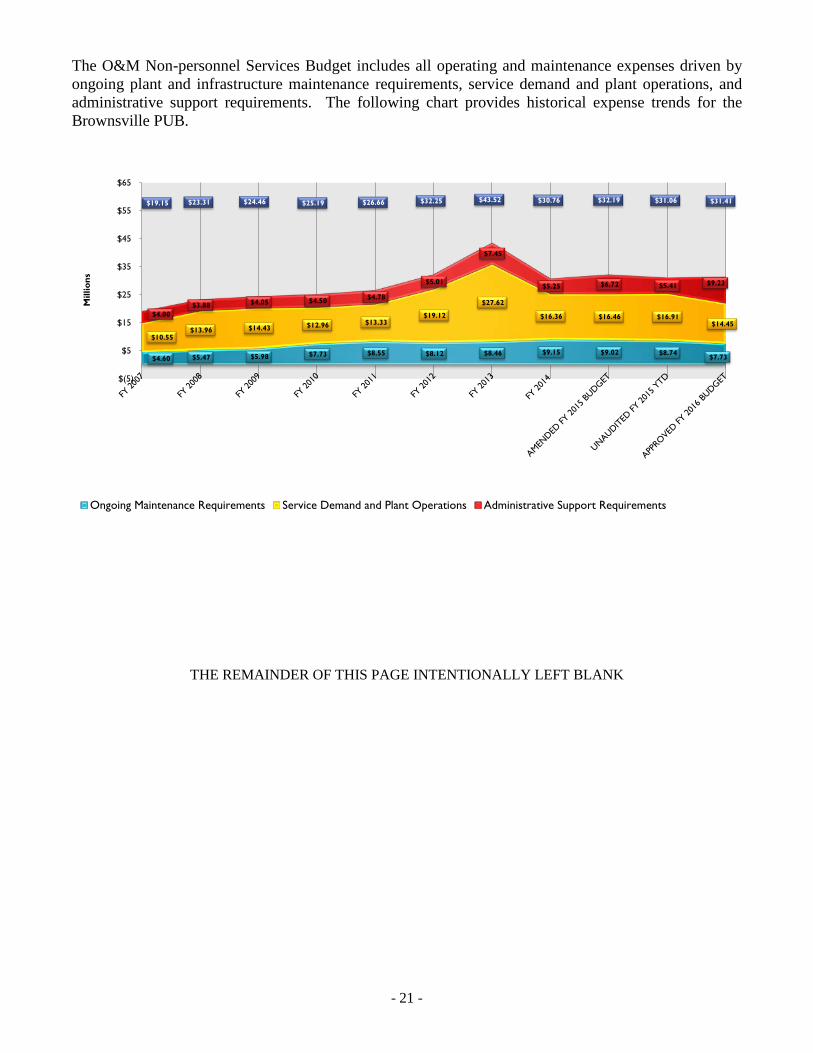
The O&M Non-personnel Services Budget includes all operating and maintenance expenses driven by ongoing plant and infrastructure maintenance requirements, service demand and plant operations, and administrative support requirements. The following chart provides historical expense trends for the Brownsville PUB.
$4.60 $5.47 $5.98 $7.73 $8.55 $8.12 $8.46 $9.15 $9.02 $8.74 $7.73
$10.55 $13.96 $14.43 $12.96 $13.33
$19.12
$27.62
$16.36 $16.46 $16.91 $14.45
$4.00 $3.88 $4.05 $4.50 $4.78
$5.01
$7.45
$5.25 $6.72 $5.41 $9.23
$19.15 $23.31 $24.46 $25.19 $26.66 $32.25 $43.52 $30.76 $32.19 $31.06 $31.41
$(5)
$5
$15
$25
$35
$45
$55
$65
Mill
ions
Ongoing Maintenance Requirements Service Demand and Plant Operations Administrative Support Requirements
THE REMAINDER OF THIS PAGE INTENTIONALLY LEFT BLANK

- 22 -
UDEBT SERVICE A summary of each system’s cost of borrowed money is on page 65, Debt Service section of this Budget. The Brownsville PUB continues to have insured bond ratings from the national rating agencies. Standard & Poor’s Ratings Services, a division of The McGraw-Hill Companies, Inc., has assigned short term insured ratings of A-1+, and Fitch Ratings has assigned short term insured ratings of F1+. The Brownsville PUB underlying ratings on its senior lien debt are “A2”, “A+” and “A+” by Moody’s, Standard & Poor’s, and Fitch Ratings, respectively.
Revenue bonds outstanding at September 30, 2015 and 2014 were $325,352,000 and $326,243,000 respectively. Interest on bonds is due semi-annually on March 1 and September 1, and the principal is due annually on September 1. Revenue bond debt service coverage for the Brownsville PUB’s priority and second lien obligations was calculated at 2.82 and 2.46 times at September 30, 2015 and 2014, respectively.
On January 15, 2003, the Brownsville PUB sold $76,400,000 variable rate demand bonds as Series 2002A Utility System Subordinate Lien Revenue and Series 2002B Utility System Subordinate Lien Revenue. The bonds’ variable rate was synthetically fixed at 2.576% until 2008 utilizing a swap financing strategy. The City Commission of the City of Brownsville, Texas authorized the execution of a Rate Cap Agreement effective September 1, 2006 through September 1, 2011 to give an insurance against increasing short term rates. The Brownsville PUB executed an agreement with an eligible provider for a notional amount of $41,880,000 with an interest rate cap of 4.50%. The notional amount of the original swap decreased to $10,830,000 effective September 1, 2006. Proceeds from the sale of the bonds were used to retire currently outstanding revenue bonds, to build, improve, extend, enlarge, and repair the system, and to pay costs of issuance of the bonds. On August 24, 2005, the Brownsville PUB sold $163,725,000 in tax exempt bonds and $56,855,000 in taxable bonds as part of a major debt restructuring. The tax exempt bonds, Series 2005A, provided proceeds to refund $50,890,000 in Series 1995 outstanding obligations, $50,000,000 in Series 2001A and $50,000,000 in Series 2001B variable rate outstanding obligations, and $7,250,000 in outstanding commercial paper notes, and provided $20,000,000 in new money bonds. The taxable bonds, Series 2005B, provided proceeds to defease $27,420,000 in Series 1992 outstanding obligations and $22,120,000 in Series 1995 outstanding obligations.
On December 1, 2006 the Brownsville PUB issued $601,000 City of Brownsville, Texas Utilities System Junior Lien Revenue Bonds, Series 2007 for the purpose of building, improving, extending, enlarging, and repairing the City’s utilities system and to pay costs of issuance of the bonds.
The Brownsville PUB issued $77,805,000 in aggregate principal amount of Utilities System Revenue Refunding Bonds, Series 2008. The refunding bonds provided proceeds to defease $40,000,000 of Commercial Paper Notes, Series 2004, $32,285,000 of the Series 2002A Utility System Subordinate Lien Revenue and Refunding Bonds, and $13,415,000 of the Series 2002B Utility System Subordinate Lien Revenue and Refunding Bonds.
On February 28, 2011, the Brownsville PUB issued $12,305,000 in Utilities System Revenue Refunding Bonds, Series 2011. The refunding bonds provided proceeds to refund $6,270,000 of Junior Lien Exchange Revenue Refunding Bonds, Series 2005A and $5,980,000 of Junior Lien Exchange Revenue Refunding Bonds, Series 2005B.
On September 26, 2012, the Brownsville PUB issued $20,960,000 in Utilities System Revenue Refunding Bonds, Series 2012. The refunding bonds plus a cash contribution of $5,275,000 provided proceeds to defease $24,450,000 in outstanding Commercial Paper Notes.

- 23 -
On November 1, 2012, the Brownsville PUB issued $840,000 City of Brownsville, Texas Utilities System Junior Lien Revenue Bonds, Series 2012 for the purpose of building, improving, extending, enlarging, and repairing the City’s utilities system and to pay costs of issuance of the bonds.
On April 10, 2013, the Brownsville PUB issued $118,185,000 in Utilities System Revenue Refunding Bonds, Series 2013. The refunding bonds provided proceeds to refund $109,985,000 of Utility System Improvement and Refunding Bonds, Series 2005A. In addition, the proceeds provided funds of $11,818,500 to make a cash deposit into the Debt Service Reserve Fund.
On July 15, 2015, the Brownsville PUB issued $94,770,000 in Utilities System Revenue Refunding Bonds, Series 2015. The bonds provided proceeds to refund $49,060,000 of Series 2005A Revenue Improvement & Refunding Bonds, $27,815,000 of Series 2005B Revenue Refunding Bonds and $5,480,000 of Series 2011 Revenue Refunding Bonds. In addition, the proceeds provided funds to defease $20,000,000 in outstanding Commercial Paper Notes.
The Brownsville PUB’s participation in the Southmost Regional Water Authority (SRWA) Reverse Osmosis Plant Project was complete and operational during 2005. The SRWA successfully issued $30,975,000 in Water Supply Contract Revenue Bonds, Series 2002 during FY 2003 and has expended approximately 100% of bond proceeds in the construction of the desalination plant. The Series 2002 bonds were issued with insured ratings of “Aaa” and “AAA” by Moody’s Investor Services and Fitch Ratings, respectively. The underlying ratings on the bonds are “A2” and “A” by Moody’s and Fitch, respectively. The Brownsville PUB total interest in the project is 92.91%. The SRWA is considered a blended component unit of the Brownsville PUB. As a participating owner, the Brownsville PUB is obligated to contribute its percentage allocation of the SRWA’s debt service obligations and annual system budget. The Brownsville PUB’s total 2015 and 2014 contributions to the SRWA were $5,738,013 and $4,942,996 respectively. The Brownsville PUB’s participation in the SRWA’s desalination project provides the City with an alternate, long-term, drought-resistant source of drinking water. The SRWA issued $9,950,000 in aggregate principal amount of Water Supply Contract Revenue Refunding Bonds, Series 2006. The refunding bonds provided proceeds to defease $9,360,000 of the Series 2002 Revenue Bonds for the years 2019 and from 2028 through 2032. On December 7, 2009, the SRWA issued $9,295,000 in Water Supply Contract Revenue Bonds, Series 2009A and $3,795,000 in Water Supply Contract Revenue Bonds, Series 2009B through the Texas Water Development Board Drinking Water State Revolving Fund for the construction of a full scale Micro Filtration Pretreatment System. The objective of this project is to achieve compliance with both existing and future maximum contaminant levels for arsenic in public drinking water by constructing a full scale Micro Filtration Pretreatment System prior to entering the existing reverse osmosis treatment process. An additional need is to control and reduce iron levels to eliminate complaints of colored water. Project objectives also include an additional 1.0 million gallons per day of capacity through upgrading certain pumps within the existing well field and adding one additional reverse osmosis train. The SRWA issued $13,530,000 in Water Supply Contract Revenue Refunding Bonds Series 2012 on September 26, 2012. The refunding bonds provided proceeds to defease $14,990,000 of the Series 2002 Revenue Bonds for the years 2013 through 2027.

- 24 -
SUMMARY OF DEBT SERVICE REQUIREMENTS Unaudited
ACTUAL ACTUAL ACTUAL ACTUAL BUDGETFY 2012 FY 2013 FY 2014 FY 2015 FY 2016
Principal 8,277,000$ 9,259,000$ 10,100,000$ 12,066,000$ 12,173,000$ Interest 14,439,065 14,652,605 14,154,839 13,508,948 13,883,522
TOTAL 22,716,065$ 23,911,605$ 24,254,839$ 25,574,948$ 26,056,522$
Commercial Paper for FY 2016 will incur $75,000 of interest expense. DEBT SERVICE COVERAGE RATIO The Debt Service Coverage Ratio is estimated at 2.82 times for Year-end FY 2015, compared to 2.15 in the Amended FY 2015 Budget and 2.22 times budgeted for FY 2016. The Brownsville PUB’s minimum coverage is 1.25 times per current bond covenants. UCAPITAL BUDGET The Board adopted the FY 2016 Capital Budget on September 14, 2015. The FY 2016 Capital Budget totals $56,116,066 which is $17,991,945 less than the Brownsville PUB approved FY 2015 Budget of $74,108,011. The BPUB’s five-year capital needs decreased from $235.39 million for FY 2015 to $204.59 million for FY 2016 for a total decrease of $30.80 million. A funding source summary and listing of construction projects and capital asset purchases are included in the Capital section of the Budget Document, beginning on page 210. The Brownsville PUB is continuously updating a long-term Capital Improvement Plan (CIP) to prioritize use of available resources and scheduled short-term and long-term financing with minimal rate impact. If available resources are less than anticipated, Brownsville PUB will scale back on its CIP funding. The projects proposed in the FY 2016 Capital Budget are crucial to efforts to continuously provide our present and future customers with the high-quality services and products that Brownsville PUB is committed to delivering. Many of the proposed capital projects are for renewals and replacements. Renewals and replacements are critical to Brownsville PUB’s aging infrastructure, and generally increase our costs, but provide no additional revenue. Of the projects budgeted for FY 2016, a sizeable portion is necessary for Brownsville PUB to stay in compliance with the requirements and standards set by governmental and regulatory agencies. The remainder of the FY 2016 Capital Budget includes a number of new projects and the continuation or completion of other projects that have already involved a considerable amount of time to design, permit, and construct. Over the last 5-10 years, considerable renewal and replacement expenses have been incurred by the Brownsville PUB to correct or prevent problems. The Brownsville PUB staff continually strives to plan for and make system improvements to all three utility systems. Brownsville PUB’s staff cannot accurately estimate the savings that are a direct result of capital improvements. However, staff is confident that O&M expenses are reduced shortly and long after the improvements are completed. Several large projects that will impact the FY 2016 Capital Budget for the electric system include the Proposed Tenaska Brownsville Generating Station. This project includes planning, consulting, engineering and feasibility services associated with the purchase of a 25% share of the proposed 800-MW natural gas-fueled Tenaska Brownsville Generating Station. Another project is the 345KV

- 25 -
transmission line from the Proposed Tenaska Brownsville Generating Station to the Loma Alta Substation. For the water system, the Water Treatment Plant I and II Filter System Rehabilitation Project will improve the effectiveness and efficiency of Water Treatment Plant I and II by upgrading/replacing the water plants’ filtration systems. The Martinal – FM 511 Waterline Loop will include the design and construction of a waterline loop from the Elevated Storage Tank on Martinal to FM 511 near the Rio del Sol Subdivision. Also, an extension of the Brownsville PUB water distribution system along the Military Highway will serve an area that the Military Highway Water Supply Corporation intends to abandon due to a Military Hwy (US 281) TxDOT construction project. Brownsville PUB has studied the viability of the proposed Seawater Desalination Plant. If the proposed Seawater Desalination Plant is viable and financially feasible with the assistance of long-term debt and/or grants, the Seawater Desalination Plant will alleviate the long-term water needs of the City of Brownsville, Texas, and the surrounding areas in Cameron County, Texas. Brownsville PUB is designing and will construct the Vapor Phase Odor Control Bio-trickling Filters at the South Wastewater Treatment Plant and 16 lift stations. Since 1999, the BPUB has been using a liquid phase pH odor control technology that consists of using a chemical to raise the pH of wastewater in order to decrease the release of odorous hydrogen sulfide gas. This chemical works by elevating the pH of wastewater above 8.5 were most of the sulfide ions stay in the liquid phase and prevent formation of hydrogen sulfide gas. BPUB will transition out of the costly liquid phase technology into a more cost effective vapor phase technology, which sequesters and treats hydrogen sulfide in its gas phase rather than in the liquid phase. The use of this vapor phase technology consists of directing air from various identified odor sources with high levels of hydrogen sulfide generation (e.g. lift stations, wastewater treatment plant) through biofilters which treat the air by removing hydrogen sulfide.
THE REMAINDER OF THIS PAGE INTENTIONALLY LEFT BLANK
- 26 -
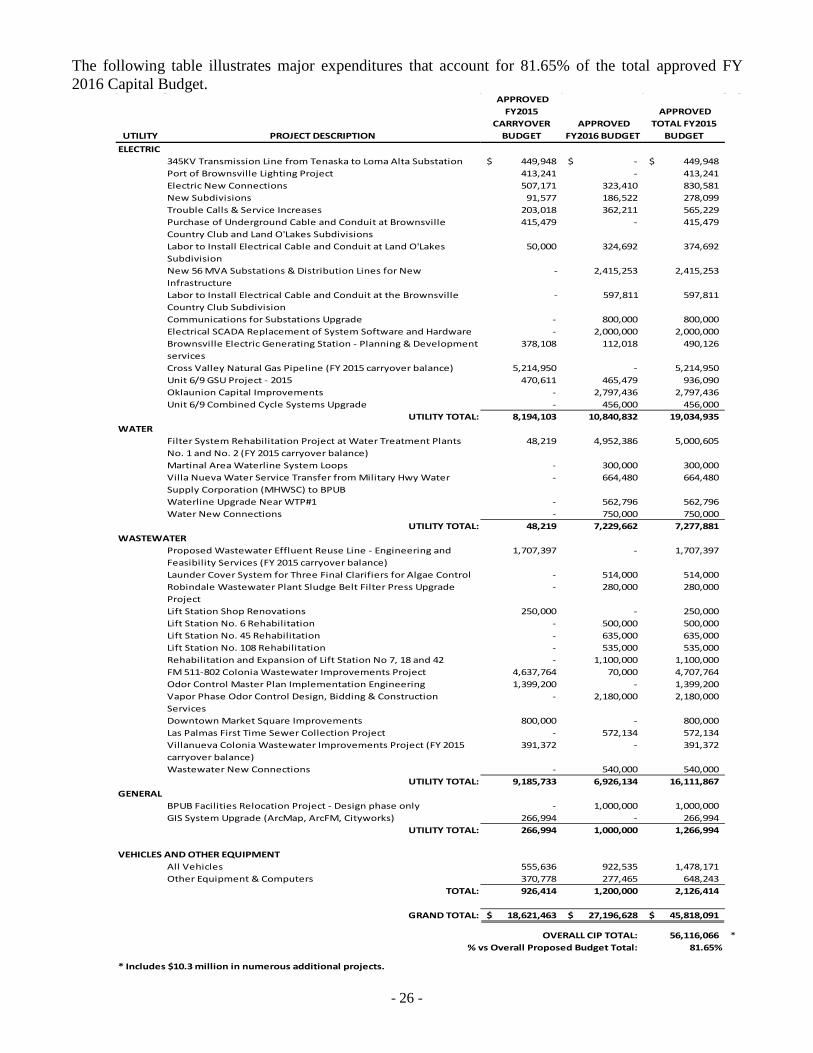
The following table illustrates major expenditures that account for 81.65% of the total approved FY 2016 Capital Budget.
UTILITY PROJECT DESCRIPTION
APPROVED FY2015
CARRYOVER BUDGET
APPROVED FY2016 BUDGET
APPROVED TOTAL FY2015
BUDGET ELECTRIC
345KV Transmission Line from Tenaska to Loma Alta Substation 449,948$ -$ 449,948$ Port of Brownsville Lighting Project 413,241 - 413,241 Electric New Connections 507,171 323,410 830,581 New Subdivisions 91,577 186,522 278,099 Trouble Calls & Service Increases 203,018 362,211 565,229 Purchase of Underground Cable and Conduit at Brownsville Country Club and Land O'Lakes Subdivisions
415,479 - 415,479
Labor to Install Electrical Cable and Conduit at Land O'Lakes Subdivision
50,000 324,692 374,692
New 56 MVA Substations & Distribution Lines for New Infrastructure
- 2,415,253 2,415,253
Labor to Install Electrical Cable and Conduit at the Brownsville Country Club Subdivision
- 597,811 597,811
Communications for Substations Upgrade - 800,000 800,000 Electrical SCADA Replacement of System Software and Hardware - 2,000,000 2,000,000 Brownsville Electric Generating Station - Planning & Development services
378,108 112,018 490,126
Cross Valley Natural Gas Pipeline (FY 2015 carryover balance) 5,214,950 - 5,214,950 Unit 6/9 GSU Project - 2015 470,611 465,479 936,090 Oklaunion Capital Improvements - 2,797,436 2,797,436 Unit 6/9 Combined Cycle Systems Upgrade - 456,000 456,000
UTILITY TOTAL: 8,194,103 10,840,832 19,034,935 WATER
Filter System Rehabilitation Project at Water Treatment Plants No. 1 and No. 2 (FY 2015 carryover balance)
48,219 4,952,386 5,000,605
Martinal Area Waterline System Loops - 300,000 300,000 Villa Nueva Water Service Transfer from Military Hwy Water Supply Corporation (MHWSC) to BPUB
- 664,480 664,480
Waterline Upgrade Near WTP#1 - 562,796 562,796 Water New Connections - 750,000 750,000
UTILITY TOTAL: 48,219 7,229,662 7,277,881 WASTEWATER
Proposed Wastewater Effluent Reuse Line - Engineering and Feasibility Services (FY 2015 carryover balance)
1,707,397 - 1,707,397
Launder Cover System for Three Final Clarifiers for Algae Control - 514,000 514,000 Robindale Wastewater Plant Sludge Belt Filter Press Upgrade Project
- 280,000 280,000
Lift Station Shop Renovations 250,000 - 250,000 Lift Station No. 6 Rehabilitation - 500,000 500,000 Lift Station No. 45 Rehabilitation - 635,000 635,000 Lift Station No. 108 Rehabilitation - 535,000 535,000 Rehabilitation and Expansion of Lift Station No 7, 18 and 42 - 1,100,000 1,100,000 FM 511-802 Colonia Wastewater Improvements Project 4,637,764 70,000 4,707,764 Odor Control Master Plan Implementation Engineering 1,399,200 - 1,399,200 Vapor Phase Odor Control Design, Bidding & Construction Services
- 2,180,000 2,180,000
Downtown Market Square Improvements 800,000 - 800,000 Las Palmas First Time Sewer Collection Project - 572,134 572,134 Villanueva Colonia Wastewater Improvements Project (FY 2015 carryover balance)
391,372 - 391,372
Wastewater New Connections - 540,000 540,000 UTILITY TOTAL: 9,185,733 6,926,134 16,111,867
GENERALBPUB Facilities Relocation Project - Design phase only - 1,000,000 1,000,000 GIS System Upgrade (ArcMap, ArcFM, Cityworks) 266,994 - 266,994
UTILITY TOTAL: 266,994 1,000,000 1,266,994
VEHICLES AND OTHER EQUIPMENTAll Vehicles 555,636 922,535 1,478,171 Other Equipment & Computers 370,778 277,465 648,243
TOTAL: 926,414 1,200,000 2,126,414
GRAND TOTAL: 18,621,463$ 27,196,628$ 45,818,091$
OVERALL CIP TOTAL: 56,116,066 *% vs Overall Proposed Budget Total: 81.65%
* Includes $10.3 million in numerous additional projects.
- 27 -
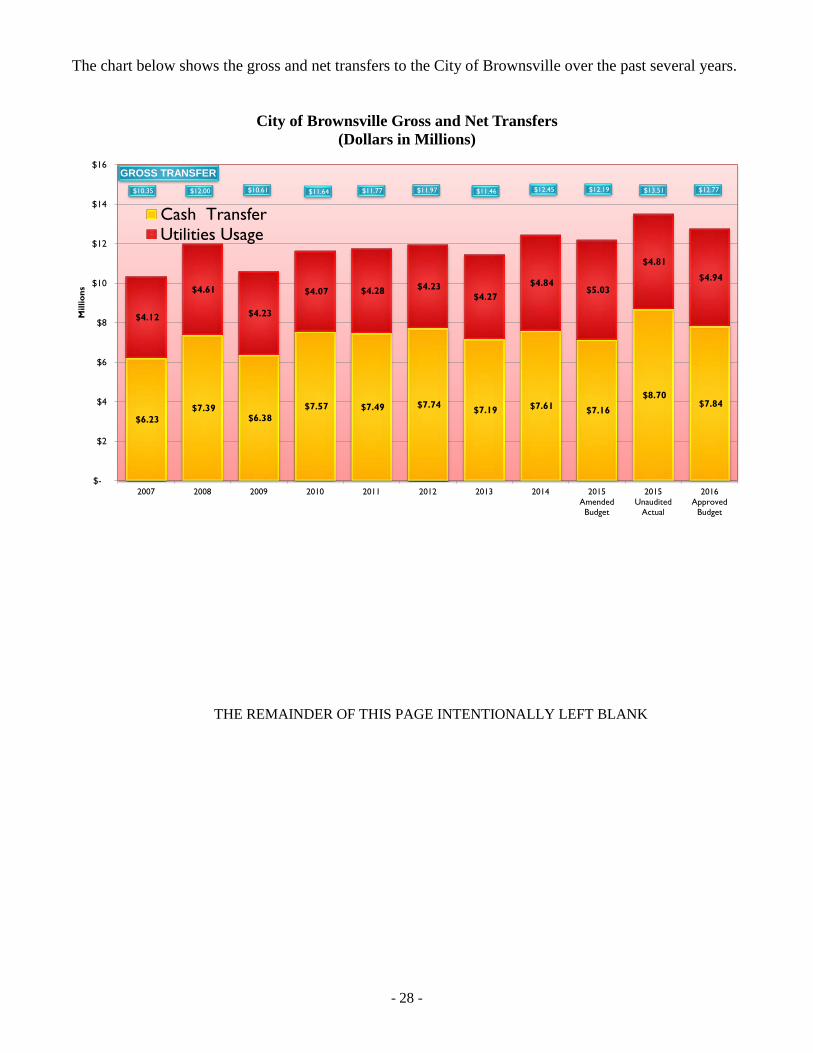
A recap of all the sources of funding for the Capital Budget can be found on page 210. The Brownsville PUB will use a combination of internally generated cash, state loans and grants, contributions-in-aid-of-construction, and short term debt obligations to fund the Capital Budget during FY 2016. Capital projects are discussed in additional detail on pages 215 through 320. UTRANSFER TO THE CITY OF BROWNSVILLE Beginning in FY 2006 transfers to the City of Brownsville (City) are undertaken on a quarterly basis calculated at ten percent (10%) of gross revenues received for the preceding fiscal year quarter, as adjusted in accordance with the following bond covenant: (1) prior to applying the percentage set forth above to determine the amount to be transferred to the City, the amount of gross revenues for a fiscal year quarter shall be reduced by an amount equal to all costs for the purchase of power and fuel paid or incurred by the Brownsville PUB during such fiscal year quarter as well as funding requirements for SRWA and (2) the amount of funds to be transferred to the City shall be reduced by any amounts owed by the City to the Brownsville PUB for utility services. The unaudited FY 2015 estimated year-end gross transfer is set at $13,505,870, up $1,315,789 from the FY 2015 Amended budget, with a net cash transfer of $8,696,129. The FY 2016 approved budget gross transfer is $12,772,610.
THE REMAINDER OF THIS PAGE INTENTIONALLY LEFT BLANK
- 28 -
The chart below shows the gross and net transfers to the City of Brownsville over the past several years.
City of Brownsville Gross and Net Transfers
(Dollars in Millions)
$6.23 $7.39
$6.38 $7.57 $7.49 $7.74 $7.19 $7.61 $7.16
$8.70 $7.84
$4.12
$4.61
$4.23
$4.07 $4.28 $4.23 $4.27
$4.84 $5.03
$4.81
$4.94
$10.35 $12.00 $10.61 $11.64 $11.77 $11.97 $11.46 $12.45 $12.19 $13.51 $12.77
$-
$2
$4
$6
$8
$10
$12
$14
$16
2007 2008 2009 2010 2011 2012 2013 2014 2015AmendedBudget
2015Unaudited
Actual
2016Approved
Budget
Mill
ions
Cash TransferUtilities Usage
GROSS TRANSFER
THE REMAINDER OF THIS PAGE INTENTIONALLY LEFT BLANK
- 29 -
UDISTINGUISHED BUDGET PRESENTATION AWARD The Government Finance Officers Association of the United States and Canada (GFOA) presented a Distinguished Budget Presentation Award to the Brownsville PUB for its Annual Budget for the fiscal year beginning October 1, 2014. In order to receive this award, a governmental unit must publish a budget document that meets program criteria as a policy document, as an operations guide, as a financial plan, and as a communications device. The Fiscal Year beginning October 1, 2007 was the first year Brownsville PUB had received the award. This award is valid for a period of one year only. We believe our current Budget continues to conform to program requirements, and we are submitting it to the GFOA to determine its eligibility for another award. UACKNOWLEDGEMENTS This year, the budget review was a very extensive process. The entire Brownsville PUB staff is to be commended for the patience and cooperation exhibited during the continued refinement of the budget process. The General Manager & CEO, Assistant General Manager & COO, Chief Financial Officer and financial staff closely analyzed each department’s budget on a line-by-line basis. Many work sessions were held to ensure proper documentation was presented to justify all requests. We extend our personal thanks to the dedicated employees who spent many hours preparing, revising and finalizing this document. We would also like to acknowledge the support of the Board of Directors for its continuing interest in the development of a strong financial system and balanced budget to serve the customers of the Brownsville PUB. Respectfully submitted, John S. Bruciak, P.E. General Manager & Chief Executive Officer Leandro G. García, CPA Chief Financial Officer

- 30 -

- 31 -
BUDGET PROGRAM
UOverview It is the Brownsville PUB’s practice to adopt a budget prior to the start of each year which begins October 1. The budget, in addition to the financial statements, is prepared on the accrual basis. The process leading to the budget adoption involves participation from all management and supervisor levels and includes a communications plan that encourages input and guidance from Board Members. The budget focuses on identifying funding levels necessary to continue basic utility services, systems improvement priorities, and community goals. The Chief Financial Officer (CFO) provides the Board Members and the General Manager & CEO with information on projected revenues and funding requirements to enable the General Manager and Board Members to provide policy direction in formulating budget goals and objectives as well as budget strategies to achieve such goals. The Brownsville PUB’s FY 2015-16 budget is a balanced budget, with revenues and other financing sources equal to the expenditures and other financing uses. UPriorities The Brownsville PUB has adopted a set of priorities for defining the Organization’s mission. These priorities are used by the departments in formulating goals, objectives and measures when preparing their budgets. UFinancial Policies The Brownsville PUB has approved a comprehensive set of financial policies to guide the financial practices including accounting and reporting practices, investments, and debt financing. These policies are reviewed by the Brownsville PUB CFO and the Finance Committee to ensure that the Utility is in compliance with Bond Covenants, GASB Statements, and state and Federal regulatory requirements. Recommendations for change are submitted to the Finance Committee or entire Board for approval when necessary. The policies provide direction for all aspects of financial planning, accounting, reporting, and resource allocation. These financial policies are explained in further detail on the significant policies section starting on page 36. URestricted Use of Public Funds The Brownsville PUB shall not lend its credit or gratuitously grant public money or things of value in aid of any individual, association, or corporation. The Brownsville PUB shall not grant any extra compensation, fee, or allowance to a public officer, agent, servant, or contractor after service has been rendered or a contract entered into and performed in whole or in part without Board approval. Nor shall the Brownsville PUB pay or authorize the payment of any claim against the Brownsville PUB under any agreement or contract made without authority of law. No public funds of the Brownsville PUB may be spent in any manner other than as provided for in the budget adopted or amended by the Board.
- 32 -
BUDGET PREPARATION PROCESS & PROCEDURES UPreface Budgeting is the process of allocating resources to the prioritized needs of the Brownsville PUB. Although budget formats and policies are by no means uniform in the public utility industry, formal budgets play a major role in the planning, control, and evaluation of operations. The adoption of the budget implies that a set of decisions have been made by the Board and Brownsville PUB’s General Manager & CEO which culminate in matching Brownsville PUB’s resources with its needs. This enables Administration to execute and control the activities that have been approved by the budget and evaluate performance based upon comparisons between budgeted and actual expenses. UObjectives of Budgeting Performance evaluations allow citizens and taxpayers to hold policy makers and administrators accountable for their actions. Because accountability to citizens often is stated explicitly in state laws and constitutions, it is considered a cornerstone of budgeting and financial reporting. The Governmental Accounting Standards Board (GASB) recognizes its importance and has outlined the following objectives taken from GASB Concepts Statement No. 1 (Section 100.177):
• Financial reporting should provide information to determine whether current-year revenues were sufficient to pay for current-year services.
• Financial reporting should demonstrate whether resources were obtained and used in
accordance with the entity’s legally adopted budget. It should also demonstrate compliance with the Bond Covenant and other finance-related legal or contractual requirements.
• Financial reporting should provide information to assist users in assessing the service efforts,
costs, and accomplishments of the governmental entity. Meeting these objectives requires budget preparation to include several concepts recognizing accountability. Often these concepts have been mandated for state and local public sector budgets. They include requirements that budgets should:
• Be balanced so that current revenues are sufficient to pay for current services.
• Be prepared in accordance with all applicable Bond Covenant, Federal, state, and local legal mandates and requirements.
• Provide a basis for the evaluation of a governmental utilities service effort, cost and
accomplishments.
• Attempt to provide adequate Improvement Funds for “normal” capital activities by utility. UBudget Process Overview The budgeting process is comprised of three major phases: planning, preparation, and evaluation. It begins with sound planning. Planning defines the goals and objectives the Board has established and defines the strategy that Brownsville PUB’s General Manager & CEO will implement to attain those goals and objectives. Once the strategy has been established, budgetary resource allocations are initiated to support them. Budgetary resource allocations are the preparation phase of budgeting.
- 33 -
Finally, the budget is evaluated for its effectiveness in attaining goals and objectives. Evaluation typically involves an examination of how funds are expended, what outcomes result from the expense of funds, and to what degree these outcomes achieve the objectives stated during the planning phase. This evaluation phase is important in determining the following year’s budgetary allocations. Budget preparation is not a one-time exercise to determine how Brownsville PUB will allocate funds. Rather, it is part of a continuous cycle of planning and evaluation necessary to achieve the established goals. UAnnual Budget Process The CFO established a process to comply with the Brownsville PUB Budget policy requiring a balanced budget. A line-item budgeting format has been selected primarily because of its simplicity and control orientation. Brownsville PUB bases the budget upon historical expenses and revenue data. The development process is comprised of the following:
• Discussion with the General Manager & CEO and Assistant General Manager & COO to set Brownsville PUB goals and budget timetable to comply with the Board’s goals and objectives.
• The Financial Planning Team prepares budget packets for the Directors and Managers. Packets will have detailed instructions to help estimate O&M and capital requirements. All line item accounts must be accompanied by a justification. Capital funding requests will be evaluated by established sub-teams for each category in the Capital Fund. Budget Team recommendations will be forwarded to the Financial Planning Team for inclusion in the first budget draft. Additionally, a 10-year Capital Project Budget is included for Director’s review and prioritization.
• Budget draft is reviewed and balanced by the General Manager & CEO, the Assistant General
Manager & COO and the CFO.
• Balanced budget is presented to the Board for approval. UApproved Detailed Budget Procedures The Financial Planning Team established the following internal controls to ensure operational compliance with the Brownsville PUB’s Board-Approved Budget (O&M and Capital). Management has identified possible issues that could compromise the budget’s integrity and implemented procedures to define, address or prevent their occurrence.
• ULine-item Budget Purchases U - The Banner 8.4.3 accounting system provides management the ability to analyze and control spending through a line-item budget process. The requisition and encumbrance process is dependent on available funds within an organization’s account structure. The system automatically denies a requisition if funds are unavailable for procurement. At no point does the system allow an account to incur a deficit budget balance. A system override of this control can be initiated only with a written approval from the CFO.
• UBudget ChangesU - Management has the option of re-allocating budgeted funds within a
department, within a division or among other divisions as long as the funds are allocated within a type/function. This may be necessary to initiate a purchase if funds are unavailable in a certain account. An approved Budget Change Form is required before changes to the budget are processed.

- 34 -
• UBudget AmendmentsU - Management will request increases to the Approved Budget only after
they have looked within the Organization for available funds and the request is a result of an extraordinary requirement or emergency situation. This may be necessary throughout the year to address unexpected requirements for additional resources. Board approval is required before amendments to the overall budget are processed.
• UPersonnel AdditionsU – Personnel additions that increase the Board-approved position control
total cannot be processed without a budget amendment. However, management can choose to re-classify open positions to address immediate staffing needs without Board approval as long as the dollar amounts or number of employees do not increase the approved budget totals. Reclassifying positions are generally allowed as long as the positions are at the same or at a lower pay level. In cases where management feels a need to reclassify a position to a higher level and after Human Resources has approved the reclassification, securing the funding with the Financial Planning Team will be the next step. Funding in these cases would mean sacrificing the salaries of two approved positions to fund the higher salaried position either by reclassifying the approved position to a lower pay grade or temporarily unfunding and suspending the approved position. The Financial Planning Team and the Human Resource Department can present management with the available options to fund the reclassification of the position requested.
USix-Month Budget Review Process Brownsville PUB’s Six-Month Budget Review enables management to evaluate mid-year performance and address unplanned expenses. During the normal course of business, there are strong possibilities that extraordinary circumstances deplete available funds. The review can be used as the tool to request budget increases, identify funding deficiencies, and predict future expenses based on mid-year totals. The evaluation process and possible budget increases will be governed by the following:
• Requests of additional O&M Funds will not exceed the calculated total of additional revenues estimated to be collected for the remainder of the year.
• Requests of additional Capital Funds must first be funded from available funds from closed
projects or funds deferred from current active projects. Request total cannot exceed approved capital fund total.
• Requests for permanent employee positions will not be considered after the budget is adopted
until all approved positions are filled or the reclassification of open positions has been exhausted.
• Any existing deficit accounts must be cleared within a department or division before Directors or Managers can consider requesting additional funds for extraordinary expenses.
• Budget analysis may identify possible available funds within a department or division prompting
a transfer to the Contingency account. The funds will be swept from the accounts unless Directors and Managers can document and justify that the funds are vital to their department’s operations in the remaining six months of the fiscal year. The CFO will initiate this procedure based on the expense justification and Brownsville PUB’s financial position. Additionally, the presence of extraordinary expenses that impact revenues, customer services, production of services, safety, Federal/state regulations, and employee benefits will influence the decision-making process.

- 35 -
BUDGET PREPARATION CALENDAR
FISCAL YEAR 2016 TIMETABLE
1 May 11, 2015 Monday Distribute Budget Process Timetable to the Board CFO
2 May 26 - 29, 2015 Week of Establish BPUB Teams & Meetings Financial Planning Team
3 May 27, 2015 Wednesday BUDGET KICKOFF! Distribution of FY 2016 Budget Instructions & Forms for Equipment Requests and Projects
Financial Planning Team
4 June 3, 2015 Wednesday Finance Committee Meeting to discuss FY 2016 O&M and Capital Improvement Plan Goals CFO
5 June 26, 2015 Friday O&M Budget, Equipment Requests, Project Request Forms & Changes to FY 2016 CIP due All Departments
6 July 6, 2015 Monday Send Equipment Requests to respective BPUB Budget Teams (Vehicle, Computer & Other Equipment) for recommendations
Financial Planning Team
7 July 17, 2015 Friday Department Performance Measures due All Departments
8 July 17, 2015 Friday Teams’ recommendations due Teams
9 July 21, 2015 Tuesday First DRAFT of budget complete Financial Planning Team
10 July 23, 2015 Thursday Distribute first DRAFT of budget and meet with Executive Team CFO
11 July 27 - 31, 2015 Week of Directors and Managers balance budget All Directors & Managers
12 August 3, 2015 Monday Submit all budget changes to Financial Planning Team All Departments
13 August 7, 2015 Friday Board Member Budget Briefing CFO
14 August 11, 2015 Tuesday Cancelled Finance Committee Meeting to discuss FY 2016 Preliminary O&M (Held Budget Briefing) CFO
15 August 25, 2015 Tuesday Finance Committee Meeting to discuss current status of O&M and Capital Improvement Plan CFO
16 September 2, 2015 Wednesday Finance Committee meeting CFO
17 September 8, 2015 Tuesday Presentation of Draft Fiscal Year 2016 Budget to the Board in a workshop (if needed) CFO
18 September 14, 2015 Monday Present Fiscal Year 2016 Budget to the Board for consideration and approval CFO
UNOTES
1. Southmost Regional Water Authority (SRWA) Budget first review, 7/6/2015, and approved on 8/3/15.
2. Dates of meetings are subject to change.
- 36 -
SIGNIFICANT POLICIES The accounting policies of Brownsville PUB conform to generally accepted accounting principles (GAAP) as applicable to local governmental units. The following is a summary of the more significant policies: UThe Reporting Entity The Brownsville PUB was formed in 1960 to provide electrical, water, and wastewater services to its customers in the Brownsville area. The financial statements of the Brownsville PUB are prepared in conformity with accounting principles generally accepted in the United States of America as applied to government units. The Governmental Accounting Standards Board (GASB) is the accepted standard-setting body for establishing governmental accounting and financial reporting principles.
The Brownsville PUB is a component unit of the City of Brownsville, Texas as defined in GASB Statement No. 14, the Reporting Entity as amended by GASB Statement No. 39, determining whether certain organizations are component units. It is a separate operating authority established by the City’s charter. Its purpose is to own, operate, and maintain a combined utilities system which provides the City and certain adjacent unincorporated areas with electricity, water, and wastewater services. The specific elements of oversight responsibility of the Brownsville PUB is that the City Commission appoints six of the seven-member governing board and the Mayor of the City serves Ex-Officio as the seventh member. Each appointed Board Member serves a four-year term. The Brownsville PUB does not have the right to encumber, sell, or hypothecate the utilities system. The specific elements of accountability for fiscal matters are (1) the City Commission is vested with the right to set utility rates and (2) the City is vested with the right to authorize the issuance of debt for the utilities system. Further, the Brownsville PUB is not required to pay any property taxes or franchise taxes to the City and the City is not required to pay for the utility services furnished to the City by the Brownsville PUB. The reporting entity of the Brownsville PUB consists of the primary and a blended component unit, the SRWA. The SRWA is a conservation and reclamation district created pursuant to Article XVI, Section 59, of the Texas Constitution and the Act of June 12, 1981, 67th Leg., Ch. 511, 1981 Tex. Gen. Laws 2196. The SRWA provides treated water to various areas of Cameron County. Essential disclosures related to SRWA are included in its complete financial statements. These statements may be obtained at P.O. Box 3270, Brownsville, Texas 78523-3270, c/o Finance Department. UFund Accounting, Measurement Focus, Basis of Accounting, and Financial Statement Presentation The Brownsville PUB is a single enterprise fund, which is organized on the basis of systems (Electric, Water and Wastewater), each of which is considered a separate accounting entity. Resources are allocated to, and accounted for in these systems based upon the purpose for which they are to be spent. For external reporting purposes, these systems are combined. The budget, as well as the financial statements, are prepared on the accrual basis; budgeted revenues will be recognized when earned and budgeted expenses will be recognized when incurred, regardless of the timing of related cash flows. The expenditure budget is prepared on a comparable basis to Generally Accepted Accounting Principles, with the exception of debt service (including principal and interest) that is budgeted in full when due. Depreciation and interest expense are recorded as expenses for financial statement purposes (depreciation is not budgeted).
- 37 -
The annual audited financial statements are presented in accordance with accounting standards generally accepted in the United States of America for proprietary funds of governmental entities. The Brownsville PUB complies with all applicable pronouncements of the GASB. The Brownsville PUB is accounted for as a proprietary fund. Proprietary funds are used to account for operations that are financed and operated in a manner similar to private business enterprises where the intent is to recover the cost of operations through user charges. A proprietary fund is accounted for on the “economic resources” measurement focus using the accrual basis of accounting, under which revenues are recognized in the accounting period in which they are earned and the related expenses are recorded in the accounting period incurred, if measurable. All assets and liabilities are included on the balance sheet. In accordance with GASB Statement No. 20, Accounting and Financial Reporting for Proprietary Funds and Other Governmental Entities that Use Proprietary Fund Accounting, the Brownsville PUB has elected not to follow pronouncements of the Financial Accounting Standards Board (FASB) issued after November 30, 1989. UFlow of Funds Policy City Ordinance No. 2005-1438 established certain “funds”. These “funds” are mandatory asset segregation and not funds in the sense of governmental fiscal and accounting entities with self-balancing sets of accounts. The following paragraphs briefly describe in summary form the manner in which Gross Revenues and Net Revenues are utilized and their priority of payment. UPlant FundU . . . The Ordinance requires all Gross Revenues to be deposited by the Brownsville PUB, as collected and received, into a separate account known as the Plant Fund. All Gross Revenues deposited into the Plant Fund shall be transferred for the following uses and in the order of priority shown below:
FIRST: to the payment of all necessary and reasonable Operating and Maintenance Expenses as defined in the Ordinance or required by statute (including, but not limited to, Chapter 1502, Texas Government Code, as amended) to be a first charge on and claim against the Gross Revenues, including the establishment of a fuel adjustment subaccount or similar accounts. In addition, the Brownsville PUB is required to retain in the Plant Fund a reserve amount to pay Operating and Maintenance Expenses of not less than two months of budgeted Operating and Maintenance Expenses for the current Fiscal Year (the "Operating Reserve Fund") which amount was funded initially in the amount of $12,500,000 with lawfully available funds of the Brownsville PUB, and will be replenished as described in subparagraph ELEVENTH below.
SECOND: to the payment of the amounts required to be deposited into the Debt Service Fund created and established for the payment of the Senior Lien Obligations as the same become due and payable. (See “Debt Service Fund” below.)
THIRD: to the payment of the amounts required to be deposited into the Senior Lien Reserve Fund and other debt service reserves for Senior Lien Obligations created and established in accordance with the Ordinance to maintain the amounts required to be deposited in accordance with the provisions of the Ordinance or the ordinances relating to the issuance of any Additional Senior Lien Obligations.
FOURTH: to the payment of the amounts required to be deposited into the debt service fund created and established for the payment of the currently outstanding Junior Lien Obligations or any Additional Junior Lien Obligations hereafter issued by the City as the same become due and payable.

- 38 -
FIFTH: to the payment of the amounts required to be deposited into the reserve fund created and established in connection with the Junior Lien Obligations to maintain the amounts required to be deposited in accordance with the provisions of the ordinances relating to the issuance of the currently outstanding Junior Lien Obligations or any Additional Junior Lien Obligations hereafter issued by the City.
SIXTH: to the payment of the amounts required to be deposited into the debt service fund created and established for the payment of the Commercial Paper Obligations (to the extent the Commercial Paper Obligations are payable from a subordinate lien on the Net Revenues), or any Subordinate Lien Obligations hereafter issued by the City as the same become due and payable.
SEVENTH: to the payment of the amounts required to be deposited into the reserve fund, if any, created and established to maintain the amounts required to be deposited in accordance with the provisions of the ordinances relating to the currently outstanding Commercial Paper Obligations (to the extent the Commercial Paper Obligations are payable from a subordinate lien on the Net Revenues), or any Subordinate Lien Obligations hereafter issued by the City as the same become due and payable.
EIGHTH: to the payment of the amounts required to be deposited into the debt service fund created and established for the payment of any Inferior Lien Obligations as the same become due and payable.
NINTH: to the payment of the amounts required to be deposited into the reserve fund, if any, created and established to maintain the amounts required to be deposited in accordance with the provisions of the ordinances relating to the issuance of any Inferior Lien Obligations.
TENTH: to the payment of the amounts to be deposited into the City Transfer Fund and to be transferred to the City’s General Fund as provided in the Ordinance. (See "Transfers to the City’s General Fund" below.)
ELEVENTH: to the payment of the amount to replenish the Operating Reserve Fund to the amount required in subparagraph FIRST above.
TWELFTH: to the payment of the accrual to fund or to replenish the Capital Improvement Fund created and established by the Ordinance, along with the accumulation of any other surplus Net Revenues. (See "Capital Improvement Fund" below.)
UDebt Service FundU . . . For purposes of providing funds to pay the principal of, premium, if any, and interest on the Senior Lien Obligations as the same become due and payable, the Brownsville PUB is required to maintain, at the Depository, a separate and special account or fund known as the Debt Service Fund. The Brownsville PUB is required to deposit into the Debt Service Fund prior to each principal and interest payment date from the available Net Revenues an amount equal to the amount required to fully pay the interest on and the principal of the Senior Lien Obligations then falling due and payable, such deposits to pay maturing principal and accrued interest on the Senior Lien Obligations to be made by the Brownsville PUB in substantially equal monthly installments on or before the business day before the 15th day of each month, beginning on or before the business day before the 15th day of the month next following the delivery of the Bonds to the Underwriters. If the Net Revenues in any month are insufficient to make the required payments into the Debt Service Fund, then the amount of any deficiency in such payment is required to be added to the amount otherwise required to be paid into the Debt Service Fund in the next month.
- 39 -
USenior Lien Reserve Fund U . . . The Ordinance requires the Brownsville PUB to create, establish, and maintain with a Depository a separate and special fund or account known as the Senior Lien Reserve Fund for the purpose of accumulating a reserve for the payment of the Senior Lien Obligations equal to the least of (1) 100% of the Maximum Annual Debt Service Requirements for the Senior Lien Obligations, (2) 125% of the Average Annual Debt Service Requirements for the Senior Lien Obligations and (3) 10% of the initial principal amount of the Outstanding Senior Lien Obligations (calculated by the Brownsville PUB at the beginning of each Fiscal Year and as of the date of issuance of the Bonds and each series of Additional Senior Lien Obligations) (the "Required Reserve Amount"). UJunior Lien Reserve FundU. . . To accumulate and maintain a reserve for the payment of the Junior Lien Obligations equal to 100% of the Average Annual Debt Service Requirements (calculated by the Brownsville PUB at the beginning of each Fiscal Year and as of the date of issuance of each series of Additional Junior Lien Obligations) for the Junior Lien Obligations (the Junior Lien Required Reserve Amount), the Issuer agrees that the Brownsville PUB will create and establish, and shall maintain a separate and special fund or account known as the “City of Brownsville, Texas Utilities System Junior Lien Revenue Bond Reserve Fund” (the Junior Lien Reserve Fund), which Fund shall be maintained at the Depository. All funds deposited into the Junior Lien Reserve Fund shall be used solely for the payment of the principal of and interest on the Junior Lien Obligations, when and to the extent other funds available for such purposes are insufficient, and, in addition, may be used to retire the last Stated Maturity or Stated Maturities of or interest on the Junior Lien Obligations. UTransfers to the City’s General Fund U . . . For purposes of providing funds to transfer to the City’s General Fund, the Ordinance requires the Brownsville PUB to create and maintain at the Depository a separate and special account or fund to be known as the City Transfer Fund. The Brownsville PUB is required to deposit into the City Transfer Fund from the available Adjusted Revenues an amount equal to one-third of the quarterly amount hereinafter described to be made by the Brownsville PUB to the City in substantially equal monthly installments on or before the business day before the 15th day of each month, beginning on or before the business day before the 15th day of the month next following the delivery of the Bonds to the Underwriters. After making each of the payments required by the provisions of subparagraphs FIRST through NINTH as described above under "Funds and Accounts and Flow of Funds - Plant Fund", the Designated Chief Financial Officer of the Brownsville PUB is required to transfer no later than the business day preceding the 15th day of the month following the end of each Fiscal Year quarter, an amount of money from the City Transfer Fund equal to ten percent (10%) (or such lesser amount as may be determined from time to time by the City Commission of the City) of the Gross Revenues received for the preceding Fiscal Year quarter, as adjusted in accordance with the next two following sentences, to be utilized by the City in the manner permitted by the provisions of Chapter 1502, as amended, Texas Government Code. Prior to applying the percentage set forth in the preceding sentence to determine the amount to be transferred to the City, the amount of Gross Revenues for a Fiscal Year quarter shall be reduced by an amount equal to all costs for the purchase of power, fuel and paid or incurred by the Brownsville PUB during such Fiscal Year quarter and by amounts paid by the Brownsville PUB to the Southmost Regional Water Authority with respect to the Southmost water project. Furthermore the amount of funds to be transferred to the City in accordance with the provisions of the Ordinance shall be reduced by any amounts owed by the City to the Brownsville PUB for utility services provided by the Brownsville PUB. To the extent that the available Net Revenues in any quarter are insufficient for the Brownsville PUB to make all or part of the required transfer to the City, the Brownsville PUB shall make up such shortfall (i) in the next quarter in which available Net Revenues exceed the amounts required to make the transfer to the City pursuant to the foregoing provisions and the payment to the Operating Reserve Fund under the provisions of the Ordinance, or (ii) to the extent such shortfall has not been made up by the last quarter of the Fiscal Year, solely from any surplus funds deposited into the Capital Improvement Fund for such Fiscal Year.
- 40 -
UCapital Improvement FundU . . . The Ordinance creates and establishes a special fund known as the Capital Improvement Fund. Money on deposit in the Capital Improvement Fund may be used for making any capital improvements to the System and for meeting contingencies of any nature in connection with the operations, maintenance, improvement, replacement, or relocation of properties constituting the System including, but not limited to, the replacement of any equipment relating to the System, as may be determined from time to time by the Brownsville PUB, and to fund the costs of any rate stabilization subaccount or any other similar subaccounts. The Ordinance requires the City to deposit Net Revenues of the System, after making each of the payments required by the provisions of subparagraphs FIRST through ELEVENTH as described above under “Funds and Accounts and Flow of Funds - Plant Fund”, into a Capital Improvement Reserve Fund of the Capital Improvement Fund in an annual sum equal to $3,000,000 until the amount on deposit in the Capital Improvement Reserve Fund of the Capital Improvement Fund equals or exceeds $15,000,000 (the "Capital Amount"). In the event that such annual payments are not made, the Brownsville PUB is required to request the City to establish sufficient rates and charges for the System to cure any such deficiency with respect to the accumulation of the Capital Amount within one year. When and so long as the cash and investments in the Capital Improvement Reserve Fund of the Capital Improvement Fund equals the Capital Amount, no deposits will be required to be made to the credit of the Capital Improvement Reserve Fund of the Capital Improvement Fund; but, if and when the Capital Improvement Reserve Fund Account of the Capital Improvement Fund at any time contains less than the Capital Amount, the City is required to cure the deficiency in the Capital Amount by resuming monthly deposits to said Fund from Net Revenues of the System, or at the option of the City from any other lawfully available funds, such monthly deposits to be in amounts equal to not less than 1/36th of the Capital Amount covenanted by the City to be maintained in the Capital Improvement Fund. UBudgetary Controls Controls are in place to reduce the possibility of overspending in individual line items. Requisitions that exceed budgeted amounts are flagged as such, and are not converted to purchase orders until the over-budget condition is corrected. This is accomplished by allowing departments to transfer budgets between line items within their purview. UOperating Revenues and Expenses Operating revenues and expenses generally result from providing services and producing and delivering goods in connection with the Brownsville PUB’s principal ongoing operations. The principal operating revenues of the Brownsville PUB are charges to customers for sales and services. Operating expenses include the cost of sales and services, administrative expenses, and depreciation on capital assets. All revenues and expenses not meeting this definition are reported as non-operating revenues and expenses. The Brownsville PUB defines operating revenues consistent with the precepts of GASB Statement No. 9, paragraphs 16 to 19 and 31: cash receipts from customers, cash receipts from quasi-external transactions with the City and other governments, and other cash receipts that do not result from transactions defined as capital and related financing, non-capital financing, or investment activities. UUtility Service Revenue and Electric Purchased Power Expense Electric, water, and wastewater revenues are recognized as billed on a cycle basis with recognition of unbilled revenues year-end, based upon the meter reading dates for the unbilled portion of each cycle. Electric rate schedules include power cost adjustment clauses that permit recovery of purchased power

- 41 -
costs, not included in base rates, in the month after such costs are incurred. The Brownsville PUB charges to expense the cost of purchased power in the period of purchase. UCapital Assets Utility plant-in-service is stated at cost which generally includes the cost of contracted services and certain materials and labor. Maintenance and repairs of property and items determined to be less than units of property are charged to operating and maintenance expenses; major plant replacements are capitalized. Assets acquired through contributions, such as those from land developers, are capitalized at estimated fair value at the date contributed. Capital assets are defined by the Brownsville PUB as assets with an initial, individual cost of more than $5,000 and an estimated useful life in excess of eighteen months. Meter and line transformer inventory have been included in utility plant to conform to Federal Energy Regulatory Commission guidelines. Depreciation is computed using the straight-line method over the estimated useful lives of the assets. UInvestments The Brownsville PUB invests funds in accordance with the Texas Public Funds Investment Act, bond indentures, and the Brownsville PUB’s approved investment policy, which is approved annually by the Board of Trustees. The investment policy was approved by the Board of Trustees on January 12, 2015 which included an “Investment Strategy Statement” that addressed the understanding of investment suitability, the preservation and safety of principal, liquidity, marketability of the investment prior to maturity, diversification, and yield of the investment portfolio. Investments consist primarily of United States Treasury Obligations, certificates of deposit, and government-backed securities. Statues authorize the Brownsville PUB to invest in obligations of the United States or its agencies and instrumentalities; direct obligations of the State of Texas or its agencies; obligations of states, agencies, counties, cities and other political subdivisions of any state rated not less than A or its equivalent; certificates of deposit; prime domestic bankers’ acceptances; eligible investment pools; certain commercial paper; certain mutual funds; and fully collateralized repurchase agreements. Investments are made only with certified brokers/dealers as required by the investment policy provisions and state law. The Brownsville PUB follows the provisions of GASB Statement No. 31, Accounting and Financial Reporting for Certain Investments and for External Investment Pools. In accordance with GASB No. 31, the Brownsville PUB’s general policy is to report short-term investments at amortized cost. All other investments are reported at fair value. The term “short-term” refers to investments that have a remaining term to maturity of one year or less at time of purchase. Fair value determinations of all securities are made on a quarterly basis. U
Cash Management Policies and Practices
During the year, cash is invested in money market mutual funds, certificates of deposit, agencies, and various investment pools as either short term or long term investments. Cash deposits are properly secured at all times per Brownsville PUB’s Investment Policy. Accordingly, cash deposits are either insured by federal depository insurance or collateralized. All collateral on deposits is held by a third-party institution in the Brownsville PUB’s name.

- 42 -
UCapital Spending Policy Working as a team, Department Heads and key staff members developed a comprehensive departmental and system capital improvements plan, taking into consideration both expansion and major rehabilitation. After completion the team met to discuss and evaluate the plans based on available working capital, anticipated capital spending improvement charges, rate increases and long-term financing to determine which projects were prudent. The Capital Improvement Plan (CIP) was then incorporated into the Capital Budget and put through the same rigorous scrutiny as the other budgets to determine which projects/items would be funded in this fiscal year. At the time major capital expenditures are initiated, or when capital projects cannot be funded from rates or other sources, staff seeks Board approval to obtain alternative financing through bonds or short-term commercial paper (CP) issues. Commercial Paper Program Short term debt, including commercial paper notes, shall be used when authorized for interim financing of capital projects approved by BPUB Board and to take advantage of lower interest rates in the short term variable rate market; which provide the BPUB with flexibility in timing its entry into the long term fixed rate market. Commercial paper notes shall be used for funding additions, improvements and extensions to the combined electric system, waterworks system, and sewer system included in BPUB’s annual CIP plan as approved by the Board. The term of any commercial paper notes shall not exceed 270 days. Authorized commercial paper program shall not exceed 20% of outstanding long term fixed rate revenue bond. Commercial paper notes shall only be defeased with refunding bonds when the amount to be refunded reaches a minimum of $15 million. The Board shall be notified when any project financed with commercial paper remains outstanding for more than 3 years. Capital projects should be financed through a combination of cash referred to as pay-as-you-go financing (equity contributions from current net revenues) and debt. An annual funding ratio between 15% and 30% of equity contribution is desirable. Commercial Paper will be paid with cash or refunded with long term revenue refunding bonds when economic and business conditions are appropriate. Debt financing for capital projects will not exceed the useful life of the asset, and in no case shall the term exceed 30 years. There shall always be at least interest paid in the first fiscal year after the sale of the revenue refunding bonds and principle starting generally no later than the second fiscal year after the issue. Bond sales shall be structured to achieve level debt service payments on an issue by issue basis. Debt Service Coverage Ratio Policy The Debt Service Coverage Ratio is estimated at 2.22 for FY 2016, compared to 2.82 unaudited actual for FY 2015, and 2.15 in the Amended FY 2015 Budget. The Utility’s minimum coverage for Senior lien debt is 1.25 times which is required by bond covenants.
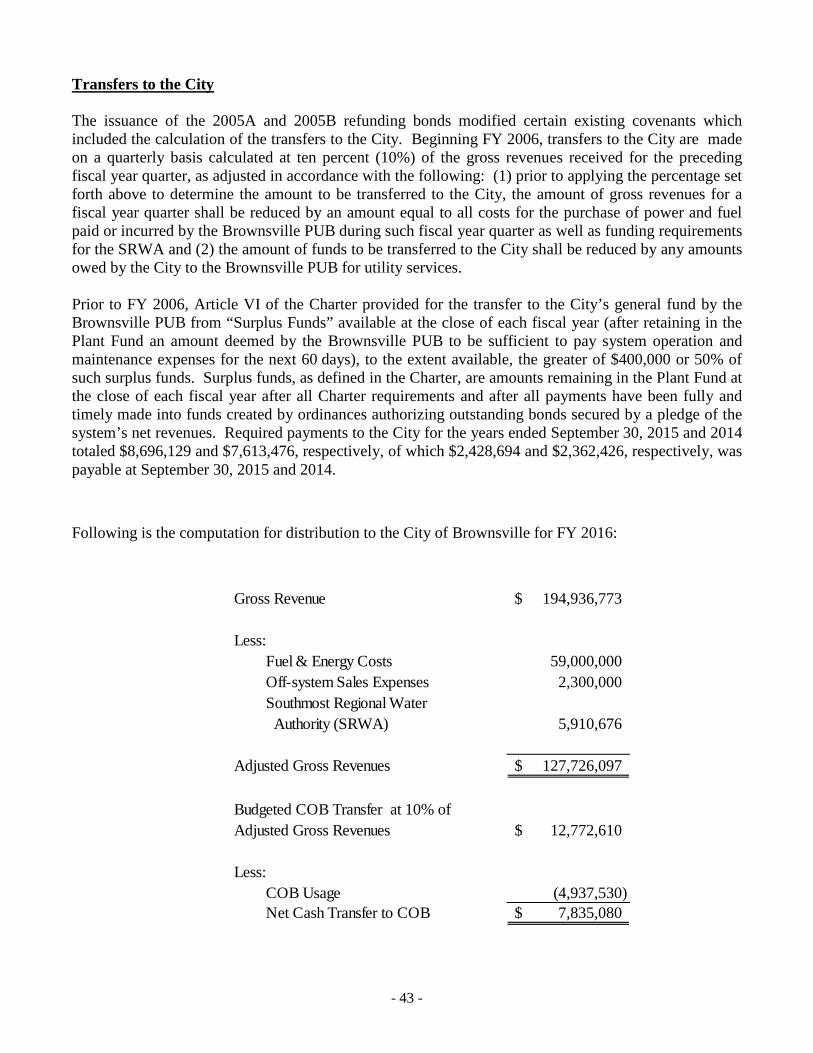
- 43 -
Transfers to the City The issuance of the 2005A and 2005B refunding bonds modified certain existing covenants which included the calculation of the transfers to the City. Beginning FY 2006, transfers to the City are made on a quarterly basis calculated at ten percent (10%) of the gross revenues received for the preceding fiscal year quarter, as adjusted in accordance with the following: (1) prior to applying the percentage set forth above to determine the amount to be transferred to the City, the amount of gross revenues for a fiscal year quarter shall be reduced by an amount equal to all costs for the purchase of power and fuel paid or incurred by the Brownsville PUB during such fiscal year quarter as well as funding requirements for the SRWA and (2) the amount of funds to be transferred to the City shall be reduced by any amounts owed by the City to the Brownsville PUB for utility services.
Prior to FY 2006, Article VI of the Charter provided for the transfer to the City’s general fund by the Brownsville PUB from “Surplus Funds” available at the close of each fiscal year (after retaining in the Plant Fund an amount deemed by the Brownsville PUB to be sufficient to pay system operation and maintenance expenses for the next 60 days), to the extent available, the greater of $400,000 or 50% of such surplus funds. Surplus funds, as defined in the Charter, are amounts remaining in the Plant Fund at the close of each fiscal year after all Charter requirements and after all payments have been fully and timely made into funds created by ordinances authorizing outstanding bonds secured by a pledge of the system’s net revenues. Required payments to the City for the years ended September 30, 2015 and 2014 totaled $8,696,129 and $7,613,476, respectively, of which $2,428,694 and $2,362,426, respectively, was payable at September 30, 2015 and 2014.
Following is the computation for distribution to the City of Brownsville for FY 2016:
Gross Revenue 194,936,773$
Less: Fuel & Energy Costs 59,000,000
Off-system Sales Expenses 2,300,000 Southmost Regional Water Authority (SRWA) 5,910,676
Adjusted Gross Revenues 127,726,097$
Budgeted COB Transfer at 10% ofAdjusted Gross Revenues 12,772,610$
Less: COB Usage (4,937,530) Net Cash Transfer to COB 7,835,080$

- 44 -
THIS PAGE INTENTIONALLY LEFT BLANK

- 45 -
BUDGET RECAP
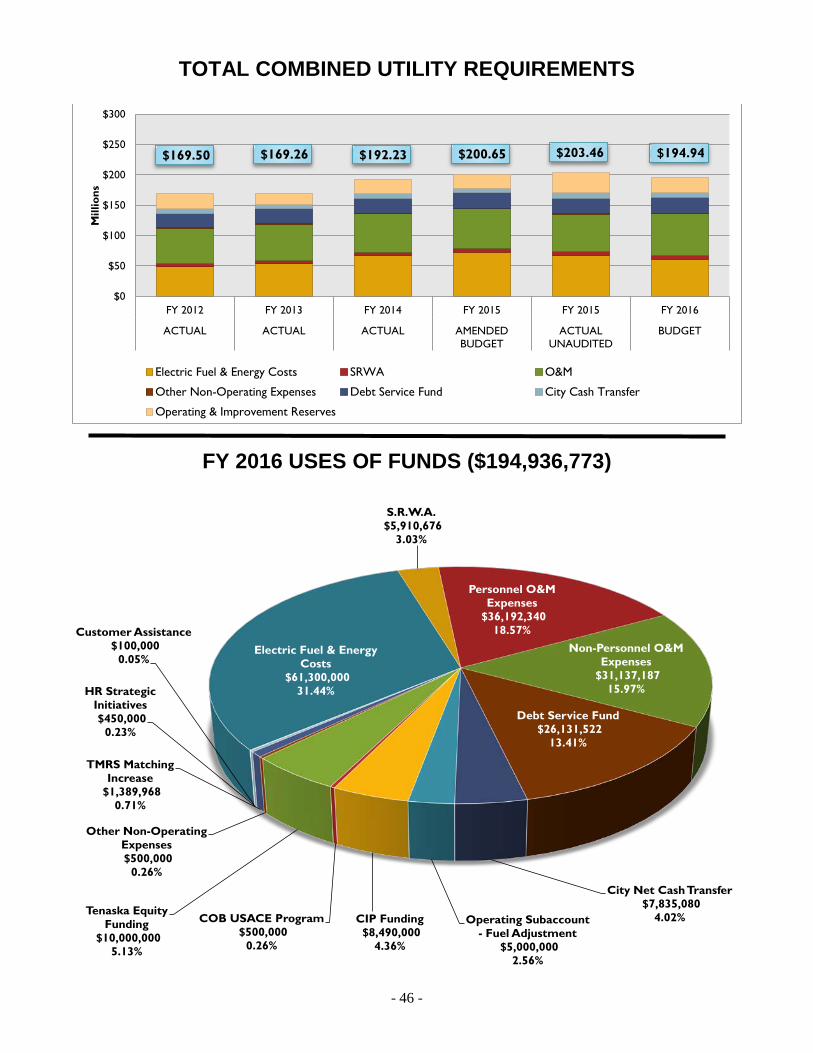
- 46 -
TOTAL COMBINED UTILITY REQUIREMENTS
$169.50 $169.26 $192.23 $200.65 $203.46 $194.94
$0
$50
$100
$150
$200
$250
$300
FY 2012 FY 2013 FY 2014 FY 2015 FY 2015 FY 2016
ACTUAL ACTUAL ACTUAL AMENDEDBUDGET
ACTUALUNAUDITED
BUDGET
Mill
ions
Electric Fuel & Energy Costs SRWA O&M
Other Non-Operating Expenses Debt Service Fund City Cash Transfer
Operating & Improvement Reserves
FY 2016 USES OF FUNDS ($194,936,773)
Electric Fuel & Energy Costs
$61,300,000 31.44%
S.R.W.A. $5,910,676
3.03%
Personnel O&M Expenses
$36,192,340 18.57%
Non-Personnel O&M Expenses
$31,137,187 15.97%
Debt Service Fund $26,131,522
13.41%
City Net Cash Transfer $7,835,080
4.02% Operating Subaccount - Fuel Adjustment
$5,000,000 2.56%
CIP Funding $8,490,000
4.36%
COB USACE Program $500,000
0.26%
Tenaska Equity Funding
$10,000,000 5.13%
Other Non-Operating Expenses $500,000
0.26%
TMRS Matching Increase
$1,389,968 0.71%
HR Strategic Initiatives $450,000
0.23%
Customer Assistance $100,000
0.05%

- 47 -
FY 2016 REQUIREMENTS AS A PERCENT OF TOTAL BUDGET
Electric Fuel & Energy Costs
31.44%
S.R.W.A. 3.03%
O&M 35.53%
Debt Service Fund 13.41%
City Net Cash Transfer 4.02%
Operating & Improvement Reserves
12.31%
Other Non-Operating Expenses
0.26%
THE REMAINDER OF THIS PAGE INTENTIONALLY LEFT BLANK
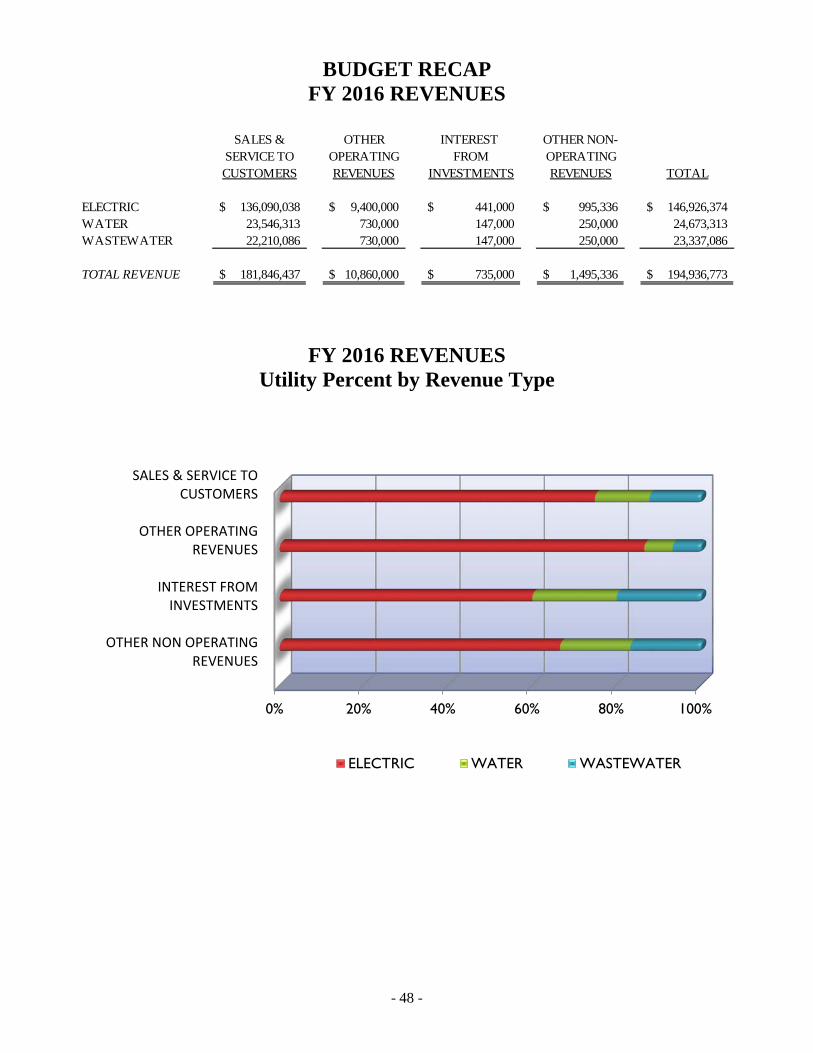
- 48 -
BUDGET RECAP FY 2016 REVENUES
SALES & OTHER INTEREST OTHER NON-
SERVICE TO OPERATING FROM OPERATINGCUSTOMERS REVENUES INVESTMENTS REVENUES TOTAL
ELECTRIC 136,090,038$ 9,400,000$ 441,000$ 995,336$ 146,926,374$ WATER 23,546,313 730,000 147,000 250,000 24,673,313 WASTEWATER 22,210,086 730,000 147,000 250,000 23,337,086
TOTAL REVENUE 181,846,437$ 10,860,000$ 735,000$ 1,495,336$ 194,936,773$
FY 2016 REVENUES Utility Percent by Revenue Type
0% 20% 40% 60% 80% 100%
ELECTRIC WATER WASTEWATER
SALES & SERVICE TO CUSTOMERS
OTHER OPERATING REVENUES
INTEREST FROM INVESTMENTS
OTHER NON OPERATING REVENUES
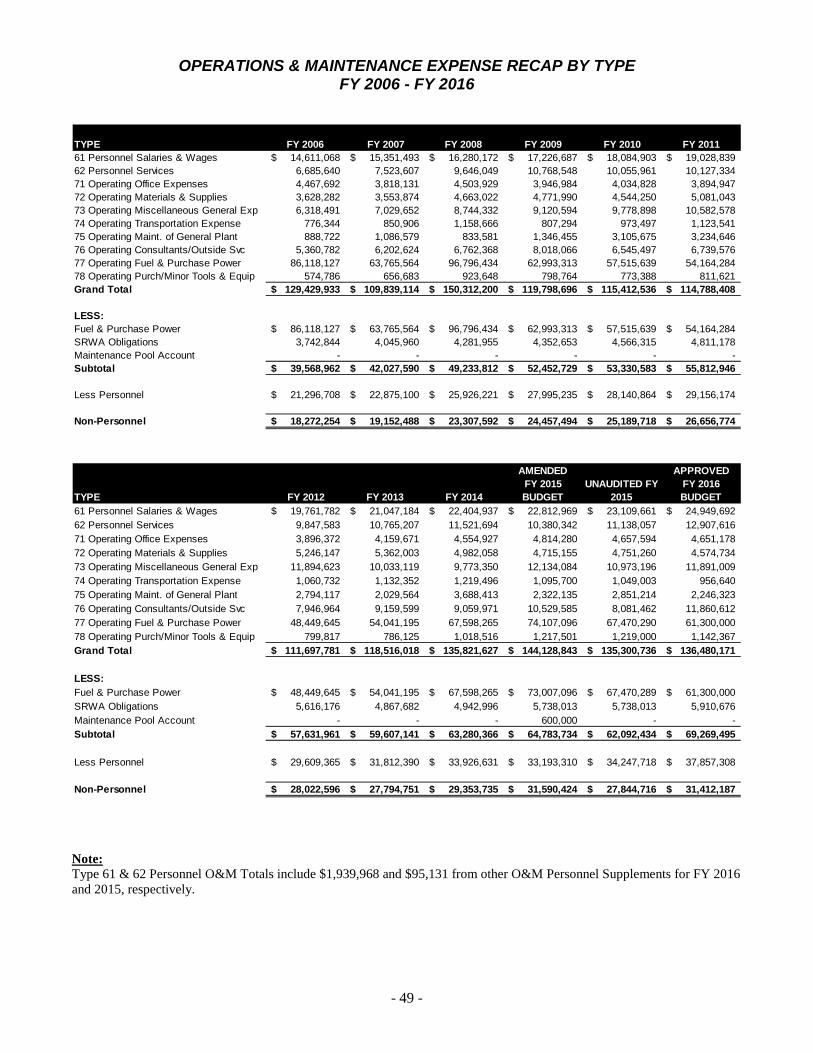
- 49 -
OPERATIONS & MAINTENANCE EXPENSE RECAP BY TYPE FY 2006 - FY 2016
TYPE FY 2006 FY 2007 FY 2008 FY 2009 FY 2010 FY 201161 Personnel Salaries & Wages 14,611,068$ 15,351,493$ 16,280,172$ 17,226,687$ 18,084,903$ 19,028,839$ 62 Personnel Services 6,685,640 7,523,607 9,646,049 10,768,548 10,055,961 10,127,33471 Operating Office Expenses 4,467,692 3,818,131 4,503,929 3,946,984 4,034,828 3,894,94772 Operating Materials & Supplies 3,628,282 3,553,874 4,663,022 4,771,990 4,544,250 5,081,04373 Operating Miscellaneous General Exp 6,318,491 7,029,652 8,744,332 9,120,594 9,778,898 10,582,57874 Operating Transportation Expense 776,344 850,906 1,158,666 807,294 973,497 1,123,54175 Operating Maint. of General Plant 888,722 1,086,579 833,581 1,346,455 3,105,675 3,234,64676 Operating Consultants/Outside Svc 5,360,782 6,202,624 6,762,368 8,018,066 6,545,497 6,739,57677 Operating Fuel & Purchase Power 86,118,127 63,765,564 96,796,434 62,993,313 57,515,639 54,164,28478 Operating Purch/Minor Tools & Equip 574,786 656,683 923,648 798,764 773,388 811,621Grand Total 129,429,933$ 109,839,114$ 150,312,200$ 119,798,696$ 115,412,536$ 114,788,408$
LESS:Fuel & Purchase Power 86,118,127$ 63,765,564$ 96,796,434$ 62,993,313$ 57,515,639$ 54,164,284$ SRWA Obligations 3,742,844 4,045,960 4,281,955 4,352,653 4,566,315 4,811,178 Maintenance Pool Account - - - - - - Subtotal 39,568,962$ 42,027,590$ 49,233,812$ 52,452,729$ 53,330,583$ 55,812,946$
Less Personnel 21,296,708$ 22,875,100$ 25,926,221$ 27,995,235$ 28,140,864$ 29,156,174$
Non-Personnel 18,272,254$ 19,152,488$ 23,307,592$ 24,457,494$ 25,189,718$ 26,656,774$
AMENDED APPROVED
TYPE FY 2012 FY 2013 FY 2014FY 2015BUDGET
UNAUDITED FY 2015
FY 2016BUDGET
61 Personnel Salaries & Wages 19,761,782$ 21,047,184$ 22,404,937$ 22,812,969$ 23,109,661$ 24,949,692$ 62 Personnel Services 9,847,583 10,765,207 11,521,694 10,380,342 11,138,057 12,907,61671 Operating Office Expenses 3,896,372 4,159,671 4,554,927 4,814,280 4,657,594 4,651,17872 Operating Materials & Supplies 5,246,147 5,362,003 4,982,058 4,715,155 4,751,260 4,574,73473 Operating Miscellaneous General Exp 11,894,623 10,033,119 9,773,350 12,134,084 10,973,196 11,891,00974 Operating Transportation Expense 1,060,732 1,132,352 1,219,496 1,095,700 1,049,003 956,64075 Operating Maint. of General Plant 2,794,117 2,029,564 3,688,413 2,322,135 2,851,214 2,246,32376 Operating Consultants/Outside Svc 7,946,964 9,159,599 9,059,971 10,529,585 8,081,462 11,860,61277 Operating Fuel & Purchase Power 48,449,645 54,041,195 67,598,265 74,107,096 67,470,290 61,300,00078 Operating Purch/Minor Tools & Equip 799,817 786,125 1,018,516 1,217,501 1,219,000 1,142,367Grand Total 111,697,781$ 118,516,018$ 135,821,627$ 144,128,843$ 135,300,736$ 136,480,171$
LESS:Fuel & Purchase Power 48,449,645$ 54,041,195$ 67,598,265$ 73,007,096$ 67,470,289$ 61,300,000$ SRWA Obligations 5,616,176 4,867,682 4,942,996 5,738,013 5,738,013 5,910,676 Maintenance Pool Account - - - 600,000 - - Subtotal 57,631,961$ 59,607,141$ 63,280,366$ 64,783,734$ 62,092,434$ 69,269,495$
Less Personnel 29,609,365$ 31,812,390$ 33,926,631$ 33,193,310$ 34,247,718$ 37,857,308$
Non-Personnel 28,022,596$ 27,794,751$ 29,353,735$ 31,590,424$ 27,844,716$ 31,412,187$
Note: Type 61 & 62 Personnel O&M Totals include $1,939,968 and $95,131 from other O&M Personnel Supplements for FY 2016 and 2015, respectively.

- 50 -
OPERATIONS & MAINTENANCE EXPENSE RECAP BY DEPARTMENT & TYPE FY 2016
61 62 71 72 73 74
ORG. NO. DEPARTMENT
SALARIES & WAGES
PERSONNEL SERVICES
OFFICE EXPENSES
MATERIALS & SUPPLIES
MISC. GENERAL EXP.
TRANSP.EXP.
1110 GENERAL MANAGER 347,475$ 107,413$ 83,673$ 750$ 3,700$ -$ 1120 INTERNAL AUDIT 189,842 66,081 12,928 100 700 350 1125 KEY ACCOUNT MARKETING 227,208 80,518 13,350 250 7,700 700 1130 COMMUNICATIONS & ADMINISTRATIVE SVC 156,667 58,103 9,300 500 6,250 - 1135 COMMUNICATIONS & PUBLIC RELATIONS 213,034 76,876 330,095 7,250 24,000 500 1140 ORGANIZATIONAL DEVELOPMENT 175,199 58,663 36,500 500 2,900 200 1145 ENERGY SERVICES 199,430 62,679 3,700 - 200 - 1150 BOARD OF DIRECTORS - - 97,250 500 11,100 - 1165 RECORDS MANAGEMENT 101,203 39,541 8,000 1,200 18,200 600 1410 ENVIRONMENTAL SERVICES 265,201 99,085 21,135 25,500 413,500 2,000 1420 ENVIRONMENTAL COMPLIANCE 389,605 133,668 26,300 17,750 17,250 750 1422 ANALYTICAL LAB 704,278 274,606 66,420 121,300 28,870 4,000 1430 PRE-TREATMENT 457,885 173,507 13,450 7,650 6,700 4,000 1440 HEALTH & SAFETY 314,965 116,478 21,650 26,000 34,100 4,000 2110 TRANS, DIST, SUBSTATIONS & PLANNING 140,005 48,636 6,575 450 75 - 2120 SUBSTATIONS AND RELAYING 577,759 211,443 118,480 17,600 41,000 13,000 2130 ELEC TRANS&DIST NEW CONSTRUCTION 762,940 296,361 11,350 75,300 46,000 60,000 2140 ELEC TRANS & DIST MAINTENANCE 1,040,184 393,633 6,750 161,000 59,600 60,000 2150 ENERGY CONTROL CENTER OPERATIONS 910,946 298,791 82,200 500 6,000 500 2210 SCADA & ELECTRICAL SUPPORT SERVICES 872,758 315,761 32,100 201,500 338,950 15,000 2220 POWER PRODUCTION 1,467,127 536,536 250,865 69,000 22,500 3,400 2310 ELECTRIC METER SHOP 321,509 132,994 2,950 17,500 4,900 14,000 2410 ELECTRIC ENGINEERING 517,291 179,303 22,400 2,650 2,660 3,500 3110 W&WW ENG, PLANNING & TREATMENT 118,365 45,584 17,595 - 800 - 3120 WATER PLANT I 349,924 138,654 255,793 743,000 6,508 2,000 3130 WATER PLANT II 323,710 132,387 48,096 695,490 8,008 1,500 3135 RESACA MAINTENANCE 579,830 (15,955) 6,909 127,758 21,824 24,451 3140 RAW WATER SUPPLY 128,040 57,421 169,150 54,600 2,050 15,000 3145 W/WW PLANT MAINTENANCE 589,236 232,852 23,172 50,500 8,450 19,000 3150 W/WW OPERATIONS & CONSTRUCTION 1,841,200 779,183 53,950 512,700 33,500 180,000 3210 SOUTH WASTEWATER TREATMENT PLANT 367,653 157,753 470,250 128,600 15,750 23,500 3220 ROBINDALE WASTEWATER TREATMENT PLANT 443,911 171,243 475,400 107,450 22,750 7,500 3230 WASTEWATER LIFT STATIONS 1,241,909 500,452 587,940 1,199,056 16,541 73,689 3310 WATER & WASTEWATER ENGINEERING 679,998 242,906 30,240 2,500 13,450 17,000 4105 OPERATIONS 285,022 83,143 29,060 - 200 - 4110 ENERGY RISK MANAGEMENT 86,258 23,940 5,700 - 300 - 4210 NERC COMPLIANCE 198,869 61,637 18,500 - 127,000 - 4220 FUEL & ENERGY SUPPLY 118,310 45,210 9,200 - 900,700 - 4230 NATURAL GAS UTILITY MANAGEMENT - - 2,100 - 500 - 4310 OPERATIONAL SUPPORT SERVICES 175,024 63,942 8,280 600 3,300 - 5110 FINANCE 468,427 160,372 35,172 300 12,000 - 5120 ACCOUNTING 582,669 230,701 20,200 175 1,371 - 5130 PURCHASING & CENTRAL STORES 268,247 104,860 45,746 1,200 3,800 - 5140 REVENUE RECOVERY 133,219 51,780 4,460 7,212 3,725 2,500 6105 CUSTOMER & INFORMATION SERVICES 186,990 69,893 8,760 1 250 - 6110 CUSTOMER SERVICE 443,388 183,213 7,575 1,000 5,800 - 6115 COLLECTIONS 124,351 56,185 1,660 500 700,500 - 6120 BILLING 212,102 102,814 346,620 62,000 94,100 4,000 6125 CALL CENTER 370,350 172,950 5,825 350 800 - 6130 METER SERVICES 326,908 135,160 10,724 11,092 16,470 25,000 6135 CIS SUPPORT 158,685 56,952 7,300 300 600 - 6145 ENERGY EFFICIENCY & CONSERVATION - - 3,950 200 447,525 - 6150 METER READING 400,940 189,419 4,740 13,000 26,500 27,000 6160 CASHIERS 240,322 109,262 9,250 2,000 700 - 7110 ADMINISTRATIVE SERVICES 200,013 56,839 - - - - 7120 RISK/INSURANCE MANAGEMENT 104,146 38,228 6,850 150 2,028,028 2,000 7130 INFORMATION TECHNOLOGY 951,358 356,811 204,200 11,000 1,400 1,000 7135 GEOGRAPHIC INFORMATION SYSTEMS 509,907 205,844 24,000 3,000 170,000 5,000 7140 HUMAN RESOURCES 356,664 628,957 32,565 500 66,500 - 7145 TALENT ACQUISTION & STAFFING 133,384 51,771 53,325 500 700 - 7150 FLEET MANAGEMENT 421,062 154,820 12,900 42,300 7,900 337,000 7160 FACILITY MAINTENANCE 121,101 59,598 315,200 38,000 878 500 7170 WAREHOUSE 173,281 81,963 1,400 2,850 2,300 2,500 9110 COMPANY-WIDE EXPENSES 182,407 3,168,196 - 100 6,020,676 - 9150 PRIOR FY ENCUMBERED BUDGET - - - - - -
GRAND TOTAL 24,949,692$ 12,907,616$ 4,651,178$ 4,574,734$ 11,891,009$ 956,640$
LESS:Fuel & Purchase Power -$ -$ -$ -$ -$ -$ SRWA Obligations - - - - 5,910,676 - Maintenance Pool Account - - - - - - TOTAL OPERATIONS & MAINTENANCE 24,949,692$ 12,907,616$ 4,651,178$ 4,574,734$ 5,980,333$ 956,640$
TYPE DESCRIPTION
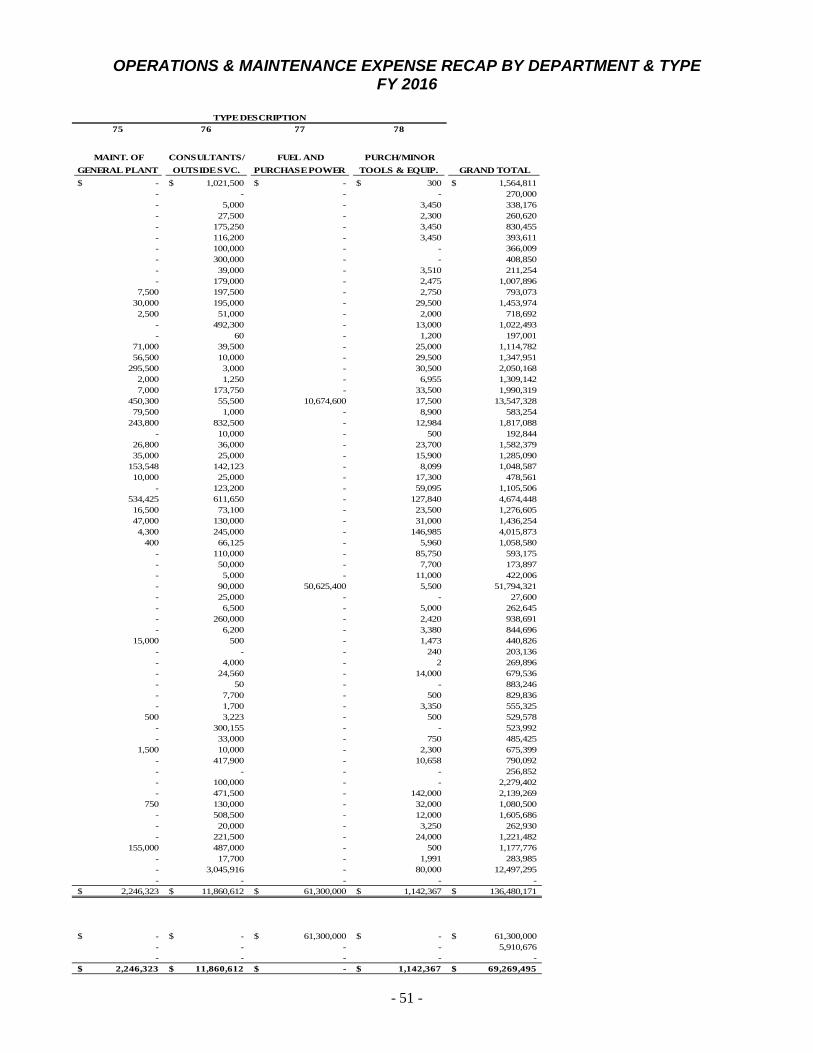
- 51 -
OPERATIONS & MAINTENANCE EXPENSE RECAP BY DEPARTMENT & TYPE FY 2016
75 76 77 78
MAINT. OF GENERAL PLANT
CONSULTANTS/OUTSIDE SVC.
FUEL AND PURCHASE POWER
PURCH/MINOR TOOLS & EQUIP. GRAND TOTAL
-$ 1,021,500$ -$ 300$ 1,564,811$ - - - - 270,000 - 5,000 - 3,450 338,176 - 27,500 - 2,300 260,620 - 175,250 - 3,450 830,455 - 116,200 - 3,450 393,611 - 100,000 - - 366,009 - 300,000 - - 408,850 - 39,000 - 3,510 211,254 - 179,000 - 2,475 1,007,896
7,500 197,500 - 2,750 793,073 30,000 195,000 - 29,500 1,453,974 2,500 51,000 - 2,000 718,692
- 492,300 - 13,000 1,022,493 - 60 - 1,200 197,001
71,000 39,500 - 25,000 1,114,782 56,500 10,000 - 29,500 1,347,951
295,500 3,000 - 30,500 2,050,168 2,000 1,250 - 6,955 1,309,142 7,000 173,750 - 33,500 1,990,319
450,300 55,500 10,674,600 17,500 13,547,328 79,500 1,000 - 8,900 583,254
243,800 832,500 - 12,984 1,817,088 - 10,000 - 500 192,844
26,800 36,000 - 23,700 1,582,379 35,000 25,000 - 15,900 1,285,090
153,548 142,123 - 8,099 1,048,587 10,000 25,000 - 17,300 478,561
- 123,200 - 59,095 1,105,506 534,425 611,650 - 127,840 4,674,448 16,500 73,100 - 23,500 1,276,605 47,000 130,000 - 31,000 1,436,254 4,300 245,000 - 146,985 4,015,873
400 66,125 - 5,960 1,058,580 - 110,000 - 85,750 593,175 - 50,000 - 7,700 173,897 - 5,000 - 11,000 422,006 - 90,000 50,625,400 5,500 51,794,321 - 25,000 - - 27,600 - 6,500 - 5,000 262,645 - 260,000 - 2,420 938,691 - 6,200 - 3,380 844,696
15,000 500 - 1,473 440,826 - - - 240 203,136 - 4,000 - 2 269,896 - 24,560 - 14,000 679,536 - 50 - - 883,246 - 7,700 - 500 829,836 - 1,700 - 3,350 555,325
500 3,223 - 500 529,578 - 300,155 - - 523,992 - 33,000 - 750 485,425
1,500 10,000 - 2,300 675,399 - 417,900 - 10,658 790,092 - - - - 256,852 - 100,000 - - 2,279,402 - 471,500 - 142,000 2,139,269
750 130,000 - 32,000 1,080,500 - 508,500 - 12,000 1,605,686 - 20,000 - 3,250 262,930 - 221,500 - 24,000 1,221,482
155,000 487,000 - 500 1,177,776 - 17,700 - 1,991 283,985 - 3,045,916 - 80,000 12,497,295 - - - - -
2,246,323$ 11,860,612$ 61,300,000$ 1,142,367$ 136,480,171$
-$ -$ 61,300,000$ -$ 61,300,000$ - - - - 5,910,676 - - - - -
2,246,323$ 11,860,612$ -$ 1,142,367$ 69,269,495$
TYPE DESCRIPTION

- 52 -
OPERATIONS & MAINTENANCE EXPENSE RECAP BY DEPARTMENT FY 2012 – FY 2016
ORG.NO. DEPARTMENT
ActualFY 2012
ActualFY 2013
ActualFY 2014
AmendedBudget
FY 2015
UNAUDITEDActual
FY 2015
ApprovedBudget
FY 20161110 GENERAL MANAGER 1,480,381$ 1,858,368$ 1,758,450$ 1,878,790$ 1,375,696$ 1,564,811$ 1120 INTERNAL AUDIT 177,414 213,453 290,130 259,520 263,471 270,000 1125 KEY ACCOUNT MARKETING 140,174 150,107 140,389 229,259 188,027 338,176 1130 COMMUNICATIONS & ADMINISTRATIVE SVC 418,624 246,850 295,303 264,220 237,785 260,620 1135 COMMUNICATIONS & PUBLIC RELATIONS 567,239 694,482 736,094 890,169 704,247 830,455 1140 ORGANIZATIONAL DEVELOPMENT 321,178 292,062 350,661 389,318 331,537 393,611 1145 ENERGY SERVICES 274,367 160,950 253,326 362,528 (4,485) 366,009 1150 BOARD OF DIRECTORS 241,442 274,356 264,117 537,532 306,060 408,850 1165 RECORDS MANAGEMENT 2,535 207,686 204,587 223,973 168,110 211,254 1410 ENVIRONMENTAL SERVICES 686,097 691,102 881,209 968,728 1,044,012 1,007,896 1420 ENVIRONMENTAL COMPLIANCE 855,083 846,421 875,292 811,576 873,439 793,073 1422 ANALYTICAL LAB 1,346,116 1,267,040 1,454,372 1,525,723 1,487,274 1,453,974 1430 PRE-TREATMENT 499,658 600,140 672,845 744,152 773,726 718,692 1440 HEALTH & SAFETY 547,101 757,114 1,012,000 1,079,550 1,018,369 1,022,493 2110 TRANS, DIST, SUBSTATIONS & PLANNING - - 127,050 193,194 195,900 197,001 2120 SUBSTATIONS AND RELAYING 616,552 948,319 1,026,105 1,074,102 1,069,806 1,114,782 2130 ELEC TRANS&DIST NEW CONSTRUCTION 1,728,977 1,676,647 1,215,946 1,022,244 1,226,171 1,347,951 2140 ELEC TRANS & DIST MAINTENANCE 2,473,298 2,252,265 2,483,879 2,003,156 2,331,197 2,050,168 2150 ENERGY CONTROL CENTER OPERATIONS 1,102,719 1,131,651 1,280,018 1,248,067 1,323,695 1,309,142 2210 SCADA & ELECTRICAL SUPPORT SERVICES 46,995,075 48,082,539 61,353,772 2,236,934 1,912,656 1,990,319 2220 POWER PRODUCTION 10,749,046 13,354,143 13,735,239 14,747,827 13,173,506 13,547,328 2310 ELECTRIC METER SHOP 502,884 524,894 559,199 534,891 582,553 583,254 2410 ELECTRIC ENGINEERING 1,735,267 1,649,897 1,596,731 1,653,565 1,621,212 1,817,088 3110 W&WW ENG. PLANNING & TREATMENT 314,918 365,778 204,461 147,866 212,234 192,844 3120 WATER PLANT I (1) 1,830,864 1,715,990 1,615,837 1,626,610 1,514,097 1,582,379 3130 WATER PLANT II (1) 1,375,379 1,296,562 1,293,962 1,237,667 1,321,191 1,285,090 3135 RESACA MAINTENANCE 541,762 1,705,909 1,988,617 1,681,840 1,954,928 1,048,587 3140 RAW WATER SUPPLY 404,496 481,771 346,835 451,051 464,908 478,561 3145 W/WW PLANT MAINTENANCE 1,074,687 949,331 1,066,212 937,046 1,074,159 1,105,506 3150 W/WW OPERATIONS & CONSTRUCTION 3,943,564 3,965,262 4,400,794 4,138,898 4,827,392 4,674,448 3210 SOUTH WASTEWATER TREATMENT PLANT 1,303,163 1,290,717 1,341,374 1,307,943 1,196,558 1,276,605 3220 ROBINDALE WASTEWATER TREATMENT PLNT 1,434,431 1,408,586 1,545,107 1,355,939 1,518,284 1,436,254 3230 WASTEWATER LIFT STATIONS 3,319,689 3,563,708 4,171,002 3,969,581 4,001,674 4,015,873 3310 WATER & WASTEWATER ENGINEERING 1,296,550 1,304,731 1,257,974 422,395 949,879 1,058,580 4105 OPERATIONS - - 64,261 264,459 548,126 593,175 4110 ENERGY RISK MANAGEMENT - - 85,669 237,733 197,980 173,897 4210 NERC COMPLIANCE - - 81,621 404,234 343,739 422,006 4220 FUEL & ENERGY SUPPLY - - 72,456 64,405,538 59,093,030 51,794,321 4230 NATURAL GAS UTILITY MANAGEMENT - - - 152,600 - 27,600 4310 OPERATIONAL SUPPORT SERVICES - - 100,561 152,343 157,612 262,645 5110 FINANCE 721,971 1,185,546 747,328 802,710 632,368 938,691 5120 ACCOUNTING 583,198 560,484 629,252 629,828 592,544 844,696 5130 PURCHASING & CENTRAL STORES 312,364 308,362 316,717 314,077 336,980 440,826 5140 REVENUE RECOVERY 138,005 219,915 204,369 201,961 201,661 203,136 6105 CUSTOMER & INFORMATION SERVICES 281,522 266,871 299,291 420,843 311,925 269,896 6110 CUSTOMER SERVICE 562,368 535,719 607,131 597,165 713,626 679,536 6115 COLLECTIONS 745,138 538,899 159,686 878,998 699,348 883,246 6120 BILLING 684,745 756,020 726,634 780,797 788,277 829,836 6125 CALL CENTER 396,437 461,606 470,010 441,194 453,762 555,325 6130 METER SERVICES 558,723 490,682 498,367 532,283 548,518 529,578 6135 CIS SUPPORT 355,426 354,398 345,706 396,190 375,133 523,992 6145 ENERGY EFFICIENCY & CONSERVATION 238,274 252,055 299,778 569,844 279,542 485,425 6150 METER READING 697,246 665,710 613,681 669,218 712,652 675,399 6160 CASHIERS 709,057 699,368 862,637 834,387 822,130 790,092 7110 ADMINISTRATIVE SERVICES - - - 258,302 - 256,852 7120 RISK/INSURANCE MANAGEMENT 1,854,309 2,136,434 1,976,056 2,278,046 2,100,917 2,279,402 7130 INFORMATION TECHNOLOGY 1,871,175 1,983,972 2,199,603 2,060,484 2,382,676 2,139,269 7135 GEOGRAPHIC INFORMATION SYSTEMS 710,868 810,952 996,970 1,058,432 1,075,720 1,080,500 7140 HUMAN RESOURCES 751,356 962,468 986,040 1,345,031 1,022,256 1,605,686 7145 TALENT ACQUISITION & STAFFING - - - - - 262,930 7150 FLEET MANAGEMENT 1,079,623 1,266,688 1,342,006 1,026,369 1,232,983 1,221,482 7160 FACILITY MAINTENANCE 759,634 913,416 818,472 1,102,733 858,509 1,177,776 7170 WAREHOUSE 199,986 214,929 211,844 202,507 218,752 283,985 9110 COMPANY-WIDE EXPENSES 6,835,355 6,776,266 6,807,400 8,954,683 7,272,569 12,497,295 9150 PRIOR FY ENCUMBERED BUDGET 350,273 226,430 1,499,193 - 88,132 -
TOTAL APPROPRIATIONS 111,697,782$ 118,516,018$ 135,821,627$ 144,128,843$ 135,300,736$ 136,480,171$
LESS:FUEL & PURCHASED POWER 48,449,645$ 54,041,195$ 67,598,265$ 73,007,096$ 67,470,289$ 61,300,000$ SRWA ASSESSMENTS 5,616,176 4,867,682 4,942,996 5,738,013 5,738,013 5,910,676 MAINTENANCE POOL ACCOUNT - - - 600,000 - TOTAL OPERATIONS & MAINTENANCE 57,631,961$ 59,607,141$ 63,280,366$ 64,783,734$ 62,092,434$ 69,269,495$
Note:1. Does not include Southmost Regional Water Authority (SRWA).
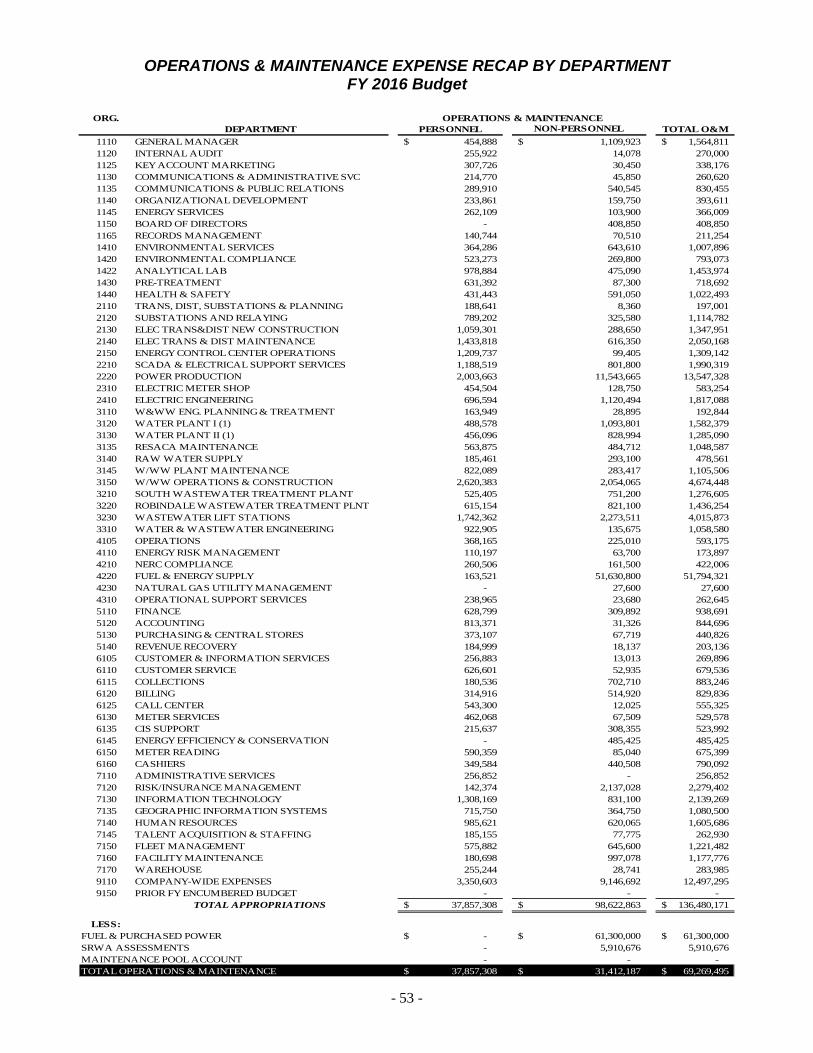
- 53 -
OPERATIONS & MAINTENANCE EXPENSE RECAP BY DEPARTMENT FY 2016 Budget
ORG.
DEPARTMENT PERSONNEL NON-PERSONNEL TOTAL O&M1110 GENERAL MANAGER 454,888$ 1,109,923$ 1,564,811$ 1120 INTERNAL AUDIT 255,922 14,078 270,000 1125 KEY ACCOUNT MARKETING 307,726 30,450 338,176 1130 COMMUNICATIONS & ADMINISTRATIVE SVC 214,770 45,850 260,620 1135 COMMUNICATIONS & PUBLIC RELATIONS 289,910 540,545 830,455 1140 ORGANIZATIONAL DEVELOPMENT 233,861 159,750 393,611 1145 ENERGY SERVICES 262,109 103,900 366,009 1150 BOARD OF DIRECTORS - 408,850 408,850 1165 RECORDS MANAGEMENT 140,744 70,510 211,254 1410 ENVIRONMENTAL SERVICES 364,286 643,610 1,007,896 1420 ENVIRONMENTAL COMPLIANCE 523,273 269,800 793,073 1422 ANALYTICAL LAB 978,884 475,090 1,453,974 1430 PRE-TREATMENT 631,392 87,300 718,692 1440 HEALTH & SAFETY 431,443 591,050 1,022,493 2110 TRANS, DIST, SUBSTATIONS & PLANNING 188,641 8,360 197,001 2120 SUBSTATIONS AND RELAYING 789,202 325,580 1,114,782 2130 ELEC TRANS&DIST NEW CONSTRUCTION 1,059,301 288,650 1,347,951 2140 ELEC TRANS & DIST MAINTENANCE 1,433,818 616,350 2,050,168 2150 ENERGY CONTROL CENTER OPERATIONS 1,209,737 99,405 1,309,142 2210 SCADA & ELECTRICAL SUPPORT SERVICES 1,188,519 801,800 1,990,319 2220 POWER PRODUCTION 2,003,663 11,543,665 13,547,328 2310 ELECTRIC METER SHOP 454,504 128,750 583,254 2410 ELECTRIC ENGINEERING 696,594 1,120,494 1,817,088 3110 W&WW ENG. PLANNING & TREATMENT 163,949 28,895 192,844 3120 WATER PLANT I (1) 488,578 1,093,801 1,582,379 3130 WATER PLANT II (1) 456,096 828,994 1,285,090 3135 RESACA MAINTENANCE 563,875 484,712 1,048,587 3140 RAW WATER SUPPLY 185,461 293,100 478,561 3145 W/WW PLANT MAINTENANCE 822,089 283,417 1,105,506 3150 W/WW OPERATIONS & CONSTRUCTION 2,620,383 2,054,065 4,674,448 3210 SOUTH WASTEWATER TREATMENT PLANT 525,405 751,200 1,276,605 3220 ROBINDALE WASTEWATER TREATMENT PLNT 615,154 821,100 1,436,254 3230 WASTEWATER LIFT STATIONS 1,742,362 2,273,511 4,015,873 3310 WATER & WASTEWATER ENGINEERING 922,905 135,675 1,058,580 4105 OPERATIONS 368,165 225,010 593,175 4110 ENERGY RISK MANAGEMENT 110,197 63,700 173,897 4210 NERC COMPLIANCE 260,506 161,500 422,006 4220 FUEL & ENERGY SUPPLY 163,521 51,630,800 51,794,321 4230 NATURAL GAS UTILITY MANAGEMENT - 27,600 27,600 4310 OPERATIONAL SUPPORT SERVICES 238,965 23,680 262,645 5110 FINANCE 628,799 309,892 938,691 5120 ACCOUNTING 813,371 31,326 844,696 5130 PURCHASING & CENTRAL STORES 373,107 67,719 440,826 5140 REVENUE RECOVERY 184,999 18,137 203,136 6105 CUSTOMER & INFORMATION SERVICES 256,883 13,013 269,896 6110 CUSTOMER SERVICE 626,601 52,935 679,536 6115 COLLECTIONS 180,536 702,710 883,246 6120 BILLING 314,916 514,920 829,836 6125 CALL CENTER 543,300 12,025 555,325 6130 METER SERVICES 462,068 67,509 529,578 6135 CIS SUPPORT 215,637 308,355 523,992 6145 ENERGY EFFICIENCY & CONSERVATION - 485,425 485,425 6150 METER READING 590,359 85,040 675,399 6160 CASHIERS 349,584 440,508 790,092 7110 ADMINISTRATIVE SERVICES 256,852 - 256,852 7120 RISK/INSURANCE MANAGEMENT 142,374 2,137,028 2,279,402 7130 INFORMATION TECHNOLOGY 1,308,169 831,100 2,139,269 7135 GEOGRAPHIC INFORMATION SYSTEMS 715,750 364,750 1,080,500 7140 HUMAN RESOURCES 985,621 620,065 1,605,686 7145 TALENT ACQUISITION & STAFFING 185,155 77,775 262,930 7150 FLEET MANAGEMENT 575,882 645,600 1,221,482 7160 FACILITY MAINTENANCE 180,698 997,078 1,177,776 7170 WAREHOUSE 255,244 28,741 283,985 9110 COMPANY-WIDE EXPENSES 3,350,603 9,146,692 12,497,295 9150 PRIOR FY ENCUMBERED BUDGET - - -
TOTAL APPROPRIATIONS 37,857,308$ 98,622,863$ 136,480,171$
LESS:FUEL & PURCHASED POWER -$ 61,300,000$ 61,300,000$ SRWA ASSESSMENTS - 5,910,676 5,910,676 MAINTENANCE POOL ACCOUNT - - - TOTAL OPERATIONS & MAINTENANCE 37,857,308$ 31,412,187$ 69,269,495$
OPERATIONS & MAINTENANCE

- 54 -
FY 2016 APPROVED BUDGETED NUMBER OF POSITIONS BY DIVISION/ORGANIZATION
DIVISION NAME ORGANIZATION POSITION TITLE
NUMBER OF POSITIONS
Administrative Services Division 7160 Facility Maintenance CUSTODIAN 1FACILITIES MAINT SUPERVISOR 1LEAD CUSTODIAN 2
ORG TOTAL: 4DIVISION TOTAL: 4
Communications & Admin Svc Division 1130 Communications & Administrative Svc ADMINISTRATIVE ASSISTANT 1DIR OF COMMUNICATIONS/ADM SERV 1
ORG TOTAL: 21135 Communications & Public Relations COMMUNICATIONS & PR COORD 1
COMMUNICATIONS & PR MANAGER 1SENIOR COMM & PR COORDINATOR 1WEB SERVICES COORDINATOR 1
ORG TOTAL: 41165 Records Management RECORDS ASSISTANT 1
RECORDS MANAGER 1ORG TOTAL: 2
1440 Health & Safety ACTING WORKER'S COMP ASST 1HEALTH & SAFETY MANAGER 1SECURITY COORDINATOR 1SENIOR SAFETY COORDINATOR 1SENIOR SAFETY TRAINING COORD 1WORKERS COMPENSATION ASST 1
ORG TOTAL: 67120 Risk/Insurance Management RISK MANAGER 1
SENIOR RISK MANAGEMENT COORD 1ORG TOTAL: 2
DIVISION TOTAL: 16Customer & Information Svc Division 1125 Key Account Marketing ACTING BUS DEV'L /KEY ACCT MGR 1
ADMINISTRATIVE ASSOCIATE II 1BUS DEVL & KEY ACCTS MANAGER 1BUSINESS DEVELOPMENT REP 1KEY ACCOUNTS REPRESENTATIVE 1SENIOR KEY ACCOUNTS REP 1
ORG TOTAL: 66105 Customer & Information Services ADMINISTRATIVE ASSOCIATE II 1
CUSTOMER SOLUTIONS REP I 1DIR OF CUSTOMER/INFO SERVICES 1
ORG TOTAL: 36110 Customer Service CUSTOMER SERVICE MANAGER 1
CUSTOMER SERVICE SUPERVISOR 1CUSTOMER SOLUTIONS REP I 2CUSTOMER SOLUTIONS REP II 3CUSTOMER SOLUTIONS REP III 3CUSTOMER SOLUTIONS REP IV 1NEW CONNECTIONS COORD 1NEW CONNECTIONS REP I 1
ORG TOTAL: 136115 Collections CUSTOMER SERVICE SUPERVISOR 1
CUSTOMER SOLUTIONS REP I 1CUSTOMER SOLUTIONS REP II 1CUSTOMER SOLUTIONS REP III 1
ORG TOTAL: 46120 Billing ACTING CUST SOLUTIONS REP I 1
CUSTOMER SERVICE SUPERVISOR 1CUSTOMER SOLUTIONS REP I 2CUSTOMER SOLUTIONS REP II 1CUSTOMER SOLUTIONS REP III 2MESSENGER 1
ORG TOTAL: 86125 Call Center CUSTOMER SERVICE SUPERVISOR 1
CUSTOMER SOLUTIONS REP I 6CUSTOMER SOLUTIONS REP II 4CUSTOMER SOLUTIONS REP III 2
ORG TOTAL: 13

- 55 -
FY 2016 APPROVED BUDGETED NUMBER OF POSITIONS BY DIVISION/ORGANIZATION – CONTINUED
DIVISION NAME ORGANIZATION POSITION TITLE
NUMBER OF POSITIONS
Customer & Information Svc Division - continued6130 Meter Services METER SERVICES SUPERVISOR 1
METER SERVICES TECHNICIAN I 4METER SERVICES TECHNICIAN II 4
ORG TOTAL: 96135 CIS Support C I S SUPPORT MANAGER 1
CUSTOMER SOLUTIONS ANALYST II 2ORG TOTAL: 3
6150 Meter Reading METER READER I 12METER READER II 2METER READING SUPERVISOR 1
ORG TOTAL: 156160 Cashiers CUSTOMER SERVICE SUPERVISOR 1
CUSTOMER SOLUTIONS REP I 3CUSTOMER SOLUTIONS REP II 3CUSTOMER SOLUTIONS REP III 1
ORG TOTAL: 87130 Information Technology APPLICATION SOFTWARE ADM 1
COMPUTER TECHNICAL SUPP SPEC 2DATA & SPECIAL PROJECTS ADMIN 1HELP DESK SUPPORT COORDINATOR 1INFORMATION TECH PROJECT COORD 1INFORMATION TECHNOLOGY ADM 1INFORMATION TECHNOLOGY MGR 1NETWORK ADMINISTRATOR 1NETWORK TECH SPEC APR 1SENIOR INFO TECH PROJECT COORD 1SENIOR NETWORK ADMINISTRATOR 1SYSTEMS PROGRAMMER ANALYST 4WIRELESS COMM & NETWORK COORD 1
ORG TOTAL: 17DIVISION TOTAL: 99
Energy Services Division 1145 Energy Services DIRECTOR OF ENERGY SERVICES 1ORG TOTAL: 1
2150 Energy Control Center Operations DISPATCH CLERK 1ENERGY SYSTEM OPERATIONS MGR 1ENERGY SYSTEM OPERATOR 3ENERGY SYSTEM OPERATOR APR 1LEAD ENERGY SYSTEM OPERATOR 4SENIOR ENERGY SYSTEM OPERATOR 4
ORG TOTAL: 142220 Power Production ADMINISTRATIVE ASSOCIATE II 1
CUSTODIAN 1GRADUATE ENGINEER I 1LAB TECHNICIAN-OPERATOR 1MAINTENANCE MECHANIC 3POWER PLANT FOREMAN 7POWER PLANT INSTRUMENT TECH I 1POWER PLANT MAINTENANCE SUPR 1POWER PLANT MAINTENANCE TECH 4POWER PLANT MANAGER 1POWER PLANT OPERATIONS SUPR 1POWER PLANT OPERATOR I 2POWER PLANT OPERATOR II 3SENIOR ENGINEER (REGISTERED) 1
ORG TOTAL: 284210 NERC Compliance NERC COMPL MANAGER & CCO 1
NERC COMPLIANCE COORDINATOR 2ORG TOTAL: 3
4220 Fuel & Purchased Energy Supply FUEL & PURCHASED ENERGY COORD 1FUEL & PURCHASED ENERGY MGR 1
ORG TOTAL: 2DIVISION TOTAL: 48
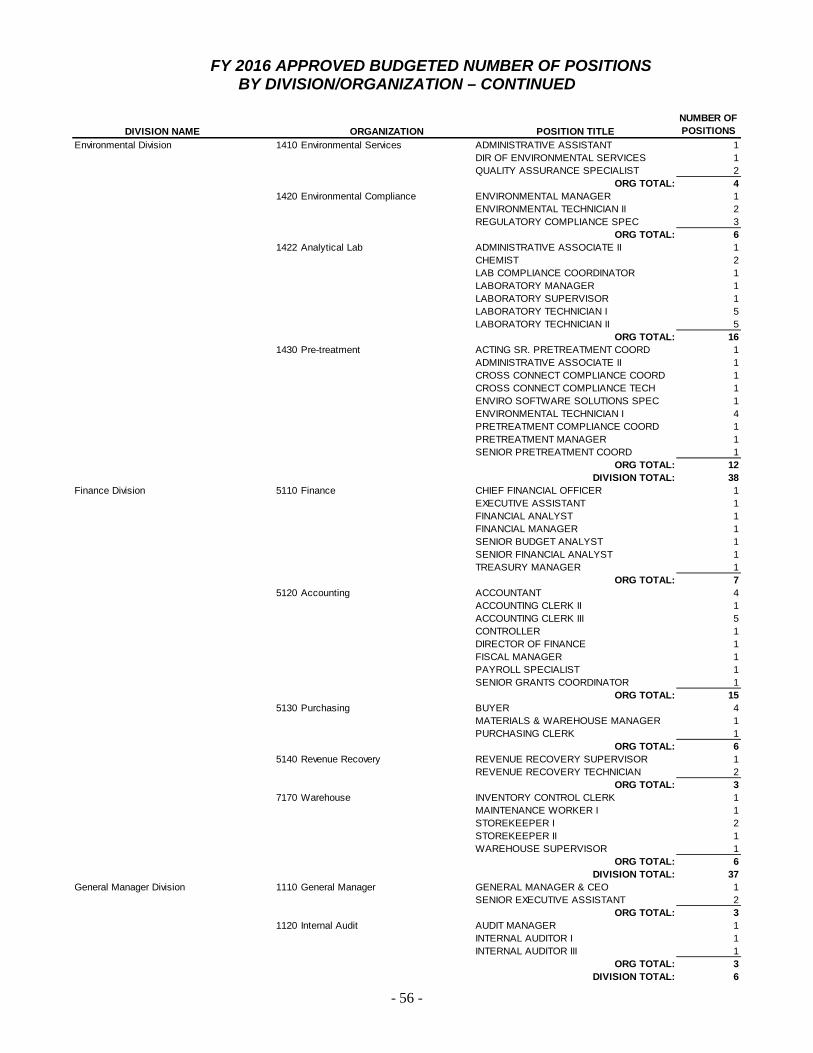
- 56 -
FY 2016 APPROVED BUDGETED NUMBER OF POSITIONS BY DIVISION/ORGANIZATION – CONTINUED
DIVISION NAME ORGANIZATION POSITION TITLE
NUMBER OF POSITIONS
Environmental Division 1410 Environmental Services ADMINISTRATIVE ASSISTANT 1DIR OF ENVIRONMENTAL SERVICES 1QUALITY ASSURANCE SPECIALIST 2
ORG TOTAL: 41420 Environmental Compliance ENVIRONMENTAL MANAGER 1
ENVIRONMENTAL TECHNICIAN II 2REGULATORY COMPLIANCE SPEC 3
ORG TOTAL: 61422 Analytical Lab ADMINISTRATIVE ASSOCIATE II 1
CHEMIST 2LAB COMPLIANCE COORDINATOR 1LABORATORY MANAGER 1LABORATORY SUPERVISOR 1LABORATORY TECHNICIAN I 5LABORATORY TECHNICIAN II 5
ORG TOTAL: 161430 Pre-treatment ACTING SR. PRETREATMENT COORD 1
ADMINISTRATIVE ASSOCIATE II 1CROSS CONNECT COMPLIANCE COORD 1CROSS CONNECT COMPLIANCE TECH 1ENVIRO SOFTWARE SOLUTIONS SPEC 1ENVIRONMENTAL TECHNICIAN I 4PRETREATMENT COMPLIANCE COORD 1PRETREATMENT MANAGER 1SENIOR PRETREATMENT COORD 1
ORG TOTAL: 12DIVISION TOTAL: 38
Finance Division 5110 Finance CHIEF FINANCIAL OFFICER 1EXECUTIVE ASSISTANT 1FINANCIAL ANALYST 1FINANCIAL MANAGER 1SENIOR BUDGET ANALYST 1SENIOR FINANCIAL ANALYST 1TREASURY MANAGER 1
ORG TOTAL: 75120 Accounting ACCOUNTANT 4
ACCOUNTING CLERK II 1ACCOUNTING CLERK III 5CONTROLLER 1DIRECTOR OF FINANCE 1FISCAL MANAGER 1PAYROLL SPECIALIST 1SENIOR GRANTS COORDINATOR 1
ORG TOTAL: 155130 Purchasing BUYER 4
MATERIALS & WAREHOUSE MANAGER 1PURCHASING CLERK 1
ORG TOTAL: 65140 Revenue Recovery REVENUE RECOVERY SUPERVISOR 1
REVENUE RECOVERY TECHNICIAN 2ORG TOTAL: 3
7170 Warehouse INVENTORY CONTROL CLERK 1MAINTENANCE WORKER I 1STOREKEEPER I 2STOREKEEPER II 1WAREHOUSE SUPERVISOR 1
ORG TOTAL: 6DIVISION TOTAL: 37
General Manager Division 1110 General Manager GENERAL MANAGER & CEO 1SENIOR EXECUTIVE ASSISTANT 2
ORG TOTAL: 31120 Internal Audit AUDIT MANAGER 1
INTERNAL AUDITOR I 1INTERNAL AUDITOR III 1
ORG TOTAL: 3DIVISION TOTAL: 6

- 57 -
FY 2016 APPROVED BUDGETED NUMBER OF POSITIONS BY DIVISION/ORGANIZATION – CONTINUED
DIVISION NAME ORGANIZATION POSITION TITLENUMBER OF POSITIONS
Human Resources Division 1140 Organizational Development ORGANIZATIONAL DEVL MANAGER 1SENIOR TRAINING COORDINATOR 1TRAINING COORDINATOR 1
ORG TOTAL: 37140 Human Resources ADMINISTRATIVE ASSISTANT 1
COMPENSATION /BENEFITS MANAGER 1DIRECTOR OF HUMAN RESOURCES 1HUMAN RESOURCES COORD 2SENIOR HUMAN RESOURCES ASST 1
ORG TOTAL: 67145 Talent Acquisition and Staffing HUMAN RESOURCES ASST 1
HUMAN RESOURCES SPEC 1TALENT ACQUISITION/STAFFING MA 1
ORG TOTAL: 3DIVISION TOTAL: 12
Operational Support Servcs Division 2210 SCADA & Electrical Support Services ACTING FLEET SERVICES MANAGER 1ADMINISTRATIVE ASSOCIATE II 1ELECTRICAL MAINT SUPERVISOR 1ELECTRICAL SCADA SUPERVISOR 1ELECTRICIAN 3ELECTRONIC TECHNICIAN II 3INSTRUMENT TECHNICIAN II 2MASTER ELECTRICIAN 3SCADA & ELEC SUPP SVC MANAGER 1SCADA NETWORK ADMINISTRATOR 1W/WW SCADA NETWORK ADM. 1
ORG TOTAL: 183145 W/WW Plant Maintenance ENGINEERING TECHNICIAN II 1
FOREMAN 1MAINTENANCE MECHANIC 4MASTER MECHANIC 6SHIFT SUPERVISOR 1
ORG TOTAL: 133150 W/WW Operations & Construction ADMINISTRATIVE ASSOCIATE II 2
CARPENTER 2FOREMAN 2MAINTENANCE WORKER I 17MAINTENANCE WORKER II 1MASTER PLUMBER 2MOTOR EQUIPMENT OPERATOR 8PIPELAYER 9SENIOR MOTOR EQUIPMENT OPER 3SERVICE CLERK 1SHIFT SUPERVISOR 6UTILITY TECHNICIAN 12W/WW OPERATIONS MANAGER 1WATER METER MECHANIC 1
ORG TOTAL: 673230 Wastewater Lift Stations ACTING MANAGER OF ENG & MAINT. 1
ADMINISTRATIVE ASSOCIATE II 1JETVAC OPERATOR APPRENTICE 3JETVAC OPERATOR I 4JETVAC OPERATOR II 1MAINTENANCE MECHANIC 10MAINTENANCE WORKER I 1MANAGER OF ENG & MAINT 1MASTER MECHANIC 7SHIFT SUPERVISOR 3WASTEWATER TV TECHNICIAN 3
ORG TOTAL: 354310 Operational Support Services ADMINISTRATIVE ASSISTANT 1
DIR OF OPERATIONAL SUPP SERV 1ORG TOTAL: 2
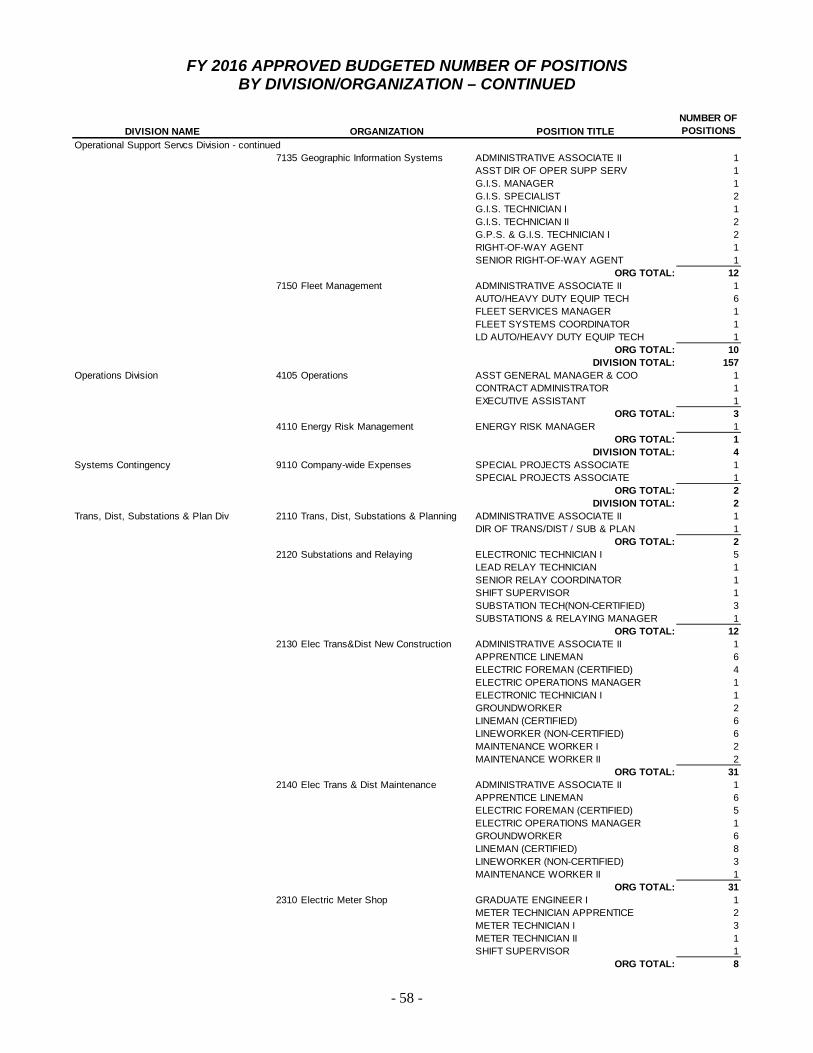
- 58 -
FY 2016 APPROVED BUDGETED NUMBER OF POSITIONS BY DIVISION/ORGANIZATION – CONTINUED
DIVISION NAME ORGANIZATION POSITION TITLE
NUMBER OF POSITIONS
Operational Support Servcs Division - continued7135 Geographic Information Systems ADMINISTRATIVE ASSOCIATE II 1
ASST DIR OF OPER SUPP SERV 1G.I.S. MANAGER 1G.I.S. SPECIALIST 2G.I.S. TECHNICIAN I 1G.I.S. TECHNICIAN II 2G.P.S. & G.I.S. TECHNICIAN I 2RIGHT-OF-WAY AGENT 1SENIOR RIGHT-OF-WAY AGENT 1
ORG TOTAL: 127150 Fleet Management ADMINISTRATIVE ASSOCIATE II 1
AUTO/HEAVY DUTY EQUIP TECH 6FLEET SERVICES MANAGER 1FLEET SYSTEMS COORDINATOR 1LD AUTO/HEAVY DUTY EQUIP TECH 1
ORG TOTAL: 10DIVISION TOTAL: 157
Operations Division 4105 Operations ASST GENERAL MANAGER & COO 1CONTRACT ADMINISTRATOR 1EXECUTIVE ASSISTANT 1
ORG TOTAL: 34110 Energy Risk Management ENERGY RISK MANAGER 1
ORG TOTAL: 1DIVISION TOTAL: 4
Systems Contingency 9110 Company-wide Expenses SPECIAL PROJECTS ASSOCIATE 1SPECIAL PROJECTS ASSOCIATE 1
ORG TOTAL: 2DIVISION TOTAL: 2
Trans, Dist, Substations & Plan Div 2110 Trans, Dist, Substations & Planning ADMINISTRATIVE ASSOCIATE II 1DIR OF TRANS/DIST / SUB & PLAN 1
ORG TOTAL: 22120 Substations and Relaying ELECTRONIC TECHNICIAN I 5
LEAD RELAY TECHNICIAN 1SENIOR RELAY COORDINATOR 1SHIFT SUPERVISOR 1SUBSTATION TECH(NON-CERTIFIED) 3SUBSTATIONS & RELAYING MANAGER 1
ORG TOTAL: 122130 Elec Trans&Dist New Construction ADMINISTRATIVE ASSOCIATE II 1
APPRENTICE LINEMAN 6ELECTRIC FOREMAN (CERTIFIED) 4ELECTRIC OPERATIONS MANAGER 1ELECTRONIC TECHNICIAN I 1GROUNDWORKER 2LINEMAN (CERTIFIED) 6LINEWORKER (NON-CERTIFIED) 6MAINTENANCE WORKER I 2MAINTENANCE WORKER II 2
ORG TOTAL: 312140 Elec Trans & Dist Maintenance ADMINISTRATIVE ASSOCIATE II 1
APPRENTICE LINEMAN 6ELECTRIC FOREMAN (CERTIFIED) 5ELECTRIC OPERATIONS MANAGER 1GROUNDWORKER 6LINEMAN (CERTIFIED) 8LINEWORKER (NON-CERTIFIED) 3MAINTENANCE WORKER II 1
ORG TOTAL: 312310 Electric Meter Shop GRADUATE ENGINEER I 1
METER TECHNICIAN APPRENTICE 2METER TECHNICIAN I 3METER TECHNICIAN II 1SHIFT SUPERVISOR 1
ORG TOTAL: 8
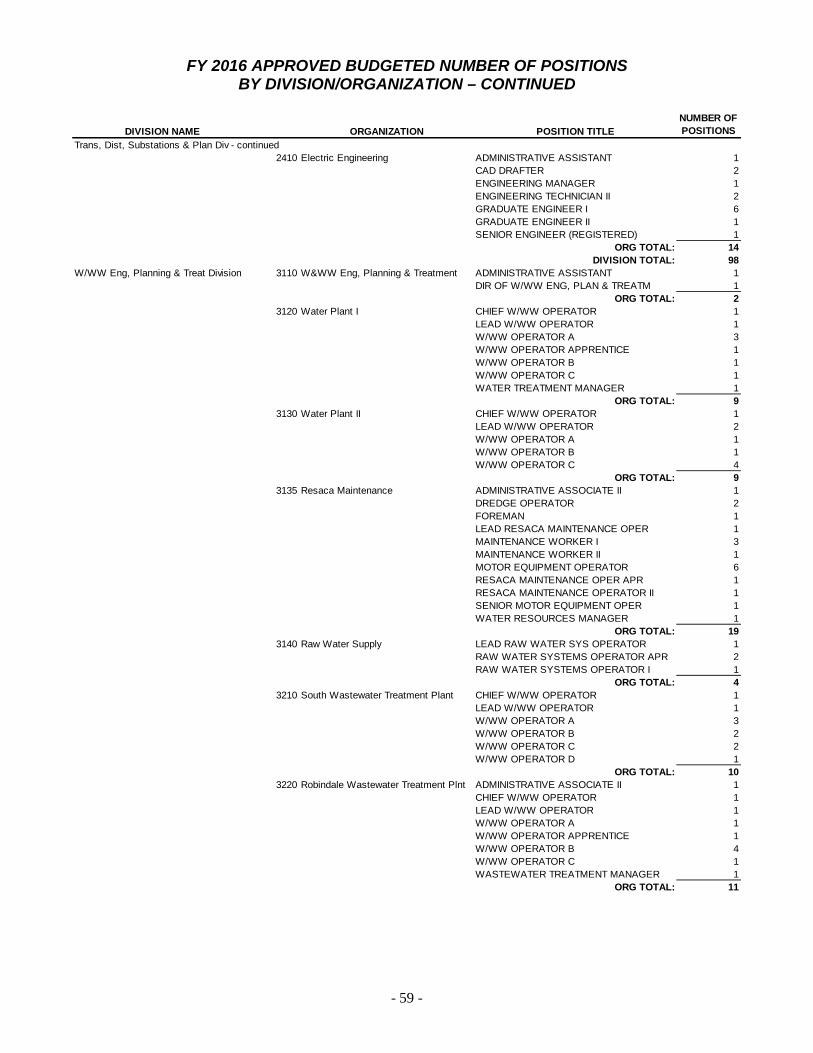
- 59 -
FY 2016 APPROVED BUDGETED NUMBER OF POSITIONS BY DIVISION/ORGANIZATION – CONTINUED
DIVISION NAME ORGANIZATION POSITION TITLE
NUMBER OF POSITIONS
Trans, Dist, Substations & Plan Div - continued2410 Electric Engineering ADMINISTRATIVE ASSISTANT 1
CAD DRAFTER 2ENGINEERING MANAGER 1ENGINEERING TECHNICIAN II 2GRADUATE ENGINEER I 6GRADUATE ENGINEER II 1SENIOR ENGINEER (REGISTERED) 1
ORG TOTAL: 14DIVISION TOTAL: 98
W/WW Eng, Planning & Treat Division 3110 W&WW Eng, Planning & Treatment ADMINISTRATIVE ASSISTANT 1DIR OF W/WW ENG, PLAN & TREATM 1
ORG TOTAL: 23120 Water Plant I CHIEF W/WW OPERATOR 1
LEAD W/WW OPERATOR 1W/WW OPERATOR A 3W/WW OPERATOR APPRENTICE 1W/WW OPERATOR B 1W/WW OPERATOR C 1WATER TREATMENT MANAGER 1
ORG TOTAL: 93130 Water Plant II CHIEF W/WW OPERATOR 1
LEAD W/WW OPERATOR 2W/WW OPERATOR A 1W/WW OPERATOR B 1W/WW OPERATOR C 4
ORG TOTAL: 93135 Resaca Maintenance ADMINISTRATIVE ASSOCIATE II 1
DREDGE OPERATOR 2FOREMAN 1LEAD RESACA MAINTENANCE OPER 1MAINTENANCE WORKER I 3MAINTENANCE WORKER II 1MOTOR EQUIPMENT OPERATOR 6RESACA MAINTENANCE OPER APR 1RESACA MAINTENANCE OPERATOR II 1SENIOR MOTOR EQUIPMENT OPER 1WATER RESOURCES MANAGER 1
ORG TOTAL: 193140 Raw Water Supply LEAD RAW WATER SYS OPERATOR 1
RAW WATER SYSTEMS OPERATOR APR 2RAW WATER SYSTEMS OPERATOR I 1
ORG TOTAL: 43210 South Wastewater Treatment Plant CHIEF W/WW OPERATOR 1
LEAD W/WW OPERATOR 1W/WW OPERATOR A 3W/WW OPERATOR B 2W/WW OPERATOR C 2W/WW OPERATOR D 1
ORG TOTAL: 103220 Robindale Wastewater Treatment Plnt ADMINISTRATIVE ASSOCIATE II 1
CHIEF W/WW OPERATOR 1LEAD W/WW OPERATOR 1W/WW OPERATOR A 1W/WW OPERATOR APPRENTICE 1W/WW OPERATOR B 4W/WW OPERATOR C 1WASTEWATER TREATMENT MANAGER 1
ORG TOTAL: 11
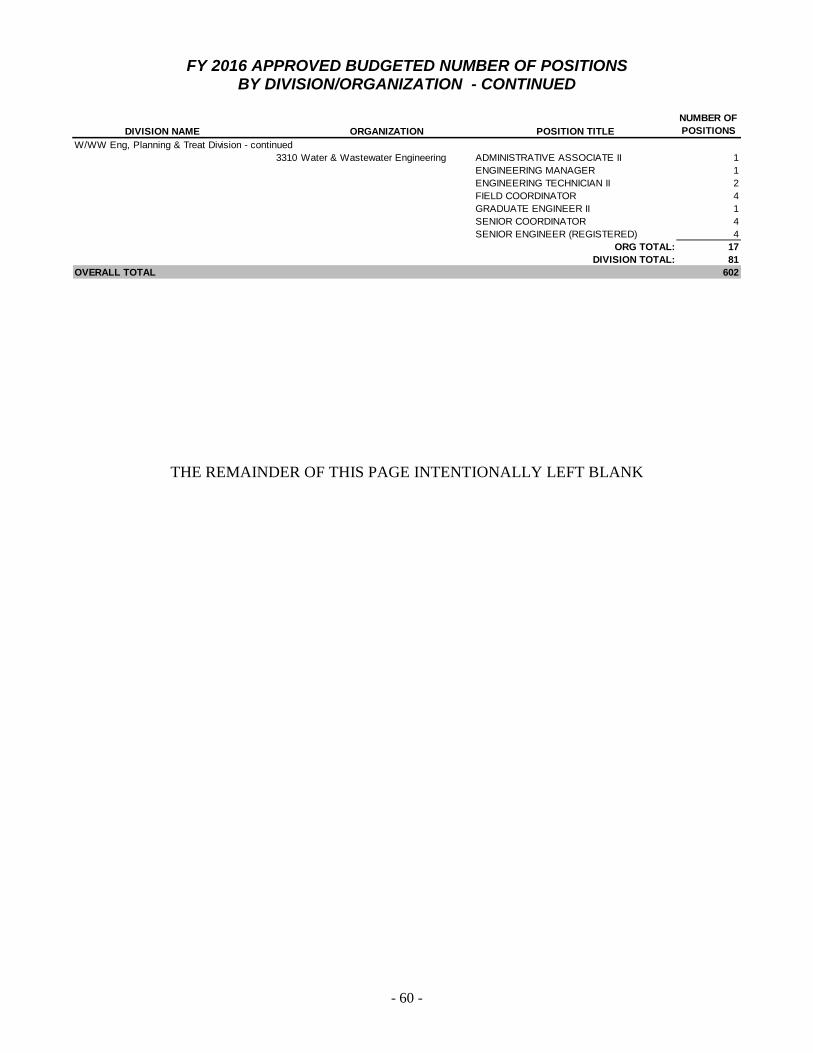
- 60 -
FY 2016 APPROVED BUDGETED NUMBER OF POSITIONS BY DIVISION/ORGANIZATION - CONTINUED
DIVISION NAME ORGANIZATION POSITION TITLENUMBER OF POSITIONS
W/WW Eng, Planning & Treat Division - continued3310 Water & Wastewater Engineering ADMINISTRATIVE ASSOCIATE II 1
ENGINEERING MANAGER 1ENGINEERING TECHNICIAN II 2FIELD COORDINATOR 4GRADUATE ENGINEER II 1SENIOR COORDINATOR 4SENIOR ENGINEER (REGISTERED) 4
ORG TOTAL: 17DIVISION TOTAL: 81
OVERALL TOTAL 602
THE REMAINDER OF THIS PAGE INTENTIONALLY LEFT BLANK

- 61 -
NET POSITION COMPUTATION OF CHANGE IN NET POSITION AND
FUNDS AVAILABLE FOR CAPITAL AND RESERVE FUNDS Net position is defined as the difference between Brownsville PUB’s assets and liabilities. Projected changes in net position are as follows:
Electric Water Wastewater TotalRevenues 162,662,559$ 23,248,931$ 22,355,505$ 208,266,995$
Expenses 119,750,810 23,699,648 19,552,121 163,002,579
Change in net assets 42,911,749$ (450,717)$ 2,803,384$ 45,264,416$
Net position, beginning of year 447,220,553$
Net position, end of year 492,484,969$
Reconciliation to "Total Utility Combined Revenues & Requirements" page 74 is as follows:
Change in net position 42,911,749$ (450,717)$ 2,803,384$ 45,264,416$
Less: Principal Pmts 7,018,593 1,689,382 3,358,025 12,066,000
Funds Available forCapital and Reserve Funds 35,893,156$ (2,140,099)$ (554,641)$ 33,198,416$
Projected changes in net position for fiscal year 2016 are as follows:
Electric Water Wastewater TotalRevenues 146,926,374$ 24,673,313$ 23,337,086$ 194,936,773$
Expenses 116,175,185 22,287,689 20,310,899 158,773,773
Change in net position 30,751,189$ 2,385,624$ 3,026,187$ 36,163,000$
Net position, beginning of year 492,484,969$
Net position, end of year 528,647,969$
Reconciliation to "Total Utility Combined Revenues & Requirements" page 74 is as follows:
Change in net position 30,751,189$ 2,385,624$ 3,026,187$ 36,163,000$
Less: Principal Pmts 8,051,189 1,635,624 2,486,187 12,173,000
Funds Available forCapital and Reserve Funds 22,700,000$ 750,000$ 540,000$ 23,990,000$
ESTIMATED FY 2015
ORIGINAL BUDGET FY 2016
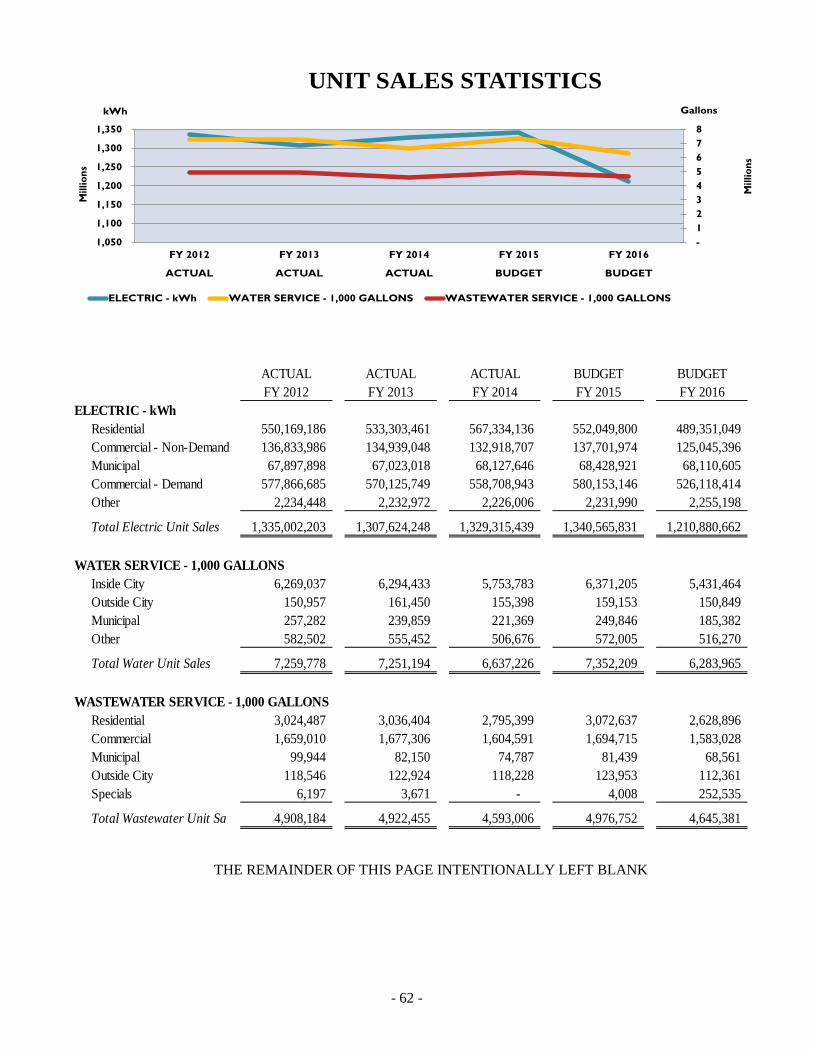
- 62 -
- 1 2 3 4 5 6 7 8
1,050
1,100
1,150
1,200
1,250
1,300
1,350
FY 2012 FY 2013 FY 2014 FY 2015 FY 2016
ACTUAL ACTUAL ACTUAL BUDGET BUDGET
Gallons
Mill
ions
kWh
Mill
ions
UNIT SALES STATISTICS
ELECTRIC - kWh WATER SERVICE - 1,000 GALLONS WASTEWATER SERVICE - 1,000 GALLONS
ACTUAL ACTUAL ACTUAL BUDGET BUDGETFY 2012 FY 2013 FY 2014 FY 2015 FY 2016
ELECTRIC - kWhResidential 550,169,186 533,303,461 567,334,136 552,049,800 489,351,049 Commercial - Non-Demand 136,833,986 134,939,048 132,918,707 137,701,974 125,045,396 Municipal 67,897,898 67,023,018 68,127,646 68,428,921 68,110,605 Commercial - Demand 577,866,685 570,125,749 558,708,943 580,153,146 526,118,414 Other 2,234,448 2,232,972 2,226,006 2,231,990 2,255,198
Total Electric Unit Sales 1,335,002,203 1,307,624,248 1,329,315,439 1,340,565,831 1,210,880,662
WATER SERVICE - 1,000 GALLONSInside City 6,269,037 6,294,433 5,753,783 6,371,205 5,431,464 Outside City 150,957 161,450 155,398 159,153 150,849 Municipal 257,282 239,859 221,369 249,846 185,382 Other 582,502 555,452 506,676 572,005 516,270
Total Water Unit Sales 7,259,778 7,251,194 6,637,226 7,352,209 6,283,965
WASTEWATER SERVICE - 1,000 GALLONSResidential 3,024,487 3,036,404 2,795,399 3,072,637 2,628,896 Commercial 1,659,010 1,677,306 1,604,591 1,694,715 1,583,028 Municipal 99,944 82,150 74,787 81,439 68,561 Outside City 118,546 122,924 118,228 123,953 112,361 Specials 6,197 3,671 - 4,008 252,535
Total Wastewater Unit Sal 4,908,184 4,922,455 4,593,006 4,976,752 4,645,381
THE REMAINDER OF THIS PAGE INTENTIONALLY LEFT BLANK
- 63 -
OUTSTANDING DEBT The Brownsville PUB has the following bonds outstanding as of September 30, 2015:
• $163,725,000 Utilities System Revenue Improvement and Refunding Bonds, Series 2005A, due in a final installment of $100,000 in 2031 with an interest rate of 5.0% through 2031. As of September 30, 2015, the outstanding balance was $100,000.
• $601,000 Utilities System Junior Lien Revenue Bonds Series 2007, due in annual installments
ranging from $28,000 to $46,000 through 2026 with interest rates ranging from 3.24% to 5.74%. As of September 30, 2015, the outstanding balance was $397,000.
• $77,805,000 Utilities System Revenue Refunding Bonds, Series 2008, due in annual installments
ranging from $2,220,000 to $5,065,000 through 2033 with interest rates ranging from 4.0% to 5.0%. As of September 30, 2015, the outstanding balance was $61,530,000.
• $20,690,000 Utilities System Revenue Refunding Bonds, Series 2012, due in annual installments
ranging from $590,000 to $1,210,000 through 2037 with interest rates ranging from 2.0% to 4.0%. As of September 30, 2015, the outstanding balance was $18,970,000.
• $840,000 Utilities System Junior Lien Revenue Bonds Series 2012, due in annual installments
ranging from $30,000 to $60,000 through 2032 with interest rates ranging from .270% to 3.49%. As of September 30, 2015, the outstanding balance was $750,000.
• $118,185,000 Utilities System Revenue Refunding Bonds, Series 2013, due in annual installments
ranging from $975,000 to $11,820,000 through 2031 with interest rates ranging from 2.0% to 5.0%. As of September 30, 2015 the outstanding balance was $117,315,000.
• $94,770,000 Utilities System Revenue Refunding Bonds, Series 2015, due in annual installments
ranging from $675,000 to $8,995,000 through 2045 with an interest rate of 5.0%. As of September 30, 2015 the outstanding balance was $94,770,000.
The Brownsville PUB had no outstanding commercial paper obligations as of September 30, 2015.
THE REMAINDER OF THIS PAGE INTENTIONALLY LEFT BLANK
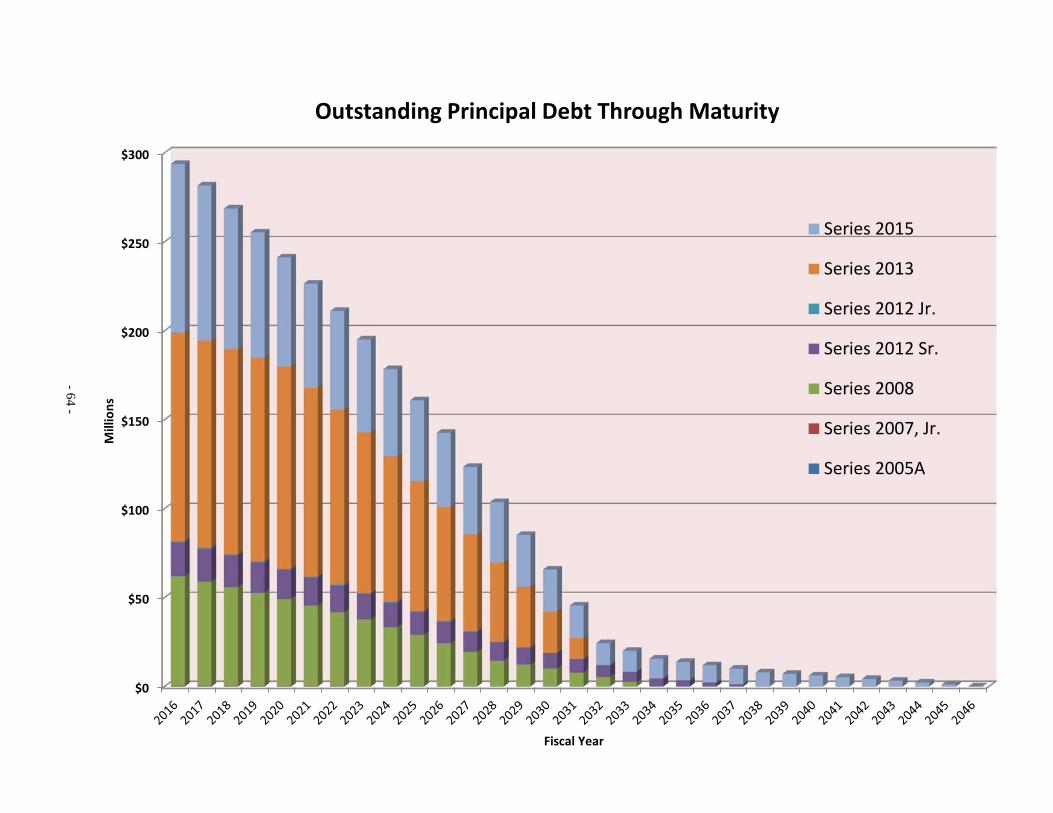
- 64 -
- 64 -
$0
$50
$100
$150
$200
$250
$300
Mill
ions
Fiscal Year
Outstanding Principal Debt Through Maturity
Series 2015
Series 2013
Series 2012 Jr.
Series 2012 Sr.
Series 2008
Series 2007, Jr.
Series 2005A
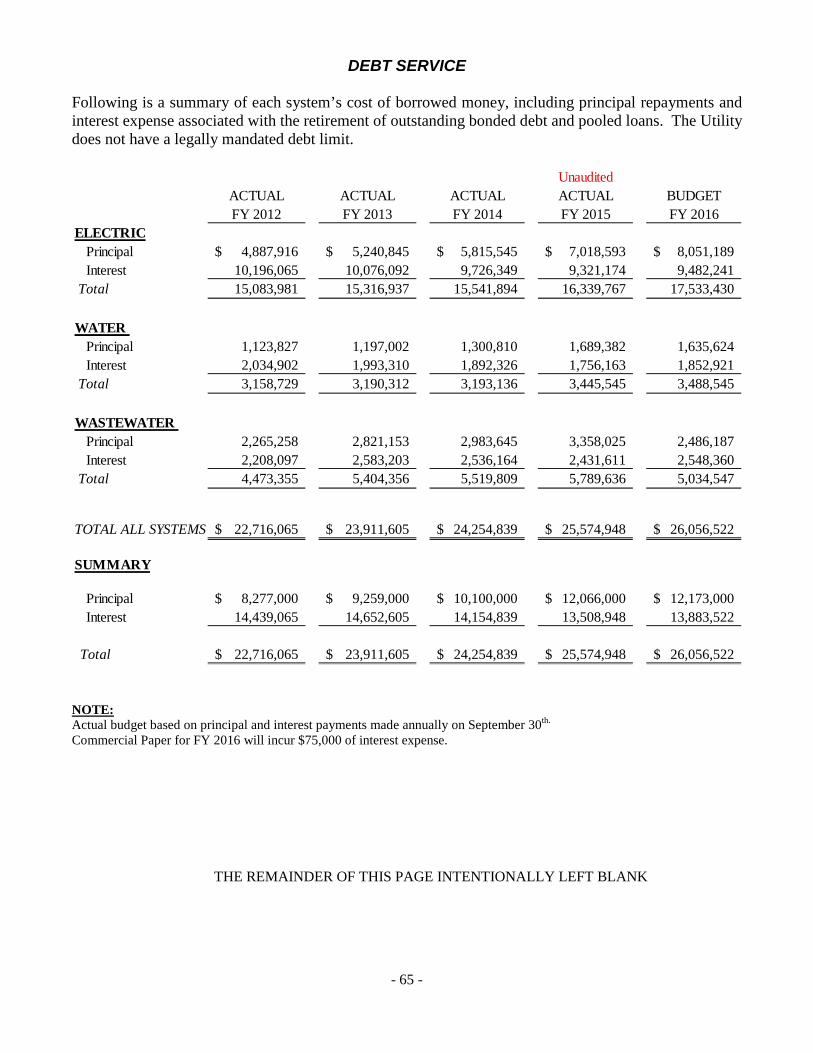
- 65 -
DEBT SERVICE
Following is a summary of each system’s cost of borrowed money, including principal repayments and interest expense associated with the retirement of outstanding bonded debt and pooled loans. The Utility does not have a legally mandated debt limit.
UnauditedACTUAL ACTUAL ACTUAL ACTUAL BUDGETFY 2012 FY 2013 FY 2014 FY 2015 FY 2016
ELECTRICPrincipal 4,887,916$ 5,240,845$ 5,815,545$ 7,018,593$ 8,051,189$ Interest 10,196,065 10,076,092 9,726,349 9,321,174 9,482,241
Total 15,083,981 15,316,937 15,541,894 16,339,767 17,533,430
WATER Principal 1,123,827 1,197,002 1,300,810 1,689,382 1,635,624 Interest 2,034,902 1,993,310 1,892,326 1,756,163 1,852,921
Total 3,158,729 3,190,312 3,193,136 3,445,545 3,488,545
WASTEWATER Principal 2,265,258 2,821,153 2,983,645 3,358,025 2,486,187 Interest 2,208,097 2,583,203 2,536,164 2,431,611 2,548,360
Total 4,473,355 5,404,356 5,519,809 5,789,636 5,034,547
TOTAL ALL SYSTEMS 22,716,065$ 23,911,605$ 24,254,839$ 25,574,948$ 26,056,522$
SUMMARY
Principal 8,277,000$ 9,259,000$ 10,100,000$ 12,066,000$ 12,173,000$ Interest 14,439,065 14,652,605 14,154,839 13,508,948 13,883,522
Total 22,716,065$ 23,911,605$ 24,254,839$ 25,574,948$ 26,056,522$ UNOTE: Actual budget based on principal and interest payments made annually on September 30th. Commercial Paper for FY 2016 will incur $75,000 of interest expense.
THE REMAINDER OF THIS PAGE INTENTIONALLY LEFT BLANK

- 66 -
DEBT SERVICE REQUIREMENTS BY FISCAL YEAR Yr Total Declining
End Debt Svc Debt SvcSep 1, Yrs Principal Interest Requirements Balance
431,472,9882016 30 12,173,000 13,883,522 26,056,522 405,416,466 2017 29 12,914,000 13,078,401 25,992,401 379,424,065 2018 28 13,456,000 12,474,068 25,930,068 353,493,996 2019 27 14,042,000 11,817,799 25,859,799 327,634,197 2020 26 14,734,000 11,132,108 25,866,108 301,768,089 2021 25 15,376,000 10,422,471 25,798,471 275,969,618 2022 24 16,002,000 9,738,859 25,740,859 250,228,758 2023 23 16,729,000 8,946,668 25,675,668 224,553,090 2024 22 17,496,000 8,118,324 25,614,324 198,938,767 2025 21 18,299,000 7,251,959 25,550,959 173,387,807 2026 20 19,086,000 6,400,468 25,486,468 147,901,340 2027 19 19,820,000 5,654,742 25,474,742 122,426,598 2028 18 18,555,000 4,681,922 23,236,922 99,189,676 2029 17 19,390,000 3,770,689 23,160,689 76,028,987 2030 16 20,275,000 2,818,119 23,093,119 52,935,868 2031 15 21,080,000 1,936,080 23,016,080 29,919,788 2032 14 4,320,000 1,018,375 5,338,375 24,581,413 2033 13 4,455,000 827,794 5,282,794 19,298,619 2034 12 1,815,000 626,531 2,441,531 16,857,088 2035 11 1,885,000 558,000 2,443,000 14,414,088 2036 10 1,955,000 486,819 2,441,819 11,972,269 2037 9 2,035,000 412,000 2,447,000 9,525,269 2038 8 855,000 334,106 1,189,106 8,336,162 2039 7 890,000 298,838 1,188,838 7,147,325 2040 6 930,000 262,125 1,192,125 5,955,200 2041 5 965,000 223,763 1,188,763 4,766,437 2042 4 1,010,000 182,750 1,192,750 3,573,687 2043 3 1,050,000 139,825 1,189,825 2,383,862 2044 2 1,095,000 95,200 1,190,200 1,193,662 2045 1 1,145,000 48,663 1,193,663 -
TOTALS 293,832,000$ 137,640,988$ 431,472,988$ UNOTE: Debt Service schedule does not include debt associated with commercial paper expense of $75,000 for the Electric, Water and Wastewater Systems approved for FY 2015.
$0
$5
$10
$15
$20
$25
$30
Millio
ns
Fiscal Year
Debt Service Cash Requirements
Interest Principal
- 67 -
REVENUES

- 68 -
SALES & SERVICES TO CUSTOMERS OPERATING REVENUES BY SYSTEM
ACTUAL ACTUAL ACTUALAMENDEDBUDGET
APPROVEDBUDGET
FY 2012 FY 2013 FY 2014 FY 2015 FY 2016
ELECTRIC 108,218,639$ 114,460,843$ 135,632,177$ 142,160,613$ 136,090,038$ WATER 21,887,142 21,845,309 22,137,313 23,827,181 23,546,313 WASTEWATER 22,223,229 22,254,767 21,691,760 23,502,328 22,210,086
TOTAL 152,329,010$ 158,560,919$ 179,461,250$ 189,490,122$ 181,846,437$
$0$20$40$60$80
$100$120$140$160$180$200
FY 2012 FY 2013 FY 2014 FY 2015 FY 2016
ACTUAL ACTUAL ACTUAL AMENDEDBUDGET
APPROVEDBUDGET
Mill
ions
WASTEWATER
WATER
ELECTRIC
UNOTE: Electric Operating Revenues include off-system sales.
THE REMAINDER OF THIS PAGE INTENTIONALLY LEFT BLANK
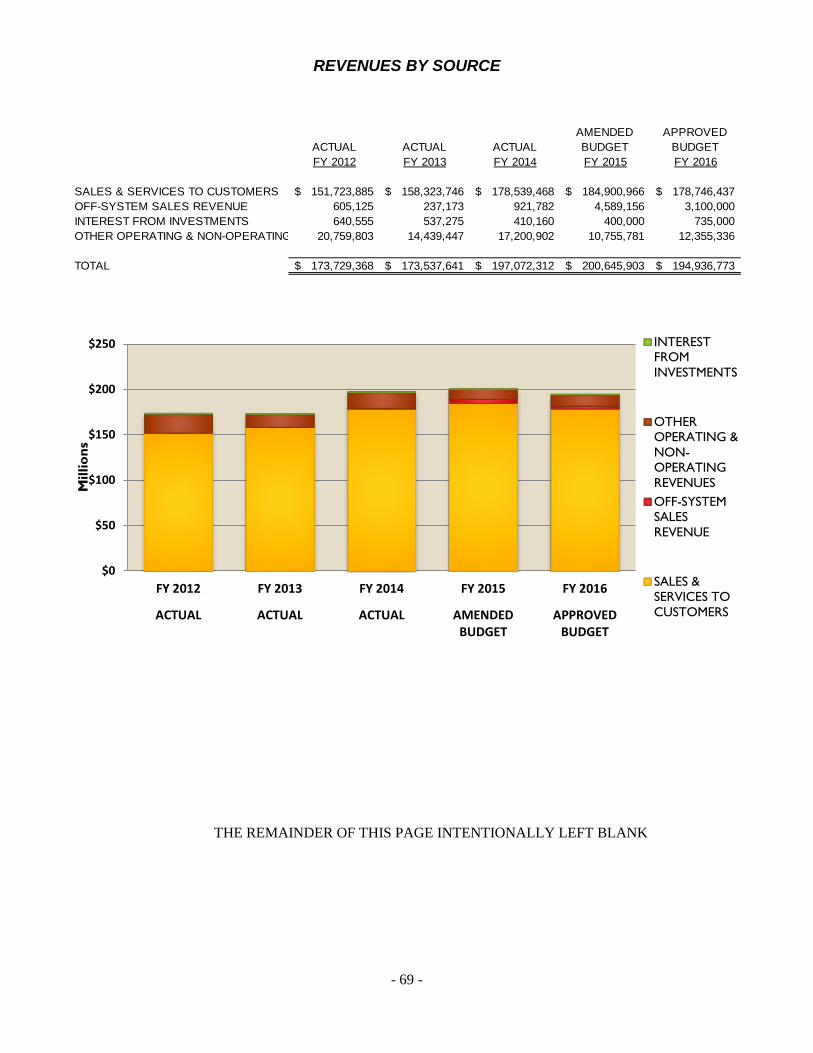
- 69 -
REVENUES BY SOURCE
ACTUAL ACTUAL ACTUALAMENDEDBUDGET
APPROVEDBUDGET
FY 2012 FY 2013 FY 2014 FY 2015 FY 2016
SALES & SERVICES TO CUSTOMERS 151,723,885$ 158,323,746$ 178,539,468$ 184,900,966$ 178,746,437$ OFF-SYSTEM SALES REVENUE 605,125 237,173 921,782 4,589,156 3,100,000 INTEREST FROM INVESTMENTS 640,555 537,275 410,160 400,000 735,000 OTHER OPERATING & NON-OPERATING 20,759,803 14,439,447 17,200,902 10,755,781 12,355,336
TOTAL 173,729,368$ 173,537,641$ 197,072,312$ 200,645,903$ 194,936,773$
$0
$50
$100
$150
$200
$250
FY 2012 FY 2013 FY 2014 FY 2015 FY 2016
ACTUAL ACTUAL ACTUAL AMENDEDBUDGET
APPROVEDBUDGET
Mill
ions
INTERESTFROMINVESTMENTS
OTHEROPERATING &NON-OPERATINGREVENUESOFF-SYSTEMSALESREVENUE
SALES &SERVICES TOCUSTOMERS
THE REMAINDER OF THIS PAGE INTENTIONALLY LEFT BLANK

- 70 -
REVENUES – SOURCES, ASSUMPTIONS AND TRENDS
USOURCES In FY 2016, Brownsville PUB expects to generate 91.69% of revenues through rates charged to customers and from the Fuel & Purchased Energy Charge (FPEC). Off-system sales revenue makes up 1.59% of the total revenue budget for FY 2016, and the remainder is made up of interest from investments and other operating and non-operating revenues (other revenues). Other revenues include customer service charges such as forfeited discounts (penalties) and connection and service charges. Other revenues also include Tele-Communications Inc. (TCI) pole rental charges, Transmission Cost of Service (TCOS), and congestion rights revenues.
FY 2016 REVENUES BY SOURCES
ELECTRIC WATER WASTEWATER TOTAL
SALES & SERVICES TO CUSTOMERS 132,990,038$ 23,546,313$ 22,210,086$ 178,746,437$
OFF-SYSTEM SALES REVENUE 3,100,000 - - 3,100,000
INTEREST FROM INVESTMENTS 441,000 147,000 147,000 735,000
OTHER OPERATING & NON-OPERATING REVENUES 10,395,336 980,000 980,000 12,355,336
146,926,374$ 24,673,313$ 23,337,086$ 194,936,773$
FY 2016 REVENUES BY SYSTEM AND SOURCES Electric Sales &
Services, $136,090,038
69.8%
Water Sales & Services,
$23,546,313 12.1%
Wastewater Sales & Services,
$22,210,086 11.4%
Other Revenues & Non-Operating
Revenues, $12,355,336
6.3%
Interest Revenue, $735,000
0.4%
U
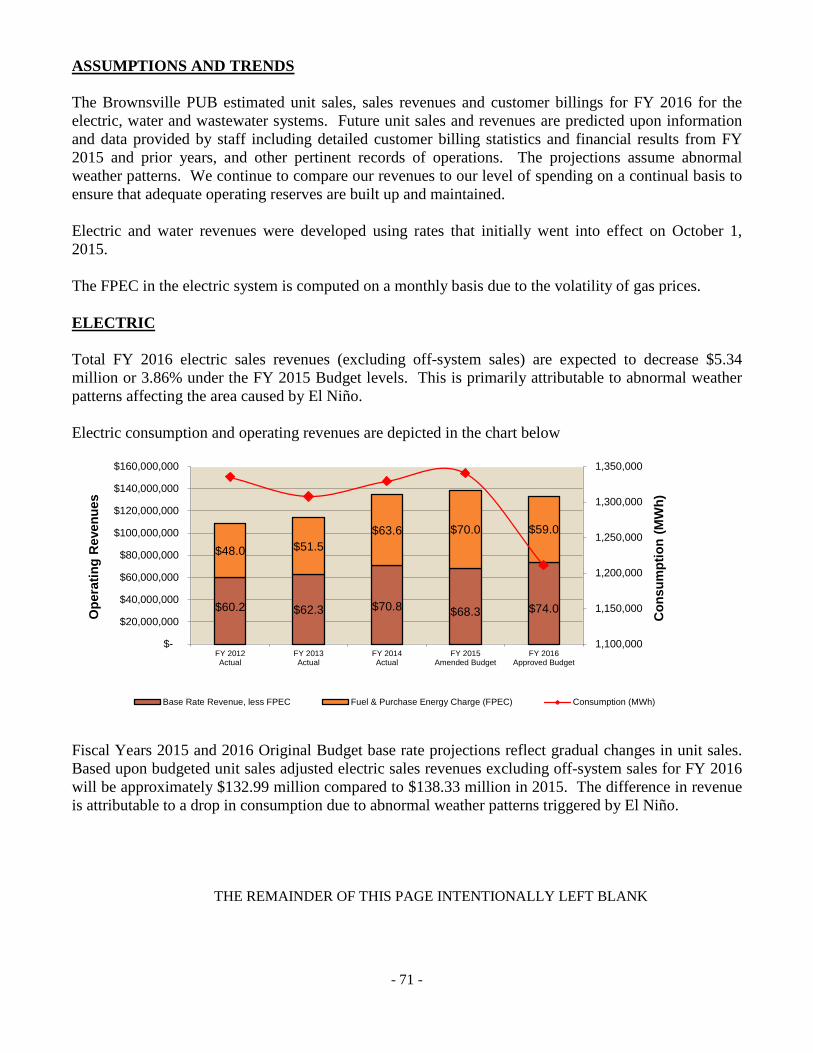
- 71 -
ASSUMPTIONS AND TRENDS The Brownsville PUB estimated unit sales, sales revenues and customer billings for FY 2016 for the electric, water and wastewater systems. Future unit sales and revenues are predicted upon information and data provided by staff including detailed customer billing statistics and financial results from FY 2015 and prior years, and other pertinent records of operations. The projections assume abnormal weather patterns. We continue to compare our revenues to our level of spending on a continual basis to ensure that adequate operating reserves are built up and maintained. Electric and water revenues were developed using rates that initially went into effect on October 1, 2015. The FPEC in the electric system is computed on a monthly basis due to the volatility of gas prices. UELECTRIC Total FY 2016 electric sales revenues (excluding off-system sales) are expected to decrease $5.34 million or 3.86% under the FY 2015 Budget levels. This is primarily attributable to abnormal weather patterns affecting the area caused by El Niño. Electric consumption and operating revenues are depicted in the chart below
$60.2 $62.3 $70.8 $68.3 $74.0
$48.0 $51.5 $63.6 $70.0 $59.0
1,100,000
1,150,000
1,200,000
1,250,000
1,300,000
1,350,000
$-
$20,000,000
$40,000,000
$60,000,000
$80,000,000
$100,000,000
$120,000,000
$140,000,000
$160,000,000
FY 2012Actual
FY 2013Actual
FY 2014Actual
FY 2015Amended Budget
FY 2016Approved Budget
Con
sum
ptio
n (M
Wh)
Ope
ratin
g R
even
ues
Base Rate Revenue, less FPEC Fuel & Purchase Energy Charge (FPEC) Consumption (MWh)
Fiscal Years 2015 and 2016 Original Budget base rate projections reflect gradual changes in unit sales. Based upon budgeted unit sales adjusted electric sales revenues excluding off-system sales for FY 2016 will be approximately $132.99 million compared to $138.33 million in 2015. The difference in revenue is attributable to a drop in consumption due to abnormal weather patterns triggered by El Niño.
THE REMAINDER OF THIS PAGE INTENTIONALLY LEFT BLANK

- 72 -
The following graph shows electric sales revenues by revenue source:
Base Rate, $73,990,038 , 54.4%
Fuel & Purchased Energy Charge (FPEC), $59,000,000 , 43.4%
Off-system Sales, $3,100,000 , 2.3%
Based upon a review of historical customer statistics, customer accounts have increased on average by approximately 1% per year. For the fiscal year ended September 30, 2015, Brownsville PUB’s approximate 47,671 electric customers were comprised of 88% residential, 11% commercial/industrial, and 1% municipal. Residential, commercial/industrial, and municipal customers provided approximately 45%, 50% and 5%, respectively, of electric system sales revenues. The remaining other operating revenues and non-operating revenues were estimated for the periods based upon recent trends and/or estimated changes in fees and charges where appropriate. U
WATER
Total FY 2016 water revenues are expected to decrease $280,868 or 1.18% under FY 2015 levels. Water consumption and operating revenues are depicted in the following chart.
$21.9 $21.8 $21.9 $23.8 $23.5
5,700,000
6,000,000
6,300,000
6,600,000
6,900,000
7,200,000
7,500,000
$5,000,000
$10,000,000
$15,000,000
$20,000,000
$25,000,000
FY 2012Actual
FY 2013Actual
FY 2014Actual
FY 2015Amended Budget
FY 2016Approved Budget
Cons
umpt
ion
Oper
atin
g Re
venu
es
Rate Revenues Consumption (1,000 gallons)
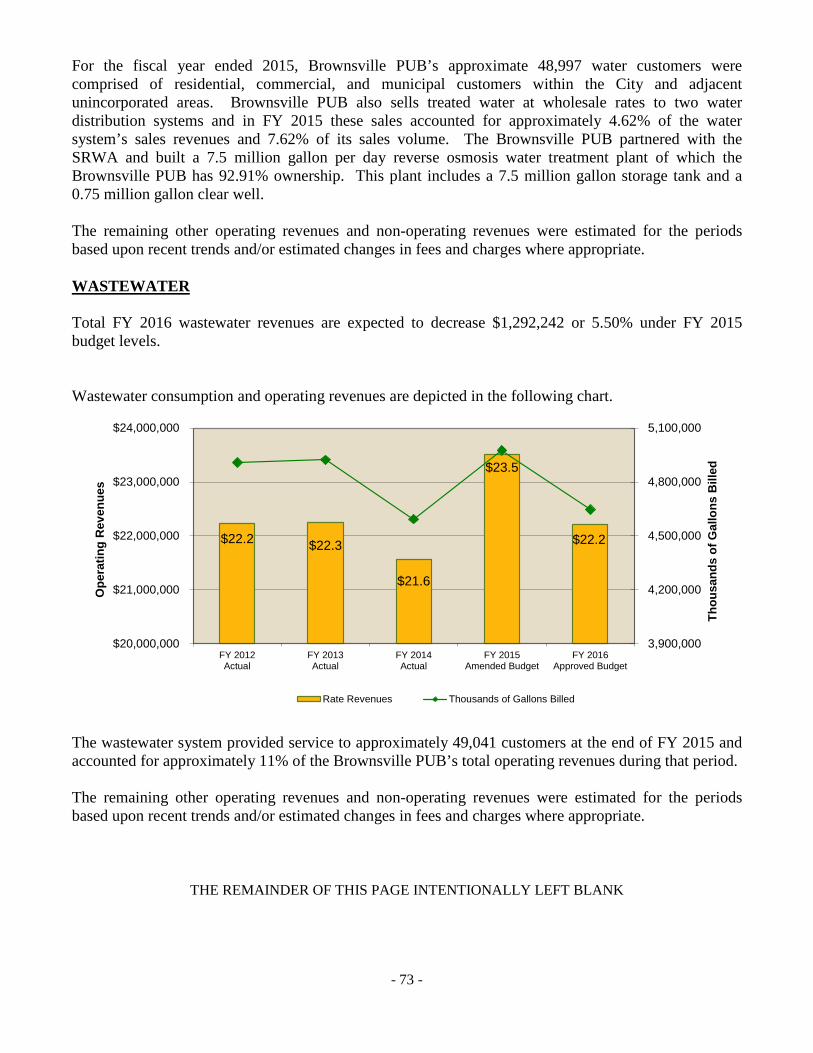
- 73 -
For the fiscal year ended 2015, Brownsville PUB’s approximate 48,997 water customers were comprised of residential, commercial, and municipal customers within the City and adjacent unincorporated areas. Brownsville PUB also sells treated water at wholesale rates to two water distribution systems and in FY 2015 these sales accounted for approximately 4.62% of the water system’s sales revenues and 7.62% of its sales volume. The Brownsville PUB partnered with the SRWA and built a 7.5 million gallon per day reverse osmosis water treatment plant of which the Brownsville PUB has 92.91% ownership. This plant includes a 7.5 million gallon storage tank and a 0.75 million gallon clear well. The remaining other operating revenues and non-operating revenues were estimated for the periods based upon recent trends and/or estimated changes in fees and charges where appropriate. WASTEWATER Total FY 2016 wastewater revenues are expected to decrease $1,292,242 or 5.50% under FY 2015 budget levels. Wastewater consumption and operating revenues are depicted in the following chart.
$22.2 $22.3
$21.6
$23.5
$22.2
3,900,000
4,200,000
4,500,000
4,800,000
5,100,000
$20,000,000
$21,000,000
$22,000,000
$23,000,000
$24,000,000
FY 2012Actual
FY 2013Actual
FY 2014Actual
FY 2015Amended Budget
FY 2016Approved Budget
Thou
sand
s of
Gal
lons
Bill
ed
Ope
ratin
g R
even
ues
Rate Revenues Thousands of Gallons Billed
The wastewater system provided service to approximately 49,041 customers at the end of FY 2015 and accounted for approximately 11% of the Brownsville PUB’s total operating revenues during that period. The remaining other operating revenues and non-operating revenues were estimated for the periods based upon recent trends and/or estimated changes in fees and charges where appropriate.
THE REMAINDER OF THIS PAGE INTENTIONALLY LEFT BLANK
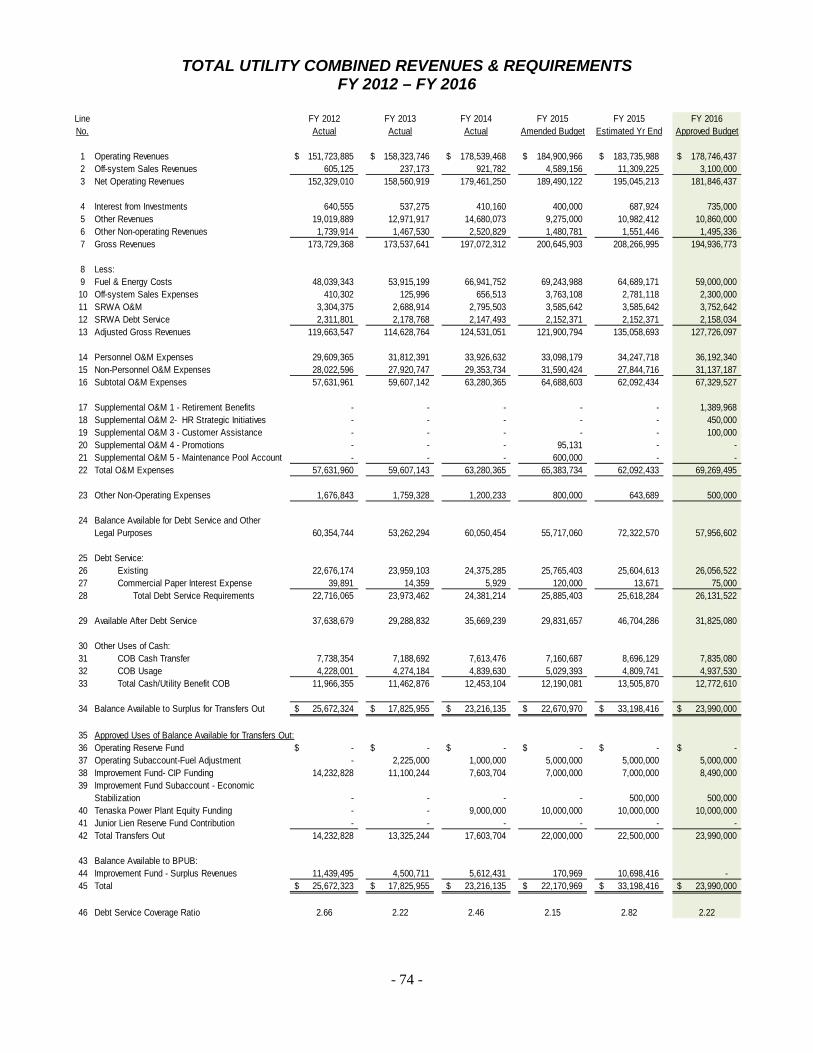
- 74 -
TOTAL UTILITY COMBINED REVENUES & REQUIREMENTS FY 2012 – FY 2016
Line FY 2012 FY 2013 FY 2014 FY 2015 FY 2015 FY 2016No. Actual Actual Actual Amended Budget Estimated Yr End Approved Budget
1 Operating Revenues 151,723,885$ 158,323,746$ 178,539,468$ 184,900,966$ 183,735,988$ 178,746,437$ 2 Off-system Sales Revenues 605,125 237,173 921,782 4,589,156 11,309,225 3,100,000 3 Net Operating Revenues 152,329,010 158,560,919 179,461,250 189,490,122 195,045,213 181,846,437
4 Interest from Investments 640,555 537,275 410,160 400,000 687,924 735,000 5 Other Revenues 19,019,889 12,971,917 14,680,073 9,275,000 10,982,412 10,860,000 6 Other Non-operating Revenues 1,739,914 1,467,530 2,520,829 1,480,781 1,551,446 1,495,336 7 Gross Revenues 173,729,368 173,537,641 197,072,312 200,645,903 208,266,995 194,936,773
8 Less:9 Fuel & Energy Costs 48,039,343 53,915,199 66,941,752 69,243,988 64,689,171 59,000,000 10 Off-system Sales Expenses 410,302 125,996 656,513 3,763,108 2,781,118 2,300,000 11 SRWA O&M 3,304,375 2,688,914 2,795,503 3,585,642 3,585,642 3,752,642 12 SRWA Debt Service 2,311,801 2,178,768 2,147,493 2,152,371 2,152,371 2,158,034 13 Adjusted Gross Revenues 119,663,547 114,628,764 124,531,051 121,900,794 135,058,693 127,726,097
14 Personnel O&M Expenses 29,609,365 31,812,391 33,926,632 33,098,179 34,247,718 36,192,340 15 Non-Personnel O&M Expenses 28,022,596 27,920,747 29,353,734 31,590,424 27,844,716 31,137,187 16 Subtotal O&M Expenses 57,631,961 59,607,142 63,280,365 64,688,603 62,092,434 67,329,527
17 Supplemental O&M 1 - Retirement Benefits - - - - - 1,389,968 18 Supplemental O&M 2- HR Strategic Initiatives - - - - - 450,000 19 Supplemental O&M 3 - Customer Assistance - - - - - 100,000 20 Supplemental O&M 4 - Promotions - - - 95,131 - - 21 Supplemental O&M 5 - Maintenance Pool Account - - - 600,000 - - 22 Total O&M Expenses 57,631,960 59,607,143 63,280,365 65,383,734 62,092,433 69,269,495
23 Other Non-Operating Expenses 1,676,843 1,759,328 1,200,233 800,000 643,689 500,000
24 Balance Available for Debt Service and Other Legal Purposes 60,354,744 53,262,294 60,050,454 55,717,060 72,322,570 57,956,602
25 Debt Service:26 Existing 22,676,174 23,959,103 24,375,285 25,765,403 25,604,613 26,056,522 27 Commercial Paper Interest Expense 39,891 14,359 5,929 120,000 13,671 75,000 28 Total Debt Service Requirements 22,716,065 23,973,462 24,381,214 25,885,403 25,618,284 26,131,522
29 Available After Debt Service 37,638,679 29,288,832 35,669,239 29,831,657 46,704,286 31,825,080
30 Other Uses of Cash:31 COB Cash Transfer 7,738,354 7,188,692 7,613,476 7,160,687 8,696,129 7,835,080 32 COB Usage 4,228,001 4,274,184 4,839,630 5,029,393 4,809,741 4,937,530 33 Total Cash/Utility Benefit COB 11,966,355 11,462,876 12,453,104 12,190,081 13,505,870 12,772,610
34 Balance Available to Surplus for Transfers Out 25,672,324$ 17,825,955$ 23,216,135$ 22,670,970$ 33,198,416$ 23,990,000$
35 Approved Uses of Balance Available for Transfers Out:36 Operating Reserve Fund -$ -$ -$ -$ -$ -$ 37 Operating Subaccount-Fuel Adjustment - 2,225,000 1,000,000 5,000,000 5,000,000 5,000,000 38 Improvement Fund- CIP Funding 14,232,828 11,100,244 7,603,704 7,000,000 7,000,000 8,490,000 39 Improvement Fund Subaccount - Economic
Stabilization - - - - 500,000 500,000 40 Tenaska Power Plant Equity Funding - - 9,000,000 10,000,000 10,000,000 10,000,000 41 Junior Lien Reserve Fund Contribution - - - - - - 42 Total Transfers Out 14,232,828 13,325,244 17,603,704 22,000,000 22,500,000 23,990,000
43 Balance Available to BPUB:44 Improvement Fund - Surplus Revenues 11,439,495 4,500,711 5,612,431 170,969 10,698,416 - 45 Total 25,672,323$ 17,825,955$ 23,216,135$ 22,170,969$ 33,198,416$ 23,990,000$
46 Debt Service Coverage Ratio 2.66 2.22 2.46 2.15 2.82 2.22

- 75 -
ELECTRIC REVENUES & REQUIREMENTS FY 2012 – FY 2016
Line FY 2012 FY 2013 FY 2014 FY 2015 FY 2015 FY 2016No. Actual Actual Actual Amended Budget Estimated Yr End Approved Budget
1 Operating Revenues 107,613,514$ 114,223,670$ 134,710,395$ 137,571,457$ 140,698,040$ 132,990,038$ 2 Off-system Sales Revenues 605,125 237,173 921,782 4,589,156 11,309,225 3,100,000 3 Net Operating Revenues 108,218,639 114,460,843 135,632,177 142,160,613 152,007,265 136,090,038
4 Interest from Investments 384,333 322,365 246,096 240,000 412,754 441,000 5 Other Revenues 17,539,199 11,412,117 12,940,146 7,815,000 9,115,051 9,400,000 6 Other Non-operating Revenues 1,134,144 960,003 2,101,377 980,781 1,127,489 995,336 7 Gross Revenues 127,276,315 127,155,328 150,919,796 151,196,394 162,662,559 146,926,374
8 Less:9 Fuel & Energy Costs 48,039,343 53,915,199 66,941,752 69,243,988 64,689,171 59,000,000 10 Off-system Sales Expenses 410,302 125,996 656,513 3,763,108 2,781,118 2,300,000 11 SRWA O&M - - - - - - 12 SRWA Debt Service - - - - - - 13 Adjusted Gross Revenues 78,826,670 73,114,133 83,321,531 78,189,298 95,192,270 85,626,374
14 Personnel O&M Expenses 14,791,866 15,507,127 16,201,467 16,829,715 17,367,557 19,493,186 15 Non-Personnel O&M Expenses 17,508,316 17,046,225 17,103,041 19,141,136 15,817,961 19,872,559 16 Subtotal O&M Expenses 32,300,182 32,427,356 33,304,508 35,970,851 33,185,518 39,365,745
17 Supplemental O&M 1 - Retirement Benefits - - - - - 694,984 18 Supplemental O&M 2- HR Strategic Initiatives - - - - - 380,000 19 Supplemental O&M 3 - Customer Assistance - - - - - 100,000 20 Supplemental O&M 4 - Promotions - - - 55,757 - - 21 Supplemental O&M 5 - Maintenance Pool Account - - - 600,000 - - 22 Total O&M Expenses 32,300,182 32,427,356 33,304,508 36,626,608 33,185,518 40,540,729
23 Other Non-Operating Expenses 801,795 747,930 524,579 480,000 159,434 300,000 Total Operating Expenses 81,551,622 87,216,481 101,427,352 110,113,704 100,815,241 102,140,729
24 Balance Available for Debt Service and Other Legal Purposes 45,724,693 39,938,847 49,492,444 41,082,690 61,847,318 44,785,645
25 Debt Service:26 Existing 15,083,981 15,319,824 15,616,019 16,469,938 16,426,851 17,533,430 27 Commercial Paper Interest Expense - 1,638 3,506 30,000 8,084 30,000 28 Total Debt Service & CP Expense 15,083,981 15,321,462 15,619,525 16,499,938 16,434,935 17,563,430
29 Available After Debt Service 30,640,712 24,617,385 33,872,919 24,582,752 45,412,383 27,222,215
30 Other Uses of Cash:31 COB Cash Transfer 4,725,502 3,975,000 4,416,131 3,818,282 5,483,869 4,522,215 32 COB Usage 3,157,165 3,336,413 3,916,022 4,000,648 4,035,358 4,040,422 33 Total Cash/Utility Benefit COB 7,882,667 7,311,413 8,332,153 7,818,930 9,519,227 8,562,637
34 Balance Available to Surplus for Transfers Out 22,758,045$ 17,305,972$ 25,540,766$ 20,764,470$ 35,893,156$ 22,700,000$
35 Approved Uses of Balance Available for Transfers Out:36 Operating Reserve Fund -$ -$ -$ -$ -$ -$ 37 Operating Subaccount-Fuel Adjustment - 2,225,000 1,000,000 5,000,000 5,000,000 5,000,000 38 Improvement Fund- CIP Funding 9,367,518 9,569,020 7,603,704 5,264,000 7,000,000 7,200,000 39 Improvement Fund Subaccount - COB USACE
Program - - - 500,000 500,000 500,000 40 Tenaska Power Plant Equity Funding - - 9,000,000 10,000,000 10,000,000 10,000,000 41 Junior Lien Reserve Fund Contribution - - - - - - 42 Total Transfers Out 9,367,518 11,794,020 17,603,704 20,764,000 22,500,000 22,700,000
43 Balance Available to BPUB:44 Improvement Fund - Surplus Revenues 13,390,527 5,511,952 7,937,062 470 13,393,156 - 45 Total 22,758,045$ 17,305,972$ 25,540,766$ 20,764,470$ 35,893,156$ 22,700,000$
46 Debt Service Coverage Ratio 3.03 2.61 3.17 2.49 3.76 2.55
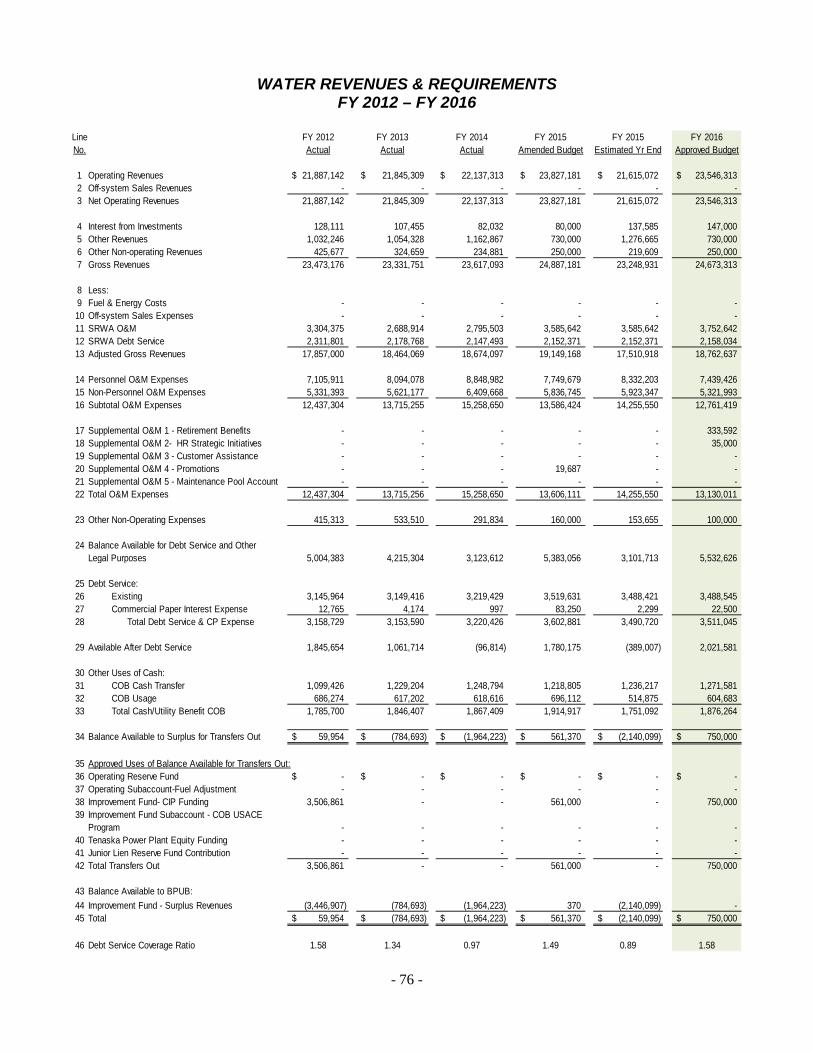
- 76 -
WATER REVENUES & REQUIREMENTS
FY 2012 – FY 2016
Line FY 2012 FY 2013 FY 2014 FY 2015 FY 2015 FY 2016No. Actual Actual Actual Amended Budget Estimated Yr End Approved Budget
1 Operating Revenues 21,887,142$ 21,845,309$ 22,137,313$ 23,827,181$ 21,615,072$ 23,546,313$ 2 Off-system Sales Revenues - - - - - - 3 Net Operating Revenues 21,887,142 21,845,309 22,137,313 23,827,181 21,615,072 23,546,313
4 Interest from Investments 128,111 107,455 82,032 80,000 137,585 147,000 5 Other Revenues 1,032,246 1,054,328 1,162,867 730,000 1,276,665 730,000 6 Other Non-operating Revenues 425,677 324,659 234,881 250,000 219,609 250,000 7 Gross Revenues 23,473,176 23,331,751 23,617,093 24,887,181 23,248,931 24,673,313
8 Less:9 Fuel & Energy Costs - - - - - - 10 Off-system Sales Expenses - - - - - - 11 SRWA O&M 3,304,375 2,688,914 2,795,503 3,585,642 3,585,642 3,752,642 12 SRWA Debt Service 2,311,801 2,178,768 2,147,493 2,152,371 2,152,371 2,158,034 13 Adjusted Gross Revenues 17,857,000 18,464,069 18,674,097 19,149,168 17,510,918 18,762,637
14 Personnel O&M Expenses 7,105,911 8,094,078 8,848,982 7,749,679 8,332,203 7,439,426 15 Non-Personnel O&M Expenses 5,331,393 5,621,177 6,409,668 5,836,745 5,923,347 5,321,993 16 Subtotal O&M Expenses 12,437,304 13,715,255 15,258,650 13,586,424 14,255,550 12,761,419
17 Supplemental O&M 1 - Retirement Benefits - - - - - 333,592 18 Supplemental O&M 2- HR Strategic Initiatives - - - - - 35,000 19 Supplemental O&M 3 - Customer Assistance - - - - - - 20 Supplemental O&M 4 - Promotions - - - 19,687 - - 21 Supplemental O&M 5 - Maintenance Pool Account - - - - - - 22 Total O&M Expenses 12,437,304 13,715,256 15,258,650 13,606,111 14,255,550 13,130,011
23 Other Non-Operating Expenses 415,313 533,510 291,834 160,000 153,655 100,000
24 Balance Available for Debt Service and Other Legal Purposes 5,004,383 4,215,304 3,123,612 5,383,056 3,101,713 5,532,626
25 Debt Service:26 Existing 3,145,964 3,149,416 3,219,429 3,519,631 3,488,421 3,488,545 27 Commercial Paper Interest Expense 12,765 4,174 997 83,250 2,299 22,500 28 Total Debt Service & CP Expense 3,158,729 3,153,590 3,220,426 3,602,881 3,490,720 3,511,045
29 Available After Debt Service 1,845,654 1,061,714 (96,814) 1,780,175 (389,007) 2,021,581
30 Other Uses of Cash:31 COB Cash Transfer 1,099,426 1,229,204 1,248,794 1,218,805 1,236,217 1,271,581 32 COB Usage 686,274 617,202 618,616 696,112 514,875 604,683 33 Total Cash/Utility Benefit COB 1,785,700 1,846,407 1,867,409 1,914,917 1,751,092 1,876,264
34 Balance Available to Surplus for Transfers Out 59,954$ (784,693)$ (1,964,223)$ 561,370$ (2,140,099)$ 750,000$
35 Approved Uses of Balance Available for Transfers Out:36 Operating Reserve Fund -$ -$ -$ -$ -$ -$ 37 Operating Subaccount-Fuel Adjustment - - - - - - 38 Improvement Fund- CIP Funding 3,506,861 - - 561,000 - 750,000 39 Improvement Fund Subaccount - COB USACE
Program - - - - - - 40 Tenaska Power Plant Equity Funding - - - - - - 41 Junior Lien Reserve Fund Contribution - - - - - - 42 Total Transfers Out 3,506,861 - - 561,000 - 750,000
43 Balance Available to BPUB:44 Improvement Fund - Surplus Revenues (3,446,907) (784,693) (1,964,223) 370 (2,140,099) - 45 Total 59,954$ (784,693)$ (1,964,223)$ 561,370$ (2,140,099)$ 750,000$
46 Debt Service Coverage Ratio 1.58 1.34 0.97 1.49 0.89 1.58
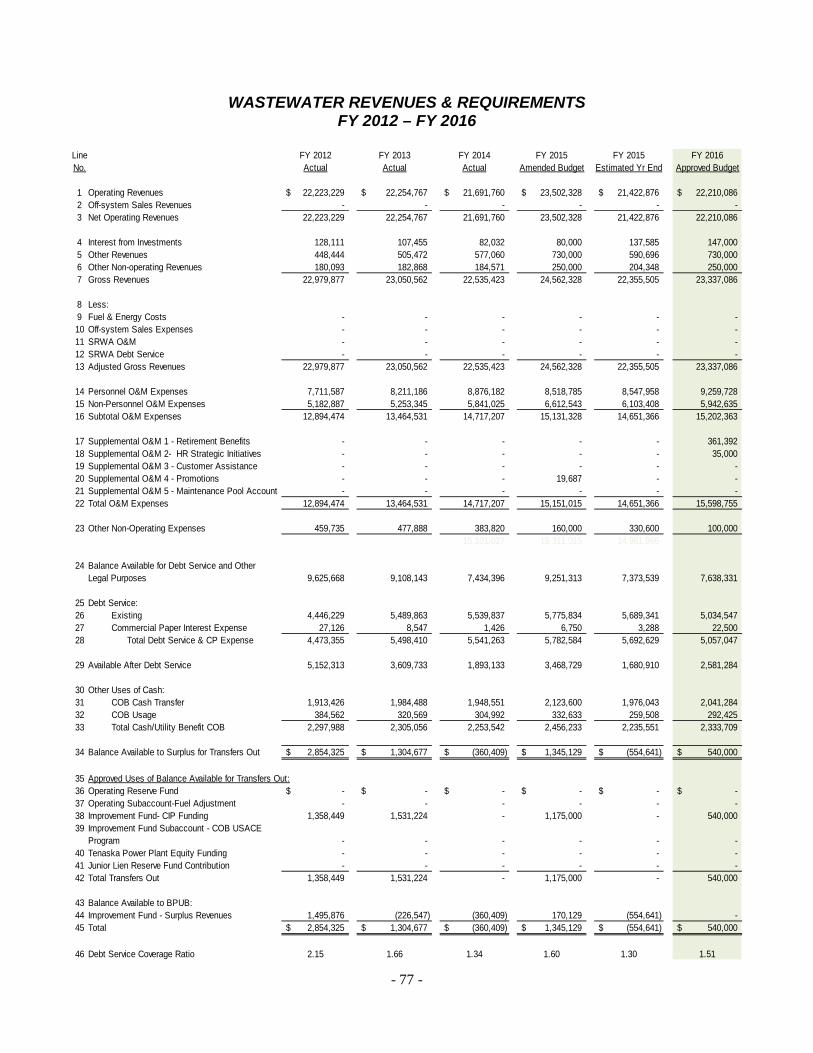
- 77 -
WASTEWATER REVENUES & REQUIREMENTS FY 2012 – FY 2016
Line FY 2012 FY 2013 FY 2014 FY 2015 FY 2015 FY 2016No. Actual Actual Actual Amended Budget Estimated Yr End Approved Budget
1 Operating Revenues 22,223,229$ 22,254,767$ 21,691,760$ 23,502,328$ 21,422,876$ 22,210,086$ 2 Off-system Sales Revenues - - - - - - 3 Net Operating Revenues 22,223,229 22,254,767 21,691,760 23,502,328 21,422,876 22,210,086
4 Interest from Investments 128,111 107,455 82,032 80,000 137,585 147,000 5 Other Revenues 448,444 505,472 577,060 730,000 590,696 730,000 6 Other Non-operating Revenues 180,093 182,868 184,571 250,000 204,348 250,000 7 Gross Revenues 22,979,877 23,050,562 22,535,423 24,562,328 22,355,505 23,337,086
8 Less:9 Fuel & Energy Costs - - - - - - 10 Off-system Sales Expenses - - - - - - 11 SRWA O&M - - - - - - 12 SRWA Debt Service - - - - - - 13 Adjusted Gross Revenues 22,979,877 23,050,562 22,535,423 24,562,328 22,355,505 23,337,086
14 Personnel O&M Expenses 7,711,587 8,211,186 8,876,182 8,518,785 8,547,958 9,259,728 15 Non-Personnel O&M Expenses 5,182,887 5,253,345 5,841,025 6,612,543 6,103,408 5,942,635 16 Subtotal O&M Expenses 12,894,474 13,464,531 14,717,207 15,131,328 14,651,366 15,202,363
17 Supplemental O&M 1 - Retirement Benefits - - - - - 361,392 18 Supplemental O&M 2- HR Strategic Initiatives - - - - - 35,000 19 Supplemental O&M 3 - Customer Assistance - - - - - - 20 Supplemental O&M 4 - Promotions - - - 19,687 - - 21 Supplemental O&M 5 - Maintenance Pool Account - - - - - - 22 Total O&M Expenses 12,894,474 13,464,531 14,717,207 15,151,015 14,651,366 15,598,755
23 Other Non-Operating Expenses 459,735 477,888 383,820 160,000 330,600 100,000 Total Operating Expenses 13,354,209 13,942,419 15,101,027 15,311,015 14,981,966 15,698,755
24 Balance Available for Debt Service and Other Legal Purposes 9,625,668 9,108,143 7,434,396 9,251,313 7,373,539 7,638,331
25 Debt Service:26 Existing 4,446,229 5,489,863 5,539,837 5,775,834 5,689,341 5,034,547 27 Commercial Paper Interest Expense 27,126 8,547 1,426 6,750 3,288 22,500 28 Total Debt Service & CP Expense 4,473,355 5,498,410 5,541,263 5,782,584 5,692,629 5,057,047
29 Available After Debt Service 5,152,313 3,609,733 1,893,133 3,468,729 1,680,910 2,581,284
30 Other Uses of Cash:31 COB Cash Transfer 1,913,426 1,984,488 1,948,551 2,123,600 1,976,043 2,041,284 32 COB Usage 384,562 320,569 304,992 332,633 259,508 292,425 33 Total Cash/Utility Benefit COB 2,297,988 2,305,056 2,253,542 2,456,233 2,235,551 2,333,709
34 Balance Available to Surplus for Transfers Out 2,854,325$ 1,304,677$ (360,409)$ 1,345,129$ (554,641)$ 540,000$
35 Approved Uses of Balance Available for Transfers Out:36 Operating Reserve Fund -$ -$ -$ -$ -$ -$ 37 Operating Subaccount-Fuel Adjustment - - - - - - 38 Improvement Fund- CIP Funding 1,358,449 1,531,224 - 1,175,000 - 540,000 39 Improvement Fund Subaccount - COB USACE
Program - - - - - - 40 Tenaska Power Plant Equity Funding - - - - - - 41 Junior Lien Reserve Fund Contribution - - - - - - 42 Total Transfers Out 1,358,449 1,531,224 - 1,175,000 - 540,000
43 Balance Available to BPUB:44 Improvement Fund - Surplus Revenues 1,495,876 (226,547) (360,409) 170,129 (554,641) - 45 Total 2,854,325$ 1,304,677$ (360,409)$ 1,345,129$ (554,641)$ 540,000$
46 Debt Service Coverage Ratio 2.15 1.66 1.34 1.60 1.30 1.51

- 78 -
THIS PAGE INTENTIONALLY LEFT BLANK
- 79 -
OPERATIONS AND MAINTENANCE EXPENSE
BUDGET

- 80 -
Department Responsibility: John BruciakTitle: General Manager & CEO
Telephone Ext: 6277Dept. No. 1110
PERFORMANCE MEASURESFOR THE
GENERAL MANAGER
Department Function:
Department Goals/Objectives:
FY 2013 ACTUAL
FY 2014 ACTUAL
FY 2015ESTIMATED YEAR END
ACTUAL
FY 2016APPROVED
BUDGETINPUT MEASURESEmployees (FTE) 4 4 4 3 O & M Exp. Personnel 510,424$ 582,380$ 321,465$ 454,888$ O & M Exp. Non-Personnel 1,347,944$ 1,093,684$ 1,054,231$ 1,109,923$
OUTPUT MEASURES Board Meetings 12 12 12 12 Director Meetings 48 48 48 48 Agenda Items Reviewed 350 350 350 300
OUTCOME MEASURESJoint Meetings with City Commission - - 1 1 Southmost Regional Water Authority Meetings 12 12 12 12 Special Board Meetings 8 11 20 10
The General Manager is the Chief Executive Officer of the Brownsville PUB. It is the General Manager & CEO'sresponsibility to execute the plans and decisions of the Board, thereby directing and coordinating the activities of allUtility employees. The General Manager & CEO ensures that all policies and resolutions passed by the Board areenforced and duly administered. In addition, the General Manager & CEO informs the Board of legislative matters,capital improvements, budget items, policies, and services offered to customers. The Assistant General Manager &COO, Chief Financial Officer, Director of Human Resources, and Communications & Administrative Services Directordirectly report to the General Manager & CEO.
The department's objectives are to provide our customers, both internally and externally, with economical, reliable, andfriendly service. To efficiently direct all aspects of the utility systems. To effectively direct Strategic Planning efforts inorder to coordinate and prioritize goals and objectives. Identify, select, and retain a professional management team.Recognize constraints and limitations of State and Industry guidelines in addition to other applicable rules andregulations. Conduct periodic staff meetings and workshops.
-
5
10
15
20
FY 2013ACTUAL
FY 2014ACTUAL
FY 2015ESTIMATEDYEAR END
ACTUAL
FY 2016APPROVED
BUDGET
12 12 12 12
8
11
20
10
12 12 12 12
Number of Meetings
Board Meetings
Special BoardMeetings
Southmost RegionalWater AuthorityMeetings

- 81 -
DEPARTMENT 1110 - GENERAL MANAGER
ACCOUNTDESCRIPTION
ACTUAL FY2012
ACTUAL FY 2013
ACTUAL FY 2014
AMENDED BUDGETFY 2015
UNAUDITED YTD ACTUAL
SEPT. 2015
APPROVEDBUDGETFY 2016
O&M PERSONNEL6101 Supervision 261,662$ 275,060$ 306,223$ 211,517$ 215,737$ 211,517$ 6110 Clerical staff 80,920 85,145 89,881 88,250 90,755 128,398 6130 Overtime 7,154 5,547 6,700 6,376 5,826 7,559 6201 T.M.R.S. 53,893 52,572 56,548 40,955 41,723 42,729 6205 F.I.C.A. 14,817 16,633 16,159 20,123 11,831 21,075 6210 Medicare 5,142 5,350 5,873 4,347 4,534 4,929 6214 Dental Insurance 926 946 908 847 738 1,180 6215 Hospitalization insurance 24,101 24,633 23,986 21,369 18,274 27,080 6220 Life Insurance 436 543 487 2,458 392 2,787 6221 Long Term Disability Insurance 896 945 1,010 1,049 810 1,190 6225 Workers Compensation 15,865 12,555 13,016 7,494 8,941 8,498 6230 Vacation leave (2,931) 11,231 496 3,617 (15,591) 5,438 6235 Sick leave 306 2,763 44,593 3,986 (71,794) 5,977 6242 Auto Benefits 16,500 16,500 16,500 9,000 9,289 9,000 6260 Vacancy Savings - - - (19,837) - (22,469)
O&M PERSONNEL TOTAL 479,687 510,424 582,380 401,551 321,465 454,888
O&M NON-PERSONNEL7102 Sponsorships - - 41,050 50,000 48,470 50,000 7105 Books & periodicals - 42 954 - - - 7110 Dues & memberships 7,083 51,030 45,993 49,700 40,993 7,548 7120 Office supplies 2,233 1,706 1,274 1,500 3,379 4,500 7130 Postage/shipping charges 693 1,149 534 900 366 500 7135 Telephone expenses - 234 - - - - 7140 Training expenses 3,085 2,714 4,495 - 3,105 2,475 7145 Travel expenses 26,379 43,064 28,353 - 18,129 18,650 7299 Other materials & supplies 790 2,430 2,444 750 497 750 7310 Federal, state, & local fees 1,503 2,922 - - - - 7315 Food, meals, ice, water 1,028 1,761 3,162 1,950 1,091 1,500 7320 Official functions 746 582 2,735 1,000 1,005 2,200 7601 Legal Fees 928,547 1,090,174 1,027,949 1,357,639 892,018 929,000 7605 Engineering fees 9,609 149,310 10,011 12,500 - 42,500 7699 Other services 15,451 498 5,567 1,000 44,510 50,000 7805 Computer equipment 272 329 - 300 - 300 7806 Software licenses - new 38 - - - - - 7820 Office furniture & equipment 3,236 - 1,549 - 668 -
O&M NON-PERSONNEL TOTAL 1,000,693 1,347,944 1,176,069 1,477,239 1,054,231 1,109,923 Total 1,480,381$ 1,858,368$ 1,758,450$ 1,878,790$ 1,375,696$ 1,564,811$

- 82 -
Department Responsibility: Melida Pinales
Title: Audit ManagerTelephone Ext: 6269
Dept. No. 1120
PERFORMANCE MEASURESFOR THE
INTERNAL AUDIT DEPARTMENT
Department Function:
Department Goals/Objectives:
FY 2013ACTUAL
FY 2014ACTUAL
FY 2015ESTIMATED YEAR END
ACTUAL
FY 2016 APPROVED
BUDGETINPUT MEASURESEmployees (FTE) 3 3 3 3 O & M Exp. Personnel 201,301$ 280,906$ 257,529$ 255,922$ O & M Exp. Non-Personnel 12,152$ 9,173$ 5,942$ 14,078$
OUTPUT MEASURES Operational/Regular Audits 7 18 26 20 Special Reviews/Cash Counts 7 11 15 10 Findings/Recommendations 70 100 90 70 Follow-ups 6 10 15 25 Board Meetings 12 12 12 12 Presentations to Audit Committee 4 4 4 4
The responsibilities of the Brownsville PUB Board include enacting resolutions and policies. The Audit Managerreports directly to the Board of Directors. The Internal Auditors deal primarily with in-depth review and analysis offinancial, contractual, operational, and administrative internal controls and processes.
The Internal Audit department's objective is to perform audits for the fiscal year that bear usefulness for otherdepartments increasing efficiencies and effectiveness through findings, recommendations and follow-ups.
-
5
10
15
20
25
30
FY 2013ACTUAL
FY 2014ACTUAL
FY 2015ESTIMATEDYEAR END
ACTUAL
FY 2016APPROVED
BUDGET
7
18
26
20
7 11
15
10 6
10
15
25
Number of Audits
Operational/Regular Audits Special Reviews/Cash Counts Follow-ups
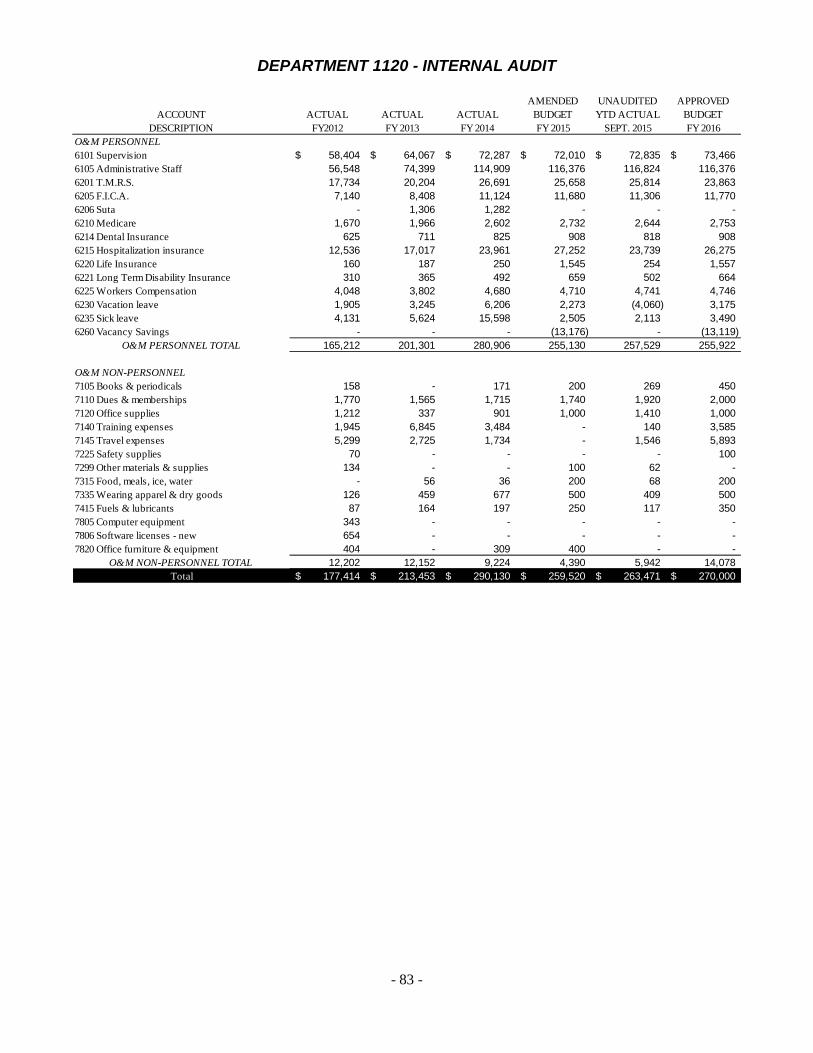
- 83 -
DEPARTMENT 1120 - INTERNAL AUDIT
ACCOUNTDESCRIPTION
ACTUAL FY2012
ACTUAL FY 2013
ACTUAL FY 2014
AMENDED BUDGETFY 2015
UNAUDITED YTD ACTUAL
SEPT. 2015
APPROVEDBUDGETFY 2016
O&M PERSONNEL6101 Supervision 58,404$ 64,067$ 72,287$ 72,010$ 72,835$ 73,466$ 6105 Administrative Staff 56,548 74,399 114,909 116,376 116,824 116,376 6201 T.M.R.S. 17,734 20,204 26,691 25,658 25,814 23,863 6205 F.I.C.A. 7,140 8,408 11,124 11,680 11,306 11,770 6206 Suta - 1,306 1,282 - - - 6210 Medicare 1,670 1,966 2,602 2,732 2,644 2,753 6214 Dental Insurance 625 711 825 908 818 908 6215 Hospitalization insurance 12,536 17,017 23,961 27,252 23,739 26,275 6220 Life Insurance 160 187 250 1,545 254 1,557 6221 Long Term Disability Insurance 310 365 492 659 502 664 6225 Workers Compensation 4,048 3,802 4,680 4,710 4,741 4,746 6230 Vacation leave 1,905 3,245 6,206 2,273 (4,060) 3,175 6235 Sick leave 4,131 5,624 15,598 2,505 2,113 3,490 6260 Vacancy Savings - - - (13,176) - (13,119)
O&M PERSONNEL TOTAL 165,212 201,301 280,906 255,130 257,529 255,922
O&M NON-PERSONNEL7105 Books & periodicals 158 - 171 200 269 450 7110 Dues & memberships 1,770 1,565 1,715 1,740 1,920 2,000 7120 Office supplies 1,212 337 901 1,000 1,410 1,000 7140 Training expenses 1,945 6,845 3,484 - 140 3,585 7145 Travel expenses 5,299 2,725 1,734 - 1,546 5,893 7225 Safety supplies 70 - - - - 100 7299 Other materials & supplies 134 - - 100 62 - 7315 Food, meals, ice, water - 56 36 200 68 200 7335 Wearing apparel & dry goods 126 459 677 500 409 500 7415 Fuels & lubricants 87 164 197 250 117 350 7805 Computer equipment 343 - - - - - 7806 Software licenses - new 654 - - - - - 7820 Office furniture & equipment 404 - 309 400 - -
O&M NON-PERSONNEL TOTAL 12,202 12,152 9,224 4,390 5,942 14,078 Total 177,414$ 213,453$ 290,130$ 259,520$ 263,471$ 270,000$
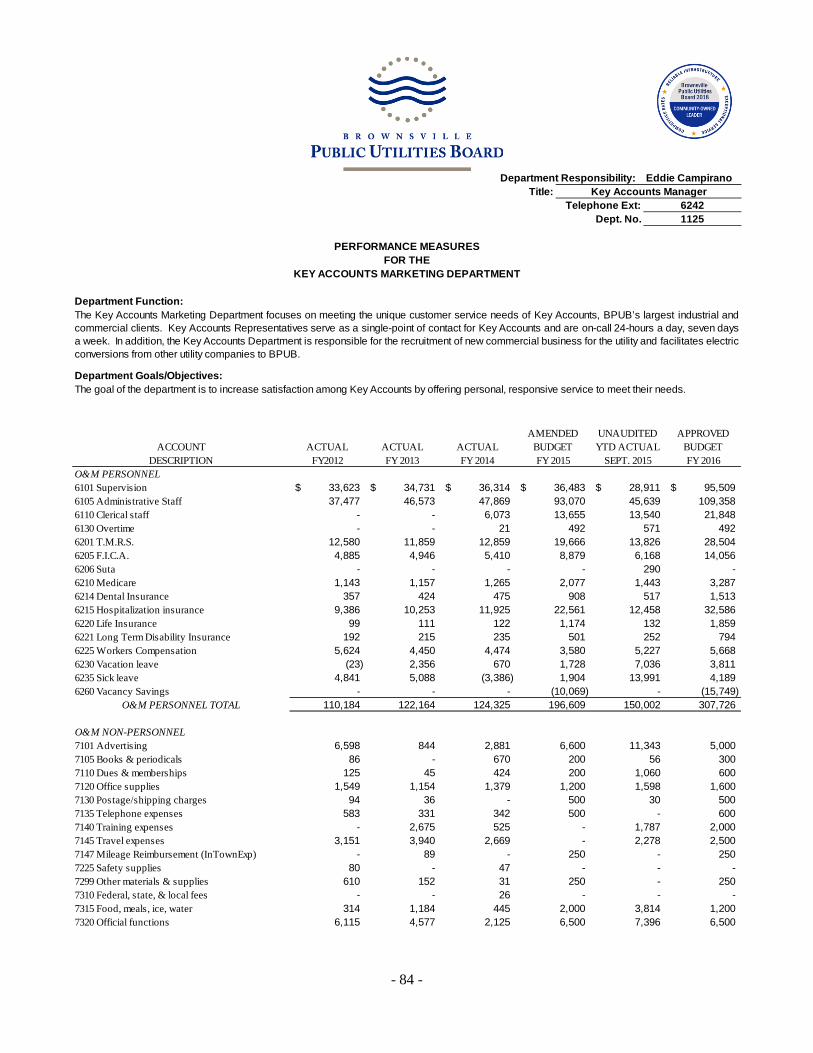
- 84 -
Department Responsibility: Eddie Campirano
Title: Key Accounts ManagerTelephone Ext: 6242
Dept. No. 1125
PERFORMANCE MEASURESFOR THE
KEY ACCOUNTS MARKETING DEPARTMENT
Department Function:
Department Goals/Objectives:
The Key Accounts Marketing Department focuses on meeting the unique customer service needs of Key Accounts, BPUB’s largest industrial andcommercial clients. Key Accounts Representatives serve as a single-point of contact for Key Accounts and are on-call 24-hours a day, seven daysa week. In addition, the Key Accounts Department is responsible for the recruitment of new commercial business for the utility and facilitates electricconversions from other utility companies to BPUB.
The goal of the department is to increase satisfaction among Key Accounts by offering personal, responsive service to meet their needs.
ACCOUNTDESCRIPTION
ACTUAL FY2012
ACTUAL FY 2013
ACTUAL FY 2014
AMENDED BUDGETFY 2015
UNAUDITED YTD ACTUAL
SEPT. 2015
APPROVEDBUDGETFY 2016
O&M PERSONNEL6101 Supervision 33,623$ 34,731$ 36,314$ 36,483$ 28,911$ 95,509$ 6105 Administrative Staff 37,477 46,573 47,869 93,070 45,639 109,358 6110 Clerical staff - - 6,073 13,655 13,540 21,848 6130 Overtime - - 21 492 571 492 6201 T.M.R.S. 12,580 11,859 12,859 19,666 13,826 28,504 6205 F.I.C.A. 4,885 4,946 5,410 8,879 6,168 14,056 6206 Suta - - - - 290 - 6210 Medicare 1,143 1,157 1,265 2,077 1,443 3,287 6214 Dental Insurance 357 424 475 908 517 1,513 6215 Hospitalization insurance 9,386 10,253 11,925 22,561 12,458 32,586 6220 Life Insurance 99 111 122 1,174 132 1,859 6221 Long Term Disability Insurance 192 215 235 501 252 794 6225 Workers Compensation 5,624 4,450 4,474 3,580 5,227 5,668 6230 Vacation leave (23) 2,356 670 1,728 7,036 3,811 6235 Sick leave 4,841 5,088 (3,386) 1,904 13,991 4,189 6260 Vacancy Savings - - - (10,069) - (15,749)
O&M PERSONNEL TOTAL 110,184 122,164 124,325 196,609 150,002 307,726
O&M NON-PERSONNEL7101 Advertising 6,598 844 2,881 6,600 11,343 5,000 7105 Books & periodicals 86 - 670 200 56 300 7110 Dues & memberships 125 45 424 200 1,060 600 7120 Office supplies 1,549 1,154 1,379 1,200 1,598 1,600 7130 Postage/shipping charges 94 36 - 500 30 500 7135 Telephone expenses 583 331 342 500 - 600 7140 Training expenses - 2,675 525 - 1,787 2,000 7145 Travel expenses 3,151 3,940 2,669 - 2,278 2,500 7147 Mileage Reimbursement (InTownExp) - 89 - 250 - 250 7225 Safety supplies 80 - 47 - - - 7299 Other materials & supplies 610 152 31 250 - 250 7310 Federal, state, & local fees - - 26 - - - 7315 Food, meals, ice, water 314 1,184 445 2,000 3,814 1,200 7320 Official functions 6,115 4,577 2,125 6,500 7,396 6,500
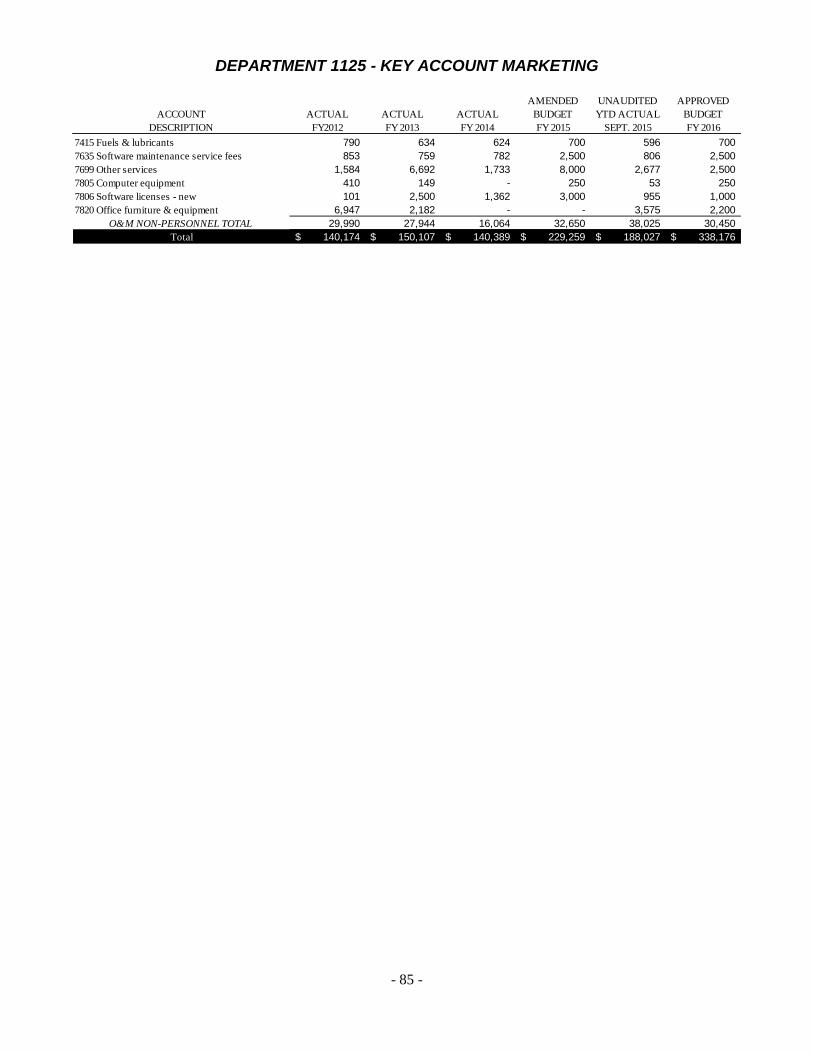
- 85 -
DEPARTMENT 1125 - KEY ACCOUNT MARKETING
ACCOUNTDESCRIPTION
ACTUAL FY2012
ACTUAL FY 2013
ACTUAL FY 2014
AMENDED BUDGETFY 2015
UNAUDITED YTD ACTUAL
SEPT. 2015
APPROVEDBUDGETFY 2016
7415 Fuels & lubricants 790 634 624 700 596 700 7635 Software maintenance service fees 853 759 782 2,500 806 2,500 7699 Other services 1,584 6,692 1,733 8,000 2,677 2,500 7805 Computer equipment 410 149 - 250 53 250 7806 Software licenses - new 101 2,500 1,362 3,000 955 1,000 7820 Office furniture & equipment 6,947 2,182 - - 3,575 2,200
O&M NON-PERSONNEL TOTAL 29,990 27,944 16,064 32,650 38,025 30,450 Total 140,174$ 150,107$ 140,389$ 229,259$ 188,027$ 338,176$
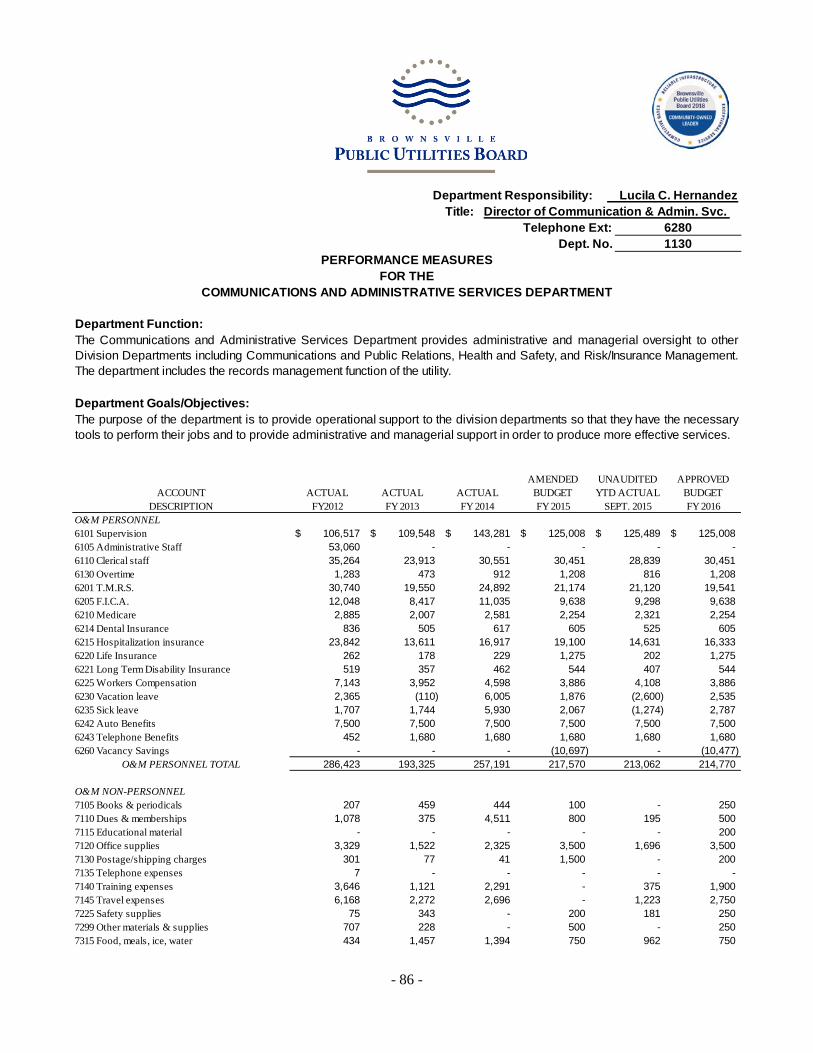
- 86 -
Department Responsibility: Lucila C. Hernandez Title: Director of Communication & Admin. Svc.
Telephone Ext: 6280Dept. No. 1130
PERFORMANCE MEASURESFOR THE
COMMUNICATIONS AND ADMINISTRATIVE SERVICES DEPARTMENT
Department Function:
Department Goals/Objectives:The purpose of the department is to provide operational support to the division departments so that they have the necessarytools to perform their jobs and to provide administrative and managerial support in order to produce more effective services.
The Communications and Administrative Services Department provides administrative and managerial oversight to otherDivision Departments including Communications and Public Relations, Health and Safety, and Risk/Insurance Management.The department includes the records management function of the utility.
ACCOUNTDESCRIPTION
ACTUAL FY2012
ACTUAL FY 2013
ACTUAL FY 2014
AMENDED BUDGETFY 2015
UNAUDITED YTD ACTUAL
SEPT. 2015
APPROVEDBUDGETFY 2016
O&M PERSONNEL6101 Supervision 106,517$ 109,548$ 143,281$ 125,008$ 125,489$ 125,008$ 6105 Administrative Staff 53,060 - - - - - 6110 Clerical staff 35,264 23,913 30,551 30,451 28,839 30,451 6130 Overtime 1,283 473 912 1,208 816 1,208 6201 T.M.R.S. 30,740 19,550 24,892 21,174 21,120 19,541 6205 F.I.C.A. 12,048 8,417 11,035 9,638 9,298 9,638 6210 Medicare 2,885 2,007 2,581 2,254 2,321 2,254 6214 Dental Insurance 836 505 617 605 525 605 6215 Hospitalization insurance 23,842 13,611 16,917 19,100 14,631 16,333 6220 Life Insurance 262 178 229 1,275 202 1,275 6221 Long Term Disability Insurance 519 357 462 544 407 544 6225 Workers Compensation 7,143 3,952 4,598 3,886 4,108 3,886 6230 Vacation leave 2,365 (110) 6,005 1,876 (2,600) 2,535 6235 Sick leave 1,707 1,744 5,930 2,067 (1,274) 2,787 6242 Auto Benefits 7,500 7,500 7,500 7,500 7,500 7,500 6243 Telephone Benefits 452 1,680 1,680 1,680 1,680 1,680 6260 Vacancy Savings - - - (10,697) - (10,477)
O&M PERSONNEL TOTAL 286,423 193,325 257,191 217,570 213,062 214,770
O&M NON-PERSONNEL7105 Books & periodicals 207 459 444 100 - 250 7110 Dues & memberships 1,078 375 4,511 800 195 500 7115 Educational material - - - - - 200 7120 Office supplies 3,329 1,522 2,325 3,500 1,696 3,500 7130 Postage/shipping charges 301 77 41 1,500 - 200 7135 Telephone expenses 7 - - - - - 7140 Training expenses 3,646 1,121 2,291 - 375 1,900 7145 Travel expenses 6,168 2,272 2,696 - 1,223 2,750 7225 Safety supplies 75 343 - 200 181 250 7299 Other materials & supplies 707 228 - 500 - 250 7315 Food, meals, ice, water 434 1,457 1,394 750 962 750

- 87 -
DEPARTMENT 1130 - COMMUNICATIONS AND ADMINISTRATIVE SERVICES
ACCOUNTDESCRIPTION
ACTUAL FY2012
ACTUAL FY 2013
ACTUAL FY 2014
AMENDED BUDGETFY 2015
UNAUDITED YTD ACTUAL
SEPT. 2015
APPROVEDBUDGETFY 2016
7320 Official functions - - 1,107 - - - 7325 Rental of equip/storage/land 20,892 6,401 3,533 8,000 3,302 5,500 7415 Fuels & lubricants 719 233 226 - - - 7601 Legal Fees 12,655 - - 5,000 740 2,500 7645 Maintenance services 19,699 25,377 18,107 25,000 16,049 25,000 7699 Other services 55,769 13,270 221 - - - 7805 Computer equipment - 311 55 - - 1,000 7806 Software licenses - new 1,685 - - - - - 7820 Office furniture & equipment 4,830 78 1,160 1,300 - 1,300
O&M NON-PERSONNEL TOTAL 132,201 53,525 38,112 46,650 24,723 45,850 Total 418,624$ 246,850$ 295,303$ 264,220$ 237,785$ 260,620$

- 88 -
Department Responsibility: Alicia Nevarez-Warner
Telephone Ext: 6284Dept. No. 1135
PERFORMANCE MEASURESFOR THE
COMMUNICATIONS AND PUBLIC RELATIONS DEPARTMENT
Department Function:
Department Goals/Objectives:
FY 2013 ACTUAL
FY 2014 ACTUAL
FY 2015 ESTIMATEDYEAR END
ACTUAL
FY 2016APPROVED
BUDGETINPUT MEASURES
3 3 4 4 694,482$ 727,323$ 704,247$ 830,455$
OUTPUT MEASURES 24 Total 12 Total 12 Total 12 Total
65 24 24 69 18 12 23 63 33 23 32 27 17 9 17 *960 (2 per hr)47 27 25 25 52 30 50 37 6 6 6 6
11 8 11 11 12 (1 per month) 12 (1 per month) 11 10
60,700/ 60,100 60,000/59,500 60,000/59,500 59,500
OUTCOME MEASURES14 10 14 11
30,500 12,456 2,100 8,175 300 321 725 504
8,700 1,920 2,000 2,881 160 200 210 2,080
680,000 577,500 600,000 554,000 50% 47% 50% 0%
45 Media/Comm. 143 Media /Comm. 200 Media/Comm. 206 Media/Comm.3,500$ 4,200$ 5,000$ 3,000$
* Information not readily available
Employees
Title: Communications & PR Manager
The Communications and Public Relations Department is responsible for the coordination and management of internal and externalcommunications, focusing on utility-wide issues, employee understanding, community relations, and governmental affairs, and working topromote a positive employee and public image of the Brownsville PUB. In addition, this department is responsible for providing educationand outreach activities in the community.
The purpose of the Communications and Public Relations program is to provide information to the Brownsville PUB personnel, the generalpublic and the media so that they understand and be aware of Brownsville PUB issues.
No. of Bill Inserts Produced
O&M Expenditures
Operational Reports [Outreach Report/ Communications & PR Report]No. of Community PresentationsNo. of ToursNo. of Safety Presentations (including lobby video)No. of Lobby Presentations *(per BPUB TV)Sponsorships Conducted within PolicyNo. of Weekly Connections ProducedNo. of Family Connections ProducedNo. of PUBCAP Meetings
Water Consumer Confidence Report (CCR) Produced and Distributed Within Regulations
Public Information Campaigns ConductedNo. of Participants in Community PresentationsNo. of Participants in ToursNo. of Participants in Safety PresentationsNo. of Participants in Lobby PresentationsNo. of Bill Inserts Distributed (Including CCR)Marketing Survey [Unofficial user surveys]
EFFICIENCY MEASURESAvg. No. of Outreach Contacts [Media/Communications]Avg. Amount of Sponsorship
$3,500
$4,200
$5,000
$3,000
$2,500
$3,000
$3,500
$4,000
$4,500
$5,000
$5,500
FY 2013ACTUAL
FY 2014ACTUAL
FY 2015ESTIMATEDYEAR END
ACTUAL
FY 2016APPROVED
BUDGET
Avg. Amount of Sponsorship
30,500
12,456
2,100
8,175
1,000
6,000
11,000
16,000
21,000
26,000
31,000
36,000
FY 2013ACTUAL
FY 2014ACTUAL
FY 2015ESTIMATEDYEAR END
ACTUAL
FY 2016APPROVED
BUDGET
No. of Participants in Community Presentations
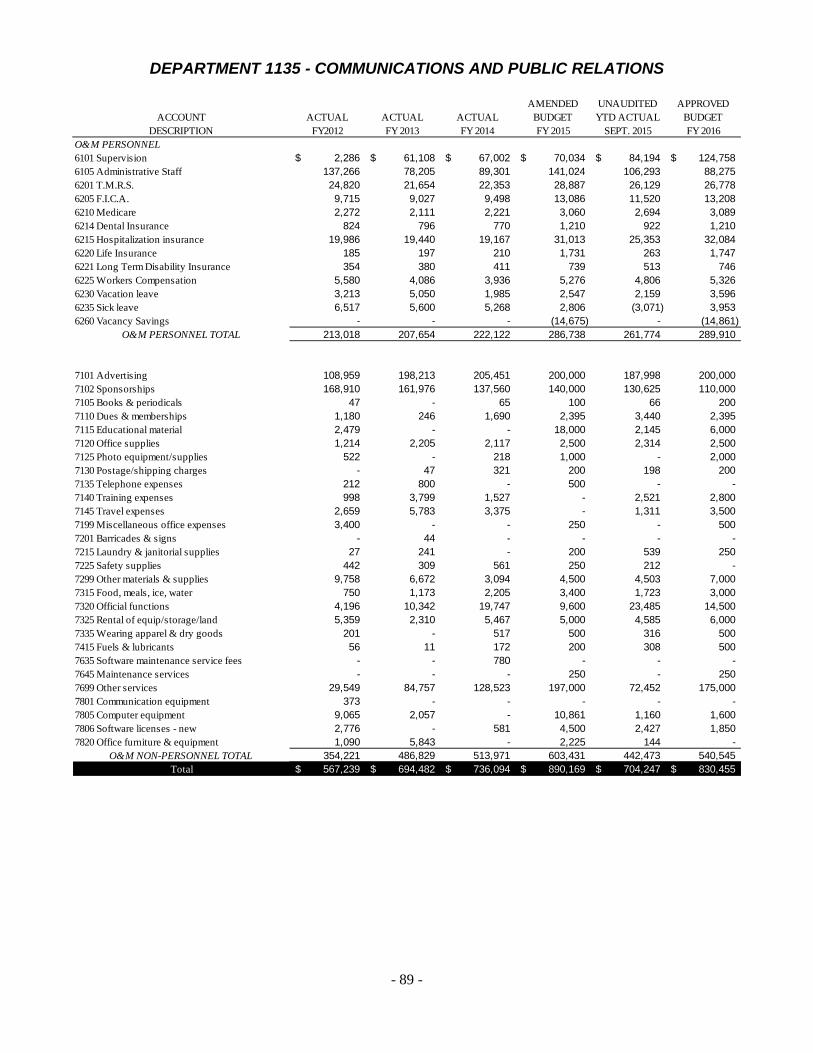
- 89 -
DEPARTMENT 1135 - COMMUNICATIONS AND PUBLIC RELATIONS
ACCOUNTDESCRIPTION
ACTUAL FY2012
ACTUAL FY 2013
ACTUAL FY 2014
AMENDED BUDGETFY 2015
UNAUDITED YTD ACTUAL
SEPT. 2015
APPROVEDBUDGETFY 2016
O&M PERSONNEL6101 Supervision 2,286$ 61,108$ 67,002$ 70,034$ 84,194$ 124,758$ 6105 Administrative Staff 137,266 78,205 89,301 141,024 106,293 88,275 6201 T.M.R.S. 24,820 21,654 22,353 28,887 26,129 26,778 6205 F.I.C.A. 9,715 9,027 9,498 13,086 11,520 13,208 6210 Medicare 2,272 2,111 2,221 3,060 2,694 3,089 6214 Dental Insurance 824 796 770 1,210 922 1,210 6215 Hospitalization insurance 19,986 19,440 19,167 31,013 25,353 32,084 6220 Life Insurance 185 197 210 1,731 263 1,747 6221 Long Term Disability Insurance 354 380 411 739 513 746 6225 Workers Compensation 5,580 4,086 3,936 5,276 4,806 5,326 6230 Vacation leave 3,213 5,050 1,985 2,547 2,159 3,596 6235 Sick leave 6,517 5,600 5,268 2,806 (3,071) 3,953 6260 Vacancy Savings - - - (14,675) - (14,861)
O&M PERSONNEL TOTAL 213,018 207,654 222,122 286,738 261,774 289,910
7101 Advertising 108,959 198,213 205,451 200,000 187,998 200,000 7102 Sponsorships 168,910 161,976 137,560 140,000 130,625 110,000 7105 Books & periodicals 47 - 65 100 66 200 7110 Dues & memberships 1,180 246 1,690 2,395 3,440 2,395 7115 Educational material 2,479 - - 18,000 2,145 6,000 7120 Office supplies 1,214 2,205 2,117 2,500 2,314 2,500 7125 Photo equipment/supplies 522 - 218 1,000 - 2,000 7130 Postage/shipping charges - 47 321 200 198 200 7135 Telephone expenses 212 800 - 500 - - 7140 Training expenses 998 3,799 1,527 - 2,521 2,800 7145 Travel expenses 2,659 5,783 3,375 - 1,311 3,500 7199 Miscellaneous office expenses 3,400 - - 250 - 500 7201 Barricades & signs - 44 - - - - 7215 Laundry & janitorial supplies 27 241 - 200 539 250 7225 Safety supplies 442 309 561 250 212 - 7299 Other materials & supplies 9,758 6,672 3,094 4,500 4,503 7,000 7315 Food, meals, ice, water 750 1,173 2,205 3,400 1,723 3,000 7320 Official functions 4,196 10,342 19,747 9,600 23,485 14,500 7325 Rental of equip/storage/land 5,359 2,310 5,467 5,000 4,585 6,000 7335 Wearing apparel & dry goods 201 - 517 500 316 500 7415 Fuels & lubricants 56 11 172 200 308 500 7635 Software maintenance service fees - - 780 - - - 7645 Maintenance services - - - 250 - 250 7699 Other services 29,549 84,757 128,523 197,000 72,452 175,000 7801 Communication equipment 373 - - - - - 7805 Computer equipment 9,065 2,057 - 10,861 1,160 1,600 7806 Software licenses - new 2,776 - 581 4,500 2,427 1,850 7820 Office furniture & equipment 1,090 5,843 - 2,225 144 -
O&M NON-PERSONNEL TOTAL 354,221 486,829 513,971 603,431 442,473 540,545 Total 567,239$ 694,482$ 736,094$ 890,169$ 704,247$ 830,455$
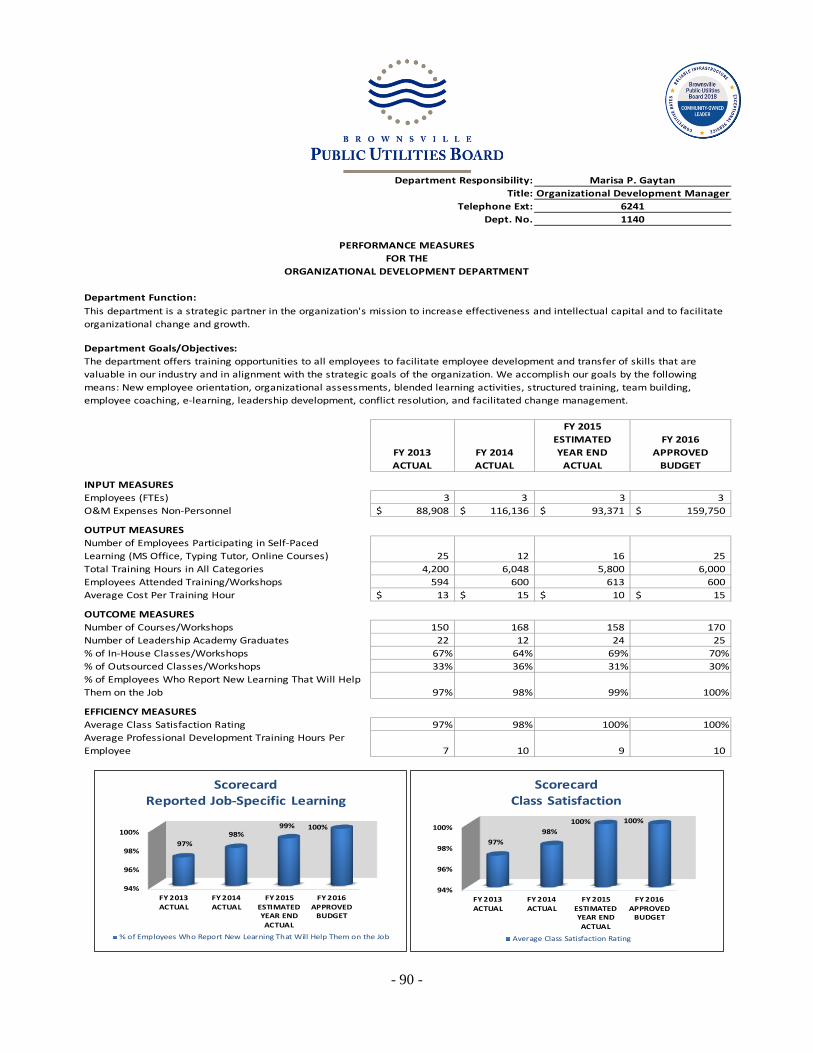
- 90 -
Organizational Development Manager
Department Function:
Department Goals/Objectives:
FY 2013 ACTUAL
FY 2014 ACTUAL
FY 2015 ESTIMATED YEAR END
ACTUAL
FY 2016 APPROVED
BUDGET
INPUT MEASURESEmployees (FTEs) 3 3 3 3 O&M Expenses Non-Personnel 88,908$ 116,136$ 93,371$ 159,750$
OUTPUT MEASURES Number of Employees Participating in Self-PacedLearning (MS Office, Typing Tutor, Online Courses) 25 12 16 25 Total Training Hours in All Categories 4,200 6,048 5,800 6,000 Employees Attended Training/Workshops 594 600 613 600 Average Cost Per Training Hour 13$ 15$ 10$ 15$
OUTCOME MEASURESNumber of Courses/Workshops 150 168 158 170 Number of Leadership Academy Graduates 22 12 24 25 % of In-House Classes/Workshops 67% 64% 69% 70%% of Outsourced Classes/Workshops 33% 36% 31% 30%% of Employees Who Report New Learning That Will Help Them on the Job 97% 98% 99% 100%
EFFICIENCY MEASURESAverage Class Satisfaction Rating 97% 98% 100% 100%Average Professional Development Training Hours Per Employee 7 10 9 10 FY FY 2013 FY 2014 FY 2015 FY 2016
This department is a strategic partner in the organization's mission to increase effectiveness and intellectual capital and to facilitate organizational change and growth.
The department offers training opportunities to all employees to facilitate employee development and transfer of skills that are valuable in our industry and in alignment with the strategic goals of the organization. We accomplish our goals by the following means: New employee orientation, organizational assessments, blended learning activities, structured training, team building, employee coaching, e-learning, leadership development, conflict resolution, and facilitated change management.
PERFORMANCE MEASURESFOR THE
ORGANIZATIONAL DEVELOPMENT DEPARTMENT
Dept. No.62411140
Department Responsibility: Marisa P. GaytanTitle:
Telephone Ext:
94%
96%
98%
100%
FY 2013ACTUAL
FY 2014ACTUAL
FY 2015ESTIMATEDYEAR ENDACTUAL
FY 2016APPROVED
BUDGET
97% 98%
99% 100%
Scorecard Reported Job-Specific Learning
% of Employees Who Report New Learning That Will Help Them on the Job
94%
96%
98%
100%
FY 2013ACTUAL
FY 2014ACTUAL
FY 2015ESTIMATEDYEAR ENDACTUAL
FY 2016APPROVED
BUDGET
97% 98%
100% 100%
Scorecard Class Satisfaction
Average Class Satisfaction Rating
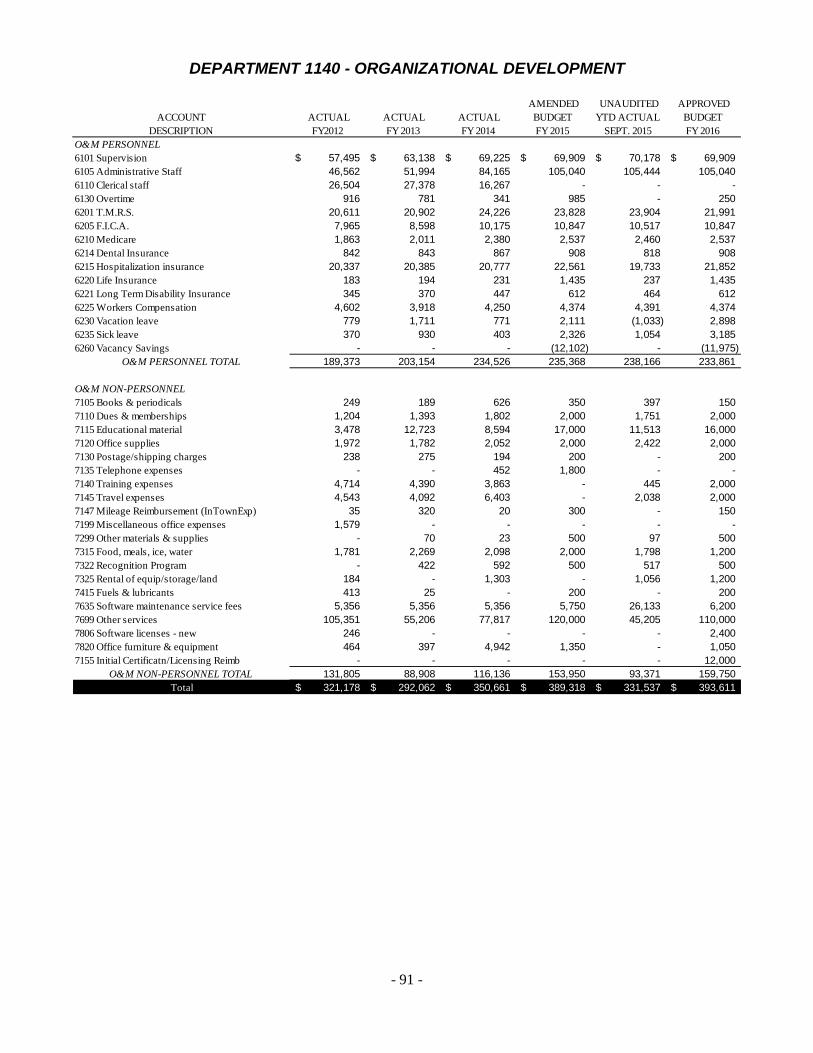
- 91 -
DEPARTMENT 1140 - ORGANIZATIONAL DEVELOPMENT
ACCOUNTDESCRIPTION
ACTUAL FY2012
ACTUAL FY 2013
ACTUAL FY 2014
AMENDED BUDGETFY 2015
UNAUDITED YTD ACTUAL
SEPT. 2015
APPROVEDBUDGETFY 2016
O&M PERSONNEL6101 Supervision 57,495$ 63,138$ 69,225$ 69,909$ 70,178$ 69,909$ 6105 Administrative Staff 46,562 51,994 84,165 105,040 105,444 105,040 6110 Clerical staff 26,504 27,378 16,267 - - - 6130 Overtime 916 781 341 985 - 250 6201 T.M.R.S. 20,611 20,902 24,226 23,828 23,904 21,991 6205 F.I.C.A. 7,965 8,598 10,175 10,847 10,517 10,847 6210 Medicare 1,863 2,011 2,380 2,537 2,460 2,537 6214 Dental Insurance 842 843 867 908 818 908 6215 Hospitalization insurance 20,337 20,385 20,777 22,561 19,733 21,852 6220 Life Insurance 183 194 231 1,435 237 1,435 6221 Long Term Disability Insurance 345 370 447 612 464 612 6225 Workers Compensation 4,602 3,918 4,250 4,374 4,391 4,374 6230 Vacation leave 779 1,711 771 2,111 (1,033) 2,898 6235 Sick leave 370 930 403 2,326 1,054 3,185 6260 Vacancy Savings - - - (12,102) - (11,975)
O&M PERSONNEL TOTAL 189,373 203,154 234,526 235,368 238,166 233,861
O&M NON-PERSONNEL7105 Books & periodicals 249 189 626 350 397 150 7110 Dues & memberships 1,204 1,393 1,802 2,000 1,751 2,000 7115 Educational material 3,478 12,723 8,594 17,000 11,513 16,000 7120 Office supplies 1,972 1,782 2,052 2,000 2,422 2,000 7130 Postage/shipping charges 238 275 194 200 - 200 7135 Telephone expenses - - 452 1,800 - - 7140 Training expenses 4,714 4,390 3,863 - 445 2,000 7145 Travel expenses 4,543 4,092 6,403 - 2,038 2,000 7147 Mileage Reimbursement (InTownExp) 35 320 20 300 - 150 7199 Miscellaneous office expenses 1,579 - - - - - 7299 Other materials & supplies - 70 23 500 97 500 7315 Food, meals, ice, water 1,781 2,269 2,098 2,000 1,798 1,200 7322 Recognition Program - 422 592 500 517 500 7325 Rental of equip/storage/land 184 - 1,303 - 1,056 1,200 7415 Fuels & lubricants 413 25 - 200 - 200 7635 Software maintenance service fees 5,356 5,356 5,356 5,750 26,133 6,200 7699 Other services 105,351 55,206 77,817 120,000 45,205 110,000 7806 Software licenses - new 246 - - - - 2,400 7820 Office furniture & equipment 464 397 4,942 1,350 - 1,050 7155 Initial Certificatn/Licensing Reimb - - - - - 12,000
O&M NON-PERSONNEL TOTAL 131,805 88,908 116,136 153,950 93,371 159,750 Total 321,178$ 292,062$ 350,661$ 389,318$ 331,537$ 393,611$
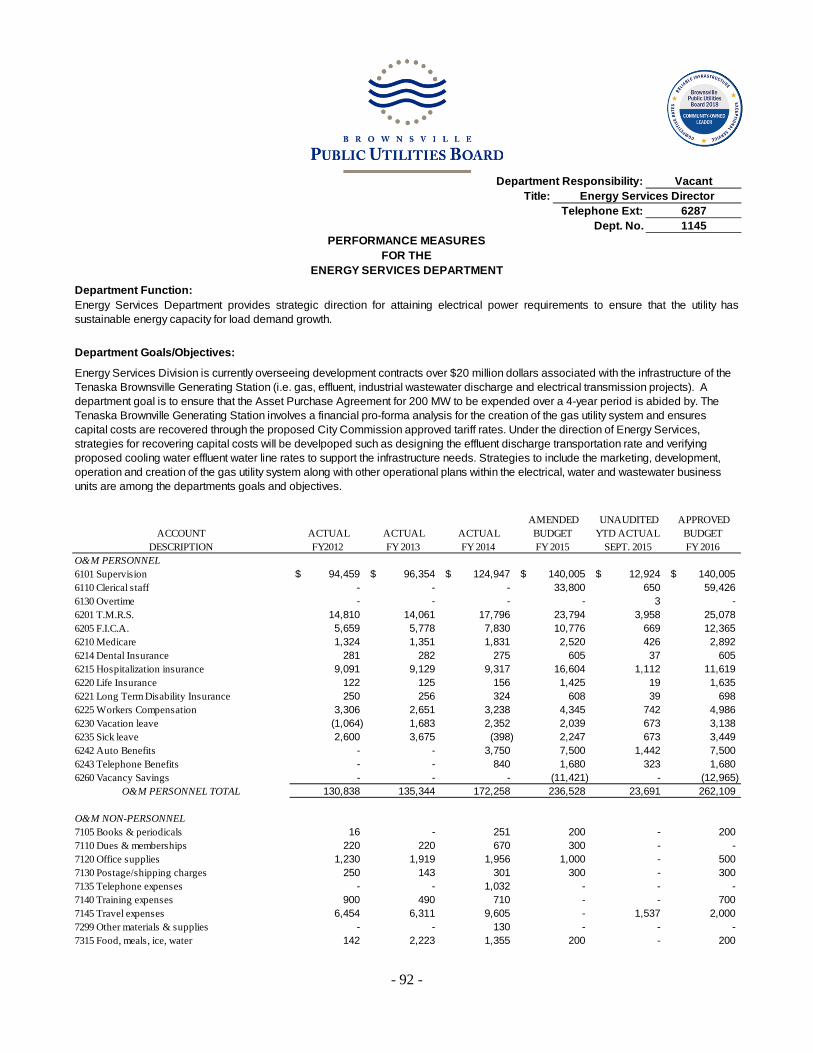
- 92 -
Department Responsibility: Vacant
Title: Energy Services DirectorTelephone Ext: 6287
Dept. No. 1145PERFORMANCE MEASURES
FOR THEENERGY SERVICES DEPARTMENT
Department Function:
Department Goals/Objectives:
Energy Services Division is currently overseeing development contracts over $20 million dollars associated with the infrastructure of the Tenaska Brownsville Generating Station (i.e. gas, effluent, industrial wastewater discharge and electrical transmission projects). A department goal is to ensure that the Asset Purchase Agreement for 200 MW to be expended over a 4-year period is abided by. The Tenaska Brownville Generating Station involves a financial pro-forma analysis for the creation of the gas utility system and ensures capital costs are recovered through the proposed City Commission approved tariff rates. Under the direction of Energy Services, strategies for recovering capital costs will be develpoped such as designing the effluent discharge transportation rate and verifying proposed cooling water effluent water line rates to support the infrastructure needs. Strategies to include the marketing, development, operation and creation of the gas utility system along with other operational plans within the electrical, water and wastewater business units are among the departments goals and objectives.
Energy Services Department provides strategic direction for attaining electrical power requirements to ensure that the utility hassustainable energy capacity for load demand growth.
ACCOUNTDESCRIPTION
ACTUAL FY2012
ACTUAL FY 2013
ACTUAL FY 2014
AMENDED BUDGETFY 2015
UNAUDITED YTD ACTUAL
SEPT. 2015
APPROVEDBUDGETFY 2016
O&M PERSONNEL6101 Supervision 94,459$ 96,354$ 124,947$ 140,005$ 12,924$ 140,005$ 6110 Clerical staff - - - 33,800 650 59,426 6130 Overtime - - - - 3 - 6201 T.M.R.S. 14,810 14,061 17,796 23,794 3,958 25,078 6205 F.I.C.A. 5,659 5,778 7,830 10,776 669 12,365 6210 Medicare 1,324 1,351 1,831 2,520 426 2,892 6214 Dental Insurance 281 282 275 605 37 605 6215 Hospitalization insurance 9,091 9,129 9,317 16,604 1,112 11,619 6220 Life Insurance 122 125 156 1,425 19 1,635 6221 Long Term Disability Insurance 250 256 324 608 39 698 6225 Workers Compensation 3,306 2,651 3,238 4,345 742 4,986 6230 Vacation leave (1,064) 1,683 2,352 2,039 673 3,138 6235 Sick leave 2,600 3,675 (398) 2,247 673 3,449 6242 Auto Benefits - - 3,750 7,500 1,442 7,500 6243 Telephone Benefits - - 840 1,680 323 1,680 6260 Vacancy Savings - - - (11,421) - (12,965)
O&M PERSONNEL TOTAL 130,838 135,344 172,258 236,528 23,691 262,109
O&M NON-PERSONNEL7105 Books & periodicals 16 - 251 200 - 200 7110 Dues & memberships 220 220 670 300 - - 7120 Office supplies 1,230 1,919 1,956 1,000 - 500 7130 Postage/shipping charges 250 143 301 300 - 300 7135 Telephone expenses - - 1,032 - - - 7140 Training expenses 900 490 710 - - 700 7145 Travel expenses 6,454 6,311 9,605 - 1,537 2,000 7299 Other materials & supplies - - 130 - - - 7315 Food, meals, ice, water 142 2,223 1,355 200 - 200
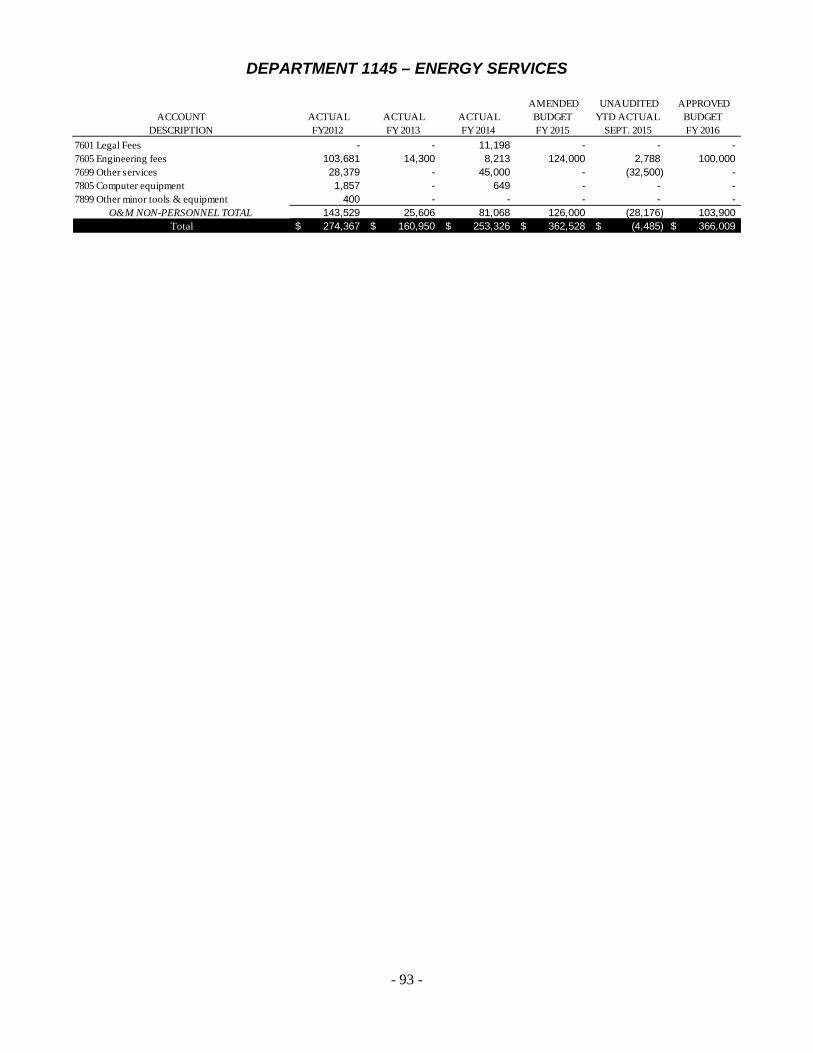
- 93 -
DEPARTMENT 1145 – ENERGY SERVICES
ACCOUNTDESCRIPTION
ACTUAL FY2012
ACTUAL FY 2013
ACTUAL FY 2014
AMENDED BUDGETFY 2015
UNAUDITED YTD ACTUAL
SEPT. 2015
APPROVEDBUDGETFY 2016
7601 Legal Fees - - 11,198 - - - 7605 Engineering fees 103,681 14,300 8,213 124,000 2,788 100,000 7699 Other services 28,379 - 45,000 - (32,500) - 7805 Computer equipment 1,857 - 649 - - - 7899 Other minor tools & equipment 400 - - - - -
O&M NON-PERSONNEL TOTAL 143,529 25,606 81,068 126,000 (28,176) 103,900 Total 274,367$ 160,950$ 253,326$ 362,528$ (4,485)$ 366,009$
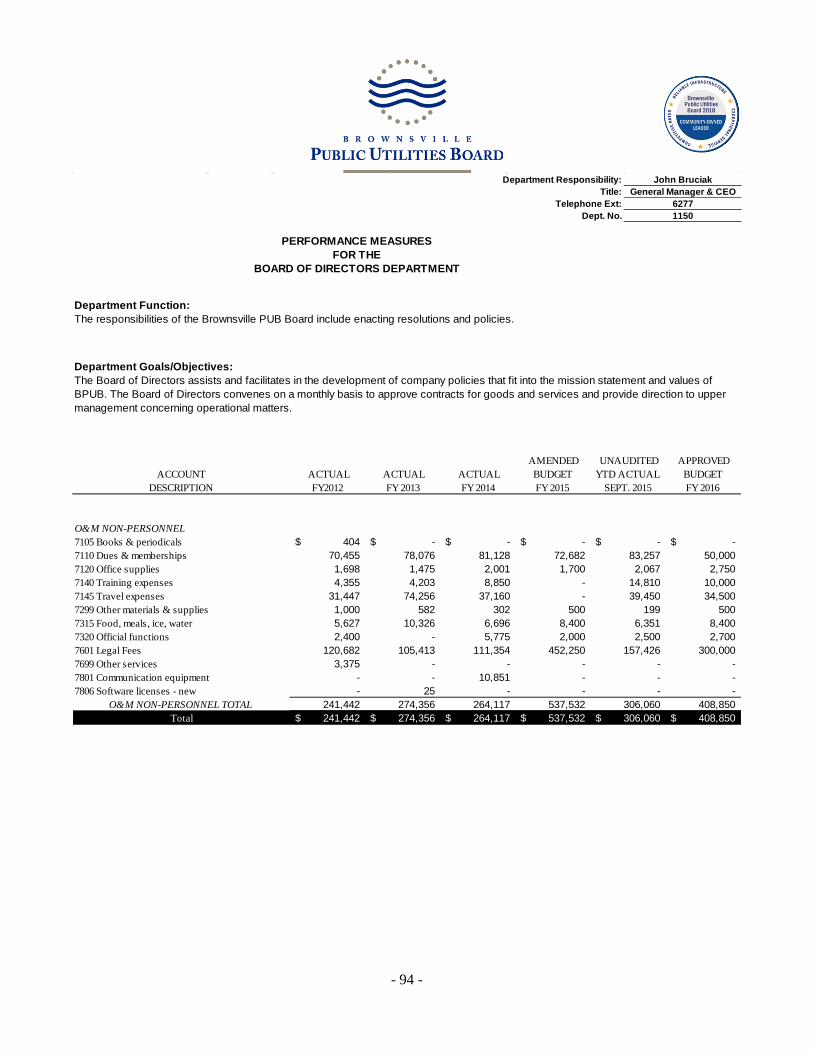
- 94 -
Department Responsibility: John Bruciak
Title: General Manager & CEOTelephone Ext: 6277
Dept. No. 1150
Department Function:
Department Goals/Objectives:
PERFORMANCE MEASURESFOR THE
The responsibilities of the Brownsville PUB Board include enacting resolutions and policies.
The Board of Directors assists and facilitates in the development of company policies that fit into the mission statement and values of BPUB. The Board of Directors convenes on a monthly basis to approve contracts for goods and services and provide direction to upper management concerning operational matters.
BOARD OF DIRECTORS DEPARTMENT
ACCOUNTDESCRIPTION
ACTUAL FY2012
ACTUAL FY 2013
ACTUAL FY 2014
AMENDED BUDGETFY 2015
UNAUDITED YTD ACTUAL
SEPT. 2015
APPROVEDBUDGETFY 2016
O&M NON-PERSONNEL7105 Books & periodicals 404$ -$ -$ -$ -$ -$ 7110 Dues & memberships 70,455 78,076 81,128 72,682 83,257 50,000 7120 Office supplies 1,698 1,475 2,001 1,700 2,067 2,750 7140 Training expenses 4,355 4,203 8,850 - 14,810 10,000 7145 Travel expenses 31,447 74,256 37,160 - 39,450 34,500 7299 Other materials & supplies 1,000 582 302 500 199 500 7315 Food, meals, ice, water 5,627 10,326 6,696 8,400 6,351 8,400 7320 Official functions 2,400 - 5,775 2,000 2,500 2,700 7601 Legal Fees 120,682 105,413 111,354 452,250 157,426 300,000 7699 Other services 3,375 - - - - - 7801 Communication equipment - - 10,851 - - - 7806 Software licenses - new - 25 - - - -
O&M NON-PERSONNEL TOTAL 241,442 274,356 264,117 537,532 306,060 408,850 Total 241,442$ 274,356$ 264,117$ 537,532$ 306,060$ 408,850$

- 95 -
THIS PAGE INTENTIONALLY LEFT BLANK

- 96 -
Department Responsibility: Nancy TelloTitle: Records Manager
Telephone Ext: 6262Dept. No. 1165
RECORDS MANAGEMENT DEPARTMENT
Department Function:
Department Goals/Objectives:
FY 2013ACTUAL
FY 2014ACTUAL
FY 2015 ESTIMATEDYEAR END
ACTUAL
FY 2016 APPROVED
BUDGETINPUT MEASURESEmployees (FTE's) 2 2 2 2O&M Expenses - Non Personnel $73,178 $62,050 $24,484 $70,510
OUTPUT MEASURES
52 52 61 61
259 280 185 200
2713 14 12
32 29 30 25
OUTCOME MEASURES
14 0 4 5
3 3 3 3
554 505 269 525
0 5 8 5
8 - 10 days 6 days 6 days 5 days
Yes Yes Yes YesYes Yes Yes YesYes Yes Yes Yes
Number of Policy or Procedure Documents Reviewed by Records Management and Approved by the BPUB Board or Executive Management
PERFORMANCE MEASURESFOR THE
The Records Management Department function is to ensure that records are administered in an efficient and systematic control since their creation, receipt, maintenance, use and disposition, including the processes for capturing and maintaining evidence of and information about BPUB activities and transactions in the form of records. The department responds to public information requests and includes the policies and procedures function.
The objectives of the department are to assist other departments manage their records so that they are accessible and are maintained efficiently and cost effectively and to retain records that are required to be kept, identify and preserve records with permanent value and dispose of records with no further value in a secure and timely manner.
Company-wide Records Inventory (No. of Departments)
Requests Submitted Related to the Public Information Act
Number of Policy or Procedure Documents Given a First Review by Records Management
Number of departments that have completed the records inventory
Number of Public Information Requests requiring a Texas Attorney General Opinion
Number of Training Sessions Held Regarding Records Management
Number of Employees Provided Training Regarding Records Management
EFFICIENCY MEASURESAverage time to respond to a public information request (within the law - 10 days)Maintaining records management program
Maintaining policies and procedures programMaintaining employees trained on records
554 505
269
525
FY 2013ACTUAL
FY 2014ACTUAL
FY 2015ESTIMATEDYEAR END
ACTUAL
FY 2016APPROVED
BUDGET
Number of Employees Provided Training Regarding Records
Management
259
280
185 200
0
100
200
300
400
FY 2013ACTUAL
FY 2014ACTUAL
FY 2015ESTIMATEDYEAR END
ACTUAL
FY 2016APPROVED
BUDGET
Requests Submitted Related to the Public Information Act

- 97 -
DEPARTMENT 1165 – RECORDS MANAGEMENT
ACCOUNTDESCRIPTION
ACTUAL FY2012
ACTUAL FY 2013
ACTUAL FY 2014
AMENDED BUDGETFY 2015
UNAUDITED YTD ACTUAL
SEPT. 2015
APPROVEDBUDGETFY 2016
O&M PERSONNEL6101 Supervision -$ 55,661$ 61,031$ 63,794$ 64,039$ 63,794$ 6105 Administrative Staff 1,041 - - - - - 6110 Clerical staff 696 37,318 37,434 36,982 37,264 36,982 6130 Overtime - 304 524 533 342 427 6201 T.M.R.S. 258 13,612 14,112 13,726 13,834 12,668 6205 F.I.C.A. 104 5,581 5,822 6,248 5,930 6,248 6210 Medicare 24 1,305 1,362 1,461 1,387 1,461 6214 Dental Insurance 12 564 548 605 546 605 6215 Hospitalization insurance 312 15,009 16,354 19,100 16,643 18,399 6220 Life Insurance - 129 134 826 138 826 6221 Long Term Disability Insurance - 245 258 353 266 353 6225 Workers Compensation 61 2,563 2,475 2,519 2,541 2,519 6230 Vacation leave - 1,493 (1,286) 1,216 518 1,741 6235 Sick leave - 726 3,769 1,340 178 1,913 6260 Vacancy Savings - - - (7,281) - (7,193)
O&M PERSONNEL TOTAL 2,507 134,508 142,537 141,423 143,626 140,744
O&M NON-PERSONNEL7105 Books & periodicals - - 123 100 - 200 7110 Dues & memberships - 461 539 400 559 600 7120 Office supplies 28 1,813 894 1,700 1,665 2,000 7130 Postage/shipping charges - 57 90 100 83 200 7135 Telephone expenses - 226 - 250 - 500 7140 Training expenses - 1,299 620 - 60 1,500 7145 Travel expenses - 112 2,046 - 964 3,000 7225 Safety supplies - 221 (37) - 130 200 7299 Other materials & supplies - 1,461 798 2,000 276 1,000 7315 Food, meals, ice, water - 171 153 100 85 200 7325 Rental of equip/storage/land - 13,086 15,876 14,000 14,787 18,000 7415 Fuels & lubricants - 1,756 618 1,000 377 600 7601 Legal Fees - 17,093 30,602 15,000 1,586 10,000 7699 Other services - 35,422 9,679 44,000 3,286 29,000 7805 Computer equipment - - - 3,000 - 1,500 7806 Software licenses - new - - - - 624 1,260 7820 Office furniture & equipment - - 49 900 - 750
O&M NON-PERSONNEL TOTAL 28 73,178 62,050 82,550 24,484 70,510 Total 2,535$ 207,686$ 204,587$ 223,973$ 168,110$ 211,254$
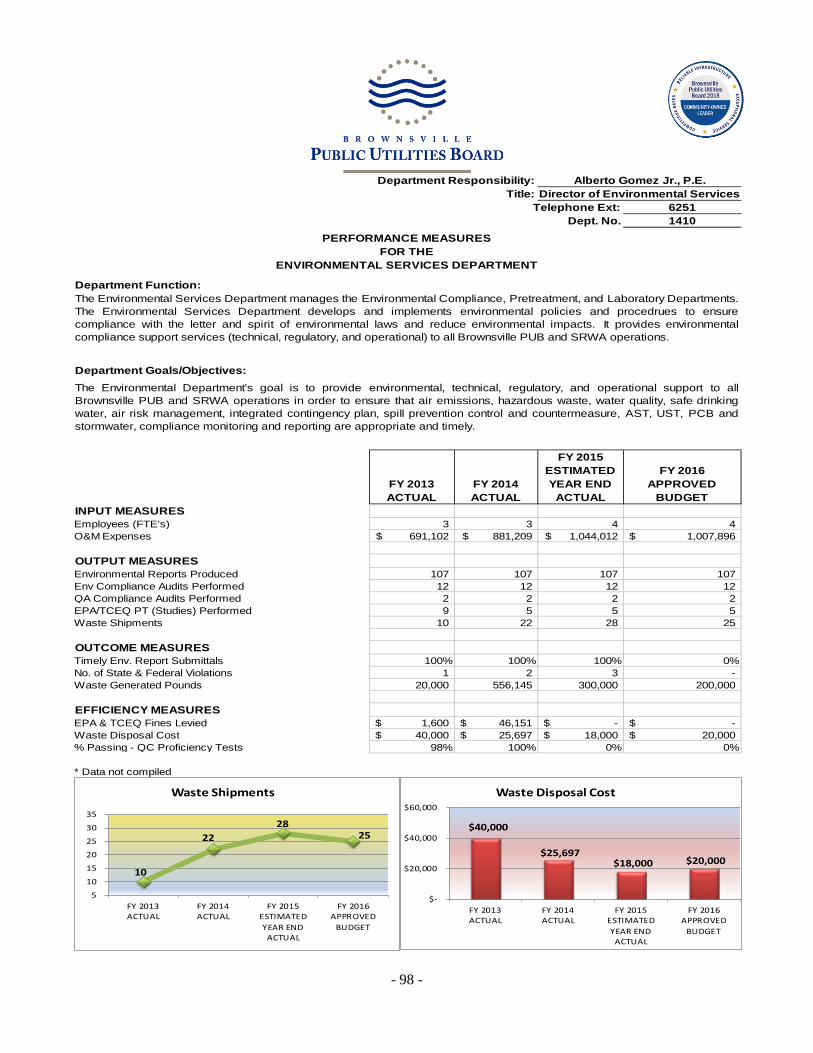
- 98 -
Department Responsibility:
Title: Director of Environmental ServicesTelephone Ext: 6251
Dept. No. 1410PERFORMANCE MEASURES
FOR THEENVIRONMENTAL SERVICES DEPARTMENT
Department Function:
Department Goals/Objectives:
FY 2013 ACTUAL
FY 2014 ACTUAL
FY 2015 ESTIMATEDYEAR END
ACTUAL
FY 2016 APPROVED
BUDGETINPUT MEASURESEmployees (FTE's) 3 3 4 4 O&M Expenses 691,102$ 881,209$ 1,044,012$ 1,007,896$
OUTPUT MEASURES Environmental Reports Produced 107 107 107 107 Env Compliance Audits Performed 12 12 12 12 QA Compliance Audits Performed 2 2 2 2 EPA/TCEQ PT (Studies) Performed 9 5 5 5 Waste Shipments 10 22 28 25
OUTCOME MEASURESTimely Env. Report Submittals 100% 100% 100% 0%No. of State & Federal Violations 1 2 3 - Waste Generated Pounds 20,000 556,145 300,000 200,000
EPA & TCEQ Fines Levied 1,600$ 46,151$ -$ -$ Waste Disposal Cost 40,000$ 25,697$ 18,000$ 20,000$ % Passing - QC Proficiency Tests 98% 100% 0% 0%
* Data not compiled
Alberto Gomez Jr., P.E.
The Environmental Services Department manages the Environmental Compliance, Pretreatment, and Laboratory Departments.The Environmental Services Department develops and implements environmental policies and procedrues to ensurecompliance with the letter and spirit of environmental laws and reduce environmental impacts. It provides environmentalcompliance support services (technical, regulatory, and operational) to all Brownsville PUB and SRWA operations.
The Environmental Department's goal is to provide environmental, technical, regulatory, and operational support to allBrownsville PUB and SRWA operations in order to ensure that air emissions, hazardous waste, water quality, safe drinkingwater, air risk management, integrated contingency plan, spill prevention control and countermeasure, AST, UST, PCB andstormwater, compliance monitoring and reporting are appropriate and timely.
EFFICIENCY MEASURES
10
22 28
25
5
10
15
20
25
30
35
FY 2013ACTUAL
FY 2014ACTUAL
FY 2015ESTIMATEDYEAR END
ACTUAL
FY 2016APPROVED
BUDGET
Waste Shipments
$40,000
$25,697 $18,000 $20,000
$-
$20,000
$40,000
$60,000
FY 2013ACTUAL
FY 2014ACTUAL
FY 2015ESTIMATEDYEAR END
ACTUAL
FY 2016APPROVED
BUDGET
Waste Disposal Cost

- 99 -
DEPARTMENT 1410 - ENVIRONMENTAL SERVICES
ACCOUNTDESCRIPTION
ACTUAL FY2012
ACTUAL FY 2013
ACTUAL FY 2014
AMENDED BUDGETFY 2015
UNAUDITED YTD ACTUAL
SEPT. 2015
APPROVEDBUDGETFY 2016
O&M PERSONNEL6101 Supervision 101,191$ 133,096$ 111,760$ 114,015$ 114,292$ 120,016$ 6105 Administrative Staff 46,114 - 52,160 95,680 104,554 106,392 6110 Clerical staff 34,991 35,658 37,836 38,106 38,444 38,106 6130 Overtime 748 35 365 687 406 687 6201 T.M.R.S. 28,690 24,606 28,816 33,941 35,061 33,249 6205 F.I.C.A. 11,080 10,342 12,328 15,364 15,379 16,400 6210 Medicare 2,680 2,469 2,902 3,593 3,701 3,835 6214 Dental Insurance 822 697 805 1,195 1,074 1,210 6215 Hospitalization insurance 25,012 20,944 25,583 35,172 30,586 34,441 6220 Life Insurance 247 220 267 2,032 348 2,169 6221 Long Term Disability Insurance 487 438 532 867 691 926 6225 Workers Compensation 6,914 4,968 5,429 6,195 6,827 6,613 6230 Vacation leave (4,482) 3,565 2,154 2,990 (837) 4,397 6235 Sick leave (13,574) 8,689 7,797 3,295 4,679 4,833 6242 Auto Benefits 7,500 7,500 7,500 7,500 7,500 7,500 6243 Telephone Benefits 1,680 1,680 1,680 1,680 1,680 1,680 6260 Vacancy Savings - - - (17,287) - (18,168)
O&M PERSONNEL TOTAL 250,099 254,907 297,915 345,025 364,383 364,286
O&M NON-PERSONNEL7101 Advertising 7,585 1,121 2,826 1,500 6,784 2,000 7105 Books & periodicals 237 - 600 300 33 300 7110 Dues & memberships 1,234 1,385 1,168 1,600 1,807 1,600 7120 Office supplies 1,514 1,192 806 1,000 841 1,000 7125 Photo equipment/supplies 200 - - - - - 7130 Postage/shipping charges 599 983 2,176 1,000 2,578 1,500 7135 Telephone expenses - 128 - - - - 7140 Training expenses 2,953 3,719 5,416 - 4,242 4,535 7145 Travel expenses 9,122 6,479 6,530 - 7,441 10,000 7147 Mileage Reimbursement (InTownExp) - - - 200 - 200 7293 Chemicals - other - 8,094 20,944 29,000 22,226 23,000 7299 Other materials & supplies 1,211 3,677 595 5,000 1,925 2,500 7310 Federal, state, & local fees 286,293 259,929 349,857 381,128 344,612 401,000 7315 Food, meals, ice, water 1,111 930 1,528 1,500 1,428 500 7325 Rental of equip/storage/land 13,458 11,049 10,917 12,000 9,588 12,000 7415 Fuels & lubricants 4,674 5,034 3,686 2,000 2,333 2,000 7599 Maintenance / other - - - - 9,092 - 7601 Legal Fees 14,055 4,178 16,844 20,200 3,065 4,000 7620 Environmental consulting fees 20,200 2,515 4,875 50,000 64,719 25,000 7699 Other services 69,579 125,782 154,427 117,000 179,488 150,000 7806 Software licenses - new 1,036 - - - - - 7810 Laboratory equipment - - - - 17,300 - 7820 Office furniture & equipment 938 - 99 - 125 2,200 7899 Other minor tools & equipment - - - 275 - 275
O&M NON-PERSONNEL TOTAL 435,998 436,195 583,294 623,703 679,629 643,610 Total 686,097$ 691,102$ 881,209$ 968,728$ 1,044,012$ 1,007,896$
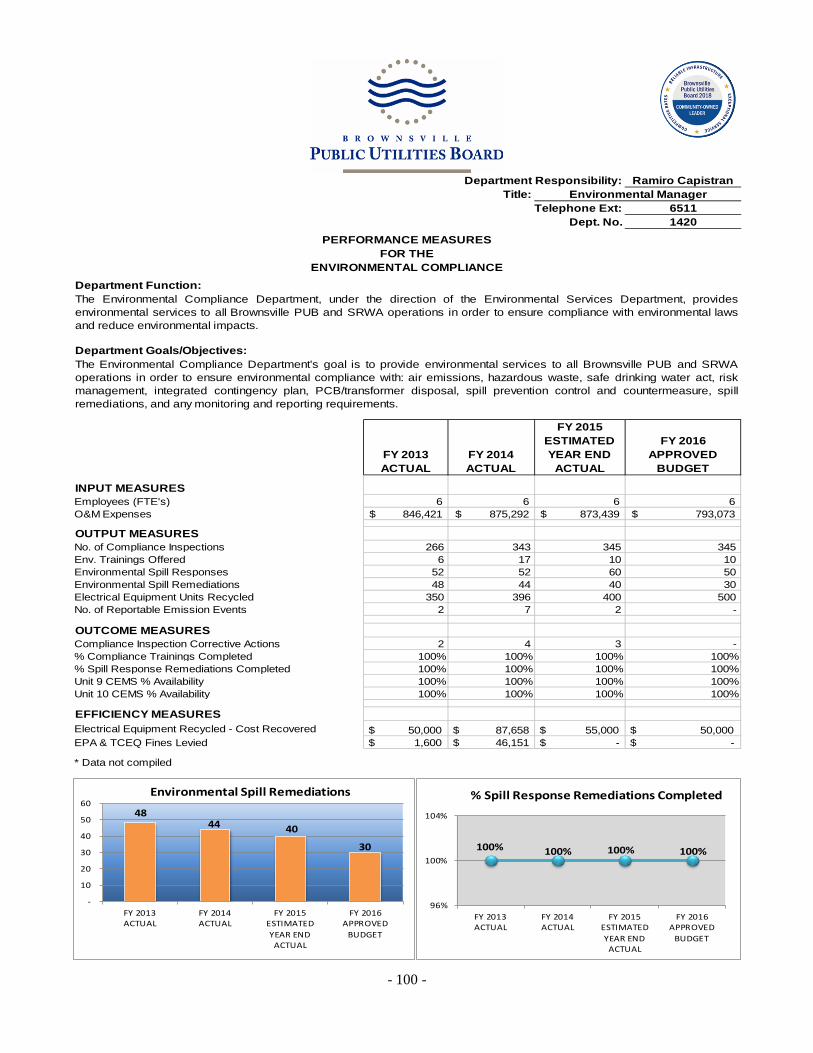
- 100 -
Department Responsibility: Ramiro Capistran
Title: Environmental ManagerTelephone Ext: 6511
Dept. No. 1420PERFORMANCE MEASURES
FOR THEENVIRONMENTAL COMPLIANCE
Department Function:
Department Goals/Objectives:
FY 2013 ACTUAL
FY 2014 ACTUAL
FY 2015 ESTIMATEDYEAR END
ACTUAL
FY 2016APPROVED
BUDGET
INPUT MEASURESEmployees (FTE's) 6 6 6 6 O&M Expenses 846,421$ 875,292$ 873,439$ 793,073$
OUTPUT MEASURES No. of Compliance Inspections 266 343 345 345 Env. Trainings Offered 6 17 10 10 Environmental Spill Responses 52 52 60 50 Environmental Spill Remediations 48 44 40 30 Electrical Equipment Units Recycled 350 396 400 500 No. of Reportable Emission Events 2 7 2 -
OUTCOME MEASURESCompliance Inspection Corrective Actions 2 4 3 - % Compliance Trainings Completed 100% 100% 100% 100%% Spill Response Remediations Completed 100% 100% 100% 100%Unit 9 CEMS % Availability 100% 100% 100% 100%Unit 10 CEMS % Availability 100% 100% 100% 100%
Electrical Equipment Recycled - Cost Recovered $ 50,000 $ 87,658 $ 55,000 $ 50,000 EPA & TCEQ Fines Levied $ 1,600 $ 46,151 $ - $ -
* Data not compiled
The Environmental Compliance Department, under the direction of the Environmental Services Department, providesenvironmental services to all Brownsville PUB and SRWA operations in order to ensure compliance with environmental lawsand reduce environmental impacts.
The Environmental Compliance Department's goal is to provide environmental services to all Brownsville PUB and SRWAoperations in order to ensure environmental compliance with: air emissions, hazardous waste, safe drinking water act, riskmanagement, integrated contingency plan, PCB/transformer disposal, spill prevention control and countermeasure, spillremediations, and any monitoring and reporting requirements.
EFFICIENCY MEASURES
48 44 40
30
-
10
20
30
40
50
60
FY 2013ACTUAL
FY 2014ACTUAL
FY 2015ESTIMATEDYEAR END
ACTUAL
FY 2016APPROVED
BUDGET
Environmental Spill Remediations
100% 100% 100% 100%
96%
100%
104%
FY 2013ACTUAL
FY 2014ACTUAL
FY 2015ESTIMATEDYEAR END
ACTUAL
FY 2016APPROVED
BUDGET
% Spill Response Remediations Completed
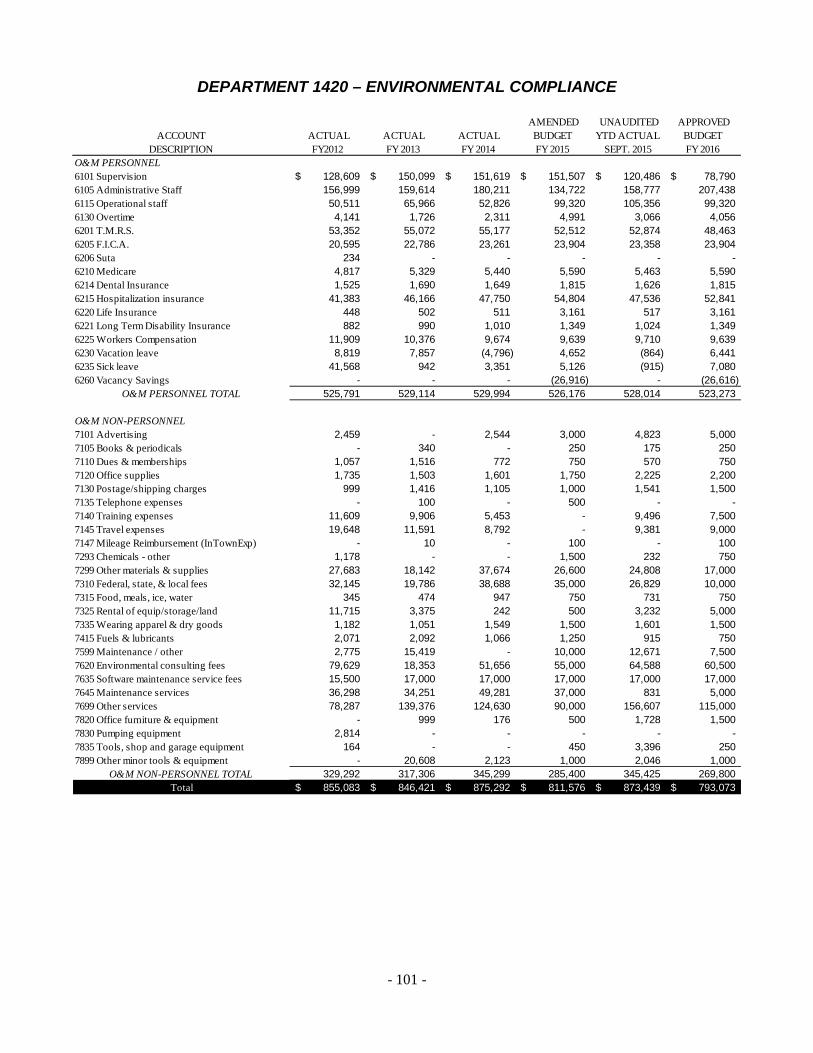
- 101 -
DEPARTMENT 1420 – ENVIRONMENTAL COMPLIANCE
ACCOUNTDESCRIPTION
ACTUAL FY2012
ACTUAL FY 2013
ACTUAL FY 2014
AMENDED BUDGETFY 2015
UNAUDITED YTD ACTUAL
SEPT. 2015
APPROVEDBUDGETFY 2016
O&M PERSONNEL6101 Supervision 128,609$ 150,099$ 151,619$ 151,507$ 120,486$ 78,790$ 6105 Administrative Staff 156,999 159,614 180,211 134,722 158,777 207,438 6115 Operational staff 50,511 65,966 52,826 99,320 105,356 99,320 6130 Overtime 4,141 1,726 2,311 4,991 3,066 4,056 6201 T.M.R.S. 53,352 55,072 55,177 52,512 52,874 48,463 6205 F.I.C.A. 20,595 22,786 23,261 23,904 23,358 23,904 6206 Suta 234 - - - - - 6210 Medicare 4,817 5,329 5,440 5,590 5,463 5,590 6214 Dental Insurance 1,525 1,690 1,649 1,815 1,626 1,815 6215 Hospitalization insurance 41,383 46,166 47,750 54,804 47,536 52,841 6220 Life Insurance 448 502 511 3,161 517 3,161 6221 Long Term Disability Insurance 882 990 1,010 1,349 1,024 1,349 6225 Workers Compensation 11,909 10,376 9,674 9,639 9,710 9,639 6230 Vacation leave 8,819 7,857 (4,796) 4,652 (864) 6,441 6235 Sick leave 41,568 942 3,351 5,126 (915) 7,080 6260 Vacancy Savings - - - (26,916) - (26,616)
O&M PERSONNEL TOTAL 525,791 529,114 529,994 526,176 528,014 523,273
O&M NON-PERSONNEL7101 Advertising 2,459 - 2,544 3,000 4,823 5,000 7105 Books & periodicals - 340 - 250 175 250 7110 Dues & memberships 1,057 1,516 772 750 570 750 7120 Office supplies 1,735 1,503 1,601 1,750 2,225 2,200 7130 Postage/shipping charges 999 1,416 1,105 1,000 1,541 1,500 7135 Telephone expenses - 100 - 500 - - 7140 Training expenses 11,609 9,906 5,453 - 9,496 7,500 7145 Travel expenses 19,648 11,591 8,792 - 9,381 9,000 7147 Mileage Reimbursement (InTownExp) - 10 - 100 - 100 7293 Chemicals - other 1,178 - - 1,500 232 750 7299 Other materials & supplies 27,683 18,142 37,674 26,600 24,808 17,000 7310 Federal, state, & local fees 32,145 19,786 38,688 35,000 26,829 10,000 7315 Food, meals, ice, water 345 474 947 750 731 750 7325 Rental of equip/storage/land 11,715 3,375 242 500 3,232 5,000 7335 Wearing apparel & dry goods 1,182 1,051 1,549 1,500 1,601 1,500 7415 Fuels & lubricants 2,071 2,092 1,066 1,250 915 750 7599 Maintenance / other 2,775 15,419 - 10,000 12,671 7,500 7620 Environmental consulting fees 79,629 18,353 51,656 55,000 64,588 60,500 7635 Software maintenance service fees 15,500 17,000 17,000 17,000 17,000 17,000 7645 Maintenance services 36,298 34,251 49,281 37,000 831 5,000 7699 Other services 78,287 139,376 124,630 90,000 156,607 115,000 7820 Office furniture & equipment - 999 176 500 1,728 1,500 7830 Pumping equipment 2,814 - - - - - 7835 Tools, shop and garage equipment 164 - - 450 3,396 250 7899 Other minor tools & equipment - 20,608 2,123 1,000 2,046 1,000
O&M NON-PERSONNEL TOTAL 329,292 317,306 345,299 285,400 345,425 269,800 Total 855,083$ 846,421$ 875,292$ 811,576$ 873,439$ 793,073$
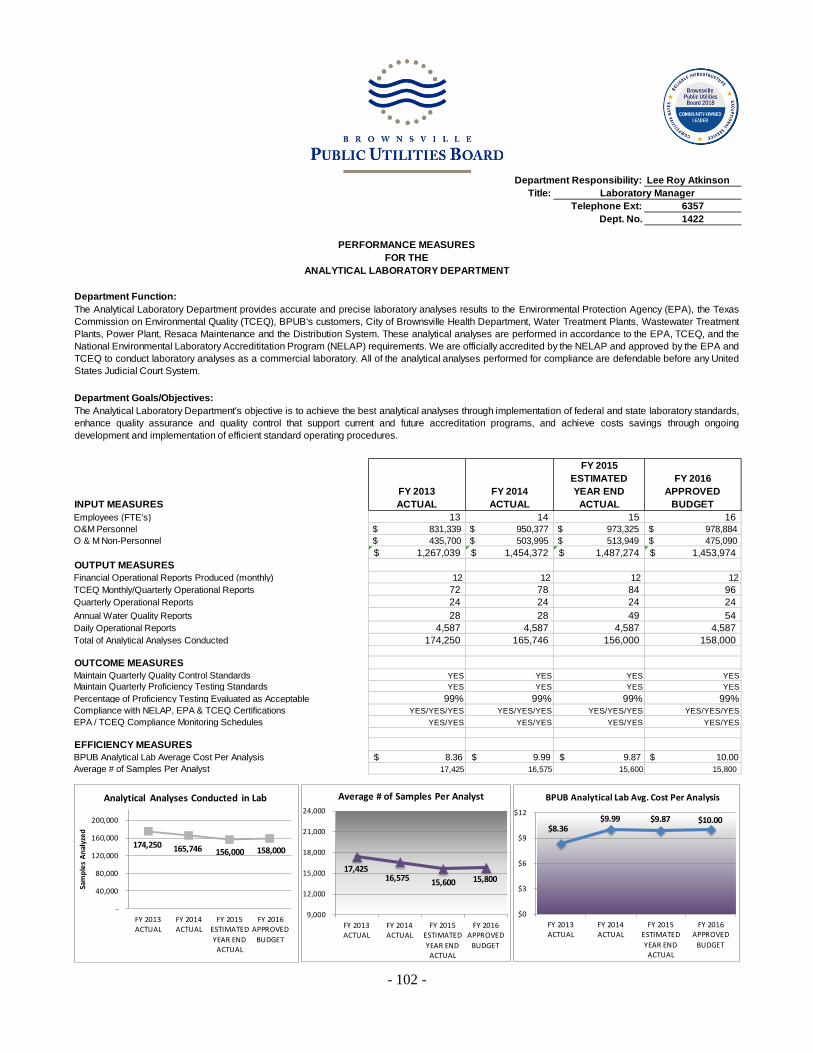
- 102 -
Department Responsibility: Lee Roy Atkinson
Title: Laboratory ManagerTelephone Ext: 6357
Dept. No. 1422
PERFORMANCE MEASURESFOR THE
ANALYTICAL LABORATORY DEPARTMENT
Department Function:
Department Goals/Objectives:
INPUT MEASURESFY 2013 ACTUAL
FY 2014 ACTUAL
FY 2015 ESTIMATEDYEAR END
ACTUAL
FY 2016 APPROVED
BUDGETEmployees (FTE's) 13 14 15 16 O&M Personnel $ 831,339 $ 950,377 $ 973,325 $ 978,884 O & M Non-Personnel $ 435,700 $ 503,995 $ 513,949 $ 475,090
1,267,039$ 1,454,372$ 1,487,274$ 1,453,974$ OUTPUT MEASURES
12 12 12 12 TCEQ Monthly/Quarterly Operational Reports 72 78 84 96 Quarterly Operational Reports 24 24 24 24 Annual Water Quality Reports 28 28 49 54 Daily Operational Reports 4,587 4,587 4,587 4,587 Total of Analytical Analyses Conducted 174,250 165,746 156,000 158,000
OUTCOME MEASURESMaintain Quarterly Quality Control Standards YES YES YES YES
YES YES YES YES 99% 99% 99% 99%
YES/YES/YES YES/YES/YES YES/YES/YES YES/YES/YESEPA / TCEQ Compliance Monitoring Schedules YES/YES YES/YES YES/YES YES/YES
EFFICIENCY MEASURESBPUB Analytical Lab Average Cost Per Analysis $ 8.36 $ 9.99 $ 9.87 $ 10.00 Average # of Samples Per Analyst 17,425 16,575 15,600 15,800
The Analytical Laboratory Department provides accurate and precise laboratory analyses results to the Environmental Protection Agency (EPA), the TexasCommission on Environmental Quality (TCEQ), BPUB's customers, City of Brownsville Health Department, Water Treatment Plants, Wastewater TreatmentPlants, Power Plant, Resaca Maintenance and the Distribution System. These analytical analyses are performed in accordance to the EPA, TCEQ, and theNational Environmental Laboratory Accredititation Program (NELAP) requirements. We are officially accredited by the NELAP and approved by the EPA andTCEQ to conduct laboratory analyses as a commercial laboratory. All of the analytical analyses performed for compliance are defendable before any UnitedStates Judicial Court System.
The Analytical Laboratory Department's objective is to achieve the best analytical analyses through implementation of federal and state laboratory standards,enhance quality assurance and quality control that support current and future accreditation programs, and achieve costs savings through ongoingdevelopment and implementation of efficient standard operating procedures.
Financial Operational Reports Produced (monthly)
Maintain Quarterly Proficiency Testing StandardsPercentage of Proficiency Testing Evaluated as AcceptableCompliance with NELAP, EPA & TCEQ Certifications
174,250 165,746 156,000 158,000
-
40,000
80,000
120,000
160,000
200,000
FY 2013ACTUAL
FY 2014ACTUAL
FY 2015ESTIMATEDYEAR END
ACTUAL
FY 2016APPROVED
BUDGET
Sam
ples
Ana
lyze
d
Analytical Analyses Conducted in Lab
$8.36 $9.99 $9.87 $10.00
$0
$3
$6
$9
$12
FY 2013ACTUAL
FY 2014ACTUAL
FY 2015ESTIMATEDYEAR END
ACTUAL
FY 2016APPROVED
BUDGET
BPUB Analytical Lab Avg. Cost Per Analysis
17,425 16,575 15,600 15,800
9,000
12,000
15,000
18,000
21,000
24,000
FY 2013ACTUAL
FY 2014ACTUAL
FY 2015ESTIMATEDYEAR END
ACTUAL
FY 2016APPROVED
BUDGET
Average # of Samples Per Analyst

- 103 -
DEPARTMENT 1422 - ANALYTICAL LABORATORY
ACCOUNTDESCRIPTION
ACTUAL FY2012
ACTUAL FY 2013
ACTUAL FY 2014
AMENDED BUDGETFY 2015
UNAUDITED YTD ACTUAL
SEPT. 2015
APPROVEDBUDGETFY 2016
O&M PERSONNEL6101 Supervision 116,776$ 120,150$ 126,589$ 128,170$ 128,663$ 128,170$ 6105 Administrative Staff 46,069 24,634 81,208 48,984 92,728 131,664 6110 Clerical staff 32,676 33,352 33,269 33,197 33,616 33,197 6115 Operational staff 386,229 379,084 380,776 461,864 391,754 379,184 6130 Overtime 69,094 14,461 41,111 39,115 34,916 32,063 6201 T.M.R.S. 101,816 86,283 94,515 91,697 92,776 84,499 6205 F.I.C.A. 38,705 35,347 39,631 41,677 40,191 41,677 6210 Medicare 9,052 8,267 9,269 9,747 9,400 9,747 6214 Dental Insurance 3,756 3,567 3,932 4,840 4,092 4,840 6215 Hospitalization insurance 108,437 93,814 101,015 128,442 113,182 133,051 6220 Life Insurance 789 764 844 5,512 890 5,512 6221 Long Term Disability Insurance 1,500 1,459 1,605 2,353 1,693 2,353 6225 Workers Compensation 22,781 16,549 16,653 16,805 17,132 16,805 6230 Vacation leave (102) 8,987 6,973 8,112 1,310 11,745 6235 Sick leave 8,224 2,795 9,843 8,938 7,379 12,910 6240 Educational assistance - 1,825 3,144 8,700 3,603 - 6260 Vacancy Savings - - - (48,661) - (48,535)
O&M PERSONNEL TOTAL 945,804 831,339 950,377 989,493 973,325 978,884
O&M NON-PERSONNEL7105 Books & periodicals 1,632 556 - 1,200 - 350 7110 Dues & memberships 1,297 1,885 1,700 1,500 1,632 1,500 7120 Office supplies 5,303 6,555 3,798 5,500 3,862 4,000 7130 Postage/shipping charges 10,090 6,447 4,677 5,000 8,757 4,700 7135 Telephone expenses - 800 - 480 - - 7140 Training expenses 8,080 4,162 5,324 - 4,730 5,870 7145 Travel expenses 8,422 5,091 7,472 - 6,210 5,000 7180 Utilities - departmental 38,159 37,186 47,565 65,000 52,869 45,000 7215 Laundry & janitorial supplies 33 709 - 800 34 800 7225 Safety supplies 214 303 495 1,100 396 600 7293 Chemicals - other 100,989 120,945 76,932 78,000 83,562 78,000 7299 Other materials & supplies 48,707 38,113 34,901 51,900 42,394 41,900 7310 Federal, state, & local fees 2,281 3,050 3,050 3,525 3,050 3,525 7315 Food, meals, ice, water 586 726 1,114 1,000 923 700 7325 Rental of equip/storage/land 19,107 19,605 22,916 22,475 20,733 20,545 7335 Wearing apparel & dry goods 3,752 3,707 3,531 2,500 5,791 4,100 7415 Fuels & lubricants 6,566 6,385 5,479 5,500 3,989 4,000 7501 Maint. of buildings & structures - 5,093 3,486 5,750 - 30,000 7605 Engineering fees 2,551 - - - - - 7645 Maintenance services 36,503 55,796 140,695 132,500 122,462 100,000 7699 Other services 78,485 106,825 94,079 100,000 124,894 95,000 7801 Communication equipment 424 - - - - - 7805 Computer equipment 4,635 115 - - - - 7806 Software licenses - new - - 7,274 26,000 2,021 5,000 7810 Laboratory equipment 15,362 11,646 37,613 22,000 25,012 22,000 7820 Office furniture & equipment 1,734 - 907 - 266 - 7899 Other minor tools & equipment 5,399 - 986 4,500 361 2,500
O&M NON-PERSONNEL TOTAL 400,313 435,700 503,995 536,230 513,949 475,090 Total 1,346,116$ 1,267,040$ 1,454,372$ 1,525,723$ 1,487,274$ 1,453,974$
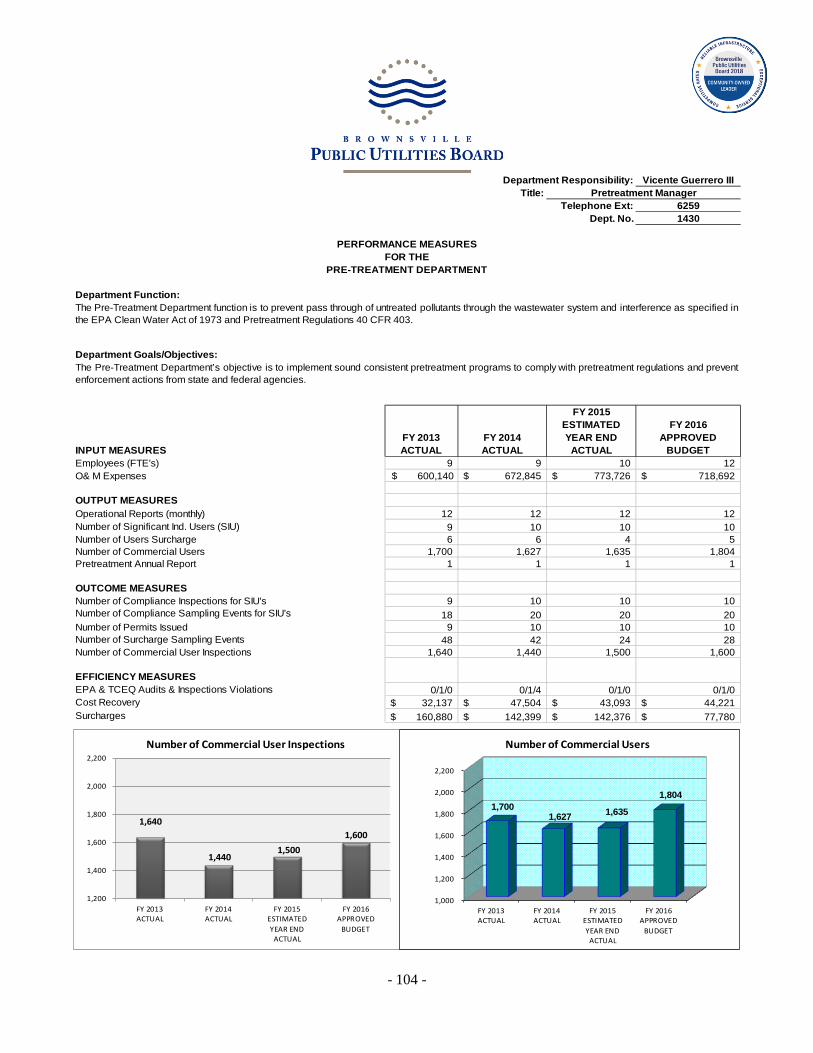
- 104 -
Department Responsibility: Vicente Guerrero IIITitle: Pretreatment Manager
Telephone Ext: 6259Dept. No. 1430
PERFORMANCE MEASURESFOR THE
PRE-TREATMENT DEPARTMENT
Department Function:
Department Goals/Objectives:
INPUT MEASURESFY 2013 ACTUAL
FY 2014 ACTUAL
FY 2015 ESTIMATEDYEAR END
ACTUAL
FY 2016APPROVED
BUDGETEmployees (FTE's) 9 9 10 12 O& M Expenses $ 600,140 672,845$ 773,726$ 718,692$
OUTPUT MEASURES Operational Reports (monthly) 12 12 12 12 Number of Significant Ind. Users (SIU) 9 10 10 10 Number of Users Surcharge 6 6 4 5 Number of Commercial Users 1,700 1,627 1,635 1,804 Pretreatment Annual Report 1 1 1 1
OUTCOME MEASURESNumber of Compliance Inspections for SIU's 9 10 10 10 Number of Compliance Sampling Events for SIU's 18 20 20 20 Number of Permits Issued 9 10 10 10 Number of Surcharge Sampling Events 48 42 24 28 Number of Commercial User Inspections 1,640 1,440 1,500 1,600
EPA & TCEQ Audits & Inspections Violations 0/1/0 0/1/4 0/1/0 0/1/0Cost Recovery 32,137$ 47,504$ 43,093$ 44,221$ Surcharges 160,880$ 142,399$ 142,376$ 77,780$
The Pre-Treatment Department function is to prevent pass through of untreated pollutants through the wastewater system and interference as specified inthe EPA Clean Water Act of 1973 and Pretreatment Regulations 40 CFR 403.
The Pre-Treatment Department’s objective is to implement sound consistent pretreatment programs to comply with pretreatment regulations and preventenforcement actions from state and federal agencies.
EFFICIENCY MEASURES
1,640
1,440 1,500
1,600
1,200
1,400
1,600
1,800
2,000
2,200
FY 2013ACTUAL
FY 2014ACTUAL
FY 2015ESTIMATEDYEAR END
ACTUAL
FY 2016APPROVED
BUDGET
Number of Commercial User Inspections
1,000
1,200
1,400
1,600
1,800
2,000
2,200
FY 2013ACTUAL
FY 2014ACTUAL
FY 2015ESTIMATEDYEAR END
ACTUAL
FY 2016APPROVED
BUDGET
1,700 1,627 1,635
1,804
Number of Commercial Users

- 105 -
DEPARTMENT 1430 – PRE-TREATMENT
ACCOUNTDESCRIPTION
ACTUAL FY2012
ACTUAL FY 2013
ACTUAL FY 2014
AMENDED BUDGETFY 2015
UNAUDITED YTD ACTUAL
SEPT. 2015
APPROVEDBUDGETFY 2016
O&M PERSONNEL6101 Supervision 42,057$ 74,382$ 78,624$ 79,685$ 79,991$ 79,685$ 6105 Administrative Staff 103,224 122,083 156,060 200,907 211,224 200,907 6110 Clerical staff 26,055 26,696 27,877 28,205 28,501 28,205 6115 Operational staff 111,331 104,638 126,737 143,811 153,100 143,811 6130 Overtime 3,888 795 3,887 18,221 8,077 5,277 6201 T.M.R.S. 47,793 47,937 56,570 61,645 65,413 56,893 6205 F.I.C.A. 18,281 19,732 23,757 28,062 28,538 28,062 6210 Medicare 4,275 4,615 5,556 6,563 6,674 6,563 6214 Dental Insurance 2,151 2,303 2,441 3,025 2,837 3,025 6215 Hospitalization insurance 51,544 55,010 60,035 78,329 73,424 78,144 6220 Life Insurance 405 465 537 3,711 656 3,711 6221 Long Term Disability Insurance 750 867 1,014 1,584 1,248 1,584 6225 Workers Compensation 10,556 8,999 9,925 11,315 12,023 11,315 6230 Vacation leave (4,157) 4,183 4,153 5,462 5,863 7,767 6235 Sick leave (6,218) 13,003 6,518 6,018 3,621 8,537 6260 Vacancy Savings - - - (32,342) - (32,095)
O&M PERSONNEL TOTAL 411,937 485,705 563,692 644,202 681,189 631,392
O&M NON-PERSONNEL7105 Books & periodicals 413 667 522 500 424 500 7110 Dues & memberships 310 450 637 1,000 966 1,000 7120 Office supplies 2,400 2,189 2,561 3,000 2,638 2,000 7130 Postage/shipping charges 382 212 207 300 299 500 7135 Telephone expenses - - - 500 - - 7140 Training expenses 2,100 1,875 4,550 - 6,991 5,000 7145 Travel expenses 3,334 5,361 7,599 - 5,846 4,200 7147 Mileage Reimbursement (InTownExp) - - - - 10 250 7215 Laundry & janitorial supplies 406 236 415 300 299 450 7225 Safety supplies 928 52 826 650 643 600 7293 Chemicals - other 596 635 488 600 888 600 7299 Other materials & supplies 5,120 6,232 7,052 7,700 8,485 6,000 7315 Food, meals, ice, water 419 544 579 600 1,039 1,000 7325 Rental of equip/storage/land 2,910 4,499 5,088 5,200 4,785 4,000 7335 Wearing apparel & dry goods 2,081 2,518 2,027 2,100 1,507 1,700 7415 Fuels & lubricants 8,072 7,617 6,535 6,500 3,793 4,000 7501 Maint. of buildings & structures - 38,149 12,286 5,000 13,350 2,500 7635 Software maintenance service fees 1,398 1,398 1,719 16,800 2,660 10,000 7645 Maintenance services 5,302 6,171 6,327 6,700 5,320 6,000 7699 Other services 48,280 33,773 40,461 40,000 32,594 35,000 7820 Office furniture & equipment 575 1,238 921 2,500 - 2,000 7899 Other minor tools & equipment 2,695 619 8,353 - - -
O&M NON-PERSONNEL TOTAL 87,721 114,435 109,153 99,950 92,537 87,300 Total 499,658$ 600,140$ 672,845$ 744,152$ 773,726$ 718,692$

- 106 -
Department Responsibility: Jo Anna Tijerina
Title: Risk & Safety ManagerTelephone Ext: 6257
Dept. No. 1440PERFORMANCE MEASURES
FOR THEHEALTH & SAFETY DEPARTMENT
Department Function:
Department Goals/Objectives:
FY 2013 ACTUAL
FY 2014 ACTUAL
FY 2015 ESTIMATEDYEAR END
ACTUAL
FY 2016APPROVED
BUDGETINPUT MEASURESEmployees (FTE) 6 6 6 6 O&M Expenses 757,114$ 1,012,000$ 1,018,369$ 1,022,493$
OUTPUT MEASURES BPUB Injury/Illness Loss Report 12 12 12 12 Workers Compensation Claim Report 12 12 12 12 Safety Training Reports 12 12 12 12 Crew Visit Inspections 200 180* 250 500 Number of Training Sessions Held 119 138 140 150
OUTPUT MEASURESMaintain Monthly Count of Incidents by Department Yes Yes yes yesMaintain Monthly Tally of Cost Per Injury Yes Yes yes yesTrack % of Timeliness of Reporting 95% 95% 98% 100%Number of Employees Provided Training 1,735 1,214 1,755 1,825 Total Number of Training Hours 5,464 5,566 5,600 6,000
Avg. # of Claims Per Month 4.83 4.44 4.30 5.50 Avg. Cost of Claim 2,668$ 3,259$ 3,150$ 5,643$ # of Work Related Injuries Per Year 58 52 50 44 Lost Time Accident/Incident Rate 3.50 3.70 3.50 4.28 Cost of Training Hour 11.16 10.98 10.50 9.98 Cost per Employee Attendee 35.15 32.75 31.33 30.58
*No Crew Visit Conduct May-July, 2014
The function of the Health & Safety Department is to provide a safe and healthful work environment for Brownsville PUB employees byplanning, developing, managing, and implementing safety and health programs in accordance with local, state, and federal standards.
The Health and Safety Department's objective is to be proactive and identify potential hazards and mediate them before the employee isinjured. To properly train and educate the employees of the importance of safety equipment and safety procedures in order to maintain a safeworking environment. If an injury is sustained, then the Health and Safety Department must make sure that the injured employee is given thebest medical care available and enable the injured employee to return to work within a timely manner.
EFFICIENCY MEASURES
4.83 4.44
4.30 5.50
-
5.00
10.00
15.00
20.00
FY 2013ACTUAL
FY 2014ACTUAL
FY 2015ESTIMATEDYEAR ENDACTUAL
FY 2016APPROVED
BUDGET
Avg. # of Claims Per Month
58 52
50 44
-
50
100
150
200
FY 2013ACTUAL
FY 2014ACTUAL
FY 2015ESTIMATEDYEAR END
ACTUAL
FY 2016APPROVED
BUDGET
# of Work Related Injuries Per Month
4.83 4.44 4.30
5.50
-
2.00
4.00
6.00
8.00
10.00Avg. # of Claims Per Month
FY2012 ACTUAL
FY2013 ACTUAL
FY2014 ESTIMATED YEAR END
ACTUAL
FY2015 PROPOSED
BUDGET
$2,668 $3,259 $3,150
$5,643
$1,000
$3,000
$5,000
$7,000
Avg. Cost of Claim
FY2012 ACTUAL
FY2013 ACTUAL
FY2014 ESTIMATED YEAR END
ACTUAL
FY2015 PROPOSED
BUDGET
58 52 50 44
-
50
100
150
200
# of Work Related Injuries Per Year
FY2012 ACTUAL
FY2013 ACTUAL
FY2014 ESTIMATED YEAR END
ACTUAL
FY2015 PROPOSED
BUDGET
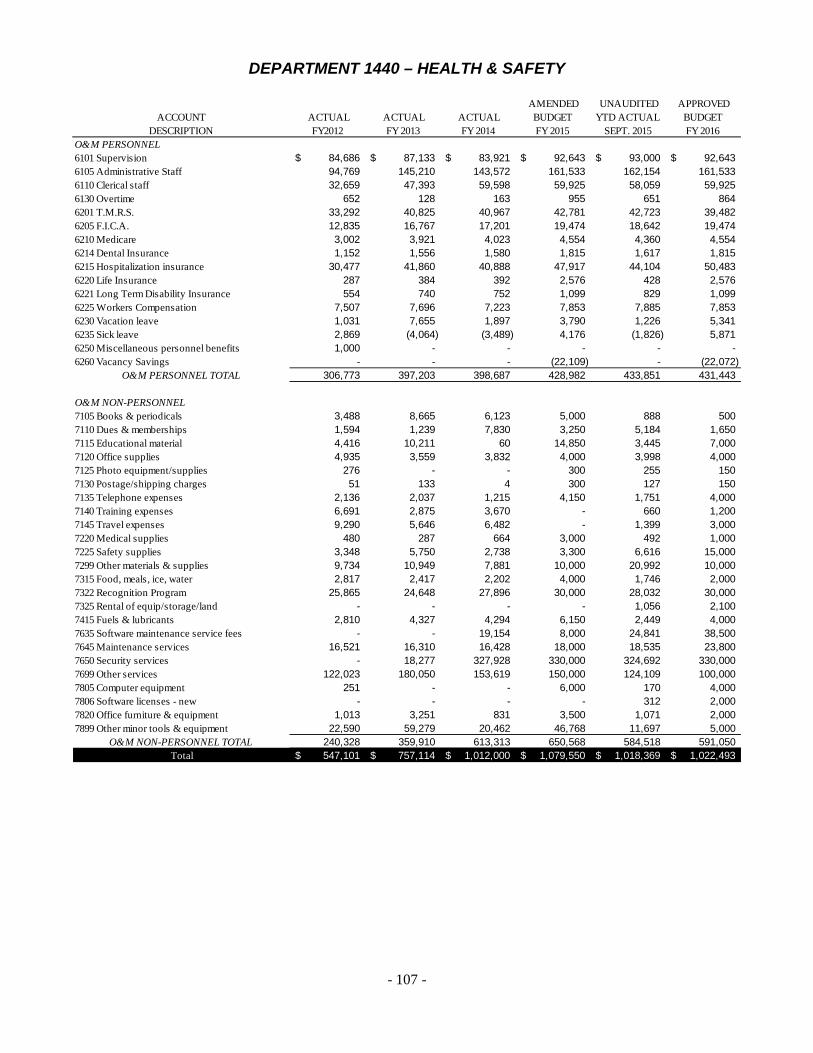
- 107 -
DEPARTMENT 1440 – HEALTH & SAFETY
ACCOUNTDESCRIPTION
ACTUAL FY2012
ACTUAL FY 2013
ACTUAL FY 2014
AMENDED BUDGETFY 2015
UNAUDITED YTD ACTUAL
SEPT. 2015
APPROVEDBUDGETFY 2016
O&M PERSONNEL6101 Supervision 84,686$ 87,133$ 83,921$ 92,643$ 93,000$ 92,643$ 6105 Administrative Staff 94,769 145,210 143,572 161,533 162,154 161,533 6110 Clerical staff 32,659 47,393 59,598 59,925 58,059 59,925 6130 Overtime 652 128 163 955 651 864 6201 T.M.R.S. 33,292 40,825 40,967 42,781 42,723 39,482 6205 F.I.C.A. 12,835 16,767 17,201 19,474 18,642 19,474 6210 Medicare 3,002 3,921 4,023 4,554 4,360 4,554 6214 Dental Insurance 1,152 1,556 1,580 1,815 1,617 1,815 6215 Hospitalization insurance 30,477 41,860 40,888 47,917 44,104 50,483 6220 Life Insurance 287 384 392 2,576 428 2,576 6221 Long Term Disability Insurance 554 740 752 1,099 829 1,099 6225 Workers Compensation 7,507 7,696 7,223 7,853 7,885 7,853 6230 Vacation leave 1,031 7,655 1,897 3,790 1,226 5,341 6235 Sick leave 2,869 (4,064) (3,489) 4,176 (1,826) 5,871 6250 Miscellaneous personnel benefits 1,000 - - - - - 6260 Vacancy Savings - - - (22,109) - (22,072)
O&M PERSONNEL TOTAL 306,773 397,203 398,687 428,982 433,851 431,443
O&M NON-PERSONNEL7105 Books & periodicals 3,488 8,665 6,123 5,000 888 500 7110 Dues & memberships 1,594 1,239 7,830 3,250 5,184 1,650 7115 Educational material 4,416 10,211 60 14,850 3,445 7,000 7120 Office supplies 4,935 3,559 3,832 4,000 3,998 4,000 7125 Photo equipment/supplies 276 - - 300 255 150 7130 Postage/shipping charges 51 133 4 300 127 150 7135 Telephone expenses 2,136 2,037 1,215 4,150 1,751 4,000 7140 Training expenses 6,691 2,875 3,670 - 660 1,200 7145 Travel expenses 9,290 5,646 6,482 - 1,399 3,000 7220 Medical supplies 480 287 664 3,000 492 1,000 7225 Safety supplies 3,348 5,750 2,738 3,300 6,616 15,000 7299 Other materials & supplies 9,734 10,949 7,881 10,000 20,992 10,000 7315 Food, meals, ice, water 2,817 2,417 2,202 4,000 1,746 2,000 7322 Recognition Program 25,865 24,648 27,896 30,000 28,032 30,000 7325 Rental of equip/storage/land - - - - 1,056 2,100 7415 Fuels & lubricants 2,810 4,327 4,294 6,150 2,449 4,000 7635 Software maintenance service fees - - 19,154 8,000 24,841 38,500 7645 Maintenance services 16,521 16,310 16,428 18,000 18,535 23,800 7650 Security services - 18,277 327,928 330,000 324,692 330,000 7699 Other services 122,023 180,050 153,619 150,000 124,109 100,000 7805 Computer equipment 251 - - 6,000 170 4,000 7806 Software licenses - new - - - - 312 2,000 7820 Office furniture & equipment 1,013 3,251 831 3,500 1,071 2,000 7899 Other minor tools & equipment 22,590 59,279 20,462 46,768 11,697 5,000
O&M NON-PERSONNEL TOTAL 240,328 359,910 613,313 650,568 584,518 591,050 Total 547,101$ 757,114$ 1,012,000$ 1,079,550$ 1,018,369$ 1,022,493$

- 108 -
Department Responsibility: James McCann
Title: Director of Trans, Dist, Subst&PlanTelephone Ext: 6204
Dept. No. 2110
TRANSMISSION, DISTRIBUTION, SUBSTATIONS AND PLANNING DEPARTMENT
Department Function:
Department Goals/Objectives:
PERFORMANCE MEASURESFOR THE
Plan, organize, and direct the iniatives,and strategies of the Division's business operations. Coordinate with assigned staff for the execution of strategies and business operations to otimize the allocation of resources.
Developing, implementing, managing, and communicating effecitve excecution of operational strategies, processes, and programs for Transmssion, Distribution, Substations, and Electric Engineering.
ACCOUNTDESCRIPTION
ACTUAL FY2012
ACTUAL FY 2013
ACTUAL FY 2014
AMENDED BUDGETFY 2015
UNAUDITED YTD ACTUAL
SEPT. 2015
APPROVEDBUDGETFY 2016
O&M PERSONNEL6101 Supervision -$ -$ 52,233$ 140,005$ 140,543$ 140,005$ 6201 T.M.R.S. - - 7,407 19,069 19,129 17,599 6205 F.I.C.A. - - 3,398 8,680 7,379 8,680 6210 Medicare - - 802 2,030 2,155 2,030 6214 Dental Insurance - - 99 303 273 303 6215 Hospitalization insurance - - 3,391 10,648 9,262 10,233 6220 Life Insurance - - 59 1,148 178 1,148 6221 Long Term Disability Insurance - - 124 490 372 490 6225 Workers Compensation - - 1,394 3,500 3,743 3,500 6230 Vacation leave - - 5,385 1,689 538 2,226 6235 Sick leave - - 48,463 1,861 - 2,447 6242 Auto Benefits - - 2,885 7,500 7,500 7,500 6243 Telephone Benefits - - 646 1,680 1,680 1,680 6260 Vacancy Savings - - - (9,294) - (9,199)
O&M PERSONNEL TOTAL - - 126,285 189,309 192,753 188,641
O&M NON-PERSONNEL7105 Books & periodicals - - - - 71 - 7110 Dues & memberships - - 240 900 784 900 7120 Office supplies - - 144 1,000 144 500 7130 Postage/shipping charges - - - 300 - 250 7140 Training expenses - - - - - 1,170 7145 Travel expenses - - - - 84 3,755 7225 Safety supplies - - - 100 - 50 7299 Other materials & supplies - - - 325 360 400 7315 Food, meals, ice, water - - - 200 29 75 7635 Software maintenance service fees - - - - 795 - 7699 Other services - - - 60 - 60 7801 Communication equipment - - 320 - - - 7805 Computer equipment - - - - 80 200 7806 Software licenses - new - - - 1,000 800 1,000 7899 Other minor tools & equipment - - 61 - - -
O&M NON-PERSONNEL TOTAL - - 765 3,885 3,147 8,360 Total -$ -$ 127,050$ 193,194$ 195,900$ 197,001$

- 109 -
THIS PAGE INTENTIONALLY LEFT BLANK

- 110 -
Department Responsibility: Arnulfo Mejia
Title: Substations & Relaying ManagerTelephone Ext: 6327
Dept. No. 2120
PERFORMANCE MEASURESFOR THE
SUBSTATIONS & RELAYING DEPARTMENT
Department Function:
Department Goals/Objectives:
FY 2013 ACTUAL
FY 2014 ACTUAL
FY 2015 ESTIMATEDYEAR END
ACTUAL
FY 2016APPROVED
BUDGET
INPUT MEASURESEmployees (FTEs) 11 11 11 12 Necessary Employees 11 11 11 12 O&M Expenditures 948,319$ 1,026,105$ 1,069,806$ 1,114,782$ No. of Substations 14 14 14 14 Total Power-Transformers Capacity (MVA) 616 644 672 644
OUTPUT MEASURES Power Transformers, Test & Maintenance 6 6 6 6 138 KV Breakers, Test & Maintenance 6 10 14 10 12.5 KV Breakers, Test & Maintenance 4 16 31 30
OUTCOME MEASURESComply With ERCOT, NERC Yes Yes YES YESMonthly Substation Inspections Yes Yes YES YESBattery Banks Inspection & Maintenance Yes Yes YES YESRelay Testing and Documentation (comply with PRC-005-1b) Yes Yes YES YESCollect Fault Data and Evaluate System Grid Integrity Yes Yes YES YES
Outages in Substations 6% 3% 3% 3%Optimization of Existing Transmission Lines
50% 50% 50% 50%NERC Audits Violations 0 0% 0% 0%Maintenance Reports 100% 100% 100% 100%
The function of the Substation & Relaying Department is the daily operation, maintenance, and attention to any emergencies inthe Substations.
The goal for the Substation & Relaying Department is to be the leader in providing reliable means of power transmission anddistribution by maintaining all substation instrumentation and equipment in good working condition.
EFFICIENCY MEASURES
6%
3% 3% 3%
0%
2%
4%
6%
8%
10%
FY 2013ACTUAL
FY 2014ACTUAL
FY 2015ESTIMATEDYEAR END
ACTUAL
FY 2016APPROVED
BUDGET
Outages in Substations
0%
20%
40%
60%
FY 2013ACTUAL
FY 2014ACTUAL
FY 2015ESTIMATEDYEAR END
ACTUAL
FY 2016APPROVED
BUDGET
50% 50% 50% 50%
Optimization of Existing Transmission Lines

- 111 -
DEPARTMENT 2120 – SUBSTATIONS & RELAYING
ACCOUNTDESCRIPTION
ACTUAL FY2012
ACTUAL FY 2013
ACTUAL FY 2014
AMENDED BUDGETFY 2015
UNAUDITED YTD ACTUAL
SEPT. 2015
APPROVEDBUDGETFY 2016
O&M PERSONNEL6101 Supervision -$ 83,752$ 96,122$ 96,886$ 97,259$ 96,886$ 6115 Operational staff 271,205 321,585 407,328 459,826 467,610 459,826 6130 Overtime 27,387 8,760 9,467 18,797 20,468 21,047 6201 T.M.R.S. 46,936 62,526 73,100 75,824 79,667 69,979 6205 F.I.C.A. 17,809 25,728 30,832 34,516 35,163 34,516 6210 Medicare 4,165 6,017 7,211 8,072 8,224 8,072 6214 Dental Insurance 1,858 2,234 2,808 3,630 3,269 3,630 6215 Hospitalization insurance 51,859 61,690 73,373 97,430 84,967 94,186 6220 Life Insurance 365 543 672 4,565 766 4,565 6221 Long Term Disability Insurance 697 1,063 1,304 1,949 1,478 1,949 6225 Workers Compensation 10,495 11,677 12,840 13,918 14,650 13,918 6230 Vacation leave (4,890) 20,561 977 6,718 5,078 9,529 6235 Sick leave (25,969) 59,560 8,215 7,402 3,505 10,474 6260 Vacancy Savings - - - (39,831) - (39,376)
O&M PERSONNEL TOTAL 401,916 665,697 724,250 789,702 822,105 789,202
O&M NON-PERSONNEL7105 Books & periodicals - 290 226 500 196 100 7110 Dues & memberships - 466 464 400 289 400 7120 Office supplies 1,612 1,977 3,326 3,000 1,093 1,000 7130 Postage/shipping charges 383 795 273 500 605 700 7140 Training expenses 630 1,605 2,155 - 1,295 7,980 7145 Travel expenses 129 4,463 1,997 - 5,126 7,800 7180 Utilities - departmental 80,218 84,574 110,599 100,000 126,482 100,000 7190 Utilities - CP&L & Mvec - 626 792 - - 500 7190 Utilities - CP&L & Mvec - - - - 770 - 7215 Laundry & janitorial supplies 201 192 239 500 422 500 7225 Safety supplies - 551 4,078 4,200 4,668 4,500 7293 Chemicals - other 1,691 2,616 3,074 3,000 4,402 3,600 7299 Other materials & supplies 10,086 6,739 19,727 12,000 6,677 9,000 7315 Food, meals, ice, water 81 162 185 300 218 500 7325 Rental of equip/storage/land - 214 4,236 4,500 2,845 33,000 7335 Wearing apparel & dry goods 2,514 2,267 7,115 5,000 8,086 7,500 7415 Fuels & lubricants 15,596 14,797 17,233 13,000 14,018 13,000 7501 Maint. of buildings & structures - - 5,378 5,000 1,623 3,000 7505 Maint. of communication equipment - 308 5,153 1,500 1,195 2,000 7540 Maint. of line transformers - 8,979 35,043 15,000 12,967 35,000 7555 Maint. of station equipment 15,760 3,322 11,026 20,000 16,851 31,000 7565 Maint. of street lighting & signals - - 314 - - - 7645 Maintenance services 81,826 128,184 39,437 47,500 6,405 24,500 7699 Other services 1,808 2,009 250 10,000 11,226 15,000 7805 Computer equipment - 452 613 12,500 - 3,500 7806 Software licenses - new - - 3,650 - - - 7820 Office furniture & equipment - - 3,886 3,000 2,552 3,500 7835 Tools, shop and garage equipment 972 33 4,283 3,000 3,441 3,000 7899 Other minor tools & equipment 1,129 17,003 17,105 20,000 14,251 15,000
O&M NON-PERSONNEL TOTAL 214,636 282,622 301,856 284,400 247,701 325,580 Total 616,552$ 948,319$ 1,026,105$ 1,074,102$ 1,069,806$ 1,114,782$

- 112 -
Department Responsibility: Manuel Arredondo
Title: Electric Operations ManagerTelephone Ext: 6323
Dept. No. 2130PERFORMANCE MEASURES
FOR THEELECTRIC TRANSMISSION AND DISTRIBUTION NEW CONSTRUCTION DEPARTMENT
Department Function:
Department Goals/Objectives:
FY 2013ACTUAL
FY 2014 ACTUAL
FY 2015 ESTIMATEDYEAR END
ACTUAL
FY 2016APPROVED
BUDGETINPUT MEASURESBPUB Employees 29 29 32 31 Outside Staff 14 - - - O&M Expenses 1,676,647$ 1,215,946$ 1,226,171$ 1,347,951$
OUTPUT MEASURES Poles Installed 826 502 400 412 Transformer Set 92 110 97 99 Miles of Line Installed 7 18 8 13 Milies of Line Washed 420 - - - Secondary Pedestals 45 50 47 49 Poles Transfers Completed 107 204 112 116
OUTCOME MEASURESResidental Lots Connected 350 120 150 155 Commercial Lots Connected 150 50 63 65
EFFICIENCY MEASURES - Lots Connected by Crew 125 130 125 129
450
Responsible for the operation and construction of the electrical system in order to provide safe, timely, and reliable service.Also responsible for the transmission and distribution of electric power from the internal and external power sources to thecustomer.
Provide the best reliable and efficient power in the safest manner.
350
120 150 155 150
50 63 65
-
200
400
FY 2013ACTUAL
FY 2014ACTUAL
FY 2015ESTIMATEDYEAR ENDACTUAL
FY 2016APPROVED
BUDGET
Lots Connected
Residental Lots Connected Commercial Lots Connected
125
130
125
129
120
122
124
126
128
130
132
FY 2013ACTUAL
FY 2014ACTUAL
FY 2015ESTIMATEDYEAR ENDACTUAL
FY 2016APPROVED
BUDGET
Lots Connected by Crew

- 113 -
DEPARTMENT 2130 - ELECTRIC TRANSMISSION AND DISTRIBUTION NEW CONSTRUCTION
ACCOUNTDESCRIPTION
ACTUAL FY2012
ACTUAL FY 2013
ACTUAL FY 2014
AMENDED BUDGETFY 2015
UNAUDITED YTD ACTUAL
SEPT. 2015
APPROVEDBUDGETFY 2016
O&M PERSONNEL6101 Supervision 40,745$ 36,403$ 38,022$ 38,199$ 38,214$ 76,398$ 6110 Clerical staff 21,024 16,037 16,263 16,172 15,877 16,172 6115 Operational staff 579,016 696,685 533,567 390,231 571,978 619,349 6130 Overtime 93,135 40,733 41,678 57,443 38,971 51,020 6201 T.M.R.S. 114,397 116,865 89,655 60,697 90,665 89,491 6205 F.I.C.A. 43,072 47,828 36,965 27,540 39,007 44,139 6206 Suta 1,582 (160) - - - - 6210 Medicare 10,074 11,150 8,645 6,441 9,122 10,323 6214 Dental Insurance 4,486 4,890 3,584 3,297 3,749 5,264 6215 Hospitalization insurance 125,779 134,571 108,570 93,224 113,864 146,446 6220 Life Insurance 935 1,062 779 3,643 878 5,838 6221 Long Term Disability Insurance 1,759 2,010 1,484 1,555 1,680 2,492 6225 Workers Compensation 27,157 23,463 17,131 11,105 18,046 17,798 6230 Vacation leave (6,929) 8,096 1,886 5,340 1,862 12,508 6235 Sick leave 12,074 1,073 (811) 5,884 (12,615) 13,748 6240 Educational assistance 1,826 2,014 1,750 1,750 - - 6260 Vacancy Savings - - - (32,476) - (51,686)
O&M PERSONNEL TOTAL 1,070,132 1,142,719 899,167 690,044 931,297 1,059,301
O&M NON-PERSONNEL7105 Books & periodicals 191 - 293 300 703 350 7110 Dues & memberships 662 384 274 500 447 700 7120 Office supplies 2,437 2,406 3,464 3,000 1,554 3,000 7130 Postage/shipping charges 387 226 1,396 1,700 263 1,000 7140 Training expenses 1,295 - 55 - 3,100 3,000 7145 Travel expenses 2,918 (396) 431 - 1,126 1,000 7180 Utilities - departmental - 6,504 2,485 2,250 2,126 2,300 7201 Barricades & signs 418 - 215 500 - 500 7203 Sand, Caliche, Gravel, Concrete etc - 1,232 - 1,000 1,096 1,000 7205 Lamps, globes & flares 3,303 2,227 2,453 2,500 4,751 3,500 7210 Landscaping/Trade a Tree Program 70 - 12 200 - 200 7215 Laundry & janitorial supplies 8 - - - - - 7225 Safety supplies 9,956 4,398 13,891 10,000 15,709 12,000 7293 Chemicals - other 26 - - - - - 7299 Other materials & supplies 63,805 57,223 72,171 58,750 65,914 58,100 7315 Food, meals, ice, water 334 334 336 1,000 873 1,000 7325 Rental of equip/storage/land 8,598 51,095 16,743 10,000 19,297 25,000 7335 Wearing apparel & dry goods 9,733 9,158 20,752 20,000 26,137 20,000 7415 Fuels & lubricants 93,212 94,133 82,814 85,000 56,571 60,000 7501 Maint. of buildings & structures 822 - - - - - 7505 Maint. of communication equipment 462 879 - - - - 7520 Maint. of minor equipment - 1,796 - 2,000 - 2,000 7540 Maint. of line transformers 294,832 10,756 500 10,000 3,515 8,500 7550 Maint. of overhead lines 43,279 18,114 29,404 48,000 9,871 35,000 7565 Maint. of street lighting & signals 45,652 45,780 2,703 5,000 5,030 5,000 7570 Maint. of underground lines 35,433 171,665 - 10,000 5,054 6,000 7599 Maintenance / other - - 311 - 193 - 7699 Other services 13,111 14,524 17,865 20,000 12,565 10,000 7801 Communication equipment 1,021 7,066 13,900 2,500 276 1,000 7805 Computer equipment 147 - 711 1,000 914 1,000 7820 Office furniture & equipment 2,860 927 2,423 3,000 1,661 2,500 7835 Tools, shop and garage equipment 13,439 11,865 9,863 23,500 40,152 14,000 7899 Other minor tools & equipment 10,432 21,633 21,313 10,500 15,976 11,000
O&M NON-PERSONNEL TOTAL 658,845 533,929 316,779 332,200 294,874 288,650 Total 1,728,977$ 1,676,647$ 1,215,946$ 1,022,244$ 1,226,171$ 1,347,951$

- 114 -
Department Responsibility: Eli Alvarez
Title: Electric Operations ManagerTelephone Ext: 6234
Dept. No. 2140PERFORMANCE MEASURES
FOR THEELECTRIC TRANSMISSION AND DISTRIBUTION MAINTENANCE DEPARTMENT
Department Function:
Department Goals/Objectives:
FY 2013ACTUAL
FY 2014ACTUAL
FY 2015ESTIMATEDYEAR END
ACTUAL
FY 2016APPROVED
BUDGETINPUT MEASURESStaff 27 31 34 31 O&M Expenses 2,252,265$ 2,483,879$ 2,331,197$ 2,050,168$
OUTPUT MEASURES Street / Security Lights Repairs - 2400 2652 2,860 Electrical Inspections - 3200 5000 6,000 Set / Replace Transformers 310 144 173 190 Set / Replace Poles 170 130 150 190 Locate / Repair URD Faults 165 144 160 170 WOs Completed 240 300 300 General Service Request Closed 3360 4480 5,000
EFFICIENCY MEASURESInstall Street / Security Lights 130 144 180 190 New Connections 1445 1440 1500 1,800 Average Power Restoration Time per Outage (hrs.) 1.70 1.75 1.65 1.59Average time of Street Light Repair (Cal. Days) 16.0 4.0 3.0 3 Average time of Security Light Repair (Cal. Days) 10.0 5.0 3.0 3
The Electric Transmission & Distribution (T&D) Maintenance Department is responsible for the operation, construction, and maintenance of the electrical system in order to provide safe, timely, and reliable service. The department is also responsible for the transmission and distribution of electric power from internal and external power sources to the customer.
Maintain Brownsville PUB's electric infrastructure in good condition to provide quality and reliable power to the customers.
-
2400 2652 2,860
- 500
1,000 1,500 2,000 2,500 3,000 3,500
FY 2013ACTUAL
FY 2014ACTUAL
FY 2015ESTIMATEDYEAR END
ACTUAL
FY 2016APPROVED
BUDGET
Street / Security Lights Repairs
130 144
180 190
0
100
200
FY 2013ACTUAL
FY 2014ACTUAL
FY 2015ESTIMATEDYEAR END
ACTUAL
FY 2016APPROVED
BUDGET
Install Street / Security Lights
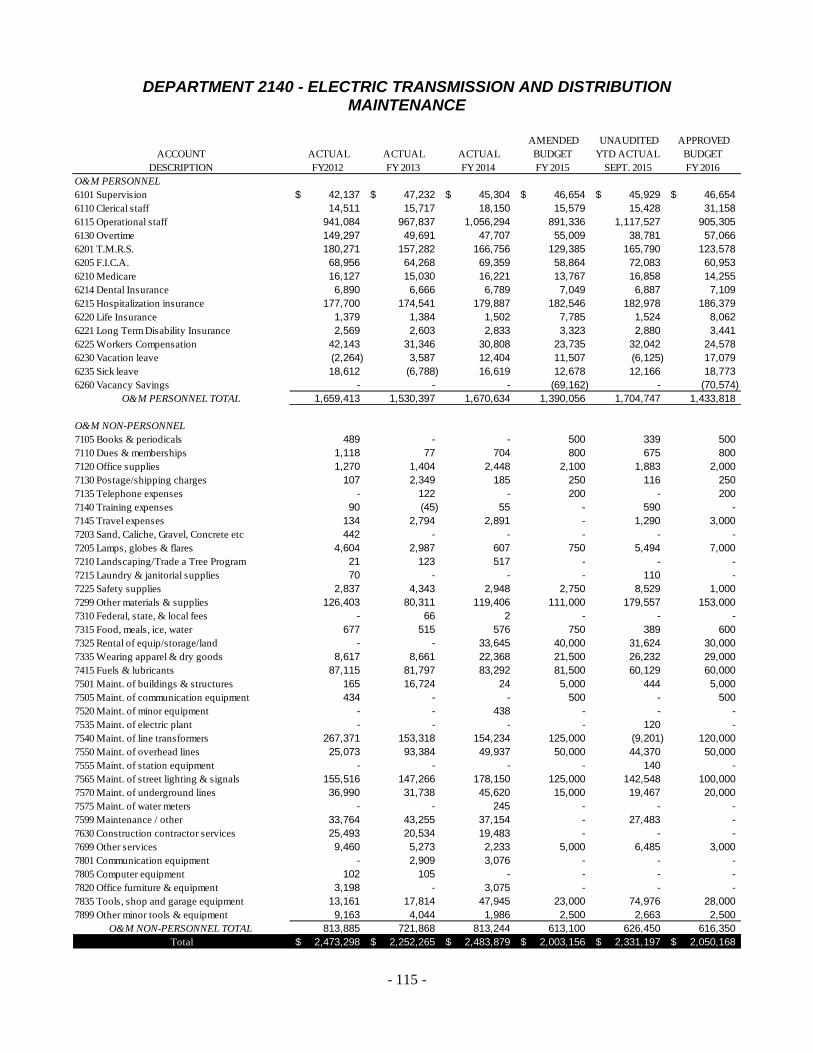
- 115 -
DEPARTMENT 2140 - ELECTRIC TRANSMISSION AND DISTRIBUTION
MAINTENANCE
ACCOUNTDESCRIPTION
ACTUAL FY2012
ACTUAL FY 2013
ACTUAL FY 2014
AMENDED BUDGETFY 2015
UNAUDITED YTD ACTUAL
SEPT. 2015
APPROVEDBUDGETFY 2016
O&M PERSONNEL6101 Supervision 42,137$ 47,232$ 45,304$ 46,654$ 45,929$ 46,654$ 6110 Clerical staff 14,511 15,717 18,150 15,579 15,428 31,158 6115 Operational staff 941,084 967,837 1,056,294 891,336 1,117,527 905,305 6130 Overtime 149,297 49,691 47,707 55,009 38,781 57,066 6201 T.M.R.S. 180,271 157,282 166,756 129,385 165,790 123,578 6205 F.I.C.A. 68,956 64,268 69,359 58,864 72,083 60,953 6210 Medicare 16,127 15,030 16,221 13,767 16,858 14,255 6214 Dental Insurance 6,890 6,666 6,789 7,049 6,887 7,109 6215 Hospitalization insurance 177,700 174,541 179,887 182,546 182,978 186,379 6220 Life Insurance 1,379 1,384 1,502 7,785 1,524 8,062 6221 Long Term Disability Insurance 2,569 2,603 2,833 3,323 2,880 3,441 6225 Workers Compensation 42,143 31,346 30,808 23,735 32,042 24,578 6230 Vacation leave (2,264) 3,587 12,404 11,507 (6,125) 17,079 6235 Sick leave 18,612 (6,788) 16,619 12,678 12,166 18,773 6260 Vacancy Savings - - - (69,162) - (70,574)
O&M PERSONNEL TOTAL 1,659,413 1,530,397 1,670,634 1,390,056 1,704,747 1,433,818
O&M NON-PERSONNEL7105 Books & periodicals 489 - - 500 339 500 7110 Dues & memberships 1,118 77 704 800 675 800 7120 Office supplies 1,270 1,404 2,448 2,100 1,883 2,000 7130 Postage/shipping charges 107 2,349 185 250 116 250 7135 Telephone expenses - 122 - 200 - 200 7140 Training expenses 90 (45) 55 - 590 - 7145 Travel expenses 134 2,794 2,891 - 1,290 3,000 7203 Sand, Caliche, Gravel, Concrete etc 442 - - - - - 7205 Lamps, globes & flares 4,604 2,987 607 750 5,494 7,000 7210 Landscaping/Trade a Tree Program 21 123 517 - - - 7215 Laundry & janitorial supplies 70 - - - 110 - 7225 Safety supplies 2,837 4,343 2,948 2,750 8,529 1,000 7299 Other materials & supplies 126,403 80,311 119,406 111,000 179,557 153,000 7310 Federal, state, & local fees - 66 2 - - - 7315 Food, meals, ice, water 677 515 576 750 389 600 7325 Rental of equip/storage/land - - 33,645 40,000 31,624 30,000 7335 Wearing apparel & dry goods 8,617 8,661 22,368 21,500 26,232 29,000 7415 Fuels & lubricants 87,115 81,797 83,292 81,500 60,129 60,000 7501 Maint. of buildings & structures 165 16,724 24 5,000 444 5,000 7505 Maint. of communication equipment 434 - - 500 - 500 7520 Maint. of minor equipment - - 438 - - - 7535 Maint. of electric plant - - - - 120 - 7540 Maint. of line transformers 267,371 153,318 154,234 125,000 (9,201) 120,000 7550 Maint. of overhead lines 25,073 93,384 49,937 50,000 44,370 50,000 7555 Maint. of station equipment - - - - 140 - 7565 Maint. of street lighting & signals 155,516 147,266 178,150 125,000 142,548 100,000 7570 Maint. of underground lines 36,990 31,738 45,620 15,000 19,467 20,000 7575 Maint. of water meters - - 245 - - - 7599 Maintenance / other 33,764 43,255 37,154 - 27,483 - 7630 Construction contractor services 25,493 20,534 19,483 - - - 7699 Other services 9,460 5,273 2,233 5,000 6,485 3,000 7801 Communication equipment - 2,909 3,076 - - - 7805 Computer equipment 102 105 - - - - 7820 Office furniture & equipment 3,198 - 3,075 - - - 7835 Tools, shop and garage equipment 13,161 17,814 47,945 23,000 74,976 28,000 7899 Other minor tools & equipment 9,163 4,044 1,986 2,500 2,663 2,500
O&M NON-PERSONNEL TOTAL 813,885 721,868 813,244 613,100 626,450 616,350 Total 2,473,298$ 2,252,265$ 2,483,879$ 2,003,156$ 2,331,197$ 2,050,168$

- 116 -
Department Responsibility: Robert Avila
Title: Energy System Operations ManagerTelephone Ext: 6319
Dept. No. 2150PERFORMANCE MEASURES
FOR THEENERGY CONTROL CENTER OPERATIONS DEPARTMENT
Department Function:
Department Goals/Objectives:
FY 2013 ACTUAL
FY 2014 ACTUAL
FY 2015 ESTIMATEDYEAR END
ACTUAL
FY 2016 APPROVED
BUDGET
INPUT MEASURESEmployees 13 13 14 14
1,131,651$ 1,280,018$ 1,323,695$ 1,309,142$
OUTPUT MEASURES 16 16 16 16
10,694 13,899 13,777 14,000 9,042 12,365 14,875 14,000 4,924 4,663 4,149 4,200
171 132 108 110
None None None NoneYes Yes Yes Yes
94.09$ 110.71$ 108.41$ 112.99$ 88% 91% 92% 92%
a
All Certified Operators Maintain NERC Certification
Energy Control Center Operations is responsible for several functions at Brownsville PUB. 1. The safe and reliable operation ofBrownsville PUB's bulk electric system in compliance with NERC Comliance Standards, ERCOT Guides and Protocols. 2. Providecoordination between ERCOT or other utilities, and Brownsville PUB during emergency situations as well as normal operations. 3.Purchase fuel and arrange for the transportation of fuel to Silas Ray power plant. 4. Economically dispatch generation to meet BrownsvillePUB load requirements. 5. Coordinate transmission outages within Brownsville PUB as well as with neighboring utilities and ERCOT. 6.Take customer calls and respond by filling out service requests in Cityworks and dispatching said requests to the Electric, Water andWastewater departments as needed. 7. Keep management informed of situations and outages affecting Brownsville PUB systems 24hours a day, seven days a week. 8. Perform duties of the Customer Service Department after normal business hours.
Perform all of the above in a safe, reliable, and efficient manner while providing excellent customer service.
O&M Expenses
Operational Reports (daily)Electrical Service Requests DispatchedWater Service Requests DispatchedWastewater Service Requests DispatchedSCADA Service Requests Dispatched
OUTCOME MEASURESFatalities or Injuries as a Result of Switching
EFFICIENCY MEASURESAvg. Residential Monthly Charges (1,000 kwh)Load Forecast Within 10% of Actual for 90% of the Year
10,694
13,899
13,777
14,000
9,042
12,365
14,875
14,000
4,924 4,663 4,149 4,200 3,000
5,000
7,000
9,000
11,000
13,000
15,000
FY 2013ACTUAL
FY 2014ACTUAL
FY 2015ESTIMATEDYEAR ENDACTUAL
FY 2016APPROVED
BUDGET
Service Requests
Electrical Service Requests DispatchedWater Service Requests DispatchedWastewater Service Requests Dispatched
$94.09
$110.71
$108.41
$112.99
$92.00
$97.00
$102.00
$107.00
$112.00
$117.00
FY 2013ACTUAL
FY 2014ACTUAL
FY 2015ESTIMATEDYEAR ENDACTUAL
FY 2016APPROVED
BUDGET
Avg. Residential Monthly Charges (1,000 kwh)
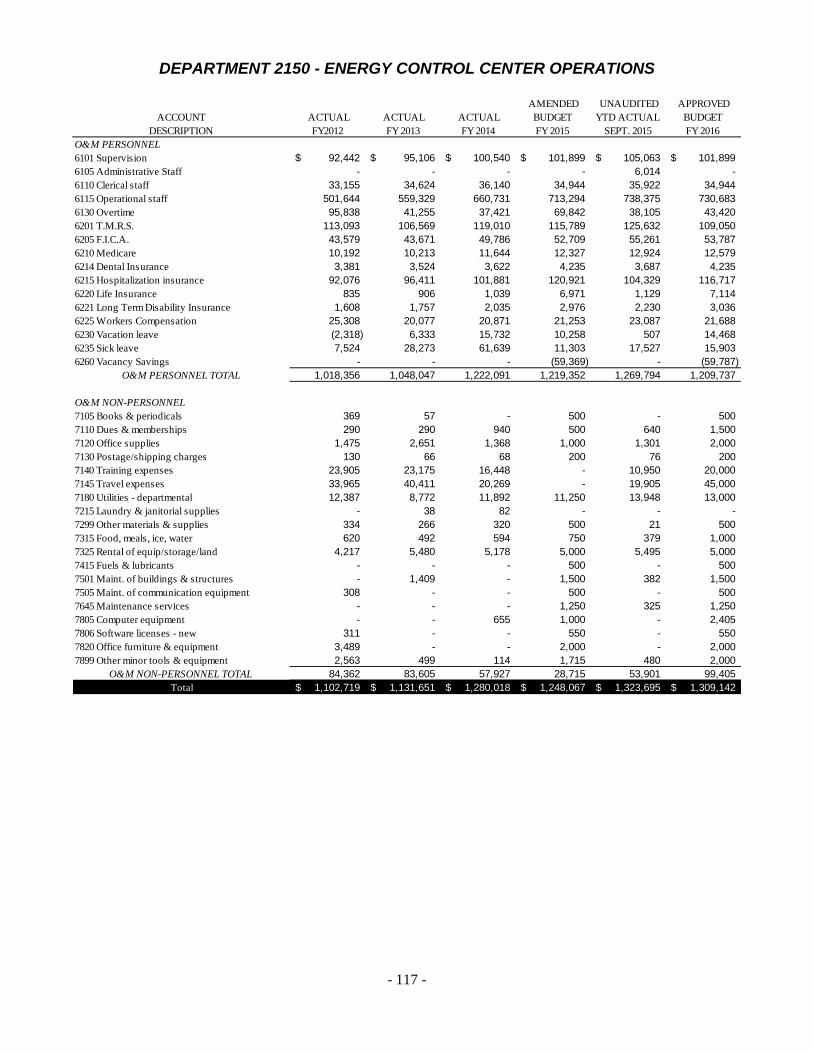
- 117 -
DEPARTMENT 2150 - ENERGY CONTROL CENTER OPERATIONS
ACCOUNTDESCRIPTION
ACTUAL FY2012
ACTUAL FY 2013
ACTUAL FY 2014
AMENDED BUDGETFY 2015
UNAUDITED YTD ACTUAL
SEPT. 2015
APPROVEDBUDGETFY 2016
O&M PERSONNEL6101 Supervision 92,442$ 95,106$ 100,540$ 101,899$ 105,063$ 101,899$ 6105 Administrative Staff - - - - 6,014 - 6110 Clerical staff 33,155 34,624 36,140 34,944 35,922 34,944 6115 Operational staff 501,644 559,329 660,731 713,294 738,375 730,683 6130 Overtime 95,838 41,255 37,421 69,842 38,105 43,420 6201 T.M.R.S. 113,093 106,569 119,010 115,789 125,632 109,050 6205 F.I.C.A. 43,579 43,671 49,786 52,709 55,261 53,787 6210 Medicare 10,192 10,213 11,644 12,327 12,924 12,579 6214 Dental Insurance 3,381 3,524 3,622 4,235 3,687 4,235 6215 Hospitalization insurance 92,076 96,411 101,881 120,921 104,329 116,717 6220 Life Insurance 835 906 1,039 6,971 1,129 7,114 6221 Long Term Disability Insurance 1,608 1,757 2,035 2,976 2,230 3,036 6225 Workers Compensation 25,308 20,077 20,871 21,253 23,087 21,688 6230 Vacation leave (2,318) 6,333 15,732 10,258 507 14,468 6235 Sick leave 7,524 28,273 61,639 11,303 17,527 15,903 6260 Vacancy Savings - - - (59,369) - (59,787)
O&M PERSONNEL TOTAL 1,018,356 1,048,047 1,222,091 1,219,352 1,269,794 1,209,737
O&M NON-PERSONNEL7105 Books & periodicals 369 57 - 500 - 500 7110 Dues & memberships 290 290 940 500 640 1,500 7120 Office supplies 1,475 2,651 1,368 1,000 1,301 2,000 7130 Postage/shipping charges 130 66 68 200 76 200 7140 Training expenses 23,905 23,175 16,448 - 10,950 20,000 7145 Travel expenses 33,965 40,411 20,269 - 19,905 45,000 7180 Utilities - departmental 12,387 8,772 11,892 11,250 13,948 13,000 7215 Laundry & janitorial supplies - 38 82 - - - 7299 Other materials & supplies 334 266 320 500 21 500 7315 Food, meals, ice, water 620 492 594 750 379 1,000 7325 Rental of equip/storage/land 4,217 5,480 5,178 5,000 5,495 5,000 7415 Fuels & lubricants - - - 500 - 500 7501 Maint. of buildings & structures - 1,409 - 1,500 382 1,500 7505 Maint. of communication equipment 308 - - 500 - 500 7645 Maintenance services - - - 1,250 325 1,250 7805 Computer equipment - - 655 1,000 - 2,405 7806 Software licenses - new 311 - - 550 - 550 7820 Office furniture & equipment 3,489 - - 2,000 - 2,000 7899 Other minor tools & equipment 2,563 499 114 1,715 480 2,000
O&M NON-PERSONNEL TOTAL 84,362 83,605 57,927 28,715 53,901 99,405 Total 1,102,719$ 1,131,651$ 1,280,018$ 1,248,067$ 1,323,695$ 1,309,142$

- 118 -
Department Responsibility: Gustavo C.LealTitle: SCADA & Electrical Support Services Mgr.
Telephone Ext: 6314Dept. No. 2210
PERFORMANCE MEASURESFOR THE
SCADA & ELECTRICAL SUPPORT SRVICES DEPARTMENT
Department Function:
Department Goals/Objectives:
FY 2013ACTUAL
FY 2014ACTUAL
FY 2015ESTIMATEDYEAR END
ACTUAL
FY 2016APPROVED
BUDGET
22 22 17 18 1,709,596$ 1,519,857$ 1,092,748$ 1,188,519$
46,372,943$ 59,833,915$ 819,909$ 801,800$
16 16 16 N/A62 75 75 78
140 180 180 185 62 126 122 N/A
235 382 405 425 557 662 529 500
31 31 31 1,285 1,951 318 300
662 670 N/A N/A
62 126 122 NA235 379 405 380 557 660 529 500
19 27 N/A N/A
2 3 N/A N/A
100% 100% 100% 100%100% 100% 100% 100%100% 100% 100% 100%
12 12 12 120.038$ 0.047$ 0.048$ 0.045$
99.99% 100% N/A N/A
% Number of Service Requests For Electric Lift StationsFuel & Purchase Energy Charge ProjectionsAverage Fuel ChargeNERC Compliant %
Number of Service Requests For W/WW SCADA System
Fuel & Energy Reports
EFFICIENCY MEASURES% Number of Service Requests For Electric SCADA System% Number of Service Requests For W/WW SCADA System
Instrumentation Locations of the W/WW SCADA SystemInstrumentation Locations of the Lift Stations
OUTCOME MEASURES
NERC Standard Requirements and ERCOT Guidelines & Protocols Applicable to BPUB
Number of NERC Compliance Self-certifications and Audits Completed
Number of Service Requests For Electrical Lift Stations
INPUT MEASURES
Number of Service Requests For Electric SCADA System
EmployeesO&M Personnel ExpenseO&M Non-Personnel Expense
OUTPUT MEASURES
Number of Service Requests For Electric SCADA System Completed Number of Service Requests For W/WW SCADA System CompletedNumber of Service Requests For Electric Lift Stations Completed
Invoices/Transactions Processed & Contracts Maintained
The objective of the department is to ensure the reliable operation of the Water/Wastewater SCADA system, lift stations, Water Plants, Wastewater Plants, Elevated WaterStorage tanks, SRWA Wells, Back Up Genrators, Fiber Optic System, TECQ and EPA Regulations.
SCADA & Electrical Support Services Department: Is responsible for planning, organizing, implementing and control the installation, maintenance, operation and repair of theelectrical/instrumentation/Supervisory Control and Data Acquisition (SCADA) systems, and all equipment associated with the Water and Wastewater Utilities. TheDepartment is also involved in the preventive maintenance, adjustment, repair, overhaul, replacement and installation of electrical, instrumentation,SCADA apparatusincluding but not limited to the communications and telemetry located at the electrical SCADA control room, lift stations, pressure points and at the Water Plants,Wastewater Plants,Water elevated Storage Tanks, SRWA Water Wells, Fiber Optic Systems, Diesel Back Up Generation. The Deparment is also heavily involved in thecompliance for the TECQ and EPA Regulations.
Back-Up Generator Maintenance
Instrumentation Locations of the Electric SCADA System
-
200
400
600
800
FY 2013ACTUAL
FY 2014ACTUAL
FY 2015ESTIMATEDYEAR END
ACTUAL
FY 2016APPROVED
BUDGET
SCADA & ELECTRICAL SUPPORT SRVICES DEPARTMENT Service Requests
Electrical Service Requests
W/WW Service Requests
Lift Station ServiceRequest

- 119 -
DEPARTMENT 2210 – SCADA & ELECTRICAL SUPPORT SERVICES
ACCOUNTDESCRIPTION
ACTUAL FY2012
ACTUAL FY 2013
ACTUAL FY 2014
AMENDED BUDGETFY 2015
UNAUDITED YTD ACTUAL
SEPT. 2015
APPROVEDBUDGETFY 2016
O&M PERSONNEL6101 Supervision 459,596$ 444,708$ 441,821$ 315,037$ 230,933$ 243,963$ 6105 Administrative Staff 178,982 202,787 137,892 52,125 46,311 52,125 6110 Clerical staff 52,773 53,717 36,438 31,533 31,709 31,533 6115 Operational staff 416,936 482,373 515,647 520,000 507,198 520,000 6130 Overtime 67,820 14,902 11,763 39,645 14,109 25,137 6201 T.M.R.S. 189,968 174,882 163,451 125,126 113,143 106,546 6205 F.I.C.A. 72,217 71,242 67,377 56,959 49,382 52,552 6206 Suta - - 2,190 - 730 - 6210 Medicare 17,270 16,998 16,085 13,321 11,549 12,291 6214 Dental Insurance 5,451 5,977 5,422 5,143 4,150 4,840 6215 Hospitalization insurance 153,496 165,343 157,646 155,660 119,088 137,765 6220 Life Insurance 1,477 1,586 1,510 7,533 1,120 6,950 6221 Long Term Disability Insurance 2,879 3,088 2,950 3,215 2,170 2,967 6225 Workers Compensation 43,214 33,475 28,872 22,967 20,762 21,191 6230 Vacation leave (5,765) 11,102 (20,562) 11,086 (11,198) 14,432 6235 Sick leave 8,545 18,236 (54,295) 12,215 (48,408) 15,863 6242 Auto Benefits 7,500 7,500 4,615 - - - 6243 Telephone Benefits 1,680 1,680 1,034 - - - 6260 Vacancy Savings - - - (65,431) - (59,636)
O&M PERSONNEL TOTAL 1,674,039 1,709,596 1,519,857 1,306,134 1,092,748 1,188,519
O&M NON-PERSONNEL7105 Books & periodicals 2,954 2,879 3,952 2,000 638 500 7110 Dues & memberships 2,684 2,069 4,585 2,400 907 1,800 7120 Office supplies 4,107 5,124 4,334 4,000 2,683 3,000 7130 Postage/shipping charges 877 648 951 1,000 450 300 7135 Telephone expenses - 332 - 300 - - 7140 Training expenses 6,184 5,770 1,695 - 175 13,900 7145 Travel expenses 22,626 19,005 22,686 - 1,643 11,100 7180 Utilities - departmental 989 1,195 1,602 1,500 2,371 1,500 7190 Utilities - CP&L & Mvec - - - - 19 - 7225 Safety supplies 209 - 526 750 2,276 500 7299 Other materials & supplies 289,032 309,429 267,293 299,500 259,286 201,000 7304 Hurricane Preparedness Expenses 146,725 283,667 80,827 230,000 206,200 230,000 7305 ERCOT expenses 2,962,548 1,799,270 1,567,229 90,000 100,055 95,000 7310 Federal, state, & local fees 126 62 - 600 - 200 7315 Food, meals, ice, water 1,106 627 529 750 1,029 750 7325 Rental of equip/storage/land - - - 10,000 - 5,000 7335 Wearing apparel & dry goods 3,465 4,980 10,673 8,000 9,888 8,000 7415 Fuels & lubricants 25,023 25,671 24,494 20,000 17,601 15,000 7501 Maint. of buildings & structures 1,573 978 840 2,000 1,211 2,000 7505 Maint. of communication equipment 24,315 1,542 890 5,000 3,530 5,000 7530 Maint. of electric meters 431 - - - - - 7601 Legal Fees 329,313 228,187 62,317 - - - 7605 Engineering fees 422,847 - - - - - 7635 Software maintenance service fees - 738 48,651 40,000 32,297 40,000 7645 Maintenance services 107,783 135,074 108,302 182,500 108,557 133,750 7701 Fuel - Natural gas - Silas Ray 2,758,991 3,374,506 3,822,520 - - - 7702 Fuel - Natural Gas - Hidalgo Energy 7,509,448 11,820,986 13,091,950 - - - 7704 Fuel - TETCO/Hinshaw Pipeline 415,837 541,701 629,567 - - - 7705 Fuel - Coal - Oklaunion 6,662,764 8,366,230 9,906,208 - - - 7706 Fuel-Diesel-Distributed Generation 12,245 26,108 3,531 - - - 7707 Fuel - Diesel oil - Oklaunion 225,004 178,077 241,855 - - - 7720 Pchp - Resource Imbalance (2,431,888) (1,527,651) (1,639,172) - - - 7721 Pchp - Economy power 15,790,064 14,354,307 21,743,977 - - -
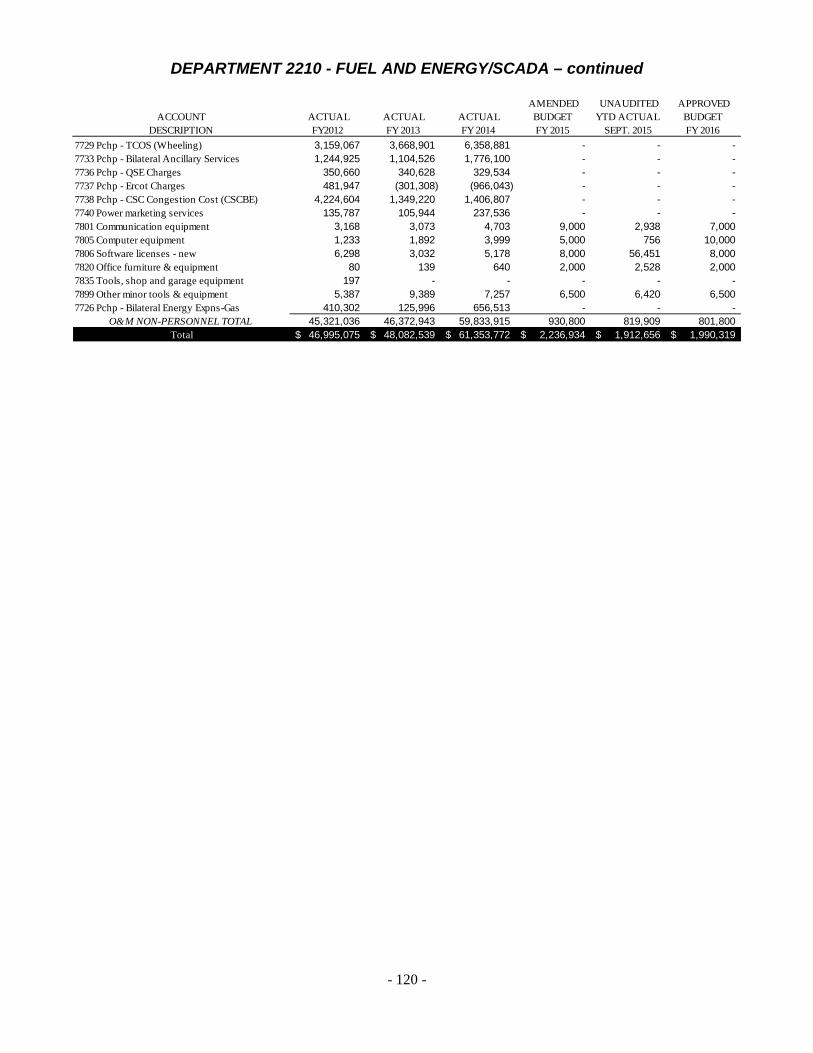
- 120 -
DEPARTMENT 2210 - FUEL AND ENERGY/SCADA – continued
ACCOUNTDESCRIPTION
ACTUAL FY2012
ACTUAL FY 2013
ACTUAL FY 2014
AMENDED BUDGETFY 2015
UNAUDITED YTD ACTUAL
SEPT. 2015
APPROVEDBUDGETFY 2016
7729 Pchp - TCOS (Wheeling) 3,159,067 3,668,901 6,358,881 - - - 7733 Pchp - Bilateral Ancillary Services 1,244,925 1,104,526 1,776,100 - - - 7736 Pchp - QSE Charges 350,660 340,628 329,534 - - - 7737 Pchp - Ercot Charges 481,947 (301,308) (966,043) - - - 7738 Pchp - CSC Congestion Cost (CSCBE) 4,224,604 1,349,220 1,406,807 - - - 7740 Power marketing services 135,787 105,944 237,536 - - - 7801 Communication equipment 3,168 3,073 4,703 9,000 2,938 7,000 7805 Computer equipment 1,233 1,892 3,999 5,000 756 10,000 7806 Software licenses - new 6,298 3,032 5,178 8,000 56,451 8,000 7820 Office furniture & equipment 80 139 640 2,000 2,528 2,000 7835 Tools, shop and garage equipment 197 - - - - - 7899 Other minor tools & equipment 5,387 9,389 7,257 6,500 6,420 6,500 7726 Pchp - Bilateral Energy Expns-Gas 410,302 125,996 656,513 - - -
O&M NON-PERSONNEL TOTAL 45,321,036 46,372,943 59,833,915 930,800 819,909 801,800 Total 46,995,075$ 48,082,539$ 61,353,772$ 2,236,934$ 1,912,656$ 1,990,319$

- 121 -
THIS PAGE INTENTIONALLY LEFT BLANK

- 122 -
Department Responsibility Rolando Lozano
Title: Power Plant ManagerTelephone Ext: 6404
Dept. No. 2220
Department Function:
Department Goals/Objectives:
FY 2013ACTUAL
FY 2014ACTUAL
FY 2015 ESTIMATEDYEAR END
ACTUAL
FY 2016APPROVED
BUDGET
INPUT MEASURES
Employees (FTE's) 27 25 29 28
Overtime (Hours) 2,650 4244 4020 4526
Personnel O&M 1,891,111$ 1,957,292$ 2,105,266$ 2,003,663$
Non-Personnel O&M (Expenses) - All Plants 11,463,032$ 11,777,947$ 11,068,240$ 11,543,665$
OUTPUT MEASURES
Generation Produced (GWH) 81.54 85.54 84.05 75.00
Availability (%) 71.67% 75% 77% 90%
OUTCOME MEASURES - Silas RayRevenue, Gross ($Base: Gen @ $0.10/kwh)
8,153,500$ 8,554,000$ 8,405,167$ 7,500,000$ Other Revenue ($ for Contract Services)
$ 394,200 534,360$ 534,360$ 534,360$
Plant Heat Rate (BTU/ KWH @ 1040 HHV)10,590 10,200 10,820 10,745
Reliability (%)100.00% 100.00% 91.66% 95.00%
PERFORMANCE MEASURESFOR THE
Department goals are to improve demand and availability for production through improved performance and efficiency.
EFFICIENCY MEASURES
This department is responsible for the operation of the Brownsville PUB wholly owned Silas Ray Power Station as well as 10 remote distributive generation units located throughout the City of Brownsville. In addition, the departement administers and tracks the operation and maintenance cost of two co-owned generating facilities: the coal-fired Oklaunion Power Station and the combined cycle Hidalgo Energy Center. In total this department oversees the production aspect of approximately 350 megawatts in generating capacity.
POWER PRODUCTION DEPARTMENT
0.00
100.00
200.00
FY 2013ACTUAL
FY 2015ESTIMATEDYEAR END
ACTUAL
81.54 85.54 84.05 75.00
Generation Produced (GWH)
10,590
10,200
10,820 10,745
9,000
9,500
10,000
10,500
11,000
11,500
12,000
FY 2013ACTUAL
FY 2014ACTUAL
FY 2015ESTIMATEDYEAR END
ACTUAL
FY 2016APPROVED
BUDGET
Plant Heat Rate (BTU/ KWH @ 1040 HHV)
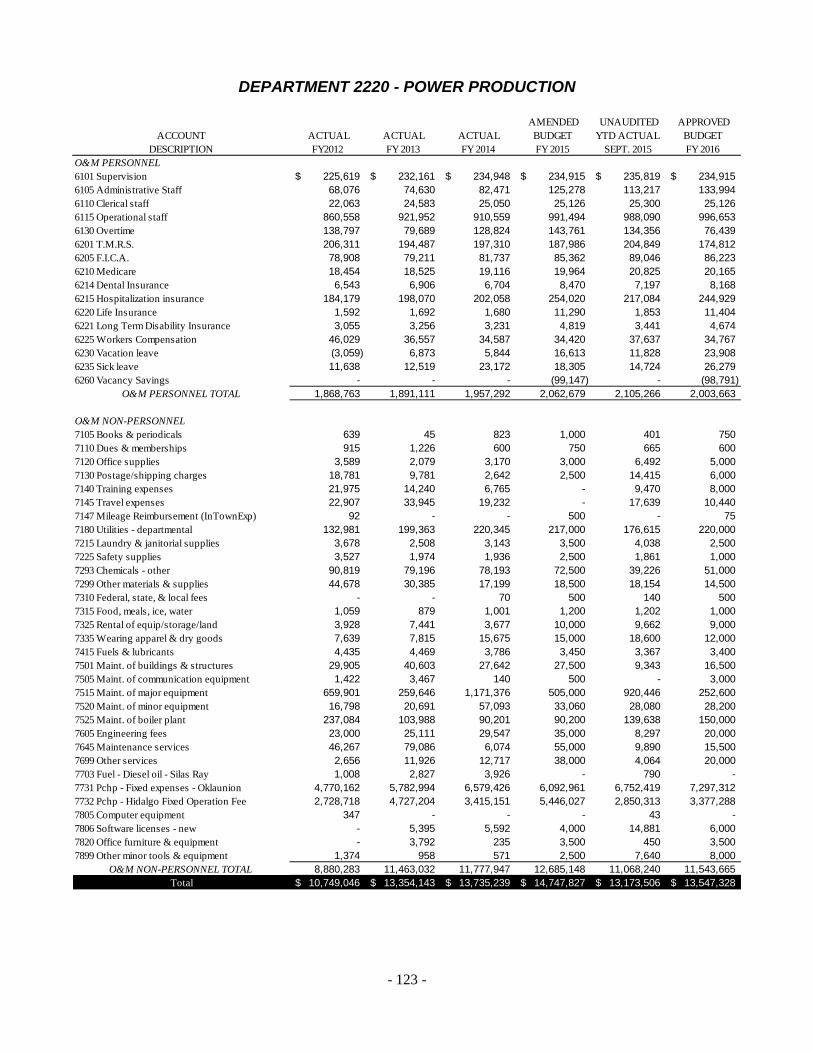
- 123 -
DEPARTMENT 2220 - POWER PRODUCTION
ACCOUNTDESCRIPTION
ACTUAL FY2012
ACTUAL FY 2013
ACTUAL FY 2014
AMENDED BUDGETFY 2015
UNAUDITED YTD ACTUAL
SEPT. 2015
APPROVEDBUDGETFY 2016
O&M PERSONNEL6101 Supervision 225,619$ 232,161$ 234,948$ 234,915$ 235,819$ 234,915$ 6105 Administrative Staff 68,076 74,630 82,471 125,278 113,217 133,994 6110 Clerical staff 22,063 24,583 25,050 25,126 25,300 25,126 6115 Operational staff 860,558 921,952 910,559 991,494 988,090 996,653 6130 Overtime 138,797 79,689 128,824 143,761 134,356 76,439 6201 T.M.R.S. 206,311 194,487 197,310 187,986 204,849 174,812 6205 F.I.C.A. 78,908 79,211 81,737 85,362 89,046 86,223 6210 Medicare 18,454 18,525 19,116 19,964 20,825 20,165 6214 Dental Insurance 6,543 6,906 6,704 8,470 7,197 8,168 6215 Hospitalization insurance 184,179 198,070 202,058 254,020 217,084 244,929 6220 Life Insurance 1,592 1,692 1,680 11,290 1,853 11,404 6221 Long Term Disability Insurance 3,055 3,256 3,231 4,819 3,441 4,674 6225 Workers Compensation 46,029 36,557 34,587 34,420 37,637 34,767 6230 Vacation leave (3,059) 6,873 5,844 16,613 11,828 23,908 6235 Sick leave 11,638 12,519 23,172 18,305 14,724 26,279 6260 Vacancy Savings - - - (99,147) - (98,791)
O&M PERSONNEL TOTAL 1,868,763 1,891,111 1,957,292 2,062,679 2,105,266 2,003,663
O&M NON-PERSONNEL7105 Books & periodicals 639 45 823 1,000 401 750 7110 Dues & memberships 915 1,226 600 750 665 600 7120 Office supplies 3,589 2,079 3,170 3,000 6,492 5,000 7130 Postage/shipping charges 18,781 9,781 2,642 2,500 14,415 6,000 7140 Training expenses 21,975 14,240 6,765 - 9,470 8,000 7145 Travel expenses 22,907 33,945 19,232 - 17,639 10,440 7147 Mileage Reimbursement (InTownExp) 92 - - 500 - 75 7180 Utilities - departmental 132,981 199,363 220,345 217,000 176,615 220,000 7215 Laundry & janitorial supplies 3,678 2,508 3,143 3,500 4,038 2,500 7225 Safety supplies 3,527 1,974 1,936 2,500 1,861 1,000 7293 Chemicals - other 90,819 79,196 78,193 72,500 39,226 51,000 7299 Other materials & supplies 44,678 30,385 17,199 18,500 18,154 14,500 7310 Federal, state, & local fees - - 70 500 140 500 7315 Food, meals, ice, water 1,059 879 1,001 1,200 1,202 1,000 7325 Rental of equip/storage/land 3,928 7,441 3,677 10,000 9,662 9,000 7335 Wearing apparel & dry goods 7,639 7,815 15,675 15,000 18,600 12,000 7415 Fuels & lubricants 4,435 4,469 3,786 3,450 3,367 3,400 7501 Maint. of buildings & structures 29,905 40,603 27,642 27,500 9,343 16,500 7505 Maint. of communication equipment 1,422 3,467 140 500 - 3,000 7515 Maint. of major equipment 659,901 259,646 1,171,376 505,000 920,446 252,600 7520 Maint. of minor equipment 16,798 20,691 57,093 33,060 28,080 28,200 7525 Maint. of boiler plant 237,084 103,988 90,201 90,200 139,638 150,000 7605 Engineering fees 23,000 25,111 29,547 35,000 8,297 20,000 7645 Maintenance services 46,267 79,086 6,074 55,000 9,890 15,500 7699 Other services 2,656 11,926 12,717 38,000 4,064 20,000 7703 Fuel - Diesel oil - Silas Ray 1,008 2,827 3,926 - 790 - 7731 Pchp - Fixed expenses - Oklaunion 4,770,162 5,782,994 6,579,426 6,092,961 6,752,419 7,297,312 7732 Pchp - Hidalgo Fixed Operation Fee 2,728,718 4,727,204 3,415,151 5,446,027 2,850,313 3,377,288 7805 Computer equipment 347 - - - 43 - 7806 Software licenses - new - 5,395 5,592 4,000 14,881 6,000 7820 Office furniture & equipment - 3,792 235 3,500 450 3,500 7899 Other minor tools & equipment 1,374 958 571 2,500 7,640 8,000
O&M NON-PERSONNEL TOTAL 8,880,283 11,463,032 11,777,947 12,685,148 11,068,240 11,543,665 Total 10,749,046$ 13,354,143$ 13,735,239$ 14,747,827$ 13,173,506$ 13,547,328$

- 124 -
Department Responsibility: Eli Alvarez
Title: Electric Operations ManagerTelephone Ext: 6234
Dept. No. 2310PERFORMANCE MEASURES
FOR THEELECTRIC METER SHOP DEPARTMENT
Department Function:
Department Goals/Objectives:
FY 2013ACTUAL
FY 2014ACTUAL
FY 2015ESTIMATEDYEAR END
ACTUAL
FY 2016APPROVED
BUDGETINPUT MEASURESStaff 7 7 8 8 ERCOT TDSP Meters 8 8 8 8 O&M Expenses 524,894$ 559,199$ 582,553$ 583,254$
OUTPUT MEASURES Install/ Maintain CT Rated Demand Meters 90 70 80 80 Meter Investigation 2,800 3,000 3,500 3,750 Set/Replace Radio Frequency Meters 125 120 130 130 Total Meter Tests - 7,400 7,400 7,444 Total Service Orders Resolved - 7,000 6,700 7,000
OUTCOME MEASURESComply With ERCOT Yes Yes Yes Yes
EFFICIENCY MEASURESMeter Tests (Per day) - 32 34 40 Service Orders Closed (Per day) - 29 32 34
The Electric Meter Shop Department is responsible for the installation, maintenance, and repair of electric meters.The department investigates high and low voltage complaints by installing voltage and current measuring devices.They test, repair, and maintain electric meters and current potential transformers. The Electric Meter Shop alsochecks on reported electric meter tampering cases, makes service connections and disconnections, and performsother related work as required.
The Electric Meter Shop objectives are to assure that BPUB's metering systems are kept up to accuracy standards, maintain meter testing programs and timely complete meter related service orders.
125 120 130 130
80
100
120
140
160
FY 2013ACTUAL
FY 2014ACTUAL
FY 2015ESTIMATEDYEAR ENDACTUAL
FY 2016APPROVED
BUDGET
Set/Replace Radio Frequency Meters
32 34 40
-
10
20
30
40
50
FY 2013ACTUAL
FY 2014ACTUAL
FY 2015ESTIMATEDYEAR ENDACTUAL
FY 2016APPROVED
BUDGET
Meter Tests (Per day)

- 125 -
DEPARTMENT 2310 - ELECTRIC METER SHOP
ACCOUNTDESCRIPTION
ACTUAL FY2012
ACTUAL FY 2013
ACTUAL FY 2014
AMENDED BUDGETFY 2015
UNAUDITED YTD ACTUAL
SEPT. 2015
APPROVEDBUDGETFY 2016
O&M PERSONNEL6101 Supervision -$ -$ -$ -$ 17$ -$ 6105 Administrative Staff 9,827 - - 42,307 36,893 51,022 6115 Operational staff 201,424 237,498 267,712 222,556 263,711 263,640 6130 Overtime 34,618 5,974 7,470 5,970 7,176 6,847 6201 T.M.R.S. 38,672 35,528 39,217 36,227 44,916 39,555 6205 F.I.C.A. 14,582 14,067 15,884 16,422 19,418 19,509 6210 Medicare 3,410 3,290 3,715 3,841 4,541 4,563 6214 Dental Insurance 1,516 1,678 1,825 2,057 1,953 2,420 6215 Hospitalization insurance 44,413 51,153 58,200 63,762 58,364 66,817 6220 Life Insurance 300 333 372 2,172 409 2,580 6221 Long Term Disability Insurance 483 528 598 813 668 974 6225 Workers Compensation 8,630 6,694 6,880 6,622 8,263 7,867 6230 Vacation leave 3,048 1,773 1,235 3,349 4,066 5,553 6235 Sick leave 4,296 9,931 5,626 3,690 (3,261) 6,104 6260 Vacancy Savings - - - (20,469) - (22,947)
O&M PERSONNEL TOTAL 365,219 368,447 408,734 389,316 447,135 454,504
O&M NON-PERSONNEL7105 Books & periodicals - - - 200 522 300 7110 Dues & memberships 252 11 - - - - 7120 Office supplies 729 1,823 1,461 1,350 2,252 1,350 7130 Postage/shipping charges 717 1,435 1,391 1,600 513 1,000 7140 Training expenses 897 1,020 295 - 307 300 7145 Travel expenses 1,641 4,509 102 - 829 - 7225 Safety supplies - - 435 525 - 500 7299 Other materials & supplies 5,695 35,362 30,992 25,000 22,249 17,000 7310 Federal, state, & local fees - - - - 128 - 7315 Food, meals, ice, water 334 281 299 500 94 400 7320 Official functions - - - - 20 - 7325 Rental of equip/storage/land 1,045 1,045 2,771 - 3,629 500 7335 Wearing apparel & dry goods 1,609 1,562 4,143 4,000 5,497 4,000 7415 Fuels & lubricants 15,028 14,849 13,525 14,000 9,064 14,000 7501 Maint. of buildings & structures - - - 2,500 - 2,000 7505 Maint. of communication equipment - - - 500 1,364 500 7530 Maint. of electric meters 98,005 78,326 84,934 85,000 73,161 75,000 7599 Maintenance / other 615 913 964 1,000 205 2,000 7645 Maintenance services 2,059 - - - - - 7699 Other services 4,084 12,117 1,831 1,000 8,651 1,000 7820 Office furniture & equipment 1,889 525 - 2,400 - 2,400 7835 Tools, shop and garage equipment 1,256 562 106 1,000 1,137 1,000 7899 Other minor tools & equipment 1,810 2,106 7,215 5,000 5,795 5,500
O&M NON-PERSONNEL TOTAL 137,665 156,446 150,465 145,575 135,417 128,750 Total 502,884$ 524,894$ 559,199$ 534,891$ 582,553$ 583,254$

- 126 -
Department Responsibility: James McCann
Title: Director of Trans,Dist,Subst&PlanTelephone Ext: 6204
Dept. No. 2410
PERFORMANCE MEASURESFOR THE
ELECTRIC ENGINEERING DEPARTMENT
Department Function:
Department Goals/Objectives:
To provide engineering, planning, and design for new and existing customers.
Will meet or exceed industry standard for design and maintenance of Electrical System.
ACCOUNTDESCRIPTION
ACTUAL FY2012
ACTUAL FY 2013
ACTUAL FY 2014
AMENDED BUDGETFY 2015
UNAUDITED YTD ACTUAL
SEPT. 2015
APPROVEDBUDGETFY 2016
O&M PERSONNEL6101 Supervision 62,028$ 36,270$ 2,430$ 56,768$ -$ 56,768$ 6105 Administrative Staff 336,660 351,654 365,660 234,235 388,292 390,397 6110 Clerical staff 134,890 102,268 90,265 81,521 61,183 69,761 6115 Operational staff 98,512 5,684 - - 43 - 6130 Overtime 4,251 305 944 1,212 189 364 6201 T.M.R.S. 101,479 72,176 73,230 51,208 62,620 64,983 6205 F.I.C.A. 39,217 30,110 31,217 23,097 28,038 32,049 6210 Medicare 9,172 7,042 7,301 5,402 6,557 7,495 6214 Dental Insurance 3,798 2,966 2,704 2,133 2,536 3,161 6215 Hospitalization insurance 100,150 75,463 68,612 53,213 61,905 70,202 6220 Life Insurance 870 686 623 3,055 624 4,239 6221 Long Term Disability Insurance 1,676 1,326 1,203 1,304 1,198 1,809 6225 Workers Compensation 25,318 15,238 13,840 9,313 11,965 12,923 6230 Vacation leave (7,700) 4,937 4,344 4,637 8,694 8,637 6235 Sick leave (4,287) (21,258) 5,959 5,109 17,727 9,493 6260 Vacancy Savings - - - (26,761) - (35,689)
O&M PERSONNEL TOTAL 906,033 684,867 668,333 505,445 651,572 696,594
O&M NON-PERSONNEL7105 Books & periodicals 747 600 133 500 881 750 7110 Dues & memberships 1,821 1,449 1,056 1,250 1,143 1,250 7120 Office supplies 7,071 5,615 8,169 7,500 4,329 6,000 7125 Photo equipment/supplies - 94 455 250 - 200 7130 Postage/shipping charges 1,139 523 579 700 617 650 7140 Training expenses 1,448 340 3,929 - 2,608 5,829 7145 Travel expenses 7,436 5,730 799 - 2,517 7,721 7203 Sand, Caliche, Gravel, Concrete etc - - - 500 - 500 7210 Landscaping/Trade a Tree Program - - - 300 - 300 7215 Laundry & janitorial supplies 32 - - - - - 7225 Safety supplies 697 797 593 550 664 600 7299 Other materials & supplies 1,310 642 1,617 2,000 239 1,250 7315 Food, meals, ice, water 1,101 896 586 700 774 700 7325 Rental of equip/storage/land 8,346 1,618 1,857 1,500 1,590 1,250 7330 Right of way fees 42,789 38,907 37,657 - - - 7335 Wearing apparel & dry goods 633 335 495 500 332 710

- 127 -
DEPARTMENT 2410 - ELECTRIC ENGINEERING
ACCOUNTDESCRIPTION
ACTUAL FY2012
ACTUAL FY 2013
ACTUAL FY 2014
AMENDED BUDGETFY 2015
UNAUDITED YTD ACTUAL
SEPT. 2015
APPROVEDBUDGETFY 2016
7415 Fuels & lubricants 6,515 6,203 4,113 4,500 1,923 3,500 7505 Maint. of communication equipment 92 87 - 400 - 400 7550 Maint. of overhead lines 9,129 - 8,000 - - - 7555 Maint. of station equipment - 135 - - - - 7565 Maint. of street lighting & signals - 1,779 37,456 100,000 76,008 60,700 7570 Maint. of underground lines - - 67,012 100,000 188,820 182,000 7599 Maintenance / other 1,125 7 - 800 - 700 7601 Legal Fees 42,854 94,674 169,245 119,000 48,187 81,000 7605 Engineering fees 5,000 33,289 - 40,500 28,548 221,000 7630 Construction contractor services - - 12,970 30,000 25,976 31,500 7635 Software maintenance service fees 15,620 12,967 16,403 17,500 18,656 17,500 7699 Other services 651,418 726,374 551,883 708,500 557,747 481,500 7805 Computer equipment 428 399 60 500 - 3,254 7806 Software licenses - new 8,845 10,841 - 7,000 7,092 7,680 7820 Office furniture & equipment 1,985 1,769 2,136 2,095 509 975 7835 Tools, shop and garage equipment - 33 67 75 35 75 7899 Other minor tools & equipment 11,653 18,925 1,128 1,000 445 1,000
O&M NON-PERSONNEL TOTAL 829,234 965,030 928,398 1,148,120 969,640 1,120,494 Total 1,735,267$ 1,649,897$ 1,596,731$ 1,653,565$ 1,621,212$ 1,817,088$
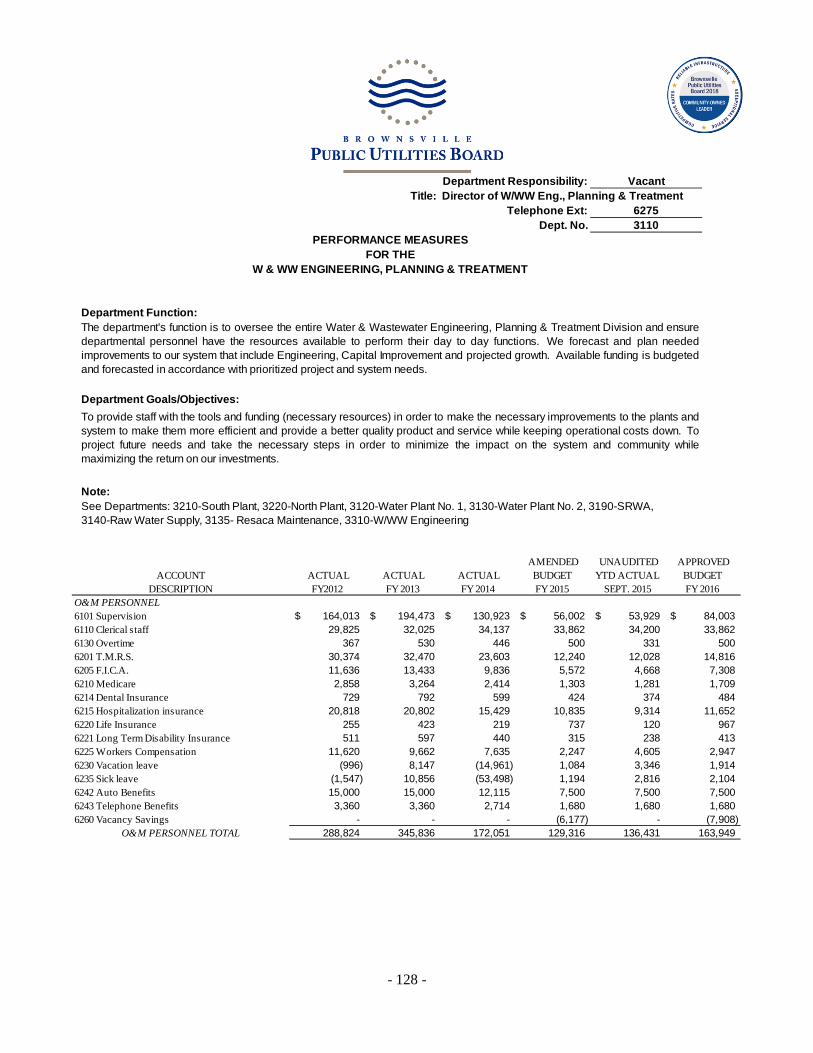
- 128 -
Department Responsibility: Vacant
Title:Telephone Ext: 6275
Dept. No. 3110PERFORMANCE MEASURES
FOR THEW & WW ENGINEERING, PLANNING & TREATMENT
Department Function:
Department Goals/Objectives:
Note:
Director of W/WW Eng., Planning & Treatment
To provide staff with the tools and funding (necessary resources) in order to make the necessary improvements to the plants andsystem to make them more efficient and provide a better quality product and service while keeping operational costs down. Toproject future needs and take the necessary steps in order to minimize the impact on the system and community whilemaximizing the return on our investments.
The department's function is to oversee the entire Water & Wastewater Engineering, Planning & Treatment Division and ensuredepartmental personnel have the resources available to perform their day to day functions. We forecast and plan neededimprovements to our system that include Engineering, Capital Improvement and projected growth. Available funding is budgetedand forecasted in accordance with prioritized project and system needs.
See Departments: 3210-South Plant, 3220-North Plant, 3120-Water Plant No. 1, 3130-Water Plant No. 2, 3190-SRWA, 3140-Raw Water Supply, 3135- Resaca Maintenance, 3310-W/WW Engineering
ACCOUNT
DESCRIPTION ACTUAL
FY2012 ACTUAL
FY 2013 ACTUAL
FY 2014
AMENDED BUDGETFY 2015
UNAUDITED YTD ACTUAL
SEPT. 2015
APPROVEDBUDGETFY 2016
O&M PERSONNEL6101 Supervision 164,013$ 194,473$ 130,923$ 56,002$ 53,929$ 84,003$ 6110 Clerical staff 29,825 32,025 34,137 33,862 34,200 33,862 6130 Overtime 367 530 446 500 331 500 6201 T.M.R.S. 30,374 32,470 23,603 12,240 12,028 14,816 6205 F.I.C.A. 11,636 13,433 9,836 5,572 4,668 7,308 6210 Medicare 2,858 3,264 2,414 1,303 1,281 1,709 6214 Dental Insurance 729 792 599 424 374 484 6215 Hospitalization insurance 20,818 20,802 15,429 10,835 9,314 11,652 6220 Life Insurance 255 423 219 737 120 967 6221 Long Term Disability Insurance 511 597 440 315 238 413 6225 Workers Compensation 11,620 9,662 7,635 2,247 4,605 2,947 6230 Vacation leave (996) 8,147 (14,961) 1,084 3,346 1,914 6235 Sick leave (1,547) 10,856 (53,498) 1,194 2,816 2,104 6242 Auto Benefits 15,000 15,000 12,115 7,500 7,500 7,500 6243 Telephone Benefits 3,360 3,360 2,714 1,680 1,680 1,680 6260 Vacancy Savings - - - (6,177) - (7,908)
O&M PERSONNEL TOTAL 288,824 345,836 172,051 129,316 136,431 163,949

- 129 -
DEPARTMENT 3110 - WATER & WASTEWATER ENGINEERING, PLANNING & TREATMENT
ACCOUNTDESCRIPTION
ACTUAL FY2012
ACTUAL FY 2013
ACTUAL FY 2014
AMENDED BUDGETFY 2015
UNAUDITED YTD ACTUAL
SEPT. 2015
APPROVEDBUDGETFY 2016
O&M NON-PERSONNEL7110 Dues & memberships 6,028 5,685 5,828 6,000 15,060 6,200 7120 Office supplies 2,196 414 240 900 629 900 7125 Photo equipment/supplies 183 - - - - - 7130 Postage/shipping charges - 64 31 200 165 200 7140 Training expenses 701 995 10 - 750 3,295 7145 Travel expenses 11,003 8,227 4,503 - 9,722 7,000 7299 Other materials & supplies 26 - - - - - 7315 Food, meals, ice, water 547 227 614 800 324 800 7415 Fuels & lubricants 92 - - 150 124 - 7601 Legal Fees 5,244 4,330 21,184 10,000 8,147 10,000 7699 Other services - - - - 40,882 - 7801 Communication equipment - - - 500 - 500 7805 Computer equipment 74 - - - - -
O&M NON-PERSONNEL TOTAL 26,094 19,941 32,410 18,550 75,802 28,895 Total 314,918$ 365,778$ 204,461$ 147,866$ 212,234$ 192,844$

- 130 -
Department Responsibility: Domingo Cortez Jr.Title: Chief W/WW Operator
Telephone Ext: 6488Dept. No. 3120
PERFORMANCE MEASURESFOR THE
WATER PLANT NO. 1
Department Function:
Department Goals/Objectives:
FY 2013 ACTUAL
FY 2014 ACTUAL
FY 2015 ESTIMATEDYEAR END
ACTUAL
FY 2016 APPROVED
BUDGETINPUT MEASURES
8 8 9 9 1,715,990$ 1,615,837$ 1,514,097$ 1,582,379$
3,434 2,990 2,817 2,868
OUTPUT MEASURES 3,269 3,072 2,709 2,724
48,406 48,946 49,512 50,084
OUTCOME MEASURESYes Yes Yes YesYes Yes Yes Yes
100% 100% 100% 100%
0.525$ 0.526$ 0.559$ 0.581$
Compliance With State Reporting Requirements
Water Plant No. 1 is responsible for producing and delivering safe and aesthetically pleasing drinking water at adequatepressures in the water distribution system.
Water Plant No. 1's objective is to cost-effectively produce high quality drinking water that meets state and federal DrinkingWater Standards and reporting requirements.
Employees (FTE's)O&M ExpensesGallons of Raw Water Used (in millions)
Gallons of Water Treated (in millions)No. of Water Customers Served
Compliance With Primary Water Standards
Completion of Oper. Reports Within 10 Days (%)
EFFICIENCY MEASURESO&M Treatment Costs Per 1,000 gal. Water
$0.525 $0.526 $0.559 $0.581
$0.200
$0.300
$0.400
$0.500
$0.600
$0.700
FY 2013ACTUAL
FY 2014ACTUAL
FY 2015ESTIMATEDYEAR ENDACTUAL
FY 2016APPROVED
BUDGET
O&M Treatment Costs per 1,000 gal. Water
3,269
3,072
2,709 2,724
2,500
2,750
3,000
3,250
3,500
3,750
4,000
FY 2013ACTUAL
FY 2014ACTUAL
FY 2015ESTIMATEDYEAR ENDACTUAL
FY 2016APPROVED
BUDGET
Gallons of Water Treated (in millions)

- 131 -
DEPARTMENT 3120 - WATER PLANT I
ACCOUNTDESCRIPTION
ACTUAL FY2012
ACTUAL FY 2013
ACTUAL FY 2014
AMENDED BUDGETFY 2015
UNAUDITED YTD ACTUAL
SEPT. 2015
APPROVEDBUDGETFY 2016
O&M PERSONNEL6101 Supervision 35,259$ 51,174$ 73,978$ 110,471$ 122,370$ 122,746$ 6110 Clerical staff - - - - 206 - 6115 Operational staff 208,247 227,127 232,846 232,814 237,384 219,086 6130 Overtime 19,749 4,769 4,559 11,666 5,165 8,092 6201 T.M.R.S. 43,380 41,293 44,390 46,756 51,212 42,970 6205 F.I.C.A. 16,627 16,913 18,327 21,284 22,336 21,194 6210 Medicare 3,889 3,955 4,286 4,978 5,224 4,957 6214 Dental Insurance 1,919 2,175 2,222 2,594 2,339 2,647 6215 Hospitalization insurance 48,885 55,952 62,655 74,833 63,422 66,459 6220 Life Insurance 342 398 433 2,815 498 2,803 6221 Long Term Disability Insurance 623 727 798 1,202 933 1,196 6225 Workers Compensation 9,649 7,742 7,785 8,582 9,409 8,546 6230 Vacation leave 4,233 6,224 7,967 4,142 (1,594) 5,961 6235 Sick leave (8,351) 20,736 25,320 4,564 2,562 6,552 6260 Vacancy Savings - - - (25,316) - (24,630)
O&M PERSONNEL TOTAL 384,449 439,187 485,564 501,385 521,466 488,578
O&M NON-PERSONNEL7105 Books & periodicals - - 44 175 - 175 7110 Dues & memberships 880 831 636 800 441 700 7120 Office supplies 312 182 63 300 417 450 7130 Postage/shipping charges - - - 50 23 300 7140 Training expenses 1,395 905 1,456 - 2,997 2,800 7145 Travel expenses 452 543 1,307 - 572 1,368 7180 Utilities - departmental 247,761 237,139 276,454 265,000 236,932 250,000 7225 Safety supplies 2,071 1,677 1,261 2,000 773 2,000 7280 Chemicals - activated carbon 20,616 18,208 40,339 25,000 - 25,000 7281 Chemicals - ammonia 52,309 54,077 50,370 45,000 46,694 45,000 7282 Chemicals - caustic soda 37,650 36,180 11,830 25,000 - 25,000 7283 Chemicals - chlorine 80,475 81,470 67,491 65,000 72,528 65,000 7284 Chemicals - coagulant 668,734 618,807 526,541 504,000 459,310 504,000 7290 Chemicals - sodium chloride 65,692 52,461 65,598 65,000 60,648 65,000 7293 Chemicals - other 1,551 1,379 855 1,100 804 2,000 7299 Other materials & supplies 18,853 26,388 14,563 17,500 10,035 10,000 7315 Food, meals, ice, water 974 183 372 400 532 400 7325 Rental of equip/storage/land 2,075 2,476 2,366 2,000 2,429 3,500 7335 Wearing apparel & dry goods 2,150 2,713 2,148 2,200 2,288 2,608 7415 Fuels & lubricants 3,591 2,894 2,255 3,500 1,509 2,000 7520 Maint. of minor equipment 537 1,098 850 2,000 - 1,800 7580 Maint. of reservoirs 155,033 68,919 13,574 25,000 - 25,000 7630 Construction contractor services 2,450 - 13,700 25,000 46,971 8,000 7645 Maintenance services 4,387 7,802 8,395 10,000 20,881 12,000 7699 Other services 22,406 14,849 14,587 16,000 9,014 16,000 7810 Laboratory equipment 4,486 6,003 1,796 4,500 3,148 4,700 7820 Office furniture & equipment 5,387 - - 1,200 876 2,500 7830 Pumping equipment 26,516 - 1,647 4,000 1,696 3,000 7840 Water treatment equipment 5,223 20,898 9,673 10,000 6,383 10,000 7899 Other minor tools & equipment 12,450 18,723 100 3,500 4,730 3,500
O&M NON-PERSONNEL TOTAL 1,446,415 1,276,803 1,130,272 1,125,225 992,632 1,093,801 Total 1,830,864$ 1,715,990$ 1,615,837$ 1,626,610$ 1,514,097$ 1,582,379$

- 132 -
Department Responsibility: Jose A. Garza
Title: Chief W/WW OperatorTelephone Ext: 6684
Dept. No. 3130
PERFORMANCE MEASURESFOR THE
WATER PLANT NO. 2
Department Function:
Department Goals/Objectives:
FY 2013 ACTUAL
FY 2014 ACTUAL
FY 2015ESTIMATEDYEAR END
ACTUAL
FY 2016 APPROVED
BUDGETINPUT MEASURES
9 9 9 9 1,296,562$ 1,293,962$ 1,321,191$ 1,285,090$
3,177 2,899 2,605 2,645
OUTPUT MEASURES 2,944 2,762 2,459 2,487
48,406 48,946 49,512 50,084
OUTCOME MEASURESYes Yes Yes YesYes Yes Yes Yes
100% 100% 100% 100%
0.440$ 0.468$ 0.537$ 0.517$
Gallons of Water Treated (in millions)No. of Water Customers Served
Gallons of Raw Water Used (in millions)
Water Plant No. 2 is responsible for producing and delivering safe and aesthetically pleasing drinking water at adequatepressures in the water distribution system.
Water Plant No. 2's objective is to cost-effectively produce high quality drinking water that meets state and federal DrinkingWater Standards and reporting requirements.
Employees (FTE's)O&M Expenses
O&M Treatment Costs Per 1,000 gal. Water
Compliance With Primary Water StandardsCompliance With State Reporting RequirementsCompletion of Oper. Reports Within 10 Days (%)
EFFICIENCY MEASURES
2,000
2,500
3,000
3,500
4,000
FY 2013ACTUAL
FY 2014ACTUAL
FY 2015ESTIMATEDYEAR ENDACTUAL
FY 2016APPROVED
BUDGET
2,944 2,762
2,459 2,487
Gallons of Water Treated (in millions)
$0.440 $0.468
$0.537 $0.517
$0.350
$0.400
$0.450
$0.500
$0.550
$0.600
FY 2013ACTUAL
FY 2014ACTUAL
FY 2015ESTIMATEDYEAR ENDACTUAL
FY 2016APPROVED
BUDGET
O&M Treatment Costs Per 1,000 gal. Water

- 133 -
DEPARTMENT 3130 - WATER PLANT II
ACCOUNTDESCRIPTION
ACTUAL FY2012
ACTUAL FY 2013
ACTUAL FY 2014
AMENDED BUDGETFY 2015
UNAUDITED YTD ACTUAL
SEPT. 2015
APPROVEDBUDGETFY 2016
O&M PERSONNEL6101 Supervision 57,537$ 59,376$ 62,020$ 56,366$ 62,870$ 62,629$ 6115 Operational staff 219,845 244,495 233,415 227,552 234,047 250,286 6130 Overtime 29,382 8,426 12,471 10,820 8,154 10,795 6201 T.M.R.S. 48,342 45,573 44,226 38,670 41,648 39,335 6205 F.I.C.A. 18,371 18,693 18,607 17,603 18,267 19,401 6206 Suta - - - - 452 - 6210 Medicare 4,297 4,372 4,352 4,117 4,272 4,537 6214 Dental Insurance 2,171 2,390 2,364 2,692 2,344 2,723 6215 Hospitalization insurance 60,637 61,879 57,844 69,413 57,485 66,138 6220 Life Insurance 389 434 420 2,328 426 2,566 6221 Long Term Disability Insurance 710 792 761 994 775 1,095 6225 Workers Compensation 10,822 8,593 7,752 7,098 7,650 7,823 6230 Vacation leave 6,136 450 69 3,426 4,922 5,524 6235 Sick leave 6,274 (8,169) 5,342 3,775 14,097 6,072 6260 Vacancy Savings - - - (21,342) - (22,827)
O&M PERSONNEL TOTAL 464,913 447,304 449,642 423,512 457,409 456,096
O&M NON-PERSONNEL7105 Books & periodicals - - - 300 - 300 7110 Dues & memberships 424 988 1,257 950 651 950 7120 Office supplies 36 556 228 250 55 500 7130 Postage/shipping charges - 25 - 100 7 100 7140 Training expenses 1,900 3,285 1,825 - 3,951 3,246 7145 Travel expenses 783 872 1,180 - 542 1,000 7180 Utilities - departmental 28,997 28,331 26,899 30,000 125,708 40,000 7190 Utilities - CP&L & Mvec 2,902 1,497 1,412 2,000 - 2,000 7190 Utilities - CP&L & Mvec - - - - 1,373 - 7225 Safety supplies 347 150 1,558 2,250 1,787 2,250 7280 Chemicals - activated carbon 47,096 32,359 21,268 25,000 21,070 25,000 7281 Chemicals - ammonia 49,517 65,223 49,864 52,500 42,386 47,648 7282 Chemicals - caustic soda 44,226 48,448 42,824 52,500 60,760 56,692 7283 Chemicals - chlorine 80,144 69,350 59,556 57,500 52,134 60,000 7284 Chemicals - coagulant 500,476 457,327 425,046 420,000 364,582 420,000 7290 Chemicals - sodium chloride 55,701 54,487 73,109 57,500 43,665 57,500 7293 Chemicals - other 1,508 1,417 1,359 5,000 805 5,000 7299 Other materials & supplies 42,030 32,326 22,699 28,000 11,650 21,400 7315 Food, meals, ice, water 368 450 183 400 314 400 7325 Rental of equip/storage/land 4,940 2,300 2,497 4,200 6,307 5,000 7335 Wearing apparel & dry goods 2,898 3,926 3,571 2,605 2,124 2,608 7415 Fuels & lubricants 2,635 1,682 1,931 1,500 1,803 1,500 7580 Maint. of reservoirs 30,903 9,668 49,715 35,000 67,758 35,000 7645 Maintenance services 1,455 3,661 542 10,000 651 10,000 7699 Other services 9,843 10,597 52,035 20,000 42,775 15,000 7805 Computer equipment 356 - - - - - 7820 Office furniture & equipment 560 150 663 600 - 3,300 7830 Pumping equipment - - 242 1,000 229 1,000 7899 Other minor tools & equipment 421 20,184 2,855 5,000 10,695 11,600
O&M NON-PERSONNEL TOTAL 910,466 849,259 844,320 814,155 863,782 828,994 Total 1,375,379$ 1,296,562$ 1,293,962$ 1,237,667$ 1,321,191$ 1,285,090$

- 134 -
Department Responsibility: Rene Mariscal
Title: Water Resource ManagerTelephone Ext: 6256
Dept. No. 3135
PERFORMANCE MEASURESFOR THE
RESACA MAINTENANCE DEPARTMENT
Department Function:
Department Goals/Objectives:
FY 2013 ACTUAL
FY 2014 ACTUAL
FY 2015 ESTIMATEDYEAR END
ACTUAL
FY 2016 APPROVED
BUDGETINPUT MEASURES
11 19 23 19 1,705,909$ 1,988,617$ 1,954,928$ 1,048,587$
OUTPUT MEASURES 19,621 42,710 88,906 18,000
OUTCOME MEASURESYes Yes Yes Yes
100% 100% 100% 100%Raw Water Storage Capacity Gained (acre-ft) 12 26 55 11
EFFICIENCY MEASURES86.94$ 46.56$ 21.99$ 58.25$
Completion of Oper. Reports Within 10 Days (%)
O&M Costs Per Cubic Yard Dredged
The Resaca Maintenance department is responsible for maintaining the City's Resaca system.
The Resaca Maintenance Department's objective is to cost-effectively dredge and maintain the City of Brownsville's Resaca System andBPUB's reservoirs in order to increase raw water storage and storm water capacity.
Employees (FTE's)O&M Expenses
Sediment Dredged (cu-yd)
Compliance With Environmental Standards
19,621
42,710
88,906
18,000
- 10,000 20,000 30,000 40,000 50,000 60,000 70,000 80,000 90,000
100,000
FY 2013ACTUAL
FY 2014ACTUAL
FY 2015ESTIMATEDYEAR ENDACTUAL
FY 2016APPROVED
BUDGET
Sediment Dredged (cu-yd)
$86.94
$46.56
$21.99
$58.25
0
20
40
60
80
100
FY 2013ACTUAL
FY 2014ACTUAL
FY 2015ESTIMATEDYEAR ENDACTUAL
FY 2016APPROVED
BUDGET
O&M Costs Per Cubic Yard Dredged

- 135 -
DEPARTMENT 3135 – RESACA MAINTENANCE
ACCOUNTDESCRIPTION
ACTUAL FY2012
ACTUAL FY 2013
ACTUAL FY 2014
AMENDED BUDGETFY 2015
UNAUDITED YTD ACTUAL
SEPT. 2015
APPROVEDBUDGETFY 2016
O&M PERSONNEL6101 Supervision 60,319$ 134,331$ 181,337$ 181,501$ 135,574$ 181,501$ 6110 Clerical staff - - 16,912 10,774 25,644 25,480 6115 Operational staff - 196,791 335,981 390,936 414,956 302,931 6130 Overtime - 37,727 22,348 50,651 72,556 69,918 6201 T.M.R.S. 9,050 53,690 79,974 79,528 88,632 72,943 6205 F.I.C.A. 3,612 21,723 33,032 36,159 38,302 35,949 6210 Medicare 845 5,080 7,725 8,457 8,958 8,408 6214 Dental Insurance 216 2,360 4,536 5,748 4,777 4,538 6215 Hospitalization insurance 7,008 68,999 123,912 156,295 132,104 128,110 6220 Life Insurance 76 456 773 4,782 829 4,755 6221 Long Term Disability Insurance 152 843 1,389 2,041 1,492 2,029 6225 Workers Compensation 2,111 9,736 14,037 14,580 16,272 14,363 6230 Vacation leave 294 20,207 4,691 7,340 2,241 6,170 6235 Sick leave - 61,321 20,118 8,087 3,758 6,782 6260 Vacancy Savings - - - (46,539) - (300,000)
O&M PERSONNEL TOTAL 83,684 613,262 846,766 910,340 946,093 563,875
O&M NON-PERSONNEL7101 Advertising - - 352 - - - 7105 Books & periodicals - - - 100 - 31 7110 Dues & memberships 187 470 574 1,000 508 306 7120 Office supplies 339 1,501 1,474 1,000 1,024 306 7130 Postage/shipping charges 190 508 363 600 1,933 183 7140 Training expenses 345 1,200 2,183 - 2,795 978 7145 Travel expenses 902 102 1,338 - 1,399 520 7147 Mileage Reimbursement (InTownExp) - - - - 40 - 7180 Utilities - departmental - 7,405 13,886 15,000 18,826 4,585 7203 Sand, Caliche, Gravel, Concrete etc - 126,549 60,881 75,000 24,710 22,923 7225 Safety supplies - 4,630 3,164 3,000 3,037 917 7251 Purchased of Raw Water 30,965 - - - - - 7293 Chemicals - other - 149,345 238,901 200,000 197,892 85,580 7299 Other materials & supplies 24,284 145,832 55,574 55,000 79,332 18,338 7315 Food, meals, ice, water 18 728 707 800 487 245 7325 Rental of equip/storage/land - 62,148 51,985 65,000 7,126 19,867 7335 Wearing apparel & dry goods 11 3,175 5,700 5,000 5,651 1,712 7415 Fuels & lubricants 323 30,756 73,735 80,000 65,242 24,451 7580 Maint. of reservoirs 45,000 - - - - - 7581 Maint. of resacas 33,650 23,778 94,789 140,000 307,097 153,548 7599 Maintenance / other - - 293,992 - - - 7605 Engineering fees 321,043 72,852 213,720 50,000 241,032 61,128 7645 Maintenance services - 3,586 3,247 30,000 3,555 4,585 7655 Hauling Services - - - - - 61,128 7699 Other services 475 446,870 1,056 30,000 25,065 15,282 7801 Communication equipment - 1,151 996 1,500 9,396 1,528 7806 Software licenses - new 345 - - - - - 7820 Office furniture & equipment - 3,772 2,703 3,500 182 1,070 7830 Pumping equipment - 290 15,465 5,000 9,307 2,445 7835 Tools, shop and garage equipment - 233 2,238 5,000 2,324 1,528 7899 Other minor tools & equipment - 5,764 2,826 5,000 875 1,528
O&M NON-PERSONNEL TOTAL 458,079 1,092,646 1,141,850 771,500 1,008,835 484,712 Total 541,762$ 1,705,909$ 1,988,617$ 1,681,840$ 1,954,928$ 1,048,587$

- 136 -
Department Responsibility: Rene Mariscal
Title: Water Resource ManagerTelephone Ext: 6256
Dept. No. 3140
PERFORMANCE MEASURESFOR THE
RAW WATER SUPPLY DEPARTMENT
Department Function:
Department Goals/Objectives:
FY 2013 ACTUAL
FY 2014ACTUAL
FY 2015 ESTIMATEDYEAR END
ACTUAL
FY 2016APPROVED
BUDGETINPUT MEASURES
3 3 4 4 481,771$ 346,835$ 464,908$ 478,561$ 29,285 29,285 31,133 31,133
OUTPUT MEASURES 26,754 24,123 20,606 21,000 6,911 6,906 4,566 5,000
Certificate M865 Diversions (acre feet) 17,719 17,215 16,689 17,000
OUTCOME MEASURES9,375 6,908 3,917 5,000
11,566 12,070 14,444 14,133 Certificate M865 Savings (acre feet)
The Raw Water Supply Department is responsible for forecasting water demands and maintenance of reservoir and resacainfrastructure.
The Raw Water Department's objective is to maintain sufficient raw water storage levels in the reservoirs and resacas tominimize the cost of purchasing water rights and surface water; and to maintain raw water equipment in a cost-efficient mannerand return equipment to operating condition in a cost-effective manner.
Employees (FTE's)O&M ExpensesCertificate M865 Water Rights (acre feet)
River Water Diversions to Reservoirs (acre feet)Raw Water Diversions to Resacas (acre feet)
Permit 1838 Diversions (acre feet)
EFFICIENCY MEASURES
9,375
6,908
3,917
5,000
3,000
6,000
9,000
12,000
FY 2013ACTUAL
FY 2014ACTUAL
FY 2015ESTIMATEDYEAR ENDACTUAL
FY 2016APPROVED
BUDGET
Permit 1838 Diversions (acre feet)
11,566 12,070
14,444 14,133
10,000
11,000
12,000
13,000
14,000
15,000
16,000
FY 2013ACTUAL
FY 2014ACTUAL
FY 2015ESTIMATEDYEAR ENDACTUAL
FY 2016APPROVED
BUDGET
Certificate M865 Savings (acre feet)
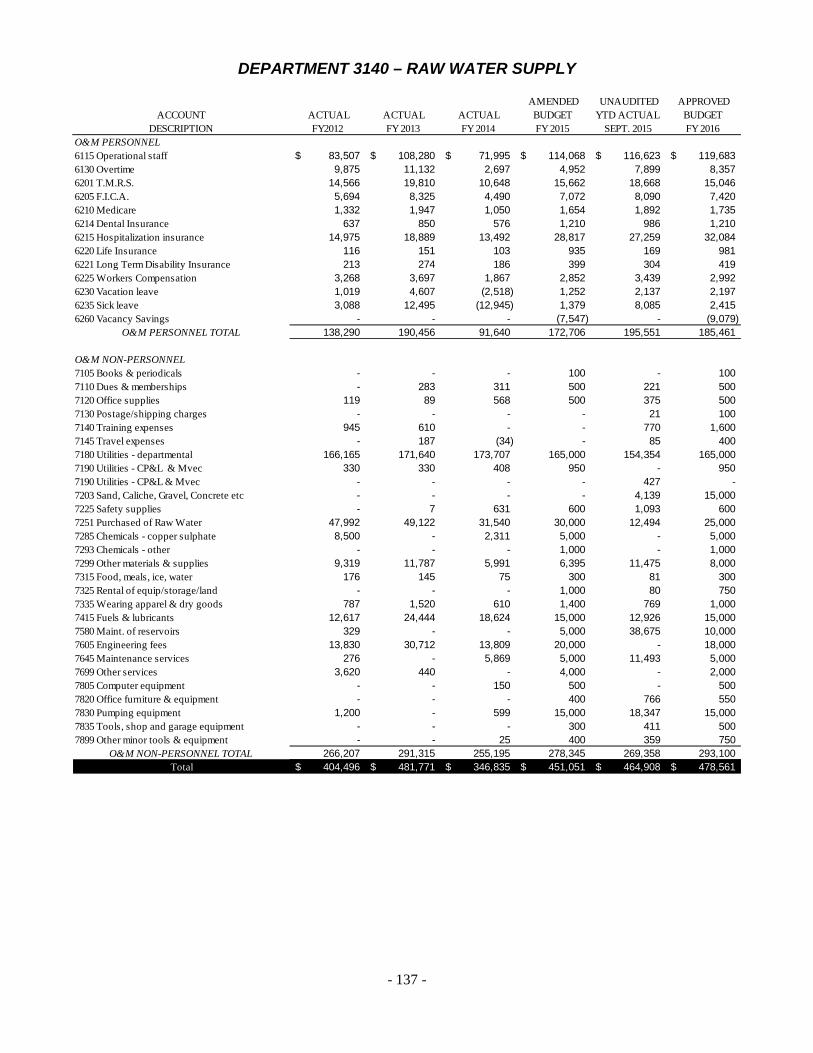
- 137 -
DEPARTMENT 3140 – RAW WATER SUPPLY
ACCOUNTDESCRIPTION
ACTUAL FY2012
ACTUAL FY 2013
ACTUAL FY 2014
AMENDED BUDGETFY 2015
UNAUDITED YTD ACTUAL
SEPT. 2015
APPROVEDBUDGETFY 2016
O&M PERSONNEL6115 Operational staff 83,507$ 108,280$ 71,995$ 114,068$ 116,623$ 119,683$ 6130 Overtime 9,875 11,132 2,697 4,952 7,899 8,357 6201 T.M.R.S. 14,566 19,810 10,648 15,662 18,668 15,046 6205 F.I.C.A. 5,694 8,325 4,490 7,072 8,090 7,420 6210 Medicare 1,332 1,947 1,050 1,654 1,892 1,735 6214 Dental Insurance 637 850 576 1,210 986 1,210 6215 Hospitalization insurance 14,975 18,889 13,492 28,817 27,259 32,084 6220 Life Insurance 116 151 103 935 169 981 6221 Long Term Disability Insurance 213 274 186 399 304 419 6225 Workers Compensation 3,268 3,697 1,867 2,852 3,439 2,992 6230 Vacation leave 1,019 4,607 (2,518) 1,252 2,137 2,197 6235 Sick leave 3,088 12,495 (12,945) 1,379 8,085 2,415 6260 Vacancy Savings - - - (7,547) - (9,079)
O&M PERSONNEL TOTAL 138,290 190,456 91,640 172,706 195,551 185,461
O&M NON-PERSONNEL7105 Books & periodicals - - - 100 - 100 7110 Dues & memberships - 283 311 500 221 500 7120 Office supplies 119 89 568 500 375 500 7130 Postage/shipping charges - - - - 21 100 7140 Training expenses 945 610 - - 770 1,600 7145 Travel expenses - 187 (34) - 85 400 7180 Utilities - departmental 166,165 171,640 173,707 165,000 154,354 165,000 7190 Utilities - CP&L & Mvec 330 330 408 950 - 950 7190 Utilities - CP&L & Mvec - - - - 427 - 7203 Sand, Caliche, Gravel, Concrete etc - - - - 4,139 15,000 7225 Safety supplies - 7 631 600 1,093 600 7251 Purchased of Raw Water 47,992 49,122 31,540 30,000 12,494 25,000 7285 Chemicals - copper sulphate 8,500 - 2,311 5,000 - 5,000 7293 Chemicals - other - - - 1,000 - 1,000 7299 Other materials & supplies 9,319 11,787 5,991 6,395 11,475 8,000 7315 Food, meals, ice, water 176 145 75 300 81 300 7325 Rental of equip/storage/land - - - 1,000 80 750 7335 Wearing apparel & dry goods 787 1,520 610 1,400 769 1,000 7415 Fuels & lubricants 12,617 24,444 18,624 15,000 12,926 15,000 7580 Maint. of reservoirs 329 - - 5,000 38,675 10,000 7605 Engineering fees 13,830 30,712 13,809 20,000 - 18,000 7645 Maintenance services 276 - 5,869 5,000 11,493 5,000 7699 Other services 3,620 440 - 4,000 - 2,000 7805 Computer equipment - - 150 500 - 500 7820 Office furniture & equipment - - - 400 766 550 7830 Pumping equipment 1,200 - 599 15,000 18,347 15,000 7835 Tools, shop and garage equipment - - - 300 411 500 7899 Other minor tools & equipment - - 25 400 359 750
O&M NON-PERSONNEL TOTAL 266,207 291,315 255,195 278,345 269,358 293,100 Total 404,496$ 481,771$ 346,835$ 451,051$ 464,908$ 478,561$
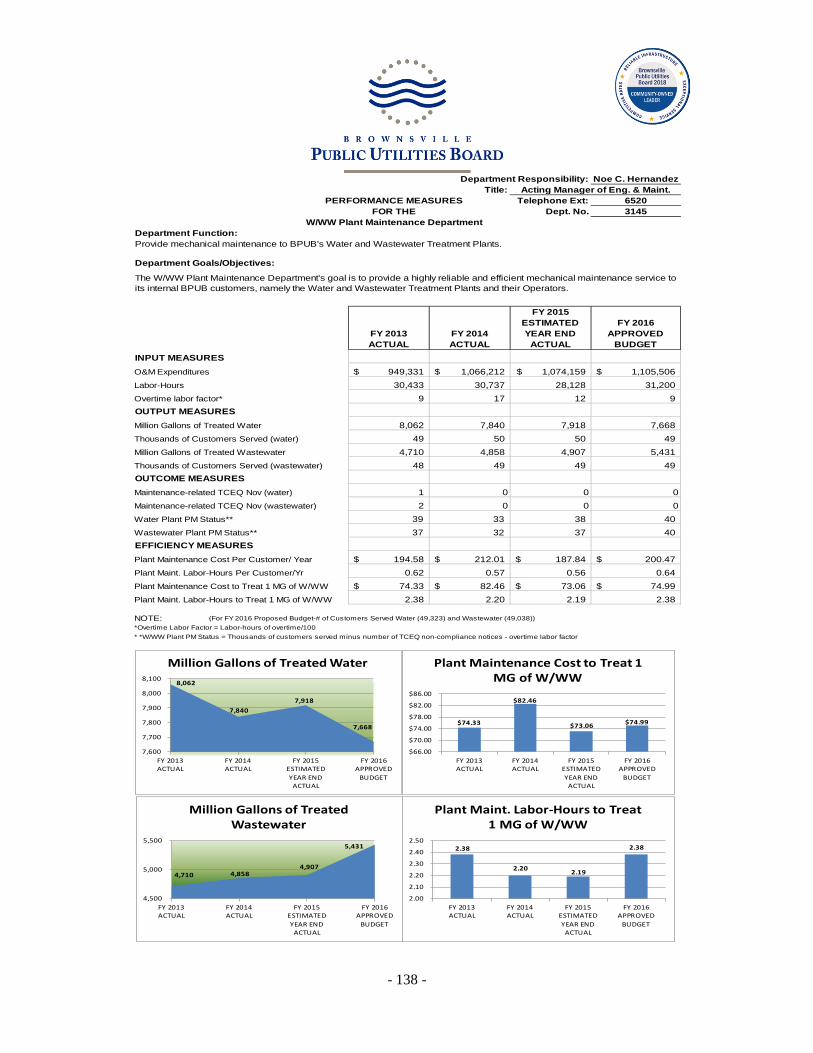
- 138 -
Department Responsibility: Noe C. Hernandez
Title:Telephone Ext: 6520
Dept. No. 3145W/WW Plant Maintenance Department
Department Function:
Department Goals/Objectives:
FY 2013ACTUAL
FY 2014ACTUAL
FY 2015ESTIMATEDYEAR END
ACTUAL
FY 2016APPROVED
BUDGETINPUT MEASURESO&M Expenditures 949,331$ 1,066,212$ 1,074,159$ 1,105,506$ Labor-Hours 30,433 30,737 28,128 31,200 Overtime labor factor* 9 17 12 9 OUTPUT MEASURES Million Gallons of Treated Water 8,062 7,840 7,918 7,668 Thousands of Customers Served (water) 49 50 50 49 Million Gallons of Treated Wastewater 4,710 4,858 4,907 5,431 Thousands of Customers Served (wastewater) 48 49 49 49 OUTCOME MEASURESMaintenance-related TCEQ Nov (water) 1 0 0 0Maintenance-related TCEQ Nov (wastewater) 2 0 0 0Water Plant PM Status** 39 33 38 40 Wastewater Plant PM Status** 37 32 37 40
Plant Maintenance Cost Per Customer/ Year 194.58$ 212.01$ 187.84$ 200.47$ Plant Maint. Labor-Hours Per Customer/Yr 0.62 0.57 0.56 0.64 Plant Maintenance Cost to Treat 1 MG of W/WW 74.33$ 82.46$ 73.06$ 74.99$ Plant Maint. Labor-Hours to Treat 1 MG of W/WW 2.38 2.20 2.19 2.38
NOTE: (For FY 2016 Proposed Budget-# of Customers Served Water (49,323) and Wastewater (49,038))*Overtime Labor Factor = Labor-hours of overtime/100* *W/WW Plant PM Status = Thousands of customers served minus number of TCEQ non-compliance notices - overtime labor factor
Acting Manager of Eng. & Maint.PERFORMANCE MEASURES
FOR THE
The W/WW Plant Maintenance Department's goal is to provide a highly reliable and efficient mechanical maintenance service to its internal BPUB customers, namely the Water and Wastewater Treatment Plants and their Operators.
EFFICIENCY MEASURES
Provide mechanical maintenance to BPUB's Water and Wastewater Treatment Plants.
8,062
7,840 7,918
7,668
7,600
7,700
7,800
7,900
8,000
8,100
FY 2013ACTUAL
FY 2014ACTUAL
FY 2015ESTIMATEDYEAR END
ACTUAL
FY 2016APPROVED
BUDGET
Million Gallons of Treated Water
4,710 4,858 4,907
5,431
4,500
5,000
5,500
FY 2013ACTUAL
FY 2014ACTUAL
FY 2015ESTIMATEDYEAR END
ACTUAL
FY 2016APPROVED
BUDGET
Million Gallons of Treated Wastewater
$74.33
$82.46
$73.06 $74.99
$66.00
$70.00
$74.00
$78.00
$82.00
$86.00
FY 2013ACTUAL
FY 2014ACTUAL
FY 2015ESTIMATEDYEAR END
ACTUAL
FY 2016APPROVED
BUDGET
Plant Maintenance Cost to Treat 1 MG of W/WW
2.38
2.20 2.19
2.38
2.00
2.10
2.20
2.30
2.40
2.50
FY 2013ACTUAL
FY 2014ACTUAL
FY 2015ESTIMATEDYEAR END
ACTUAL
FY 2016APPROVED
BUDGET
Plant Maint. Labor-Hours to Treat 1 MG of W/WW
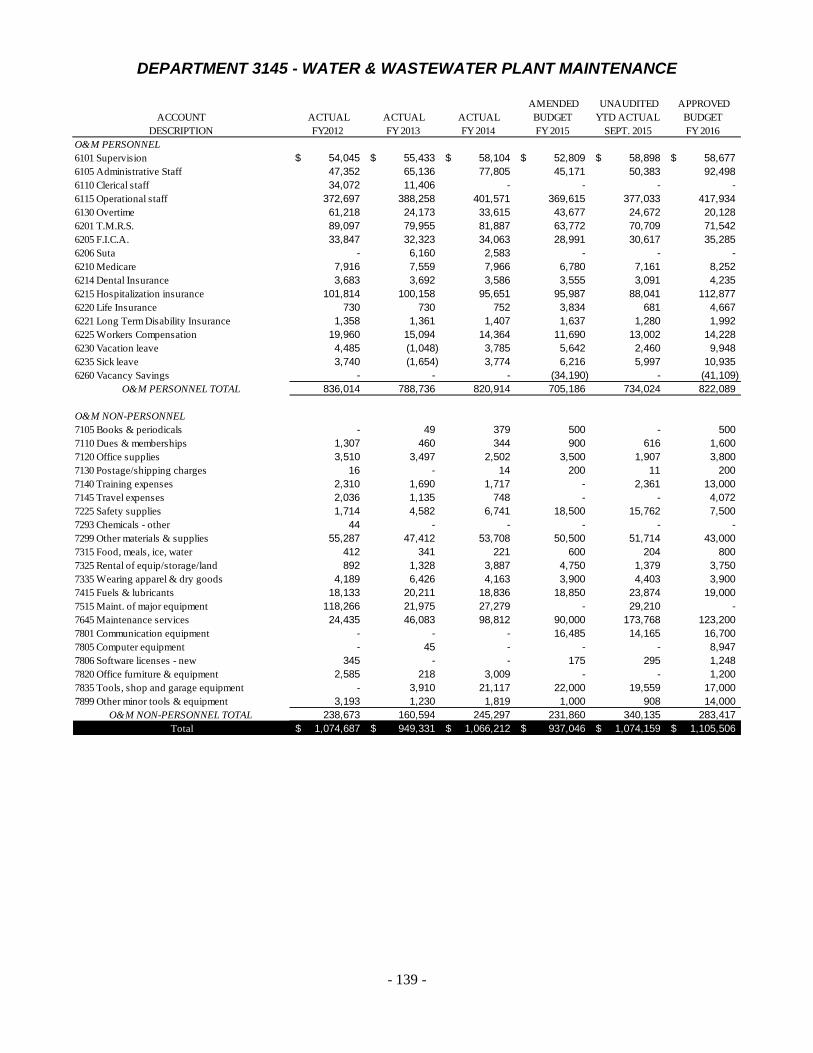
- 139 -
DEPARTMENT 3145 - WATER & WASTEWATER PLANT MAINTENANCE
ACCOUNTDESCRIPTION
ACTUAL FY2012
ACTUAL FY 2013
ACTUAL FY 2014
AMENDED BUDGETFY 2015
UNAUDITED YTD ACTUAL
SEPT. 2015
APPROVEDBUDGETFY 2016
O&M PERSONNEL6101 Supervision 54,045$ 55,433$ 58,104$ 52,809$ 58,898$ 58,677$ 6105 Administrative Staff 47,352 65,136 77,805 45,171 50,383 92,498 6110 Clerical staff 34,072 11,406 - - - - 6115 Operational staff 372,697 388,258 401,571 369,615 377,033 417,934 6130 Overtime 61,218 24,173 33,615 43,677 24,672 20,128 6201 T.M.R.S. 89,097 79,955 81,887 63,772 70,709 71,542 6205 F.I.C.A. 33,847 32,323 34,063 28,991 30,617 35,285 6206 Suta - 6,160 2,583 - - - 6210 Medicare 7,916 7,559 7,966 6,780 7,161 8,252 6214 Dental Insurance 3,683 3,692 3,586 3,555 3,091 4,235 6215 Hospitalization insurance 101,814 100,158 95,651 95,987 88,041 112,877 6220 Life Insurance 730 730 752 3,834 681 4,667 6221 Long Term Disability Insurance 1,358 1,361 1,407 1,637 1,280 1,992 6225 Workers Compensation 19,960 15,094 14,364 11,690 13,002 14,228 6230 Vacation leave 4,485 (1,048) 3,785 5,642 2,460 9,948 6235 Sick leave 3,740 (1,654) 3,774 6,216 5,997 10,935 6260 Vacancy Savings - - - (34,190) - (41,109)
O&M PERSONNEL TOTAL 836,014 788,736 820,914 705,186 734,024 822,089
O&M NON-PERSONNEL7105 Books & periodicals - 49 379 500 - 500 7110 Dues & memberships 1,307 460 344 900 616 1,600 7120 Office supplies 3,510 3,497 2,502 3,500 1,907 3,800 7130 Postage/shipping charges 16 - 14 200 11 200 7140 Training expenses 2,310 1,690 1,717 - 2,361 13,000 7145 Travel expenses 2,036 1,135 748 - - 4,072 7225 Safety supplies 1,714 4,582 6,741 18,500 15,762 7,500 7293 Chemicals - other 44 - - - - - 7299 Other materials & supplies 55,287 47,412 53,708 50,500 51,714 43,000 7315 Food, meals, ice, water 412 341 221 600 204 800 7325 Rental of equip/storage/land 892 1,328 3,887 4,750 1,379 3,750 7335 Wearing apparel & dry goods 4,189 6,426 4,163 3,900 4,403 3,900 7415 Fuels & lubricants 18,133 20,211 18,836 18,850 23,874 19,000 7515 Maint. of major equipment 118,266 21,975 27,279 - 29,210 - 7645 Maintenance services 24,435 46,083 98,812 90,000 173,768 123,200 7801 Communication equipment - - - 16,485 14,165 16,700 7805 Computer equipment - 45 - - - 8,947 7806 Software licenses - new 345 - - 175 295 1,248 7820 Office furniture & equipment 2,585 218 3,009 - - 1,200 7835 Tools, shop and garage equipment - 3,910 21,117 22,000 19,559 17,000 7899 Other minor tools & equipment 3,193 1,230 1,819 1,000 908 14,000
O&M NON-PERSONNEL TOTAL 238,673 160,594 245,297 231,860 340,135 283,417 Total 1,074,687$ 949,331$ 1,066,212$ 937,046$ 1,074,159$ 1,105,506$

- 140 -
Department Responsibility: Armando GarciaTitle: W/WW Operations Manager
Telephone Ext: 6386Dept. No. 3150
PERFORMANCE MEASURESFOR THE
WATER/WASTEWATER OPERATIONS & CONSTRUCTION DEPARTMENT
Department Function:
Department Goals/Objectives:
FY 2013 ACTUAL
FY 2014ACTUAL
FY 2015 ESTIMATEDYEAR END
ACTUAL
FY 2016APPROVED
BUDGETINPUT MEASURESEmployees 63 63 68 67 O&M Expenses 3,965,262$ 4,400,794$ 4,827,392$ 4,674,448$ Miles of Water & Wastewater Mains 1,300 1,300 1,300 1,292 Number of Service Requests 18,708 16,500 16,065 19,578 Number of Service Orders 17,538 16,400 5,902 8,252 Overtime Expenses -$ -$ 130,000$ 235,000$
OUTPUT MEASURES Water Mains/Service Line # of Repairs 4,808 2,800 2,354 1,434 Wastewater Line # of Repairs 5,491 3,200 445 444 Number of W/WW Service Connections 105,050 103,379 97,215 98,361
OUTCOME MEASURESOngoing Maintenance YES YES YES YESAverage Response Time Per Call 90min. 90min. 90min. 90min.Water Losses 10% 10% 13% 13%Number of Connections Per Mile 87 80 75 76
Estimated Expenses W/WW Main Lines 1,978,288$ 2,015,695$ 2,053,811$ 2,096,605$ Turnaround Time Per New Connection (days) 10 10 10 10 Cost per Customer per W/WW Connection $ 3,927 $ 3,927 $ 2,810 $ 2,695
The Water/Wastewater Operations & Construction Department is responsible for the operations, construction, and maintenance of theBrownsville PUB water and wastewater utility system. Maintenance and repairs of water mains, water service lines, water meters, watermain valves and hydrants, wastewater force mains, gravity mains, new water and wastewater line extensions, special projects, wateraudits, manage daily department activities, generate reports, and provide support to other departments.
The Water/Wastewater Department objective is to effectively provide and maintain high quality service for Brownsville PUB internal andexternal customers. To complete all functions of the department by enhancing reliability, responsiveness, and total commitment inproviding a safe working environment to our employees and to the safe delivery of quality services to our customers.
EFFICIENCY MEASURES
5.00%
10.00%
15.00%
20.00%
FY 2013ACTUAL
FY 2014ACTUAL
FY 2015ESTIMATEDYEAR END
ACTUAL
FY 2016APPROVED
BUDGET
10% 10%
13% 13%
Water Losses
87
80
75 76
70.00
75.00
80.00
85.00
90.00
FY 2013ACTUAL
FY 2014ACTUAL
FY 2015ESTIMATEDYEAR END
ACTUAL
FY 2016APPROVED
BUDGET
Number of Connections Per Mile

- 141 -
DEPARTMENT 3150 - WATER & WASTEWATER OPERATIONS AND CONSTRUCTION
ACCOUNTDESCRIPTION
ACTUAL FY2012
ACTUAL FY 2013
ACTUAL FY 2014
AMENDED BUDGETFY 2015
UNAUDITED YTD ACTUAL
SEPT. 2015
APPROVEDBUDGETFY 2016
O&M PERSONNEL6101 Supervision 98,047$ 117,853$ 173,309$ 103,436$ 154,490$ 129,251$ 6110 Clerical staff 53,477 66,921 72,290 72,613 74,108 72,613 6115 Operational staff 1,079,302 1,213,953 1,300,466 1,201,606 1,275,948 1,438,408 6130 Overtime 189,404 92,997 140,710 130,078 242,481 200,928 6201 T.M.R.S. 227,049 217,106 236,133 187,859 239,680 206,189 6205 F.I.C.A. 85,748 89,048 99,434 85,366 105,674 101,697 6206 Suta 7,193 - 448 - 5,468 - 6210 Medicare 20,054 20,826 23,255 19,965 24,714 23,784 6214 Dental Insurance 12,004 13,602 14,486 15,345 14,233 18,133 6215 Hospitalization insurance 315,873 343,864 350,848 370,077 344,302 430,327 6220 Life Insurance 1,800 2,084 2,247 11,290 2,188 13,325 6221 Long Term Disability Insurance 3,154 3,647 3,938 4,819 3,830 5,741 6225 Workers Compensation 51,016 41,928 42,613 34,422 45,270 41,007 6230 Vacation leave 10,076 5,069 7,921 16,614 2,455 30,014 6235 Sick leave 33,692 (14,069) 4,180 18,306 (3,350) 32,990 6260 Vacancy Savings - - - (105,210) - (124,024)
O&M PERSONNEL TOTAL 2,187,888 2,214,827 2,472,276 2,166,585 2,531,492 2,620,383
O&M NON-PERSONNEL7105 Books & periodicals - - 265 - - - 7110 Dues & memberships 2,874 1,478 905 2,500 1,632 1,500 7120 Office supplies 6,523 6,518 6,242 7,000 5,891 5,000 7125 Photo equipment/supplies - 192 - 500 - 250 7130 Postage/shipping charges 194 118 92 500 65 300 7135 Telephone expenses 456 - - - - - 7140 Training expenses 10,750 4,384 2,598 - 6,000 3,950 7145 Travel expenses 362 300 1,560 - 1,095 3,950 7180 Utilities - departmental 41,282 36,733 39,459 38,300 47,051 39,000 7201 Barricades & signs 4,408 1,792 1,922 3,500 1,795 3,500 7203 Sand, Caliche, Gravel, Concrete etc 72,987 134,326 125,777 136,000 250,573 205,000 7210 Landscaping/Trade a Tree Program 1,952 3,210 2,002 2,500 5,405 5,000 7215 Laundry & janitorial supplies 669 44 32 700 - 700 7225 Safety supplies 8,925 9,316 21,608 18,500 34,949 32,000 7293 Chemicals - other 453 876 1,121 1,500 1,550 1,500 7299 Other materials & supplies 495,021 221,921 248,043 260,000 312,105 265,000 7315 Food, meals, ice, water 3,142 2,580 2,227 2,850 2,008 2,000 7325 Rental of equip/storage/land 8,794 6,669 2,439 8,000 3,078 7,500 7335 Wearing apparel & dry goods 19,471 25,668 20,696 21,000 22,818 24,000 7415 Fuels & lubricants 196,447 168,958 189,222 180,000 174,480 180,000 7501 Maint. of buildings & structures 8,331 5,475 6,707 6,000 3,491 5,000 7505 Maint. of communication equipment 468 260 561 925 294 925 7515 Maint. of major equipment 10,643 2,934 11,670 18,000 20 13,000 7520 Maint. of minor equipment 1,214 1,753 1,710 900 3,830 3,500 7575 Maint. of water meters 236,565 207,036 218,467 225,000 178,744 200,000 7577 Maint. of distribution mains 22,457 117,088 129,656 120,000 146,633 120,000 7585 Maint. of sewer force mains - 20,201 18,846 17,000 21,814 30,000 7586 Maint. of sewer gravity lines - 57,737 145,077 162,500 165,133 140,000 7599 Maintenance / other 8,947 13,954 20,943 25,000 14,499 22,000 7630 Construction contractor services 264,818 162,922 306,237 295,000 390,600 290,000 7635 Software maintenance service fees 656 - - 3,500 - 3,500 7645 Maintenance services 275 360 317 1,498 - 1,150 7655 Hauling Services 65,017 94,301 115,850 112,000 127,591 112,000 7699 Other services 172,037 356,058 233,130 190,000 308,308 205,000 7801 Communication equipment - - - 22,800 19,755 30,000 7805 Computer equipment 1,050 482 - 8,400 - 5,400 7806 Software licenses - new 1,040 - - - - - 7820 Office furniture & equipment 1,920 2,483 1,476 1,000 1,213 17,000 7899 Other minor tools & equipment 85,526 82,307 51,659 79,440 43,479 75,440
O&M NON-PERSONNEL TOTAL 1,755,676 1,750,435 1,928,518 1,972,313 2,295,899 2,054,065 Total 3,943,564$ 3,965,262$ 4,400,794$ 4,138,898$ 4,827,392$ 4,674,448$
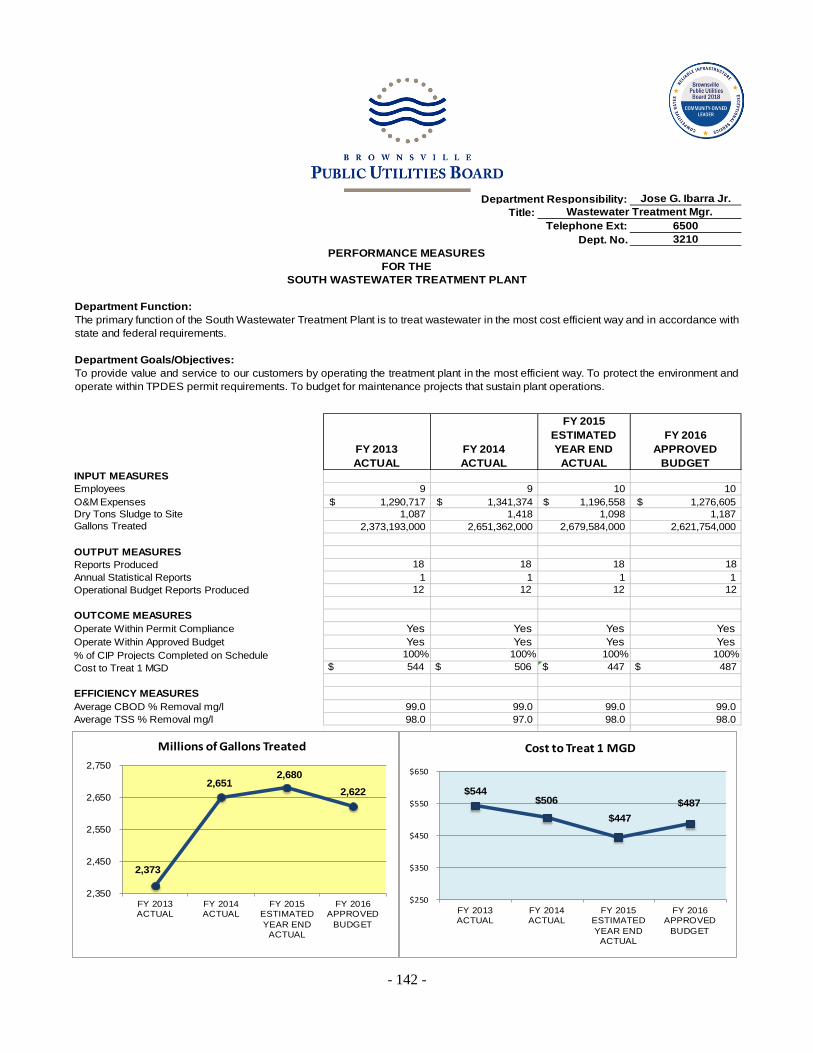
- 142 -
Department Responsibility: Jose G. Ibarra Jr.
Title: Wastewater Treatment Mgr.Telephone Ext: 6500
Dept. No. 3210PERFORMANCE MEASURES
FOR THESOUTH WASTEWATER TREATMENT PLANT
Department Function:
Department Goals/Objectives:
FY 2013 ACTUAL
FY 2014 ACTUAL
FY 2015 ESTIMATEDYEAR END
ACTUAL
FY 2016 APPROVED
BUDGETINPUT MEASURESEmployees 9 9 10 10 O&M Expenses 1,290,717$ 1,341,374$ 1,196,558$ 1,276,605$
1,087 1,418 1,098 1,187 Gallons Treated 2,373,193,000 2,651,362,000 2,679,584,000 2,621,754,000
OUTPUT MEASURES 18 18 18 18
1 1 1 1 12 12 12 12
OUTCOME MEASURESYes Yes Yes YesYes Yes Yes Yes
100% 100% 100% 100% $ 544 $ 506 $ 447 $ 487
99.0 99.0 99.0 99.0 98.0 97.0 98.0 98.0
EFFICIENCY MEASURESAverage CBOD % Removal mg/lAverage TSS % Removal mg/l
Operational Budget Reports Produced
Operate Within Permit ComplianceOperate Within Approved Budget% of CIP Projects Completed on ScheduleCost to Treat 1 MGD
Annual Statistical Reports
The primary function of the South Wastewater Treatment Plant is to treat wastewater in the most cost efficient way and in accordance withstate and federal requirements.
To provide value and service to our customers by operating the treatment plant in the most efficient way. To protect the environment andoperate within TPDES permit requirements. To budget for maintenance projects that sustain plant operations.
Dry Tons Sludge to Site
Reports Produced
$544 $506
$447 $487
$250
$350
$450
$550
$650
FY 2013ACTUAL
FY 2014ACTUAL
FY 2015ESTIMATEDYEAR END
ACTUAL
FY 2016APPROVED
BUDGET
Cost to Treat 1 MGD
2,373
2,651 2,680
2,622
2,350
2,450
2,550
2,650
2,750
FY 2013ACTUAL
FY 2014ACTUAL
FY 2015ESTIMATEDYEAR END
ACTUAL
FY 2016APPROVED
BUDGET
Millions of Gallons Treated
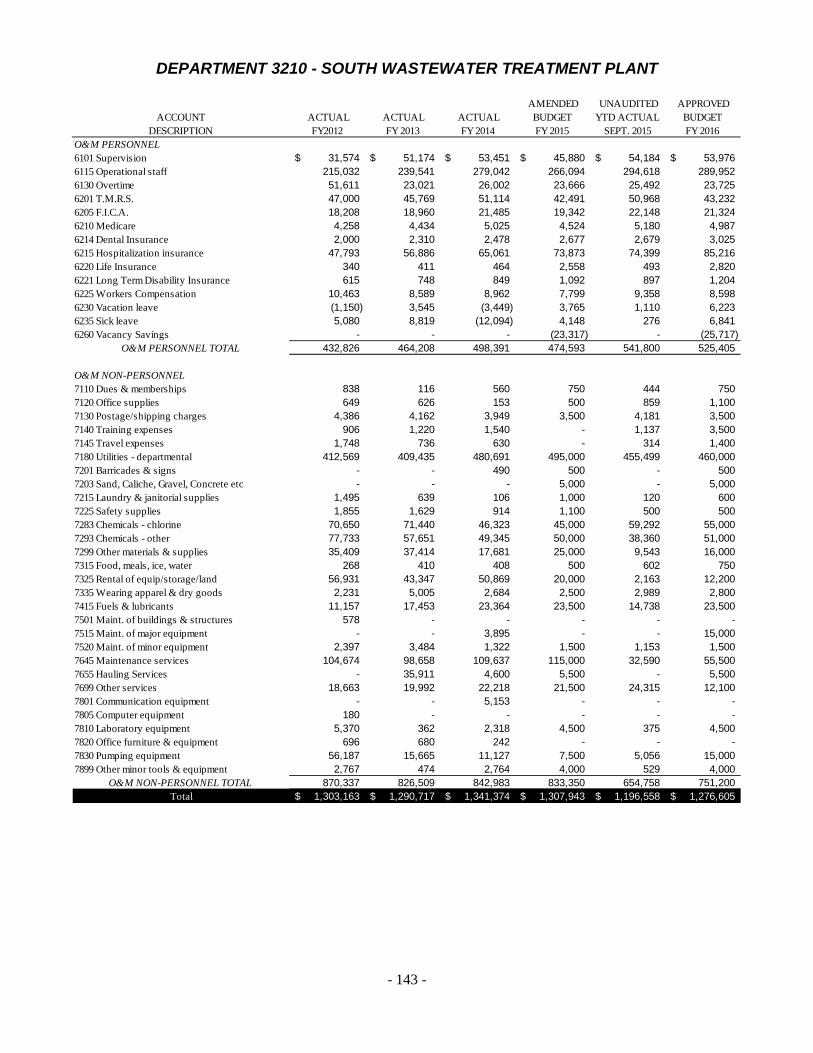
- 143 -
DEPARTMENT 3210 - SOUTH WASTEWATER TREATMENT PLANT
ACCOUNTDESCRIPTION
ACTUAL FY2012
ACTUAL FY 2013
ACTUAL FY 2014
AMENDED BUDGETFY 2015
UNAUDITED YTD ACTUAL
SEPT. 2015
APPROVEDBUDGETFY 2016
O&M PERSONNEL6101 Supervision 31,574$ 51,174$ 53,451$ 45,880$ 54,184$ 53,976$ 6115 Operational staff 215,032 239,541 279,042 266,094 294,618 289,952 6130 Overtime 51,611 23,021 26,002 23,666 25,492 23,725 6201 T.M.R.S. 47,000 45,769 51,114 42,491 50,968 43,232 6205 F.I.C.A. 18,208 18,960 21,485 19,342 22,148 21,324 6210 Medicare 4,258 4,434 5,025 4,524 5,180 4,987 6214 Dental Insurance 2,000 2,310 2,478 2,677 2,679 3,025 6215 Hospitalization insurance 47,793 56,886 65,061 73,873 74,399 85,216 6220 Life Insurance 340 411 464 2,558 493 2,820 6221 Long Term Disability Insurance 615 748 849 1,092 897 1,204 6225 Workers Compensation 10,463 8,589 8,962 7,799 9,358 8,598 6230 Vacation leave (1,150) 3,545 (3,449) 3,765 1,110 6,223 6235 Sick leave 5,080 8,819 (12,094) 4,148 276 6,841 6260 Vacancy Savings - - - (23,317) - (25,717)
O&M PERSONNEL TOTAL 432,826 464,208 498,391 474,593 541,800 525,405
O&M NON-PERSONNEL7110 Dues & memberships 838 116 560 750 444 750 7120 Office supplies 649 626 153 500 859 1,100 7130 Postage/shipping charges 4,386 4,162 3,949 3,500 4,181 3,500 7140 Training expenses 906 1,220 1,540 - 1,137 3,500 7145 Travel expenses 1,748 736 630 - 314 1,400 7180 Utilities - departmental 412,569 409,435 480,691 495,000 455,499 460,000 7201 Barricades & signs - - 490 500 - 500 7203 Sand, Caliche, Gravel, Concrete etc - - - 5,000 - 5,000 7215 Laundry & janitorial supplies 1,495 639 106 1,000 120 600 7225 Safety supplies 1,855 1,629 914 1,100 500 500 7283 Chemicals - chlorine 70,650 71,440 46,323 45,000 59,292 55,000 7293 Chemicals - other 77,733 57,651 49,345 50,000 38,360 51,000 7299 Other materials & supplies 35,409 37,414 17,681 25,000 9,543 16,000 7315 Food, meals, ice, water 268 410 408 500 602 750 7325 Rental of equip/storage/land 56,931 43,347 50,869 20,000 2,163 12,200 7335 Wearing apparel & dry goods 2,231 5,005 2,684 2,500 2,989 2,800 7415 Fuels & lubricants 11,157 17,453 23,364 23,500 14,738 23,500 7501 Maint. of buildings & structures 578 - - - - - 7515 Maint. of major equipment - - 3,895 - - 15,000 7520 Maint. of minor equipment 2,397 3,484 1,322 1,500 1,153 1,500 7645 Maintenance services 104,674 98,658 109,637 115,000 32,590 55,500 7655 Hauling Services - 35,911 4,600 5,500 - 5,500 7699 Other services 18,663 19,992 22,218 21,500 24,315 12,100 7801 Communication equipment - - 5,153 - - - 7805 Computer equipment 180 - - - - - 7810 Laboratory equipment 5,370 362 2,318 4,500 375 4,500 7820 Office furniture & equipment 696 680 242 - - - 7830 Pumping equipment 56,187 15,665 11,127 7,500 5,056 15,000 7899 Other minor tools & equipment 2,767 474 2,764 4,000 529 4,000
O&M NON-PERSONNEL TOTAL 870,337 826,509 842,983 833,350 654,758 751,200 Total 1,303,163$ 1,290,717$ 1,341,374$ 1,307,943$ 1,196,558$ 1,276,605$
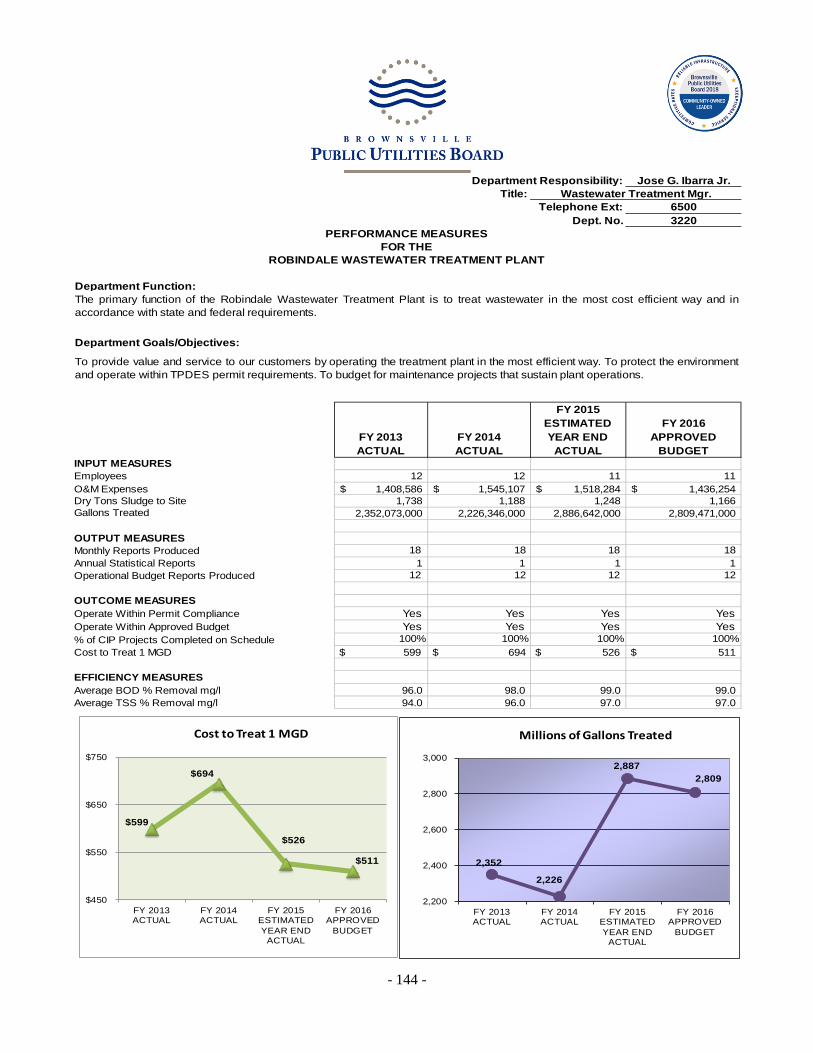
- 144 -
Department Responsibility: Jose G. Ibarra Jr.
Title: Wastewater Treatment Mgr.Telephone Ext: 6500
Dept. No. 3220PERFORMANCE MEASURES
FOR THEROBINDALE WASTEWATER TREATMENT PLANT
Department Function:
Department Goals/Objectives:
FY 2013ACTUAL
FY 2014ACTUAL
FY 2015ESTIMATEDYEAR END
ACTUAL
FY 2016APPROVED
BUDGETINPUT MEASURESEmployees 12 12 11 11 O&M Expenses 1,408,586$ 1,545,107$ 1,518,284$ 1,436,254$
1,738 1,188 1,248 1,166 Gallons Treated 2,352,073,000 2,226,346,000 2,886,642,000 2,809,471,000
OUTPUT MEASURES 18 18 18 18
1 1 1 1 12 12 12 12
OUTCOME MEASURESYes Yes Yes YesYes Yes Yes Yes
100% 100% 100% 100% $ 599 $ 694 $ 526 $ 511
96.0 98.0 99.0 99.0 94.0 96.0 97.0 97.0
EFFICIENCY MEASURESAverage BOD % Removal mg/lAverage TSS % Removal mg/l
Annual Statistical ReportsOperational Budget Reports Produced
Operate Within Permit ComplianceOperate Within Approved Budget% of CIP Projects Completed on ScheduleCost to Treat 1 MGD
Monthly Reports Produced
The primary function of the Robindale Wastewater Treatment Plant is to treat wastewater in the most cost efficient way and inaccordance with state and federal requirements.
To provide value and service to our customers by operating the treatment plant in the most efficient way. To protect the environmentand operate within TPDES permit requirements. To budget for maintenance projects that sustain plant operations.
Dry Tons Sludge to Site
2,352
2,226
2,887 2,809
2,200
2,400
2,600
2,800
3,000
FY 2013ACTUAL
FY 2014ACTUAL
FY 2015ESTIMATEDYEAR END
ACTUAL
FY 2016APPROVED
BUDGET
Millions of Gallons Treated
$599
$694
$526
$511
$450
$550
$650
$750
FY 2013ACTUAL
FY 2014ACTUAL
FY 2015ESTIMATEDYEAR END
ACTUAL
FY 2016APPROVED
BUDGET
Cost to Treat 1 MGD
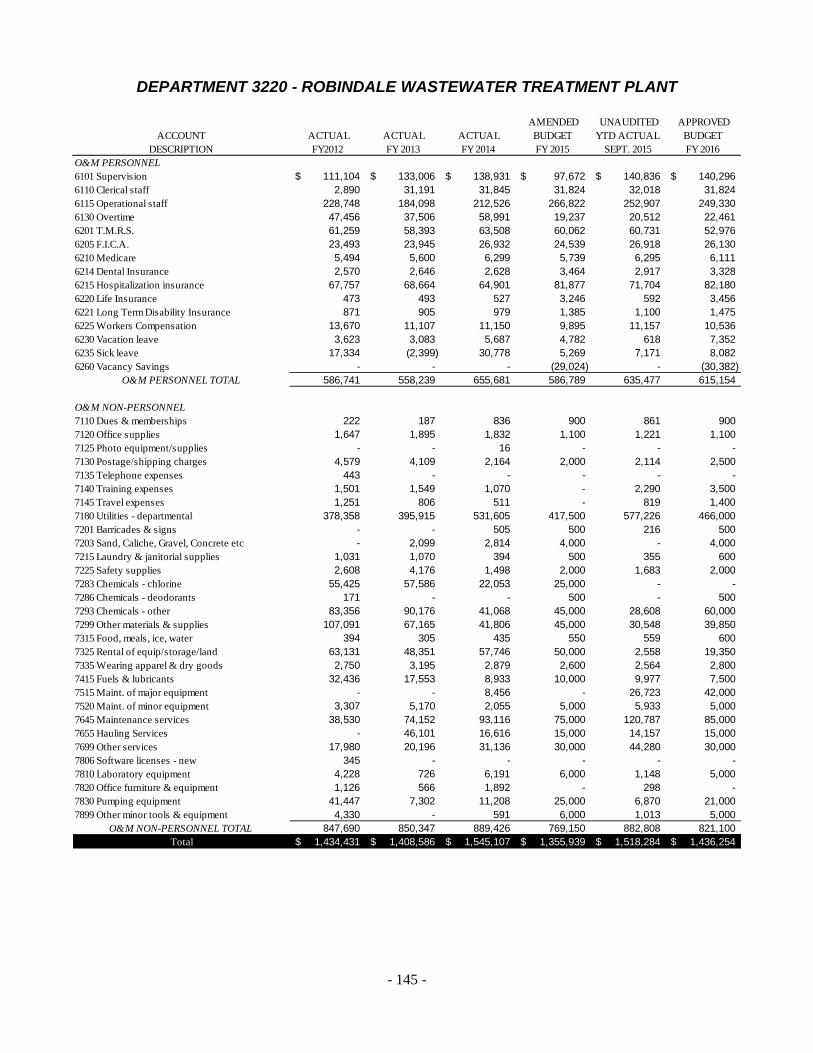
- 145 -
DEPARTMENT 3220 - ROBINDALE WASTEWATER TREATMENT PLANT
ACCOUNTDESCRIPTION
ACTUAL FY2012
ACTUAL FY 2013
ACTUAL FY 2014
AMENDED BUDGETFY 2015
UNAUDITED YTD ACTUAL
SEPT. 2015
APPROVEDBUDGETFY 2016
O&M PERSONNEL6101 Supervision 111,104$ 133,006$ 138,931$ 97,672$ 140,836$ 140,296$ 6110 Clerical staff 2,890 31,191 31,845 31,824 32,018 31,824 6115 Operational staff 228,748 184,098 212,526 266,822 252,907 249,330 6130 Overtime 47,456 37,506 58,991 19,237 20,512 22,461 6201 T.M.R.S. 61,259 58,393 63,508 60,062 60,731 52,976 6205 F.I.C.A. 23,493 23,945 26,932 24,539 26,918 26,130 6210 Medicare 5,494 5,600 6,299 5,739 6,295 6,111 6214 Dental Insurance 2,570 2,646 2,628 3,464 2,917 3,328 6215 Hospitalization insurance 67,757 68,664 64,901 81,877 71,704 82,180 6220 Life Insurance 473 493 527 3,246 592 3,456 6221 Long Term Disability Insurance 871 905 979 1,385 1,100 1,475 6225 Workers Compensation 13,670 11,107 11,150 9,895 11,157 10,536 6230 Vacation leave 3,623 3,083 5,687 4,782 618 7,352 6235 Sick leave 17,334 (2,399) 30,778 5,269 7,171 8,082 6260 Vacancy Savings - - - (29,024) - (30,382)
O&M PERSONNEL TOTAL 586,741 558,239 655,681 586,789 635,477 615,154
O&M NON-PERSONNEL7110 Dues & memberships 222 187 836 900 861 900 7120 Office supplies 1,647 1,895 1,832 1,100 1,221 1,100 7125 Photo equipment/supplies - - 16 - - - 7130 Postage/shipping charges 4,579 4,109 2,164 2,000 2,114 2,500 7135 Telephone expenses 443 - - - - - 7140 Training expenses 1,501 1,549 1,070 - 2,290 3,500 7145 Travel expenses 1,251 806 511 - 819 1,400 7180 Utilities - departmental 378,358 395,915 531,605 417,500 577,226 466,000 7201 Barricades & signs - - 505 500 216 500 7203 Sand, Caliche, Gravel, Concrete etc - 2,099 2,814 4,000 - 4,000 7215 Laundry & janitorial supplies 1,031 1,070 394 500 355 600 7225 Safety supplies 2,608 4,176 1,498 2,000 1,683 2,000 7283 Chemicals - chlorine 55,425 57,586 22,053 25,000 - - 7286 Chemicals - deodorants 171 - - 500 - 500 7293 Chemicals - other 83,356 90,176 41,068 45,000 28,608 60,000 7299 Other materials & supplies 107,091 67,165 41,806 45,000 30,548 39,850 7315 Food, meals, ice, water 394 305 435 550 559 600 7325 Rental of equip/storage/land 63,131 48,351 57,746 50,000 2,558 19,350 7335 Wearing apparel & dry goods 2,750 3,195 2,879 2,600 2,564 2,800 7415 Fuels & lubricants 32,436 17,553 8,933 10,000 9,977 7,500 7515 Maint. of major equipment - - 8,456 - 26,723 42,000 7520 Maint. of minor equipment 3,307 5,170 2,055 5,000 5,933 5,000 7645 Maintenance services 38,530 74,152 93,116 75,000 120,787 85,000 7655 Hauling Services - 46,101 16,616 15,000 14,157 15,000 7699 Other services 17,980 20,196 31,136 30,000 44,280 30,000 7806 Software licenses - new 345 - - - - - 7810 Laboratory equipment 4,228 726 6,191 6,000 1,148 5,000 7820 Office furniture & equipment 1,126 566 1,892 - 298 - 7830 Pumping equipment 41,447 7,302 11,208 25,000 6,870 21,000 7899 Other minor tools & equipment 4,330 - 591 6,000 1,013 5,000
O&M NON-PERSONNEL TOTAL 847,690 850,347 889,426 769,150 882,808 821,100 Total 1,434,431$ 1,408,586$ 1,545,107$ 1,355,939$ 1,518,284$ 1,436,254$
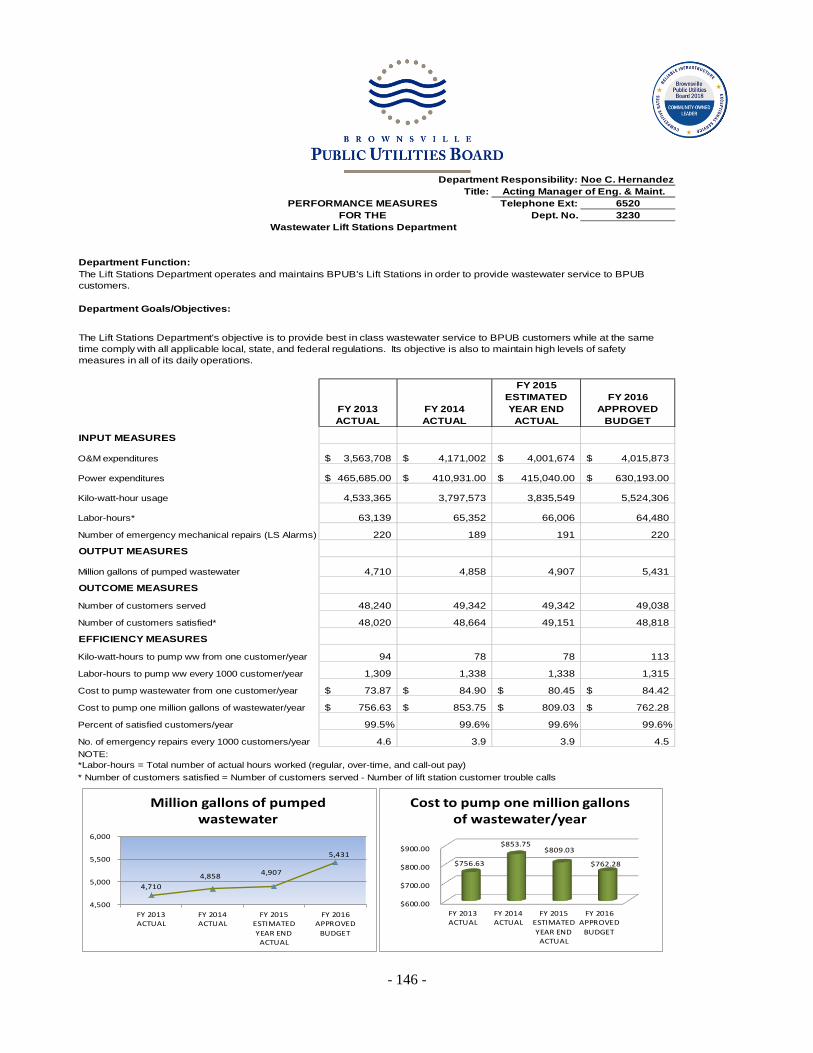
- 146 -
Department Responsibility: Noe C. HernandezTitle:
Telephone Ext: 6520Dept. No. 3230
Wastewater Lift Stations Department
Department Function:
Department Goals/Objectives:
FY 2013ACTUAL
FY 2014ACTUAL
FY 2015ESTIMATEDYEAR END
ACTUAL
FY 2016APPROVED
BUDGET
INPUT MEASURES
O&M expenditures 3,563,708$ 4,171,002$ 4,001,674$ 4,015,873$
Power expenditures 465,685.00$ 410,931.00$ 415,040.00$ 630,193.00$
Kilo-watt-hour usage 4,533,365 3,797,573 3,835,549 5,524,306
Labor-hours* 63,139 65,352 66,006 64,480
Number of emergency mechanical repairs (LS Alarms) 220 189 191 220
OUTPUT MEASURES
Million gallons of pumped wastewater 4,710 4,858 4,907 5,431
OUTCOME MEASURES
Number of customers served 48,240 49,342 49,342 49,038
Number of customers satisfied* 48,020 48,664 49,151 48,818
Kilo-watt-hours to pump ww from one customer/year 94 78 78 113
Labor-hours to pump ww every 1000 customer/year 1,309 1,338 1,338 1,315
Cost to pump wastewater from one customer/year 73.87$ 84.90$ 80.45$ 84.42$
Cost to pump one million gallons of wastewater/year 756.63$ 853.75$ 809.03$ 762.28$
Percent of satisfied customers/year 99.5% 99.6% 99.6% 99.6%
No. of emergency repairs every 1000 customers/year 4.6 3.9 3.9 4.5 NOTE:*Labor-hours = Total number of actual hours worked (regular, over-time, and call-out pay)* Number of customers satisfied = Number of customers served - Number of lift station customer trouble calls
PERFORMANCE MEASURESFOR THE
The Lift Stations Department's objective is to provide best in class wastewater service to BPUB customers while at the same time comply with all applicable local, state, and federal regulations. Its objective is also to maintain high levels of safety measures in all of its daily operations.
EFFICIENCY MEASURES
The Lift Stations Department operates and maintains BPUB's Lift Stations in order to provide wastewater service to BPUB customers.
Acting Manager of Eng. & Maint.
4,710 4,858 4,907
5,431
4,500
5,000
5,500
6,000
FY 2013ACTUAL
FY 2014ACTUAL
FY 2015ESTIMATEDYEAR END
ACTUAL
FY 2016APPROVED
BUDGET
Million gallons of pumped wastewater
$600.00
$700.00
$800.00
$900.00
FY 2013ACTUAL
FY 2014ACTUAL
FY 2015ESTIMATEDYEAR END
ACTUAL
FY 2016APPROVED
BUDGET
$756.63
$853.75 $809.03
$762.28
Cost to pump one million gallons of wastewater/year
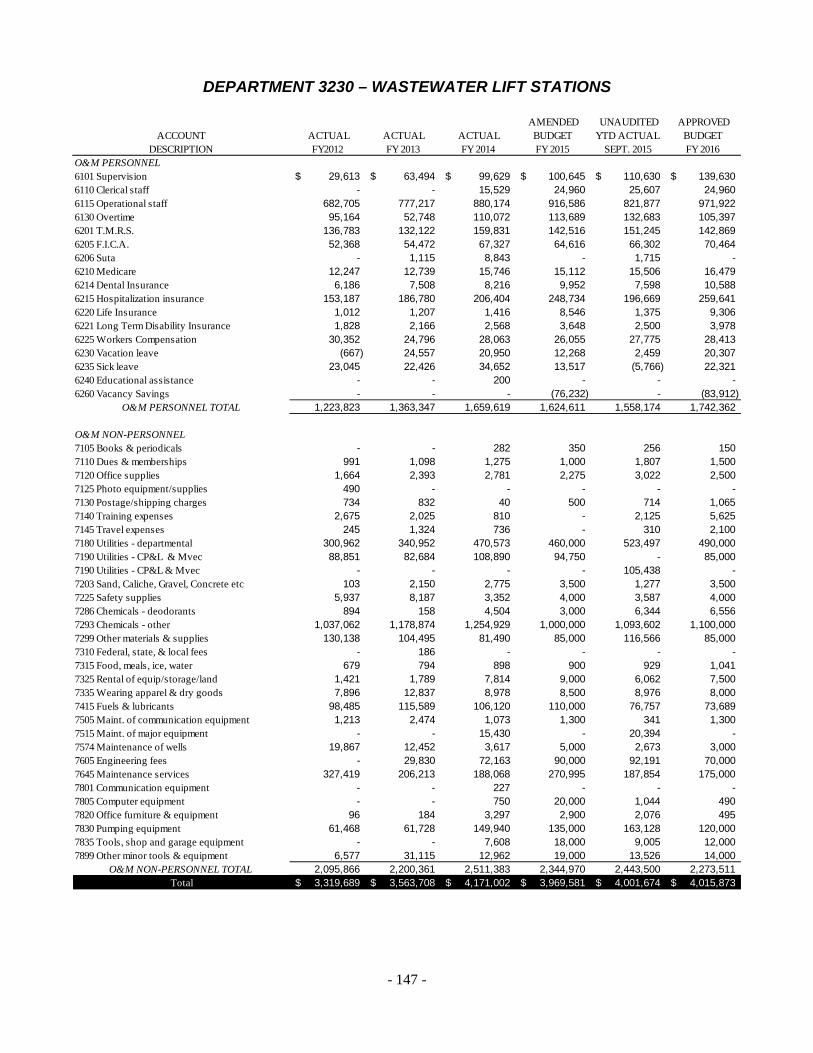
- 147 -
DEPARTMENT 3230 – WASTEWATER LIFT STATIONS
ACCOUNTDESCRIPTION
ACTUAL FY2012
ACTUAL FY 2013
ACTUAL FY 2014
AMENDED BUDGETFY 2015
UNAUDITED YTD ACTUAL
SEPT. 2015
APPROVEDBUDGETFY 2016
O&M PERSONNEL6101 Supervision 29,613$ 63,494$ 99,629$ 100,645$ 110,630$ 139,630$ 6110 Clerical staff - - 15,529 24,960 25,607 24,960 6115 Operational staff 682,705 777,217 880,174 916,586 821,877 971,922 6130 Overtime 95,164 52,748 110,072 113,689 132,683 105,397 6201 T.M.R.S. 136,783 132,122 159,831 142,516 151,245 142,869 6205 F.I.C.A. 52,368 54,472 67,327 64,616 66,302 70,464 6206 Suta - 1,115 8,843 - 1,715 - 6210 Medicare 12,247 12,739 15,746 15,112 15,506 16,479 6214 Dental Insurance 6,186 7,508 8,216 9,952 7,598 10,588 6215 Hospitalization insurance 153,187 186,780 206,404 248,734 196,669 259,641 6220 Life Insurance 1,012 1,207 1,416 8,546 1,375 9,306 6221 Long Term Disability Insurance 1,828 2,166 2,568 3,648 2,500 3,978 6225 Workers Compensation 30,352 24,796 28,063 26,055 27,775 28,413 6230 Vacation leave (667) 24,557 20,950 12,268 2,459 20,307 6235 Sick leave 23,045 22,426 34,652 13,517 (5,766) 22,321 6240 Educational assistance - - 200 - - - 6260 Vacancy Savings - - - (76,232) - (83,912)
O&M PERSONNEL TOTAL 1,223,823 1,363,347 1,659,619 1,624,611 1,558,174 1,742,362
O&M NON-PERSONNEL7105 Books & periodicals - - 282 350 256 150 7110 Dues & memberships 991 1,098 1,275 1,000 1,807 1,500 7120 Office supplies 1,664 2,393 2,781 2,275 3,022 2,500 7125 Photo equipment/supplies 490 - - - - - 7130 Postage/shipping charges 734 832 40 500 714 1,065 7140 Training expenses 2,675 2,025 810 - 2,125 5,625 7145 Travel expenses 245 1,324 736 - 310 2,100 7180 Utilities - departmental 300,962 340,952 470,573 460,000 523,497 490,000 7190 Utilities - CP&L & Mvec 88,851 82,684 108,890 94,750 - 85,000 7190 Utilities - CP&L & Mvec - - - - 105,438 - 7203 Sand, Caliche, Gravel, Concrete etc 103 2,150 2,775 3,500 1,277 3,500 7225 Safety supplies 5,937 8,187 3,352 4,000 3,587 4,000 7286 Chemicals - deodorants 894 158 4,504 3,000 6,344 6,556 7293 Chemicals - other 1,037,062 1,178,874 1,254,929 1,000,000 1,093,602 1,100,000 7299 Other materials & supplies 130,138 104,495 81,490 85,000 116,566 85,000 7310 Federal, state, & local fees - 186 - - - - 7315 Food, meals, ice, water 679 794 898 900 929 1,041 7325 Rental of equip/storage/land 1,421 1,789 7,814 9,000 6,062 7,500 7335 Wearing apparel & dry goods 7,896 12,837 8,978 8,500 8,976 8,000 7415 Fuels & lubricants 98,485 115,589 106,120 110,000 76,757 73,689 7505 Maint. of communication equipment 1,213 2,474 1,073 1,300 341 1,300 7515 Maint. of major equipment - - 15,430 - 20,394 - 7574 Maintenance of wells 19,867 12,452 3,617 5,000 2,673 3,000 7605 Engineering fees - 29,830 72,163 90,000 92,191 70,000 7645 Maintenance services 327,419 206,213 188,068 270,995 187,854 175,000 7801 Communication equipment - - 227 - - - 7805 Computer equipment - - 750 20,000 1,044 490 7820 Office furniture & equipment 96 184 3,297 2,900 2,076 495 7830 Pumping equipment 61,468 61,728 149,940 135,000 163,128 120,000 7835 Tools, shop and garage equipment - - 7,608 18,000 9,005 12,000 7899 Other minor tools & equipment 6,577 31,115 12,962 19,000 13,526 14,000
O&M NON-PERSONNEL TOTAL 2,095,866 2,200,361 2,511,383 2,344,970 2,443,500 2,273,511 Total 3,319,689$ 3,563,708$ 4,171,002$ 3,969,581$ 4,001,674$ 4,015,873$

- 148 -
Department Responsibility:
Department Manager:Telephone Ext: 6570
Dept. No. 3310
PERFORMANCE MEASURESFOR THE
WATER & WASTEWATER ENGINEERING DEPARTMENT
Department Function:
Department Goals/Objectives:
FY 2013ACTUAL
FY 2014ACTUAL
FY 2015ESTIMATEDYEAR END
ACTUAL
FY 2016APPROVED
BUDGETINPUT MEASURESNew Connections - Number of Employees (transferred to Dept. 6110) 2 2 2 - W/WW Engineering - Number of Engineers/Senior Coordinators 10 10 8 12W/WW Engineering - Number of Field Coordinators/Inspectors 5 4 4 4
OUTPUT MEASURES 392 420 240 N/A
W/WW Engineering - Number of Projects Facilitated. 43 53 35 50W/WW Engineering - Number of Subdivision/Plats Reviewed*
OUTCOME MEASURES621 643 445 N/A
W/WW Engineering - Total Value of Projects in Millons $ 23.700$ 28.000$ 36.000$ 42.000$ W/WW Engineering - Impact Fees Invoiced
New Connections - Amount of New Connections per Employee 311 322 223 N/AW/WW Engineering - Dollars in Millions Facilitated per Employee on Projects 1.58$ 2.00$ 3.00$ 2.63$ W/WW Engineering - Amount of Subdivisions Reviewed per Employee*Note-Tw o Senior Coordinators review all Subdivisions/Plats
EFFICIENCY MEASURES
Department facilitates new water and wastewater connections; approves subdivision plats and commercial site plans in cooperation with the City;performs and oversees planning, design, inspection, and construction of water and wastewater infrastructure projects and BPUB FacilitiesImprovements. The department provides engineering services to raw water, water treatment plants, wastewater treatment plants, lift stations, andconstruction and operations in order to complete various projects. The department also facilitates grants, compiles information related to the Semi-Annual Report for the Impact Fee Program, and protects the public drinking water system through the prevention of cross connections.
1) To produce accurate invoices to customers in order to obtain new water and/or sewer service connections in a timely manner. 2) To produce reviewsfor the City in order to approve subdivisions and commercial site plans in compliance with BPUB Service Policies. 3) To provide internal data to outsideconsultants/contractors in order to complete planning, design, and construction projects with accuracy. 4) To perform construction inspection forcontractors in order to accept and approve water and wastewater infrastructure. 5) To produce engineering reports, plans, specifications, and costestimates for water and sewer facilities. 6) To help obtain grants to fund infrastructure projects. 7) To ensure the safety of the public water supply bypreventing cross connections through public education and compliance enforcement.
New Connections - Letters of Availability Generated
New Connections - Amount of new W&WW Connections
Omar Anzaldua Jr., P.E.W/WW Eng. Manager
43
53
35 50
$23.700 $28.000
$36.000 $42.000
0
20
40
60
80
FY 2013ACTUAL
FY 2014ACTUAL
FY 2015ESTIMATEDYEAR ENDACTUAL
FY 2016APPROVED
BUDGET
W/WW Engineering Projects
W/WW Engineering - Number of Projects Facilitated.W/WW Engineering - Total Value of Projects in Millons $
621 643
445 392 420
240
-
200
400
600
800
FY 2013ACTUAL
FY 2014ACTUAL
FY 2015ESTIMATEDYEAR ENDACTUAL
New Connections
New Connections - Amount of new W&WW Connections
New Connections - Letters of Availability Generated

- 149 -
DEPARTMENT 3310 - WATER & WASTEWATER ENGINEERING
ACCOUNTDESCRIPTION
ACTUAL FY2012
ACTUAL FY 2013
ACTUAL FY 2014
AMENDED BUDGETFY 2015
UNAUDITED YTD ACTUAL
SEPT. 2015
APPROVEDBUDGETFY 2016
O&M PERSONNEL6101 Supervision 92,928$ 138,372$ 152,265$ 29,688$ 57,135$ 117,275$ 6105 Administrative Staff 370,714 433,996 394,270 66,620 368,217 402,517 6110 Clerical staff 258,431 184,432 220,849 59,082 167,893 157,448 6115 Operational staff - - - - 4,723 - 6130 Overtime 14,270 12,964 1,075 3,366 2,452 2,759 6140 Severance Pay - 12,926 5,856 - - - 6201 T.M.R.S. 117,398 109,958 113,028 21,188 88,351 85,132 6205 F.I.C.A. 44,796 45,294 47,174 9,634 38,722 41,989 6206 Suta - 2,090 8,701 - - - 6210 Medicare 10,476 10,594 11,033 2,253 9,056 9,820 6214 Dental Insurance 4,167 3,703 3,672 968 2,946 3,570 6215 Hospitalization insurance 116,391 102,774 106,557 30,190 84,182 100,748 6220 Life Insurance 985 1,041 1,014 1,274 807 5,553 6221 Long Term Disability Insurance 1,894 1,914 1,992 544 1,558 2,370 6225 Workers Compensation 27,570 21,878 20,150 3,885 17,694 16,931 6230 Vacation leave (707) 27,382 8,420 1,876 4,592 11,415 6235 Sick leave 12,603 25,434 (3,704) 2,066 6,175 12,547 6260 Vacancy Savings - - - (11,241) - (47,168)
O&M PERSONNEL TOTAL 1,071,918 1,134,753 1,092,351 221,395 854,502 922,905
O&M NON-PERSONNEL7101 Advertising - - 1,491 - 1,159 - 7105 Books & periodicals - - 740 1,500 2,037 1,500 7110 Dues & memberships 1,311 580 1,704 2,700 1,874 2,220 7115 Educational material - - 266 300 - 300 7120 Office supplies 12,648 10,783 11,496 10,500 9,410 12,000 7125 Photo equipment/supplies 178 321 - 800 - 800 7130 Postage/shipping charges 440 1,221 1,176 1,500 321 800 7140 Training expenses 3,410 3,680 4,497 - 3,518 7,720 7145 Travel expenses 12,210 4,921 4,053 - 1,294 4,900 7225 Safety supplies 1,259 760 436 1,150 350 1,000 7299 Other materials & supplies 1,428 2,521 683 1,500 1,120 1,500 7310 Federal, state, & local fees 6,287 - - - - - 7315 Food, meals, ice, water 1,150 1,176 1,198 1,450 1,372 1,450 7320 Official functions 1,357 - - - - - 7325 Rental of equip/storage/land 12,203 10,353 11,985 12,600 8,204 10,000 7330 Right of way fees 7,450 8,089 6,292 - - - 7335 Wearing apparel & dry goods 2,735 2,117 2,239 2,000 1,513 2,000 7415 Fuels & lubricants 24,196 20,063 21,029 21,000 14,678 17,000 7505 Maint. of communication equipment - - - 400 - 400 7605 Engineering fees 75,351 91,876 90,253 80,000 44,274 62,000 7620 Environmental consulting fees - - - 25,000 - - 7635 Software maintenance service fees 2,120 1,415 1,415 1,600 1,415 - 7645 Maintenance services 675 - - 1,000 175 1,000 7699 Other services 54,490 8,080 208 30,000 1,750 3,125 7801 Communication equipment - 495 162 800 209 400 7805 Computer equipment 494 - 179 600 179 1,960 7806 Software licenses - new 690 590 - - - - 7820 Office furniture & equipment 1,113 939 971 1,600 525 1,600 7899 Other minor tools & equipment 1,438 - 3,149 3,000 - 2,000
O&M NON-PERSONNEL TOTAL 224,632 169,977 165,623 201,000 95,377 135,675 Total 1,296,550$ 1,304,731$ 1,257,974$ 422,395$ 949,879$ 1,058,580$
- 150 -
Department Responsibility: Fernando Saenz
Title: Assistant General Manager & COOTelephone Ext: 6266
Dept. No. 4105PERFORMANCE MEASURES
FOR THEOPERATIONS DEPARTMENT
Department Function:
Department Goals/Objectives:
The Assistant General Manager & Chief Operating Officer (AGM & COO) is the executive officer of the Brownsville PUB,which serves as the Assistant General Manager and which has responsibility for the operational functions of all the utilities. Itis the AGM & COO's responsibilty to support the General Manager & CEO to execute the plans and decisions of the Board,thereby directing and coordinating the activities of all uility employees. The AGM & COO ensures that all policies andresolutions passed by the Board are enforced and duly administered. In addition, the AGM & COO informs the GeneralManager and the Board of legislative matters, capital improvements, budget items, policies, and services offered tocustomers. The Director of Energy Services, Director of Operational Support Services, Director of Enviornmental Services,Director of Transmission, Distribution, Substations & Planning, and Director of Water & Wastewater Engineering, Planning& Treatment, Energy Risk Manager and Contracts Administrator directly report to the AGM & COO.
The department's objectives are to provide our customers, both internally and externally, with economical, reliable, andfriendly service. To efficiently direct all aspects of the utility systems. To effectively direct Strategic Planning efforts in orderto coordinate and prioritize goals and objectives. Identify, select, and retain a professional management team. Recognizeconstraints and limitations of State and Industry guidelines in addition to other applicable rules and regulations. Conductperiodic staff meetings and workshops.
ACCOUNTDESCRIPTION
ACTUAL FY2012
ACTUAL FY 2013
ACTUAL FY 2014
AMENDED BUDGETFY 2015
UNAUDITED YTD ACTUAL
SEPT. 2015
APPROVEDBUDGETFY 2016
O&M PERSONNEL6101 Supervision -$ -$ -$ 126,011$ 120,195$ 210,018$ 6105 Administrative Staff - - 4,904 75,005 72,697 75,005 6110 Clerical staff - - - - 3,050 - 6130 Overtime - - - - 191 - 6201 T.M.R.S. - - 695 27,378 27,206 35,827 6205 F.I.C.A. - - 305 12,463 9,516 17,671 6210 Medicare - - 71 2,915 2,944 4,133 6214 Dental Insurance - - 19 484 436 605 6215 Hospitalization insurance - - 370 12,345 10,900 16,042 6220 Life Insurance - - 8 1,648 246 2,337 6221 Long Term Disability Insurance - - 17 704 510 998 6225 Workers Compensation - - 148 5,025 7,253 7,126 6230 Vacation leave - - 361 2,426 20,847 4,474 6235 Sick leave - - 361 2,673 77,902 4,918 6242 Auto Benefits - - - 7,500 7,212 7,500 6250 Miscellaneous personnel benefits - - 1,000 - - - 6260 Vacancy Savings - - - (13,206) - (18,488)
O&M PERSONNEL TOTAL - - 8,259 263,371 361,104 368,165

- 151 -
DEPARTMENT 4105 – OPERATIONS
ACCOUNTDESCRIPTION
ACTUAL FY2012
ACTUAL FY 2013
ACTUAL FY 2014
AMENDED BUDGETFY 2015
UNAUDITED YTD ACTUAL
SEPT. 2015
APPROVEDBUDGETFY 2016
O&M NON-PERSONNEL7105 Books & periodicals - - - - 68 200 7110 Dues & memberships - - - 238 285 485 7120 Office supplies - - 229 500 14 1,000 7130 Postage/shipping charges - - - 350 - 350 7135 Telephone expenses - - 266 - 90 500 7140 Training expenses - - - - 4,830 5,575 7145 Travel expenses - - 452 - 16,201 20,950 7225 Safety supplies - - - - 176 - 7315 Food, meals, ice, water - - - - 39 200 7601 Legal Fees - - 53,666 - 164,580 110,000 7805 Computer equipment - - 1,390 - 739 750 7806 Software licenses - new - - - - - 85,000
O&M NON-PERSONNEL TOTAL - - 56,002 1,088 187,022 225,010 Total -$ -$ 64,261$ 264,459$ 548,126$ 593,175$

- 152 -
Department Responsibility: Lina AlvarezTitle: Energy Risk Management
Telephone Ext: 6378Dept. No. 4110
PERFORMANCE MEASURESFOR THE
ENERGY RISK MANAGEMENT DEPARTMENT
Department Function:
Department Goals/Objectives:
FY 2013*ACTUAL
FY 2014*ACTUAL
FY 2015ESTIMATEDYEAR END
ACTUAL
FY 2016APPROVED
BUDGETINPUT MEASURESO&M expenditures -$ 85,669$ 197,980$ 173,897$
OUTPUT MEASURES:ERM Reports (monthly) produced - 12 12 12 Audits Produced - 1 1 1 Developed Energy Risk Analysis - 2 2 2 Unsolicited Proposal Evaluations - 10 10 10 Energy Risk Management Policy Updated - 1 1 1 Review of Other Energy Risk Management Policies - 7 7 7 Review of Load Forecast, Generation Resource Availability & Costs - 5 5 5
OUTCOME MEASURESTransaction accountability review - yes yes yesIncrease Energy Risk Management Analysis - yes yes yesEstablish frequent policy review - yes yes yesEstablish a ERM Software - yes yes yes
* New Department in 2014
ERM independently monitors and reports the execution of energy risk management activities results inclusive of energy transactions,new generation resources risk exposure and evaluation of new strategies to the Risk Oversight Committee. Also, ERM reviews,processes, and directs new opportunities for long term power and incremental blocks of energy strategies needed. Perform calculationsof risk exposure for the sources of risk identified in the ERM policy using ROC-approved risk measurement methods (if any arenecessary). Temporarily adjust hedging and trading limits in order to reduce risk exposure of the organization in response to unusualadverse changes in market or operating conditions on an as-needed basis. Perform stress testing of the portfolio to determine thepotential impacts on organizational financial measures that could be caused by large, unexpected price movements.
Goals include third party external auditing of the power marketer provider. Reports that include power and gas price volatility and futurecurve projections to the Risk Oversight Comiittee. The Brownsville PUB Board has requested for Brownsville PUB staff toprocure/negotiate required energy to meet the native load demands and projections with least risk exposure possible

- 153 -
DEPARTMENT 4110 – ENERGY RISK MANAGEMENT
ACCOUNTDESCRIPTION
ACTUAL FY2012
ACTUAL FY 2013
ACTUAL FY 2014
AMENDED BUDGETFY 2015
UNAUDITED YTD ACTUAL
SEPT. 2015
APPROVEDBUDGETFY 2016
O&M PERSONNEL6101 Supervision -$ -$ 37,536$ 86,258$ 100,636$ 86,258$ 6105 Administrative Staff - - - 70,450 - - 6201 T.M.R.S. - - 5,323 11,694 13,778 10,843 6205 F.I.C.A. - - 2,321 9,716 6,200 5,348 6210 Medicare - - 543 2,169 1,450 1,251 6214 Dental Insurance - - 118 605 322 303 6215 Hospitalization insurance - - 2,383 16,604 6,915 5,810 6220 Life Insurance - - 47 921 131 707 6221 Long Term Disability Insurance - - 96 431 266 302 6225 Workers Compensation - - 938 3,740 2,516 2,156 6230 Vacation leave - - 15,849 1,041 (11,412) 1,367 6235 Sick leave - - 20,082 1,147 (11,415) 1,503 6260 Vacancy Savings - - - (5,701) - (5,649)
O&M PERSONNEL TOTAL - - 85,236 199,076 109,387 110,197
O&M NON-PERSONNEL7105 Books & periodicals - - - 300 - 300 7110 Dues & memberships - - - 500 - 500 7120 Office supplies - - 77 400 586 1,000 7130 Postage/shipping charges - - - 300 150 400 7140 Training expenses - - - - 2,049 1,500 7145 Travel expenses - - 356 - 2,807 2,000 7315 Food, meals, ice, water - - - 300 189 300 7605 Engineering fees - - - 30,000 11,000 - 7699 Other services - - - - 70,265 50,000 7805 Computer equipment - - - 1,857 1,547 1,200 7806 Software licenses - new - - - - - 5,000 7820 Office furniture & equipment - - - 5,000 - 1,500
O&M NON-PERSONNEL TOTAL - - 433 38,657 88,593 63,700 Total -$ -$ 85,669$ 237,733$ 197,980$ 173,897$

- 154 -
Department Responsibility: Vacant
Title: NERC Compliance AdministratorTelephone Ext: 6287
Dept. No. 4210
NERC Compliance Department
Department Function:
FY 2013* ACTUAL
FY 2014*ACTUAL
FY 2015 ESTIMATEDYEAR END
ACTUAL
FY 2016 APPROVED
BUDGETINPUT MEASURES
- - 3 3
-$ 80,558$ 230,673$ 260,506$ -$ 1,062$ 113,066$ 161,500$
OUTPUT MEASURES - - 4 4
- - 44 44
- - 40 40
- - 4 4
- - 4 4
- - 118 136
- - 862 982OUTCOME MEASURES
- - 10 28 - - 2 2 - - 2 2 - - 12 12
- - 100% 100%- - 100% 100%
* New Department in 2014
Compliance Coaching Program Workshops
Monthly Newsletter Submittals
% of NERC Complaince
O&M Non-Personnel Expense
Review of NERC Responsibility Matrix
Number of RSAWs, ERCOT operating guides, and NERC requirements
PERFORMANCE MEASURESFOR THE
The department's goals and objectives are to ensure that BPUB complies with all applicable federal, state, and local laws and regulations, and to continually and proactively review its operations and activities to comply with applicable requirements.
Number of 693 Policies and Procedures Reviewed
Yearly Misoperations Submittals
Quarterly Awareness Submittals for Employees with access to CCAs
% of Trainings Completed
EFFICIENCY MEASURES
The department is responsible for compliance in accordance with the NERC Standards and Regulations and ERCOT Guideliness to ensure the reliability of the Bulk Electric System. In addition, the department enforces compliance by overseeing and coordinating BPUB departments, such as Electrical Engineering, SCADA & Electrical Support Services, Substations & Relaying, Energy Control Center Operations, and Power Production.
Number of Employees
O&M Personnel Expense
Total Number of Training Hours for Online SOS & CIP Cyber Security
Department Goals/Objectives:
Number of CIP Policies and Procedures Reviewed
Quarterly Employee Verification Submittals for Authorized Personnel
Number of Trainings to Provide

- 155 -
DEPARTMENT 4210 – NERC COMPLIANCE
ACCOUNTDESCRIPTION
ACTUAL FY2012
ACTUAL FY 2013
ACTUAL FY 2014
AMENDED BUDGETFY 2015
UNAUDITED YTD ACTUAL
SEPT. 2015
APPROVEDBUDGETFY 2016
O&M PERSONNEL6101 Supervision -$ -$ -$ 75,691$ 11,258$ 75,691$ 6105 Administrative Staff - - 50,692 123,178 123,651 123,178 6201 T.M.R.S. - - 7,188 27,358 18,342 25,002 6205 F.I.C.A. - - 3,123 12,330 8,189 12,330 6210 Medicare - - 730 2,884 1,915 2,884 6214 Dental Insurance - - 220 908 577 908 6215 Hospitalization insurance - - 4,221 11,913 13,213 19,786 6220 Life Insurance - - 69 1,631 177 1,631 6221 Long Term Disability Insurance - - 136 696 350 696 6225 Workers Compensation - - 1,267 4,972 3,373 4,972 6230 Vacation leave - - 4,086 2,400 13,498 3,232 6235 Sick leave - - 8,824 2,644 36,128 3,552 6260 Vacancy Savings - - - (13,369) - (13,354)
O&M PERSONNEL TOTAL - - 80,558 253,234 230,673 260,506
O&M NON-PERSONNEL7105 Books & periodicals - - - 1,500 300 750 7110 Dues & memberships - - - 1,500 - 750 7120 Office supplies - - - 2,000 1,650 1,200 7130 Postage/shipping charges - - - 700 - 150 7135 Telephone expenses - - - 1,300 - 650 7140 Training expenses - - - - 405 5,000 7145 Travel expenses - - 1,062 - 12,471 10,000 7304 Hurricane Preparedness Expenses - - - 1,500 - 1,500 7305 ERCOT expenses - - - 125,000 95,656 125,000 7315 Food, meals, ice, water - - - 500 552 500 7325 Rental of equip/storage/land - - - - 290 - 7635 Software maintenance service fees - - - 5,000 - 5,000 7699 Other services - - - - 28 - 7805 Computer equipment - - - 2,500 - 2,500 7806 Software licenses - new - - - 6,000 - 5,000 7820 Office furniture & equipment - - - 3,500 1,714 3,500
O&M NON-PERSONNEL TOTAL - - 1,062 151,000 113,066 161,500 Total -$ -$ 81,621$ 404,234$ 343,739$ 422,006$
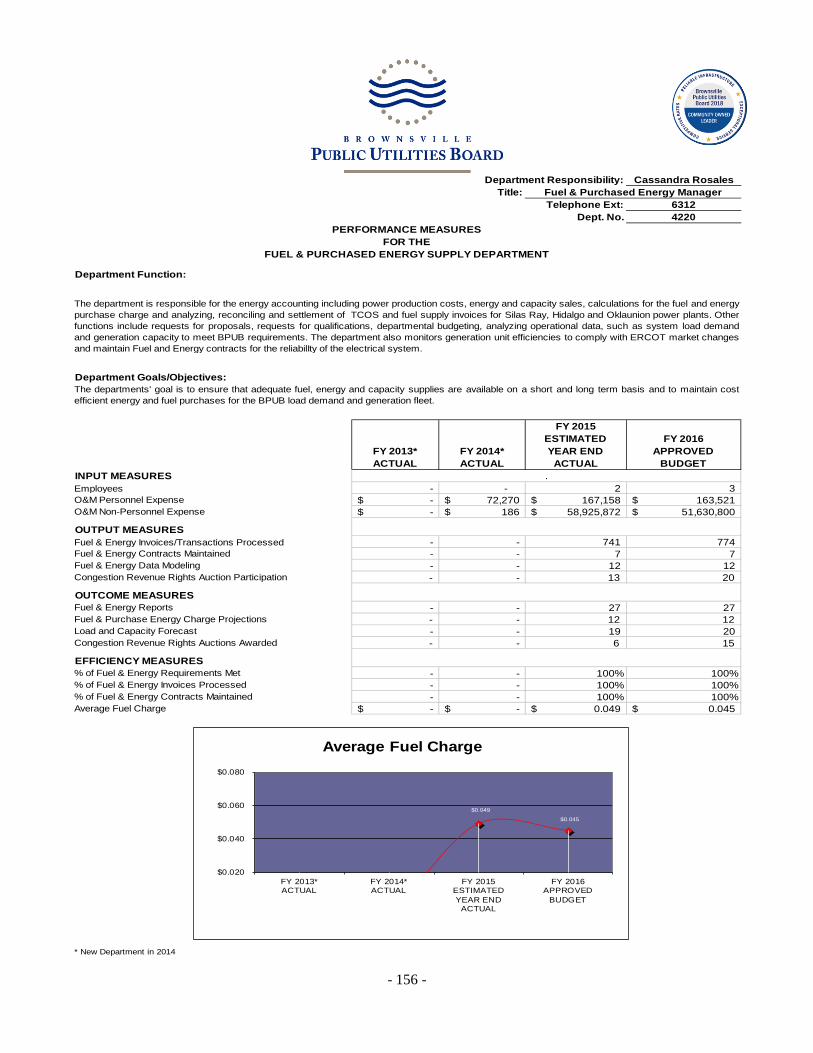
- 156 -
Department Responsibility: Cassandra Rosales
Title: Fuel & Purchased Energy ManagerTelephone Ext: 6312
Dept. No. 4220PERFORMANCE MEASURES
FOR THEFUEL & PURCHASED ENERGY SUPPLY DEPARTMENT
Department Function:
Department Goals/Objectives:
FY 2013*ACTUAL
FY 2014*ACTUAL
FY 2015ESTIMATEDYEAR END
ACTUAL
FY 2016APPROVED
BUDGET
- - 2 3 -$ 72,270$ 167,158$ 163,521$ -$ 186$ 58,925,872$ 51,630,800$
- - 741 774 - - 7 7 - - 12 12
- - 13 20
- - 27 27 - - 12 12
- - 19 20 - - 6 15
- - 100% 100%- - 100% 100%- - 100% 100%-$ -$ 0.049$ 0.045$
* New Department in 2014
Fuel & Energy ReportsFuel & Purchase Energy Charge ProjectionsLoad and Capacity ForecastCongestion Revenue Rights Auctions Awarded
EFFICIENCY MEASURES
% of Fuel & Energy Invoices Processed% of Fuel & Energy Contracts Maintained Average Fuel Charge
Fuel & Energy Data ModelingCongestion Revenue Rights Auction Participation
OUTCOME MEASURES
% of Fuel & Energy Requirements Met
Fuel & Energy Contracts Maintained
INPUT MEASURES .EmployeesO&M Personnel ExpenseO&M Non-Personnel Expense
OUTPUT MEASURES Fuel & Energy Invoices/Transactions Processed
The departments' goal is to ensure that adequate fuel, energy and capacity supplies are available on a short and long term basis and to maintain costefficient energy and fuel purchases for the BPUB load demand and generation fleet.
The department is responsible for the energy accounting including power production costs, energy and capacity sales, calculations for the fuel and energypurchase charge and analyzing, reconciling and settlement of TCOS and fuel supply invoices for Silas Ray, Hidalgo and Oklaunion power plants. Otherfunctions include requests for proposals, requests for qualifications, departmental budgeting, analyzing operational data, such as system load demandand generation capacity to meet BPUB requirements. The department also monitors generation unit efficiencies to comply with ERCOT market changesand maintain Fuel and Energy contracts for the reliabilIty of the electrical system.
$0.049
$0.045
$0.020
$0.040
$0.060
$0.080
FY 2013*ACTUAL
FY 2014*ACTUAL
FY 2015ESTIMATEDYEAR END
ACTUAL
FY 2016APPROVED
BUDGET
Average Fuel Charge
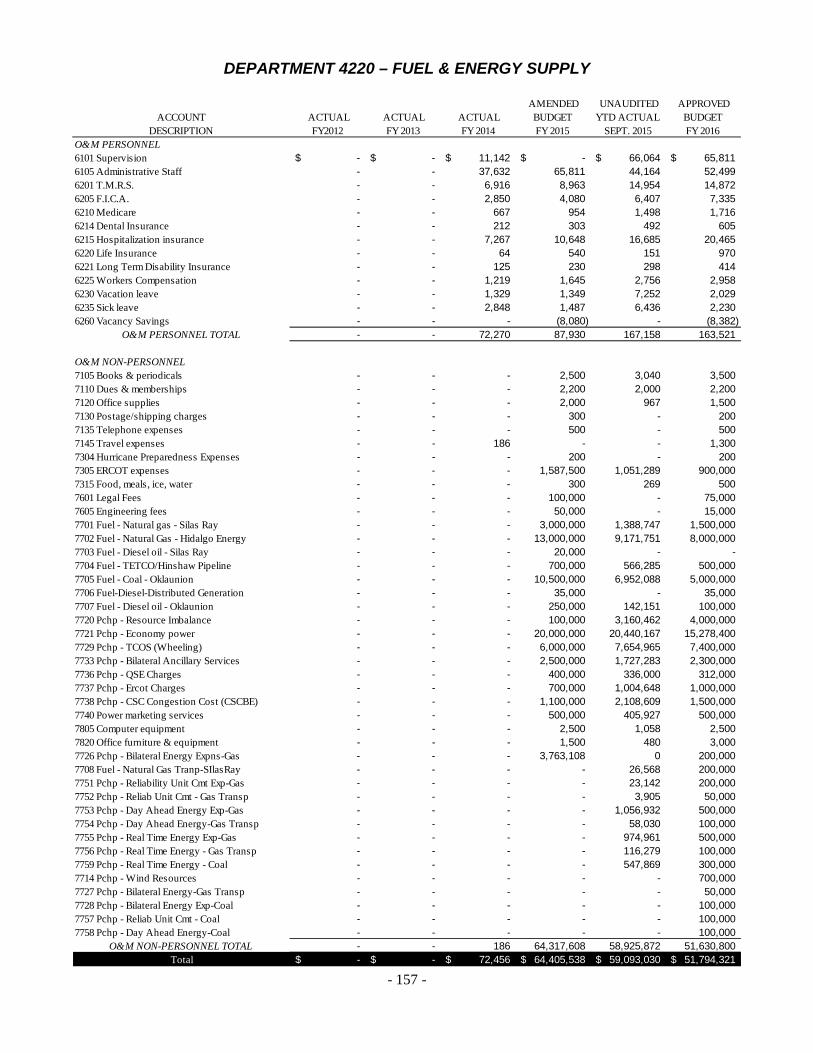
- 157 -
DEPARTMENT 4220 – FUEL & ENERGY SUPPLY
ACCOUNTDESCRIPTION
ACTUAL FY2012
ACTUAL FY 2013
ACTUAL FY 2014
AMENDED BUDGETFY 2015
UNAUDITED YTD ACTUAL
SEPT. 2015
APPROVEDBUDGETFY 2016
O&M PERSONNEL6101 Supervision -$ -$ 11,142$ -$ 66,064$ 65,811$ 6105 Administrative Staff - - 37,632 65,811 44,164 52,499 6201 T.M.R.S. - - 6,916 8,963 14,954 14,872 6205 F.I.C.A. - - 2,850 4,080 6,407 7,335 6210 Medicare - - 667 954 1,498 1,716 6214 Dental Insurance - - 212 303 492 605 6215 Hospitalization insurance - - 7,267 10,648 16,685 20,465 6220 Life Insurance - - 64 540 151 970 6221 Long Term Disability Insurance - - 125 230 298 414 6225 Workers Compensation - - 1,219 1,645 2,756 2,958 6230 Vacation leave - - 1,329 1,349 7,252 2,029 6235 Sick leave - - 2,848 1,487 6,436 2,230 6260 Vacancy Savings - - - (8,080) - (8,382)
O&M PERSONNEL TOTAL - - 72,270 87,930 167,158 163,521
O&M NON-PERSONNEL7105 Books & periodicals - - - 2,500 3,040 3,500 7110 Dues & memberships - - - 2,200 2,000 2,200 7120 Office supplies - - - 2,000 967 1,500 7130 Postage/shipping charges - - - 300 - 200 7135 Telephone expenses - - - 500 - 500 7145 Travel expenses - - 186 - - 1,300 7304 Hurricane Preparedness Expenses - - - 200 - 200 7305 ERCOT expenses - - - 1,587,500 1,051,289 900,000 7315 Food, meals, ice, water - - - 300 269 500 7601 Legal Fees - - - 100,000 - 75,000 7605 Engineering fees - - - 50,000 - 15,000 7701 Fuel - Natural gas - Silas Ray - - - 3,000,000 1,388,747 1,500,000 7702 Fuel - Natural Gas - Hidalgo Energy - - - 13,000,000 9,171,751 8,000,000 7703 Fuel - Diesel oil - Silas Ray - - - 20,000 - - 7704 Fuel - TETCO/Hinshaw Pipeline - - - 700,000 566,285 500,000 7705 Fuel - Coal - Oklaunion - - - 10,500,000 6,952,088 5,000,000 7706 Fuel-Diesel-Distributed Generation - - - 35,000 - 35,000 7707 Fuel - Diesel oil - Oklaunion - - - 250,000 142,151 100,000 7720 Pchp - Resource Imbalance - - - 100,000 3,160,462 4,000,000 7721 Pchp - Economy power - - - 20,000,000 20,440,167 15,278,400 7729 Pchp - TCOS (Wheeling) - - - 6,000,000 7,654,965 7,400,000 7733 Pchp - Bilateral Ancillary Services - - - 2,500,000 1,727,283 2,300,000 7736 Pchp - QSE Charges - - - 400,000 336,000 312,000 7737 Pchp - Ercot Charges - - - 700,000 1,004,648 1,000,000 7738 Pchp - CSC Congestion Cost (CSCBE) - - - 1,100,000 2,108,609 1,500,000 7740 Power marketing services - - - 500,000 405,927 500,000 7805 Computer equipment - - - 2,500 1,058 2,500 7820 Office furniture & equipment - - - 1,500 480 3,000 7726 Pchp - Bilateral Energy Expns-Gas - - - 3,763,108 0 200,000 7708 Fuel - Natural Gas Tranp-SIlasRay - - - - 26,568 200,000 7751 Pchp - Reliability Unit Cmt Exp-Gas - - - - 23,142 200,000 7752 Pchp - Reliab Unit Cmt - Gas Transp - - - - 3,905 50,000 7753 Pchp - Day Ahead Energy Exp-Gas - - - - 1,056,932 500,000 7754 Pchp - Day Ahead Energy-Gas Transp - - - - 58,030 100,000 7755 Pchp - Real Time Energy Exp-Gas - - - - 974,961 500,000 7756 Pchp - Real Time Energy - Gas Transp - - - - 116,279 100,000 7759 Pchp - Real Time Energy - Coal - - - - 547,869 300,000 7714 Pchp - Wind Resources - - - - - 700,000 7727 Pchp - Bilateral Energy-Gas Transp - - - - - 50,000 7728 Pchp - Bilateral Energy Exp-Coal - - - - - 100,000 7757 Pchp - Reliab Unit Cmt - Coal - - - - - 100,000 7758 Pchp - Day Ahead Energy-Coal - - - - - 100,000
O&M NON-PERSONNEL TOTAL - - 186 64,317,608 58,925,872 51,630,800 Total -$ -$ 72,456$ 64,405,538$ 59,093,030$ 51,794,321$
- 158 -
Department Responsibility: Vacant
Title: Energy Service DirectorTelephone Ext: 6287
Dept. No. 4230NATURAL GAS MANAGEMWNT DEPARTMENT
Department Function:
Department Goals/Objectives:
PERFORMANCE MEASURESFOR THE
Enter your department function/responsibilities. Information on departmental functions/responsiblities can be found in the FY 2015 budget book, and refined as needed.
Objectives may change annually as you further the department toward a certain goal. An example to help you write your objective statement follows: To provide/produce (service or product) to (customer) in order to (statement of accomplishment).
ACCOUNTDESCRIPTION
ACTUAL FY2012
ACTUAL FY 2013
ACTUAL FY 2014
AMENDED BUDGETFY 2015
UNAUDITED YTD ACTUAL
SEPT. 2015
APPROVEDBUDGETFY 2016
O&M NON-PERSONNEL7105 Books & periodicals - - - 250 - 250 7120 Office supplies - - - 1,500 - 1,500 7130 Postage/shipping charges - - - 350 - 350 7315 Food, meals, ice, water - - - 500 - 500 7605 Engineering fees - - - 150,000 - 25,000
O&M NON-PERSONNEL TOTAL - - - 152,600 - 27,600 Total -$ -$ -$ 152,600$ -$ 27,600$

- 159 -
THIS PAGE INTENTIONALLY LEFT BLANK

- 160 -
Department Responsibility: Jaime EstradaTitle:
Telephone Ext: 6218Dept. No. 4310
OPERATIONAL SUPPORT SERVICES
Department Function:
Department Goals/Objectives:
Director of Operational Support Services
PERFORMANCE MEASURESFOR THE
The Operational Support Services Department is responsible for defining, implementing, managing, and communicating the effective execution of operational strategies, processes, and programs for the G.I.S., Key Accounts Marketing, W/WW Operations & Construction, W/WW Plant Maintenance, Wastewater Lift Stations, Fleet Management and SCADA.
The department's objectives are to provide our customers, both internally and externally, with economical, reliable, and friendly service. To effectively direct Strategic Planning efforts in order to coordinate and prioritize goals and objectives. Recognize constraints and limitations of State and Industry guidelines in addition to other applicable rules and regulations. Conduct periodic staff meetings and workshops.
ACCOUNTDESCRIPTION
ACTUAL FY2012
ACTUAL FY 2013
ACTUAL FY 2014
AMENDED BUDGETFY 2015
UNAUDITED YTD ACTUAL
SEPT. 2015
APPROVEDBUDGETFY 2016
O&M PERSONNEL6101 Supervision -$ -$ 23,155$ 70,002$ 68,387$ 140,005$ 6110 Clerical staff - - - 28,995 30,626 33,800 6130 Overtime - - - 500 1,183 1,219 6201 T.M.R.S. - - 3,283 13,588 13,614 21,847 6205 F.I.C.A. - - 1,505 6,138 5,632 10,776 6210 Medicare - - 352 1,435 1,476 2,520 6214 Dental Insurance - - 44 454 379 605 6215 Hospitalization insurance - - 1,524 11,280 10,800 18,399 6220 Life Insurance - - 24 812 134 1,425 6221 Long Term Disability Insurance - - 50 346 268 608 6225 Workers Compensation - - 1,394 2,475 4,538 4,345 6230 Vacation leave - - 11,375 1,195 (1,018) 2,835 6235 Sick leave - - 48,463 1,316 2,754 3,117 6242 Auto Benefits - - 2,885 7,500 7,500 7,500 6243 Telephone Benefits - - 646 1,680 1,680 1,680 6260 Vacancy Savings - - - (6,774) - (11,717)
O&M PERSONNEL TOTAL - - 94,700 140,943 147,953 238,965

- 161 -
DEPARTMENT 4310 – OPERATIONAL SUPPORT SERVICES
ACCOUNTDESCRIPTION
ACTUAL FY2012
ACTUAL FY 2013
ACTUAL FY 2014
AMENDED BUDGETFY 2015
UNAUDITED YTD ACTUAL
SEPT. 2015
APPROVEDBUDGETFY 2016
O&M NON-PERSONNEL7105 Books & periodicals - - - 500 - 200 7110 Dues & memberships - - - 1,000 45 250 7115 Educational material - - - 300 - 300 7120 Office supplies - - - 1,000 1,217 1,500 7130 Postage/shipping charges - - - 200 - 200 7140 Training expenses - - - - - 2,380 7145 Travel expenses - - - - - 3,450 7225 Safety supplies - - - 200 - 200 7299 Other materials & supplies - - - 400 57 400 7315 Food, meals, ice, water - - 167 800 2,804 3,300 7601 Legal Fees - - 5,694 4,000 2,290 6,500 7801 Communication equipment - - - 500 - 500 7805 Computer equipment - - - 1,500 - 1,900 7820 Office furniture & equipment - - - 1,000 3,246 2,600
O&M NON-PERSONNEL TOTAL - - 5,861 11,400 9,659 23,680 Total -$ -$ 100,561$ 152,343$ 157,612$ 262,645$
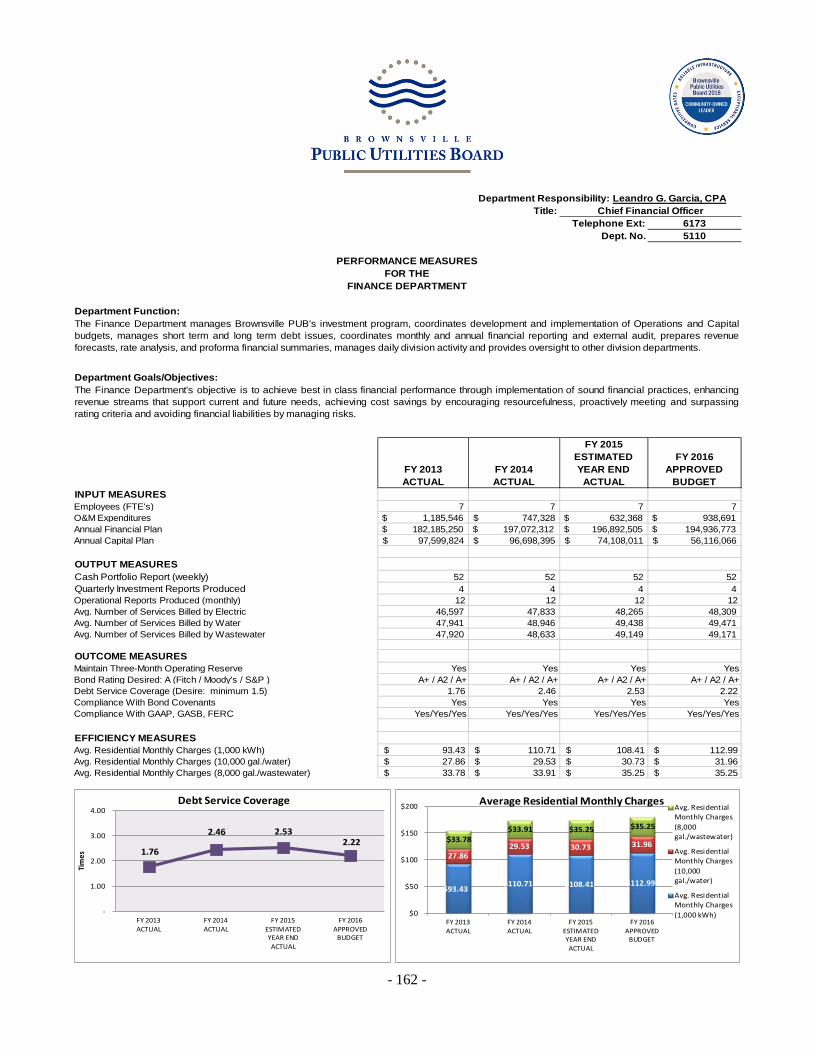
- 162 -
Department Responsibility: Leandro G. Garcia, CPATitle: Chief Financial Officer
Telephone Ext: 6173Dept. No. 5110
PERFORMANCE MEASURESFOR THE
FINANCE DEPARTMENT
Department Function:
Department Goals/Objectives:
FY 2013 ACTUAL
FY 2014 ACTUAL
FY 2015ESTIMATEDYEAR END
ACTUAL
FY 2016 APPROVED
BUDGETINPUT MEASURESEmployees (FTE's) 7 7 7 7 O&M Expenditures $ 1,185,546 747,328$ $ 632,368 $ 938,691 Annual Financial Plan $ 182,185,250 $ 197,072,312 $ 196,892,505 $ 194,936,773 Annual Capital Plan 97,599,824$ 96,698,395$ 74,108,011$ 56,116,066$
OUTPUT MEASURES Cash Portfolio Report (weekly) 52 52 52 52 Quarterly Investment Reports Produced 4 4 4 4 Operational Reports Produced (monthly) 12 12 12 12 Avg. Number of Services Billed by Electric 46,597 47,833 48,265 48,309 Avg. Number of Services Billed by Water 47,941 48,946 49,438 49,471 Avg. Number of Services Billed by Wastewater 47,920 48,633 49,149 49,171
OUTCOME MEASURESMaintain Three-Month Operating Reserve Yes Yes Yes Yes
A+ / A2 / A+ A+ / A2 / A+ A+ / A2 / A+ A+ / A2 / A+ Debt Service Coverage (Desire: minimum 1.5) 1.76 2.46 2.53 2.22 Compliance With Bond Covenants Yes Yes Yes Yes Compliance With GAAP, GASB, FERC Yes/Yes/Yes Yes/Yes/Yes Yes/Yes/Yes Yes/Yes/Yes
EFFICIENCY MEASURESAvg. Residential Monthly Charges (1,000 kWh) $ 93.43 $ 110.71 $ 108.41 $ 112.99 Avg. Residential Monthly Charges (10,000 gal./water) $ 27.86 $ 29.53 $ 30.73 $ 31.96 Avg. Residential Monthly Charges (8,000 gal./wastewater) $ 33.78 $ 33.91 $ 35.25 $ 35.25
The Finance Department manages Brownsville PUB's investment program, coordinates development and implementation of Operations and Capitalbudgets, manages short term and long term debt issues, coordinates monthly and annual financial reporting and external audit, prepares revenueforecasts, rate analysis, and proforma financial summaries, manages daily division activity and provides oversight to other division departments.
The Finance Department's objective is to achieve best in class financial performance through implementation of sound financial practices, enhancingrevenue streams that support current and future needs, achieving cost savings by encouraging resourcefulness, proactively meeting and surpassingrating criteria and avoiding financial liabilities by managing risks.
Bond Rating Desired: A (Fitch / Moody's / S&P )
1.76
2.46 2.53 2.22
-
1.00
2.00
3.00
4.00
FY 2013ACTUAL
FY 2014ACTUAL
FY 2015ESTIMATEDYEAR ENDACTUAL
FY 2016APPROVED
BUDGET
Tim
es
Debt Service Coverage
$93.43 $110.71 $108.41 $112.99
27.86 29.53 30.73 31.96 $33.78
$33.91 $35.25 $35.25
$0
$50
$100
$150
$200
FY 2013ACTUAL
FY 2014ACTUAL
FY 2015ESTIMATEDYEAR ENDACTUAL
FY 2016APPROVED
BUDGET
Average Residential Monthly Charges Avg. ResidentialMonthly Charges(8,000gal./wastewater)
Avg. ResidentialMonthly Charges(10,000gal./water)
Avg. ResidentialMonthly Charges(1,000 kWh)

- 163 -
DEPARTMENT 5110 – FINANCE
ACCOUNTDESCRIPTION
ACTUAL FY2012
ACTUAL FY 2013
ACTUAL FY 2014
AMENDED BUDGETFY 2015
UNAUDITED YTD ACTUAL
SEPT. 2015
APPROVEDBUDGETFY 2016
O&M PERSONNEL6101 Supervision 192,033$ 207,374$ 216,598$ 228,120$ 210,498$ 288,124$ 6105 Administrative Staff 48,413 53,226 53,971 54,833 85,410 110,300 6110 Clerical staff 37,565 41,691 41,480 39,998 41,273 68,994 6130 Overtime 946 398 1,004 346 1,077 1,010 6201 T.M.R.S. 43,659 44,762 44,615 43,986 45,979 58,756 6205 F.I.C.A. 15,046 17,089 16,156 20,023 17,255 28,980 6210 Medicare 4,063 4,460 4,452 4,683 4,792 6,778 6214 Dental Insurance 1,249 1,309 1,232 1,346 1,331 2,118 6215 Hospitalization insurance 29,642 29,901 33,777 40,670 37,816 54,730 6220 Life Insurance 372 526 410 2,648 449 3,833 6221 Long Term Disability Insurance 734 817 816 1,130 894 1,636 6225 Workers Compensation 14,201 11,534 11,362 8,074 12,477 11,685 6230 Vacation leave 3,333 4,912 7,376 3,897 (4,818) 7,695 6235 Sick leave 7,510 15,958 16,391 4,294 (10,270) 8,458 6240 Educational assistance 1,961 2,418 - - - - 6242 Auto Benefits 7,500 7,500 7,500 7,500 7,500 7,500 6260 Vacancy Savings - - - (22,201) - (31,797)
O&M PERSONNEL TOTAL 408,226 443,875 457,139 439,348 451,664 628,799
O&M NON-PERSONNEL7105 Books & periodicals 1,100 89 283 200 283 200 7110 Dues & memberships 4,793 3,904 1,098 2,662 1,694 1,500 7115 Educational material 32 - 2,760 - - - 7120 Office supplies 15,626 16,043 20,395 15,000 20,655 16,400 7130 Postage/shipping charges 910 2,054 870 3,000 722 1,500 7135 Telephone expenses 483 286 - - 266 - 7140 Training expenses 3,423 2,865 2,772 - 5,480 4,770 7145 Travel expenses 11,041 7,819 4,356 - 5,231 10,602 7199 Miscellaneous office expenses - - - - 513 200 7299 Other materials & supplies 289 32 - 300 161 300 7315 Food, meals, ice, water 2,204 2,777 2,511 1,200 2,204 2,000 7320 Official functions 148 - - - - - 7325 Rental of equip/storage/land 9,251 7,775 10,103 10,000 7,764 10,000 7335 Wearing apparel & dry goods - - 152 - - - 7415 Fuels & lubricants - - - - 51 - 7601 Legal Fees 119,904 34,684 46,698 96,000 4,288 50,000 7605 Engineering fees 2,188 470,907 14,658 50,000 1,612 40,000 7610 Financial advisor services 57,789 118,659 95,461 100,000 60,591 85,000 7615 External auditor fees 60,000 60,000 72,000 60,000 44,000 60,000 7699 Other services 15,595 13,095 12,153 25,000 21,966 25,000 7805 Computer equipment - - 1,651 - - - 7806 Software licenses - new 1,602 - 130 - - - 7820 Office furniture & equipment 7,370 682 2,137 - 3,222 2,420
O&M NON-PERSONNEL TOTAL 313,745 741,671 290,189 363,362 180,703 309,892 Total 721,971$ 1,185,546$ 747,328$ 802,710$ 632,368$ 938,691$

- 164 -
Department Responsibility: Miguel A. PerezTitle: Director of Finance
Telephone Ext: 6187Dept. No. 5120
PERFORMANCE MEASURESFOR THE
ACCOUNTING DEPARTMENT
Department Function:
Department Goals/Objectives:
FY 2013 ACTUAL
FY 2014 ACTUAL
FY 2015 ESTIMATEDYEAR END
ACTUAL
FY 2016 APPROVED
BUDGETINPUT MEASURES
3,672 3,558 3,500 3,430 5,112 5,261 5,400 5,300
17,196 17,300 17,800 17,819 1,424 1,464 1,480 1,490 4,431 4,400 4,460 4,400
578,704,704$ 604,111,412$ 631,111,412$ 658,611,412$
OUTPUT MEASURES 88% 89% 89% 90%
100% 100% 100% 100%369 378 384 372 12 12 12 12
58,207,894$ 53,981,281$ 55,000,000$ 56,000,000$
OUTCOME MEASURES58.20% 59.66% 60.67% 61.16%99.99% 99.99% 99.99% 99.99%
100.00% 100.00% 100.00% 100.00%100.00% 100.00% 100.00% 100.00%
Yes Yes Yes Yes
110,018$ 123,312$ 131,324$ 149,971$ 27,755$ 28,444$ 31,699$ 37,201$
8.0 8.1 8.2 6.0 162,302$ 166,353$ 155,769$ 164,035$ 59,908$ 70,341$ 84,690$ 71,166$ Annual Cost to Maintain Capital Assets CPR
Dollar Recorded for Capital Asset Additions
% of ACH Payments to Total Payments% Payroll Direct Deposits to Total Cks & DD% of Bank Accounts Reconciled Within 15 days% of Mo. FS Completed on ScheduleTimely Recon (60 days) of Capital Assets at YE
EFFICIENCY MEASURESAnnual Cost of Cks and ACH InitiatedAnnual Cost of Processing Bi-Weekly PayrollStaff Hours Per 100 Bank ReconciliationsAnnual Cost to Produce Monthly Financial Stmts
# of FS Produced Annually
The Accounting Department is responsible for payment of vendor invoices, processing payroll, and performing accountingfunctions in a timely manner. In addition, this department is responsible for timely reporting of company finances through themonthly financial statements, payroll reports and other reports as required and needed, and timely file accurate financial reports tovarious Local, State and Federal agencies as required.
The Accounting Department's goal is to provide technical accounting oversight to Brownsville PUB departments to ensure thatgenerally accepted accounting procedures and Brownsville PUB policies and procedures are consistently applied, to maintain theintegrity of the Brownsville PUB's accounting records, and to satisfy all reporting requirements. The objectives are to performtimely reconciliation of accounts and timely preparation of monthly financial statements; timely processing of vendor invoices; andaccurate and timely processing of Brownsville PUB's payroll.
Number of AP Checks & Wires ProcessedNumber of AP ACH Payments ProcessedNumber of Payroll Cks and DD ProcessedAverage Mo. Bank Transactions ReconciledNo. of JEs Processed for Recon. of Accts.Capital Assets, Net Capitalized in the CPR
Percentage of Invoice Pd. Within 30 daysPercentage of Payrolls Process TimelyNo. of Bank Accounts Reconciled Annually
$58 $54 $55 $56
$20
$40
$60
$80
$100
FY 2013ACTUAL
FY 2014ACTUAL
FY 2015ESTIMATEDYEAR END
ACTUAL
FY 2016APPROVED
BUDGET
Milli
ons
Dollar Recorded for Capital Asset Additions
58.20% 59.66% 60.67% 61.16%
0.00%
20.00%
40.00%
60.00%
80.00%
FY 2013ACTUAL
FY 2014ACTUAL
FY 2015ESTIMATEDYEAR END
ACTUAL
FY 2016APPROVED
BUDGET
% of ACH Payments to Total Payments
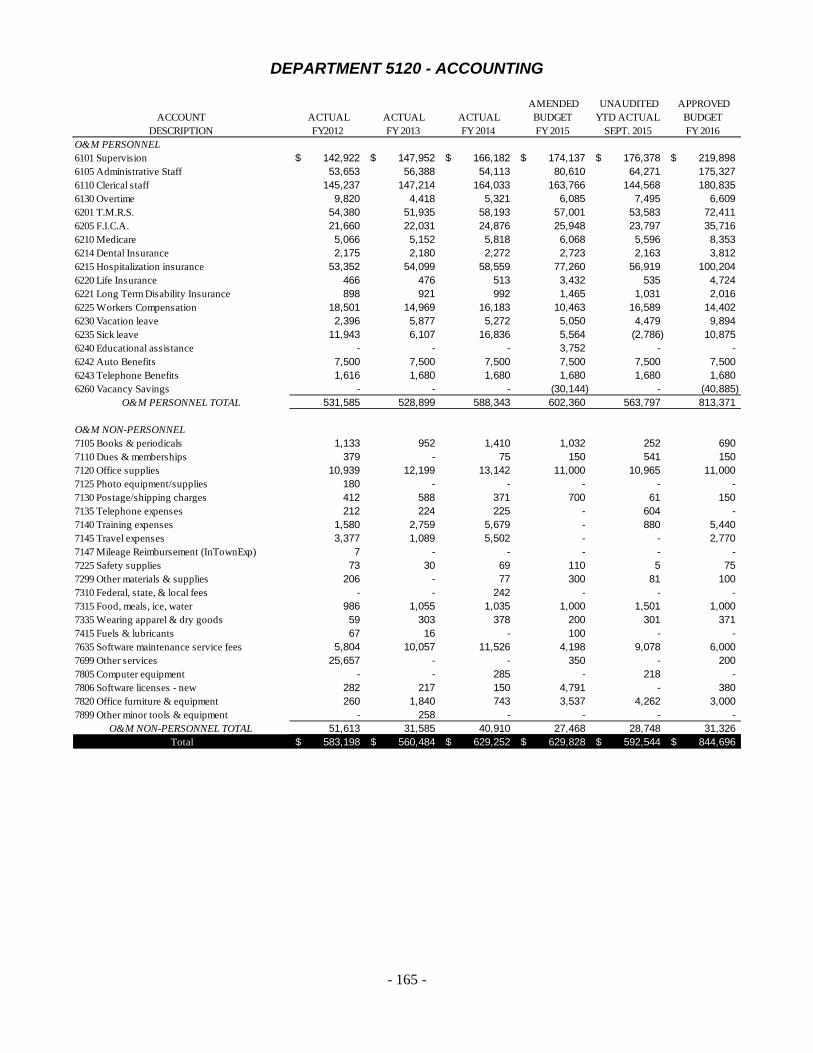
- 165 -
DEPARTMENT 5120 - ACCOUNTING
ACCOUNTDESCRIPTION
ACTUAL FY2012
ACTUAL FY 2013
ACTUAL FY 2014
AMENDED BUDGETFY 2015
UNAUDITED YTD ACTUAL
SEPT. 2015
APPROVEDBUDGETFY 2016
O&M PERSONNEL6101 Supervision 142,922$ 147,952$ 166,182$ 174,137$ 176,378$ 219,898$ 6105 Administrative Staff 53,653 56,388 54,113 80,610 64,271 175,327 6110 Clerical staff 145,237 147,214 164,033 163,766 144,568 180,835 6130 Overtime 9,820 4,418 5,321 6,085 7,495 6,609 6201 T.M.R.S. 54,380 51,935 58,193 57,001 53,583 72,411 6205 F.I.C.A. 21,660 22,031 24,876 25,948 23,797 35,716 6210 Medicare 5,066 5,152 5,818 6,068 5,596 8,353 6214 Dental Insurance 2,175 2,180 2,272 2,723 2,163 3,812 6215 Hospitalization insurance 53,352 54,099 58,559 77,260 56,919 100,204 6220 Life Insurance 466 476 513 3,432 535 4,724 6221 Long Term Disability Insurance 898 921 992 1,465 1,031 2,016 6225 Workers Compensation 18,501 14,969 16,183 10,463 16,589 14,402 6230 Vacation leave 2,396 5,877 5,272 5,050 4,479 9,894 6235 Sick leave 11,943 6,107 16,836 5,564 (2,786) 10,875 6240 Educational assistance - - - 3,752 - - 6242 Auto Benefits 7,500 7,500 7,500 7,500 7,500 7,500 6243 Telephone Benefits 1,616 1,680 1,680 1,680 1,680 1,680 6260 Vacancy Savings - - - (30,144) - (40,885)
O&M PERSONNEL TOTAL 531,585 528,899 588,343 602,360 563,797 813,371
O&M NON-PERSONNEL7105 Books & periodicals 1,133 952 1,410 1,032 252 690 7110 Dues & memberships 379 - 75 150 541 150 7120 Office supplies 10,939 12,199 13,142 11,000 10,965 11,000 7125 Photo equipment/supplies 180 - - - - - 7130 Postage/shipping charges 412 588 371 700 61 150 7135 Telephone expenses 212 224 225 - 604 - 7140 Training expenses 1,580 2,759 5,679 - 880 5,440 7145 Travel expenses 3,377 1,089 5,502 - - 2,770 7147 Mileage Reimbursement (InTownExp) 7 - - - - - 7225 Safety supplies 73 30 69 110 5 75 7299 Other materials & supplies 206 - 77 300 81 100 7310 Federal, state, & local fees - - 242 - - - 7315 Food, meals, ice, water 986 1,055 1,035 1,000 1,501 1,000 7335 Wearing apparel & dry goods 59 303 378 200 301 371 7415 Fuels & lubricants 67 16 - 100 - - 7635 Software maintenance service fees 5,804 10,057 11,526 4,198 9,078 6,000 7699 Other services 25,657 - - 350 - 200 7805 Computer equipment - - 285 - 218 - 7806 Software licenses - new 282 217 150 4,791 - 380 7820 Office furniture & equipment 260 1,840 743 3,537 4,262 3,000 7899 Other minor tools & equipment - 258 - - - -
O&M NON-PERSONNEL TOTAL 51,613 31,585 40,910 27,468 28,748 31,326 Total 583,198$ 560,484$ 629,252$ 629,828$ 592,544$ 844,696$
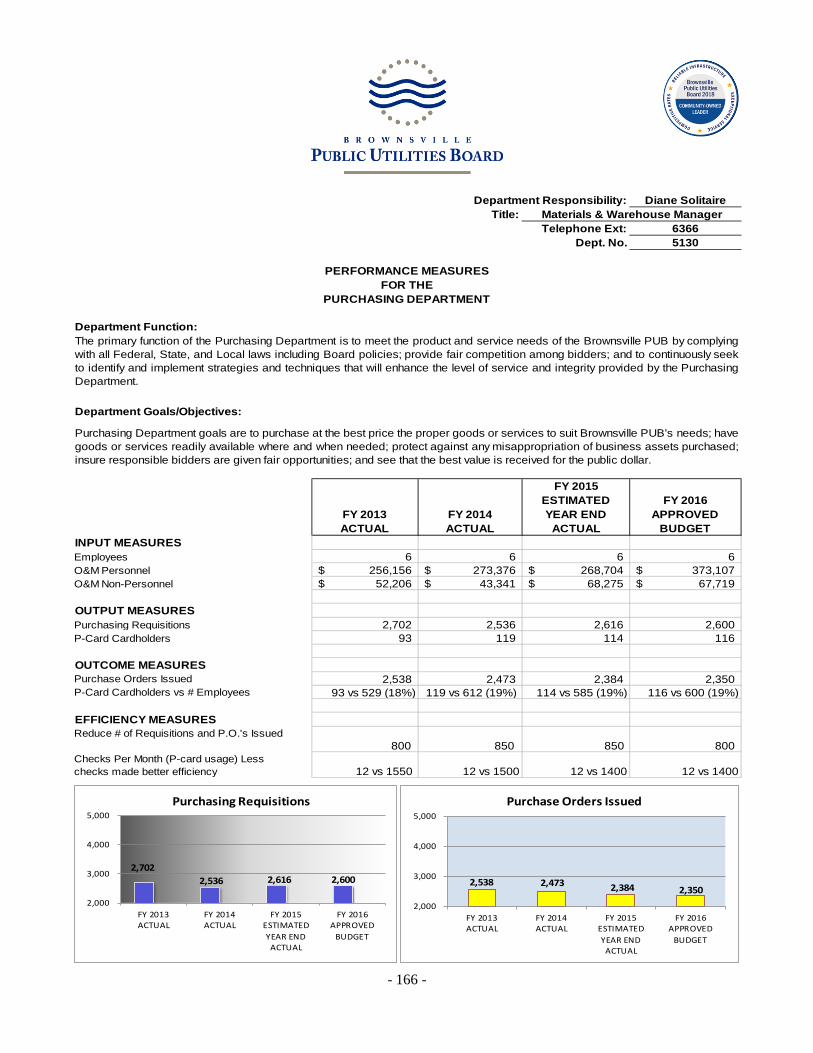
- 166 -
Department Responsibility: Diane SolitaireTitle: Materials & Warehouse Manager
Telephone Ext: 6366Dept. No. 5130
PERFORMANCE MEASURESFOR THE
PURCHASING DEPARTMENT
Department Function:
Department Goals/Objectives:
FY 2013 ACTUAL
FY 2014 ACTUAL
FY 2015 ESTIMATEDYEAR END
ACTUAL
FY 2016 APPROVED
BUDGETINPUT MEASURESEmployees 6 6 6 6 O&M Personnel 256,156$ 273,376$ 268,704$ 373,107$ O&M Non-Personnel 52,206$ 43,341$ 68,275$ 67,719$
OUTPUT MEASURES Purchasing Requisitions 2,702 2,536 2,616 2,600 P-Card Cardholders 93 119 114 116
OUTCOME MEASURESPurchase Orders Issued 2,538 2,473 2,384 2,350 P-Card Cardholders vs # Employees 93 vs 529 (18%) 119 vs 612 (19%) 114 vs 585 (19%) 116 vs 600 (19%)
Reduce # of Requisitions and P.O.'s Issued 800 850 850 800
Checks Per Month (P-card usage) Less checks made better efficiency 12 vs 1550 12 vs 1500 12 vs 1400 12 vs 1400
The primary function of the Purchasing Department is to meet the product and service needs of the Brownsville PUB by complyingwith all Federal, State, and Local laws including Board policies; provide fair competition among bidders; and to continuously seekto identify and implement strategies and techniques that will enhance the level of service and integrity provided by the PurchasingDepartment.
Purchasing Department goals are to purchase at the best price the proper goods or services to suit Brownsville PUB's needs; havegoods or services readily available where and when needed; protect against any misappropriation of business assets purchased;insure responsible bidders are given fair opportunities; and see that the best value is received for the public dollar.
EFFICIENCY MEASURES
2,702 2,536 2,616 2,600
2,000
3,000
4,000
5,000
FY 2013ACTUAL
FY 2014ACTUAL
FY 2015ESTIMATEDYEAR END
ACTUAL
FY 2016APPROVED
BUDGET
Purchasing Requisitions
2,538 2,473 2,384 2,350 2,000
3,000
4,000
5,000
FY 2013ACTUAL
FY 2014ACTUAL
FY 2015ESTIMATEDYEAR END
ACTUAL
FY 2016APPROVED
BUDGET
Purchase Orders Issued

- 167 -
DEPARTMENT 5130 – PURCHASING
ACCOUNTDESCRIPTION
ACTUAL FY2012
ACTUAL FY 2013
ACTUAL FY 2014
AMENDED BUDGETFY 2015
UNAUDITED YTD ACTUAL
SEPT. 2015
APPROVEDBUDGETFY 2016
O&M PERSONNEL6101 Supervision 53,322$ 54,958$ 57,079$ 57,410$ 56,968$ 82,014$ 6105 Administrative Staff 98,554 99,856 106,928 109,069 108,124 155,813 6110 Clerical staff 26,647 27,285 21,604 24,161 24,194 30,202 6130 Overtime 698 28 205 218 21 218 6201 T.M.R.S. 27,981 27,079 27,040 25,965 25,754 33,691 6205 F.I.C.A. 10,898 11,285 11,207 11,820 11,179 16,618 6206 Suta (404) - - - 171 - 6210 Medicare 2,549 2,639 2,621 2,764 2,614 3,886 6214 Dental Insurance 1,149 1,148 1,170 1,301 1,157 1,815 6215 Hospitalization insurance 26,754 26,754 32,676 37,681 32,102 48,418 6220 Life Insurance 252 254 263 1,563 269 2,198 6221 Long Term Disability Insurance 476 482 499 667 510 938 6225 Workers Compensation 8,782 7,168 6,517 4,766 6,726 6,701 6230 Vacation leave (3,009) (1,556) 5,439 2,300 879 4,626 6235 Sick leave 6,398 (1,225) 127 2,535 (1,964) 5,085 6260 Vacancy Savings - - - (13,858) - (19,115)
O&M PERSONNEL TOTAL 261,047 256,156 273,376 268,362 268,704 373,107
O&M NON-PERSONNEL7101 Advertising 27,839 28,354 18,584 24,000 25,693 25,000 7105 Books & periodicals 210 - 114 240 - 240 7110 Dues & memberships 295 320 345 250 360 300 7120 Office supplies 2,658 3,933 4,078 4,000 4,450 4,000 7130 Postage/shipping charges 339 518 91 300 139 300 7140 Training expenses - - - - 215 2,574 7145 Travel expenses - - - - - 2,332 7180 Utilities - departmental 12,001 11,828 12,525 11,000 11,868 11,000 7215 Laundry & janitorial supplies - - 42 75 161 200 7225 Safety supplies 5 - - - - - 7299 Other materials & supplies 169 96 533 250 510 1,000 7315 Food, meals, ice, water 93 69 133 100 204 300 7325 Rental of equip/storage/land 3,486 3,904 4,700 3,500 4,285 3,500 7415 Fuels & lubricants 564 917 495 800 283 - 7599 Maintenance / other - - - - 13,435 15,000 7645 Maintenance services 2,560 1,290 964 1,200 1,426 500 7801 Communication equipment 715 - - - - - 7805 Computer equipment 175 - 245 - - - 7806 Software licenses - new 207 - - - - - 7820 Office furniture & equipment - 978 492 - 5,248 1,473
O&M NON-PERSONNEL TOTAL 51,317 52,206 43,341 45,715 68,275 67,719 Total 312,364$ 308,362$ 316,717$ 314,077$ 336,980$ 440,826$
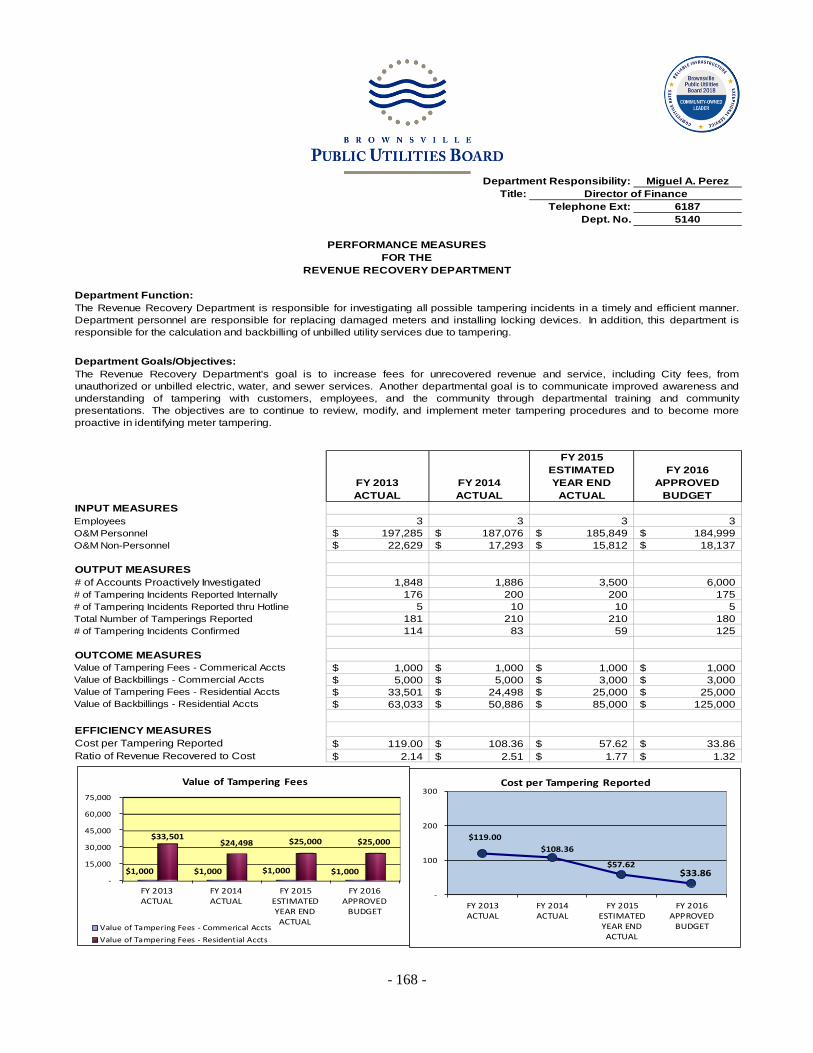
- 168 -
Department Responsibility: Miguel A. Perez
Title: Director of FinanceTelephone Ext: 6187
Dept. No. 5140
PERFORMANCE MEASURESFOR THE
REVENUE RECOVERY DEPARTMENT
Department Function:
Department Goals/Objectives:
FY 2013ACTUAL
FY 2014ACTUAL
FY 2015 ESTIMATEDYEAR END
ACTUAL
FY 2016APPROVED
BUDGETINPUT MEASURESEmployees 3 3 3 3 O&M Personnel 197,285$ 187,076$ 185,849$ 184,999$ O&M Non-Personnel 22,629$ 17,293$ 15,812$ 18,137$
OUTPUT MEASURES # of Accounts Proactively Investigated 1,848 1,886 3,500 6,000 # of Tampering Incidents Reported Internally 176 200 200 175 # of Tampering Incidents Reported thru Hotline 5 10 10 5 Total Number of Tamperings Reported 181 210 210 180 # of Tampering Incidents Confirmed 114 83 59 125
OUTCOME MEASURES Value of Tampering Fees - Commerical Accts 1,000$ 1,000$ 1,000$ 1,000$ Value of Backbillings - Commercial Accts 5,000$ 5,000$ 3,000$ 3,000$ Value of Tampering Fees - Residential Accts 33,501$ 24,498$ 25,000$ 25,000$ Value of Backbillings - Residential Accts 63,033$ 50,886$ 85,000$ 125,000$
EFFICIENCY MEASURESCost per Tampering Reported 119.00$ 108.36$ 57.62$ 33.86$ Ratio of Revenue Recovered to Cost 2.14$ 2.51$ 1.77$ 1.32$
The Revenue Recovery Department is responsible for investigating all possible tampering incidents in a timely and efficient manner.Department personnel are responsible for replacing damaged meters and installing locking devices. In addition, this department isresponsible for the calculation and backbilling of unbilled utility services due to tampering.
The Revenue Recovery Department's goal is to increase fees for unrecovered revenue and service, including City fees, fromunauthorized or unbilled electric, water, and sewer services. Another departmental goal is to communicate improved awareness andunderstanding of tampering with customers, employees, and the community through departmental training and communitypresentations. The objectives are to continue to review, modify, and implement meter tampering procedures and to become moreproactive in identifying meter tampering.
-
15,000
30,000
45,000
60,000
75,000
FY 2013ACTUAL
FY 2014ACTUAL
FY 2015ESTIMATEDYEAR ENDACTUAL
FY 2016APPROVED
BUDGET
$1,000 $1,000 $1,000 $1,000
$33,501 $24,498 $25,000 $25,000
Value of Tampering Fees
Value of Tampering Fees - Commerical AcctsValue of Tampering Fees - Residential Accts
$119.00 $108.36
$57.62 $33.86
-
100
200
300
FY 2013ACTUAL
FY 2014ACTUAL
FY 2015ESTIMATEDYEAR ENDACTUAL
FY 2016APPROVED
BUDGET
Cost per Tampering Reported
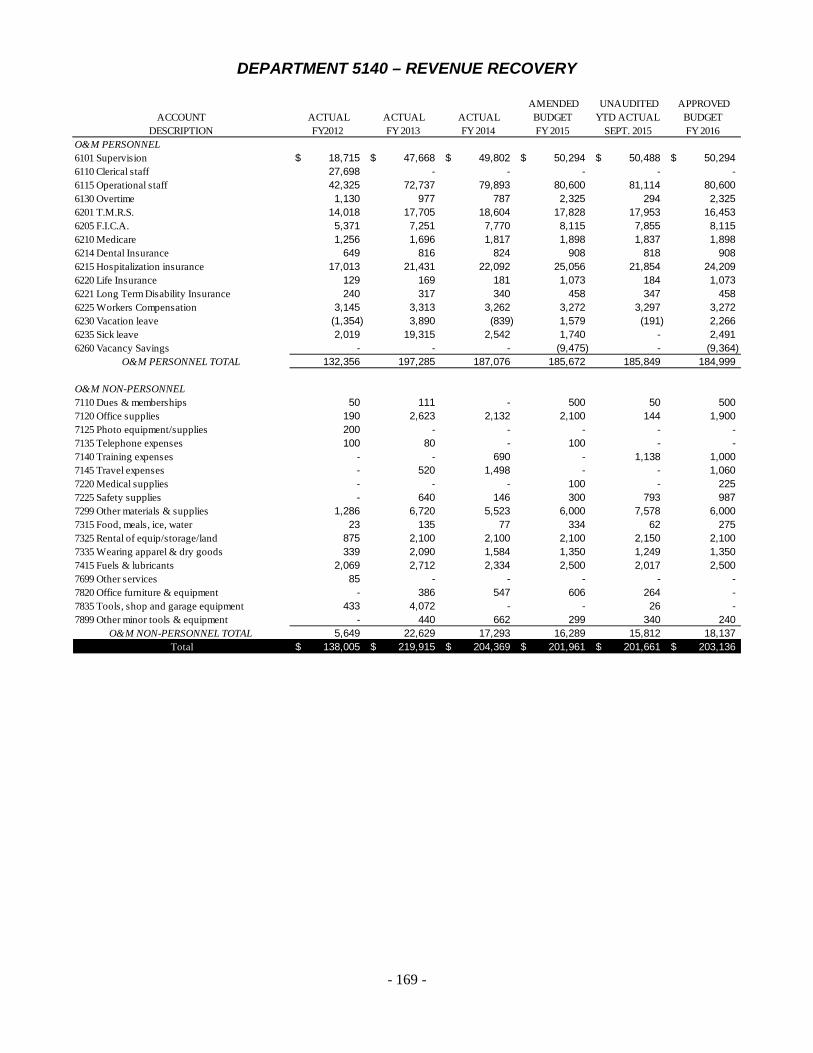
- 169 -
DEPARTMENT 5140 – REVENUE RECOVERY
ACCOUNTDESCRIPTION
ACTUAL FY2012
ACTUAL FY 2013
ACTUAL FY 2014
AMENDED BUDGETFY 2015
UNAUDITED YTD ACTUAL
SEPT. 2015
APPROVEDBUDGETFY 2016
O&M PERSONNEL6101 Supervision 18,715$ 47,668$ 49,802$ 50,294$ 50,488$ 50,294$ 6110 Clerical staff 27,698 - - - - - 6115 Operational staff 42,325 72,737 79,893 80,600 81,114 80,600 6130 Overtime 1,130 977 787 2,325 294 2,325 6201 T.M.R.S. 14,018 17,705 18,604 17,828 17,953 16,453 6205 F.I.C.A. 5,371 7,251 7,770 8,115 7,855 8,115 6210 Medicare 1,256 1,696 1,817 1,898 1,837 1,898 6214 Dental Insurance 649 816 824 908 818 908 6215 Hospitalization insurance 17,013 21,431 22,092 25,056 21,854 24,209 6220 Life Insurance 129 169 181 1,073 184 1,073 6221 Long Term Disability Insurance 240 317 340 458 347 458 6225 Workers Compensation 3,145 3,313 3,262 3,272 3,297 3,272 6230 Vacation leave (1,354) 3,890 (839) 1,579 (191) 2,266 6235 Sick leave 2,019 19,315 2,542 1,740 - 2,491 6260 Vacancy Savings - - - (9,475) - (9,364)
O&M PERSONNEL TOTAL 132,356 197,285 187,076 185,672 185,849 184,999
O&M NON-PERSONNEL7110 Dues & memberships 50 111 - 500 50 500 7120 Office supplies 190 2,623 2,132 2,100 144 1,900 7125 Photo equipment/supplies 200 - - - - - 7135 Telephone expenses 100 80 - 100 - - 7140 Training expenses - - 690 - 1,138 1,000 7145 Travel expenses - 520 1,498 - - 1,060 7220 Medical supplies - - - 100 - 225 7225 Safety supplies - 640 146 300 793 987 7299 Other materials & supplies 1,286 6,720 5,523 6,000 7,578 6,000 7315 Food, meals, ice, water 23 135 77 334 62 275 7325 Rental of equip/storage/land 875 2,100 2,100 2,100 2,150 2,100 7335 Wearing apparel & dry goods 339 2,090 1,584 1,350 1,249 1,350 7415 Fuels & lubricants 2,069 2,712 2,334 2,500 2,017 2,500 7699 Other services 85 - - - - - 7820 Office furniture & equipment - 386 547 606 264 - 7835 Tools, shop and garage equipment 433 4,072 - - 26 - 7899 Other minor tools & equipment - 440 662 299 340 240
O&M NON-PERSONNEL TOTAL 5,649 22,629 17,293 16,289 15,812 18,137 Total 138,005$ 219,915$ 204,369$ 201,961$ 201,661$ 203,136$
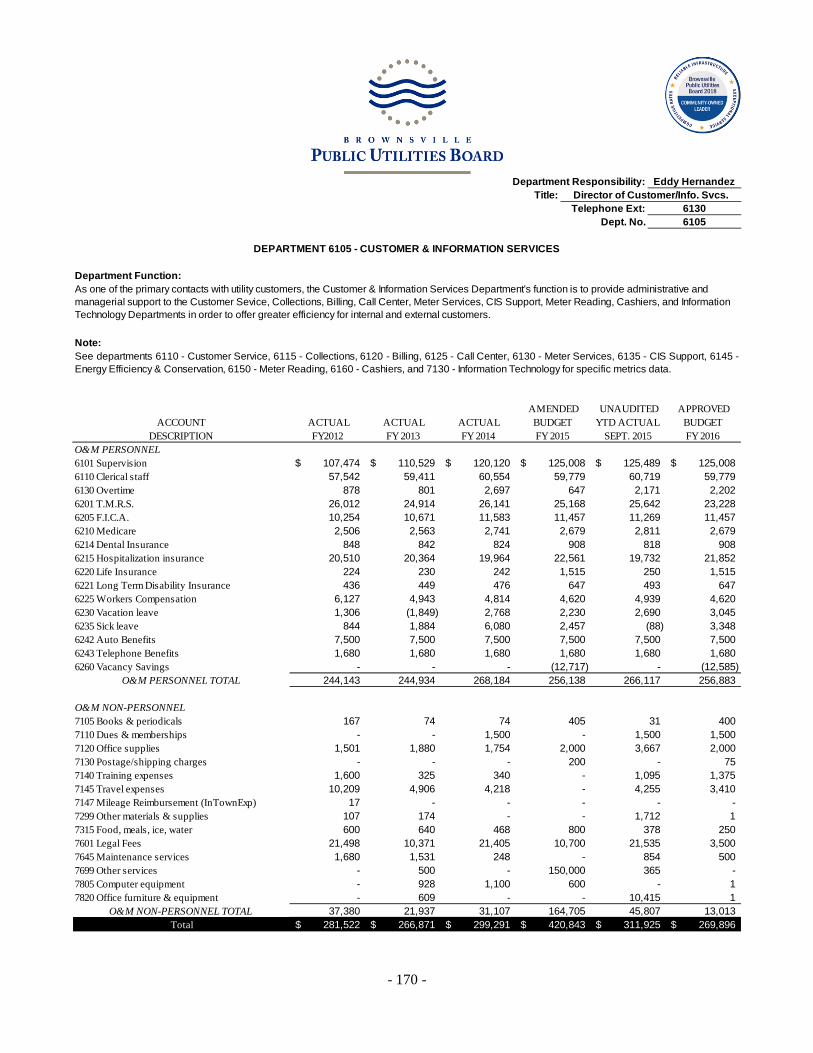
- 170 -
Department Responsibility: Eddy HernandezTitle: Director of Customer/Info. Svcs.
Telephone Ext: 6130Dept. No. 6105
DEPARTMENT 6105 - CUSTOMER & INFORMATION SERVICES
Department Function:
Note:
As one of the primary contacts with utility customers, the Customer & Information Services Department's function is to provide administrative and managerial support to the Customer Sevice, Collections, Billing, Call Center, Meter Services, CIS Support, Meter Reading, Cashiers, and Information Technology Departments in order to offer greater efficiency for internal and external customers.
See departments 6110 - Customer Service, 6115 - Collections, 6120 - Billing, 6125 - Call Center, 6130 - Meter Services, 6135 - CIS Support, 6145 -Energy Efficiency & Conservation, 6150 - Meter Reading, 6160 - Cashiers, and 7130 - Information Technology for specific metrics data.
ACCOUNTDESCRIPTION
ACTUAL FY2012
ACTUAL FY 2013
ACTUAL FY 2014
AMENDED BUDGETFY 2015
UNAUDITED YTD ACTUAL
SEPT. 2015
APPROVEDBUDGETFY 2016
O&M PERSONNEL6101 Supervision 107,474$ 110,529$ 120,120$ 125,008$ 125,489$ 125,008$ 6110 Clerical staff 57,542 59,411 60,554 59,779 60,719 59,779 6130 Overtime 878 801 2,697 647 2,171 2,202 6201 T.M.R.S. 26,012 24,914 26,141 25,168 25,642 23,228 6205 F.I.C.A. 10,254 10,671 11,583 11,457 11,269 11,457 6210 Medicare 2,506 2,563 2,741 2,679 2,811 2,679 6214 Dental Insurance 848 842 824 908 818 908 6215 Hospitalization insurance 20,510 20,364 19,964 22,561 19,732 21,852 6220 Life Insurance 224 230 242 1,515 250 1,515 6221 Long Term Disability Insurance 436 449 476 647 493 647 6225 Workers Compensation 6,127 4,943 4,814 4,620 4,939 4,620 6230 Vacation leave 1,306 (1,849) 2,768 2,230 2,690 3,045 6235 Sick leave 844 1,884 6,080 2,457 (88) 3,348 6242 Auto Benefits 7,500 7,500 7,500 7,500 7,500 7,500 6243 Telephone Benefits 1,680 1,680 1,680 1,680 1,680 1,680 6260 Vacancy Savings - - - (12,717) - (12,585)
O&M PERSONNEL TOTAL 244,143 244,934 268,184 256,138 266,117 256,883
O&M NON-PERSONNEL7105 Books & periodicals 167 74 74 405 31 400 7110 Dues & memberships - - 1,500 - 1,500 1,500 7120 Office supplies 1,501 1,880 1,754 2,000 3,667 2,000 7130 Postage/shipping charges - - - 200 - 75 7140 Training expenses 1,600 325 340 - 1,095 1,375 7145 Travel expenses 10,209 4,906 4,218 - 4,255 3,410 7147 Mileage Reimbursement (InTownExp) 17 - - - - - 7299 Other materials & supplies 107 174 - - 1,712 1 7315 Food, meals, ice, water 600 640 468 800 378 250 7601 Legal Fees 21,498 10,371 21,405 10,700 21,535 3,500 7645 Maintenance services 1,680 1,531 248 - 854 500 7699 Other services - 500 - 150,000 365 - 7805 Computer equipment - 928 1,100 600 - 1 7820 Office furniture & equipment - 609 - - 10,415 1
O&M NON-PERSONNEL TOTAL 37,380 21,937 31,107 164,705 45,807 13,013 Total 281,522$ 266,871$ 299,291$ 420,843$ 311,925$ 269,896$

- 171 -
THIS PAGE INTENTIONALLY LEFT BLANK
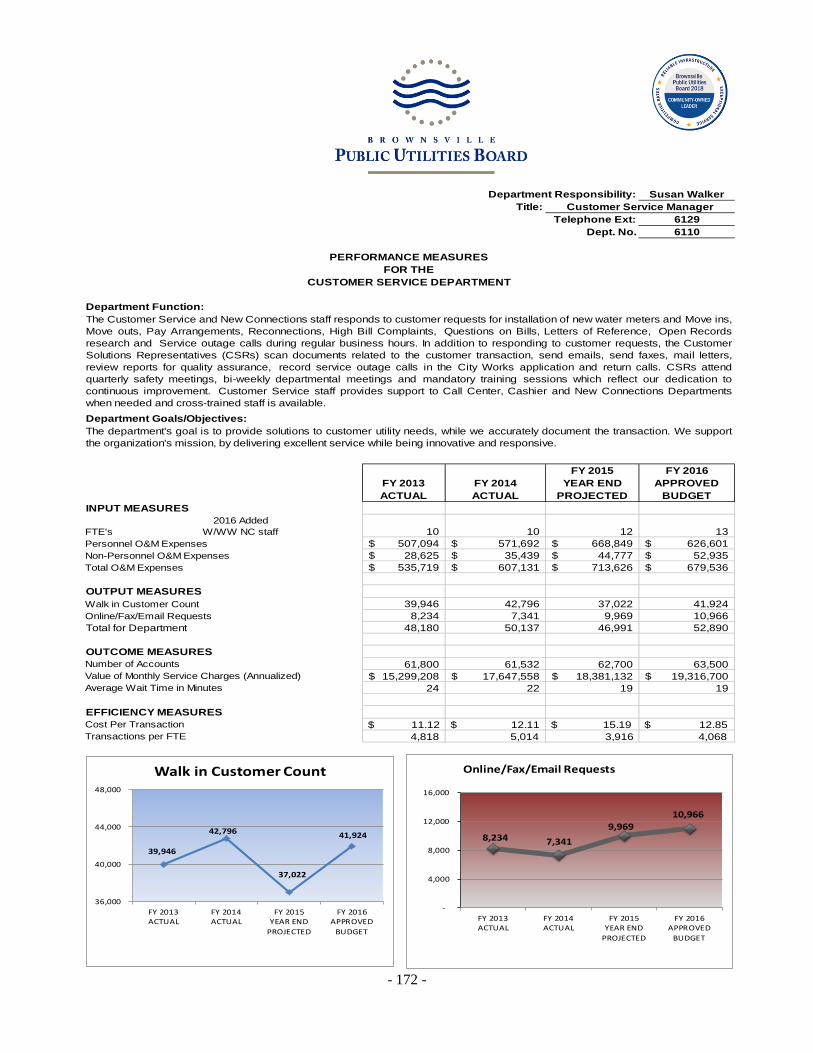
- 172 -
Department Responsibility: Susan WalkerTitle: Customer Service Manager
Telephone Ext: 6129Dept. No. 6110
PERFORMANCE MEASURESFOR THE
CUSTOMER SERVICE DEPARTMENT
Department Function:
Department Goals/Objectives:
FY 2013ACTUAL
FY 2014ACTUAL
FY 2015YEAR END
PROJECTED
FY 2016APPROVED
BUDGETINPUT MEASURES
FTE's2016 Added
W/WW NC staff 10 10 12 13 Personnel O&M Expenses 507,094$ 571,692$ 668,849$ 626,601$ Non-Personnel O&M Expenses 28,625$ 35,439$ 44,777$ 52,935$ Total O&M Expenses 535,719$ 607,131$ 713,626$ 679,536$
OUTPUT MEASURES 39,946 42,796 37,022 41,924
8,234 7,341 9,969 10,966 Total for Department 48,180 50,137 46,991 52,890
OUTCOME MEASURES61,800 61,532 62,700 63,500
15,299,208$ 17,647,558$ 18,381,132$ 19,316,700$ 24 22 19 19
$ 11.12 $ 12.11 $ 15.19 $ 12.85 4,818 5,014 3,916 4,068
Value of Monthly Service Charges (Annualized)
The Customer Service and New Connections staff responds to customer requests for installation of new water meters and Move ins,Move outs, Pay Arrangements, Reconnections, High Bill Complaints, Questions on Bills, Letters of Reference, Open Recordsresearch and Service outage calls during regular business hours. In addition to responding to customer requests, the CustomerSolutions Representatives (CSRs) scan documents related to the customer transaction, send emails, send faxes, mail letters,review reports for quality assurance, record service outage calls in the City Works application and return calls. CSRs attendquarterly safety meetings, bi-weekly departmental meetings and mandatory training sessions which reflect our dedication tocontinuous improvement. Customer Service staff provides support to Call Center, Cashier and New Connections Departmentswhen needed and cross-trained staff is available.
The department's goal is to provide solutions to customer utility needs, while we accurately document the transaction. We supportthe organization's mission, by delivering excellent service while being innovative and responsive.
Walk in Customer CountOnline/Fax/Email Requests
Number of Accounts
Average Wait Time in Minutes
EFFICIENCY MEASURESCost Per TransactionTransactions per FTE
8,234 7,341 9,969
10,966
-
4,000
8,000
12,000
16,000
FY 2013ACTUAL
FY 2014ACTUAL
FY 2015YEAR END
PROJECTED
FY 2016APPROVED
BUDGET
Online/Fax/Email Requests
39,946
42,796
37,022
41,924
36,000
40,000
44,000
48,000
FY 2013ACTUAL
FY 2014ACTUAL
FY 2015YEAR END
PROJECTED
FY 2016APPROVED
BUDGET
Walk in Customer Count
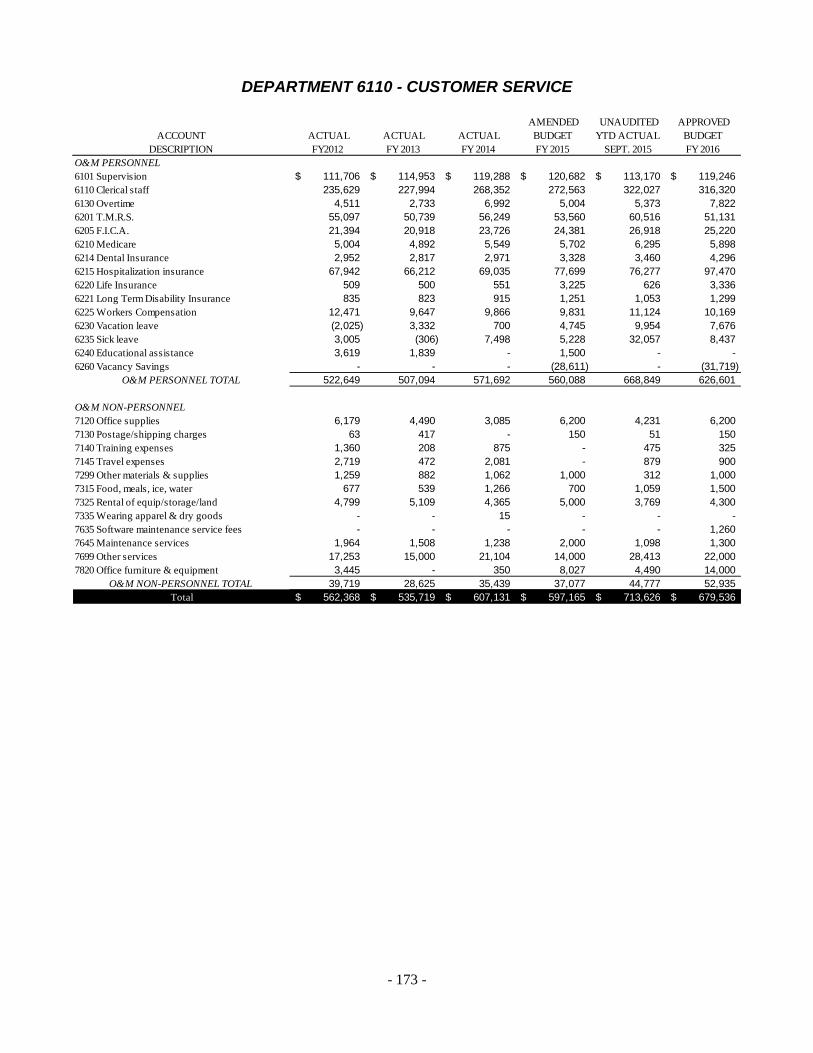
- 173 -
DEPARTMENT 6110 - CUSTOMER SERVICE
ACCOUNTDESCRIPTION
ACTUAL FY2012
ACTUAL FY 2013
ACTUAL FY 2014
AMENDED BUDGETFY 2015
UNAUDITED YTD ACTUAL
SEPT. 2015
APPROVEDBUDGETFY 2016
O&M PERSONNEL6101 Supervision 111,706$ 114,953$ 119,288$ 120,682$ 113,170$ 119,246$ 6110 Clerical staff 235,629 227,994 268,352 272,563 322,027 316,320 6130 Overtime 4,511 2,733 6,992 5,004 5,373 7,822 6201 T.M.R.S. 55,097 50,739 56,249 53,560 60,516 51,131 6205 F.I.C.A. 21,394 20,918 23,726 24,381 26,918 25,220 6210 Medicare 5,004 4,892 5,549 5,702 6,295 5,898 6214 Dental Insurance 2,952 2,817 2,971 3,328 3,460 4,296 6215 Hospitalization insurance 67,942 66,212 69,035 77,699 76,277 97,470 6220 Life Insurance 509 500 551 3,225 626 3,336 6221 Long Term Disability Insurance 835 823 915 1,251 1,053 1,299 6225 Workers Compensation 12,471 9,647 9,866 9,831 11,124 10,169 6230 Vacation leave (2,025) 3,332 700 4,745 9,954 7,676 6235 Sick leave 3,005 (306) 7,498 5,228 32,057 8,437 6240 Educational assistance 3,619 1,839 - 1,500 - - 6260 Vacancy Savings - - - (28,611) - (31,719)
O&M PERSONNEL TOTAL 522,649 507,094 571,692 560,088 668,849 626,601
O&M NON-PERSONNEL7120 Office supplies 6,179 4,490 3,085 6,200 4,231 6,200 7130 Postage/shipping charges 63 417 - 150 51 150 7140 Training expenses 1,360 208 875 - 475 325 7145 Travel expenses 2,719 472 2,081 - 879 900 7299 Other materials & supplies 1,259 882 1,062 1,000 312 1,000 7315 Food, meals, ice, water 677 539 1,266 700 1,059 1,500 7325 Rental of equip/storage/land 4,799 5,109 4,365 5,000 3,769 4,300 7335 Wearing apparel & dry goods - - 15 - - - 7635 Software maintenance service fees - - - - - 1,260 7645 Maintenance services 1,964 1,508 1,238 2,000 1,098 1,300 7699 Other services 17,253 15,000 21,104 14,000 28,413 22,000 7820 Office furniture & equipment 3,445 - 350 8,027 4,490 14,000
O&M NON-PERSONNEL TOTAL 39,719 28,625 35,439 37,077 44,777 52,935 Total 562,368$ 535,719$ 607,131$ 597,165$ 713,626$ 679,536$
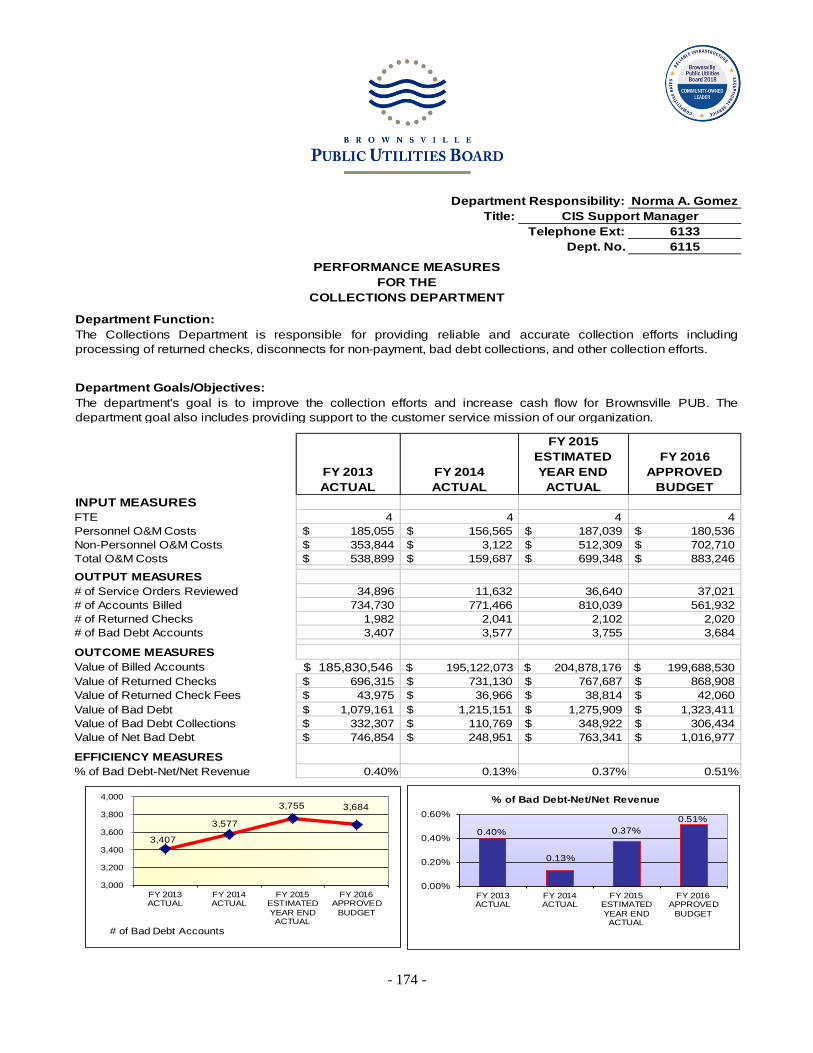
- 174 -
Department Responsibility: Norma A. GomezTitle: CIS Support Manager
Telephone Ext: 6133Dept. No. 6115
PERFORMANCE MEASURESFOR THE
COLLECTIONS DEPARTMENT
Department Function:
Department Goals/Objectives:
FY 2013ACTUAL
FY 2014ACTUAL
FY 2015ESTIMATEDYEAR END
ACTUAL
FY 2016APPROVED
BUDGETINPUT MEASURESFTE 4 4 4 4 Personnel O&M Costs 185,055$ 156,565$ 187,039$ 180,536$ Non-Personnel O&M Costs 353,844$ 3,122$ 512,309$ 702,710$ Total O&M Costs 538,899$ 159,687$ 699,348$ 883,246$
OUTPUT MEASURES# of Service Orders Reviewed 34,896 11,632 36,640 37,021 # of Accounts Billed 734,730 771,466 810,039 561,932 # of Returned Checks 1,982 2,041 2,102 2,020 # of Bad Debt Accounts 3,407 3,577 3,755 3,684
OUTCOME MEASURESValue of Billed Accounts 185,830,546$ $ 195,122,073 $ 204,878,176 $ 199,688,530 Value of Returned Checks 696,315$ 731,130$ 767,687$ 868,908$ Value of Returned Check Fees 43,975$ 36,966$ 38,814$ 42,060$ Value of Bad Debt 1,079,161$ 1,215,151$ 1,275,909$ 1,323,411$ Value of Bad Debt Collections 332,307$ 110,769$ 348,922$ 306,434$ Value of Net Bad Debt 746,854$ 248,951$ 763,341$ 1,016,977$
EFFICIENCY MEASURES% of Bad Debt-Net/Net Revenue 0.40% 0.13% 0.37% 0.51%
The Collections Department is responsible for providing reliable and accurate collection efforts includingprocessing of returned checks, disconnects for non-payment, bad debt collections, and other collection efforts.
The department's goal is to improve the collection efforts and increase cash flow for Brownsville PUB. Thedepartment goal also includes providing support to the customer service mission of our organization.
0.40%
0.13%
0.37% 0.51%
0.00%
0.20%
0.40%
0.60%
FY 2013ACTUAL
FY 2014ACTUAL
FY 2015ESTIMATEDYEAR ENDACTUAL
FY 2016APPROVED
BUDGET
% of Bad Debt-Net/Net Revenue
3,407
3,577
3,755 3,684
3,000
3,200
3,400
3,600
3,800
4,000
FY 2013ACTUAL
FY 2014ACTUAL
FY 2015ESTIMATEDYEAR ENDACTUAL
FY 2016APPROVED
BUDGET
# of Bad Debt Accounts
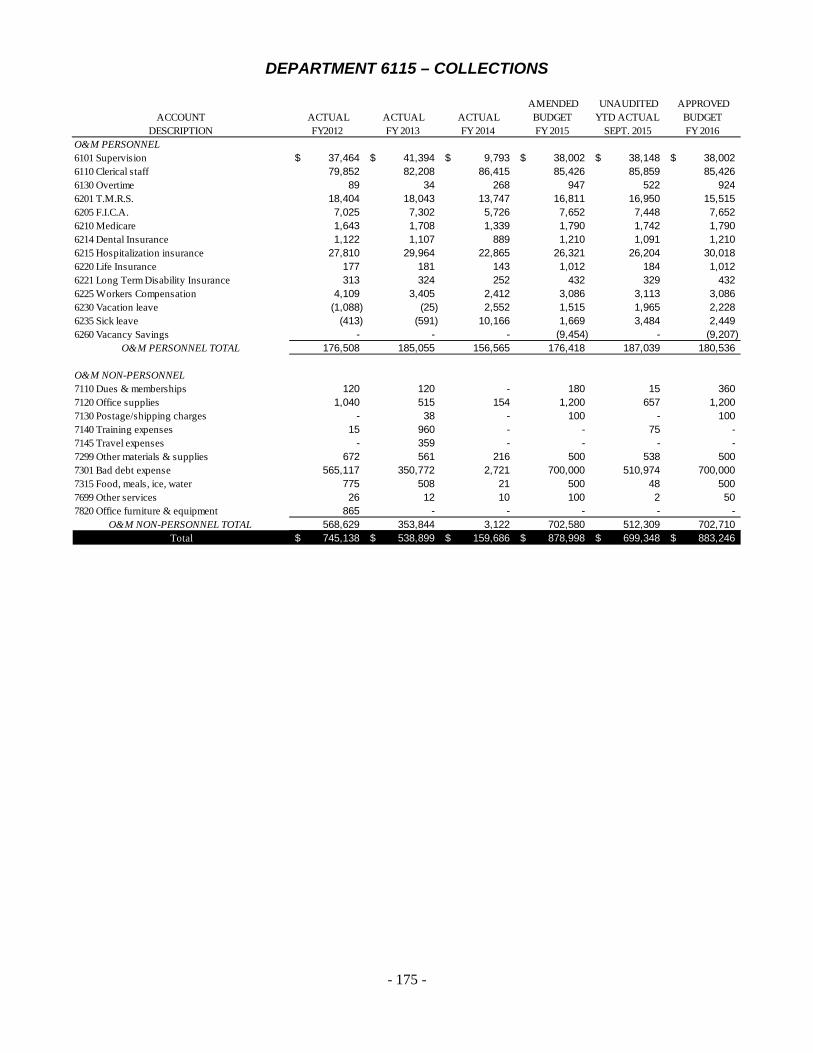
- 175 -
DEPARTMENT 6115 – COLLECTIONS
ACCOUNTDESCRIPTION
ACTUAL FY2012
ACTUAL FY 2013
ACTUAL FY 2014
AMENDED BUDGETFY 2015
UNAUDITED YTD ACTUAL
SEPT. 2015
APPROVEDBUDGETFY 2016
O&M PERSONNEL6101 Supervision 37,464$ 41,394$ 9,793$ 38,002$ 38,148$ 38,002$ 6110 Clerical staff 79,852 82,208 86,415 85,426 85,859 85,426 6130 Overtime 89 34 268 947 522 924 6201 T.M.R.S. 18,404 18,043 13,747 16,811 16,950 15,515 6205 F.I.C.A. 7,025 7,302 5,726 7,652 7,448 7,652 6210 Medicare 1,643 1,708 1,339 1,790 1,742 1,790 6214 Dental Insurance 1,122 1,107 889 1,210 1,091 1,210 6215 Hospitalization insurance 27,810 29,964 22,865 26,321 26,204 30,018 6220 Life Insurance 177 181 143 1,012 184 1,012 6221 Long Term Disability Insurance 313 324 252 432 329 432 6225 Workers Compensation 4,109 3,405 2,412 3,086 3,113 3,086 6230 Vacation leave (1,088) (25) 2,552 1,515 1,965 2,228 6235 Sick leave (413) (591) 10,166 1,669 3,484 2,449 6260 Vacancy Savings - - - (9,454) - (9,207)
O&M PERSONNEL TOTAL 176,508 185,055 156,565 176,418 187,039 180,536
O&M NON-PERSONNEL7110 Dues & memberships 120 120 - 180 15 360 7120 Office supplies 1,040 515 154 1,200 657 1,200 7130 Postage/shipping charges - 38 - 100 - 100 7140 Training expenses 15 960 - - 75 - 7145 Travel expenses - 359 - - - - 7299 Other materials & supplies 672 561 216 500 538 500 7301 Bad debt expense 565,117 350,772 2,721 700,000 510,974 700,000 7315 Food, meals, ice, water 775 508 21 500 48 500 7699 Other services 26 12 10 100 2 50 7820 Office furniture & equipment 865 - - - - -
O&M NON-PERSONNEL TOTAL 568,629 353,844 3,122 702,580 512,309 702,710 Total 745,138$ 538,899$ 159,686$ 878,998$ 699,348$ 883,246$
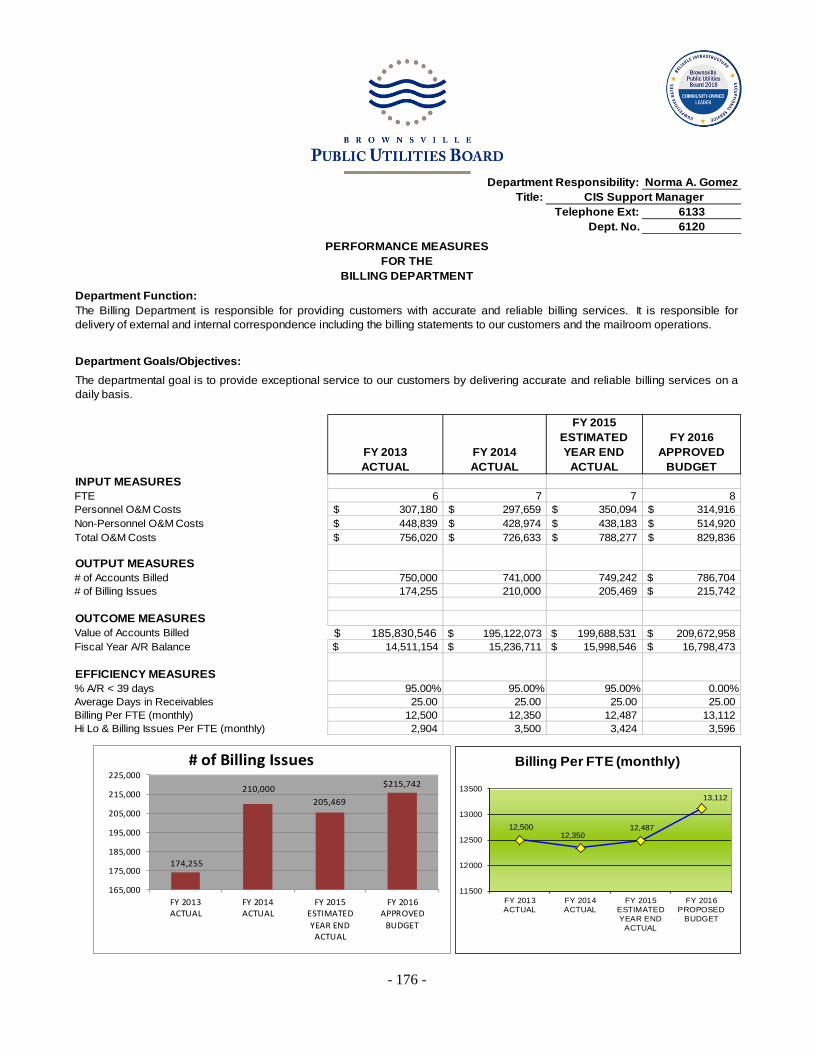
- 176 -
Department Responsibility: Norma A. Gomez
Title: CIS Support ManagerTelephone Ext: 6133
Dept. No. 6120
PERFORMANCE MEASURESFOR THE
BILLING DEPARTMENT
Department Function:
Department Goals/Objectives:
FY 2013 ACTUAL
FY 2014ACTUAL
FY 2015ESTIMATEDYEAR END
ACTUAL
FY 2016APPROVED
BUDGETINPUT MEASURESFTE 6 7 7 8 Personnel O&M Costs 307,180$ 297,659$ 350,094$ 314,916$ Non-Personnel O&M Costs 448,839$ 428,974$ 438,183$ 514,920$ Total O&M Costs 756,020$ 726,633$ 788,277$ 829,836$
OUTPUT MEASURES# of Accounts Billed 750,000 741,000 749,242 $ 786,704 # of Billing Issues 174,255 210,000 205,469 $ 215,742
OUTCOME MEASURESValue of Accounts Billed 185,830,546$ $ 195,122,073 $ 199,688,531 $ 209,672,958 Fiscal Year A/R Balance $ 14,511,154 $ 15,236,711 $ 15,998,546 $ 16,798,473
EFFICIENCY MEASURES% A/R < 39 days 95.00% 95.00% 95.00% 0.00%Average Days in Receivables 25.00 25.00 25.00 25.00 Billing Per FTE (monthly) 12,500 12,350 12,487 13,112 Hi Lo & Billing Issues Per FTE (monthly) 2,904 3,500 3,424 3,596
The Billing Department is responsible for providing customers with accurate and reliable billing services. It is responsible fordelivery of external and internal correspondence including the billing statements to our customers and the mailroom operations.
The departmental goal is to provide exceptional service to our customers by delivering accurate and reliable billing services on adaily basis.
12,500 12,350
12,487
13,112
11500
12000
12500
13000
13500
FY 2013ACTUAL
FY 2014ACTUAL
FY 2015ESTIMATEDYEAR END
ACTUAL
FY 2016PROPOSED
BUDGET
Billing Per FTE (monthly)
174,255
210,000 205,469
$215,742
165,000
175,000
185,000
195,000
205,000
215,000
225,000
FY 2013ACTUAL
FY 2014ACTUAL
FY 2015ESTIMATEDYEAR END
ACTUAL
FY 2016APPROVED
BUDGET
# of Billing Issues
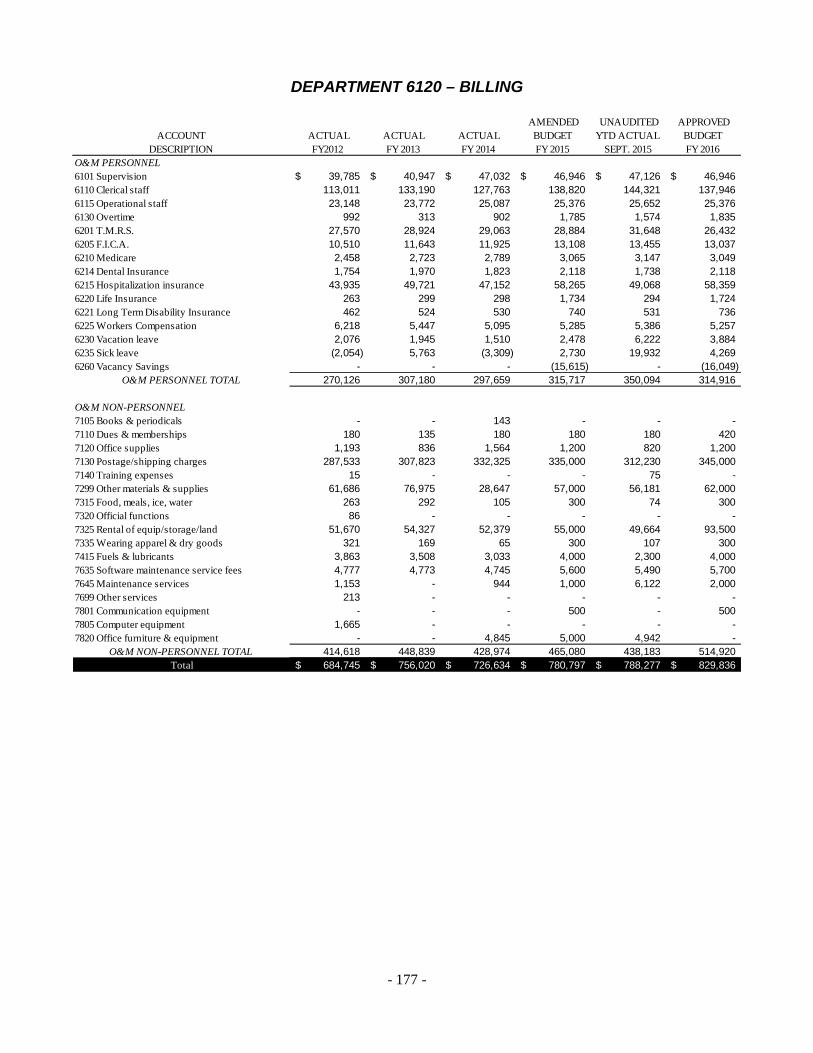
- 177 -
DEPARTMENT 6120 – BILLING
ACCOUNTDESCRIPTION
ACTUAL FY2012
ACTUAL FY 2013
ACTUAL FY 2014
AMENDED BUDGETFY 2015
UNAUDITED YTD ACTUAL
SEPT. 2015
APPROVEDBUDGETFY 2016
O&M PERSONNEL6101 Supervision 39,785$ 40,947$ 47,032$ 46,946$ 47,126$ 46,946$ 6110 Clerical staff 113,011 133,190 127,763 138,820 144,321 137,946 6115 Operational staff 23,148 23,772 25,087 25,376 25,652 25,376 6130 Overtime 992 313 902 1,785 1,574 1,835 6201 T.M.R.S. 27,570 28,924 29,063 28,884 31,648 26,432 6205 F.I.C.A. 10,510 11,643 11,925 13,108 13,455 13,037 6210 Medicare 2,458 2,723 2,789 3,065 3,147 3,049 6214 Dental Insurance 1,754 1,970 1,823 2,118 1,738 2,118 6215 Hospitalization insurance 43,935 49,721 47,152 58,265 49,068 58,359 6220 Life Insurance 263 299 298 1,734 294 1,724 6221 Long Term Disability Insurance 462 524 530 740 531 736 6225 Workers Compensation 6,218 5,447 5,095 5,285 5,386 5,257 6230 Vacation leave 2,076 1,945 1,510 2,478 6,222 3,884 6235 Sick leave (2,054) 5,763 (3,309) 2,730 19,932 4,269 6260 Vacancy Savings - - - (15,615) - (16,049)
O&M PERSONNEL TOTAL 270,126 307,180 297,659 315,717 350,094 314,916
O&M NON-PERSONNEL7105 Books & periodicals - - 143 - - - 7110 Dues & memberships 180 135 180 180 180 420 7120 Office supplies 1,193 836 1,564 1,200 820 1,200 7130 Postage/shipping charges 287,533 307,823 332,325 335,000 312,230 345,000 7140 Training expenses 15 - - - 75 - 7299 Other materials & supplies 61,686 76,975 28,647 57,000 56,181 62,000 7315 Food, meals, ice, water 263 292 105 300 74 300 7320 Official functions 86 - - - - - 7325 Rental of equip/storage/land 51,670 54,327 52,379 55,000 49,664 93,500 7335 Wearing apparel & dry goods 321 169 65 300 107 300 7415 Fuels & lubricants 3,863 3,508 3,033 4,000 2,300 4,000 7635 Software maintenance service fees 4,777 4,773 4,745 5,600 5,490 5,700 7645 Maintenance services 1,153 - 944 1,000 6,122 2,000 7699 Other services 213 - - - - - 7801 Communication equipment - - - 500 - 500 7805 Computer equipment 1,665 - - - - - 7820 Office furniture & equipment - - 4,845 5,000 4,942 -
O&M NON-PERSONNEL TOTAL 414,618 448,839 428,974 465,080 438,183 514,920 Total 684,745$ 756,020$ 726,634$ 780,797$ 788,277$ 829,836$

- 178 -
Department Responsibility: Susan WalkerTitle: Customer Service Manager
Telephone Ext: 6129Dept. No. 6125
PERFORMANCE MEASURESFOR THE
CALL CENTER DEPARTMENT
Department Function:
Department Goals/Objectives:
FY 2013ACTUAL
FY 2014ACTUAL
FY 2015 YEAR END
PROJECTED
FY 2016APPROVED
BUDGETINPUT MEASURESFTE's 11 11 11 13 Personnel O & M Expenses 448,206$ 464,653$ 445,705$ 543,300$ Non Persnnel O & M Expenses 13,399$ 5,357$ 8,058$ 12,025$ Total O & M Expenses 461,605$ 470,010$ 453,763$ 555,325$
OUTPUT MEASURES Handled Calls 261,796 264,904 265,100 267,751 IVR Automated Only 34% 273,605 496,179 430,839 435,147 Total Calls 535,401 761,083 695,939 702,898
OUTCOME MEASURESNumber of Accounts 61,800 61,532 62,700 63,500
15,299,208$ 17,647,558$ 18,381,132$ 19,316,700$ Average Wait Time in Minutes 5 5 5 3
0.86$ 0.62$ 0.65$ 0.79$ 23,800 24,082 24,100 20,596 Transactions Handled per Agent
The Call Center staff responds to customer requests for 1) Move in, 2) Move out, 3) Payment Arrangements, 4) Reconnections, 5)High Bill Complaints, 6) Questions on Bills, 7) Letters of Reference, 8) Open Records research and 9) Trouble calls during regularbusiness hours. In addition to responding to customer requests, the CSR 1) scans documents related to the customer transaction,2) sends emails, 3) sends faxes, 4) mails letters, 5) reviews reports for quality assurance, 6) records trouble calls in the City Worksapplication and 7) returns calls. CSRs attend quarterly safety meetings, bi-weekly departmental meetings and mandatory trainingsessions which reflect our dedication to continuous improvement. Call Center staff provides support to Customer Service andCashier Departments when needed and cross trained staff is available.
The department's goal is to provide solutions to customer utility needs, while we accurately document the transaction. By deliveringexcellent service while being innovative and responsive, we support the organization's mission.
Value of Monthly Service Charges (Annualized)
EFFICIENCY MEASURESAverage Cost Per Call
261,796
264,904 265,100
267,751
260,000
265,000
270,000
275,000
280,000
FY 2013ACTUAL
FY 2014ACTUAL
FY 2015YEAR END
PROJECTED
FY 2016APPROVED
BUDGET
Handled Calls
273,605
496,179
430,839 435,147
200,000
300,000
400,000
500,000
600,000
FY 2013ACTUAL
FY 2014ACTUAL
FY 2015YEAR END
PROJECTED
FY 2016APPROVED
BUDGET
IVR Automated Only

- 179 -
DEPARTMENT 6125 - CALL CENTER
ACCOUNTDESCRIPTION
ACTUAL FY2012
ACTUAL FY 2013
ACTUAL FY 2014
AMENDED BUDGETFY 2015
UNAUDITED YTD ACTUAL
SEPT. 2015
APPROVEDBUDGETFY 2016
O&M PERSONNEL6101 Supervision 39,660$ 40,822$ 41,614$ 41,704$ 41,864$ 41,704$ 6110 Clerical staff 201,143 249,156 253,388 244,712 253,656 322,421 6130 Overtime 4,919 2,159 8,227 5,559 4,654 6,226 6201 T.M.R.S. 38,478 42,617 43,711 39,010 40,959 45,770 6205 F.I.C.A. 14,969 17,474 18,084 17,758 17,719 22,576 6210 Medicare 3,501 4,087 4,229 4,153 4,144 5,280 6214 Dental Insurance 2,517 2,962 2,818 3,025 2,725 3,933 6215 Hospitalization insurance 54,714 68,800 68,931 73,939 65,302 95,573 6220 Life Insurance 372 436 441 2,349 440 2,986 6221 Long Term Disability Insurance 650 761 778 1,002 779 1,274 6225 Workers Compensation 8,608 8,041 7,778 7,160 7,529 9,103 6230 Vacation leave 2,588 (167) 3,577 3,456 3,690 6,663 6235 Sick leave 3,845 9,208 6,455 3,808 2,242 7,323 6240 Educational assistance - 1,852 4,623 5,250 - - 6260 Vacancy Savings - - - (21,741) - (27,531)
O&M PERSONNEL TOTAL 375,964 448,206 464,653 431,144 445,705 543,300
O&M NON-PERSONNEL7120 Office supplies 6,508 4,188 3,065 4,500 3,703 4,500 7130 Postage/shipping charges - - - 100 - 100 7140 Training expenses 20 208 - - 400 325 7145 Travel expenses - - - - 881 900 7299 Other materials & supplies 317 546 87 350 183 350 7315 Food, meals, ice, water 366 399 967 600 804 800 7645 Maintenance services 11,903 8,058 1,238 1,000 1,074 1,200 7699 Other services - - - - - 500 7820 Office furniture & equipment 1,358 - - 3,500 1,014 3,350
O&M NON-PERSONNEL TOTAL 20,473 13,399 5,357 10,050 8,058 12,025 Total 396,437$ 461,606$ 470,010$ 441,194$ 453,762$ 555,325$
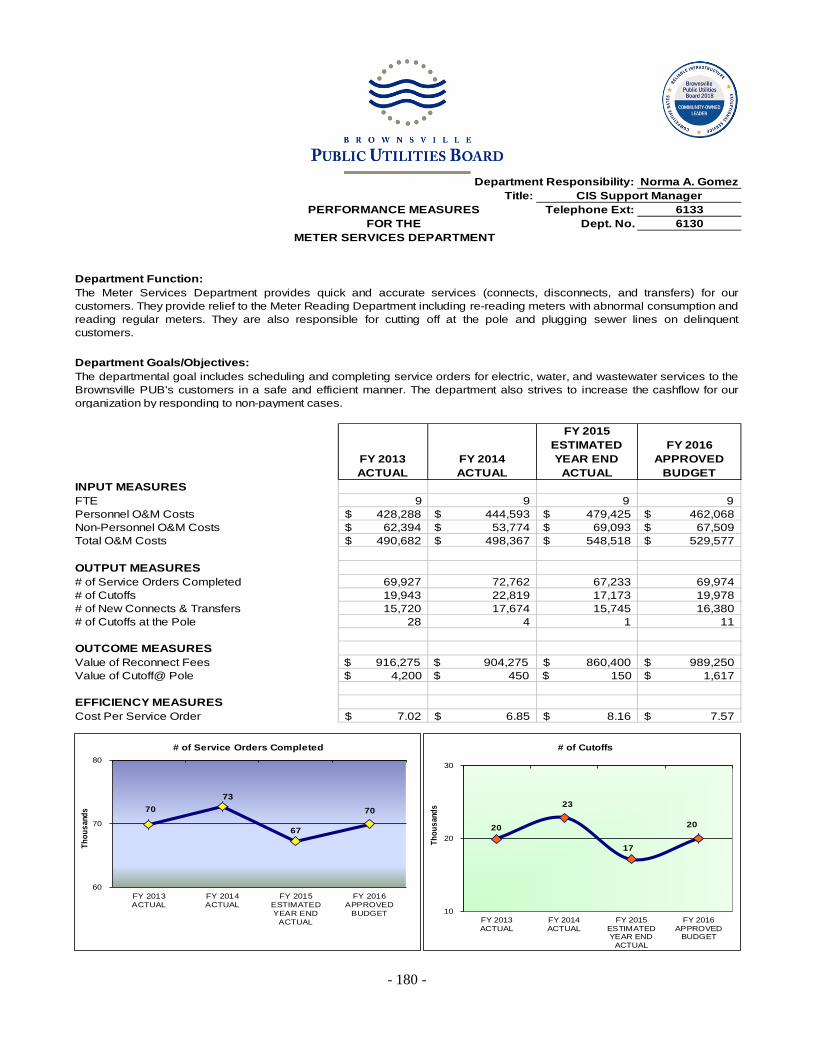
- 180 -
Department Responsibility: Norma A. Gomez
Title: CIS Support ManagerTelephone Ext: 6133
Dept. No. 6130
Department Function:
Department Goals/Objectives:
FY 2013ACTUAL
FY 2014ACTUAL
FY 2015ESTIMATEDYEAR END
ACTUAL
FY 2016APPROVED
BUDGETINPUT MEASURESFTE 9 9 9 9 Personnel O&M Costs 428,288$ 444,593$ 479,425$ 462,068$ Non-Personnel O&M Costs 62,394$ 53,774$ 69,093$ 67,509$ Total O&M Costs 490,682$ 498,367$ 548,518$ 529,577$
OUTPUT MEASURES# of Service Orders Completed 69,927 72,762 67,233 69,974 # of Cutoffs 19,943 22,819 17,173 19,978 # of New Connects & Transfers 15,720 17,674 15,745 16,380 # of Cutoffs at the Pole 28 4 1 11
OUTCOME MEASURESValue of Reconnect Fees $ 916,275 $ 904,275 860,400$ 989,250$ Value of Cutoff@ Pole $ 4,200 $ 450 $ 150 1,617$
EFFICIENCY MEASURESCost Per Service Order 7.02$ 6.85$ 8.16$ 7.57$
PERFORMANCE MEASURESFOR THE
METER SERVICES DEPARTMENT
The Meter Services Department provides quick and accurate services (connects, disconnects, and transfers) for ourcustomers. They provide relief to the Meter Reading Department including re-reading meters with abnormal consumption andreading regular meters. They are also responsible for cutting off at the pole and plugging sewer lines on delinquentcustomers.
The departmental goal includes scheduling and completing service orders for electric, water, and wastewater services to theBrownsville PUB's customers in a safe and efficient manner. The department also strives to increase the cashflow for ourorganization by responding to non-payment cases.
70 73
67
70
60
70
80
FY 2013ACTUAL
FY 2014ACTUAL
FY 2015ESTIMATEDYEAR END
ACTUAL
FY 2016APPROVED
BUDGET
Thou
sand
s
# of Service Orders Completed
20
23
17
20
10
20
30
FY 2013ACTUAL
FY 2014ACTUAL
FY 2015ESTIMATEDYEAR END
ACTUAL
FY 2016APPROVED
BUDGET
Thou
sand
s
# of Cutoffs

- 181 -
DEPARTMENT 6130 – METER SERVICES
ACCOUNTDESCRIPTION
ACTUAL FY2012
ACTUAL FY 2013
ACTUAL FY 2014
AMENDED BUDGETFY 2015
UNAUDITED YTD ACTUAL
SEPT. 2015
APPROVEDBUDGETFY 2016
O&M PERSONNEL6101 Supervision 44,071$ -$ 8,432$ 35,360$ 35,496$ 35,360$ 6115 Operational staff 272,392 274,311 273,479 270,171 269,034 270,171 6130 Overtime 14,820 12,714 15,938 19,484 16,424 21,377 6201 T.M.R.S. 57,318 41,882 44,618 41,613 44,376 38,405 6205 F.I.C.A. 22,044 17,175 18,646 18,943 19,344 18,943 6210 Medicare 5,156 4,017 4,361 4,430 4,524 4,430 6214 Dental Insurance 2,449 2,228 2,246 2,723 2,404 2,723 6215 Hospitalization insurance 62,584 57,004 58,917 70,779 61,530 70,561 6220 Life Insurance 447 392 408 2,505 440 2,505 6221 Long Term Disability Insurance 819 713 741 1,069 800 1,069 6225 Workers Compensation 12,839 7,893 7,843 7,638 8,166 7,638 6230 Vacation leave (2,888) 4,778 2,727 3,687 4,875 5,467 6235 Sick leave 6,499 5,182 6,240 4,062 12,012 6,009 6260 Vacancy Savings - - - (22,762) - (22,590)
O&M PERSONNEL TOTAL 498,550 428,288 444,593 459,703 479,425 462,068
O&M NON-PERSONNEL7110 Dues & memberships - - 20 180 45 180 7120 Office supplies 871 574 720 900 567 2,000 7140 Training expenses - 3,840 - - 2,502 590 7145 Travel expenses - 1,687 - - 1,780 1,954 7180 Utilities - departmental - - - - - 6,000 7225 Safety supplies 428 126 109 500 448 1,092 7299 Other materials & supplies 13,111 14,129 9,578 17,000 14,462 10,000 7315 Food, meals, ice, water 329 176 96 300 279 300 7325 Rental of equip/storage/land - 6,270 - 6,500 7,631 7,950 7335 Wearing apparel & dry goods 3,530 2,303 5,482 2,500 6,700 8,220 7415 Fuels & lubricants 37,007 32,105 30,622 30,000 24,618 25,000 7505 Maint. of communication equipment - 780 - 400 - 500 7635 Software maintenance service fees - - 6,930 6,500 2,930 3,223 7805 Computer equipment - 175 - - - - 7820 Office furniture & equipment 4,899 - 217 7,300 7,132 - 7835 Tools, shop and garage equipment - 230 - 500 - 500
O&M NON-PERSONNEL TOTAL 60,173 62,394 53,774 72,580 69,093 67,509 Total 558,723$ 490,682$ 498,367$ 532,283$ 548,518$ 529,578$

- 182 -
Department Responsibility: Norma A. Gomez
Title: CIS Support ManagerTelephone Ext: 6133
Dept. No. 6135PERFORMANCE MEASURES
FOR THECIS SUPPORT DEPARTMENT
Department Function:
Department Goals/Objectives:
FY 2013 ACTUAL
FY 2014 ACTUAL
FY 2015 ESTIMATEDYEAR END
ACTUAL
FY 2016APPROVED
BUDGETINPUT MEASURESEmployees (FTE's) 3 3 3 3 O&M Expenses 354,398$ 345,706$ 375,133$ 523,992$
OUTPUT MEASURES Cayenta Utilities Billing Projects 9 11 13 10 Cayenta Utilities System Reports 10 9 10 15 Training on Major Projects 90% 100% 100% 100%
OUTCOME MEASURESYes Yes Yes YesYes Yes Yes Yes
This department is responsible for implementation and testing of new features and improving upon the existing features of the Utility ManagerSystem (UMS). In addition, this department is responsible for implementation and testing rate changes on the UMS application. Staff addressesissues from users and creates reports that will allow the user to review their work faster and complete their tasks accurately. Staff also coordinatesand monitors daily and nightly billing processes which include revenues from penalties and billing.
The CIS Support Department's objective is to establish new tools that will allow the Customer & Information Services Department to care for theneeds of our customers efficiently. To meet the demands of customers with new tools such as the customer self-service portal and e-mail systems.To provide audit tools to the departments that will maximize our revenue and allow them to complete their tasks accurately.
Cayenta Utilities System Downtime (desire <3% daily)Development Training Employee Success Rate (desire 100%)
9
11
13
10 10 9
10
15
0
2
4
6
8
10
12
14
16
FY 2013ACTUAL
FY 2014ACTUAL
FY 2015ESTIMATEDYEAR END
ACTUAL
FY 2016PROPOSED
BUDGET
Cayenta Utilities Billing Projects and System Reports
Cayenta Utilities Billing Projects Cayenta Utilities System Reports

- 183 -
DEPARTMENT 6135 – CIS SUPPORT
ACCOUNTDESCRIPTION
ACTUAL FY2012
ACTUAL FY 2013
ACTUAL FY 2014
AMENDED BUDGETFY 2015
UNAUDITED YTD ACTUAL
SEPT. 2015
APPROVEDBUDGETFY 2016
O&M PERSONNEL6101 Supervision 74,602$ 76,761$ 79,949$ 80,662$ 80,973$ 80,662$ 6110 Clerical staff 68,735 70,436 74,891 75,046 76,077 75,046 6130 Overtime 1,085 1,170 867 2,165 1,912 2,977 6201 T.M.R.S. 22,684 21,648 22,200 21,208 21,635 19,573 6205 F.I.C.A. 8,728 9,025 9,374 9,654 9,374 9,654 6210 Medicare 2,041 2,111 2,192 2,258 2,192 2,258 6214 Dental Insurance 842 844 823 908 816 908 6215 Hospitalization insurance 20,341 19,416 20,205 22,861 21,387 24,209 6220 Life Insurance 196 202 210 1,277 213 1,277 6221 Long Term Disability Insurance 374 387 405 545 411 545 6225 Workers Compensation 5,055 4,073 3,893 3,893 3,974 3,893 6230 Vacation leave (2,406) 2,903 (440) 1,879 1,248 2,638 6235 Sick leave 1,370 2,347 2,678 2,070 - 2,900 6260 Vacancy Savings - - - (10,916) - (10,901)
O&M PERSONNEL TOTAL 203,647 211,322 217,248 213,510 220,210 215,637
O&M NON-PERSONNEL7110 Dues & memberships 105 90 30 200 45 200 7120 Office supplies 1,689 1,362 (74) 1,700 240 1,800 7130 Postage/shipping charges 23 - - 100 - 100 7140 Training expenses 2,715 425 1,750 - 3,700 1,700 7145 Travel expenses 3,879 3,229 1,096 - 3,824 3,500 7299 Other materials & supplies 269 36 279 300 116 300 7315 Food, meals, ice, water 475 187 531 300 387 600 7415 Fuels & lubricants - - - - - - 7635 Software maintenance service fees 136,910 129,347 119,398 170,080 144,012 215,155 7699 Other services 3,100 8,400 5,447 10,000 740 85,000 7805 Computer equipment 2,613 - - - - - 7820 Office furniture & equipment - - - - 1,858 -
O&M NON-PERSONNEL TOTAL 151,778 143,076 128,458 182,680 154,922 308,355 Total 355,426$ 354,398$ 345,706$ 396,190$ 375,133$ 523,992$
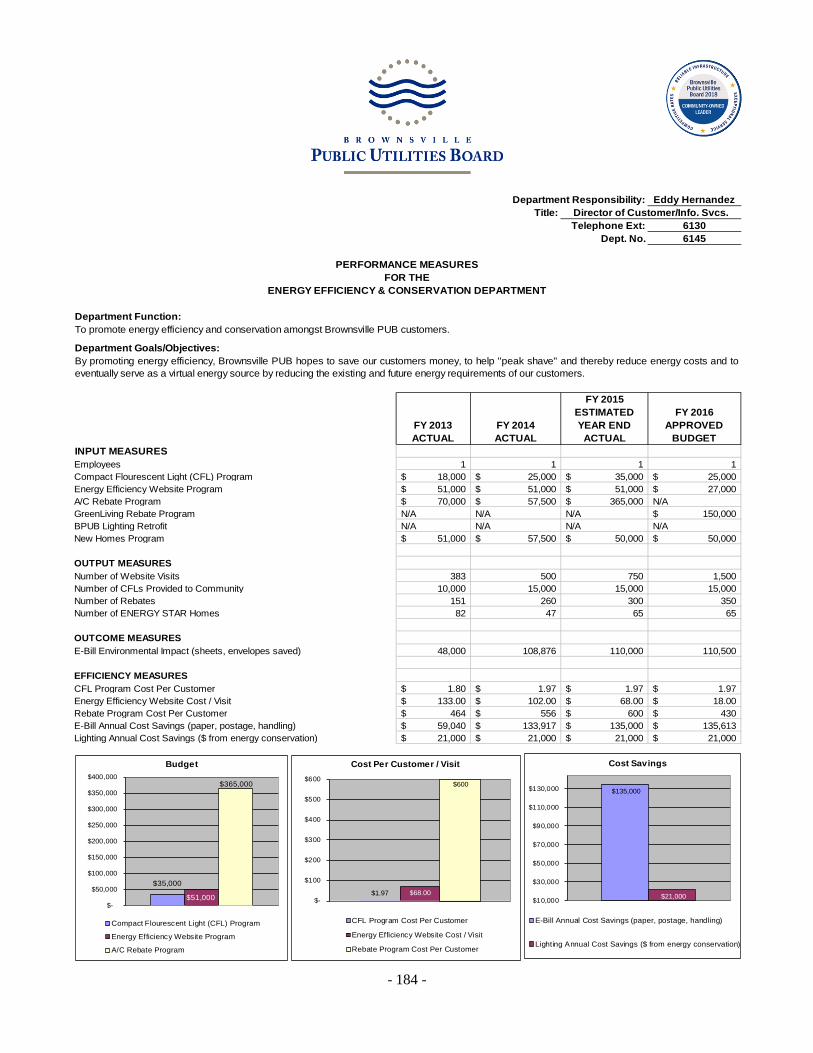
- 184 -
Department Responsibility: Eddy HernandezTitle: Director of Customer/Info. Svcs.
Telephone Ext: 6130Dept. No. 6145
PERFORMANCE MEASURESFOR THE
ENERGY EFFICIENCY & CONSERVATION DEPARTMENT
Department Function:
Department Goals/Objectives:
FY 2013ACTUAL
FY 2014ACTUAL
FY 2015ESTIMATEDYEAR END
ACTUAL
FY 2016APPROVED
BUDGETINPUT MEASURESEmployees 1 1 1 1 Compact Flourescent Light (CFL) Program 18,000$ 25,000$ 35,000$ 25,000$ Energy Efficiency Website Program 51,000$ 51,000$ 51,000$ 27,000$ A/C Rebate Program 70,000$ 57,500$ 365,000$ N/AGreenLiving Rebate Program N/A N/A N/A 150,000$ BPUB Lighting Retrofit N/A N/A N/A N/ANew Homes Program 51,000$ 57,500$ 50,000$ 50,000$
OUTPUT MEASURES Number of Website Visits 383 500 750 1,500Number of CFLs Provided to Community 10,000 15,000 15,000 15,000Number of Rebates 151 260 300 350Number of ENERGY STAR Homes 82 47 65 65
OUTCOME MEASURESE-Bill Environmental Impact (sheets, envelopes saved) 48,000 108,876 110,000 110,500
EFFICIENCY MEASURESCFL Program Cost Per Customer 1.80$ 1.97$ 1.97$ 1.97$ Energy Efficiency Website Cost / Visit 133.00$ 102.00$ 68.00$ 18.00$ Rebate Program Cost Per Customer 464$ 556$ 600$ 430$ E-Bill Annual Cost Savings (paper, postage, handling) 59,040$ 133,917$ 135,000$ 135,613$ Lighting Annual Cost Savings ($ from energy conservation) 21,000$ 21,000$ 21,000$ 21,000$
To promote energy efficiency and conservation amongst Brownsville PUB customers.
By promoting energy efficiency, Brownsville PUB hopes to save our customers money, to help "peak shave" and thereby reduce energy costs and toeventually serve as a virtual energy source by reducing the existing and future energy requirements of our customers.
$35,000
$51,000
$365,000
$-
$50,000
$100,000
$150,000
$200,000
$250,000
$300,000
$350,000
$400,000
Budget
Compact Flourescent Light (CFL) Program
Energy Efficiency Website Program
A/C Rebate Program
$1.97 $68.00
$600
$-
$100
$200
$300
$400
$500
$600
Cost Per Customer / Visit
CFL Program Cost Per Customer
Energy Efficiency Website Cost / Visit
Rebate Program Cost Per Customer
$135,000
$21,000 $10,000
$30,000
$50,000
$70,000
$90,000
$110,000
$130,000
Cost Savings
E-Bill Annual Cost Savings (paper, postage, handling)
Lighting Annual Cost Savings ($ from energy conservation)

- 185 -
DEPARTMENT 6145 – ENERGY EFFICIENCY & CONSERVATION
ACCOUNTDESCRIPTION
ACTUAL FY2012
ACTUAL FY 2013
ACTUAL FY 2014
AMENDED BUDGETFY 2015
UNAUDITED YTD ACTUAL
SEPT. 2015
APPROVEDBUDGETFY 2016
O&M PERSONNEL6105 Administrative Staff 44,994$ 45,423$ 46,052$ 46,197$ 29,850$ -$ 6201 T.M.R.S. 7,044 6,629 6,567 6,292 4,093 - 6205 F.I.C.A. 2,795 2,822 2,861 2,864 1,855 - 6210 Medicare 654 660 669 670 434 - 6214 Dental Insurance 281 278 275 303 178 - 6215 Hospitalization insurance 5,623 5,563 5,325 5,956 3,427 - 6220 Life Insurance 62 61 64 379 43 - 6221 Long Term Disability Insurance 117 116 121 162 83 - 6225 Workers Compensation 1,575 1,251 1,151 1,155 746 - 6230 Vacation leave 1,808 (68) (624) 557 (3,109) - 6235 Sick leave 2,208 2,037 2,687 614 (11,794) - 6260 Vacancy Savings - - - (3,199) - -
O&M PERSONNEL TOTAL 67,161 64,774 65,147 61,949 25,807 -
O&M NON-PERSONNEL7102 Sponsorships - - - 1,000 - 1,000 7105 Books & periodicals - - - 100 - 200 7110 Dues & memberships - - - 100 - 100 7120 Office supplies 67 75 60 75 51 200 7130 Postage/shipping charges - 74 - 50 - 50 7140 Training expenses 300 325 365 - 325 800 7145 Travel expenses 3,576 1,134 1,291 - 927 1,600 7299 Other materials & supplies - 375 137 200 54 200 7315 Food, meals, ice, water 12 12 12 20 12 25 7340 Promo Exp-Enrgy Efficiency & Consrv - 20,688 27,984 35,000 25,513 37,500 7345 Rebate Exp-Enrgy Efficiency & Cnsrv 116,159 113,598 153,781 150,000 187,728 150,000 7346 Water Efficiency Program - - - 10,000 - 10,000 7347 Commercial & Industrial Rebate Prog - - - 250,000 - 250,000 7635 Software maintenance service fees 51,000 51,000 51,000 51,000 39,125 28,000 7699 Other services - - - 10,000 - 5,000 7805 Computer equipment - - - 100 - 250 7820 Office furniture & equipment - - - 250 - 500
O&M NON-PERSONNEL TOTAL 171,113 187,281 234,631 507,895 253,735 485,425 Total 238,274$ 252,055$ 299,778$ 569,844$ 279,542$ 485,425$

- 186 -
Department Responsibility: Norma A. GomezTitle: CIS Support Manager
Telephone Ext: 6133Dept. No. 6150
PERFORMANCE MEASURESFOR THE
METER READING DEPARTMENT
Department Function:
Department Goals/Objectives:
FY 2013ACTUAL
FY 2014ACTUAL
FY 2015ESTIMATEDYEAR END
ACTUAL
FY 2016APPROVED
BUDGETINPUT MEASURESFTE 15 15 15 15 Personnel O&M Costs 591,421$ 548,525$ 580,850$ 590,359$ Non-Personnel O & M Costs 74,289$ 65,156$ 131,803$ 85,040$ Total O&M Costs 665,710$ 613,681$ 712,653$ 675,399$
OUTPUT MEASURES# of Meter Reads 1,285,659 1,298,619 1,363,550 1,431,727 # of Meters Estimated 3,797 5,643 5,926 6,224
OUTCOME MEASURES% of Estimated Readings 0.30% 0.43% 0.43% 0.43%% of Radio Frequency Meters Installed 6% 8% 8% 7%
EFFICIENCY MEASURESCost Per Meter Read -BPUB 0.52$ 0.47$ 0.52$ 0.47$ Best Performer Full AMR (cost per read) 0.27$ 0.27$ 0.27$ -$ Best Performer Minimal AMR (cost per read) 0.47$ 0.47$ 0.47$ -$ Meters Read Per FTE (annual) 91,833 92,759 97,396 102,266 Meters Read Per FTE (daily) 375 373 391 411
The Meter Reading Department is responsible for providing reliable and timely reads on electric and water meters to the BrownsvillePUB's customers in a safe and efficient manner.
The departmental goals include scheduling and performing daily meter reads which will generate timely and accurate billings.
1,285,659 1,298,619 1,363,550 1,431,727
3,797 5,643 5,926 6,224 -
200,000
400,000
600,000
800,000
1,000,000
1,200,000
1,400,000
1,600,000
FY 2013ACTUAL
FY 2014ACTUAL
FY 2015ESTIMATEDYEAR END
ACTUAL
FY 2016APPROVED
BUDGET
Meter Reading
# of Meter Reads # of Meters Estimated
91,833 92,759
97,396
102,266
88000
92000
96000
100000
104000
FY 2013ACTUAL
FY 2014ACTUAL
FY 2015ESTIMATEDYEAR END
ACTUAL
FY 2016PROPOSED
BUDGET

- 187 -
DEPARTMENT 6150 – METER READING
ACCOUNTDESCRIPTION
ACTUAL FY2012
ACTUAL FY 2013
ACTUAL FY 2014
AMENDED BUDGETFY 2015
UNAUDITED YTD ACTUAL
SEPT. 2015
APPROVEDBUDGETFY 2016
O&M PERSONNEL6101 Supervision 38,081$ 38,293$ 24,072$ 35,360$ 35,496$ 35,360$ 6115 Operational staff 347,721 345,489 346,453 353,933 340,598 349,211 6130 Overtime 14,700 8,546 13,684 18,460 11,552 16,369 6201 T.M.R.S. 62,850 57,632 55,746 53,105 52,971 48,341 6205 F.I.C.A. 24,154 23,849 23,481 24,136 23,157 23,843 6206 Suta 4,608 - - - 1,354 - 6210 Medicare 5,649 5,578 5,492 5,645 5,416 5,576 6214 Dental Insurance 4,097 3,993 3,856 4,538 3,967 4,538 6215 Hospitalization insurance 95,790 91,479 89,161 108,412 93,814 107,483 6220 Life Insurance 590 581 568 3,192 582 3,153 6221 Long Term Disability Insurance 1,024 1,010 984 1,363 1,006 1,346 6225 Workers Compensation 14,034 10,832 9,776 9,732 9,734 9,614 6230 Vacation leave 1,051 (304) (3,310) 4,739 3,843 7,120 6235 Sick leave 14,547 4,442 (21,439) 5,221 (2,641) 7,827 6260 Vacancy Savings - - - (30,182) - (29,423)
O&M PERSONNEL TOTAL 628,896 591,421 548,525 597,653 580,850 590,359
O&M NON-PERSONNEL7110 Dues & memberships 105 659 80 200 45 500 7120 Office supplies 626 687 402 850 458 1,000 7130 Postage/shipping charges 3,647 2,306 2,024 3,000 318 3,000 7140 Training expenses 15 - - - 214 - 7180 Utilities - departmental - - - - 571 - 7190 Utilities - CP&L & Mvec - - 502 - - 240 7190 Utilities - CP&L & Mvec - - - - 477 - 7225 Safety supplies 2,741 2,826 835 3,000 1,244 3,000 7299 Other materials & supplies 15,732 17,073 9,949 16,000 10,379 10,000 7310 Federal, state, & local fees 15 10 - 100 100 100 7315 Food, meals, ice, water 409 648 1,062 600 618 600 7325 Rental of equip/storage/land - - - - 5,517 7,800 7335 Wearing apparel & dry goods 5,866 5,198 10,839 5,200 15,419 18,000 7415 Fuels & lubricants 35,912 31,642 28,626 27,000 18,793 27,000 7505 Maint. of communication equipment 1,365 1,044 - 1,500 1,040 1,500 7645 Maintenance services 345 10,468 10,635 10,000 2,782 10,000 7699 Other services - - - - 3,920 - 7801 Communication equipment - 600 - 500 69,516 1,300 7820 Office furniture & equipment 1,144 788 - 2,415 178 - 7899 Other minor tools & equipment 428 341 203 1,200 215 1,000
O&M NON-PERSONNEL TOTAL 68,350 74,289 65,156 71,565 131,803 85,040 Total 697,246$ 665,710$ 613,681$ 669,218$ 712,652$ 675,399$

- 188 -
Department Responsibility: Susan WalkerTitle: Customer Service Manager
Telephone Ext: 6129Dept. No. 6160
PERFORMANCE MEASURESFOR THE
CASHIERS DEPARTMENT
Department Function:
Department Goals/Objectives:
FY 2013 ACTUAL
FY 2014ACTUAL
FY 2015YEAR END
PROJECTED
FY 2016APPROVED
BUDGETINPUT MEASURESFTE's 8 8 8 8
350,813$ 370,525$ 375,827$ 349,584$ 348,555$ 492,112$ 446,303$ 440,508$
Total Expenses 699,368$ 862,637$ 822,130$ 790,092$
OUTPUT MEASURES 369,432 356,178 338,682 348,842.46 352,033 370,732 395,507 407,372 721,465 726,910 734,189 756,215
OUTCOME MEASURESNumber of Accounts 61,800 61,532 62,700 63,500
187,785,635$ 205,577,974$ 204,616,196$ 218,939,330$
Transactions Per FTE 90,183 90,864 91,774 94,527 0.97$ 1.19$ 1.12$ 1.04$
Automated Payments
The Cashiers Department is responsible for processing payments in an efficient and effective manner. In addition, thisdepartment is responsible for controlling departmental costs and staffing levels while implementing new methods of paymentprocessing to achieve greater efficiency. Cashiers staff provides support to Call Center and Customer Service when neededand cross-trained staff is available.
The department's goal is to provide customers with the timely processing of payments and accurate handling of both the cash/checks and credit card transactions. The department's goal includes providing support to the mission of our organization.
Personnel O & M ExpensesNon-Personnel O & M Expenses
Cashier Handled Payments
Total Payments Processed
Total Revenue Collected
EFFICIENCY MEASURES
Cost Per Payment
$188 $206 $205
$219
$0
$50
$100
$150
$200
$250
FY 2013ACTUAL
FY 2014ACTUAL
FY 2015YEAR END
PROJECTED
FY 2016APPROVED
BUDGET
Milli
ons
Total Revenue Collected
721,465 726,910
734,189
756,215
680,000
700,000
720,000
740,000
760,000
780,000
800,000
FY 2013ACTUAL
FY 2014ACTUAL
FY 2015YEAR END
PROJECTED
FY 2016APPROVED
BUDGET
Total Payments Processed

- 189 -
DEPARTMENT 6160 - CASHIERS
ACCOUNTDESCRIPTION
ACTUAL FY2012
ACTUAL FY 2013
ACTUAL FY 2014
AMENDED BUDGETFY 2015
UNAUDITED YTD ACTUAL
SEPT. 2015
APPROVEDBUDGETFY 2016
O&M PERSONNEL6101 Supervision 39,660$ 40,822$ 39,528$ 70,949$ 39,213$ 39,062$ 6110 Clerical staff 191,753 191,958 194,991 198,910 201,587 192,878 6130 Overtime 9,748 4,507 7,876 8,858 7,904 8,382 6201 T.M.R.S. 37,778 34,627 34,562 36,870 35,774 29,155 6205 F.I.C.A. 14,850 14,510 14,534 14,754 15,621 14,380 6206 Suta 1,039 - - - - - 6210 Medicare 3,473 3,393 3,399 3,913 3,653 3,363 6214 Dental Insurance 2,239 2,218 2,147 2,723 2,158 2,420 6215 Hospitalization insurance 45,262 47,559 50,230 67,982 53,761 60,037 6220 Life Insurance 344 347 343 2,213 355 1,902 6221 Long Term Disability Insurance 605 613 608 945 631 812 6225 Workers Compensation 8,441 6,528 6,060 6,746 6,574 5,799 6230 Vacation leave (3,347) 2,597 2,076 3,256 4,432 4,233 6235 Sick leave (1,481) 1,131 14,172 3,588 4,162 4,652 6260 Vacancy Savings - - - (20,396) - (17,490)
O&M PERSONNEL TOTAL 350,365 350,813 370,525 401,311 375,827 349,584
O&M NON-PERSONNEL7120 Office supplies 8,486 2,986 3,957 9,000 6,686 9,000 7130 Postage/shipping charges 41 - - 250 - 250 7140 Training expenses 20 178 - - - - 7299 Other materials & supplies 2,071 885 1,155 2,000 286 2,000 7315 Food, meals, ice, water 196 382 772 300 671 700 7635 Software maintenance service fees 3,245 3,245 3,245 3,300 3,245 3,300 7645 Maintenance services 6,395 6,540 5,643 7,000 5,037 12,500 7650 Security services 3,569 3,467 3,622 3,500 3,763 4,100 7699 Other services 334,520 328,288 470,047 398,000 424,121 398,000 7805 Computer equipment 150 - - - - - 7820 Office furniture & equipment - 2,585 3,671 9,726 2,494 10,658
O&M NON-PERSONNEL TOTAL 358,692 348,555 492,112 433,076 446,303 440,508 Total 709,057$ 699,368$ 862,637$ 834,387$ 822,130$ 790,092$
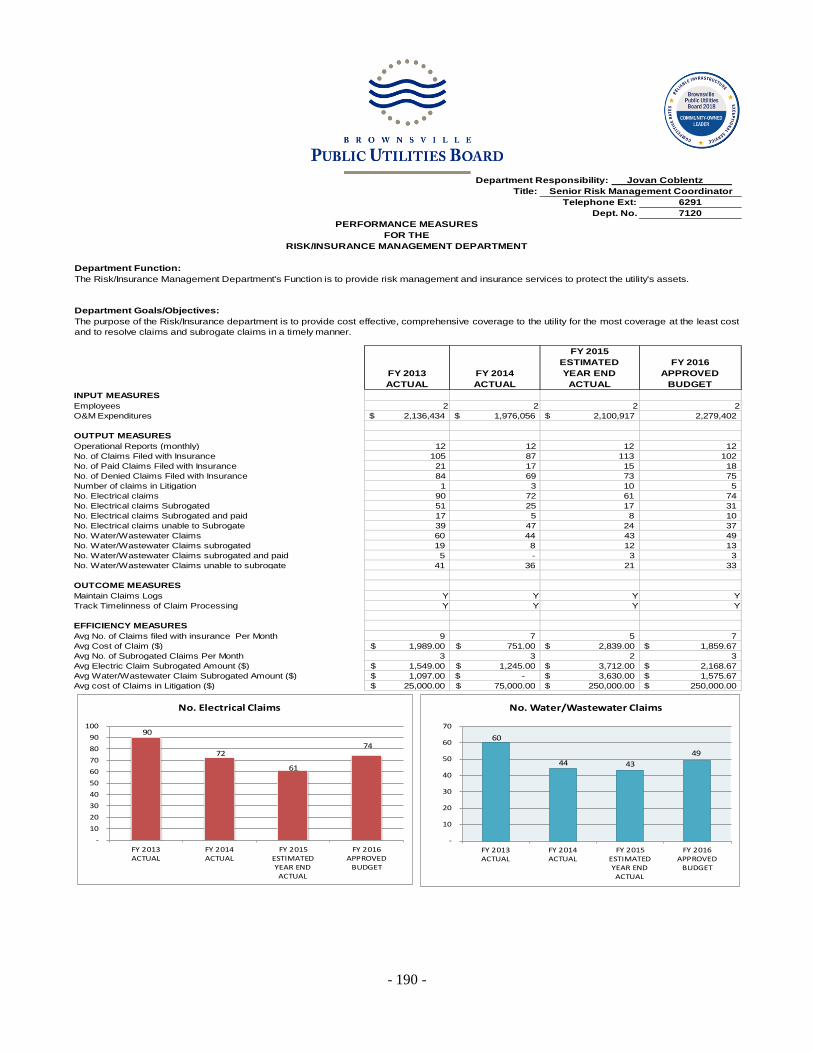
- 190 -
Department Responsibility: Jovan Coblentz Title: Senior Risk Management Coordinator
Telephone Ext: 6291Dept. No. 7120
PERFORMANCE MEASURESFOR THE
RISK/INSURANCE MANAGEMENT DEPARTMENT
Department Function:
Department Goals/Objectives:
FY 2013 ACTUAL
FY 2014 ACTUAL
FY 2015ESTIMATEDYEAR END
ACTUAL
FY 2016 APPROVED
BUDGETINPUT MEASURES
2 2 2 22,136,434$ 1,976,056$ 2,100,917$ 2,279,402
OUTPUT MEASURES 12 12 12 12 105 87 113 102 21 17 15 18 84 69 73 75 1 3 10 5 90 72 61 74 51 25 17 31 17 5 8 10 39 47 24 37
60 44 43 49 19 8 12 13 5 - 3 3
41 36 21 33
OUTCOME MEASURESY Y Y YY Y Y Y
9 7 5 7 1,989.00$ 751.00$ 2,839.00$ 1,859.67$
3 3 2 3 1,549.00$ 1,245.00$ 3,712.00$ 2,168.67$ 1,097.00$ -$ 3,630.00$ 1,575.67$
25,000.00$ 75,000.00$ 250,000.00$ 250,000.00$
O&M Expenditures
No. Electrical claims unable to Subrogate
Operational Reports (monthly)No. of Claims Filed with InsuranceNo. of Paid Claims Filed with InsuranceNo. of Denied Claims Filed with InsuranceNumber of claims in LitigationNo. Electrical claims No. Electrical claims SubrogatedNo. Electrical claims Subrogated and paid
The Risk/Insurance Management Department's Function is to provide risk management and insurance services to protect the utility's assets.
The purpose of the Risk/Insurance department is to provide cost effective, comprehensive coverage to the utility for the most coverage at the least costand to resolve claims and subrogate claims in a timely manner.
Employees
No. Water/Wastewater Claims subrogatedNo. Water/Wastewater Claims
No. Water/Wastewater Claims subrogated and paidNo. Water/Wastewater Claims unable to subrogate
Maintain Claims LogsTrack Timelinness of Claim Processing
EFFICIENCY MEASURESAvg No. of Claims filed with insurance Per MonthAvg Cost of Claim ($)Avg No. of Subrogated Claims Per Month
Avg Water/Wastewater Claim Subrogated Amount ($)Avg cost of Claims in Litigation ($)
Avg Electric Claim Subrogated Amount ($)
90
72
61
74
- 10 20 30 40 50 60 70 80 90
100
FY 2013ACTUAL
FY 2014ACTUAL
FY 2015ESTIMATEDYEAR ENDACTUAL
FY 2016APPROVED
BUDGET
No. Electrical Claims
60
44 43 49
-
10
20
30
40
50
60
70
FY 2013ACTUAL
FY 2014ACTUAL
FY 2015ESTIMATEDYEAR ENDACTUAL
FY 2016APPROVED
BUDGET
No. Water/Wastewater Claims

- 191 -
DEPARTMENT 7120 – RISK / INSURANCE MANAGEMENT
ACCOUNTDESCRIPTION
ACTUAL FY2012
ACTUAL FY 2013
ACTUAL FY 2014
AMENDED BUDGETFY 2015
UNAUDITED YTD ACTUAL
SEPT. 2015
APPROVEDBUDGETFY 2016
O&M PERSONNEL6101 Supervision -$ -$ -$ -$ 4,339$ -$ 6105 Administrative Staff 50,719 89,693 103,215 104,146 95,741 104,146 6201 T.M.R.S. 7,930 13,065 14,716 14,185 13,630 13,091 6205 F.I.C.A. 3,201 5,569 6,309 6,457 5,972 6,457 6210 Medicare 749 1,302 1,475 1,510 1,397 1,510 6214 Dental Insurance 281 499 549 605 514 605 6215 Hospitalization insurance 5,623 11,437 13,380 16,905 13,904 16,333 6220 Life Insurance 69 121 140 854 138 854 6221 Long Term Disability Insurance 134 234 271 365 268 365 6225 Workers Compensation 1,802 2,426 2,628 2,604 2,532 2,604 6230 Vacation leave 1,157 1,761 (48) 1,257 (2,197) 1,766 6235 Sick leave 3,942 6,275 3,625 1,385 2,014 1,941 6240 Educational assistance - - 571 - - - 6260 Vacancy Savings - - - (7,381) - (7,298)
O&M PERSONNEL TOTAL 75,607 132,383 146,832 142,890 138,251 142,374
O&M NON-PERSONNEL7105 Books & periodicals - - - 100 364 - 7110 Dues & memberships 663 880 880 700 - 1,500 7120 Office supplies 111 358 58 200 77 200 7125 Photo equipment/supplies 222 130 - 500 - - 7130 Postage/shipping charges 42 107 489 250 168 150 7135 Telephone expenses - 100 - - - - 7140 Training expenses 1,310 526 100 - 1,440 2,500 7145 Travel expenses 5,707 936 2,659 - 1,314 2,500 7225 Safety supplies 241 59 131 200 135 150 7299 Other materials & supplies 5,895 4,337 292 - - - 7310 Federal, state, & local fees - 19 - - - - 7315 Food, meals, ice, water 12 35 24 - 24 - 7380 Insurance - general liability 50,228 54,829 64,497 64,500 64,882 71,000 7381 Insurance - boiler,mchnry,property 861,860 982,735 1,063,925 1,200,000 1,045,339 1,200,000 7382 Insurance - blanket bond 1,482 1,703 1,582 2,000 4,040 1,000 7384 Insurance - public officials liab 66,225 63,960 74,241 81,500 73,611 91,650 7385 Insurance - comprehensive auto liab 90,063 87,524 103,845 135,800 109,393 109,378 7386 Insurance - umbrella liability 316,543 325,479 350,956 397,406 397,767 405,000 7387 Insurance - self insured damages 64,583 25,592 53,544 150,000 114,156 150,000 7388 Excess Workers Compensation 57,273 61,948 63,039 - 70,740 - 7415 Fuels & lubricants 1,874 1,761 2,293 2,000 1,986 2,000 7635 Software maintenance service fees - - 5,124 - 4,500 - 7650 Security services 251,314 274,153 - - - - 7699 Other services 465 84,183 41,545 100,000 72,730 100,000 7820 Office furniture & equipment 2,591 78 - - - - 7899 Other minor tools & equipment - 32,620 - - - -
O&M NON-PERSONNEL TOTAL 1,778,702 2,004,051 1,829,224 2,135,156 1,962,666 2,137,028 Total 1,854,309$ 2,136,434$ 1,976,056$ 2,278,046$ 2,100,917$ 2,279,402$
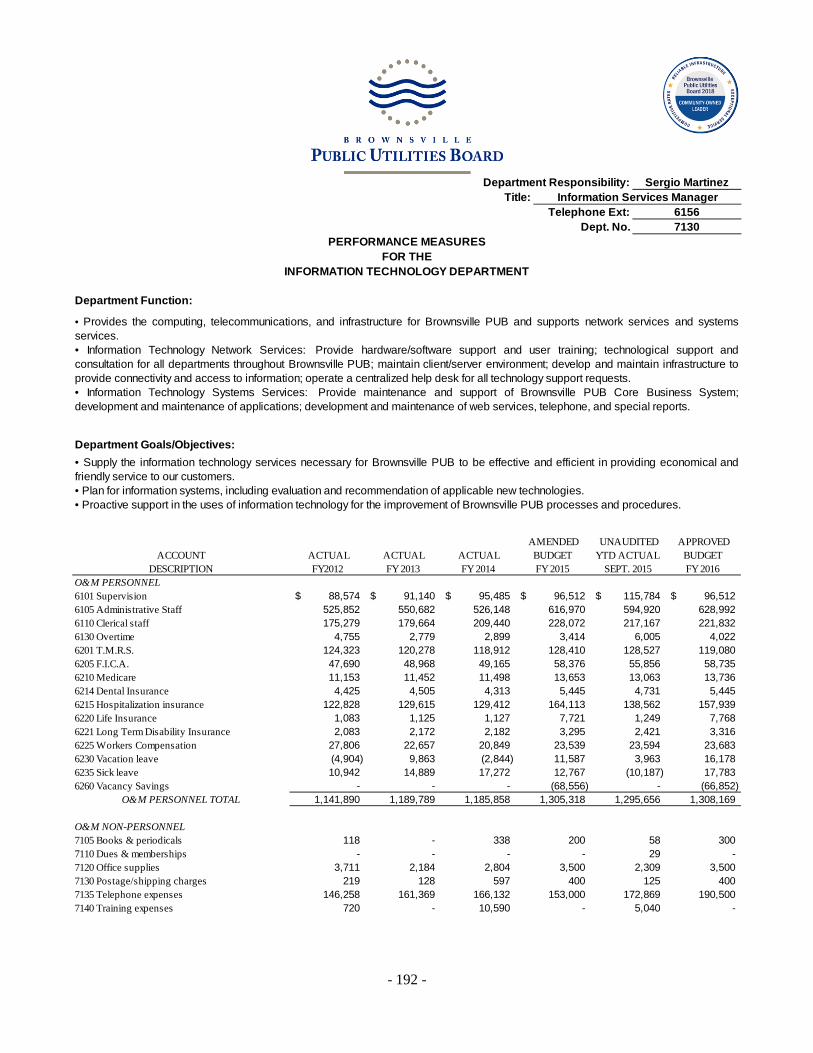
- 192 -
Department Responsibility: Sergio Martinez
Title: Information Services ManagerTelephone Ext: 6156
Dept. No. 7130PERFORMANCE MEASURES
FOR THEINFORMATION TECHNOLOGY DEPARTMENT
Department Function:
Department Goals/Objectives:
• Provides the computing, telecommunications, and infrastructure for Brownsville PUB and supports network services and systemsservices. • Information Technology Network Services: Provide hardware/software support and user training; technological support andconsultation for all departments throughout Brownsville PUB; maintain client/server environment; develop and maintain infrastructure toprovide connectivity and access to information; operate a centralized help desk for all technology support requests.• Information Technology Systems Services: Provide maintenance and support of Brownsville PUB Core Business System;development and maintenance of applications; development and maintenance of web services, telephone, and special reports.
• Supply the information technology services necessary for Brownsville PUB to be effective and efficient in providing economical andfriendly service to our customers.• Plan for information systems, including evaluation and recommendation of applicable new technologies.• Proactive support in the uses of information technology for the improvement of Brownsville PUB processes and procedures.
ACCOUNTDESCRIPTION
ACTUAL FY2012
ACTUAL FY 2013
ACTUAL FY 2014
AMENDED BUDGETFY 2015
UNAUDITED YTD ACTUAL
SEPT. 2015
APPROVEDBUDGETFY 2016
O&M PERSONNEL6101 Supervision 88,574$ 91,140$ 95,485$ 96,512$ 115,784$ 96,512$ 6105 Administrative Staff 525,852 550,682 526,148 616,970 594,920 628,992 6110 Clerical staff 175,279 179,664 209,440 228,072 217,167 221,832 6130 Overtime 4,755 2,779 2,899 3,414 6,005 4,022 6201 T.M.R.S. 124,323 120,278 118,912 128,410 128,527 119,080 6205 F.I.C.A. 47,690 48,968 49,165 58,376 55,856 58,735 6210 Medicare 11,153 11,452 11,498 13,653 13,063 13,736 6214 Dental Insurance 4,425 4,505 4,313 5,445 4,731 5,445 6215 Hospitalization insurance 122,828 129,615 129,412 164,113 138,562 157,939 6220 Life Insurance 1,083 1,125 1,127 7,721 1,249 7,768 6221 Long Term Disability Insurance 2,083 2,172 2,182 3,295 2,421 3,316 6225 Workers Compensation 27,806 22,657 20,849 23,539 23,594 23,683 6230 Vacation leave (4,904) 9,863 (2,844) 11,587 3,963 16,178 6235 Sick leave 10,942 14,889 17,272 12,767 (10,187) 17,783 6260 Vacancy Savings - - - (68,556) - (66,852)
O&M PERSONNEL TOTAL 1,141,890 1,189,789 1,185,858 1,305,318 1,295,656 1,308,169
O&M NON-PERSONNEL7105 Books & periodicals 118 - 338 200 58 300 7110 Dues & memberships - - - - 29 - 7120 Office supplies 3,711 2,184 2,804 3,500 2,309 3,500 7130 Postage/shipping charges 219 128 597 400 125 400 7135 Telephone expenses 146,258 161,369 166,132 153,000 172,869 190,500 7140 Training expenses 720 - 10,590 - 5,040 -

- 193 -
DEPARTMENT 7130 - INFORMATION TECHNOLOGY
ACCOUNTDESCRIPTION
ACTUAL FY2012
ACTUAL FY 2013
ACTUAL FY 2014
AMENDED BUDGETFY 2015
UNAUDITED YTD ACTUAL
SEPT. 2015
APPROVEDBUDGETFY 2016
7145 Travel expenses 136 2,625 3,475 - 6,541 4,000 7180 Utilities - departmental 4,812 3,081 3,712 4,466 9,536 5,500 7299 Other materials & supplies 40,057 25,154 14,977 11,000 25,747 11,000 7315 Food, meals, ice, water 2,509 1,113 603 1,000 778 1,000 7325 Rental of equip/storage/land - 390 832 - - - 7335 Wearing apparel & dry goods 322 321 347 400 301 400 7415 Fuels & lubricants 1,869 2,183 1,573 1,700 1,232 1,000 7635 Software maintenance service fees 255,867 293,242 231,856 305,000 359,605 350,000 7645 Maintenance services 80,447 122,621 219,699 75,000 168,447 91,500 7699 Other services - - 223 - - 30,000 7801 Communication equipment - - - - 929 - 7805 Computer equipment 181,231 178,605 346,851 199,500 327,068 142,000 7806 Software licenses - new - 694 9,134 - 5,944 - 7820 Office furniture & equipment 11,007 474 - - - - 7899 Other minor tools & equipment - - - - 464 -
O&M NON-PERSONNEL TOTAL 729,284 794,183 1,013,745 755,166 1,087,021 831,100 Total 1,871,175$ 1,983,972$ 2,199,603$ 2,060,484$ 2,382,676$ 2,139,269$
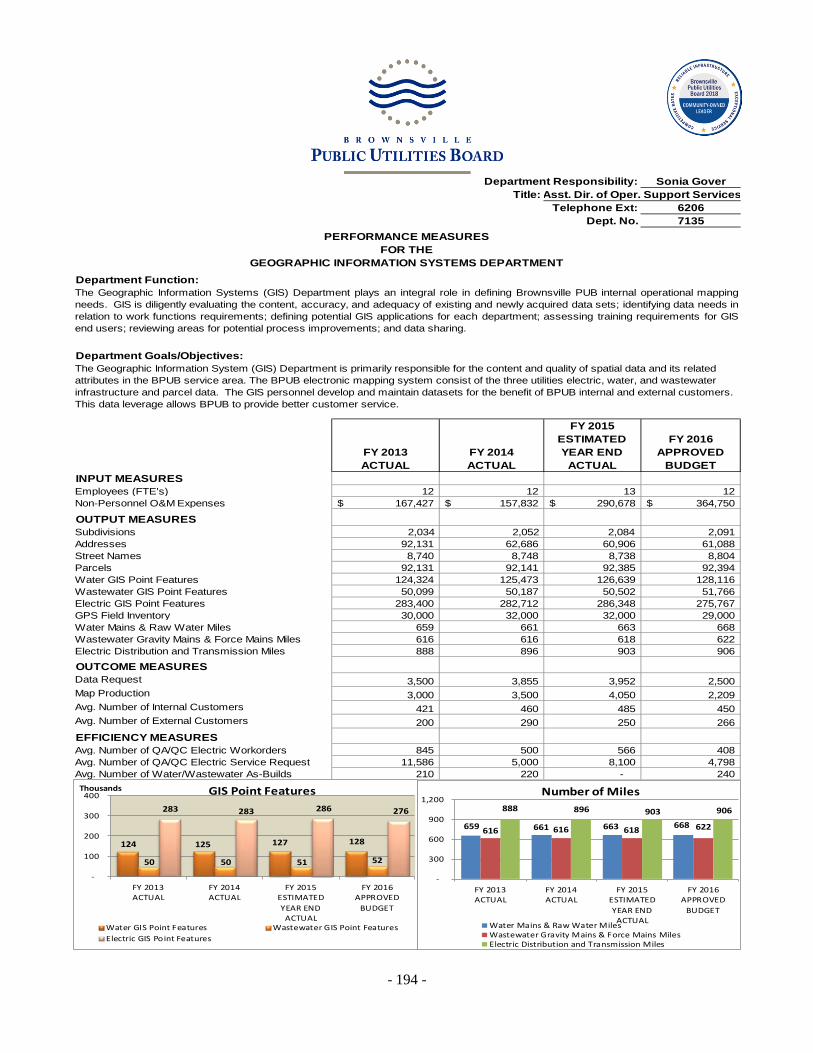
- 194 -
Department Responsibility: Sonia Gover
Title: Asst. Dir. of Oper. Support ServicesTelephone Ext: 6206
Dept. No. 7135PERFORMANCE MEASURES
FOR THEGEOGRAPHIC INFORMATION SYSTEMS DEPARTMENT
Department Function:
Department Goals/Objectives:
FY 2013 ACTUAL
FY 2014 ACTUAL
FY 2015 ESTIMATEDYEAR END
ACTUAL
FY 2016 APPROVED
BUDGETINPUT MEASURES
12 12 13 12 167,427$ 157,832$ 290,678$ 364,750$
OUTPUT MEASURES 2,034 2,052 2,084 2,091
92,131 62,686 60,906 61,088 8,740 8,748 8,738 8,804
92,131 92,141 92,385 92,394 124,324 125,473 126,639 128,116 50,099 50,187 50,502 51,766
283,400 282,712 286,348 275,767 30,000 32,000 32,000 29,000
659 661 663 668 616 616 618 622 888 896 903 906
OUTCOME MEASURES3,500 3,855 3,952 2,500 3,000 3,500 4,050 2,209
421 460 485 450 200 290 250 266
845 500 566 408 11,586 5,000 8,100 4,798
210 220 - 240
Addresses
The Geographic Information Systems (GIS) Department plays an integral role in defining Brownsville PUB internal operational mappingneeds. GIS is diligently evaluating the content, accuracy, and adequacy of existing and newly acquired data sets; identifying data needs inrelation to work functions requirements; defining potential GIS applications for each department; assessing training requirements for GISend users; reviewing areas for potential process improvements; and data sharing.
The Geographic Information System (GIS) Department is primarily responsible for the content and quality of spatial data and its related attributes in the BPUB service area. The BPUB electronic mapping system consist of the three utilities electric, water, and wastewater infrastructure and parcel data. The GIS personnel develop and maintain datasets for the benefit of BPUB internal and external customers. This data leverage allows BPUB to provide better customer service.
Employees (FTE's)Non-Personnel O&M Expenses
Subdivisions
Avg. Number of Internal Customers
Street NamesParcelsWater GIS Point FeaturesWastewater GIS Point FeaturesElectric GIS Point FeaturesGPS Field InventoryWater Mains & Raw Water MilesWastewater Gravity Mains & Force Mains MilesElectric Distribution and Transmission Miles
Data RequestMap Production
Avg. Number of External Customers
EFFICIENCY MEASURESAvg. Number of QA/QC Electric WorkordersAvg. Number of QA/QC Electric Service RequestAvg. Number of Water/Wastewater As-Builds
124 125 127 128
50 50 51 52
283 283 286 276
-
100
200
300
400
FY 2013ACTUAL
FY 2014ACTUAL
FY 2015ESTIMATEDYEAR END
ACTUAL
FY 2016APPROVED
BUDGET
Thousands GIS Point Features
Water GIS Point Features Wastewater GIS Point FeaturesElectric GIS Point Features
659 661 663 668 616 616 618 622
888 896 903 906
-
300
600
900
1,200
FY 2013ACTUAL
FY 2014ACTUAL
FY 2015ESTIMATEDYEAR END
ACTUAL
FY 2016APPROVED
BUDGET
Number of Miles
Water Mains & Raw Water MilesWastewater Gravity Mains & Force Mains MilesElectric Distribution and Transmission Miles
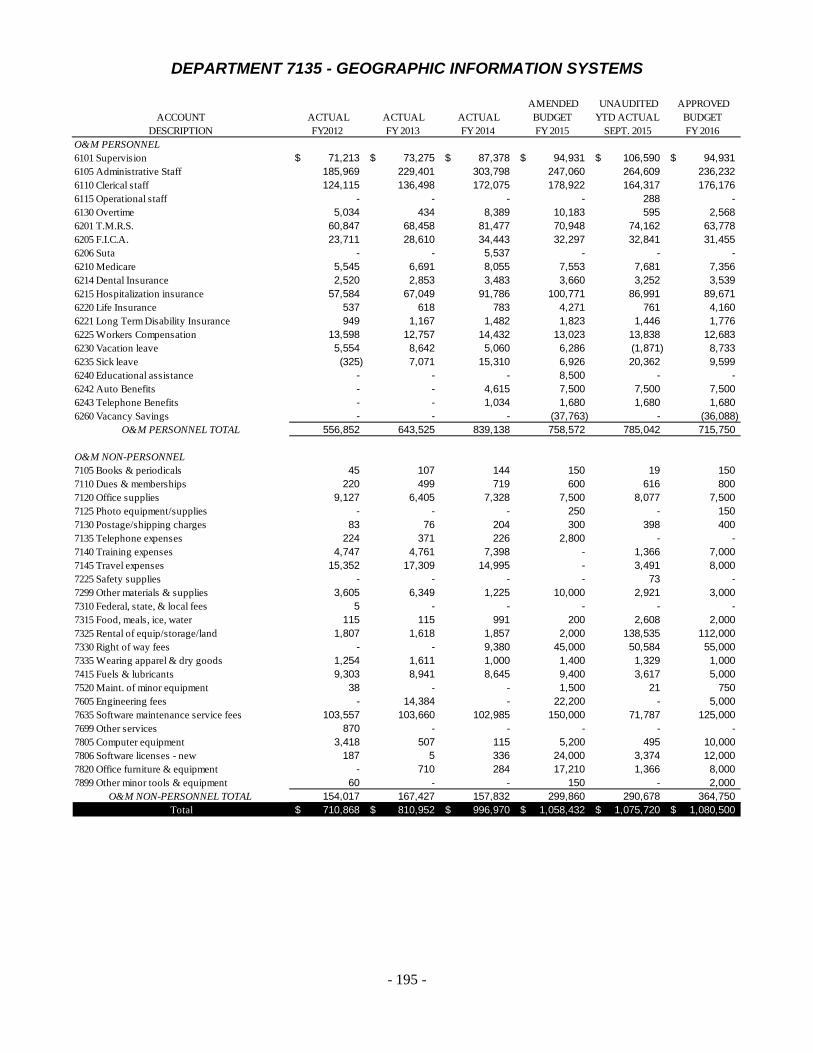
- 195 -
DEPARTMENT 7135 - GEOGRAPHIC INFORMATION SYSTEMS
ACCOUNTDESCRIPTION
ACTUAL FY2012
ACTUAL FY 2013
ACTUAL FY 2014
AMENDED BUDGETFY 2015
UNAUDITED YTD ACTUAL
SEPT. 2015
APPROVEDBUDGETFY 2016
O&M PERSONNEL6101 Supervision 71,213$ 73,275$ 87,378$ 94,931$ 106,590$ 94,931$ 6105 Administrative Staff 185,969 229,401 303,798 247,060 264,609 236,232 6110 Clerical staff 124,115 136,498 172,075 178,922 164,317 176,176 6115 Operational staff - - - - 288 - 6130 Overtime 5,034 434 8,389 10,183 595 2,568 6201 T.M.R.S. 60,847 68,458 81,477 70,948 74,162 63,778 6205 F.I.C.A. 23,711 28,610 34,443 32,297 32,841 31,455 6206 Suta - - 5,537 - - - 6210 Medicare 5,545 6,691 8,055 7,553 7,681 7,356 6214 Dental Insurance 2,520 2,853 3,483 3,660 3,252 3,539 6215 Hospitalization insurance 57,584 67,049 91,786 100,771 86,991 89,671 6220 Life Insurance 537 618 783 4,271 761 4,160 6221 Long Term Disability Insurance 949 1,167 1,482 1,823 1,446 1,776 6225 Workers Compensation 13,598 12,757 14,432 13,023 13,838 12,683 6230 Vacation leave 5,554 8,642 5,060 6,286 (1,871) 8,733 6235 Sick leave (325) 7,071 15,310 6,926 20,362 9,599 6240 Educational assistance - - - 8,500 - - 6242 Auto Benefits - - 4,615 7,500 7,500 7,500 6243 Telephone Benefits - - 1,034 1,680 1,680 1,680 6260 Vacancy Savings - - - (37,763) - (36,088)
O&M PERSONNEL TOTAL 556,852 643,525 839,138 758,572 785,042 715,750
O&M NON-PERSONNEL7105 Books & periodicals 45 107 144 150 19 150 7110 Dues & memberships 220 499 719 600 616 800 7120 Office supplies 9,127 6,405 7,328 7,500 8,077 7,500 7125 Photo equipment/supplies - - - 250 - 150 7130 Postage/shipping charges 83 76 204 300 398 400 7135 Telephone expenses 224 371 226 2,800 - - 7140 Training expenses 4,747 4,761 7,398 - 1,366 7,000 7145 Travel expenses 15,352 17,309 14,995 - 3,491 8,000 7225 Safety supplies - - - - 73 - 7299 Other materials & supplies 3,605 6,349 1,225 10,000 2,921 3,000 7310 Federal, state, & local fees 5 - - - - - 7315 Food, meals, ice, water 115 115 991 200 2,608 2,000 7325 Rental of equip/storage/land 1,807 1,618 1,857 2,000 138,535 112,000 7330 Right of way fees - - 9,380 45,000 50,584 55,000 7335 Wearing apparel & dry goods 1,254 1,611 1,000 1,400 1,329 1,000 7415 Fuels & lubricants 9,303 8,941 8,645 9,400 3,617 5,000 7520 Maint. of minor equipment 38 - - 1,500 21 750 7605 Engineering fees - 14,384 - 22,200 - 5,000 7635 Software maintenance service fees 103,557 103,660 102,985 150,000 71,787 125,000 7699 Other services 870 - - - - - 7805 Computer equipment 3,418 507 115 5,200 495 10,000 7806 Software licenses - new 187 5 336 24,000 3,374 12,000 7820 Office furniture & equipment - 710 284 17,210 1,366 8,000 7899 Other minor tools & equipment 60 - - 150 - 2,000
O&M NON-PERSONNEL TOTAL 154,017 167,427 157,832 299,860 290,678 364,750 Total 710,868$ 810,952$ 996,970$ 1,058,432$ 1,075,720$ 1,080,500$

- 196 -
Department Responsibility: Dr. Emilia Guerra
Title: Director of Human Resources Telephone Ext: 6188
Dept. No. 7140
PERFORMANCE MEASURESFOR THE
HUMAN RESOURCES DEPARTMENT
Department Function:
Department Goals/Objectives:
FY 2013ACTUAL
FY 2014ACTUAL
FY 2015ESTIMATEDYEAR END
ACTUAL
FY 2016APPROVED
BUDGETINPUT MEASURES
Employees (FTEs) 8 9 8 6
962,468$ 986,040$ 1,022,256$ 1,605,686$
OUTPUT MEASURES
N/A* N/A* 571 571
N/A* N/A* 96.0% 96.0%
N/A* N/A* 48.0% 48.0%
7 15 211 226
92.4% 94.0% 67.0% 95.0%
OUTCOME MEASURES
N/A* N/A* 4 4
N/A* N/A* 4 6
N/A* N/A* 1:114 1:95
N/A* N/A* 9.38% 9.46%
N/A* N/A* 5.50% 6.00%
The Human Resources Department is responsible for planning and maintaining a comprehensive human resources program for BPUB. In addition to wage, salary, and benefit administration, this department is responsible for oversight of employee issues, facilitating management-employee relations, personnel records and partnering with management to achieve the organizational strategy.
Recognition Events (quarterly)
Wellness Programs (Bi-monthly)
EFFICIENCY MEASURES
Maintain company-wide absentee rate at less than 6%
Maintain company-wide turnover at less than 10%
Number of HR Staff to FTEs
Number of Positions Reviewed and Slotted
To develop human capital within Brownsville PUB through leadership and support in the following areas: employee retention; employeedevelopment; employee benefits; rewards and recognition; employee satisfaction and morale; performance management; and other employeeissues.
Total O&M Expenses
Number of Employees Enrolled in Medical Benefits Plan
Employee Satisfaction with Benefits Program (Percent Favorable)
Employee Satisfaction with Compensation Package
Percentage of Employees Receiving Annual Performance Evaluation
9.38%
9.46%
0.00%
2.00%
4.00%
6.00%
8.00%
10.00%
12.00%
FY 2013ACTUAL
FY 2014ACTUAL
Maintain company-wide turnover at less than 10%
5.50%
6.00%
0.00%
2.00%
4.00%
6.00%
8.00%
FY 2013ACTUAL
FY 2014ACTUAL
Maintain company-wide absentee rate at less than 6%
* New Measure

- 197 -
DEPARTMENT 7140 - HUMAN RESOURCES
ACCOUNTDESCRIPTION
ACTUAL FY2012
ACTUAL FY 2013
ACTUAL FY 2014
AMENDED BUDGETFY 2015
UNAUDITED YTD ACTUAL
SEPT. 2015
APPROVEDBUDGETFY 2016
O&M PERSONNEL6101 Supervision 87,048$ 89,533$ 112,554$ 125,008$ 215,040$ 192,005$ 6105 Administrative Staff 151,782 156,193 166,889 184,746 127,756 56,077 6110 Clerical staff 90,717 117,518 119,265 138,736 104,898 102,523 6130 Overtime 8,261 8,948 12,414 10,038 6,656 6,060 6201 T.M.R.S. 52,800 55,683 62,363 61,298 62,355 44,076 6205 F.I.C.A. 21,326 24,644 28,966 27,806 29,516 21,738 6210 Medicare 4,988 5,764 6,776 6,503 7,010 5,084 6214 Dental Insurance 1,894 2,266 2,452 2,723 2,484 1,815 6215 Hospitalization insurance 49,454 59,598 66,824 72,974 67,974 46,060 6220 Life Insurance 454 533 605 3,678 658 2,875 6221 Long Term Disability Insurance 872 1,016 1,158 1,570 1,272 1,227 6225 Workers Compensation 12,375 11,290 12,174 11,212 12,743 8,765 6230 Vacation leave 939 (1,113) 7,965 5,412 12,727 5,835 6235 Sick leave 8,774 2,815 18,765 5,963 21,839 6,414 6240 Educational assistance - - - 20,000 1,070 - 6242 Auto Benefits 7,500 7,500 7,500 7,500 7,500 7,500 6243 Telephone Benefits 1,163 1,680 1,680 1,680 1,680 1,680 6250 Miscellaneous personnel benefits 68,798 64,887 61,539 89,500 60,294 450,000 6260 Vacancy Savings - - - (31,927) - (24,112) 6270 Retention Plan Budget - - - 25,000 - 50,000
O&M PERSONNEL TOTAL 569,145 608,755 689,889 769,421 743,472 985,621
O&M NON-PERSONNEL7101 Advertising 34,519 33,965 9,837 35,000 25,166 - 7105 Books & periodicals 745 521 2,891 800 1,074 1,450 7110 Dues & memberships 2,520 2,777 3,364 2,975 4,370 3,565 7115 Educational material 27 - - - 871 1,000 7120 Office supplies 7,972 8,853 12,052 9,000 15,135 11,300 7130 Postage/shipping charges 134 102 109 100 1,121 900 7135 Telephone expenses 542 - 266 - - - 7140 Training expenses 7,989 4,043 6,911 - 7,475 7,000 7145 Travel expenses 5,869 11,140 13,434 - 9,569 7,000 7147 Mileage Reimbursement (InTownExp) - 403 288 1,000 511 350 7150 Recruitment Expenses 6,384 2,864 5,986 20,000 1,763 - 7299 Other materials & supplies 222 276 374 1,000 984 500 7315 Food, meals, ice, water 390 2,290 352 500 1,907 2,500 7322 Recognition Program 36,927 30,241 38,173 40,000 37,679 60,000 7325 Rental of equip/storage/land 3,364 3,736 3,110 4,000 4,285 4,000 7415 Fuels & lubricants 54 - - - 26 - 7601 Legal Fees 5,828 24,881 21,126 33,576 39,124 33,500 7605 Engineering fees - 161,188 69,583 50,000 38,815 50,000 7699 Other services 57,234 65,166 101,306 368,439 85,934 425,000 7805 Computer equipment 147 1,267 1,658 1,720 385 4,000 7806 Software licenses - new 543 - - - 95 - 7820 Office furniture & equipment 5,171 - 5,332 7,500 2,494 8,000 7899 Other minor tools & equipment 5,628 - - - - -
O&M NON-PERSONNEL TOTAL 182,211 353,712 296,151 575,610 278,784 620,065 Total 751,356$ 962,468$ 986,040$ 1,345,031$ 1,022,256$ 1,605,686$
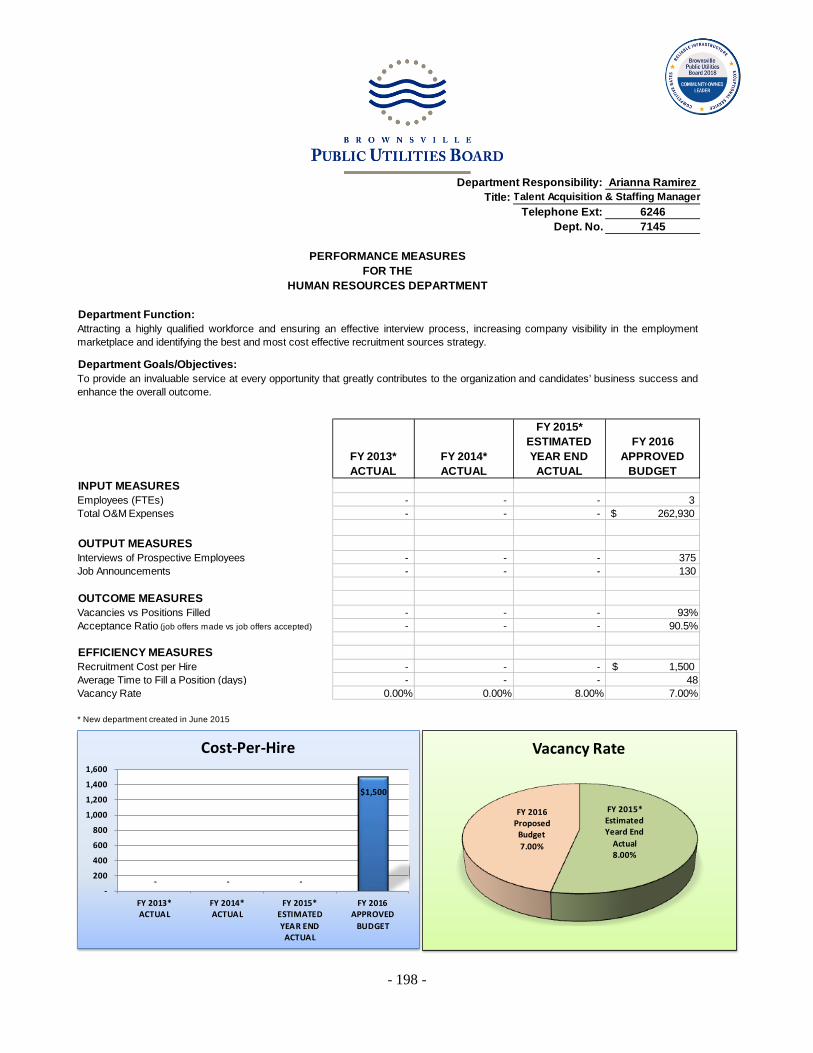
- 198 -
Department Responsibility: Arianna RamirezTitle: Talent Acquisition & Staffing Manager
Telephone Ext: 6246Dept. No. 7145
PERFORMANCE MEASURESFOR THE
HUMAN RESOURCES DEPARTMENT
Department Function:
Department Goals/Objectives:
FY 2013*ACTUAL
FY 2014*ACTUAL
FY 2015*ESTIMATEDYEAR END
ACTUAL
FY 2016APPROVED
BUDGETINPUT MEASURESEmployees (FTEs) - - - 3
- - - 262,930$
OUTPUT MEASURES - - - 375 - - - 130
OUTCOME MEASURES - - - 93% - - - 90.5%
Recruitment Cost per Hire - - - 1,500$ - - - 48
0.00% 0.00% 8.00% 7.00%
* New department created in June 2015
Vacancy Rate
Vacancies vs Positions FilledAcceptance Ratio (job offers made vs job offers accepted)
EFFICIENCY MEASURES
Average Time to Fill a Position (days)
Attracting a highly qualified workforce and ensuring an effective interview process, increasing company visibility in the employmentmarketplace and identifying the best and most cost effective recruitment sources strategy.
To provide an invaluable service at every opportunity that greatly contributes to the organization and candidates’ business success andenhance the overall outcome.
Total O&M Expenses
Interviews of Prospective EmployeesJob Announcements
- - -
$1,500
-
200
400
600
800
1,000
1,200
1,400
1,600
FY 2013*ACTUAL
FY 2014*ACTUAL
FY 2015*ESTIMATEDYEAR END
ACTUAL
FY 2016APPROVED
BUDGET
Cost-Per-Hire
FY 2015* Estimated Yeard End
Actual 8.00%
FY 2016 Proposed
Budget 7.00%
Vacancy Rate
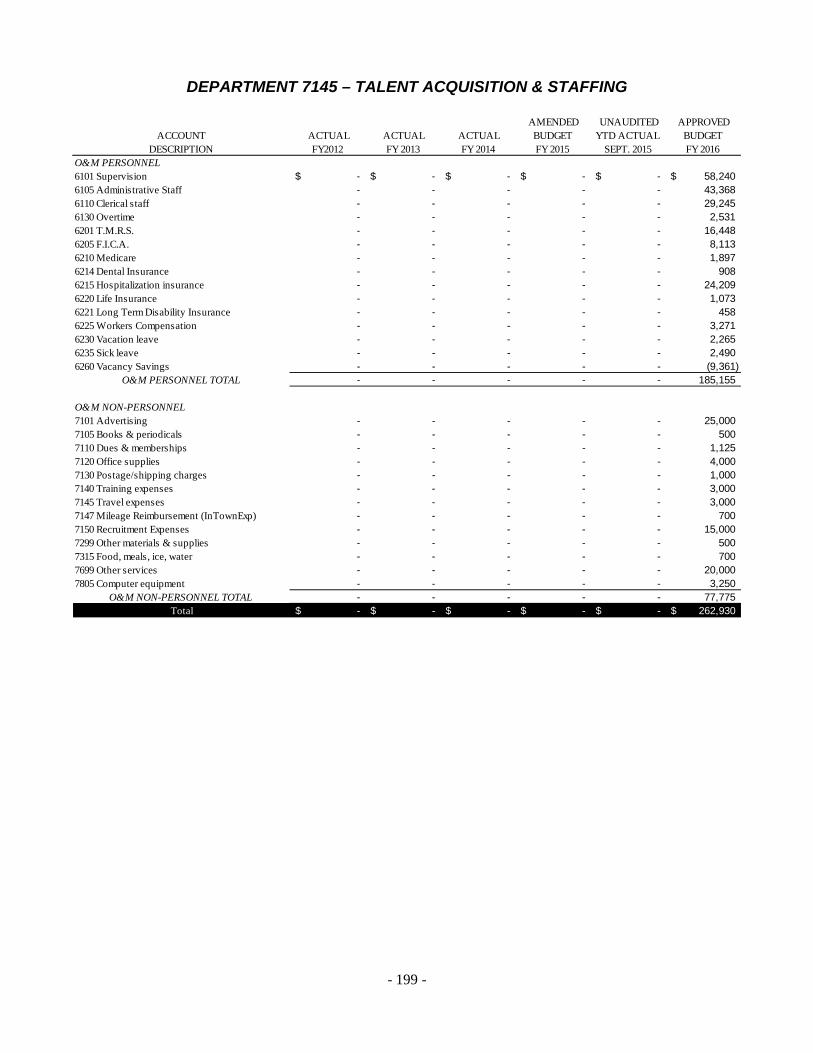
- 199 -
DEPARTMENT 7145 – TALENT ACQUISITION & STAFFING
ACCOUNTDESCRIPTION
ACTUAL FY2012
ACTUAL FY 2013
ACTUAL FY 2014
AMENDED BUDGETFY 2015
UNAUDITED YTD ACTUAL
SEPT. 2015
APPROVEDBUDGETFY 2016
O&M PERSONNEL6101 Supervision -$ -$ -$ -$ -$ 58,240$ 6105 Administrative Staff - - - - - 43,368 6110 Clerical staff - - - - - 29,245 6130 Overtime - - - - - 2,531 6201 T.M.R.S. - - - - - 16,448 6205 F.I.C.A. - - - - - 8,113 6210 Medicare - - - - - 1,897 6214 Dental Insurance - - - - - 908 6215 Hospitalization insurance - - - - - 24,209 6220 Life Insurance - - - - - 1,073 6221 Long Term Disability Insurance - - - - - 458 6225 Workers Compensation - - - - - 3,271 6230 Vacation leave - - - - - 2,265 6235 Sick leave - - - - - 2,490 6260 Vacancy Savings - - - - - (9,361)
O&M PERSONNEL TOTAL - - - - - 185,155
O&M NON-PERSONNEL7101 Advertising - - - - - 25,000 7105 Books & periodicals - - - - - 500 7110 Dues & memberships - - - - - 1,125 7120 Office supplies - - - - - 4,000 7130 Postage/shipping charges - - - - - 1,000 7140 Training expenses - - - - - 3,000 7145 Travel expenses - - - - - 3,000 7147 Mileage Reimbursement (InTownExp) - - - - - 700 7150 Recruitment Expenses - - - - - 15,000 7299 Other materials & supplies - - - - - 500 7315 Food, meals, ice, water - - - - - 700 7699 Other services - - - - - 20,000 7805 Computer equipment - - - - - 3,250
O&M NON-PERSONNEL TOTAL - - - - - 77,775 Total -$ -$ -$ -$ -$ 262,930$

- 200 -
Department Responsibility: Elias Quintero Jr.
Title: Acting Fleet Services ManagerTelephone Ext: 6325
Dept. No. 7150
PERFORMANCE MEASURES
FLEET MANAGEMENT DEPARTMENT
Department Function:
Department Goals/Objectives:
FY 2013 ACTUAL
FY 2014 ACTUAL
FY 2015 ESTIMATEDYEAR END
ACTUAL
FY 2016 APPROVED
BUDGETINPUT MEASURES# of Employees 9 9 9 10 # of Scheduled Preventive Maintenance 631 240 100 200 # State/DOT Inspections 230 250 281 350 # Safety Inspections/Month 1,700 1,800 1,800 1,800 % Scheduled Repair 1,314 760 800 750 Scheduled: Unscheduled Ratio 1:1.84 1:2.8 1:2.25 1:2.97Technicians to Equipment Ratio 1:82.5 1:88.5 1:85.8 1:86.1
OUTPUT MEASURES 495 531 513 515
1,700 1,800 1,800 1,800 2,414 2,128 3,053 2,800 4,566 7,200 9,195 8,500
# Weekly/Monthly Tech Insp.
# Labor Hours
# of Units Maintained
FOR THE
The Fleet Department is responsible for "keeping the fleet operating". The primary objective is to make repairs with the shortest "TurnAround" time and as effectively as possible, so that we may achieve a safe operating fleet and at an optimum cost/hour. Personnel areavailable for "stand-by" support 24 hour/days, 365 days/year. Additionally, the department is responsible for providing PUB with costeffective fleet equipment that will allow us to complete our jobs safely and efficiently.
To provide superior customer service to internal and external customers by responding immediately to concerns related to vehicles andequipment utilized by Brownsville PUB personnel.
# W.O. Generated
495
531 513 515
400
450
500
550
600
FY 2013ACTUAL
FY 2014ACTUAL
FY 2015ESTIMATEDYEAR ENDACTUAL
FY 2016APPROVED
BUDGET
# of Units Maintained
1,700
1,800 1,800 1,800
1,500
1,600
1,700
1,800
1,900
2,000
FY 2013ACTUAL
FY 2014ACTUAL
FY 2015ESTIMATEDYEAR ENDACTUAL
FY 2016APPROVED
BUDGET
# Weekly/Monthly Tech Insp.
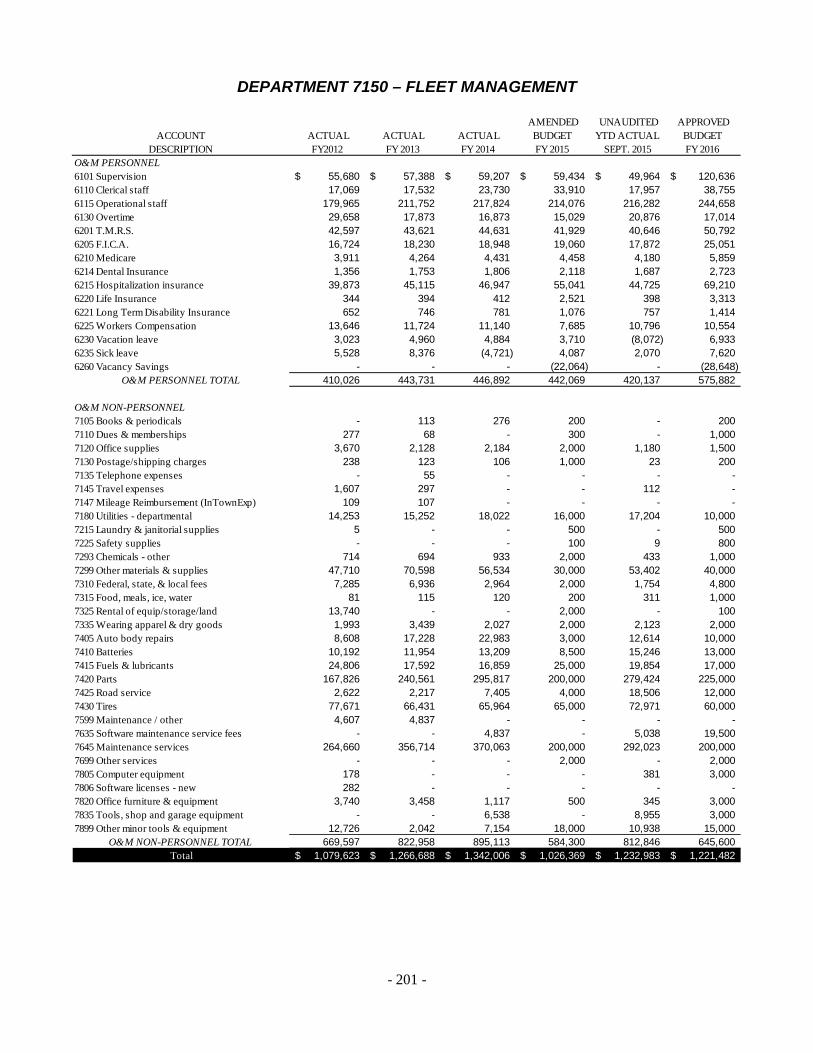
- 201 -
DEPARTMENT 7150 – FLEET MANAGEMENT
ACCOUNTDESCRIPTION
ACTUAL FY2012
ACTUAL FY 2013
ACTUAL FY 2014
AMENDED BUDGETFY 2015
UNAUDITED YTD ACTUAL
SEPT. 2015
APPROVEDBUDGETFY 2016
O&M PERSONNEL6101 Supervision 55,680$ 57,388$ 59,207$ 59,434$ 49,964$ 120,636$ 6110 Clerical staff 17,069 17,532 23,730 33,910 17,957 38,755 6115 Operational staff 179,965 211,752 217,824 214,076 216,282 244,658 6130 Overtime 29,658 17,873 16,873 15,029 20,876 17,014 6201 T.M.R.S. 42,597 43,621 44,631 41,929 40,646 50,792 6205 F.I.C.A. 16,724 18,230 18,948 19,060 17,872 25,051 6210 Medicare 3,911 4,264 4,431 4,458 4,180 5,859 6214 Dental Insurance 1,356 1,753 1,806 2,118 1,687 2,723 6215 Hospitalization insurance 39,873 45,115 46,947 55,041 44,725 69,210 6220 Life Insurance 344 394 412 2,521 398 3,313 6221 Long Term Disability Insurance 652 746 781 1,076 757 1,414 6225 Workers Compensation 13,646 11,724 11,140 7,685 10,796 10,554 6230 Vacation leave 3,023 4,960 4,884 3,710 (8,072) 6,933 6235 Sick leave 5,528 8,376 (4,721) 4,087 2,070 7,620 6260 Vacancy Savings - - - (22,064) - (28,648)
O&M PERSONNEL TOTAL 410,026 443,731 446,892 442,069 420,137 575,882
O&M NON-PERSONNEL7105 Books & periodicals - 113 276 200 - 200 7110 Dues & memberships 277 68 - 300 - 1,000 7120 Office supplies 3,670 2,128 2,184 2,000 1,180 1,500 7130 Postage/shipping charges 238 123 106 1,000 23 200 7135 Telephone expenses - 55 - - - - 7145 Travel expenses 1,607 297 - - 112 - 7147 Mileage Reimbursement (InTownExp) 109 107 - - - - 7180 Utilities - departmental 14,253 15,252 18,022 16,000 17,204 10,000 7215 Laundry & janitorial supplies 5 - - 500 - 500 7225 Safety supplies - - - 100 9 800 7293 Chemicals - other 714 694 933 2,000 433 1,000 7299 Other materials & supplies 47,710 70,598 56,534 30,000 53,402 40,000 7310 Federal, state, & local fees 7,285 6,936 2,964 2,000 1,754 4,800 7315 Food, meals, ice, water 81 115 120 200 311 1,000 7325 Rental of equip/storage/land 13,740 - - 2,000 - 100 7335 Wearing apparel & dry goods 1,993 3,439 2,027 2,000 2,123 2,000 7405 Auto body repairs 8,608 17,228 22,983 3,000 12,614 10,000 7410 Batteries 10,192 11,954 13,209 8,500 15,246 13,000 7415 Fuels & lubricants 24,806 17,592 16,859 25,000 19,854 17,000 7420 Parts 167,826 240,561 295,817 200,000 279,424 225,000 7425 Road service 2,622 2,217 7,405 4,000 18,506 12,000 7430 Tires 77,671 66,431 65,964 65,000 72,971 60,000 7599 Maintenance / other 4,607 4,837 - - - - 7635 Software maintenance service fees - - 4,837 - 5,038 19,500 7645 Maintenance services 264,660 356,714 370,063 200,000 292,023 200,000 7699 Other services - - - 2,000 - 2,000 7805 Computer equipment 178 - - - 381 3,000 7806 Software licenses - new 282 - - - - - 7820 Office furniture & equipment 3,740 3,458 1,117 500 345 3,000 7835 Tools, shop and garage equipment - - 6,538 - 8,955 3,000 7899 Other minor tools & equipment 12,726 2,042 7,154 18,000 10,938 15,000
O&M NON-PERSONNEL TOTAL 669,597 822,958 895,113 584,300 812,846 645,600 Total 1,079,623$ 1,266,688$ 1,342,006$ 1,026,369$ 1,232,983$ 1,221,482$

- 202 -
Department Responsibility: Steven LuceroTitle: Facilities Maintenance Supervisor
Telephone Ext: 6170Dept. No. 7160
PERFORMANCE MEASURES
FACILITY MAINTENANCE DEPARTMENT
Department Function:
Department Goals/Objectives:
FY 2013 ACTUAL
FY 2014 ACTUAL
FY 2015 ESTIMATEDYEAR END
ACTUAL
FY 2016 APPROVED
BUDGETINPUT MEASURESFTE 4 4 4 4 O&M Personnel Costs 171,728$ 185,537$ 187,453$ 180,698$ O & M Non-Personnel Costs 741,688$ 632,935$ 671,056$ 997,078$ Total Costs 913,416$ 818,472$ 858,509$ 1,177,776$
OUTPUT MEASURES# of custodial work request 250 312 300 300 Admin. Bldg. daily water consumption/gals 875 600 700 600 A/C repair cost in dollars 6,738$ 4,100$ 8,255$ 8,000$ Preventitive service agreement cost in dollars 26,133$ 13,000$ 14,000$ 14,995$
OUTCOME MEASURESMaintain/ improve customer service Yes Yes Yes YesImprove water conservation Yes Yes No YesLimit repair cost Yes Yes Yes Yes
EFFICIENCY MEASURESSquare Feet of Facitity Maintenance 33,000 33,000 33,000 33,000 Per unit cost of A/C prevent maintenance per sq.ft. 0.996$ 0.518$ 0.674$ 0.697$
To provide superior professional service to internal and external customers by responding in a timely manner to maintenanceconcerns.
FOR THE
This department is responsible for the facility maintenance which includes electrical, HVAC, janitorial and plumbing work. Thedepartment is responsible for groundkeeeping Brownsville PUB sites throughout the city.
250
312 300 300
-
100
200
300
400
FY 2013ACTUAL
FY 2014ACTUAL
FY 2015ESTIMATEDYEAR END
ACTUAL
FY 2016APPROVED
BUDGET
# of custodial work request
$26,133
$13,000 $14,000 $14,995
$5,000
$10,000
$15,000
$20,000
$25,000
$30,000
FY 2013ACTUAL
FY 2014ACTUAL
FY 2015ESTIMATEDYEAR END
ACTUAL
FY 2016APPROVED
BUDGET
Preventitive service agreement cost in dollars

- 203 -
DEPARTMENT 7160 – FACILITY MAINTENANCE
ACCOUNTDESCRIPTION
ACTUAL FY2012
ACTUAL FY 2013
ACTUAL FY 2014
AMENDED BUDGETFY 2015
UNAUDITED YTD ACTUAL
SEPT. 2015
APPROVEDBUDGETFY 2016
O&M PERSONNEL6101 Supervision 45,166$ 47,789$ 49,370$ 49,670$ 49,861$ 49,670$ 6115 Operational staff 64,901 64,437 69,407 69,430 71,672 69,430 6130 Overtime 1,518 1,562 1,283 1,803 1,098 2,000 6201 T.M.R.S. 21,013 16,813 17,119 16,222 16,690 14,971 6205 F.I.C.A. 8,248 7,043 6,996 7,384 7,091 7,384 6206 Suta 76 - - - - - 6210 Medicare 1,929 1,647 1,636 1,727 1,658 1,727 6214 Dental Insurance 907 1,109 1,096 1,210 1,089 1,210 6215 Hospitalization insurance 24,514 24,735 30,538 35,704 31,084 34,441 6220 Life Insurance 167 170 176 977 178 977 6221 Long Term Disability Insurance 293 299 311 417 317 417 6225 Workers Compensation 4,718 3,169 3,002 2,978 3,066 2,978 6230 Vacation leave (669) 1,088 988 1,437 331 2,217 6235 Sick leave 2,965 1,867 3,616 1,584 3,316 2,437 6260 Vacancy Savings - - - (9,286) - (9,160)
O&M PERSONNEL TOTAL 175,745 171,728 185,537 181,256 187,453 180,698
O&M NON-PERSONNEL7120 Office supplies 190 303 151 200 158 200 7130 Postage/shipping charges - - - - 280 - 7135 Telephone expenses 167,195 156,442 123,017 144,000 127,932 140,000 7180 Utilities - departmental 107,387 114,114 126,000 198,000 126,803 175,000 7210 Landscaping/Trade a Tree Program - 3,000 - 3,000 3,240 3,000 7225 Safety supplies - 21 - - - - 7299 Other materials & supplies 20,978 25,884 96,440 20,000 50,707 35,000 7310 Federal, state, & local fees - 10 10 10 10 10 7315 Food, meals, ice, water 46 46 48 68 48 68 7335 Wearing apparel & dry goods 1,139 1,482 827 950 528 800 7415 Fuels & lubricants 1,010 173 87 1,000 174 500 7501 Maint. of buildings & structures - 1,935 10,740 25,000 860 25,000 7599 Maintenance / other 49,290 125,998 13,063 85,000 40,379 130,000 7645 Maintenance services 83,843 101,507 38,791 80,000 44,176 75,000 7650 Security services 1,610 1,555 1,440 1,440 2,340 2,000 7660 Ground Keeping Maintenance 146,693 206,579 148,436 271,810 177,507 285,000 7699 Other services 4,508 - 70,347 87,000 81,641 125,000 7820 Office furniture & equipment - - 500 499 13,873 500 7899 Other minor tools & equipment - 2,639 3,038 3,500 399 -
O&M NON-PERSONNEL TOTAL 583,889 741,688 632,935 921,477 671,056 997,078 Total 759,634$ 913,416$ 818,472$ 1,102,733$ 858,509$ 1,177,776$
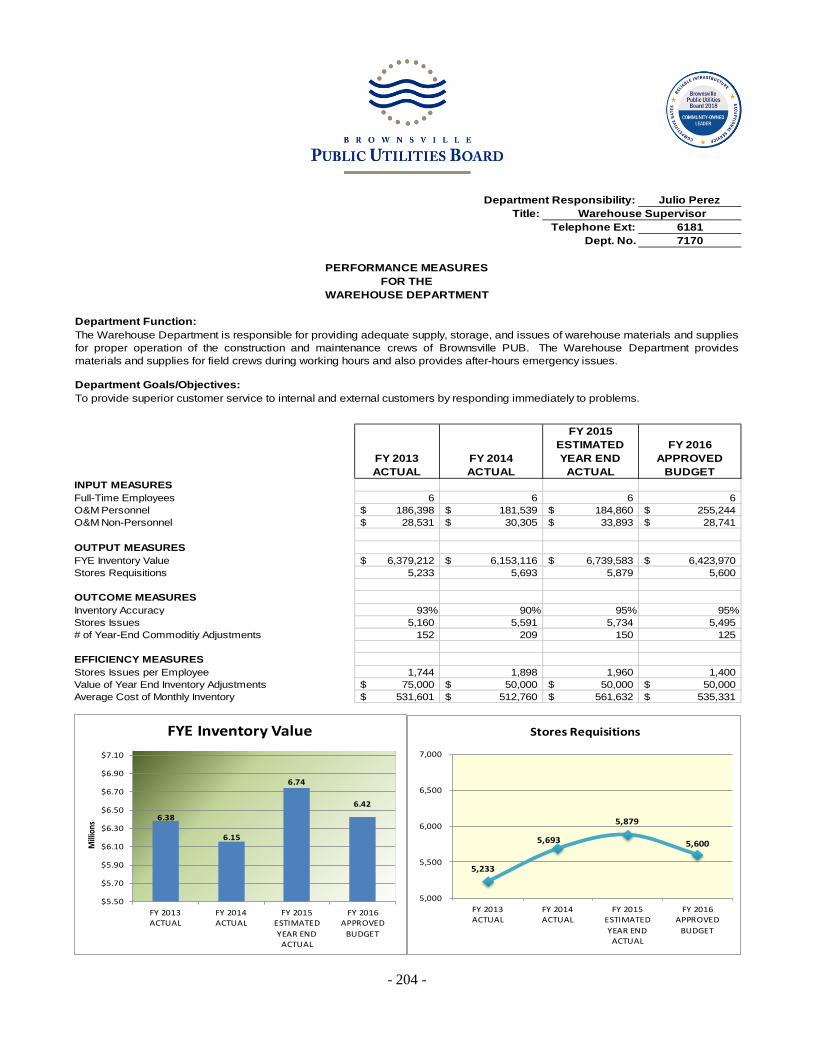
- 204 -
Department Responsibility: Julio PerezTitle: Warehouse Supervisor
Telephone Ext: 6181Dept. No. 7170
PERFORMANCE MEASURES
WAREHOUSE DEPARTMENT
Department Function:
Department Goals/Objectives:
FY 2013 ACTUAL
FY 2014 ACTUAL
FY 2015 ESTIMATEDYEAR END
ACTUAL
FY 2016 APPROVED
BUDGETINPUT MEASURESFull-Time Employees 6 6 6 6 O&M Personnel 186,398$ 181,539$ 184,860$ 255,244$ O&M Non-Personnel 28,531$ 30,305$ 33,893$ 28,741$
OUTPUT MEASURESFYE Inventory Value 6,379,212$ 6,153,116$ 6,739,583$ 6,423,970$ Stores Requisitions 5,233 5,693 5,879 5,600
OUTCOME MEASURESInventory Accuracy 93% 90% 95% 95%Stores Issues 5,160 5,591 5,734 5,495 # of Year-End Commoditiy Adjustments 152 209 150 125
EFFICIENCY MEASURESStores Issues per Employee 1,744 1,898 1,960 1,400 Value of Year End Inventory Adjustments 75,000$ 50,000$ 50,000$ 50,000$ Average Cost of Monthly Inventory 531,601$ 512,760$ 561,632$ 535,331$
To provide superior customer service to internal and external customers by responding immediately to problems.
FOR THE
The Warehouse Department is responsible for providing adequate supply, storage, and issues of warehouse materials and suppliesfor proper operation of the construction and maintenance crews of Brownsville PUB. The Warehouse Department providesmaterials and supplies for field crews during working hours and also provides after-hours emergency issues.
5,233
5,693
5,879
5,600
5,000
5,500
6,000
6,500
7,000
FY 2013ACTUAL
FY 2014ACTUAL
FY 2015ESTIMATEDYEAR END
ACTUAL
FY 2016APPROVED
BUDGET
Stores Requisitions
6.38
6.15
6.74
6.42
$5.50
$5.70
$5.90
$6.10
$6.30
$6.50
$6.70
$6.90
$7.10
FY 2013ACTUAL
FY 2014ACTUAL
FY 2015ESTIMATEDYEAR END
ACTUAL
FY 2016APPROVED
BUDGET
Milli
ons
FYE Inventory Value
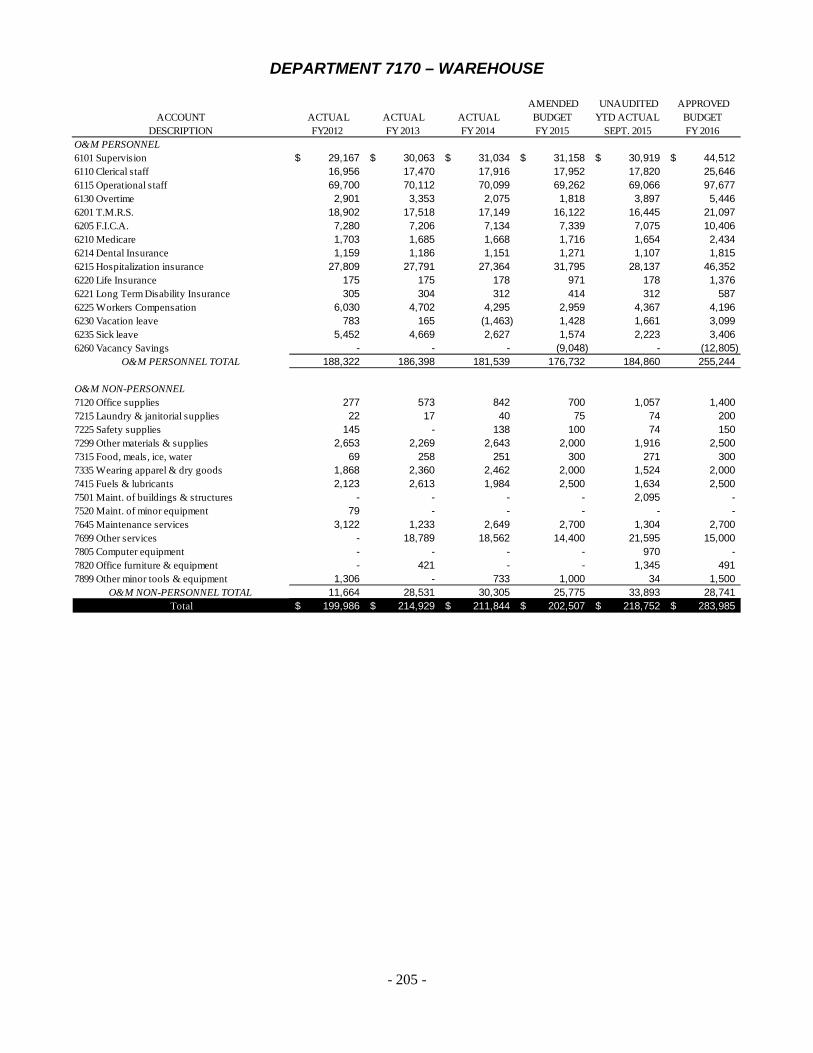
- 205 -
DEPARTMENT 7170 – WAREHOUSE
ACCOUNTDESCRIPTION
ACTUAL FY2012
ACTUAL FY 2013
ACTUAL FY 2014
AMENDED BUDGETFY 2015
UNAUDITED YTD ACTUAL
SEPT. 2015
APPROVEDBUDGETFY 2016
O&M PERSONNEL6101 Supervision 29,167$ 30,063$ 31,034$ 31,158$ 30,919$ 44,512$ 6110 Clerical staff 16,956 17,470 17,916 17,952 17,820 25,646 6115 Operational staff 69,700 70,112 70,099 69,262 69,066 97,677 6130 Overtime 2,901 3,353 2,075 1,818 3,897 5,446 6201 T.M.R.S. 18,902 17,518 17,149 16,122 16,445 21,097 6205 F.I.C.A. 7,280 7,206 7,134 7,339 7,075 10,406 6210 Medicare 1,703 1,685 1,668 1,716 1,654 2,434 6214 Dental Insurance 1,159 1,186 1,151 1,271 1,107 1,815 6215 Hospitalization insurance 27,809 27,791 27,364 31,795 28,137 46,352 6220 Life Insurance 175 175 178 971 178 1,376 6221 Long Term Disability Insurance 305 304 312 414 312 587 6225 Workers Compensation 6,030 4,702 4,295 2,959 4,367 4,196 6230 Vacation leave 783 165 (1,463) 1,428 1,661 3,099 6235 Sick leave 5,452 4,669 2,627 1,574 2,223 3,406 6260 Vacancy Savings - - - (9,048) - (12,805)
O&M PERSONNEL TOTAL 188,322 186,398 181,539 176,732 184,860 255,244
O&M NON-PERSONNEL7120 Office supplies 277 573 842 700 1,057 1,400 7215 Laundry & janitorial supplies 22 17 40 75 74 200 7225 Safety supplies 145 - 138 100 74 150 7299 Other materials & supplies 2,653 2,269 2,643 2,000 1,916 2,500 7315 Food, meals, ice, water 69 258 251 300 271 300 7335 Wearing apparel & dry goods 1,868 2,360 2,462 2,000 1,524 2,000 7415 Fuels & lubricants 2,123 2,613 1,984 2,500 1,634 2,500 7501 Maint. of buildings & structures - - - - 2,095 - 7520 Maint. of minor equipment 79 - - - - - 7645 Maintenance services 3,122 1,233 2,649 2,700 1,304 2,700 7699 Other services - 18,789 18,562 14,400 21,595 15,000 7805 Computer equipment - - - - 970 - 7820 Office furniture & equipment - 421 - - 1,345 491 7899 Other minor tools & equipment 1,306 - 733 1,000 34 1,500
O&M NON-PERSONNEL TOTAL 11,664 28,531 30,305 25,775 33,893 28,741 Total 199,986$ 214,929$ 211,844$ 202,507$ 218,752$ 283,985$

- 206 -
Department Responsibility: Leandro G. García,CPA
Title: Chief Financial OfficerTelephone Ext: 6173
Dept. No. 9110
DEPARTMENT 9110 - COMPANY - WIDE EXPENSES
Departmental Functions:This department meets the expenses of the Brownsville PUB for items shared company-wide. This department includes the expenses for part-time employees, obligations for SRWA, and the budget pool for training, travel, company-wide contingency, maintenance services, and equipment contingency.
ACCOUNTDESCRIPTION
ACTUAL FY2012
ACTUAL FY 2013
ACTUAL FY 2014
AMENDED BUDGETFY 2015
UNAUDITED YTD ACTUAL
SEPT. 2015
APPROVEDBUDGETFY 2016
O&M PERSONNEL6120 Part-time staff 356,127$ 631,703$ 281,357$ 338,944$ 153,271$ 179,907$ 6130 Overtime 15,375 20,972 7,008 8,726 2,319 2,500 6201 T.M.R.S. 796 - - - - 1,389,968 6205 F.I.C.A. 23,049 40,473 17,879 21,015 9,617 11,154 6206 Suta 4,842 985 10,082 - 397 - 6210 Medicare 5,391 9,465 4,181 4,915 2,276 2,609 6214 Dental Insurance 30 - - - - - 6215 Hospitalization insurance 380,113 391,694 350,389 384,366 299,135 354,897 6216 Other Post-Employmnt Benefits (ins) 340,916 806,513 1,122,644 1,020,000 1,020,000 1,221,396 6220 Life Insurance 10 - - - - - 6221 Long Term Disability Insurance 18 - - - - - 6225 Workers Compensation 13,003 (36,180) 7,209 8,474 3,890 4,498 6240 Educational assistance - (2,024) - - (4,183) 33,675 6250 Miscellaneous personnel benefits - - - 95,131 - 150,000
O&M PERSONNEL TOTAL 1,139,668 1,863,600 1,800,749 1,881,570 1,486,722 3,350,603
O&M NON-PERSONNEL7130 Postage/shipping charges 161 19 31 - 478 - 7140 Training expenses - - - 200,000 - - 7145 Travel expenses - - - 400,000 - - 7299 Other materials & supplies 18 154 (25) 100 (13) 100 7301 Bad debt expense - 7,247 - - - - 7306 SRWA O&M Assessment 3,304,375 2,688,914 2,795,503 3,585,642 3,585,642 3,752,642 7307 SRWA Dbt Svc Assessment 2,311,801 2,178,768 2,147,493 2,152,371 2,152,371 2,158,034 7335 Wearing apparel & dry goods 33,709 7,040 55,972 10,000 9,125 10,000 7415 Fuels & lubricants - - 1,363 - - - 7645 Maintenance services - - - 600,000 - - 7699 Other services 45,623 30,523 6,314 45,000 38,244 55,000 7805 Computer equipment - - - 50,000 - 50,000 7820 Office furniture & equipment - - - 10,000 - 10,000 7899 Other minor tools & equipment - - - 20,000 - 20,000 7697 O&M Contingency-Maintenance Pool - - - - - 600,000 7698 Contingency-Budget Pool - Electric - - - - - 1,519,248 7698 Contingency-Budget Pool - Water - - - - - 516,700 7698 Contingency-Budget Pool - Wastewater - - - - - 354,968 7348 Customer Assistance Program - - - - - 100,000
O&M NON-PERSONNEL TOTAL 5,695,687 4,912,666 5,006,651 7,073,113 5,785,847 9,146,692 Total 6,835,355$ 6,776,266$ 6,807,400$ 8,954,683$ 7,272,569$ 12,497,295$

- 207 -
THIS PAGE INTENTIONALLY LEFT BLANK

- 208 -
Department Responsibility: Leandro G. García,CPATitle: Chief Financial Officer
Telephone Ext: 6173Dept. No. 9150
DEPARTMENT 9150– PRIOR FY ENCUMBERED BUDGET
UDEPARTMENT FUNCTIONS This department meets the prior-year expenses of the Brownsville PUB for non-routine services shared company-wide.
ACCOUNTDESCRIPTION
ACTUAL FY2012
ACTUAL FY 2013
ACTUAL FY 2014
AMENDED BUDGETFY 2015
UNAUDITED YTD ACTUAL
SEPT. 2015
APPROVEDBUDGETFY 2016
O&M NON-PERSONNEL7515 Maint. of major equipment -$ -$ 476,969$ -$ -$ -$ 7605 Engineering fees 243,079 226,430 1,022,224 - 88,132 - 7699 Other services 107,194 - - - - -
O&M NON-PERSONNEL TOTAL 350,273 226,430 1,499,193 - 88,132 - Total 350,273$ 226,430$ 1,499,193$ -$ 88,132$ -$

- 209 -
CAPITAL BUDGET

FIVE-YEAR CAPITAL IMPROVEMENT PLAN SUMMARY BY FUNDING SOURCE
FY 2015 CARRYOVER 1 FY 2016 FY 2017 FY 2018 FY 2019 FY 2020
FIVE-YEAR TOTAL
Improvement Fund - CIP Funding Budget: 17,561,798 7,290,000 7,750,000 7,750,000 7,750,000 9,165,000 57,266,798 Improvement Fund - Grant Funding Budget: - - - - - - -
Capitalizable Equipment Budget: 926,414 1,200,000 1,250,000 1,250,000 1,250,000 1,250,000 7,126,414 Improvement Fund - CIP Funding Total: 18,488,212 8,490,000 9,000,000 9,000,000 9,000,000 10,415,000 64,393,212
2 Impact Fees Fund Total: 594,243 1,727,276 750,000 750,000 750,000 11,675,000 16,246,519
Commercial Paper Funding Budget-Internal: 1,537,467 20,742,533 10,510,000 7,970,000 6,240,000 20,416,695 67,416,695 Commercial Paper Funding Budget-Facilities: - 1,000,000 8,500,000 6,800,000 1,700,000 - 18,000,000 Commercial Paper Funding Budget-Tenaska: - - - 17,500,000 17,500,000 - 35,000,000
Capitalizable Equipment Budget: - - - - - - - 3 Commercial Paper Proceeds Total: 1,537,467 21,742,533 19,010,000 32,270,000 25,440,000 20,416,695 120,416,695
4 Grants Total: 3,536,335 - - - - - 3,536,335
Total Planned Projects: 24,156,257 31,959,809 28,760,000 42,020,000 35,190,000 42,506,695 204,592,761
Approved Budget Total for Fiscal Year 2016: 56,116,066$ Amended Budget Total for Fiscal Year 2015: 78,860,511$ % Change (2016 vs 2015): -28.84%
1 Note: Amounts are as of July 31, 2015 and are subject to change. 2 Note: Amounts indicate estimated project costs; future debt requirements will fund the projected costs for new projects for Fiscal Year 2016 and beyond.3 Note: Total includes the carryover budget funded from the Commercial Paper Fund and future debt requirements for Fiscal Year 2016 and beyond.4 Note: Amounts indicate the estimated project costs eligible for grants administered by the relevant state and/or federal agencies.
- 210 -

- 211 -
FIVE-YEAR CAPITAL IMPROVEMENT PLAN SUMMARY BY UTILITY CHART
$204,592,761
$0.0
$5.0
$10.0
$15.0
$20.0
$25.0
$30.0
$35.0
$40.0
$45.0
2015 Carryover 2016 2017 2018 2019 2020
Mill
ions
Wastewater Water Electric
TOTAL 5-YEAR CAPITAL IMPROVEMENT PLAN SUMMARY BY UTILITY
$204,592,761
Electric 111,175,588
54% Water 25,983,209
13%
Wastewater 67,433,964
33%
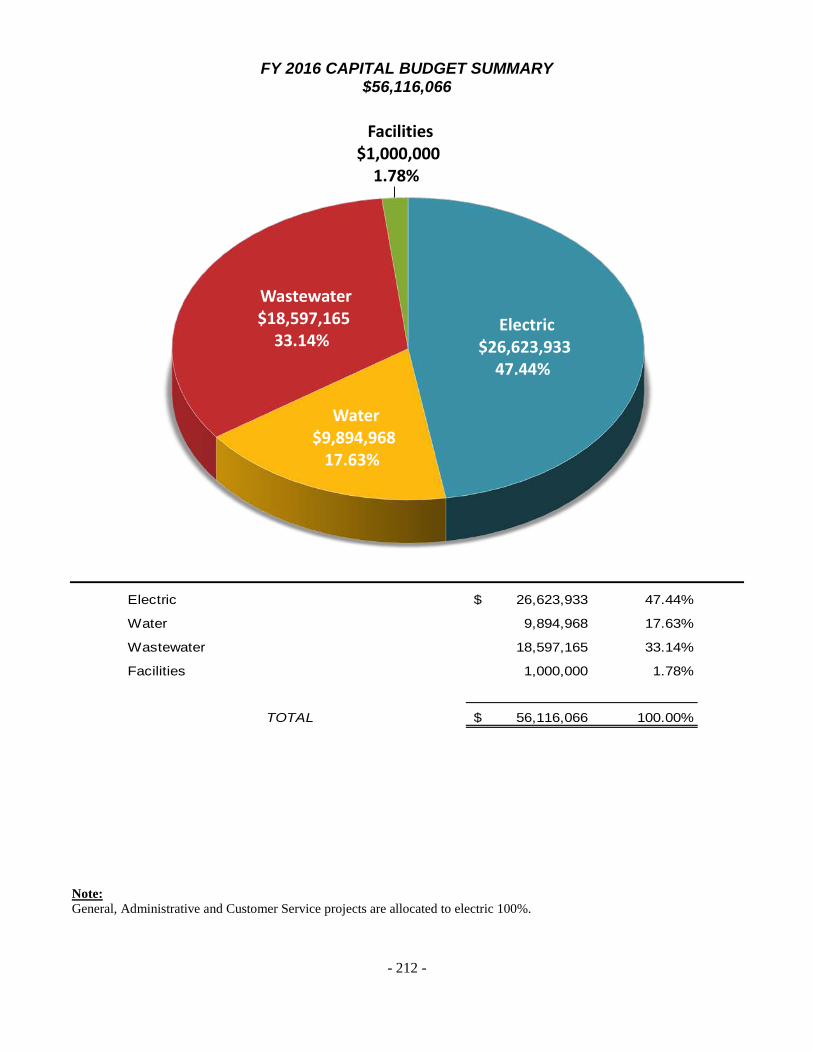
- 212 -
FY 2016 CAPITAL BUDGET SUMMARY $56,116,066
Electric $26,623,933
47.44%
Water $9,894,968
17.63%
Wastewater $18,597,165
33.14%
Facilities $1,000,000
1.78%
Electric 26,623,933$ 47.44%
Water 9,894,968 17.63%
Wastewater 18,597,165 33.14%
Facilities 1,000,000 1.78%
TOTAL 56,116,066$ 100.00%
UNote: General, Administrative and Customer Service projects are allocated to electric 100%.
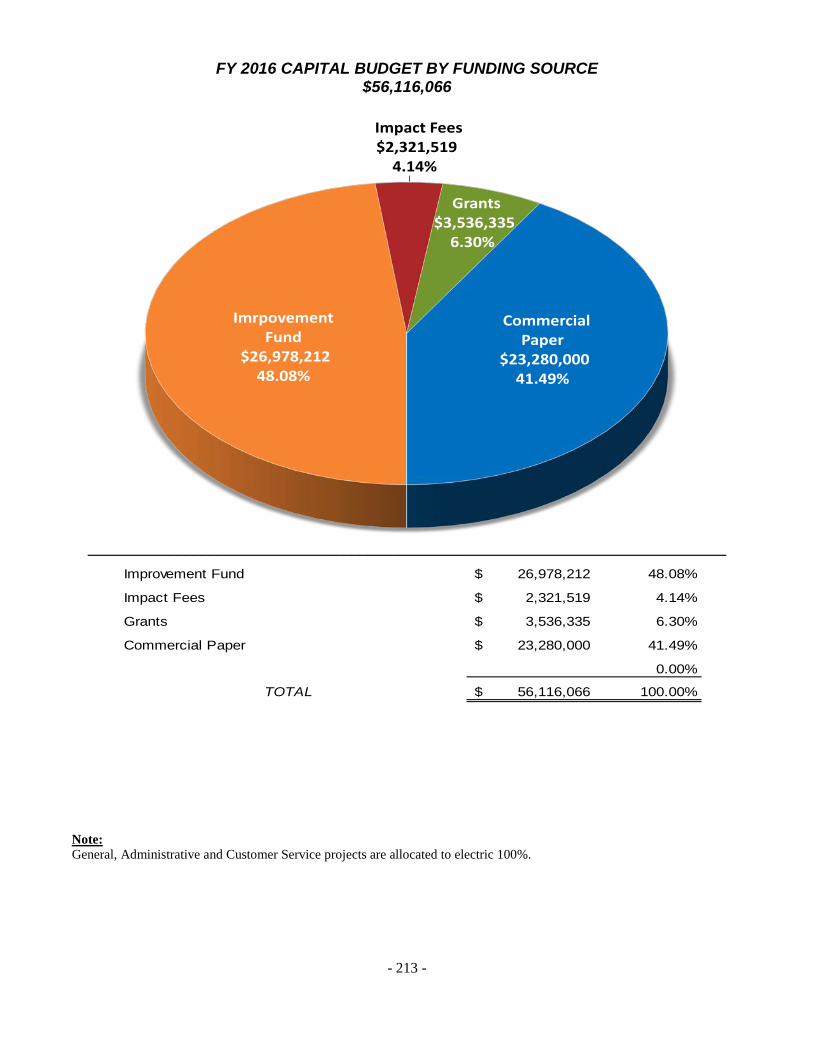
- 213 -
FY 2016 CAPITAL BUDGET BY FUNDING SOURCE $56,116,066
Imrpovement Fund
$26,978,212 48.08%
Impact Fees $2,321,519
4.14%
Grants $3,536,335
6.30%
Commercial Paper
$23,280,000 41.49%
________________________________________________________________________________
Improvement Fund 26,978,212$ 48.08%
Impact Fees 2,321,519$ 4.14%
Grants 3,536,335$ 6.30%
Commercial Paper 23,280,000$ 41.49%
0.00%
TOTAL 56,116,066$ 100.00%
Note: General, Administrative and Customer Service projects are allocated to electric 100%.
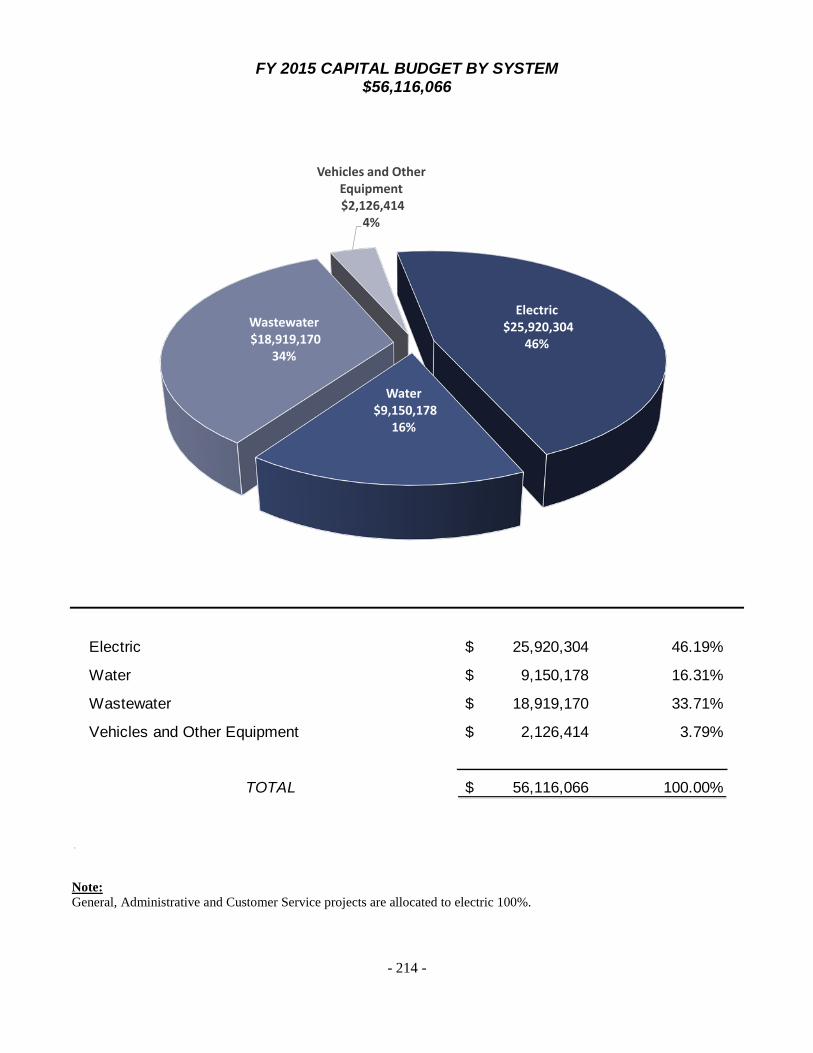
- 214 -
FY 2015 CAPITAL BUDGET BY SYSTEM $56,116,066
Electric$25,920,304
46%
Water$9,150,178
16%
Wastewater$18,919,170
34%
Vehicles and Other Equipment$2,126,414
4%
Electric 25,920,304$ 46.19%
Water 9,150,178$ 16.31%
Wastewater 18,919,170$ 33.71%
Vehicles and Other Equipment 2,126,414$ 3.79%
TOTAL 56,116,066$ 100.00%
U
Note: General, Administrative and Customer Service projects are allocated to electric 100%.
FIVE-YEAR CAPITAL IMPROVEMENTS PLAN SUMMARY ELECTRIC, WATER AND WASTEWATER
FY 2016 – FY 2020
- 215 -
The process of establishing the Brownsville Public Utilities Board’s (BPUB) Capital Budget involves evaluating all submitted projects, assigning them to a particular category, and then ultimately allocating resources toward top-ranked priorities. The current ranking system categorizes all Capital Improvement Projects (CIP) into four (4) categories:
Project Consideration Category Reference
Category General Criteria Must Do These projects are required for the normal course of business and to provide
day-to-day customer service or system operations, to correct a health or safety condition, or are mandated by local, state, or federal agencies.
Load/Capacity Relief
These projects are identified for improved switching capability, backup reliability for critical systems, or for specific system reinforcements needed for load relief.
Reliability These projects are solely based on an increased reliability benefit.
General These projects are considered general spending.

FIVE-YEAR CAPITAL IMPROVEMENTS PLAN SUMMARY ELECTRIC, WATER AND WASTEWATER
FY 2016 – FY 2020
- 216 -
PROJECT REFERENCE E1 Power Transformers Radiators Replacement Organization: 2120 Substations & Relaying Funding Source: Commercial Paper Project Related to: Replacements/Upgrades/Rehabilitation Project Considered: Reliability Project Occurrence: One-time Originator: Arnulfo Mejia Category: Resubmission Estimated Costs by Fiscal Year FY 2016 FY 2017 FY 2018 FY 2019 FY 2020 TOTAL $65,161 $0 $0 $0 $0 $65,161 Description: The BPUB Substations & Relaying Department proposes to replace radiators that are rusting prematurely due to Brownsville’s high humidity. Once radiators begin to rust, it is difficult to stop the rusting due to the shape and construction. Project Cost Savings & Revenues: The replacement of rusted radiators will avoid potential oil spills, which will cost thousands of dollars to clean up. PROJECT REFERENCE E2 Replace Legacy Overcurrent and Transformer Differential Protection Relays Organization: 2120 Substations & Relaying Funding Source: Commercial Paper Project Related to: Replacements/Upgrades/Rehabilitation Project Considered: Reliability Project Occurrence: One-time Originator: Arnulfo Mejia Category: Resubmission Estimated Costs by Fiscal Year FY 2016 FY 2017 FY 2018 FY 2019 FY 2020 TOTAL $69,788 $0 $0 $0 $0 $69,788 Description: Relays are essential for substation equipment protection. Several of the first generation solid state relays are no longer supported with software and hardware upgrades. Current software programs are no longer compatible with relays currently in use. Existing relays are essentially obsolete. Project Cost Savings & Revenues: Savings will become apparent when there is an event or disturbance on the electric system. The new relays have the capability of providing more information about the event, which will allow for better analysis and remediation measures.
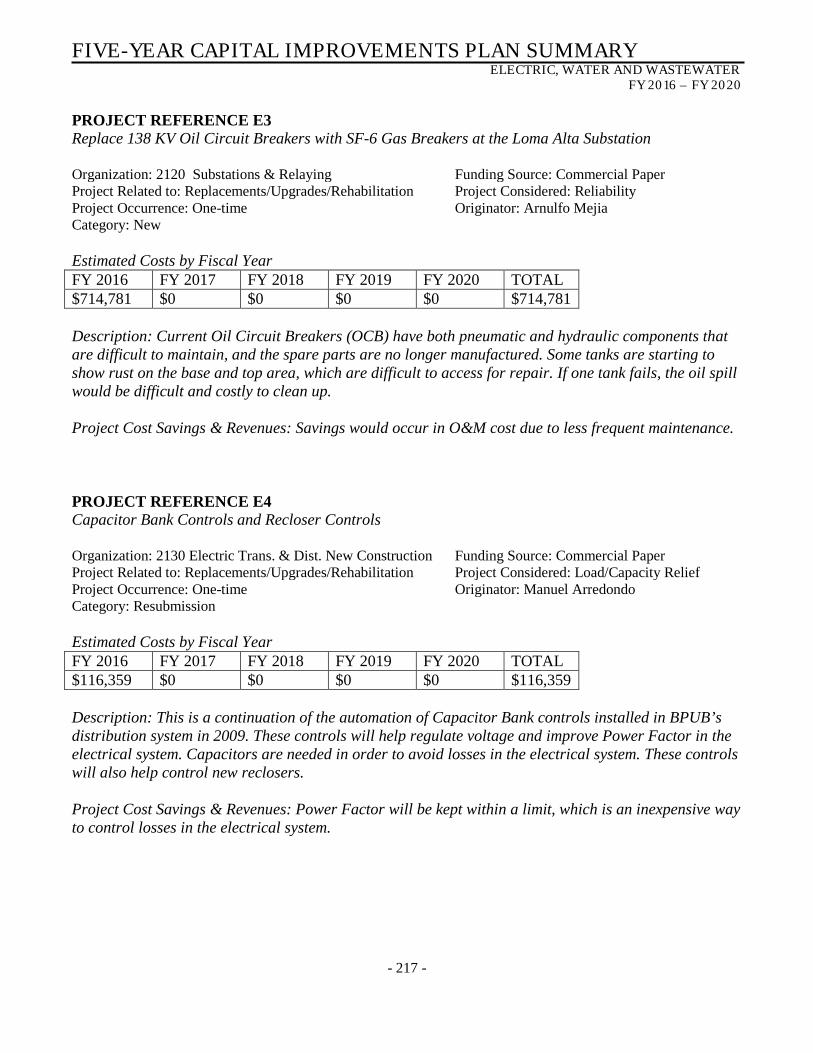
FIVE-YEAR CAPITAL IMPROVEMENTS PLAN SUMMARY ELECTRIC, WATER AND WASTEWATER
FY 2016 – FY 2020
- 217 -
PROJECT REFERENCE E3 Replace 138 KV Oil Circuit Breakers with SF-6 Gas Breakers at the Loma Alta Substation Organization: 2120 Substations & Relaying Funding Source: Commercial Paper Project Related to: Replacements/Upgrades/Rehabilitation Project Considered: Reliability Project Occurrence: One-time Originator: Arnulfo Mejia Category: New Estimated Costs by Fiscal Year FY 2016 FY 2017 FY 2018 FY 2019 FY 2020 TOTAL $714,781 $0 $0 $0 $0 $714,781 Description: Current Oil Circuit Breakers (OCB) have both pneumatic and hydraulic components that are difficult to maintain, and the spare parts are no longer manufactured. Some tanks are starting to show rust on the base and top area, which are difficult to access for repair. If one tank fails, the oil spill would be difficult and costly to clean up. Project Cost Savings & Revenues: Savings would occur in O&M cost due to less frequent maintenance. PROJECT REFERENCE E4 Capacitor Bank Controls and Recloser Controls Organization: 2130 Electric Trans. & Dist. New Construction Funding Source: Commercial Paper Project Related to: Replacements/Upgrades/Rehabilitation Project Considered: Load/Capacity Relief Project Occurrence: One-time Originator: Manuel Arredondo Category: Resubmission Estimated Costs by Fiscal Year FY 2016 FY 2017 FY 2018 FY 2019 FY 2020 TOTAL $116,359 $0 $0 $0 $0 $116,359 Description: This is a continuation of the automation of Capacitor Bank controls installed in BPUB’s distribution system in 2009. These controls will help regulate voltage and improve Power Factor in the electrical system. Capacitors are needed in order to avoid losses in the electrical system. These controls will also help control new reclosers. Project Cost Savings & Revenues: Power Factor will be kept within a limit, which is an inexpensive way to control losses in the electrical system.

FIVE-YEAR CAPITAL IMPROVEMENTS PLAN SUMMARY ELECTRIC, WATER AND WASTEWATER
FY 2016 – FY 2020
- 218 -
PROJECT REFERENCE E5 15KV Recloser Controls Organization: 2130 Electric Trans. & Dist. New Construction Funding Source: Commercial Paper Project Related to: Replacements/Upgrades/Rehabilitation Project Considered: Must Do Project Occurrence: One-time Originator: Manuel Arredondo Category: New Estimated Costs by Fiscal Year FY 2016 FY 2017 FY 2018 FY 2019 FY 2020 TOTAL $151,266 $0 $0 $0 $0 $151,266 Description: Currently, a small outage can cause a substation to shut down due to current fault. With the installation of the recloser, the system will be more reliable, and the revenue will not be affected. The recloser will help isolate the fault to one specific area. Project Cost Savings & Revenues: Better control of outages will mean more revenue. PROJECT REFERENCE E6 Electric Distribution – Multiple Improvement Carryover Projects Organization: 2410 Electric Engineering Funding Source: Improvement Project Related to: Replacements/Upgrades/Rehabilitation Project Considered: Must Do Project Occurrence: One-time Originator: James McCann Category: Carryover Estimated Costs by Fiscal Year FY 2016 FY 2017 FY 2018 FY 2019 FY 2020 TOTAL $617,567 $0 $0 $0 $0 $617,567 Description: This line item is the budget for the carryover projects rolled over from Fiscal Year 2015. Projects include the installation of a medium voltage switchgear for the river pumps, a new feeder at the FM 802 substation, and primary jumper replacements at the Airport Substation. Note: $617,567 is the FY 2015 carryover amount. Project Cost Savings & Revenues: N/A
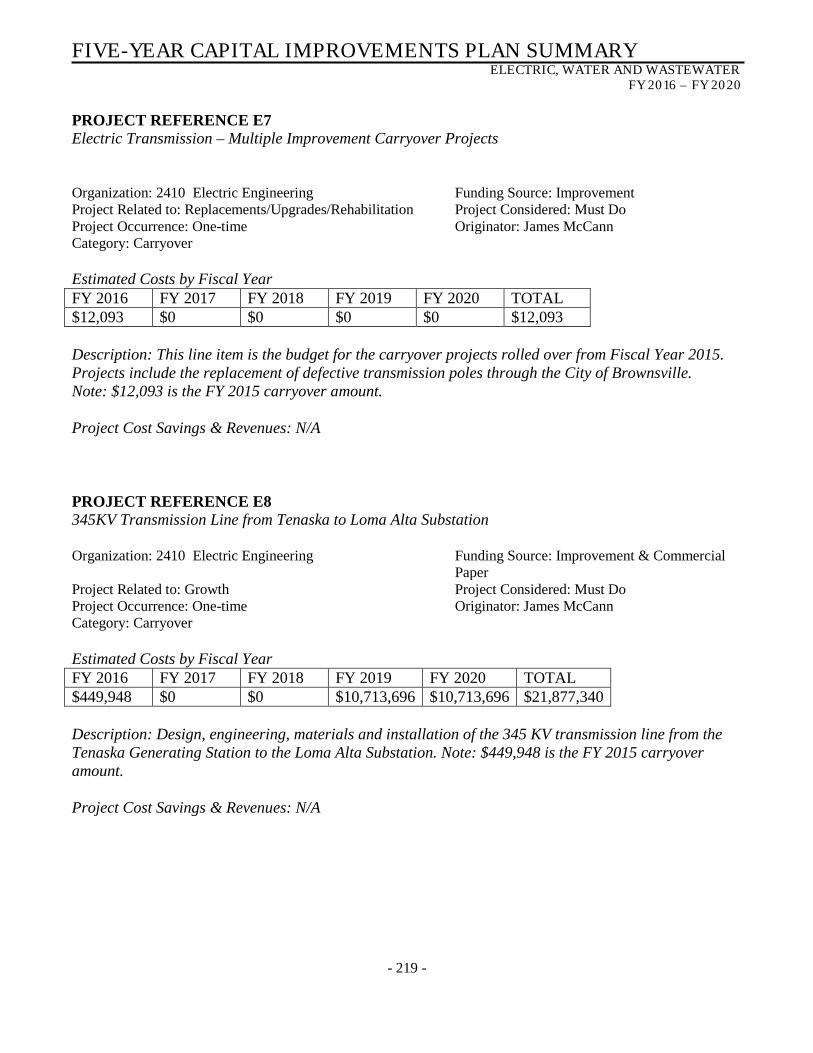
FIVE-YEAR CAPITAL IMPROVEMENTS PLAN SUMMARY ELECTRIC, WATER AND WASTEWATER
FY 2016 – FY 2020
- 219 -
PROJECT REFERENCE E7 Electric Transmission – Multiple Improvement Carryover Projects Organization: 2410 Electric Engineering Funding Source: Improvement Project Related to: Replacements/Upgrades/Rehabilitation Project Considered: Must Do Project Occurrence: One-time Originator: James McCann Category: Carryover Estimated Costs by Fiscal Year FY 2016 FY 2017 FY 2018 FY 2019 FY 2020 TOTAL $12,093 $0 $0 $0 $0 $12,093 Description: This line item is the budget for the carryover projects rolled over from Fiscal Year 2015. Projects include the replacement of defective transmission poles through the City of Brownsville. Note: $12,093 is the FY 2015 carryover amount. Project Cost Savings & Revenues: N/A PROJECT REFERENCE E8 345KV Transmission Line from Tenaska to Loma Alta Substation Organization: 2410 Electric Engineering Funding Source: Improvement & Commercial
Paper Project Related to: Growth Project Considered: Must Do Project Occurrence: One-time Originator: James McCann Category: Carryover Estimated Costs by Fiscal Year FY 2016 FY 2017 FY 2018 FY 2019 FY 2020 TOTAL $449,948 $0 $0 $10,713,696 $10,713,696 $21,877,340 Description: Design, engineering, materials and installation of the 345 KV transmission line from the Tenaska Generating Station to the Loma Alta Substation. Note: $449,948 is the FY 2015 carryover amount. Project Cost Savings & Revenues: N/A

FIVE-YEAR CAPITAL IMPROVEMENTS PLAN SUMMARY ELECTRIC, WATER AND WASTEWATER
FY 2016 – FY 2020
- 220 -
PROJECT REFERENCE E9 Security Light Installations (ED2000’s) Organization: 2410 Electric Engineering Funding Source: Improvement Project Related to: Growth Project Considered: General Project Occurrence: Recurring Originator: Eliazar Perez Category: Routine Estimated Costs by Fiscal Year FY 2016 FY 2017 FY 2018 FY 2019 FY 2020 TOTAL $61,110 $46,537 $60,412 $102,204 $124,841 $395,104 Description: Security light installations are necessary throughout the City of Brownsville and are a good source of revenue for BPUB. Note: $13,443 is the FY 2015 carryover amount. Project Cost Savings & Revenues: Security light installation projects begin to earn revenues on the second year of a four-year contract. In addition, extra kWh is sold during the contract term. PROJECT REFERENCE E10 Street Light Installations (ED7000’s) Organization: 2410 Electric Engineering Funding Source: Improvement Project Related to: Growth Project Considered: General Project Occurrence: Recurring Originator: Christian Lopez Category: Routine Estimated Costs by Fiscal Year FY 2016 FY 2017 FY 2018 FY 2019 FY 2020 TOTAL $66,120 $22,993 $29,848 $50,496 $61,680 $231,137 Description: This project supports the installation and upgrades of BPUB street light installations that are necessary throughout the City of Brownsville. Note: $42,569 is the FY 2015 carryover amount. Project Cost Savings & Revenues: N/A
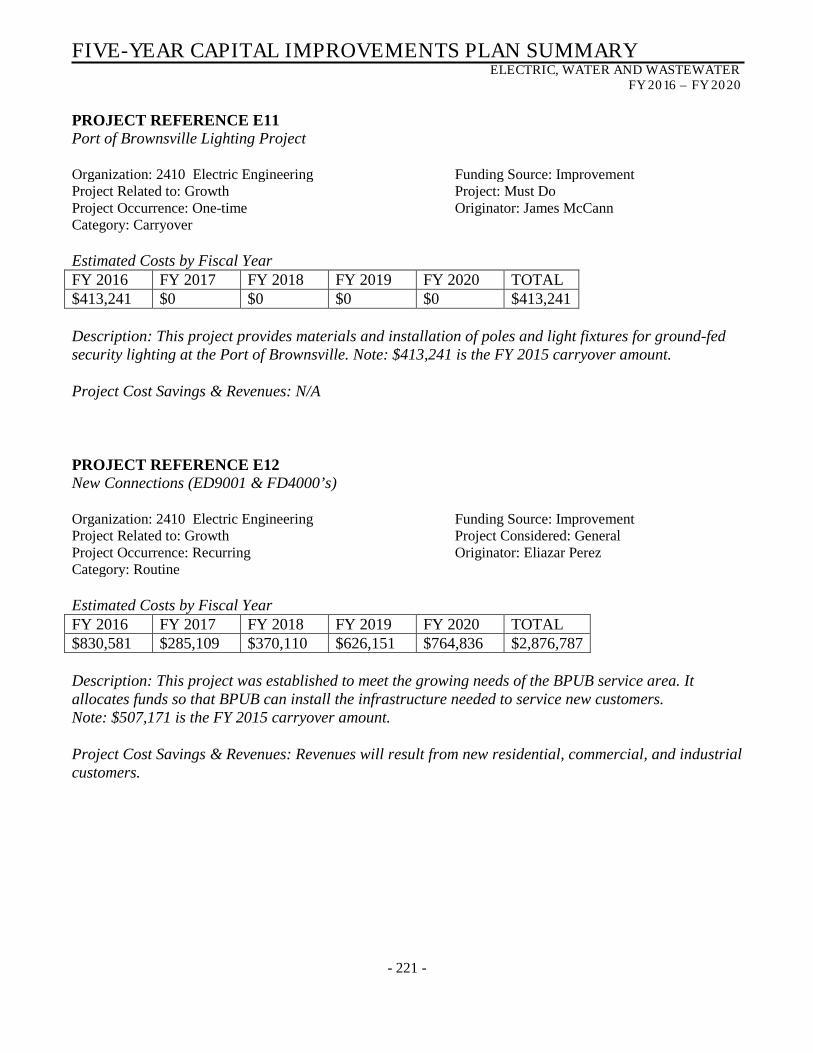
FIVE-YEAR CAPITAL IMPROVEMENTS PLAN SUMMARY ELECTRIC, WATER AND WASTEWATER
FY 2016 – FY 2020
- 221 -
PROJECT REFERENCE E11 Port of Brownsville Lighting Project Organization: 2410 Electric Engineering Funding Source: Improvement Project Related to: Growth Project: Must Do Project Occurrence: One-time Originator: James McCann Category: Carryover Estimated Costs by Fiscal Year FY 2016 FY 2017 FY 2018 FY 2019 FY 2020 TOTAL $413,241 $0 $0 $0 $0 $413,241 Description: This project provides materials and installation of poles and light fixtures for ground-fed security lighting at the Port of Brownsville. Note: $413,241 is the FY 2015 carryover amount. Project Cost Savings & Revenues: N/A PROJECT REFERENCE E12 New Connections (ED9001 & FD4000’s) Organization: 2410 Electric Engineering Funding Source: Improvement Project Related to: Growth Project Considered: General Project Occurrence: Recurring Originator: Eliazar Perez Category: Routine Estimated Costs by Fiscal Year FY 2016 FY 2017 FY 2018 FY 2019 FY 2020 TOTAL $830,581 $285,109 $370,110 $626,151 $764,836 $2,876,787 Description: This project was established to meet the growing needs of the BPUB service area. It allocates funds so that BPUB can install the infrastructure needed to service new customers. Note: $507,171 is the FY 2015 carryover amount. Project Cost Savings & Revenues: Revenues will result from new residential, commercial, and industrial customers.

FIVE-YEAR CAPITAL IMPROVEMENTS PLAN SUMMARY ELECTRIC, WATER AND WASTEWATER
FY 2016 – FY 2020
- 222 -
PROJECT REFERENCE E13 New Subdivisions (ED5000’s) Organization: 2410 Electric Engineering Funding Source: Improvement Project Related to: Growth Project Considered: General Project Occurrence: Recurring Originator: Eliazar Perez Category: Routine Estimated Costs by Fiscal Year FY 2016 FY 2017 FY 2018 FY 2019 FY 2020 TOTAL $278,099 $182,103 $325,795 $671,668 $741,379 $2,199,044 Description: This project will meet the growing needs of the BPUB service area. It allocates funds so that BPUB can install the electric infrastructure needed to service new residential subdivisions. Note: $91,577 is the FY 2015 carryover amount. Project Cost Savings & Revenues: Revenues will result from new customers who average 1,000 kWh per month on their electric usage. Each subdivision averages 50 lots. PROJECT REFERENCE E14 Trouble Calls & Service Increases (FD6000’s) Organization: 2410 Electric Engineering Funding Source: Improvement Project Related to: Growth Project Considered: General Project Occurrence: Recurring Originator: Eliazar Perez Category: Routine Estimated Costs by Fiscal Year FY 2016 FY 2017 FY 2018 FY 2019 FY 2020 TOTAL $565,229 $353,628 $459,057 $776,631 $948,644 $3,103,189 Description: This project will allocate the funds necessary to address safety and issues with existing services. This program also allocates funds for infrastructure upgrades. Note: $203,018 is the FY 2015 carryover amount. Project Cost Savings & Revenues: Service upgrades equal more revenues for BPUB in terms of increased demand charges as well as consumption.
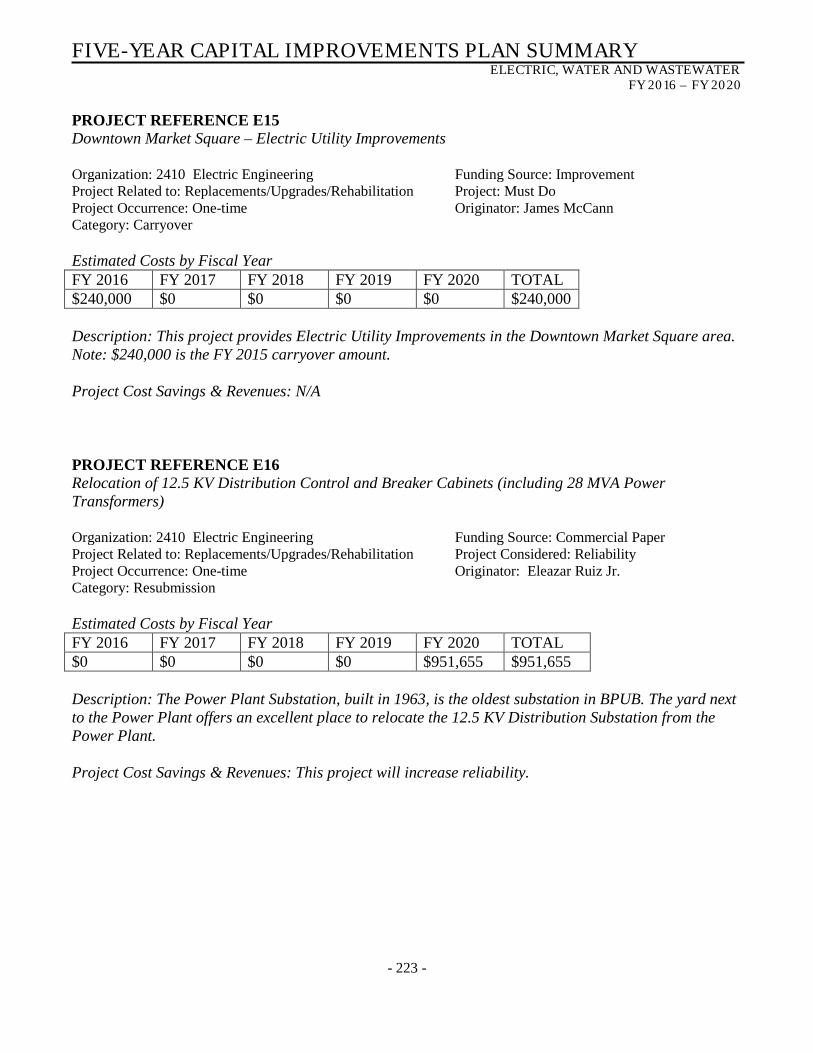
FIVE-YEAR CAPITAL IMPROVEMENTS PLAN SUMMARY ELECTRIC, WATER AND WASTEWATER
FY 2016 – FY 2020
- 223 -
PROJECT REFERENCE E15 Downtown Market Square – Electric Utility Improvements Organization: 2410 Electric Engineering Funding Source: Improvement Project Related to: Replacements/Upgrades/Rehabilitation Project: Must Do Project Occurrence: One-time Originator: James McCann Category: Carryover Estimated Costs by Fiscal Year FY 2016 FY 2017 FY 2018 FY 2019 FY 2020 TOTAL $240,000 $0 $0 $0 $0 $240,000 Description: This project provides Electric Utility Improvements in the Downtown Market Square area. Note: $240,000 is the FY 2015 carryover amount. Project Cost Savings & Revenues: N/A PROJECT REFERENCE E16 Relocation of 12.5 KV Distribution Control and Breaker Cabinets (including 28 MVA Power Transformers) Organization: 2410 Electric Engineering Funding Source: Commercial Paper Project Related to: Replacements/Upgrades/Rehabilitation Project Considered: Reliability Project Occurrence: One-time Originator: Eleazar Ruiz Jr. Category: Resubmission Estimated Costs by Fiscal Year FY 2016 FY 2017 FY 2018 FY 2019 FY 2020 TOTAL $0 $0 $0 $0 $951,655 $951,655 Description: The Power Plant Substation, built in 1963, is the oldest substation in BPUB. The yard next to the Power Plant offers an excellent place to relocate the 12.5 KV Distribution Substation from the Power Plant. Project Cost Savings & Revenues: This project will increase reliability.

FIVE-YEAR CAPITAL IMPROVEMENTS PLAN SUMMARY ELECTRIC, WATER AND WASTEWATER
FY 2016 – FY 2020
- 224 -
PROJECT REFERENCE E17 LED Lighting Pilot Project Organization: 2410 Electric Engineering Funding Source: Commercial Paper Project Related to: Replacements/Upgrades/Rehabilitation Project Considered: Load/Capacity Relief Project Occurrence: One-time Originator: Christian Lopez Category: Resubmission Estimated Costs by Fiscal Year FY 2016 FY 2017 FY 2018 FY 2019 FY 2020 TOTAL $13,659 $0 $0 $0 $0 $13,659 Description: Initiation of a pilot LED project by replacing 26 of 400 watt sodium vapor lights with comparable LED lighting at Oliveira Park. The project will help determine the benefits of LED technology. Project Cost Savings & Revenues: Minimal maintenance cost is expected for a five to ten year period in comparison to sodium vapor lights. LED’s use 30% of the energy compared to existing High Pressure Sodium lights. PROJECT REFERENCE E18 Overhead Insulated Wire Installation Organization: 2410 Electric Engineering Funding Source: Commercial Paper Project Related to: Replacements/Upgrades/Rehabilitation Project Considered: Reliability Project Occurrence: One-time Originator: Eleazar Ruiz Jr. Category: Resubmission Estimated Costs by Fiscal Year FY 2016 FY 2017 FY 2018 FY 2019 FY 2020 TOTAL $51,812 $0 $0 $0 $0 $51,812 Description: The project will include the installation of insulated overhead wire in approximately 13 different locations where tree trimming is not practical, easily accessible, or where trimming might possibly destroy the tree. The insulation will help avoid vegetation coming in contact with distribution power lines, thus, reducing the likelihood of feeder operations and extended outage time. Project Cost Savings & Revenues: By increasing reliability, BPUB will experience reduced outage times, and maintain tree integrity.
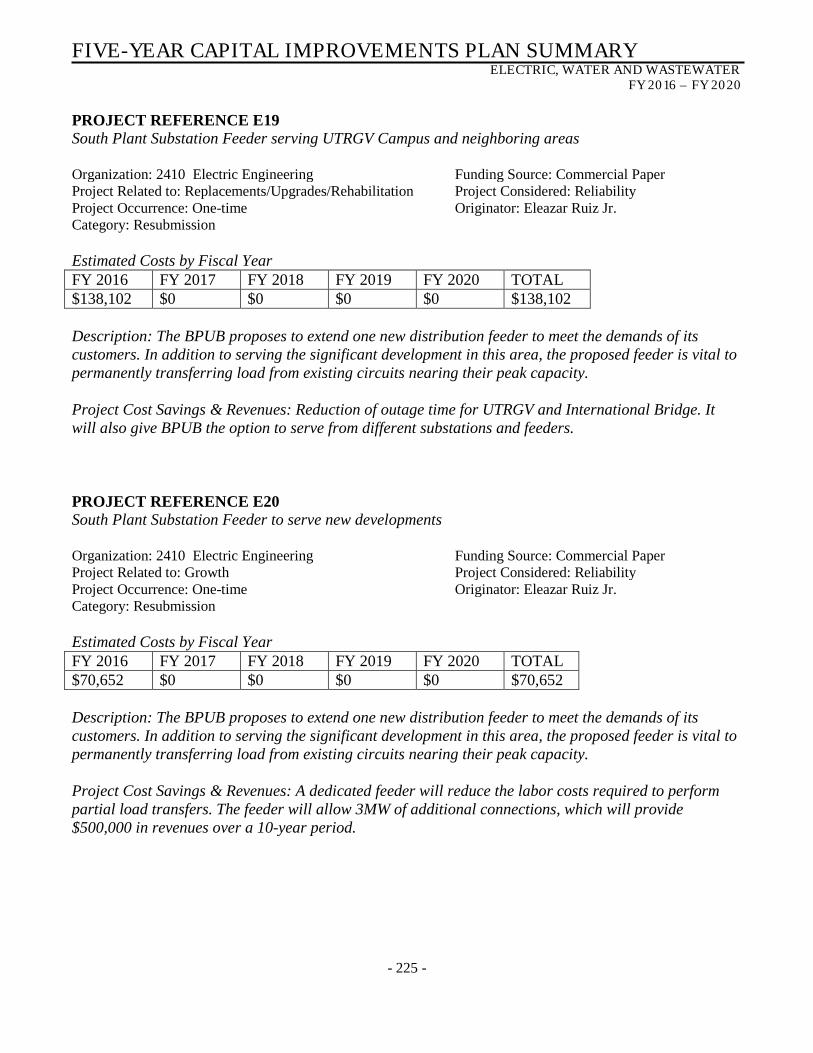
FIVE-YEAR CAPITAL IMPROVEMENTS PLAN SUMMARY ELECTRIC, WATER AND WASTEWATER
FY 2016 – FY 2020
- 225 -
PROJECT REFERENCE E19 South Plant Substation Feeder serving UTRGV Campus and neighboring areas Organization: 2410 Electric Engineering Funding Source: Commercial Paper Project Related to: Replacements/Upgrades/Rehabilitation Project Considered: Reliability Project Occurrence: One-time Originator: Eleazar Ruiz Jr. Category: Resubmission Estimated Costs by Fiscal Year FY 2016 FY 2017 FY 2018 FY 2019 FY 2020 TOTAL $138,102 $0 $0 $0 $0 $138,102 Description: The BPUB proposes to extend one new distribution feeder to meet the demands of its customers. In addition to serving the significant development in this area, the proposed feeder is vital to permanently transferring load from existing circuits nearing their peak capacity. Project Cost Savings & Revenues: Reduction of outage time for UTRGV and International Bridge. It will also give BPUB the option to serve from different substations and feeders. PROJECT REFERENCE E20 South Plant Substation Feeder to serve new developments Organization: 2410 Electric Engineering Funding Source: Commercial Paper Project Related to: Growth Project Considered: Reliability Project Occurrence: One-time Originator: Eleazar Ruiz Jr. Category: Resubmission Estimated Costs by Fiscal Year FY 2016 FY 2017 FY 2018 FY 2019 FY 2020 TOTAL $70,652 $0 $0 $0 $0 $70,652 Description: The BPUB proposes to extend one new distribution feeder to meet the demands of its customers. In addition to serving the significant development in this area, the proposed feeder is vital to permanently transferring load from existing circuits nearing their peak capacity. Project Cost Savings & Revenues: A dedicated feeder will reduce the labor costs required to perform partial load transfers. The feeder will allow 3MW of additional connections, which will provide $500,000 in revenues over a 10-year period.
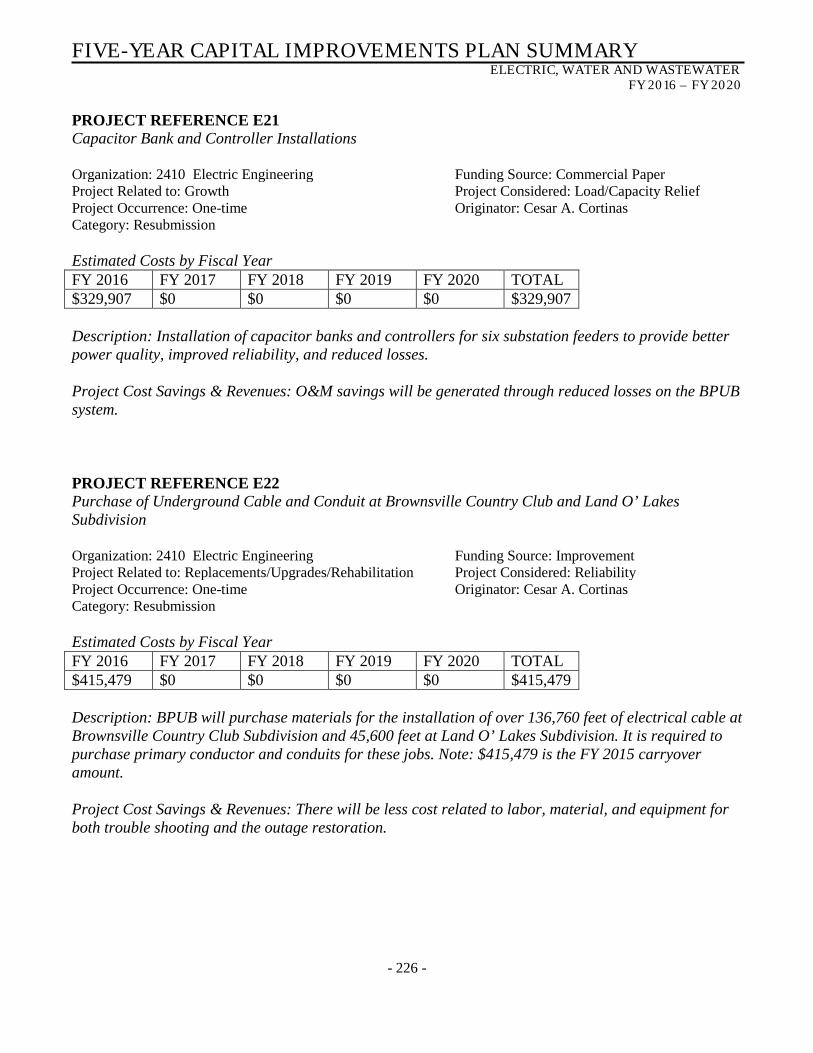
FIVE-YEAR CAPITAL IMPROVEMENTS PLAN SUMMARY ELECTRIC, WATER AND WASTEWATER
FY 2016 – FY 2020
- 226 -
PROJECT REFERENCE E21 Capacitor Bank and Controller Installations Organization: 2410 Electric Engineering Funding Source: Commercial Paper Project Related to: Growth Project Considered: Load/Capacity Relief Project Occurrence: One-time Originator: Cesar A. Cortinas Category: Resubmission Estimated Costs by Fiscal Year FY 2016 FY 2017 FY 2018 FY 2019 FY 2020 TOTAL $329,907 $0 $0 $0 $0 $329,907 Description: Installation of capacitor banks and controllers for six substation feeders to provide better power quality, improved reliability, and reduced losses. Project Cost Savings & Revenues: O&M savings will be generated through reduced losses on the BPUB system. PROJECT REFERENCE E22 Purchase of Underground Cable and Conduit at Brownsville Country Club and Land O’ Lakes Subdivision Organization: 2410 Electric Engineering Funding Source: Improvement Project Related to: Replacements/Upgrades/Rehabilitation Project Considered: Reliability Project Occurrence: One-time Originator: Cesar A. Cortinas Category: Resubmission Estimated Costs by Fiscal Year FY 2016 FY 2017 FY 2018 FY 2019 FY 2020 TOTAL $415,479 $0 $0 $0 $0 $415,479 Description: BPUB will purchase materials for the installation of over 136,760 feet of electrical cable at Brownsville Country Club Subdivision and 45,600 feet at Land O’ Lakes Subdivision. It is required to purchase primary conductor and conduits for these jobs. Note: $415,479 is the FY 2015 carryover amount. Project Cost Savings & Revenues: There will be less cost related to labor, material, and equipment for both trouble shooting and the outage restoration.
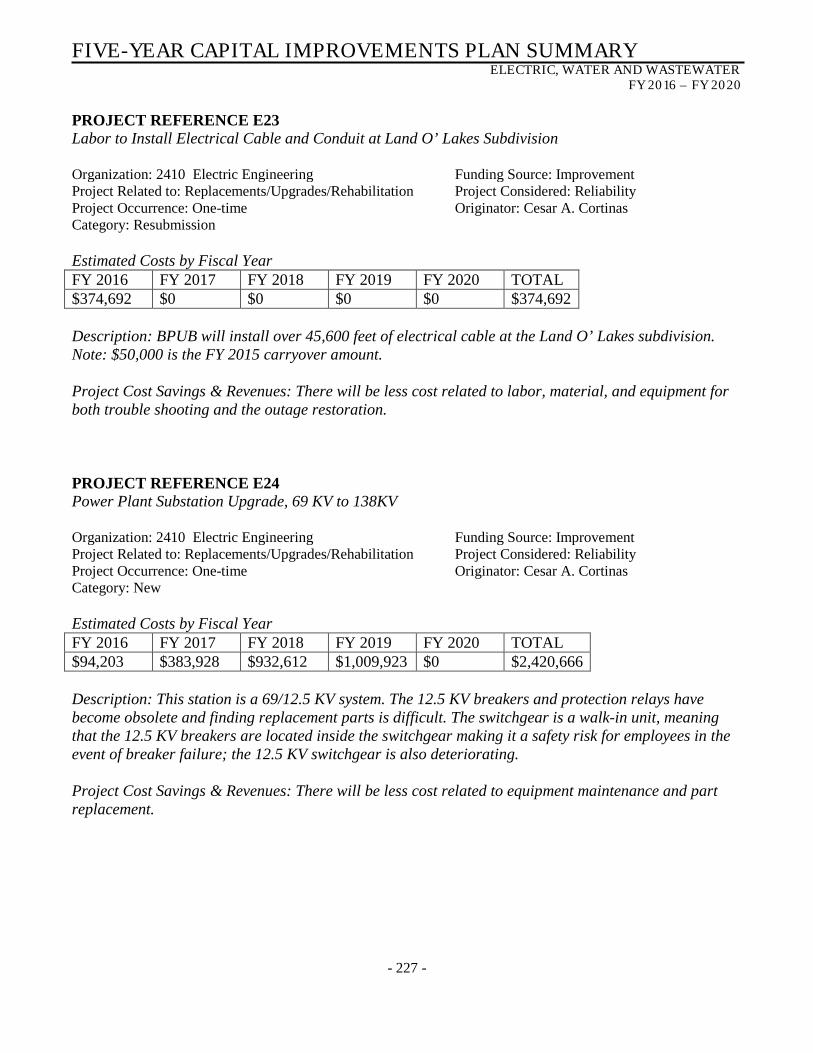
FIVE-YEAR CAPITAL IMPROVEMENTS PLAN SUMMARY ELECTRIC, WATER AND WASTEWATER
FY 2016 – FY 2020
- 227 -
PROJECT REFERENCE E23 Labor to Install Electrical Cable and Conduit at Land O’ Lakes Subdivision Organization: 2410 Electric Engineering Funding Source: Improvement Project Related to: Replacements/Upgrades/Rehabilitation Project Considered: Reliability Project Occurrence: One-time Originator: Cesar A. Cortinas Category: Resubmission Estimated Costs by Fiscal Year FY 2016 FY 2017 FY 2018 FY 2019 FY 2020 TOTAL $374,692 $0 $0 $0 $0 $374,692 Description: BPUB will install over 45,600 feet of electrical cable at the Land O’ Lakes subdivision. Note: $50,000 is the FY 2015 carryover amount. Project Cost Savings & Revenues: There will be less cost related to labor, material, and equipment for both trouble shooting and the outage restoration. PROJECT REFERENCE E24 Power Plant Substation Upgrade, 69 KV to 138KV Organization: 2410 Electric Engineering Funding Source: Improvement Project Related to: Replacements/Upgrades/Rehabilitation Project Considered: Reliability Project Occurrence: One-time Originator: Cesar A. Cortinas Category: New Estimated Costs by Fiscal Year FY 2016 FY 2017 FY 2018 FY 2019 FY 2020 TOTAL $94,203 $383,928 $932,612 $1,009,923 $0 $2,420,666 Description: This station is a 69/12.5 KV system. The 12.5 KV breakers and protection relays have become obsolete and finding replacement parts is difficult. The switchgear is a walk-in unit, meaning that the 12.5 KV breakers are located inside the switchgear making it a safety risk for employees in the event of breaker failure; the 12.5 KV switchgear is also deteriorating. Project Cost Savings & Revenues: There will be less cost related to equipment maintenance and part replacement.
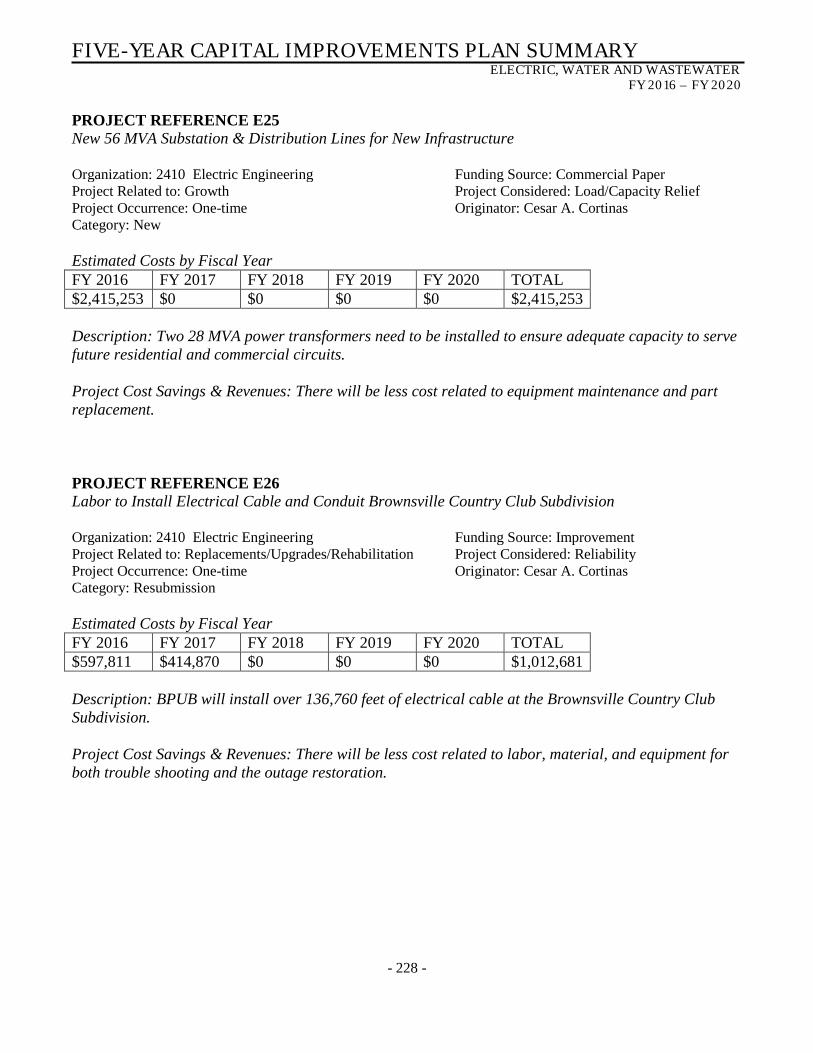
FIVE-YEAR CAPITAL IMPROVEMENTS PLAN SUMMARY ELECTRIC, WATER AND WASTEWATER
FY 2016 – FY 2020
- 228 -
PROJECT REFERENCE E25 New 56 MVA Substation & Distribution Lines for New Infrastructure Organization: 2410 Electric Engineering Funding Source: Commercial Paper Project Related to: Growth Project Considered: Load/Capacity Relief Project Occurrence: One-time Originator: Cesar A. Cortinas Category: New Estimated Costs by Fiscal Year FY 2016 FY 2017 FY 2018 FY 2019 FY 2020 TOTAL $2,415,253 $0 $0 $0 $0 $2,415,253 Description: Two 28 MVA power transformers need to be installed to ensure adequate capacity to serve future residential and commercial circuits. Project Cost Savings & Revenues: There will be less cost related to equipment maintenance and part replacement. PROJECT REFERENCE E26 Labor to Install Electrical Cable and Conduit Brownsville Country Club Subdivision Organization: 2410 Electric Engineering Funding Source: Improvement Project Related to: Replacements/Upgrades/Rehabilitation Project Considered: Reliability Project Occurrence: One-time Originator: Cesar A. Cortinas Category: Resubmission Estimated Costs by Fiscal Year FY 2016 FY 2017 FY 2018 FY 2019 FY 2020 TOTAL $597,811 $414,870 $0 $0 $0 $1,012,681 Description: BPUB will install over 136,760 feet of electrical cable at the Brownsville Country Club Subdivision. Project Cost Savings & Revenues: There will be less cost related to labor, material, and equipment for both trouble shooting and the outage restoration.

FIVE-YEAR CAPITAL IMPROVEMENTS PLAN SUMMARY ELECTRIC, WATER AND WASTEWATER
FY 2016 – FY 2020
- 229 -
PROJECT REFERENCE E27 Install a Second Power Transformer at the Palo Alto Substation Organization: 2410 Electric Engineering Funding Source: Improvement Project Related to: Growth Project Considered: General Project Occurrence: One-time Originator: Eleazar Ruiz Jr. Category: New Estimated Costs by Fiscal Year FY 2016 FY 2017 FY 2018 FY 2019 FY 2020 TOTAL $0 $0 $0 $423,765 $0 $423,765 Description: The Palo Alto Substation has only one 15/20/25 MVA power transformer, which is at 70% capacity. A new transformer needs to be added to accommodate the load from the Tenaska Generation Plant. Project Cost Savings & Revenues: N/A PROJECT REFERENCE E28 Electric Distribution – Multiple Commercial Paper Carryover Projects Organization: 2410 Electric Engineering Funding Source: Commercial Paper Project Related to: Replacements/Upgrades/Rehabilitation Project Considered: Must Do Project Occurrence: One-time Originator: James McCann Category: Carryover Estimated Costs by Fiscal Year FY 2016 FY 2017 FY 2018 FY 2019 FY 2020 TOTAL $58,981 $0 $0 $0 $0 $58,981 Description: This line item is the budget for the carryover projects rolled over from Fiscal Year 2015. Projects include the initial engineering services associated with the new Electric SCADA System. Note: $58,981 is the FY 2015 carryover amount. Project Cost Savings & Revenues: N/A
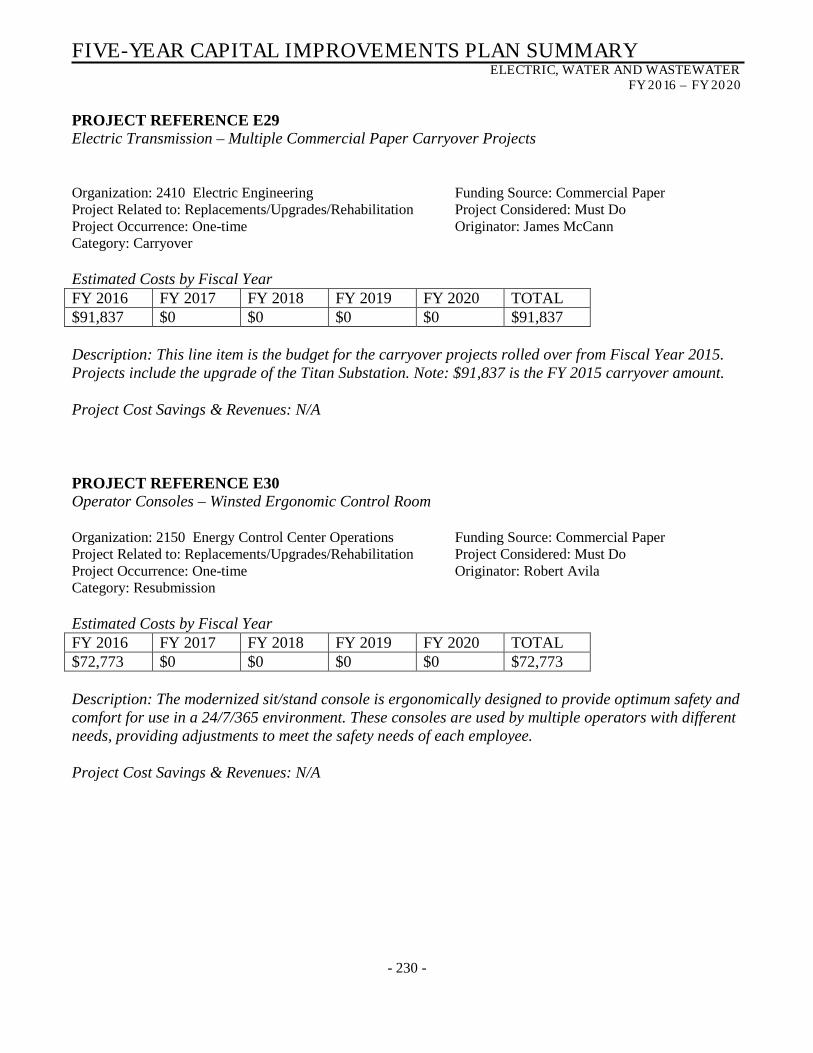
FIVE-YEAR CAPITAL IMPROVEMENTS PLAN SUMMARY ELECTRIC, WATER AND WASTEWATER
FY 2016 – FY 2020
- 230 -
PROJECT REFERENCE E29 Electric Transmission – Multiple Commercial Paper Carryover Projects Organization: 2410 Electric Engineering Funding Source: Commercial Paper Project Related to: Replacements/Upgrades/Rehabilitation Project Considered: Must Do Project Occurrence: One-time Originator: James McCann Category: Carryover Estimated Costs by Fiscal Year FY 2016 FY 2017 FY 2018 FY 2019 FY 2020 TOTAL $91,837 $0 $0 $0 $0 $91,837 Description: This line item is the budget for the carryover projects rolled over from Fiscal Year 2015. Projects include the upgrade of the Titan Substation. Note: $91,837 is the FY 2015 carryover amount. Project Cost Savings & Revenues: N/A PROJECT REFERENCE E30 Operator Consoles – Winsted Ergonomic Control Room Organization: 2150 Energy Control Center Operations Funding Source: Commercial Paper Project Related to: Replacements/Upgrades/Rehabilitation Project Considered: Must Do Project Occurrence: One-time Originator: Robert Avila Category: Resubmission Estimated Costs by Fiscal Year FY 2016 FY 2017 FY 2018 FY 2019 FY 2020 TOTAL $72,773 $0 $0 $0 $0 $72,773 Description: The modernized sit/stand console is ergonomically designed to provide optimum safety and comfort for use in a 24/7/365 environment. These consoles are used by multiple operators with different needs, providing adjustments to meet the safety needs of each employee. Project Cost Savings & Revenues: N/A

FIVE-YEAR CAPITAL IMPROVEMENTS PLAN SUMMARY ELECTRIC, WATER AND WASTEWATER
FY 2016 – FY 2020
- 231 -
PROJECT REFERENCE E31 Responder Implementation Services Organization: 2210 SCADA & Electrical Support Services Funding Source: Commercial Paper Project Related to: Replacements/Upgrades/Rehabilitation Project Considered: Reliability Project Occurrence: One-time Originator: Gustavo Leal Category: Resubmission Estimated Costs by Fiscal Year FY 2016 FY 2017 FY 2018 FY 2019 FY 2020 TOTAL $250,000 $0 $0 $0 $0 $250,000 Description: Outage management is a computer-based program used by System Operations and Customer Service. This program will assist in the restoration of the electrical power to customers by predicting the location of the fault, prioritizing restoration efforts, and managing resources. Project Cost Savings & Revenues: Cost savings will be achieved due to reduction in outage duration. PROJECT REFERENCE E32 Communications for Substations Upgrade Organization: 2210 SCADA & Electrical Support Services Funding Source: Commercial Paper Project Related to: Replacements/Upgrades/Rehabilitation Project Considered: Reliability Project Occurrence: One-time Originator: Gustavo Leal Category: Resubmission Estimated Costs by Fiscal Year FY 2016 FY 2017 FY 2018 FY 2019 FY 2020 TOTAL $800,000 $0 $0 $0 $0 $800,000 Description: The fiber optic multiplexer system and the Electrical Substations RTU’s are old and obsolete, which makes finding replacement parts close to impossible. This will be a turnkey project that includes the replacement of the Fiber Optic JMUX multiplexer system. Project Cost Savings & Revenues: The new equipment will alleviate recurring maintenance costs due to the existing equipment’s age.

FIVE-YEAR CAPITAL IMPROVEMENTS PLAN SUMMARY ELECTRIC, WATER AND WASTEWATER
FY 2016 – FY 2020
- 232 -
PROJECT REFERENCE E33 Electrical SCADA Replacement of System Software and Hardware Organization: 2210 SCADA & Electrical Support Services Funding Source: Commercial Paper Project Related to: Replacements/Upgrades/Rehabilitation Project Considered: Reliability Project Occurrence: One-time Originator: Gustavo Leal Category: Resubmission Estimated Costs by Fiscal Year FY 2016 FY 2017 FY 2018 FY 2019 FY 2020 TOTAL $2,000,000 $0 $0 $0 $0 $2,000,000 Description: The current SCADA system was installed about eighteen years ago and is in need of an upgrade with regard to software/hardware and other key components. Project Cost Savings & Revenues: Upgrades will alleviate current maintenance and reliability costs. PROJECT REFERENCE E34 Fiber Optic for Loma Alta to Price Road and South Plant to Airport Substations Organization: 2210 SCADA & Electrical Support Services Funding Source: Improvement Project Related to: Replacements/Upgrades/Rehabilitation Project Considered: Reliability Project Occurrence: One-time Originator: Gustavo Leal Category: Resubmission Estimated Costs by Fiscal Year FY 2016 FY 2017 FY 2018 FY 2019 FY 2020 TOTAL $0 $0 $0 $0 $150,000 $150,000 Description: All existing fiber optic cable run from Loma Alta to Price Road Substation is currently being used with no spares available. Staff would have a reliability issue if a pair of fibers should break. Project Cost Savings & Revenues: O&M savings will be seen in reduction of trouble shooting communication problems and increased reliability.
FIVE-YEAR CAPITAL IMPROVEMENTS PLAN SUMMARY ELECTRIC, WATER AND WASTEWATER
FY 2016 – FY 2020
- 233 -
PROJECT REFERENCE E35 Improvements Submitted by Staff for Electric Utility Organization: 7135 Geographic Information Systems Funding Source: Improvement Project Related to: Growth Project Considered: Must Do Project Occurrence: One-time Originator: Jesus Alfaro Category: New Estimated Costs by Fiscal Year FY 2016 FY 2017 FY 2018 FY 2019 FY 2020 TOTAL $0 $0 $0 $0 $367,000 $367,000 Description: Improvements submitted by staff for the Electric Utility. Project Cost Savings & Revenues: N/A PROJECT REFERENCE E36 Brownsville Electric Generating Station – Planning & Development Services (FY 2015 carryover balance) Organization: 1145 Energy Services Funding Source: Improvement Project Related to: Growth Project Considered: Must Do Project Occurrence: One-time Originator: Jaime Estrada Category: Carryover Estimated Costs by Fiscal Year FY 2016 FY 2017 FY 2018 FY 2019 FY 2020 TOTAL $490,126 $1,473,112 $414,870 $0 $0 $2,378,108 Description: Planning and development services for the new Tenaska Brownsville Generation Station. Note: $378,108 is the FY 2015 carryover amount. Project Cost Savings & Revenues: N/A

FIVE-YEAR CAPITAL IMPROVEMENTS PLAN SUMMARY ELECTRIC, WATER AND WASTEWATER
FY 2016 – FY 2020
- 234 -
PROJECT REFERENCE E37 Cross Valley Natural Gas Pipeline (FY 2015 carryover balance) Organization: 1145 Energy Risk Management Funding Source: Improvement Project Related to: Growth Project Considered: Must Do Project Occurrence: One-time Originator: Jaime Estrada Category: Carryover Estimated Costs by Fiscal Year FY 2016 FY 2017 FY 2018 FY 2019 FY 2020 TOTAL $5,214,950 $0 $0 $0 $0 $5,214,950 Description: Engineering and feasibility services and right-of-way for the proposed natural gas pipeline to the new Tenaska Brownsville Generation Station. Note: $5,214,950 is the FY 2015 carryover amount. Project Cost Savings & Revenues: N/A PROJECT REFERENCE E38 Continuous Emissions Monitor System Data Controllers for Units 9 & 10 Organization: 1420 Environmental Compliance Funding Source: Commercial Paper Project Related to: Replacements/Upgrades/Rehabilitation Project Considered: Must Do Project Occurrence: One-time Originator: Ramiro Capistran Jr. Category: New Estimated Costs by Fiscal Year FY 2016 FY 2017 FY 2018 FY 2019 FY 2020 TOTAL $65,000 $0 $0 $0 $0 $65,000 Description: BPUB received an obsolescence notice from the Environmental Services Corporation stating that they will no longer manufacture data controllers 8832 and will stop providing updates and support. The 8832 data controllers need to be replaced with 8864 data controllers for compliance purposes. Project Cost Savings & Revenues: Cost savings is generated indirectly. Fines/fees for violations can far exceed the equipment cost or the cost resulting from stopping operations.
FIVE-YEAR CAPITAL IMPROVEMENTS PLAN SUMMARY ELECTRIC, WATER AND WASTEWATER
FY 2016 – FY 2020
- 235 -
PROJECT REFERENCE E39 Unit 10 Umbilical Cord Replacement Organization: 1420 Environmental Compliance Funding Source: Commercial Paper Project Related to: Replacements/Upgrades/Rehabilitation Project Considered: Must Do Project Occurrence: One-time Originator: Ramiro Capistran Jr. Category: New Estimated Costs by Fiscal Year FY 2016 FY 2017 FY 2018 FY 2019 FY 2020 TOTAL $110,000 $0 $0 $0 $0 $110,000 Description: The umbilical cord is a vital component of the CEM’s; without proper sample transport, staff is not able to analyze and report emissions as required by EPA and TCEQ regulations. Project Cost Savings & Revenues: Cost savings is generated indirectly. Fines/fees for violation can far exceed the equipment cost or the cost resulting from stopping operations. PROJECT REFERENCE E40 Electric Generation – Multiple Carryover Improvement Projects Organization: 2220 Power Production Funding Source: Improvement Project Related to: Replacements/Upgrades/Rehabilitation Project Considered: Must Do Project Occurrence: One-time Originator: Rolando Lozano Category: Carryover Estimated Costs by Fiscal Year FY 2016 FY 2017 FY 2018 FY 2019 FY 2020 TOTAL $322,604 $0 $0 $0 $0 $322,604 Description: This line item is the budget for the carryover projects rolled over from Fiscal Year 2015. Projects include the purchase and installation of a condenser, battery charger, and battery bank for unit 6 as well as other electric generation projects. Note: $322,604 is the FY 2015 carryover amount. Project Cost Savings & Revenues: N/A

FIVE-YEAR CAPITAL IMPROVEMENTS PLAN SUMMARY ELECTRIC, WATER AND WASTEWATER
FY 2016 – FY 2020
- 236 -
PROJECT REFERENCE E41 Unit 6/9 GSU Project - 2015 Organization: 2220 Power Production Funding Source: Improvement Project Related to: Emergency Project Considered: Load/Capacity Relief Project Occurrence: One-time Originator: Rolando Lozano Category: Carryover Estimated Costs by Fiscal Year FY 2016 FY 2017 FY 2018 FY 2019 FY 2020 TOTAL $936,090 $0 $0 $0 $0 $936,090 Description: Unit 6 generator step-up transformer is 1961 vintage equipment that requires replacement due to test indications of impending failure. Unit 6 operates in combined cycle and is the most efficient unit at the Silas Ray Power Plant. Note: $470,611 is the FY 2015 carryover amount. Project Cost Savings & Revenues: New equipment will provide greater efficiency and lessened risk of loss, which results in higher cost for insurance coverage. Newer cooler operating equipment will result in lower operating cost. PROJECT REFERENCE E42 Oklaunion Capital Improvements (routine) Organization: 2220 Power Production Funding Source: Improvement Project Related to: Replacement/Upgrades/Rehabilitation Project Considered: Reliability Project Occurrence: Recurring Originator: Rolando Lozano Category: Routine Estimated Costs by Fiscal Year FY 2016 FY 2017 FY 2018 FY 2019 FY 2020 TOTAL $2,797,436 $2,197,750 $2,362,296 $2,539,162 $2,729,270 $12,625,914 Description: Capital budgeting for Oklaunion Power Station will be for various minor and major capital projects throughout the year. Project Cost Savings & Revenues: Implementation of Capital Projects will improve plant’s overall reliability and availability, reducing lost time and emergency outage repairs.

FIVE-YEAR CAPITAL IMPROVEMENTS PLAN SUMMARY ELECTRIC, WATER AND WASTEWATER
FY 2016 – FY 2020
- 237 -
PROJECT REFERENCE E43 Unit 10 Ovation Control Upgrade Organization: 2220 Power Production Funding Source: Improvement Project Related to: Replacement/Upgrades/Rehabilitation Project Considered: Reliability Project Occurrence: One-time Originator: Rolando Lozano Category: New Estimated Costs by Fiscal Year FY 2016 FY 2017 FY 2018 FY 2019 FY 2020 TOTAL $0 $640,000 $0 $0 $0 $640,000 Description: The system is not supported by the manufacturer without an extensive and expensive upgrade. The system does not meet the operations needs of the plant, and in time, the system will require an extensive upgrade beyond just the controls. Project Cost Savings & Revenues: Non-proprietary open architectural components will facilitate a faster and more economical turn around on repairs. PROJECT REFERENCE E44 Unit 6 HRSG Improvement Organization: 2220 Power Production Funding Source: Improvement Project Related to: Replacement/Upgrades/Rehabilitation Project Considered: Reliability Project Occurrence: One-time Originator: Rolando Lozano Category: New Estimated Costs by Fiscal Year FY 2016 FY 2017 FY 2018 FY 2019 FY 2020 TOTAL $0 $0 $1,180,000 $0 $0 $1,180,000 Description: This project is intended for the replacement of the HRSG Economizer that preheats the boiler-feed water for unit 6. Occasional leaks in that section have occurred in the past, largely due to a combination of corrosion and cycling of the unit. Project Cost Savings & Revenues: O&M costs to repair the part of the boiler as well as the impact those repairs have on the operating efficiency would be mitigated as the HRSG matures.

FIVE-YEAR CAPITAL IMPROVEMENTS PLAN SUMMARY ELECTRIC, WATER AND WASTEWATER
FY 2016 – FY 2020
- 238 -
PROJECT REFERENCE E45 Unit 6/9 Combined Cycle Systems Upgrade Organization: 2220 Power Production Funding Source: Commercial Paper Project Related to: Replacement/Upgrades/Rehabilitation Project Considered: Must Do Project Occurrence: One-time Originator: Rolando Lozano Category: New Estimated Costs by Fiscal Year FY 2016 FY 2017 FY 2018 FY 2019 FY 2020 TOTAL $456,000 $0 $0 $0 $0 $456,000 Description: Combined, Unit 6 and 9 represent the most fuel efficient generating resource for the plant. The steam turbine governor is an analog mechanical/hydraulic governor for which wear and control issues have been cited by the original equipment manufacturer, Siemens Energy. Project Cost Savings & Revenues: Legal expenses and staff involvement from NERC Compliance, Risk Management, Power Production and Energy Control will be eliminated. PROJECT REFERENCE E46 Unit 6 Circulation Line Repair/Restoration Organization: 2220 Power Production Funding Source: Improvement Project Related to: Replacement/Upgrades/Rehabilitation Project Considered: Must Do Project Occurrence: One-time Originator: Rolando Lozano Category: New Estimated Costs by Fiscal Year FY 2016 FY 2017 FY 2018 FY 2019 FY 2020 TOTAL $0 $84,970 $0 $0 $0 $84,970 Description: This 54-year-old water line circulates cooling water from the cooling tower to the Unit 6 condenser but has recently begun to leak near the building foundation; a breech in the pipeline can threaten critical aboveground infrastructure. Project Cost Savings & Revenues: Reduced energy in pumping, water losses and elimination of downtime and repair costs due to underground water leaks.
FIVE-YEAR CAPITAL IMPROVEMENTS PLAN SUMMARY ELECTRIC, WATER AND WASTEWATER
FY 2016 – FY 2020
- 239 -
PROJECT REFERENCE G1 An Annex Administration Building, a New Service Center (FM 511) and Remodeling of the Existing Administration Building Organization: 1110 General Manager Funding Source: Commercial Paper Project Related to: Growth Project Considered: Must Do Project Occurrence: One-time Originator: Lina Alvarez Category: New Estimated Costs by Fiscal Year FY 2016 FY 2017 FY 2018 FY 2019 FY 2020 TOTAL $1,000,000 $8,500,000 $6,800,000 $1,700,000 $0 $18,000,000 Description: The Brownsville Public Utilities Board (BPUB) facilities, including the Administration Building and the Service Center, are currently in need of expansion to meet company and customer growth over the years. Project Cost Savings & Revenues: N/A PROJECT REFERENCE G2 Implementation of an Enterprise Content Management System (ECMS) Organization: 1165 Records Management Funding Source: Improvement Project Related to: Replacement/Upgrades/Rehabilitation Project Considered: General Project Occurrence: One-time Originator: Nancy Tello Category: Resubmission Estimated Costs by Fiscal Year FY 2016 FY 2017 FY 2018 FY 2019 FY 2020 TOTAL $0 $50,000 $200,000 $200,000 $100,000 $550,000 Description: The implementation of the ECMS consists of conducting a needs assessment, developing system specifications, projecting cost benefit analysis, developing request for proposals, evaluating and selecting vendor, installation and implementation of the system. Project Cost Savings & Revenues: $35,000 - $40,000 per year – BPUB will not have to spend tens of thousands of dollars every six months to add 20 terabytes of storage capacity and will not have to store paper records since the retention period will be incorporated into the ECMS.

FIVE-YEAR CAPITAL IMPROVEMENTS PLAN SUMMARY ELECTRIC, WATER AND WASTEWATER
FY 2016 – FY 2020
- 240 -
PROJECT REFERENCE G3 Preventative Maintenance Program – software to inspect, detect & maintain equipment and facilities Organization: 2210 SCADA & Electrical Support Services Funding Source: Improvement Project Related to: Growth Project Considered: Reliability Project Occurrence: One-time Originator: Gustavo Leal Category: Resubmission Estimated Costs by Fiscal Year FY 2016 FY 2017 FY 2018 FY 2019 FY 2020 TOTAL $100,000 $0 $0 $0 $0 $100,000 Description: Purchase and implementation of Preventative Maintenance Program. Project Cost Savings & Revenues: Potential savings by improving operational efficiency, avoiding or mitigating equipment failure before it occurs and increasing the systems reliability. PROJECT REFERENCE G4 Design Services for the Administration Building Annex Organization: 4110 Energy Risk Management Funding Source: Improvement Project Related to: Growth Project Considered: Must Do Project Occurrence: One-time Originator: Lina Alvarez Category: Carryover Estimated Costs by Fiscal Year FY 2016 FY 2017 FY 2018 FY 2019 FY 2020 TOTAL $175,000 $0 $0 $0 $0 $175,000 Description: Architectural and engineering design services for the Administration Building annex. Note: $175,000 is the FY 2015 carryover amount. Project Cost Savings & Revenues: N/A

FIVE-YEAR CAPITAL IMPROVEMENTS PLAN SUMMARY ELECTRIC, WATER AND WASTEWATER
FY 2016 – FY 2020
- 241 -
PROJECT REFERENCE G5 Design Services for the FM 511 Facilities Relocation Project Organization: 4110 Energy Risk Management Funding Source: Improvement Project Related to: Growth Project Considered: Must Do Project Occurrence: One-time Originator: Lina Alvarez Category: Carryover Estimated Costs by Fiscal Year FY 2016 FY 2017 FY 2018 FY 2019 FY 2020 TOTAL $87,500 $0 $0 $0 $0 $87,500 Description: Architectural and engineering design services of the Operations Service Center to be located on FM 511. Note: $87,500 is the FY 2015 carryover amount. Project Cost Savings & Revenues: N/A PROJECT REFERENCE C1 MeterSense (AMI software application) Organization: 6135 CIS Support Funding Source: Improvement Project Related to: Growth Project Considered: Must Do Project Occurrence: One-time Originator: Norma Gomez Category: Resubmission Estimated Costs by Fiscal Year FY 2016 FY 2017 FY 2018 FY 2019 FY 2020 TOTAL $0 $0 $0 $0 $412,350 $412,350 Description: Full acquisition and integration of MeterSense software with Cayenta Utilities. MeterSense will be the master data repository software to hold all interval data for electric and water meters that are part of the Pilot AMI Project or any additional meter installation through the AMI Program. Project Cost Savings & Revenues: Savings on Meter Reader and Meter Service Technician Personnel site visit to location. Fuel and Vehicle Maintenance saving since truck roll will not be needed.

FIVE-YEAR CAPITAL IMPROVEMENTS PLAN SUMMARY ELECTRIC, WATER AND WASTEWATER
FY 2016 – FY 2020
- 242 -
PROJECT REFERENCE G6 Blade Servers Project Organization: 7130 Information Technology Funding Source: Improvement Project Related to: Growth Project Considered: Must Do Project Occurrence: One-time Originator: Sergio Martinez Category: Carryover Estimated Costs by Fiscal Year FY 2016 FY 2017 FY 2018 FY 2019 FY 2020 TOTAL $200,000 $0 $0 $0 $0 $200,000 Description: Purchase and installation of a blades server system to store current software application and accommodate future growth. Note: $200,000 is the FY 2015 carryover amount. Project Cost Savings & Revenues: N/A PROJECT REFERENCE G7 Dell Modular Disk Storage Organization: 7130 Information Technology Funding Source: Improvement Project Related to: Growth Project Considered: Must Do Project Occurrence: One-time Originator: Sergio Martinez Category: New Estimated Costs by Fiscal Year FY 2016 FY 2017 FY 2018 FY 2019 FY 2020 TOTAL $60,000 $0 $0 $0 $0 $60,000 Description: Users need more space to place data. Additional disk space is also needed for new employees and system growth. Project Cost Savings & Revenues: N/A

FIVE-YEAR CAPITAL IMPROVEMENTS PLAN SUMMARY ELECTRIC, WATER AND WASTEWATER
FY 2016 – FY 2020
- 243 -
PROJECT REFERENCE G8 Enterprise Backup Appliance DR4100 Organization: 7130 Information Technology Funding Source: Improvement Project Related to: Growth Project Considered: Must Do Project Occurrence: One-time Originator: Sergio Martinez Category: New Estimated Costs by Fiscal Year FY 2016 FY 2017 FY 2018 FY 2019 FY 2020 TOTAL $0 $60,000 $0 $0 $0 $60,000 Description: This appliance will be used to backup enterprise systems used throughout the organization and allow those systems to be stored at the power plant facility. Project Cost Savings & Revenues: N/A PROJECT REFERENCE G9 ArcMail Appliance & Email Archive Organization: 7130 Information Technology Funding Source: Improvement Project Related to: Replacements/Upgrades/Rehabilitation Project Considered: Load/Capacity Relief Project Occurrence: One-time Originator: Sergio Martinez Category: Resubmission Estimated Costs by Fiscal Year FY 2016 FY 2017 FY 2018 FY 2019 FY 2020 TOTAL $50,000 $0 $0 $0 $0 $50,000 Description: Archive and application for e-mail enterprise. Project Cost Savings & Revenues: N/A
FIVE-YEAR CAPITAL IMPROVEMENTS PLAN SUMMARY ELECTRIC, WATER AND WASTEWATER
FY 2016 – FY 2020
- 244 -
PROJECT REFERENCE G10 Fax over Internet Protocol Organization: 7130 Information Technology Funding Source: Improvement Project Related to: Replacements/Upgrades/Rehabilitation Project Considered: Reliability Project Occurrence: One-time Originator: Sergio Martinez Category: New Estimated Costs by Fiscal Year FY 2016 FY 2017 FY 2018 FY 2019 FY 2020 TOTAL $0 $10,000 $0 $0 $0 $10,000 Description: Fax over Internet Protocol is needed since most telephone provider’s communication is moving away from analog telephone lines. Faxing is still heavily used in the health and safety, purchasing, and customer service departments. Project Cost Savings & Revenues: N/A PROJECT REFERENCE G11 Document Management Software Hardware and Implementation Organization: 7130 Information Technology Funding Source: Improvement Project Related to: Growth Project Considered: Must Do Project Occurrence: One-time Originator: Sergio Martinez Category: Resubmission Estimated Costs by Fiscal Year FY 2016 FY 2017 FY 2018 FY 2019 FY 2020 TOTAL $0 $50,000 $0 $0 $0 $50,000 Description: Implementation of document management system as per records retention study (server and disk). Project Cost Savings & Revenues: N/A
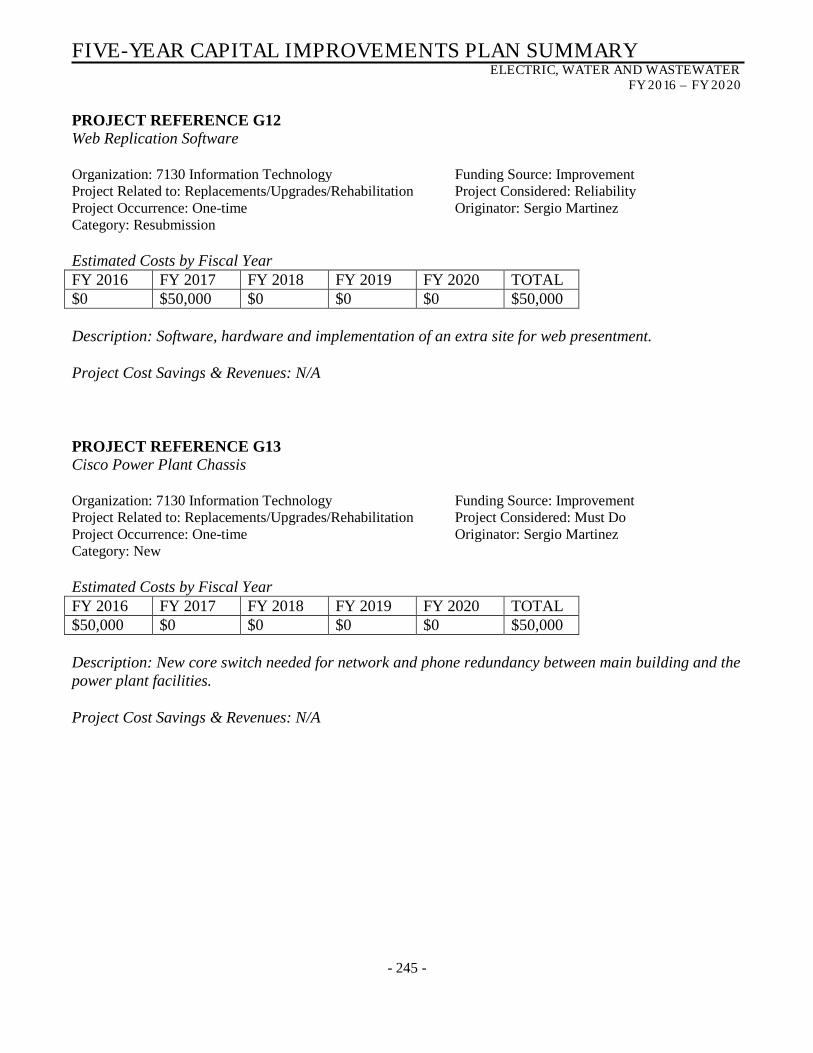
FIVE-YEAR CAPITAL IMPROVEMENTS PLAN SUMMARY ELECTRIC, WATER AND WASTEWATER
FY 2016 – FY 2020
- 245 -
PROJECT REFERENCE G12 Web Replication Software Organization: 7130 Information Technology Funding Source: Improvement Project Related to: Replacements/Upgrades/Rehabilitation Project Considered: Reliability Project Occurrence: One-time Originator: Sergio Martinez Category: Resubmission Estimated Costs by Fiscal Year FY 2016 FY 2017 FY 2018 FY 2019 FY 2020 TOTAL $0 $50,000 $0 $0 $0 $50,000 Description: Software, hardware and implementation of an extra site for web presentment. Project Cost Savings & Revenues: N/A PROJECT REFERENCE G13 Cisco Power Plant Chassis Organization: 7130 Information Technology Funding Source: Improvement Project Related to: Replacements/Upgrades/Rehabilitation Project Considered: Must Do Project Occurrence: One-time Originator: Sergio Martinez Category: New Estimated Costs by Fiscal Year FY 2016 FY 2017 FY 2018 FY 2019 FY 2020 TOTAL $50,000 $0 $0 $0 $0 $50,000 Description: New core switch needed for network and phone redundancy between main building and the power plant facilities. Project Cost Savings & Revenues: N/A

FIVE-YEAR CAPITAL IMPROVEMENTS PLAN SUMMARY ELECTRIC, WATER AND WASTEWATER
FY 2016 – FY 2020
- 246 -
PROJECT REFERENCE G14 Wireless Controller Organization: 7130 Information Technology Funding Source: Improvement Project Related to: Replacements/Upgrades/Rehabilitation Project Considered: Must Do Project Occurrence: One-time Originator: Sergio Martinez Category: New Estimated Costs by Fiscal Year FY 2016 FY 2017 FY 2018 FY 2019 FY 2020 TOTAL $40,000 $0 $0 $0 $0 $40,000 Description: Current wireless controller is no longer supported and issues are starting to arise. These issues are affecting user functionality. Project Cost Savings & Revenues: N/A PROJECT REFERENCE G15 SCADA Uninterruptable Power Supply Organization: 7130 Information Technology Funding Source: Improvement Project Related to: Growth Project Considered: Must Do Project Occurrence: One-time Originator: Sergio Martinez Category: New Estimated Costs by Fiscal Year FY 2016 FY 2017 FY 2018 FY 2019 FY 2020 TOTAL $15,000 $0 $0 $0 $0 $15,000 Description: This hardware will sustain power for the SCADA network facilities in the event of a natural disaster or hardware failure. Project Cost Savings & Revenues: N/A
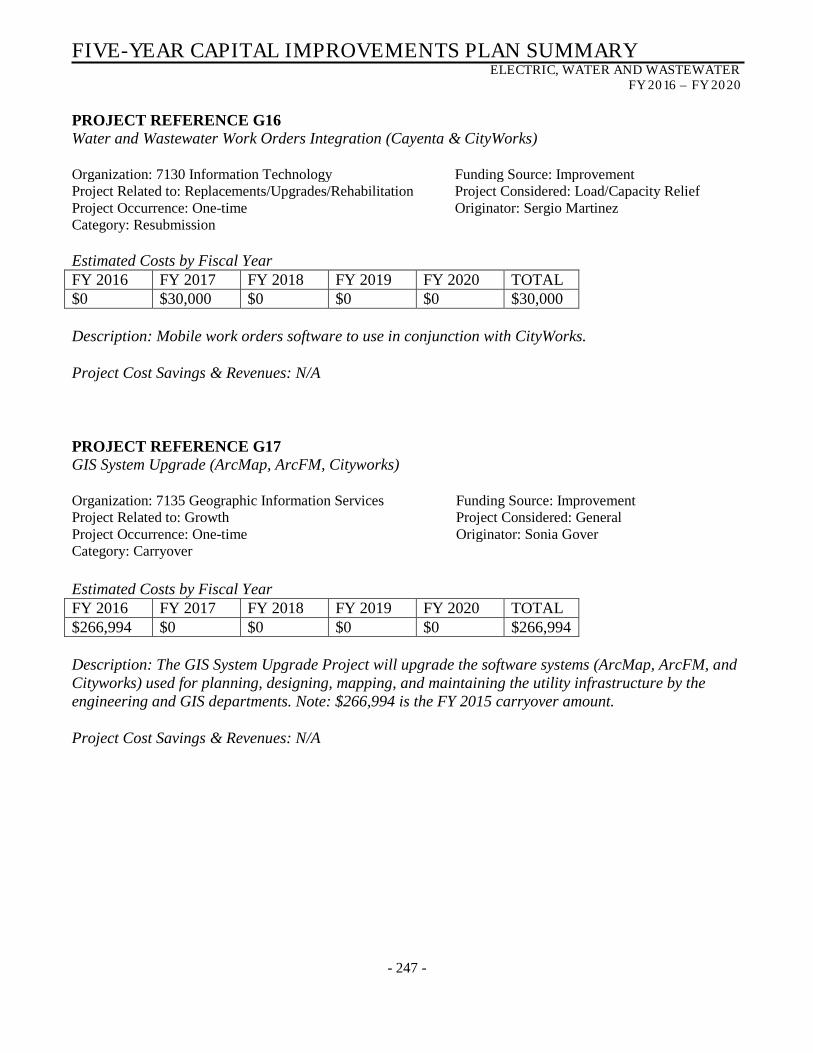
FIVE-YEAR CAPITAL IMPROVEMENTS PLAN SUMMARY ELECTRIC, WATER AND WASTEWATER
FY 2016 – FY 2020
- 247 -
PROJECT REFERENCE G16 Water and Wastewater Work Orders Integration (Cayenta & CityWorks) Organization: 7130 Information Technology Funding Source: Improvement Project Related to: Replacements/Upgrades/Rehabilitation Project Considered: Load/Capacity Relief Project Occurrence: One-time Originator: Sergio Martinez Category: Resubmission Estimated Costs by Fiscal Year FY 2016 FY 2017 FY 2018 FY 2019 FY 2020 TOTAL $0 $30,000 $0 $0 $0 $30,000 Description: Mobile work orders software to use in conjunction with CityWorks. Project Cost Savings & Revenues: N/A PROJECT REFERENCE G17 GIS System Upgrade (ArcMap, ArcFM, Cityworks) Organization: 7135 Geographic Information Services Funding Source: Improvement Project Related to: Growth Project Considered: General Project Occurrence: One-time Originator: Sonia Gover Category: Carryover Estimated Costs by Fiscal Year FY 2016 FY 2017 FY 2018 FY 2019 FY 2020 TOTAL $266,994 $0 $0 $0 $0 $266,994 Description: The GIS System Upgrade Project will upgrade the software systems (ArcMap, ArcFM, and Cityworks) used for planning, designing, mapping, and maintaining the utility infrastructure by the engineering and GIS departments. Note: $266,994 is the FY 2015 carryover amount. Project Cost Savings & Revenues: N/A

FIVE-YEAR CAPITAL IMPROVEMENTS PLAN SUMMARY ELECTRIC, WATER AND WASTEWATER
FY 2016 – FY 2020
- 248 -
PROJECT REFERENCE G18 LandWorks Property Management Implementation Services Organization: 7135 Geographic Information Services Funding Source: Improvement Project Related to: Growth Project Considered: General Project Occurrence: One-time Originator: Sonia Gover Category: New Estimated Costs by Fiscal Year FY 2016 FY 2017 FY 2018 FY 2019 FY 2020 TOTAL $125,000 $0 $0 $0 $0 $125,000 Description: LandWorks Implementation Services is a new system that will be used for property management. Project Cost Savings & Revenues: Right-of-way personnel level of efficiency will increase in the areas of negotiations, easements, relocations, appraisals, utility acquisitions and adjustments, land leasing, water rights leasing, water right purchases and real estate purchases. PROJECT REFERENCE G19 Human Resources Information System (HRIS) Software Organization: 7140 Human Resources Funding Source: Improvement Project Related to: Replacements/Upgrades/Rehabilitation Project Considered: General Project Occurrence: One-time Originator: Emilia Guerra Category: Resubmission Estimated Costs by Fiscal Year FY 2016 FY 2017 FY 2018 FY 2019 FY 2020 TOTAL $65,000 $65,000 $65,000 $0 $0 $195,000 Description: Purchase of new HR Software to include an applicant tracking system. Project Cost Savings & Revenues: Savings will be in HR Staff time and productivity. This could help reduce HR overtime costs.

FIVE-YEAR CAPITAL IMPROVEMENTS PLAN SUMMARY ELECTRIC, WATER AND WASTEWATER
FY 2016 – FY 2020
- 249 -
PROJECT REFERENCE G20 Fuel Tank Maintenance & Replacement Organization: 7150 Fleet Management Funding Source: Improvement Project Related to: Replacements/Upgrades/Rehabilitation Project Considered: Must Do Project Occurrence: One-time Originator: Hector Quintanilla Category: New Estimated Costs by Fiscal Year FY 2016 FY 2017 FY 2018 FY 2019 FY 2020 TOTAL $25,000 $0 $0 $0 $0 $25,000 Description: Replacement of gasoline and diesel pumps as well as maintenance of the gasoline tanks. Project Cost Savings & Revenues: N/A PROJECT REFERENCE G21 Security System Upgrade Organization: 7160 Facility Maintenance Funding Source: Improvement Project Related to: Replacements/Upgrades/Rehabilitation Project Considered: Reliability Project Occurrence: One-time Originator: Steven Lucero Category: New Estimated Costs by Fiscal Year FY 2016 FY 2017 FY 2018 FY 2019 FY 2020 TOTAL $130,000 $0 $0 $0 $0 $130,000 Description: Replace obsolete security alarm panel and key pads, make conversion from phone line to cellular monitoring communication, replace/upgrade obsolete fire panel, replace parking security cameras and add cameras to the new overflow parking area. Project Cost Savings & Revenues: Cost savings will occur as a result of not having to call service out for equipment that is down; piece-by-piece purchases are more costly than a blanket purchase.

FIVE-YEAR CAPITAL IMPROVEMENTS PLAN SUMMARY ELECTRIC, WATER AND WASTEWATER
FY 2016 – FY 2020
- 250 -
PROJECT REFERENCE G22 Facilities Storage Shed Organization: 7160 Facility Maintenance Funding Source: Improvement Project Related to: Growth Project Considered: Must Do Project Occurrence: One-time Originator: Steven Lucero Category: New Estimated Costs by Fiscal Year FY 2016 FY 2017 FY 2018 FY 2019 FY 2020 TOTAL $5,000 $0 $0 $0 $0 $5,000 Description: Purchase and install a shed to store custodial equipment and supplies. Project Cost Savings & Revenues: N/A PROJECT REFERENCE G23 Warehouse & Purchasing Roof Replacement Project Organization: 7170 Warehouse Funding Source: Improvement Project Related to: Replacements/Upgrades/Rehabilitation Project Considered: Must Do Project Occurrence: One-time Originator: Diane Solitaire Category: Carryover Estimated Costs by Fiscal Year FY 2016 FY 2017 FY 2018 FY 2019 FY 2020 TOTAL $187,500 $0 $0 $0 $0 $187,500 Description: Replacement of the roof for the Warehouse/Purchasing Building. Note: $187,500 is the FY 2015 carryover amount. Project Cost Savings & Revenues: N/A
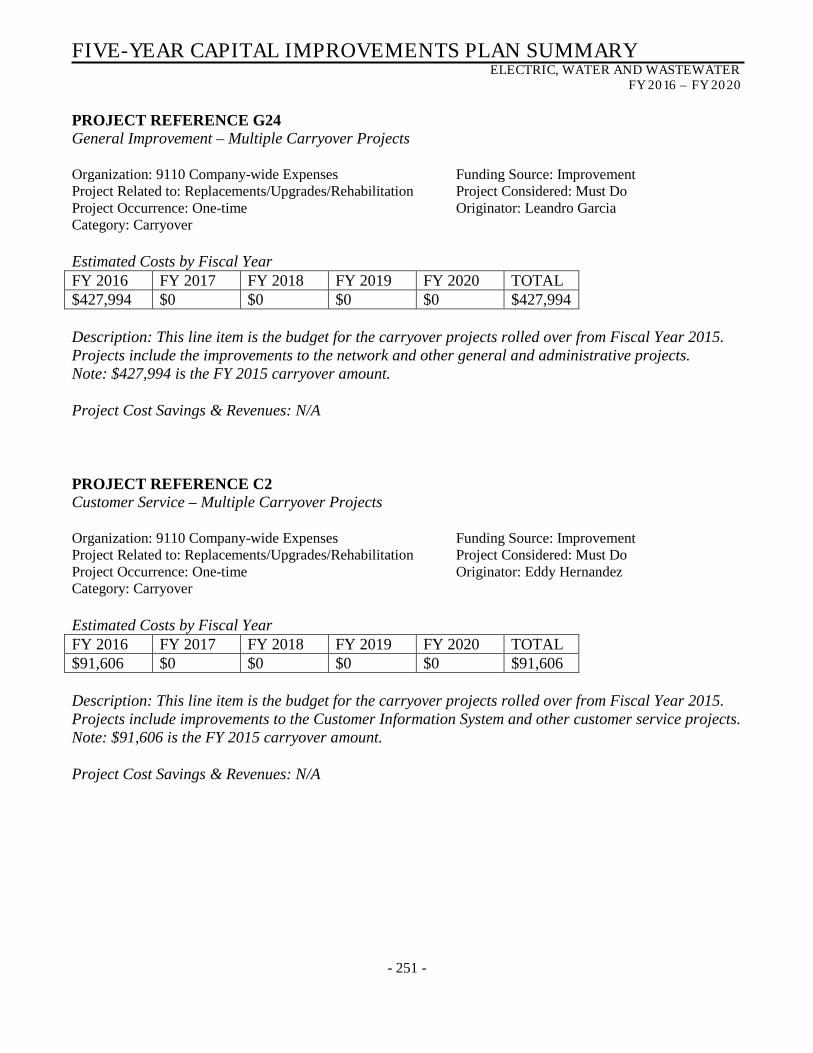
FIVE-YEAR CAPITAL IMPROVEMENTS PLAN SUMMARY ELECTRIC, WATER AND WASTEWATER
FY 2016 – FY 2020
- 251 -
PROJECT REFERENCE G24 General Improvement – Multiple Carryover Projects Organization: 9110 Company-wide Expenses Funding Source: Improvement Project Related to: Replacements/Upgrades/Rehabilitation Project Considered: Must Do Project Occurrence: One-time Originator: Leandro Garcia Category: Carryover Estimated Costs by Fiscal Year FY 2016 FY 2017 FY 2018 FY 2019 FY 2020 TOTAL $427,994 $0 $0 $0 $0 $427,994 Description: This line item is the budget for the carryover projects rolled over from Fiscal Year 2015. Projects include the improvements to the network and other general and administrative projects. Note: $427,994 is the FY 2015 carryover amount. Project Cost Savings & Revenues: N/A PROJECT REFERENCE C2 Customer Service – Multiple Carryover Projects Organization: 9110 Company-wide Expenses Funding Source: Improvement Project Related to: Replacements/Upgrades/Rehabilitation Project Considered: Must Do Project Occurrence: One-time Originator: Eddy Hernandez Category: Carryover Estimated Costs by Fiscal Year FY 2016 FY 2017 FY 2018 FY 2019 FY 2020 TOTAL $91,606 $0 $0 $0 $0 $91,606 Description: This line item is the budget for the carryover projects rolled over from Fiscal Year 2015. Projects include improvements to the Customer Information System and other customer service projects. Note: $91,606 is the FY 2015 carryover amount. Project Cost Savings & Revenues: N/A
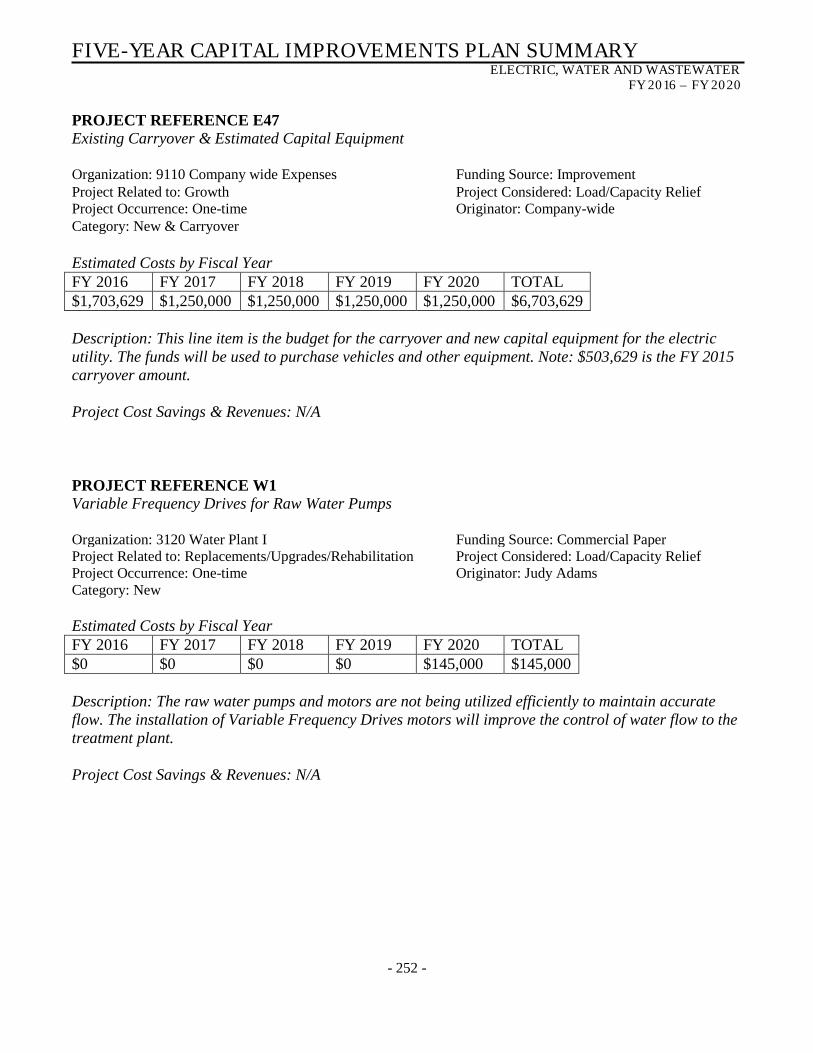
FIVE-YEAR CAPITAL IMPROVEMENTS PLAN SUMMARY ELECTRIC, WATER AND WASTEWATER
FY 2016 – FY 2020
- 252 -
PROJECT REFERENCE E47 Existing Carryover & Estimated Capital Equipment Organization: 9110 Company wide Expenses Funding Source: Improvement Project Related to: Growth Project Considered: Load/Capacity Relief Project Occurrence: One-time Originator: Company-wide Category: New & Carryover Estimated Costs by Fiscal Year FY 2016 FY 2017 FY 2018 FY 2019 FY 2020 TOTAL $1,703,629 $1,250,000 $1,250,000 $1,250,000 $1,250,000 $6,703,629 Description: This line item is the budget for the carryover and new capital equipment for the electric utility. The funds will be used to purchase vehicles and other equipment. Note: $503,629 is the FY 2015 carryover amount. Project Cost Savings & Revenues: N/A PROJECT REFERENCE W1 Variable Frequency Drives for Raw Water Pumps Organization: 3120 Water Plant I Funding Source: Commercial Paper Project Related to: Replacements/Upgrades/Rehabilitation Project Considered: Load/Capacity Relief Project Occurrence: One-time Originator: Judy Adams Category: New Estimated Costs by Fiscal Year FY 2016 FY 2017 FY 2018 FY 2019 FY 2020 TOTAL $0 $0 $0 $0 $145,000 $145,000 Description: The raw water pumps and motors are not being utilized efficiently to maintain accurate flow. The installation of Variable Frequency Drives motors will improve the control of water flow to the treatment plant. Project Cost Savings & Revenues: N/A
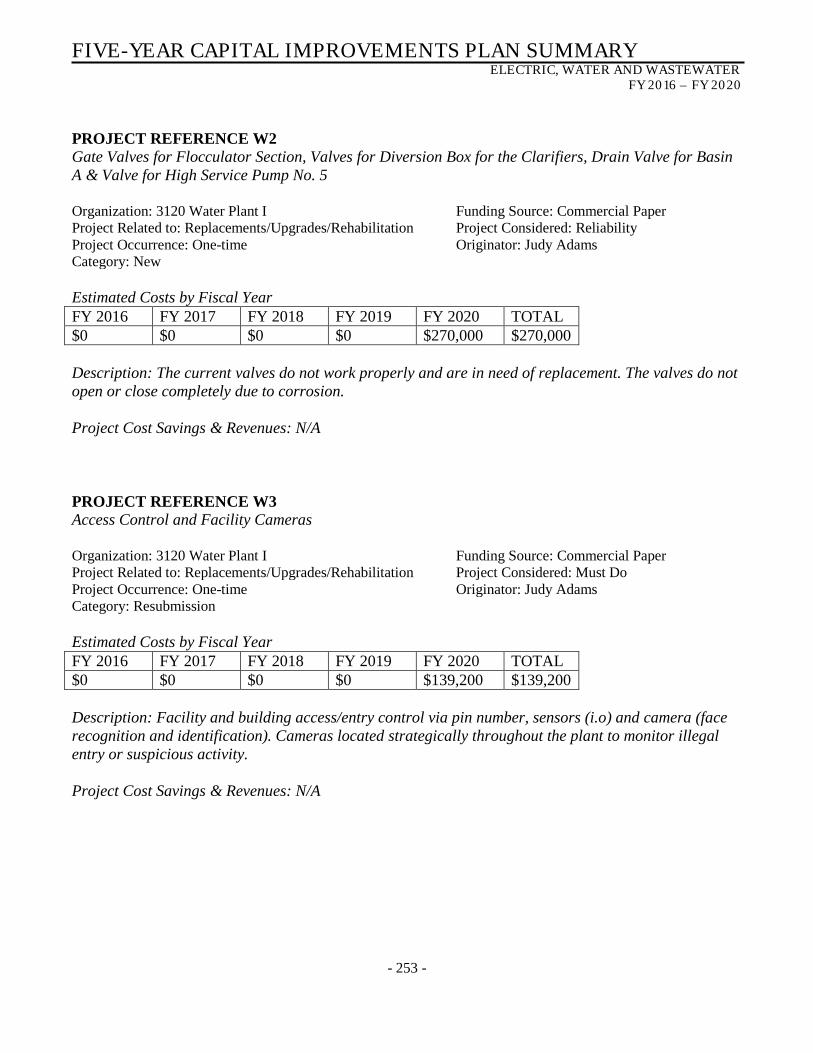
FIVE-YEAR CAPITAL IMPROVEMENTS PLAN SUMMARY ELECTRIC, WATER AND WASTEWATER
FY 2016 – FY 2020
- 253 -
PROJECT REFERENCE W2 Gate Valves for Flocculator Section, Valves for Diversion Box for the Clarifiers, Drain Valve for Basin A & Valve for High Service Pump No. 5 Organization: 3120 Water Plant I Funding Source: Commercial Paper Project Related to: Replacements/Upgrades/Rehabilitation Project Considered: Reliability Project Occurrence: One-time Originator: Judy Adams Category: New Estimated Costs by Fiscal Year FY 2016 FY 2017 FY 2018 FY 2019 FY 2020 TOTAL $0 $0 $0 $0 $270,000 $270,000 Description: The current valves do not work properly and are in need of replacement. The valves do not open or close completely due to corrosion. Project Cost Savings & Revenues: N/A PROJECT REFERENCE W3 Access Control and Facility Cameras Organization: 3120 Water Plant I Funding Source: Commercial Paper Project Related to: Replacements/Upgrades/Rehabilitation Project Considered: Must Do Project Occurrence: One-time Originator: Judy Adams Category: Resubmission Estimated Costs by Fiscal Year FY 2016 FY 2017 FY 2018 FY 2019 FY 2020 TOTAL $0 $0 $0 $0 $139,200 $139,200 Description: Facility and building access/entry control via pin number, sensors (i.o) and camera (face recognition and identification). Cameras located strategically throughout the plant to monitor illegal entry or suspicious activity. Project Cost Savings & Revenues: N/A

FIVE-YEAR CAPITAL IMPROVEMENTS PLAN SUMMARY ELECTRIC, WATER AND WASTEWATER
FY 2016 – FY 2020
- 254 -
PROJECT REFERENCE W4 Ammonia Conversion from Gas to Liquid Organization: 3120 Water Plant I Funding Source: Commercial Paper Project Related to: Replacements/Upgrades/Rehabilitation Project Considered: Must Do Project Occurrence: One-time Originator: Judy Adams Category: Resubmission Estimated Costs by Fiscal Year FY 2016 FY 2017 FY 2018 FY 2019 FY 2020 TOTAL $0 $0 $0 $0 $261,000 $261,000 Description: Anhydrous ammonia is used in the water treatment process to form chloramines. Chloramines are formed by mixing ammonia and chlorine. Chloramines are the main disinfectants in the water treatment process and distribution system. The ammonia the plants currently handle is in a gaseous form; staff is recommending changing the ammonia state to a liquid form, which is safer to handle. Project Cost Savings & Revenues: N/A PROJECT REFERENCE W5 Chlorine Ton Container Emergency Shutdown System Organization: 3120 Water Plant I Funding Source: Commercial Paper Project Related to: Replacements/Upgrades/Rehabilitation Project Considered: Must Do Project Occurrence: One-time Originator: Judy Adams Category: Resubmission Estimated Costs by Fiscal Year FY 2016 FY 2017 FY 2018 FY 2019 FY 2020 TOTAL $0 $0 $0 $0 $40,000 $40,000 Description: Purchase of chlorine ton container emergency shutdown system (Model 2000C-X3500 Actuator) to replace existing system. Project Cost Savings & Revenues: N/A

FIVE-YEAR CAPITAL IMPROVEMENTS PLAN SUMMARY ELECTRIC, WATER AND WASTEWATER
FY 2016 – FY 2020
- 255 -
PROJECT REFERENCE W6 Replacement of Windows Organization: 3120 Water Plant I Funding Source: Commercial Paper Project Related to: Replacements/Upgrades/Rehabilitation Project Considered: Must Do Project Occurrence: One-time Originator: Judy Adams Category: New Estimated Costs by Fiscal Year FY 2016 FY 2017 FY 2018 FY 2019 FY 2020 TOTAL $0 $0 $0 $0 $104,768 $104,768 Description: Water penetrates through the bottom sections of the window. They will be replaced with a 9/16 clear laminated impact glass and clear-finished anodized aluminum. Project Cost Savings & Revenues: N/A PROJECT REFERENCE W7 Aerator Structure Rehabilitation Organization: 3130 Water Plant II Funding Source: Commercial Paper Project Related to: Replacements/Upgrades/Rehabilitation Project Considered: Must Do Project Occurrence: One-time Originator: Judy Adams Category: New Estimated Costs by Fiscal Year FY 2016 FY 2017 FY 2018 FY 2019 FY 2020 TOTAL $0 $0 $0 $0 $348,000 $348,000 Description: There are signs of deterioration in the aerator basin with visible cracks and exposed rebar in areas. Project Cost Savings & Revenues: N/A
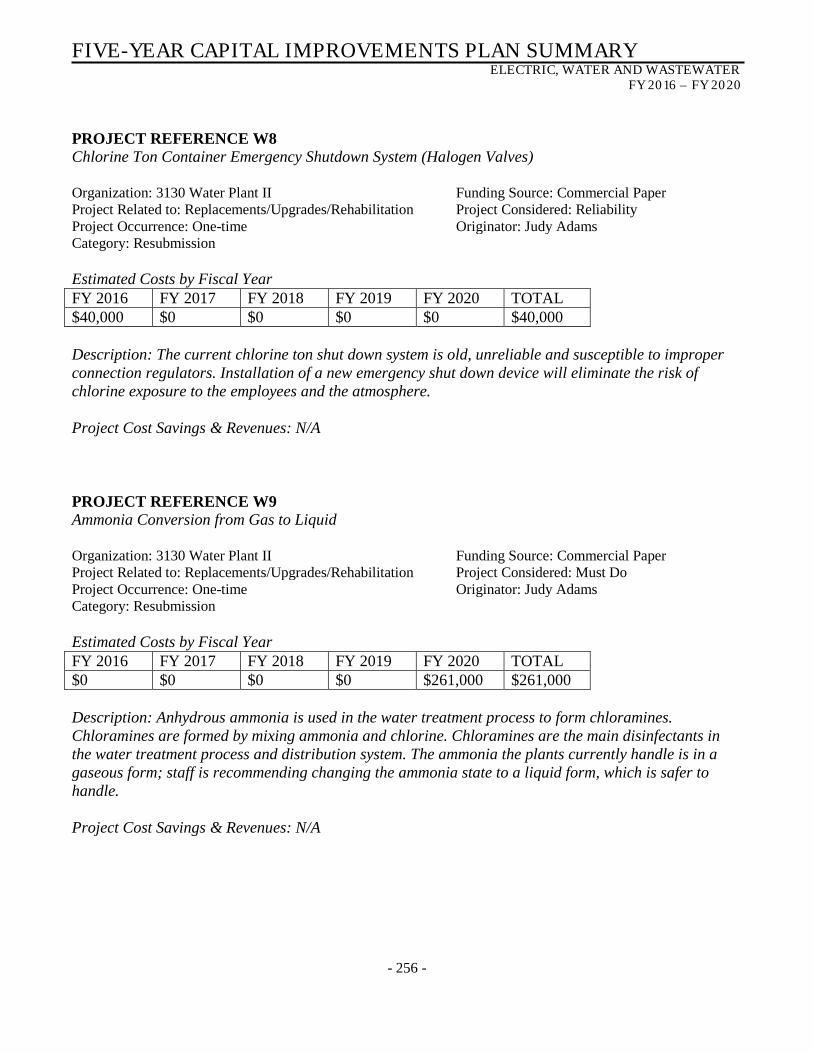
FIVE-YEAR CAPITAL IMPROVEMENTS PLAN SUMMARY ELECTRIC, WATER AND WASTEWATER
FY 2016 – FY 2020
- 256 -
PROJECT REFERENCE W8 Chlorine Ton Container Emergency Shutdown System (Halogen Valves) Organization: 3130 Water Plant II Funding Source: Commercial Paper Project Related to: Replacements/Upgrades/Rehabilitation Project Considered: Reliability Project Occurrence: One-time Originator: Judy Adams Category: Resubmission Estimated Costs by Fiscal Year FY 2016 FY 2017 FY 2018 FY 2019 FY 2020 TOTAL $40,000 $0 $0 $0 $0 $40,000 Description: The current chlorine ton shut down system is old, unreliable and susceptible to improper connection regulators. Installation of a new emergency shut down device will eliminate the risk of chlorine exposure to the employees and the atmosphere. Project Cost Savings & Revenues: N/A PROJECT REFERENCE W9 Ammonia Conversion from Gas to Liquid Organization: 3130 Water Plant II Funding Source: Commercial Paper Project Related to: Replacements/Upgrades/Rehabilitation Project Considered: Must Do Project Occurrence: One-time Originator: Judy Adams Category: Resubmission Estimated Costs by Fiscal Year FY 2016 FY 2017 FY 2018 FY 2019 FY 2020 TOTAL $0 $0 $0 $0 $261,000 $261,000 Description: Anhydrous ammonia is used in the water treatment process to form chloramines. Chloramines are formed by mixing ammonia and chlorine. Chloramines are the main disinfectants in the water treatment process and distribution system. The ammonia the plants currently handle is in a gaseous form; staff is recommending changing the ammonia state to a liquid form, which is safer to handle. Project Cost Savings & Revenues: N/A

FIVE-YEAR CAPITAL IMPROVEMENTS PLAN SUMMARY ELECTRIC, WATER AND WASTEWATER
FY 2016 – FY 2020
- 257 -
PROJECT REFERENCE W10 Replacement of Chlorine Ton Scales Organization: 3130 Water Plant II Funding Source: Commercial Paper Project Related to: Replacements/Upgrades/Rehabilitation Project Considered: Reliability Project Occurrence: One-time Originator: Judy Adams Category: New Estimated Costs by Fiscal Year FY 2016 FY 2017 FY 2018 FY 2019 FY 2020 TOTAL $24,000 $0 $0 $0 $0 $24,000 Description: The existing chlorine ton scale frames are deteriorating and displays inaccurate readings. Project Cost Savings & Revenues: N/A PROJECT REFERENCE W11 Replacement of Isolation Valves Organization: 3130 Water Plant II Funding Source: Commercial Paper Project Related to: Replacements/Upgrades/Rehabilitation Project Considered: Reliability Project Occurrence: One-time Originator: Judy Adams Category: New Estimated Costs by Fiscal Year FY 2016 FY 2017 FY 2018 FY 2019 FY 2020 TOTAL $60,000 $0 $0 $0 $0 $60,000 Description: The 36” raw water isolation valve is broken in the open position; the east aerator isolation valve is broken in the open position; and the east sedimentation isolation valve is damaged to the point that it takes several operators to close it. Project Cost Savings & Revenues: N/A
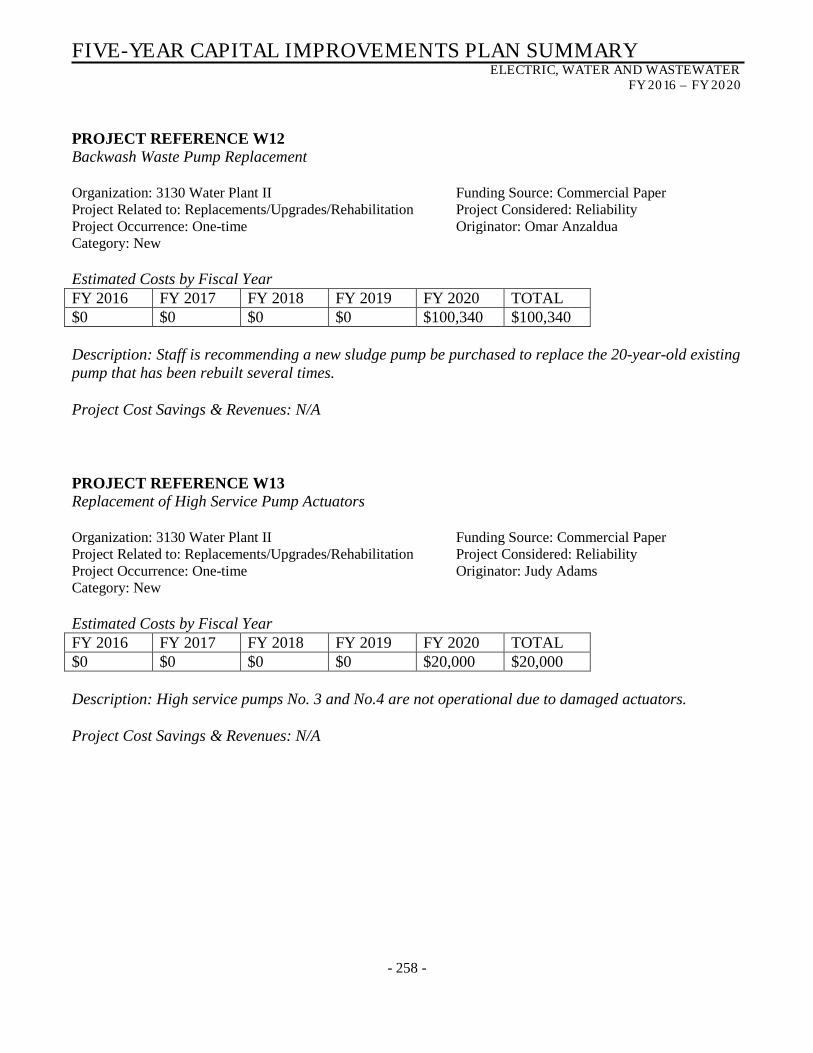
FIVE-YEAR CAPITAL IMPROVEMENTS PLAN SUMMARY ELECTRIC, WATER AND WASTEWATER
FY 2016 – FY 2020
- 258 -
PROJECT REFERENCE W12 Backwash Waste Pump Replacement Organization: 3130 Water Plant II Funding Source: Commercial Paper Project Related to: Replacements/Upgrades/Rehabilitation Project Considered: Reliability Project Occurrence: One-time Originator: Omar Anzaldua Category: New Estimated Costs by Fiscal Year FY 2016 FY 2017 FY 2018 FY 2019 FY 2020 TOTAL $0 $0 $0 $0 $100,340 $100,340 Description: Staff is recommending a new sludge pump be purchased to replace the 20-year-old existing pump that has been rebuilt several times. Project Cost Savings & Revenues: N/A PROJECT REFERENCE W13 Replacement of High Service Pump Actuators Organization: 3130 Water Plant II Funding Source: Commercial Paper Project Related to: Replacements/Upgrades/Rehabilitation Project Considered: Reliability Project Occurrence: One-time Originator: Judy Adams Category: New Estimated Costs by Fiscal Year FY 2016 FY 2017 FY 2018 FY 2019 FY 2020 TOTAL $0 $0 $0 $0 $20,000 $20,000 Description: High service pumps No. 3 and No.4 are not operational due to damaged actuators. Project Cost Savings & Revenues: N/A

FIVE-YEAR CAPITAL IMPROVEMENTS PLAN SUMMARY ELECTRIC, WATER AND WASTEWATER
FY 2016 – FY 2020
- 259 -
PROJECT REFERENCE W14 River Pump No. 1 Impeller Replacement Organization: 3140 Raw Water Supply Funding Source: Commercial Paper Project Related to: Replacements/Upgrades/Rehabilitation Project Considered: Must Do Project Occurrence: One-time Originator: Rene Mariscal Category: Resubmission Estimated Costs by Fiscal Year FY 2016 FY 2017 FY 2018 FY 2019 FY 2020 TOTAL $50,000 $0 $0 $0 $0 $50,000 Description: River pump impeller for River Pump No. 1. Project Cost Savings & Revenues: N/A PROJECT REFERENCE W15 Estimated carryover project amount Organization: 3310 Water & Wastewater Engineering Funding Source: Improvement Project Related to: Replacements/Upgrades/Rehabilitation Project Considered: Must Do Project Occurrence: One-time Originator: Omar Anzaldua Category: Carryover Estimated Costs by Fiscal Year FY 2016 FY 2017 FY 2018 FY 2019 FY 2020 TOTAL $399,622 $0 $0 $0 $0 $399,622 Description: This line item is the budget for the carryover projects rolled over from Fiscal Year 2015. Projects include water line utility improvements on Impala Court and in Cameron Park. Note: $399,622 is the FY 2015 carryover amount. Project Cost Savings & Revenues: N/A

FIVE-YEAR CAPITAL IMPROVEMENTS PLAN SUMMARY ELECTRIC, WATER AND WASTEWATER
FY 2016 – FY 2020
- 260 -
PROJECT REFERENCE W16 Filter System Rehabilitation Project at Water Treatment Plants No. 1 and No. 2 (Construction Phase) Organization: 3310 Water & Wastewater Engineering Funding Source: Improvement & Commercial
Paper Project Related to: Replacements/Upgrades/Rehabilitation Project Considered: Must Do Project Occurrence: One-time Originator: Sergio Espinoza Category: Carryover Estimated Costs by Fiscal Year FY 2016 FY 2017 FY 2018 FY 2019 FY 2020 TOTAL $5,000,605 $0 $0 $0 $0 $5,000,605 Description: This work includes replacement of filter under drains, filter media, coating the interior concrete of each filter cell, and installation of an air backwash system including piping, valves, and blowers, at each plant. A new motor and VFD will be installed at Water Treatment Plant No. 2’s High Service Pump Station. Note: $48,219 is from the Commercial Paper Fund. Project Cost Savings & Revenues: Water savings of 21 million gallons per year in addition to the energy savings generated by the addition of Variable Frequency Drives to the pumps. PROJECT REFERENCE W17 South Iowa COB and Utility Improvements Organization: 3310 Water & Wastewater Engineering Funding Source: Commercial Paper Project Related to: Replacements/Upgrades/Rehabilitation Project Considered: Reliability Project Occurrence: One-time Originator: David Abrego Category: Resubmission Estimated Costs by Fiscal Year FY 2016 FY 2017 FY 2018 FY 2019 FY 2020 TOTAL $0 $0 $0 $0 $348,685 $348,685 Description: This project is for the replacement of asbestos cement waterlines with polyvinyl chloride waterline on South Iowa from Billy Mitchell Blvd. to Boca Chica Blvd. Project Cost Savings & Revenues: The replacement of these items with polyvinyl chloride lines and new valves and services will reduce the need for maintenance and O&M costs.

FIVE-YEAR CAPITAL IMPROVEMENTS PLAN SUMMARY ELECTRIC, WATER AND WASTEWATER
FY 2016 – FY 2020
- 261 -
PROJECT REFERENCE W18 North Street COB and Utility Improvements Organization: 3310 Water & Wastewater Engineering Funding Source: Commercial Paper Project Related to: Replacements/Upgrades/Rehabilitation Project Considered: Reliability Project Occurrence: One-time Originator: David Abrego Category: Resubmission Estimated Costs by Fiscal Year FY 2016 FY 2017 FY 2018 FY 2019 FY 2020 TOTAL $0 $0 $0 $0 $343,381 $343,381 Description: This project is for the replacement of AC waterlines with PVC waterline on North Street from Boca Chica Blvd. to Rockwell Dr. Project Cost Savings & Revenues: The replacement of these items with PVC lines and new valves and services will reduce the need for maintenance and O&M costs. PROJECT REFERENCE W19 Southmost Blvd COB and Utility Improvements Organization: 3310 Water & Wastewater Engineering Funding Source: Commercial Paper Project Related to: Replacements/Upgrades/Rehabilitation Project Considered: Reliability Project Occurrence: One-time Originator: David Abrego Category: Resubmission Estimated Costs by Fiscal Year FY 2016 FY 2017 FY 2018 FY 2019 FY 2020 TOTAL $0 $0 $0 $0 $638,867 $638,867 Description: This project is for the replacement of AC waterlines with PVC waterline on Southmost Blvd. from International Blvd. to 14th Street. Project Cost Savings & Revenues: The replacement of these items with PVC lines and new valves and services will reduce the need for maintenance and O&M costs.
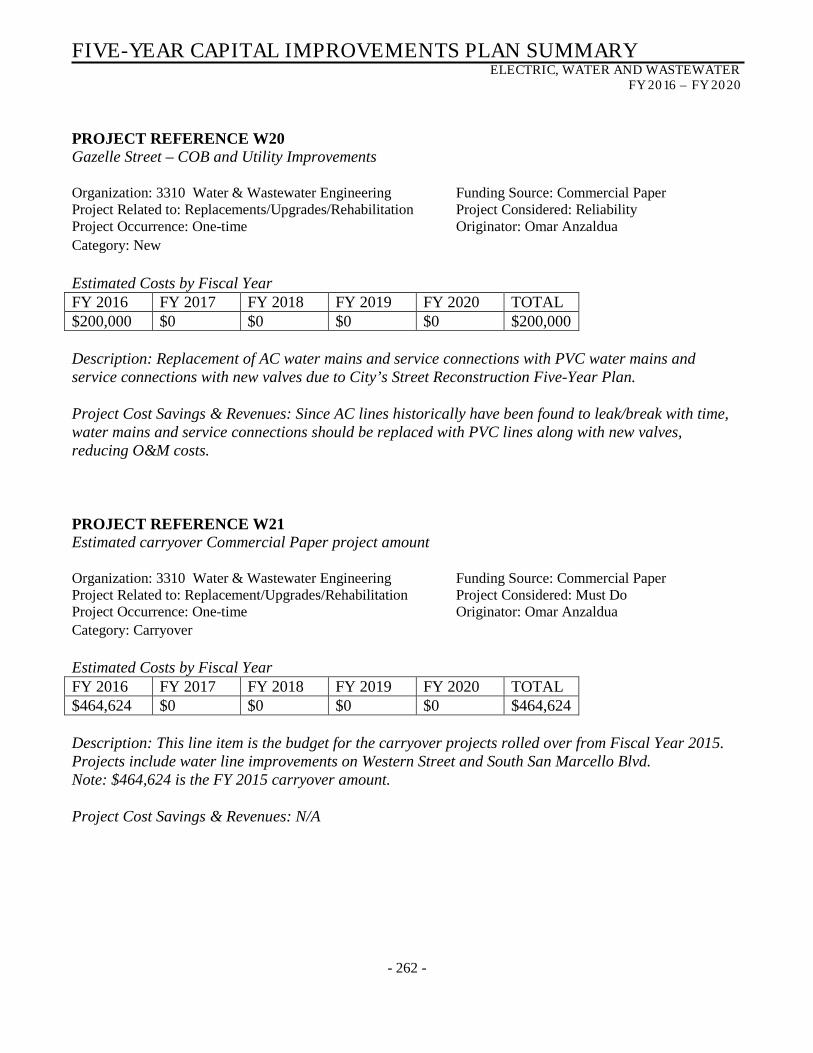
FIVE-YEAR CAPITAL IMPROVEMENTS PLAN SUMMARY ELECTRIC, WATER AND WASTEWATER
FY 2016 – FY 2020
- 262 -
PROJECT REFERENCE W20 Gazelle Street – COB and Utility Improvements Organization: 3310 Water & Wastewater Engineering Funding Source: Commercial Paper Project Related to: Replacements/Upgrades/Rehabilitation Project Considered: Reliability Project Occurrence: One-time Originator: Omar Anzaldua Category: New Estimated Costs by Fiscal Year FY 2016 FY 2017 FY 2018 FY 2019 FY 2020 TOTAL $200,000 $0 $0 $0 $0 $200,000 Description: Replacement of AC water mains and service connections with PVC water mains and service connections with new valves due to City’s Street Reconstruction Five-Year Plan. Project Cost Savings & Revenues: Since AC lines historically have been found to leak/break with time, water mains and service connections should be replaced with PVC lines along with new valves, reducing O&M costs. PROJECT REFERENCE W21 Estimated carryover Commercial Paper project amount Organization: 3310 Water & Wastewater Engineering Funding Source: Commercial Paper Project Related to: Replacement/Upgrades/Rehabilitation Project Considered: Must Do Project Occurrence: One-time Originator: Omar Anzaldua Category: Carryover Estimated Costs by Fiscal Year FY 2016 FY 2017 FY 2018 FY 2019 FY 2020 TOTAL $464,624 $0 $0 $0 $0 $464,624 Description: This line item is the budget for the carryover projects rolled over from Fiscal Year 2015. Projects include water line improvements on Western Street and South San Marcello Blvd. Note: $464,624 is the FY 2015 carryover amount. Project Cost Savings & Revenues: N/A
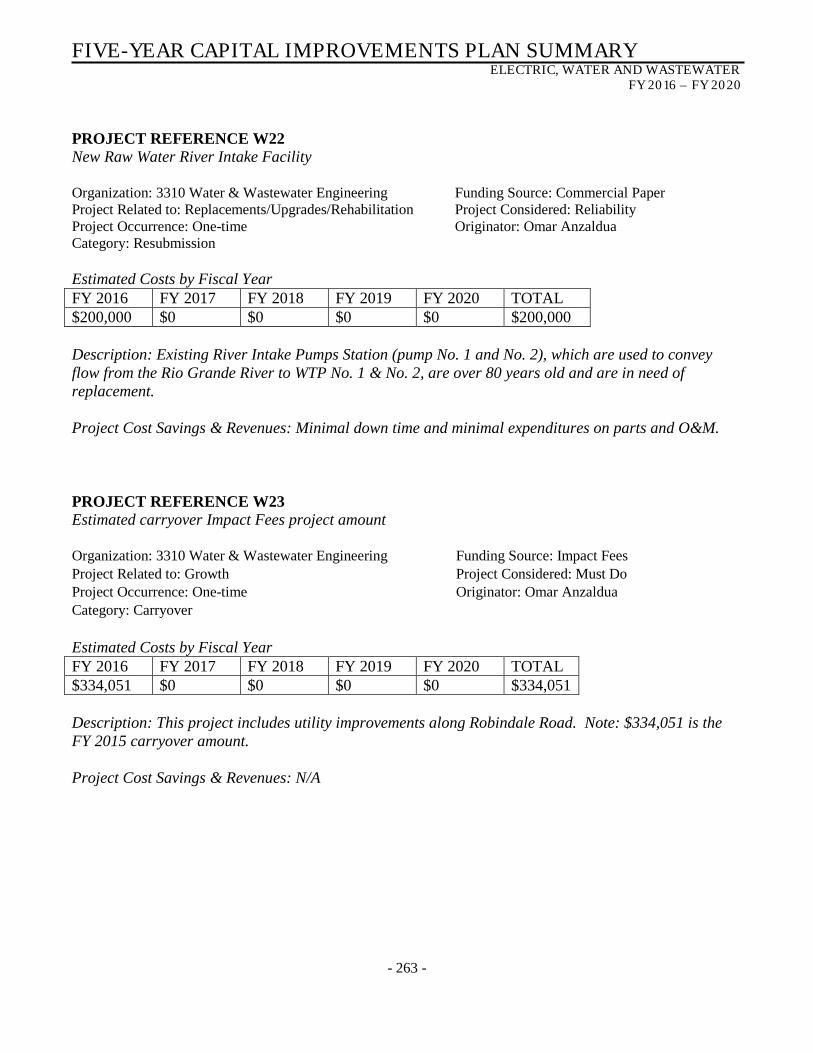
FIVE-YEAR CAPITAL IMPROVEMENTS PLAN SUMMARY ELECTRIC, WATER AND WASTEWATER
FY 2016 – FY 2020
- 263 -
PROJECT REFERENCE W22 New Raw Water River Intake Facility Organization: 3310 Water & Wastewater Engineering Funding Source: Commercial Paper Project Related to: Replacements/Upgrades/Rehabilitation Project Considered: Reliability Project Occurrence: One-time Originator: Omar Anzaldua Category: Resubmission Estimated Costs by Fiscal Year FY 2016 FY 2017 FY 2018 FY 2019 FY 2020 TOTAL $200,000 $0 $0 $0 $0 $200,000 Description: Existing River Intake Pumps Station (pump No. 1 and No. 2), which are used to convey flow from the Rio Grande River to WTP No. 1 & No. 2, are over 80 years old and are in need of replacement. Project Cost Savings & Revenues: Minimal down time and minimal expenditures on parts and O&M. PROJECT REFERENCE W23 Estimated carryover Impact Fees project amount Organization: 3310 Water & Wastewater Engineering Funding Source: Impact Fees Project Related to: Growth Project Considered: Must Do Project Occurrence: One-time Originator: Omar Anzaldua Category: Carryover Estimated Costs by Fiscal Year FY 2016 FY 2017 FY 2018 FY 2019 FY 2020 TOTAL $334,051 $0 $0 $0 $0 $334,051 Description: This project includes utility improvements along Robindale Road. Note: $334,051 is the FY 2015 carryover amount. Project Cost Savings & Revenues: N/A

FIVE-YEAR CAPITAL IMPROVEMENTS PLAN SUMMARY ELECTRIC, WATER AND WASTEWATER
FY 2016 – FY 2020
- 264 -
PROJECT REFERENCE W24 Martinal Area Waterline System Loops Organization: 3310 Water & Wastewater Engineering Funding Source: Impact Fees Project Related to: Replacements/Upgrades/Rehabilitation Project Considered: General Project Occurrence: One-time Originator: Omar Anzaldua Category: Resubmission Estimated Costs by Fiscal Year FY 2016 FY 2017 FY 2018 FY 2019 FY 2020 TOTAL $300,000 $300,000 $300,000 $215,000 $0 $1,115,000 Description: Design and construction of proposed waterlines to close loops within the water system between the areas of Old Port Isabel and Boca Chica along FM 802. Project Cost Savings & Revenues: N/A PROJECT REFERENCE W25 Concrete Steel Cylinder Waterline Upgrade from Boca Chica Blvd. (SH 48) to WTP No. 2 Organization: 3310 Water & Wastewater Engineering Funding Source: Impact Fees Project Related to: Growth Project Considered: Load/Capacity Relief Project Occurrence: One-time Originator: Omar Anzaldua Category: New Estimated Costs by Fiscal Year FY 2016 FY 2017 FY 2018 FY 2019 FY 2020 TOTAL $0 $0 $500,000 $963,000 $0 $1,463,000 Description: This project upgrades an existing 30-inch diameter concrete steel cylinder waterline to 36-inch diameter and 42-inch diameter concrete steel cylinder waterline to meet future required capacity in the eastern part of the water distribution system. Project Cost Savings & Revenues: N/A

FIVE-YEAR CAPITAL IMPROVEMENTS PLAN SUMMARY ELECTRIC, WATER AND WASTEWATER
FY 2016 – FY 2020
- 265 -
PROJECT REFERENCE W26 24-inch Waterline Loop along FM 511 from SRWA to Old Port Isabel Rd. Organization: 3310 Water & Wastewater Engineering Funding Source: Impact Fees Project Related to: Growth Project Considered: Load/Capacity Relief Project Occurrence: One-time Originator: Omar Anzaldua Category: New Estimated Costs by Fiscal Year FY 2016 FY 2017 FY 2018 FY 2019 FY 2020 TOTAL $0 $0 $0 $0 $8,368,000 $8,368,000 Description: This project is a segment of a 24-inch transmission waterline proposed from the Southmost Regional Water Authority (SRWA) Water Plant to the Port of Brownsville. This project will provide new service capabilities along FM 511 from Paredes Line Rd. to Dr. Hugh Emerson Rd. Project Cost Savings & Revenues: N/A PROJECT REFERENCE W27 16-inch Waterline Loop along FM 511 from SH 48 to Boca Chica Blvd. Organization: 3310 Water & Wastewater Engineering Funding Source: Impact Fees Project Related to: Growth Project Considered: Load/Capacity Relief Project Occurrence: One-time Originator: Omar Anzaldua Category: New Estimated Costs by Fiscal Year FY 2016 FY 2017 FY 2018 FY 2019 FY 2020 TOTAL $0 $0 $0 $2,900,000 $0 $2,900,000 Description: Construction of approximately 14,357 linear feet of 16-inch waterline to extend the Brownsville PUB transmission waterline loop to the southeastern part of the city. Project Cost Savings & Revenues: N/A

FIVE-YEAR CAPITAL IMPROVEMENTS PLAN SUMMARY ELECTRIC, WATER AND WASTEWATER
FY 2016 – FY 2020
- 266 -
PROJECT REFERENCE W28 16-inch Waterline Loop from Lago Vista to W. Alton Gloor Blvd. Organization: 3310 Water & Wastewater Engineering Funding Source: Impact Fee Project Related to: Growth Project Considered: Load/Capacity Relief Project Occurrence: One-time Originator: Omar Anzaldua Category: New Estimated Costs by Fiscal Year FY 2016 FY 2017 FY 2018 FY 2019 FY 2020 TOTAL $0 $0 $0 $2,268,000 $0 $2,268,000 Description: Construction of a new 16-inch diameter PVC waterline approximately 13,882 linear feet in length on the northwest part of the water distribution system to meet future demand. Project Cost Savings & Revenues: N/A PROJECT REFERENCE W29 16-inch Waterline on Boca Chica Blvd. from Owens Rd. to Iowa Ave. Organization: 3310 Water & Wastewater Engineering Funding Source: Impact Fees Project Related to: Growth Project Considered: Load/Capacity Relief Project Occurrence: One-time Originator: Omar Anzaldua Category: New Estimated Costs by Fiscal Year FY 2016 FY 2017 FY 2018 FY 2019 FY 2020 TOTAL $0 $0 $0 $1,850,000 $0 $1,850,000 Description: Upgrade an existing 12-inch AC waterline to 16-inch PVC waterline to meet expected demand. Project Cost Savings & Revenues: Since deteriorated AC lines typically require more maintenance/repair, there will be less O&M costs after replaced.
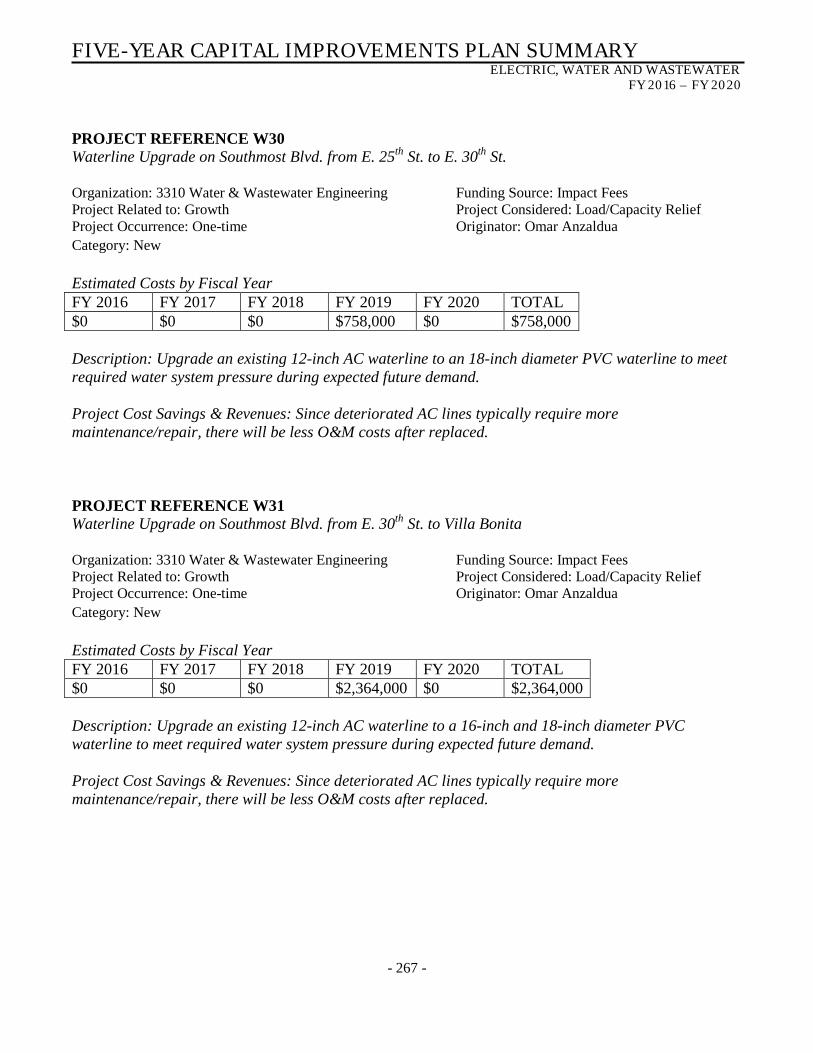
FIVE-YEAR CAPITAL IMPROVEMENTS PLAN SUMMARY ELECTRIC, WATER AND WASTEWATER
FY 2016 – FY 2020
- 267 -
PROJECT REFERENCE W30 Waterline Upgrade on Southmost Blvd. from E. 25th St. to E. 30th St. Organization: 3310 Water & Wastewater Engineering Funding Source: Impact Fees Project Related to: Growth Project Considered: Load/Capacity Relief Project Occurrence: One-time Originator: Omar Anzaldua Category: New Estimated Costs by Fiscal Year FY 2016 FY 2017 FY 2018 FY 2019 FY 2020 TOTAL $0 $0 $0 $758,000 $0 $758,000 Description: Upgrade an existing 12-inch AC waterline to an 18-inch diameter PVC waterline to meet required water system pressure during expected future demand. Project Cost Savings & Revenues: Since deteriorated AC lines typically require more maintenance/repair, there will be less O&M costs after replaced. PROJECT REFERENCE W31 Waterline Upgrade on Southmost Blvd. from E. 30th St. to Villa Bonita Organization: 3310 Water & Wastewater Engineering Funding Source: Impact Fees Project Related to: Growth Project Considered: Load/Capacity Relief Project Occurrence: One-time Originator: Omar Anzaldua Category: New Estimated Costs by Fiscal Year FY 2016 FY 2017 FY 2018 FY 2019 FY 2020 TOTAL $0 $0 $0 $2,364,000 $0 $2,364,000 Description: Upgrade an existing 12-inch AC waterline to a 16-inch and 18-inch diameter PVC waterline to meet required water system pressure during expected future demand. Project Cost Savings & Revenues: Since deteriorated AC lines typically require more maintenance/repair, there will be less O&M costs after replaced.

FIVE-YEAR CAPITAL IMPROVEMENTS PLAN SUMMARY ELECTRIC, WATER AND WASTEWATER
FY 2016 – FY 2020
- 268 -
PROJECT REFERENCE W32 Waterline Upgrade on Southmost Blvd. from E. 14th St. to E. 25th St. Organization: 3310 Water & Wastewater Engineering Funding Source: Impact Fees Project Related to: Growth Project Considered: Load/Capacity Relief Project Occurrence: One-time Originator: Omar Anzaldua Category: New Estimated Costs by Fiscal Year FY 2016 FY 2017 FY 2018 FY 2019 FY 2020 TOTAL $0 $0 $0 $1,575,000 $0 $1,575,000 Description: Upgrade an existing 12-inch diameter AC waterline with approximately 3,352 linear feet of 16-inch diameter PVC waterline and 870 linear feet of 18-inch diameter PVC waterline to attain water distribution to meet expected future demand. Project Cost Savings & Revenues: Since deteriorated AC lines typically require more maintenance/repair, there will be less O&M costs after replaced. PROJECT REFERENCE W33 18-inch Waterline along Old Hwy 77 and FM 511 to Old Alice Rd. Organization: 3310 Water & Wastewater Engineering Funding Source: Impact Fees Project Related to: Growth Project Considered: Load/Capacity Relief Project Occurrence: One-time Originator: Omar Anzaldua Category: New Estimated Costs by Fiscal Year FY 2016 FY 2017 FY 2018 FY 2019 FY 2020 TOTAL $0 $0 $0 $3,099,000 $0 $3,099,000 Description: This project proposes 12,698 linear feet of new 18-inch diameter waterline to meet required water system pressure to future demand located along FM 1732. Project Cost Savings & Revenues: N/A
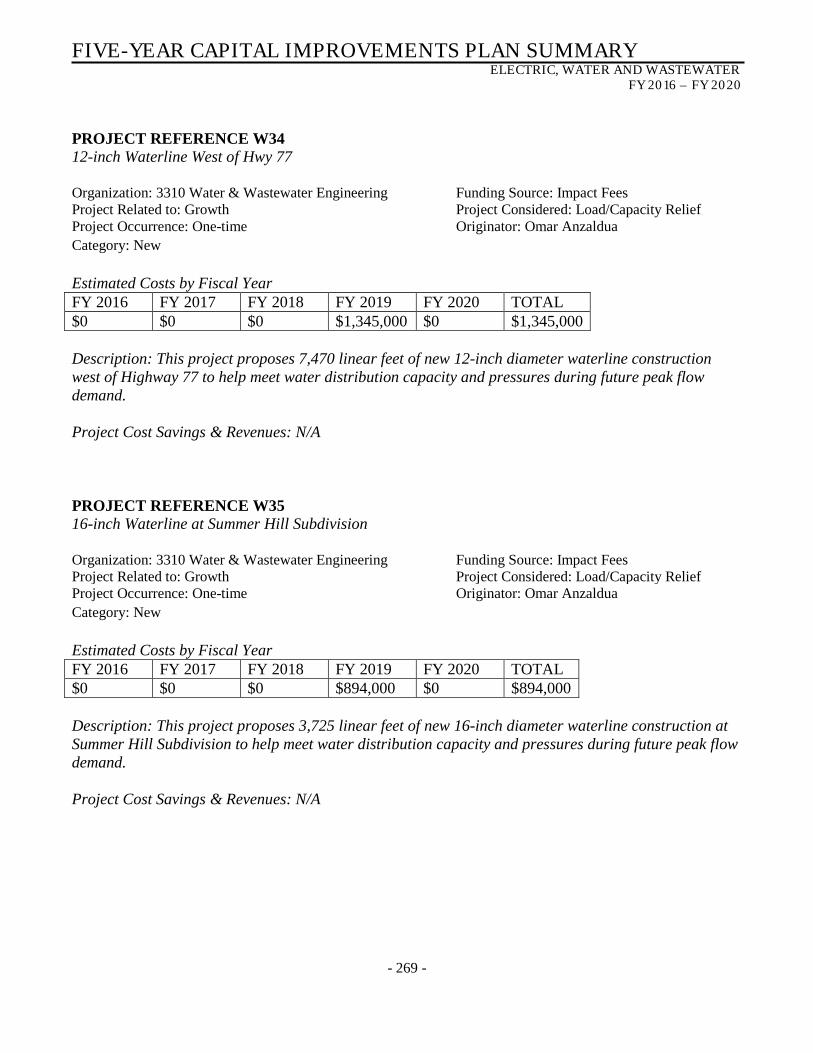
FIVE-YEAR CAPITAL IMPROVEMENTS PLAN SUMMARY ELECTRIC, WATER AND WASTEWATER
FY 2016 – FY 2020
- 269 -
PROJECT REFERENCE W34 12-inch Waterline West of Hwy 77 Organization: 3310 Water & Wastewater Engineering Funding Source: Impact Fees Project Related to: Growth Project Considered: Load/Capacity Relief Project Occurrence: One-time Originator: Omar Anzaldua Category: New Estimated Costs by Fiscal Year FY 2016 FY 2017 FY 2018 FY 2019 FY 2020 TOTAL $0 $0 $0 $1,345,000 $0 $1,345,000 Description: This project proposes 7,470 linear feet of new 12-inch diameter waterline construction west of Highway 77 to help meet water distribution capacity and pressures during future peak flow demand. Project Cost Savings & Revenues: N/A PROJECT REFERENCE W35 16-inch Waterline at Summer Hill Subdivision Organization: 3310 Water & Wastewater Engineering Funding Source: Impact Fees Project Related to: Growth Project Considered: Load/Capacity Relief Project Occurrence: One-time Originator: Omar Anzaldua Category: New Estimated Costs by Fiscal Year FY 2016 FY 2017 FY 2018 FY 2019 FY 2020 TOTAL $0 $0 $0 $894,000 $0 $894,000 Description: This project proposes 3,725 linear feet of new 16-inch diameter waterline construction at Summer Hill Subdivision to help meet water distribution capacity and pressures during future peak flow demand. Project Cost Savings & Revenues: N/A
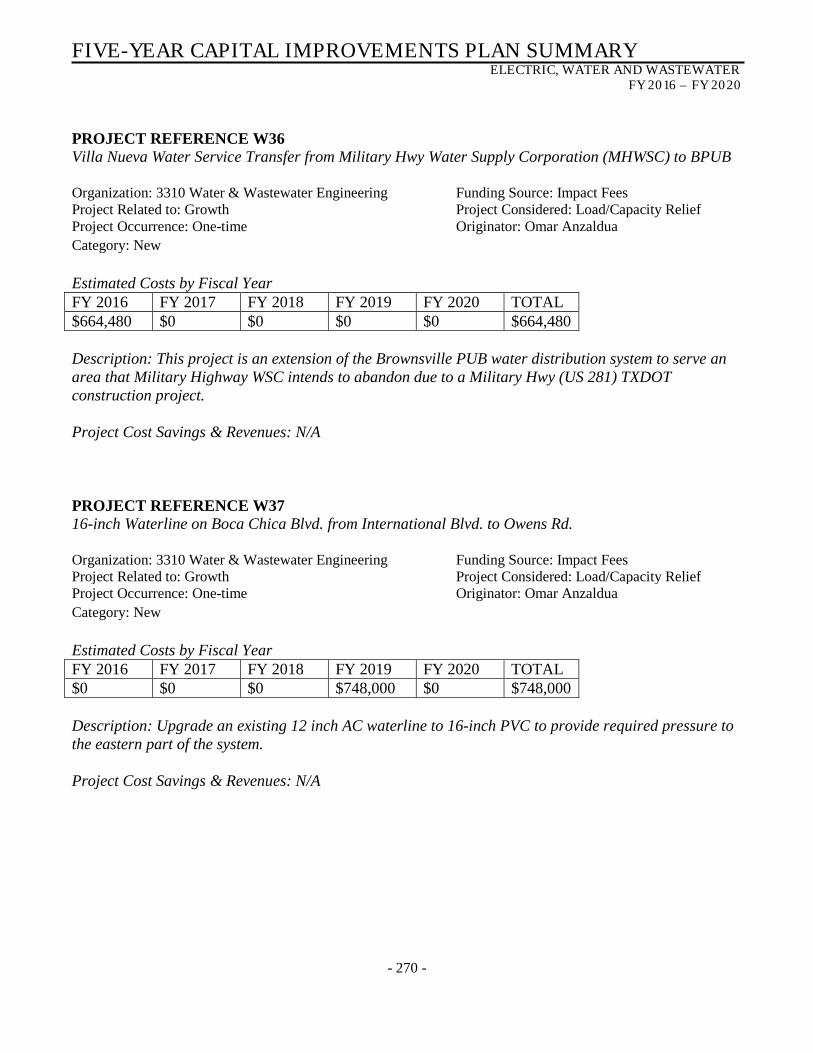
FIVE-YEAR CAPITAL IMPROVEMENTS PLAN SUMMARY ELECTRIC, WATER AND WASTEWATER
FY 2016 – FY 2020
- 270 -
PROJECT REFERENCE W36 Villa Nueva Water Service Transfer from Military Hwy Water Supply Corporation (MHWSC) to BPUB Organization: 3310 Water & Wastewater Engineering Funding Source: Impact Fees Project Related to: Growth Project Considered: Load/Capacity Relief Project Occurrence: One-time Originator: Omar Anzaldua Category: New Estimated Costs by Fiscal Year FY 2016 FY 2017 FY 2018 FY 2019 FY 2020 TOTAL $664,480 $0 $0 $0 $0 $664,480 Description: This project is an extension of the Brownsville PUB water distribution system to serve an area that Military Highway WSC intends to abandon due to a Military Hwy (US 281) TXDOT construction project. Project Cost Savings & Revenues: N/A PROJECT REFERENCE W37 16-inch Waterline on Boca Chica Blvd. from International Blvd. to Owens Rd. Organization: 3310 Water & Wastewater Engineering Funding Source: Impact Fees Project Related to: Growth Project Considered: Load/Capacity Relief Project Occurrence: One-time Originator: Omar Anzaldua Category: New Estimated Costs by Fiscal Year FY 2016 FY 2017 FY 2018 FY 2019 FY 2020 TOTAL $0 $0 $0 $748,000 $0 $748,000 Description: Upgrade an existing 12 inch AC waterline to 16-inch PVC to provide required pressure to the eastern part of the system. Project Cost Savings & Revenues: N/A
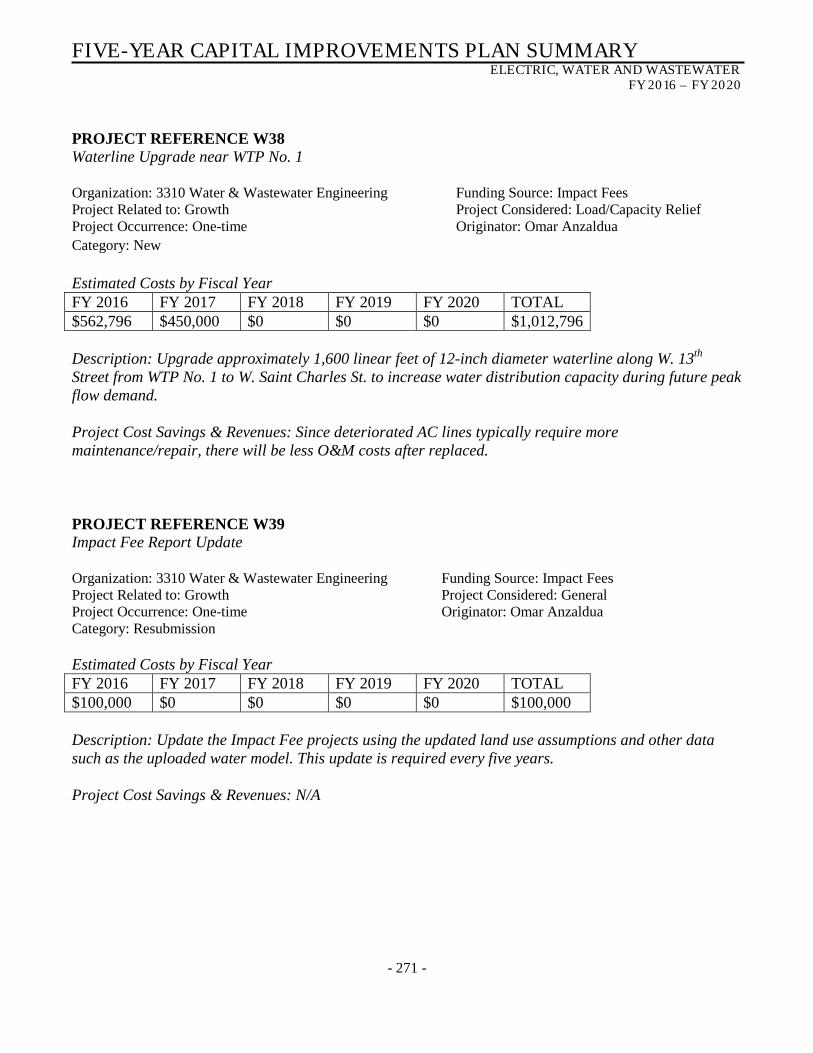
FIVE-YEAR CAPITAL IMPROVEMENTS PLAN SUMMARY ELECTRIC, WATER AND WASTEWATER
FY 2016 – FY 2020
- 271 -
PROJECT REFERENCE W38 Waterline Upgrade near WTP No. 1 Organization: 3310 Water & Wastewater Engineering Funding Source: Impact Fees Project Related to: Growth Project Considered: Load/Capacity Relief Project Occurrence: One-time Originator: Omar Anzaldua Category: New Estimated Costs by Fiscal Year FY 2016 FY 2017 FY 2018 FY 2019 FY 2020 TOTAL $562,796 $450,000 $0 $0 $0 $1,012,796 Description: Upgrade approximately 1,600 linear feet of 12-inch diameter waterline along W. 13th Street from WTP No. 1 to W. Saint Charles St. to increase water distribution capacity during future peak flow demand. Project Cost Savings & Revenues: Since deteriorated AC lines typically require more maintenance/repair, there will be less O&M costs after replaced. PROJECT REFERENCE W39 Impact Fee Report Update Organization: 3310 Water & Wastewater Engineering Funding Source: Impact Fees Project Related to: Growth Project Considered: General Project Occurrence: One-time Originator: Omar Anzaldua Category: Resubmission Estimated Costs by Fiscal Year FY 2016 FY 2017 FY 2018 FY 2019 FY 2020 TOTAL $100,000 $0 $0 $0 $0 $100,000 Description: Update the Impact Fee projects using the updated land use assumptions and other data such as the uploaded water model. This update is required every five years. Project Cost Savings & Revenues: N/A
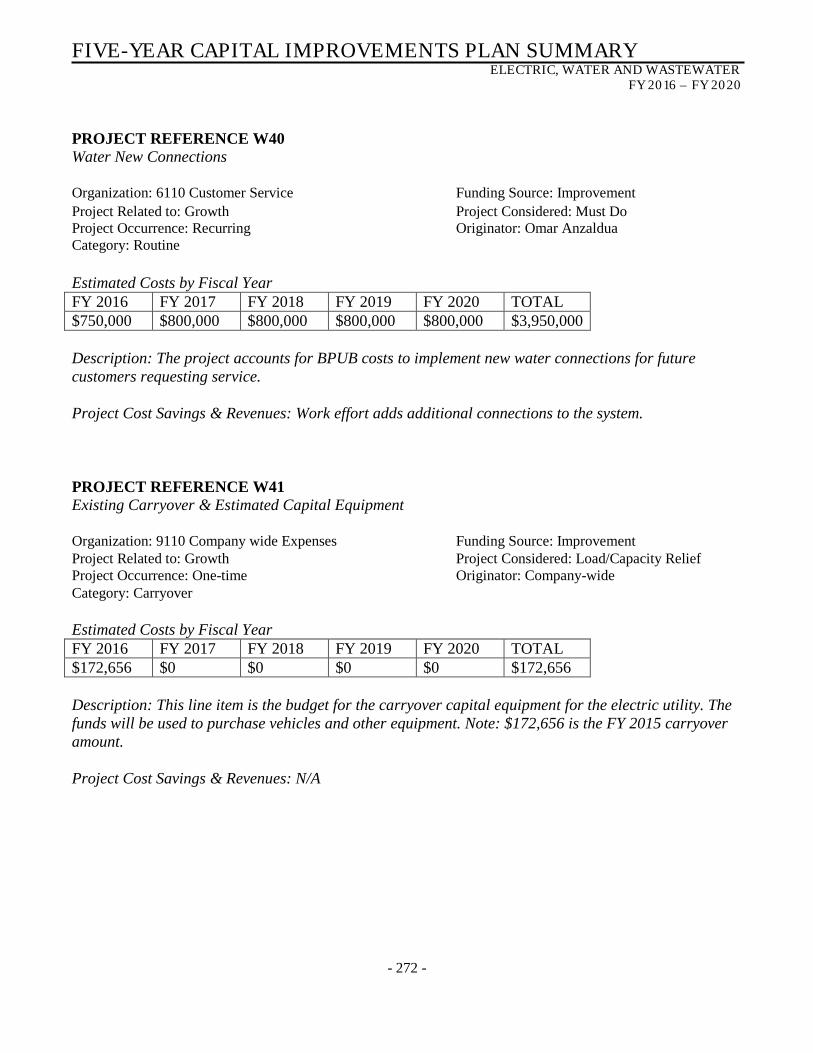
FIVE-YEAR CAPITAL IMPROVEMENTS PLAN SUMMARY ELECTRIC, WATER AND WASTEWATER
FY 2016 – FY 2020
- 272 -
PROJECT REFERENCE W40 Water New Connections Organization: 6110 Customer Service Funding Source: Improvement Project Related to: Growth Project Considered: Must Do Project Occurrence: Recurring Originator: Omar Anzaldua Category: Routine Estimated Costs by Fiscal Year FY 2016 FY 2017 FY 2018 FY 2019 FY 2020 TOTAL $750,000 $800,000 $800,000 $800,000 $800,000 $3,950,000 Description: The project accounts for BPUB costs to implement new water connections for future customers requesting service. Project Cost Savings & Revenues: Work effort adds additional connections to the system. PROJECT REFERENCE W41 Existing Carryover & Estimated Capital Equipment Organization: 9110 Company wide Expenses Funding Source: Improvement Project Related to: Growth Project Considered: Load/Capacity Relief Project Occurrence: One-time Originator: Company-wide Category: Carryover Estimated Costs by Fiscal Year FY 2016 FY 2017 FY 2018 FY 2019 FY 2020 TOTAL $172,656 $0 $0 $0 $0 $172,656 Description: This line item is the budget for the carryover capital equipment for the electric utility. The funds will be used to purchase vehicles and other equipment. Note: $172,656 is the FY 2015 carryover amount. Project Cost Savings & Revenues: N/A
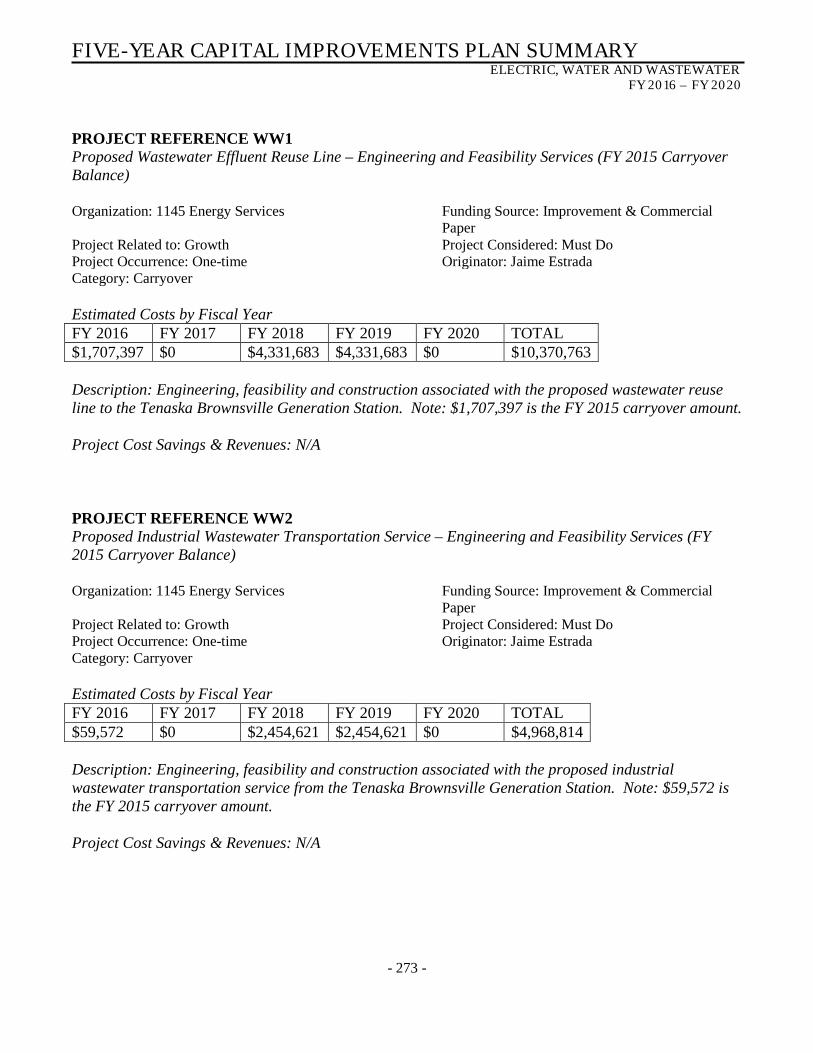
FIVE-YEAR CAPITAL IMPROVEMENTS PLAN SUMMARY ELECTRIC, WATER AND WASTEWATER
FY 2016 – FY 2020
- 273 -
PROJECT REFERENCE WW1 Proposed Wastewater Effluent Reuse Line – Engineering and Feasibility Services (FY 2015 Carryover Balance) Organization: 1145 Energy Services Funding Source: Improvement & Commercial
Paper Project Related to: Growth Project Considered: Must Do Project Occurrence: One-time Originator: Jaime Estrada Category: Carryover Estimated Costs by Fiscal Year FY 2016 FY 2017 FY 2018 FY 2019 FY 2020 TOTAL $1,707,397 $0 $4,331,683 $4,331,683 $0 $10,370,763 Description: Engineering, feasibility and construction associated with the proposed wastewater reuse line to the Tenaska Brownsville Generation Station. Note: $1,707,397 is the FY 2015 carryover amount. Project Cost Savings & Revenues: N/A PROJECT REFERENCE WW2 Proposed Industrial Wastewater Transportation Service – Engineering and Feasibility Services (FY 2015 Carryover Balance) Organization: 1145 Energy Services Funding Source: Improvement & Commercial
Paper Project Related to: Growth Project Considered: Must Do Project Occurrence: One-time Originator: Jaime Estrada Category: Carryover Estimated Costs by Fiscal Year FY 2016 FY 2017 FY 2018 FY 2019 FY 2020 TOTAL $59,572 $0 $2,454,621 $2,454,621 $0 $4,968,814 Description: Engineering, feasibility and construction associated with the proposed industrial wastewater transportation service from the Tenaska Brownsville Generation Station. Note: $59,572 is the FY 2015 carryover amount. Project Cost Savings & Revenues: N/A
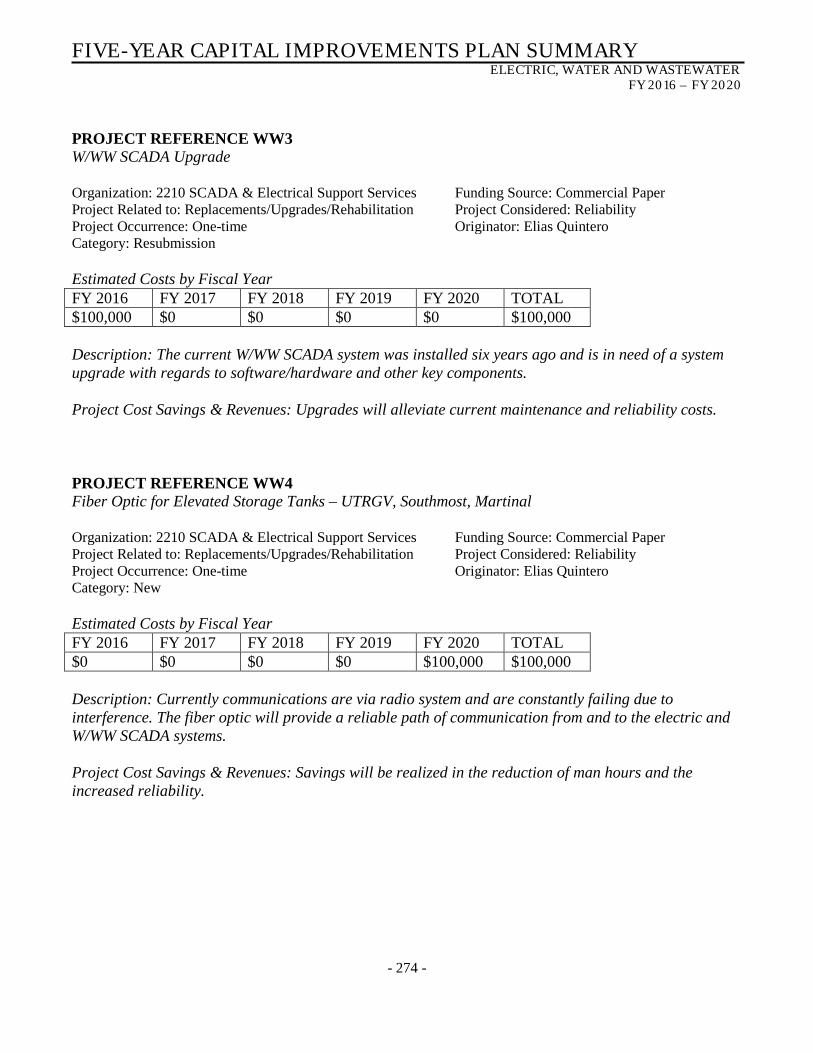
FIVE-YEAR CAPITAL IMPROVEMENTS PLAN SUMMARY ELECTRIC, WATER AND WASTEWATER
FY 2016 – FY 2020
- 274 -
PROJECT REFERENCE WW3 W/WW SCADA Upgrade Organization: 2210 SCADA & Electrical Support Services Funding Source: Commercial Paper Project Related to: Replacements/Upgrades/Rehabilitation Project Considered: Reliability Project Occurrence: One-time Originator: Elias Quintero Category: Resubmission Estimated Costs by Fiscal Year FY 2016 FY 2017 FY 2018 FY 2019 FY 2020 TOTAL $100,000 $0 $0 $0 $0 $100,000 Description: The current W/WW SCADA system was installed six years ago and is in need of a system upgrade with regards to software/hardware and other key components. Project Cost Savings & Revenues: Upgrades will alleviate current maintenance and reliability costs. PROJECT REFERENCE WW4 Fiber Optic for Elevated Storage Tanks – UTRGV, Southmost, Martinal Organization: 2210 SCADA & Electrical Support Services Funding Source: Commercial Paper Project Related to: Replacements/Upgrades/Rehabilitation Project Considered: Reliability Project Occurrence: One-time Originator: Elias Quintero Category: New Estimated Costs by Fiscal Year FY 2016 FY 2017 FY 2018 FY 2019 FY 2020 TOTAL $0 $0 $0 $0 $100,000 $100,000 Description: Currently communications are via radio system and are constantly failing due to interference. The fiber optic will provide a reliable path of communication from and to the electric and W/WW SCADA systems. Project Cost Savings & Revenues: Savings will be realized in the reduction of man hours and the increased reliability.
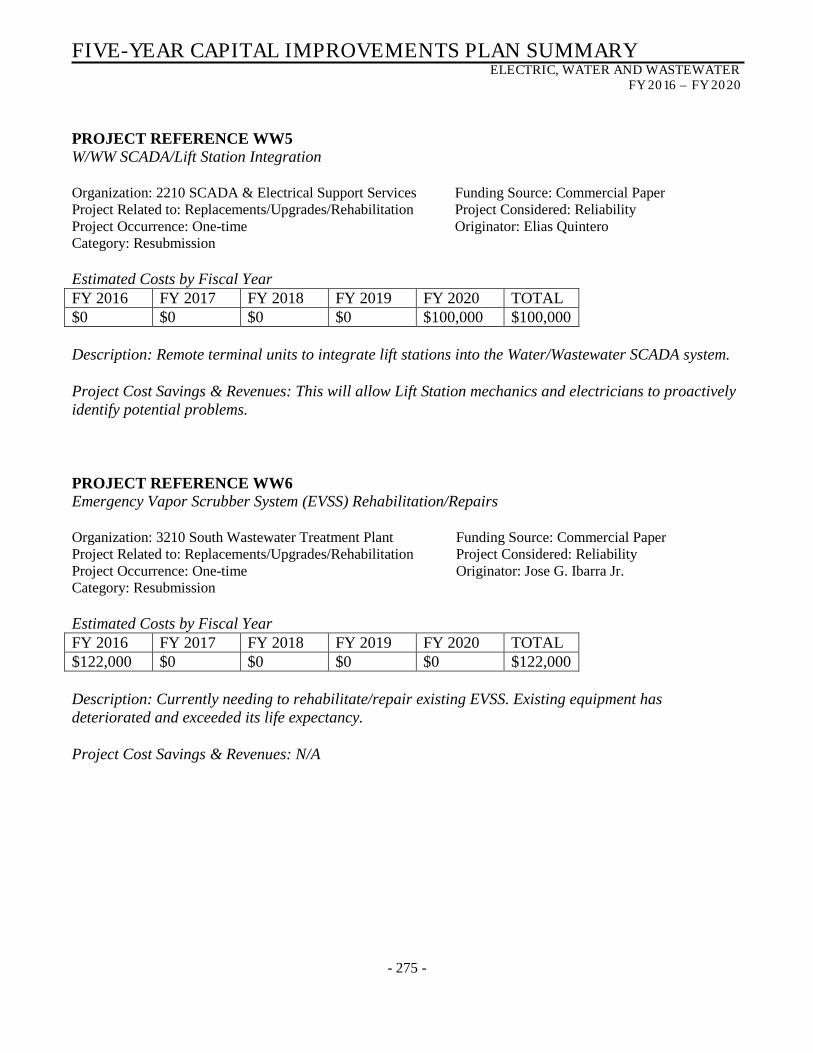
FIVE-YEAR CAPITAL IMPROVEMENTS PLAN SUMMARY ELECTRIC, WATER AND WASTEWATER
FY 2016 – FY 2020
- 275 -
PROJECT REFERENCE WW5 W/WW SCADA/Lift Station Integration Organization: 2210 SCADA & Electrical Support Services Funding Source: Commercial Paper Project Related to: Replacements/Upgrades/Rehabilitation Project Considered: Reliability Project Occurrence: One-time Originator: Elias Quintero Category: Resubmission Estimated Costs by Fiscal Year FY 2016 FY 2017 FY 2018 FY 2019 FY 2020 TOTAL $0 $0 $0 $0 $100,000 $100,000 Description: Remote terminal units to integrate lift stations into the Water/Wastewater SCADA system. Project Cost Savings & Revenues: This will allow Lift Station mechanics and electricians to proactively identify potential problems. PROJECT REFERENCE WW6 Emergency Vapor Scrubber System (EVSS) Rehabilitation/Repairs Organization: 3210 South Wastewater Treatment Plant Funding Source: Commercial Paper Project Related to: Replacements/Upgrades/Rehabilitation Project Considered: Reliability Project Occurrence: One-time Originator: Jose G. Ibarra Jr. Category: Resubmission Estimated Costs by Fiscal Year FY 2016 FY 2017 FY 2018 FY 2019 FY 2020 TOTAL $122,000 $0 $0 $0 $0 $122,000 Description: Currently needing to rehabilitate/repair existing EVSS. Existing equipment has deteriorated and exceeded its life expectancy. Project Cost Savings & Revenues: N/A
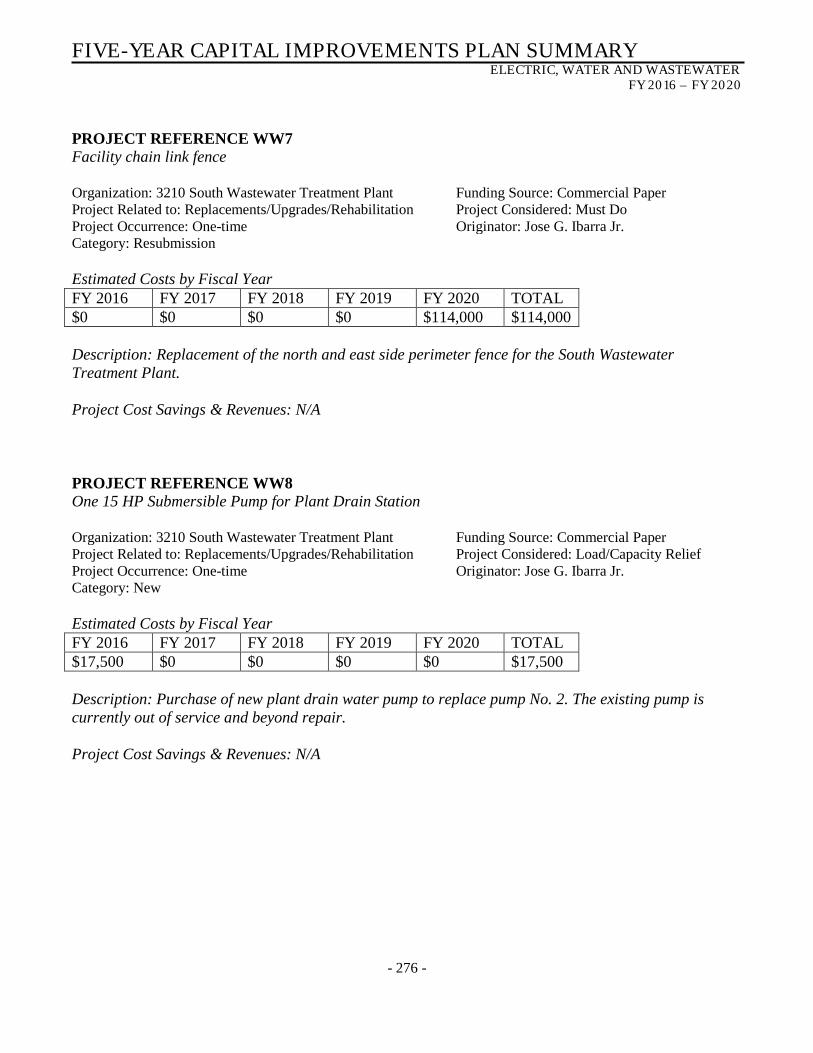
FIVE-YEAR CAPITAL IMPROVEMENTS PLAN SUMMARY ELECTRIC, WATER AND WASTEWATER
FY 2016 – FY 2020
- 276 -
PROJECT REFERENCE WW7 Facility chain link fence Organization: 3210 South Wastewater Treatment Plant Funding Source: Commercial Paper Project Related to: Replacements/Upgrades/Rehabilitation Project Considered: Must Do Project Occurrence: One-time Originator: Jose G. Ibarra Jr. Category: Resubmission Estimated Costs by Fiscal Year FY 2016 FY 2017 FY 2018 FY 2019 FY 2020 TOTAL $0 $0 $0 $0 $114,000 $114,000 Description: Replacement of the north and east side perimeter fence for the South Wastewater Treatment Plant. Project Cost Savings & Revenues: N/A PROJECT REFERENCE WW8 One 15 HP Submersible Pump for Plant Drain Station Organization: 3210 South Wastewater Treatment Plant Funding Source: Commercial Paper Project Related to: Replacements/Upgrades/Rehabilitation Project Considered: Load/Capacity Relief Project Occurrence: One-time Originator: Jose G. Ibarra Jr. Category: New Estimated Costs by Fiscal Year FY 2016 FY 2017 FY 2018 FY 2019 FY 2020 TOTAL $17,500 $0 $0 $0 $0 $17,500 Description: Purchase of new plant drain water pump to replace pump No. 2. The existing pump is currently out of service and beyond repair. Project Cost Savings & Revenues: N/A

FIVE-YEAR CAPITAL IMPROVEMENTS PLAN SUMMARY ELECTRIC, WATER AND WASTEWATER
FY 2016 – FY 2020
- 277 -
PROJECT REFERENCE WW9 Chlorination System Equipment Upgrades Organization: 3210 South Wastewater Treatment Plant Funding Source: Commercial Paper Project Related to: Replacements/Upgrades/Rehabilitation Project Considered: Reliability Project Occurrence: One-time Originator: Jose G. Ibarra Jr. Category: New Estimated Costs by Fiscal Year FY 2016 FY 2017 FY 2018 FY 2019 FY 2020 TOTAL $33,000 $0 $0 $0 $0 $33,000 Description: Replace six vacuum regulators and three emergency shut off actuators of existing chlorination equipment system. The equipment is currently in operation, but, due to normal wear and tear, it is in need of replacement. Project Cost Savings & Revenues: N/A PROJECT REFERENCE WW10 Reclaim Water Pump Station Automatic Control System Upgrades Organization: 3210 South Wastewater Treatment Plant Funding Source: Commercial Paper Project Related to: Replacements/Upgrades/Rehabilitation Project Considered: Must Do Project Occurrence: One-time Originator: Jose G. Ibarra Jr. Category: New Estimated Costs by Fiscal Year FY 2016 FY 2017 FY 2018 FY 2019 FY 2020 TOTAL $42,000 $0 $0 $0 $0 $42,000 Description: Existing pump controls are currently not working. BPUB SCADA technicians have tried, but were not able to fix the problem and have recommended out sourcing repairs to a specialized company. Project Cost Savings & Revenues: N/A

FIVE-YEAR CAPITAL IMPROVEMENTS PLAN SUMMARY ELECTRIC, WATER AND WASTEWATER
FY 2016 – FY 2020
- 278 -
PROJECT REFERENCE WW11 40 HP Return Activated Sludge (RAS) Pump Organization: 3210 South Wastewater Treatment Plant Funding Source: Commercial Paper Project Related to: Replacements/Upgrades/Rehabilitation Project Considered: Load/Capacity Relief Project Occurrence: One-time Originator: Jose G. Ibarra Jr. Category: Resubmission Estimated Costs by Fiscal Year FY 2016 FY 2017 FY 2018 FY 2019 FY 2020 TOTAL $0 $0 $0 $0 $48,000 $48,000 Description: Currently needing to replace one 40 HP RAS pump. Existing pump is 15 years old and exceeded its life expectancy. Project Cost Savings & Revenues: Cost savings will be reflected in the O&M account budget over an eight-year period. PROJECT REFERENCE WW12 6-inch Double Disc Pump for Digester Station No. 2 Organization: 3210 South Wastewater Treatment Plant Funding Source: Commercial Paper Project Related to: Replacements/Upgrades/Rehabilitation Project Considered: Must Do Project Occurrence: One-time Originator: Jose G. Ibarra Jr. Category: New Estimated Costs by Fiscal Year FY 2016 FY 2017 FY 2018 FY 2019 FY 2020 TOTAL $35,000 $0 $0 $0 $0 $35,000 Description: Through normal wear and tear, the existing pumps have worn out. Pumps have exceeded their life expectancy and need to be replaced. Project Cost Savings & Revenues: N/A
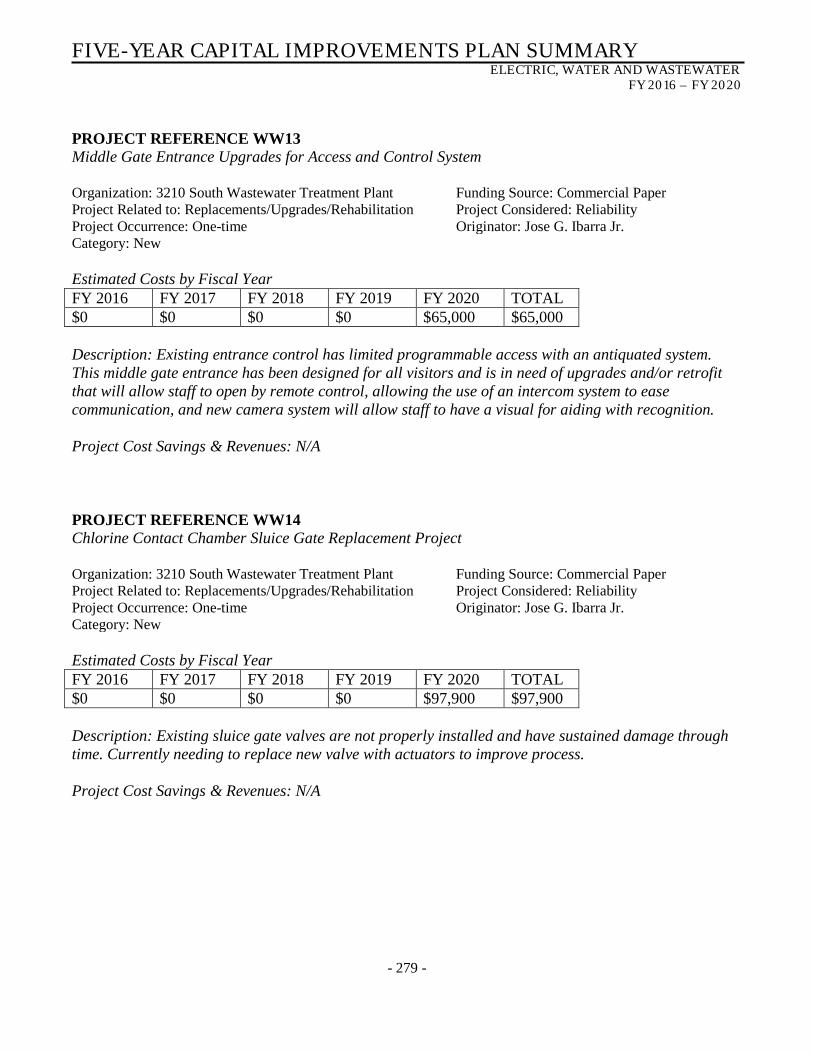
FIVE-YEAR CAPITAL IMPROVEMENTS PLAN SUMMARY ELECTRIC, WATER AND WASTEWATER
FY 2016 – FY 2020
- 279 -
PROJECT REFERENCE WW13 Middle Gate Entrance Upgrades for Access and Control System Organization: 3210 South Wastewater Treatment Plant Funding Source: Commercial Paper Project Related to: Replacements/Upgrades/Rehabilitation Project Considered: Reliability Project Occurrence: One-time Originator: Jose G. Ibarra Jr. Category: New Estimated Costs by Fiscal Year FY 2016 FY 2017 FY 2018 FY 2019 FY 2020 TOTAL $0 $0 $0 $0 $65,000 $65,000 Description: Existing entrance control has limited programmable access with an antiquated system. This middle gate entrance has been designed for all visitors and is in need of upgrades and/or retrofit that will allow staff to open by remote control, allowing the use of an intercom system to ease communication, and new camera system will allow staff to have a visual for aiding with recognition. Project Cost Savings & Revenues: N/A PROJECT REFERENCE WW14 Chlorine Contact Chamber Sluice Gate Replacement Project Organization: 3210 South Wastewater Treatment Plant Funding Source: Commercial Paper Project Related to: Replacements/Upgrades/Rehabilitation Project Considered: Reliability Project Occurrence: One-time Originator: Jose G. Ibarra Jr. Category: New Estimated Costs by Fiscal Year FY 2016 FY 2017 FY 2018 FY 2019 FY 2020 TOTAL $0 $0 $0 $0 $97,900 $97,900 Description: Existing sluice gate valves are not properly installed and have sustained damage through time. Currently needing to replace new valve with actuators to improve process. Project Cost Savings & Revenues: N/A

FIVE-YEAR CAPITAL IMPROVEMENTS PLAN SUMMARY ELECTRIC, WATER AND WASTEWATER
FY 2016 – FY 2020
- 280 -
PROJECT REFERENCE WW15 Ultra Violet Light Canopy Project Organization: 3220 Robindale Wastewater Treatment Plant Funding Source: Commercial Paper Project Related to: Replacements/Upgrades/Rehabilitation Project Considered: Reliability Project Occurrence: One-time Originator: Jose G. Ibarra Jr. Category: New Estimated Costs by Fiscal Year FY 2016 FY 2017 FY 2018 FY 2019 FY 2020 TOTAL $0 $0 $0 $0 $410,000 $410,000 Description: UV light is currently being impacted with the growth of algae. A canopy cover system will minimize the sunlight exposure to the UV light station and reduce algae growth. Project Cost Savings & Revenues: N/A PROJECT REFERENCE WW16 Launder Cover System for Three Final Clarifiers for Algae Control Organization: 3220 Robindale Wastewater Treatment Plant Funding Source: Commercial Paper Project Related to: Replacements/Upgrades/Rehabilitation Project Considered: Reliability Project Occurrence: One-time Originator: Jose G. Ibarra Jr. Category: New Estimated Costs by Fiscal Year FY 2016 FY 2017 FY 2018 FY 2019 FY 2020 TOTAL $514,000 $0 $0 $0 $0 $514,000 Description: Install a launder cover system on three final clarifiers. This will minimize sunlight exposure to effluent collected through the channel area, minimizing the production of algae growth to the system. Project Cost Savings & Revenues: N/A

FIVE-YEAR CAPITAL IMPROVEMENTS PLAN SUMMARY ELECTRIC, WATER AND WASTEWATER
FY 2016 – FY 2020
- 281 -
PROJECT REFERENCE WW17 Robindale Wastewater Plant Sludge Belt Filter Press Upgrade Project Organization: 3220 Robindale Wastewater Treatment Plant Funding Source: Commercial Paper Project Related to: Replacements/Upgrades/Rehabilitation Project Considered: Reliability Project Occurrence: One-time Originator: Omar Anzaldua Category: Resubmission Estimated Costs by Fiscal Year FY 2016 FY 2017 FY 2018 FY 2019 FY 2020 TOTAL $280,000 $2,385,000 $0 $0 $0 $2,665,000 Description: The Tenaska project is the driving force for this project to ensure the availability and quality of the reuse water flow demands to Tenaska. TCEQ requires a redundant sludge mechanical dewatering unit. Since there is only one belt press for the wastewater plants, there is the need to implement a secondary belt press for redundancy, as per TCEQ requirements. Project Cost Savings & Revenues: N/A PROJECT REFERENCE WW18 Roof Rehabilitation for Blower Building No. 1 and Face Lift Organization: 3220 Robindale Wastewater Treatment Plant Funding Source: Commercial Paper Project Related to: Replacements/Upgrades/Rehabilitation Project Considered: Must Do Project Occurrence: One-time Originator: Jose G. Ibarra Category: Resubmission Estimated Costs by Fiscal Year FY 2016 FY 2017 FY 2018 FY 2019 FY 2020 TOTAL $0 $0 $0 $0 $54,000 $54,000 Description: Currently needing to rehabilitate/repair the existing flat gravel roofs of Blower Building No. 1 and the roof for the Chemical Storage Station due to leaks. Project Cost Savings & Revenues: The new roof will protect new and old master control panel units. Replacement cost savings will be reflected in the O&M account budget over a 25 to 35-year period.

FIVE-YEAR CAPITAL IMPROVEMENTS PLAN SUMMARY ELECTRIC, WATER AND WASTEWATER
FY 2016 – FY 2020
- 282 -
PROJECT REFERENCE WW19 Lift Station Shop Renovations Organization: 3230 Wastewater Lift Stations Funding Source: Improvement Project Related to: Replacements/Upgrades/Rehabilitation Project Considered: Must Do Project Occurrence: One-time Originator: David Ramirez Category: Carryover Estimated Costs by Fiscal Year FY 2016 FY 2017 FY 2018 FY 2019 FY 2020 TOTAL $250,000 $0 $0 $0 $0 $250,000 Description: Lift station shop building renovations and modifications to provide for additional personnel office space and restrooms. Note: $250,000 is the FY 2015 carryover amount. Project Cost Savings & Revenues: N/A PROJECT REFERENCE WW20 Lift Station No. 12 Jib Crane Replacement Organization: 3230 Wastewater Lift Stations Funding Source: Commercial Paper Project Related to: Replacements/Upgrades/Rehabilitation Project Considered: Must Do Project Occurrence: One-time Originator: Noe C. Hernandez Category: Resubmission Estimated Costs by Fiscal Year FY 2016 FY 2017 FY 2018 FY 2019 FY 2020 TOTAL $0 $0 $0 $55,000 $0 $55,000 Description: Replacement of existing jib crane located at lift station No. 12. Project Cost Savings & Revenues: Minimal down time and minimal expenses on parts.
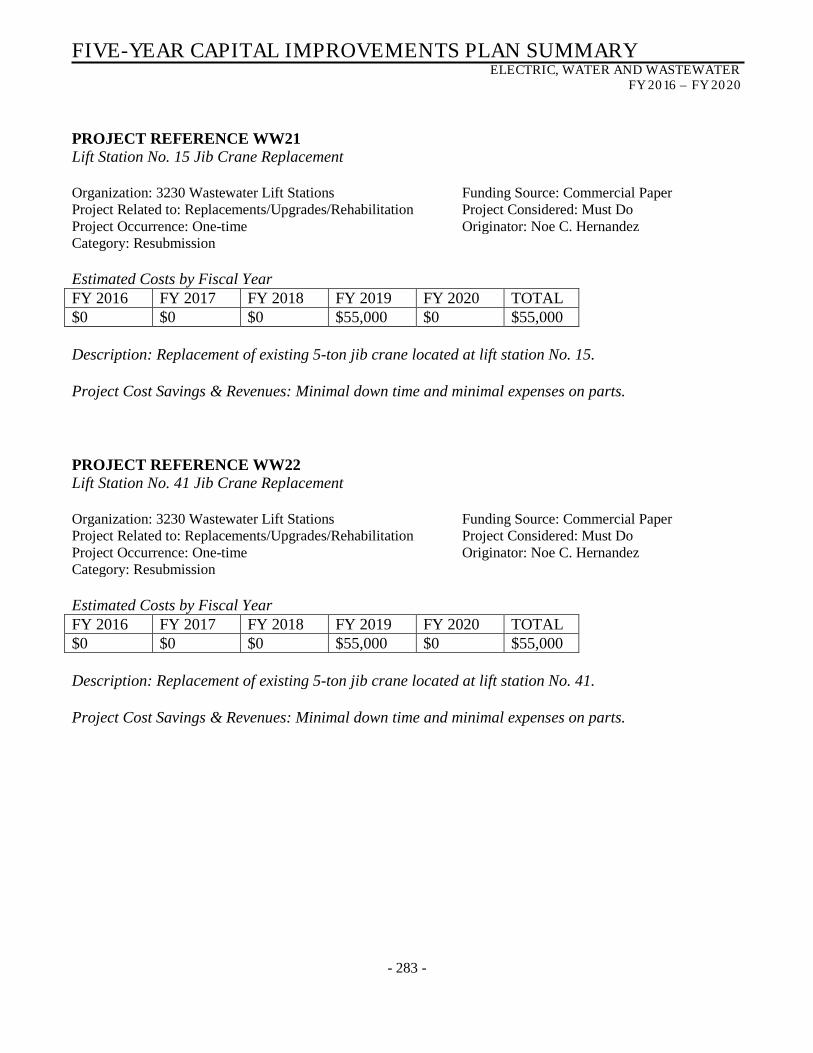
FIVE-YEAR CAPITAL IMPROVEMENTS PLAN SUMMARY ELECTRIC, WATER AND WASTEWATER
FY 2016 – FY 2020
- 283 -
PROJECT REFERENCE WW21 Lift Station No. 15 Jib Crane Replacement Organization: 3230 Wastewater Lift Stations Funding Source: Commercial Paper Project Related to: Replacements/Upgrades/Rehabilitation Project Considered: Must Do Project Occurrence: One-time Originator: Noe C. Hernandez Category: Resubmission Estimated Costs by Fiscal Year FY 2016 FY 2017 FY 2018 FY 2019 FY 2020 TOTAL $0 $0 $0 $55,000 $0 $55,000 Description: Replacement of existing 5-ton jib crane located at lift station No. 15. Project Cost Savings & Revenues: Minimal down time and minimal expenses on parts. PROJECT REFERENCE WW22 Lift Station No. 41 Jib Crane Replacement Organization: 3230 Wastewater Lift Stations Funding Source: Commercial Paper Project Related to: Replacements/Upgrades/Rehabilitation Project Considered: Must Do Project Occurrence: One-time Originator: Noe C. Hernandez Category: Resubmission Estimated Costs by Fiscal Year FY 2016 FY 2017 FY 2018 FY 2019 FY 2020 TOTAL $0 $0 $0 $55,000 $0 $55,000 Description: Replacement of existing 5-ton jib crane located at lift station No. 41. Project Cost Savings & Revenues: Minimal down time and minimal expenses on parts.
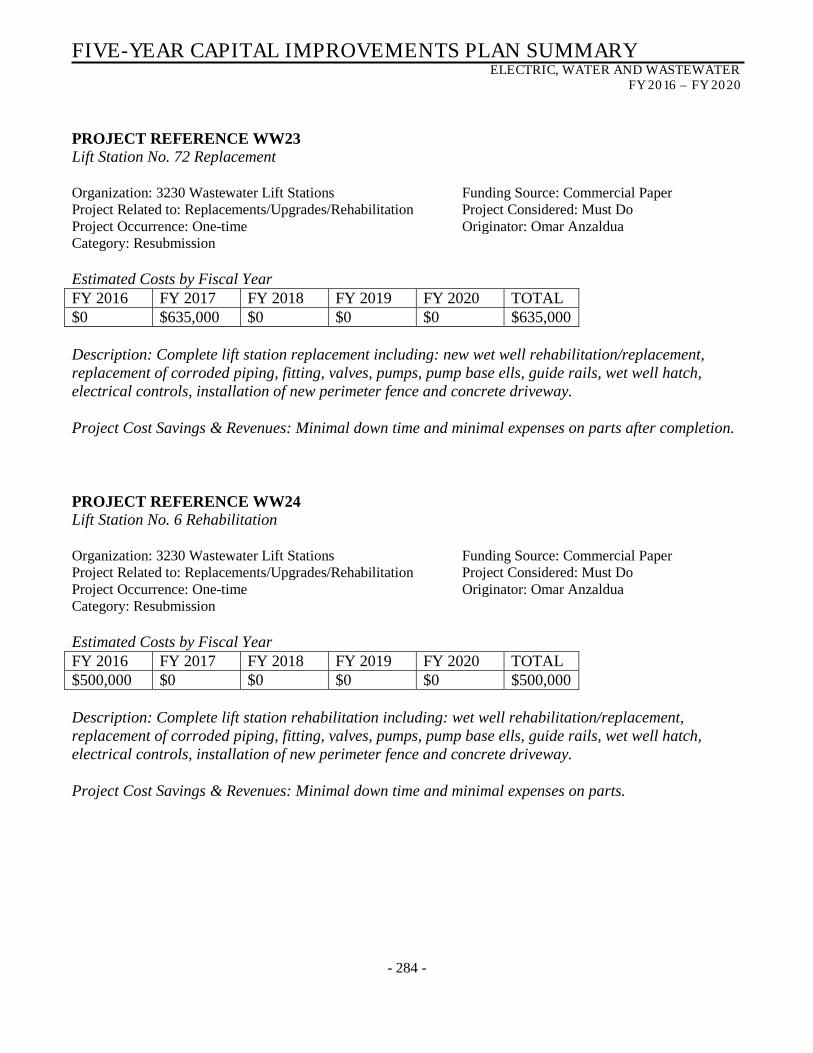
FIVE-YEAR CAPITAL IMPROVEMENTS PLAN SUMMARY ELECTRIC, WATER AND WASTEWATER
FY 2016 – FY 2020
- 284 -
PROJECT REFERENCE WW23 Lift Station No. 72 Replacement Organization: 3230 Wastewater Lift Stations Funding Source: Commercial Paper Project Related to: Replacements/Upgrades/Rehabilitation Project Considered: Must Do Project Occurrence: One-time Originator: Omar Anzaldua Category: Resubmission Estimated Costs by Fiscal Year FY 2016 FY 2017 FY 2018 FY 2019 FY 2020 TOTAL $0 $635,000 $0 $0 $0 $635,000 Description: Complete lift station replacement including: new wet well rehabilitation/replacement, replacement of corroded piping, fitting, valves, pumps, pump base ells, guide rails, wet well hatch, electrical controls, installation of new perimeter fence and concrete driveway. Project Cost Savings & Revenues: Minimal down time and minimal expenses on parts after completion. PROJECT REFERENCE WW24 Lift Station No. 6 Rehabilitation Organization: 3230 Wastewater Lift Stations Funding Source: Commercial Paper Project Related to: Replacements/Upgrades/Rehabilitation Project Considered: Must Do Project Occurrence: One-time Originator: Omar Anzaldua Category: Resubmission Estimated Costs by Fiscal Year FY 2016 FY 2017 FY 2018 FY 2019 FY 2020 TOTAL $500,000 $0 $0 $0 $0 $500,000 Description: Complete lift station rehabilitation including: wet well rehabilitation/replacement, replacement of corroded piping, fitting, valves, pumps, pump base ells, guide rails, wet well hatch, electrical controls, installation of new perimeter fence and concrete driveway. Project Cost Savings & Revenues: Minimal down time and minimal expenses on parts.

FIVE-YEAR CAPITAL IMPROVEMENTS PLAN SUMMARY ELECTRIC, WATER AND WASTEWATER
FY 2016 – FY 2020
- 285 -
PROJECT REFERENCE WW25 Lift Station No. 9 Rehabilitation Organization: 3230 Wastewater Lift Stations Funding Source: Commercial Paper Project Related to: Replacements/Upgrades/Rehabilitation Project Considered: Must Do Project Occurrence: One-time Originator: Omar Anzaldua Category: Resubmission Estimated Costs by Fiscal Year FY 2016 FY 2017 FY 2018 FY 2019 FY 2020 TOTAL $0 $0 $0 $535,000 $0 $535,000 Description: Complete lift station rehabilitation including: wet well rehabilitation/replacement, replacement of corroded piping, fitting, valves, pumps, pump base ells, guide rails, wet well hatch, electrical controls, installation of new perimeter fence and concrete driveway. Project Cost Savings & Revenues: Minimal down time and minimal expenses on parts. PROJECT REFERENCE WW26 Lift Station No. 10 Rehabilitation Organization: 3230 Wastewater Lift Stations Funding Source: Commercial Paper Project Related to: Replacements/Upgrades/Rehabilitation Project Considered: Must Do Project Occurrence: One-time Originator: Omar Anzaldua Category: Resubmission Estimated Costs by Fiscal Year FY 2016 FY 2017 FY 2018 FY 2019 FY 2020 TOTAL $0 $0 $0 $535,000 $0 $535,000 Description: Complete lift station rehabilitation including: wet well rehabilitation/replacement, replacement of corroded piping, fitting, valves, pumps, pump base ells, guide rails, wet well hatch, electrical controls, installation of new perimeter fence and concrete driveway. Project Cost Savings & Revenues: Minimal down time and minimal expenses on parts.
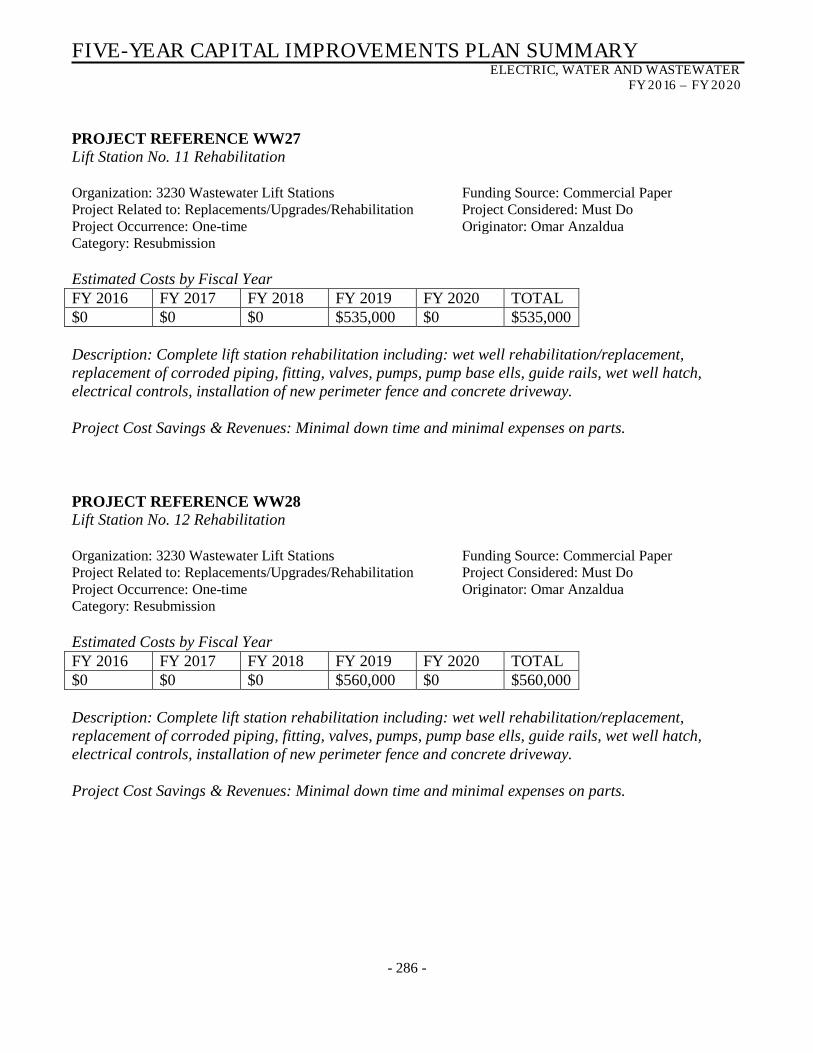
FIVE-YEAR CAPITAL IMPROVEMENTS PLAN SUMMARY ELECTRIC, WATER AND WASTEWATER
FY 2016 – FY 2020
- 286 -
PROJECT REFERENCE WW27 Lift Station No. 11 Rehabilitation Organization: 3230 Wastewater Lift Stations Funding Source: Commercial Paper Project Related to: Replacements/Upgrades/Rehabilitation Project Considered: Must Do Project Occurrence: One-time Originator: Omar Anzaldua Category: Resubmission Estimated Costs by Fiscal Year FY 2016 FY 2017 FY 2018 FY 2019 FY 2020 TOTAL $0 $0 $0 $535,000 $0 $535,000 Description: Complete lift station rehabilitation including: wet well rehabilitation/replacement, replacement of corroded piping, fitting, valves, pumps, pump base ells, guide rails, wet well hatch, electrical controls, installation of new perimeter fence and concrete driveway. Project Cost Savings & Revenues: Minimal down time and minimal expenses on parts. PROJECT REFERENCE WW28 Lift Station No. 12 Rehabilitation Organization: 3230 Wastewater Lift Stations Funding Source: Commercial Paper Project Related to: Replacements/Upgrades/Rehabilitation Project Considered: Must Do Project Occurrence: One-time Originator: Omar Anzaldua Category: Resubmission Estimated Costs by Fiscal Year FY 2016 FY 2017 FY 2018 FY 2019 FY 2020 TOTAL $0 $0 $0 $560,000 $0 $560,000 Description: Complete lift station rehabilitation including: wet well rehabilitation/replacement, replacement of corroded piping, fitting, valves, pumps, pump base ells, guide rails, wet well hatch, electrical controls, installation of new perimeter fence and concrete driveway. Project Cost Savings & Revenues: Minimal down time and minimal expenses on parts.

FIVE-YEAR CAPITAL IMPROVEMENTS PLAN SUMMARY ELECTRIC, WATER AND WASTEWATER
FY 2016 – FY 2020
- 287 -
PROJECT REFERENCE WW29 Lift Station No. 13 Rehabilitation Organization: 3230 Wastewater Lift Stations Funding Source: Commercial Paper Project Related to: Replacements/Upgrades/Rehabilitation Project Considered: Must Do Project Occurrence: One-time Originator: Omar Anzaldua Category: Resubmission Estimated Costs by Fiscal Year FY 2016 FY 2017 FY 2018 FY 2019 FY 2020 TOTAL $0 $0 $500,000 $0 $0 $500,000 Description: Complete lift station rehabilitation including: wet well rehabilitation/replacement, replacement of corroded piping, fitting, valves, pumps, pump base ells, guide rails, wet well hatch, electrical controls, installation of new perimeter fence and concrete driveway. Project Cost Savings & Revenues: Minimal down time and minimal expenses on parts. PROJECT REFERENCE WW30 Lift Station No. 17 Rehabilitation Organization: 3230 Wastewater Lift Stations Funding Source: Commercial Paper Project Related to: Replacements/Upgrades/Rehabilitation Project Considered: Must Do Project Occurrence: One-time Originator: Omar Anzaldua Category: Resubmission Estimated Costs by Fiscal Year FY 2016 FY 2017 FY 2018 FY 2019 FY 2020 TOTAL $0 $0 $500,000 $0 $0 $500,000 Description: Complete lift station rehabilitation including: wet well rehabilitation/replacement, replacement of corroded piping, fitting, valves, pumps, pump base ells, guide rails, wet well hatch, electrical controls, installation of new perimeter fence and concrete driveway. Project Cost Savings & Revenues: Minimal down time and minimal expenses on parts.

FIVE-YEAR CAPITAL IMPROVEMENTS PLAN SUMMARY ELECTRIC, WATER AND WASTEWATER
FY 2016 – FY 2020
- 288 -
PROJECT REFERENCE WW31 Lift Station No. 23 Rehabilitation Organization: 3230 Wastewater Lift Stations Funding Source: Commercial Paper Project Related to: Replacements/Upgrades/Rehabilitation Project Considered: Must Do Project Occurrence: One-time Originator: Omar Anzaldua Category: Resubmission Estimated Costs by Fiscal Year FY 2016 FY 2017 FY 2018 FY 2019 FY 2020 TOTAL $0 $0 $535,000 $0 $0 $535,000 Description: Complete lift station rehabilitation including: wet well rehabilitation/replacement, replacement of corroded piping, fitting, valves, pumps, pump base ells, guide rails, wet well hatch, electrical controls, installation of new perimeter fence and concrete driveway. Project Cost Savings & Revenues: Minimal down time and minimal expenses on parts. PROJECT REFERENCE WW32 Lift Station No. 28 Rehabilitation Organization: 3230 Wastewater Lift Stations Funding Source: Commercial Paper Project Related to: Replacements/Upgrades/Rehabilitation Project Considered: Must Do Project Occurrence: One-time Originator: Omar Anzaldua Category: Resubmission Estimated Costs by Fiscal Year FY 2016 FY 2017 FY 2018 FY 2019 FY 2020 TOTAL $0 $0 $0 $535,000 $0 $535,000 Description: Complete lift station rehabilitation including: wet well rehabilitation/replacement, replacement of corroded piping, fitting, valves, pumps, pump base ells, guide rails, wet well hatch, electrical controls, installation of new perimeter fence and concrete driveway. Project Cost Savings & Revenues: Minimal down time and minimal expenses on parts.

FIVE-YEAR CAPITAL IMPROVEMENTS PLAN SUMMARY ELECTRIC, WATER AND WASTEWATER
FY 2016 – FY 2020
- 289 -
PROJECT REFERENCE WW33 Lift Station No. 43 Rehabilitation Organization: 3230 Wastewater Lift Stations Funding Source: Commercial Paper Project Related to: Replacements/Upgrades/Rehabilitation Project Considered: Must Do Project Occurrence: One-time Originator: Omar Anzaldua Category: Resubmission Estimated Costs by Fiscal Year FY 2016 FY 2017 FY 2018 FY 2019 FY 2020 TOTAL $0 $535,000 $0 $0 $0 $535,000 Description: Complete lift station rehabilitation including: wet well rehabilitation/replacement, replacement of corroded piping, fitting, valves, pumps, pump base ells, guide rails, wet well hatch, electrical controls, installation of new perimeter fence and concrete driveway. Project Cost Savings & Revenues: Minimal down time and minimal expenses on parts. PROJECT REFERENCE WW34 Lift Station No.44 Rehabilitation Organization: 3230 Wastewater Lift Stations Funding Source: Commercial Paper Project Related to: Replacements/Upgrades/Rehabilitation Project Considered: Must Do Project Occurrence: One-time Originator: Omar Anzaldua Category: Resubmission Estimated Costs by Fiscal Year FY 2016 FY 2017 FY 2018 FY 2019 FY 2020 TOTAL $25,000 $525,000 $0 $0 $0 $550,000 Description: Complete lift station rehabilitation including: wet well rehabilitation/replacement, replacement of corroded piping, fitting, valves, pumps, pump base ells, guide rails, wet well hatch, electrical controls, installation of new perimeter fence and concrete driveway. Project Cost Savings & Revenues: Minimal down time and minimal expenses on parts.
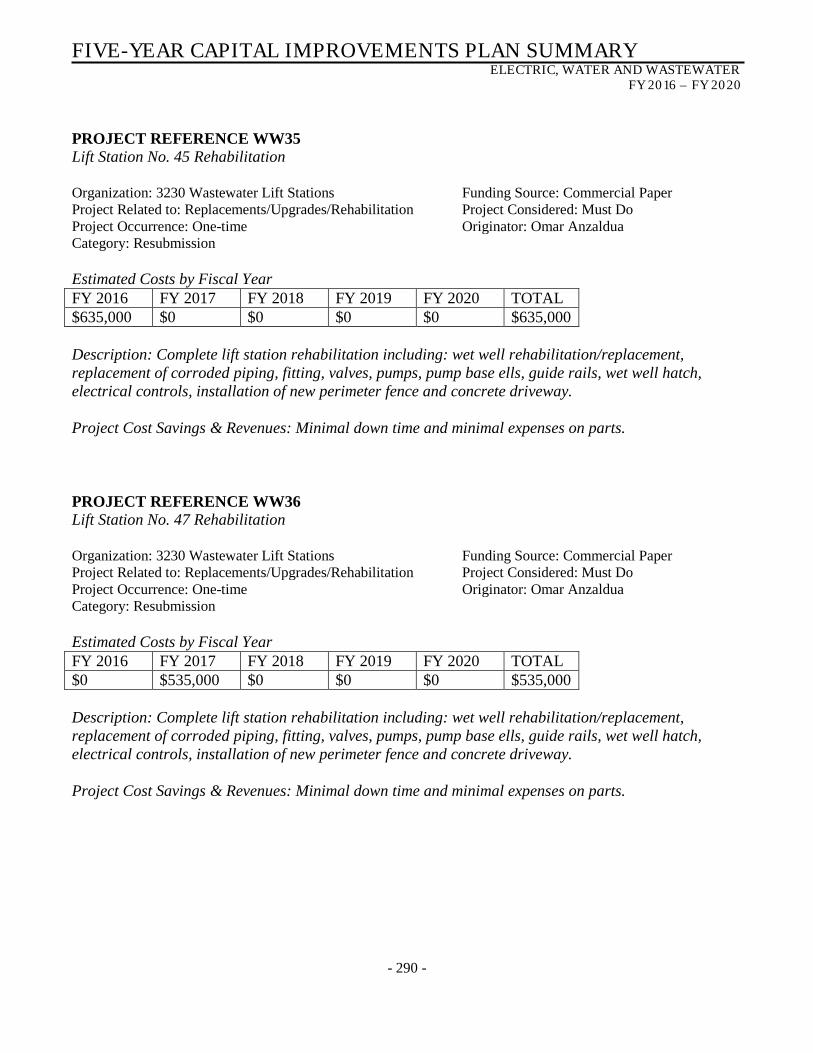
FIVE-YEAR CAPITAL IMPROVEMENTS PLAN SUMMARY ELECTRIC, WATER AND WASTEWATER
FY 2016 – FY 2020
- 290 -
PROJECT REFERENCE WW35 Lift Station No. 45 Rehabilitation Organization: 3230 Wastewater Lift Stations Funding Source: Commercial Paper Project Related to: Replacements/Upgrades/Rehabilitation Project Considered: Must Do Project Occurrence: One-time Originator: Omar Anzaldua Category: Resubmission Estimated Costs by Fiscal Year FY 2016 FY 2017 FY 2018 FY 2019 FY 2020 TOTAL $635,000 $0 $0 $0 $0 $635,000 Description: Complete lift station rehabilitation including: wet well rehabilitation/replacement, replacement of corroded piping, fitting, valves, pumps, pump base ells, guide rails, wet well hatch, electrical controls, installation of new perimeter fence and concrete driveway. Project Cost Savings & Revenues: Minimal down time and minimal expenses on parts. PROJECT REFERENCE WW36 Lift Station No. 47 Rehabilitation Organization: 3230 Wastewater Lift Stations Funding Source: Commercial Paper Project Related to: Replacements/Upgrades/Rehabilitation Project Considered: Must Do Project Occurrence: One-time Originator: Omar Anzaldua Category: Resubmission Estimated Costs by Fiscal Year FY 2016 FY 2017 FY 2018 FY 2019 FY 2020 TOTAL $0 $535,000 $0 $0 $0 $535,000 Description: Complete lift station rehabilitation including: wet well rehabilitation/replacement, replacement of corroded piping, fitting, valves, pumps, pump base ells, guide rails, wet well hatch, electrical controls, installation of new perimeter fence and concrete driveway. Project Cost Savings & Revenues: Minimal down time and minimal expenses on parts.
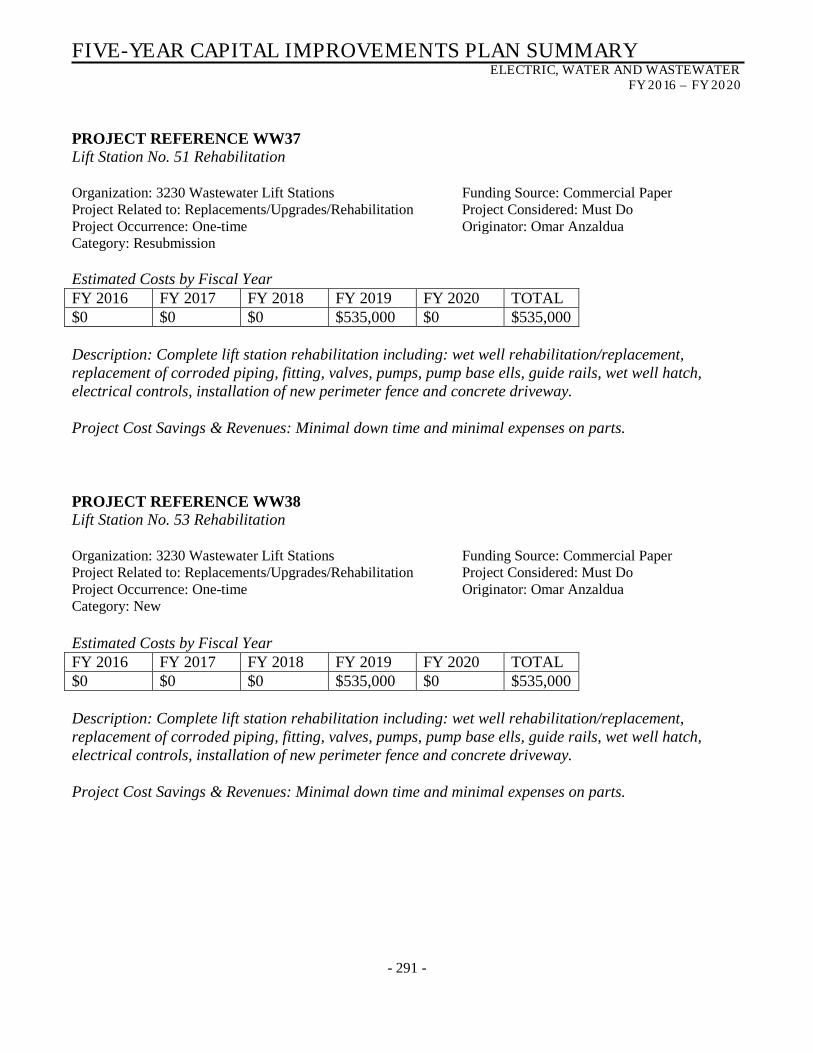
FIVE-YEAR CAPITAL IMPROVEMENTS PLAN SUMMARY ELECTRIC, WATER AND WASTEWATER
FY 2016 – FY 2020
- 291 -
PROJECT REFERENCE WW37 Lift Station No. 51 Rehabilitation Organization: 3230 Wastewater Lift Stations Funding Source: Commercial Paper Project Related to: Replacements/Upgrades/Rehabilitation Project Considered: Must Do Project Occurrence: One-time Originator: Omar Anzaldua Category: Resubmission Estimated Costs by Fiscal Year FY 2016 FY 2017 FY 2018 FY 2019 FY 2020 TOTAL $0 $0 $0 $535,000 $0 $535,000 Description: Complete lift station rehabilitation including: wet well rehabilitation/replacement, replacement of corroded piping, fitting, valves, pumps, pump base ells, guide rails, wet well hatch, electrical controls, installation of new perimeter fence and concrete driveway. Project Cost Savings & Revenues: Minimal down time and minimal expenses on parts. PROJECT REFERENCE WW38 Lift Station No. 53 Rehabilitation Organization: 3230 Wastewater Lift Stations Funding Source: Commercial Paper Project Related to: Replacements/Upgrades/Rehabilitation Project Considered: Must Do Project Occurrence: One-time Originator: Omar Anzaldua Category: New Estimated Costs by Fiscal Year FY 2016 FY 2017 FY 2018 FY 2019 FY 2020 TOTAL $0 $0 $0 $535,000 $0 $535,000 Description: Complete lift station rehabilitation including: wet well rehabilitation/replacement, replacement of corroded piping, fitting, valves, pumps, pump base ells, guide rails, wet well hatch, electrical controls, installation of new perimeter fence and concrete driveway. Project Cost Savings & Revenues: Minimal down time and minimal expenses on parts.
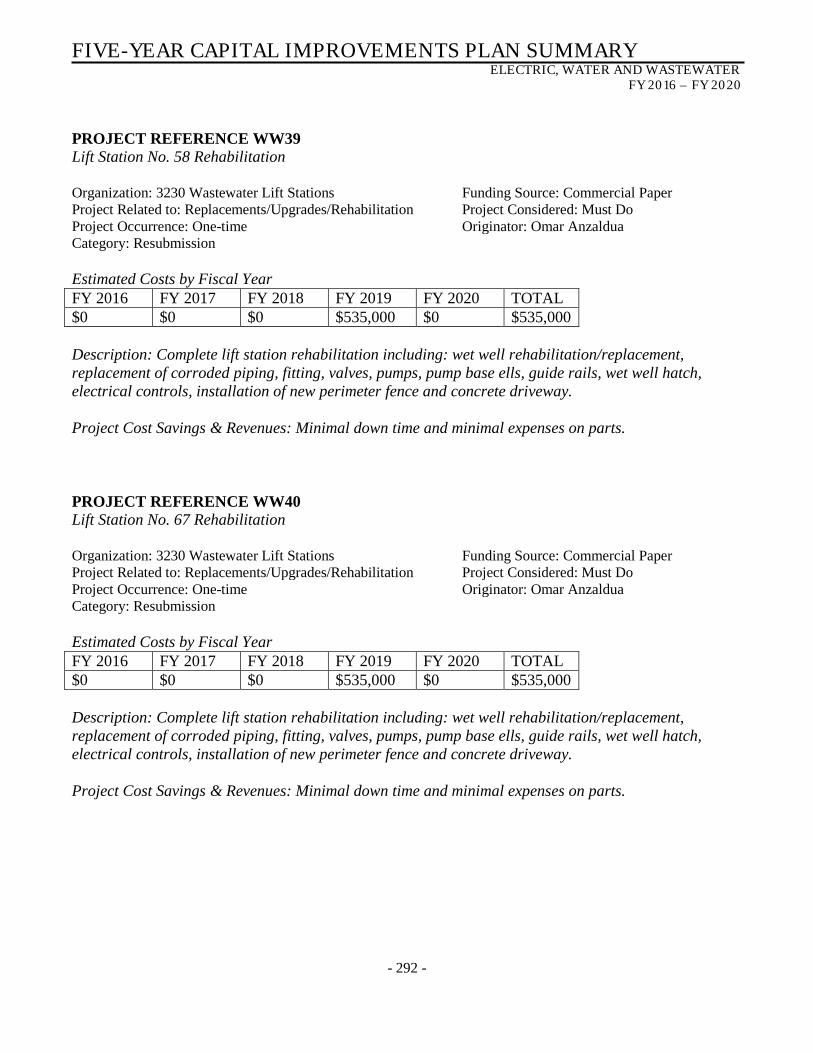
FIVE-YEAR CAPITAL IMPROVEMENTS PLAN SUMMARY ELECTRIC, WATER AND WASTEWATER
FY 2016 – FY 2020
- 292 -
PROJECT REFERENCE WW39 Lift Station No. 58 Rehabilitation Organization: 3230 Wastewater Lift Stations Funding Source: Commercial Paper Project Related to: Replacements/Upgrades/Rehabilitation Project Considered: Must Do Project Occurrence: One-time Originator: Omar Anzaldua Category: Resubmission Estimated Costs by Fiscal Year FY 2016 FY 2017 FY 2018 FY 2019 FY 2020 TOTAL $0 $0 $0 $535,000 $0 $535,000 Description: Complete lift station rehabilitation including: wet well rehabilitation/replacement, replacement of corroded piping, fitting, valves, pumps, pump base ells, guide rails, wet well hatch, electrical controls, installation of new perimeter fence and concrete driveway. Project Cost Savings & Revenues: Minimal down time and minimal expenses on parts. PROJECT REFERENCE WW40 Lift Station No. 67 Rehabilitation Organization: 3230 Wastewater Lift Stations Funding Source: Commercial Paper Project Related to: Replacements/Upgrades/Rehabilitation Project Considered: Must Do Project Occurrence: One-time Originator: Omar Anzaldua Category: Resubmission Estimated Costs by Fiscal Year FY 2016 FY 2017 FY 2018 FY 2019 FY 2020 TOTAL $0 $0 $0 $535,000 $0 $535,000 Description: Complete lift station rehabilitation including: wet well rehabilitation/replacement, replacement of corroded piping, fitting, valves, pumps, pump base ells, guide rails, wet well hatch, electrical controls, installation of new perimeter fence and concrete driveway. Project Cost Savings & Revenues: Minimal down time and minimal expenses on parts.

FIVE-YEAR CAPITAL IMPROVEMENTS PLAN SUMMARY ELECTRIC, WATER AND WASTEWATER
FY 2016 – FY 2020
- 293 -
PROJECT REFERENCE WW41 Lift Station No. 68 Rehabilitation Organization: 3230 Wastewater Lift Stations Funding Source: Commercial Paper Project Related to: Replacements/Upgrades/Rehabilitation Project Considered: Must Do Project Occurrence: One-time Originator: Omar Anzaldua Category: Resubmission Estimated Costs by Fiscal Year FY 2016 FY 2017 FY 2018 FY 2019 FY 2020 TOTAL $25,000 $490,000 $0 $0 $0 $515,000 Description: Complete lift station rehabilitation including: wet well rehabilitation/replacement, replacement of corroded piping, fitting, valves, pumps, pump base ells, guide rails, wet well hatch, electrical controls, installation of new perimeter fence and concrete driveway. Project Cost Savings & Revenues: Minimal down time and minimal expenses on parts. PROJECT REFERENCE WW42 Lift Station No. 69 Rehabilitation Organization: 3230 Wastewater Lift Stations Funding Source: Commercial Paper Project Related to: Replacements/Upgrades/Rehabilitation Project Considered: Must Do Project Occurrence: One-time Originator: Omar Anzaldua Category: Resubmission Estimated Costs by Fiscal Year FY 2016 FY 2017 FY 2018 FY 2019 FY 2020 TOTAL $25,000 $415,000 $0 $0 $0 $440,000 Description: Complete lift station rehabilitation including: wet well rehabilitation/replacement, replacement of corroded piping, fitting, valves, pumps, pump base ells, guide rails, wet well hatch, electrical controls, installation of new perimeter fence and concrete driveway. Project Cost Savings & Revenues: Minimal down time and minimal expenses on parts.

FIVE-YEAR CAPITAL IMPROVEMENTS PLAN SUMMARY ELECTRIC, WATER AND WASTEWATER
FY 2016 – FY 2020
- 294 -
PROJECT REFERENCE WW43 Lift Station No. 77 Rehabilitation Organization: 3230 Wastewater Lift Stations Funding Source: Commercial Paper Project Related to: Replacements/Upgrades/Rehabilitation Project Considered: Must Do Project Occurrence: One-time Originator: Omar Anzaldua Category: Resubmission Estimated Costs by Fiscal Year FY 2016 FY 2017 FY 2018 FY 2019 FY 2020 TOTAL $0 $0 $0 $0 $535,000 $535,000 Description: Complete lift station rehabilitation including: wet well rehabilitation/replacement, replacement of corroded piping, fitting, valves, pumps, pump base ells, guide rails, wet well hatch, electrical controls, installation of new perimeter fence and concrete driveway. Project Cost Savings & Revenues: Minimal down time and minimal expenses on parts. PROJECT REFERENCE WW44 Lift Station No. 80 Rehabilitation Organization: 3230 Wastewater Lift Stations Funding Source: Commercial Paper Project Related to: Replacements/Upgrades/Rehabilitation Project Considered: Must Do Project Occurrence: One-time Originator: Omar Anzaldua Category: Resubmission Estimated Costs by Fiscal Year FY 2016 FY 2017 FY 2018 FY 2019 FY 2020 TOTAL $0 $0 $0 $0 $535,000 $535,000 Description: Complete lift station rehabilitation including: wet well rehabilitation/replacement, replacement of corroded piping, fitting, valves, pumps, pump base ells, guide rails, wet well hatch, electrical controls, installation of new perimeter fence and concrete driveway. Project Cost Savings & Revenues: Minimal down time and minimal expenses on parts.
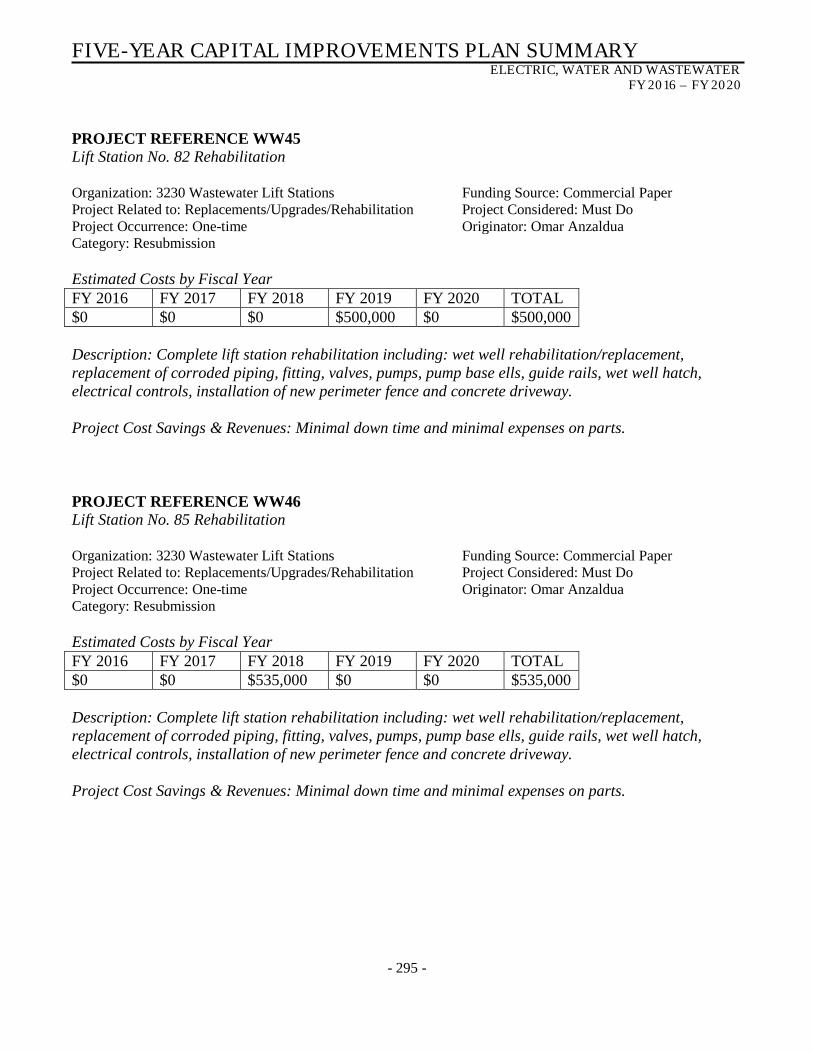
FIVE-YEAR CAPITAL IMPROVEMENTS PLAN SUMMARY ELECTRIC, WATER AND WASTEWATER
FY 2016 – FY 2020
- 295 -
PROJECT REFERENCE WW45 Lift Station No. 82 Rehabilitation Organization: 3230 Wastewater Lift Stations Funding Source: Commercial Paper Project Related to: Replacements/Upgrades/Rehabilitation Project Considered: Must Do Project Occurrence: One-time Originator: Omar Anzaldua Category: Resubmission Estimated Costs by Fiscal Year FY 2016 FY 2017 FY 2018 FY 2019 FY 2020 TOTAL $0 $0 $0 $500,000 $0 $500,000 Description: Complete lift station rehabilitation including: wet well rehabilitation/replacement, replacement of corroded piping, fitting, valves, pumps, pump base ells, guide rails, wet well hatch, electrical controls, installation of new perimeter fence and concrete driveway. Project Cost Savings & Revenues: Minimal down time and minimal expenses on parts. PROJECT REFERENCE WW46 Lift Station No. 85 Rehabilitation Organization: 3230 Wastewater Lift Stations Funding Source: Commercial Paper Project Related to: Replacements/Upgrades/Rehabilitation Project Considered: Must Do Project Occurrence: One-time Originator: Omar Anzaldua Category: Resubmission Estimated Costs by Fiscal Year FY 2016 FY 2017 FY 2018 FY 2019 FY 2020 TOTAL $0 $0 $535,000 $0 $0 $535,000 Description: Complete lift station rehabilitation including: wet well rehabilitation/replacement, replacement of corroded piping, fitting, valves, pumps, pump base ells, guide rails, wet well hatch, electrical controls, installation of new perimeter fence and concrete driveway. Project Cost Savings & Revenues: Minimal down time and minimal expenses on parts.

FIVE-YEAR CAPITAL IMPROVEMENTS PLAN SUMMARY ELECTRIC, WATER AND WASTEWATER
FY 2016 – FY 2020
- 296 -
PROJECT REFERENCE WW47 Lift Station No. 89 Rehabilitation Organization: 3230 Wastewater Lift Stations Funding Source: Commercial Paper Project Related to: Replacements/Upgrades/Rehabilitation Project Considered: Must Do Project Occurrence: One-time Originator: Omar Anzaldua Category: Resubmission Estimated Costs by Fiscal Year FY 2016 FY 2017 FY 2018 FY 2019 FY 2020 TOTAL $0 $0 $515,000 $0 $0 $515,000 Description: Complete lift station rehabilitation including: wet well rehabilitation/replacement, replacement of corroded piping, fitting, valves, pumps, pump base ells, guide rails, wet well hatch, electrical controls, installation of new perimeter fence and concrete driveway. Project Cost Savings & Revenues: Minimal down time and minimal expenses on parts. PROJECT REFERENCE WW48 Lift Station No. 95 Rehabilitation Organization: 3230 Wastewater Lift Stations Funding Source: Commercial Paper Project Related to: Replacements/Upgrades/Rehabilitation Project Considered: Must Do Project Occurrence: One-time Originator: Omar Anzaldua Category: Resubmission Estimated Costs by Fiscal Year FY 2016 FY 2017 FY 2018 FY 2019 FY 2020 TOTAL $0 $0 $535,000 $0 $0 $535,000 Description: Complete lift station rehabilitation including: wet well rehabilitation/replacement, replacement of corroded piping, fitting, valves, pumps, pump base ells, guide rails, wet well hatch, electrical controls, installation of new perimeter fence and concrete driveway. Project Cost Savings & Revenues: Minimal down time and minimal expenses on parts.

FIVE-YEAR CAPITAL IMPROVEMENTS PLAN SUMMARY ELECTRIC, WATER AND WASTEWATER
FY 2016 – FY 2020
- 297 -
PROJECT REFERENCE WW49 Lift Station No. 99 Rehabilitation Organization: 3230 Wastewater Lift Stations Funding Source: Commercial Paper Project Related to: Replacements/Upgrades/Rehabilitation Project Considered: Must Do Project Occurrence: One-time Originator: Omar Anzaldua Category: Resubmission Estimated Costs by Fiscal Year FY 2016 FY 2017 FY 2018 FY 2019 FY 2020 TOTAL $0 $0 $0 $535,000 $0 $535,000 Description: Complete lift station rehabilitation including: wet well rehabilitation/replacement, replacement of corroded piping, fitting, valves, pumps, pump base ells, guide rails, wet well hatch, electrical controls, installation of new perimeter fence and concrete driveway. Project Cost Savings & Revenues: Minimal down time and minimal expenses on parts. PROJECT REFERENCE WW50 Lift Station No. 101 Rehabilitation Organization: 3230 Wastewater Lift Stations Funding Source: Commercial Paper Project Related to: Replacements/Upgrades/Rehabilitation Project Considered: Must Do Project Occurrence: One-time Originator: Omar Anzaldua Category: Resubmission Estimated Costs by Fiscal Year FY 2016 FY 2017 FY 2018 FY 2019 FY 2020 TOTAL $0 $0 $0 $0 $535,000 $535,000 Description: Complete lift station rehabilitation including: wet well rehabilitation/replacement, replacement of corroded piping, fitting, valves, pumps, pump base ells, guide rails, wet well hatch, electrical controls, installation of new perimeter fence and concrete driveway. Project Cost Savings & Revenues: Minimal down time and minimal expenses on parts.

FIVE-YEAR CAPITAL IMPROVEMENTS PLAN SUMMARY ELECTRIC, WATER AND WASTEWATER
FY 2016 – FY 2020
- 298 -
PROJECT REFERENCE WW51 Lift Station No. 102 Rehabilitation Organization: 3230 Wastewater Lift Stations Funding Source: Commercial Paper Project Related to: Replacements/Upgrades/Rehabilitation Project Considered: Must Do Project Occurrence: One-time Originator: Omar Anzaldua Category: Resubmission Estimated Costs by Fiscal Year FY 2016 FY 2017 FY 2018 FY 2019 FY 2020 TOTAL $0 $0 $0 $0 $635,000 $635,000 Description: Complete lift station rehabilitation including: wet well rehabilitation/replacement, replacement of corroded piping, fitting, valves, pumps, pump base ells, guide rails, wet well hatch, electrical controls, installation of new perimeter fence and concrete driveway. Project Cost Savings & Revenues: Minimal down time and minimal expenses on parts. PROJECT REFERENCE WW52 Lift Station No. 105 Rehabilitation Organization: 3230 Wastewater Lift Stations Funding Source: Commercial Paper Project Related to: Replacements/Upgrades/Rehabilitation Project Considered: Must Do Project Occurrence: One-time Originator: Omar Anzaldua Category: Resubmission Estimated Costs by Fiscal Year FY 2016 FY 2017 FY 2018 FY 2019 FY 2020 TOTAL $0 $0 $0 $0 $535,000 $535,000 Description: Complete lift station rehabilitation including: wet well rehabilitation/replacement, replacement of corroded piping, fitting, valves, pumps, pump base ells, guide rails, wet well hatch, electrical controls, installation of new perimeter fence and concrete driveway. Project Cost Savings & Revenues: Minimal down time and minimal expenses on parts.

FIVE-YEAR CAPITAL IMPROVEMENTS PLAN SUMMARY ELECTRIC, WATER AND WASTEWATER
FY 2016 – FY 2020
- 299 -
PROJECT REFERENCE WW53 Lift Station No. 106 Rehabilitation Organization: 3230 Wastewater Lift Stations Funding Source: Commercial Paper Project Related to: Replacements/Upgrades/Rehabilitation Project Considered: Must Do Project Occurrence: One-time Originator: Omar Anzaldua Category: Resubmission Estimated Costs by Fiscal Year FY 2016 FY 2017 FY 2018 FY 2019 FY 2020 TOTAL $0 $0 $0 $0 $535,000 $535,000 Description: Complete lift station rehabilitation including: wet well rehabilitation/replacement, replacement of corroded piping, fitting, valves, pumps, pump base ells, guide rails, wet well hatch, electrical controls, installation of new perimeter fence and concrete driveway. Project Cost Savings & Revenues: Minimal down time and minimal expenses on parts. PROJECT REFERENCE WW54 Lift Station No. 108 Rehabilitation Organization: 3230 Wastewater Lift Stations Funding Source: Commercial Paper Project Related to: Replacements/Upgrades/Rehabilitation Project Considered: Must Do Project Occurrence: One-time Originator: Omar Anzaldua Category: Resubmission Estimated Costs by Fiscal Year FY 2016 FY 2017 FY 2018 FY 2019 FY 2020 TOTAL $535,000 $0 $0 $0 $0 $535,000 Description: Complete lift station rehabilitation including: wet well rehabilitation/replacement, replacement of corroded piping, fitting, valves, pumps, pump base ells, guide rails, wet well hatch, electrical controls, installation of new perimeter fence and concrete driveway. Project Cost Savings & Revenues: Minimal down time and minimal expenses on parts.
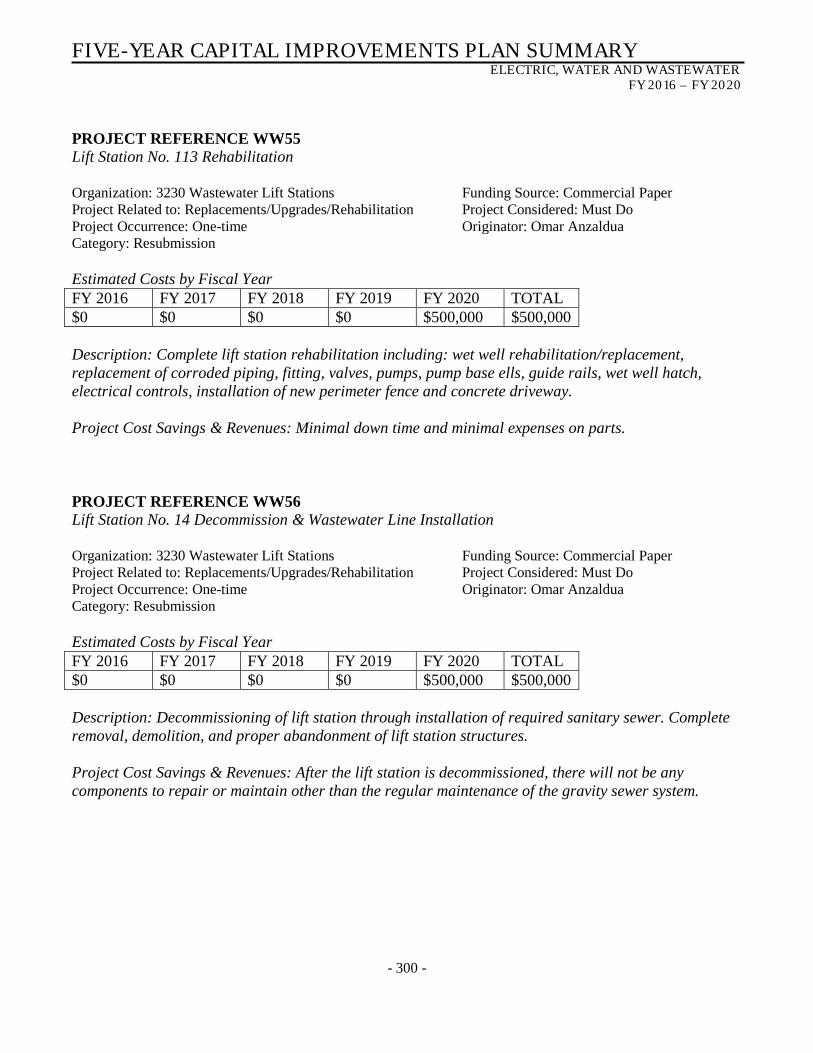
FIVE-YEAR CAPITAL IMPROVEMENTS PLAN SUMMARY ELECTRIC, WATER AND WASTEWATER
FY 2016 – FY 2020
- 300 -
PROJECT REFERENCE WW55 Lift Station No. 113 Rehabilitation Organization: 3230 Wastewater Lift Stations Funding Source: Commercial Paper Project Related to: Replacements/Upgrades/Rehabilitation Project Considered: Must Do Project Occurrence: One-time Originator: Omar Anzaldua Category: Resubmission Estimated Costs by Fiscal Year FY 2016 FY 2017 FY 2018 FY 2019 FY 2020 TOTAL $0 $0 $0 $0 $500,000 $500,000 Description: Complete lift station rehabilitation including: wet well rehabilitation/replacement, replacement of corroded piping, fitting, valves, pumps, pump base ells, guide rails, wet well hatch, electrical controls, installation of new perimeter fence and concrete driveway. Project Cost Savings & Revenues: Minimal down time and minimal expenses on parts. PROJECT REFERENCE WW56 Lift Station No. 14 Decommission & Wastewater Line Installation Organization: 3230 Wastewater Lift Stations Funding Source: Commercial Paper Project Related to: Replacements/Upgrades/Rehabilitation Project Considered: Must Do Project Occurrence: One-time Originator: Omar Anzaldua Category: Resubmission Estimated Costs by Fiscal Year FY 2016 FY 2017 FY 2018 FY 2019 FY 2020 TOTAL $0 $0 $0 $0 $500,000 $500,000 Description: Decommissioning of lift station through installation of required sanitary sewer. Complete removal, demolition, and proper abandonment of lift station structures. Project Cost Savings & Revenues: After the lift station is decommissioned, there will not be any components to repair or maintain other than the regular maintenance of the gravity sewer system.
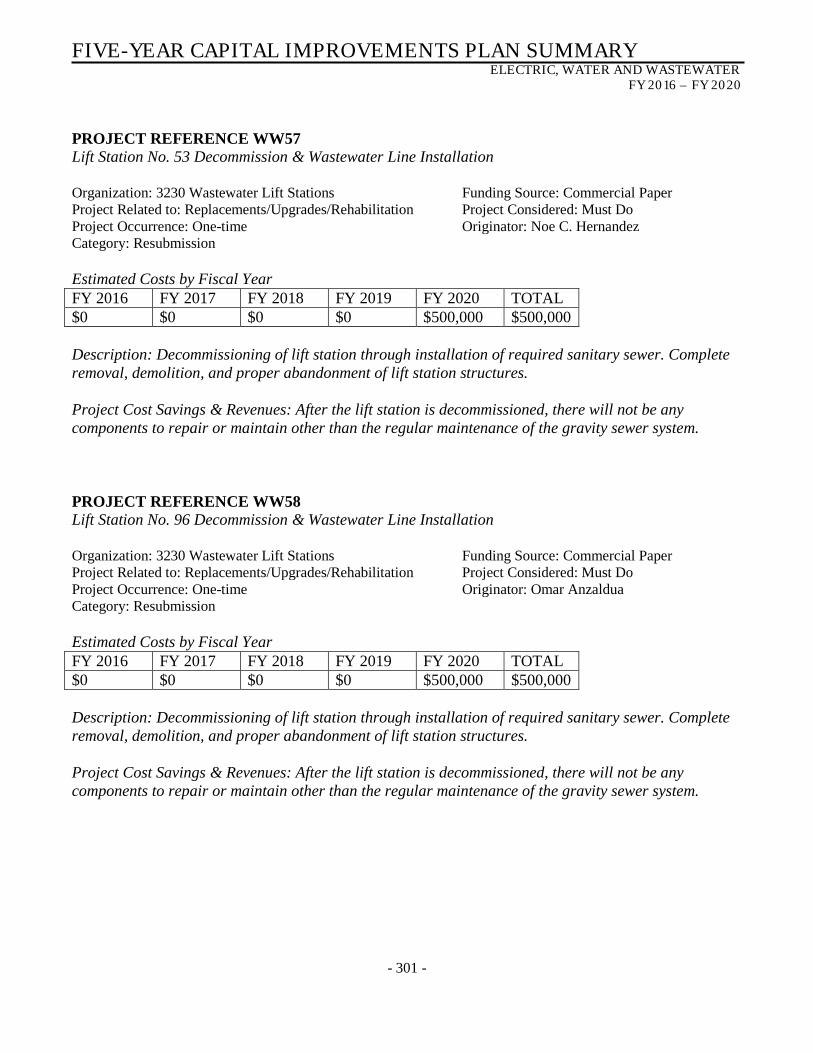
FIVE-YEAR CAPITAL IMPROVEMENTS PLAN SUMMARY ELECTRIC, WATER AND WASTEWATER
FY 2016 – FY 2020
- 301 -
PROJECT REFERENCE WW57 Lift Station No. 53 Decommission & Wastewater Line Installation Organization: 3230 Wastewater Lift Stations Funding Source: Commercial Paper Project Related to: Replacements/Upgrades/Rehabilitation Project Considered: Must Do Project Occurrence: One-time Originator: Noe C. Hernandez Category: Resubmission Estimated Costs by Fiscal Year FY 2016 FY 2017 FY 2018 FY 2019 FY 2020 TOTAL $0 $0 $0 $0 $500,000 $500,000 Description: Decommissioning of lift station through installation of required sanitary sewer. Complete removal, demolition, and proper abandonment of lift station structures. Project Cost Savings & Revenues: After the lift station is decommissioned, there will not be any components to repair or maintain other than the regular maintenance of the gravity sewer system. PROJECT REFERENCE WW58 Lift Station No. 96 Decommission & Wastewater Line Installation Organization: 3230 Wastewater Lift Stations Funding Source: Commercial Paper Project Related to: Replacements/Upgrades/Rehabilitation Project Considered: Must Do Project Occurrence: One-time Originator: Omar Anzaldua Category: Resubmission Estimated Costs by Fiscal Year FY 2016 FY 2017 FY 2018 FY 2019 FY 2020 TOTAL $0 $0 $0 $0 $500,000 $500,000 Description: Decommissioning of lift station through installation of required sanitary sewer. Complete removal, demolition, and proper abandonment of lift station structures. Project Cost Savings & Revenues: After the lift station is decommissioned, there will not be any components to repair or maintain other than the regular maintenance of the gravity sewer system.

FIVE-YEAR CAPITAL IMPROVEMENTS PLAN SUMMARY ELECTRIC, WATER AND WASTEWATER
FY 2016 – FY 2020
- 302 -
PROJECT REFERENCE WW59 Lift Station No. 103 Decommission & Wastewater Line Installation Organization: 3230 Wastewater Lift Stations Funding Source: Commercial Paper Project Related to: Replacements/Upgrades/Rehabilitation Project Considered: Must Do Project Occurrence: One-time Originator: Omar Anzaldua Category: Resubmission Estimated Costs by Fiscal Year FY 2016 FY 2017 FY 2018 FY 2019 FY 2020 TOTAL $0 $0 $0 $0 $500,000 $500,000 Description: Decommissioning of lift station through installation of required sanitary sewer. Complete removal, demolition, and proper abandonment of lift station structures. Project Cost Savings & Revenues: After the lift station is decommissioned, there will not be any components to repair or maintain other than the regular maintenance of the gravity sewer system. PROJECT REFERENCE WW60 Lift Station No. 9 Pump Replacement Organization: 3230 Wastewater Lift Stations Funding Source: Commercial Paper Project Related to: Replacements/Upgrades/Rehabilitation Project Considered: Must Do Project Occurrence: One-time Originator: Noe C. Hernandez Category: Resubmission Estimated Costs by Fiscal Year FY 2016 FY 2017 FY 2018 FY 2019 FY 2020 TOTAL $36,000 $0 $0 $0 $0 $36,000 Description: New submersible wastewater non-clog pump. Project Cost Savings & Revenues: Minimal down time and O&M cost savings.
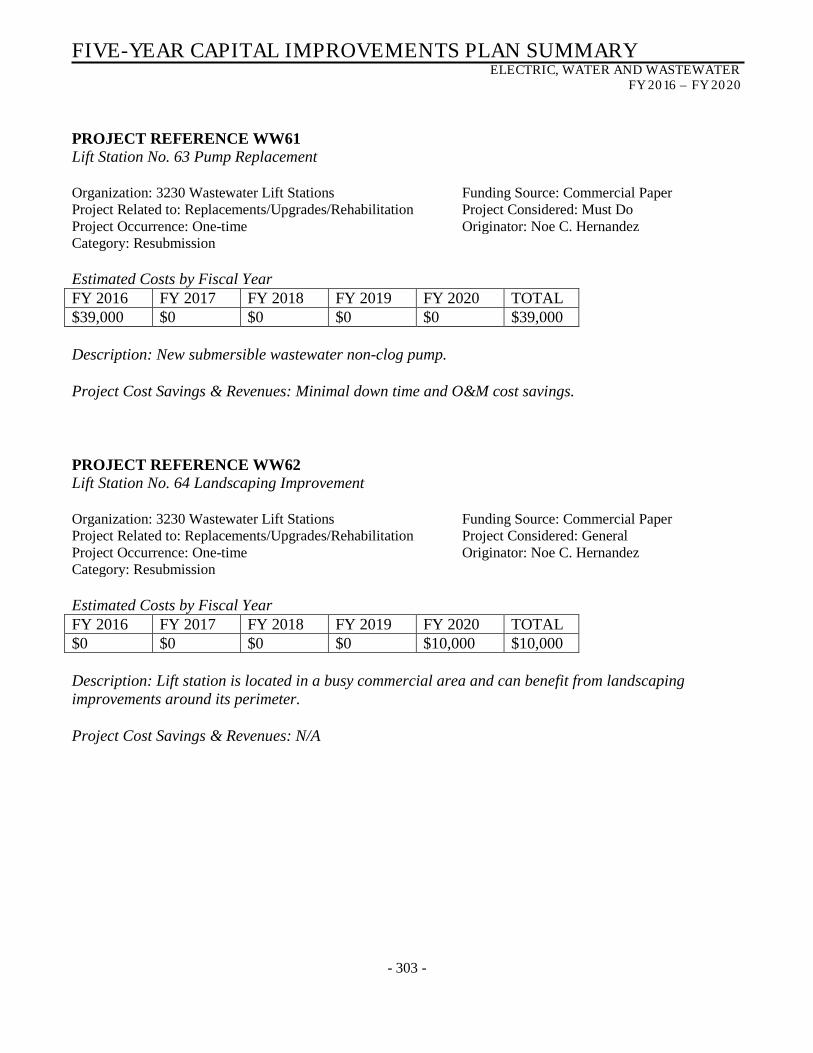
FIVE-YEAR CAPITAL IMPROVEMENTS PLAN SUMMARY ELECTRIC, WATER AND WASTEWATER
FY 2016 – FY 2020
- 303 -
PROJECT REFERENCE WW61 Lift Station No. 63 Pump Replacement Organization: 3230 Wastewater Lift Stations Funding Source: Commercial Paper Project Related to: Replacements/Upgrades/Rehabilitation Project Considered: Must Do Project Occurrence: One-time Originator: Noe C. Hernandez Category: Resubmission Estimated Costs by Fiscal Year FY 2016 FY 2017 FY 2018 FY 2019 FY 2020 TOTAL $39,000 $0 $0 $0 $0 $39,000 Description: New submersible wastewater non-clog pump. Project Cost Savings & Revenues: Minimal down time and O&M cost savings. PROJECT REFERENCE WW62 Lift Station No. 64 Landscaping Improvement Organization: 3230 Wastewater Lift Stations Funding Source: Commercial Paper Project Related to: Replacements/Upgrades/Rehabilitation Project Considered: General Project Occurrence: One-time Originator: Noe C. Hernandez Category: Resubmission Estimated Costs by Fiscal Year FY 2016 FY 2017 FY 2018 FY 2019 FY 2020 TOTAL $0 $0 $0 $0 $10,000 $10,000 Description: Lift station is located in a busy commercial area and can benefit from landscaping improvements around its perimeter. Project Cost Savings & Revenues: N/A

FIVE-YEAR CAPITAL IMPROVEMENTS PLAN SUMMARY ELECTRIC, WATER AND WASTEWATER
FY 2016 – FY 2020
- 304 -
PROJECT REFERENCE WW63 Lift Station No. 15 Turbulence Reduction Organization: 3230 Wastewater Lift Stations Funding Source: Commercial Paper Project Related to: Replacements/Upgrades/Rehabilitation Project Considered: Must Do Project Occurrence: One-time Originator: Omar Anzaldua Category: Resubmission Estimated Costs by Fiscal Year FY 2016 FY 2017 FY 2018 FY 2019 FY 2020 TOTAL $0 $0 $0 $0 $100,000 $100,000 Description: Modifications to the receiving manholes and force main outfall at lift station No. 15 to reduce wastewater turbulence, thereby reducing corrosion and foul odor generation. Project Cost Savings & Revenues: Cost savings due to less odor control. PROJECT REFERENCE WW64 Lift Station No. 106 Turbulence Reduction Organization: 3230 Wastewater Lift Stations Funding Source: Commercial Paper Project Related to: Replacements/Upgrades/Rehabilitation Project Considered: Must Do Project Occurrence: One-time Originator: Omar Anzaldua Category: Resubmission Estimated Costs by Fiscal Year FY 2016 FY 2017 FY 2018 FY 2019 FY 2020 TOTAL $0 $0 $0 $0 $100,000 $100,000 Description: Modifications to the receiving manholes and force main outfall at lift station No. 106 to reduce wastewater turbulence, thereby reducing corrosion and foul odor generation. Project Cost Savings & Revenues: Cost savings due to less odor control.
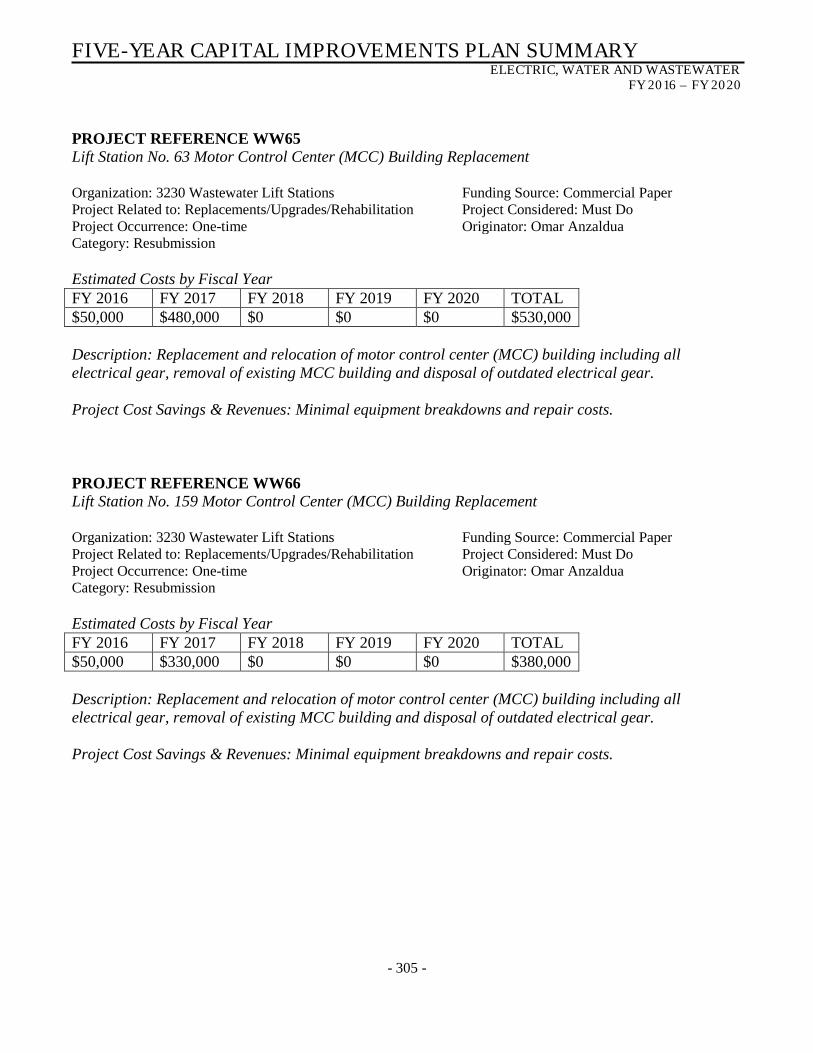
FIVE-YEAR CAPITAL IMPROVEMENTS PLAN SUMMARY ELECTRIC, WATER AND WASTEWATER
FY 2016 – FY 2020
- 305 -
PROJECT REFERENCE WW65 Lift Station No. 63 Motor Control Center (MCC) Building Replacement Organization: 3230 Wastewater Lift Stations Funding Source: Commercial Paper Project Related to: Replacements/Upgrades/Rehabilitation Project Considered: Must Do Project Occurrence: One-time Originator: Omar Anzaldua Category: Resubmission Estimated Costs by Fiscal Year FY 2016 FY 2017 FY 2018 FY 2019 FY 2020 TOTAL $50,000 $480,000 $0 $0 $0 $530,000 Description: Replacement and relocation of motor control center (MCC) building including all electrical gear, removal of existing MCC building and disposal of outdated electrical gear. Project Cost Savings & Revenues: Minimal equipment breakdowns and repair costs. PROJECT REFERENCE WW66 Lift Station No. 159 Motor Control Center (MCC) Building Replacement Organization: 3230 Wastewater Lift Stations Funding Source: Commercial Paper Project Related to: Replacements/Upgrades/Rehabilitation Project Considered: Must Do Project Occurrence: One-time Originator: Omar Anzaldua Category: Resubmission Estimated Costs by Fiscal Year FY 2016 FY 2017 FY 2018 FY 2019 FY 2020 TOTAL $50,000 $330,000 $0 $0 $0 $380,000 Description: Replacement and relocation of motor control center (MCC) building including all electrical gear, removal of existing MCC building and disposal of outdated electrical gear. Project Cost Savings & Revenues: Minimal equipment breakdowns and repair costs.
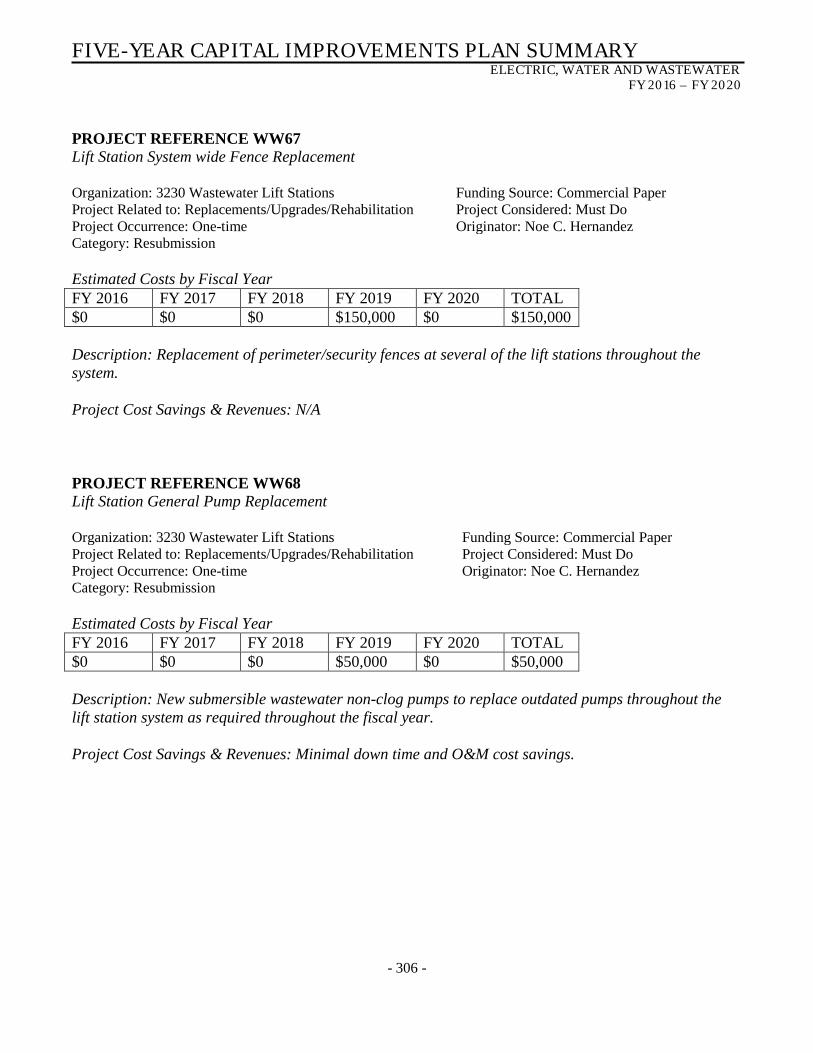
FIVE-YEAR CAPITAL IMPROVEMENTS PLAN SUMMARY ELECTRIC, WATER AND WASTEWATER
FY 2016 – FY 2020
- 306 -
PROJECT REFERENCE WW67 Lift Station System wide Fence Replacement Organization: 3230 Wastewater Lift Stations Funding Source: Commercial Paper Project Related to: Replacements/Upgrades/Rehabilitation Project Considered: Must Do Project Occurrence: One-time Originator: Noe C. Hernandez Category: Resubmission Estimated Costs by Fiscal Year FY 2016 FY 2017 FY 2018 FY 2019 FY 2020 TOTAL $0 $0 $0 $150,000 $0 $150,000 Description: Replacement of perimeter/security fences at several of the lift stations throughout the system. Project Cost Savings & Revenues: N/A PROJECT REFERENCE WW68 Lift Station General Pump Replacement Organization: 3230 Wastewater Lift Stations Funding Source: Commercial Paper Project Related to: Replacements/Upgrades/Rehabilitation Project Considered: Must Do Project Occurrence: One-time Originator: Noe C. Hernandez Category: Resubmission Estimated Costs by Fiscal Year FY 2016 FY 2017 FY 2018 FY 2019 FY 2020 TOTAL $0 $0 $0 $50,000 $0 $50,000 Description: New submersible wastewater non-clog pumps to replace outdated pumps throughout the lift station system as required throughout the fiscal year. Project Cost Savings & Revenues: Minimal down time and O&M cost savings.
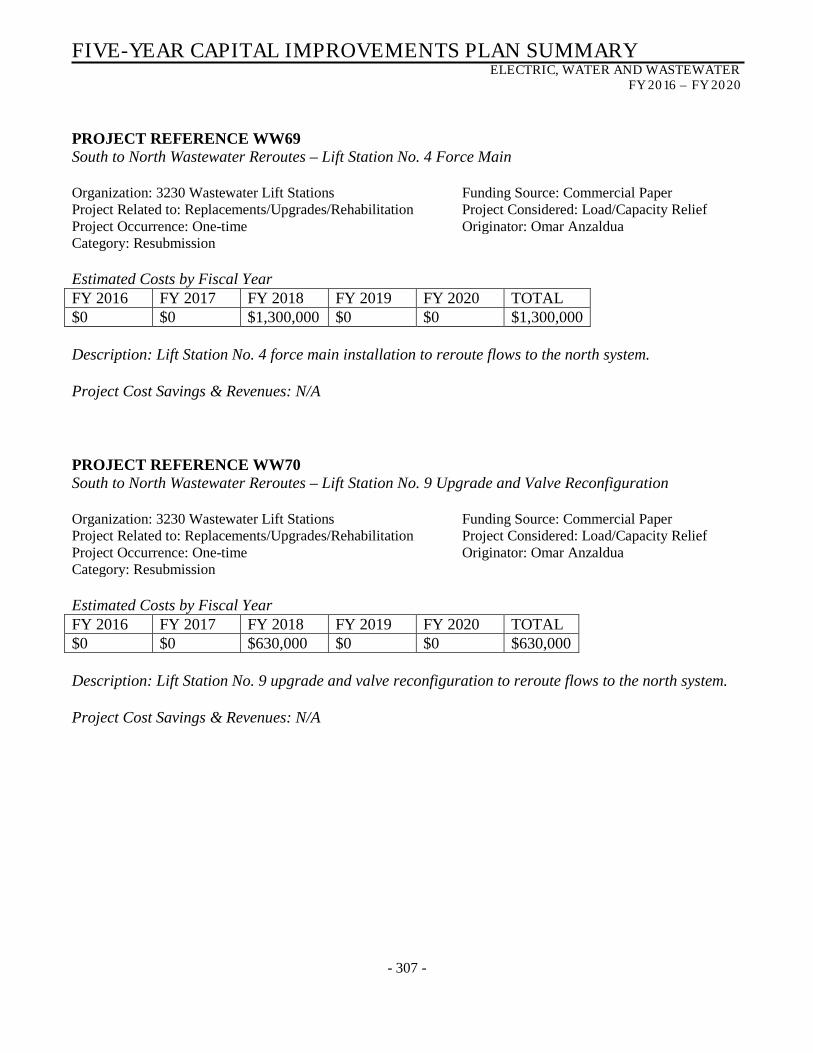
FIVE-YEAR CAPITAL IMPROVEMENTS PLAN SUMMARY ELECTRIC, WATER AND WASTEWATER
FY 2016 – FY 2020
- 307 -
PROJECT REFERENCE WW69 South to North Wastewater Reroutes – Lift Station No. 4 Force Main Organization: 3230 Wastewater Lift Stations Funding Source: Commercial Paper Project Related to: Replacements/Upgrades/Rehabilitation Project Considered: Load/Capacity Relief Project Occurrence: One-time Originator: Omar Anzaldua Category: Resubmission Estimated Costs by Fiscal Year FY 2016 FY 2017 FY 2018 FY 2019 FY 2020 TOTAL $0 $0 $1,300,000 $0 $0 $1,300,000 Description: Lift Station No. 4 force main installation to reroute flows to the north system. Project Cost Savings & Revenues: N/A PROJECT REFERENCE WW70 South to North Wastewater Reroutes – Lift Station No. 9 Upgrade and Valve Reconfiguration Organization: 3230 Wastewater Lift Stations Funding Source: Commercial Paper Project Related to: Replacements/Upgrades/Rehabilitation Project Considered: Load/Capacity Relief Project Occurrence: One-time Originator: Omar Anzaldua Category: Resubmission Estimated Costs by Fiscal Year FY 2016 FY 2017 FY 2018 FY 2019 FY 2020 TOTAL $0 $0 $630,000 $0 $0 $630,000 Description: Lift Station No. 9 upgrade and valve reconfiguration to reroute flows to the north system. Project Cost Savings & Revenues: N/A
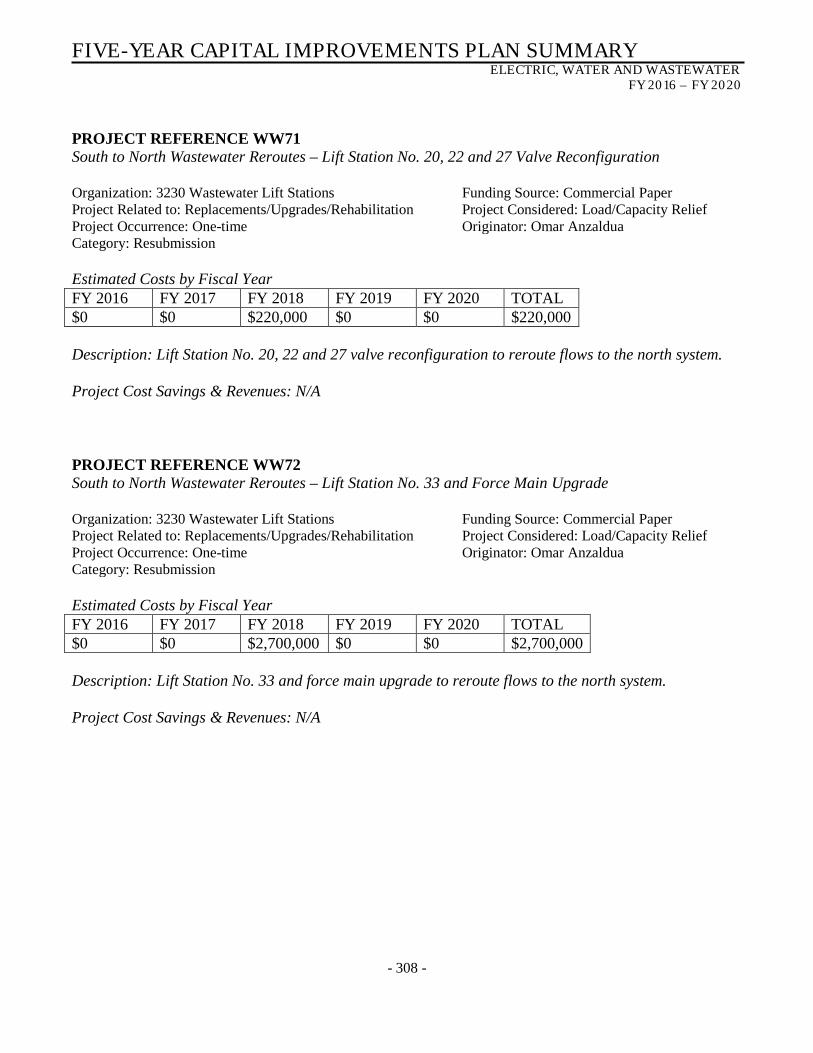
FIVE-YEAR CAPITAL IMPROVEMENTS PLAN SUMMARY ELECTRIC, WATER AND WASTEWATER
FY 2016 – FY 2020
- 308 -
PROJECT REFERENCE WW71 South to North Wastewater Reroutes – Lift Station No. 20, 22 and 27 Valve Reconfiguration Organization: 3230 Wastewater Lift Stations Funding Source: Commercial Paper Project Related to: Replacements/Upgrades/Rehabilitation Project Considered: Load/Capacity Relief Project Occurrence: One-time Originator: Omar Anzaldua Category: Resubmission Estimated Costs by Fiscal Year FY 2016 FY 2017 FY 2018 FY 2019 FY 2020 TOTAL $0 $0 $220,000 $0 $0 $220,000 Description: Lift Station No. 20, 22 and 27 valve reconfiguration to reroute flows to the north system. Project Cost Savings & Revenues: N/A PROJECT REFERENCE WW72 South to North Wastewater Reroutes – Lift Station No. 33 and Force Main Upgrade Organization: 3230 Wastewater Lift Stations Funding Source: Commercial Paper Project Related to: Replacements/Upgrades/Rehabilitation Project Considered: Load/Capacity Relief Project Occurrence: One-time Originator: Omar Anzaldua Category: Resubmission Estimated Costs by Fiscal Year FY 2016 FY 2017 FY 2018 FY 2019 FY 2020 TOTAL $0 $0 $2,700,000 $0 $0 $2,700,000 Description: Lift Station No. 33 and force main upgrade to reroute flows to the north system. Project Cost Savings & Revenues: N/A

FIVE-YEAR CAPITAL IMPROVEMENTS PLAN SUMMARY ELECTRIC, WATER AND WASTEWATER
FY 2016 – FY 2020
- 309 -
PROJECT REFERENCE WW73 SWWTP Parking Lot Addition Organization: 3230 Wastewater Lift Stations Funding Source: Commercial Paper Project Related to: Replacements/Upgrades/Rehabilitation Project Considered: General Project Occurrence: One-time Originator: Omar Anzaldua Category: Resubmission Estimated Costs by Fiscal Year FY 2016 FY 2017 FY 2018 FY 2019 FY 2020 TOTAL $30,000 $0 $0 $0 $0 $30,000 Description: Addition of paved parking lot at the South Wastewater Treatment Plant to be used by maintenance personnel to park company and employee vehicles. Project Cost Savings & Revenues: N/A PROJECT REFERENCE WW74 Lift Station No. 111 Force Main Reroute to Robindale WWTP Organization: 3230 Wastewater Lift Stations Funding Source: Impact Fees Project Related to: Growth Project Considered: Load/Capacity Relief Project Occurrence: One-time Originator: Omar Anzaldua Category: Resubmission Estimated Costs by Fiscal Year FY 2016 FY 2017 FY 2018 FY 2019 FY 2020 TOTAL $0 $0 $0 $0 $3,307,000 $3,307,000 Description: This project was identified in BPUB’s 2010 Water and Wastewater Master Plan. The project entails installing a 30-inch diameter force main from lift station 111 directly to the North Wastewater Treatment Plant. Project Cost Savings & Revenues: N/A
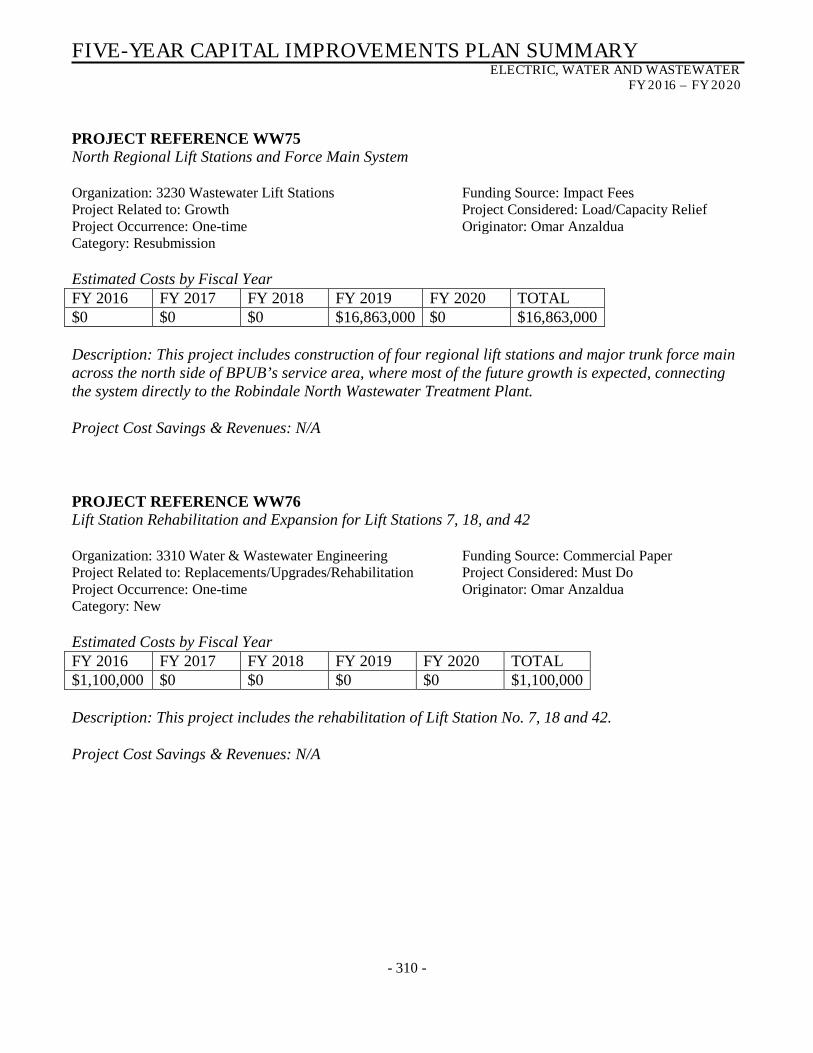
FIVE-YEAR CAPITAL IMPROVEMENTS PLAN SUMMARY ELECTRIC, WATER AND WASTEWATER
FY 2016 – FY 2020
- 310 -
PROJECT REFERENCE WW75 North Regional Lift Stations and Force Main System Organization: 3230 Wastewater Lift Stations Funding Source: Impact Fees Project Related to: Growth Project Considered: Load/Capacity Relief Project Occurrence: One-time Originator: Omar Anzaldua Category: Resubmission Estimated Costs by Fiscal Year FY 2016 FY 2017 FY 2018 FY 2019 FY 2020 TOTAL $0 $0 $0 $16,863,000 $0 $16,863,000 Description: This project includes construction of four regional lift stations and major trunk force main across the north side of BPUB’s service area, where most of the future growth is expected, connecting the system directly to the Robindale North Wastewater Treatment Plant. Project Cost Savings & Revenues: N/A PROJECT REFERENCE WW76 Lift Station Rehabilitation and Expansion for Lift Stations 7, 18, and 42 Organization: 3310 Water & Wastewater Engineering Funding Source: Commercial Paper Project Related to: Replacements/Upgrades/Rehabilitation Project Considered: Must Do Project Occurrence: One-time Originator: Omar Anzaldua Category: New Estimated Costs by Fiscal Year FY 2016 FY 2017 FY 2018 FY 2019 FY 2020 TOTAL $1,100,000 $0 $0 $0 $0 $1,100,000 Description: This project includes the rehabilitation of Lift Station No. 7, 18 and 42. Project Cost Savings & Revenues: N/A
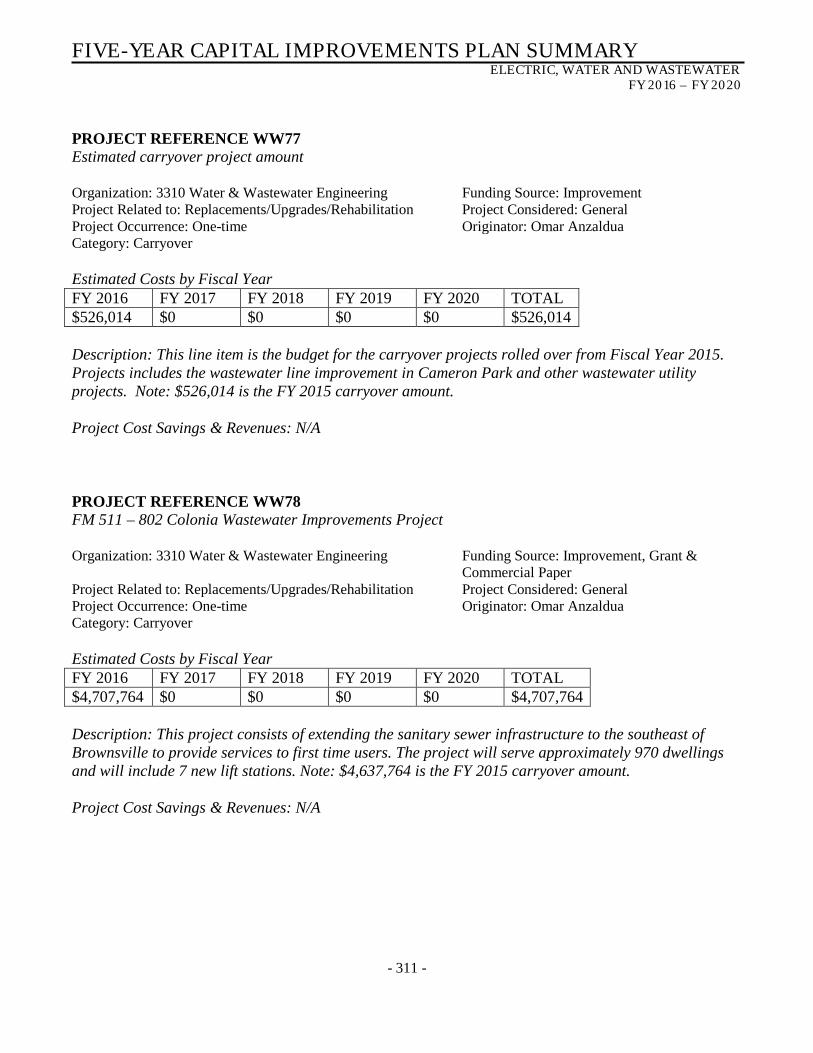
FIVE-YEAR CAPITAL IMPROVEMENTS PLAN SUMMARY ELECTRIC, WATER AND WASTEWATER
FY 2016 – FY 2020
- 311 -
PROJECT REFERENCE WW77 Estimated carryover project amount Organization: 3310 Water & Wastewater Engineering Funding Source: Improvement Project Related to: Replacements/Upgrades/Rehabilitation Project Considered: General Project Occurrence: One-time Originator: Omar Anzaldua Category: Carryover Estimated Costs by Fiscal Year FY 2016 FY 2017 FY 2018 FY 2019 FY 2020 TOTAL $526,014 $0 $0 $0 $0 $526,014 Description: This line item is the budget for the carryover projects rolled over from Fiscal Year 2015. Projects includes the wastewater line improvement in Cameron Park and other wastewater utility projects. Note: $526,014 is the FY 2015 carryover amount. Project Cost Savings & Revenues: N/A PROJECT REFERENCE WW78 FM 511 – 802 Colonia Wastewater Improvements Project Organization: 3310 Water & Wastewater Engineering Funding Source: Improvement, Grant &
Commercial Paper Project Related to: Replacements/Upgrades/Rehabilitation Project Considered: General Project Occurrence: One-time Originator: Omar Anzaldua Category: Carryover Estimated Costs by Fiscal Year FY 2016 FY 2017 FY 2018 FY 2019 FY 2020 TOTAL $4,707,764 $0 $0 $0 $0 $4,707,764 Description: This project consists of extending the sanitary sewer infrastructure to the southeast of Brownsville to provide services to first time users. The project will serve approximately 970 dwellings and will include 7 new lift stations. Note: $4,637,764 is the FY 2015 carryover amount. Project Cost Savings & Revenues: N/A
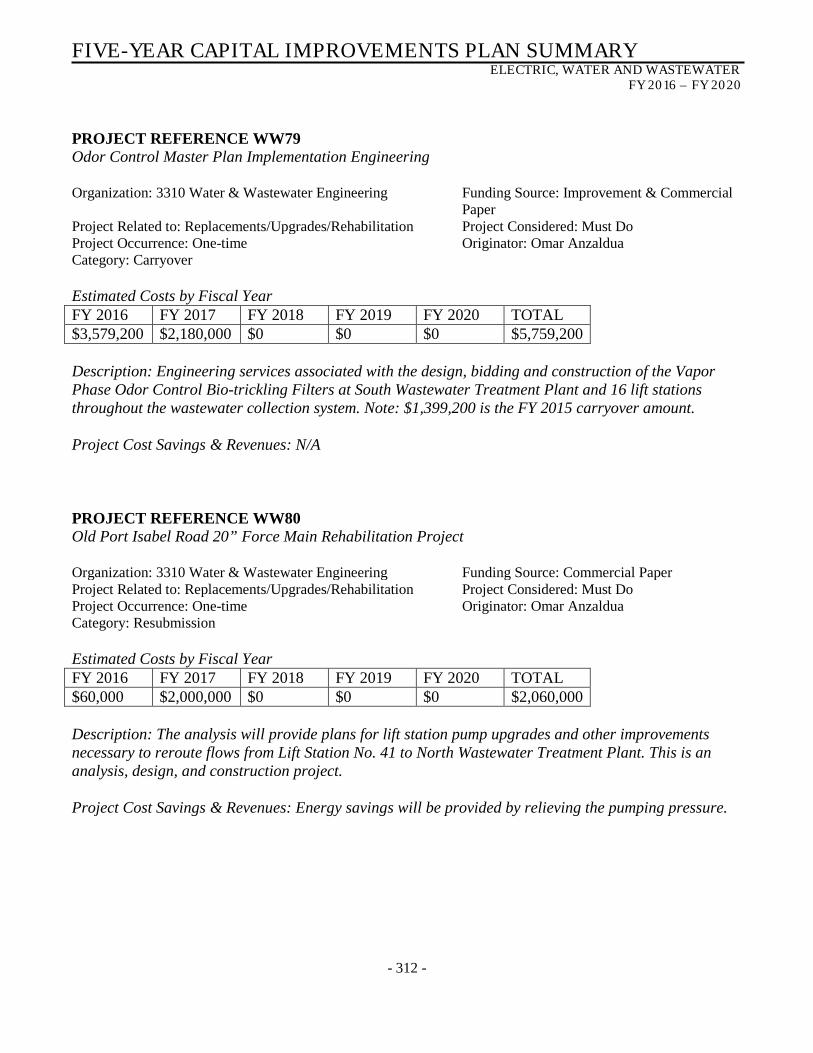
FIVE-YEAR CAPITAL IMPROVEMENTS PLAN SUMMARY ELECTRIC, WATER AND WASTEWATER
FY 2016 – FY 2020
- 312 -
PROJECT REFERENCE WW79 Odor Control Master Plan Implementation Engineering Organization: 3310 Water & Wastewater Engineering Funding Source: Improvement & Commercial
Paper Project Related to: Replacements/Upgrades/Rehabilitation Project Considered: Must Do Project Occurrence: One-time Originator: Omar Anzaldua Category: Carryover Estimated Costs by Fiscal Year FY 2016 FY 2017 FY 2018 FY 2019 FY 2020 TOTAL $3,579,200 $2,180,000 $0 $0 $0 $5,759,200 Description: Engineering services associated with the design, bidding and construction of the Vapor Phase Odor Control Bio-trickling Filters at South Wastewater Treatment Plant and 16 lift stations throughout the wastewater collection system. Note: $1,399,200 is the FY 2015 carryover amount. Project Cost Savings & Revenues: N/A PROJECT REFERENCE WW80 Old Port Isabel Road 20” Force Main Rehabilitation Project Organization: 3310 Water & Wastewater Engineering Funding Source: Commercial Paper Project Related to: Replacements/Upgrades/Rehabilitation Project Considered: Must Do Project Occurrence: One-time Originator: Omar Anzaldua Category: Resubmission Estimated Costs by Fiscal Year FY 2016 FY 2017 FY 2018 FY 2019 FY 2020 TOTAL $60,000 $2,000,000 $0 $0 $0 $2,060,000 Description: The analysis will provide plans for lift station pump upgrades and other improvements necessary to reroute flows from Lift Station No. 41 to North Wastewater Treatment Plant. This is an analysis, design, and construction project. Project Cost Savings & Revenues: Energy savings will be provided by relieving the pumping pressure.
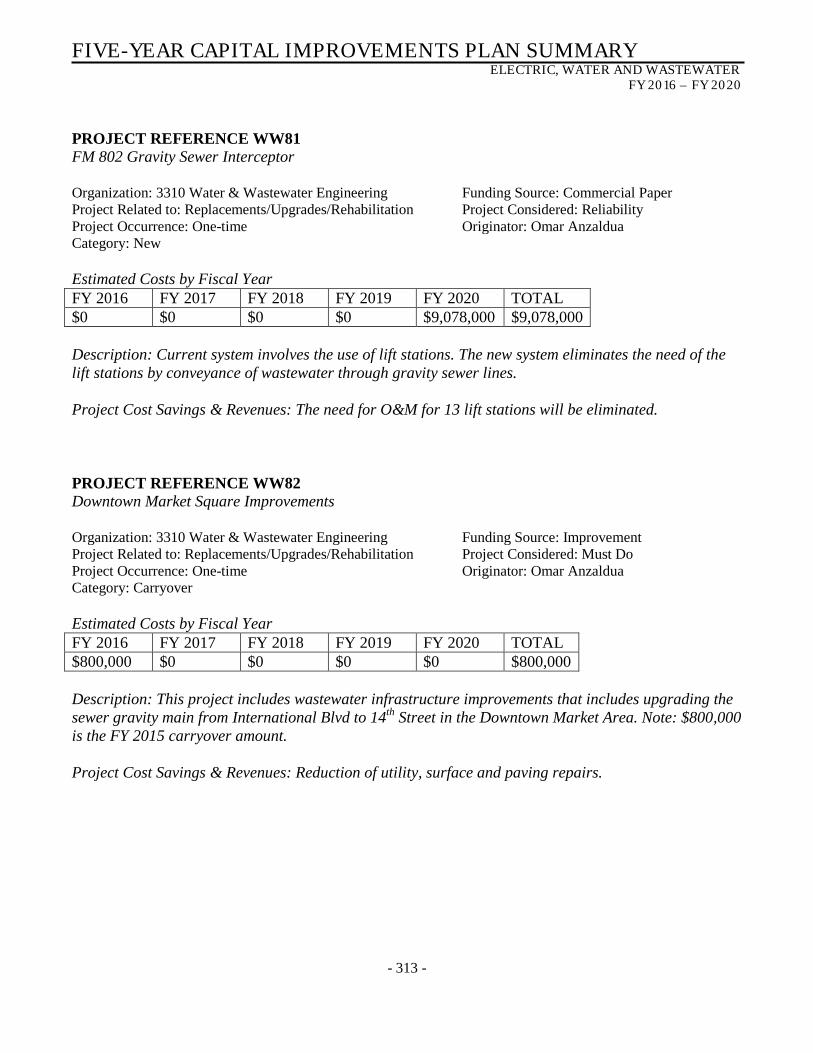
FIVE-YEAR CAPITAL IMPROVEMENTS PLAN SUMMARY ELECTRIC, WATER AND WASTEWATER
FY 2016 – FY 2020
- 313 -
PROJECT REFERENCE WW81 FM 802 Gravity Sewer Interceptor Organization: 3310 Water & Wastewater Engineering Funding Source: Commercial Paper Project Related to: Replacements/Upgrades/Rehabilitation Project Considered: Reliability Project Occurrence: One-time Originator: Omar Anzaldua Category: New Estimated Costs by Fiscal Year FY 2016 FY 2017 FY 2018 FY 2019 FY 2020 TOTAL $0 $0 $0 $0 $9,078,000 $9,078,000 Description: Current system involves the use of lift stations. The new system eliminates the need of the lift stations by conveyance of wastewater through gravity sewer lines. Project Cost Savings & Revenues: The need for O&M for 13 lift stations will be eliminated. PROJECT REFERENCE WW82 Downtown Market Square Improvements Organization: 3310 Water & Wastewater Engineering Funding Source: Improvement Project Related to: Replacements/Upgrades/Rehabilitation Project Considered: Must Do Project Occurrence: One-time Originator: Omar Anzaldua Category: Carryover Estimated Costs by Fiscal Year FY 2016 FY 2017 FY 2018 FY 2019 FY 2020 TOTAL $800,000 $0 $0 $0 $0 $800,000 Description: This project includes wastewater infrastructure improvements that includes upgrading the sewer gravity main from International Blvd to 14th Street in the Downtown Market Area. Note: $800,000 is the FY 2015 carryover amount. Project Cost Savings & Revenues: Reduction of utility, surface and paving repairs.
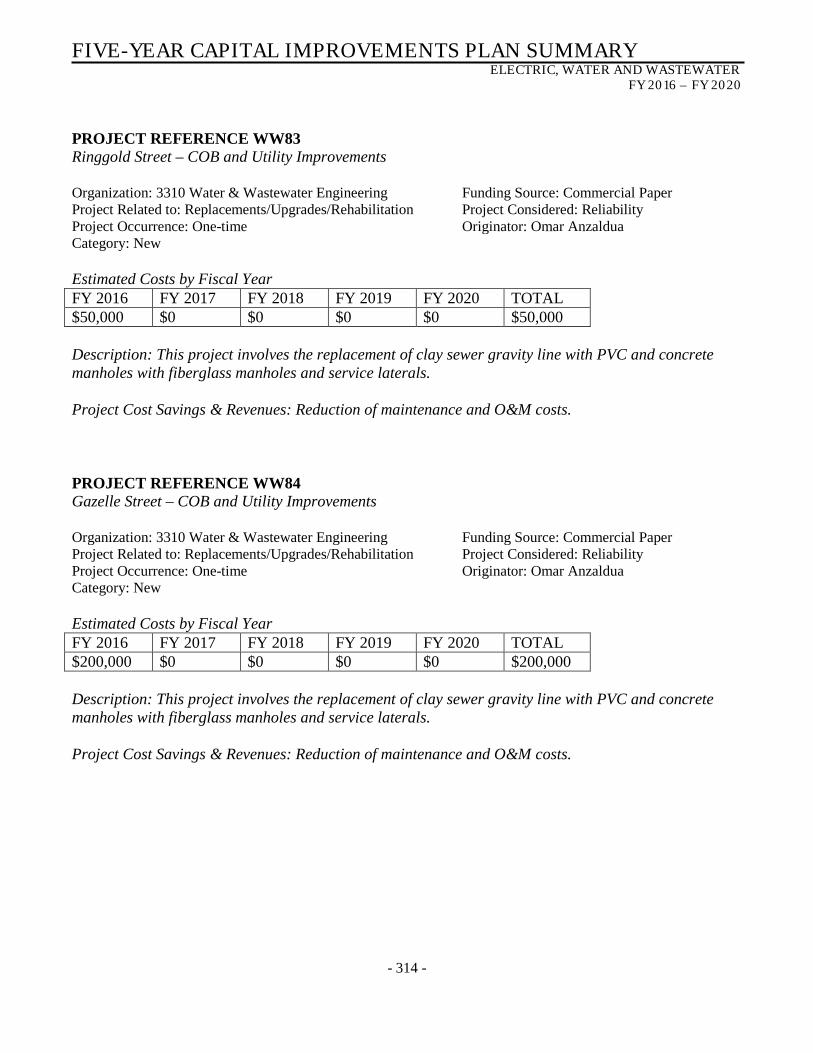
FIVE-YEAR CAPITAL IMPROVEMENTS PLAN SUMMARY ELECTRIC, WATER AND WASTEWATER
FY 2016 – FY 2020
- 314 -
PROJECT REFERENCE WW83 Ringgold Street – COB and Utility Improvements Organization: 3310 Water & Wastewater Engineering Funding Source: Commercial Paper Project Related to: Replacements/Upgrades/Rehabilitation Project Considered: Reliability Project Occurrence: One-time Originator: Omar Anzaldua Category: New Estimated Costs by Fiscal Year FY 2016 FY 2017 FY 2018 FY 2019 FY 2020 TOTAL $50,000 $0 $0 $0 $0 $50,000 Description: This project involves the replacement of clay sewer gravity line with PVC and concrete manholes with fiberglass manholes and service laterals. Project Cost Savings & Revenues: Reduction of maintenance and O&M costs. PROJECT REFERENCE WW84 Gazelle Street – COB and Utility Improvements Organization: 3310 Water & Wastewater Engineering Funding Source: Commercial Paper Project Related to: Replacements/Upgrades/Rehabilitation Project Considered: Reliability Project Occurrence: One-time Originator: Omar Anzaldua Category: New Estimated Costs by Fiscal Year FY 2016 FY 2017 FY 2018 FY 2019 FY 2020 TOTAL $200,000 $0 $0 $0 $0 $200,000 Description: This project involves the replacement of clay sewer gravity line with PVC and concrete manholes with fiberglass manholes and service laterals. Project Cost Savings & Revenues: Reduction of maintenance and O&M costs.

FIVE-YEAR CAPITAL IMPROVEMENTS PLAN SUMMARY ELECTRIC, WATER AND WASTEWATER
FY 2016 – FY 2020
- 315 -
PROJECT REFERENCE WW85 North Street COB and Utility Improvements Organization: 3310 Water & Wastewater Engineering Funding Source: Commercial Paper Project Related to: Replacements/Upgrades/Rehabilitation Project Considered: Reliability Project Occurrence: One-time Originator: Omar Anzaldua Category: Resubmission Estimated Costs by Fiscal Year FY 2016 FY 2017 FY 2018 FY 2019 FY 2020 TOTAL $ $0 $0 $0 $248,697 $248,697 Description: This project involves the replacement of clay sewer gravity line with PVC and concrete manholes with fiberglass manholes and service laterals. Project Cost Savings & Revenues: Reduction of maintenance and O&M costs. PROJECT REFERENCE WW86 North and South Colonias Project Design Organization: 3310 Water & Wastewater Engineering Funding Source: Commercial Paper Project Related to: Replacements/Upgrades/Rehabilitation Project Considered: General Project Occurrence: One-time Originator: Omar Anzaldua Category: New Estimated Costs by Fiscal Year FY 2016 FY 2017 FY 2018 FY 2019 FY 2020 TOTAL $0 $0 $0 $0 $109,202 $109,202 Description: Design and surveying for the addition of first-time sewer services to various colonias in the North and South areas of Brownsville. Project Cost Savings & Revenues: N/A
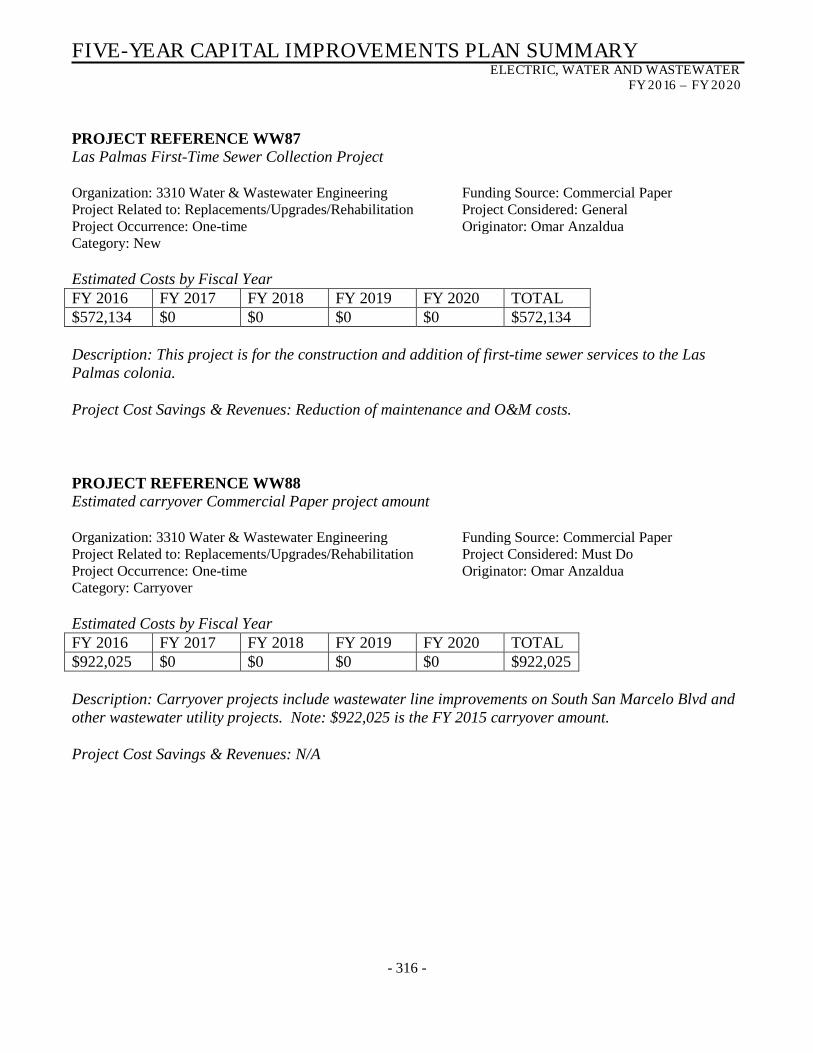
FIVE-YEAR CAPITAL IMPROVEMENTS PLAN SUMMARY ELECTRIC, WATER AND WASTEWATER
FY 2016 – FY 2020
- 316 -
PROJECT REFERENCE WW87 Las Palmas First-Time Sewer Collection Project Organization: 3310 Water & Wastewater Engineering Funding Source: Commercial Paper Project Related to: Replacements/Upgrades/Rehabilitation Project Considered: General Project Occurrence: One-time Originator: Omar Anzaldua Category: New Estimated Costs by Fiscal Year FY 2016 FY 2017 FY 2018 FY 2019 FY 2020 TOTAL $572,134 $0 $0 $0 $0 $572,134 Description: This project is for the construction and addition of first-time sewer services to the Las Palmas colonia. Project Cost Savings & Revenues: Reduction of maintenance and O&M costs. PROJECT REFERENCE WW88 Estimated carryover Commercial Paper project amount Organization: 3310 Water & Wastewater Engineering Funding Source: Commercial Paper Project Related to: Replacements/Upgrades/Rehabilitation Project Considered: Must Do Project Occurrence: One-time Originator: Omar Anzaldua Category: Carryover Estimated Costs by Fiscal Year FY 2016 FY 2017 FY 2018 FY 2019 FY 2020 TOTAL $922,025 $0 $0 $0 $0 $922,025 Description: Carryover projects include wastewater line improvements on South San Marcelo Blvd and other wastewater utility projects. Note: $922,025 is the FY 2015 carryover amount. Project Cost Savings & Revenues: N/A
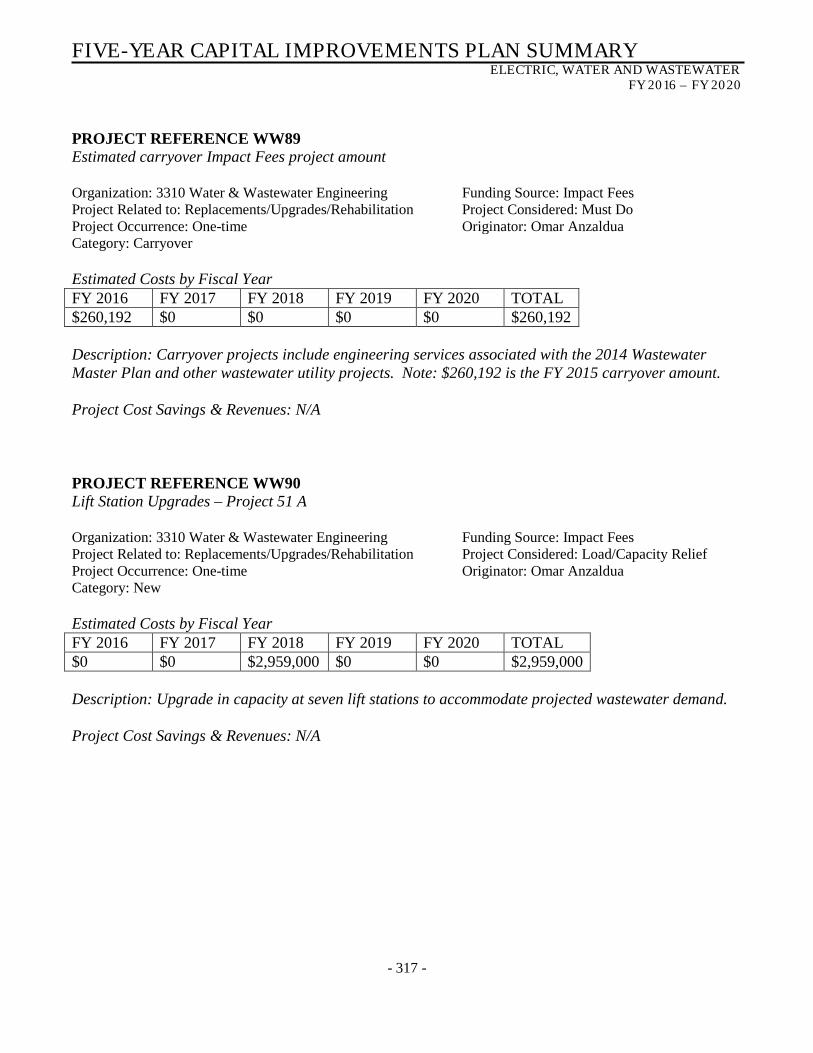
FIVE-YEAR CAPITAL IMPROVEMENTS PLAN SUMMARY ELECTRIC, WATER AND WASTEWATER
FY 2016 – FY 2020
- 317 -
PROJECT REFERENCE WW89 Estimated carryover Impact Fees project amount Organization: 3310 Water & Wastewater Engineering Funding Source: Impact Fees Project Related to: Replacements/Upgrades/Rehabilitation Project Considered: Must Do Project Occurrence: One-time Originator: Omar Anzaldua Category: Carryover Estimated Costs by Fiscal Year FY 2016 FY 2017 FY 2018 FY 2019 FY 2020 TOTAL $260,192 $0 $0 $0 $0 $260,192 Description: Carryover projects include engineering services associated with the 2014 Wastewater Master Plan and other wastewater utility projects. Note: $260,192 is the FY 2015 carryover amount. Project Cost Savings & Revenues: N/A PROJECT REFERENCE WW90 Lift Station Upgrades – Project 51 A Organization: 3310 Water & Wastewater Engineering Funding Source: Impact Fees Project Related to: Replacements/Upgrades/Rehabilitation Project Considered: Load/Capacity Relief Project Occurrence: One-time Originator: Omar Anzaldua Category: New Estimated Costs by Fiscal Year FY 2016 FY 2017 FY 2018 FY 2019 FY 2020 TOTAL $0 $0 $2,959,000 $0 $0 $2,959,000 Description: Upgrade in capacity at seven lift stations to accommodate projected wastewater demand. Project Cost Savings & Revenues: N/A
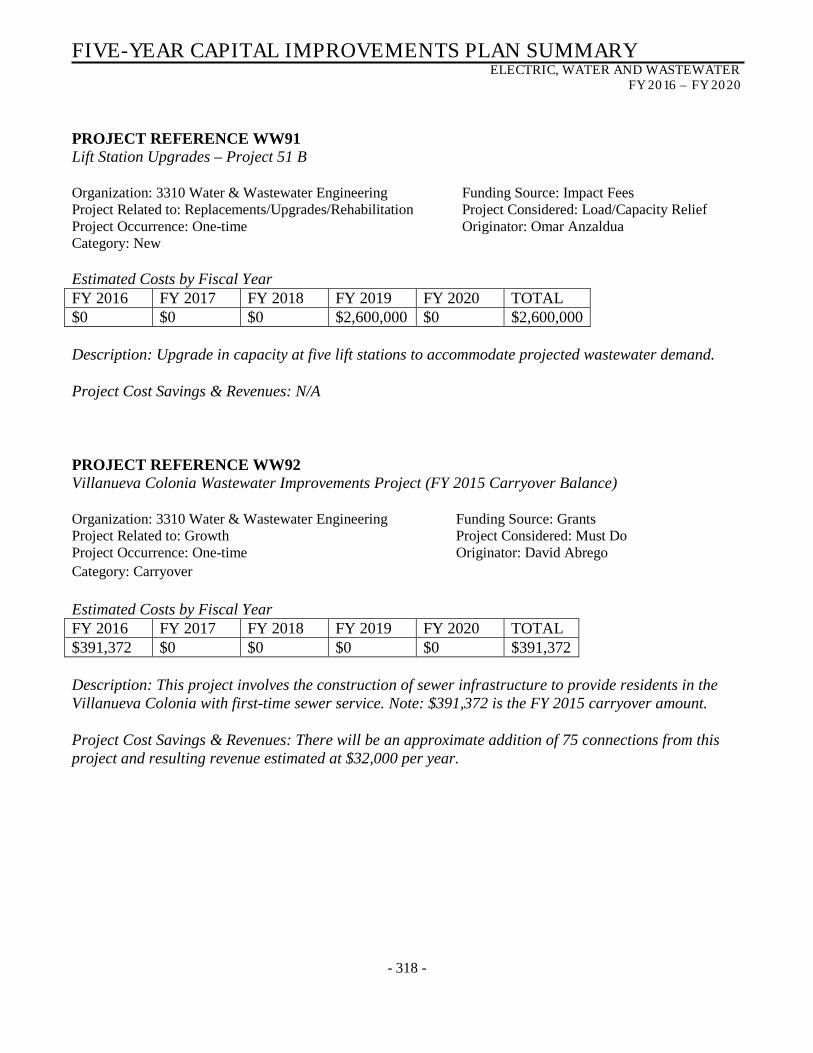
FIVE-YEAR CAPITAL IMPROVEMENTS PLAN SUMMARY ELECTRIC, WATER AND WASTEWATER
FY 2016 – FY 2020
- 318 -
PROJECT REFERENCE WW91 Lift Station Upgrades – Project 51 B Organization: 3310 Water & Wastewater Engineering Funding Source: Impact Fees Project Related to: Replacements/Upgrades/Rehabilitation Project Considered: Load/Capacity Relief Project Occurrence: One-time Originator: Omar Anzaldua Category: New Estimated Costs by Fiscal Year FY 2016 FY 2017 FY 2018 FY 2019 FY 2020 TOTAL $0 $0 $0 $2,600,000 $0 $2,600,000 Description: Upgrade in capacity at five lift stations to accommodate projected wastewater demand. Project Cost Savings & Revenues: N/A PROJECT REFERENCE WW92 Villanueva Colonia Wastewater Improvements Project (FY 2015 Carryover Balance) Organization: 3310 Water & Wastewater Engineering Funding Source: Grants Project Related to: Growth Project Considered: Must Do Project Occurrence: One-time Originator: David Abrego Category: Carryover Estimated Costs by Fiscal Year FY 2016 FY 2017 FY 2018 FY 2019 FY 2020 TOTAL $391,372 $0 $0 $0 $0 $391,372 Description: This project involves the construction of sewer infrastructure to provide residents in the Villanueva Colonia with first-time sewer service. Note: $391,372 is the FY 2015 carryover amount. Project Cost Savings & Revenues: There will be an approximate addition of 75 connections from this project and resulting revenue estimated at $32,000 per year.
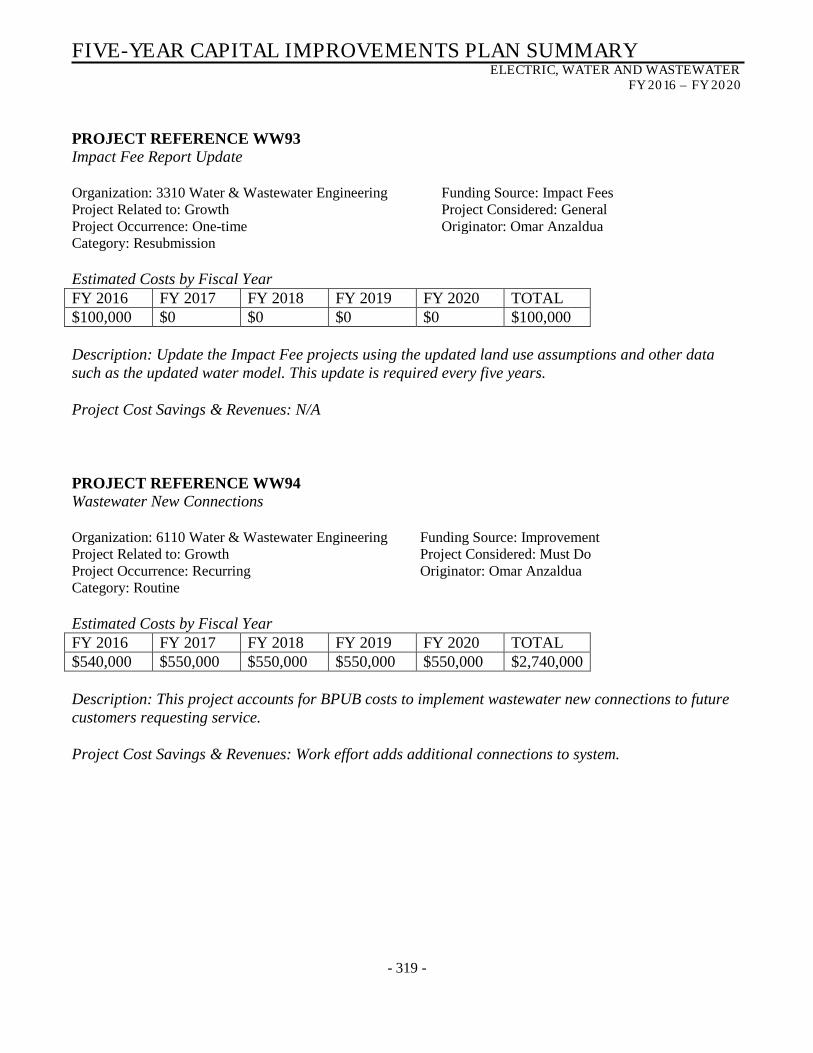
FIVE-YEAR CAPITAL IMPROVEMENTS PLAN SUMMARY ELECTRIC, WATER AND WASTEWATER
FY 2016 – FY 2020
- 319 -
PROJECT REFERENCE WW93 Impact Fee Report Update Organization: 3310 Water & Wastewater Engineering Funding Source: Impact Fees Project Related to: Growth Project Considered: General Project Occurrence: One-time Originator: Omar Anzaldua Category: Resubmission Estimated Costs by Fiscal Year FY 2016 FY 2017 FY 2018 FY 2019 FY 2020 TOTAL $100,000 $0 $0 $0 $0 $100,000 Description: Update the Impact Fee projects using the updated land use assumptions and other data such as the updated water model. This update is required every five years. Project Cost Savings & Revenues: N/A PROJECT REFERENCE WW94 Wastewater New Connections Organization: 6110 Water & Wastewater Engineering Funding Source: Improvement Project Related to: Growth Project Considered: Must Do Project Occurrence: Recurring Originator: Omar Anzaldua Category: Routine Estimated Costs by Fiscal Year FY 2016 FY 2017 FY 2018 FY 2019 FY 2020 TOTAL $540,000 $550,000 $550,000 $550,000 $550,000 $2,740,000 Description: This project accounts for BPUB costs to implement wastewater new connections to future customers requesting service. Project Cost Savings & Revenues: Work effort adds additional connections to system.

FIVE-YEAR CAPITAL IMPROVEMENTS PLAN SUMMARY ELECTRIC, WATER AND WASTEWATER
FY 2016 – FY 2020
- 320 -
PROJECT REFERENCE WW95 Improvements Submitted by Staff for Wastewater Utility Organization: 7135 Geographic Information Systems Funding Source: Improvement Project Related to: Replacements/Upgrades/Rehabilitation Project Considered: Must Do Project Occurrence: One-time Originator: Jesus Alfaro Category: New Estimated Costs by Fiscal Year FY 2016 FY 2017 FY 2018 FY 2019 FY 2020 TOTAL $0 $0 $0 $0 $1,415,000 $1,415,000 Description: Improvements submitted by staff. Project Cost Savings & Revenues: N/A PROJECT REFERENCE WW96 Existing Carryover & Estimated Capital Equipment Organization: 3310 Water & Wastewater Engineering Funding Source: Improvement Project Related to: Replacements/Upgrades/Rehabilitation Project Considered: General Project Occurrence: One-time Originator: Company-wide Category: Carryover Estimated Costs by Fiscal Year FY 2016 FY 2017 FY 2018 FY 2019 FY 2020 TOTAL $250,129 0 $0 $0 $0 $250,129 Description: This line item is the budget for the carryover capital equipment for the wastewater utility. The funds will be used to purchase vehicles and other equipment. Note: $250,129 is the FY 2015 carryover amount. Project Cost Savings & Revenues: N/A
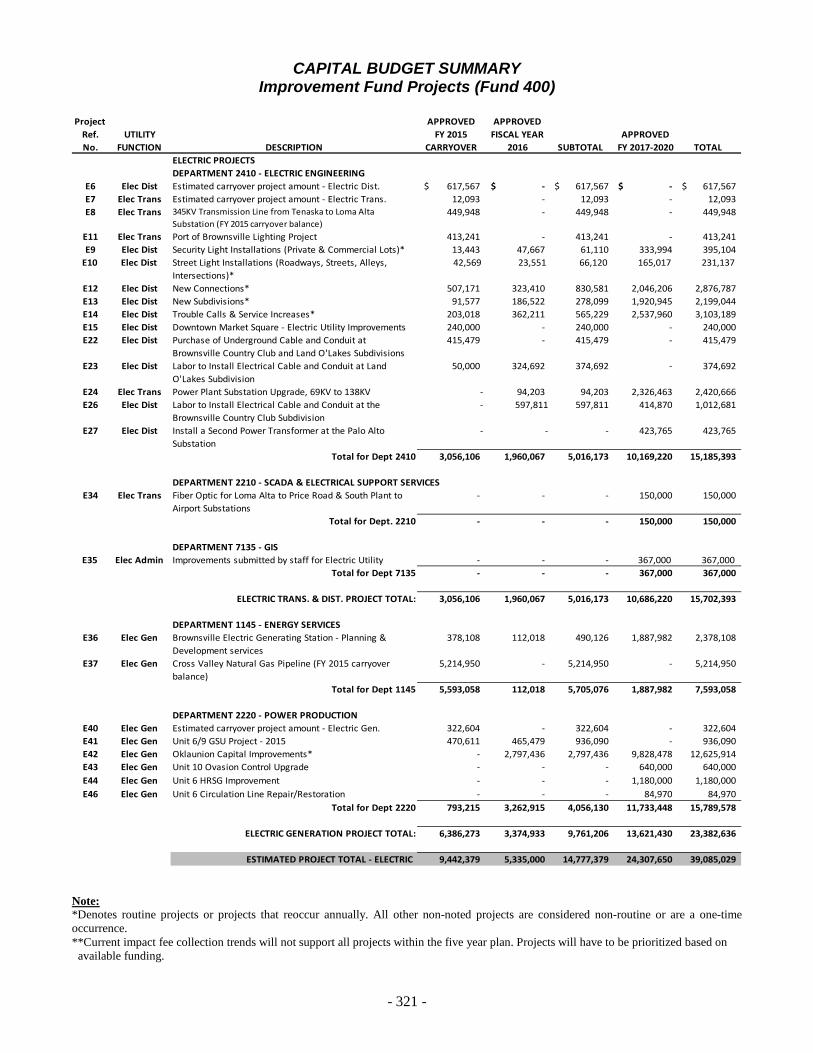
- 321 -
CAPITAL BUDGET SUMMARY Improvement Fund Projects (Fund 400)
Project APPROVED APPROVED
Ref. UTILITY FY 2015 FISCAL YEAR APPROVEDNo. FUNCTION DESCRIPTION CARRYOVER 2016 SUBTOTAL FY 2017-2020 TOTAL
ELECTRIC PROJECTS DEPARTMENT 2410 - ELECTRIC ENGINEERING
E6 Elec Dist Estimated carryover project amount - Electric Dist. 617,567$ -$ 617,567$ -$ 617,567$ E7 Elec Trans Estimated carryover project amount - Electric Trans. 12,093 - 12,093 - 12,093 E8 Elec Trans 345KV Transmission Line from Tenaska to Loma Alta
Substation (FY 2015 carryover balance)449,948 - 449,948 - 449,948
E11 Elec Trans Port of Brownsville Lighting Project 413,241 - 413,241 - 413,241 E9 Elec Dist Security Light Installations (Private & Commercial Lots)* 13,443 47,667 61,110 333,994 395,104
E10 Elec Dist Street Light Installations (Roadways, Streets, Alleys, Intersections)*
42,569 23,551 66,120 165,017 231,137
E12 Elec Dist New Connections* 507,171 323,410 830,581 2,046,206 2,876,787 E13 Elec Dist New Subdivisions* 91,577 186,522 278,099 1,920,945 2,199,044 E14 Elec Dist Trouble Calls & Service Increases* 203,018 362,211 565,229 2,537,960 3,103,189 E15 Elec Dist Downtown Market Square - Electric Utility Improvements 240,000 - 240,000 - 240,000 E22 Elec Dist Purchase of Underground Cable and Conduit at
Brownsville Country Club and Land O'Lakes Subdivisions415,479 - 415,479 - 415,479
E23 Elec Dist Labor to Install Electrical Cable and Conduit at Land O'Lakes Subdivision
50,000 324,692 374,692 - 374,692
E24 Elec Trans Power Plant Substation Upgrade, 69KV to 138KV - 94,203 94,203 2,326,463 2,420,666 E26 Elec Dist Labor to Install Electrical Cable and Conduit at the
Brownsville Country Club Subdivision - 597,811 597,811 414,870 1,012,681
E27 Elec Dist Install a Second Power Transformer at the Palo Alto Substation
- - - 423,765 423,765
Total for Dept 2410 3,056,106 1,960,067 5,016,173 10,169,220 15,185,393
DEPARTMENT 2210 - SCADA & ELECTRICAL SUPPORT SERVICESE34 Elec Trans Fiber Optic for Loma Alta to Price Road & South Plant to
Airport Substations- - - 150,000 150,000
Total for Dept. 2210 - - - 150,000 150,000
DEPARTMENT 7135 - GISE35 Elec Admin Improvements submitted by staff for Electric Utility - - - 367,000 367,000
Total for Dept 7135 - - - 367,000 367,000
ELECTRIC TRANS. & DIST. PROJECT TOTAL: 3,056,106 1,960,067 5,016,173 10,686,220 15,702,393
DEPARTMENT 1145 - ENERGY SERVICESE36 Elec Gen Brownsville Electric Generating Station - Planning &
Development services378,108 112,018 490,126 1,887,982 2,378,108
E37 Elec Gen Cross Valley Natural Gas Pipeline (FY 2015 carryover balance)
5,214,950 - 5,214,950 - 5,214,950
Total for Dept 1145 5,593,058 112,018 5,705,076 1,887,982 7,593,058
DEPARTMENT 2220 - POWER PRODUCTION E40 Elec Gen Estimated carryover project amount - Electric Gen. 322,604 - 322,604 - 322,604 E41 Elec Gen Unit 6/9 GSU Project - 2015 470,611 465,479 936,090 - 936,090 E42 Elec Gen Oklaunion Capital Improvements* - 2,797,436 2,797,436 9,828,478 12,625,914 E43 Elec Gen Unit 10 Ovasion Control Upgrade - - - 640,000 640,000 E44 Elec Gen Unit 6 HRSG Improvement - - - 1,180,000 1,180,000 E46 Elec Gen Unit 6 Circulation Line Repair/Restoration - - - 84,970 84,970
Total for Dept 2220 793,215 3,262,915 4,056,130 11,733,448 15,789,578
ELECTRIC GENERATION PROJECT TOTAL: 6,386,273 3,374,933 9,761,206 13,621,430 23,382,636
ESTIMATED PROJECT TOTAL - ELECTRIC 9,442,379 5,335,000 14,777,379 24,307,650 39,085,029
Note: *Denotes routine projects or projects that reoccur annually. All other non-noted projects are considered non-routine or are a one-time occurrence. **Current impact fee collection trends will not support all projects within the five year plan. Projects will have to be prioritized based on
available funding.

- 322 -
CAPITAL BUDGET SUMMARY
Improvement Fund Projects (Fund 400) – Continued
Project APPROVED APPROVEDRef. UTILITY FY 2015 FISCAL YEAR APPROVEDNo. FUNCTION DESCRIPTION CARRYOVER 2016 SUBTOTAL FY 2017-2020 TOTAL
GENERAL & ADMINISTRATIVE PROJECTSDEPARTMENT 1165 - RECORDS MANAGEMENT
G2 Gen. Admin. Implementation of an ECMS system - - - 550,000 550,000 Total for Dept 1165 - - - 550,000 550,000
DEPARTMENT 2210 - SCADA & ELECTRICAL SUPPORT SERVICESG3 Gen. Admin. Preventative Maintenance Software Program - 100,000 100,000 - 100,000
Total for Dept. 2210 - 100,000 100,000 - 100,000
DEPARTMENT 4110 - ENERGY RISK MANAGEMENTG4 Gen. Admin. Design services for the Administration Building Annex 175,000 - 175,000 - 175,000 G5 Gen. Admin. Design services for the FM 511 Facilities Relocation
Project87,500 - 87,500 - 87,500
Total for Dept. 4110 262,500 - 262,500 - 262,500
DEPARTMENT 6135 - CIS SUPPORTC1 Customer Svc MeterSense (AMI Software Application) - - - 412,350 412,350
Total for Dept 6135 - - - 412,350 412,350
DEPARTMENT 7130 - INFORMATION TECHNOLOGYG6 Gen. Admin. Blade servers project 200,000 - 200,000 - 200,000 G7 Gen. Admin. Dell MD Storage - 60,000 60,000 - 60,000 G8 Gen. Admin. Enterprise Backup Appliance DR4100 - - - 60,000 60,000 G9 Gen. Admin. ArcMail Appliance & Email Archive - 50,000 50,000 - 50,000
G10 Gen. Admin. FAX Over IP - - - 10,000 10,000 G11 Gen. Admin. Document Management Software Hardware and
Implementation - - - 50,000 50,000
G12 Gen. Admin. Web Replication Software - - - 50,000 50,000 G13 Gen. Admin. Cisco Power Plant Chassis - 50,000 50,000 - 50,000 G14 Gen. Admin. Wireless Controller - 40,000 40,000 - 40,000 G15 Gen. Admin. UPS SCADA - 15,000 15,000 - 15,000 G16 Gen. Admin. Water and Wastewater Work Orders Integration (Cayenta
& City Works)- - - 30,000 30,000
Total for Dept 7130 200,000 215,000 415,000 200,000 615,000
DEPARTMENT 7135 - GEOGRAPHIC INFORMATION SYSTEMSG17 Gen. Admin. GIS System Upgrade (ArcMap, ArcFM, Cityworks) 266,994 - 266,994 - 266,994 G18 Gen. Admin. LandWorks Property Management Implementation
Services - 125,000 125,000 - 125,000
Total for Dept 7135 266,994 125,000 391,994 - 391,994 DEPARTMENT 7140 - HUMAN RESOURCES
G19 Gen. Admin. HR Information System (HRIS) Software - 65,000 65,000 130,000 195,000 Total for Dept. 7140 - 65,000 65,000 130,000 195,000
DEPARTMENT 7150 - FLEET MANAGEMENTG20 Gen. Admin. Fuel Tank Maintenance & Replacement - 25,000 25,000 - 25,000
Total for Dept. 7150 - 25,000 25,000 - 25,000
DEPARTMENT 7160 - FACILITY MAINTENANCEG21 Gen. Admin. Security System Upgrade - 130,000 130,000 - 130,000 G22 Gen. Admin. Facilities Storage Shed - 5,000 5,000 - 5,000
Total for Dept. 7160 - 135,000 135,000 - 135,000
DEPARTMENT 7170 - WAREHOUSEG23 Gen. Admin. Warehouse & Purchasing Roof Replacement Project 187,500 - 187,500 - 187,500
Total for Dept. 7170 187,500 - 187,500 - 187,500
Note: *Denotes routine projects or projects that reoccur annually. All other non-noted projects are considered non-routine or are a one-time
occurrence. **Current impact fee collection trends will not support all projects within the five year plan. Projects will have to be prioritized based on
available funding.
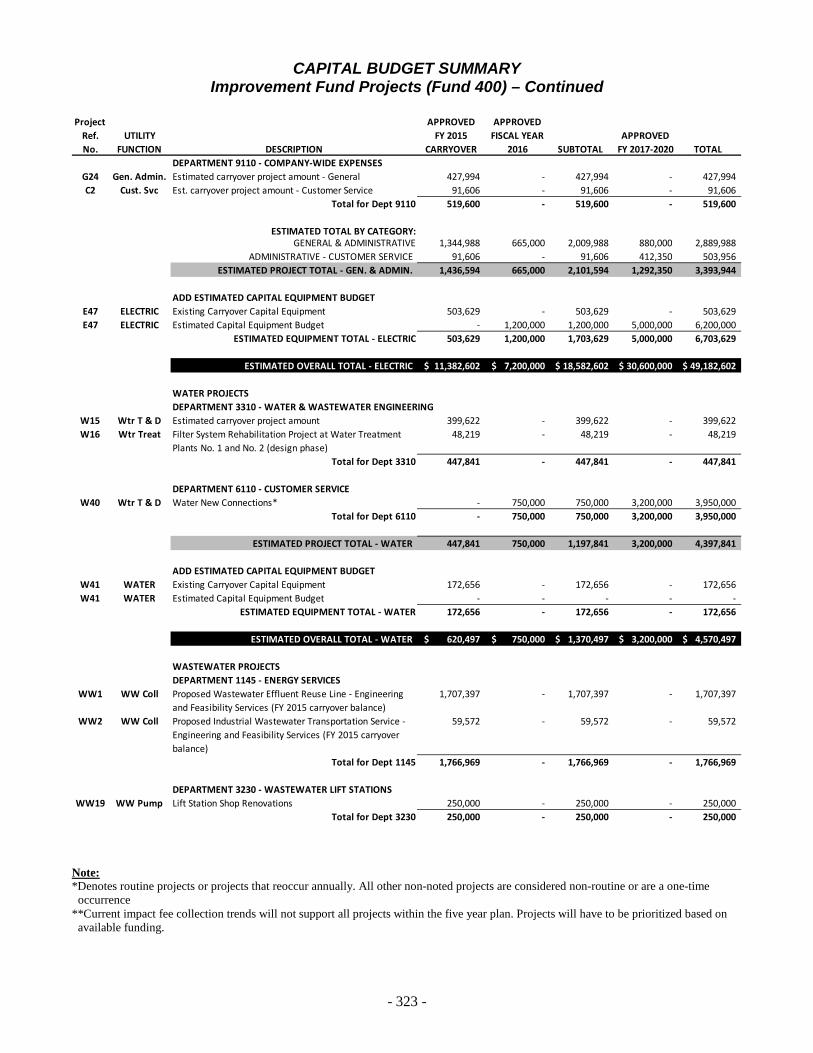
- 323 -
CAPITAL BUDGET SUMMARY Improvement Fund Projects (Fund 400) – Continued
Project APPROVED APPROVED
Ref. UTILITY FY 2015 FISCAL YEAR APPROVEDNo. FUNCTION DESCRIPTION CARRYOVER 2016 SUBTOTAL FY 2017-2020 TOTAL
DEPARTMENT 9110 - COMPANY-WIDE EXPENSESG24 Gen. Admin. Estimated carryover project amount - General 427,994 - 427,994 - 427,994 C2 Cust. Svc Est. carryover project amount - Customer Service 91,606 - 91,606 - 91,606
Total for Dept 9110 519,600 - 519,600 - 519,600
ESTIMATED TOTAL BY CATEGORY: GENERAL & ADMINISTRATIVE 1,344,988 665,000 2,009,988 880,000 2,889,988
ADMINISTRATIVE - CUSTOMER SERVICE 91,606 - 91,606 412,350 503,956 ESTIMATED PROJECT TOTAL - GEN. & ADMIN. 1,436,594 665,000 2,101,594 1,292,350 3,393,944
ADD ESTIMATED CAPITAL EQUIPMENT BUDGET E47 ELECTRIC Existing Carryover Capital Equipment 503,629 - 503,629 - 503,629 E47 ELECTRIC Estimated Capital Equipment Budget - 1,200,000 1,200,000 5,000,000 6,200,000
ESTIMATED EQUIPMENT TOTAL - ELECTRIC 503,629 1,200,000 1,703,629 5,000,000 6,703,629
ESTIMATED OVERALL TOTAL - ELECTRIC 11,382,602$ 7,200,000$ 18,582,602$ 30,600,000$ 49,182,602$
WATER PROJECTSDEPARTMENT 3310 - WATER & WASTEWATER ENGINEERING
W15 Wtr T & D Estimated carryover project amount 399,622 - 399,622 - 399,622 W16 Wtr Treat Filter System Rehabilitation Project at Water Treatment
Plants No. 1 and No. 2 (design phase)48,219 - 48,219 - 48,219
Total for Dept 3310 447,841 - 447,841 - 447,841
DEPARTMENT 6110 - CUSTOMER SERVICE W40 Wtr T & D Water New Connections* - 750,000 750,000 3,200,000 3,950,000
Total for Dept 6110 - 750,000 750,000 3,200,000 3,950,000
ESTIMATED PROJECT TOTAL - WATER 447,841 750,000 1,197,841 3,200,000 4,397,841
ADD ESTIMATED CAPITAL EQUIPMENT BUDGET W41 WATER Existing Carryover Capital Equipment 172,656 - 172,656 - 172,656 W41 WATER Estimated Capital Equipment Budget - - - - -
ESTIMATED EQUIPMENT TOTAL - WATER 172,656 - 172,656 - 172,656
ESTIMATED OVERALL TOTAL - WATER 620,497$ 750,000$ 1,370,497$ 3,200,000$ 4,570,497$
WASTEWATER PROJECTSDEPARTMENT 1145 - ENERGY SERVICES
WW1 WW Coll Proposed Wastewater Effluent Reuse Line - Engineering and Feasibility Services (FY 2015 carryover balance)
1,707,397 - 1,707,397 - 1,707,397
WW2 WW Coll Proposed Industrial Wastewater Transportation Service - Engineering and Feasibility Services (FY 2015 carryover balance)
59,572 - 59,572 - 59,572
Total for Dept 1145 1,766,969 - 1,766,969 - 1,766,969
DEPARTMENT 3230 - WASTEWATER LIFT STATIONSWW19 WW Pump Lift Station Shop Renovations 250,000 - 250,000 - 250,000
Total for Dept 3230 250,000 - 250,000 - 250,000
Note: *Denotes routine projects or projects that reoccur annually. All other non-noted projects are considered non-routine or are a one-time
occurrence **Current impact fee collection trends will not support all projects within the five year plan. Projects will have to be prioritized based on
available funding.
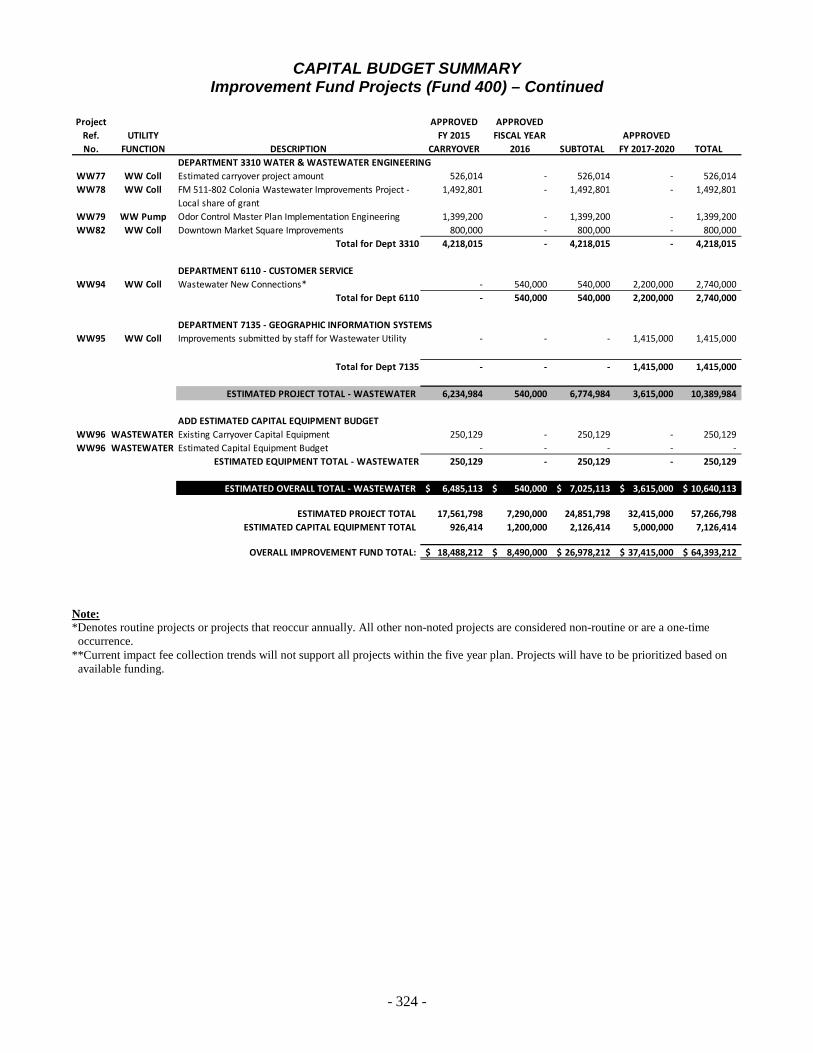
- 324 -
CAPITAL BUDGET SUMMARY Improvement Fund Projects (Fund 400) – Continued
Project APPROVED APPROVED
Ref. UTILITY FY 2015 FISCAL YEAR APPROVEDNo. FUNCTION DESCRIPTION CARRYOVER 2016 SUBTOTAL FY 2017-2020 TOTAL
DEPARTMENT 3310 WATER & WASTEWATER ENGINEERING WW77 WW Coll Estimated carryover project amount 526,014 - 526,014 - 526,014 WW78 WW Coll FM 511-802 Colonia Wastewater Improvements Project -
Local share of grant1,492,801 - 1,492,801 - 1,492,801
WW79 WW Pump Odor Control Master Plan Implementation Engineering 1,399,200 - 1,399,200 - 1,399,200 WW82 WW Coll Downtown Market Square Improvements 800,000 - 800,000 - 800,000
Total for Dept 3310 4,218,015 - 4,218,015 - 4,218,015
DEPARTMENT 6110 - CUSTOMER SERVICE WW94 WW Coll Wastewater New Connections* - 540,000 540,000 2,200,000 2,740,000
Total for Dept 6110 - 540,000 540,000 2,200,000 2,740,000
DEPARTMENT 7135 - GEOGRAPHIC INFORMATION SYSTEMSWW95 WW Coll Improvements submitted by staff for Wastewater Utility - - - 1,415,000 1,415,000
Total for Dept 7135 - - - 1,415,000 1,415,000
ESTIMATED PROJECT TOTAL - WASTEWATER 6,234,984 540,000 6,774,984 3,615,000 10,389,984
ADD ESTIMATED CAPITAL EQUIPMENT BUDGET WW96 WASTEWATER Existing Carryover Capital Equipment 250,129 - 250,129 - 250,129 WW96 WASTEWATER Estimated Capital Equipment Budget - - - - -
ESTIMATED EQUIPMENT TOTAL - WASTEWATER 250,129 - 250,129 - 250,129
ESTIMATED OVERALL TOTAL - WASTEWATER 6,485,113$ 540,000$ 7,025,113$ 3,615,000$ 10,640,113$
ESTIMATED PROJECT TOTAL 17,561,798 7,290,000 24,851,798 32,415,000 57,266,798 ESTIMATED CAPITAL EQUIPMENT TOTAL 926,414 1,200,000 2,126,414 5,000,000 7,126,414
OVERALL IMPROVEMENT FUND TOTAL: 18,488,212$ 8,490,000$ 26,978,212$ 37,415,000$ 64,393,212$
Note: *Denotes routine projects or projects that reoccur annually. All other non-noted projects are considered non-routine or are a one-time
occurrence. **Current impact fee collection trends will not support all projects within the five year plan. Projects will have to be prioritized based on
available funding.

- 325 -
CAPITAL BUDGET SUMMARY Impact Fees Fund Projects (Fund 410)
Project APPROVED APPROVED
Ref. UTILITY FY 2015 FISCAL YEAR APPROVEDNo. FUNCTION DESCRIPTION CARRYOVER 2016 SUBTOTAL FY 2017-2020 TOTAL
WATER PROJECTSDEPARTMENT 3310 - W/WW ENGINEERING
W23 Wtr Admin Estimated carryover project amount 334,051$ -$ 334,051$ -$ 334,051$ W24 Wtr T & D Martinal Area Waterline System Loops - 300,000 300,000 815,000 1,115,000 W25 Wtr T & D Concrete Steel Cylinder Waterline Upgrade from
Boca Chica Blvd. (SH 48) to WTP No. 2- - - 1,463,000 1,463,000
W26 Wtr T & D 24-inch Waterline Loop along FM511 from SRWA to Old Port Isabel Rd.
- - - 8,368,000 8,368,000
W27 Wtr T & D 16-inch Waterline Loop along FM511 from SH 48 to Boca Chica Blvd.
- - - 2,900,000 2,900,000
W28 Wtr T & D 16-inch Waterline Loop from Lago Vista to W. Alton Gloor Blvd.
- - - 2,268,000 2,268,000
W29 Wtr T & D 16-inch Waterline on Boca Chica Blvd. from Owens Rd. to Iowa Ave.
- - - 1,850,000 1,850,000
W30 Wtr T & D Waterline Upgrade on Southmost Blvd. from E. 25th St. to E. 30th St.
- - - 758,000 758,000
W31 Wtr T & D Waterline Upgrade on Southmost Blvd. from E. 30th St. to Villa Bonita
- - - 2,364,000 2,364,000
W32 Wtr T & D Waterline Upgrade on Southmost Blvd. from E. 14th St. to E. 25th St.
- - - 1,575,000 1,575,000
W33 Wtr T & D 18-inch Waterline along Old Hwy 77 and FM 511 to Old Alice Rd.
- - - 3,099,000 3,099,000
W34 Wtr T & D 12-inch Waterline West of Hwy 77 - - - 1,345,000 1,345,000 W35 Wtr T & D 16-inch Waterline at Summer Hill Subdivision - - - 894,000 894,000
W36 Wtr T & D Villa Nueva Water Service Transfer from Military Hwy Water Supply Corporation (MHWSC) to BPUB
- 664,480 664,480 - 664,480
W37 Wtr T & D 16-inch Waterline on Boca Chica Blvd. from International Blvd. to Owens Rd.
- - - 748,000 748,000
W38 Wtr T & D Waterline Upgrade Near WTP No. 1 - 562,796 562,796 450,000 1,012,796 W39 Wtr Admin Impact Fee Report Update - 100,000 100,000 - 100,000
Water Projects Impact Fees Pool** - - - 750,000 750,000 Budget Adjustment** - - - (19,779,000) (19,779,000)
Total for Dept 3310 334,051 1,627,276 1,961,327 9,868,000 11,829,327
ESTIMATED PROJECT TOTAL - WATER 334,051$ 1,627,276$ 1,961,327$ 9,868,000$ 11,829,327$
WASTEWATER PROJECTSDEPARTMENT 3230 - WASTEWATER LIFT STATION
WW74 WW Pump Lift Station No. 111 Force Main Reroute to Robindale WWTP
- - - 3,307,000 3,307,000
WW75 WW Pump North Regional Lift Stations and Force Main System
- - - 16,863,000 16,863,000
Budget Adjustment** - - - (16,863,000) (16,863,000) Total for Dept 3230 - - - 3,307,000 3,307,000
DEPARTMENT 3310 - W/WW ENGINEERINGWW89 WW Coll Estimated carryover project amount 260,192 - 260,192 - 260,192 WW90 WW Coll Lift Station Upgrades - Project 51 A - - - 2,959,000 2,959,000 WW91 WW Coll Lift Station Upgrades - Project 51 B - - - 2,600,000 2,600,000 WW93 WW Admin Impact Fee Report Update - 100,000 100,000 - 100,000
Wastewater Projects Impact Fees Pool** - - - 750,000 750,000 Budget Adjustment** - - - (5,559,000) (5,559,000)
Total for Dept 3310 260,192 100,000 360,192 750,000 1,110,192
ESTIMATED PROJECT TOTAL - WASTEWATER 260,192$ 100,000$ 360,192$ 4,057,000$ 4,417,192$
OVERALL TOTAL IMPACT FEES FUND BUDGET: 594,243$ 1,727,276$ 2,321,519$ 13,925,000$ 16,246,519$
U Note: *Denotes routine projects or projects that reoccur annually. All other non-noted projects are considered non-routine or are a one-time
occurrence. **Current impact fee collection trends will not support all projects within the five year plan. Projects will have to be prioritized based on
available funding.
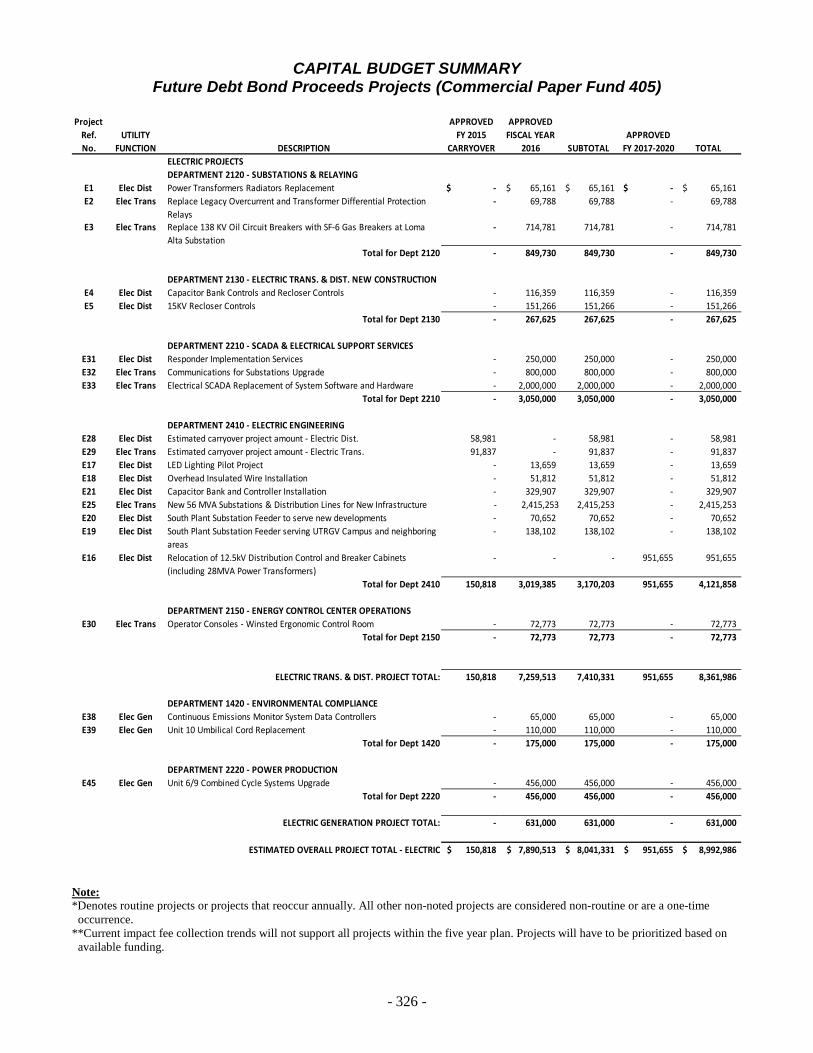
- 326 -
CAPITAL BUDGET SUMMARY Future Debt Bond Proceeds Projects (Commercial Paper Fund 405)
Project APPROVED APPROVED
Ref. UTILITY FY 2015 FISCAL YEAR APPROVEDNo. FUNCTION DESCRIPTION CARRYOVER 2016 SUBTOTAL FY 2017-2020 TOTAL
ELECTRIC PROJECTSDEPARTMENT 2120 - SUBSTATIONS & RELAYING
E1 Elec Dist Power Transformers Radiators Replacement -$ 65,161$ 65,161$ -$ 65,161$ E2 Elec Trans Replace Legacy Overcurrent and Transformer Differential Protection
Relays- 69,788 69,788 - 69,788
E3 Elec Trans Replace 138 KV Oil Circuit Breakers with SF-6 Gas Breakers at Loma Alta Substation
- 714,781 714,781 - 714,781
Total for Dept 2120 - 849,730 849,730 - 849,730
DEPARTMENT 2130 - ELECTRIC TRANS. & DIST. NEW CONSTRUCTIONE4 Elec Dist Capacitor Bank Controls and Recloser Controls - 116,359 116,359 - 116,359 E5 Elec Dist 15KV Recloser Controls - 151,266 151,266 - 151,266
Total for Dept 2130 - 267,625 267,625 - 267,625
DEPARTMENT 2210 - SCADA & ELECTRICAL SUPPORT SERVICESE31 Elec Dist Responder Implementation Services - 250,000 250,000 - 250,000 E32 Elec Trans Communications for Substations Upgrade - 800,000 800,000 - 800,000 E33 Elec Trans Electrical SCADA Replacement of System Software and Hardware - 2,000,000 2,000,000 - 2,000,000
Total for Dept 2210 - 3,050,000 3,050,000 - 3,050,000
DEPARTMENT 2410 - ELECTRIC ENGINEERINGE28 Elec Dist Estimated carryover project amount - Electric Dist. 58,981 - 58,981 - 58,981 E29 Elec Trans Estimated carryover project amount - Electric Trans. 91,837 - 91,837 - 91,837 E17 Elec Dist LED Lighting Pilot Project - 13,659 13,659 - 13,659 E18 Elec Dist Overhead Insulated Wire Installation - 51,812 51,812 - 51,812 E21 Elec Dist Capacitor Bank and Controller Installation - 329,907 329,907 - 329,907 E25 Elec Trans New 56 MVA Substations & Distribution Lines for New Infrastructure - 2,415,253 2,415,253 - 2,415,253 E20 Elec Dist South Plant Substation Feeder to serve new developments - 70,652 70,652 - 70,652 E19 Elec Dist South Plant Substation Feeder serving UTRGV Campus and neighboring
areas- 138,102 138,102 - 138,102
E16 Elec Dist Relocation of 12.5kV Distribution Control and Breaker Cabinets (including 28MVA Power Transformers)
- - - 951,655 951,655
Total for Dept 2410 150,818 3,019,385 3,170,203 951,655 4,121,858
DEPARTMENT 2150 - ENERGY CONTROL CENTER OPERATIONSE30 Elec Trans Operator Consoles - Winsted Ergonomic Control Room - 72,773 72,773 - 72,773
Total for Dept 2150 - 72,773 72,773 - 72,773
ELECTRIC TRANS. & DIST. PROJECT TOTAL: 150,818 7,259,513 7,410,331 951,655 8,361,986
DEPARTMENT 1420 - ENVIRONMENTAL COMPLIANCE E38 Elec Gen Continuous Emissions Monitor System Data Controllers - 65,000 65,000 - 65,000 E39 Elec Gen Unit 10 Umbilical Cord Replacement - 110,000 110,000 - 110,000
Total for Dept 1420 - 175,000 175,000 - 175,000
DEPARTMENT 2220 - POWER PRODUCTION E45 Elec Gen Unit 6/9 Combined Cycle Systems Upgrade - 456,000 456,000 - 456,000
Total for Dept 2220 - 456,000 456,000 - 456,000
ELECTRIC GENERATION PROJECT TOTAL: - 631,000 631,000 - 631,000
ESTIMATED OVERALL PROJECT TOTAL - ELECTRIC 150,818$ 7,890,513$ 8,041,331$ 951,655$ 8,992,986$ Note: *Denotes routine projects or projects that reoccur annually. All other non-noted projects are considered non-routine or are a one-time
occurrence. **Current impact fee collection trends will not support all projects within the five year plan. Projects will have to be prioritized based on
available funding.
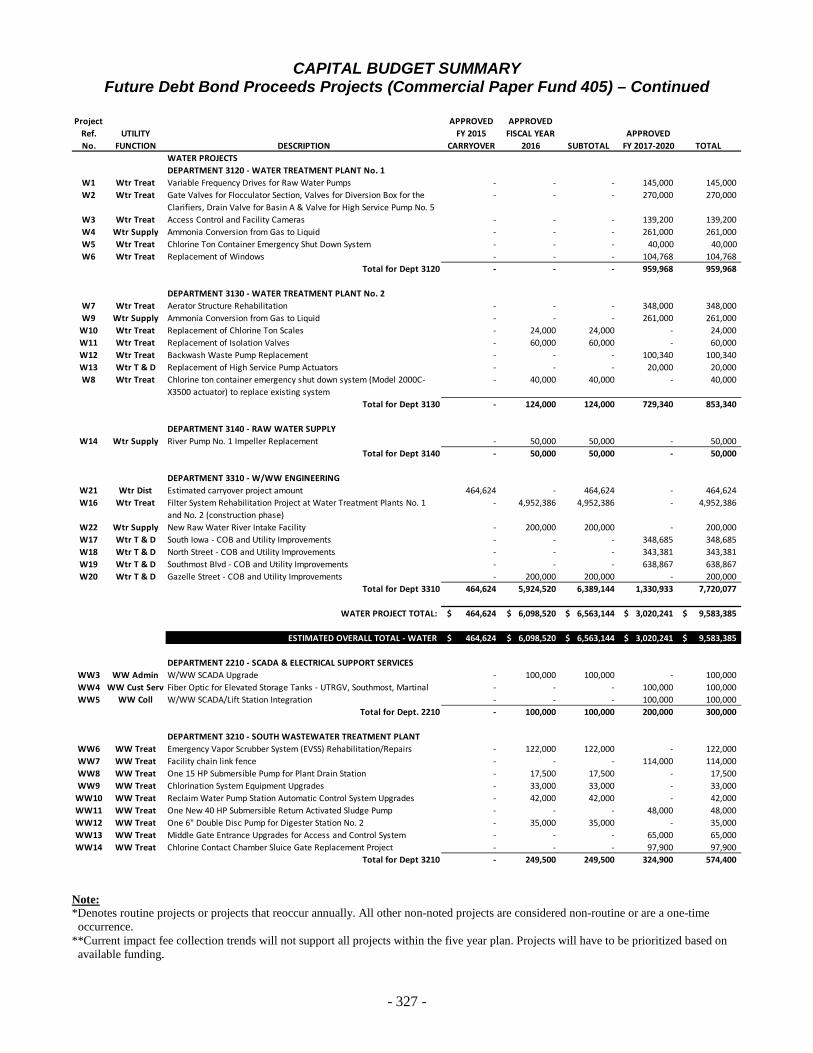
- 327 -
CAPITAL BUDGET SUMMARY Future Debt Bond Proceeds Projects (Commercial Paper Fund 405) – Continued
Project APPROVED APPROVED
Ref. UTILITY FY 2015 FISCAL YEAR APPROVEDNo. FUNCTION DESCRIPTION CARRYOVER 2016 SUBTOTAL FY 2017-2020 TOTAL
WATER PROJECTSDEPARTMENT 3120 - WATER TREATMENT PLANT No. 1
W1 Wtr Treat Variable Frequency Drives for Raw Water Pumps - - - 145,000 145,000 W2 Wtr Treat Gate Valves for Flocculator Section, Valves for Diversion Box for the
Clarifiers, Drain Valve for Basin A & Valve for High Service Pump No. 5- - - 270,000 270,000
W3 Wtr Treat Access Control and Facility Cameras - - - 139,200 139,200 W4 Wtr Supply Ammonia Conversion from Gas to Liquid - - - 261,000 261,000 W5 Wtr Treat Chlorine Ton Container Emergency Shut Down System - - - 40,000 40,000 W6 Wtr Treat Replacement of Windows - - - 104,768 104,768
Total for Dept 3120 - - - 959,968 959,968
DEPARTMENT 3130 - WATER TREATMENT PLANT No. 2W7 Wtr Treat Aerator Structure Rehabilitation - - - 348,000 348,000 W9 Wtr Supply Ammonia Conversion from Gas to Liquid - - - 261,000 261,000
W10 Wtr Treat Replacement of Chlorine Ton Scales - 24,000 24,000 - 24,000 W11 Wtr Treat Replacement of Isolation Valves - 60,000 60,000 - 60,000 W12 Wtr Treat Backwash Waste Pump Replacement - - - 100,340 100,340 W13 Wtr T & D Replacement of High Service Pump Actuators - - - 20,000 20,000 W8 Wtr Treat Chlorine ton container emergency shut down system (Model 2000C-
X3500 actuator) to replace existing system- 40,000 40,000 - 40,000
Total for Dept 3130 - 124,000 124,000 729,340 853,340
DEPARTMENT 3140 - RAW WATER SUPPLYW14 Wtr Supply River Pump No. 1 Impeller Replacement - 50,000 50,000 - 50,000
Total for Dept 3140 - 50,000 50,000 - 50,000
DEPARTMENT 3310 - W/WW ENGINEERINGW21 Wtr Dist Estimated carryover project amount 464,624 - 464,624 - 464,624 W16 Wtr Treat Filter System Rehabilitation Project at Water Treatment Plants No. 1
and No. 2 (construction phase)- 4,952,386 4,952,386 - 4,952,386
W22 Wtr Supply New Raw Water River Intake Facility - 200,000 200,000 - 200,000 W17 Wtr T & D South Iowa - COB and Utility Improvements - - - 348,685 348,685 W18 Wtr T & D North Street - COB and Utility Improvements - - - 343,381 343,381 W19 Wtr T & D Southmost Blvd - COB and Utility Improvements - - - 638,867 638,867 W20 Wtr T & D Gazelle Street - COB and Utility Improvements - 200,000 200,000 - 200,000
Total for Dept 3310 464,624 5,924,520 6,389,144 1,330,933 7,720,077
WATER PROJECT TOTAL: 464,624$ 6,098,520$ 6,563,144$ 3,020,241$ 9,583,385$
ESTIMATED OVERALL TOTAL - WATER 464,624$ 6,098,520$ 6,563,144$ 3,020,241$ 9,583,385$
DEPARTMENT 2210 - SCADA & ELECTRICAL SUPPORT SERVICESWW3 WW Admin W/WW SCADA Upgrade - 100,000 100,000 - 100,000 WW4 WW Cust Serv Fiber Optic for Elevated Storage Tanks - UTRGV, Southmost, Martinal - - - 100,000 100,000 WW5 WW Coll W/WW SCADA/Lift Station Integration - - - 100,000 100,000
Total for Dept. 2210 - 100,000 100,000 200,000 300,000
DEPARTMENT 3210 - SOUTH WASTEWATER TREATMENT PLANTWW6 WW Treat Emergency Vapor Scrubber System (EVSS) Rehabilitation/Repairs - 122,000 122,000 - 122,000 WW7 WW Treat Facility chain link fence - - - 114,000 114,000 WW8 WW Treat One 15 HP Submersible Pump for Plant Drain Station - 17,500 17,500 - 17,500 WW9 WW Treat Chlorination System Equipment Upgrades - 33,000 33,000 - 33,000
WW10 WW Treat Reclaim Water Pump Station Automatic Control System Upgrades - 42,000 42,000 - 42,000 WW11 WW Treat One New 40 HP Submersible Return Activated Sludge Pump - - - 48,000 48,000 WW12 WW Treat One 6" Double Disc Pump for Digester Station No. 2 - 35,000 35,000 - 35,000 WW13 WW Treat Middle Gate Entrance Upgrades for Access and Control System - - - 65,000 65,000 WW14 WW Treat Chlorine Contact Chamber Sluice Gate Replacement Project - - - 97,900 97,900
Total for Dept 3210 - 249,500 249,500 324,900 574,400
Note: *Denotes routine projects or projects that reoccur annually. All other non-noted projects are considered non-routine or are a one-time
occurrence. **Current impact fee collection trends will not support all projects within the five year plan. Projects will have to be prioritized based on
available funding.
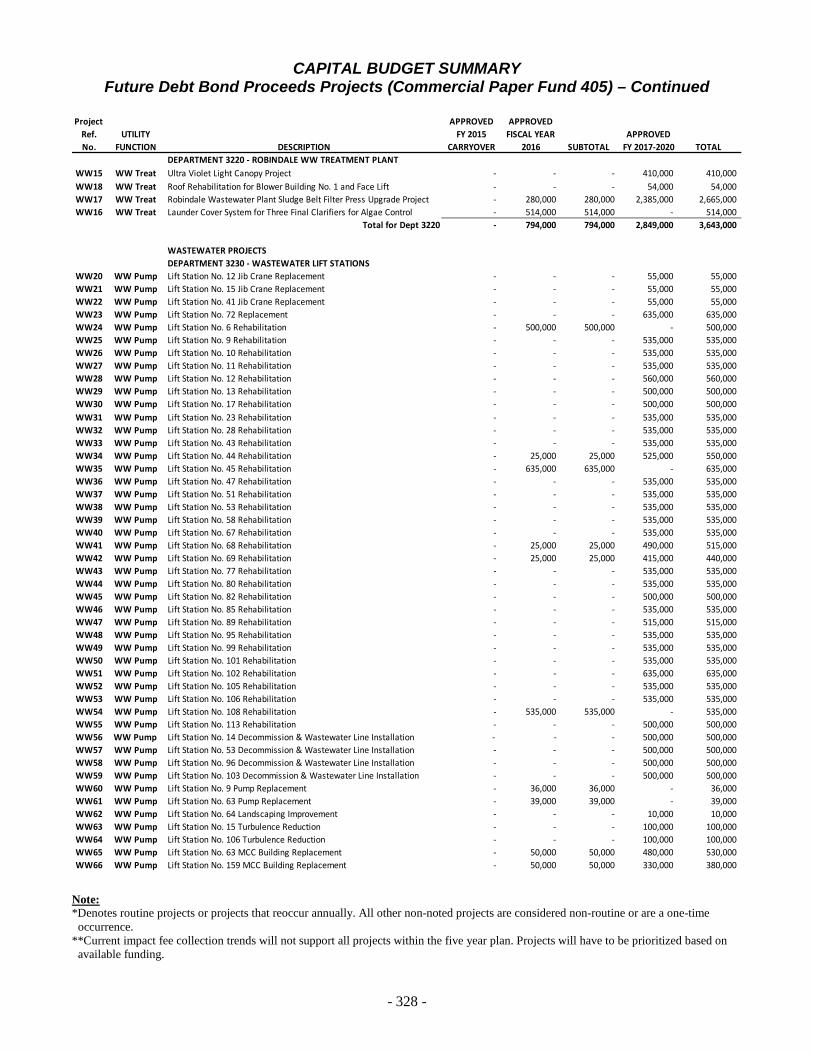
- 328 -
CAPITAL BUDGET SUMMARY Future Debt Bond Proceeds Projects (Commercial Paper Fund 405) – Continued
Project APPROVED APPROVED
Ref. UTILITY FY 2015 FISCAL YEAR APPROVEDNo. FUNCTION DESCRIPTION CARRYOVER 2016 SUBTOTAL FY 2017-2020 TOTAL
DEPARTMENT 3220 - ROBINDALE WW TREATMENT PLANTWW15 WW Treat Ultra Violet Light Canopy Project - - - 410,000 410,000 WW18 WW Treat Roof Rehabilitation for Blower Building No. 1 and Face Lift - - - 54,000 54,000 WW17 WW Treat Robindale Wastewater Plant Sludge Belt Filter Press Upgrade Project - 280,000 280,000 2,385,000 2,665,000 WW16 WW Treat Launder Cover System for Three Final Clarifiers for Algae Control - 514,000 514,000 - 514,000
Total for Dept 3220 - 794,000 794,000 2,849,000 3,643,000
WASTEWATER PROJECTSDEPARTMENT 3230 - WASTEWATER LIFT STATIONS
WW20 WW Pump Lift Station No. 12 Jib Crane Replacement - - - 55,000 55,000 WW21 WW Pump Lift Station No. 15 Jib Crane Replacement - - - 55,000 55,000 WW22 WW Pump Lift Station No. 41 Jib Crane Replacement - - - 55,000 55,000 WW23 WW Pump Lift Station No. 72 Replacement - - - 635,000 635,000 WW24 WW Pump Lift Station No. 6 Rehabilitation - 500,000 500,000 - 500,000 WW25 WW Pump Lift Station No. 9 Rehabilitation - - - 535,000 535,000 WW26 WW Pump Lift Station No. 10 Rehabilitation - - - 535,000 535,000 WW27 WW Pump Lift Station No. 11 Rehabilitation - - - 535,000 535,000 WW28 WW Pump Lift Station No. 12 Rehabilitation - - - 560,000 560,000 WW29 WW Pump Lift Station No. 13 Rehabilitation - - - 500,000 500,000 WW30 WW Pump Lift Station No. 17 Rehabilitation - - - 500,000 500,000 WW31 WW Pump Lift Station No. 23 Rehabilitation - - - 535,000 535,000 WW32 WW Pump Lift Station No. 28 Rehabilitation - - - 535,000 535,000 WW33 WW Pump Lift Station No. 43 Rehabilitation - - - 535,000 535,000 WW34 WW Pump Lift Station No. 44 Rehabilitation - 25,000 25,000 525,000 550,000 WW35 WW Pump Lift Station No. 45 Rehabilitation - 635,000 635,000 - 635,000 WW36 WW Pump Lift Station No. 47 Rehabilitation - - - 535,000 535,000 WW37 WW Pump Lift Station No. 51 Rehabilitation - - - 535,000 535,000 WW38 WW Pump Lift Station No. 53 Rehabilitation - - - 535,000 535,000 WW39 WW Pump Lift Station No. 58 Rehabilitation - - - 535,000 535,000 WW40 WW Pump Lift Station No. 67 Rehabilitation - - - 535,000 535,000 WW41 WW Pump Lift Station No. 68 Rehabilitation - 25,000 25,000 490,000 515,000 WW42 WW Pump Lift Station No. 69 Rehabilitation - 25,000 25,000 415,000 440,000 WW43 WW Pump Lift Station No. 77 Rehabilitation - - - 535,000 535,000 WW44 WW Pump Lift Station No. 80 Rehabilitation - - - 535,000 535,000 WW45 WW Pump Lift Station No. 82 Rehabilitation - - - 500,000 500,000 WW46 WW Pump Lift Station No. 85 Rehabilitation - - - 535,000 535,000 WW47 WW Pump Lift Station No. 89 Rehabilitation - - - 515,000 515,000 WW48 WW Pump Lift Station No. 95 Rehabilitation - - - 535,000 535,000 WW49 WW Pump Lift Station No. 99 Rehabilitation - - - 535,000 535,000 WW50 WW Pump Lift Station No. 101 Rehabilitation - - - 535,000 535,000 WW51 WW Pump Lift Station No. 102 Rehabilitation - - - 635,000 635,000 WW52 WW Pump Lift Station No. 105 Rehabilitation - - - 535,000 535,000 WW53 WW Pump Lift Station No. 106 Rehabilitation - - - 535,000 535,000 WW54 WW Pump Lift Station No. 108 Rehabilitation - 535,000 535,000 - 535,000 WW55 WW Pump Lift Station No. 113 Rehabilitation - - - 500,000 500,000 WW56 WW Pump Lift Station No. 14 Decommission & Wastewater Line Installation - - - 500,000 500,000 WW57 WW Pump Lift Station No. 53 Decommission & Wastewater Line Installation - - - 500,000 500,000 WW58 WW Pump Lift Station No. 96 Decommission & Wastewater Line Installation - - - 500,000 500,000 WW59 WW Pump Lift Station No. 103 Decommission & Wastewater Line Installation - - - 500,000 500,000 WW60 WW Pump Lift Station No. 9 Pump Replacement - 36,000 36,000 - 36,000 WW61 WW Pump Lift Station No. 63 Pump Replacement - 39,000 39,000 - 39,000 WW62 WW Pump Lift Station No. 64 Landscaping Improvement - - - 10,000 10,000 WW63 WW Pump Lift Station No. 15 Turbulence Reduction - - - 100,000 100,000 WW64 WW Pump Lift Station No. 106 Turbulence Reduction - - - 100,000 100,000 WW65 WW Pump Lift Station No. 63 MCC Building Replacement - 50,000 50,000 480,000 530,000 WW66 WW Pump Lift Station No. 159 MCC Building Replacement - 50,000 50,000 330,000 380,000
Note: *Denotes routine projects or projects that reoccur annually. All other non-noted projects are considered non-routine or are a one-time
occurrence. **Current impact fee collection trends will not support all projects within the five year plan. Projects will have to be prioritized based on
available funding.
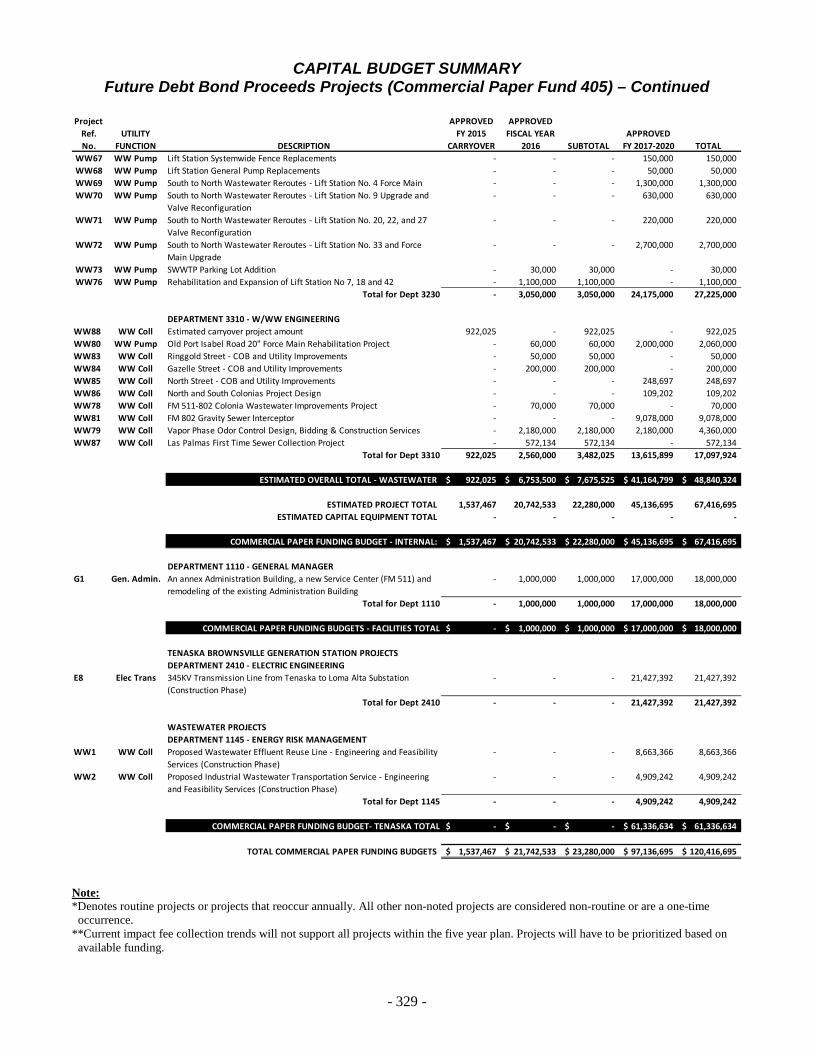
- 329 -
CAPITAL BUDGET SUMMARY Future Debt Bond Proceeds Projects (Commercial Paper Fund 405) – Continued
Project APPROVED APPROVED
Ref. UTILITY FY 2015 FISCAL YEAR APPROVEDNo. FUNCTION DESCRIPTION CARRYOVER 2016 SUBTOTAL FY 2017-2020 TOTAL
WW67 WW Pump Lift Station Systemwide Fence Replacements - - - 150,000 150,000 WW68 WW Pump Lift Station General Pump Replacements - - - 50,000 50,000 WW69 WW Pump South to North Wastewater Reroutes - Lift Station No. 4 Force Main - - - 1,300,000 1,300,000 WW70 WW Pump South to North Wastewater Reroutes - Lift Station No. 9 Upgrade and
Valve Reconfiguration - - - 630,000 630,000
WW71 WW Pump South to North Wastewater Reroutes - Lift Station No. 20, 22, and 27 Valve Reconfiguration
- - - 220,000 220,000
WW72 WW Pump South to North Wastewater Reroutes - Lift Station No. 33 and Force Main Upgrade
- - - 2,700,000 2,700,000
WW73 WW Pump SWWTP Parking Lot Addition - 30,000 30,000 - 30,000 WW76 WW Pump Rehabilitation and Expansion of Lift Station No 7, 18 and 42 - 1,100,000 1,100,000 - 1,100,000
Total for Dept 3230 - 3,050,000 3,050,000 24,175,000 27,225,000
DEPARTMENT 3310 - W/WW ENGINEERINGWW88 WW Coll Estimated carryover project amount 922,025 - 922,025 - 922,025 WW80 WW Pump Old Port Isabel Road 20" Force Main Rehabilitation Project - 60,000 60,000 2,000,000 2,060,000 WW83 WW Coll Ringgold Street - COB and Utility Improvements - 50,000 50,000 - 50,000 WW84 WW Coll Gazelle Street - COB and Utility Improvements - 200,000 200,000 - 200,000 WW85 WW Coll North Street - COB and Utility Improvements - - - 248,697 248,697 WW86 WW Coll North and South Colonias Project Design - - - 109,202 109,202 WW78 WW Coll FM 511-802 Colonia Wastewater Improvements Project - 70,000 70,000 - 70,000 WW81 WW Coll FM 802 Gravity Sewer Interceptor - - - 9,078,000 9,078,000 WW79 WW Coll Vapor Phase Odor Control Design, Bidding & Construction Services - 2,180,000 2,180,000 2,180,000 4,360,000 WW87 WW Coll Las Palmas First Time Sewer Collection Project - 572,134 572,134 - 572,134
Total for Dept 3310 922,025 2,560,000 3,482,025 13,615,899 17,097,924
ESTIMATED OVERALL TOTAL - WASTEWATER 922,025$ 6,753,500$ 7,675,525$ 41,164,799$ 48,840,324$
ESTIMATED PROJECT TOTAL 1,537,467 20,742,533 22,280,000 45,136,695 67,416,695 ESTIMATED CAPITAL EQUIPMENT TOTAL - - - - -
COMMERCIAL PAPER FUNDING BUDGET - INTERNAL: 1,537,467$ 20,742,533$ 22,280,000$ 45,136,695$ 67,416,695$
DEPARTMENT 1110 - GENERAL MANAGERG1 Gen. Admin. An annex Administration Building, a new Service Center (FM 511) and
remodeling of the existing Administration Building- 1,000,000 1,000,000 17,000,000 18,000,000
Total for Dept 1110 - 1,000,000 1,000,000 17,000,000 18,000,000
COMMERCIAL PAPER FUNDING BUDGETS - FACILITIES TOTAL -$ 1,000,000$ 1,000,000$ 17,000,000$ 18,000,000$
TENASKA BROWNSVILLE GENERATION STATION PROJECTSDEPARTMENT 2410 - ELECTRIC ENGINEERING
E8 Elec Trans 345KV Transmission Line from Tenaska to Loma Alta Substation (Construction Phase)
- - - 21,427,392 21,427,392
Total for Dept 2410 - - - 21,427,392 21,427,392
WASTEWATER PROJECTSDEPARTMENT 1145 - ENERGY RISK MANAGEMENT
WW1 WW Coll Proposed Wastewater Effluent Reuse Line - Engineering and Feasibility Services (Construction Phase)
- - - 8,663,366 8,663,366
WW2 WW Coll Proposed Industrial Wastewater Transportation Service - Engineering and Feasibility Services (Construction Phase)
- - - 4,909,242 4,909,242
Total for Dept 1145 - - - 4,909,242 4,909,242
COMMERCIAL PAPER FUNDING BUDGET- TENASKA TOTAL -$ -$ -$ 61,336,634$ 61,336,634$
TOTAL COMMERCIAL PAPER FUNDING BUDGETS 1,537,467$ 21,742,533$ 23,280,000$ 97,136,695$ 120,416,695$
Note: *Denotes routine projects or projects that reoccur annually. All other non-noted projects are considered non-routine or are a one-time
occurrence. **Current impact fee collection trends will not support all projects within the five year plan. Projects will have to be prioritized based on
available funding.
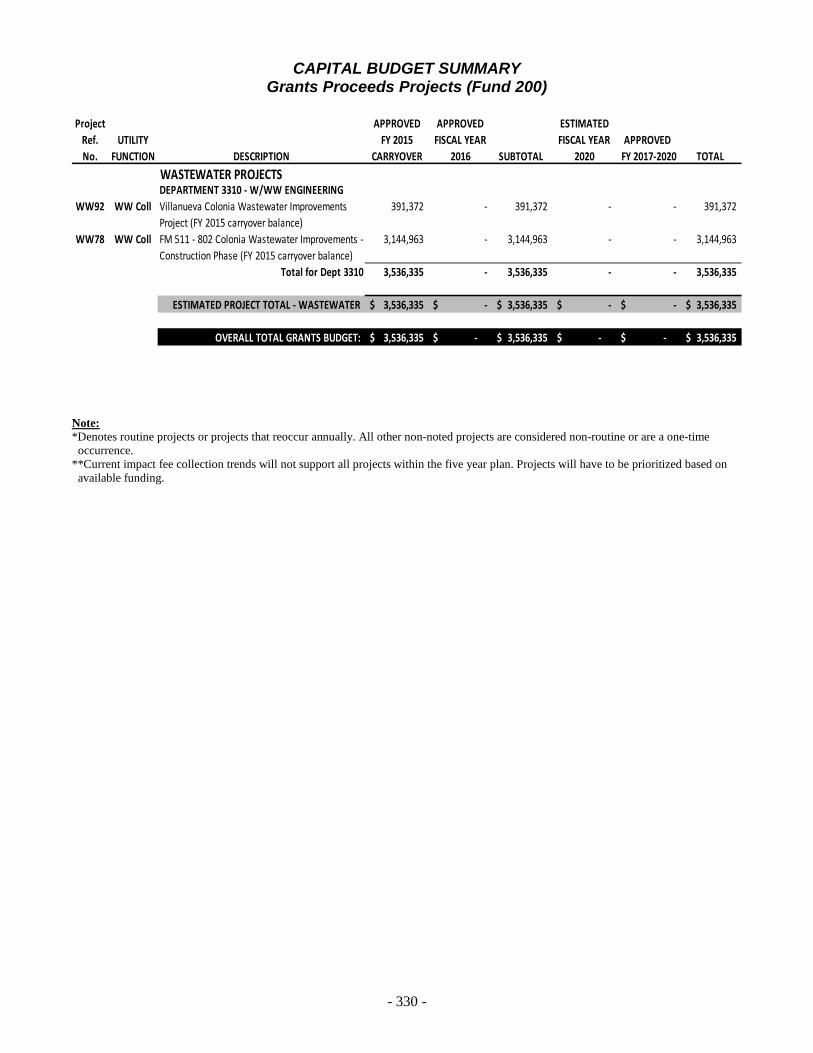
- 330 -
CAPITAL BUDGET SUMMARY Grants Proceeds Projects (Fund 200)
Project APPROVED APPROVED ESTIMATED
Ref. UTILITY FY 2015 FISCAL YEAR FISCAL YEAR APPROVED No. FUNCTION DESCRIPTION CARRYOVER 2016 SUBTOTAL 2020 FY 2017-2020 TOTAL
WASTEWATER PROJECTSDEPARTMENT 3310 - W/WW ENGINEERING
WW92 WW Coll Villanueva Colonia Wastewater Improvements Project (FY 2015 carryover balance)
391,372 - 391,372 - - 391,372
WW78 WW Coll FM 511 - 802 Colonia Wastewater Improvements - Construction Phase (FY 2015 carryover balance)
3,144,963 - 3,144,963 - - 3,144,963
Total for Dept 3310 3,536,335 - 3,536,335 - - 3,536,335
ESTIMATED PROJECT TOTAL - WASTEWATER 3,536,335$ -$ 3,536,335$ -$ -$ 3,536,335$
OVERALL TOTAL GRANTS BUDGET: 3,536,335$ -$ 3,536,335$ -$ -$ 3,536,335$
Note: *Denotes routine projects or projects that reoccur annually. All other non-noted projects are considered non-routine or are a one-time
occurrence. **Current impact fee collection trends will not support all projects within the five year plan. Projects will have to be prioritized based on
available funding.

- 331 -
Summary Expenditure Report For All Carryover Projects – FY 2015
Improvement Fund (Fund 400)
FY 2015 FY 2015BEGINNING ENDING DEFERREDBALANCE BALANCE BUDGET
GENERAL & ADMINISTRATIVE $ 1,720,710 $ 787,379 $ 251,500
ELECTRIC (less Tenaska) 5,099,685 2,418,624 555,026
WATER (less grant-funded projects) 709,599 164,695 -
WASTEWATER (less Tenaska & grants) 1,748,604 1,482,851 1,050,000
WATER & WASTEWATER 608,662 491,144 -
CARRYOVER WORK ORDER BUDGET TOTAL $ 9,887,260 $ 5,344,693 $ 1,856,526
NET BUDGET CHANGES SINCE 07/31/15: 1,083,088
APPROVED CARRYOVER WORK ORDER BUDGET TOTAL: $ 8,284,307
GENERATING STATION (EG3848) 1,065,518 375,675 - GAS TRANSMISSION LINE (EG3849) 2,656,903 - - CROSS VALLEY NATURAL GAS PIPELINE (EG3926) 2,000,000 309,408 4,610,000 345KV TRANSMISSION LINE (ET3886) 768,786 397,935 - WASTEWATER EFFLUENT REUSE LINE (SA3846) 2,171,840 1,665,898 - INDUSTRIAL WASTEWATER TRANSPORTATION (SA3862)
285,603 46,783 -
CARRYOVER TENASKA PROJECTS TOTAL - LOCAL CONTRIBUTIONS
$ 8,948,650 $ 2,795,699 $ 4,610,000
NET BUDGET CHANGES SINCE 07/31/15: 404,276
APPROVED CARRYOVER TENASKA PROJECTS - LOCAL CONTRIBUTIONS TOTAL: $ 7,809,975
WATER (CDAM) - - - WASTEWATER (SC3551, SC9228, SC9265-6, SC9272) 1,496,401 1,412,617 - CARRYOVER GRANT PROJECTS TOTAL - LOCAL CONTRIBUTIONS
$ 1,496,401 $ 1,412,617 $ -
NET BUDGET CHANGES SINCE 07/31/15: 54,899
APPROVED CARRYOVER GRANT PROJECTS - LOCAL CONTRIBUTIONS TOTAL: $ 1,467,516
APPROVED CARRYOVER CAPITAL PROJECT BUDGET TOTAL: $ 17,561,798
APPROVED CARRYOVER CAPITAL EQUIPMENT BUDGET TOTAL: 926,414
APPROVED CARRYOVER IMPROVEMENT FUND - CIP FUNDING TOTAL: $ 18,488,212
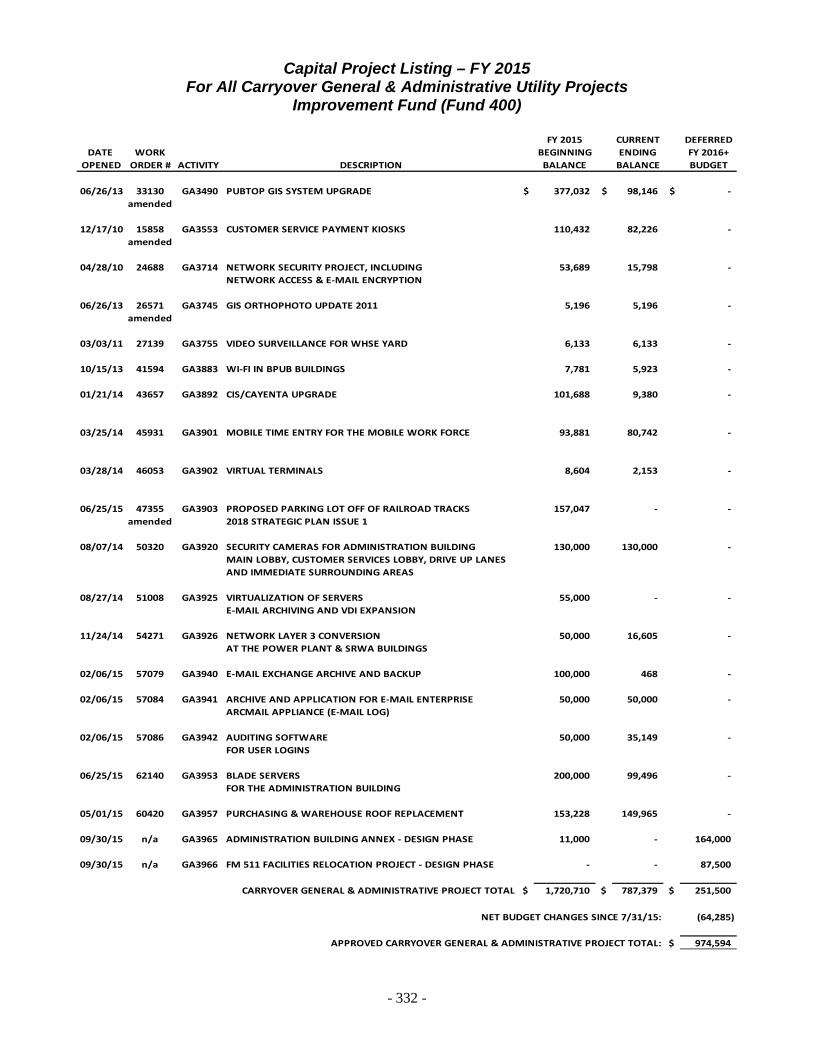
- 332 -
Capital Project Listing – FY 2015 For All Carryover General & Administrative Utility Projects
Improvement Fund (Fund 400)
FY 2015 CURRENT DEFERREDDATE WORK BEGINNING ENDING FY 2016+
OPENED ORDER # ACTIVITY DESCRIPTION BALANCE BALANCE BUDGET
06/26/13 33130 GA3490 PUBTOP GIS SYSTEM UPGRADE $ 377,032 $ 98,146 $ - amended
12/17/10 15858 GA3553 CUSTOMER SERVICE PAYMENT KIOSKS 110,432 82,226 - amended
04/28/10 24688 GA3714 NETWORK SECURITY PROJECT, INCLUDING 53,689 15,798 - NETWORK ACCESS & E-MAIL ENCRYPTION
06/26/13 26571 GA3745 GIS ORTHOPHOTO UPDATE 2011 5,196 5,196 - amended
03/03/11 27139 GA3755 VIDEO SURVEILLANCE FOR WHSE YARD 6,133 6,133 -
10/15/13 41594 GA3883 WI-FI IN BPUB BUILDINGS 7,781 5,923 -
01/21/14 43657 GA3892 CIS/CAYENTA UPGRADE 101,688 9,380 -
03/25/14 45931 GA3901 MOBILE TIME ENTRY FOR THE MOBILE WORK FORCE 93,881 80,742 -
03/28/14 46053 GA3902 VIRTUAL TERMINALS 8,604 2,153 -
06/25/15 47355 GA3903 PROPOSED PARKING LOT OFF OF RAILROAD TRACKS 157,047 - - amended 2018 STRATEGIC PLAN ISSUE 1
08/07/14 50320 GA3920 SECURITY CAMERAS FOR ADMINISTRATION BUILDING 130,000 130,000 - MAIN LOBBY, CUSTOMER SERVICES LOBBY, DRIVE UP LANESAND IMMEDIATE SURROUNDING AREAS
08/27/14 51008 GA3925 VIRTUALIZATION OF SERVERS 55,000 - - E-MAIL ARCHIVING AND VDI EXPANSION
11/24/14 54271 GA3926 NETWORK LAYER 3 CONVERSION 50,000 16,605 - AT THE POWER PLANT & SRWA BUILDINGS
02/06/15 57079 GA3940 E-MAIL EXCHANGE ARCHIVE AND BACKUP 100,000 468 -
02/06/15 57084 GA3941 ARCHIVE AND APPLICATION FOR E-MAIL ENTERPRISE 50,000 50,000 - ARCMAIL APPLIANCE (E-MAIL LOG)
02/06/15 57086 GA3942 AUDITING SOFTWARE 50,000 35,149 - FOR USER LOGINS
06/25/15 62140 GA3953 BLADE SERVERS 200,000 99,496 - FOR THE ADMINISTRATION BUILDING
05/01/15 60420 GA3957 PURCHASING & WAREHOUSE ROOF REPLACEMENT 153,228 149,965 -
09/30/15 n/a GA3965 ADMINISTRATION BUILDING ANNEX - DESIGN PHASE 11,000 - 164,000
09/30/15 n/a GA3966 FM 511 FACILITIES RELOCATION PROJECT - DESIGN PHASE - - 87,500
CARRYOVER GENERAL & ADMINISTRATIVE PROJECT TOTAL $ 1,720,710 $ 787,379 $ 251,500
(64,285)
$ 974,594
NET BUDGET CHANGES SINCE 7/31/15:
APPROVED CARRYOVER GENERAL & ADMINISTRATIVE PROJECT TOTAL:

- 333 -
Capital Project Listing – FY 2015 For All Carryover Electric Utility Projects
Improvement Fund (Fund 400)
FY 2015 CURRENT DEFERREDDATE WORK BEGINNING ENDING FY 2016+
OPENED ORDER # ACTIVITY DESCRIPTION BALANCE BALANCE BUDGET
01/10/13 34764 ED2879 1355 FM 511 $ 1,027 $ 1,027 $ - NORTH BROWNSVILLE KICKBALL FACILITY
02/14/14 44508 ED2901 1465 S EXPRESSWAY 597 597 -
04/02/14 46172 ED2913 454 N CLUBHOUSE RD 475 475 -
07/29/13 39258 ED2934 1800 W SAN MARCELO BLVD 1,641 - - BROWNSVILLE COUNTRY CLUB
10/27/14 53206 ED2953 1737 GREENBRIAR 346 - -
01/26/15 56423 ED2966 3147 BOCA CHICA BLVD 2,123 - -
03/09/15 58455 ED2967 505 HONEYDALE RD 887 - - HONEYDALE MOBILE PARK
02/25/15 58025 ED2968 5101 SUGAR MILL RD 343 - -
03/20/15 58899 ED2969 525 OLD PORT ISABEL RD 366 - - KNIGHTS OF COLUMBUS
04/30/15 60347 ED2971 115 PAREDES LINE ROAD 224 - - VERMILLION RESTAURANT
05/22/15 61153 ED2972 144 AZUCENA AVE 137 - -
06/12/15 61777 ED2973 2661 REDWOOD LN 191 - -
06/22/15 61986 ED2974 3125 ALTON GLOOR BLVD 598 306 -
06/30/15 62410 ED2976 2601 DANA AVENUE 9,461 - -
08/03/15 63578 ED2977 3192 W ALTON GLOOR BLVD 657 295 -
08/28/15 64488 ED2978 672 N CENTRAL AVENUE 668 464 -
08/25/15 64259 ED2979 2601 DANA ROAD 986 986 -
09/02/15 64684 ED2980 450 E ALTON GLOOR BLVD 657 657 -
09/04/15 64812 ED2981 123 OLD PORT ISABEL RD 1,017 - -
09/18/15 65209 ED2982 975 EXPRESSWAY 1,315 1,315 - DON JOHNSON MOTORS
CARRYOVER SECURITY LIGHT PROJECT TOTAL $ 23,716 $ 6,124 $ -
03/09/15 58436 EA3947 FIBER OPTIC INSTALLATION ON ALTON GLOOR BLVD 19,503 - - BETWEEN US 77 AND PABLO KISEL BLVD
04/17/15 59820 EA3954 FIBER OPTIOC EXTENSION FROM THE 11,325 - - SOUTHMOST LIBRARY TO THE AIRPORT
CARRYOVER ADMINISTRATION CONSTRUCTION PROJECT TOTAL: $ 30,827 $ - $ -
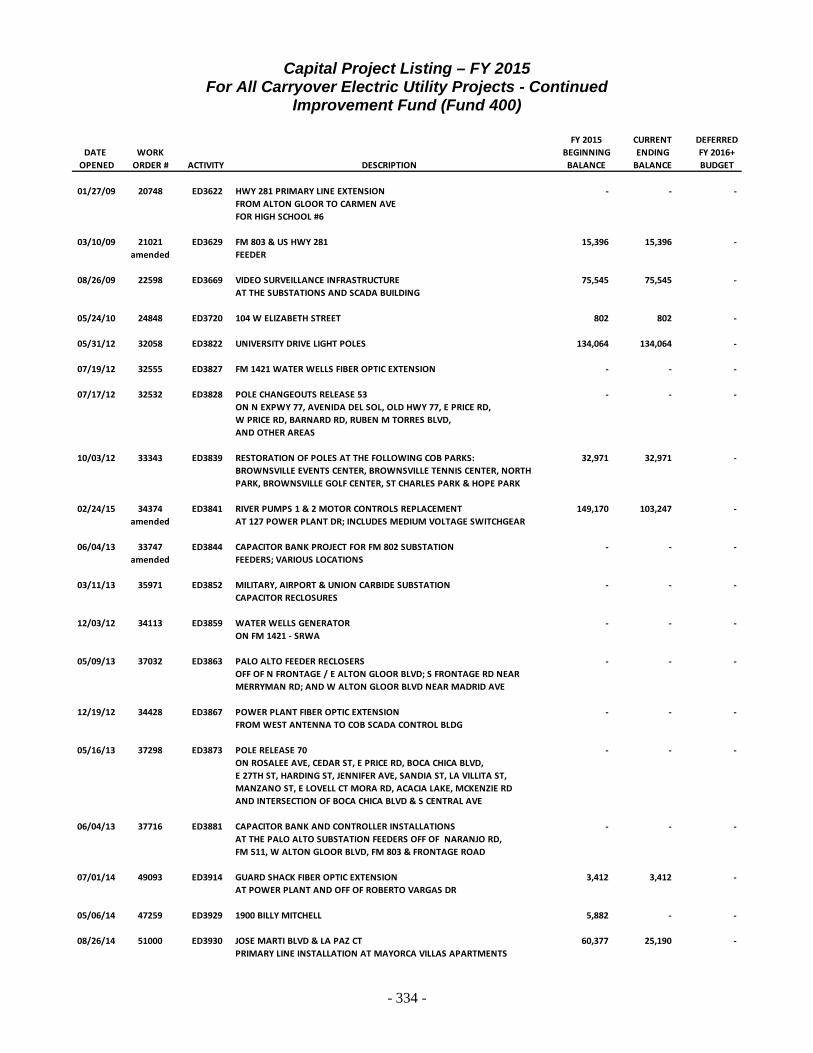
- 334 -
Capital Project Listing – FY 2015 For All Carryover Electric Utility Projects - Continued
Improvement Fund (Fund 400)
FY 2015 CURRENT DEFERREDDATE WORK BEGINNING ENDING FY 2016+
OPENED ORDER # ACTIVITY DESCRIPTION BALANCE BALANCE BUDGET
01/27/09 20748 ED3622 HWY 281 PRIMARY LINE EXTENSION - - - FROM ALTON GLOOR TO CARMEN AVEFOR HIGH SCHOOL #6
03/10/09 21021 ED3629 FM 803 & US HWY 281 15,396 15,396 - amended FEEDER
08/26/09 22598 ED3669 VIDEO SURVEILLANCE INFRASTRUCTURE 75,545 75,545 - AT THE SUBSTATIONS AND SCADA BUILDING
05/24/10 24848 ED3720 104 W ELIZABETH STREET 802 802 -
05/31/12 32058 ED3822 UNIVERSITY DRIVE LIGHT POLES 134,064 134,064 -
07/19/12 32555 ED3827 FM 1421 WATER WELLS FIBER OPTIC EXTENSION - - -
07/17/12 32532 ED3828 POLE CHANGEOUTS RELEASE 53 - - - ON N EXPWY 77, AVENIDA DEL SOL, OLD HWY 77, E PRICE RD,W PRICE RD, BARNARD RD, RUBEN M TORRES BLVD,AND OTHER AREAS
10/03/12 33343 ED3839 RESTORATION OF POLES AT THE FOLLOWING COB PARKS: 32,971 32,971 - BROWNSVILLE EVENTS CENTER, BROWNSVILLE TENNIS CENTER, NORTHPARK, BROWNSVILLE GOLF CENTER, ST CHARLES PARK & HOPE PARK
02/24/15 34374 ED3841 RIVER PUMPS 1 & 2 MOTOR CONTROLS REPLACEMENT 149,170 103,247 - amended AT 127 POWER PLANT DR; INCLUDES MEDIUM VOLTAGE SWITCHGEAR
06/04/13 33747 ED3844 CAPACITOR BANK PROJECT FOR FM 802 SUBSTATION - - - amended FEEDERS; VARIOUS LOCATIONS
03/11/13 35971 ED3852 MILITARY, AIRPORT & UNION CARBIDE SUBSTATION - - - CAPACITOR RECLOSURES
12/03/12 34113 ED3859 WATER WELLS GENERATOR - - - ON FM 1421 - SRWA
05/09/13 37032 ED3863 PALO ALTO FEEDER RECLOSERS - - - OFF OF N FRONTAGE / E ALTON GLOOR BLVD; S FRONTAGE RD NEARMERRYMAN RD; AND W ALTON GLOOR BLVD NEAR MADRID AVE
12/19/12 34428 ED3867 POWER PLANT FIBER OPTIC EXTENSION - - - FROM WEST ANTENNA TO COB SCADA CONTROL BLDG
05/16/13 37298 ED3873 POLE RELEASE 70 - - - ON ROSALEE AVE, CEDAR ST, E PRICE RD, BOCA CHICA BLVD,E 27TH ST, HARDING ST, JENNIFER AVE, SANDIA ST, LA VILLITA ST,MANZANO ST, E LOVELL CT MORA RD, ACACIA LAKE, MCKENZIE RDAND INTERSECTION OF BOCA CHICA BLVD & S CENTRAL AVE
06/04/13 37716 ED3881 CAPACITOR BANK AND CONTROLLER INSTALLATIONS - - - AT THE PALO ALTO SUBSTATION FEEDERS OFF OF NARANJO RD,FM 511, W ALTON GLOOR BLVD, FM 803 & FRONTAGE ROAD
07/01/14 49093 ED3914 GUARD SHACK FIBER OPTIC EXTENSION 3,412 3,412 - AT POWER PLANT AND OFF OF ROBERTO VARGAS DR
05/06/14 47259 ED3929 1900 BILLY MITCHELL 5,882 - -
08/26/14 51000 ED3930 JOSE MARTI BLVD & LA PAZ CT 60,377 25,190 - PRIMARY LINE INSTALLATION AT MAYORCA VILLAS APARTMENTS
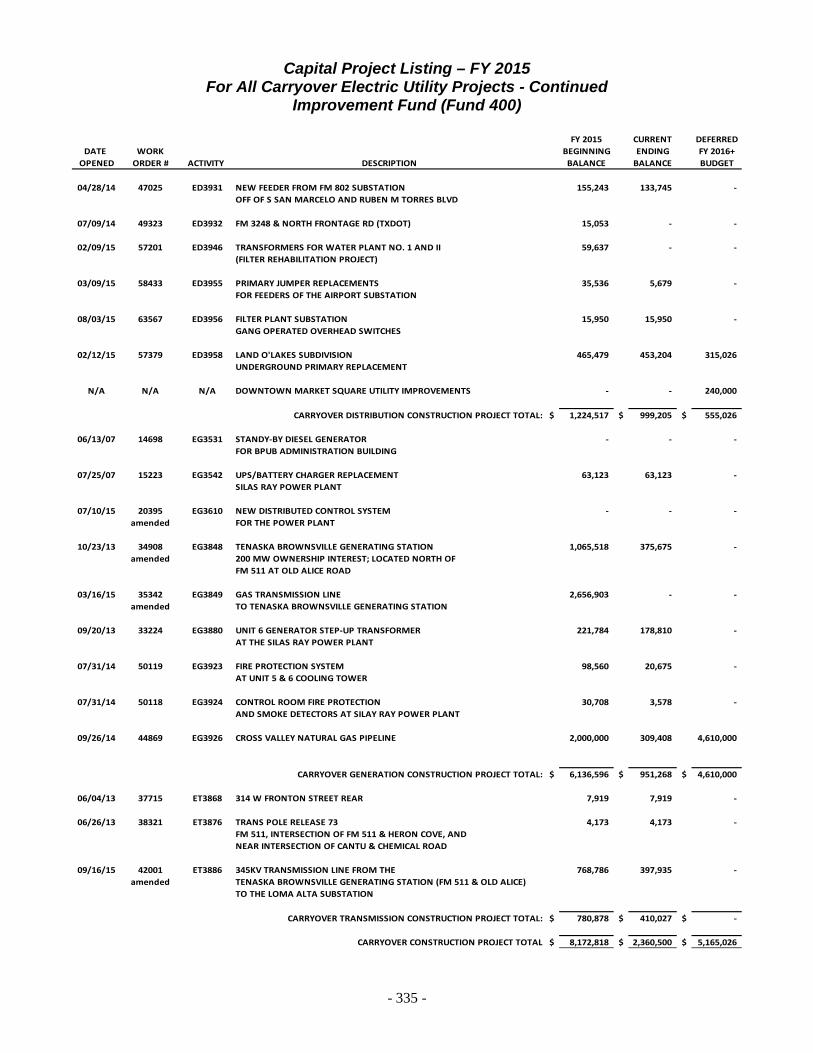
- 335 -
Capital Project Listing – FY 2015 For All Carryover Electric Utility Projects - Continued
Improvement Fund (Fund 400)
FY 2015 CURRENT DEFERREDDATE WORK BEGINNING ENDING FY 2016+
OPENED ORDER # ACTIVITY DESCRIPTION BALANCE BALANCE BUDGET
04/28/14 47025 ED3931 NEW FEEDER FROM FM 802 SUBSTATION 155,243 133,745 - OFF OF S SAN MARCELO AND RUBEN M TORRES BLVD
07/09/14 49323 ED3932 FM 3248 & NORTH FRONTAGE RD (TXDOT) 15,053 - -
02/09/15 57201 ED3946 TRANSFORMERS FOR WATER PLANT NO. 1 AND II 59,637 - - (FILTER REHABILITATION PROJECT)
03/09/15 58433 ED3955 PRIMARY JUMPER REPLACEMENTS 35,536 5,679 - FOR FEEDERS OF THE AIRPORT SUBSTATION
08/03/15 63567 ED3956 FILTER PLANT SUBSTATION 15,950 15,950 - GANG OPERATED OVERHEAD SWITCHES
02/12/15 57379 ED3958 LAND O'LAKES SUBDIVISION 465,479 453,204 315,026UNDERGROUND PRIMARY REPLACEMENT
N/A N/A N/A DOWNTOWN MARKET SQUARE UTILITY IMPROVEMENTS - - 240,000
CARRYOVER DISTRIBUTION CONSTRUCTION PROJECT TOTAL: $ 1,224,517 $ 999,205 $ 555,026
06/13/07 14698 EG3531 STANDY-BY DIESEL GENERATOR - - - FOR BPUB ADMINISTRATION BUILDING
07/25/07 15223 EG3542 UPS/BATTERY CHARGER REPLACEMENT 63,123 63,123 - SILAS RAY POWER PLANT
07/10/15 20395 EG3610 NEW DISTRIBUTED CONTROL SYSTEM - - - amended FOR THE POWER PLANT
10/23/13 34908 EG3848 TENASKA BROWNSVILLE GENERATING STATION 1,065,518 375,675 - amended 200 MW OWNERSHIP INTEREST; LOCATED NORTH OF
FM 511 AT OLD ALICE ROAD
03/16/15 35342 EG3849 GAS TRANSMISSION LINE 2,656,903 - - amended TO TENASKA BROWNSVILLE GENERATING STATION
09/20/13 33224 EG3880 UNIT 6 GENERATOR STEP-UP TRANSFORMER 221,784 178,810 - AT THE SILAS RAY POWER PLANT
07/31/14 50119 EG3923 FIRE PROTECTION SYSTEM 98,560 20,675 - AT UNIT 5 & 6 COOLING TOWER
07/31/14 50118 EG3924 CONTROL ROOM FIRE PROTECTION 30,708 3,578 - AND SMOKE DETECTORS AT SILAY RAY POWER PLANT
09/26/14 44869 EG3926 CROSS VALLEY NATURAL GAS PIPELINE 2,000,000 309,408 4,610,000
CARRYOVER GENERATION CONSTRUCTION PROJECT TOTAL: $ 6,136,596 $ 951,268 $ 4,610,000
06/04/13 37715 ET3868 314 W FRONTON STREET REAR 7,919 7,919 -
06/26/13 38321 ET3876 TRANS POLE RELEASE 73 4,173 4,173 - FM 511, INTERSECTION OF FM 511 & HERON COVE, ANDNEAR INTERSECTION OF CANTU & CHEMICAL ROAD
09/16/15 42001 ET3886 345KV TRANSMISSION LINE FROM THE 768,786 397,935 - amended TENASKA BROWNSVILLE GENERATING STATION (FM 511 & OLD ALICE)
TO THE LOMA ALTA SUBSTATION
CARRYOVER TRANSMISSION CONSTRUCTION PROJECT TOTAL: $ 780,878 $ 410,027 $ -
CARRYOVER CONSTRUCTION PROJECT TOTAL $ 8,172,818 $ 2,360,500 $ 5,165,026

- 336 -
Capital Project Listing – FY 2015 For All Carryover Electric Utility Projects - Continued
Improvement Fund (Fund 400)
FY 2015 CURRENT DEFERREDDATE WORK BEGINNING ENDING FY 2016+
OPENED ORDER # ACTIVITY DESCRIPTION BALANCE BALANCE BUDGET
10/08/09 22986 FD4002 FM 802 SUBSTATION PRIMARY CROSSING 1,739 1,739 -
12/09/10 26449 FD4078 6928 EAST HWY 48 - - -
07/11/11 27731 FD4158 FIBER OPTIC EXTENSION - NEW BUS STATION - - - TO EL TAPIZ BUILDING
03/27/12 31421 FD4186 ITECC WIND PROJECT 918 918 -
07/30/13 39358 FD4282 SLOSS DRIVE 2,221 2,221 - LA ESCONDIDA APARTMENTS
04/03/13 36377 FD4288 674 N CENTRAL AVENUE - - -
10/09/13 41460 FD4293 591 CENTRAL AVENUE 3,581 3,581 -
10/29/13 41941 FD4306 C.O.B. SCADA GRANT PROJECT 8,985 8,985 - OFF OF LAREDO RD, KUMQUAT, LAS PALMAS LN ANDWEST ALTON GLOOR AT SCHAEFER LN
12/13/13 42920 FD4308 1100 RUBEN M TORRES BLVD 513 513 - US MARSHAL SERVICE
12/20/13 43132 FD4312 684 CALDER LANE - - -
03/25/14 45897 FD4326 5101 ALTON GLOOR BLVD 937 937 - PLAZA VISTA
05/27/14 47942 FD4331 PORT OF BROWNSVILLE - DOCK 16 17,652 5,084 - OFF OF R.L. OSTOS RD
07/22/14 46680 FD4332 4325 JAIME ZAPATA AVE 28,604 25,681 - amended BRAVE RIVER DUPLEX
05/20/14 47795 FD4333 1205 E ALTON GLOOR BLVD 1,194 - -
12/10/13 42819 FD4339 15801 RL OSTOS RD - - - DEEP SOUTH TEXAS NEW FACILITY
08/14/14 50260 FD4340 1305 ACACIA LAKE DR - - -
09/16/14 51657 FD4350 90 GALONSKY 1,548 1,043 -
09/17/14 51687 FD4351 6750 N EXPRESSWAY 77 5,868 - - UNDERGROUND SERVICE TO TOYOTA DEALERSHIP
09/24/14 51945 FD4352 929 MEXICO BLVD - CAR LOT 6,545 - -
N/A N/A ED9001 NEW CONNECTIONS - ELECTRIC 157,407 - -
06/16/14 48670 FD4354 2644 OLD PORT ISABEL ROAD 95,825 64,363 - CALI TOWNHOMES
10/16/14 52850 FD4355 5403 RUSTIC MANOR DR - - -
10/21/14 53048 FD4356 JOSE MARTI BLVD & LA PAZ CT 3,239 3,239 - TEMP CONNECTIONS FOR MAYORCA APARTMENTS
10/30/14 53350 FD4357 3 ALBERTA DRIVE 1,581 - -
12/10/14 54889 FD4362 3595 RUBEN M TORRES BLVD 626 626 -
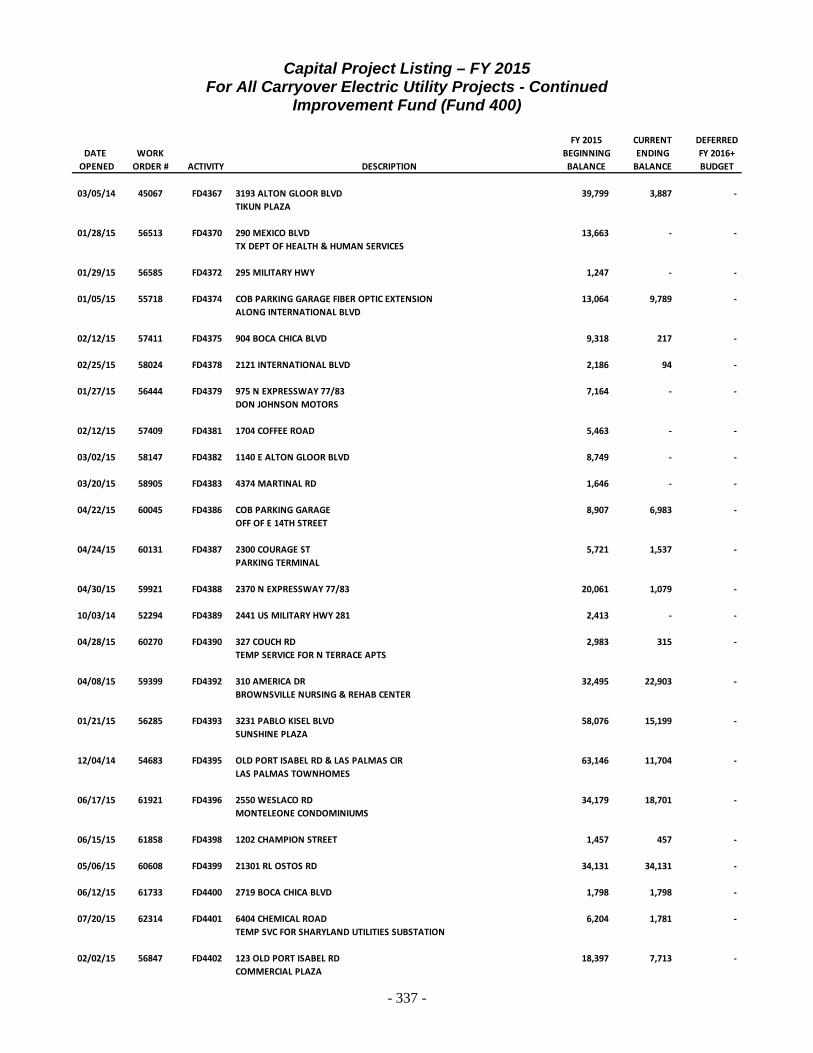
- 337 -
Capital Project Listing – FY 2015 For All Carryover Electric Utility Projects - Continued
Improvement Fund (Fund 400)
FY 2015 CURRENT DEFERREDDATE WORK BEGINNING ENDING FY 2016+
OPENED ORDER # ACTIVITY DESCRIPTION BALANCE BALANCE BUDGET
03/05/14 45067 FD4367 3193 ALTON GLOOR BLVD 39,799 3,887 - TIKUN PLAZA
01/28/15 56513 FD4370 290 MEXICO BLVD 13,663 - - TX DEPT OF HEALTH & HUMAN SERVICES
01/29/15 56585 FD4372 295 MILITARY HWY 1,247 - -
01/05/15 55718 FD4374 COB PARKING GARAGE FIBER OPTIC EXTENSION 13,064 9,789 - ALONG INTERNATIONAL BLVD
02/12/15 57411 FD4375 904 BOCA CHICA BLVD 9,318 217 -
02/25/15 58024 FD4378 2121 INTERNATIONAL BLVD 2,186 94 -
01/27/15 56444 FD4379 975 N EXPRESSWAY 77/83 7,164 - - DON JOHNSON MOTORS
02/12/15 57409 FD4381 1704 COFFEE ROAD 5,463 - -
03/02/15 58147 FD4382 1140 E ALTON GLOOR BLVD 8,749 - -
03/20/15 58905 FD4383 4374 MARTINAL RD 1,646 - -
04/22/15 60045 FD4386 COB PARKING GARAGE 8,907 6,983 - OFF OF E 14TH STREET
04/24/15 60131 FD4387 2300 COURAGE ST 5,721 1,537 - PARKING TERMINAL
04/30/15 59921 FD4388 2370 N EXPRESSWAY 77/83 20,061 1,079 -
10/03/14 52294 FD4389 2441 US MILITARY HWY 281 2,413 - -
04/28/15 60270 FD4390 327 COUCH RD 2,983 315 - TEMP SERVICE FOR N TERRACE APTS
04/08/15 59399 FD4392 310 AMERICA DR 32,495 22,903 - BROWNSVILLE NURSING & REHAB CENTER
01/21/15 56285 FD4393 3231 PABLO KISEL BLVD 58,076 15,199 - SUNSHINE PLAZA
12/04/14 54683 FD4395 OLD PORT ISABEL RD & LAS PALMAS CIR 63,146 11,704 - LAS PALMAS TOWNHOMES
06/17/15 61921 FD4396 2550 WESLACO RD 34,179 18,701 - MONTELEONE CONDOMINIUMS
06/15/15 61858 FD4398 1202 CHAMPION STREET 1,457 457 -
05/06/15 60608 FD4399 21301 RL OSTOS RD 34,131 34,131 -
06/12/15 61733 FD4400 2719 BOCA CHICA BLVD 1,798 1,798 -
07/20/15 62314 FD4401 6404 CHEMICAL ROAD 6,204 1,781 - TEMP SVC FOR SHARYLAND UTILITIES SUBSTATION
02/02/15 56847 FD4402 123 OLD PORT ISABEL RD 18,397 7,713 - COMMERCIAL PLAZA
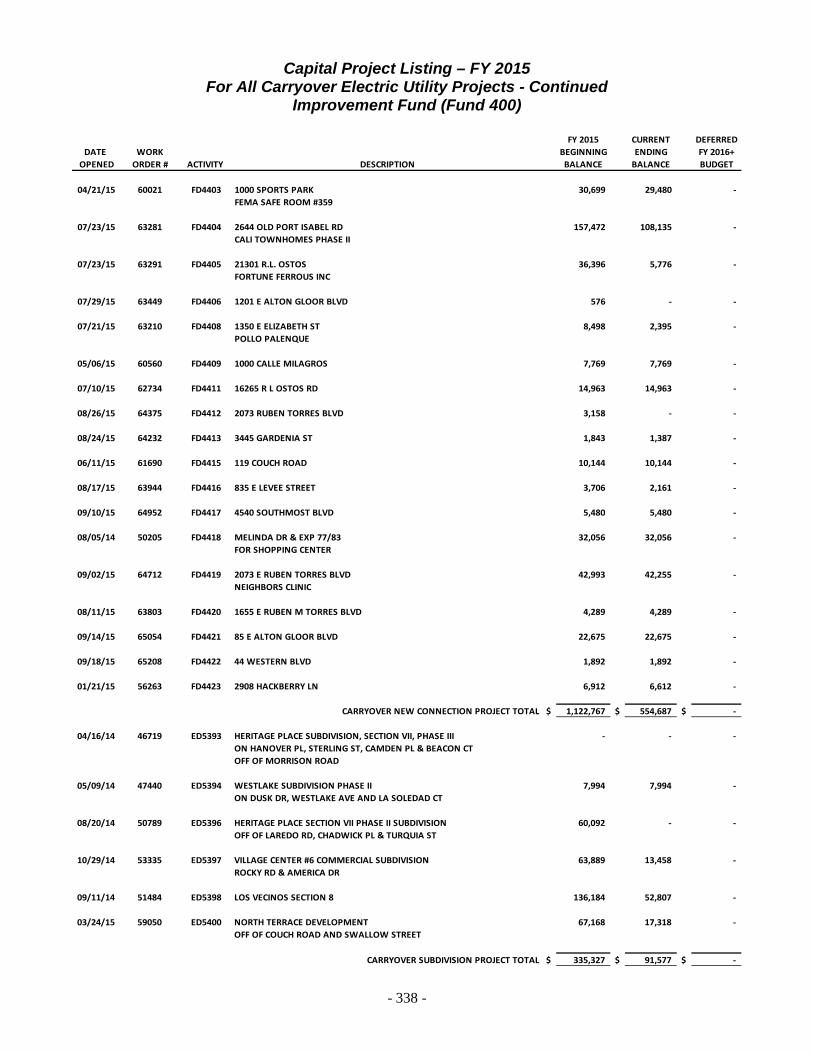
- 338 -
Capital Project Listing – FY 2015 For All Carryover Electric Utility Projects - Continued
Improvement Fund (Fund 400)
FY 2015 CURRENT DEFERREDDATE WORK BEGINNING ENDING FY 2016+
OPENED ORDER # ACTIVITY DESCRIPTION BALANCE BALANCE BUDGET
04/21/15 60021 FD4403 1000 SPORTS PARK 30,699 29,480 - FEMA SAFE ROOM #359
07/23/15 63281 FD4404 2644 OLD PORT ISABEL RD 157,472 108,135 - CALI TOWNHOMES PHASE II
07/23/15 63291 FD4405 21301 R.L. OSTOS 36,396 5,776 - FORTUNE FERROUS INC
07/29/15 63449 FD4406 1201 E ALTON GLOOR BLVD 576 - -
07/21/15 63210 FD4408 1350 E ELIZABETH ST 8,498 2,395 - POLLO PALENQUE
05/06/15 60560 FD4409 1000 CALLE MILAGROS 7,769 7,769 -
07/10/15 62734 FD4411 16265 R L OSTOS RD 14,963 14,963 -
08/26/15 64375 FD4412 2073 RUBEN TORRES BLVD 3,158 - -
08/24/15 64232 FD4413 3445 GARDENIA ST 1,843 1,387 -
06/11/15 61690 FD4415 119 COUCH ROAD 10,144 10,144 -
08/17/15 63944 FD4416 835 E LEVEE STREET 3,706 2,161 -
09/10/15 64952 FD4417 4540 SOUTHMOST BLVD 5,480 5,480 -
08/05/14 50205 FD4418 MELINDA DR & EXP 77/83 32,056 32,056 - FOR SHOPPING CENTER
09/02/15 64712 FD4419 2073 E RUBEN TORRES BLVD 42,993 42,255 - NEIGHBORS CLINIC
08/11/15 63803 FD4420 1655 E RUBEN M TORRES BLVD 4,289 4,289 -
09/14/15 65054 FD4421 85 E ALTON GLOOR BLVD 22,675 22,675 -
09/18/15 65208 FD4422 44 WESTERN BLVD 1,892 1,892 -
01/21/15 56263 FD4423 2908 HACKBERRY LN 6,912 6,612 -
CARRYOVER NEW CONNECTION PROJECT TOTAL $ 1,122,767 $ 554,687 $ -
04/16/14 46719 ED5393 HERITAGE PLACE SUBDIVISION, SECTION VII, PHASE III - - - ON HANOVER PL, STERLING ST, CAMDEN PL & BEACON CTOFF OF MORRISON ROAD
05/09/14 47440 ED5394 WESTLAKE SUBDIVISION PHASE II 7,994 7,994 - ON DUSK DR, WESTLAKE AVE AND LA SOLEDAD CT
08/20/14 50789 ED5396 HERITAGE PLACE SECTION VII PHASE II SUBDIVISION 60,092 - - OFF OF LAREDO RD, CHADWICK PL & TURQUIA ST
10/29/14 53335 ED5397 VILLAGE CENTER #6 COMMERCIAL SUBDIVISION 63,889 13,458 - ROCKY RD & AMERICA DR
09/11/14 51484 ED5398 LOS VECINOS SECTION 8 136,184 52,807 -
03/24/15 59050 ED5400 NORTH TERRACE DEVELOPMENT 67,168 17,318 - OFF OF COUCH ROAD AND SWALLOW STREET
CARRYOVER SUBDIVISION PROJECT TOTAL $ 335,327 $ 91,577 $ -

- 339 -
Capital Project Listing – FY 2015 For All Carryover Electric Utility Projects - Continued
Improvement Fund (Fund 400)
FY 2015 CURRENT DEFERREDDATE WORK BEGINNING ENDING FY 2016+
OPENED ORDER # ACTIVITY DESCRIPTION BALANCE BALANCE BUDGET
04/25/13 36810 ED7615 SAM PERL BLVD 236 236 -
06/11/13 37968 ED7616 MORRISON RD AND WALKING TRAIL 3,004 3,004 -
12/29/14 55570 ED7652 373 VIKING LN 150 - -
01/23/15 56368 ED7654 HUDSON BLVD - WALMART 1,114 1,114 -
07/09/14 49306 ED7655 1047 E MADISON ST 277 - -
02/23/15 57915 ED7657 16 RESACA BLVD 158 - -
03/19/15 58834 ED7658 1205 DURANTA LN REAR 136 - -
01/28/15 56501 ED7659 PORT OF BROWNSVILLE LIGHTING PROJECT 655,276 241,861 - ON CAPTAIN DONALD FOUST ROAD, MILO ROAD, WINDHAUS ROAD, RL OSTOS ROAD, LIQUID CARGO DOCK ROAD AND OLD SH 48
05/20/15 61080 ED7660 34 TONY GONZALEZ DR 4,475 4,475 - TONY GONZALEZ PARK
05/20/15 61343 ED7661 104 EL PASO RD 19,858 4,611 - OLIVEIRA SKATE PARK
05/22/15 61143 ED7662 2000 ROOSEVELT ST 5,636 5,063 - ALSO TANGELO AND CLEVELAND ST
04/15/15 59670 ED7664 E COWAN TERRACE 993 563 -
06/15/15 61838 ED7666 2035 LINCOLN ST 612 214 -
07/06/15 62513 ED7667 SUNSHINE ROAD 1,476 1,229 -
03/18/15 58774 ED7668 HISTORIC HIKE AND BIKE TRAIL 10,931 4,957 - FROM RINGGOLD ROAD TO DENNET ROAD
06/22/15 61989 ED7669 84 YORK DRIVE 940 817 -
06/10/15 61634 ED7670 PALM BLVD 24,608 3,020 -
06/11/15 61711 ED7671 4775 AUSTIN RD 23,337 23,337 - PORTWAY ACRES PARK
CARRYOVER STREET LIGHT PROJECT TOTAL $ 753,218 $ 294,501 $ -
01/13/10 23798 FD6261 3201 LIMA STREET 1,266 1,266 - METER CONSOLIDATION AT CASTANEDA ELEMENTARY
12/07/10 26423 FD6266 METERS FOR STELL & FAULK MIDDLE SCHOOL - - - AND RUSSELL ELEMENTARY
03/24/11 24052 FD6275 7 ORANGE STREET - - - METER CONSOLIDATION PROJECT AT LINCOLN PARK SCHOOL
02/07/12 30948 FD6359 3555 E 14TH STREET 68,268 68,268 - RICH SEA PAK TRANSFORMER REPLACEMENT
06/01/12 32071 FD6372 708 PAREDES LINE RD 1,111 1,111 - TIME WARNER CABLE
05/10/12 31844 FD6380 3029 LAZY ACRES 1,825 1,825 -

- 340 -
Capital Project Listing – FY 2015 For All Carryover Electric Utility Projects - Continued
Improvement Fund (Fund 400)
FY 2015 CURRENT DEFERREDDATE WORK BEGINNING ENDING FY 2016+
OPENED ORDER # ACTIVITY DESCRIPTION BALANCE BALANCE BUDGET
07/03/12 32403 FD6382 205 CALLE AMISTOSA #115 347 347 -
01/03/13 34632 FD6397 LIFT STATION 13 POLE INSTALLATION 487 487 - OFF OF ROOSEVELT ST AND CAMINO DEL ORO
02/11/13 35362 FD6406 341 JOSE MARTI AND - - - 4200 BOCA CHICA
01/23/13 34986 FD6412 5304 FM 802 5,481 - -
03/18/13 36120 FD6428 663 HILLCREST CT 3,581 3,581 -
04/05/13 36487 FD6435 OPI RD AND LINDA VISTA 4,351 4,351 -
03/27/13 36267 FD6443 183 E COWAN TERRACE 2,121 2,121 -
05/13/13 37102 FD6454 2807 N CENTRAL AVE 23,140 - -
08/30/13 40447 FD6468 POLES ALONG HWY 48 - - -
11/18/13 42334 FD6479 722 WEST ELIZABETH ST 1,216 1,216 -
04/04/14 46270 FD6492 4656 TOWERWOOD DR 31,569 31,569 -
04/24/14 46941 FD6499 105 BILLY MITCHELL BLVD - STRIPES - - -
04/24/14 46974 FD6500 1564 E LOS EBANOS BLVD - STRIPES - - -
06/09/14 48462 FD6501 1940 WESTMINISTER DR 2,419 2,419 -
02/26/14 44789 FD6504 18501 RL OSTOS RD - - - INTERNATIONAL SHIPBREAKING
07/17/14 49620 FD6514 POLE CHANGED OUTS - RELEASE 77 8,568 8,568 - AT THE PORT OF BROWNSVILLE ON R.L. OSTOS RD
N/A N/A ED6000 EMERGENCY TROUBLE CALL 870,603 - - Activity for use when work order is not available at time of emergency.
10/07/14 52409 FD6524 525 ACACIA LAKE DR 5,441 - -
03/24/14 45869 FD6525 101 BOXCAR RD 51,428 25,627 -
11/14/14 53955 FD6526 20000 SH 48 17,285 17,285 - 1500 KVA XFMR AT AMFELS
01/29/15 56613 FD6528 940 FM 511 1,289 - -
02/12/15 57380 FD6529 1455 ROBINHOOD DR 8,752 1,612 -
02/02/15 56867 FD6530 1345 E MONROE ST 2,128 - -
03/17/15 58761 FD6531 635 INTERNATIONAL BLVD - VALERO 2,707 - -
03/13/15 58600 FD6533 75 GALONSKY ST 2,926 2,926 -
02/24/15 57962 FD6534 10150 OLD HIGHWAY 48 20,439 - - UPGRADE XFMR TO 1000KVA 277/480V
03/05/15 58358 FD6535 1730 BAYOU CT 3,886 - -
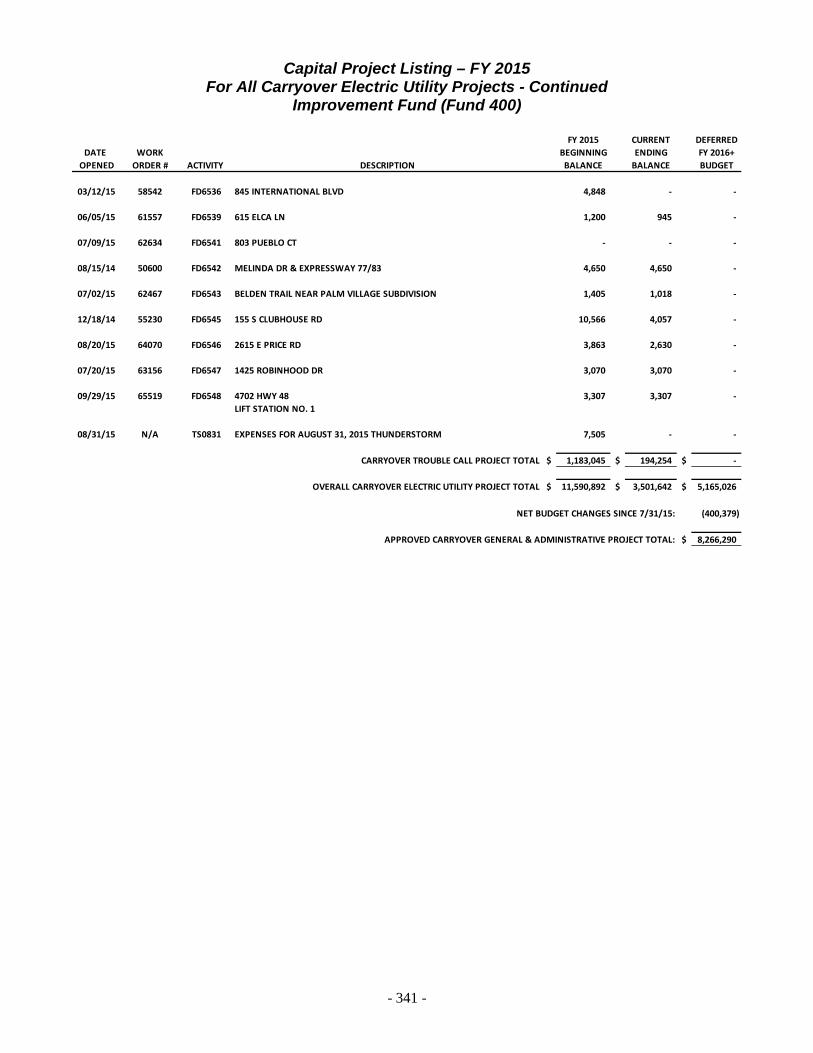
- 341 -
Capital Project Listing – FY 2015 For All Carryover Electric Utility Projects - Continued
Improvement Fund (Fund 400)
FY 2015 CURRENT DEFERREDDATE WORK BEGINNING ENDING FY 2016+
OPENED ORDER # ACTIVITY DESCRIPTION BALANCE BALANCE BUDGET
03/12/15 58542 FD6536 845 INTERNATIONAL BLVD 4,848 - -
06/05/15 61557 FD6539 615 ELCA LN 1,200 945 -
07/09/15 62634 FD6541 803 PUEBLO CT - - -
08/15/14 50600 FD6542 MELINDA DR & EXPRESSWAY 77/83 4,650 4,650 -
07/02/15 62467 FD6543 BELDEN TRAIL NEAR PALM VILLAGE SUBDIVISION 1,405 1,018 -
12/18/14 55230 FD6545 155 S CLUBHOUSE RD 10,566 4,057 -
08/20/15 64070 FD6546 2615 E PRICE RD 3,863 2,630 -
07/20/15 63156 FD6547 1425 ROBINHOOD DR 3,070 3,070 -
09/29/15 65519 FD6548 4702 HWY 48 3,307 3,307 - LIFT STATION NO. 1
08/31/15 N/A TS0831 EXPENSES FOR AUGUST 31, 2015 THUNDERSTORM 7,505 - -
CARRYOVER TROUBLE CALL PROJECT TOTAL $ 1,183,045 $ 194,254 $ -
OVERALL CARRYOVER ELECTRIC UTILITY PROJECT TOTAL $ 11,590,892 $ 3,501,642 $ 5,165,026
(400,379)
$ 8,266,290
NET BUDGET CHANGES SINCE 7/31/15:
APPROVED CARRYOVER GENERAL & ADMINISTRATIVE PROJECT TOTAL:

- 342 -
Capital Project Listing – FY 2015 For All Carryover Water Utility Projects
Improvement Fund (Fund 400)
FY 2015 CURRENT DEFERREDDATE WORK BEGINNING ENDING FY 2016+
OPENED ORDER # ACTIVITY DESCRIPTION BALANCE BALANCE BUDGET
N/A N/A CDAM CHANNEL DAM $ - $ - $ -
03/05/09 20571 WS3612 PRETREATMENT AND WELL FIELD PUMPING - - -
06/16/11 28143 WD3765 8" WATER MAIN ALONG ALTON GLOOR 13,386 13,386 - INTERSECTION OF LAREDO RD AND SCAEFER LANE
07/24/14 28551 WT3772 FILTER SYSTEM REHABILITATION PROJECT 419,599 4,617 - amended AT WATER PLANT I AND II
09/18/12 32867 WT3829 WATER PLANT #1 GATE VALVE 14,442 14,442 - amended
11/30/12 34085 WT3860 UPGRADE RAW WATER PUMPS FOR #3 AND #6 41,175 41,175 - VARIABLE FREQUENCY DRIVES AT WTP #1
12/16/14 42758 WD3899 SRWA UTILITY ADJUSTMENTS FOR THE TXDOT FM 803 12,743 - - amended REALIGNMENT PROJECT OFF OF THE INTERSECTION OF
US 77/83 AND RANCHO VIEJO OVERPASS
06/24/14 48851 WA3913 JARDIN TERRACE SUBDIVISION 18 18 - APPRAISAL OF LOTS
12/17/14 55220 WA3936 WATER PLANT #1 CHAIN LINK PERIMITER FENCE 29,000 - -
05/11/15 60717 WT3949 BACKWASH VALVE AND ACTUATOR 15,038 1,657 - FOR WATER PLANT I
05/11/15 60742 WT3950 CHLORINE SCALES FOR WATER PLANT I 25,764 5,558 -
08/25/15 N/A WP2PGF EQUIPMENT FOR WATER PLANT II PIPE GALLERY AREA 37,882 - -
CARRYOVER CONSTRUCTION PROJECT TOTAL $ 609,047 $ 80,854 $ -
CARRYOVER SUBDIVISION PROJECT TOTAL $ - $ - $ -
04/03/13 30300 WD6075 W MADISON ST WATERLINE REPLACEMENT 9,726 9,432 - amended FROM BOCA CHICA BLVD TO LAKESIDE BLVD
10/15/12 32525 WD6078 JEFFERSON STREET WATER LINE REPLACEMENT - - - amended FROM CENTRAL BLVD TO PALM BLVD
07/14/15 44331 WD6087 IMPALA COURT WATERLINE RELOCATION PROJECT 88,743 72,326 - amended
05/28/15 61336 WD6090 108 HACIENDA LANE 2,083 2,083 -
CARRYOVER RELOCATION/REPLACEMENT OF LINES PROJECT TOTAL $ 100,552 $ 83,841 $ -
N/A N/A WD9001 NEW CONNECTIONS-NO PROJ # ASSIGNED - - -
CARRYOVER NEW CONNECTION PROJECT TOTAL $ - $ - $ -
OVERALL CARRYOVER WATER UTILITY PROJECT TOTAL $ 709,599 $ 164,695 $ -
115,593
$ 280,288
NET BUDGET CHANGES SINCE 7/31/15:
APPROVED CARRYOVER GENERAL & ADMINISTRATIVE PROJECT TOTAL:
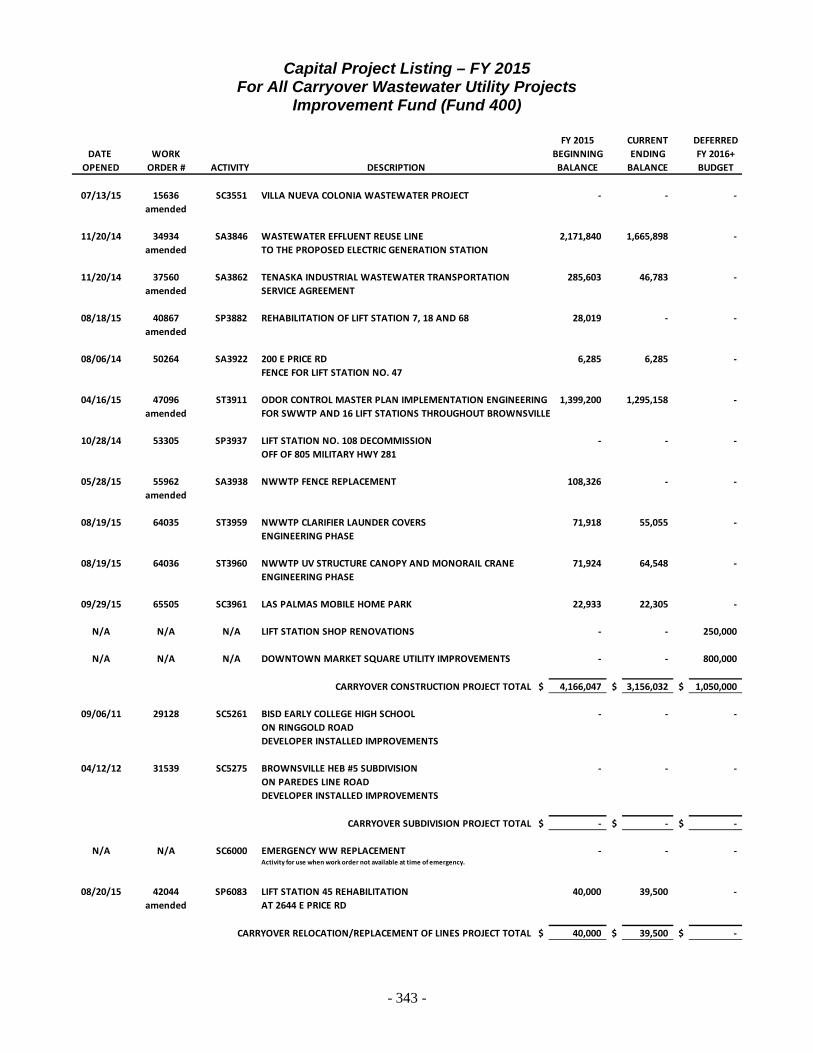
- 343 -
Capital Project Listing – FY 2015 For All Carryover Wastewater Utility Projects
Improvement Fund (Fund 400)
FY 2015 CURRENT DEFERREDDATE WORK BEGINNING ENDING FY 2016+
OPENED ORDER # ACTIVITY DESCRIPTION BALANCE BALANCE BUDGET
07/13/15 15636 SC3551 VILLA NUEVA COLONIA WASTEWATER PROJECT - - - amended
11/20/14 34934 SA3846 WASTEWATER EFFLUENT REUSE LINE 2,171,840 1,665,898 - amended TO THE PROPOSED ELECTRIC GENERATION STATION
11/20/14 37560 SA3862 TENASKA INDUSTRIAL WASTEWATER TRANSPORTATION 285,603 46,783 - amended SERVICE AGREEMENT
08/18/15 40867 SP3882 REHABILITATION OF LIFT STATION 7, 18 AND 68 28,019 - - amended
08/06/14 50264 SA3922 200 E PRICE RD 6,285 6,285 - FENCE FOR LIFT STATION NO. 47
04/16/15 47096 ST3911 ODOR CONTROL MASTER PLAN IMPLEMENTATION ENGINEERING 1,399,200 1,295,158 - amended FOR SWWTP AND 16 LIFT STATIONS THROUGHOUT BROWNSVILLE
10/28/14 53305 SP3937 LIFT STATION NO. 108 DECOMMISSION - - - OFF OF 805 MILITARY HWY 281
05/28/15 55962 SA3938 NWWTP FENCE REPLACEMENT 108,326 - - amended
08/19/15 64035 ST3959 NWWTP CLARIFIER LAUNDER COVERS 71,918 55,055 - ENGINEERING PHASE
08/19/15 64036 ST3960 NWWTP UV STRUCTURE CANOPY AND MONORAIL CRANE 71,924 64,548 - ENGINEERING PHASE
09/29/15 65505 SC3961 LAS PALMAS MOBILE HOME PARK 22,933 22,305 -
N/A N/A N/A LIFT STATION SHOP RENOVATIONS - - 250,000
N/A N/A N/A DOWNTOWN MARKET SQUARE UTILITY IMPROVEMENTS - - 800,000
CARRYOVER CONSTRUCTION PROJECT TOTAL $ 4,166,047 $ 3,156,032 $ 1,050,000
09/06/11 29128 SC5261 BISD EARLY COLLEGE HIGH SCHOOL - - - ON RINGGOLD ROADDEVELOPER INSTALLED IMPROVEMENTS
04/12/12 31539 SC5275 BROWNSVILLE HEB #5 SUBDIVISION - - - ON PAREDES LINE ROADDEVELOPER INSTALLED IMPROVEMENTS
CARRYOVER SUBDIVISION PROJECT TOTAL $ - $ - $ -
N/A N/A SC6000 EMERGENCY WW REPLACEMENT - - - Activity for use when work order not available at time of emergency.
08/20/15 42044 SP6083 LIFT STATION 45 REHABILITATION 40,000 39,500 - amended AT 2644 E PRICE RD
CARRYOVER RELOCATION/REPLACEMENT OF LINES PROJECT TOTAL $ 40,000 $ 39,500 $ -
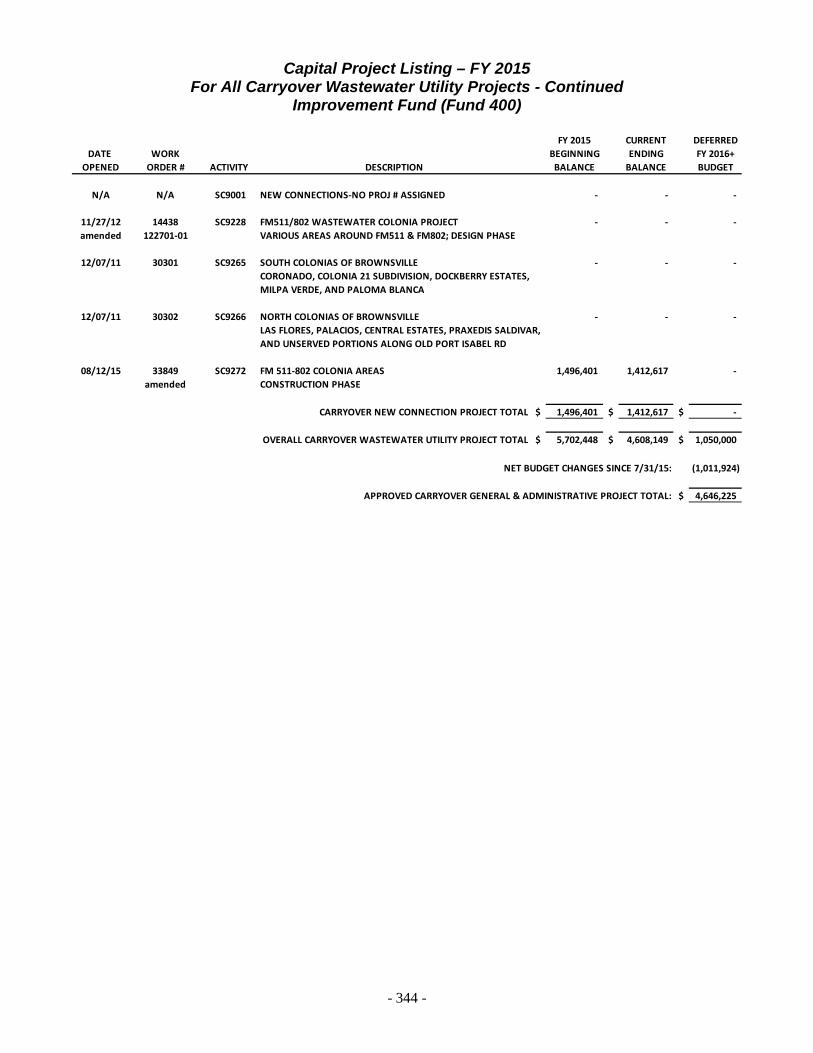
- 344 -
Capital Project Listing – FY 2015 For All Carryover Wastewater Utility Projects - Continued
Improvement Fund (Fund 400)
FY 2015 CURRENT DEFERREDDATE WORK BEGINNING ENDING FY 2016+
OPENED ORDER # ACTIVITY DESCRIPTION BALANCE BALANCE BUDGET
N/A N/A SC9001 NEW CONNECTIONS-NO PROJ # ASSIGNED - - -
11/27/12 14438 SC9228 FM511/802 WASTEWATER COLONIA PROJECT - - - amended 122701-01 VARIOUS AREAS AROUND FM511 & FM802; DESIGN PHASE
12/07/11 30301 SC9265 SOUTH COLONIAS OF BROWNSVILLE - - - CORONADO, COLONIA 21 SUBDIVISION, DOCKBERRY ESTATES,MILPA VERDE, AND PALOMA BLANCA
12/07/11 30302 SC9266 NORTH COLONIAS OF BROWNSVILLE - - - LAS FLORES, PALACIOS, CENTRAL ESTATES, PRAXEDIS SALDIVAR, AND UNSERVED PORTIONS ALONG OLD PORT ISABEL RD
08/12/15 33849 SC9272 FM 511-802 COLONIA AREAS 1,496,401 1,412,617 - amended CONSTRUCTION PHASE
CARRYOVER NEW CONNECTION PROJECT TOTAL $ 1,496,401 $ 1,412,617 $ -
OVERALL CARRYOVER WASTEWATER UTILITY PROJECT TOTAL $ 5,702,448 $ 4,608,149 $ 1,050,000
(1,011,924)
$ 4,646,225
NET BUDGET CHANGES SINCE 7/31/15:
APPROVED CARRYOVER GENERAL & ADMINISTRATIVE PROJECT TOTAL:
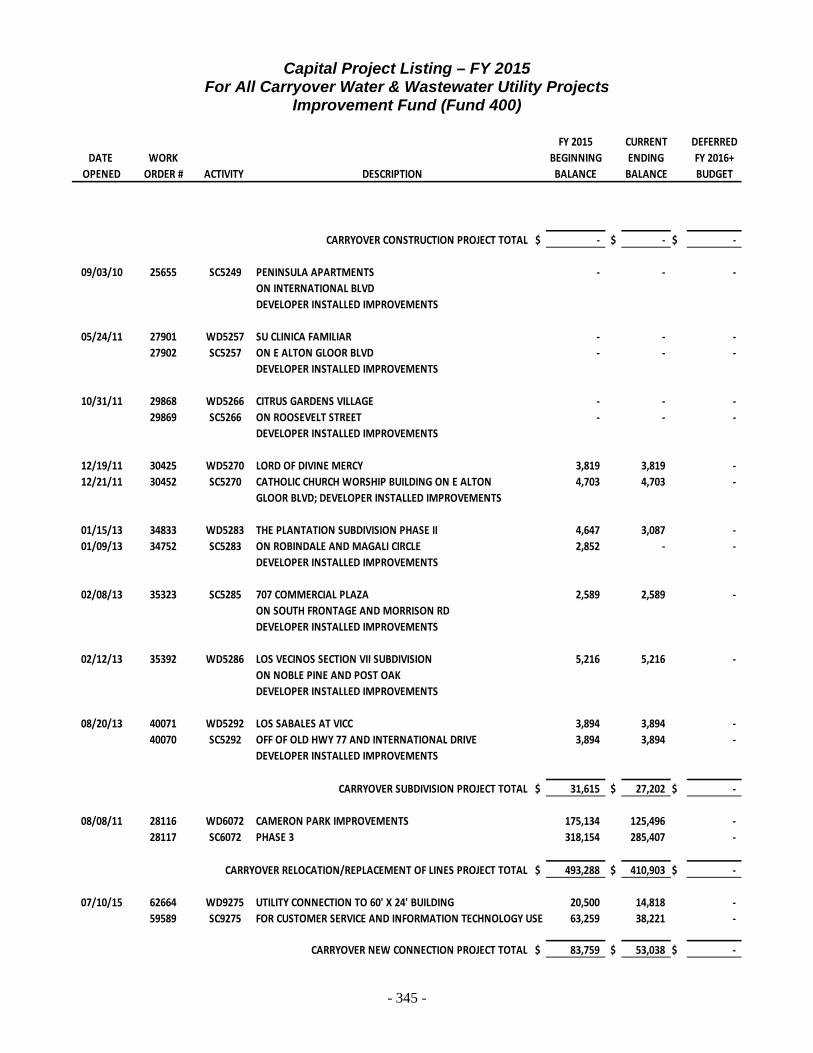
- 345 -
Capital Project Listing – FY 2015 For All Carryover Water & Wastewater Utility Projects
Improvement Fund (Fund 400)
FY 2015 CURRENT DEFERREDDATE WORK BEGINNING ENDING FY 2016+
OPENED ORDER # ACTIVITY DESCRIPTION BALANCE BALANCE BUDGET
CARRYOVER CONSTRUCTION PROJECT TOTAL $ - $ - $ -
09/03/10 25655 SC5249 PENINSULA APARTMENTS - - - ON INTERNATIONAL BLVDDEVELOPER INSTALLED IMPROVEMENTS
05/24/11 27901 WD5257 SU CLINICA FAMILIAR - - - 27902 SC5257 ON E ALTON GLOOR BLVD - - -
DEVELOPER INSTALLED IMPROVEMENTS
10/31/11 29868 WD5266 CITRUS GARDENS VILLAGE - - - 29869 SC5266 ON ROOSEVELT STREET - - -
DEVELOPER INSTALLED IMPROVEMENTS
12/19/11 30425 WD5270 LORD OF DIVINE MERCY 3,819 3,819 - 12/21/11 30452 SC5270 CATHOLIC CHURCH WORSHIP BUILDING ON E ALTON 4,703 4,703 -
GLOOR BLVD; DEVELOPER INSTALLED IMPROVEMENTS
01/15/13 34833 WD5283 THE PLANTATION SUBDIVISION PHASE II 4,647 3,087 - 01/09/13 34752 SC5283 ON ROBINDALE AND MAGALI CIRCLE 2,852 - -
DEVELOPER INSTALLED IMPROVEMENTS
02/08/13 35323 SC5285 707 COMMERCIAL PLAZA 2,589 2,589 - ON SOUTH FRONTAGE AND MORRISON RDDEVELOPER INSTALLED IMPROVEMENTS
02/12/13 35392 WD5286 LOS VECINOS SECTION VII SUBDIVISION 5,216 5,216 - ON NOBLE PINE AND POST OAKDEVELOPER INSTALLED IMPROVEMENTS
08/20/13 40071 WD5292 LOS SABALES AT VICC 3,894 3,894 - 40070 SC5292 OFF OF OLD HWY 77 AND INTERNATIONAL DRIVE 3,894 3,894 -
DEVELOPER INSTALLED IMPROVEMENTS
CARRYOVER SUBDIVISION PROJECT TOTAL $ 31,615 $ 27,202 $ -
08/08/11 28116 WD6072 CAMERON PARK IMPROVEMENTS 175,134 125,496 - 28117 SC6072 PHASE 3 318,154 285,407 -
CARRYOVER RELOCATION/REPLACEMENT OF LINES PROJECT TOTAL $ 493,288 $ 410,903 $ -
07/10/15 62664 WD9275 UTILITY CONNECTION TO 60' X 24' BUILDING 20,500 14,818 - 59589 SC9275 FOR CUSTOMER SERVICE AND INFORMATION TECHNOLOGY USE 63,259 38,221 -
CARRYOVER NEW CONNECTION PROJECT TOTAL $ 83,759 $ 53,038 $ -

- 346 -
Capital Project Listing – FY 2015 For All Carryover Water & Wastewater Utility Projects - Continued
Improvement Fund (Fund 400)
FY 2015 CURRENT DEFERREDDATE WORK BEGINNING ENDING FY 2016+
OPENED ORDER # ACTIVITY DESCRIPTION BALANCE BALANCE BUDGET
Carryover Water Utility Project Total 213,211 156,329 - Carryover Wastewater Utility Project Total 395,451 334,814 -
OVERALL CARRYOVER WATER & WASTEWATER UTILITY PROJECT TOTAL $ 608,662 $ 491,144 $ -
11,2236,450
$ 502,367
NET BUDGET CHANGES SINCE 7/31/15 - WATER:
APPROVED CARRYOVER GENERAL & ADMINISTRATIVE PROJECT TOTAL:
NET BUDGET CHANGES SINCE 7/31/15 - WASTEWATER:
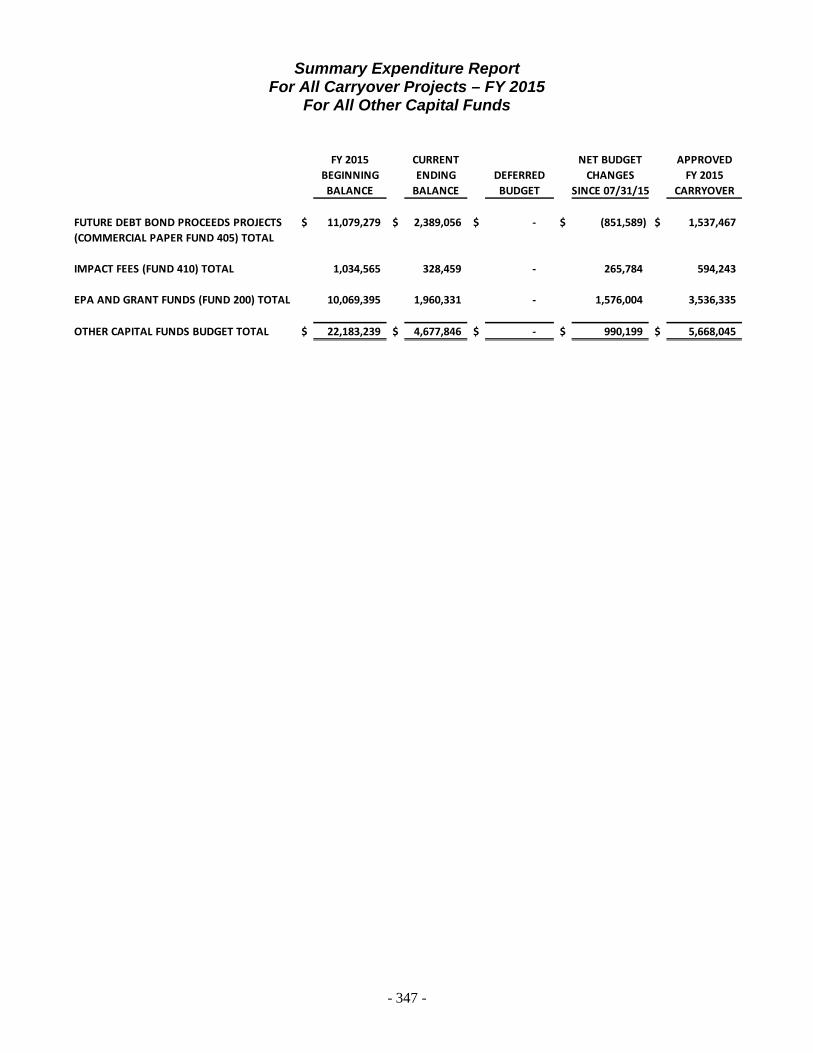
- 347 -
Summary Expenditure Report For All Carryover Projects – FY 2015
For All Other Capital Funds
FY 2015 CURRENT NET BUDGET APPROVEDBEGINNING ENDING DEFERRED CHANGES FY 2015BALANCE BALANCE BUDGET SINCE 07/31/15 CARRYOVER
FUTURE DEBT BOND PROCEEDS PROJECTS (COMMERCIAL PAPER FUND 405) TOTAL
$ 11,079,279 $ 2,389,056 $ - $ (851,589) $ 1,537,467
IMPACT FEES (FUND 410) TOTAL 1,034,565 328,459 - 265,784 594,243
EPA AND GRANT FUNDS (FUND 200) TOTAL 10,069,395 1,960,331 - 1,576,004 3,536,335
OTHER CAPITAL FUNDS BUDGET TOTAL $ 22,183,239 $ 4,677,846 $ - $ 990,199 $ 5,668,045
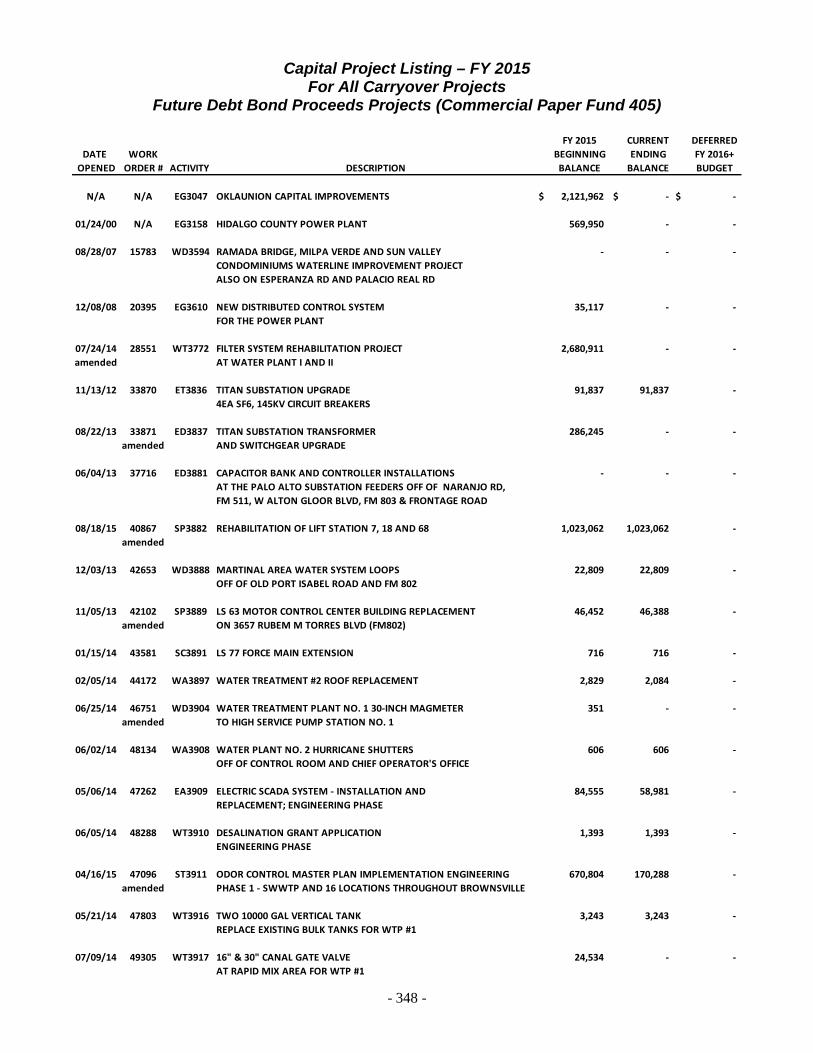
- 348 -
Capital Project Listing – FY 2015 For All Carryover Projects
Future Debt Bond Proceeds Projects (Commercial Paper Fund 405)
FY 2015 CURRENT DEFERREDDATE WORK BEGINNING ENDING FY 2016+
OPENED ORDER # ACTIVITY DESCRIPTION BALANCE BALANCE BUDGET
N/A N/A EG3047 OKLAUNION CAPITAL IMPROVEMENTS $ 2,121,962 $ - $ -
01/24/00 N/A EG3158 HIDALGO COUNTY POWER PLANT 569,950 - -
08/28/07 15783 WD3594 RAMADA BRIDGE, MILPA VERDE AND SUN VALLEY - - - CONDOMINIUMS WATERLINE IMPROVEMENT PROJECTALSO ON ESPERANZA RD AND PALACIO REAL RD
12/08/08 20395 EG3610 NEW DISTRIBUTED CONTROL SYSTEM 35,117 - - FOR THE POWER PLANT
07/24/14 28551 WT3772 FILTER SYSTEM REHABILITATION PROJECT 2,680,911 - - amended AT WATER PLANT I AND II
11/13/12 33870 ET3836 TITAN SUBSTATION UPGRADE 91,837 91,837 - 4EA SF6, 145KV CIRCUIT BREAKERS
08/22/13 33871 ED3837 TITAN SUBSTATION TRANSFORMER 286,245 - - amended AND SWITCHGEAR UPGRADE
06/04/13 37716 ED3881 CAPACITOR BANK AND CONTROLLER INSTALLATIONS - - - AT THE PALO ALTO SUBSTATION FEEDERS OFF OF NARANJO RD,FM 511, W ALTON GLOOR BLVD, FM 803 & FRONTAGE ROAD
08/18/15 40867 SP3882 REHABILITATION OF LIFT STATION 7, 18 AND 68 1,023,062 1,023,062 - amended
12/03/13 42653 WD3888 MARTINAL AREA WATER SYSTEM LOOPS 22,809 22,809 - OFF OF OLD PORT ISABEL ROAD AND FM 802
11/05/13 42102 SP3889 LS 63 MOTOR CONTROL CENTER BUILDING REPLACEMENT 46,452 46,388 - amended ON 3657 RUBEM M TORRES BLVD (FM802)
01/15/14 43581 SC3891 LS 77 FORCE MAIN EXTENSION 716 716 -
02/05/14 44172 WA3897 WATER TREATMENT #2 ROOF REPLACEMENT 2,829 2,084 -
06/25/14 46751 WD3904 WATER TREATMENT PLANT NO. 1 30-INCH MAGMETER 351 - - amended TO HIGH SERVICE PUMP STATION NO. 1
06/02/14 48134 WA3908 WATER PLANT NO. 2 HURRICANE SHUTTERS 606 606 - OFF OF CONTROL ROOM AND CHIEF OPERATOR'S OFFICE
05/06/14 47262 EA3909 ELECTRIC SCADA SYSTEM - INSTALLATION AND 84,555 58,981 - REPLACEMENT; ENGINEERING PHASE
06/05/14 48288 WT3910 DESALINATION GRANT APPLICATION 1,393 1,393 - ENGINEERING PHASE
04/16/15 47096 ST3911 ODOR CONTROL MASTER PLAN IMPLEMENTATION ENGINEERING 670,804 170,288 - amended PHASE 1 - SWWTP AND 16 LOCATIONS THROUGHOUT BROWNSVILLE
05/21/14 47803 WT3916 TWO 10000 GAL VERTICAL TANK 3,243 3,243 - REPLACE EXISTING BULK TANKS FOR WTP #1
07/09/14 49305 WT3917 16" & 30" CANAL GATE VALVE 24,534 - - AT RAPID MIX AREA FOR WTP #1
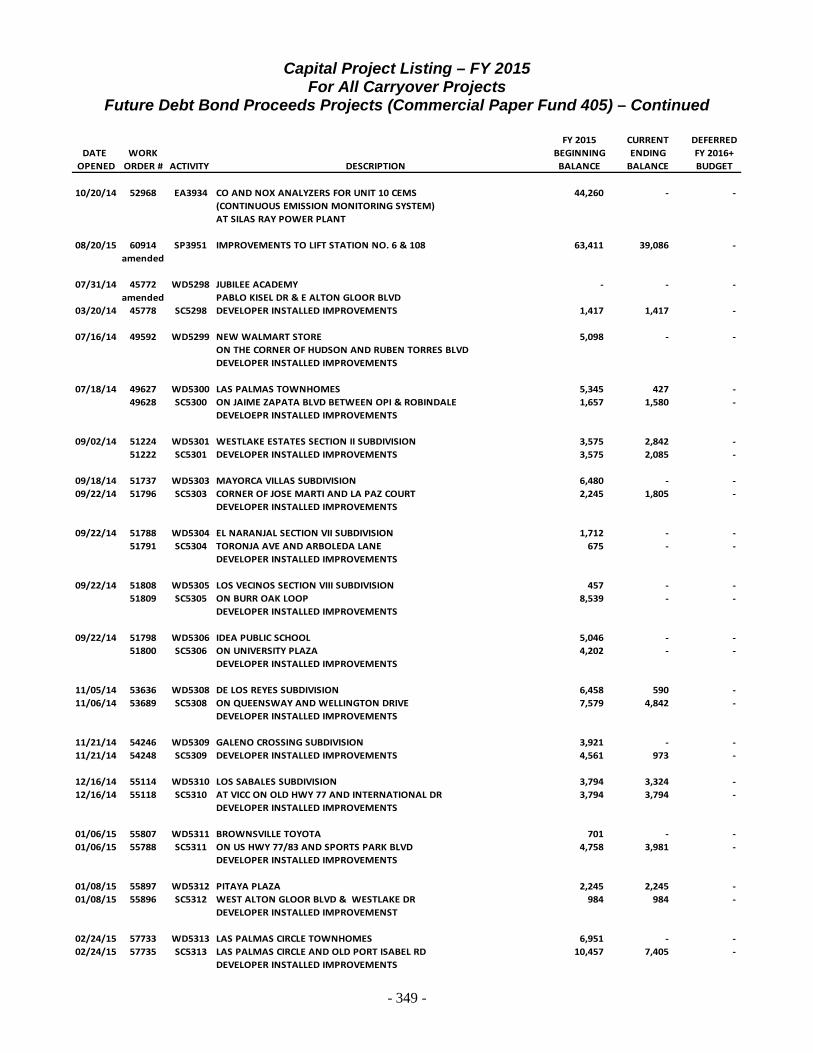
- 349 -
Capital Project Listing – FY 2015 For All Carryover Projects
Future Debt Bond Proceeds Projects (Commercial Paper Fund 405) – Continued
FY 2015 CURRENT DEFERREDDATE WORK BEGINNING ENDING FY 2016+
OPENED ORDER # ACTIVITY DESCRIPTION BALANCE BALANCE BUDGET
10/20/14 52968 EA3934 CO AND NOX ANALYZERS FOR UNIT 10 CEMS 44,260 - - (CONTINUOUS EMISSION MONITORING SYSTEM)AT SILAS RAY POWER PLANT
08/20/15 60914 SP3951 IMPROVEMENTS TO LIFT STATION NO. 6 & 108 63,411 39,086 - amended
07/31/14 45772 WD5298 JUBILEE ACADEMY - - - amended PABLO KISEL DR & E ALTON GLOOR BLVD
03/20/14 45778 SC5298 DEVELOPER INSTALLED IMPROVEMENTS 1,417 1,417 -
07/16/14 49592 WD5299 NEW WALMART STORE 5,098 - - ON THE CORNER OF HUDSON AND RUBEN TORRES BLVDDEVELOPER INSTALLED IMPROVEMENTS
07/18/14 49627 WD5300 LAS PALMAS TOWNHOMES 5,345 427 - 49628 SC5300 ON JAIME ZAPATA BLVD BETWEEN OPI & ROBINDALE 1,657 1,580 -
DEVELOEPR INSTALLED IMPROVEMENTS
09/02/14 51224 WD5301 WESTLAKE ESTATES SECTION II SUBDIVISION 3,575 2,842 - 51222 SC5301 DEVELOPER INSTALLED IMPROVEMENTS 3,575 2,085 -
09/18/14 51737 WD5303 MAYORCA VILLAS SUBDIVISION 6,480 - - 09/22/14 51796 SC5303 CORNER OF JOSE MARTI AND LA PAZ COURT 2,245 1,805 -
DEVELOPER INSTALLED IMPROVEMENTS
09/22/14 51788 WD5304 EL NARANJAL SECTION VII SUBDIVISION 1,712 - - 51791 SC5304 TORONJA AVE AND ARBOLEDA LANE 675 - -
DEVELOPER INSTALLED IMPROVEMENTS
09/22/14 51808 WD5305 LOS VECINOS SECTION VIII SUBDIVISION 457 - - 51809 SC5305 ON BURR OAK LOOP 8,539 - -
DEVELOPER INSTALLED IMPROVEMENTS
09/22/14 51798 WD5306 IDEA PUBLIC SCHOOL 5,046 - - 51800 SC5306 ON UNIVERSITY PLAZA 4,202 - -
DEVELOPER INSTALLED IMPROVEMENTS
11/05/14 53636 WD5308 DE LOS REYES SUBDIVISION 6,458 590 - 11/06/14 53689 SC5308 ON QUEENSWAY AND WELLINGTON DRIVE 7,579 4,842 -
DEVELOPER INSTALLED IMPROVEMENTS
11/21/14 54246 WD5309 GALENO CROSSING SUBDIVISION 3,921 - - 11/21/14 54248 SC5309 DEVELOPER INSTALLED IMPROVEMENTS 4,561 973 -
12/16/14 55114 WD5310 LOS SABALES SUBDIVISION 3,794 3,324 - 12/16/14 55118 SC5310 AT VICC ON OLD HWY 77 AND INTERNATIONAL DR 3,794 3,794 -
DEVELOPER INSTALLED IMPROVEMENTS
01/06/15 55807 WD5311 BROWNSVILLE TOYOTA 701 - - 01/06/15 55788 SC5311 ON US HWY 77/83 AND SPORTS PARK BLVD 4,758 3,981 -
DEVELOPER INSTALLED IMPROVEMENTS
01/08/15 55897 WD5312 PITAYA PLAZA 2,245 2,245 - 01/08/15 55896 SC5312 WEST ALTON GLOOR BLVD & WESTLAKE DR 984 984 -
DEVELOPER INSTALLED IMPROVEMENST
02/24/15 57733 WD5313 LAS PALMAS CIRCLE TOWNHOMES 6,951 - - 02/24/15 57735 SC5313 LAS PALMAS CIRCLE AND OLD PORT ISABEL RD 10,457 7,405 -
DEVELOPER INSTALLED IMPROVEMENTS

- 350 -
Capital Project Listing – FY 2015 For All Carryover Projects
Future Debt Bond Proceeds Projects (Commercial Paper Fund 405) – Continued
FY 2015 CURRENT DEFERREDDATE WORK BEGINNING ENDING FY 2016+
OPENED ORDER # ACTIVITY DESCRIPTION BALANCE BALANCE BUDGET
02/24/15 57725 WD5314 UTB MODULAR BUILDING 6,088 4,203 - FJRM AND JACKSON STREETDEVELOPER INSTALLED IMPROVEMENTS
03/23/15 59020 WD5315 CYNTHIA AND LUIS DEVELOPMENT LLC SUBDIVISION 2,039 1,741 - 08/05/15 59017 SC5315 OFF OF ALTON GLOOR BLVD AND STAGECOACH TRAIL 18,646 18,646 -
amended DEVELOPER INSTALLED IMPROVEMENTS
04/01/15 59203 WD5316 VILLAS DE SAN PEDRO TOWNHOMES 6,305 2,794 - 04/01/15 59204 SC5316 ON KINGSWAY DR AND OLD PORT ISABEL RD 1,417 - -
DEVELOPER INSTALLED IMPROVEMENTS
04/22/15 60029 WD5317 BROWNSVILLE NURSING & REHABILITATION 5,344 - - ON LOT 5, VILLAGE CENTER NO. 6 SUBDIVISIONOFF OF AMERICA DRIVEDEVELOPER INSTALLED IMPROVEMENTS
04/24/15 60128 WD5318 DICKS SPORTING GOODS 2,537 312 - BEHIND SUNRISE MALL, BETWEEN SEARS AND BEALLSDEVELOPER INSTALLED IMPROVEMENTS
04/28/15 60251 WD5319 SIMMONS CROSSING SUBDIVISION 5,473 4,657 - 60252 SC5319 INTERSECTION OF MORRISON RD & STERLING STREET 4,125 4,125 -
DEVELOPER INSTALLED IMPROVEMENTS
05/05/15 60549 SC5320 BOCA CHICA RETAIL 9,122 9,122 - CORNER OF BOCA CHICA BLVD AND S FRONTAGE RDDEVELOPER INSTALLED IMPROVEMENTS
05/18/15 60951 SC5321 TIKUN PLAZA WASTEWATER LINE EXTENSION 5,279 4,865 - ON WEST ALTON GLOOR BLVD AND LAREDO RDDEVELOPER INSTALLED IMPROVEMENTS
07/06/15 62521 WD5322 MONTEBELLA PARK 2,887 1,755 - 62520 SC5322 UTILITY IMPROVEMENTS 3,482 655 -
07/29/15 63418 WD5323 MARCYLN SUBIDIVISION 4,023 3,713 - 63419 SC5323 OFF OF ALTON GLOOR BLVD AND CAMERON AVENUE 4,023 3,713 -
DEVELOPER INSTALLED IMPROVEMENTS
08/07/15 63681 WD5324 SUNSHINE PLAZA PHASE II 3,027 531 - INTERSECTION OF GALENO STREET AND PABLO KISEL BLVDDEVELOPER INSTALLED IMPROVEMENTS
08/04/14 33622 WD6079 WESTERN STREET UTILITY IMPROVEMENTS 248,078 117,482 - 08/04/14 35568 SC6079 WESTERN STREET UTILITY IMPROVEMENTS 211,171 77,522 -
amended
08/20/15 42044 SP6083 LIFT STATION 45 REHABILITATION 69,931 61,896 - amended AT 2644 E PRICE RD
09/09/15 42465 WD6085 NAVARRA AND TOLEDO STREET 123,884 52,435 - amended INFRASTRUCTURE IMPROVEMENTS
09/09/15 42434 SC6085 153,668 50,685 - amended
09/17/15 42467 WD6086 WOOD HOLLOW DRIVE 178,125 - - amended INFRASTRUCTURE IMPROVEMENTS
09/17/15 42466 SC6086 147,901 26,024 - amended

- 351 -
Capital Project Listing – FY 2015 For All Carryover Projects
Future Debt Bond Proceeds Projects (Commercial Paper Fund 405) – Continued
FY 2015 CURRENT DEFERREDDATE WORK BEGINNING ENDING FY 2016+
OPENED ORDER # ACTIVITY DESCRIPTION BALANCE BALANCE BUDGET
12/16/14 44331 WD6087 IMPALA COURT WATERLINE RELOCATION PROJECT - - - amended Reclassified project to the Improvement Fund.
12/11/14 49129 WD6088 SOUTH SAN MARCELO BLVD 201,496 88,448 - amended UTILITY IMPROVEMENTS
02/02/15 49126 SC6088 303,427 31,098 - amended
09/17/15 52769 WD6089 BON AIRE LN 172,512 157,117 - amended WATER LINE REPLACEMENTS
N/A N/A WD9001 NEW CONNECTIONS-NO PROJ # ASSIGNED 807,675 - -
N/A N/A SC9001 NEW CONNECTIONS-NO PROJ # ASSIGNED 184,919 - -
05/28/15 33849 SC9272 FM 511-802 COLONIA AREAS 188,500 98,080 - amended CONSTRUCTION PHASE
09/26/14 52092 WD9273 8-INCH WATERLINE ON SAN JACINTO ROAD 45,694 6,043 - FOR NEW CONNECTIONS AND FIRE PROTECTION
11/06/14 53616 SC9274 FM 511-802 HOME CONNECTIONS AND 77,207 62,604 - SEPTIC TANK DECOMMISSIONING FOR AREAS E, H & I
CARRYOVER CONSTRUCTION PROJECT TOTAL $ 11,079,279 $ 2,389,056 $ -
ELECTRIC UTILITY TOTAL: $ 3,233,926 $ 150,818 $ -
GENERAL & ADMINISTRATIVE UTILITY: - - -
WATER UTILITY TOTAL: 4,603,645 480,794 -
WASTEWATER UTILITY TOTAL: 3,241,708 1,757,444 -
OVERALL COMMERCIAL PAPER FUND TOTAL $ 11,079,279 $ 2,389,056 $ -
3,886,797
$ 6,275,853
NET BUDGET CHANGES SINCE 7/31/15:
OVERALL APPROVED COMMERCIAL PAPER FUND CARRYOVER BUDGET TOTAL:
Capital Project Listing – FY 2015

- 352 -
For All Carryover Projects Impact Fees Fund Projects (Fund 410)
FY 2015 CURRENT DEFERRED
DATE WORK BEGINNING ENDING FY 2016+OPENED ORDER # ACTIVITY DESCRIPTION BALANCE BALANCE BUDGET
11/20/14 48534 WA3912 2014 WATER AND WASTEWATER MASTER PLAN $ 555,434 $ 152,210 $ - amended AND SYSTEM MODELING
11/20/14 48542 SA3912 479,131 176,249 - amended
CARRYOVER CONSTRUCTION PROJECT TOTAL $ 1,034,565 $ 328,459 $ -
WATER UTILITY TOTAL: $ 555,434 $ 152,210 $ -
WASTEWATER UTILITY TOTAL: 479,131 176,249 -
OVERALL IMPACT FEES FUND CARRYOVER PROJECT TOTAL $ 1,034,565 $ 328,459 $ -
265,784
$ 594,243
NET BUDGET CHANGES SINCE 7/31/15:
OVERALL APPROVED COMMERCIAL PAPER FUND CARRYOVER BUDGET TOTAL:
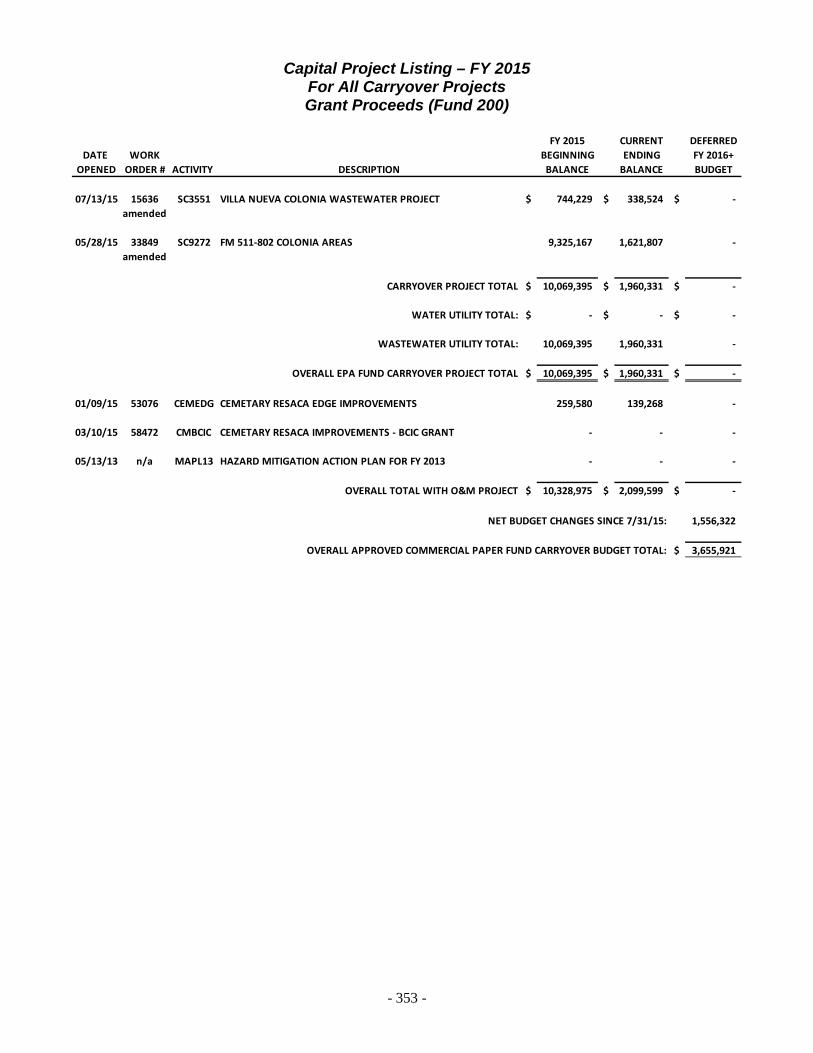
- 353 -
Capital Project Listing – FY 2015 For All Carryover Projects Grant Proceeds (Fund 200)
FY 2015 CURRENT DEFERRED
DATE WORK BEGINNING ENDING FY 2016+OPENED ORDER # ACTIVITY DESCRIPTION BALANCE BALANCE BUDGET
07/13/15 15636 SC3551 VILLA NUEVA COLONIA WASTEWATER PROJECT $ 744,229 $ 338,524 $ - amended
05/28/15 33849 SC9272 FM 511-802 COLONIA AREAS 9,325,167 1,621,807 - amended
CARRYOVER PROJECT TOTAL $ 10,069,395 $ 1,960,331 $ -
WATER UTILITY TOTAL: $ - $ - $ -
WASTEWATER UTILITY TOTAL: 10,069,395 1,960,331 -
OVERALL EPA FUND CARRYOVER PROJECT TOTAL $ 10,069,395 $ 1,960,331 $ -
01/09/15 53076 CEMEDG CEMETARY RESACA EDGE IMPROVEMENTS 259,580 139,268 -
03/10/15 58472 CMBCIC CEMETARY RESACA IMPROVEMENTS - BCIC GRANT - - -
05/13/13 n/a MAPL13 HAZARD MITIGATION ACTION PLAN FOR FY 2013 - - -
OVERALL TOTAL WITH O&M PROJECT $ 10,328,975 $ 2,099,599 $ -
1,556,322
$ 3,655,921
NET BUDGET CHANGES SINCE 7/31/15:
OVERALL APPROVED COMMERCIAL PAPER FUND CARRYOVER BUDGET TOTAL:

- 354 -
THIS PAGE INTENTIONALLY LEFT BLANK

- 355 -
GRANTS
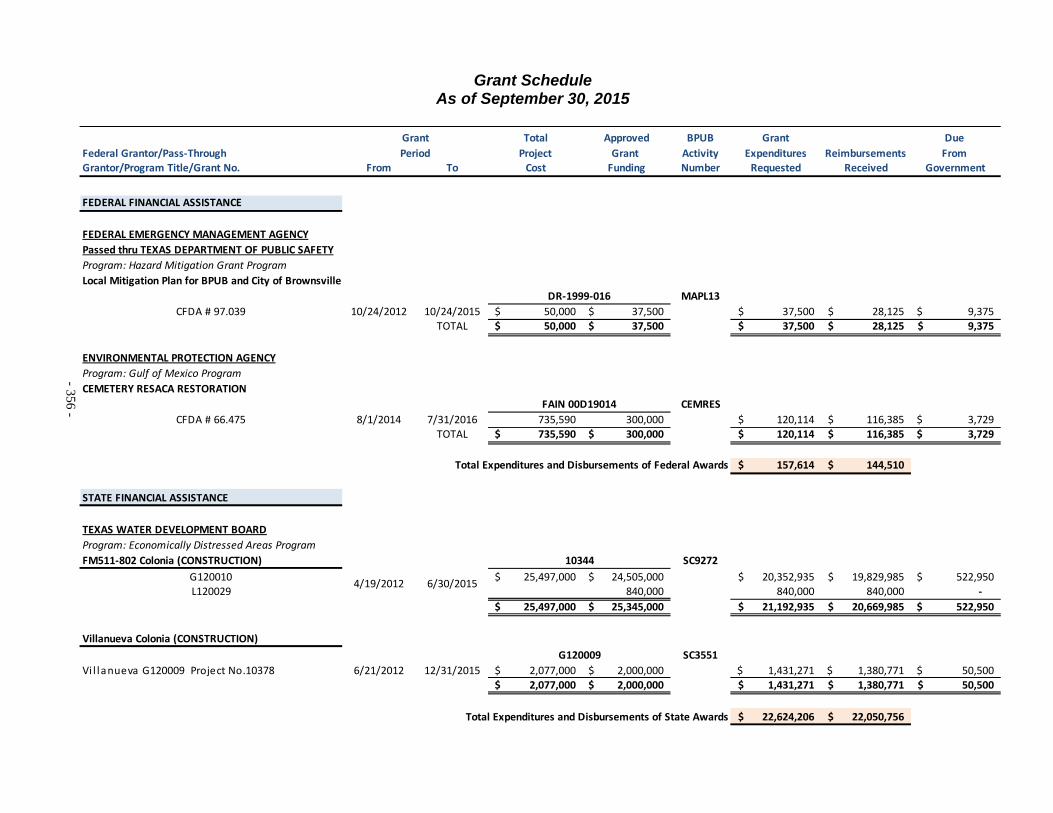
- 356 -
Grant Schedule As of September 30, 2015
Total Approved BPUB Grant Due
Federal Grantor/Pass-Through Project Grant Activity Expenditures Reimbursements From Grantor/Program Title/Grant No. From To Cost Funding Number Requested Received Government
FEDERAL FINANCIAL ASSISTANCE
FEDERAL EMERGENCY MANAGEMENT AGENCYPassed thru TEXAS DEPARTMENT OF PUBLIC SAFETYProgram: Hazard Mitigation Grant ProgramLocal Mitigation Plan for BPUB and City of Brownsville
MAPL13CFDA # 97.039 10/24/2012 10/24/2015 50,000$ 37,500$ 37,500$ 28,125$ 9,375$
TOTAL 50,000$ 37,500$ 37,500$ 28,125$ 9,375$
ENVIRONMENTAL PROTECTION AGENCYProgram: Gulf of Mexico ProgramCEMETERY RESACA RESTORATION
CEMRESCFDA # 66.475 8/1/2014 7/31/2016 735,590 300,000 120,114$ 116,385$ 3,729$
TOTAL 735,590$ 300,000$ 120,114$ 116,385$ 3,729$
Total Expenditures and Disbursements of Federal Awards 157,614$ 144,510$
STATE FINANCIAL ASSISTANCE
TEXAS WATER DEVELOPMENT BOARDProgram: Economically Distressed Areas ProgramFM511-802 Colonia (CONSTRUCTION) SC9272
G120010 25,497,000$ 24,505,000$ 20,352,935$ 19,829,985$ 522,950$ L120029 840,000 840,000 840,000 -
25,497,000$ 25,345,000$ 21,192,935$ 20,669,985$ 522,950$
Villanueva Colonia (CONSTRUCTION)SC3551
Vi l lanueva G120009 Project No.10378 6/21/2012 12/31/2015 2,077,000$ 2,000,000$ 1,431,271$ 1,380,771$ 50,500$ 2,077,000$ 2,000,000$ 1,431,271$ 1,380,771$ 50,500$
Total Expenditures and Disbursements of State Awards 22,624,206$ 22,050,756$
Grant
G120009
FAIN 00D19014
10344
4/19/2012 6/30/2015
Period
DR-1999-016

- 357 -
Grant Schedule As of September 30, 2015 - Continued
Total Approved BPUB Grant Due
Federal Grantor/Pass-Through Project Grant Activity Expenditures Reimbursements From Grantor/Program Title/Grant No. From To Cost Funding Number Requested Received Government
GrantPeriod
TWDB BONDS
Program: DWSRFSRWA Arsenic and Iron Removal Project WS3612Series A - L090067 5/1/2009 8/31/2015 9,295,000$ 9,295,000$ 8,694,035$ 8,694,035$ -$ Series B - L090068 5/1/2009 8/31/2015 3,795,000 3,795,000 3,624,597 3,624,597 -
TOTAL 13,090,000$ 13,090,000$ 12,318,632$ 12,318,632$ -$
Total Expenditures and Disbursements of TWDB Bonds 12,318,632$ 12,318,632$
LOCAL FINANCIAL ASSISTANCE
Villanueva Colonia (CONSTRUCTION) SC3551CDBG Funds - Vi l lanueva Phase 2 -38th 3/26/2013 10/1/2019 2,077,000$ 476,450$ 151,258$ 105,207$ 46,051$
2,077,000$ 476,450$ 151,258$ 105,207$ 46,051$
BPUB: Residential Data Collection, and Plans, Specifications and Construction Costs SC9272FM511-802 Colonia (DESIGN) BECC 125,283$ 125,283$ 125,283$ 125,283$ -$
125,283$ 125,283$ 125,283$ 125,283$ -$
Brownsville Community Improvement Corporation
Cemetery Resaca Restoration 12/1/2014 5/31/2016 735,590$ 100,000$ -$ -$ -$ TOTAL 735,590$ 100,000$ -$ -$ -$
Total Expenditures and Disbursements of Local Awards 276,541$ 230,490$
Total Expenditures and Disbursements of Federal, State, Local Awards and TWDB Bonds 35,376,993$ 34,744,388$
B-12-MC-48-0501
61531
Cemetery Resaca
10344
5/20/2014 7/31/2014

- 358 -
THIS PAGE INTENTIONALLY LEFT BLANK

- 359 -
APPENDICES
- 360 -
Appendices Section This part of the Brownsville PUB Annual Budget Report presents detailed information as a context for understanding what the information in the required statistical and supplementary information says about the Brownsville PUB.
PageContents Operations Expenses Analysis by Account Appendix A 361-363
This schedule contains information to help the reader understand the Brownsville Public Utilities Operations & Maintenance expenses at the account level for prior years, the current year and the budget year.
BPUB Description and Utility Service Territory Maps Appendix B 364-370
These schedules include supplemental data that describe the organization, the community, and service territory.
Glossary Appendix C 371-380
This schedule includes any terminology (including abbreviations and acronyms) that are not readily understandable.
Financial Trends Appendix D 382-384
These schedules contain trend information to help the reader understand how the Brownsville Public Utilities Board’s financial performance and well-being has changed over time.
Revenue Capacity Appendix D 386-390
These schedules contain information to help the reader access the Brownsville PUB’s local revenue source.
Debt Capacity Appendix D 392
These schedules present information to help the reader assess the Brownsville PUB’s debt burden and its ability to issue additional debt in the future.
Demographic and Economic Information Appendix E 394-402
This schedule offers demographic and economic indicators to help the reader understand the environment in which the Brownsville PUB’s financial activities take place.
Operating Information Appendix F 404-407
These schedules contain service and infrastructure data to help the reader understand how the information in the Brownsville PUB’s financial report relates to the service Brownsville PUB provides and activities it performs.

Appendix A- 361 -
OPERATIONS EXPENSE ANALYSIS BY ACCOUNT Amended Unaudited
Actual Actual Actual Budget Actual BudgetAccount 2012 2013 2014 2015 2015 2016
Personnel O&M6101 Supervision 4,061,117$ 4,650,504$ 5,054,537$ 5,338,934$ 5,045,773$ 6,126,725$ 6105 Administrative Staff 2,950,675 3,111,778 3,461,896 3,441,148 3,724,158 4,110,473 6110 Clerical staff 2,535,828 2,589,001 2,788,553 2,730,332 2,784,878 3,089,242 6115 Operational staff 8,508,685 9,385,000 9,942,438 9,962,674 10,408,561 10,514,428 6120 Part-time staff 356,127 631,703 281,357 338,944 153,271 179,907 6125 Pay for Performance Wages - - - - 6130 Overtime 1,349,351 666,272 870,301 1,000,937 993,021 928,916 6140 Severance Pay - 12,926 5,856 - - - 6201 T.M.R.S. 3,078,297 2,990,166 3,173,825 2,925,676 3,157,620 4,392,085 6205 F.I.C.A. 1,197,499 1,265,404 1,340,387 1,351,560 1,378,199 1,491,838 6206 Suta 19,170 11,496 39,666 - 10,578 - 6210 Medicare 283,065 298,444 316,747 316,091 327,201 348,898 6214 Dental Insurance 121,207 130,634 134,241 152,374 136,043 166,938 6215 Hospitalization insurance 3,540,305 3,775,462 3,905,342 4,442,437 3,929,715 4,702,837 6216 Other Post-Employmnt Benefits (ins) 340,916 806,513 1,122,644 1,020,000 1,020,000 1,221,396 6220 Life Insurance 25,136 27,808 29,242 175,670 30,398 195,694 6221 Long Term Disability Insurance 46,983 51,427 54,996 74,780 57,144 83,142 6225 Workers Compensation 741,776 559,504 597,880 544,983 620,537 601,867 6230 Vacation leave 6,146 276,024 169,716 259,111 105,668 408,858 6235 Sick leave 274,248 402,074 456,501 285,494 195,783 449,406 6240 Educational assistance 7,406 7,924 10,288 49,452 490 33,675 6242 Auto Benefits 84,001 84,001 92,366 106,500 92,943 106,501 6243 Telephone Benefits 11,632 13,441 15,315 18,480 15,444 18,481 6250 Miscellaneous personnel benefits 69,798 64,887 62,539 184,631 60,294 600,000 6260 Vacancy Savings - - - (1,551,898) - (1,964,002) 6270 Retention Plan Budget - - - 25,000 - 50,000 Personnel O&M Total 29,609,365 31,812,390 33,926,631 33,193,311 34,247,718 37,857,307
Non-personnel O&M7101 Advertising 187,958 262,497 243,966 270,100 262,967 262,000 7102 Sponsorships 168,910 161,976 178,610 191,000 179,095 161,000 7105 Books & periodicals 15,844 16,696 23,359 25,502 13,839 19,686 7110 Dues & memberships 121,115 167,596 181,963 178,432 184,818 115,104 7115 Educational material 10,432 22,935 11,679 50,450 17,974 30,800 7120 Office supplies 164,915 153,636 163,121 175,350 166,378 185,256 7125 Photo equipment/supplies 2,451 737 689 3,600 255 3,550 7130 Postage/shipping charges 340,606 352,210 362,181 376,400 356,854 385,523 7135 Telephone expenses 318,851 324,036 293,172 310,880 303,512 337,450 7140 Training expenses 160,167 139,143 137,352 200,000 145,729 213,312 7145 Travel expenses 322,137 359,861 272,515 400,000 235,347 315,147 7147 Mileage Reimbursement (InTownExp) 259 929 308 2,350 561 2,075 7150 Recruitment Expenses 6,384 2,864 5,986 20,000 1,763 15,000 7155 Initial Certificatn/Licensing Reimb - - - - - 12,000 7180 Utilities - departmental 1,979,280 2,109,419 2,568,022 2,512,266 2,679,485 2,503,885 7190 Utilities - CP&L & Mvec 92,083 85,137 112,004 97,700 108,503 88,690 7199 Miscellaneous office expenses 4,979 - - 250 513 700 7201 Barricades & signs 4,827 1,836 3,133 5,000 2,011 5,000 7203 Sand, Caliche, Gravel, Concrete etc 73,532 266,357 192,248 225,000 281,796 256,923 7205 Lamps, globes & flares 7,907 5,213 3,060 3,250 10,245 10,500 7210 Landscaping/Trade a Tree Program 2,044 6,333 2,531 6,000 8,644 8,500 7215 Laundry & janitorial supplies 7,678 5,692 4,493 8,150 6,150 7,300 7220 Medical supplies 480 287 664 3,100 492 1,225 7225 Safety supplies 50,730 57,856 71,629 84,485 108,361 96,121 7251 Purchased of Raw Water 78,957 49,122 31,540 30,000 12,494 25,000 7280 Chemicals - activated carbon 67,712 50,567 61,607 50,000 21,070 50,000 7281 Chemicals - ammonia 101,825 119,300 100,235 97,500 89,080 92,648 7282 Chemicals - caustic soda 81,876 84,627 54,653 77,500 60,760 81,692 7283 Chemicals - chlorine 286,694 279,846 195,424 192,500 183,954 180,000 7284 Chemicals - coagulant 1,169,210 1,076,134 951,586 924,000 823,892 924,000 7285 Chemicals - copper sulphate 8,500 - 2,311 5,000 - 5,000 7286 Chemicals - deodorants 1,065 158 4,504 3,500 6,344 7,056 7301 Bad debt expense 565,117 358,019 2,721 700,000 510,974 700,000 7304 Hurricane Preparedness Expenses 146,725 283,667 80,827 231,700 206,200 231,700 7305 ERCOT expenses 2,962,548 1,799,270 1,567,229 1,802,500 1,247,000 1,120,000
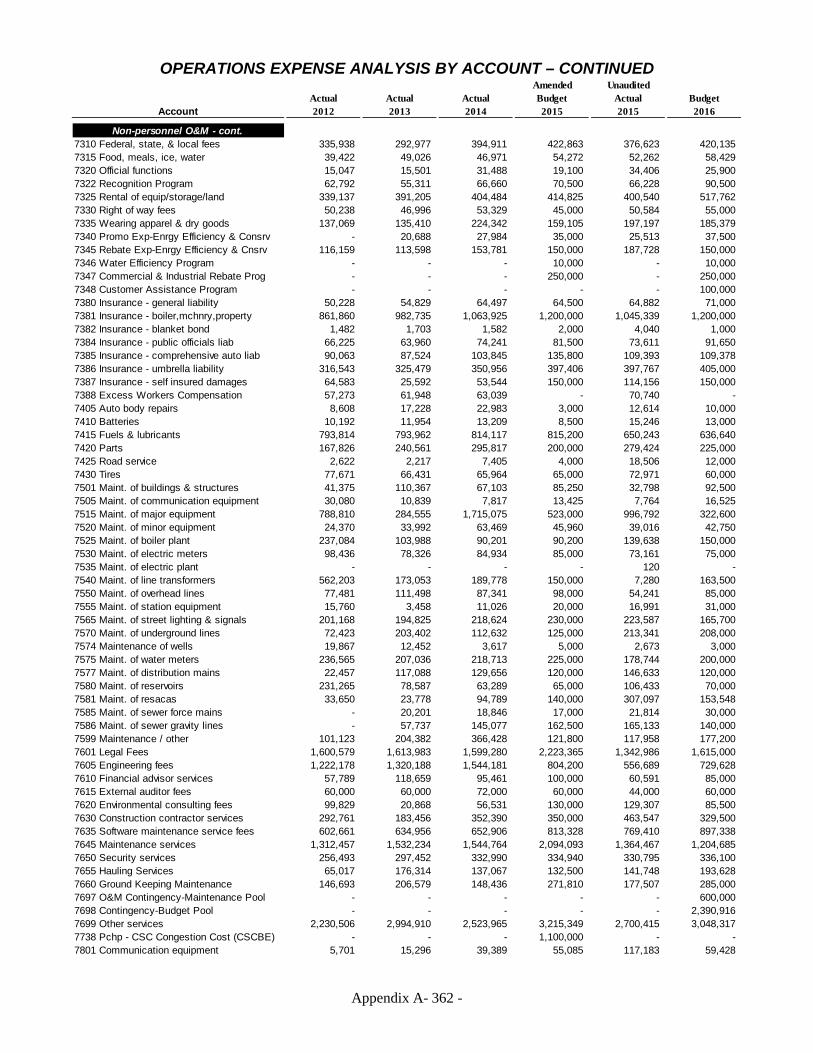
Appendix A- 362 -
OPERATIONS EXPENSE ANALYSIS BY ACCOUNT – CONTINUED Amended Unaudited
Actual Actual Actual Budget Actual BudgetAccount 2012 2013 2014 2015 2015 2016
Non-personnel O&M - cont.7310 Federal, state, & local fees 335,938 292,977 394,911 422,863 376,623 420,135 7315 Food, meals, ice, water 39,422 49,026 46,971 54,272 52,262 58,429 7320 Official functions 15,047 15,501 31,488 19,100 34,406 25,900 7322 Recognition Program 62,792 55,311 66,660 70,500 66,228 90,500 7325 Rental of equip/storage/land 339,137 391,205 404,484 414,825 400,540 517,762 7330 Right of way fees 50,238 46,996 53,329 45,000 50,584 55,000 7335 Wearing apparel & dry goods 137,069 135,410 224,342 159,105 197,197 185,379 7340 Promo Exp-Enrgy Efficiency & Consrv - 20,688 27,984 35,000 25,513 37,500 7345 Rebate Exp-Enrgy Efficiency & Cnsrv 116,159 113,598 153,781 150,000 187,728 150,000 7346 Water Efficiency Program - - - 10,000 - 10,000 7347 Commercial & Industrial Rebate Prog - - - 250,000 - 250,000 7348 Customer Assistance Program - - - - - 100,000 7380 Insurance - general liability 50,228 54,829 64,497 64,500 64,882 71,000 7381 Insurance - boiler,mchnry,property 861,860 982,735 1,063,925 1,200,000 1,045,339 1,200,000 7382 Insurance - blanket bond 1,482 1,703 1,582 2,000 4,040 1,000 7384 Insurance - public officials liab 66,225 63,960 74,241 81,500 73,611 91,650 7385 Insurance - comprehensive auto liab 90,063 87,524 103,845 135,800 109,393 109,378 7386 Insurance - umbrella liability 316,543 325,479 350,956 397,406 397,767 405,000 7387 Insurance - self insured damages 64,583 25,592 53,544 150,000 114,156 150,000 7388 Excess Workers Compensation 57,273 61,948 63,039 - 70,740 - 7405 Auto body repairs 8,608 17,228 22,983 3,000 12,614 10,000 7410 Batteries 10,192 11,954 13,209 8,500 15,246 13,000 7415 Fuels & lubricants 793,814 793,962 814,117 815,200 650,243 636,640 7420 Parts 167,826 240,561 295,817 200,000 279,424 225,000 7425 Road service 2,622 2,217 7,405 4,000 18,506 12,000 7430 Tires 77,671 66,431 65,964 65,000 72,971 60,000 7501 Maint. of buildings & structures 41,375 110,367 67,103 85,250 32,798 92,500 7505 Maint. of communication equipment 30,080 10,839 7,817 13,425 7,764 16,525 7515 Maint. of major equipment 788,810 284,555 1,715,075 523,000 996,792 322,600 7520 Maint. of minor equipment 24,370 33,992 63,469 45,960 39,016 42,750 7525 Maint. of boiler plant 237,084 103,988 90,201 90,200 139,638 150,000 7530 Maint. of electric meters 98,436 78,326 84,934 85,000 73,161 75,000 7535 Maint. of electric plant - - - - 120 - 7540 Maint. of line transformers 562,203 173,053 189,778 150,000 7,280 163,500 7550 Maint. of overhead lines 77,481 111,498 87,341 98,000 54,241 85,000 7555 Maint. of station equipment 15,760 3,458 11,026 20,000 16,991 31,000 7565 Maint. of street lighting & signals 201,168 194,825 218,624 230,000 223,587 165,700 7570 Maint. of underground lines 72,423 203,402 112,632 125,000 213,341 208,000 7574 Maintenance of wells 19,867 12,452 3,617 5,000 2,673 3,000 7575 Maint. of water meters 236,565 207,036 218,713 225,000 178,744 200,000 7577 Maint. of distribution mains 22,457 117,088 129,656 120,000 146,633 120,000 7580 Maint. of reservoirs 231,265 78,587 63,289 65,000 106,433 70,000 7581 Maint. of resacas 33,650 23,778 94,789 140,000 307,097 153,548 7585 Maint. of sewer force mains - 20,201 18,846 17,000 21,814 30,000 7586 Maint. of sewer gravity lines - 57,737 145,077 162,500 165,133 140,000 7599 Maintenance / other 101,123 204,382 366,428 121,800 117,958 177,200 7601 Legal Fees 1,600,579 1,613,983 1,599,280 2,223,365 1,342,986 1,615,000 7605 Engineering fees 1,222,178 1,320,188 1,544,181 804,200 556,689 729,628 7610 Financial advisor services 57,789 118,659 95,461 100,000 60,591 85,000 7615 External auditor fees 60,000 60,000 72,000 60,000 44,000 60,000 7620 Environmental consulting fees 99,829 20,868 56,531 130,000 129,307 85,500 7630 Construction contractor services 292,761 183,456 352,390 350,000 463,547 329,500 7635 Software maintenance service fees 602,661 634,956 652,906 813,328 769,410 897,338 7645 Maintenance services 1,312,457 1,532,234 1,544,764 2,094,093 1,364,467 1,204,685 7650 Security services 256,493 297,452 332,990 334,940 330,795 336,100 7655 Hauling Services 65,017 176,314 137,067 132,500 141,748 193,628 7660 Ground Keeping Maintenance 146,693 206,579 148,436 271,810 177,507 285,000 7697 O&M Contingency-Maintenance Pool - - - - - 600,000 7698 Contingency-Budget Pool - - - - - 2,390,916 7699 Other services 2,230,506 2,994,910 2,523,965 3,215,349 2,700,415 3,048,317 7738 Pchp - CSC Congestion Cost (CSCBE) - - - 1,100,000 - - 7801 Communication equipment 5,701 15,296 39,389 55,085 117,183 59,428
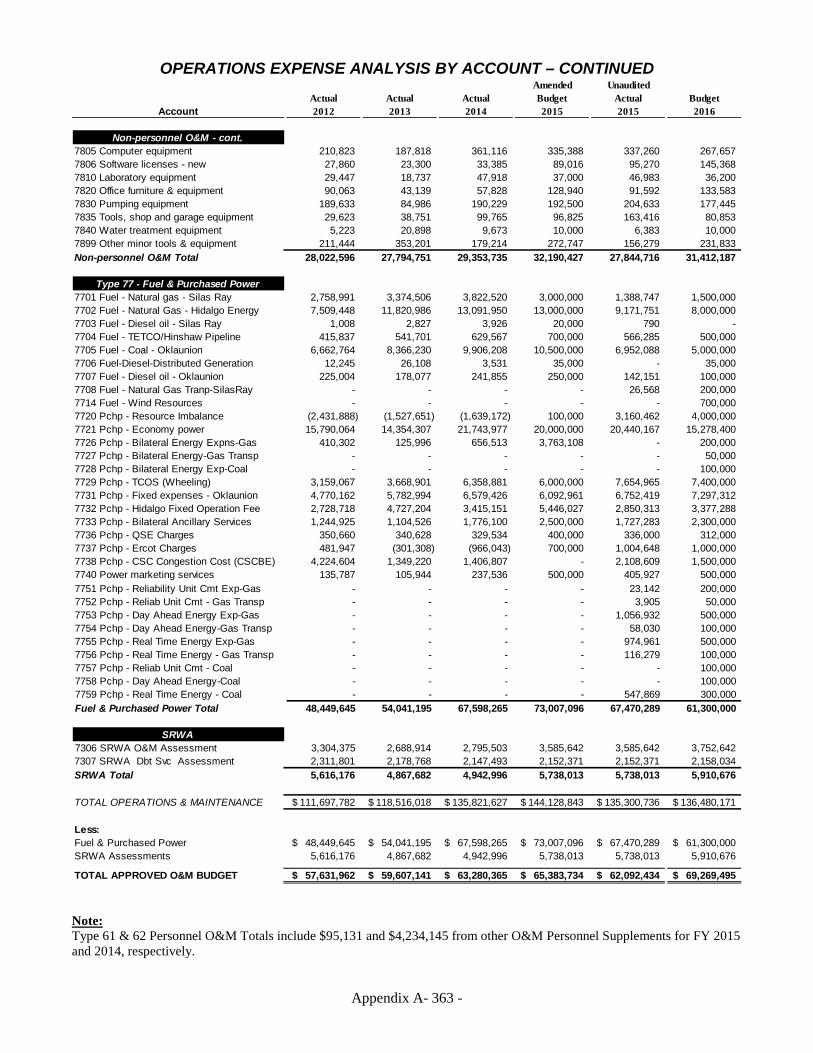
Appendix A- 363 -
OPERATIONS EXPENSE ANALYSIS BY ACCOUNT – CONTINUED Amended Unaudited
Actual Actual Actual Budget Actual BudgetAccount 2012 2013 2014 2015 2015 2016
Non-personnel O&M - cont.7805 Computer equipment 210,823 187,818 361,116 335,388 337,260 267,657 7806 Software licenses - new 27,860 23,300 33,385 89,016 95,270 145,368 7810 Laboratory equipment 29,447 18,737 47,918 37,000 46,983 36,200 7820 Office furniture & equipment 90,063 43,139 57,828 128,940 91,592 133,583 7830 Pumping equipment 189,633 84,986 190,229 192,500 204,633 177,445 7835 Tools, shop and garage equipment 29,623 38,751 99,765 96,825 163,416 80,853 7840 Water treatment equipment 5,223 20,898 9,673 10,000 6,383 10,000 7899 Other minor tools & equipment 211,444 353,201 179,214 272,747 156,279 231,833 Non-personnel O&M Total 28,022,596 27,794,751 29,353,735 32,190,427 27,844,716 31,412,187
Type 77 - Fuel & Purchased Power7701 Fuel - Natural gas - Silas Ray 2,758,991 3,374,506 3,822,520 3,000,000 1,388,747 1,500,000 7702 Fuel - Natural Gas - Hidalgo Energy 7,509,448 11,820,986 13,091,950 13,000,000 9,171,751 8,000,000 7703 Fuel - Diesel oil - Silas Ray 1,008 2,827 3,926 20,000 790 - 7704 Fuel - TETCO/Hinshaw Pipeline 415,837 541,701 629,567 700,000 566,285 500,000 7705 Fuel - Coal - Oklaunion 6,662,764 8,366,230 9,906,208 10,500,000 6,952,088 5,000,000 7706 Fuel-Diesel-Distributed Generation 12,245 26,108 3,531 35,000 - 35,000 7707 Fuel - Diesel oil - Oklaunion 225,004 178,077 241,855 250,000 142,151 100,000 7708 Fuel - Natural Gas Tranp-SilasRay - - - - 26,568 200,000 7714 Fuel - Wind Resources - - - - - 700,000 7720 Pchp - Resource Imbalance (2,431,888) (1,527,651) (1,639,172) 100,000 3,160,462 4,000,000 7721 Pchp - Economy power 15,790,064 14,354,307 21,743,977 20,000,000 20,440,167 15,278,400 7726 Pchp - Bilateral Energy Expns-Gas 410,302 125,996 656,513 3,763,108 - 200,000 7727 Pchp - Bilateral Energy-Gas Transp - - - - - 50,000 7728 Pchp - Bilateral Energy Exp-Coal - - - - - 100,000 7729 Pchp - TCOS (Wheeling) 3,159,067 3,668,901 6,358,881 6,000,000 7,654,965 7,400,000 7731 Pchp - Fixed expenses - Oklaunion 4,770,162 5,782,994 6,579,426 6,092,961 6,752,419 7,297,312 7732 Pchp - Hidalgo Fixed Operation Fee 2,728,718 4,727,204 3,415,151 5,446,027 2,850,313 3,377,288 7733 Pchp - Bilateral Ancillary Services 1,244,925 1,104,526 1,776,100 2,500,000 1,727,283 2,300,000 7736 Pchp - QSE Charges 350,660 340,628 329,534 400,000 336,000 312,000 7737 Pchp - Ercot Charges 481,947 (301,308) (966,043) 700,000 1,004,648 1,000,000 7738 Pchp - CSC Congestion Cost (CSCBE) 4,224,604 1,349,220 1,406,807 - 2,108,609 1,500,000 7740 Power marketing services 135,787 105,944 237,536 500,000 405,927 500,000 7751 Pchp - Reliability Unit Cmt Exp-Gas - - - - 23,142 200,000 7752 Pchp - Reliab Unit Cmt - Gas Transp - - - - 3,905 50,000 7753 Pchp - Day Ahead Energy Exp-Gas - - - - 1,056,932 500,000 7754 Pchp - Day Ahead Energy-Gas Transp - - - - 58,030 100,000 7755 Pchp - Real Time Energy Exp-Gas - - - - 974,961 500,000 7756 Pchp - Real Time Energy - Gas Transp - - - - 116,279 100,000 7757 Pchp - Reliab Unit Cmt - Coal - - - - - 100,000 7758 Pchp - Day Ahead Energy-Coal - - - - - 100,000 7759 Pchp - Real Time Energy - Coal - - - - 547,869 300,000 Fuel & Purchased Power Total 48,449,645 54,041,195 67,598,265 73,007,096 67,470,289 61,300,000
SRWA7306 SRWA O&M Assessment 3,304,375 2,688,914 2,795,503 3,585,642 3,585,642 3,752,642 7307 SRWA Dbt Svc Assessment 2,311,801 2,178,768 2,147,493 2,152,371 2,152,371 2,158,034 SRWA Total 5,616,176 4,867,682 4,942,996 5,738,013 5,738,013 5,910,676
TOTAL OPERATIONS & MAINTENANCE 111,697,782$ 118,516,018$ 135,821,627$ 144,128,843$ 135,300,736$ 136,480,171$
Less:Fuel & Purchased Power 48,449,645$ 54,041,195$ 67,598,265$ 73,007,096$ 67,470,289$ 61,300,000$ SRWA Assessments 5,616,176 4,867,682 4,942,996 5,738,013 5,738,013 5,910,676
TOTAL APPROVED O&M BUDGET 57,631,962$ 59,607,141$ 63,280,365$ 65,383,734$ 62,092,434$ 69,269,495$
Note: Type 61 & 62 Personnel O&M Totals include $95,131 and $4,234,145 from other O&M Personnel Supplements for FY 2015 and 2014, respectively.

Appendix B- 364 -
DESCRIPTION Profile The Brownsville PUB was formed in 1960 to provide electrical, water, and wastewater services to its customers in the Brownsville area. Pursuant to the City’s Charter, management, operation, and control of the City’s combined water, wastewater, and electric utilities system is delegated to the Brownsville PUB. The Brownsville PUB is comprised of seven members, six of whom are appointed by the City Commission for four-year terms and the seventh member being the City’s Mayor serving ex-officio. The Electric System provides retail electric service through its electric facilities to consumers inside and outside the city limits. The existing customer service area of the electric facilities encompasses approximately 133 square miles of Cameron County, including substantially the entire City (estimated by the Brownsville PUB as over 96%). The electric system serves a growing base of approximately 47,671 customers and serves a peak load of 286 MW. Current resources, mainly owned by the Brownsville PUB, are sufficient to cover peak demand. The Brownsville PUB meets its power supply obligations through a combination of resources: (i) the operation of Oklaunion Unit No. 1, a coal-fired steam electric generating unit jointly owned and operated by Public Service Company of Oklahoma, AEP Texas Central Company, Oklahoma Municipal Power Authority, and the Brownsville PUB entitling the Brownsville PUB to 124 MW of capacity, (ii) the operation of the Silas Ray Power Production Facilities owned and operated by the Brownsville PUB (composed of one conventional steam turbine unit and a re-powered steam turbine in Combined Cycle with a combustion turbine and a GE LM6000 gas turbine generator for an estimated gas fired capability of 115 MW), (iii) the operation of the Calpine/Hidalgo combined cycle Power Plant in which the Brownsville PUB has an ownership interest entitling it to 105 MW of capacity, and (iv) economy energy purchases through an economy power interchange arrangement. The Board currently has a gas transportation agreement with Texas Gas Services ("TGS"), a division of One Gas and a gas supply agreement with Tenaska Marketing Ventures ("TMV") for service to its Silas Ray Generation units, and a gas supply agreement with Calpine Energy Services, LP for service to its Calpine/Hidalgo Plant. Fuel and transportation contracts with a variety of suppliers are in place, limiting the Brownsville PUB’s exposure to the volatile fuel commodity markets. Electric service is also provided in the unincorporated areas surrounding the City by American Electric Power (AEP, formally Central Power and Light Company) and Magic Valley Electric Cooperative, Inc. (MVEC). Each such entity also has a small number of customers inside the Brownsville city limits. The Brownsville PUB has authority to provide electric service to customers within and outside the boundaries of the City in areas to which it is certified for electric service by the PUCT. The Brownsville PUB is singly certified in a substantial portion of its service area within the boundaries of the City and, within the area, it alone is presently authorized to provide electric service. The Brownsville PUB is also singly certified to serve the developed portion of the Port of Brownsville. While the Brownsville PUB’s multiple-certified service area will not be open to new competitors unless the Brownsville PUB and the City Commission “opt in” to retail competition, the electric system competes within that area against the other utilities that have been certified in the past to provide service in that area.

Appendix B- 365 -
In areas where the Brownsville PUB is dually or multiple-certified with other electric utilities, the Brownsville PUB, AEP and MVEC compete for electric customers. In these areas the customer chooses the utility system from which it will receive electric service. Of the approximately 133 square miles which comprise the Brownsville PUB’s electric service area, competition exists within approximately 11.5 square miles. The Brownsville PUB may serve areas newly annexed by the City only if it is singly, dually, or multiple-certified by the PUCT to serve the area. The Water System draws raw water from the Rio Grande River and consists of a river rock weir, a river pump station, two reservoirs providing 187 million gallons total capacity, and a raw water transport system. Surface water treatment is achieved by two water treatment plants providing 40 million gallons per day (MGD) of total capacity (20 MGD treatment capacity each). Two clear wells provide 6.84 million gallons storage capacity, and four elevated storage tanks provide 6 million gallons of elevated storage capacity. Water is pumped by three high-service pumping stations into the distribution system which consists of 668 miles of transmission and distribution mains. The Brownsville PUB mainly sells to residential and commercial customers, but also sells treated water on a wholesale basis to two other water distribution companies that amount to approximately 5.07% of sales. The Brownsville PUB partnered with the SRWA and built a 7.5 million gallon reverse osmosis water treatment plant of which the Brownsville PUB has 92.91% ownership. The SRWA plant will complete an expansion in 2015 to provide microfiltration pretreatment and a total production capacity up to 11 MGD. This SRWA plant includes a 7.5 million gallon storage tank and a 0.75 million gallon clear well. The Brownsville PUB has an annual allocation of municipal priority water rights from the Texas Commission on Environmental Quality (TCEQ) in the amount of 31,133.631 acre-feet of water, which is dependent upon inflow to the Falcon and Amistad Reservoirs, providing an estimated annual yield of 891 acre-feet. In addition, the Brownsville PUB holds Permit No. 1838 entitling it the right to 40,000 acre-feet of surplus water. The Brownsville PUB is subject to regulation of water quality by the TCEQ. The Brownsville PUB presently has a “Superior” water system as determined in accordance with current TCEQ regulations. The Brownsville PUB’s water utility service area is subject to the certification jurisdiction of the TCEQ. The Brownsville PUB has been certified singly to provide water service within the boundaries of the City. A large portion of the area, three and one-half miles surrounding the boundaries (the “extraterritorial jurisdiction”) of the City, is dually certified. There is a small water utility system (El Jardin Water Supply Corporation) whose customers are situated adjacent to or within the System. All of its treated water is supplied by the Brownsville PUB’s water system. The Wastewater System, consisting of collection and treatment facilities, includes gravity wastewater collection lines, 172 pumping/lift stations and two treatment plants. Wastewater is transported by pumping stations and associated force mains to one of two wastewater treatment plants – the Robindale Plant or the South Plant. The Robindale Plant was designed to treat 5 MGD in 1980 and expanded to a capacity of 10 MGD in 1995. The Robindale renovation and expansion project completed in June 24, 2014 increased the treatment capacity to 14.5 MGD. The Robindale Plant provides secondary waste treatment utilizing a Modified Ludzack-Ettinger (MLE) process (anoxic and aerobic with an internal nitrate cycle) of activated sludge, turbo blowers (with magnetic bearings) with auto dissolved oxygen control, secondary settling, ultra-violet light system (as alternate source of disinfection), effluent cascade aeration system, sludge thickening, aerobic digestion, mechanical sludge dewatering (via 2-meter belt filter press), a SCADA (Supervisory Control and Data Acquisition) system, and land disposal of sludge (Dedicated Land Disposal Site of 137 Acres). The South Plant was originally designed as a trickling filter plant with a treatment capacity of 5 MGD. In 1971, it was expanded to a capacity of 7.8 MGD and
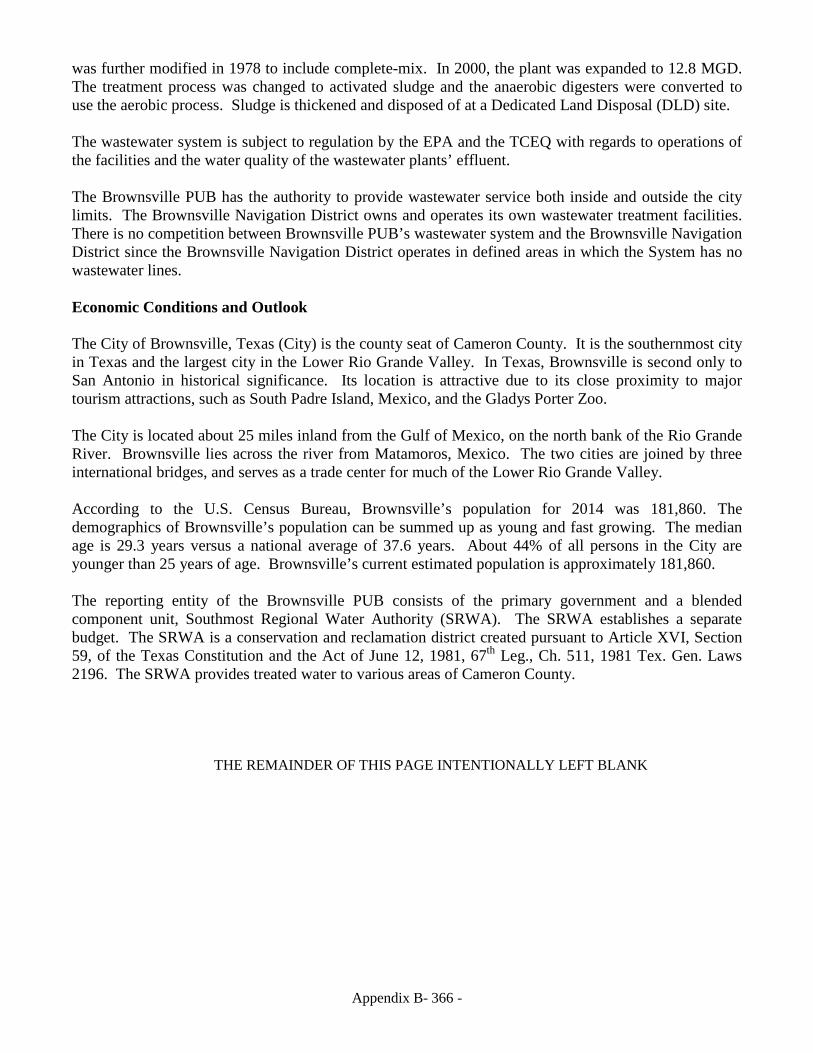
Appendix B- 366 -
was further modified in 1978 to include complete-mix. In 2000, the plant was expanded to 12.8 MGD. The treatment process was changed to activated sludge and the anaerobic digesters were converted to use the aerobic process. Sludge is thickened and disposed of at a Dedicated Land Disposal (DLD) site.
The wastewater system is subject to regulation by the EPA and the TCEQ with regards to operations of the facilities and the water quality of the wastewater plants’ effluent. The Brownsville PUB has the authority to provide wastewater service both inside and outside the city limits. The Brownsville Navigation District owns and operates its own wastewater treatment facilities. There is no competition between Brownsville PUB’s wastewater system and the Brownsville Navigation District since the Brownsville Navigation District operates in defined areas in which the System has no wastewater lines.
Economic Conditions and Outlook The City of Brownsville, Texas (City) is the county seat of Cameron County. It is the southernmost city in Texas and the largest city in the Lower Rio Grande Valley. In Texas, Brownsville is second only to San Antonio in historical significance. Its location is attractive due to its close proximity to major tourism attractions, such as South Padre Island, Mexico, and the Gladys Porter Zoo. The City is located about 25 miles inland from the Gulf of Mexico, on the north bank of the Rio Grande River. Brownsville lies across the river from Matamoros, Mexico. The two cities are joined by three international bridges, and serves as a trade center for much of the Lower Rio Grande Valley. According to the U.S. Census Bureau, Brownsville’s population for 2014 was 181,860. The demographics of Brownsville’s population can be summed up as young and fast growing. The median age is 29.3 years versus a national average of 37.6 years. About 44% of all persons in the City are younger than 25 years of age. Brownsville’s current estimated population is approximately 181,860. The reporting entity of the Brownsville PUB consists of the primary government and a blended component unit, Southmost Regional Water Authority (SRWA). The SRWA establishes a separate budget. The SRWA is a conservation and reclamation district created pursuant to Article XVI, Section 59, of the Texas Constitution and the Act of June 12, 1981, 67th Leg., Ch. 511, 1981 Tex. Gen. Laws 2196. The SRWA provides treated water to various areas of Cameron County.
THE REMAINDER OF THIS PAGE INTENTIONALLY LEFT BLANK
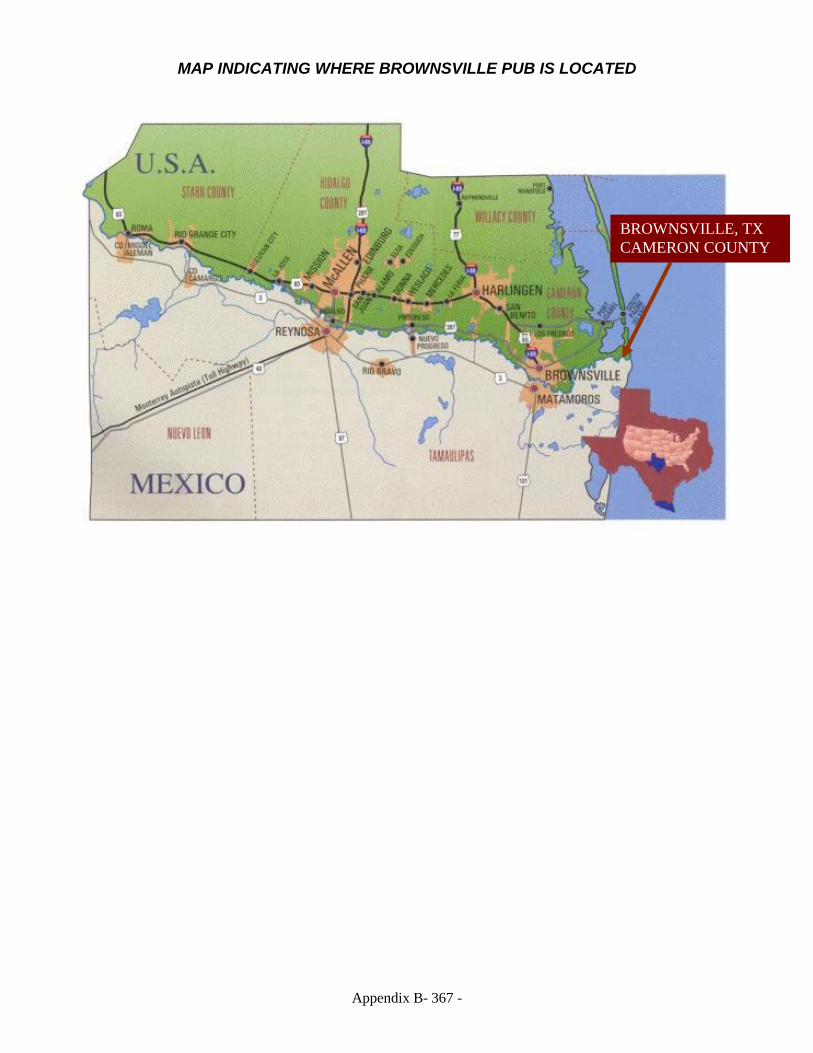
Appendix B- 367 -
MAP INDICATING WHERE BROWNSVILLE PUB IS LOCATED
BROWNSVILLE, TX CAMERON COUNTY

Appendix B
- 368 -
SERVICE AREA MAPS – ELECTRIC
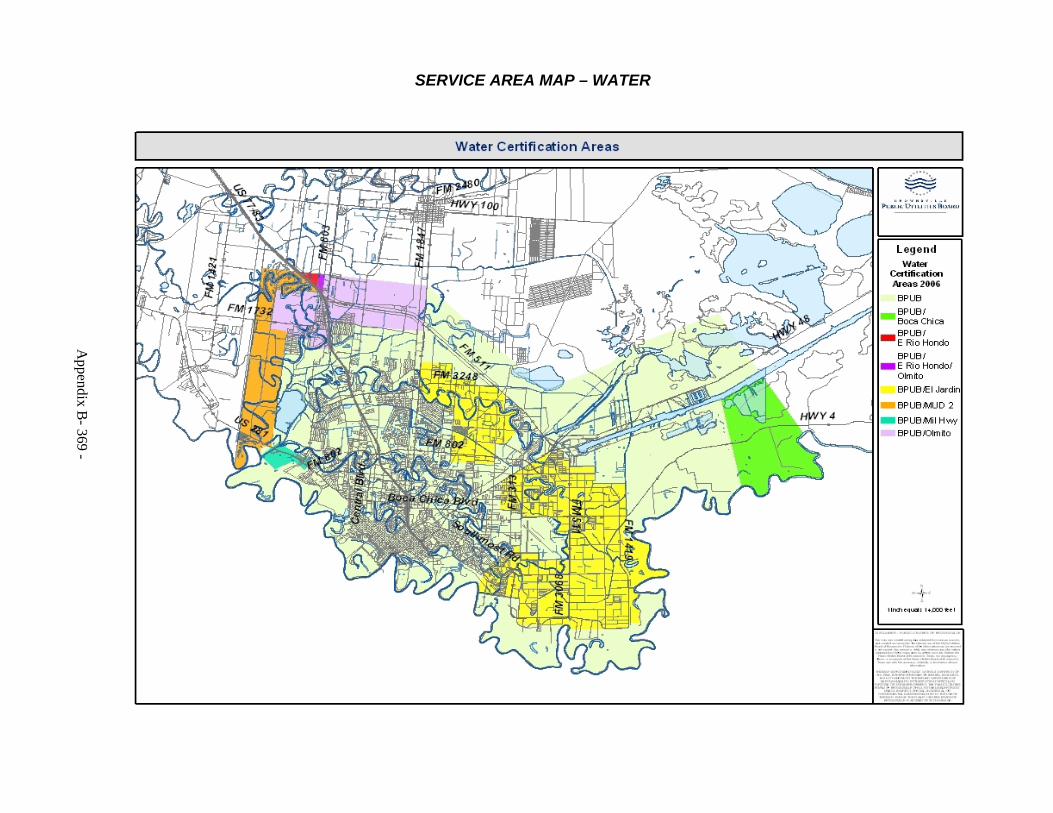
Appendix B
- 369 -
SERVICE AREA MAP – WATER
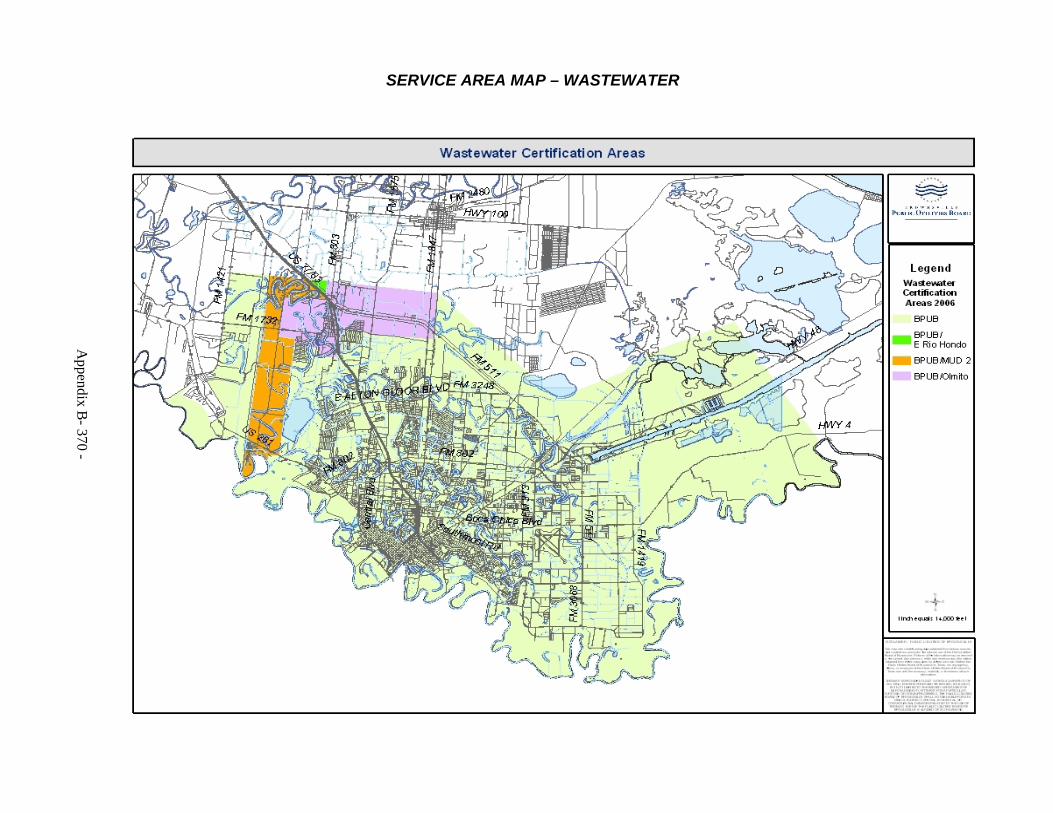
Appendix B
- 370 -
SERVICE AREA MAP – WASTEWATER
Appendix C- 371 -
GLOSSARY A/P – Accounts Payable A/R – Accounts Receivable Account – A basis for distinguishing types of expenses or expenditures. Accrual – The method of accounting that recognizes income when earned and expenses when incurred regardless of when cash is received or disbursed. ACH – Automated Clearing House; name of the network used for electronic financial transactions. AMI – Automated Metering Infrastructure AMR – Automated Meter Reading ARRA – American Recovery and Reinvestment Act of 2009 is a nationwide effort to create jobs, jumpstart growth and transform our economy to compete in the 21st century signed into effect February 17, 2009. Asset – A property that has value. AST – Above-ground storage tank Balanced Budget – a budget in which forward expenditures for a set period are matched by expected revenues for the same period. BANNER 8.4 – name of program used as the Financial Management Information System. Bond – A written promise to pay a sum of money on a specific date at a specified interest rate. The interest payments and the repayments of the principal are detailed in a bond ordinance. The most common type of bonds is the general obligation (G.O.) and revenue bonds. These bonds are most frequently used for the construction costs of large capital projects, such as buildings and streets. Bond Covenants – The issuer’s pledge, in the financing documents, to do or to avoid performing certain practices and actions. Bond Ratings – A measure of the quality and safety of a bond, based on the issuer’s financial condition; more specifically, an evaluation from a rating service indicating the likelihood that a debt issuer will be able to meet scheduled interest and principal repayments. Typically, AAA is the highest (best), and D is the lowest (worst). The Brownsville PUB is maintaining an “A2”, as rated by Moody’s, an “A” as rated by Standard & Poor’s, and an “A” as rated by Fitch Ratings. BPUB – Brownsville Public Utilities Board; Brownsville PUB; the Public Utilities Board; PUB; the System; the Board. BTU – British Thermal Units; in science and engineering, a unit measurement of heat or energy.
Appendix C- 372 -
GLOSSARY Budget – A financial plan, generally for one fiscal year, presenting proposed expenditures and an estimate of the necessary sources of funds; the Budget Document, as prepared and presented, to the governing body. Budget Document – The compilation of the spending plans for the various funds, along with supporting schedules, tables and charts, which, in total, comprises the annual revenue and expenditure plan. CAFR – Comprehensive Annual Financial Report Capital Asset – An asset with an initial, individual cost of more than $5,000 and an estimated useful life in excess of eighteen (18) months. Capital Budget – The portion of the budget devoted to proposed additions to capital assets. Capital Expenditure – Capital Expenditures are those investments in property, plant, and equipment that have a useful life that is greater than one year (depreciable assets). Capital Project – the construction, reconstruction, acquisition, and structural maintenance of buildings or real property that adds value to the utility’s system. CBOD – Chemical Biological Oxygen Demand CDBG – Community Development Block Grant Program (www.hud.gov/edbg). CFO – Chief Financial Officer; in charge of managing the finances of the company. CIP – Capital Improvement Plan; strategy of planning and prioritizing capital projects based on projected availability of resources. Clean Water State Revolving Fund (CWSRF) - a self-perpetuating loan assistance authority for water quality improvement projects in the United States. The fund is administered by the Environmental Protection Agency and state agencies. The CWSRF, which replaced the Clean Water Act Construction Grants program, provides loans for the construction of municipal wastewater facilities and implementation of nonpoint source pollution control and estuary protection projects. Congress established the fund in the Water Quality Act of 1987. Contribution in Aid of Construction (CIAC) – Fees that offset construction costs and developer contributed plant. These can also be cash and non-cash contributions from developers for specific projects. A primary example is the development charge on new water and wastewater connections to Utilities’ system. A development charge is assessed for connection to the water and wastewater systems to compensate existing customers for the costs of developing the current system and to help pay for the growth of the system caused by new customers. COB Usage – City of Brownsville Usage; municipal utility services used by the City of Brownsville. Commercial Paper (CP) - Commercial Paper Obligations means the “City of Brownsville, Texas Utilities System Commercial Paper Notes, Series A” which BPUB has authorized in a maximum aggregate principal amount of $100,000,000.

Appendix C- 373 -
GLOSSARY COO – Chief Operating Officer; in charge of managing the operations of the company. CPA – Certified Public Accountant; certification given to individual who has passed the Uniform Certified Public Accountant Examination and has met the required state education and experience requirements. CPIM – Certificate Program in Management CPR – Continuing Property Records System; information system used to record and keep track of the capital assets of the company.
Davis-Bacon Act - is a United States federal law which established the requirement for paying prevailing wages on public works projects. All federal government construction contracts, and most contracts for federally assisted construction over $2,000, must include provisions for paying workers on-site no less than the locally prevailing wages and benefits paid on similar projects.
DD – Demand Deposits; ACH checks. Debt Service – The principal repayment, interest expense, and issue costs associated with the retirement of outstanding debt. Defeasance – Termination of the rights and interests of the trustee and bondholders under a trust agreement or indenture on final payment or provision for payment of all debt service and premiums and other costs, as specifically provided for in the trust instrument. Department – A major administrative segment responsible for management of operating divisions, which provide services within a functional area. Depreciation – Depreciation represents the use of capital asset over its useful life. Eventually all physical assets wear out or become obsolete. Depreciation recognizes this fact, but does not represent either an actual cash outflow or cash inflow. Distribution – Usable portion of the delivery system coming from the substation or water plant/tank to the customer’s meter. Division – A basic organizational unit that is functionally unique and provides service under the administrative direction of a department. Enterprise Fund – A fund established to account for operations 1) that are financed and operated in a manner similar to business enterprises, where the intent of the governing body is that the costs of providing goods and services to the general public on a continuing bases be financed or recovered primarily through user charges or 2) where the governing body has decided the periodic determination of revenues earned, expenses incurred, and/or net income is appropriate for capital maintenance, public policy, management control, and accountability of other purposes. EPA – Environmental Protection Agency; federal government agency charged with protecting and safeguarding human health and the natural environment (www.epa.gov).
Appendix C- 374 -
GLOSSARY ERCOT – Electric Reliability Council of Texas; Texas State Agency in charge of directing and ensuring the reliable and cost-effective operation of the electric grid and to enable fair and efficient market driven solutions to meet the customers’ electric service needs (www.ercot.com). ERM – Energy Risk Management Expense – A use of financial resources to acquire goods or services consumed in a single year’s current operations. Federal Deposit Insurance Corporation (FDIC) – An independent agency created by Congress that maintains the stability and public confidence in the nation’s financial system by insuring deposits, examining and supervising financial institutions, and managing receiverships (www.fdic.gov).
Feeder – That portion of the circuit that is protected by the breaker up to any protective device excluding branches.
Fiscal Year (FY) – A consecutive 12-month period marking the beginning and ending dates for recording financial transactions. The Brownsville PUB’s fiscal year begins October 1 and ends September 30 of the following calendar year. This is also referred to as the budget year. FS – Financial Statements FTE – Full Time Employee working 40 hours per week. Fuel & Purchased Energy Charge (FPEC) – An electric cost adjustment is the mechanism that tracks and passes through to customers the actual cost of purchased fuel or purchased electricity. The Brownsville PUB meets on a monthly basis to make FPEC adjustments if actual costs vary from forecasted prices. Adjustments can be decreased or increased. Fund Obligation – Repair and Contingency - Funds set aside for unforeseen circumstances. FY – See “Fiscal Year”. GASB - The Governmental Accounting Standards Board; Governmental Board organized in 1984 as an operating entity of the Financial Accounting Foundation (FAF) to establish standards of financial accounting and reporting for state and local governmental entities (www.gasb.org). GAAP - Generally Accepted Accounting Principles; the conventions, rules, and procedures necessary to define an accepted accounting practice at a particular time. The principles have been developed on the basis of experience, custom, usage, and to a significant extent, practical necessity. GFOA – Government Finance Officers Association; organization that enhances and promotes the professional management of governments for the public benefit by identifying and developing financial policies and practices and promoting them through education, training and leadership (www.gfoa.org). GIS – Geographic Information System; software system that manages the geographic information of the company.
Appendix C- 375 -
GLOSSARY GM & CEO – General Manager & Chief Executive Officer; in charge of managing the company and reports to the Board of Directors Grant – A legal transaction giving money or property for a specific purpose. Gross Revenues - total amounts the organization received from all sources during its annual accounting period, without subtracting any costs or expenses. GWH – Gigawatt hours; one billion watts. HRSG – Heat recovery steam generator Improvement Fund CIP Funding – deposit account used for meeting any capital improvements to the System. Improvement Fund Surplus Revenues – deposit of any funds remaining after all debt requirements have been made. Improvement Reserve Fund - reserve account for future CIP projects. The goal is to establish reserves of $15,000,000, as required by City Commission Ordinance No. 2005-1438. Interest Expense – Interest expense is the cost of borrowing funds. It is shown as a financial expense item within the income statement. Interest From Investments – See “Investment Income”. Investment Income –Interest and dividends from short-term and overnight investments. The Brownsville PUB invests certain cash assets in order to receive interest earnings until that cash is needed. All interest earned is recorded as investment income. JEs – Journal Entries JMUX – (Brand name) Electronic System used to control the fiber optic system. Junior lien – See “lien obligations”. Kilovolts (kV) – 1,000 volts. Kilowatt (kW) – 1,000 watts. Kilowatt Hour (kWh) A unit of work or energy equal to that expended by one kilowatt to one hour.
Liabilities - a liability is a debt or obligation that a company must pay. Liabilities are recorded on a company's balance sheet and can include accounts payable, taxes, wages, accrued expenses, and deferred revenues.

Appendix C- 376 -
GLOSSARY
Lien Obligations – Security protection claim for repayment of a debt. Legal priority rights are placed on the repayment of debt. If legal remedies for repayment occur, first emphasis for repayment is Priority Obligations, then Second Lien Obligations, then Junior Lien Obligations, and then Subordinate Lien Obligations. While bonds with second or third liens are generally rated significantly lower than those with first liens, the issuer may determine that the senior-lien credit is so strong that a well-structured junior-lien bond will be rated relatively close to senior bond.
Maintenance Pool Account – account used to fund unexpected/extraordinary repairs or services that incurred during the fiscal year.
Mega Volt Ampere (MVA) – 1,000,000 volt amperes. Megawatt (MW) – 1,000,000 watts or 1,000 kilowatts. Megawatt hour (MWh) – 1,000 kilowatt hours. MG – Million gallons MGD – Million gallons per day Mg/l – Million gallons per load NELAP – National Environmental Laboratory Accreditation Program (www.nelac-instituting.org/newnelap.php). Net Assets - Total assets minus total liabilities of an individual or company. Net Earnings – Gross Revenues after deducting the O&M expenses, but not expenditures, under standard accounting practice, should be charged to capital expenditures. Notional amount – A stated principal amount in an interest rate swap on which the swap is based. O&M – Operations & Maintenance Off-system Sales (wholesale sales) – Off-system or wholesale sales are electric sales outside of the system. Oklaunion - a coal-fired steam electric generating unit jointly owned and operated by Public Service Company of Oklahoma, AEP Texas Central Company, Oklahoma Municipal Power Authority, and the Brownsville PUB entitling the Brownsville PUB to 124 MW of capacity. Operating Reserve Funds – reserve amount to pay the O&M expenses of not less than two months of budgeted O&M expenses ($12,500,000 minimum) for the current fiscal year. Operating Revenues – Gross Revenues with respect to any period, after deducting the O&M expenses.
Appendix C- 377 -
GLOSSARY Operating Subaccount – Fuel Adjustment – account to fund increases in fuel costs without passing on these differences to the customer as part of the FPEC. Operations and Maintenance Budget (O&M Budget) – Plan of current expenditures and proposed means of financing them. The annual operating budget is the primary means by which most of the financing, acquisition, spending, and service delivery activities of the utility are controlled. Operations and Maintenance Expense (O&M Non-personnel) – Also known as operating costs, these are the expenses of the day-to-day operations assigned to the current operating period. Operations and Maintenance Personnel (O&M Personnel) – Cost related to compensating employees, including salaries, wages, insurance, payroll taxes, and retirement contributions. Other Fees – fees charged to customers for a specific use or purpose, such as reconnection fees, meter fees, etc. Other Non-Operating Expenses – Miscellaneous expenses, debt discounts/expenses and other interest expenses. Other Non-Operating Revenues – Revenues consisting of TCI – Pole Rental charges, miscellaneous income and billing discounts. Other Revenues – Revenues consisting of other sales, forfeited discounts (penalties), connection and service charges and TCOS charges. P.E. – Professional Engineer; registered or licensed engineer. PAYGO – The principle or practice of financing expenditures with surplus funds that are currently available rather than borrowed. Personnel Market Pay Study Adjustment – Adjustments to payroll rates as a result of analysis of the most current Market Pay Study. Plant Fund - This fund group is used to account for the acquisition, construction, and maintenance of the Systems physical plant and to control the resulting assets. Policy – A program of actions adopted by a person, group, or government, or the set of principles on which they are based. Polychlorinated biphenyl (PCB) – Several compounds that are produced by replacing hydrogen atoms in biphenyl with chlorine, have various industrial applications, and are toxic environmental pollutants which tend to accumulate in animal tissues.
Power Factor - The power factor of an AC electric power system is defined as the ratio of the real power flowing to the load over the apparent power in the circuit, and is a dimensionless number between 0 and 1 (frequently expressed as a percentage, e.g. 0.5 pf = 50% pf).
Appendix C- 378 -
GLOSSARY Proprietary Fund – Fund used to account for operations that are financed and operated in a manner similar to private business enterprises where the intent is to recover the cost of operations through user charges. PUB – See “BPUB”. Public Utility Commission of Texas (PUCT) – agency that regulates the rates and services of electric, water and wastewater utilities, as defined by state and Federal laws and regulations (www.puc.state.tx.us). Purview – Scope or range. QA – Quality assurance QC – Quality control Ratings – Alpha and/or numeric symbols used to give indications of relative credit quality. In the municipal market these designations are published by the investors’ rating services. Internal ratings are also used by other market participants to indicate relative credit quality. Resaca - Resacas were former channels of the Rio Grande River. Today, they serve as water storage pools as well as habitats for waterfowl, nutria, gar and even alligators; a body of water or water body. Revenue Bonds – Securities for which debt service payments are generated from a specific revenue source. Reverse Osmosis – A process by which a solvent such as water is purified of solutes by being forced through a semi-permeable membrane through which the solvent, but not the solutes, may pass. Revenue Neutral – No gain or loss in revenues. RTU – Remote Terminal Unit SCADA – Supervisory Control and Data Acquisition System; a computer system used to control and monitor power generation; electric, gas, and water transmission and distribution; and wastewater collection. Senior Lien – See “lien obligations”. Sources of Funds – The Sources of Funds identifies the origination of cash received by the Utilities to pay for the various activities of the organization. There are four major categories of cash sources: sales & services to customers, off-system sales, interest from investments, and other operating & non-operating revenues. The primary source of cash is from sales & services to customers paying for the utility services provided to them. The second largest source is from off-system sales. As needed, the Brownsville PUB generates cash through selling excess electricity outside the system. The remaining cash receipts include interest from investments and other operating & non-operating revenues.

Appendix C- 379 -
GLOSSARY Southmost Regional Water Authority (SRWA) – The largest such facility in Texas, the regional reverse osmosis plant uses state-of-the-art reverse osmosis (RO) technology to treat previously untapped and unusable brackish groundwater resources as an alternative water supply. Strategic Management (Strategic Plan) – A type of management to determine mission, vision, values, goals, objectives, roles and responsibilities, timelines, etc. Subordinate Lien – See “lien obligations”. Substations – Electric facility where electrical energy is taken from either the transmission or sub-transmission system and transformed from a higher voltage down to a distribution voltage. Summary Letter – The opening section of the budget, which provides the Brownsville PUB Board and public with a general summary of the most important aspects of the budget. The message explains principal budget issues against the background of financial experience in recent years, and presents the views and recommendations of the General Manager & CEO and Chief Financial Officer. Supplemental O&M – O&M expenses separate from and in addition to the current O&M Budget. These consist of new positions, promotions and reclassifications, maintenance pool account, personnel market pay study adjustment, cost of living, and the new internal auditor positions. Swap – A contract between two parties to swap a series of commitments over a defined period. The commitments which are exchanged are generally an obligation to make one or more payments or the right to receive one or more payments. T&D – Transmission and Distribution TBD – To Be Determined TCEQ – Texas Commission for Environmental Quality is the environmental agency for the State of Texas (www.tceq.state.tx.us). TCI – Tele-Communications Inc.; Time Warner Communications.
TCOS – Transmission Cost of Service; cost of transmission between utilities.
THE REMAINDER OF THIS PAGE INTENTIONALLY LEFT BLANK
Appendix C- 380 -
GLOSSARY TENASKA – Tenaska, based in Omaha, Neb., is one of the leading independent power producers in the U.S., with regional offices in Dallas, Denver, Pittsburgh and Calgary and Vancouver, Canada. Forbes magazine ranks Tenaska 35th among the largest privately-held U.S. companies, based on 2011 revenues. Tenaska and its affiliates have developed approximately 9,000 MW of natural gas-fueled and renewable power generation, and manage operations for approximately 11,000 MW of power generation consisting of 14 power plants, seven of which are owned by Tenaska in partnership with other companies and seven of which are private equity investments managed by affiliate Tenaska Capital Management, LLC. Tenaska is repeatedly listed in benchmarking studies by the Natural Resources Defense Council as having among the best fleet-wide records in the United States for controlling emissions. The company also markets natural gas, biofuels and electric power, and provides energy risk management services. Tenaska is involved in asset acquisition, fuel supply, natural gas exploration, production and transportation systems, and electric transmission development. For more information about Tenaska, visit the company’s website at www.tenaska.com. TENASKA-BROWNSVILLE GENERATION STATION – Capital Project in which BPUB will purchase a 25% share of the proposed 800 MW natural gas fueled station. TPDES – Texas Pollutant Discharge Elimination System; refer to the following web address: http://www.tceq.state.tx.us/permitting/water_quality/wastewater/pretreatment/tpdes_definition.html. TSS – Total Suspended Solids TWDB – Texas Water Development Board; state agency providing leadership, planning, financial assistance, information, and education for the conservation and responsible development of water resources for the State of Texas (www.twdb.state.tx.us). TXDOT – Texas Department of Transportation; state agency providing safe, effective, and efficient movement of goods within the State of Texas (www.dot.state.tx.us). UPS – Uninterruptible Power Supply Uses of Funds – The Uses of Funds identifies how the Brownsville PUB spends the cash it receives. There are nine major categories of cash uses: electric fuel & energy costs, SRWA (the Authority), personnel O&M expenses, non-personnel O&M expenses, other non-operating expenses, debt service fund, city cash transfer, operating & improvement reserves, and CIP funding. The largest use of cash is for operational expenses (labor, fuel, and other expenses) related to the day-to-day operation and maintenance of the Brownsville PUB. The amount of operating cash used to pay for capital projects is also identified. Debt service fund represent the principal and interest payments for the outstanding and planned bond issues. The remaining uses of cash include city cash transfer and operating & improvement reserves. UST – Underground Storage Tank. Utility Manager System (UMS) – Software that manages the customer accounts for electric, water and wastewater utilities. The UMS is the primary billing system for the Brownsville PUB. Vacancy Savings – Personnel account used to allow for the effects of attrition through resignations of employees and non-hiring of currently vacant positions. Watt – The rate of work represented by a current of one ampere under a pressure of one volt and taken as the standard in the United States.

Appendix D- 381 -
Financial Trends
These schedules contain trend information to help the reader understand how the Brownsville PUB’s financial performance and well-being has changed over time.
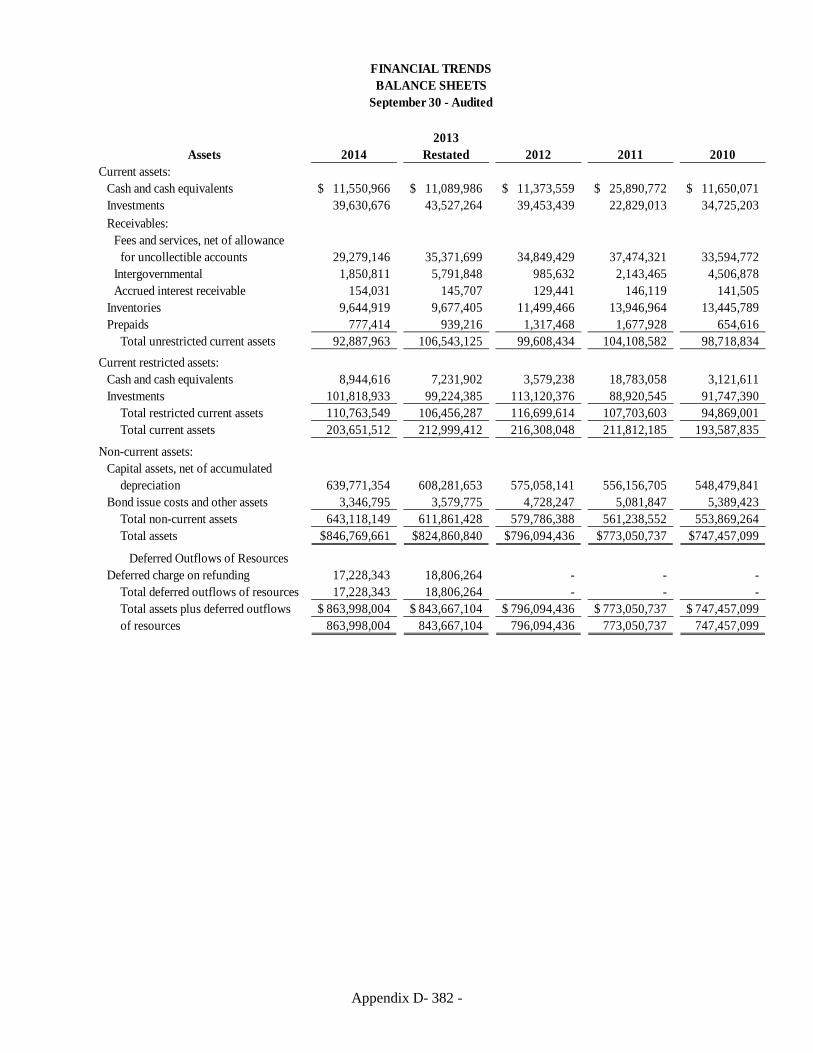
Appendix D- 382 -
Assets 20142013
Restated 2012 2011 2010Current assets:
Cash and cash equivalents 11,550,966$ 11,089,986$ 11,373,559$ 25,890,772$ 11,650,071$ Investments 39,630,676 43,527,264 39,453,439 22,829,013 34,725,203 Receivables:
Fees and services, net of allowancefor uncollectible accounts 29,279,146 35,371,699 34,849,429 37,474,321 33,594,772
Intergovernmental 1,850,811 5,791,848 985,632 2,143,465 4,506,878 Accrued interest receivable 154,031 145,707 129,441 146,119 141,505
Inventories 9,644,919 9,677,405 11,499,466 13,946,964 13,445,789 Prepaids 777,414 939,216 1,317,468 1,677,928 654,616
Total unrestricted current assets 92,887,963 106,543,125 99,608,434 104,108,582 98,718,834 Current restricted assets:
Cash and cash equivalents 8,944,616 7,231,902 3,579,238 18,783,058 3,121,611 Investments 101,818,933 99,224,385 113,120,376 88,920,545 91,747,390
Total restricted current assets 110,763,549 106,456,287 116,699,614 107,703,603 94,869,001 Total current assets 203,651,512 212,999,412 216,308,048 211,812,185 193,587,835
Non-current assets:Capital assets, net of accumulated
depreciation 639,771,354 608,281,653 575,058,141 556,156,705 548,479,841 Bond issue costs and other assets 3,346,795 3,579,775 4,728,247 5,081,847 5,389,423
Total non-current assets 643,118,149 611,861,428 579,786,388 561,238,552 553,869,264 Total assets 846,769,661$ 824,860,840$ 796,094,436$ 773,050,737$ 747,457,099$
Deferred Outflows of ResourcesDeferred charge on refunding 17,228,343 18,806,264 - - -
Total deferred outflows of resources 17,228,343 18,806,264 - - - Total assets plus deferred outflows 863,998,004$ 843,667,104$ 796,094,436$ 773,050,737$ 747,457,099$ of resources 863,998,004 843,667,104 796,094,436 773,050,737 747,457,099
FINANCIAL TRENDSBALANCE SHEETS
September 30 - Audited
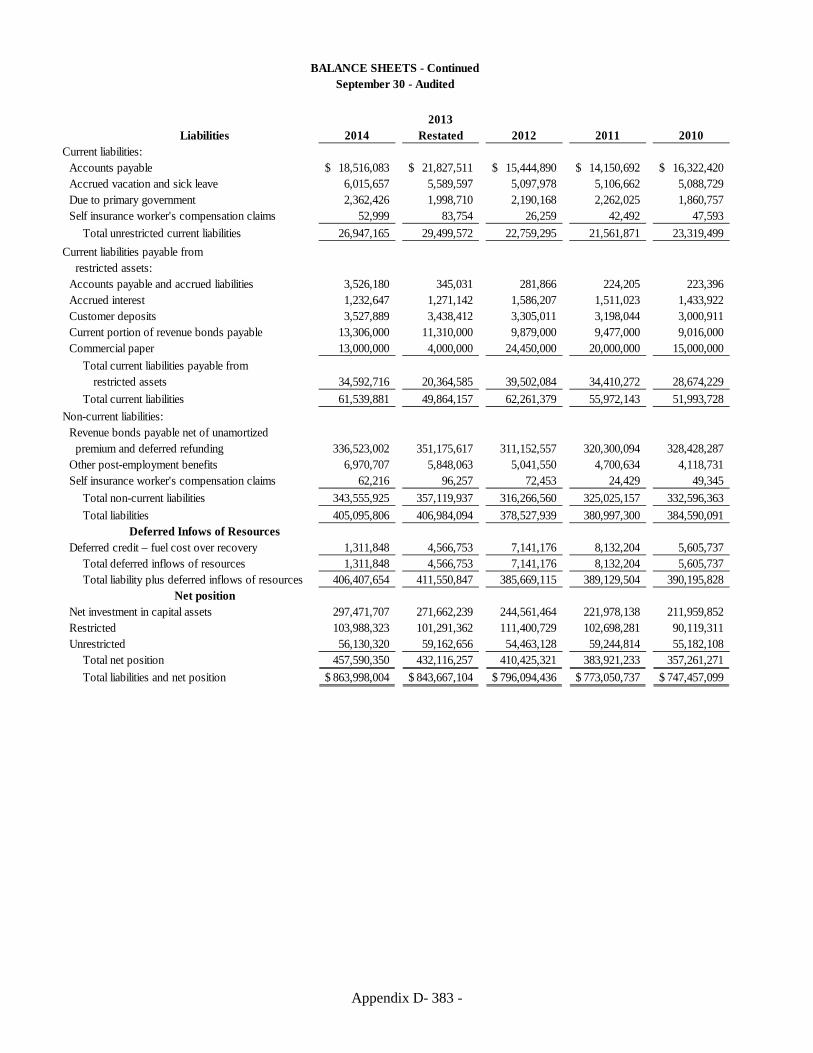
Appendix D- 383 -
Liabilities 20142013
Restated 2012 2011 2010Current liabilities:
Accounts payable 18,516,083$ 21,827,511$ 15,444,890$ 14,150,692$ 16,322,420$ Accrued vacation and sick leave 6,015,657 5,589,597 5,097,978 5,106,662 5,088,729 Due to primary government 2,362,426 1,998,710 2,190,168 2,262,025 1,860,757 Self insurance worker's compensation claims 52,999 83,754 26,259 42,492 47,593
Total unrestricted current liabilities 26,947,165 29,499,572 22,759,295 21,561,871 23,319,499 Current liabilities payable from
restricted assets:Accounts payable and accrued liabilities 3,526,180 345,031 281,866 224,205 223,396 Accrued interest 1,232,647 1,271,142 1,586,207 1,511,023 1,433,922 Customer deposits 3,527,889 3,438,412 3,305,011 3,198,044 3,000,911 Current portion of revenue bonds payable 13,306,000 11,310,000 9,879,000 9,477,000 9,016,000 Commercial paper 13,000,000 4,000,000 24,450,000 20,000,000 15,000,000
Total current liabilities payable fromrestricted assets 34,592,716 20,364,585 39,502,084 34,410,272 28,674,229
Total current liabilities 61,539,881 49,864,157 62,261,379 55,972,143 51,993,728 Non-current liabilities:
Revenue bonds payable net of unamortizedpremium and deferred refunding 336,523,002 351,175,617 311,152,557 320,300,094 328,428,287
Other post-employment benefits 6,970,707 5,848,063 5,041,550 4,700,634 4,118,731 Self insurance worker's compensation claims 62,216 96,257 72,453 24,429 49,345
Total non-current liabilities 343,555,925 357,119,937 316,266,560 325,025,157 332,596,363 Total liabilities 405,095,806 406,984,094 378,527,939 380,997,300 384,590,091
Deferred Infows of ResourcesDeferred credit – fuel cost over recovery 1,311,848 4,566,753 7,141,176 8,132,204 5,605,737
Total deferred inflows of resources 1,311,848 4,566,753 7,141,176 8,132,204 5,605,737 Total liability plus deferred inflows of resources 406,407,654 411,550,847 385,669,115 389,129,504 390,195,828
Net positionNet investment in capital assets 297,471,707 271,662,239 244,561,464 221,978,138 211,959,852 Restricted 103,988,323 101,291,362 111,400,729 102,698,281 90,119,311 Unrestricted 56,130,320 59,162,656 54,463,128 59,244,814 55,182,108
Total net position 457,590,350 432,116,257 410,425,321 383,921,233 357,261,271 Total liabilities and net position 863,998,004$ 843,667,104$ 796,094,436$ 773,050,737$ 747,457,099$
BALANCE SHEETS - ContinuedSeptember 30 - Audited

Appendix D- 384 -
20142013
Restated 2012 2011 2010Operating revenues:
Sales and services charges 192,061,381 170,446,499 169,799,255 172,360,843 158,868,186 Less utilities service to theCity of Brownsville, Texas (4,839,630) (4,274,184) (4,228,001) (4,278,285) (4,069,336) Total operating revenues 187,221,751 166,172,315 165,571,254 168,082,558 154,798,850
Operating expenses:Purchased power and fuel 66,941,752 53,915,199 48,039,343 52,502,812 53,527,194 Personnel services 32,821,858 30,615,677 27,962,188 27,387,747 26,024,535 Materials and supplies 7,376,475 7,432,636 7,276,419 7,160,977 6,444,102 Repairs and maintenance 3,688,413 2,029,564 2,794,117 3,234,646 3,105,675 Contractual and other services 19,152,582 19,319,359 18,971,803 18,166,393 19,570,071 Depreciation 28,409,046 27,366,045 23,601,822 28,269,982 25,555,305
Total operating expenses 158,390,126 140,678,480 128,645,692 136,722,557 134,226,882 Operating income 28,831,625 25,493,835 36,925,562 31,360,001 20,571,968
Nonoperating revenues (expenses):Investment and interest income 532,650 564,334 672,133 628,698 840,533 Interest expense (15,108,927) (15,653,933) (15,579,814) (16,131,381) (16,514,764) Operating grant revenues - - - - - Loss on disposition of capital assets (1,028,494) (116,447) (1,417,327) (359,218) (140,401) Other 1,212,924 (1,483,565) (581,763) (2,157,129) 11,086,396 Payments to City of Brownsville (7,613,475) (7,188,692) (7,738,354) (7,488,261) (7,569,772)
Net nonoperating revenues(expenses) (22,005,322) (23,878,303) (24,645,125) (25,507,291) (12,298,008)
Income before capital contributions 6,826,303 1,615,532 12,280,437 5,852,710 8,273,960 Capital contributions 18,647,790 20,075,404 14,223,651 20,807,252 21,734,690
Change in net position 25,474,093 21,690,936 26,504,088 26,659,962 30,008,650
Net position, beginning of year 432,116,257 410,425,321 383,921,233 357,261,271 327,252,621 Prior Period Adjustment - - - - - Net position, beginning of year as restated 432,116,257 410,425,321 383,921,233 357,261,271 327,252,621 Net position, end of year 457,590,350 432,116,257 410,425,321 383,921,233 357,261,271
FINANCIAL TRENDSSTATEMENTS OF REVENUES, EXPENSES, AND CHANGES IN NET POSITION
Fiscal Years 2014 - 2010

Appendix D- 385 -
Revenue Capacity
These schedules contain information to help the reader assess the Brownsville PUB’s local revenue source.
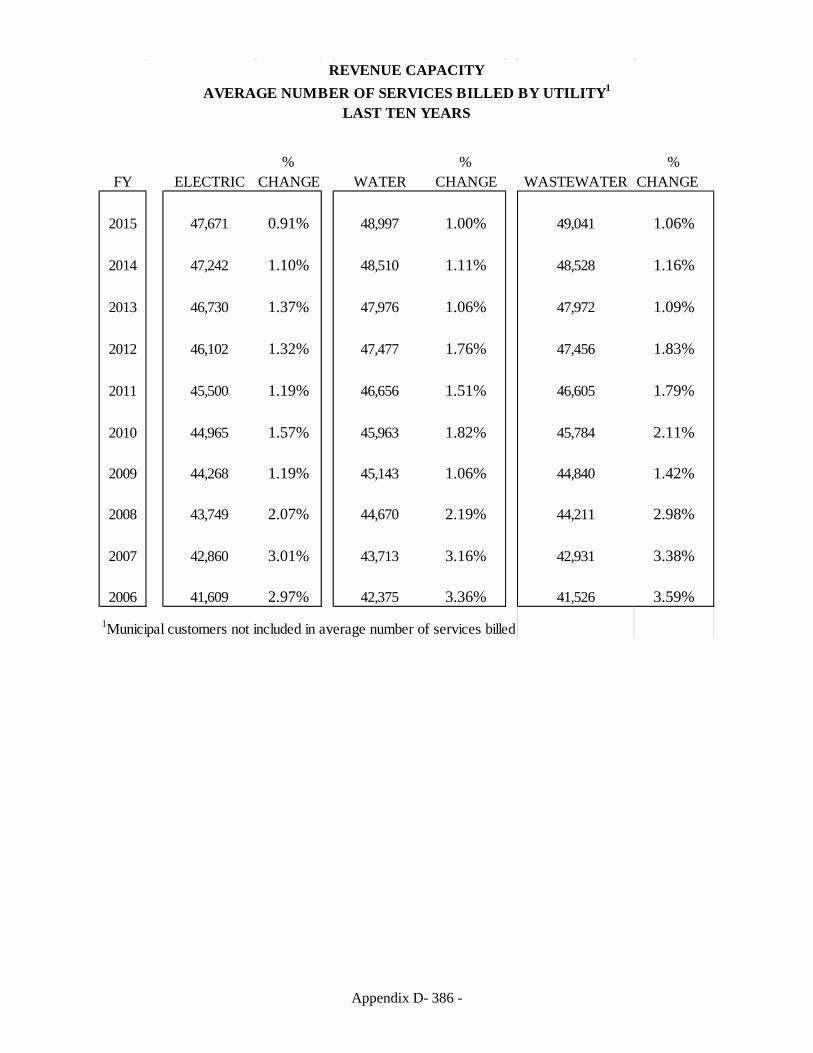
Appendix D- 386 -
% % %FY ELECTRIC CHANGE WATER CHANGE WASTEWATER CHANGE
2015 47,671 0.91% 48,997 1.00% 49,041 1.06%
2014 47,242 1.10% 48,510 1.11% 48,528 1.16%
2013 46,730 1.37% 47,976 1.06% 47,972 1.09%
2012 46,102 1.32% 47,477 1.76% 47,456 1.83%
2011 45,500 1.19% 46,656 1.51% 46,605 1.79%
2010 44,965 1.57% 45,963 1.82% 45,784 2.11%
2009 44,268 1.19% 45,143 1.06% 44,840 1.42%
2008 43,749 2.07% 44,670 2.19% 44,211 2.98%
2007 42,860 3.01% 43,713 3.16% 42,931 3.38%
2006 41,609 2.97% 42,375 3.36% 41,526 3.59%1Municipal customers not included in average number of services billed
REVENUE CAPACITYAVERAGE NUMBER OF SERVICES BILLED BY UTILITY1
LAST TEN YEARS

Appendix D- 387 -
THIS PAGE INTENTIONALLY LEFT BLANK
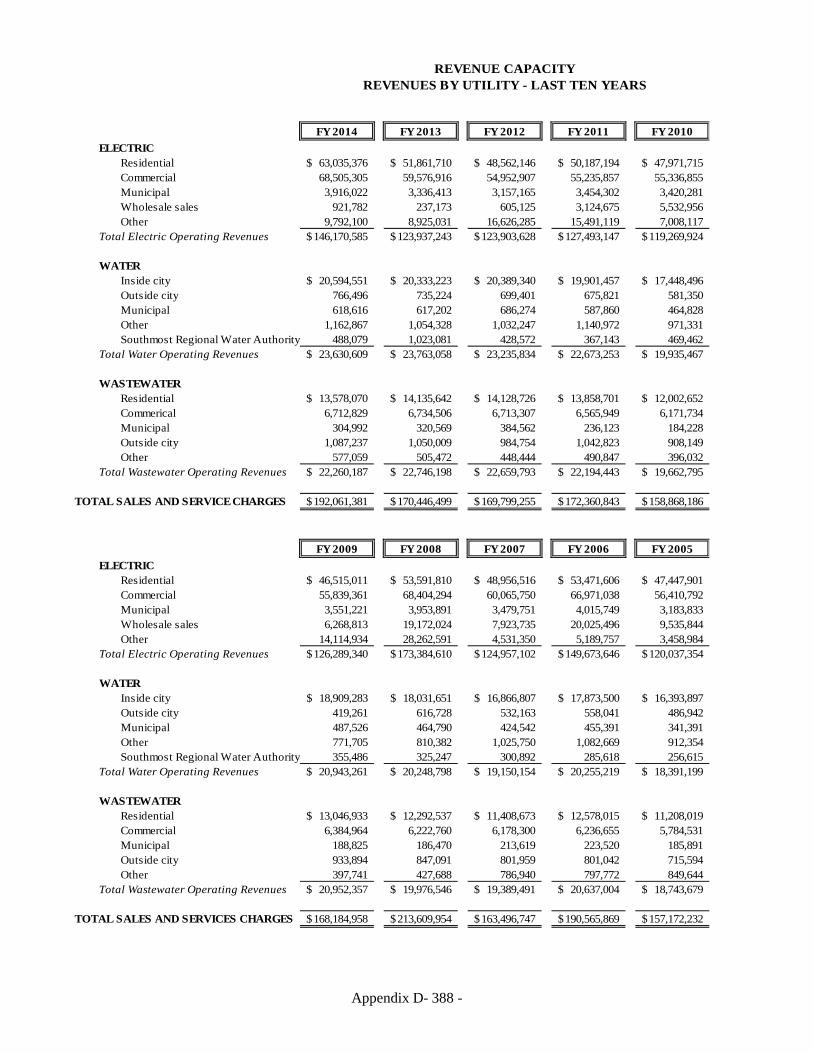
Appendix D- 388 -
FY 2014 FY 2013 FY 2012 FY 2011 FY 2010ELECTRIC
Residential 63,035,376$ 51,861,710$ 48,562,146$ 50,187,194$ 47,971,715$ Commercial 68,505,305 59,576,916 54,952,907 55,235,857 55,336,855 Municipal 3,916,022 3,336,413 3,157,165 3,454,302 3,420,281 Wholesale sales 921,782 237,173 605,125 3,124,675 5,532,956 Other 9,792,100 8,925,031 16,626,285 15,491,119 7,008,117
Total Electric Operating Revenues 146,170,585$ 123,937,243$ 123,903,628$ 127,493,147$ 119,269,924$
WATERInside city 20,594,551$ 20,333,223$ 20,389,340$ 19,901,457$ 17,448,496$ Outside city 766,496 735,224 699,401 675,821 581,350 Municipal 618,616 617,202 686,274 587,860 464,828 Other 1,162,867 1,054,328 1,032,247 1,140,972 971,331 Southmost Regional Water Authority 488,079 1,023,081 428,572 367,143 469,462
Total Water Operating Revenues 23,630,609$ 23,763,058$ 23,235,834$ 22,673,253$ 19,935,467$
WASTEWATERResidential 13,578,070$ 14,135,642$ 14,128,726$ 13,858,701$ 12,002,652$ Commerical 6,712,829 6,734,506 6,713,307 6,565,949 6,171,734 Municipal 304,992 320,569 384,562 236,123 184,228 Outside city 1,087,237 1,050,009 984,754 1,042,823 908,149 Other 577,059 505,472 448,444 490,847 396,032
Total Wastewater Operating Revenues 22,260,187$ 22,746,198$ 22,659,793$ 22,194,443$ 19,662,795$
TOTAL SALES AND SERVICE CHARGES 192,061,381$ 170,446,499$ 169,799,255$ 172,360,843$ 158,868,186$
FY 2009 FY 2008 FY 2007 FY 2006 FY 2005ELECTRIC
Residential 46,515,011$ 53,591,810$ 48,956,516$ 53,471,606$ 47,447,901$ Commercial 55,839,361 68,404,294 60,065,750 66,971,038 56,410,792 Municipal 3,551,221 3,953,891 3,479,751 4,015,749 3,183,833 Wholesale sales 6,268,813 19,172,024 7,923,735 20,025,496 9,535,844 Other 14,114,934 28,262,591 4,531,350 5,189,757 3,458,984
Total Electric Operating Revenues 126,289,340$ 173,384,610$ 124,957,102$ 149,673,646$ 120,037,354$
WATERInside city 18,909,283$ 18,031,651$ 16,866,807$ 17,873,500$ 16,393,897$ Outside city 419,261 616,728 532,163 558,041 486,942 Municipal 487,526 464,790 424,542 455,391 341,391 Other 771,705 810,382 1,025,750 1,082,669 912,354 Southmost Regional Water Authority 355,486 325,247 300,892 285,618 256,615
Total Water Operating Revenues 20,943,261$ 20,248,798$ 19,150,154$ 20,255,219$ 18,391,199$
WASTEWATERResidential 13,046,933$ 12,292,537$ 11,408,673$ 12,578,015$ 11,208,019$ Commercial 6,384,964 6,222,760 6,178,300 6,236,655 5,784,531 Municipal 188,825 186,470 213,619 223,520 185,891 Outside city 933,894 847,091 801,959 801,042 715,594 Other 397,741 427,688 786,940 797,772 849,644
Total Wastewater Operating Revenues 20,952,357$ 19,976,546$ 19,389,491$ 20,637,004$ 18,743,679$
TOTAL SALES AND SERVICES CHARGES 168,184,958$ 213,609,954$ 163,496,747$ 190,565,869$ 157,172,232$
REVENUE CAPACITYREVENUES BY UTILITY - LAST TEN YEARS

Appendix D- 389 -
FY 2014 FY 2013 FY 2012 FY 2011 FY 2010ELECTRIC SERVICE (kWh) Residential 567,334,136 533,303,461 550,169,186 550,421,195 528,459,863 Commercial Non-Demand 132,918,707 134,939,048 136,833,986 136,117,506 131,502,719 Municipal 39,371,016 38,895,227 38,876,114 39,038,235 38,912,608 Commercial Demand 558,708,943 570,125,749 577,866,685 552,274,846 547,906,595 Other 2,226,006 2,232,972 2,234,448 2,188,674 2,183,004
Total Electric Unit Sales 1,300,558,808 1,279,496,457 1,305,980,419 1,280,040,456 1,248,964,789
WATER SERVICE - 1,000 GALLONS Inside City 5,753,783 6,294,433 6,269,037 6,431,432 5,488,648 Outside City 155,398 161,450 150,957 159,187 138,846 Municipal 176,477 189,804 223,176 190,732 129,757 Other 506,676 555,452 582,502 576,616 524,299
Total Water Unit Sales 6,592,334 7,201,139 7,225,672 7,357,967 6,281,550
WASTEWATER SERVICE - 1,000 GALLONS Residential 2,795,399 3,036,404 3,024,487 3,102,690 2,605,256 Commercial 1,604,591 1,677,306 1,659,010 1,703,770 1,597,067 Municipal 74,464 80,169 98,579 60,720 45,905 Outside City 118,228 122,924 118,546 125,817 107,481 Other - 3,671 6,197 6,861 8,248
Total Wastewater Unit Sales 4,592,682 4,920,474 4,906,819 4,999,858 4,363,957
FY 2009 FY 2008 FY 2007 FY 2006 FY 2005ELECTRIC SERVICE Residential 500,830,035 492,440,123 482,667,057 464,233,888 460,554,053 Commercial Non-Demand 131,592,355 151,550,919 144,469,924 128,883,400 132,698,091 Municipal 38,693,875 37,337,658 35,891,236 34,594,940 33,995,538 Commercial Demand 538,603,116 553,765,276 556,660,013 513,297,878 485,395,220 Other 2,156,058 2,210,427 2,249,019 2,134,692 2,039,922
Total Electric Unit Sales 1,211,875,439 1,237,304,403 1,221,937,249 1,143,144,798 1,114,682,824
WATER SERVICE Inside City 6,117,159 5,802,459 5,425,569 5,824,475 5,605,718 Outside City 147,236 127,173 124,426 117,186 115,766 Municipal 153,402 130,520 128,075 154,909 124,677 Other 581,193 491,686 520,179 449,766 521,073
Total Water Unit Sales 6,998,990 6,551,838 6,198,249 6,546,336 6,367,234
WASTEWATER SERVICE Residential 2,930,048 2,770,296 2,513,955 2,668,519 2,516,244 Commercial 1,654,968 1,600,161 1,546,491 1,610,776 1,550,500 Municipal 47,571 48,953 56,673 58,507 58,783 Outside City 117,281 103,510 94,591 101,588 88,730 Other 8,579 7,333 10,275 7,881 5,066
Total Wastewater Unit Sales 4,758,447 4,530,253 4,221,985 4,447,271 4,219,323
1 Excludes Public Utilities Board's usage
REVENUE CAPACITYUNIT SALES BY UTILITY - LAST TEN YEARS 1

Appendix D- 390 -
2015 2014 2013 2012 2011 2010 2009 2008 2007 2006
ELECTRIC 1
Customer Service Charge 6.01 5.62 5.25 3.53 3.53$ 2.53$ 2.53$ 2.53$ 5.53$ 5.53$ Energy Charge First 500 kWh 0.05022 0.04862 0.04708 0.04708 0.04708 0.04708 0.04708 0.04708 0.04708 0.04708 Over 500 kWh 0.06458 0.05964 0.05479 0.05152 0.04708 0.04708 0.04708 0.04708 0.04708 0.04708 Fuel & Purchased Power 0.00450 0.05096 0.04000 0.03200 0.04200 0.03500 0.04000 0.07000 0.04250 0.05800
WATER (Inside City) 2
0-3,000 gallons 1.80 1.73 1.63 1.63 1.55 1.55 1.55 1.55 1.55 1.68 4,000-9,000 gallons 1.99 1.91 1.80 1.80 1.71 1.71 1.71 1.71 1.71 1.86 10,000 to 16,000 gallons 2.45 2.36 2.23 2.23 2.12 2.12 2.12 2.12 2.12 1.93 Over 16,000 gallons 3.70 3.56 3.36 3.36 3.20 3.20 3.20 3.20 3.20 2.90
Customer Service Charge 5/8x3/4 Water Meter Size 10.94 10.52 9.93 9.93 9.47 9.47 9.47 9.47 9.47 9.47
WATER (Outside City) 2
0-3,000 gallons 2.70 2.68 2.65 2.65 2.52 2.52 2.52 2.52 2.52 2.52 4,000-9,000 gallons 2.98 2.95 2.93 2.93 2.79 2.79 2.79 2.79 2.79 2.79 10,000 to 16,000 gallons 3.68 3.10 3.05 3.05 2.90 2.90 2.90 2.90 2.90 2.90 Over 16,000 gallons 5.55 4.60 4.56 4.56 4.34 4.34 4.34 4.34 4.34 4.34
Customer Service Charge 5/8 x 3/4 Water Meter Size 16.43 15.8 14.90 14.90 14.21 14.21 14.21 14.21 14.21 14.21
SEWER (Inside City) 3
Rate per 1,000 gallons -$ -$ -$ -$ -$ -$ -$ -$ -$ 3.40$
0-7,000 gallons 3.43 3.30 3.29 3.29 3.13 3.13 3.13 3.13 3.13 - over 7,000 gallons 3.76 3.62 3.57 3.57 3.40 3.40 3.40 3.40 3.40 -
Customer Service Charge 5/8 x 3/4 Water Meter Size 7.48 7.19 7.17 7.17 6.84 6.84 6.84 6.84 6.84 6.84
SEWER (Outside City)
Rate per 1,000 gallons 5.65$ 5.43$ 5.36$ 5.36$ 5.10$ 5.10$ 5.10$ 5.10$ 5.10$ 5.10$
Customer Service Charge 5/8 x 3/4 Water Meter Size 11.22 10.79 10.75 10.75 10.26 10.26 10.26 10.26 10.26 10.26
1 Electric rates were tiered effective fiscal year 2012.2 Water rates were tiered effective fiscal year 2006.3 Wastewater rates were tiered effective March 2007.Note: The City Commission of the City of Brownsville, Texas is vested with the right to set utility rates.
REVENUE CAPACITYTEN YEAR RATE ANALYSIS
RESIDENTIAL RATES

Appendix D- 391 -
Debt Capacity
These schedules present information to help the reader assess
the Brownsville PUB’s debt burden and its ability to issue additional debt in the future.
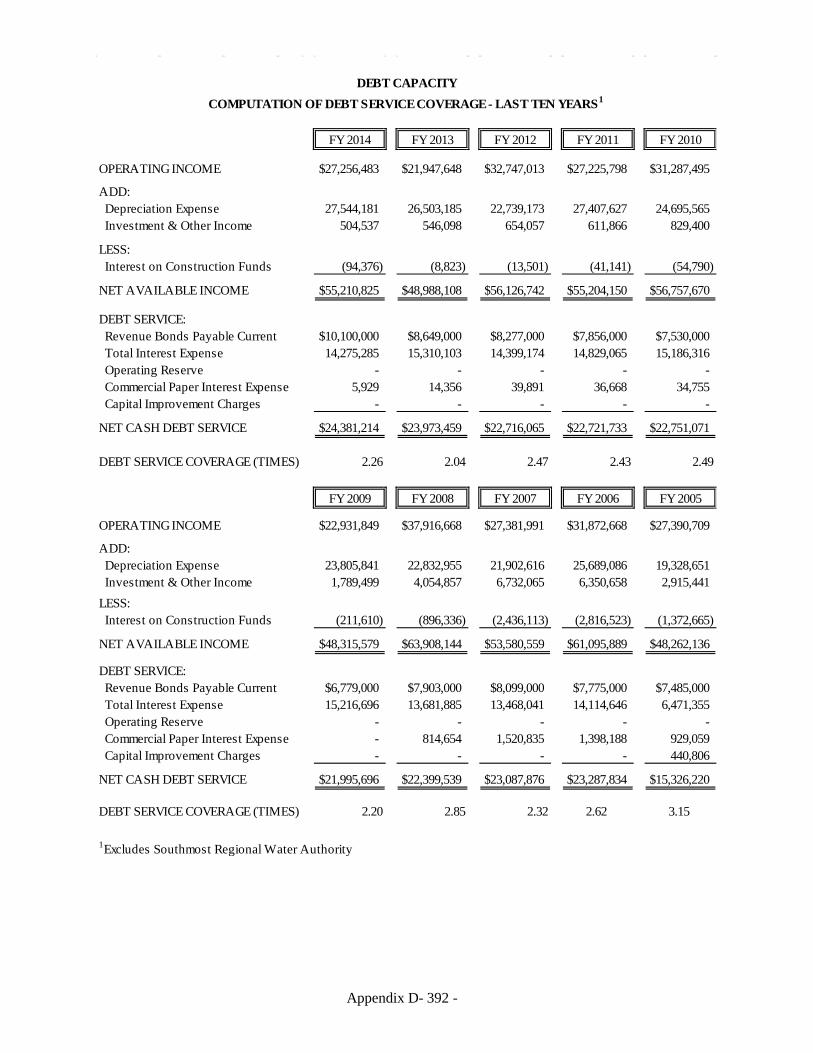
Appendix D- 392 -
FY 2014 FY 2013 FY 2012 FY 2011 FY 2010
OPERATING INCOME $27,256,483 $21,947,648 $32,747,013 $27,225,798 $31,287,495
ADD: Depreciation Expense 27,544,181 26,503,185 22,739,173 27,407,627 24,695,565 Investment & Other Income 504,537 546,098 654,057 611,866 829,400
LESS: Interest on Construction Funds (94,376) (8,823) (13,501) (41,141) (54,790)
NET AVAILABLE INCOME $55,210,825 $48,988,108 $56,126,742 $55,204,150 $56,757,670
DEBT SERVICE: Revenue Bonds Payable Current $10,100,000 $8,649,000 $8,277,000 $7,856,000 $7,530,000 Total Interest Expense 14,275,285 15,310,103 14,399,174 14,829,065 15,186,316 Operating Reserve - - - - - Commercial Paper Interest Expense 5,929 14,356 39,891 36,668 34,755 Capital Improvement Charges - - - - -
NET CASH DEBT SERVICE $24,381,214 $23,973,459 $22,716,065 $22,721,733 $22,751,071
DEBT SERVICE COVERAGE (TIMES) 2.26 2.04 2.47 2.43 2.49
FY 2009 FY 2008 FY 2007 FY 2006 FY 2005
OPERATING INCOME $22,931,849 $37,916,668 $27,381,991 $31,872,668 $27,390,709
ADD: Depreciation Expense 23,805,841 22,832,955 21,902,616 25,689,086 19,328,651 Investment & Other Income 1,789,499 4,054,857 6,732,065 6,350,658 2,915,441LESS: Interest on Construction Funds (211,610) (896,336) (2,436,113) (2,816,523) (1,372,665)
NET AVAILABLE INCOME $48,315,579 $63,908,144 $53,580,559 $61,095,889 $48,262,136
DEBT SERVICE: Revenue Bonds Payable Current $6,779,000 $7,903,000 $8,099,000 $7,775,000 $7,485,000 Total Interest Expense 15,216,696 13,681,885 13,468,041 14,114,646 6,471,355 Operating Reserve - - - - - Commercial Paper Interest Expense - 814,654 1,520,835 1,398,188 929,059 Capital Improvement Charges - - - - 440,806
NET CASH DEBT SERVICE $21,995,696 $22,399,539 $23,087,876 $23,287,834 $15,326,220
DEBT SERVICE COVERAGE (TIMES) 2.20 2.85 2.32 2.62 3.15
1Excludes Southmost Regional Water Authority
DEBT CAPACITYCOMPUTATION OF DEBT SERVICE COVERAGE - LAST TEN YEARS1
Appendix E- 393 -
Demographic and Economic Information
This schedule offers demographic and economic indicators to help the reader understand the environment in which the
Brownsville PUB’s financial activities take place

Appendix E- 394 -
GENERAL INFORMATION REGARDING THE CITY The information contained herein is relative to the City and the System service area is intended solely to provide a general description of the community served by the System and to provide certain information concerning the City. GENERAL The City is the county seat of Cameron County, Texas. It is the southernmost city in Texas and the largest city in the lower Rio Grande Valley. The City is located about 23 miles inland from the Gulf of Mexico, on the north bank of the Rio Grande River directly across from Matamoros, Mexico, which it joins by three international bridges. The City serves as a trade center for much of the lower Rio Grande Valley. The City has a semi-arid, subtropical climate. The lower Rio Grande Valley has rich, fertile delta soil, much of which is irrigated. Crops consist of vegetables, cotton, grain, sugar cane and citrus. The vegetation is typical of the tropics with palms, bougainvillea, poinciana and many other flowering trees and plants. Throughout the area are citrus orchards, which bloom in February and ripen in October. It has not snowed in the City since 2004 and seldom freezes. Weather characteristics of the City are 74 degrees mean average temperature (60 average in winter, 84 average in summer); 25.4 inch average rainfall; 11.5 mph. average wind velocity; average elevation 57 feet above sea level; and 76 percent relative humidity. POPULATION The lower Rio Grande Valley consists of Cameron, Hidalgo, Starr and Willacy Counties with an area of approximately 4,200 square miles and a population of over 1,200,000 based on 2010 census information. Winter residents increase the population substantially. The table below sets forth the population of the City, as reported in the Federal censuses covering the last six decades. POPULATION STATISTICS
YEAR BROWNSVLLE CAMERON COUNTY (2)
2012 178,448 414,123
2013 178,448 415,557
2014 181,860 436,584
_______________ (1) Estimate from US Census Bureau (2) US Census Bureau, Texas Department of State Health Services
Appendix E- 395 -
INDUSTRIAL DEVELOPMENT The major portion of the City's industrial jobs and related payroll has materialized since 1971. Industrial manufacturing is rapidly becoming the primary base of economic growth, causing additional residential and commercial development. Industries which are represented in the City include offshore drilling platforms, chemicals, electronics, communications components, ship dismantling, shrimp processing, paper and plastic bags, fluorspar, engineering, industrial engines, tool-die service, plastic injection molding, industrial services, and the manufacturing of fiberglass swimming pool accessories, corrugated boxes, utility buildings, marble vanities, fiberglass boats, appliances, automotive products, drill bits, apparel, fire and safety equipment and shrimp boats. A sampling of corporations includes Levi Strauss & Co., Lepco Inc., Duro Paper Bag Manufacturing Co., Carlingswitch, Inc., CTS, Brownsville Electronics, Eaton Corp., Sunbeam-Oster, ITT Automotive Electrical Products Division, Norton Co., Fort Brown Manufacturing Co., Pool Technology Ltd., Inc., Magnetek, National Electric Coil Division, General Motors Corp., Zenith Electronics Corporation, Allied-Signal Corporation, Trico, KLH, Ranco Corp., and Shell Tex Fisheries.
The following companies either started up or expanded operations in Brownsville/Matamoros: Airpax Corporation (N.A. Philips) AMFELS, Inc. Antique Street Lamps, Inc. AT&T Microelectronics Border Alliance, SA de CV (Subcontractor) Breed Automotive Butternut Electronics Eaton Corporation FAMSA (Mitsubishi International Corp.) Fort Brown Manufacturing Gateway Services, Inc. Levi Strauss & Co. Hunter Fan, Inc. Magnetek-Louis Allis Motor Controls Magnetek-Hesgon Division Austin Star Detonator Magnetek-National Electric Coil Northern Electric (NECO) Magnetek-Universal Div. Olson Metal Products Nova/Link (shelter/subcontractor) Rapid Design Service, Inc. Panasonic Industrial Corp Unique Molded Products Yount Int'l, Ltd. (subcontracting) Roca Construction RGV Shelter Assoc. (Shelter) Summit Polymers Rohm & Haas Latin America, Inc. Teccor Electronics (Ranco) Synchro Mechanisms of America Trico Technologies Corporation Therma-Tru Corp.
THE REMAINDER OF THIS PAGE INTENTIONALLY LEFT BLANK

Appendix E- 396 -
The following table lists the principal employers in the System service area. MAJOR EMPLOYERS CITY OF BROWNSVILLE
NAME CLASSIFICATION EMPLOYEES1 Brownville ISD Education 76702 Cameron County Government 19503 UT Rio Grande Valley Education 17344 Keppel Amfels Manufacturing 16505 Wal-Mart Retail 14136 Abundant Life Home Health Medical 13007 City of Brownsville Government 12278 Caring For You Home Health Medical 12009 H-E-B Grocery Retail 975
10 Maximus Call Center 950
Source: Brownsville Economic Development Council (May 2015)
THE REMAINDER OF THIS PAGE INTENTIONALLY LEFT BLANK

Appendix E- 397 -
THE BROWNSVILLE NAVIGATION DISTRICT AND THE PORT OF BROWNSVILLE LOCATION The Port of Brownsville (the “Port”) is the southernmost port in Texas and the western terminus of the Gulf Intracoastal Waterway System. The Port, a man-made basin 3,500 feet by 1,200 feet, is located three miles north of the Rio Grande River and the Mexican border, five miles east of the City of Brownsville, and seven miles from the rail and highway border crossing. The Port is connected with the Gulf of Mexico by a 17-mile long ship channel. Entrance from the Gulf of Mexico is at Brazos-Santiago Pass (Latitude 26 degrees 04 mins. North; Longitude 97 degrees 08 mins. 30 sec. West). CHANNELS The entrance channel is protected by two rock jetties each over 5,000 feet in length and 1,200 feet apart. The 17-mile ship channel has no bridges or other obstructions for the entire length of this virtually straight waterway. Currently the channel has a depth of 42 feet to within .85 mile of the Turning Basin, and a depth of 36 feet to and through the Turning Basin. The channel has a controlling (or minimum) width of 250 feet. The Turning Basin has a width of 1,200 feet. The District is currently beginning the studies phase in conjunction with the U.S. Corps of Engineers to deepen the easternmost section of the channel to a depth of up to 55 feet. HARBOR FACILITIES The Main Harbor consists of the Turning Basin and Approach, containing over five miles of improved frontage. The Turning Basin is 3,500 feet long and 1,200 feet wide and contains ten General Cargo Docks aggregating 5,200 lineal feet plus a 30-foot small craft dock. Four Oil Docks, a 400 foot Bulk Cargo Dock serving the Grain Elevator and Bulk Plant, a Liquid Cargo Dock, an Express Dock and the newly completed 600 foot by 280 foot deepwater General Cargo Dock are located in the Turning Basin Approach which is 7,000 feet long with a 650 foot bank width and a 500 foot controlling bottom width. A privately-owned 3,750,000 bu. capacity grain elevator as well as corrugated iron sprinklered cargo transfer sheds; open surface storage yards; 41 miles of railroad trackage and mechanical freight handling equipment augment the Port of Brownsville’s ability to handle a wide variety of cargos. The Brownsville Navigation District (the “District”) has purchased and put into operation a mobile harbor crane, located at the deepwater General Cargo Dock (Dock 15). This crane, while designed to handle container cargo, has proven its worth in the efficient handling of steel and bulk products. The District is currently seeking funding to construct a second, deepwater General Cargo Dock (Dock 16) adjacent to Dock 15. The mobile harbor crane would be able to service both docks. A complete shrimp and Fishing Harbor, separate and apart from the Main Harbor, was completed and placed in service in mid-summer 1953. A second phase was finished in December, 1968. All docks were completely rebuilt in a project that was completed in 1993. Located four miles east of the main Turning Basin, with a protected entrance to the Ship Channel, this basin measures 2,100 feet by 1,600 feet overall with two 300 feet by 1,200 foot peninsulas in the center. The channel connecting with the Ship Channel is 200 feet wide and 600 feet long. Controlling depth in the Fishing Harbor is 14 feet. This basin provides 12,000 lineal feet of dock space for trawlers, tugs, and other small craft and is equipped with all necessary facilities for handling and processing fish
Appendix E- 398 -
and shrimp, as well as maintaining and servicing shrimp vessels. More than 200 shrimp trawlers are home-ported at the Fishing Harbor, more than double that number of foreign trawlers call regularly for repairs, fuel and stores. Plans over the next 15 to 20 years for the Port include the construction of a new turning basin and docking facilities with a depth of 55 feet to be located approximately seven miles west of the entrance to the channel. The property has been purchased for this new harbor, and preliminary studies are underway. TERMINAL OPERATIONS All waterfront facilities on the Brownsville Ship Channel, at the Main Harbor and the Fishing Harbor, are owned by the District. Certain small craft facilities are leased to private operators, but all deep-water facilities at the Main Harbor are operated as public facilities. Vessels and agents are assigned berths at the discretion of the District. Vessel loading and discharge is performed by stevedoring contractors. Rail car and truck loading and unloading is customarily performed by stevedoring contractors. Around-the-clock supervision of vessels and vehicle traffic at the Port is provided by the District. The Harbormaster’s Office schedules vessel arrivals and departures, maintains radio contact with the pilot boat of the Brazos-Santiago Pilots’ Association and provides up-to-the-minute information on schedules useful to agents, stevedores, tugboats, line-runners and the general public. Vessels can call on Channel 16 twenty-four hours a day. All General Cargo Sheds, except Shed No. 2, are protected with automatic fire sprinkler systems, hose stations, and fire extinguishers suitable for the type of cargo normally handled through the particular shed. Fire hydrants are located on wharf aprons and throughout the Port’s storage facilities. Water supply is from a 16-inch main connecting with the Board’s distribution system. Storage capacity and pressure equalization are provided by one 500,000 gallon and one 1,000,000 gallon elevated water storage tank. Around-the-clock guard service is provided to all general cargo facilities. The District’s Administration Offices are located at the Port. These offices handle inquiries on trade and industrial development, environmental issues, accounting, purchasing, credit, traffic, personnel, and engineering. All docks at the Port are equipped with electric lights, light and power lines, and fresh water. All docks are served by rail. Wastewater and ballast facilities are available. All of the facilities are operated for hire on a first-come, first-served basis. The dry dock Los Alamos was signed over to the District by the United States Department of the Navy. It was re-christened the Solomon P. Ortiz and was originally leased to AMFELS for operation as a dry dock to repair drilling rigs. AMFELS subsequently exercised their option to purchase the Solomon P. Ortiz. The dry dock was placed into service by AMFELS in May, 1996, and is now one of the few dry docks carrying out oil rig repairs. The District owns and controls approximately 50,000 acres of land adjoining the Turning Basin and Ship Channel, and approximately 18,000 acres of this land have been developed as an industrial park with additional land available for development. In recent years over $150 million

Appendix E- 399 -
worth of industrial development has been located on Port property, including tank farms, heavy and light manufacturing, seafood processing, steel fabrication, and a grain elevator and storage facility. Plant sites of virtually any size, with access to the deep-water harbor, rail connections, paved highways, and utilities may be rented on long-term leases at attractive prices from the District. The District derives its operating revenues from charges for lease rentals, wharfage, storage, vessel dockage, and the sale of various port services such as utilities. The District currently has 72 full-time employees. FOREIGN TRADE ZONE On October 20, 1980, U. S. Customs created Foreign Trade Zone (“FTZ”) Number 62 with the District as the Grantee and operator. There is a total of 2,680 acres available for FTZ status at the Port of Brownsville, the Brownsville/South Padre Island International Airport, the Harlingen Industrial Park, the Los Indios Industrial Park/FINSA Industrial Park, and the NAFTA Industrial Park. The District receives fees from tenants utilizing the District’s zone status. There are currently six Foreign Trade Zone tenants operating within the FTZ with general purpose warehousing and liquid bulk storage available. TOURISM Tourism is one of the area's biggest industries. The City ranks among the top five cities in Texas for long and short term stays, with the Rio Grande Valley as the number one area in the State of Texas as a destination point for automobile tourist traffic entering Texas. The City area has twenty-nine hotels and motels with 1,740 rooms and two country clubs. Vacationers are attracted by subtropical climate, proximity to Mexico and access to South Padre Island. In addition to a rich historical past, the City has one of the finest zoos in the nation, the Gladys Porter Zoo, donated by the Sams Foundation. Also the Laguna-Atascosa Wildlife Refuge, Confederate Air Force Flying Museum and the Port Isabel Lighthouse are open for tourists. TRANSPORTATION The City is the only location on the U.S./Mexico border offering all modes of transportation including highway, air, railroad and waterborne. The City is the terminus of U.S. Highways 77/83 and 281. Three international bridges, B&M (a privately-owned bridge), Gateway International, and Veteran’s International, owned by Cameron County, connect the City with Matamoros, Mexico. Several bus companies, including Greyhound Bus Line, Valley Transit and El Expresso, and motor freight carriers also serve the area. Two international airports are within a 30-mile area; the Brownsville/South Padre Island International Airport, which now services international flights through Continental Airlines, and the Valley International Airport, serviced by Southwest Airlines, Continental Airlines, and American Eagle. Air cargo is provided by Emery Worldwide and Burlington Air Express. An international flight school, Southwest Flight Systems, Inc., provides flight training for numerous airlines worldwide at the Brownsville/South Padre Island International Airport. Railroad needs are met by Union Pacific and Ferrocarriles Nacionales de Mexico.
Appendix E- 400 -
Waterborne shipping is provided through the Port to domestic and foreign destinations by barge and deep water vessels. EDUCATIONAL FACILITIES The City is encompassed by the Brownsville Independent School District (“BISD”). The BISD is currently comprised of 6 high schools, 11 middle schools, 37 elementary schools and 5 alternative learning centers. In addition to the public schools, there are several private schools ranging from kindergarten through high school available in the City. St. Joseph's Academy, its most prominent parochial school, provides education from 7th to 12th grades. SECONDARY EDUCATION Institutions of higher learning within a 60-mile radius of the City include the University of Texas at Brownsville and the University of Texas-Pan American in Edinburg which will consolidate into the University of Texas Rio Grande Valley effective September 1, 2015. Texas State Technical Institute (“TSTC”), located in Harlingen (25 miles from the City), opened in 1967 as a member of the James Connally Technical Institute of Texas A&M University. In 1969, the colleges separated from Texas A&M and took the name Texas State Technical Institute. In 1991, the system took its current name. The system includes four Texas colleges and serves more than 10,000 students. TSTC is a state-supported technical college system, with a mission of preparing its students to enter the workforce ready to meet the high-tech challenges of today’s industry. The college’s administration actively works with representatives of companies who have specific labor training needs in order to design training courses which meet the requirements of each company.
THE REMAINDER OF THIS PAGE INTENTIONALLY LEFT BLANK

Appendix E- 401 -
Education(Thousand's Level in
Per of Dollars) Years of PublicFiscal Capita Personal Median Formal School UnemploymentYear Population* Income Income Age Schooling Enrollment Rate
2014 181,860 14,167 2,576,411 29.3 64.3%-High School 48,248 8.10%18.4%-Bachelor's Degree
2013 180,097 13,556 2,441,395 29.5 61.8%-High School 49,274 10.30%15.7%-Bachelor's Degree
2012 175,023 12,900 2,257,797 29.5 60.3%-High School 49,271 10.50%15.0%-Bachelor's Degree
2011 175,023 12,917 2,260,772 29.5 60.2%-High School 49,587 12.40%15.6%-Bachelor's Degree
2010 175,023 11,824 2,069,472 27.0 59.5%-High School 49,835 11.60%15.2%-Bachelor's Degree
2009 176,859 11,623 2,055,632 27.6 58.5%-High School 49,605 10.90%15.8%-Bachelor's Degree
2008 172,806 11,685 2,019,238 26.9 57.9%-High School 49,082 7.50%15.2%-Bachelor's Degree
2007 172,437 11,161 1,924,569 26.9 57.9%-High School 48,799 5.90%15.2%-Bachelor's Degree
2006 172,437 11,161 1,924,569 26.7 60%-High School 48,123 6.50%16.2%-Bachelor's Degree
2005 167,493 11,161 1,869,389 25.4 60%-High School 48,236 7.35%14.4%-Bachelor's Degree
*Population Estimates U.S. Census Bureau
SOURCES:
City of Brownsville, Texas
Brownsville Independent School District
Texas Workforce Commission
U.S. Census Bureau
U.S. Bureau of Economic Analysis
DEMOGRAPHIC STATISTICSLAST TEN FISCAL YEARS

Appendix E- 402 -
THIS PAGE INTENTIONALLY LEFT BLANK

Appendix F- 403 -
Operating Information
These schedules contain service and infrastructure data to help the reader understand how the information in the
Brownsville PUB’s Budget and CAFR relate to the service Brownsville PUB provides and the activities it
performs

Appendix F- 404 -
OPERATING INFORMATION EXPENSES BY UTILITY – LAST TEN YEARS
2014 2013 2012 2011
ELECTRICGeneration and Purchases for Resale 73,010,092$ 58,343,217$ 54,353,235$ 60,519,100$ Transmission and Distribution 6,284,873 6,305,706 6,347,120 5,464,375 Administrative and General 20,437,763 20,656,916 18,697,201 16,918,463 Depreciation 14,768,870 14,793,412 13,373,507 16,331,733
Total Electric Operating Expenses 114,501,598$ 100,099,251$ 92,771,063$ 99,233,671$
WATERPlant Operations 6,397,130$ 5,649,170$ 4,993,739$ 4,707,258$ Transmission and Distribution 2,743,060 2,565,614 2,514,676 2,655,300 Administrative and General 5,325,225 4,748,131 4,081,484 3,961,827 Depreciation 5,543,534 5,345,962 3,766,336 3,941,128
Total Water Operating Expenses 20,008,949$ 18,308,877$ 15,356,235$ 15,265,513$
WASTEWATERPlant Operations 6,656,181$ 6,138,037$ 5,967,684$ 6,117,905$ Transmission and Distribution 920,364 764,006 804,846 967,001 Administrative and General 5,431,148 5,171,407 4,696,229 4,703,383 Depreciation 7,231,777 6,363,811 5,599,330 7,134,766
Total Wastewater Operating Expenses 20,239,470$ 18,437,261$ 17,068,089$ 18,923,055$
SOUTHMOST REGIONAL WATER AUTHORITYAdministration and General 2,775,244$ 2,970,231$ 2,587,656$ 2,437,963$ Depreciation 864,865 862,860 862,649 862,355
Total SRWA Operating Expenses 3,640,109$ 3,833,091$ 3,450,305$ 3,300,318$
TOTAL OPERATING EXPENSES 158,390,126$ 140,678,480$ 128,645,692$ 136,722,557$
OTHER NONOPERATING REVENUES (EXPENSES)1 (14,391,847)$ (16,689,611)$ (16,906,771)$ (18,019,030)$
1 Excludes payments to City of Brownsville

Appendix F- 405 -
2010 2009 FY 2008 FY 2007 FY 2006 FY 2005
64,165,188$ 67,454,789$ 101,176,542$ 67,165,042$ 89,266,558$ 70,509,676$ 4,624,680 4,611,675 3,920,988 3,486,094 2,497,172 2,661,484
16,366,264 16,376,681 13,236,701 12,397,626 12,030,998 10,959,383 14,662,285 13,961,232 13,622,466 12,647,117 16,357,921 10,885,513 99,818,417$ 102,404,377$ 131,956,697$ 95,695,879$ 120,152,649$ 95,016,056$
3,432,591$ 3,870,958$ 3,122,381$ 2,782,802$ 2,730,596$ 2,681,328$ 2,426,368 2,584,580 2,110,791 1,897,290 1,652,982 1,595,306 3,875,983 3,916,202 5,438,548 5,131,917 4,801,385 4,595,069 4,286,330 4,420,121 4,138,811 3,791,008 3,605,668 3,769,817
14,021,272$ 14,791,861$ 14,810,531$ 13,603,017$ 12,790,631$ 12,641,520$
5,539,157$ 5,586,811$ 5,039,214$ 4,116,603$ 3,439,993$ 3,183,812$ 1,382,386 1,103,481 1,117,675 930,871 862,280 748,237 4,536,291 4,505,516 5,962,321 5,305,607 5,040,621 4,677,346 5,746,950 5,424,488 5,071,678 5,464,491 5,725,496 4,673,321
17,204,784$ 16,620,296$ 17,190,888$ 15,817,572$ 15,068,390$ 13,282,716$
2,322,669$ 2,727,667$ 2,461,614$ 2,325,001$ 2,303,829$ 1,399,347$ 859,740 857,645 858,151 868,275 774,124 337,156
3,182,409$ 3,585,312$ 3,319,765$ 3,193,276$ 3,077,953$ 1,736,503$
134,226,882$ 137,401,846$ 167,277,881$ 128,309,744$ 151,089,623$ 122,676,795$
(4,728,236)$ (14,641,424)$ (12,416,165)$ (10,778,680)$ (13,050,339)$ (6,290,197)$
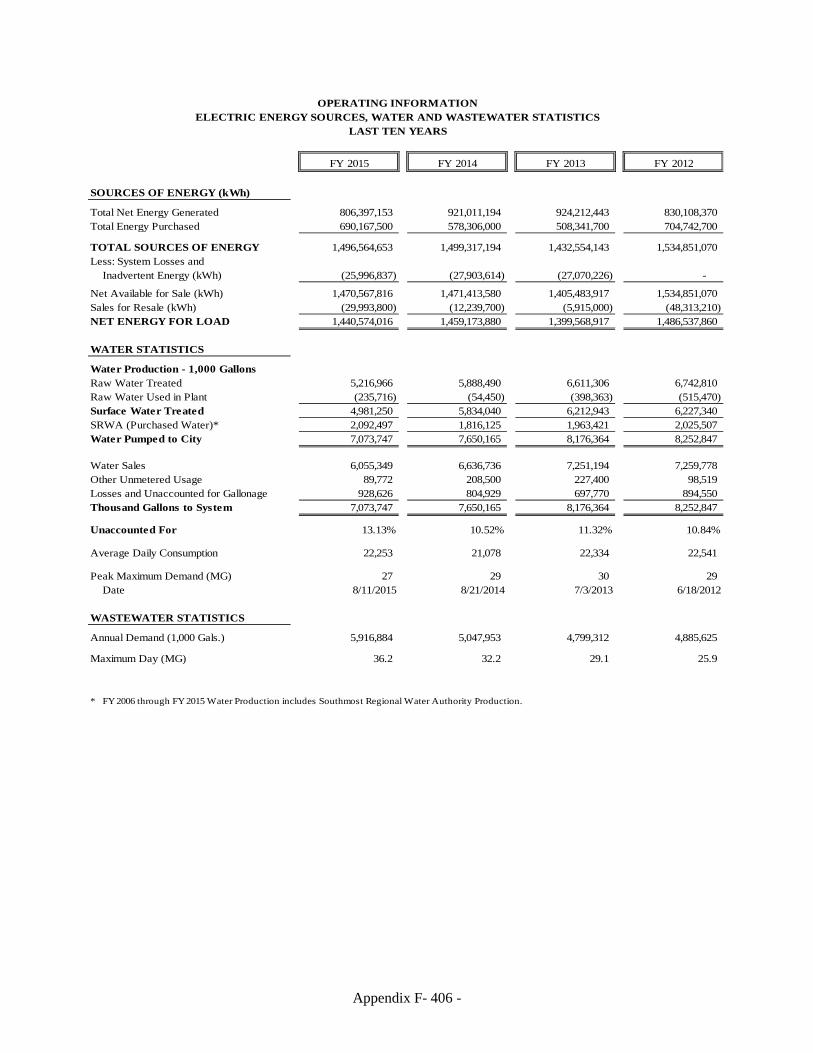
Appendix F- 406 -
FY 2015 FY 2014 FY 2013 FY 2012
SOURCES OF ENERGY (kWh)
Total Net Energy Generated 806,397,153 921,011,194 924,212,443 830,108,370 Total Energy Purchased 690,167,500 578,306,000 508,341,700 704,742,700
TOTAL SOURCES OF ENERGY 1,496,564,653 1,499,317,194 1,432,554,143 1,534,851,070 Less: System Losses and
Inadvertent Energy (kWh) (25,996,837) (27,903,614) (27,070,226) -
Net Available for Sale (kWh) 1,470,567,816 1,471,413,580 1,405,483,917 1,534,851,070 Sales for Resale (kWh) (29,993,800) (12,239,700) (5,915,000) (48,313,210) NET ENERGY FOR LOAD 1,440,574,016 1,459,173,880 1,399,568,917 1,486,537,860
WATER STATISTICS
Water Production - 1,000 GallonsRaw Water Treated 5,216,966 5,888,490 6,611,306 6,742,810 Raw Water Used in Plant (235,716) (54,450) (398,363) (515,470) Surface Water Treated 4,981,250 5,834,040 6,212,943 6,227,340 SRWA (Purchased Water)* 2,092,497 1,816,125 1,963,421 2,025,507 Water Pumped to City 7,073,747 7,650,165 8,176,364 8,252,847
Water Sales 6,055,349 6,636,736 7,251,194 7,259,778 Other Unmetered Usage 89,772 208,500 227,400 98,519 Losses and Unaccounted for Gallonage 928,626 804,929 697,770 894,550 Thousand Gallons to System 7,073,747 7,650,165 8,176,364 8,252,847
Unaccounted For 13.13% 10.52% 11.32% 10.84%
Average Daily Consumption 22,253 21,078 22,334 22,541
Peak Maximum Demand (MG) 27 29 30 29 Date 8/11/2015 8/21/2014 7/3/2013 6/18/2012
WASTEWATER STATISTICS
Annual Demand (1,000 Gals.) 5,916,884 5,047,953 4,799,312 4,885,625
Maximum Day (MG) 36.2 32.2 29.1 25.9
* FY 2006 through FY 2015 Water Production includes Southmost Regional Water Authority Production.
OPERATING INFORMATIONELECTRIC ENERGY SOURCES, WATER AND WASTEWATER STATISTICS
LAST TEN YEARS

Appendix F- 407 -
FY 2011 FY 2010 FY 2009 FY 2008 FY 2007 FY 2006
1,353,750,565 1,577,510,000 1,120,083,000 1,304,850,000 1,174,655,000 1,041,227,000 429,383,640 378,317,000 528,558,000 181,698,000 224,840,000 374,198,000
1,783,134,205 1,955,827,000 1,648,641,000 1,486,548,000 1,399,495,000 1,415,425,000
- (69,693,000) (82,039,000) (67,321,000) (34,606,000) (45,282,000)
1,783,134,205 1,886,134,000 1,566,602,000 1,419,227,000 1,364,889,000 1,370,143,000 (245,366,425) (366,669,000) (250,127,000) (84,279,000) (50,295,000) (125,884,000)
1,537,767,779 1,519,465,000 1,316,475,000 1,334,948,000 1,314,594,000 1,244,259,000
7,502,790 7,073,522 8,217,557 7,427,578 6,572,379 7,173,000 (791,199) (845,261) (439,663) (290,178) (250,170) (734,543)
6,711,591 6,228,261 7,777,894 7,137,400 6,322,209 6,438,457 1,929,481 1,947,011 1,617,101 1,649,267 1,762,984 1,545,520 8,641,072 8,175,272 9,394,995 8,786,667 8,085,193 7,983,977
7,417,175 6,321,717 7,062,104 6,624,490 6,245,897 6,621,000 68,577 88,719 44,915 21,809 29,067 222,013
1,155,320 1,764,836 2,287,976 2,140,368 1,810,229 1,140,964 8,641,072 8,175,272 9,394,995 8,786,667 8,085,193 7,983,977
13.37% 21.59% 24.35% 24.61% 22.39% 14.29%
23,674 22,398 25,740 24,007 22,151 21,874
30 29 39 33 31 31 6/17/2011 4/5/2010 6/16/2009 6/19/2008 6/19/2007 5/2/2006
4,992,236 5,522,605 5,052,595 5,154,241 4,966,233 4,574,090
32.6 38.5 25.5 19.7 26.6 19.7
- 408 -

1425 Robinhood Drive P.O. Box 3270 Brownsville, TX 78523-3270 (956) 983-6100 Fax: (956) 983-6175