annual catch estimates &kkp.go.id/an-component/media/upload-gambar-pendukung/kkp...annual catch...
TRANSCRIPT

ANNUAL CATCH ESTIMATES & INDONESIA’s EFFORTS TO COMPLY WITH RFMOs
(IOTC, WCPFC and CCSBT)
Dr. Fayakun Satria
Research Intitute for Marine Fisheries – Center for Research for Fisheries MMAF
31 may to 1 June 2018
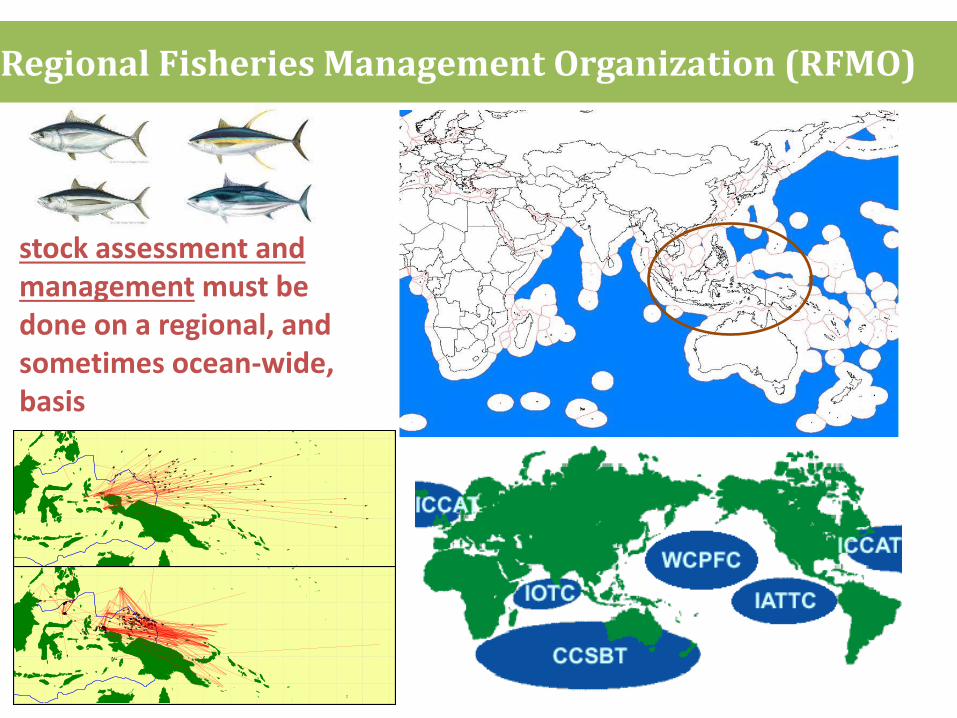
Regional Fisheries Management Organization (RFMO)
stock assessment and management must be done on a regional, and sometimes ocean-wide, basis

WCPFC
IOTC
CCSBT
538 Fishing port
Motorized boat Total 623.970
Motorized boat 617.730 < 30 GT
> 37 Type of Fishery For Tuna Fishery > 8 fishery HL (Surface HL and Deep HL) , PL, LL, PS, GN, TL, Kite Line, Ring Net
Map source PIPP DJPT MMAF
Small Scale tuna Fishery

TUNA CATCH BY INDONESIA
EFFORTS TAKING BY INDONESIA TO COMPLY WITH RFMOs CMM
Questions to be Addressed

ANNUAL CATCH ESTIMATE
• Obligatory and Binding measures (CMM/Resolutions): Estimates of catches during each calender year shall be provided to the comission for each gear type
– WCPFC : Annual catch estimate Workshop Mid June for INDONESIA DGCF Report formally before 1st July every year (Part 1 and Part 2 report)
– IOTC : Catch estimate by DGCF Report to IOTC June (Part) November (Full)
– CCSBT : CDS , DGCF report to CCSBT April /year

Indonesian Tuna Data ANNUAL CATCH
ESTIMATES -- (WCPFC Area)
Longline
0
5,000
10,000
15,000
20,000
25,000
19
78
19
79
19
80
19
81
19
82
19
83
19
84
19
85
19
86
19
87
19
88
19
89
19
90
19
91
19
92
19
93
19
94
19
95
19
96
19
97
19
98
19
99
20
00
20
01
20
02
20
03
20
04
20
05
20
06
20
07
20
08
20
09
20
10
Bigeye
Yellowfin
0
50,000
100,000
150,000
200,000
250,000
1980
1981
1982
1983
1984
1985
1986
1987
1988
1989
1990
1991
1992
1993
1994
1995
1996
1997
1998
1999
2000
2001
2002
2003
2004
2005
2006
2007
2008
2009
2010
Skipjack
Bigeye
Yellowfin
Purse seine
0
20,000
40,000
60,000
80,000
100,000
120,000
19
80
19
81
19
82
19
83
19
84
19
85
19
86
19
87
19
88
19
89
19
90
19
91
19
92
19
93
19
94
19
95
19
96
19
97
19
98
19
99
20
00
20
01
20
02
20
03
20
04
20
05
20
06
20
07
20
08
20
09
20
10
Skipjack
Bigeye
Yellowfin
Pole-and-line (Huhate)

Skipjack % Yellowfin % Bigeye % Total tuna
2000 84,537 79.8% 17,842 16.8% 3,599 3.4% 105,978
2001 77,790 79.8% 16,418 16.8% 3,311 3.4% 97,520
2002 74,769 79.8% 15,781 16.8% 3,183 3.4% 93,733
2003 76,269 79.8% 16,097 16.8% 3,247 3.4% 95,613
2004 100,418 79.8% 21,194 16.8% 4,275 3.4% 125,886
2005 54,081 73.1% 16,025 21.7% 3,911 5.3% 74,017
2006 72,746 80.6% 13,240 14.7% 4,288 4.7% 90,273
2007 90,514 81.0% 17,197 15.4% 4,032 3.6% 111,743
2008 94,262 82.5% 14,210 12.4% 5,743 5.0% 114,215
2009 110,574 87.0% 12,710 10.0% 3,813 3.0% 127,097
2010 105,280 87.0% 12,101 10.0% 3,630 3.0% 121,012
2011 97,057 77.0% 25,210 20.0% 3,781 3.0% 126,048
2012 65,358 68.8% 29,354 30.9% 285 0.3% 94,997
2013 68,971 80.9% 14,039 16.5% 2,209 2.6% 85,219
2014 72,393 79.2% 16,975 18.6% 1,996 2.2% 91,364
2015 69,978 67.1% 30,155 28.9% 4,179 4.0% 104,312
2016 77,497 80.0% 16,719 17.3% 2,608 2.7% 96,824
Fishing port 0 78.4% 0 14.6% 0 7.0%
Non fishing port 63,924 79.6% 14,563 18.1% 1,837 2.3% 80,324
Average 2005-2007 72,447 78.7% 15,487 16.8% 4,077 4.4% 92,011
POLE-AND-LINE (FMAs 713, 714 and 715)
YearEstimated Tuna Catch (metric tonnes)
TABLE CATCH ESTIMATE TUNA BY GEAR BY SPECIES 2000-2016
Source National Report AR Part 1 (Indonesia to WCPFC) year 2017

2016*) estimates from DGCF Statistics (in metric ton) FMAs Skipjack % Yellowfin % Bigeye % Albacore Total
Tuna
FMAs 713,714,715
239.039 65% 103.291 28% 23.514 6% - 366.191
FMAs 716, 717 97.416 61% 56.801 36% 4.830 3% - 159.047
FAO Area 71 336.455 64% 160.092 31% 28.343 5% - 525.238
Total tuna catch (Skipjack, Yellowfin, Bigeye) for all gear within FMA 713, 714, 715 ; and FMA 716, 717 and FAO area 71
estimated for INDONESIA Cath in 2016
Note: Detail Annual catch estimates by gear by species by FMAs is annually conducted with WPCPFC.
Source National Report AR Part 1 (Indonesia to WCPFC) year 2017
40 seats at the table: –26 Members, 7 Participating
Territories and 7 cooperating
non member Countries
55% of the worlds tuna catch: 2.7 m mt 80-85% of catches taken from EEZ’s Indonesia takes nearly 20% of WCPFC catch
Indonesia catch >60 % from its Archipelagic water

Year INDONESIA
YFT BET SKJ ALB
1997 50,631 35,485 51,392 3,799
1998 46,660 35,445 46,338 4,035
1999 53,121 40,219 48,266 4,388
2000 40,994 30,352 45,959 5,109
2001 39,797 31,119 44,695 5,623
2002 34,638 34,838 38,802 5,137
2003 30,780 21,387 40,388 8,278
2004 30,387 22,582 47,354 11,243
2005 31,405 23,707 60,866 9,285
2006 24,787 20,922 54,674 7,950
2007 29,835 28,426 68,987 9,367
2008 29,909 27,900 67,521 9,194
2009 26,735 24,677 78,851 14,570
2010 29,289 22,826 80,621 13,035
2011 33,550 28,089 83,627 11,474
2012 41,221 30,165 82,496 11,019
2013 45,901 31,213 92,662 6,100
2014 36,334 23,952 78,778 8,750
2015 36,789 22,689 76,697 7,301
2016 36,789 22,689 76,697 7,301
Total tuna catch (Skipjack, Yellowfin, Bigeye and albacore) for
all gear 143.476 (in Metric ton) 1997-2016
(IOTC)
Source National Report 2017(Indonesia to IOTC)
35 seats at the table: – 31 Members, 4
cooperating non Non-
Contracting Parties – Indonesia catch 18-23 %
of total catch of IOTC
– Some catches from
Arcipelagic waters

Year
CCSBT
INDONESIA Global TAC
1997 2,210 16,076
1998 1,324 17,777
1999 2,504 19,529
2000 1,203 15,475
2001 1,632 16,031
2002 1,701 15,258
2003 565 14,077
2004 633 13,505
2005 1,726 16,156
2006 598 11,747
2007 1,077 10,599
2008 926 11,395
2009 641 10,954
2010 636 9,743
2011 842 9,459
2012 910 10,292
2013 1,383 11,770
2014 1,063 11,909
2015 593 14,361
2016 601 14,445
Total tuna catch (SBT) in metric tonnes 1997-2016
(CCSBT)
Source National Report year 2017 (Indonesia to CCSBT)
9 seats at the table: – 8 Members, and 1 cooperating
non member Countries
TAC (2010-2016) range from 9.743 to 14.445 million mt
Indonesia takes nearly 4- 11 % of
CCSBT catches

EFFORTS TAKING BY INDONESIA TO COMPLY WITH RFMOs CMM
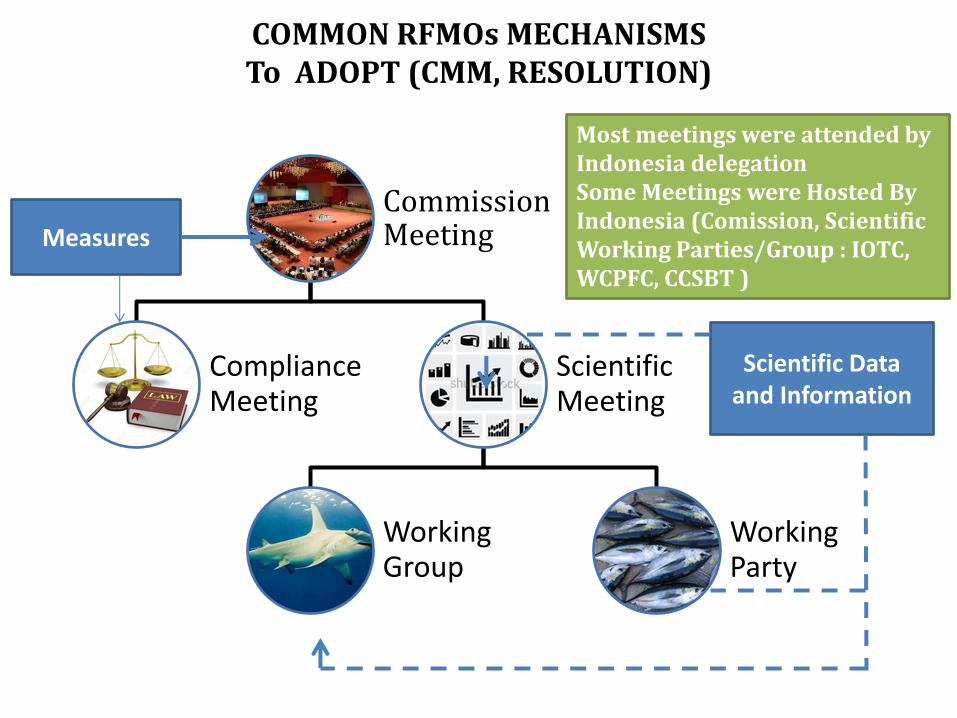
Commission Meeting
Compliance Meeting
Scientific Meeting
Working Group
Working Party
COMMON RFMOs MECHANISMS To ADOPT (CMM, RESOLUTION)
Scientific Data and Information
Measures
Most meetings were attended by Indonesia delegation Some Meetings were Hosted By Indonesia (Comission, Scientific Working Parties/Group : IOTC, WCPFC, CCSBT )

INDONESIA WCPFC Compliance
Assessment (Scientific Data to
be provided to WCPFC)
Data type 2015 2016
Annual Catch Estimate
LL II (65%) III
PS, PL, HL, TR. OT
II (96%) III
Agg. C & E data
LL, PS, PL I II (50%)
HL, TR, GN, OT
I III
Op. C & E data
LL, PS, PL I II (72%)
HL, TR, GN, OT
III III
Size data LL, PS, OT III III
Annual Catch
estimates workshop
YEAR GEAR(s)Annual Catch
estimates
Aggregate
CATCH/EFFORT
data
Operational
CATCH/EFFORT
data
SIZE dataOVERALL Science
Data
2013 LL, PS, PL, HL, TR, OT 30% 0% 0% 80% 28%
2014 LL, PS, PL, HL, TR, OT 80% 0% 0% 100% 45%
2015 LL, PS, PL, HL, TR, OT 80% 0% 0% 100% 45%
2016 LL, PS, PL, HL, TR, OT 100% 50% 72% 100% 81%
Significant improvements in data provisions !! 8 years !!
Source Peter Williams SPC
N = 3185
N = 5514
N = 6005
N = 1647
N = 5838
N = 3896
N = 2192
N = 4270
N = 1434
N = 2104
N = 2036
N = 1718
N = 1771
N = 2011
N = 2891
N = 2292
N = 846
N = 2658
N = 2783
N = 1553
N = 1298
N = 313
N = 3018
N = 2553
N = 2104
N = 1470
N = 1790
N = 1877
90 50 60 70 80
Weight (kg)
20 0 10 30 40
2017 - 1st Quarter
2016 - 1st Quarter
2nd Quarter
3rd Quarter
4th Quarter
2nd Quarter
3rd Quarter
4th Quarter
4th Quarter
4th Quarter
2015 - 1st Quarter
2nd Quarter
3rd Quarter
2012 - 1st Quarter
2011 - 1st Quarter
2nd Quarter
3rd Quarter
4th Quarter
3rd Quarter
3rd Quarter
4th Quarter
2014 - 1st Quarter
2nd Quarter
2nd Quarter
2nd Quarter
3rd Quarter
4th Quarter
2013 - 1st Quarter
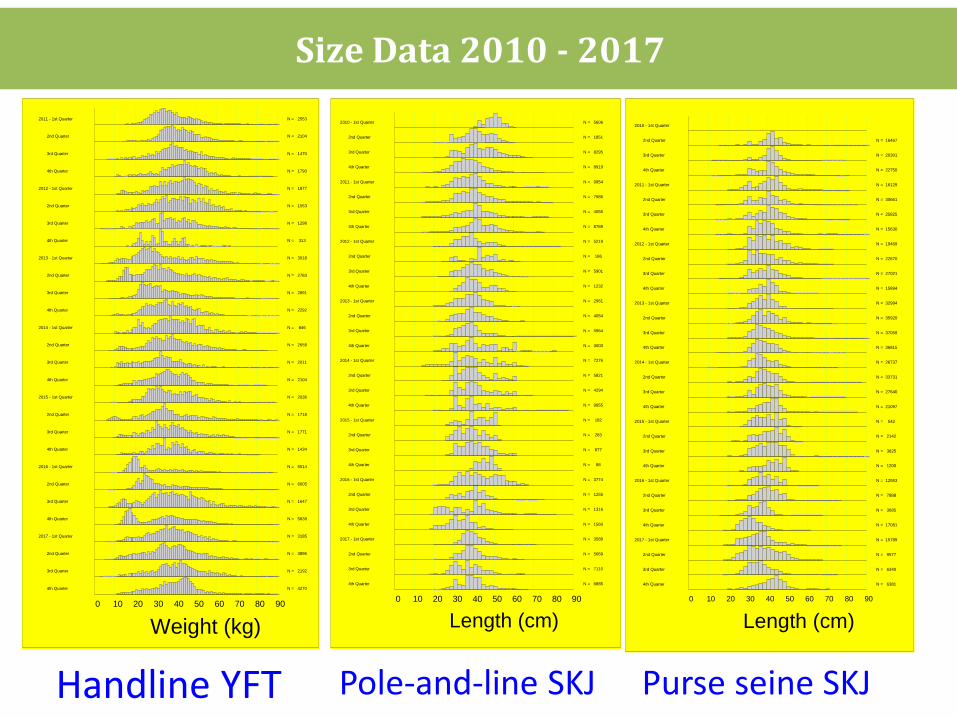
Handline YFT
N = 1560
N = 88
N = 3774
N = 1255
N = 1316
N = 3589
N = 5669
N = 7110
N = 6885
N = 877
N = 4294
N = 9955
N = 182
N = 283
N = 5901
N = 1232
N = 2961
N = 4054
N = 186
N = 7986
N = 4055
N = 8789
N = 5219
N = 5606
N = 1851
N = 8295
N = 8919
N = 9954
N = 5964
N = 3003
N = 7276
N = 5821
90 50 60 70 80
Length (cm)
40 0 10 20 30
2nd Quarter
2nd Quarter
3rd Quarter
4th Quarter
2017 - 1st Quarter
3rd Quarter
4th Quarter
2016 - 1st Quarter
2015 - 1st Quarter
2nd Quarter
3rd Quarter
4th Quarter
4th Quarter
4th Quarter
2014 - 1st Quarter
2nd Quarter
3rd Quarter
2nd Quarter
2nd Quarter
3rd Quarter
4th Quarter
2012 - 1st Quarter
3rd Quarter
3rd Quarter
4th Quarter
2013 - 1st Quarter
2nd Quarter
2011 - 1st Quarter
2010 - 1st Quarter
2nd Quarter
3rd Quarter
4th Quarter
Pole-and-line SKJ
N = 9577
N = 7888
N = 3685
N = 17081
N = 15789
N = 6340
N = 6381
N = 3825
N = 542
N = 2142
N = 1200
N = 12553
N = 27640
N = 21097
N = 26737
N = 35920
N = 37059
N = 36815
N = 33731
N = 32994
N = 22670
N = 27021
N = 15894
N = 16467
N = 20301
N = 22750
N = 30661
N = 25825
N = 15630
N = 19469
N = 16129
90 50 60 70 80
Length (cm)
40 0 10 20 30
2nd Quarter
2nd Quarter
3rd Quarter
4th Quarter
2017 - 1st Quarter
3rd Quarter
4th Quarter
2016 - 1st Quarter
2015 - 1st Quarter
2nd Quarter
3rd Quarter
4th Quarter
4th Quarter
4th Quarter
2014 - 1st Quarter
2nd Quarter
3rd Quarter
2011 - 1st Quarter
2010 - 1st Quarter
2nd Quarter
3rd Quarter
4th Quarter
3rd Quarter
3rd Quarter
4th Quarter
2013 - 1st Quarter
2nd Quarter
2nd Quarter
2nd Quarter
3rd Quarter
4th Quarter
2012 - 1st Quarter
Purse seine SKJ
Size Data 2010 - 2017

COMPLIANCE SUMMARY
ITEMS 2013 CMR
2014 CMR
2015 CMR
2016 CMR
2017 CMR
Total Measures for Assessment
62 128 110 119 121
Assessed measures for Indonesia
43 93 73 64 71
No Measures of non Compliance /Capacity Assistance need
21 46 33 19 8/1
Sea turtle interaction; reporting on shark fins; reporting of shark release; FAD ban option; PS catch limit; observer data on PS 100%; LL bigeye catch limit; monthly bigeye
catch report; fishing effort for other commercial fisheries; operational data (CPUE),
199/11

COMPLIANCE PERFORMANCE INDONESIA 2017 (IOTC)
REPORTING REQUIREMENTS
COMPLIANT PARTIALLY COMPLIANT NON COMPLIANT NOT APPLICABLE
47 10 6 21
IR CQ SC FL
Compliance Issues • Repeated (19)
• N/C : Catch and Effort from Coastal, Surface and Longline • N/C : Size Frequency from Coastal and Surface Fisheries • P/C : Nominal Catch Surface and Longline Fisheries not to IOTC
standard • P/C : C/E and Size Frequency on Sharks • P/C : Regional / National Observer Program
• Non Repeated • P/C : Response on Feedback Letter not complete
320

13 7
47 45
62 60
68 73
0
25
50
75
100
2010 2011 2012 2013 2014 2015 2016 2017
Year
COMPLIANCE RATE INDONESIA (IOTC)
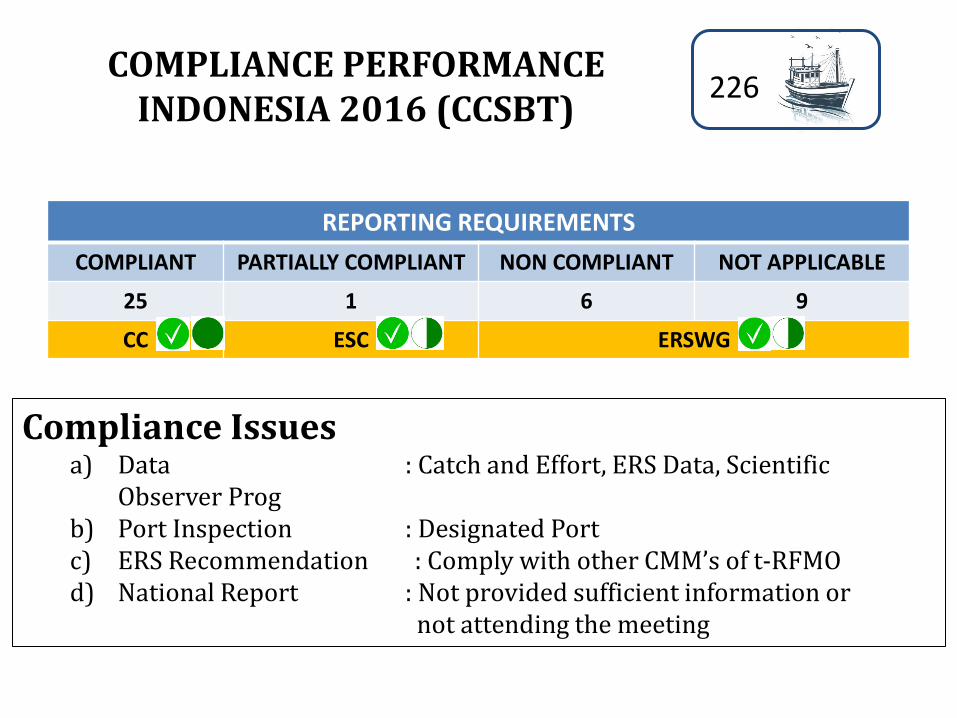
COMPLIANCE PERFORMANCE INDONESIA 2016 (CCSBT)
REPORTING REQUIREMENTS
COMPLIANT PARTIALLY COMPLIANT NON COMPLIANT NOT APPLICABLE
25 1 6 9
CC ESC ERSWG
Compliance Issues a) Data : Catch and Effort, ERS Data, Scientific
Observer Prog b) Port Inspection : Designated Port c) ERS Recommendation : Comply with other CMM’s of t-RFMO d) National Report : Not provided sufficient information or not attending the meeting
226

Various entity/body related to Indonesia Tuna Fishery (All Are Related)
Global tuna fisheries
sustainability
HIGHER LEVEL
OFFICER
Central Goverment
Higher Level Officer
Provincial Level
Scientist , Expert,
academics
NGOs
Fishing Asssociati
on
Regional Bodies, RFMOs,
Lead Institutions
For Tuna
Small scale Fishers
Fishing Industry
COLLABORATION
MONITORING
(DATA
COLLECTION)
REPORTING
REGULATING
ENFORCING Required to Strengthen

Ministerial Decree and Regulation ISSUE
Ministerial Decree of MAF 107/2015
Tuna, Skipjack and Neritic Tuna Fishery management Plan: a direction and guidance for central and regional government for tuna conservation & management implementation in Indonesia (Review every 5 years)
EAFM, Harvest Strategy, Apropriate Data Collection ssytem
Ministerial Reg. No. 30/2012 jo. 26/2013 jo. 26/2015
Regulate capture fisheries business, fishing license, Database Sharing System, and others: all catches shall be landed at port
Landed Catch at non ID Fishing Port
Ministerial Reg. No. 12/2012
Regulates vessel operating in EEZ & high seas
Observer Coverage
Ministerial Reg. No. 26/2014
Regulates FAD Deployment, FADs Register, marking and Monitoring
Other Ministerial Regulations, i.a:
VMS Installment Fishing Logbook Observer on board program Moratorium at Banda Sea (Conservation for
Tuna) Transshipment Prohibition and etc.
VMS reporting, Log book validation, observer Coverage, catch from small boat <5GT

Field to be strengthened
• Improvements of the tuna data collection and the vessel registration systems;
• The development of a harvest strategy for tropical tuna in archipelagic waters as well as for neritic tunas;
• The development and implementation of a Fish Aggregating Device (FAD) management plan;
• The development of electronic reporting systems; and revision of the regulations for tuna fishing activities on the high seas.

DATA COLLECTION LINK TO RFMOs
AGENCY Data to be provided
DGCF / SDI (statistics) (2011-2017) One Data (2018- ) PUSDATIN
Total oceanic tuna, billfish and shark species catch estimates by FMA and GEAR (covers 11 FMA)
CFR/RIMF/RITF E-BRPL (national stock Assessment)
Species and size composition by GEAR and YEAR, Operational Data: Size, Composition, Fishing ground (Marine Fisheries), All WPP, Independent Data ( Survey)
DGCF (other divisions), DG MCS.
Logbook and Observer data (used to cross-check estimates and species composition), VMS
Industry, NGOs (MDPI, TNC) – IFISH , IDAPAR
Tuna species catch estimates, species composition and related information
Supervised
Repor t
In Colaboration with: WCPFC-WPEA, ACIAR-CSIRO, IOTC, CCSBT

THANK YOU Expectation for continued improvements
Special thanks to all enumerators, observers, WCPFC_WPEA, IOTC, CCSBT,
CSIRO, ACIAR, OFCF, NGOs, Fishing Associatios, All Parties. Looking
forward for continued collaboration.