annual education results report 2014-2015 · is doing. for example’ the ‘doing it right at st....
TRANSCRIPT

AERR: 2014-2015 and THREE-YEAR EDUCATION PLAN 2015-2016 – 2017-2018 Page 1
ANNUAL EDUCATION RESULTS REPORT 2014-2015 and
SCHOOL EDUCATION PLAN (2015-2016 – 2017-2018)
St. James School
Alberta Education requires all schools to maintain an education plan that reflects and aligns with the district’s 3 Year Plan. These plans are cyclical and fluid and are to be considered “living documents”.
The Annual Education Results Reports (AERR) is the evaluation for all the goals and outcomes identified in the school plan. It is in the AERR that schools report their assessment of progress as it relates to the school’s past performance and achievement of targets. The AERR appears first followed by the 3 Year Plan to reflect the cyclical planning process. There should be a strong connection between the AERR and the School Education Plan.
The School Education Plans are to reflect the adjustment of strategies and targets for each year.
Target setting means establishing outcomes that arise from the analysis of current measures and performance at the school and district level and are expressed qualitatively.
Outcomes are measurable statements of what you seek to achieve. In broad terms, they answer the question, “What will this look like when we get to where we want to be?”
Some guiding questions are:
How is every student being empowered to become an engaged thinker and an ethical citizen with an entrepreneurial spirit?
How can the school build on what is currently being done to empower every student to be an engaged thinker and an ethical citizen with an entrepreneurial spirit? What needs to be done more? What needs to be done less?
Have strategies been developed to address the academic theme “Success for all students” with the focus on assessment, academic excellence, student wellness (mental health/resiliency) and technology integration?
Have strategies been developed to address the faith theme “Walk humbly with God” and with the focus on faith formation and advocacy?
Have strategies been developed to address any issues or concerns as indicated on the Accountability Pillar report?
Will the identified strategies meet the targets in a systematic and timely manner?
What learnings can be included based on the 2015-16 district focus books:
Lead with Humility – Jeffrey A. Krames
Shepherd Leadership – Blaine McCormack and David Davenport
Well Aware: Developing Resilient, Active and Flourishing Students – Patrick Carney

AERR: 2014-2015 and THREE-YEAR EDUCATION PLAN 2015-2016 – 2017-2018 Page 2
THE SCHOOL’S VISION/MISSION STATEMENT
In the spirit of Catholicity, we at St. James School provide quality education for the whole person in a positive, secure learning environment. As part of a broader community, we believe in modeling the teachings of Christ, creating and fostering a safe, healthy and caring learning environment, encouraging individuals to take risks, experience growth and celebrate. While doing so, we recognize the unique and diverse qualities of each individual. In short: ‘St. James – Learn, Love and Lead Together’
SCHOOL COUNCIL INVOLVEMENT
The School Council was given opportunity to review the school plan and give feedback and advice at the monthly November meeting. School plans will also be posted on our website and parents will be encouraged to offer suggestions about the school and its future.

AERR: 2014-2015 and THREE-YEAR EDUCATION PLAN 2015-2016 – 2017-2018 Page 3
ANNUAL EDUCATION RESULTS REPORT 2014-2015
DISTRICT VISION STATEMENT: FAITH
Our Catholic schools demonstrate their constitutional right to provide and support the development, permeation, and modeling of our faith.
LOCAL GOAL ONE: Enhance and Support Catholicity within the District
ANNUAL EDUCATION RESULTS REPORTING for:
LOCAL OUTCOME 1.1: The school district models the social teachings of the Catholic church
by promoting justice.
Performance Measure For AERR Number of projects
Total number of service acts as indicated within the context of the Catholic Community of Caring survey.
(Write in the number of projects reported to Bonnie Landry.)
Comment on Results for Local Outcome 1.1 (The school district models the social teachings of the Catholic church by promoting justice.)
(Contextual information, factors affecting results, analysis of results). Include service learning projects, their success, and how they promoted justice, etc.)
Our goal is to ‘Walk Humbly With God’. We will continue to deliver sandwiches to the Drop-in Centre, through St. James Church. As well, as in past years our Grade 9 Global Leadership students completed various projects related to doing justice, including those related to The Centre for Affordable Water and Sanitation, and they were in charge of running part of the Mayor’s Expo. St. James also collected for the Food Bank and Jacket Racket. We also had a junior high Leadership option class which empowered students to become active global citizens as viewed from a Catholic perspective, and our junior high Student Council continued to promote a positive school culture. We also had many students involved in We Day, with the attendant social justice projects which that involves. The school participated in “Passit On”, where used clothing is gatherd, organized and distributed to those in need. We created a “Friendship Bench” where grade 5 and 6 students took the lead to develop games and encouraged students to welcoming new students to our school.
ANNUAL EDUCATION RESULTS REPORTING for:
LOCAL OUTCOME 1.2: The school district builds resiliency through the ongoing development
of the Catholic Community of Caring within the school climate and culture.
Performance Measure For AERR Results (in percentages)
Percentage of parents who agree and strongly agree with the following statement from the annual parent satisfaction survey:
Church teachings and Christian values are reinforced through the culture and climate of my child’s school.
2014 2015 Target
2016
School 87.0 93.0 95.0
District 93.9 93.4

AERR: 2014-2015 and THREE-YEAR EDUCATION PLAN 2015-2016 – 2017-2018 Page 4
Comment on Results for Local Outcome 1.2 (The school district builds resiliency through the ongoing development of the Catholic Community of Caring within the school climate and culture.)
(Contextual information, factors affecting results, analysis of results). Include Religion Education Achievement assessment results (Gr. 5, 8, 12) as applicable to your school; Catholic Community of Caring Plan; Tell Them From Me survey regarding how students face problems and life’s challenges; resiliency initiatives/projects, etc.)
The increase satisfaction in this area is reflective of increased communication about all the school is doing. For example’ The ‘Doing it Right at St. James’ initiative last year, as well as our Catholic Community of Caring initiatives - …. ‘Doing it Right at St. James’ involved Grade 9 students defining, in groups, what it means to be an ethical citizen at St. James School, and it will be based heavily on our district’s ‘Love Kindness’ religious theme. We’re hoping to continue to build student resilience through this project, by making each student feel valued and welcome at our school. We will continue to have our Bible study group meet a few times a month as well. We will offer our annual retreat to Junior High Students as well. We will continue the “Good News” a section about religious education in our newsletter. Monthly, father comes over from the church and does a Mass in the classroom. Our students did well on their Religion exams. 97.5% of our grade 5 students scored above AC in the Demonstration of Learning. Grade 8 students enjoyed similar success with all the students who wrote the exam scoring AC or better.
AERR: 2014-2015 and THREE-YEAR EDUCATION PLAN 2015-2016 – 2017-2018 Page 5
SCHOOL EDUCATION PLAN (2015-2016 – 2017-2018)
DISTRICT VISION STATEMENT: FAITH
Our Catholic schools demonstrate their constitutional right to provide and support the development, permeation, and modeling of our faith.
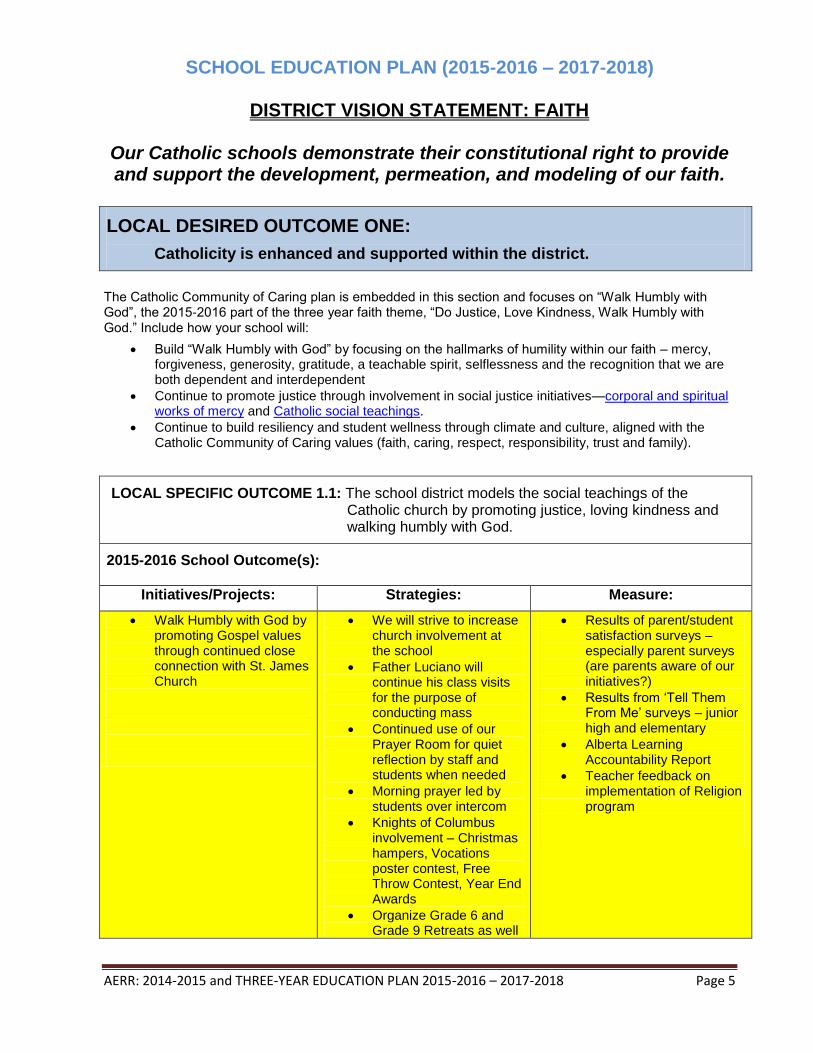
LOCAL DESIRED OUTCOME ONE:
Catholicity is enhanced and supported within the district.
The Catholic Community of Caring plan is embedded in this section and focuses on “Walk Humbly with God”, the 2015-2016 part of the three year faith theme, “Do Justice, Love Kindness, Walk Humbly with God.” Include how your school will:
Build “Walk Humbly with God” by focusing on the hallmarks of humility within our faith – mercy, forgiveness, generosity, gratitude, a teachable spirit, selflessness and the recognition that we are both dependent and interdependent
Continue to promote justice through involvement in social justice initiatives—corporal and spiritual works of mercy and Catholic social teachings.
Continue to build resiliency and student wellness through climate and culture, aligned with the Catholic Community of Caring values (faith, caring, respect, responsibility, trust and family).
LOCAL SPECIFIC OUTCOME 1.1: The school district models the social teachings of the Catholic church by promoting justice, loving kindness and walking humbly with God.
2015-2016 School Outcome(s):
Initiatives/Projects: Strategies: Measure:
Walk Humbly with God by promoting Gospel values through continued close connection with St. James Church
We will strive to increase church involvement at the school
Father Luciano will continue his class visits for the purpose of conducting mass
Continued use of our Prayer Room for quiet reflection by staff and students when needed
Morning prayer led by students over intercom
Knights of Columbus involvement – Christmas hampers, Vocations poster contest, Free Throw Contest, Year End Awards
Organize Grade 6 and Grade 9 Retreats as well
Results of parent/student satisfaction surveys – especially parent surveys (are parents aware of our initiatives?)
Results from ‘Tell Them From Me’ surveys – junior high and elementary
Alberta Learning Accountability Report
Teacher feedback on implementation of Religion program

AERR: 2014-2015 and THREE-YEAR EDUCATION PLAN 2015-2016 – 2017-2018 Page 6
as Grade 9 Farewell Mass
Coordination of charity work between school and church – especially sandwich making for the Calgary Drop-in Centre and Christmas hampers
Gather as a faith community for Liturgies, welcoming families.
LOCAL SPECIFIC OUTCOME 1.2: The school district builds student wellness through the ongoing development of the Catholic Community of Caring within the school climate and culture.
2015-2016 School Outcome(s):
Initiatives/Projects: Strategies: Measure:
Build ‘Loving Kindness’ through Catholic Community of Caring and other school Initiatives
Catholic Community of Caring Initiatives – Peers Running Organized Play Stations (PROPS) in October; Christmas cards prepared by all students and delivered to community; Loving Kindness to be theme throughout year – possible ideas include Virtues to be read over PA, use of district ‘Resiliency’ book as a resource, focus on Respect
We will continue the “Kindness Calendar” during Lent
Introduce the “Friendship bench” where lonely students can go at noon hours and recess to help create new friendships.
‘Be” at St. James initiative to continue.
Continue to reference ‘THINK Before You Speak’
Have classes visit St. James Church in order to make sandwiches for the Calgary Drop-In Centre,
Results of parent/student satisfaction surveys – especially parent surveys (are parents aware of our initiatives?)
Results from ‘Tell Them From Me’ surveys – junior high and elementary
Alberta Learning Accountability Report
Teacher feedback on implementation of Religion program

AERR: 2014-2015 and THREE-YEAR EDUCATION PLAN 2015-2016 – 2017-2018 Page 7
using food supplied by staff
Participate in CCSD’s ‘Pass it On’ clothing drive
(Have higher grade students connect with and befriend high needs students at lunch recess)
Bible Study group to continue
Continued ‘Linkages’ visits by junior high students to the senior citizens at Staywell Manor
Support families in our school who are in need – eg. Fire Fighters charity, Jacket Racket, Brown Bag Program, The Magic of Christmas program
S4 program will continue
AERR: 2014-2015 and THREE-YEAR EDUCATION PLAN 2015-2016 – 2017-2018 Page 8
ANNUAL EDUCATION RESULTS REPORT 2014-2015
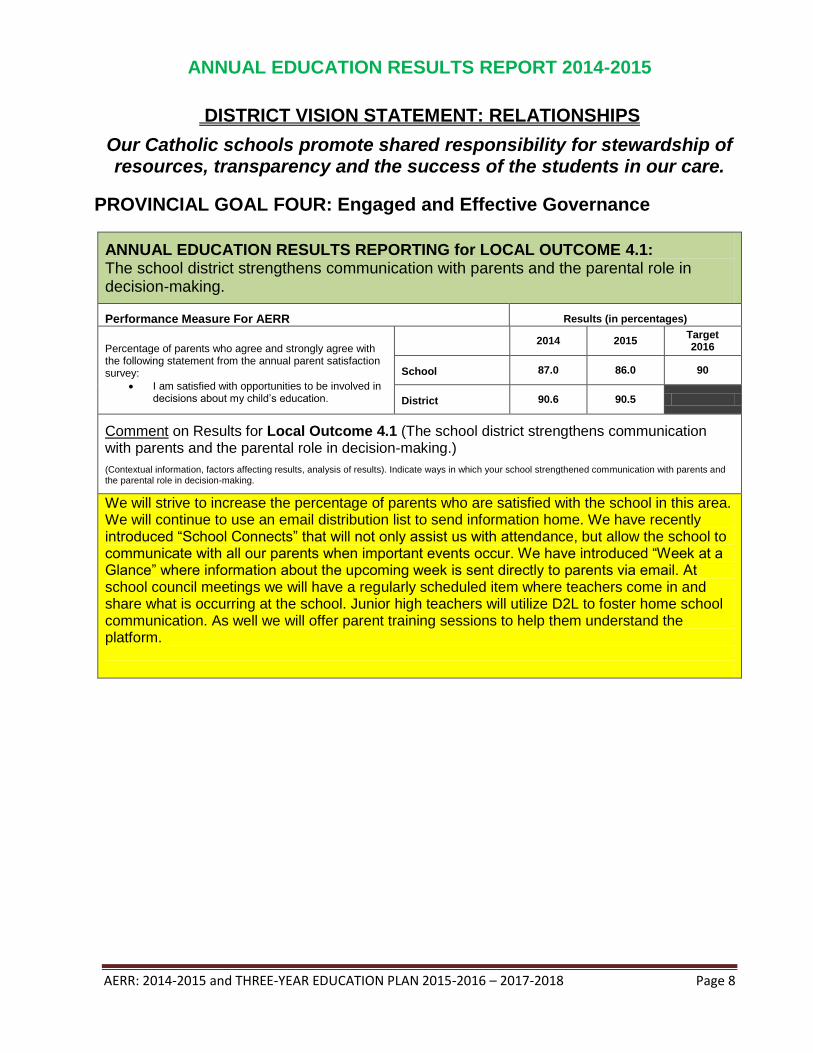
DISTRICT VISION STATEMENT: RELATIONSHIPS
Our Catholic schools promote shared responsibility for stewardship of resources, transparency and the success of the students in our care.
PROVINCIAL GOAL FOUR: Engaged and Effective Governance
ANNUAL EDUCATION RESULTS REPORTING for LOCAL OUTCOME 4.1: The school district strengthens communication with parents and the parental role in decision-making.
Performance Measure For AERR Results (in percentages)
Percentage of parents who agree and strongly agree with the following statement from the annual parent satisfaction survey:
I am satisfied with opportunities to be involved in decisions about my child’s education.
2014 2015 Target 2016
School 87.0 86.0 90
District 90.6 90.5
Comment on Results for Local Outcome 4.1 (The school district strengthens communication with parents and the parental role in decision-making.)
(Contextual information, factors affecting results, analysis of results). Indicate ways in which your school strengthened communication with parents and the parental role in decision-making.
We will strive to increase the percentage of parents who are satisfied with the school in this area. We will continue to use an email distribution list to send information home. We have recently introduced “School Connects” that will not only assist us with attendance, but allow the school to communicate with all our parents when important events occur. We have introduced “Week at a Glance” where information about the upcoming week is sent directly to parents via email. At school council meetings we will have a regularly scheduled item where teachers come in and share what is occurring at the school. Junior high teachers will utilize D2L to foster home school communication. As well we will offer parent training sessions to help them understand the platform.

AERR: 2014-2015 and THREE-YEAR EDUCATION PLAN 2015-2016 – 2017-2018 Page 9
ANNUAL EDUCATION RESULTS REPORTING for PROVINCIAL OUTCOME 4.1: The education system demonstrates collaboration and engagement.
REQUIRED PROVINCIAL PERFORMANCE MEASURES AND DATA
Overall teacher and parent satisfaction with parental involvement in decisions about their child’s education. (Required Provincial Accountability Measure)
CURRENT MEASURES: Parental Involvement
3 Year Plan
Current Result 2015 (%)
Prev Year
Result (%)
Prev 3-yr.
Average (%)
Measure Evaluation
Achievement Improvement Overall
School 83.9 85.7 86.9 Very High Maintained Excellent
CCSD 79.6 80.1 80.2 High Maintained Good
Province 80.7 80.6 80.2 High Improved Significantly Good
Performance Measure For AERR Results (in percentages) Target
Percentage of teachers and parent satisfaction with parental involvement in decisions about their child's education.
Overall (required) 2011 2012 2013 2014 2015 2016
School 89.9 83.5 93.3 83.9 85.7 90.0
CCSD 79.7 80.1 80.5 80.1 79.6 80.7
Province 79.9 79.7 80.3 80.6 80.7
* Data provided by Alberta Education October 2015.
Overall teacher, parent and student satisfaction with the overall quality of basic education. (Required
Provincial Accountability Measure)
CURRENT MEASURES: Education Quality
3 Year Plan
Current Result 2015 (%)
Prev Year
Result (%)
Prev 3-yr.
Average (%)
Measure Evaluation
Achievement Improvement Overall
School 93.3 91.4 92.8 Very High Maintained Excellent
CCSD 89.2 89.8 89.4 High Maintained Good
Province 89.5 89.2 89.5 High Maintained Good
Performance Measure For AERR Results (in percentages) Target
Percentage of teachers, parents and students satisfied with the overall quality of basic education.
Overall (required) 2011 2012 2013 2014 2015 2016
School 92.9 94.2 92.7 91.4 93.3 93
CCSD 89.4 89.2 89.3 89.8 89.2 89.5
Province 89.4 89.4 89.8 89.2 89.5
* Data provided by Alberta Education October 2015.

AERR: 2014-2015 and THREE-YEAR EDUCATION PLAN 2015-2016 – 2017-2018 Page 10
Comment on Results for Provincial Outcome 4.1 (The education system demonstrates collaboration and engagement.)
(Contextual information, factors affecting performance, analysis of results). Indicate whether the target was achieved, factors that influenced the results, actions taken to improve results to date and in the future. If results on Accountability Pillar measures have an improvement evaluation of “Improved” or “Improved significantly,” identify the strategies or actions taken by the authority (or schools) that may have contributed to this improvement.
St. James School has done very well in this area. We continue to strive to create a program that meets the needs of a diverse group of students. We will work very hard to maintain, if not improve communication between home and school.

AERR: 2014-2015 and THREE-YEAR EDUCATION PLAN 2015-2016 – 2017-2018 Page 11
ANNUAL EDUCATION RESULTS REPORTING for PROVINCIAL OUTCOME 4.2: Students and communities have access to safe and healthy learning environments.
REQUIRED PROVINCIAL PERFORMANCE MEASURES AND DATA
Overall teacher, parent, and student agreement that students are safe at school, are learning the importance of caring for others, learning respect for others, and are treated fairly at school. (Required Provincial Accountability Measure)
CURRENT MEASURES: Safe and Caring
3 Year Plan
Current Result 2015 (%)
Prev Year
Result (%)
Prev 3-yr.
Average (%)
Measure Evaluation
Achievement Improvement Overall
School 95.0 94.5 93.1 Very High Maintained Excellent
CCSD 89.1 89.8 89.3 Very High Maintained Excellent
Province 89.2 89.1 88.9 Very High Improved Significantly Excellent
Performance Measure For AERR Results (in percentages) Target
Percentage of teacher, parent and student agreement that students are safe at school, are learning the importance of caring for others, are learning respect for others and are treated fairly in school.
Overall (required) 2011 2012 2013 2014 2015 2016
School 90.8 90.5 94.3 94.5 95.0 95.0
CCSD 88.9 89.1 88.9 89.8 89.1 89.2
Province 88.1 88.6 89.0 89.1 89.2
* Data provided by Alberta Education October 2015.
Overall percentage of teachers, parents, and students indicating that their school and schools in
their jurisdiction have improved or stayed the same in the last three years. (Required Provincial Accountability Measure)
CURRENT MEASURES: School Improvement
3 Year Plan Current Result 2015 (%)
Prev Year
Result (%)
Prev 3-yr.
Average (%)
Measure Evaluation
Achievement Improvement Overall
School 86.6 82.0 81.9 Very High Improved Excellent
CCSD 79.1 79.4 79.5 High Maintained Good
Province 79.6 79.8 80.1 High Declined Significantly Issue
Performance Measure For AERR Results (in percentages) Target
Percentages of teachers, parents and students indicating that their school and schools in their jurisdiction have improved or stayed the same the last three years.
Overall (required) 2011 2012 2013 2014 2015 2016
School 83.7 81.8 81.7 82.0 86.6 90.0
CCSD 80.3 80.3 78.7 79.4 79.1 79.6
Province 80.1 80.0 80.6 79.8 79.6
* Data provided by Alberta Education October 2015.

AERR: 2014-2015 and THREE-YEAR EDUCATION PLAN 2015-2016 – 2017-2018 Page 12
Comment on Results for Provincial Outcome 4.2 (Students and communities have access to safe and healthy learning environments.)
(Contextual information, factors affecting performance, analysis of results). Indicate whether the target was achieved, factors that influenced the results, actions taken to improve results to date and in the future. If results on Accountability Pillar measures have an improvement evaluation of “Improved” or “Improved significantly,” identify the strategies or actions taken by the authority (or schools) that may have contributed to this improvement.
St. James has very high results in this area. We will strive to meet the needs of all our students and to maintain a safe and healthy learning environment. All volunteers will take the volunteer orientation this year in accordance with district guidelines.

AERR: 2014-2015 and THREE-YEAR EDUCATION PLAN 2015-2016 – 2017-2018 Page 13
SCHOOL EDUCATION PLAN (2015-2016 – 2017-2018)
DISTRICT VISION STATEMENT: RELATIONSHIPS
Our Catholic schools promote shared responsibility for stewardship of resources, transparency and the success of the students in our care.
PROVINCIAL DESIRED OUTCOME THREE: Alberta’s education system is governed effectively.
LOCAL SPECIFIC OUTCOME 3.1: The school district strengthens communication with parents and the parental role in decision making.
2015-2016 School Outcome(s):
Initiatives/Projects: Strategies: Measure:
Increase Home/School communication within junior high
Increase Home/School communication within elementary
Send home postcards in August welcoming students to their assigned classes
Make continuously better use of D2L
Remind parents of the information they can and should be receiving through D2L
Offer a parent training session on the use of D2L in October and during parent-teacher interviews
Invite junior high teachers to openly share their use of D2L with each other, so that all may grow together
Administration to monitor growth of D2L use
Send home postcards in August welcoming students to their assigned classes
Teachers to be even more pro-active in notifying parents of issues which could have a potentially negative effect on student learning
Teachers to be even more pro-active in celebrating successes (academic, social or otherwise) with parents
Some teachers to experiment with class newsletters and
Results of parent/student/teacher satisfaction surveys
Results from ‘Tell Them From Me’ junior high survey
Survey of junior high staff to discover/discuss comfort and confidence level with D2L
Discussions between TMT and administration
Results of parent/student/teacher satisfaction surveys
Results from ‘Tell Them From Me’ elementary survey
Success stories from teachers using newsletters
Informal conversations between parents and admin – are we addressing issues more promptly?

AERR: 2014-2015 and THREE-YEAR EDUCATION PLAN 2015-2016 – 2017-2018 Page 14
Increase parent awareness
in the school’s recognition that parents are the primary educators of their children
share their experiences with rest of staff
Make note in school newsletter, through emails and on Twitter
Include when addressing parents in large group situations
Results of parent/student satisfaction surveys – especially parent surveys
PROVINCIAL SPECIFIC OUTCOME 3.1: The education system demonstrates collaboration and engagement.
2015-2016 School Outcome(s):
Initiatives/Projects: Strategies: Measure:
Students collaborate between grades
Students collaborate within grade
Collaboration between school and community
‘Be at St. James’ initiative
Buddy activities during key liturgical times of the year
Increased opportunity for students to work within pair and small group situations
Shared best practice among staff with reference to above
Increased opportunity for students to contribute to what they will learn and how they will be assessed
Partnership with Marda Loop Alberta Treasury Branch – Junior ATB - students given opportunity to ‘run a bank’ within the school, and to learn about saving
Linkages program run with Staywell Manor
Participation in We Day, and development of projects which stem from that experience
St. James Church and St. James School - entire school year making sandwiches for the Calgary Drop In Centre.
Continue to have student engagement be a focus of
Results of parent/student/teacher satisfaction surveys
Results from ‘Tell Them From Me’ junior high survey
Observations from classroom visits – is learning collaborative? Are students engaged?

AERR: 2014-2015 and THREE-YEAR EDUCATION PLAN 2015-2016 – 2017-2018 Page 15
Increase student engagement
staff meetings and Professional Development Day sessions
Shared best practice among staff – what is working? How do we engage all learners
Increase use of technology and Bring Your Own Device in the classroom
Survey students on what works best to engage them in their learning – informal discussions and ‘Tell Them From Me’ surveys in Divisions II and III
PROVINCIAL SPECIFIC OUTCOME 3.2: Students and communities have access to safe and healthy learning environments.
2015-2016 School Goal(s):
Initiatives/Projects: Strategies: Measure:
Safe and Caring School
Healthy Choices
Catholic Community of Caring initiatives as listed above
Everactive Schools initiatives
School Safety Patrols
Volunteer orientation
Continuation of Healthy Choices offered by our canteen
Continuation of Daily Physical Activities
Intramural sports extended from elementary to junior high students
Teach students activities utilizing the lines for more games painted on re-surfaced tarmac(part of PROPS)
Playground enhanced with new equipment for even greater student participation
Results of parent/student/teacher satisfaction surveys
Results from ‘Tell Them From Me’ elementary and junior high surveys
Tally of intramural activities offered
Tally of DPA activities included in teacher’s delivery of program

AERR: 2014-2015 and THREE-YEAR EDUCATION PLAN 2015-2016 – 2017-2018 Page 16
ANNUAL EDUCATION RESULTS REPORT 2014-2015
DISTRICT VISION STATEMENT: EXCELLENCE IN TEACHING AND LEARNING
Our Catholic schools develop students who reflect the image of God and are successful contributors to a global society.
PROVINCIAL GOAL ONE: An Excellent Start to Learning
ANNUAL EDUCATION RESULTS REPORTING for:
LOCAL OUTCOME 1.2: Children demonstrate learning outcomes within the Kindergarten Program Statement.
Comment on Results for Provincial Outcome 1.2 (Children demonstrate learning outcomes within the Kindergarten Program Statement.) (Indicate Kindergarten completion rate; number of PUF and Mild/Moderate children receiving early intervention support and Welcome to Kindergarten/orientation involvement)
We continue to hold a Kindergarten Orientation each spring and it is always very well attended, and our parent/teacher meetings each fall are scheduled before students attend their first class. We will continue to base our kindergarten program on an inquiry learning model, centered on strength based and play learning. Our kindergarten students have, on the whole, entered grade one well equipped to handle the first stages of the division I program. In collaboration with Renfrew Services, we will continue to provide an in-class center model with services provided in the classroom setting. Collaborative work between the school and Renfrew Services through the inclusive centers model allows for collaboration between the therapist and the teacher to ensure appropriate referrals based on educational impact and student need.

AERR: 2014-2015 and THREE-YEAR EDUCATION PLAN 2015-2016 – 2017-2018 Page 17
PROVINCIAL GOAL TWO: Success for Every Student
ANNUAL EDUCATION RESULTS REPORTING for PROVINCIAL OUTCOME 2.1:
Students achieve student learning outcomes. (High School only and those schools with Drop Out Rate data)
REQUIRED PROVINCIAL PERFORMANCE MEASURES AND DATA Annual drop out rate of students aged 14 to 18. (Required Provincial Accountability Measure)
CURRENT MEASURES: Drop Out Rate
3 Year Plan
Current Result 2014 (%)
Prev Year
Result (%)
Prev 3-yr.
Average (%)
Measure Evaluation
Achievement Improvement Overall
School 0.0 6.3 2.7 Very High Maintained Excellent
CCSD 1.8 1.6 1.5 Very High Declined Good
Province 3.4 3.3 3.3 High Declined Acceptable
The annual drop out rate is the percentage of students aged 14-18 in a given school year who leave the school system without having met the requirements for high school completion and who are not in the education system, including post-secondary and apprenticeship programs in the subsequent school year.
Performance Measure For AERR Results (in percentages) Target
Drop Out Rate - annual dropout rate of students aged 14 to 18.
Overall (required) 2010 2011 2012 2013 2014 2015
School 1.5 1.9 0.0 6.3 0.0 0.0
CCSD 2.3 1.5 1.5 1.6 1.8
Province 4.2 3.2 3.5 3.3 3.4
* Data provided by Alberta Education October 2015. (2015 results will be available May 2016.)
Comment on Results for Provincial Outcome 2.1: Students achieve student learning outcomes.) (Contextual information, factors affecting performance, analysis of results). Indicate whether the target was achieved, factors that influenced the results, actions taken to improve results to date and in the future. If results on Accountability Pillar measures have an improvement evaluation of “Improved” or “Improved significantly,” identify the strategies or actions taken by the authority (or schools) that may have contributed to this improvement.
St. James performs extremely well in this area.

AERR: 2014-2015 and THREE-YEAR EDUCATION PLAN 2015-2016 – 2017-2018 Page 18
ANNUAL EDUCATION RESULTS REPORTING for PROVINCIAL OUTCOME 2.2:
Students demonstrate proficiency in literacy and numeracy.
Overall percentage of students in grades 6 and 9 who achieved the Acceptable Standard and overall percentage of students who achieved the Standard of Excellence on Provincial Achievement Tests (overall cohort* results). (Required Provincial Accountability Measure)
Student Learning Achievement (K-9)
(Percentage) October 2015 Evaluation
Current Measures Current Result
Prev Year
Result
Prev. 3-yr
Average Achievement Improvement Overall
Overall percentage of students in Grades 6 and 9 who achieved the Acceptable Standard on
Provincial Achievement Tests (School).
72.3 72.5 71.3 Intermediate Maintained Acceptabl
e
Overall percentage of students in Grades 6 and 9 who achieved the Acceptable Standard on
Provincial Achievement Tests (District).
75.3 75.5 76.6 Intermediate Declined
Significantly Issue
Overall percentage of students in Grades 6 and 9 who achieved the Acceptable Standard on
Provincial Achievement Tests (Province).
73.0 73.1 73.9 Intermediate Declined
Significantly Issue
Overall percentage of students in Grades 6 and 9 who achieved the Standard of Excellence on
Provincial Achievement Tests (School).
18.9 21.0 22.4 Intermediate Maintained Acceptabl
e
Overall percentage of students in Grades 6 and 9 who achieved the Standard of Excellence on
Provincial Achievement Tests (District).
20.1 19.9 20.7 High Maintained Good
Overall percentage of students in Grades 6 and 9 who achieved the Standard of Excellence on
Provincial Achievement Tests (Province).
18.8 18.4 18.9 Intermediate Maintained Acceptable
“A” = Acceptable; “E” = Excellence – the percentages achieving the Acceptable Standard include the percentages achieving the Standard of Excellence. Alberta Education requires jurisdictions and schools to report results for Provincial Achievement Test data on the basis of the cohort group.
*This form of reporting accounts for all students enrolled at a grade level. For example, the number of students in the cohort is determined as the total of number of students who write, the number of students who are absent, and the number of students who are excused from writing by the Superintendent for valid reasons as determined by Alberta Education (because participation would be harmful to the student or the student could not respond to the test instrument). When the percentage of students meeting Standards is calculated, students who are absent or excused are considered to have not demonstrated the Acceptable Standard for a given achievement test as their achievement is not known.
Aggregated PAT results are based upon a weighted average of per cent meeting standards (Acceptable, Excellence). The weights are the number of students enrolled in each course. Courses included: English Language Arts (grades 6, 9, 9KAE), Français (grades 6 and 9), French Language Arts (grades 6 and 9), Mathematics (grades 6, 9, 9KAE), Science (grades 6, 9, 9KAE) and Social Studies (grades 6, 9, 9KAE)
Grade 9 Provincial Achievement Tests were substantially impacted by the flooding of June 2013 so caution should be used when interpreting trends over time for the province and district.

AERR: 2014-2015 and THREE-YEAR EDUCATION PLAN 2015-2016 – 2017-2018 Page 19
Provincial Achievement Tests
Percentage of students in grade 6 and 9 who achieved the Acceptable Standard and the percentage who achieved the Standard of Excellence on Provincial Achievement Tests. Results based on students who wrote the test (required by the district – see *note below).
PAT Results – By Number Writing 2015 2012-2014 Average
Acceptable Excellence Acceptable Excellence
Grade 6
(%) (%) (%) (%)
English Language Arts 6 School 96.8 22.6 91.8 17.9
CCSD 95.2 23.9 95.8 22.8
Prov. 91.4 21.5 90.9 19.0
French Language Arts 6 School
CCSD 87.7 14.3 93.6 21.9
Prov. 89.7 13.9 90.7 16.8
Mathematics 6 School 93.1 10.3 85.6 22.3
CCSD 87.2 17.4 87.7 20.8
Prov. 80.7 15.5 81.2 17.8
Science 6 School 93.3 33.6 85.6 22.3
CCSD 89.9 30.6 90.7 32.3
Prov. 84.6 28.1 85.0 29.0
Social Studies 6 School 89.7 13.8 82.5 27.9
CCSD 85.1 21.3 87.0 23.7
Prov. 77.7 20.1 80.0 20.4
PAT Results – By Number Writing 2015 2012-2014 Average
Acceptable Excellence Acceptable Excellence
Grade 9 (%) (%) (%) (%)
English Language Arts 9 School 97.3 16.9 97.1 21.8
CCSD 91.1 17.6 92.6 20.7
Prov. 85.5 16.3 86.9 17.4
French Language Arts 9 School
CCSD 87.8 10.0 88.5 11.5
Prov. 89.3 10.5 89.7 12.8
Mathematics 9 School 75.0 20.4 84.1 39.5
CCSD 78.9 22.4 79.3 21.4
Prov. 73.1 20.1 74.9 19.9
Science 9 School 97.2 36.1 92.0 18.8
CCSD 87.4 29.7 87.0 27.7
Prov. 82.4 25.4 81.9 24.0
Social Studies 9 School 82.4 35.3 84.5 45.0
CCSD 79.2 24.2 80.8 23.1
Prov. 73.5 22.4 75.1 21.7
* For all Achievement Tests, schools complete Analysis Packages to address specific strategies and goals based on results. The Analysis Packages provide opportunities for individual teachers and divisional groups to reflect on achievement data and set priorities for instruction.

AERR: 2014-2015 and THREE-YEAR EDUCATION PLAN 2015-2016 – 2017-2018 Page 20
Comment on Results for Provincial Outcome 2.2: Students demonstrate proficiency in literacy and numeracy. (Contextual information, factors affecting performance, analysis of results). Indicate whether the target was achieved, factors that influenced the results, actions taken to improve results to date and in the future. If results on Accountability Pillar measures have an improvement evaluation of “Improved” or “Improved significantly,” identify the strategies or actions taken by the authority (or schools) that may have contributed to this improvement.
The one area of concern is our math results. Last year the school implemented Jump Math and Mathletics, to assist teachers in implementing the math program. We will continue to use these programs. Please note that the results for those students who wrote the exam exceeded provincial averages in 14 out of 16 areas.

AERR: 2014-2015 and THREE-YEAR EDUCATION PLAN 2015-2016 – 2017-2018 Page 21
ANNUAL EDUCATION RESULTS REPORTING for PROVINCIAL OUTCOME 2.3: Students demonstrate citizenship and entrepreneurship.
REQUIRED PROVINCIAL PERFORMANCE MEASURES AND DATA Overall teacher, parent, and student agreement that students model the characteristics of active
citizenship. (Required Provincial Accountability Measure)
CURRENT MEASURES: Citizenship
3 Year Plan Current Result 2015 (%)
Prev Year
Result (%)
Prev 3-yr.
Average (%)
Measure Evaluation
Achievement Improvement Overall
School 91.7 90.2 88.7 Very High Maintained Excellent
CCSD 84.8 85.2 84.2 Very High Improved Excellent
Province 83.5 83.4 83.1 Very High Improved Significantly Excellent
Performance Measure For AERR
Results (in percentages) Target
Percentages of teachers, parents and students who are satisfied that students model the characteristics of active citizenship.
Overall (required) 2011 2012 2013 2014 2015 2016
School 83.4 86.0 90.0 90.2 91.7 90.0
CCSD 83.4 83.7 83.7 85.2 84.8
Province 81.9 82.5 83.4 83.4 83.5
* Data provided by Alberta Education October 2015.
Overall teacher and parent agreement that students are taught attitudes and behaviours that will make
them successful at work when they finish school. (Require d Provincial Accountability Measure)
CURRENT MEASURES: Work Preparation
3 Year Plan Current Result 2015 (%)
Prev Year
Result (%)
Prev 3-yr.
Average (%)
Measure Evaluation
Achievement Improvement Overall
School 91.8 74.0 83.0 Very High Improved Excellent
CCSD 78.5 79.5 78.1 High Maintained Good
Province 82.0 81.2 80.4 High Improved Significantly Good
Performance Measure For AERR Results (in percentages) Target
Percentages of teachers and parents who agree that students are taught attitudes and behaviors that will make them successful at work when they finish school.
Overall (required
) 2011 2012 2013 2014 2015 2016
School 80.7 86.1 88.9 74.5 91.8 90.0
CCSD 78.5 77.9 76.8 79.5 78.5 82.0
Province 80.1 79.7 80.3 81.2 82.0
* Data provided by Alberta Education October 2015.

AERR: 2014-2015 and THREE-YEAR EDUCATION PLAN 2015-2016 – 2017-2018 Page 22
Comment on Results for Provincial Outcome 2.3 (Students demonstrate citizenship and entrepreneurship.) (Contextual information, factors affecting performance, analysis of results). Indicate whether the target was achieved, factors that influenced the results, actions taken to improve results to date and in the future. If results on Accountability Pillar measures have an improvement evaluation of “Improved” or “Improved significantly,” identify the strategies or actions taken by the authority (or schools) that may have contributed to this improvement.
The results in this area have improved form the previous year, and are a result of new initiatives and an increased effort to let parents know what is occurring at the school (Global Leadership, We Day, Junior ATB and Junior Achievement). This year the school is implementing the new CTF (Career Technology Foundations) courses, as well as Financial Management and Enterprise and Innovation courses, with an eye to helping prepare students for careers in the future.
SCHOOL EDUCATION PLAN (2015-2016 – 2017-2018)
DISTRICT VISION STATEMENT: EXCELLENCE IN TEACHING AND LEARNING
Our Catholic schools develop students who reflect the image of God and are successful contributors to a global society.
PROVINCIAL DESIRED OUTCOME ONE: Every student is successful.
PROVINCIAL SPECIFIC OUTCOME 1.1: Students achieve student learning outcomes. (High School only)
PROVINCIAL SPECIFIC OUTCOME 1.2: Students demonstrate a strong foundation in literacy and numeracy.
2015-2016 School Outcome(s): To focus on literacy and numeracy as a means to achieve success for all students.
Initiatives/Projects: Strategies: Measure:
To increase reading comprehension and student engagement in reading throughout the grades
To increase student facility with writing – both narrative and informative, with an eye to improving use of conventions
Student Learning Profiles for
students K-6
Fountas & Pinnell –
Benchmark Assessment-
(assessment tool)
Fountas & Pinnell – Leveled
Literacy Intervention
(program)
Tell Them from Me Surveys
success of strategies listed in LSPs, ELL Benchmarks
grade 9 PAT results
Student Learner Profiles
Grade 3 and 6 Student Learning Assessment Results

AERR: 2014-2015 and THREE-YEAR EDUCATION PLAN 2015-2016 – 2017-2018 Page 23
DRA – Diagnostic Reading
Assessment – tool to assess
reading
Jerry Johns IRI to support
coded students
Students will have access to Literacy Place, PM Reading, Scholastic Books, Daily 5 and Personal Classroom Libraries, with the goal of increasing literacy levels
Scholastic Reading Program
– Literacy Place – K-3 and
Moving Up 4 and 5 (with 6 in
the works)
Weekly Library Exchange
and Storytime
USSR in the Jr High –
Uninterrupted Sustained
Silent Reading
Literacy Groups (based on
need) – Jr. High Day 6 PM,
Small pull-out groups in the
Elementary
Classrooms have Leveled
Libraries to support the
Leveled Literacy (F & P)
iPads, Chromebooks,
Laptops with programs to
support Diverse Learner
literacy (Premier Tools,
Lexia, etc.)
Parent Volunteers – Reading
with students
Home Reading Programs in
the classroom/Home read-
aloud program
Daily 5
Animated Literacy
Fun with Phonics
Word work (phonemes)/word
walls
Barbara Mariconda
strategies
ELL Benchmarks –
identification of ability levels
and strategies for success
Use SMART technology,
laptops, LCD projectors and
student personal devices to
increase literacy engagement

AERR: 2014-2015 and THREE-YEAR EDUCATION PLAN 2015-2016 – 2017-2018 Page 24
To increase students’ facility with basic math skills, and overall math results
Reading Comprehension
Junior High Option Class
Use of Jump Math program in grades 1-6
Mathletics – Transitions, Diverse Learners, Math 5 to 9
Professional Development in this program throughout the year
Share best practices and results with entire teaching staff

AERR: 2014-2015 and THREE-YEAR EDUCATION PLAN 2015-2016 – 2017-2018 Page 25
ANNUAL EDUCATION RESULTS REPORT 2014-2015
PROVINCIAL GOAL THREE: Quality Teaching and School Leadership
ANNUAL EDUCATION RESULTS REPORTING for PROVINCIAL OUTCOME 3.1:
Teacher preparation and professional growth focus on the competencies needed to help students learn. Effective learning and teaching is achieved through collaborative leadership.
Overall teacher, parent and student satisfaction with the opportunity for students to receive a broad program of studies, including fine arts, career, technology, health and physical education. (Required Provincial Accountability Measure)
CURRENT MEASURES: Program of Studies
3 Year Plan Current Result 2015 (%)
Prev Year
Result (%)
Prev 3-yr.
Average (%)
Measure Evaluation
Achievement Improvement Overall
School 84.9 86.6 85.5 Very High Maintained Excellent
CCSD 82.8 83.8 82.8 Very High Maintained Excellent
Province 81.3 81.3 81.2 High Maintained Good
Performance Measure For AERR Results (in percentages) Target
Percentages of teachers, parents and students satisfied with the opportunity for students to receive a broad program of studies including fine arts, career, technology, and health and physical education.
Overall (required) 2011 2012 2013 2014 2015 2016
School 85.1 82.7 87.3 86.6 84.9 85.0
CCSD 82.3 82.1 82.5 83.8 82.8
Province 80.9 80.7 81.5 81.3 81.3
* Data provided by Alberta Education October 2015.
Comment on Results for Provincial Outcome 3.1 (Teacher preparation and professional growth focus on the competencies needed to help students learn. Effective learning and teaching is achieved through collaborative leadership.) (Contextual information, factors affecting performance,
analysis of results). Indicate whether the target was achieved, factors that influenced the results, actions taken to improve results to date and in the future. If results on Accountability Pillar measures have an improvement evaluation of “Improved” or “Improved significantly,” identify the strategies or actions taken by the authority (or schools) that may have contributed to this improvement.
St. James School continues to do well in this area. Even though we are relatively small school, we are able to offer the students a wide variety of choice (especially in Junior High) and we have experts in music, art and physical education.

AERR: 2014-2015 and THREE-YEAR EDUCATION PLAN 2015-2016 – 2017-2018 Page 26
SCHOOL EDUCATION PLAN (2015-2016 – 2017-2018)
DISTRICT VISION STATEMENT: EXCELLENCE IN TEACHING AND LEARNING
Our Catholic schools develop students who reflect the image of God and are successful contributors to a global society.
PROVINCIAL DESIRED OUTCOME TWO: Alberta has quality teaching and school leadership.
PROVINCIAL SPECIFIC OUTCOME 2.1: Teacher preparation and professional growth focus on the competencies needed to help students learn. Effective learning and teaching is achieved through collaborative leadership.
2015-2016 School Outcome(s): To develop a cohesive professional development plan.
Initiatives/Projects: Strategies: Measure:
Focus on Student Engagement
Focus on Increased Communication with families
Focus on Building Relationship with our Students
Focus on Inspiring Education Outcomes
Teacher in-servicing led by our Diverse Learners Teacher – Coordinating Teacher
Teacher in-servicing led by district personnel
Teacher in-servicing led by school administration
Teacher Professional Growth Plans
Ed-Camp strategy to be used on Professional Development Day
Frequent sharing of Best Practices among teachers
Tell Them From Me surveys
Student Satisfaction survey
Parent Satisfaction survey
Teacher Professional Growth Plans
Teacher Evaluation
Anecdotal Evidence from Staff Meetings