annual energy outlook 2016 - front page · 9/20/2016 u.s. energy information administration eia ...
TRANSCRIPT
9/20/2016 U.S. Energy Information Administration EIA Independent Statistics and Analysis
https://www.eia.gov/forecasts/aeo/section_issues.cfm#cpp 1/20
Annual Energy Outlook 2016Full Release Dates: September 15, 2016 | Next Early Release Date: January 2017
Report Number: DOE/EIA0383(2016)
Issues in Focus
Effects of the Clean Power PlanLaura Martin and Jeffrey Jones
Release Date: 6/20/16
The Clean Power Plan (CPP) [1] rule, issued under Section 111(d) of the Clean Air Act, is the U.S.Environmental Protection Agency (EPA) program to regulate carbon dioxide (CO2) emissions at existingfossilfired electric power plants. EPA estimates that the CPP will reduce CO2 emissions from the powersector by 32% from 2005 levels by 2030. As described in the Annual Energy Outlook 2016 (AEO2016)Legislation and Regulations section, the CPP rule allows states to choose either massbased or ratebasedemissions targets. A massbased target simply specifies an annual limit on the amount of CO2 that can beemitted by states from the affected sources. A ratebased target requires states to meet an annual adjustedemission rate (lbs CO2/MWh) based on emissions from affected sources divided by generation from affectedsources, which for this calculation includes new nonemitting sources, such as nuclear and renewablecapacity, and incremental energy efficiency. The rule also provides flexibility in other areas, such as regionalcooperation through trading.
The final rule incorporated in the AEO2016 is a revision to the initial proposal [2] that U.S. Energy Information(EIA) analyzed in May 2015 [3]. The final rule differs from the initial proposal in several ways, including:
The compliance start date has been delayed from 2020 to 2022, and the reductions are phased inbetween 2022 and 2030 using 3 sets of multiyear, interim goals instead of one interim period.
Demandside energy efficiency was not used in setting ratebased targets although it still may be usedfor compliance.

9/20/2016 U.S. Energy Information Administration EIA Independent Statistics and Analysis
https://www.eia.gov/forecasts/aeo/section_issues.cfm#cpp 2/20
The variations between state targets have been reduced by using sourcespecific rates for fossil fuelsteam and natural gasfired combinedcycle generation at the interconnection level, rather thanindividual state emission rates.
Compliance calculations for ratebased targets have been limited to capacity additions since 2012,rather than also including preexisting renewable capacity and atrisk nuclear plants.
Greater detail is provided for massbased implementation approaches and emissions credit trading.
In comparison with the EIA's analysis of the preliminary CPP rule, which was based on the Annual EnergyOutlook 2015 (AEO2015) Reference case, the analysis described here includes other differences inunderlying trends that are unrelated to the CPP but influence compliance decisions. These differences includelower natural gas prices, lower capital costs for renewable electricity generation plants, and extension ofrenewable tax credits.
In February 2016, the U.S. Supreme Court issued a stay of enforcement of the existing plant rule [4], pendingresolution of legal challenges from the states and the affected industries. The AEO2016 Reference caseassumes that the CPP will proceed as currently promulgated, and that all states will implement it by using amassbased standard that caps emissions from both existing and new power plants, with allowance revenuesrebated to ratepayers [5]. Alternative cases consider how outcomes could change with differentimplementation approaches, without the rule in place, and in a scenario with tighter standards beyond 2030.
Reductions in CO2 emissions can be achieved by switching from carbonintensive fuels (such as coal) to lesscarbonintensive natural gasfired power plants or to zerocarbon technologies (such as renewables andnuclear power). Other options to reduce CO2 emissions include improving plant efficiency to reduce fuel useand increasing energy efficiency to reduce energy demand. Compliance decisions made by the states, as wellas any future court decision regarding the rule, would have implications for plant retirements, capacityadditions, generation by fuel type, demand, and prices.
Alternative Clean Power Plan casesAs described in the Legislation and regulations section below, the AEO2016 Reference case assumes thatthe CPP is upheld, and that all states choose to meet a massbased standard to cover both existing and newsources. Using the standard that includes new sources ensures that leakage (which would represent a shift ofemissions from existing sources to new natural gasfired sources not covered by the CPP) does not occur.Because EIA's model is not developed at the state level, and because some level of trading is likely to happenamong states with the massbased approach, the Reference case assumes compliance at the same level inthe 22 electricity regions included in the Electricity Market Model (EMM) [6]. An aggregate cap is calculatedfor each region, with the implicit assumption that carbon allowance trading can occur within the region. TheReference case also assumes that the allowances are allocated to loadserving entities, which provide therevenue back to consumers through lower distribution prices. The cap is specified for 2022 through 2030,based on EPA specifications, and remains flat at 2030 levels thereafter.
No CPP caseThe No CPP case assumes that the final CPP rule is permanently voided and is not replaced by other
9/20/2016 U.S. Energy Information Administration EIA Independent Statistics and Analysis
https://www.eia.gov/forecasts/aeo/section_issues.cfm#cpp 3/20
controls on power sector CO2 emissions. States have no federal requirement to reduce CO2 emissions fromexisting power plants, but other programs remain in place, including the Regional Greenhouse Gas Initiative(RGGI) [7], the California Assembly Bill 32 (AB32), and the Global Warming Solutions Act of 2006 [8]. Also,state and regional renewable portfolio standard programs remain in place, as described in the Legislation andregulations section, and may have an indirect impact on CO2 emissions.
CPP Rate caseThe CPP provides statespecific, ratebased targets as an option for compliance. The affected electricitygeneration used in the rate calculation includes existing fossil steam and natural gasfired combinedcycleunits, incremental renewable generation added since January 2012, incremental nuclear generation, andincremental energy efficiency. Renewable capacity added in the enduse sectors also can be used to offsetthe affected emissions in the rate calculation. The CPP Rate case assumes that all regions (even thosecurrently under massbased programs such as in the Northeast and California) choose to comply with theCPP by meeting average ratebased targets—calculated as pounds of CO2 per megawatthour (lb/MWh)—ineach EMM region. The rates are based on a weighted average of the state targets, specified by year from2022 to 2030 as provided in the CPP. After 2030, the average emission rates for each region remain constantthrough 2040, implying that total emissions can increase after 2030 as electricity generation increases.
CPP Interregional Trading caseThe EPA allows trading of carbon allowances among states, as long as the states involved use the massbased compliance option. The CPP Interregional Trading case assumes that all regions choose to meetmassbased targets, covering existing and new sources (as in the AEO2016 Reference case), but with tradingof carbon allowances between regions within the Eastern Interconnection and within the WesternInterconnection. In the CPP Interregional Trading case, regions that reduce emissions by more than isneeded to meet their own regional caps may trade their excess allowances, enabling the purchasing regionsto exceed their nominal emissions caps.
CPP Extended caseThe CPP Extended case further reduces the CO2 targets after 2030 instead of maintaining a constantstandard, as specified in the CPP. This case assumes that the massbased limits in 2030, which result inpower sector CO2 emissions that are about 35% below 2005 levels, continue to decline linearly to achieve a45% reduction below 2005 levels in 2040. The post2030 reductions are applied using the same rate ofdecline for each state.
CPP Hybrid caseUnlike the CPP Rate case, the CPP Hybrid case assumes that regions in which existing programs enforcecarbon caps (RGGI in the Northeast [9] and AB32 in California) comply with the CPP through a massbasedtarget (considered more likely given their public comments on the rule). The CPP Hybrid case also assumesthat states in other regions implement the CPP using a ratebased approach. This case assumes nointerregional trading for CPP compliance. Because the RGGI and AB32 constraints already are reducingemissions in these regions, the RGGI states and California tend to overcomply with their CPP requirements,whether implemented as a massbased or ratebased standard. Consequently, the results of the CPP Hybridcase are similar to those of the CPP Rate case, because these regions do not need to behave differently to
9/20/2016 U.S. Energy Information Administration EIA Independent Statistics and Analysis
https://www.eia.gov/forecasts/aeo/section_issues.cfm#cpp 4/20
comply with either a mass or a ratebased standard. The remaining regions are assumed to have ratebasedstandards in both cases. Because the results are indistinguishable, the following discussion of the caseresults does not include the CPP Hybrid case.
CPP Allocation to Generators caseThe CPP Allocation to Generators case assumes that (as in the Reference case) all regions meet massbased caps that include new sources; however, the case also assumes that the carbon allowances areallocated to electricity generators rather than to loadserving entities. The CPP Allocation to Generators casealso assumes that generators in competitive regions will continue to include the value of their carbonallowances in their operating costs. As a result, marginal generation costs will reflect the costs of allowances.The Reference case assumes that allowances are allocated to loadserving entities, which then refund therevenue from allowance sales to consumers through lower distribution prices. In the CPP Allocation toGenerators case, retail electricity prices are higher than in the Reference case because there is no reductionof distribution costs, showing the impact of allowance allocation alternatives on retail prices. Because theimpact of the CPP Allocation to Generators case is primarily on retail prices—and not on changes in howcompliance is achieved, so that capacity and generation mix results are close to those in the Reference case—this case is discussed primarily in terms of pricing impacts.
Results
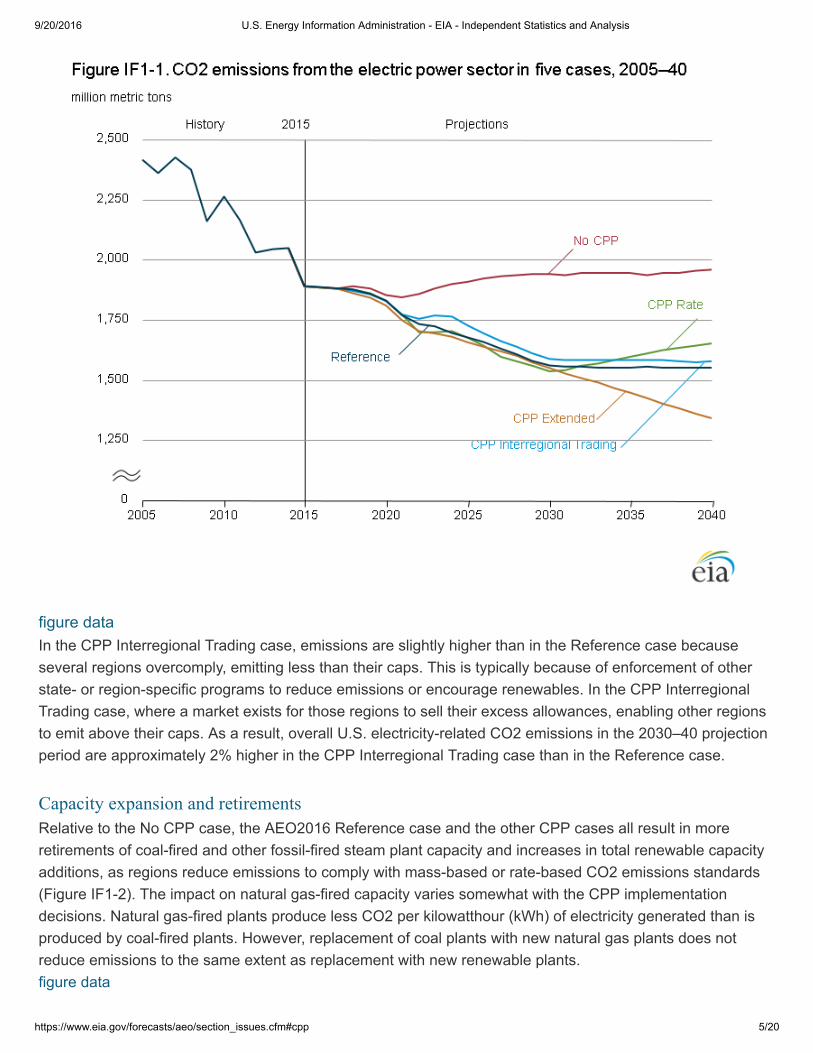
CO2 EmissionsIn the Reference case, which assumes that states comply with massbased CPP requirements, total CO2emissions from the U.S. electric power sector in 2030 are 35% below their 2005 level. Emissions from theelectric power sector, which have historically been the largest source of energyrelated CO2 emissions in theUnited States, fall below those in the transportation sector by 2020 and throughout the remainder of theprojection. After 2030, with the carbon cap assumed to remain flat and binding in almost all regions,emissions remain constant through 2040 (Figure IF11). Roughly the same reduction is seen in 2030 in theCPP Rate case, consistent with EPA's intent to develop equivalent measures for the alternate programs. After2030, emissions increase in the CPP Rate case, and in 2040 they are only 32% below the 2005 total,because a constant emission rate standard can result in increasing emissions when overall generation isgrowing. Relative to the No CPP case, the powersector CO2 emissions are 18% to 21% lower in 2030across the cases that include the CPP and 16% to 21% lower in 2040 in all CPP cases except the CPPExtended case. The CPP Extended case assumes that further CO2 emissions reductions, beyond thosecurrently specified in the CPP, are required after 2030, to 45% below 2005 levels in 2040, or 32% below the2040 emissions total in the No CPP case.
9/20/2016 U.S. Energy Information Administration EIA Independent Statistics and Analysis
https://www.eia.gov/forecasts/aeo/section_issues.cfm#cpp 5/20
figure data In the CPP Interregional Trading case, emissions are slightly higher than in the Reference case becauseseveral regions overcomply, emitting less than their caps. This is typically because of enforcement of otherstate or regionspecific programs to reduce emissions or encourage renewables. In the CPP InterregionalTrading case, where a market exists for those regions to sell their excess allowances, enabling other regionsto emit above their caps. As a result, overall U.S. electricityrelated CO2 emissions in the 2030–40 projectionperiod are approximately 2% higher in the CPP Interregional Trading case than in the Reference case.
Capacity expansion and retirementsRelative to the No CPP case, the AEO2016 Reference case and the other CPP cases all result in moreretirements of coalfired and other fossilfired steam plant capacity and increases in total renewable capacityadditions, as regions reduce emissions to comply with massbased or ratebased CO2 emissions standards(Figure IF12). The impact on natural gasfired capacity varies somewhat with the CPP implementationdecisions. Natural gasfired plants produce less CO2 per kilowatthour (kWh) of electricity generated than isproduced by coalfired plants. However, replacement of coal plants with new natural gas plants does notreduce emissions to the same extent as replacement with new renewable plants.figure data

9/20/2016 U.S. Energy Information Administration EIA Independent Statistics and Analysis
https://www.eia.gov/forecasts/aeo/section_issues.cfm#cpp 6/20
Of the cases that maintain the final CPP target beyond 2030, the AEO2016 Reference case (which includesthe massbased approach) has the highest level of fossilfired capacity retirements and the most new naturalgasfired capacity additions. To comply by EMM region using a massbased standard, the EMM regionschoose to replace existing fossilfired plants with both new renewable generating capacity and new, moreefficient, natural gasfired combinedcycle plants. In the CPP Rate case, zeroemitting generation can helpmeet the rate standard both by offsetting emissions and by providing additional affected generation used tocalculate the rate. As a result, more new renewable capacity is added than in the Reference case. Naturalgasfired combinedcycle capacity additions are 48 gigawatts (GW) lower than in the Reference case, andfossilfired capacity retirements are 33 GW lower.
Because the rate standard allows new renewable generation to be included in the base of the rate calculation,additional incentive exists to meet incremental load growth with renewable capacity rather than with naturalgasfired capacity. Consequently, more existing fossilfired capacity continues to operate. In the CPP Ratecase, significantly more wind and solar capacity is added by 2030 than in the Reference case, but less isadded after 2030. In the CPP Rate case, less incremental change is required after 2030 to maintain theemission rate standard than is required to maintain the massbased cap in the Reference case as electricitydemand increases.
9/20/2016 U.S. Energy Information Administration EIA Independent Statistics and Analysis
https://www.eia.gov/forecasts/aeo/section_issues.cfm#cpp 7/20
In the CPP Interregional Trading case, a shift from natural gasfired additions to renewable additions alsooccurs. Although regions are still required to meet a massbased standard in the CPP Interregional Tradingcase, the ability to trade allowances provides regions that have cheaper renewable sources an incentive toexceed the required standards so they have excess allowances to sell. The availability and costs ofrenewable energy resources can vary significantly across the country. Broader allowance trading can allow formore economical means to achieve compliance overall. Regions that are best able to lower their emissionscan sell allowances to regions that have fewer options to reduce emissions. In the CPP Interregional Tradingcase, solar capacity additions increase by 31 GW and natural gasfired additions decrease by 15 GW fromthe 2040 totals in the Reference case. Also, 5 GW less capacity is retired as more existing capacity remainsonline in regions that purchase allowances.
In the CPP Extended case, the mix of compliance actions is similar to that of the Reference case, but largershifts are needed after 2030. From 2015 to 2030, plans for future declines in emissions targets will result inchanges to the generation capacity mix, retiring an additional 12 GW of fossilfired capacity and adding 20GW of solar capacity beyond the Reference case totals. After 2030, the differences are more significant, withanother 21 GW of incremental fossilfired retirements in the CPP Extended case beyond the Reference case,and additional solar (7 GW) and natural gasfired (11 GW) capacity.
Generation fuel mixAcross the AEO2016 Reference case and CPP cases, shifts in the generation fuel mix reduce coalfiredgeneration by between 24% and 28% from 2015 to 2030 (Figure IF13). The declines from 2015 to 2040 varyacross the cases, ranging from 20% to 32% across the cases that keep the CPP target constant after 2030.The ratebased case allows some increase in coal generation in the later years as long as sufficientrenewable generation is available to offset it. The massbased case continues to reduce coal generation anduses loweremitting sources to meet new demand and maintain the same emission cap. In the CPP Extendedcase, which assumes that CO2 emissions target continues to decline after 2030, coal generation in 2040 is52% below 2015 levels. In the No CPP case, coal electricity generation increases slightly from 2015 levels, asnatural gas prices increase and as existing coal units are used at higher levels than in 2015, but remainsrelatively flat after 2020. Most growth in electricity demand is met by generation with natural gas andrenewable capacity, which are more economic to build to meet new demand even without the CPP in place.
figure data
The tradeoff between natural gas and renewable capacity for compliance in the AEO2016 Reference caseversus the CPP Rate case similarly affects the electricity generation mix across the cases. The natural gasshare of total electricity generation grows from 33% in 2015 to 37% in 2030 in the Reference case andremains at 33% in the CPP Rate case, while the renewable share grows from 13% in 2015 to 24% in theReference case and to 27% in the CPP Rate case. The CPP Interregional Trading case provides regions withmore flexibility by allowing them to purchase allowances and reduce their own emissions, resulting in morerenewable generation and less replacement of coalfired generation with natural gasfired generation than inthe Reference case. Incremental demandside energy efficiency (EE), measured as additional to what occurswithout the CPP in place, lowers electricity demand by 73 billion kWh to 76 billion kWh in 2030 across theReference, CPP Rate and CPP Interregional Trading cases. The additional EE impacts the calculation of the

9/20/2016 U.S. Energy Information Administration EIA Independent Statistics and Analysis
https://www.eia.gov/forecasts/aeo/section_issues.cfm#cpp 8/20
achieved emissions rate for a region, as the kWh are included in the denominator of the calculation. However,incremental EE can also help in meeting a massbased target by reducing the need for additional fossilfiredgeneration by reducing electricity demand.
The CPP Extended case requires further shifts beyond 2030, resulting in a significant drop in coal's share ofgeneration, from 33% in 2015 to 21% in 2030 and to 13% in 2040. In 2040, both the renewable share and thenatural gas share, at 29% and 42% of total electricity generation, respectively, are higher than those in theReference case. Incremental EE is also 21 billion kWh higher in the CPP Extended case compared with theReference case. In 2030, natural gasfired generation in the CPP Extended case is slightly lower than in theReference case, as more early development of renewable capacity occurs in anticipation of the decliningtarget.
Electricity pricesRetail electricity prices are higher when the CPP is in place than when it is not, as the fuel and capital costs ofcomplying with the rule by shifting to natural gasfired generation, or by building new renewable capacity, arepassed through to retail prices. Price impacts are similar in the Reference and the CPP Rate cases, withconstant dollar retail prices increasing by 1% to 5% above prices in the No CPP case over the 2022–30 CPP

9/20/2016 U.S. Energy Information Administration EIA Independent Statistics and Analysis
https://www.eia.gov/forecasts/aeo/section_issues.cfm#cpp 9/20
compliance period (Figure IF14). Prices remain, on average, 3% higher in constant dollars in the Referenceand the CPP Rate case than in the No CPP case after 2030. In the CPP Extended case, average electricityprices are slightly lower than in the Reference case through 2030, as additional renewable capacity is addedand as less natural gasfired capacity is used for generation, with less impact on natural gas prices. Deliverednatural gas prices in 2030 are 4% lower in the CPP Extended case than in the Reference case; but after2030, the CPP Extended case requires further emissions reductions and more natural gas use. In theReference case, electricity prices decline after 2030. In the CPP Extended case, incremental compliancecosts keep electricity prices higher, and in 2040 they are 3% and 6% higher than in the Reference and NoCPP cases, respectively.
figure data
Under a massbased standard, states have options for the allocation of carbon allowances, with implicationsfor electricity prices. The AEO2016 Reference case assumes that allowances will be allocated to loadservingentities, which will pass along the revenues from allowance sales to consumers in the form of rebates tolessen the price effects of CPP compliance. This rebate is reflected through lower electric distribution systemcosts. The CPP Allocation to Generators case assumes that allowances are distributed to generators. As a
9/20/2016 U.S. Energy Information Administration EIA Independent Statistics and Analysis
https://www.eia.gov/forecasts/aeo/section_issues.cfm#cpp 10/20
result, retail prices in competitive regions are higher, and average electricity prices from 2022 to 2040 in theCPP Allocation to Generators case are 1% higher than in the Reference case and 4% higher than in the NoCPP case.
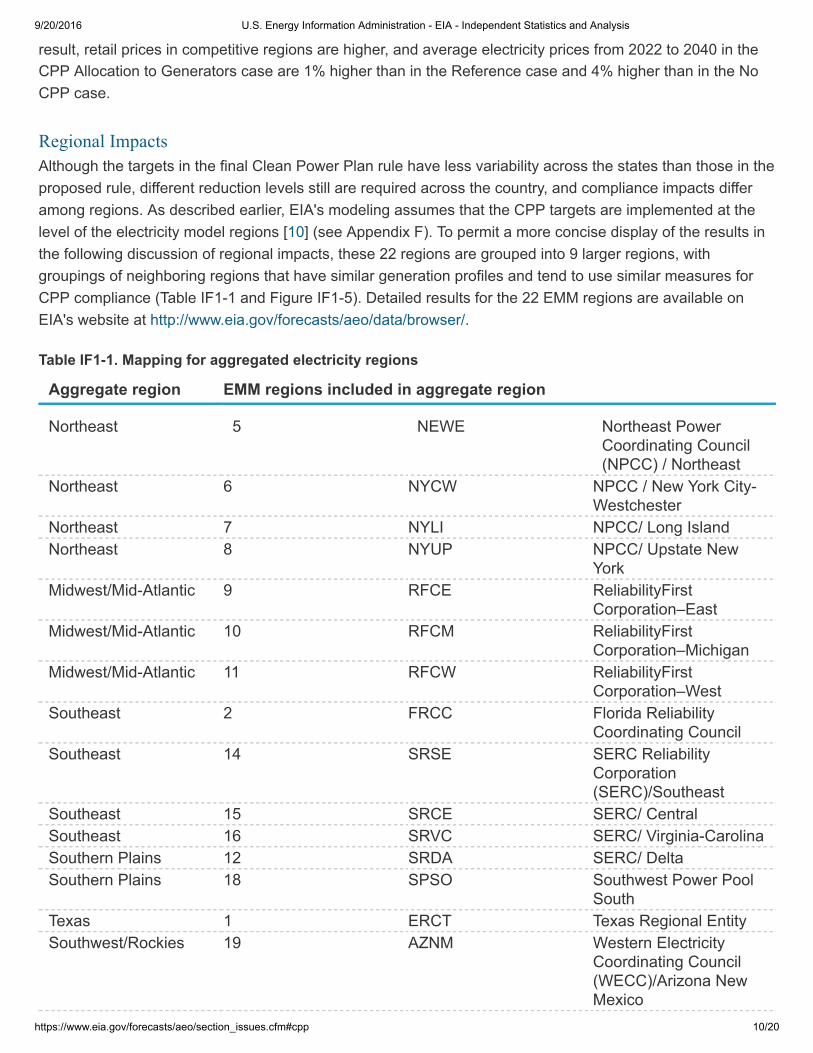
Regional ImpactsAlthough the targets in the final Clean Power Plan rule have less variability across the states than those in theproposed rule, different reduction levels still are required across the country, and compliance impacts differamong regions. As described earlier, EIA's modeling assumes that the CPP targets are implemented at thelevel of the electricity model regions [10] (see Appendix F). To permit a more concise display of the results inthe following discussion of regional impacts, these 22 regions are grouped into 9 larger regions, withgroupings of neighboring regions that have similar generation profiles and tend to use similar measures forCPP compliance (Table IF11 and Figure IF15). Detailed results for the 22 EMM regions are available onEIA's website at http://www.eia.gov/forecasts/aeo/data/browser/.
Table IF11. Mapping for aggregated electricity regions
Aggregate region EMM regions included in aggregate region
Northeast 5 NEWE Northeast PowerCoordinating Council(NPCC) / Northeast
Northeast 6 NYCW NPCC / New York CityWestchester
Northeast 7 NYLI NPCC/ Long IslandNortheast 8 NYUP NPCC/ Upstate New
YorkMidwest/MidAtlantic 9 RFCE ReliabilityFirst
Corporation–EastMidwest/MidAtlantic 10 RFCM ReliabilityFirst
Corporation–MichiganMidwest/MidAtlantic 11 RFCW ReliabilityFirst
Corporation–WestSoutheast 2 FRCC Florida Reliability
Coordinating CouncilSoutheast 14 SRSE SERC Reliability
Corporation(SERC)/Southeast
Southeast 15 SRCE SERC/ CentralSoutheast 16 SRVC SERC/ VirginiaCarolinaSouthern Plains 12 SRDA SERC/ DeltaSouthern Plains 18 SPSO Southwest Power Pool
SouthTexas 1 ERCT Texas Regional EntitySouthwest/Rockies 19 AZNM Western Electricity
Coordinating Council(WECC)/Arizona NewMexico
Southwest/Rockies 22 RMPA WECC/ Rockies

9/20/2016 U.S. Energy Information Administration EIA Independent Statistics and Analysis
https://www.eia.gov/forecasts/aeo/section_issues.cfm#cpp 11/20
Southwest/Rockies 22 RMPA WECC/ RockiesCalifornia 20 CAMX WECC/ California
Northwest 21 NWPP WECC/ NorthwestPower Pool Area
Northern Plains 3 MROE Midwest ReliabilityCouncil–East
Northern Plains 4 MROW Midwest ReliabilityCouncil–West
Northern Plains 13 SRGW SERC/ GatewayNorthern Plains 17 SPNO Southwest Power Pool
North
Notes: Names of grouped regions are intended to be approximately descriptive of location. Exactregional boundaries do not necessarily correspond to state borders or to other regional namingconventions. Aggregate region data are summed or averaged over the electricity model regionslisted.
The current mix of generation types across the regions varies considerably. The Northern Plains,
9/20/2016 U.S. Energy Information Administration EIA Independent Statistics and Analysis
https://www.eia.gov/forecasts/aeo/section_issues.cfm#cpp 12/20
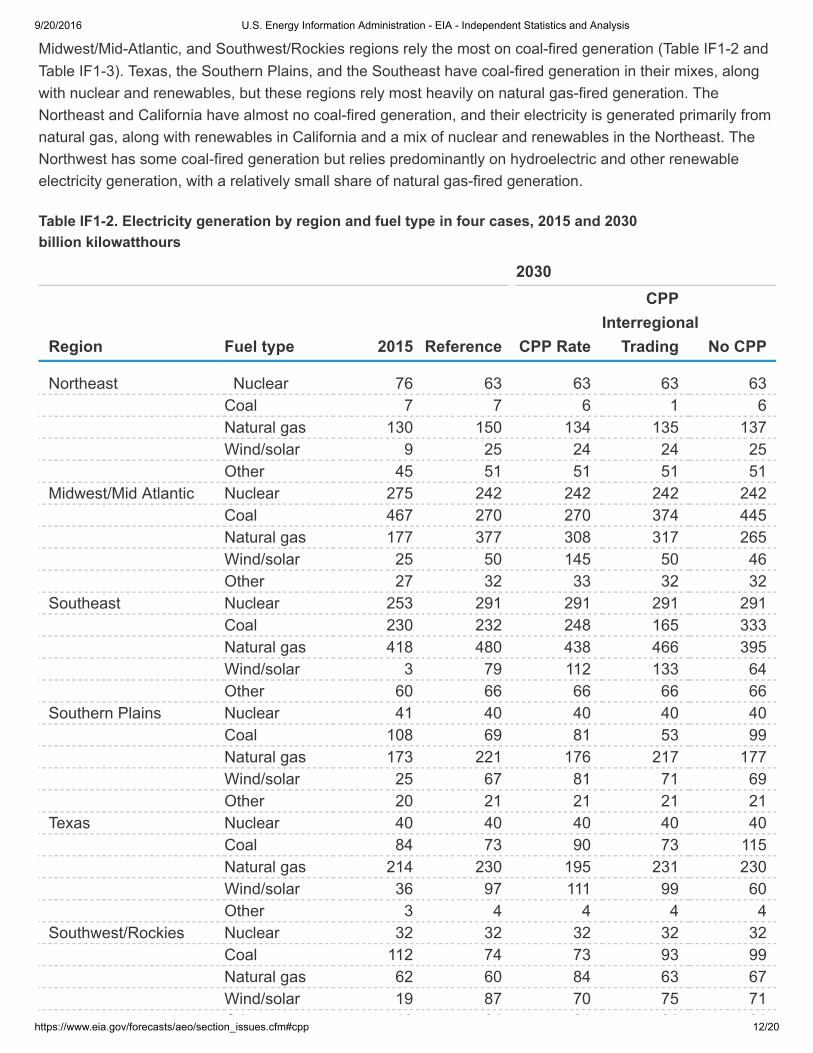
Midwest/MidAtlantic, and Southwest/Rockies regions rely the most on coalfired generation (Table IF12 andTable IF13). Texas, the Southern Plains, and the Southeast have coalfired generation in their mixes, alongwith nuclear and renewables, but these regions rely most heavily on natural gasfired generation. TheNortheast and California have almost no coalfired generation, and their electricity is generated primarily fromnatural gas, along with renewables in California and a mix of nuclear and renewables in the Northeast. TheNorthwest has some coalfired generation but relies predominantly on hydroelectric and other renewableelectricity generation, with a relatively small share of natural gasfired generation.
Table IF12. Electricity generation by region and fuel type in four cases, 2015 and 2030billion kilowatthours
2030
Region Fuel type 2015 Reference CPP Rate
CPPInterregional
Trading No CPP
Northeast Nuclear 76 63 63 63 63 Coal 7 7 6 1 6 Natural gas 130 150 134 135 137 Wind/solar 9 25 24 24 25 Other 45 51 51 51 51Midwest/Mid Atlantic Nuclear 275 242 242 242 242 Coal 467 270 270 374 445 Natural gas 177 377 308 317 265 Wind/solar 25 50 145 50 46 Other 27 32 33 32 32Southeast Nuclear 253 291 291 291 291 Coal 230 232 248 165 333 Natural gas 418 480 438 466 395 Wind/solar 3 79 112 133 64 Other 60 66 66 66 66Southern Plains Nuclear 41 40 40 40 40 Coal 108 69 81 53 99 Natural gas 173 221 176 217 177 Wind/solar 25 67 81 71 69 Other 20 21 21 21 21Texas Nuclear 40 40 40 40 40 Coal 84 73 90 73 115 Natural gas 214 230 195 231 230 Wind/solar 36 97 111 99 60 Other 3 4 4 4 4Southwest/Rockies Nuclear 32 32 32 32 32 Coal 112 74 73 93 99 Natural gas 62 60 84 63 67 Wind/solar 19 87 70 75 71 Other 18 21 21 21 21

9/20/2016 U.S. Energy Information Administration EIA Independent Statistics and Analysis
https://www.eia.gov/forecasts/aeo/section_issues.cfm#cpp 13/20
Other 18 21 21 21 21California Nuclear 18 18 18 18 18 Coal 9 1 1 1 1 Natural gas 116 116 113 110 122 Wind/solar 32 83 75 82 75 Other 42 68 67 67 67Northwest Nuclear 9 9 9 9 9 Coal 73 52 56 55 56 Natural gas 47 41 45 41 49 Wind/solar 24 56 53 56 44 Other 121 148 151 148 148Northern Plains Nuclear 53 54 54 54 54 Coal 261 194 169 213 266 Natural gas 10 22 33 23 24 Wind/solar 54 135 155 133 115 Other 18 22 22 22 22U.S. Total Nuclear 798 798 789 789 789 Coal 1,355 972 995 1,029 1,422 Natural gas 1,348 1,702 1,531 1,607 1,471 Wind/solar 227 683 830 727 571 Other 362 443 446 442 442
Notes: Names of grouped regions are intended to be approximately descriptive of location. Exactregional boundaries do not necessarily correspond to state borders or to other regional namingconventions. Aggregate data for each region are summed or averaged over the electricity modelregions listed. United States totals include estimated projections for Alaska and Hawaii, which are notincluded within any listed region.
Table IF13. Electricity generation shares by region and fuel type in four cases, 2015 and 2030 percent of region total
2030
Region Fuel type 2015 Reference CPP Rate
CPPInterregional
Trading No CPP
Northeast Nuclear 29% 21% 23% 23% 22% Coal 3% 2% 2% 1% 2% Natural gas 49% 51% 48% 49% 49% Wind/solar 3% 8% 8% 9% 9% Other 17% 17% 18% 19% 18%Midwest/Mid Atlantic Nuclear 28% 25% 24% 24% 23% Coal 48% 28% 27% 37% 43% Natural gas 18% 39% 31% 31% 26%

9/20/2016 U.S. Energy Information Administration EIA Independent Statistics and Analysis
https://www.eia.gov/forecasts/aeo/section_issues.cfm#cpp 14/20
Natural gas Wind/solar 3% 5% 15% 5% 4% Other 3% 3% 3% 3% 3%Southeast Nuclear 26% 25% 25% 26% 25% Coal 24% 20% 21% 15% 29% Natural gas 43% 42% 38% 42% 34% Wind/solar 0% 7% 10% 12% 6%
Other 6% 6% 6% 6% 6%Southern Plains Nuclear 11% 10% 10% 10% 10% Coal 30% 16% 20% 13% 24% Natural gas 47% 53% 44% 54% 44% Wind/solar 7% 16% 20% 18% 17% Other 6% 5% 5% 5% 5%Texas Nuclear 11% 9% 9% 9% 9% Coal 22% 16% 20% 16% 26% Natural gas 57% 52% 44% 52% 51% Wind/solar 9% 22% 25% 22% 13% Other 1% 1% 1% 1% 1%Southwest/Rockies Nuclear 13% 12% 11% 11% 11% Coal 46% 27% 26% 33% 34% Natural gas 25% 22% 30% 22% 23% Wind/solar 8% 32% 25% 26% 25% Other 7% 8% 8% 7% 7%California Nuclear 8% 6% 7% 6% 6% Coal 4% 0% 0% 0% 0% Natural gas 53% 41% 41% 40% 43% Wind/solar 15% 29% 27% 30% 27% Other 19% 24% 24% 24% 24%Northwest Nuclear 3% 3% 3% 3% 3% Coal 27% 17% 18% 18% 18% Natural gas 17% 13% 14% 13% 16% Wind/solar 9% 18% 17% 18% 14% Other 44% 48% 48% 48% 48%Northern Plains Nuclear 13% 13% 12% 12% 11% Coal 66% 45% 39% 48% 55% Natural gas 3% 5% 8% 5% 5% Wind/solar 14% 31% 36% 30% 24% Other 5% 5% 5% 5% 5%U.S. Total Nuclear 20% 17% 17% 17% 17% Coal 33% 21% 22% 22% 30% Natural gas 33% 37% 33% 35% 31% Wind/solar 6% 15% 18% 16% 12% Other 9% 10% 10% 10% 9%
Notes: Names of grouped regions are intended to be approximately descriptive of location. Exact

9/20/2016 U.S. Energy Information Administration EIA Independent Statistics and Analysis
https://www.eia.gov/forecasts/aeo/section_issues.cfm#cpp 15/20
Notes: Names of grouped regions are intended to be approximately descriptive of location. Exactregional boundaries do not necessarily correspond to state borders or to other regional namingconventions. Aggregate data for each region are summed or averaged over the electricity modelregions listed. United States totals include estimated projections for Alaska and Hawaii, which are notincluded within any listed region.
Even without the CPP (No CPP case), renewable electricity generation increases from 2015 to 2030 in allregions, with the largest increases in the Southeast, California, and the Northern Plains regions. Strongrenewable electricity generation growth occurs as a result of the combination of extended tax credits,renewable portfolio standards in many regions, and declining construction costs. The Midwest/MidAtlanticregion also experiences additional growth in natural gasfired generation to replace generation from nuclearand coalfired units that are retired during the 15year period. Although these trends limit emissions growth,they do not result in the declines required by the CPP. In the No CPP case, total U.S. coalfired generationgrows slightly from the level in 2015, when low natural gas prices increased utilization rates for natural gasfired plants and lowered utilization rates for coalfired plants.
In the Reference case, the regions that currently have the highest levels of coalfired generation make thelargest shifts in generation mix to comply with the CPP. The Midwest/MidAtlantic region retires additionalcoalfired capacity and increases natural gas use, in addition to reducing its required electricity generation byimporting more power from neighboring regions—which also reduces the region’s direct CO2 emissions in theReference case. The EPA allows the states to determine how they will account for emissions in power trades,and EIA assumes that emissions counted against each region’s target are based solely on electricitygeneration within the region, including generation exported to other regions. The Southeast region and theSouthern Plains region also increase natural gas use considerably to comply with the CPP. In the Southeastregion, where natural gas prices generally are relatively low, the available natural gasfired, combinedcyclecapacity is sufficient to support higher utilization levels.
The largest regional change in the increase in renewable electricity generation from 2015 to 2030 in theReference case relative to the No CPP case is projected to be in Texas. The Northern Plains region alsorelies on increased wind generation and reduced coalfired generation to meet the CPP targets. TheSouthwest/Rockies region decreases coalfired generation and more than triples solar electricity generationbetween 2015 and 2030 in the No CPP case. In the Reference case, solar electric power provides theregion’s most economical option for CPP compliance.
California and the Northeast regions have existing regional programs that are already reducing emissions. Asa result, emissions tend to be below the emission caps that are applied with a massbased implementation ofthe CPP in these regions. However, minor shifts in the generation mix occur relative to the No CPP case asboth regions reduce their levels of imports in the Reference case, because compliance costs in neighboringregions affect the costs and relative economics of these imports.
The electricity price effects of the CPP vary across the regions, depending on the magnitude of changesrequired in each region's generation mix and the method of compliance (Table IF14). The Northeast regionexperiences larger price impacts, even though emissions are below the CPP cap in both the No CPP caseand Reference case because the region relies heavily on natural gasfired generation. The Northeast is also acompetitive pricing market where the marginal cost of generation sets the wholesale power price that, addedto distribution charges, sets the retail price. Natural gas prices are higher in the Reference case compared to

9/20/2016 U.S. Energy Information Administration EIA Independent Statistics and Analysis
https://www.eia.gov/forecasts/aeo/section_issues.cfm#cpp 16/20
the No CPP case in all regions of the country, as a result of increased consumption, and thus result in highermarginal costs. The Midwest/MidAtlantic and Southeast regions also shift to greater natural gas use and seerelatively larger price impacts. California and the Northwest, which have large shares of lowcost renewablegeneration, have smaller price impacts. Texas has an early price reduction because the region adds a largeamount of wind capacity in the early years of the projection period to take advantage of available federal taxcredits. Initially, this extra capacity with low operating costs lowers electricity prices. In the longer term, theprice increases in Texas are consistent with those in other regions.
Table IF14. Differences in average electricity prices in the Reference case from the No CPP case byregion, 2025, 2030, 2035, and 2040 (percent)
Region 2025 2030 2035 2040
Northeast 4% 7% 4% 3%Midwest/MidAtlantic
0% 6% 3% 2%
Southeast 4% 6% 4% 3%Southern Plains 0% 4% 3% 3%Texas 7% 4% 2% 0%Southwest/Rockies 4% 5% 3% 3%California 1% 2% 2% 2%Northwest 2% 2% 2% 2%Northern Plains 3% 4% 4% 4%U.S. 1% 5% 3% 2%
Note: differences are based on aggregate region averaged prices weighted by regional sales.
CPP Interregional Trading caseIn the CPP Interregional Trading case, the EMM regions can trade carbon allowances within the EasternInterconnection and within the Western Interconnection [11]. This trading allows emissions to be above anindividual region's cap, as long as that region holds allowances from another region with total emissions thatare below its limit. In the CPP Interregional Trading case, emissions are higher than their Reference caselevels in the Eastern Interconnection's Midwest/MidAtlantic region and in the Northern Plains region, andemissions are lower in the Northeast, Southeast, and Southern Plains regions, indicating the directions ofallowance trading (see Figure IF15). Trading is not limited to contiguous regions, and transactions can occurbetween any of the EMM regions within a given interconnect.
The generation mix in the regions changes as a result of emissions trading (see Tables IF12 and IF13). TheMidwest/MidAtlantic region, which has the most purchases of allowances, retains more of its coalfiredgeneration and reduces the shift to natural gas use. The Southeast region, which has the most allowancesales, further reduces coal use and expands renewable electricity generation, as it has more favorable solarresources than the Midwest/MidAtlantic region. The shifts in power sales in those regions in the Referencecase do not occur in the CPP Interregional Trading case, where the Midwest/MidAtlantic region can increase
9/20/2016 U.S. Energy Information Administration EIA Independent Statistics and Analysis
https://www.eia.gov/forecasts/aeo/section_issues.cfm#cpp 17/20
its electricity generation from lower cost, fossil fuelfired generation and purchase allowances to cover excessemissions. The Northeast also reduces emissions in the CPP Interregional Trading case relative to theReference case and provides allowances to the Midwest/MidAtlantic region.
In the middle of the country, shifts in emissions and allowance trading are not as large as in other regions,although some changes do occur. The Southern Plains region reduces emissions and sells allowances, andthe Northern Plains region purchases allowances to increase its emissions. The Northern Plains region hascoalfired generation capacity that continues to operate when allowances are available at costs lower than thecost of developing less carbonintensive generation facilities. The Southern Plains region has economicallyviable wind and solar potential.
Although the California region does not reduce emissions significantly from the Reference case, the WesternInterconnection region is well below its CPP emissions cap in all CPP cases. In the Interregional Tradingcase, California provides more than 20 million allowances to other regions, primarily to the Southwest/Rockiesregion. As a result, a slight increase occurs in total national emissions in the CPP Interregional Trading casecompared with the Reference case.
The interplay of interregional power trade and compliance occurs in several areas. The Southern Plainsregion increases exports to the Northern Plains and Southwest/Rockies regions in the Reference case, butreduces exports when allowance trading is permitted. Regions that purchase allowances can meet their owngeneration needs more economically by increasing generation with fossil fuels.
CPP Rate caseOn a national level, power sector emissions in 2030 in the CPP Rate case are slightly lower than in theReference case. However, regional emission reductions are more variable in the CPP rate case. The largestchanges in emissions relative to the Reference case occur in the Midwest/MidAtlantic and Northern Plainsregions, which reduce emissions by 5% and 10%, respectively, from their Reference case levels in 2030, andin the Texas region and the Southwest/Rockies region, which increase emissions by 6% and 9%, respectively,from Reference case levels. Total emissions with the ratebased target can vary by region, depending on thegeneration mix and total generation. New renewable sources also play a larger role in meeting the ratebasedtarget, which allows for shifts in the mix of existing fossilfired generation versus generation from new energysources. Incremental EE can also be counted as affected generation in the ratebased calculation. After 2030,total U.S. emissions increase in the CPP Rate case. With an increase in electricity generation, total emissionscan increase while the emission rate is maintained with the ratebased target. Total emissions increase in theCPP Rate case after 2030 in most regions; however, in California and the Northeast, where state and regionalcaps remain in place, emissions remain relatively constant through 2040.
In most regions, new renewable electricity generation shifts occur in the CPP Rate case (Table IF12 andTable IF13), because the calculation of the emission rate includes generation from renewable sources in thedenominator of the rate calculation. This is an added benefit from increasing renewable generation with theratebased standard, in addition to simply offsetting emissions from fossilfired generation. In theMidwest/MidAtlantic region, an additional 95 billion kWh of generation from wind and solar capacity occurs in2030 in the CPP Rate case, relative to the Reference case, with a decline in natural gasfired generation of 69billion kWh compared with the Reference case. The new wind and solar capacity is added relatively early,
9/20/2016 U.S. Energy Information Administration EIA Independent Statistics and Analysis
https://www.eia.gov/forecasts/aeo/section_issues.cfm#cpp 18/20
before the production and investment tax credits are phased out, and this capacity provides a steady sourceof carbonfree electricity generation through 2030. However, coalfired generation is reduced over time as thestandard tightens. The patterns are similar in the Southeast, Southern Plains, and Texas regions, wheregeneration from wind and solar energy sources in 2030 is higher than in the Reference case, and natural gasfired generation is lower. (Coalfired generation also increases slightly from the Reference case levels inthese three regions.) In the Northern Plains region, which has little natural gasfired capacity, electricitygeneration from wind and solar resources increases and coal use declines in the CPP Rate case
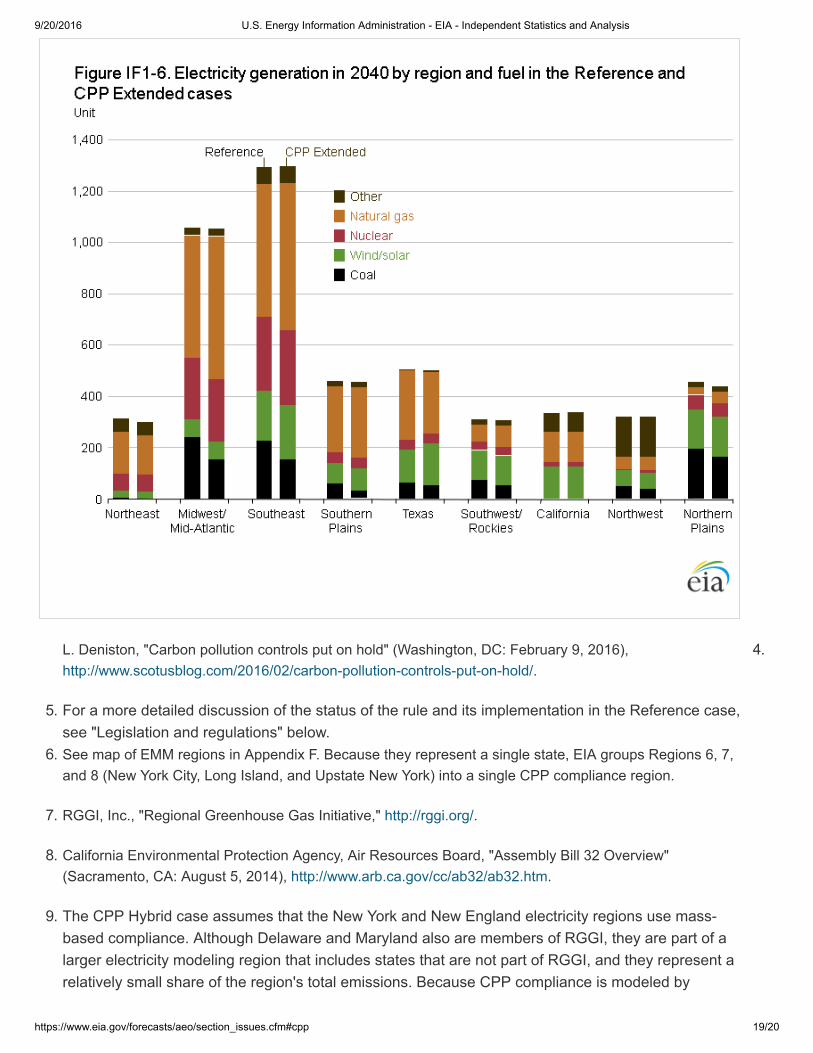
CPP Extended caseIn the CPP Extended case, the CPP emission targets continue to decline after 2030, and coalfired electricitygeneration declines in all regions (Figure IF16). The most significant changes relative to the Reference caseoccur in the Midwest/MidAtlantic and Southeast regions. In the Midwest/MidAtlantic region, the additionalemission reductions result primarily from switching to natural gasfired generation from coal. In the Southeastregion, both natural gasfired generation and renewable electricity generation are higher in 2040 in the CPPExtended case than in the Reference case. In the Northwest and the Southern Plains regions, electricitygeneration from natural gas and from renewables in 2040 is higher than in the Reference case, as coalfiredgeneration declines. In the Southwest Rockies and Northern Plains regions, natural gasfired generation ishigher in 2040 to make up for the decline in coal consumption.figure data
In Texas, coalfired and natural gasfired generation are lower in 2040 in the CPP Extended case than in theReference case, as fossil fuel consumption is reduced to meet the declining emissions target, and largeamounts of new solar capacity are added after 2035. In the Northeast region, as emissions targets arelowered in the CPP Extended case, the CPP target eventually becomes more stringent than the regionalprogram (RGGI) that is in place, and natural gas use in 2040 is lower than in the Reference case. In contrast,California's AB32 program continues to result in emissions below the 2040 targets in the CPP Extended case,and the generation mix is unchanged from that in the Reference case.
Endnotes1. U.S. Environmental Protection Agency, “Standards of Performance for Greenhouse Gas Emissions From
New, Modified, and Reconstructed Stationary Sources: Electric Utility Generating Units” (Washington, DC:October 23, 2015), https://www.federalregister.gov/articles/2015/10/23/201522837/standardsofperformanceforgreenhousegasemissionsfromnewmodifiedandreconstructedstationary; and U.S.Environmental Protection Agency, “Carbon Pollution Emission Guidelines for Existing Stationary Sources:Electric Utility Generating Units” (Washington, DC: October 23, 2015),https://www.federalregister.gov/articles/2015/10/23/201522842/carbonpollutionemissionguidelinesforexistingstationarysourceselectricutilitygenerating.
2. U.S. Environmental Protection Agency, "Carbon Pollution Emission Guidelines for Existing StationarySources: Electric Utility Generating Units" (Proposed Rule), 79 Fed. Reg. 34,830 (June 18, 2014), accessedJanuary 10, 2015.
3. U.S. Energy Information Administration, Analysis of the Impacts of the Clean Power Plan (Washington,DC: May 2015), http://www.eia.gov/analysis/requests/powerplants/cleanplan/pdf/powerplant.pdf.
9/20/2016 U.S. Energy Information Administration EIA Independent Statistics and Analysis
https://www.eia.gov/forecasts/aeo/section_issues.cfm#cpp 19/20
4. L. Deniston, "Carbon pollution controls put on hold" (Washington, DC: February 9, 2016),http://www.scotusblog.com/2016/02/carbonpollutioncontrolsputonhold/.
5. For a more detailed discussion of the status of the rule and its implementation in the Reference case,see "Legislation and regulations" below.
6. See map of EMM regions in Appendix F. Because they represent a single state, EIA groups Regions 6, 7,and 8 (New York City, Long Island, and Upstate New York) into a single CPP compliance region.
7. RGGI, Inc., "Regional Greenhouse Gas Initiative," http://rggi.org/.
8. California Environmental Protection Agency, Air Resources Board, "Assembly Bill 32 Overview"(Sacramento, CA: August 5, 2014), http://www.arb.ca.gov/cc/ab32/ab32.htm.
9. The CPP Hybrid case assumes that the New York and New England electricity regions use massbased compliance. Although Delaware and Maryland also are members of RGGI, they are part of alarger electricity modeling region that includes states that are not part of RGGI, and they represent arelatively small share of the region's total emissions. Because CPP compliance is modeled by

9/20/2016 U.S. Energy Information Administration EIA Independent Statistics and Analysis
https://www.eia.gov/forecasts/aeo/section_issues.cfm#cpp 20/20
electricity model regions, not by state, the CPP Hybrid case assumes that the region includingDelaware and Maryland complies by using a ratebased approach.
10. The three New York regions are modeled as one compliance region.11. The Electric Reliability Council of Texas (ERCOT) is located entirely within Texas, so there is no
opportunity for trade between states as in the other interconnections.