annual energy outlook 2019 - eia.gov · by law, eia's data, analyses, and forecasts are...
TRANSCRIPT
Annual Energy Outlook 2019with projections to 2050
January 24, 2019www.eia.gov/aeo#AEO2019
U.S. Energy Information Administration www.eia.gov/aeo#AEO2019U.S. Energy Information Administration
Annual Energy Outlook 2019with projections to 2050
January 2019U.S. Energy Information Administration
Office of Energy AnalysisU.S. Department of Energy
Washington, DC 20585
This publication is on the Web at:www.eia.gov/aeo
This report was prepared by the U.S. Energy Information Administration (EIA), the statistical and analytical agency within the U.S. Department of Energy. By law, EIA's data, analyses, and forecasts are independent of approval by any other officer or employee of the United States Government. The views in this report therefore should not be construed as representing those of the Department of Energy or other federal agencies.
3
U.S. Energy Information Administration www.eia.gov/aeo#AEO2019U.S. Energy Information Administration 4
• Projections in the Annual Energy Outlook 2019 (AEO2019) are not predictions of what will happen, but rather modeled projections of what may happen given certain assumptions and methodologies.
• The AEO is developed using the National Energy Modeling System (NEMS), an integrated model that captures interactions of economic changes and energy supply, demand, and prices.
• Energy market projections are subject to much uncertainty because many of the events that shape energy markets as well as future developments in technologies, demographics, and resources cannot be foreseen with certainty. To illustrate the importance of key assumptions, AEO2019 includes a Reference case and six side cases that systematically vary important underlying assumptions.
• More information about the assumptions used in developing these projections will be available shortly after the release of the AEO2019.
• The AEO is published to satisfy the Department of Energy Organization Act of 1977, which requires the Administrator of the U.S. Energy Information Administration to prepare annual reports on trends and projections for energy use and supply.
The Annual Energy Outlook provides long-term energy projections for the United States

U.S. Energy Information Administration www.eia.gov/aeo#AEO2019U.S. Energy Information Administration
• The AEO2019 Reference case represents EIA’s best assessment of how U.S. and world energy markets will operate through 2050, based on many key assumptions. For instance, the Reference case projection assumes improvement in known energy production, delivery, and consumption technology trends.
• The economic and demographic trends reflected in the Reference case reflect current views of leading economic forecasters and demographers.
• The Reference case generally assumes that current laws and regulations that affect the energy sector, including laws that have end dates, are unchanged throughout the projection period. This assumption is important because it permits EIA to use the Reference case as a benchmark to compare policy-based modeling.
• The potential impacts of proposed legislation, regulations, or standards are not included in the AEO2019 cases.
• The Reference case should be interpreted as a reasonable baseline case that can be compared with the cases that include alternative assumptions.
What is the Reference case?
5
U.S. Energy Information Administration www.eia.gov/aeo#AEO2019U.S. Energy Information Administration
• The side cases in AEO2019 show the effect that changing important model assumptions have on the projections when compared with the Reference case.
• Two AEO2019 side cases are the High and Low Oil Price cases, which represent international conditions outside the United States that could collectively drive prices to extreme, sustained deviations from the Reference case price path.
• Additional AEO2019 side cases are the High and Low Oil and Gas Resource and Technology cases, where production costs and resource availability within the United States are varied, allowing for more or less production at given world oil and natural gas prices.
• The two AEO2019 side cases that vary the effects of economic assumptions on energy consumption are the High and Low Economic Growth cases, which modify population growth and productivity assumptions throughout the projection period to yield higher or lower compound annual growth rates for U.S. gross domestic product than in the Reference case.
What are the side cases?
6

U.S. Energy Information Administration www.eia.gov/aeo#AEO2019U.S. Energy Information Administration
Key takeaways
Critical drivers and model updates
Petroleum and other liquids
Natural gas
Electricity generation
Transportation
Buildings
Industrial
References
7
Table of contents slide number
9
29
51
69
87
115
131
147
161
8

U.S. Energy Information Administration www.eia.gov/aeo#AEO2019U.S. Energy Information Administration
Key takeawaysEIA’s Annual Energy Outlook provides modeled projections of domestic energy markets through 2050, and it includes cases with different assumptions regarding macroeconomic growth, world oil prices, and technological progress.
U.S. Energy Information Administration www.eia.gov/aeo#AEO2019U.S. Energy Information Administration

U.S. Energy Information Administration www.eia.gov/aeo#AEO2019U.S. Energy Information Administration
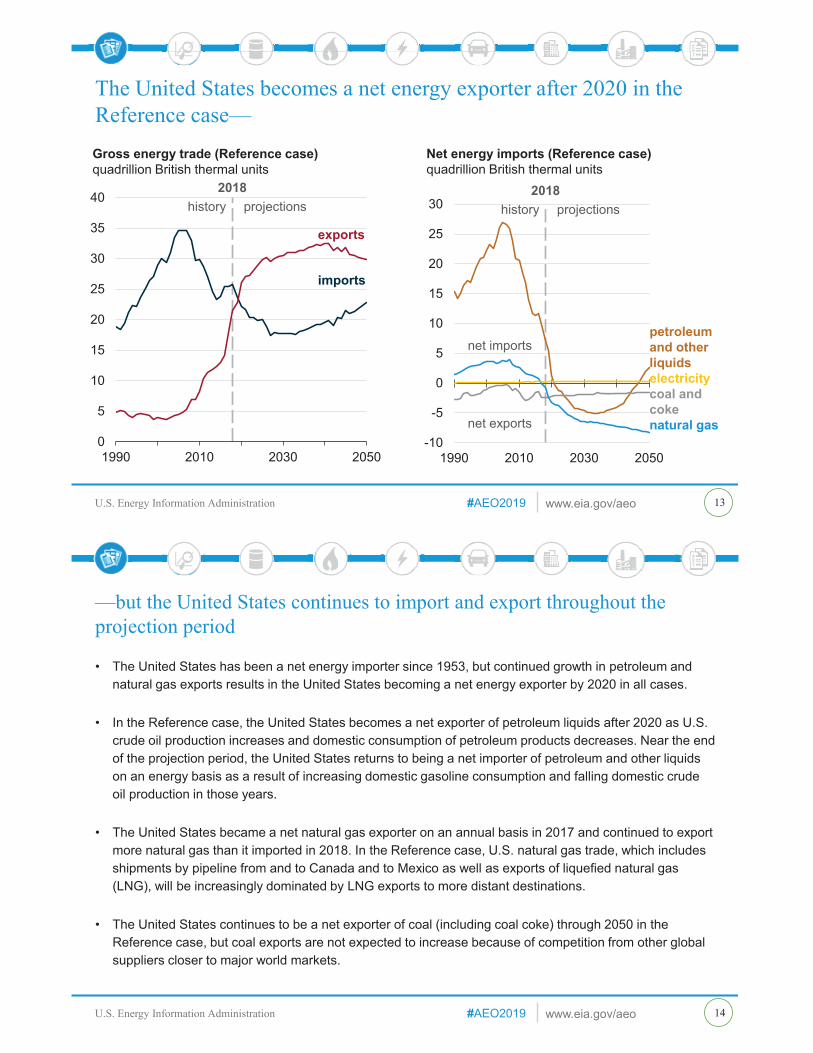
• The United States becomes a net energy exporter in 2020 and remains so throughout the projection period as a result of large increases in crude oil, natural gas, and natural gas plant liquids (NGPL) production coupled with slow growth in U.S. energy consumption.
• Of the fossil fuels, natural gas and NGPLs have the highest production growth, and NGPLs account for almost one-third of cumulative U.S. liquids production during the projection period.
• Natural gas prices remain comparatively low during the projection period compared with historical prices, leading to increased use of this fuel across end-use sectors and increased liquefied natural gas exports.
• The power sector experiences a notable shift in fuels used to generate electricity, driven in part by historically low natural gas prices. Increased natural gas-fired electricity generation; larger shares of intermittent renewables; and additional retirements of less economic existing coal and nuclear plants occur during the projection period.
• Increasing energy efficiency across end-use sectors keeps U.S. energy consumption relatively flat, even as the U.S. economy continues to expand.
Key takeaways from the Reference case
12
U.S. Energy Information Administration www.eia.gov/aeo#AEO2019U.S. Energy Information Administration 13
The United States becomes a net energy exporter after 2020 in the Reference case—
0
5
10
15
20
25
30
35
40
1990 2010 2030 2050
Gross energy trade (Reference case)quadrillion British thermal units
exports
imports
2018history projections
-10
-5
0
5
10
15
20
25
30
1990 2010 2030 2050
Net energy imports (Reference case)quadrillion British thermal units
petroleumand other liquidselectricitycoal and cokenatural gas
2018history projections
net imports
net exports
U.S. Energy Information Administration www.eia.gov/aeo#AEO2019U.S. Energy Information Administration
• The United States has been a net energy importer since 1953, but continued growth in petroleum and natural gas exports results in the United States becoming a net energy exporter by 2020 in all cases.
• In the Reference case, the United States becomes a net exporter of petroleum liquids after 2020 as U.S. crude oil production increases and domestic consumption of petroleum products decreases. Near the end of the projection period, the United States returns to being a net importer of petroleum and other liquids on an energy basis as a result of increasing domestic gasoline consumption and falling domestic crude oil production in those years.
• The United States became a net natural gas exporter on an annual basis in 2017 and continued to export more natural gas than it imported in 2018. In the Reference case, U.S. natural gas trade, which includes shipments by pipeline from and to Canada and to Mexico as well as exports of liquefied natural gas (LNG), will be increasingly dominated by LNG exports to more distant destinations.
• The United States continues to be a net exporter of coal (including coal coke) through 2050 in the Reference case, but coal exports are not expected to increase because of competition from other global suppliers closer to major world markets.
—but the United States continues to import and export throughout the projection period
14
U.S. Energy Information Administration www.eia.gov/aeo#AEO2019U.S. Energy Information Administration 15
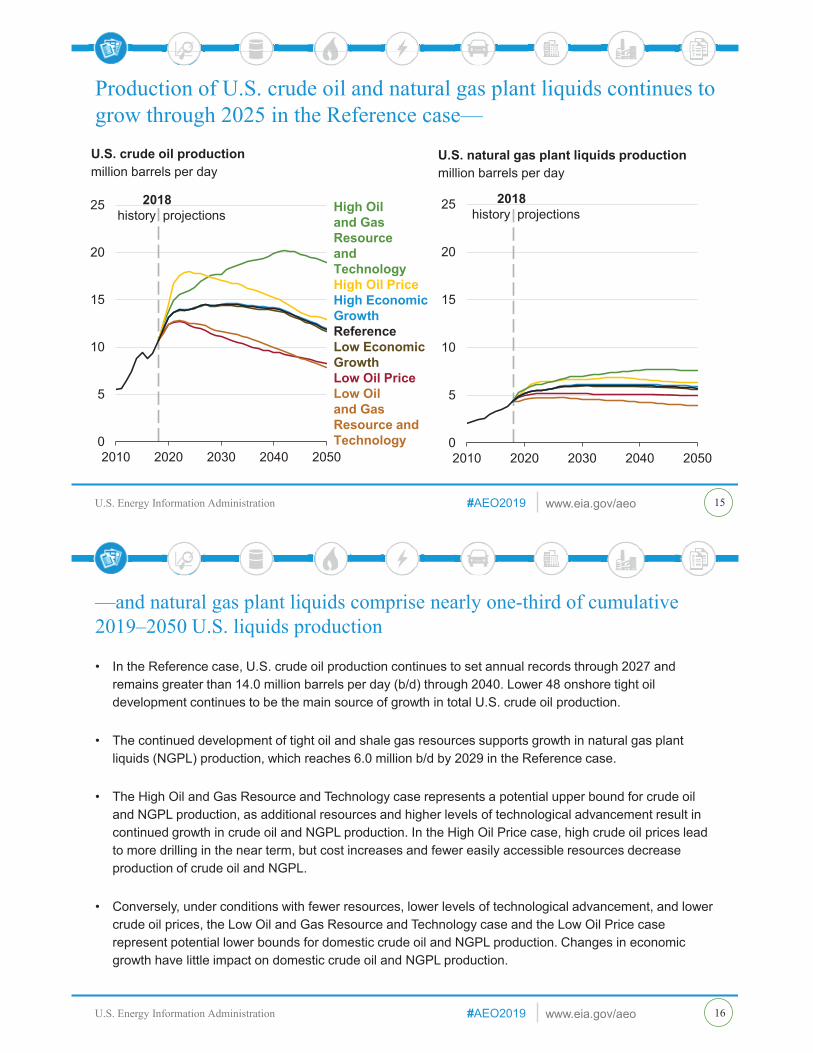
Production of U.S. crude oil and natural gas plant liquids continues to grow through 2025 in the Reference case—
0
5
10
15
20
25
2010 2020 2030 2040 2050
U.S. crude oil productionmillion barrels per day
2018history projections High Oil
and Gas Resource and TechnologyHigh Oil PriceHigh Economic GrowthReferenceLow EconomicGrowthLow Oil PriceLow Oil and Gas Resource and Technology 0
5
10
15
20
25
2010 2020 2030 2040 2050
U.S. natural gas plant liquids productionmillion barrels per day
2018history projections
U.S. Energy Information Administration www.eia.gov/aeo#AEO2019U.S. Energy Information Administration
• In the Reference case, U.S. crude oil production continues to set annual records through 2027 and remains greater than 14.0 million barrels per day (b/d) through 2040. Lower 48 onshore tight oil development continues to be the main source of growth in total U.S. crude oil production.
• The continued development of tight oil and shale gas resources supports growth in natural gas plant liquids (NGPL) production, which reaches 6.0 million b/d by 2029 in the Reference case.
• The High Oil and Gas Resource and Technology case represents a potential upper bound for crude oil and NGPL production, as additional resources and higher levels of technological advancement result in continued growth in crude oil and NGPL production. In the High Oil Price case, high crude oil prices lead to more drilling in the near term, but cost increases and fewer easily accessible resources decrease production of crude oil and NGPL.
• Conversely, under conditions with fewer resources, lower levels of technological advancement, and lower crude oil prices, the Low Oil and Gas Resource and Technology case and the Low Oil Price case represent potential lower bounds for domestic crude oil and NGPL production. Changes in economic growth have little impact on domestic crude oil and NGPL production.
—and natural gas plant liquids comprise nearly one-third of cumulative 2019–2050 U.S. liquids production
16
U.S. Energy Information Administration www.eia.gov/aeo#AEO2019U.S. Energy Information Administration
0
1
2
3
4
5
6
7
8
9
10
2000 2010 2020 2030 2040 2050
Dry natural gas production from oil formationstrillion cubic feet
2018history projections
Southwest
Gulf Coast
Other
17
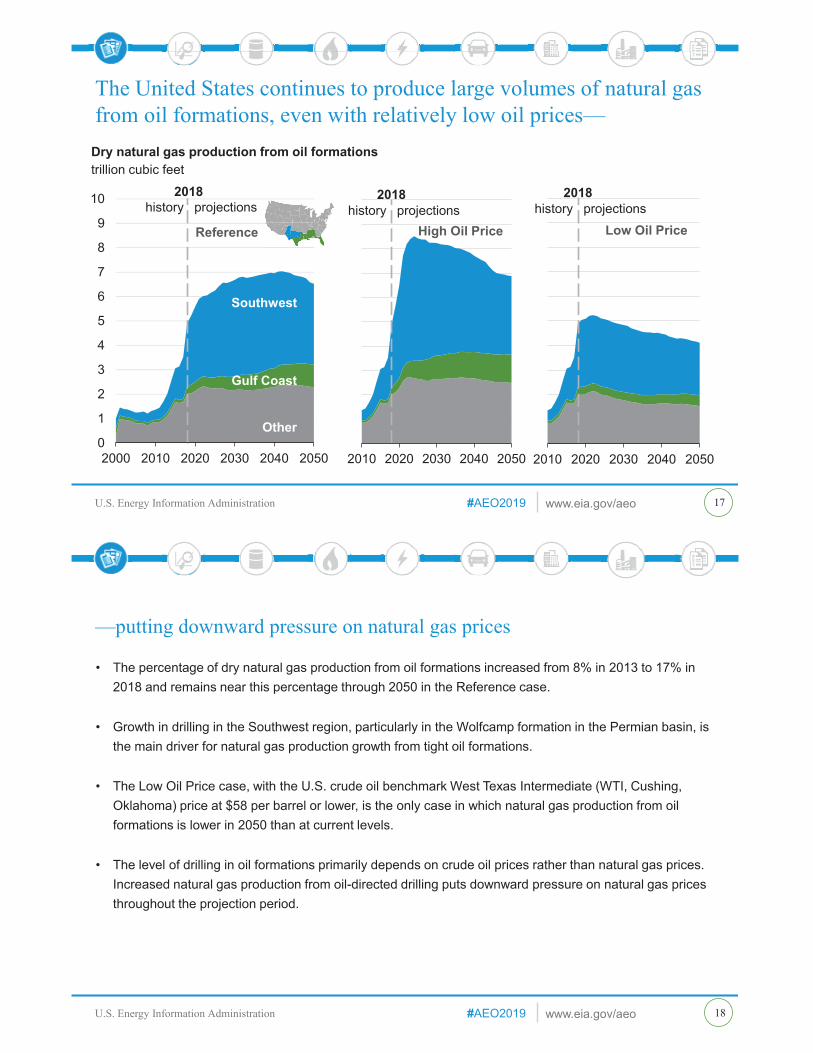
The United States continues to produce large volumes of natural gas from oil formations, even with relatively low oil prices—
2010 2020 2030 2040 2050
High Oil Price
2018history projections
2010 2020 2030 2040 2050
Low Oil Price
2018history projections
Reference
Southwest
Gulf Coast
Other
U.S. Energy Information Administration www.eia.gov/aeo#AEO2019U.S. Energy Information Administration
• The percentage of dry natural gas production from oil formations increased from 8% in 2013 to 17% in 2018 and remains near this percentage through 2050 in the Reference case.
• Growth in drilling in the Southwest region, particularly in the Wolfcamp formation in the Permian basin, is the main driver for natural gas production growth from tight oil formations.
• The Low Oil Price case, with the U.S. crude oil benchmark West Texas Intermediate (WTI, Cushing, Oklahoma) price at $58 per barrel or lower, is the only case in which natural gas production from oil formations is lower in 2050 than at current levels.
• The level of drilling in oil formations primarily depends on crude oil prices rather than natural gas prices. Increased natural gas production from oil-directed drilling puts downward pressure on natural gas prices throughout the projection period.
—putting downward pressure on natural gas prices
18
U.S. Energy Information Administration www.eia.gov/aeo#AEO2019U.S. Energy Information Administration 19
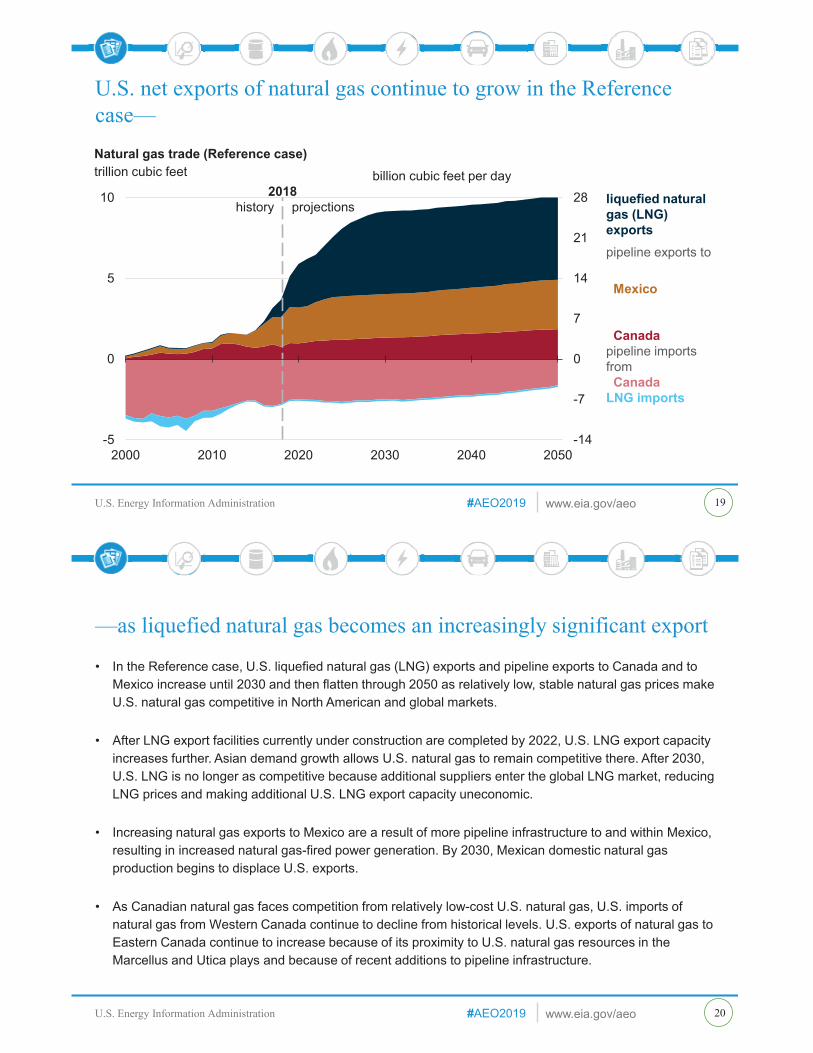
U.S. net exports of natural gas continue to grow in the Reference case—
-14
-7
0
7
14
21
28
-5
0
5
10
2000 2010 2020 2030 2040 2050
Natural gas trade (Reference case)trillion cubic feet
2018history projections liquefied natural
gas (LNG) exportspipeline exports to
Mexico
Canadapipeline imports fromCanada
LNG imports
billion cubic feet per day
U.S. Energy Information Administration www.eia.gov/aeo#AEO2019U.S. Energy Information Administration
• In the Reference case, U.S. liquefied natural gas (LNG) exports and pipeline exports to Canada and to Mexico increase until 2030 and then flatten through 2050 as relatively low, stable natural gas prices make U.S. natural gas competitive in North American and global markets.
• After LNG export facilities currently under construction are completed by 2022, U.S. LNG export capacity increases further. Asian demand growth allows U.S. natural gas to remain competitive there. After 2030, U.S. LNG is no longer as competitive because additional suppliers enter the global LNG market, reducing LNG prices and making additional U.S. LNG export capacity uneconomic.
• Increasing natural gas exports to Mexico are a result of more pipeline infrastructure to and within Mexico, resulting in increased natural gas-fired power generation. By 2030, Mexican domestic natural gas production begins to displace U.S. exports.
• As Canadian natural gas faces competition from relatively low-cost U.S. natural gas, U.S. imports of natural gas from Western Canada continue to decline from historical levels. U.S. exports of natural gas to Eastern Canada continue to increase because of its proximity to U.S. natural gas resources in the Marcellus and Utica plays and because of recent additions to pipeline infrastructure.
—as liquefied natural gas becomes an increasingly significant export
20

U.S. Energy Information Administration www.eia.gov/aeo#AEO2019U.S. Energy Information Administration 21
Electricity generation from natural gas and renewables increases, and the shares of nuclear and coal generation decrease—
0
1,000
2,000
3,000
4,000
5,000
6,000
2010 2020 2030 2040 2050
2018
history projections
Electricity generation from selected fuels (Reference case)billion kilowatthours
natural gasrenewablesnuclearcoal
39%
31%
12%
17%
19%
18%
34%
28%
0
200
400
600
800
1,000
1,200
1,400
1,600
1,800
2010 2020 2030 2040 2050
Renewable electricity generation, including end-use (Reference case)billion kilowatthours
2018
history projections
solar PVwindgeothermalhydroelectricother
48%
37%
18%
25%
39%9%
13%
4%
5%
2%
U.S. Energy Information Administration www.eia.gov/aeo#AEO2019U.S. Energy Information Administration
• The continuing decline in natural gas prices and increasing penetration of renewable electricity generation have resulted in lower wholesale electricity prices, changes in utilization rates, and operating losses for a large number of baseload coal and nuclear generators.
• Generation from both coal and nuclear is expected to decline in all cases. In the Reference case, from a 28% share in 2018, coal generation drops to 17% of total generation by 2050. Nuclear generation declines from a 19% share of total generation in 2018 to 12% by 2050. The share of natural gas generation rises from 34% in 2018 to 39% in 2050, and the share of renewable generation increases from 18% to 31%.
• Assumptions of declining costs and improving performance make wind and solar increasingly competitive compared with other renewable resources in the Reference case. Most of the wind generation increase occurs in the near term, when new projects enter service ahead of the expiration of key federal production tax credits.
• Solar Investment Tax Credits (ITC) phase down after 2024, but solar generation growth continues because the costs for solar continue to fall faster than for other sources.
—as lower natural gas prices and declining costs of renewable capacity make these fuels increasingly competitive
22

U.S. Energy Information Administration www.eia.gov/aeo#AEO2019U.S. Energy Information Administration 23
End-use activities grow, and energy intensities decrease in all sectors in the Reference case—
0.00.20.40.60.81.01.21.41.61.82.0
Residential: households
2018 2050
energyintensity
demand
Commercial: floorspace
Industrial: value of shipments
Indexed end-use demand drivers and energy intensities by sector (2018–50) (Reference case)index (2018=1.0)
Note: Energy intensities are a lighter shade of the same color as the respective demand, and they are calculated as energy used per unit of respective demand.
Transportation: passenger and vehicle travel
bus, air, and rail passengermiles
energyintensity
Transportation: off-highway freight travel
highway vehicle miles
U.S. Energy Information Administration www.eia.gov/aeo#AEO2019U.S. Energy Information Administration
• Delivered U.S. energy consumption grows across all major end-use sectors, with electricity and natural gas growing fastest. However, increases in efficiency, represented by declines in energy intensity (the amount of energy consumed per unit of potential demand), partially offset growth in total U.S. energy consumption across all end-use sectors.
• The end-use sectors have different representative metrics for demand used to estimate energy intensity—number of households for the residential sector, floorspace for the commercial sector, industrial value of shipments for the industrial sector, and travel metrics for the transportation sector.
• Transportation travel is measured in three ways, depending on the mode: highway vehicle miles (light-and heavy-duty vehicles), passenger miles (bus, passenger rail, and air), and off-highway freight ton-miles (freight rail, air, and domestic shipping).
• The steepest decline in energy intensity is in the transportation sector, with the level of energy used per highway vehicle-mile traveled declining by 32% from 2018 to 2050 as a result of increasingly stringent fuel economy and energy efficiency standards for light- and heavy-duty vehicles.
—offsetting each other to limit energy consumption growth
24

U.S. Energy Information Administration www.eia.gov/aeo#AEO2019U.S. Energy Information Administration
35
40
45
50
55
60
65
70
75
1990 2000 2010 2020 2030 2040 2050
transportation
commercialresidential
industrial
electric power
Carbon dioxide intensity by end-use sector(Reference case)metric tons of carbon dioxide per billion British thermal units 2018
history projections
1990 2000 2010 2020 2030 2040 2050
Carbon dioxide intensity by end-use sector (Reference case)metric tons of carbon dioxide per billion British thermal units 2018
history projections
The electric power sector is redistributed to each end-use sector
25
Across end-use sectors, carbon dioxide intensity declines with changes in the fuel mix—
Note: Carbon dioxide intensities are calculated as carbon dioxide emissions per unit energy output (in British thermal units).
U.S. Energy Information Administration www.eia.gov/aeo#AEO2019U.S. Energy Information Administration
• Carbon dioxide (CO2) intensity can vary greatly depending on the mix of fuels the end-use sectors consume. Historically, the industrial sector has had the lowest CO2 intensity, as measured by CO2 emissions per British thermal unit (Btu). The transportation sector historically has had the highest CO2 intensity, which continues in the projection because carbon-intensive petroleum remains the dominant fuel used in vehicles throughout the projection period.
• The generation fuel mix in the electric power sector has changed since the mid-2000s, with lower generation from high-carbon intensive coal and higher generation from natural gas and carbon-free renewables, such as wind and solar. This change resulted in the overall CO2 intensity of the electric power sector declining by 25% from the mid-2000s to 2018 and continuing to decline through 2050.
• Accounting for the CO2 emissions from the electricity sector in the end-use sectors that consume the electricity results in larger declines in CO2 intensity across those sectors for all AEO2019 cases. In the Reference case, the CO2 intensities of the residential and commercial sectors decline less than 1% when only their direct CO2 intensities are counted. When the electric power sector energy is distributed to the end-use sectors, the residential and commercial sectors decline by 11% and 10%, respectively, while the industrial sector declines by 11%. Transportation carbon intensity declines by 5%.
—despite overall increases in energy consumption
26

U.S. Energy Information Administration www.eia.gov/aeo#AEO2019U.S. Energy Information Administration
0
5
10
15
20
25
30
35
40
45
1990 2000 2010 2020 2030 2040 2050
electric powerindustrial
transportation
residential
commercial
Energy consumption by sector (Reference case)quadrillion British thermal units
2018history projections
0
5
10
15
20
25
30
35
40
45
1990 2000 2010 2020 2030 2040 2050
Energy consumption by fuel (Reference case)quadrillion British thermal units
2018history projections petroleum
and other liquidsnatural gas
other renewable energycoalnuclearhydroliquidbiofuels
27
Policy, technology, and economics affect the mix of U.S. fuel consumption—
U.S. Energy Information Administration www.eia.gov/aeo#AEO2019U.S. Energy Information Administration
• In all cases, non-hydroelectric renewables consumption grows the most (on a percentage basis). Implementing policies at the state level (renewable portfolio standards) and at the federal level (production and investment tax credits) has encouraged the use of renewables. Growing renewable use has driven down the costs of renewables technologies (wind and solar photovoltaic), further supporting their expanding adoption by the electric power and buildings sectors.
• Natural gas consumption rises as well, driven by projected low natural gas prices. In the Reference case, the industrial sector becomes the largest consumer of natural gas starting in the early 2020s. This sector will expand the use of natural gas as feedstock in the chemical industries and as lease and plant fuel, for industrial heat and power, and for liquefied natural gas production. Natural gas consumption for electric power also increases significantly in the power sector in response to low natural gas prices and to installing lower cost natural gas-fired combined-cycle generating units.
• The transportation sector is the largest consumer of petroleum and other liquids, particularly motor gasoline and distillate fuel oil. Current fuel economy standards stop requiring additional efficiency increases in 2025 for light-duty vehicles and in 2027 for heavy-duty vehicles, but travel continues to rise, and as a result, consumption of petroleum and other liquids increases later in the projection period.
—which affects energy consumption patterns throughout the projection period
28

U.S. Energy Information Administration www.eia.gov/aeo#AEO2019U.S. Energy Information Administration
Critical drivers and model updatesMany factors influence the model results in AEO2019, including varying assumptions about domestic energy resources and production technology; global oil prices; macroeconomic growth; model improvements; and new and existing laws and regulations since AEO2018.
U.S. Energy Information Administration www.eia.gov/aeo#AEO2019U.S. Energy Information Administration

U.S. Energy Information Administration www.eia.gov/aeo#AEO2019U.S. Energy Information Administration
• Future oil prices are highly uncertain and are subject to international market conditions influenced by factors outside of the National Energy Modeling System. The High and Low Oil Price cases represent international conditions that could collectively drive prices to extreme, sustained deviations from the Reference case price path. Compared with the Reference case, in the High Oil Price case, non-U.S. demand is higher and non-U.S. supply is lower; in the Low Oil Price case, the opposite is true.
• Projections of tight oil and shale gas production are uncertain because large portions of the known formations have relatively little or no production history, and extraction technologies and practices continue to evolve rapidly. In the High Oil and Gas Resource and Technology case, lower production costs and higher resource availability than in the Reference case allow for higher production at lower prices. In the Low Oil and Gas Resource and Technology case, assumptions of lower resources and higher production costs are applied. These assumptions are not extended outside the United States.
• Economic growth particularly affects energy consumption, and those effects are addressed in the High and Low Economic Growth cases, which modify population growth and productivity assumptions throughout the projection period to yield higher or lower compound annual growth rates for U.S. gross domestic product than in the Reference case.
Critical drivers and uncertainty
32
U.S. Energy Information Administration www.eia.gov/aeo#AEO2019U.S. Energy Information Administration 33
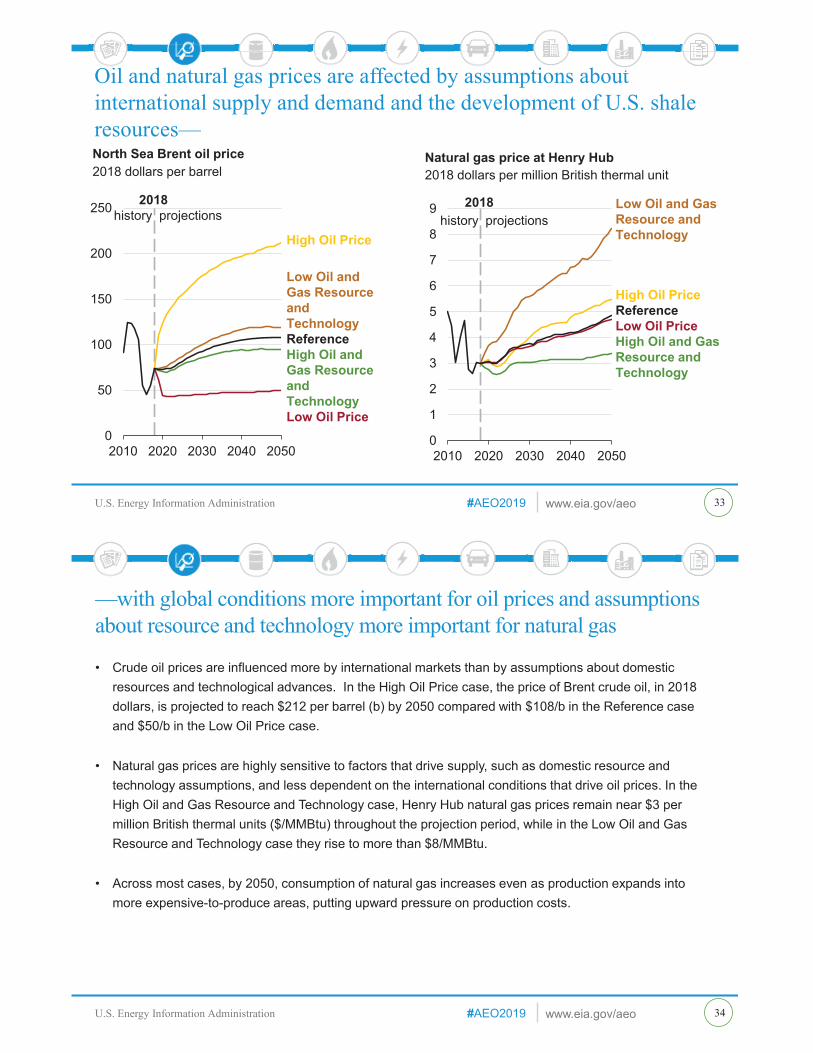
Oil and natural gas prices are affected by assumptions about international supply and demand and the development of U.S. shale resources—
titi o tt
0
50
100
150
200
250
2010 2020 2030 2040 2050
North Sea Brent oil price2018 dollars per barrel
High Oil Price
Low Oil and Gas Resource and TechnologyReferenceHigh Oil and Gas Resource and TechnologyLow Oil Price
2018history projections
0
1
2
3
4
5
6
7
8
9
2010 2020 2030 2040 2050
Natural gas price at Henry Hub2018 dollars per million British thermal unit
2018history projections
Low Oil and Gas Resource and Technology
High Oil PriceReferenceLow Oil PriceHigh Oil and Gas Resource and Technology
U.S. Energy Information Administration www.eia.gov/aeo#AEO2019U.S. Energy Information Administration
• Crude oil prices are influenced more by international markets than by assumptions about domestic resources and technological advances. In the High Oil Price case, the price of Brent crude oil, in 2018 dollars, is projected to reach $212 per barrel (b) by 2050 compared with $108/b in the Reference case and $50/b in the Low Oil Price case.
• Natural gas prices are highly sensitive to factors that drive supply, such as domestic resource and technology assumptions, and less dependent on the international conditions that drive oil prices. In the High Oil and Gas Resource and Technology case, Henry Hub natural gas prices remain near $3 per million British thermal units ($/MMBtu) throughout the projection period, while in the Low Oil and Gas Resource and Technology case they rise to more than $8/MMBtu.
• Across most cases, by 2050, consumption of natural gas increases even as production expands into more expensive-to-produce areas, putting upward pressure on production costs.
—with global conditions more important for oil prices and assumptions about resource and technology more important for natural gas
34
U.S. Energy Information Administration www.eia.gov/aeo#AEO2019U.S. Energy Information Administration
0
5
10
15
20
25
30
35
40
2010 2030 2050
Gross domestic producttrillion 2009 dollars
2018history projections
High Economic GrowthReference Low Economic Growth
0
100
200
300
400
500
2010 2030 2050
Populationmillions
2018
history projections
35
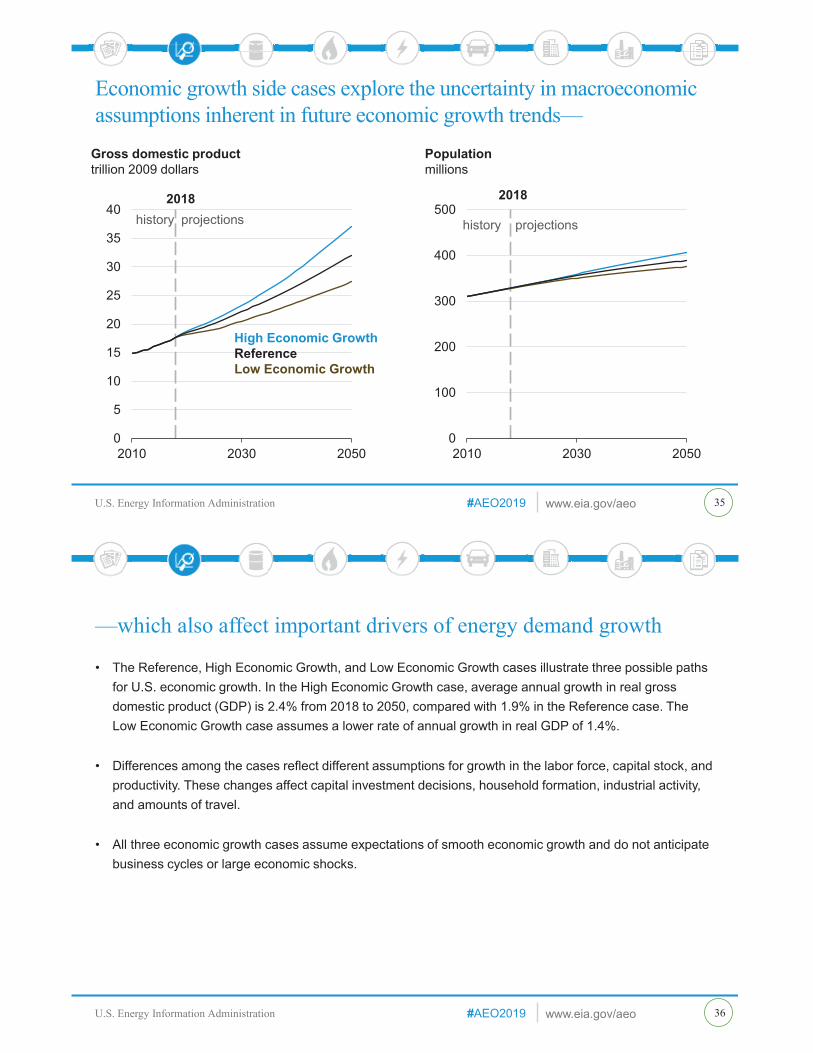
Economic growth side cases explore the uncertainty in macroeconomic assumptions inherent in future economic growth trends—
U.S. Energy Information Administration www.eia.gov/aeo#AEO2019U.S. Energy Information Administration
• The Reference, High Economic Growth, and Low Economic Growth cases illustrate three possible paths for U.S. economic growth. In the High Economic Growth case, average annual growth in real gross domestic product (GDP) is 2.4% from 2018 to 2050, compared with 1.9% in the Reference case. The Low Economic Growth case assumes a lower rate of annual growth in real GDP of 1.4%.
• Differences among the cases reflect different assumptions for growth in the labor force, capital stock, and productivity. These changes affect capital investment decisions, household formation, industrial activity, and amounts of travel.
• All three economic growth cases assume expectations of smooth economic growth and do not anticipate business cycles or large economic shocks.
—which also affect important drivers of energy demand growth
36
37
U.S. Energy Information Administration www.eia.gov/aeo#AEO2019U.S. Energy Information Administration
• EIA released data from its 2015 Residential Energy Consumption Survey (RECS) in May 2018, and introduced estimates of energy consumption for an expanded list of energy end uses. Incorporating these updated estimates resulted in revised total housing units and end-use energy consumption shares.
• EIA updated residential and commercial technology efficiency and cost characteristics for space heating, space cooling, water heating, cooking equipment, and appliances based on reports Navigant Consulting, Inc. prepared for EIA.
• EIA updated vehicle stock data and related inputs such as vehicle scrappage and annual travel by vintage, which affected stock fuel economy and vehicle-miles traveled. Along with improved modeling of fleet-operated automated vehicles, these changes resulted in higher estimates of the number of light-duty vehicles on the road and higher vehicle-miles traveled.
Significant data and model updates
38

U.S. Energy Information Administration www.eia.gov/aeo#AEO2019U.S. Energy Information Administration
• EIA updated its modeling of the Annex VI of the International Convention for the Prevention of Pollution from Ships (MARPOL Convention), which limits sulfur emissions to 0.5% by weight, compared with the current 3.5% by weight, for ocean-going ships by 2020. The new modeling reflects expectations that U.S. refiners will supply a larger share of the low-sulfur fuel market. EIA also lowered the initial penetration of marine scrubbers and added a 60/40 blend of high sulfur fuel oil and distillate as a 2020 global sulfur-compliant fuel.
• In December 2017, Congress enacted the Tax Cuts and Jobs Act of 2017 (P.L. 115-97). Although this act is mainly associated with reducing the maximum marginal tax rate for corporations from 38% to 21% and temporarily allowing immediate expensing of major capital expenditures, it also established an oil and natural gas program for the leasing, development, production, and transportation of oil and natural gas in and from the coastal plain (1002 Area) of the Arctic National Wildlife Refuge (ANWR). Modeling the opening of ANWR to drilling increases Alaskan crude oil production after 2030.
New laws and regulations reflected in the Reference case as of October 2018
39
U.S. Energy Information Administration www.eia.gov/aeo#AEO2019U.S. Energy Information Administration
• The Internal Revenue Service issued safe harbor guidance for solar facilities to qualify for the Investment Tax Credit (ITC) as it phases down from 30% to 10% after 2020. Under the new guidance, utility-scale solar photovoltaic (PV) projects starting construction before January 1, 2020, have up to four years to bring the plant online, while still qualifying for the full 30% ITC. Projects entering service after January 1, 2024, receive a 10% ITC, including those starting construction after 2020. Modeling the safe harbor guidance results in later additions of solar PV systems as developers postpone in-service dates and in higher total solar PV builds.
• A number of new state and regional policies were enacted in the past year. These policies included California’s requirement for 100% clean energy generation by 2045 and New Jersey’s and Massachusetts’s increased renewable portfolio standard (RPS) requirements that renewables contribute 50% and 35% of generation, respectively, by 2030. Even with the stricter requirements, EIA projects compliance to be easily met.
• EIA did not include the effects of the existing 45Q federal tax credits for carbon capture and sequestration in AEO2019 because the credits, although recently doubled, still do not appear large enough to encourage substantial market penetration of carbon capture in the scenarios modeled.
New laws and regulations reflected in the Reference case as of October 2018 (continued)
40

U.S. Energy Information Administration www.eia.gov/aeo#AEO2019U.S. Energy Information Administration 41
New limit on global sulfur emissions affects refinery operations and maritime transport—
0
200
400
600
800
1,000
1,200
2010 2020 2030 2040 2050
International marine shipping fuel consumption (Reference case)trillion British thermal units
low-sulfur fuel oil
distillate fuel oil
liquefied natural gas
high-sulfur fuel oil
2018history projections
U.S. Energy Information Administration www.eia.gov/aeo#AEO2019U.S. Energy Information Administration
• Annex VI of the International Convention for the Prevention of Pollution from Ships (MARPOL Convention) limits emissions for ocean-going ships by 2020 (IMO 2020). From January 1, 2020, the limit for sulfur in fuel used on board ships operating outside designated emission control areas will be reduced to 0.5% m/m (mass by mass), a reduction of more than 85% from its present level of 3.5% m/m. Ships can meet the new global sulfur limit by installing pollutant-control equipment (scrubbers); by using a low-sulfur, petroleum-based marine fuel; or by switching to an alternative non-petroleum fuel such as liquefied natural gas (LNG).
• Shippers that install scrubbers have remained limited, and refineries continue to announce plans to upgrade high-sulfur fuel oils into higher quality products and increase availability of low-sulfur compliant fuel oils. Some shippers have also announced plans to address the costs associated with higher quality fuels by shifting those costs to their customers.
• Although some price swings and fuel availability issues are expected when the regulations take effect in 2020, by 2030 more than 83% of international marine fuel purchases in U.S. ports are for low-sulfur compliant fuel in the Reference case, and the share of LNG increases from negligible levels in 2018 to 7% in 2030.
—as refiners and marine transporters adapt to meet the new requirements
42

U.S. Energy Information Administration www.eia.gov/aeo#AEO2019U.S. Energy Information Administration 43
Refinery utilization in the Reference case peaks in 2020—
0
10
20
30
40
50
60
70
80
90
100
2010 2020 2030 2040 2050
U.S. refinery utilization (Reference case)percent
portion of throughput
exported
portion of throughputconsumed
domestically
utilization
2018history projections
0.0
0.5
1.0
1.5
2.0
2.5
3.0
2010 2020 2030 2040 2050
U.S. diesel and residual fuel exports and unfinished oils imports (Reference case)million barrels per day
2018history projections
diesel and residualfuel exports
unfinished oils imports
U.S. Energy Information Administration www.eia.gov/aeo#AEO2019U.S. Energy Information Administration
• U.S. refinery utilization peaks in most cases in 2020 as complex refineries in the United States that can process high-sulfur fuel oil in downstream units take advantage of the increased price spread between light and heavy crude oil. In the Reference case, refinery utilization peaks at 96% in 2020, gradually decreases between 2020 and 2026, and remains between 90% and 92% for the rest of the projection.
• The share of U.S. refinery throughput that is exported increases as more petroleum products are exported from 2020 to 2036 and as domestic consumption of refined products decreases. The trend reverses after 2036 when domestic consumption (especially of gasoline) increases.
• Imports of unfinished oils peak in 2020 as U.S. refineries take advantage of the increased discount of the heavy, high-sulfur residual fuel oil available on the global market.
—as a result of sulfur emissions regulations that take effect in 2020
44

U.S. Energy Information Administration www.eia.gov/aeo#AEO2019U.S. Energy Information Administration 45
Development of the Arctic National Wildlife Refuge increases Alaskan crude oil production in AEO2019—
0.0
0.5
1.0
1.5
2.0
2.5
2000 2010 2020 2030 2040 2050
Alaskan crude oil productionmillion barrels per day
2018history projections
AEO2018Reference
High Oil and Gas Resource and Technology
High Oil Price
ReferenceLow Oil PriceLow Oil and Gas Resource and Technology
2010 2020 2030 2040 2050
ANWR crude oil productionmillion barrels per day
2018history projections
U.S. Energy Information Administration www.eia.gov/aeo#AEO2019U.S. Energy Information Administration
• The passage of Public Law 115-97 required the Secretary of the Interior to establish a program to lease and develop oil and natural gas from the coastal plain (1002 Area) of the Arctic National Wildlife Refuge (ANWR). Previously, ANWR was effectively under a drilling moratorium.
• Opening ANWR is not expected to have a significant impact on crude oil production before the 2030s because of the time needed to acquire leases, explore, and develop the required production infrastructure. Alaskan crude oil production in AEO2019 is 90% higher (3.2 billion barrels) from 2031 to 2050 than previously forecasted for that period in last year’s AEO Reference case.
• The ANWR projections are highly uncertain because of several factors that affect the timing and cost of development, little direct knowledge of the resource size and quality that exists in ANWR, and inherent uncertainty about market dynamics. Cumulative ANWR crude oil production from 2031 to 2050 is 6.8 billion barrels, 0.7 billion barrels, and zero in the High Oil and Gas Resource and Technology, Low Oil and Gas Resource and Technology, and Low Oil Price cases, respectively.
• A more in-depth analysis exploring the effect of this law on U.S. crude oil production projections was published in May 2018 as part of the AEO2018 Issues in Focus series.
—but only after 2030 because of the time needed to acquire leases and develop infrastructure
46
U.S. Energy Information Administration www.eia.gov/aeo#AEO2019U.S. Energy Information Administration
0%
5%
10%
15%
20%
25%
30%
35%
2015 2020 2025 2030
Tax credit assumptions for utility-scale solar percentage of installed cost
Jan-15 Jan-20 Jan-25 // Jan-50
AEO2019
AEO2018
Legislative milestone
(begin construction)
EIA assumedtwo-year lead time
four-year safe harbor
0
10
20
30
40
50
60
70
80
2020 2021 2022 2023
AEO2018 Reference caseAEO2019 Reference case
Power sector solar photovoltaic installed capacitygigawatts
47
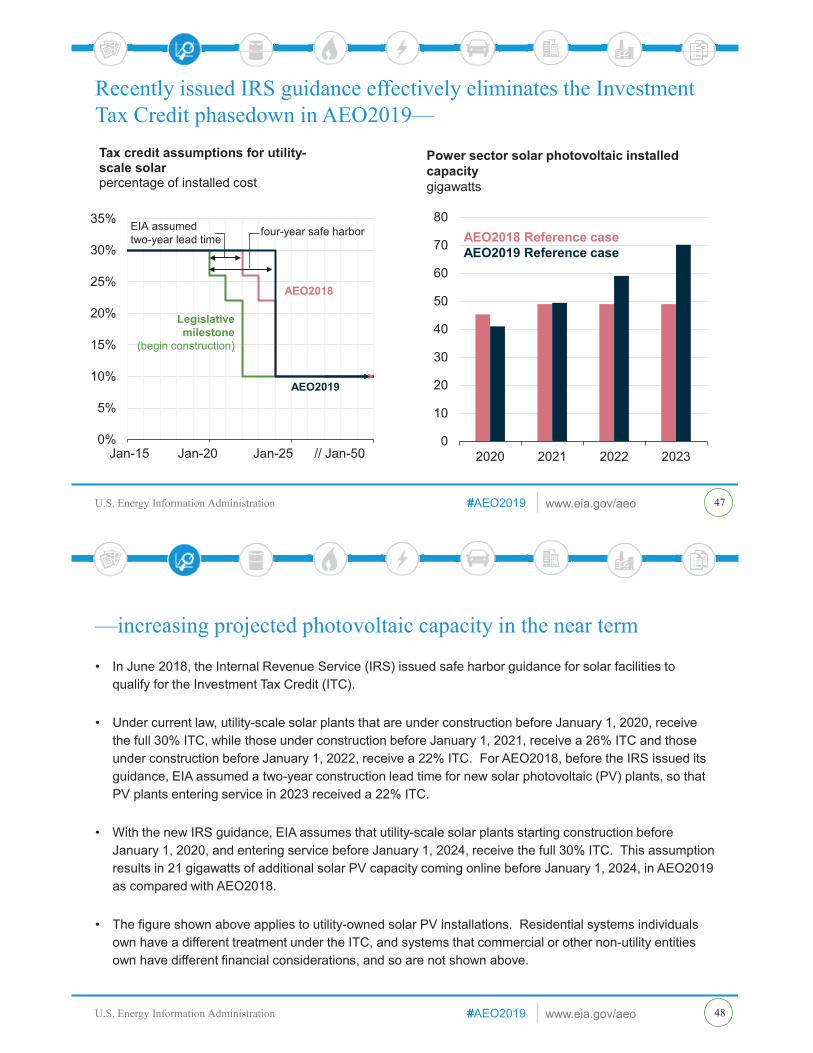
Recently issued IRS guidance effectively eliminates the Investment Tax Credit phasedown in AEO2019—
U.S. Energy Information Administration www.eia.gov/aeo#AEO2019U.S. Energy Information Administration
• In June 2018, the Internal Revenue Service (IRS) issued safe harbor guidance for solar facilities to qualify for the Investment Tax Credit (ITC).
• Under current law, utility-scale solar plants that are under construction before January 1, 2020, receive the full 30% ITC, while those under construction before January 1, 2021, receive a 26% ITC and those under construction before January 1, 2022, receive a 22% ITC. For AEO2018, before the IRS issued its guidance, EIA assumed a two-year construction lead time for new solar photovoltaic (PV) plants, so that PV plants entering service in 2023 received a 22% ITC.
• With the new IRS guidance, EIA assumes that utility-scale solar plants starting construction before January 1, 2020, and entering service before January 1, 2024, receive the full 30% ITC. This assumption results in 21 gigawatts of additional solar PV capacity coming online before January 1, 2024, in AEO2019 as compared with AEO2018.
• The figure shown above applies to utility-owned solar PV installations. Residential systems individuals own have a different treatment under the ITC, and systems that commercial or other non-utility entities own have different financial considerations, and so are not shown above.
—increasing projected photovoltaic capacity in the near term
48
U.S. Energy Information Administration www.eia.gov/aeo#AEO2019U.S. Energy Information Administration
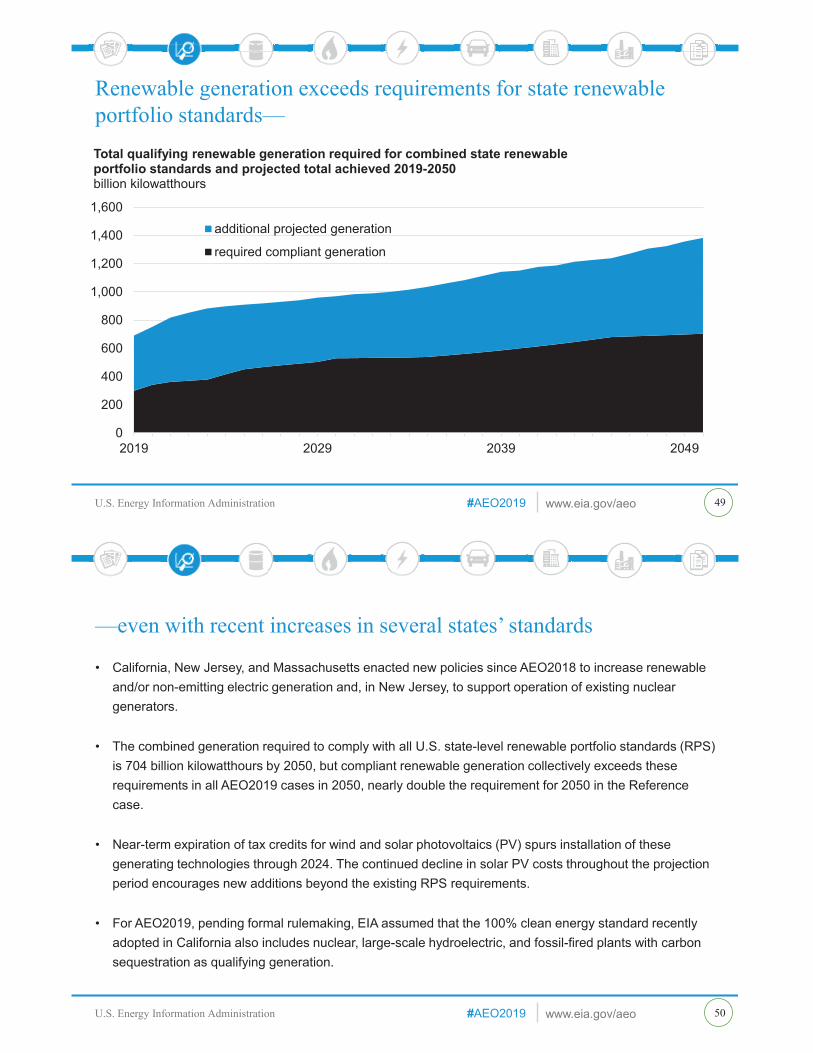
Renewable generation exceeds requirements for state renewable portfolio standards—
49
0
200
400
600
800
1,000
1,200
1,400
1,600
2019 2029 2039 2049
Total qualifying renewable generation required for combined state renewable portfolio standards and projected total achieved 2019-2050 billion kilowatthours
additional projected generation
required compliant generation
U.S. Energy Information Administration www.eia.gov/aeo#AEO2019U.S. Energy Information Administration
• California, New Jersey, and Massachusetts enacted new policies since AEO2018 to increase renewable and/or non-emitting electric generation and, in New Jersey, to support operation of existing nuclear generators.
• The combined generation required to comply with all U.S. state-level renewable portfolio standards (RPS) is 704 billion kilowatthours by 2050, but compliant renewable generation collectively exceeds these requirements in all AEO2019 cases in 2050, nearly double the requirement for 2050 in the Reference case.
• Near-term expiration of tax credits for wind and solar photovoltaics (PV) spurs installation of these generating technologies through 2024. The continued decline in solar PV costs throughout the projection period encourages new additions beyond the existing RPS requirements.
• For AEO2019, pending formal rulemaking, EIA assumed that the 100% clean energy standard recently adopted in California also includes nuclear, large-scale hydroelectric, and fossil-fired plants with carbon sequestration as qualifying generation.
—even with recent increases in several states’ standards
50

U.S. Energy Information Administration www.eia.gov/aeo#AEO2019U.S. Energy Information Administration
Petroleum and other liquidsU.S. crude oil and natural gas plant liquids production continues to grow as a result of the further development of tight oil resources during the projection period. During the same period, domestic consumption falls, making the United States a net exporter of liquid fuels in the Reference case.
U.S. Energy Information Administration www.eia.gov/aeo#AEO2019U.S. Energy Information Administration
U.S. Energy Information Administration www.eia.gov/aeo#AEO2019U.S. Energy Information Administration
0
5
10
15
20
25
30
2000 2010 2020 2030 2040 2050
2018history projections
U.S. crude oil and natural gas plant liquids productionmillion barrels per day
High Oil and Gas Resource and TechnologyHigh Oil PriceHigh Economic GrowthReferenceLow EconomicGrowthLow Oil PriceLow Oil and Gas Resource and TechnologyReference, crude oil only
1970 crude oil production level
0
5
10
15
20
25
30
2000 2010 2020 2030 2040 2050
Petroleum and other liquids consumptionmillion barrels per day
2018history projections
Low Oil PriceHigh Economic GrowthHigh Oil and Gas Resource and TechnologyReferenceLow Oil and Gas Resource and TechnologyLow EconomicGrowthHigh Oil Price
53
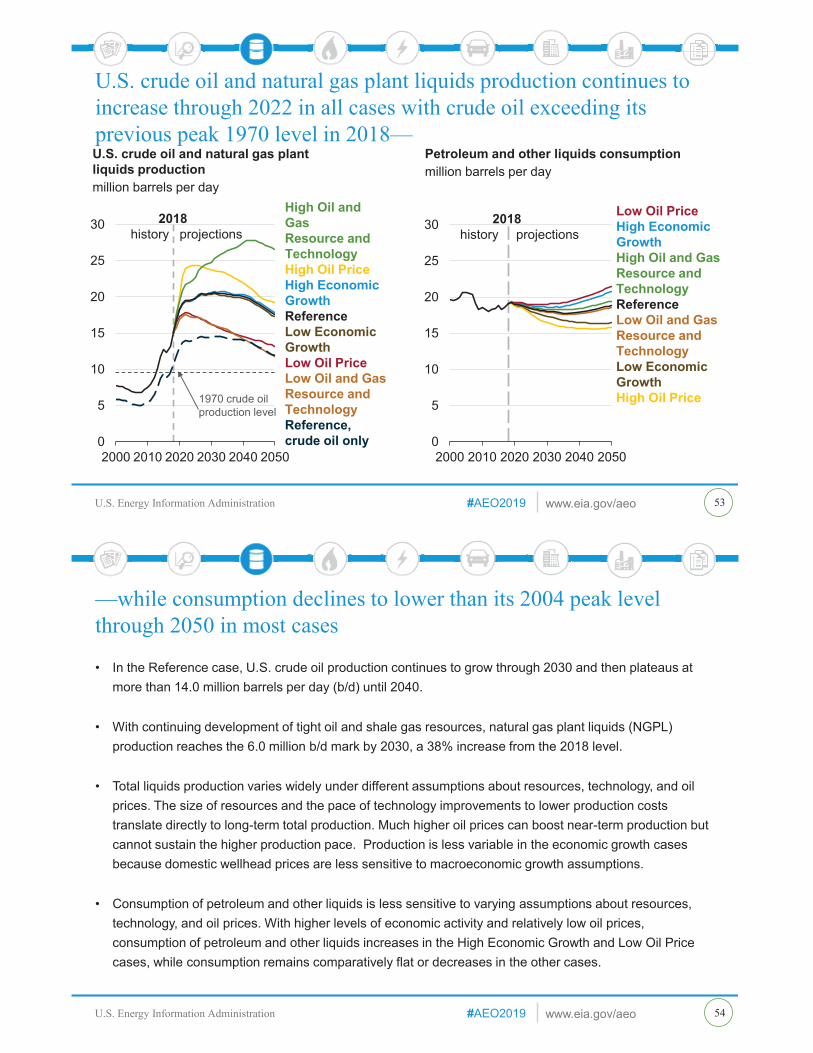
U.S. crude oil and natural gas plant liquids production continues to increase through 2022 in all cases with crude oil exceeding its previous peak 1970 level in 2018—
i
U.S. Energy Information Administration www.eia.gov/aeo#AEO2019U.S. Energy Information Administration
• In the Reference case, U.S. crude oil production continues to grow through 2030 and then plateaus at more than 14.0 million barrels per day (b/d) until 2040.
• With continuing development of tight oil and shale gas resources, natural gas plant liquids (NGPL) production reaches the 6.0 million b/d mark by 2030, a 38% increase from the 2018 level.
• Total liquids production varies widely under different assumptions about resources, technology, and oil prices. The size of resources and the pace of technology improvements to lower production costs translate directly to long-term total production. Much higher oil prices can boost near-term production but cannot sustain the higher production pace. Production is less variable in the economic growth cases because domestic wellhead prices are less sensitive to macroeconomic growth assumptions.
• Consumption of petroleum and other liquids is less sensitive to varying assumptions about resources, technology, and oil prices. With higher levels of economic activity and relatively low oil prices, consumption of petroleum and other liquids increases in the High Economic Growth and Low Oil Price cases, while consumption remains comparatively flat or decreases in the other cases.
—while consumption declines to lower than its 2004 peak level through 2050 in most cases
54

U.S. Energy Information Administration www.eia.gov/aeo#AEO2019U.S. Energy Information Administration 55
Tight oil development drives U.S. crude oil production from 2018 to 2050—
2010 2020 2030 2040 2050
Low Oil and Gas Resourceand Technology2018
history projections
0
5
10
15
20
25
2000 2010 2020 2030 2040 2050
Crude oil productionmillion barrels per day
tight oil
AlaskaGulf of Mexicoother
Reference2018history projections
2010 2020 2030 2040 2050
High Oil and Gas Resource and Technology2018
history projections
U.S. Energy Information Administration www.eia.gov/aeo#AEO2019U.S. Energy Information Administration
• Lower 48 onshore tight oil development continues to be the main driver of total U.S. crude oil production, accounting for about 68% of cumulative domestic production in the Reference case during the projection period.
• U.S. crude oil production levels off at about 14 million barrels per day (b/d) through 2040 in the Reference case as tight oil development moves into less productive areas and well productivity declines.
• In the Reference case, oil and natural gas resource discoveries in deepwater in the Gulf of Mexico lead Lower 48 states offshore production to reach a record 2.4 million b/d in 2022. Many of these discoveries resulted from exploration when oil prices were higher than $100 per barrel before the oil price collapse in 2015 and are being developed as oil prices rise. Offshore production then declines through 2035 before flattening through 2050 as a result of new discoveries offsetting declines in legacy fields.
• Alaska crude oil production increases through 2030, driven primarily by the development of fields in the National Petroleum Reserve–Alaska (NPR-A), and after 2030, the development of fields in the 1002 Section of the Arctic National Wildlife Refuge (ANWR). Exploration and development of fields in ANWR is not economical in the Low Oil Price case.
—a result consistent across all side cases
56
U.S. Energy Information Administration www.eia.gov/aeo#AEO2019U.S. Energy Information Administration
0
1
2
3
4
5
6
2000 2010 2020 2030 2040 2050
Lower 48 onshore crude oil production by region (Reference case)million barrels per day
2018history projections
Southwest
Gulf CoastNorthern Great Plains
Rocky Mountains MidcontinentEast West Coast
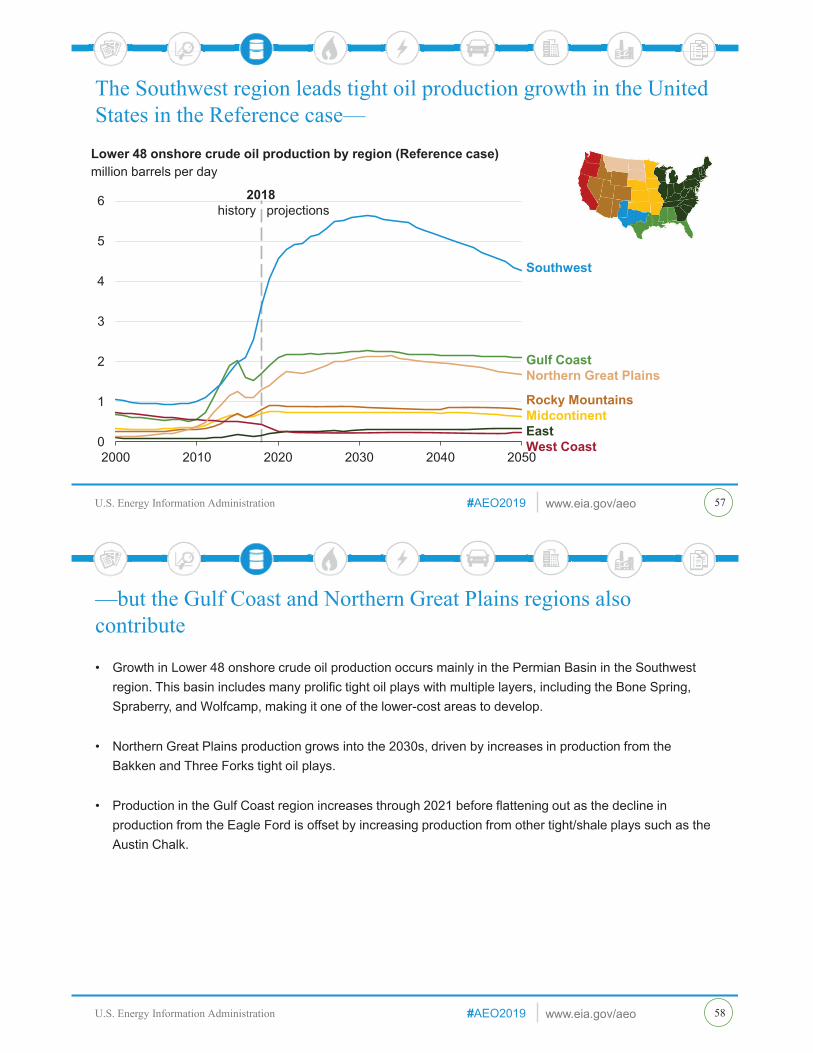
The Southwest region leads tight oil production growth in the United States in the Reference case—
57
U.S. Energy Information Administration www.eia.gov/aeo#AEO2019U.S. Energy Information Administration
• Growth in Lower 48 onshore crude oil production occurs mainly in the Permian Basin in the Southwest region. This basin includes many prolific tight oil plays with multiple layers, including the Bone Spring, Spraberry, and Wolfcamp, making it one of the lower-cost areas to develop.
• Northern Great Plains production grows into the 2030s, driven by increases in production from the Bakken and Three Forks tight oil plays.
• Production in the Gulf Coast region increases through 2021 before flattening out as the decline in production from the Eagle Ford is offset by increasing production from other tight/shale plays such as the Austin Chalk.
—but the Gulf Coast and Northern Great Plains regions also contribute
58

U.S. Energy Information Administration www.eia.gov/aeo#AEO2019U.S. Energy Information Administration 59
Natural gas plant liquids production increases in most AEO cases—
0
1
2
3
4
5
6
7
8
9
1980 1990 2000 2010 2020 2030 2040 2050
U.S. natural gas plant liquids productionmillion barrels per day
2018history projections High Oil and Gas
Resource and TechnologyHigh Oil PriceHigh Economic GrowthReferenceLow EconomicGrowthLow Oil PriceLow Oil and Gas Resource and Technology
U.S. Energy Information Administration www.eia.gov/aeo#AEO2019U.S. Energy Information Administration
• In the Reference case, natural gas plant liquids (NGPL) production grows by 32% between 2018 and 2050 as a result of demand increases in the global petrochemical industry.
• Most NGPL production growth in the Reference case occurs before 2025 as producers focus on natural gas liquids-rich plays, where NGPL-to-gas ratios are highest and increased demand spurs higher ethane recovery.
• NGPL production is sensitive to changes in resource and technology assumptions. In the High Oil and Gas Resource and Technology case, which has higher rates of technological improvement, higher recovery estimates, and additional tight oil and shale gas resources, NGPL production grows by 73% between 2018 and 2050. In contrast, in the Low Oil and Gas Resource and Technology, which has lower rates of technological improvement and lower recovery estimates, NGPL production declines by 10% between 2018 and 2050.
—because of higher levels of drilling in liquid-rich natural gas formations and increased demand
60
U.S. Energy Information Administration www.eia.gov/aeo#AEO2019U.S. Energy Information Administration 61
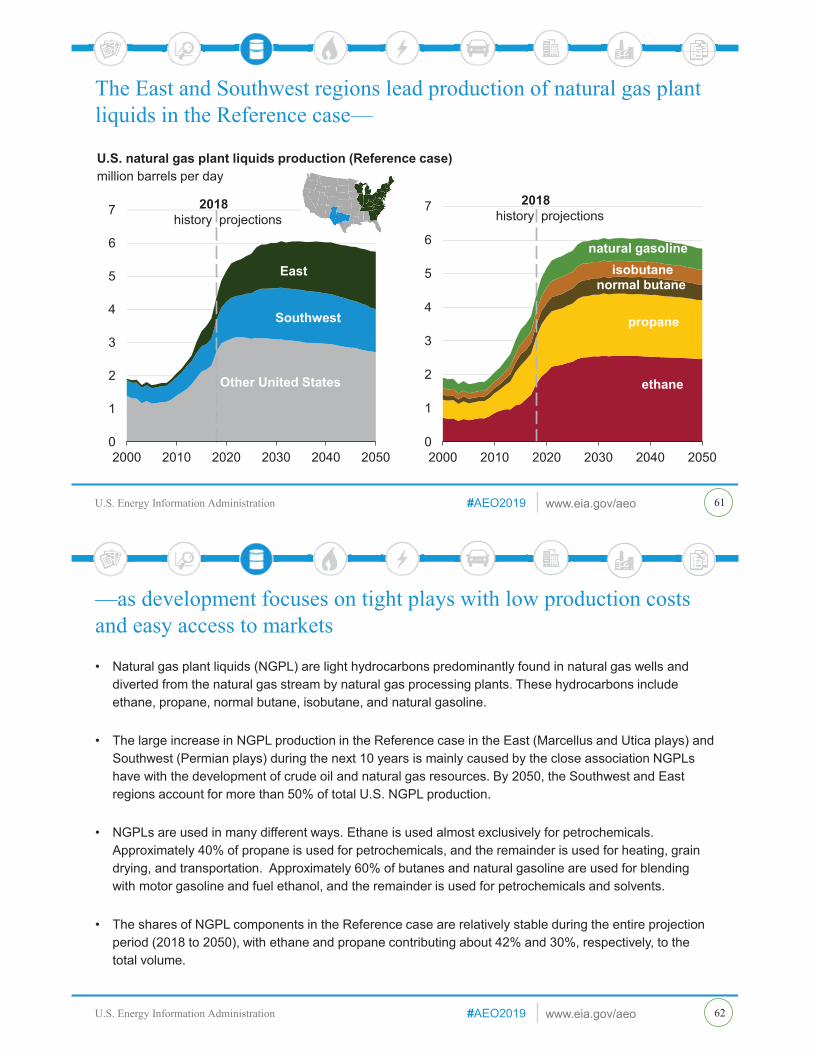
The East and Southwest regions lead production of natural gas plant liquids in the Reference case—
0
1
2
3
4
5
6
7
2000 2010 2020 2030 2040 2050
2018history projections
normal butaneisobutane
propane
ethane
natural gasoline
0
1
2
3
4
5
6
7
2000 2010 2020 2030 2040 2050
2018history projections
East
Southwest
Other United States
U.S. natural gas plant liquids production (Reference case)million barrels per day
U.S. Energy Information Administration www.eia.gov/aeo#AEO2019U.S. Energy Information Administration
• Natural gas plant liquids (NGPL) are light hydrocarbons predominantly found in natural gas wells and diverted from the natural gas stream by natural gas processing plants. These hydrocarbons include ethane, propane, normal butane, isobutane, and natural gasoline.
• The large increase in NGPL production in the Reference case in the East (Marcellus and Utica plays) and Southwest (Permian plays) during the next 10 years is mainly caused by the close association NGPLs have with the development of crude oil and natural gas resources. By 2050, the Southwest and East regions account for more than 50% of total U.S. NGPL production.
• NGPLs are used in many different ways. Ethane is used almost exclusively for petrochemicals. Approximately 40% of propane is used for petrochemicals, and the remainder is used for heating, grain drying, and transportation. Approximately 60% of butanes and natural gasoline are used for blending with motor gasoline and fuel ethanol, and the remainder is used for petrochemicals and solvents.
• The shares of NGPL components in the Reference case are relatively stable during the entire projection period (2018 to 2050), with ethane and propane contributing about 42% and 30%, respectively, to the total volume.
—as development focuses on tight plays with low production costs and easy access to markets
62

U.S. Energy Information Administration www.eia.gov/aeo#AEO2019U.S. Energy Information Administration 63
Most natural gas liquids in the Reference case serve as feedstocks to the bulk chemical industry—
0
1
2
3
4
5
6
2000 2010 2020 2030 2040 2050
U.S. industrial NGL consumption (Reference case)quadrillion British thermal units
2018history projections
chemical feedstocks
heat and power
U.S. Energy Information Administration www.eia.gov/aeo#AEO2019U.S. Energy Information Administration
• Consumption of ethane, propane, and butane used as bulk chemical feedstock grows an average of 1.5% per year between 2018 and 2050 in the Reference case, compared with 3.1% per year from 2010 to 2018.
• The consumption of natural gas liquids (NGL) as feedstock grows faster in the High Economic Growth case (1.9% per year) and the High Resource and Technology case (1.8% per year). In the High Economic Growth case, demand for all goods is higher than in the Reference case, including bulk chemicals for domestic use and export. In the High Resource and Technology case, NGL are more abundant and less expensive. As a result, shipments of bulk chemicals are greater.
• Most NGL feedstock is ethane, which is processed almost exclusively into ethylene, a building block for plastics, resins, and other industrial products. Propane, normal butane, and isobutane are also used to produce propylene and butadiene, respectively, but in much smaller quantities compared with ethane.
• Propane is used in the agriculture sector for grain drying and heating and in the construction industry for heating and for powering vehicles and equipment.
—although a small proportion is also used as fuel
64

U.S. Energy Information Administration www.eia.gov/aeo#AEO2019U.S. Energy Information Administration
-15
-10
-5
0
5
10
15
2000 2010 2020 2030 2040 2050
U.S. petroleum and other liquids net imports/exportsmillion barrels per day
2018history projections
net imports
net exports
Low Oil PriceLow Oil and GasResource and TechnologyReference
High Oil PriceHigh Oil and GasResource and Technology
In the Reference case, the United States becomes a net exporter of petroleum on a volume basis from 2020 to 2049—
65
U.S. Energy Information Administration www.eia.gov/aeo#AEO2019U.S. Energy Information Administration
• Net U.S. imports of crude oil and liquid fuels will fall between 2018 and 2034 in the Reference case as strong production growth and decreasing domestic demand result in the United States becoming a net exporter.
• In the Reference case, net exports from the United States peak at more than 3.68 million barrels per day (b/d) in 2034 before gradually reversing as domestic consumption rises. The United States returns to being a net importer in 2050 on a volume basis.
• Additional resources and higher levels of technological improvement in the High Oil and Gas Resource and Technology case results in higher crude oil production and higher exports, with exports reaching a high of 10.26 million b/d in 2041. Projected net exports reach a high of 8.39 million b/d in 2033 in the High Oil Price case as a result of higher prices that support higher domestic production. Conversely, low oil prices in the Low Oil Price case drive projected net imports up from 2.37 million b/d in 2018 to 7.17 million b/d in 2050.
—but side case results vary significantly using different assumptions
66
U.S. Energy Information Administration www.eia.gov/aeo#AEO2019U.S. Energy Information Administration 67
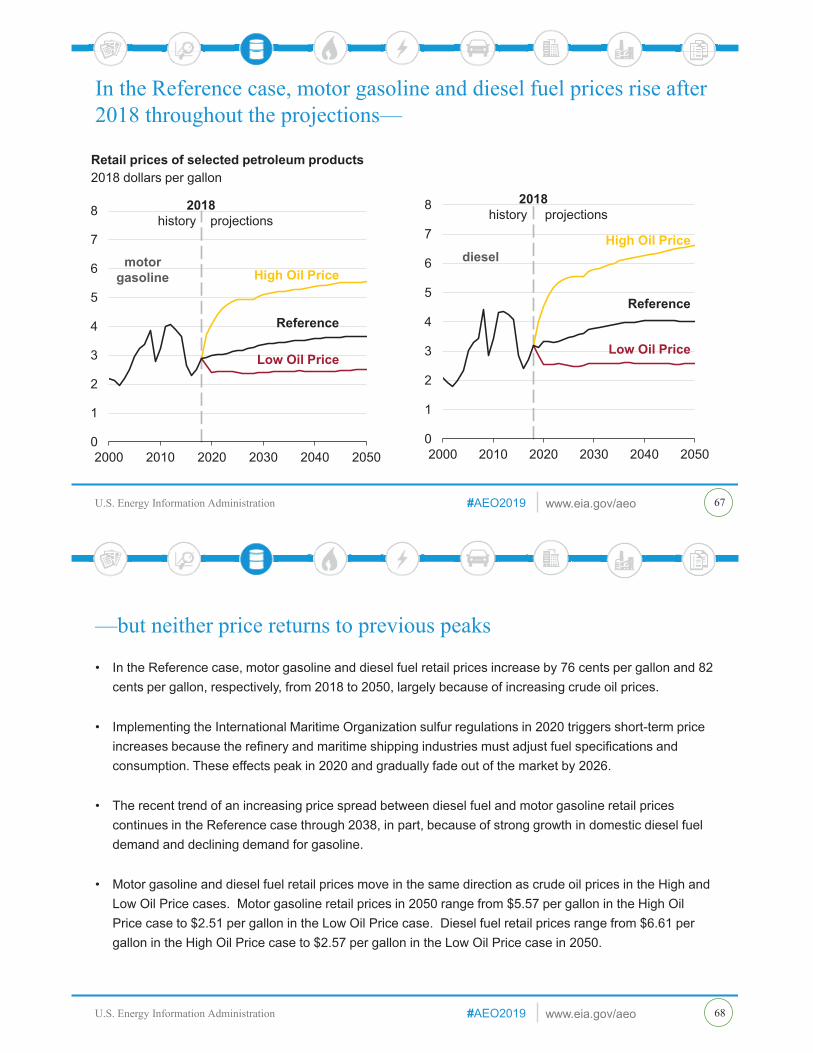
In the Reference case, motor gasoline and diesel fuel prices rise after 2018 throughout the projections—
0
1
2
3
4
5
6
7
8
2000 2010 2020 2030 2040 2050
2018history projections
motor gasoline High Oil Price
Reference
Low Oil Price
Retail prices of selected petroleum products2018 dollars per gallon
0
1
2
3
4
5
6
7
8
2000 2010 2020 2030 2040 2050
diesel
2018history projections
High Oil Price
Reference
Low Oil Price
U.S. Energy Information Administration www.eia.gov/aeo#AEO2019U.S. Energy Information Administration
• In the Reference case, motor gasoline and diesel fuel retail prices increase by 76 cents per gallon and 82 cents per gallon, respectively, from 2018 to 2050, largely because of increasing crude oil prices.
• Implementing the International Maritime Organization sulfur regulations in 2020 triggers short-term price increases because the refinery and maritime shipping industries must adjust fuel specifications and consumption. These effects peak in 2020 and gradually fade out of the market by 2026.
• The recent trend of an increasing price spread between diesel fuel and motor gasoline retail prices continues in the Reference case through 2038, in part, because of strong growth in domestic diesel fuel demand and declining demand for gasoline.
• Motor gasoline and diesel fuel retail prices move in the same direction as crude oil prices in the High and Low Oil Price cases. Motor gasoline retail prices in 2050 range from $5.57 per gallon in the High Oil Price case to $2.51 per gallon in the Low Oil Price case. Diesel fuel retail prices range from $6.61 per gallon in the High Oil Price case to $2.57 per gallon in the Low Oil Price case in 2050.
—but neither price returns to previous peaks
68
U.S. Energy Information Administration www.eia.gov/aeo#AEO2019U.S. Energy Information Administration
Natural gasNatural gas experiences the largest production increase of all fossil fuels during the projection period across all cases, driven by continued development of lower-cost shale gas and tight oil resources. The growth in natural gas production supports increasing domestic consumption, particularly in the industrial and electric power sectors, and higher levels of natural gas exports.
U.S. Energy Information Administration www.eia.gov/aeo#AEO2019U.S. Energy Information Administration
U.S. Energy Information Administration www.eia.gov/aeo#AEO2019U.S. Energy Information Administration 71
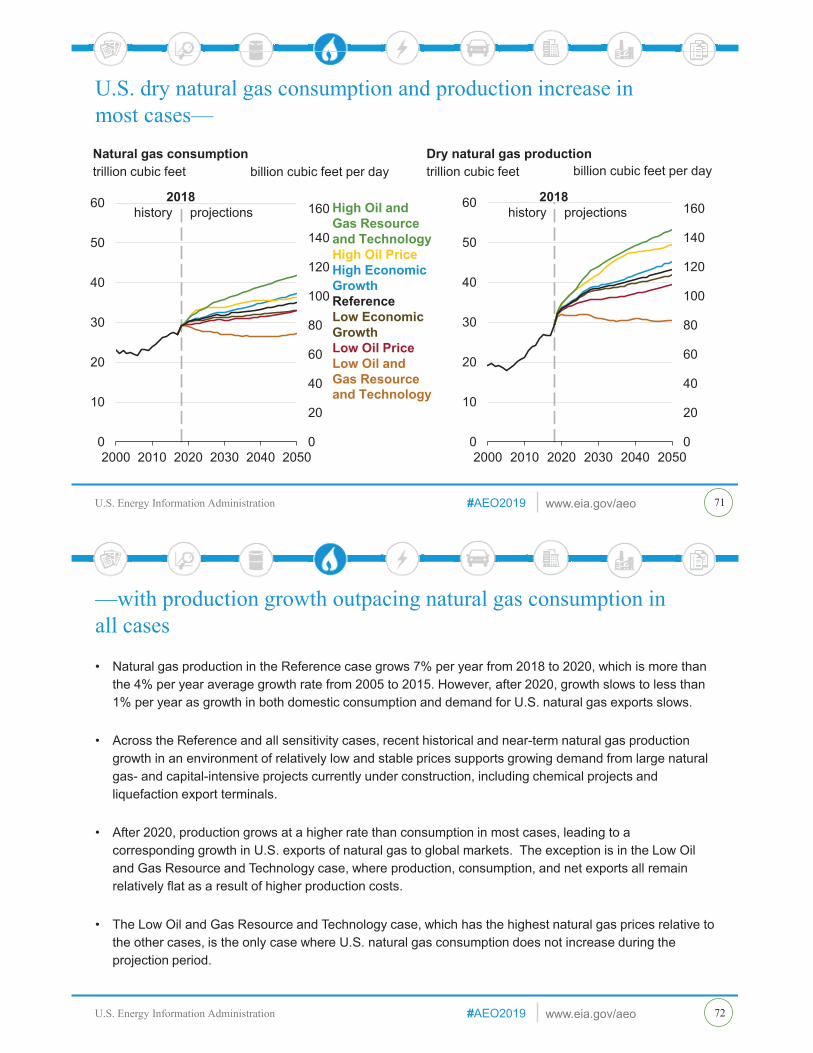
U.S. dry natural gas consumption and production increase in most cases—
0
20
40
60
80
100
120
140
160
0
10
20
30
40
50
60
2000 2010 2020 2030 2040 2050
Natural gas consumptiontrillion cubic feet
2018history projections High Oil and
Gas Resource and TechnologyHigh Oil PriceHigh Economic GrowthReferenceLow EconomicGrowthLow Oil PriceLow Oil and Gas Resource and Technology
billion cubic feet per day
0
20
40
60
80
100
120
140
160
0
10
20
30
40
50
60
2000 2010 2020 2030 2040 2050
Dry natural gas productiontrillion cubic feet billion cubic feet per day
2018history projections
U.S. Energy Information Administration www.eia.gov/aeo#AEO2019U.S. Energy Information Administration
• Natural gas production in the Reference case grows 7% per year from 2018 to 2020, which is more than the 4% per year average growth rate from 2005 to 2015. However, after 2020, growth slows to less than 1% per year as growth in both domestic consumption and demand for U.S. natural gas exports slows.
• Across the Reference and all sensitivity cases, recent historical and near-term natural gas production growth in an environment of relatively low and stable prices supports growing demand from large natural gas- and capital-intensive projects currently under construction, including chemical projects and liquefaction export terminals.
• After 2020, production grows at a higher rate than consumption in most cases, leading to a corresponding growth in U.S. exports of natural gas to global markets. The exception is in the Low Oil and Gas Resource and Technology case, where production, consumption, and net exports all remain relatively flat as a result of higher production costs.
• The Low Oil and Gas Resource and Technology case, which has the highest natural gas prices relative to the other cases, is the only case where U.S. natural gas consumption does not increase during the projection period.
—with production growth outpacing natural gas consumption in all cases
72
U.S. Energy Information Administration www.eia.gov/aeo#AEO2019U.S. Energy Information Administration
0
10
20
30
40
50
60
2000 2010 2020 2030 2040 2050
Dry natural gas productiontrillion cubic feet
2018history projections
ReferenceHigh Oil and
Gas Resource and Technology
Low Oil and Gas Resource and Technology
0
2
4
6
8
10
12
2000 2010 2020 2030 2040 2050
Natural gas spot price at Henry Hub2
2018 dollars per million British thermal unit
2018history projections
Low Oil and Gas Resource and Technology
Reference
High Oil and Gas Resource and Technology
73
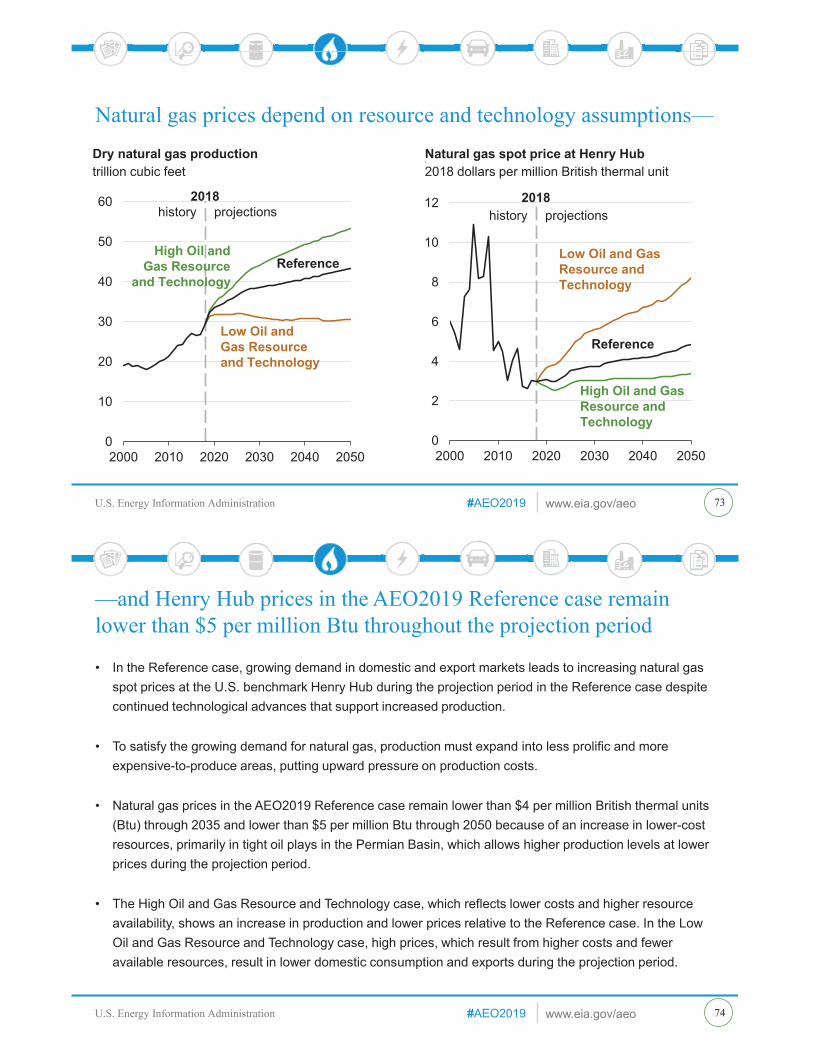
Natural gas prices depend on resource and technology assumptions—
U.S. Energy Information Administration www.eia.gov/aeo#AEO2019U.S. Energy Information Administration
• In the Reference case, growing demand in domestic and export markets leads to increasing natural gas spot prices at the U.S. benchmark Henry Hub during the projection period in the Reference case despite continued technological advances that support increased production.
• To satisfy the growing demand for natural gas, production must expand into less prolific and more expensive-to-produce areas, putting upward pressure on production costs.
• Natural gas prices in the AEO2019 Reference case remain lower than $4 per million British thermal units (Btu) through 2035 and lower than $5 per million Btu through 2050 because of an increase in lower-cost resources, primarily in tight oil plays in the Permian Basin, which allows higher production levels at lower prices during the projection period.
• The High Oil and Gas Resource and Technology case, which reflects lower costs and higher resource availability, shows an increase in production and lower prices relative to the Reference case. In the Low Oil and Gas Resource and Technology case, high prices, which result from higher costs and fewer available resources, result in lower domestic consumption and exports during the projection period.
—and Henry Hub prices in the AEO2019 Reference case remain lower than $5 per million Btu throughout the projection period
74
U.S. Energy Information Administration www.eia.gov/aeo#AEO2019U.S. Energy Information Administration 75
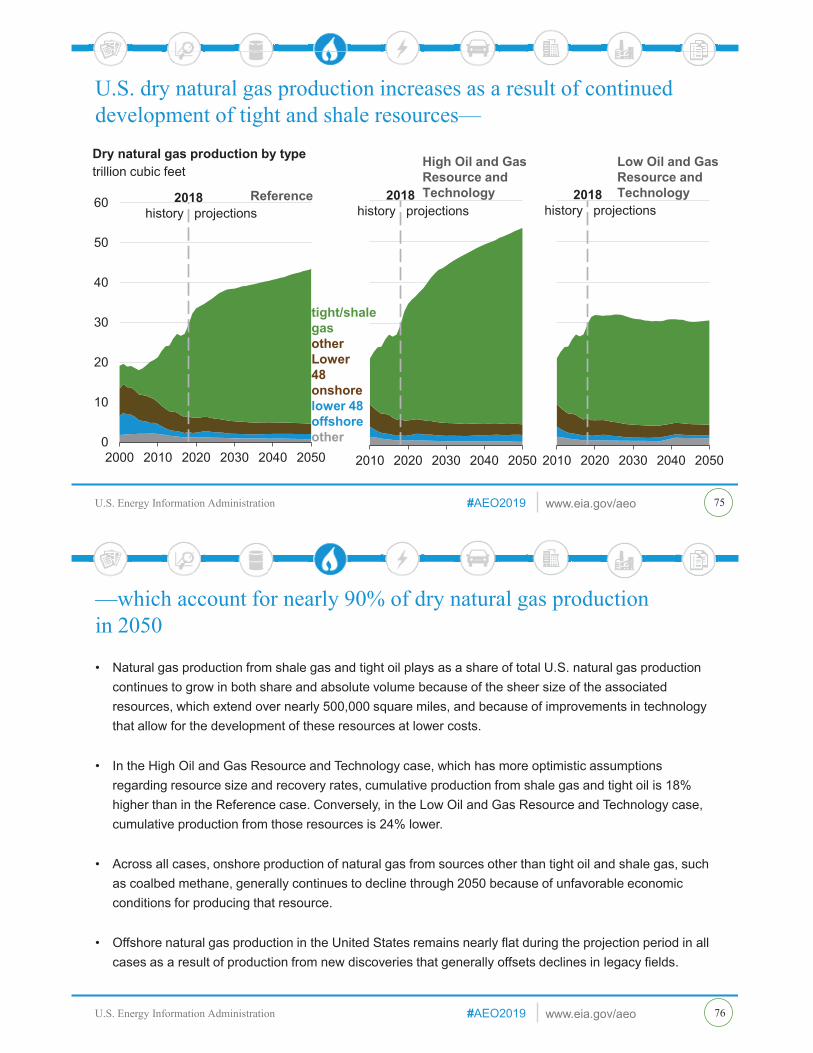
U.S. dry natural gas production increases as a result of continued development of tight and shale resources—
0
10
20
30
40
50
60
2000 2010 2020 2030 2040 2050
Dry natural gas production by typetrillion cubic feet
Reference
tight/shale gasotherLower 48 onshorelower 48 offshoreother
2018history projections
2010 2020 2030 2040 2050
High Oil and Gas Resource and Technology2018
history projections
2010 2020 2030 2040 2050
Low Oil and Gas Resource and Technology2018
history projections
U.S. Energy Information Administration www.eia.gov/aeo#AEO2019U.S. Energy Information Administration
• Natural gas production from shale gas and tight oil plays as a share of total U.S. natural gas production continues to grow in both share and absolute volume because of the sheer size of the associated resources, which extend over nearly 500,000 square miles, and because of improvements in technology that allow for the development of these resources at lower costs.
• In the High Oil and Gas Resource and Technology case, which has more optimistic assumptions regarding resource size and recovery rates, cumulative production from shale gas and tight oil is 18% higher than in the Reference case. Conversely, in the Low Oil and Gas Resource and Technology case, cumulative production from those resources is 24% lower.
• Across all cases, onshore production of natural gas from sources other than tight oil and shale gas, such as coalbed methane, generally continues to decline through 2050 because of unfavorable economic conditions for producing that resource.
• Offshore natural gas production in the United States remains nearly flat during the projection period in all cases as a result of production from new discoveries that generally offsets declines in legacy fields.
—which account for nearly 90% of dry natural gas production in 2050
76

U.S. Energy Information Administration www.eia.gov/aeo#AEO2019U.S. Energy Information Administration 77
Eastern U.S. production of natural gas from shale resources leads growth in the Reference case—
0
5
10
15
20
25
30
35
40
45
2000 2010 2020 2030 2040 2050
Dry shale gas production by regiontrillion cubic feet
2018history projections
Southwest
East
Gulf Coast
rest of U.S.
Reference
2010 2020 2030 2040 2050
High Oil and Gas Resource and Technology2018
history projections
2010 2020 2030 2040 2050
Low Oil and Gas Resource and Technology2018
history projections
U.S. Energy Information Administration www.eia.gov/aeo#AEO2019U.S. Energy Information Administration
• Total U.S. natural gas production across most cases is driven by continued development of the Marcellus and Utica shale plays in the East.
• Natural gas from the Eagle Ford (co-produced with oil) and the Haynesville plays in the Gulf Coast region also contributes to domestic dry natural gas production.
• Associated natural gas production from tight oil production in the Permian Basin in the Southwest region grows strongly in the early part of the projection period but remains relatively flat after 2030.
• Technological advancements and improvements in industry practices lower production costs in the Reference case and increase the volume of oil and natural gas recovery per well. These advancements have a significant cumulative effect in plays that extend over wide areas and that have large undeveloped resources (Marcellus, Utica, and Haynesville).
• Natural gas production from regions with shale and tight resources show higher levels of variability across the resource and technology cases, compared with the Reference case because assumptions in those cases target those specific resources.
—followed by growth in Gulf Coast onshore production
78

U.S. Energy Information Administration www.eia.gov/aeo#AEO2019U.S. Energy Information Administration 79
Natural gas production flows increase from the Mid-Atlantic and Ohio to the South Central through the Eastern Midwest—
0
1
2
3
4
5
6
7
8
2010 2020 2030 2040 2050
to Eastern Midwest
to Southeastto New England
Flows of natural gas from theMid-Atlantic and Ohio (Reference case)trillion cubic feet
2018history projections
st
0
1
2
3
4
5
6
7
8
2010 2020 2030 2040 2050
2018history projections
Flows of natural gas to the South Central (Reference case)trillion cubic feet
from Eastern Midwestfrom Arizona/New Mexicofrom Rocky Mountain Great Plains
U.S. Energy Information Administration www.eia.gov/aeo#AEO2019U.S. Energy Information Administration
• Reference case growth of natural gas production in the Mid-Atlantic and Ohio region, from the Marcellus and Utica formations, continues the trend of more natural gas flowing out of the region. This trend
• Although historically a net supplier of natural gas to U.S. markets, the South Central region’s demand growth outpaces production growth throughout the projection period. In addition to increased natural gas consumption in both the industrial and electric power sectors during the projection period in this region, U.S. natural gas exports to Mexico and U.S. liquefied natural gas exports from Gulf Coast facilities also rise. As a result, the Gulf Coast will become the fastest-growing demand market in the United States.
• To transport increased volumes of natural gas from the Mid-Atlantic and Ohio region to demand in the South Central region, additional natural gas pipeline capacity will be built from the Mid-Atlantic through the Eastern Midwest region.
—as growth in domestic consumption and exports is concentrated in the Gulf Coast
80

U.S. Energy Information Administration www.eia.gov/aeo#AEO2019U.S. Energy Information Administration
0
20
40
60
80
100
0
5
10
15
20
25
30
35
40
2000 2010 2020 2030 2040 2050
Natural gas consumption by sector (Reference case) trillion cubic feet billion cubic feet per day
2018history projections
residential
electric power
industrialliquefactionlease and plantother
commercialtransportation
Industrial and electric power demand drives natural gas consumption growth—
81
U.S. Energy Information Administration www.eia.gov/aeo#AEO2019U.S. Energy Information Administration
• Natural gas prices that are relatively low compared with historical prices lead to growing use of natural gas across most end-use sectors.
• The industrial sector, which includes fuel used for liquefaction at export facilities and in lease and plant operations, is the largest consumer of natural gas in the Reference case. Major natural gas consumers in this sector include the chemical industry (where natural gas is used as a feedstock to produce methanol and ammonia), industrial heat and power, and lease and plant fuel.
• Natural gas used for electric power generation generally increases during the projection period but at a slower rate than in the industrial sector. This growth is supported by the scheduled expiration of renewable tax credits in the mid-2020s, as well as the retirement of coal-fired and nuclear generation capacity during the projection period.
• Natural gas consumption in the residential and commercial sectors remains largely flat because of efficiency gains and population shifts that counterbalance demand growth. Although natural gas use rises in the transportation sector, particularly for freight trucks and rail and marine shipping, it remains a small share of both transportation fuel demand and total natural gas consumption.
—while consumption in the residential and commercial sectors remains relatively flat across the projection period in the Reference case
82
U.S. Energy Information Administration www.eia.gov/aeo#AEO2019U.S. Energy Information Administration 83
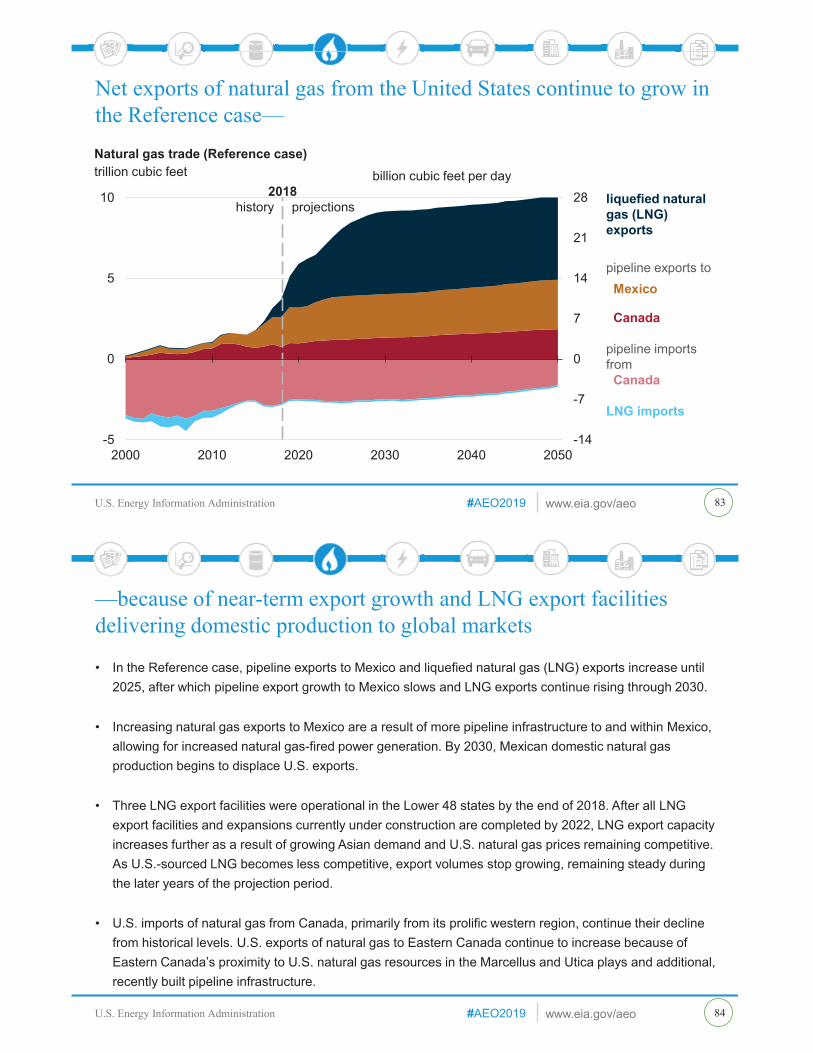
Net exports of natural gas from the United States continue to grow in the Reference case—
-14
-7
0
7
14
21
28
-5
0
5
10
2000 2010 2020 2030 2040 2050
Natural gas trade (Reference case)trillion cubic feet
2018history projections liquefied natural
gas (LNG) exports
pipeline exports to Mexico
Canada
pipeline imports fromCanada
LNG imports
billion cubic feet per day
U.S. Energy Information Administration www.eia.gov/aeo#AEO2019U.S. Energy Information Administration
• In the Reference case, pipeline exports to Mexico and liquefied natural gas (LNG) exports increase until 2025, after which pipeline export growth to Mexico slows and LNG exports continue rising through 2030.
• Increasing natural gas exports to Mexico are a result of more pipeline infrastructure to and within Mexico, allowing for increased natural gas-fired power generation. By 2030, Mexican domestic natural gas production begins to displace U.S. exports.
• Three LNG export facilities were operational in the Lower 48 states by the end of 2018. After all LNG export facilities and expansions currently under construction are completed by 2022, LNG export capacity increases further as a result of growing Asian demand and U.S. natural gas prices remaining competitive. As U.S.-sourced LNG becomes less competitive, export volumes stop growing, remaining steady during the later years of the projection period.
• U.S. imports of natural gas from Canada, primarily from its prolific western region, continue their decline from historical levels. U.S. exports of natural gas to Eastern Canada continue to increase because of Eastern Canada’s proximity to U.S. natural gas resources in the Marcellus and Utica plays and additional, recently built pipeline infrastructure.
—because of near-term export growth and LNG export facilities delivering domestic production to global markets
84

U.S. Energy Information Administration www.eia.gov/aeo#AEO2019U.S. Energy Information Administration 85
U.S. LNG exports are sensitive to both oil and natural gas prices—
0
5
10
15
20
25
30
35
0
2
4
6
8
10
12
2000 2010 2020 2030 2040 2050
Liquefied natural gas exportstrillion cubic feet
2018history projections
billion cubic feet per day
High OilPriceHigh Oil and Gas Resource and TechnologyReferenceLow Oil and Gas Resource and TechnologyLow OilPrice 0
1
2
3
4
5
6
7
8
9
2000 2010 2020 2030 2040 2050
Brent crude oil price to Henry Hub natural gas price ratioenergy-equivalent terms
2018history projections
U.S. Energy Information Administration www.eia.gov/aeo#AEO2019U.S. Energy Information Administration
• Historically, most liquefied natural gas (LNG) was traded under long-term contracts linked to crude oil prices because the regional nature of natural gas markets prevented the development of a natural gas price index that could be used globally. In addition to providing a liquid pricing benchmark, crude oil to some degree can substitute for natural gas in industry and for power generation.
• When the crude oil-to-natural gas price ratio is highest, such as in the High Oil Price case, U.S. LNG exports are at their highest levels. U.S. LNG supplies have the advantage of being priced based on relatively low domestic spot prices instead of oil-linked contracts. Also, demand for LNG increases, in part, as a result of consumers moving away from petroleum products.
• In the High Oil and Gas Resource and Technology case, low U.S. natural gas prices make U.S. LNG exports competitive relative to other suppliers. Conversely, higher U.S. natural gas prices in the Low Oil and Gas Resource and Technology case result in lower U.S. LNG exports.
• As more natural gas is traded via short-term contracts or traded on the spot market, the link between LNG and oil prices weakens over time, making U.S. LNG exports less sensitive to the crude oil-to-natural gas price ratio and causing growth in U.S. LNG exports to slow in all cases.
—resulting in a wide range of U.S. LNG export levels across cases
86

U.S. Energy Information Administration www.eia.gov/aeo#AEO2019U.S. Energy Information Administration
ElectricityAs electricity demand grows modestly, the primary drivers for new capacity in the Reference case are the retirements of older, less-efficient fossil fuel units, the near-term availability of renewable energy tax credits, and the continued decline in the capital cost of renewables, especially solar photovoltaic. Low natural gas prices and favorable costs for renewables result in natural gas and renewables as the primary sources of new generation capacity. The future generation mix is sensitive to the price of natural gas and the growth in electricity demand.
U.S. Energy Information Administration www.eia.gov/aeo#AEO2019U.S. Energy Information Administration

U.S. Energy Information Administration www.eia.gov/aeo#AEO2019U.S. Energy Information Administration 89
Electricity demand grows slowly through 2050 in the Reference case—
-1
0
1
2
3
4
5
1990 2000 2010 2020 2030 2040 2050
Electricity use growth rate percent growth (three-year rolling average)
2018history projections
High Economic GrowthReferenceLow Economic Growth
0
400
800
1,200
1,600
2,000
1990
2018
2050
1990
2018
2050
1990
2018
2050
1990
2018
2050
Electricity use by end-use demand sector (Reference case) billion kilowatthours
direct use
electricity sales
residential industrialcommercial transportation
U.S. Energy Information Administration www.eia.gov/aeo#AEO2019U.S. Energy Information Administration
• Although near-term electricity demand increases or decreases as a result of year-to-year weather fluctuations, long-term projections typically assume long-term average weather patterns. As a result, economic growth tends to drive long-term demand trends offset by increases in energy efficiency. The annual growth in electricity demand averages about 1% throughout the projection period in the Reference case.
• Historically, electricity demand growth rates have slowed as new efficient devices and production processes replaced older, less-efficient appliances, heating, ventilation, cooling units, and capital equipment, even as the economy continued to grow.
• Average electricity growth rates in the High and Low Economic Growth cases vary the most from the Reference case. Electricity use in the High Economic Growth case grows about 0.2 percentage points faster on average as opposed to 0.2 percentage points slower in the Low Economic Growth case.
• The modest growth in projected electricity sales from 2018 to 2050 would be higher but for significant direct-use generation from rooftop photovoltaic (PV) systems primarily on residential and commercial buildings and combined heat and power systems in industrial and some commercial applications.
—with increases occurring across all demand sectors
90
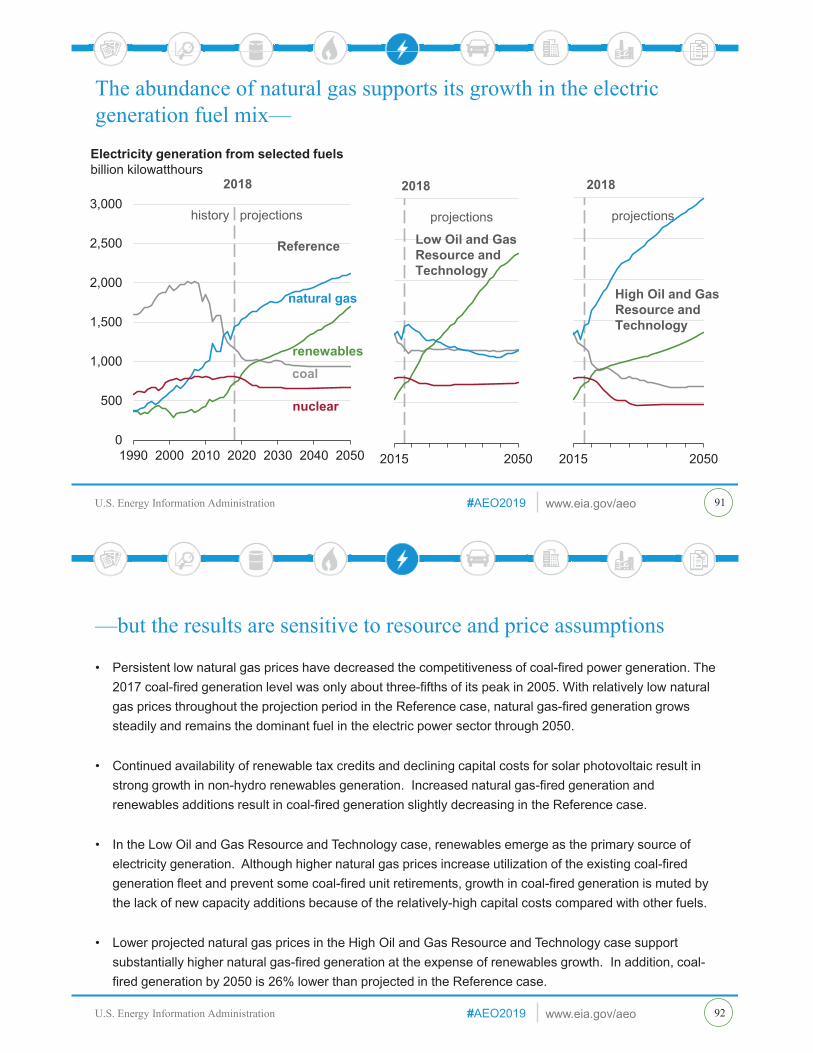
U.S. Energy Information Administration www.eia.gov/aeo#AEO2019U.S. Energy Information Administration
0
500
1,000
1,500
2,000
2,500
3,000
1990 2000 2010 2020 2030 2040 2050
2018
history projections
Reference
Electricity generation from selected fuelsbillion kilowatthours
natural gas
coal
nuclear
renewables
91
The abundance of natural gas supports its growth in the electric generation fuel mix—
0
500
1,000
1,500
2,000
2,500
3,000
2015 2050
2018
projections
High Oil and Gas Resource and Technology
0
500
1,000
1,500
2,000
2,500
3,000
2015 2050
2018
projections
Low Oil and Gas Resource and Technology
U.S. Energy Information Administration www.eia.gov/aeo#AEO2019U.S. Energy Information Administration
• Persistent low natural gas prices have decreased the competitiveness of coal-fired power generation. The 2017 coal-fired generation level was only about three-fifths of its peak in 2005. With relatively low natural gas prices throughout the projection period in the Reference case, natural gas-fired generation grows steadily and remains the dominant fuel in the electric power sector through 2050.
• Continued availability of renewable tax credits and declining capital costs for solar photovoltaic result in strong growth in non-hydro renewables generation. Increased natural gas-fired generation and renewables additions result in coal-fired generation slightly decreasing in the Reference case.
• In the Low Oil and Gas Resource and Technology case, renewables emerge as the primary source of electricity generation. Although higher natural gas prices increase utilization of the existing coal-fired generation fleet and prevent some coal-fired unit retirements, growth in coal-fired generation is muted by the lack of new capacity additions because of the relatively-high capital costs compared with other fuels.
• Lower projected natural gas prices in the High Oil and Gas Resource and Technology case support substantially higher natural gas-fired generation at the expense of renewables growth. In addition, coal-fired generation by 2050 is 26% lower than projected in the Reference case.
—but the results are sensitive to resource and price assumptions
92
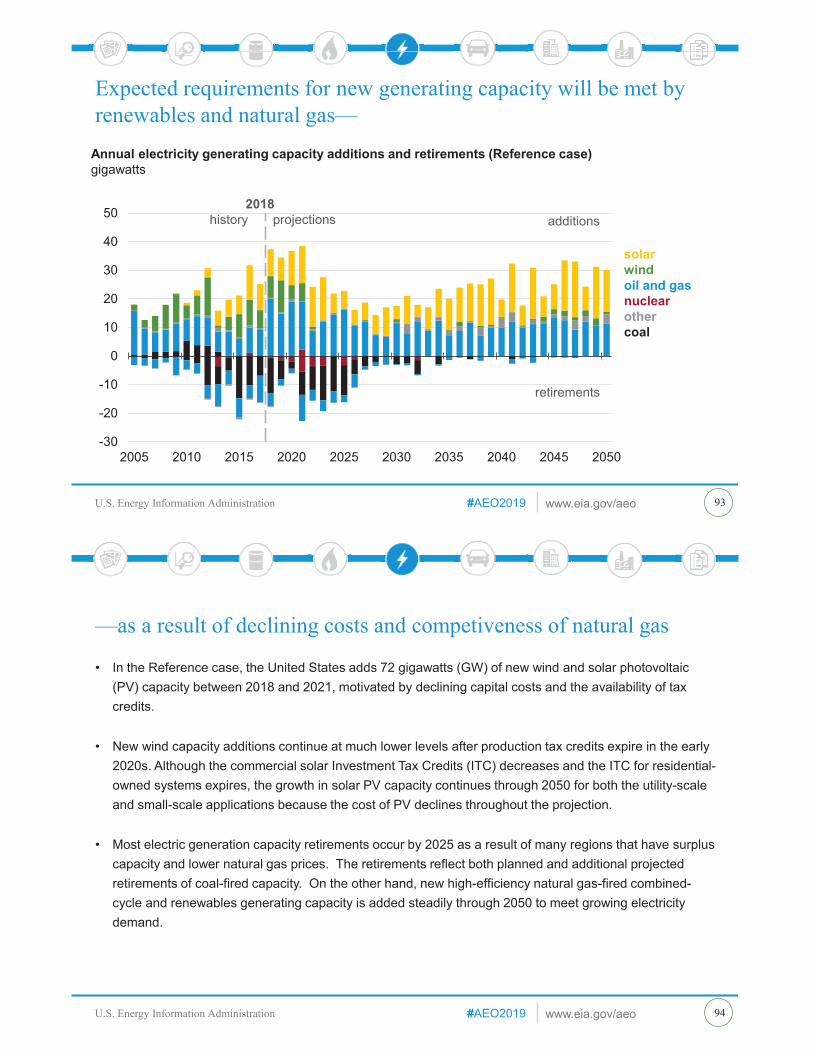
U.S. Energy Information Administration www.eia.gov/aeo#AEO2019U.S. Energy Information Administration
-30
-20
-10
0
10
20
30
40
50
2005 2010 2015 2020 2025 2030 2035 2040 2045 2050
Annual electricity generating capacity additions and retirements (Reference case) gigawatts
2018history projections
solarwindoil and gasnuclearothercoal
additions
retirements
93
Expected requirements for new generating capacity will be met by renewables and natural gas—
U.S. Energy Information Administration www.eia.gov/aeo#AEO2019U.S. Energy Information Administration
• In the Reference case, the United States adds 72 gigawatts (GW) of new wind and solar photovoltaic (PV) capacity between 2018 and 2021, motivated by declining capital costs and the availability of tax credits.
• New wind capacity additions continue at much lower levels after production tax credits expire in the early 2020s. Although the commercial solar Investment Tax Credits (ITC) decreases and the ITC for residential-owned systems expires, the growth in solar PV capacity continues through 2050 for both the utility-scale and small-scale applications because the cost of PV declines throughout the projection.
• Most electric generation capacity retirements occur by 2025 as a result of many regions that have surplus capacity and lower natural gas prices. The retirements reflect both planned and additional projected retirements of coal-fired capacity. On the other hand, new high-efficiency natural gas-fired combined-cycle and renewables generating capacity is added steadily through 2050 to meet growing electricity demand.
—as a result of declining costs and competiveness of natural gas
94

U.S. Energy Information Administration www.eia.gov/aeo#AEO2019U.S. Energy Information Administration
-22 -14 -22 -46-101 -69 -101 -129-53 -74 -53 -44
-400
-200
0
95
Long-term trends in electricity generation are dominated by solar and natural gas-fired capacity additions—
379 259 379 474
50 128 5035
357499
357 247
0
200
400
600
800
1,000
Cumulative electricity generating capacity additions and retirements (2050)gigawatts
additions
retirements
ReferenceLow Oil and
Gas Resource and Technology
High Oil and Gas Resource and Technology
Reference
solarwindoil and gasnuclearothercoal
more solar and wind additions,higher total installed capacity
more natural gas additions,more nuclear and coal retirements
U.S. Energy Information Administration www.eia.gov/aeo#AEO2019U.S. Energy Information Administration
• In the Reference case, coal-fired generating capacity declines faster than coal-fired generation through 2050, with 101 gigawatts (GW) (or 42% of existing coal-fired capacity) projected to retire by 2050. For nuclear generators, 22 GW (22% of current nuclear capacity) retires by 2050 in the Reference case.
• From 2018 to 2021, wind builds play a more significant role in total capacity additions, accounting for 20% of the additions. Over time, solar generation grows for both the utility- and small-scale sectors. In the Reference case, 43% of total capacity additions through 2050 are solar photovoltaic capacity.
• In the Low Oil and Gas Resource and Technology case, the relatively higher natural gas prices support the build-out of wind and solar generating technologies instead of natural gas-fired additions. More total installed capacity is required because the wind and solar generator capacity factors are lower than for natural gas-fired combined-cycle units.
• Low natural gas prices resulting from higher-than-expected natural gas resources in the High Oil and Gas Resource and Technology case favor the installation of natural gas capacity (61% of the capacity added through 2050) instead of renewables (36% of capacity additions through 2050) and result in higher levels of coal and nuclear retirements compared with the Reference case.
—with coal, nuclear, and less efficient natural gas generators contributing to capacity retirements
96

U.S. Energy Information Administration www.eia.gov/aeo#AEO2019U.S. Energy Information Administration
8
9
10
11
12
2010 2020 2030 2040 2050
Average electricity price2018 cents per kilowatthour
2018
history projectionsLow Oil and Gas Resource and TechnologyHigh Economic GrowthHigh Oil PriceLow Economic GrowthLow Oil PriceReferenceHigh Oil and Gas Resource and Technology//
0
6.38 5.92 5.57 5.37 5.40
1.32 1.34 1.46 1.56 1.55
2.85 2.97 3.41 3.58 3.54
0
2
4
6
8
10
12
2018 2020 2030 2040 2050
Electricity prices by service category (Reference case)2018 cents per kilowatthours
distribution
transmission
generation
97
Reference case electricity prices fall slightly, with dropping generation costs offset by rising transmission and distribution costs—
U.S. Energy Information Administration www.eia.gov/aeo#AEO2019U.S. Energy Information Administration
• Average electricity prices vary considerably across scenarios mainly because of the effect natural gas prices have on the projections. By 2050, prices range from 9.7 cents/kilowatthours (kWh) to 11.6 cents/kWh across the High and Low Oil and Gas Resource and Technology cases.
• Generation costs, which account for the largest share of the price of electricity, decrease 15% from 2018 to 2050 in the Reference case. Generation costs in regulated markets (70% of the United States) reflect recovery of investment costs and fuel and operating costs. Investment costs decline over time as older capacity is retired and new, lower cost capacity is added. Fuel and operating costs are projected to remain flat as more efficient generators and renewables offsets long-term increases in fuel prices.
• Average electricity prices fall 4.2% from 2018 to 2022. This decline is driven by customer rebates from lower utility taxes associated with the Tax Cuts and Jobs Act of 2017, lower construction and operating costs of some new fossil and renewable plants, and the subsequent retirement of plants that were relatively more costly to operate.
• In the Reference case, transmission and distribution costs increase by 18% and 24%, respectively, as a result of replacing aging infrastructure and upgrading the grid to integrate wind and solar capacity.
—while generation costs vary across the resource cases that influence the generation mix
98

U.S. Energy Information Administration www.eia.gov/aeo#AEO2019U.S. Energy Information Administration
0 40 80 120
Leve
lized
avo
ided
cos
t of e
lect
ricity
Levelized cost of electricity
coal with 30% carbon capture
Levelized cost of electricity and levelized avoided cost of electricity by technology and region, 2023 online year (Reference case)2018 dollars per megawatthour
region with no built capacity
Economically attractive builds are shown on or above the diagonal line for each technology.
region with builtcapacity
advanced combined cycle
0 40 80 120
nuclear
economically attractive
economically unattractive
99
Combined-cycle and solar photovoltaic are the most economically attractive generating technologies—
0
40
80
120solar photovoltaic
0
40
80
120
0 40 80 120
onshore wind
Note: See more information in EIA’s LCOE/LACE report on EIA.gov
U.S. Energy Information Administration www.eia.gov/aeo#AEO2019U.S. Energy Information Administration
• The levelized cost of electricity (LCOE) indicates the average revenue per unit of generation needed for a generating plant to be economically viable. When compared with the levelized avoided cost of electricity (LACE), or expected average revenue realized by that plant, a rough estimate of economic viability for that generating technology can be determined.
• The solid, colored points on the figure demonstrate that projects tend to be built in regions where value (LACE) exceeds costs (LCOE). Expected revenues from advanced natural gas-fired combined-cycle and solar photovoltaic generating technologies are generally greater than or equal to projected costs across the most electricity market regions in 2023. Correspondingly, these two technologies show the greatest projected growth through the middle of the next decade.
• The figure indicates a few regions where the value of wind is approaching costs, and these regions see new wind capacity builds, primarily in advance of the phase-out of the production tax credit (PTC), through the early part of the next decade. However, the potential wind sites with the most favorable value-to-cost ratios are largely exploited before the PTC expires, with a several-years lag needed for wind values to recover. Markets for wind rebound faster under conditions with higher natural gas prices or faster growth in electricity demand.
—when considering the overall cost to build and operate a plant and the value of the plant to the power system
100

U.S. Energy Information Administration www.eia.gov/aeo#AEO2019U.S. Energy Information Administration
0
500
1,000
1,500
2,000
2,50020
10
2020
2035
2050
2020
2035
2050
2020
2035
2050
2020
2035
2050
2020
2035
2050
Renewables electricity generation (all sectors) by casebillion kilowatthours
solarwind other
history projections
Reference LowEconomicGrowth
HighEconomicGrowth
Low Oil andGas Resourceand Technology
High Oil andGas Resourceand Technology
101
Increases in renewables generation is led by solar and wind—
U.S. Energy Information Administration www.eia.gov/aeo#AEO2019U.S. Energy Information Administration
• Renewables generation increases more than 130% through the end of the projection period in the Reference case, reaching nearly 1,700 billion kilowatthours (BkWh) by 2050.
• Increases in wind and solar generation lead the growth in renewables generation throughout the projection period across all cases, accounting for nearly 900 BkWh (about 90%) of total renewables growth in the Reference case.
• The extended tax credits account for much of the accelerated growth in the near term. Solar photovoltaic (PV) growth continues through the projection period as a result of solar PV costs continuing to decrease.
• In the High Oil and Gas Resource and Technology case, low natural gas prices limit the growth of renewables in favor of natural gas-fired generation. Renewables generation is nearly 350 BkWh lower than in the Reference case in 2050, but this increase is still more than 60% higher than 2018 levels.
• In the Low Economic Growth case, electricity demand is lower than in the Reference case. Because renewables are a marginal source of new capacity additions, this lower level of demand results in nearly 200 BkWh less renewables generation by 2050 compared with the Reference case.
—which grows most quickly in the High Economic Growth and Low Oil and Gas Resource and Technology cases
102

U.S. Energy Information Administration www.eia.gov/aeo#AEO2019U.S. Energy Information Administration
0
100
200
300
400
500
600
2017 2020 2030 2040 2050
small-scale
utility-scale
Solar photovoltaic electricity generation by region (Reference case)billion kilowatthours
2018history projections
Eastern Interconnection Western Interconnection Texas
103
Solar generation grows for both utility- and small-scale sectors—
U.S. Energy Information Administration www.eia.gov/aeo#AEO2019U.S. Energy Information Administration
• Electricity generation from solar photovoltaic (PV) in all sectors grows to 15% of total U.S. electricity generation from all technologies by 2050 in the Reference case, and it is composed of more utility-scale systems (66%) than small-scale systems (34%).
• In the Western Interconnection, the growth in solar PV generation comes mostly from small-scale systems, increasing from 34% of the share in 2018 to 57% in 2050.
• Solar PV generation in Texas and in the Eastern Interconnection is produced mostly from utility-scale systems throughout the projection period, averaging 80% for Texas and 76% for the Eastern Interconnection.
• During the projection period, Texas increases its share of U.S. PV generation from 4% in 2018 to 8% in 2050, while the Eastern Interconnection increases its share from 32% to 59%. The share of U.S. PV generation from the Western Interconnection decreases from 64% to 33% during the same period.
—but at different relative rates across the interconnections
104

U.S. Energy Information Administration www.eia.gov/aeo#AEO2019U.S. Energy Information Administration
-6
-5
-4
-3
-2
-1
0
1
2
3
2015 2020 2025 2030 2035 2040 2045 2050
Year-over-year nuclear capacity changes (Reference case)gigawatts
additions
retirements
assumed upratesnew reactors
actual/announcedretirements
projectedretirements
0
20
40
60
80
100
120
2010 2020 2030 2040 2050
Nuclear electricity generating capacitygigawatts
2018history projections
Low Oil and Gas Resource and TechnologyReferenceHigh Oil and Gas Resource and Technology
105
Nuclear capacity retirements accelerate with lower natural gas prices—
U.S. Energy Information Administration www.eia.gov/aeo#AEO2019U.S. Energy Information Administration
• The Reference case projects a steady decline of 17% in nuclear electric generating capacity from 99 gigawatts (GW) in 2018 to 83 GW in 2050. No new plant additions occur beyond 2021, and existing plants have 2 GW of uprates starting in 2030.
• Projected nuclear retirements are driven by declining revenues resulting from low growth in electricity load and from increasing competition from low-cost natural gas and declining-cost renewables. Smaller, single-reactor nuclear plants with higher average operating costs are most affected, particularly those plants operating in regions with deregulated wholesale power markets and in states without a Zero Emission Credit policy.
• Lower natural gas prices in the High Oil and Gas Resource and Technology case lead to lower wholesale power market revenues for nuclear power plant operators, accelerating an additional 24 GW of nuclear capacity closing by 2050 compared with the Reference case.
• Higher natural gas prices in the Low Oil and Gas Resource and Technology case decrease the financial risks to nuclear power plant operators, resulting in 8 GW fewer retirements and an additional 1 GW of new, unplanned nuclear capacity through 2050 compared with the Reference case.
—as a result of declining revenue in competitive wholesale power markets
106
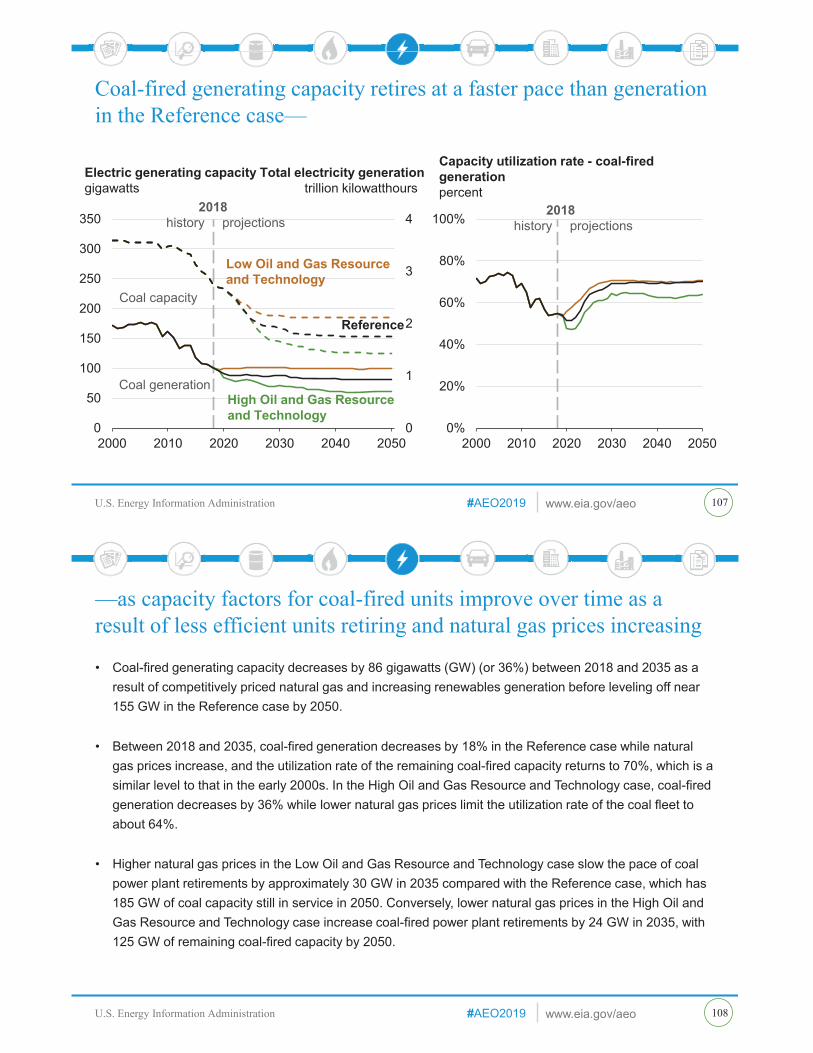
U.S. Energy Information Administration www.eia.gov/aeo#AEO2019U.S. Energy Information Administration
0
1
2
3
4
0
50
100
150
200
250
300
350
2000 2010 2020 2030 2040 2050
2018history projections
Low Oil and Gas Resourceand Technology
Reference
High Oil and Gas Resourceand Technology
Electric generating capacity Total electricity generationgigawatts trillion kilowatthours
0%
20%
40%
60%
80%
100%
2000 2010 2020 2030 2040 2050
2018history projections
Capacity utilization rate - coal-fired generationpercent
107
Coal-fired generating capacity retires at a faster pace than generation in the Reference case—
Coal capacity
Coal generation
U.S. Energy Information Administration www.eia.gov/aeo#AEO2019U.S. Energy Information Administration
• Coal-fired generating capacity decreases by 86 gigawatts (GW) (or 36%) between 2018 and 2035 as a result of competitively priced natural gas and increasing renewables generation before leveling off near 155 GW in the Reference case by 2050.
• Between 2018 and 2035, coal-fired generation decreases by 18% in the Reference case while natural gas prices increase, and the utilization rate of the remaining coal-fired capacity returns to 70%, which is a similar level to that in the early 2000s. In the High Oil and Gas Resource and Technology case, coal-fired generation decreases by 36% while lower natural gas prices limit the utilization rate of the coal fleet to about 64%.
• Higher natural gas prices in the Low Oil and Gas Resource and Technology case slow the pace of coal power plant retirements by approximately 30 GW in 2035 compared with the Reference case, which has 185 GW of coal capacity still in service in 2050. Conversely, lower natural gas prices in the High Oil and Gas Resource and Technology case increase coal-fired power plant retirements by 24 GW in 2035, with 125 GW of remaining coal-fired capacity by 2050.
—as capacity factors for coal-fired units improve over time as a result of less efficient units retiring and natural gas prices increasing
108

U.S. Energy Information Administration www.eia.gov/aeo#AEO2019U.S. Energy Information Administration
0
200
400
600
800
1,000
1,200
1,400
2015 2050
2018
projections
High Oil and Gas Resource and Technology
0
200
400
600
800
1,000
1,200
1,400
2015 2050
2018
projections
Low Oil and Gas Resource and Technology
0
200
400
600
800
1,000
1,200
1,400
2000 2010 2020 2030 2040 2050
Coal production by regionmillion short tons
2018
history projections
total
West
InteriorAppalachia
s
Reference
109
Coal production decreases through 2035 because of retiring coal-fired electric generating capacity—
U.S. Energy Information Administration www.eia.gov/aeo#AEO2019U.S. Energy Information Administration
• U.S. coal production in the Reference case continues to decline, from 762 million short tons (MMst) in 2018 to 608 MMst in 2035, before later stabilizing. This decline is in response to coal-fired generating unit retirements and competitive price pressure from natural gas and renewables.
• In the Interior region of the United States, coal production in the Reference case grows by 20 MMstbetween 2018 and 2050, while production in the Appalachia and the West regions declines by 85 MMstand 106 MMst, respectively.
• In the Low Oil and Gas Resource and Technology case, Interior region coal production in 2050 is 52 MMst (31%) higher than in the Reference case, compared with higher estimates of 13 MMst (11%) in Appalachia and 50 MMst (16%) in the West region.
• In the High Oil and Gas Resource and Technology case, lower natural gas prices result in lower West region coal production in 2050 of 64 MMst (21%) relative to the Reference case, compared with lower regional coal production levels of 12 MMst (11%) in Appalachia and 50 MMst (30%) in the Interior.
—before stabilizing as a result of higher natural gas prices increasing the utilization of coal-fired electric generating capacity
110
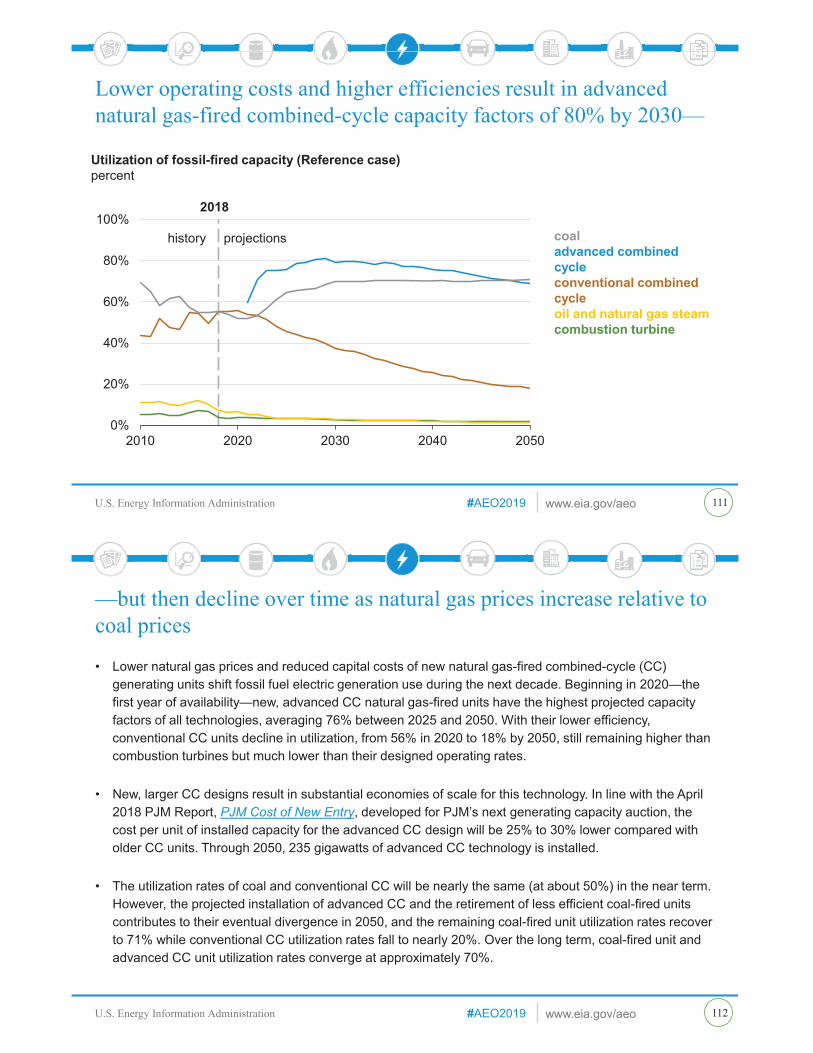
U.S. Energy Information Administration www.eia.gov/aeo#AEO2019U.S. Energy Information Administration
0%
20%
40%
60%
80%
100%
2010 2020 2030 2040 2050
Utilization of fossil-fired capacity (Reference case)percent
coaladvanced combined cycleconventional combined cycle oil and natural gas steamcombustion turbine
2018
history projections
111
Lower operating costs and higher efficiencies result in advanced natural gas-fired combined-cycle capacity factors of 80% by 2030—
U.S. Energy Information Administration www.eia.gov/aeo#AEO2019U.S. Energy Information Administration
• Lower natural gas prices and reduced capital costs of new natural gas-fired combined-cycle (CC) generating units shift fossil fuel electric generation use during the next decade. Beginning in 2020—the first year of availability—new, advanced CC natural gas-fired units have the highest projected capacity factors of all technologies, averaging 76% between 2025 and 2050. With their lower efficiency, conventional CC units decline in utilization, from 56% in 2020 to 18% by 2050, still remaining higher than combustion turbines but much lower than their designed operating rates.
• New, larger CC designs result in substantial economies of scale for this technology. In line with the April 2018 PJM Report, PJM Cost of New Entry, developed for PJM’s next generating capacity auction, the cost per unit of installed capacity for the advanced CC design will be 25% to 30% lower compared with older CC units. Through 2050, 235 gigawatts of advanced CC technology is installed.
• The utilization rates of coal and conventional CC will be nearly the same (at about 50%) in the near term. However, the projected installation of advanced CC and the retirement of less efficient coal-fired units contributes to their eventual divergence in 2050, and the remaining coal-fired unit utilization rates recover to 71% while conventional CC utilization rates fall to nearly 20%. Over the long term, coal-fired unit and advanced CC unit utilization rates converge at approximately 70%.
—but then decline over time as natural gas prices increase relative to coal prices
112

U.S. Energy Information Administration www.eia.gov/aeo#AEO2019U.S. Energy Information Administration 113
Electric sector emissions in the United States closely track decreasing dependence on coal—
0
1
2
3
4
0
2
4
6
8
10
12
14
16
18
1990 2000 2010 2020 2030 2040 2050
carbon dioxidesulfur dioxide1
nitrogen oxide1
NOx BudgetTrading Program
Electric sector emissions: Reference casemillion short tons sulfur dioxide/nitrogen oxide billion metric tons of carbon dioxide
SO2 Phase 2
SO2 Phase 1
MATS
2018history projections
1Annual sulfur dioxide and nitrogen oxide data unavailable prior to 1995
U.S. Energy Information Administration www.eia.gov/aeo#AEO2019U.S. Energy Information Administration
• Any future changes in emissions will be tied to the level of coal-fired generation because EIA’s Reference case only incorporates policies that are current laws (including tax credits and air regulations). Coal-fired generation is sensitive to projected natural gas prices.
• Changes in air emissions from power plants in recent years have generally followed the compliance requirements and deadlines specified under the Clean Air Act Amendments of 1990 (CAAA 1990). For sulfur dioxide (SO2), these include the phased implementation of the acid rain cap-and-trade program (Title IV) with deadlines for Phase I and II in 1995 and 2000. For nitrogen oxides (NOx), the key deadline was in 2003, when the Environmental Protection Agency expanded the NOx Budget Trading Program (Title I) to include most states east of the Mississippi. For air toxics (Title III), the initial compliance deadline for the Mercury and Air Toxics Standards (MATS) arrived in April 2015. Finally, emissions of carbon dioxide (CO2) have followed evolving state standards for renewable portfolios or regional caps on CO2.
• Once the CAAA 1990 programs are implemented, and in the absence of additional federal regulations on CO2, the level of emissions remains relatively unchanged in the Reference case from 2018 to 2050, despite a 30% increase in generation during the projection period.
—with carbon dioxide, sulfur dioxide, and nitrogen oxide emissions generally flat going forward
114

U.S. Energy Information Administration www.eia.gov/aeo#AEO2019U.S. Energy Information Administration
TransportationTransportation energy consumption peaks in 2019 in the Reference case because rising fuel efficiency more than offsets the effects of increases in total travel and freight movements, but this trend reverses toward the end of the projection period.
U.S. Energy Information Administration www.eia.gov/aeo#AEO2019U.S. Energy Information Administration
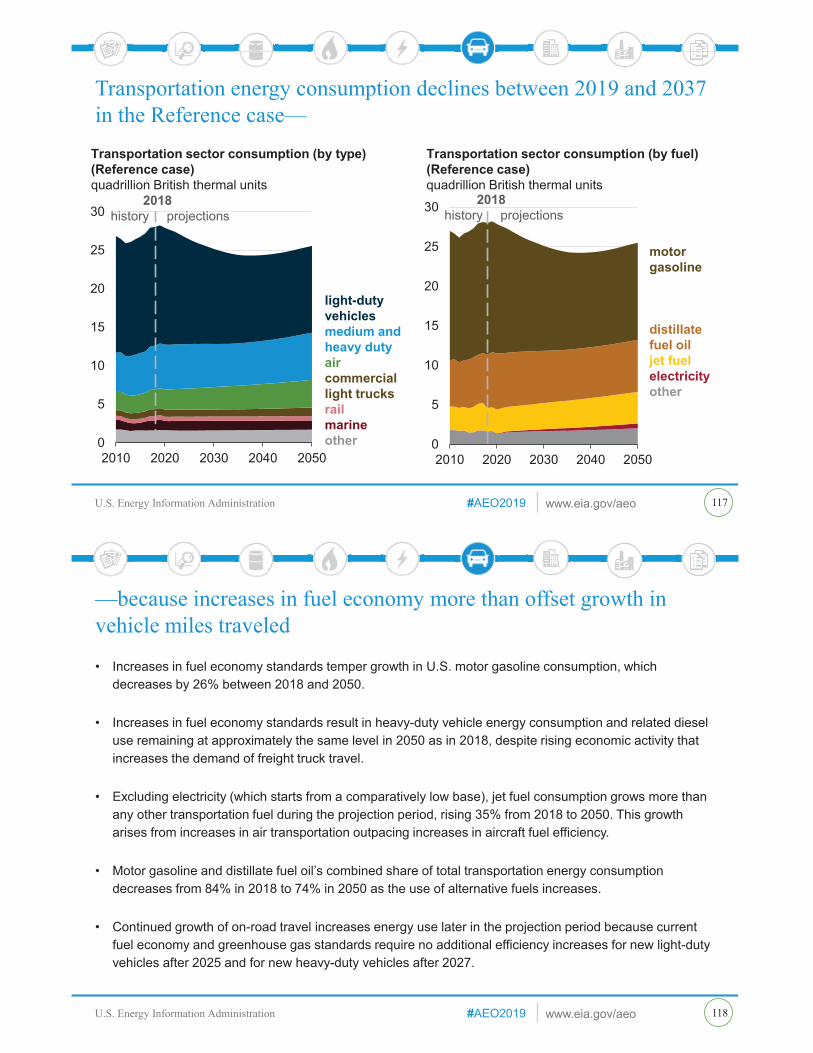
U.S. Energy Information Administration www.eia.gov/aeo#AEO2019U.S. Energy Information Administration 117
Transportation energy consumption declines between 2019 and 2037 in the Reference case—
0
5
10
15
20
25
30
2010 2020 2030 2040 2050
Transportation sector consumption (by type) (Reference case)quadrillion British thermal units
2018history projections
light-dutyvehiclesmedium and heavy dutyaircommerciallight trucksrailmarineother 0
5
10
15
20
25
30
2010 2020 2030 2040 2050
Transportation sector consumption (by fuel)(Reference case)quadrillion British thermal units
2018history projections
motorgasoline
distillatefuel oiljet fuelelectricityother
U.S. Energy Information Administration www.eia.gov/aeo#AEO2019U.S. Energy Information Administration
• Increases in fuel economy standards temper growth in U.S. motor gasoline consumption, which decreases by 26% between 2018 and 2050.
• Increases in fuel economy standards result in heavy-duty vehicle energy consumption and related diesel use remaining at approximately the same level in 2050 as in 2018, despite rising economic activity that increases the demand of freight truck travel.
• Excluding electricity (which starts from a comparatively low base), jet fuel consumption grows more than any other transportation fuel during the projection period, rising 35% from 2018 to 2050. This growth arises from increases in air transportation outpacing increases in aircraft fuel efficiency.
• Motor gasoline and distillate fuel oil’s combined share of total transportation energy consumption decreases from 84% in 2018 to 74% in 2050 as the use of alternative fuels increases.
• Continued growth of on-road travel increases energy use later in the projection period because current fuel economy and greenhouse gas standards require no additional efficiency increases for new light-duty vehicles after 2025 and for new heavy-duty vehicles after 2027.
—because increases in fuel economy more than offset growth in vehicle miles traveled
118
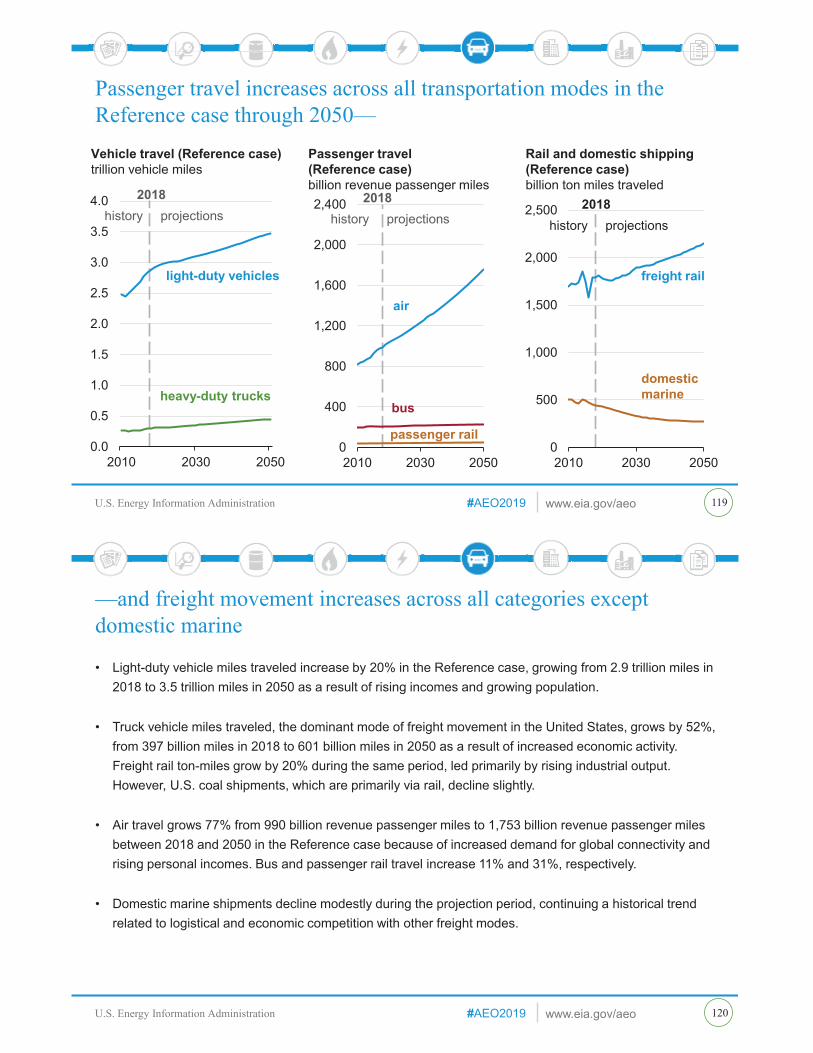
U.S. Energy Information Administration www.eia.gov/aeo#AEO2019U.S. Energy Information Administration 119
Passenger travel increases across all transportation modes in the Reference case through 2050—
0.0
0.5
1.0
1.5
2.0
2.5
3.0
3.5
4.0
2010 2030 2050
2018history projections
Vehicle travel (Reference case)trillion vehicle miles
light-duty vehicles
heavy-duty trucks
0
400
800
1,200
1,600
2,000
2,400
2010 2030 2050
2018history projections
Passenger travel (Reference case)billion revenue passenger miles
bus
passenger rail
air
0
500
1,000
1,500
2,000
2,500
2010 2030 2050
2018history projections
Rail and domestic shipping (Reference case)billion ton miles traveled
freight rail
domesticmarine
U.S. Energy Information Administration www.eia.gov/aeo#AEO2019U.S. Energy Information Administration
• Light-duty vehicle miles traveled increase by 20% in the Reference case, growing from 2.9 trillion miles in 2018 to 3.5 trillion miles in 2050 as a result of rising incomes and growing population.
• Truck vehicle miles traveled, the dominant mode of freight movement in the United States, grows by 52%, from 397 billion miles in 2018 to 601 billion miles in 2050 as a result of increased economic activity. Freight rail ton-miles grow by 20% during the same period, led primarily by rising industrial output. However, U.S. coal shipments, which are primarily via rail, decline slightly.
• Air travel grows 77% from 990 billion revenue passenger miles to 1,753 billion revenue passenger miles between 2018 and 2050 in the Reference case because of increased demand for global connectivity and rising personal incomes. Bus and passenger rail travel increase 11% and 31%, respectively.
• Domestic marine shipments decline modestly during the projection period, continuing a historical trend related to logistical and economic competition with other freight modes.
—and freight movement increases across all categories except domestic marine
120

U.S. Energy Information Administration www.eia.gov/aeo#AEO2019U.S. Energy Information Administration
0
500
1,000
1,500
2,000
2,500
3,000
3,500
2015 2020 2030 2040 2050
Passenger mode energy intensity (Reference case)British thermal unit per passenger-mile
2018history projections
aircraft
light-duty vehicle
passenger rail
bus
121
Energy intensity decreases across most transportation modes in the Reference case—
Note: Energy intensity is the energy required for a travel metric. In the graphs above, energy intensity is calculated for passenger modes in British thermal unit (Btu) per passenger-mile (energy to move a passenger one mile) and for freight modes in Btu per ton-mile (energy to move a ton of freight one mile).
0
1,000
2,000
3,000
4,000
5,000
6,000
7,000
8,000
2015 2020 2030 2040 2050
Freight mode energy intensity (Reference case)British thermal unit per ton-mile
2018history projections
Class 3truck
Classes 4 - 6truck
Classes 7 - 8truck
freight raildomestic marine
U.S. Energy Information Administration www.eia.gov/aeo#AEO2019U.S. Energy Information Administration
• Energy use per passenger-mile of travel in light-duty vehicles declines nearly 40% between 2018 and 2050 as newer, more fuel-efficient vehicles enter the market, including both more efficient conventional gasoline vehicles and highly efficient alternatives such as battery electric vehicles. Light-duty vehicle energy efficiencies are affected by current federal fuel economy and greenhouse gas emission standards.
• Energy use per passenger-mile of travel in aircraft decreases because of the economically driven adoption of energy-efficient technology and practices. Energy use per passenger-mile of travel on passenger rail and buses, already relatively energy-efficient modes of travel per passenger-mile, remains relatively constant.
• Energy use per ton-mile of travel by freight modes decreases, led by increases in the fuel economy of heavy-duty trucks across all weight classes as the second phase of heavy-duty vehicle efficiency and greenhouse gas standards takes full effect in 2027.
• Gains in energy efficiency offset increases in travel for passenger and freight modes. These efficiency gains decrease energy use by light-duty vehicles and freight trucks later in the projection and temper the rise in energy use by other transportation modes.
122
—because of policy, economic factors, and technology

U.S. Energy Information Administration www.eia.gov/aeo#AEO2019U.S. Energy Information Administration 123
Fuel economy of all on-road vehicles increases in the Reference case—
0
5
10
15
20
25
30
35
40
45
50
2010 2020 2030 2040 2050
Light-duty fuel economy (Reference case)miles per gallon (all vehicles)
2018history projections car
combined
light truck
0
2
4
6
8
10
12
14
16
18
20
2010 2020 2030 2040 2050
Heavy-duty fuel economy (Reference case)miles per gallon (all vehicles)
2018history projections
Classes 2b - 3
Classes 4 - 6
Classes 7 - 8
U.S. Energy Information Administration www.eia.gov/aeo#AEO2019U.S. Energy Information Administration
• The fuel economy of light-duty vehicles in use from 2018 to 2050 increases by 60% for cars and by 60% for light trucks in the Reference case. Across all light-duty vehicles, fuel efficiency improves by 65% from 2018 to 2050 as newer, more fuel-efficient vehicles enter the market, including a higher share of cars, which are more efficient than light trucks.
• Fuel economy of the heavy-duty vehicles in use improves across all weight classes as the second phase of heavy-duty vehicle efficiency and greenhouse gas standards takes full effect in 2027.
• Gains in fuel economy temper heavy-duty vehicle energy consumption growth and decrease light-duty vehicle energy consumption. After 2040, increasing vehicle travel outweighs fuel economy improvements, leading to increases in fuel demand.
124
—across all vehicle types throughout the projection period
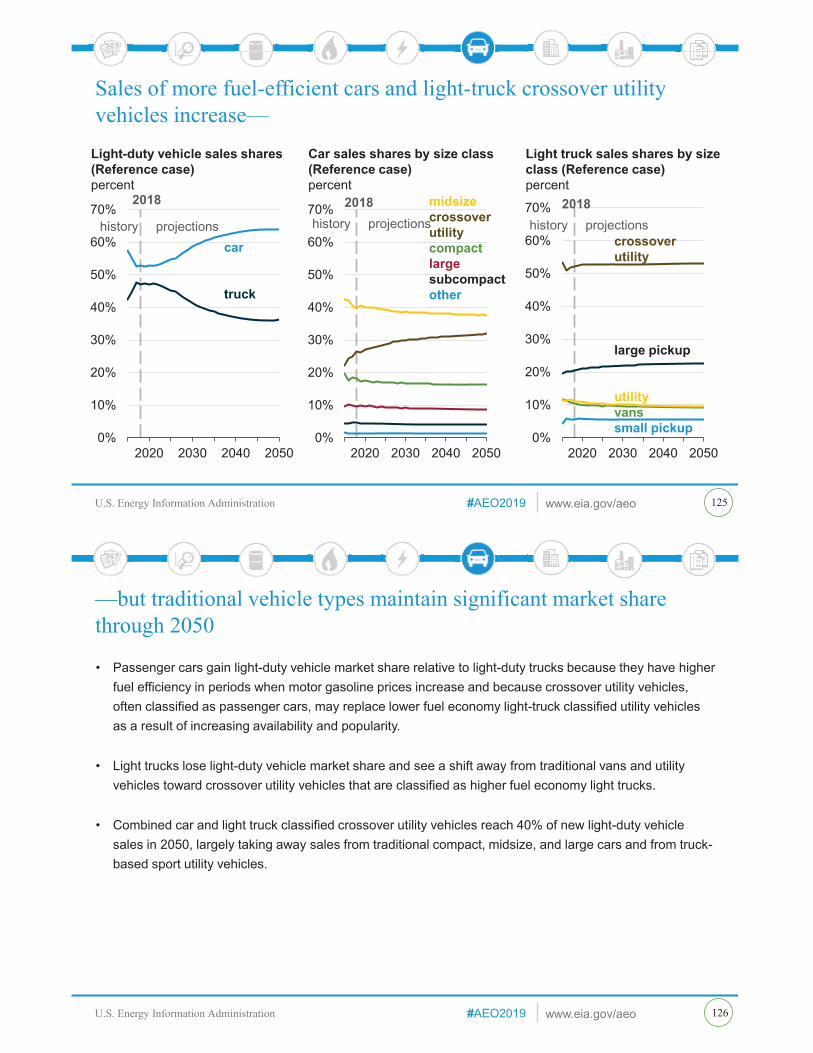
U.S. Energy Information Administration www.eia.gov/aeo#AEO2019U.S. Energy Information Administration 125
Sales of more fuel-efficient cars and light-truck crossover utility vehicles increase—
0%
10%
20%
30%
40%
50%
60%
70%
2020 2030 2040 2050
Light-duty vehicle sales shares(Reference case)percent
car
truck
2018
history projections
0%
10%
20%
30%
40%
50%
60%
70%
2020 2030 2040 2050
Car sales shares by size class (Reference case)percent
midsizecrossoverutilitycompactlargesubcompactother
2018history projections
0%
10%
20%
30%
40%
50%
60%
70%
2020 2030 2040 2050
Light truck sales shares by sizeclass (Reference case) percent
crossoverutility
large pickup
utilityvans small pickup
2018history projections
U.S. Energy Information Administration www.eia.gov/aeo#AEO2019U.S. Energy Information Administration
• Passenger cars gain light-duty vehicle market share relative to light-duty trucks because they have higher fuel efficiency in periods when motor gasoline prices increase and because crossover utility vehicles, often classified as passenger cars, may replace lower fuel economy light-truck classified utility vehicles as a result of increasing availability and popularity.
• Light trucks lose light-duty vehicle market share and see a shift away from traditional vans and utility vehicles toward crossover utility vehicles that are classified as higher fuel economy light trucks.
• Combined car and light truck classified crossover utility vehicles reach 40% of new light-duty vehicle sales in 2050, largely taking away sales from traditional compact, midsize, and large cars and from truck-based sport utility vehicles.
126
—but traditional vehicle types maintain significant market share through 2050
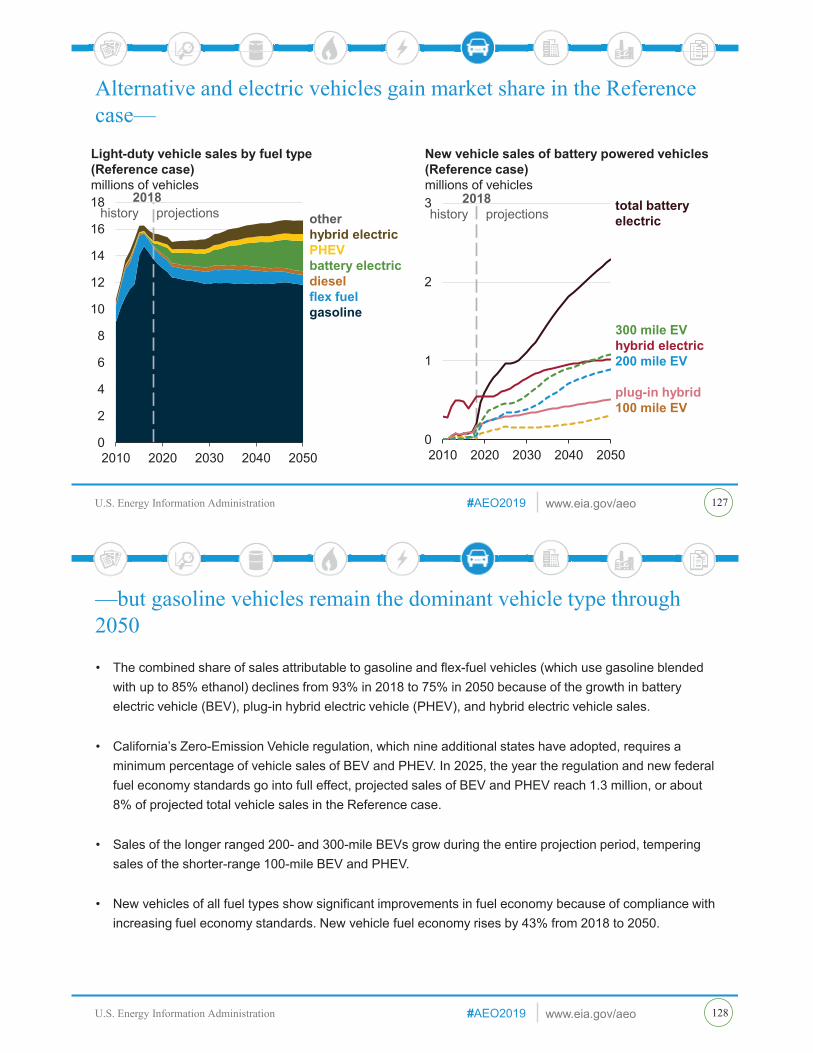
U.S. Energy Information Administration www.eia.gov/aeo#AEO2019U.S. Energy Information Administration 127
Alternative and electric vehicles gain market share in the Reference case—
0
2
4
6
8
10
12
14
16
18
2010 2020 2030 2040 2050
Light-duty vehicle sales by fuel type (Reference case)millions of vehicles
2018history projections other
hybrid electricPHEVbattery electricdieselflex fuelgasoline
0
1
2
3
2010 2020 2030 2040 2050
New vehicle sales of battery powered vehicles(Reference case)millions of vehicles
total batteryelectric
300 mile EVhybrid electric200 mile EV
plug-in hybrid100 mile EV
2018history projections
U.S. Energy Information Administration www.eia.gov/aeo#AEO2019U.S. Energy Information Administration
• The combined share of sales attributable to gasoline and flex-fuel vehicles (which use gasoline blended with up to 85% ethanol) declines from 93% in 2018 to 75% in 2050 because of the growth in battery electric vehicle (BEV), plug-in hybrid electric vehicle (PHEV), and hybrid electric vehicle sales.
• California’s Zero-Emission Vehicle regulation, which nine additional states have adopted, requires a minimum percentage of vehicle sales of BEV and PHEV. In 2025, the year the regulation and new federal fuel economy standards go into full effect, projected sales of BEV and PHEV reach 1.3 million, or about 8% of projected total vehicle sales in the Reference case.
• Sales of the longer ranged 200- and 300-mile BEVs grow during the entire projection period, tempering sales of the shorter-range 100-mile BEV and PHEV.
• New vehicles of all fuel types show significant improvements in fuel economy because of compliance with increasing fuel economy standards. New vehicle fuel economy rises by 43% from 2018 to 2050.
128
—but gasoline vehicles remain the dominant vehicle type through 2050
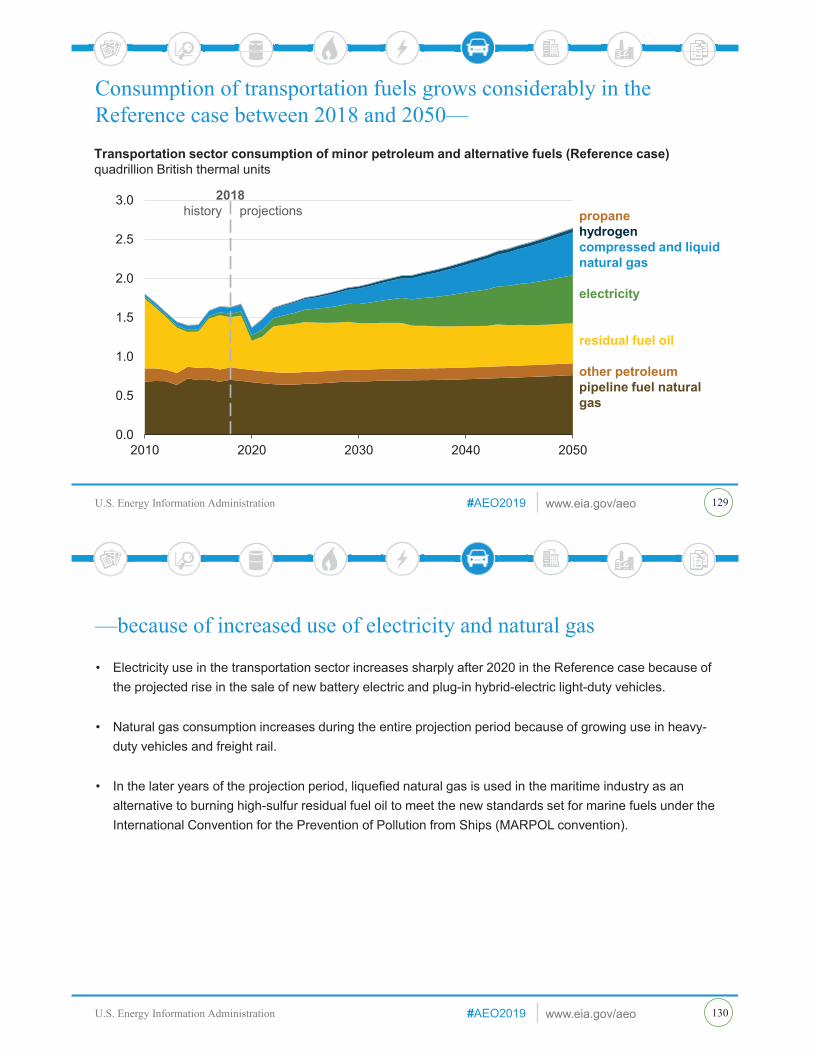
U.S. Energy Information Administration www.eia.gov/aeo#AEO2019U.S. Energy Information Administration 129
Consumption of transportation fuels grows considerably in the Reference case between 2018 and 2050—
0.0
0.5
1.0
1.5
2.0
2.5
3.0
2010 2020 2030 2040 2050
Transportation sector consumption of minor petroleum and alternative fuels (Reference case) quadrillion British thermal units
2018history projections propane
hydrogencompressed and liquid natural gas
electricity
residual fuel oil
other petroleumpipeline fuel natural gas
U.S. Energy Information Administration www.eia.gov/aeo#AEO2019U.S. Energy Information Administration
• Electricity use in the transportation sector increases sharply after 2020 in the Reference case because of the projected rise in the sale of new battery electric and plug-in hybrid-electric light-duty vehicles.
• Natural gas consumption increases during the entire projection period because of growing use in heavy-duty vehicles and freight rail.
• In the later years of the projection period, liquefied natural gas is used in the maritime industry as an alternative to burning high-sulfur residual fuel oil to meet the new standards set for marine fuels under the International Convention for the Prevention of Pollution from Ships (MARPOL convention).
130
—because of increased use of electricity and natural gas

U.S. Energy Information Administration www.eia.gov/aeo#AEO2019U.S. Energy Information Administration
BuildingsDelivered energy consumption and on-site generation in the residential and commercial buildings sectors are expected to grow through 2050 in the Reference case. At the same time, increasing demand for electricity and natural gas is partially offset by advances in energy efficiency.
U.S. Energy Information Administration www.eia.gov/aeo#AEO2019U.S. Energy Information Administration
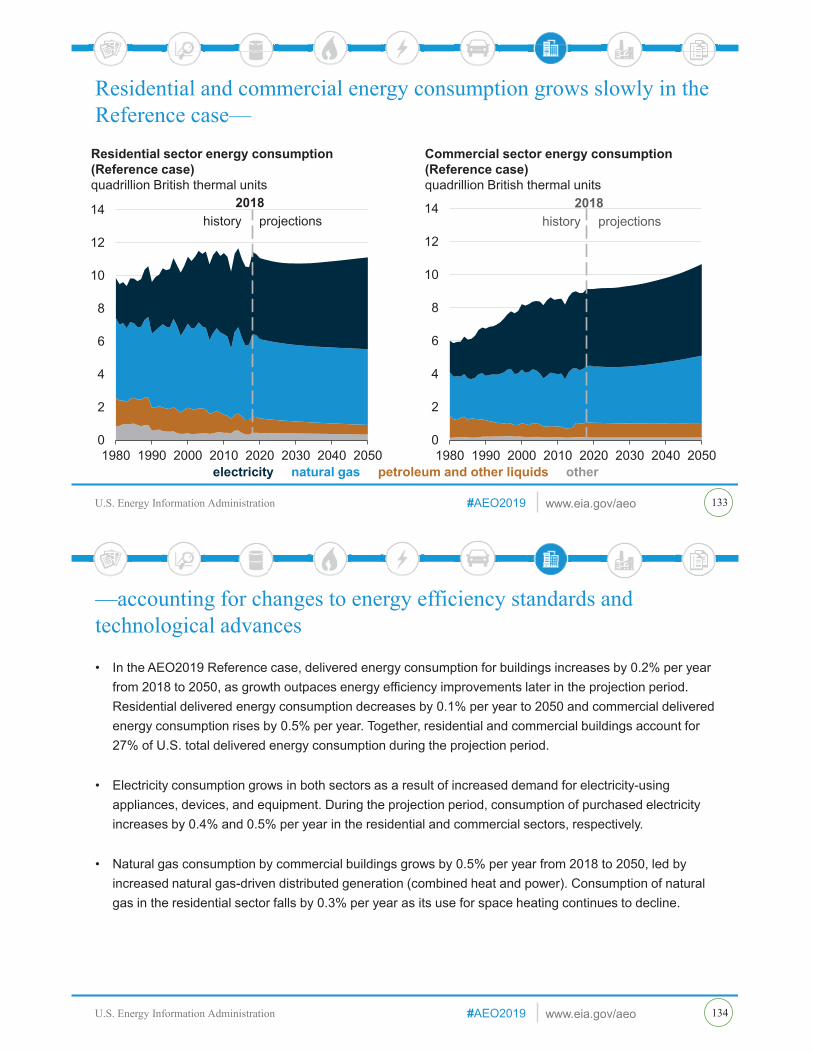
U.S. Energy Information Administration www.eia.gov/aeo#AEO2019U.S. Energy Information Administration 133
Residential and commercial energy consumption grows slowly in the Reference case—
0
2
4
6
8
10
12
14
1980 1990 2000 2010 2020 2030 2040 2050
Residential sector energy consumption(Reference case)quadrillion British thermal units
2018history projections
0
2
4
6
8
10
12
14
1980 1990 2000 2010 2020 2030 2040 2050
Commercial sector energy consumption(Reference case)quadrillion British thermal units
2018history projections
electricity natural gas petroleum and other liquids other
U.S. Energy Information Administration www.eia.gov/aeo#AEO2019U.S. Energy Information Administration
• In the AEO2019 Reference case, delivered energy consumption for buildings increases by 0.2% per year from 2018 to 2050, as growth outpaces energy efficiency improvements later in the projection period. Residential delivered energy consumption decreases by 0.1% per year to 2050 and commercial delivered energy consumption rises by 0.5% per year. Together, residential and commercial buildings account for 27% of U.S. total delivered energy consumption during the projection period.
• Electricity consumption grows in both sectors as a result of increased demand for electricity-using appliances, devices, and equipment. During the projection period, consumption of purchased electricity increases by 0.4% and 0.5% per year in the residential and commercial sectors, respectively.
• Natural gas consumption by commercial buildings grows by 0.5% per year from 2018 to 2050, led by increased natural gas-driven distributed generation (combined heat and power). Consumption of natural gas in the residential sector falls by 0.3% per year as its use for space heating continues to decline.
—accounting for changes to energy efficiency standards and technological advances
134

U.S. Energy Information Administration www.eia.gov/aeo#AEO2019U.S. Energy Information Administration
0
5
10
15
20
25
30
35
New England
East North Central
West North Central
South Atlantic
East South Central
West South Central
Mountain PacificMid-Atlantic
2018 2050
mobile
multifamily
single family
Residential housing units (Reference case)millions
135
Residential housing stocks continue to grow—
CENSUS DIVISIONSNewEngland
Mid-Atlantic
SouthAtlantic
EastSouth
CentralWestSouth
Central
EastNorth
Central
WestNorth
CentralMountain
Pacific
U.S. Energy Information Administration www.eia.gov/aeo#AEO2019U.S. Energy Information Administration
• The number of U.S. households increases by an average of 0.7% per year from 2018 through 2050, with single-family homes growing most quickly at 0.8% per year. Mobile home stocks decrease by 0.8% per year and are the only category not expected to grow.
• Cooling-dominated West South Central, South Atlantic, and East South Central census divisions all experience average annual housing stock growth that exceeds the national average.
• The size of housing units also continue to grow; the national average floorspace per home increases 0.3% per year from 1,779 square feet in 2018 to 1,978 square feet in 2050.
—especially in warmer regions with higher space cooling demand
136

U.S. Energy Information Administration www.eia.gov/aeo#AEO2019U.S. Energy Information Administration 137
Residential energy intensity decreases in the Reference case—
0.0
0.2
0.4
0.6
0.8
1.0
1.2
2015 2020 2030 2040 2050
electricity
total delivered energy
natural gas
Residential delivered energy intensity index (Reference case)2018=1.0
0 1 2 3 4 5
cooking
laundry anddishwashing
TVs and PCs
lighting
refrigerationand freezing
water heating
space cooling
space heating
other uses
Residential purchased electricity intensity(Reference case)thousand kilowatthours per household
20182050
U.S. Energy Information Administration www.eia.gov/aeo#AEO2019U.S. Energy Information Administration
• Total delivered residential energy intensity, defined as annual delivered energy use per household, decreases by 22% from 2018 to 2050 as the number of households grows faster than energy use. The main factors contributing to this decline include gains in appliance efficiency, on-site electricity generation (e.g., solar photovoltaic), utility energy efficiency rebates, increasing residential natural gas prices, and lower space heating demand based on historical trends and a continued population shift to warmer regions.
• Lighting electricity consumption per household declines faster than other electric end uses as a result of compliance with minimum performance requirements of the Energy Independence and Security Act of 2007. The federal standards effectively eliminate low-efficacy incandescent lamps, replacing them with more energy-efficient light-emitting diodes (LEDs) and compact fluorescent lamps (CFLs) by 2020. Energy efficiency incentives also accelerate LED and CFL penetration before 2020. In 2050, purchased electricity intensity for lighting is 51% lower than in 2018.
• As near-term appliance standards result in efficiency gains beyond those caused by market forces and technological change, electricity intensity declines the most quickly before 2030.
138
—although changes in electricity consumption vary by end use

U.S. Energy Information Administration www.eia.gov/aeo#AEO2019U.S. Energy Information Administration 139
Commercial energy consumption growth is limited because of increased appliance and lighting efficiencies—
0.0% 0.5% 1.0% 1.5%
assembly
office
food sales/service
mercantile/service
education
lodging
health care
warehouse
other
Commercial floorspace growth(Reference case)percent compound annual growth rate
0 2 4 6
water heating
cooking
space heating
lighting
ventilation
space cooling
refrigeration
computers/office equip.
other uses
Purchased electricity consumption intensity(Reference case)kilowatthours per square foot
20182050
U.S. Energy Information Administration www.eia.gov/aeo#AEO2019U.S. Energy Information Administration
• Commercial floorspace grows by an average 1% per year in the Reference case through the projection period, reflecting rising economic output. Some of the fastest-growing building types, including health care and lodging, are also among the most energy-intensive.
• Commercial electricity intensity, defined as electricity consumption per square foot of commercial floorspace, declines at an average 0.4% per year from 2018 to 2050. Lighting accounts for the steepest intensity decline among the major end uses, as falling costs and energy efficiency incentives lead efficient light-emitting diodes to displace linear fluorescent lighting as the dominant commercial lighting technology by 2030.
• Improved appliance efficiency and a population shift to warmer regions of the United States cause commercial electricity consumption for space heating, water heating, and ventilation to decline by 29% from 2018 to 2050. This population shift causes space cooling intensity to decrease less rapidly, and commercial space cooling electricity consumption remains flat during the projection period.
• Although the United States has no federal building energy code, state- and local-level building codes also reduce energy used for heating and cooling in commercial buildings.
—but growing floorspace and expanding information technology needs drive an overall increase in electricity consumption
140
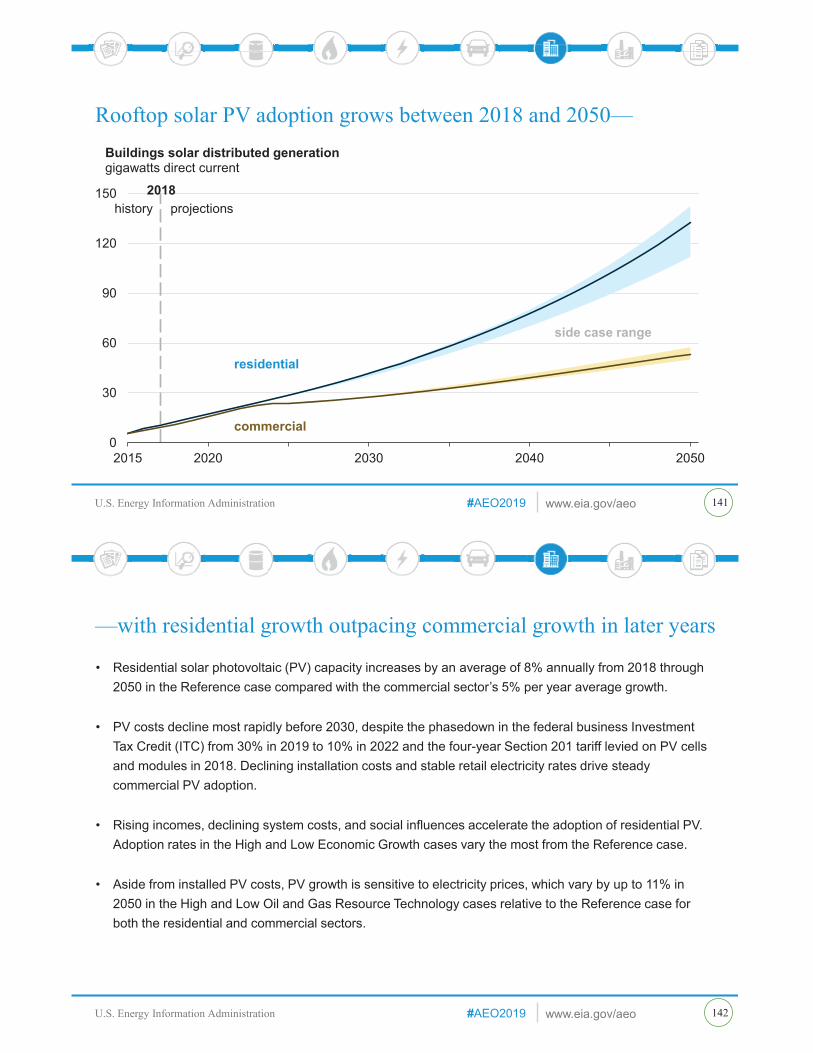
U.S. Energy Information Administration www.eia.gov/aeo#AEO2019U.S. Energy Information Administration 141
Rooftop solar PV adoption grows between 2018 and 2050—
0
30
60
90
120
150
2015 2020 2030 2040 2050
Buildings solar distributed generationgigawatts direct current
side case range
residential
commercial
2018history projections
U.S. Energy Information Administration www.eia.gov/aeo#AEO2019U.S. Energy Information Administration
• Residential solar photovoltaic (PV) capacity increases by an average of 8% annually from 2018 through 2050 in the Reference case compared with the commercial sector’s 5% per year average growth.
• PV costs decline most rapidly before 2030, despite the phasedown in the federal business Investment Tax Credit (ITC) from 30% in 2019 to 10% in 2022 and the four-year Section 201 tariff levied on PV cells and modules in 2018. Declining installation costs and stable retail electricity rates drive steady commercial PV adoption.
• Rising incomes, declining system costs, and social influences accelerate the adoption of residential PV. Adoption rates in the High and Low Economic Growth cases vary the most from the Reference case.
• Aside from installed PV costs, PV growth is sensitive to electricity prices, which vary by up to 11% in 2050 in the High and Low Oil and Gas Resource Technology cases relative to the Reference case for both the residential and commercial sectors.
142
—with residential growth outpacing commercial growth in later years

U.S. Energy Information Administration www.eia.gov/aeo#AEO2019U.S. Energy Information Administration 143
Combined heat and power and other non-solar sources account for less than one-quarter of commercial on-site capacity in 2018—
0
25
50
75
2015 2020 2030 2040 2050
Commercial distributed generation capacity (Reference case)gigawatts direct current
othernatural gas-fired combined heat and powerwindsolar PV
2018history projections
U.S. Energy Information Administration www.eia.gov/aeo#AEO2019U.S. Energy Information Administration
• Non-photovoltaic (PV) technologies such as combined heat and power (CHP) and distributed wind account for 24% of commercial distributed generation capacity in 2018. Although the growth is much slower than for commercial PV, these technologies grow from 3.5 gigawatts of capacity in 2018 to 13.6 gigawatts of capacity by 2050 in the Reference case.
• Apart from PV, natural gas-fired CHP (i.e., conventional turbine, microturbine, reciprocating engine, and fuel cell) capacity expands the most quickly at an average of 5% per year. Its growth is a result of low equipment costs throughout the projection period.
• The installed cost of commercial wind equipment falls by 30% between 2018 and 2050, resulting in an average growth in capacity of 4% per year during this period.
• The 2018 Bipartisan Budget Act extends the Investment Tax Credit provisions for qualifying CHP and small wind equipment (defined as wind turbines with a capacity less than 100 kW) beginning construction before January 1, 2022. These tax credits drive further growth in non-PV distributed generation in the short term.
—but they grow by more than 4% per year, driven by equipment cost declines and near-term tax credits
144
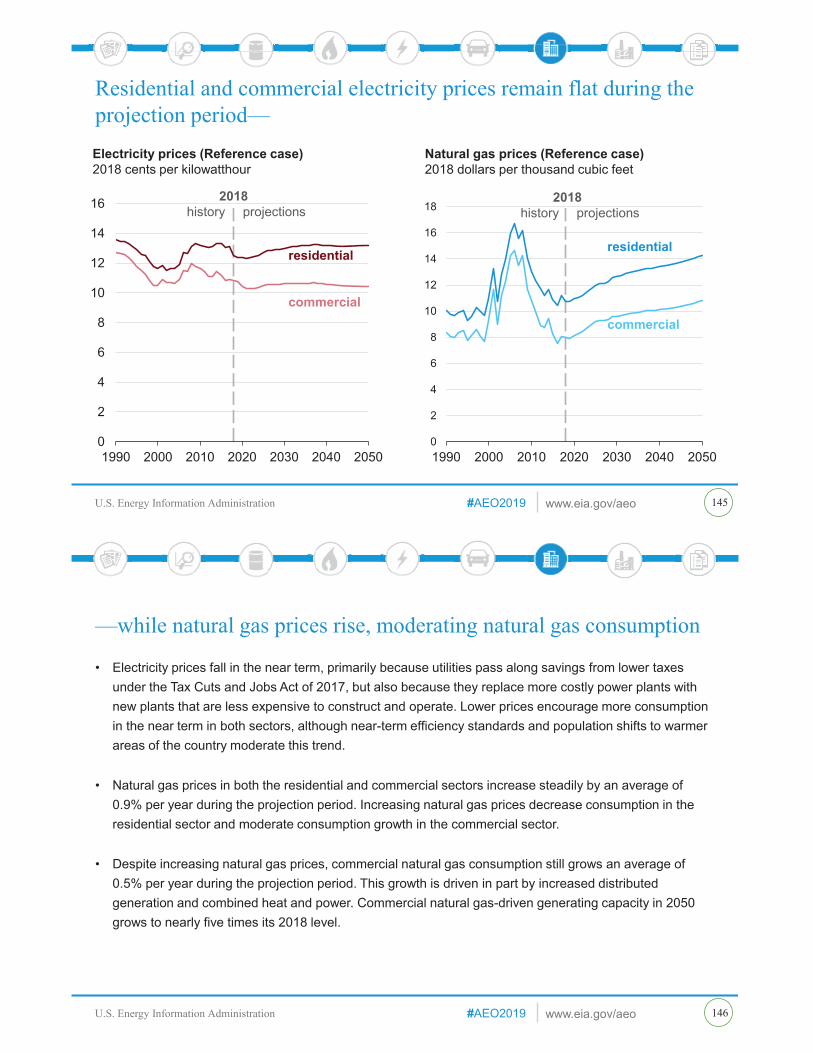
U.S. Energy Information Administration www.eia.gov/aeo#AEO2019U.S. Energy Information Administration 145
Residential and commercial electricity prices remain flat during the projection period—
0
2
4
6
8
10
12
14
16
1990 2000 2010 2020 2030 2040 2050
Electricity prices (Reference case)2018 cents per kilowatthour
2018history projections
residential
commercial
0
2
4
6
8
10
12
14
16
18
1990 2000 2010 2020 2030 2040 2050
2018history projections
Natural gas prices (Reference case)2018 dollars per thousand cubic feet
residential
commercial
U.S. Energy Information Administration www.eia.gov/aeo#AEO2019U.S. Energy Information Administration
• Electricity prices fall in the near term, primarily because utilities pass along savings from lower taxes under the Tax Cuts and Jobs Act of 2017, but also because they replace more costly power plants with new plants that are less expensive to construct and operate. Lower prices encourage more consumption in the near term in both sectors, although near-term efficiency standards and population shifts to warmer areas of the country moderate this trend.
• Natural gas prices in both the residential and commercial sectors increase steadily by an average of 0.9% per year during the projection period. Increasing natural gas prices decrease consumption in the residential sector and moderate consumption growth in the commercial sector.
• Despite increasing natural gas prices, commercial natural gas consumption still grows an average of 0.5% per year during the projection period. This growth is driven in part by increased distributed generation and combined heat and power. Commercial natural gas-driven generating capacity in 2050 grows to nearly five times its 2018 level.
—while natural gas prices rise, moderating natural gas consumption
146

U.S. Energy Information Administration www.eia.gov/aeo#AEO2019U.S. Energy Information Administration
IndustrialEnergy consumption in the industrial sector increases between 2018 and 2050 across all cases. Increases in industrial energy use from increasing shipments are partially offset by efficiency gains. Consumption of all energy sources except coal increases, while coal consumption declines.
U.S. Energy Information Administration www.eia.gov/aeo#AEO2019U.S. Energy Information Administration

U.S. Energy Information Administration www.eia.gov/aeo#AEO2019U.S. Energy Information Administration 149
Consumption of delivered industrial energy grows in all cases—Industrial delivered energy consumptionquadrillion British thermal units
20
25
30
35
40
2000 2010 2020 2030 2040 2050
2018history projections
Low Economic Growth
High Economic Growth
Reference
20
25
30
35
40
2020 2030 2040 2050
High OilPrice
Low Oil Price
2018projections
20
25
30
35
40
2020 2030 2040 2050
Low Oil & GasResource & Technology
High Oil & GasResource &Technology
2018projections
Note: The hatched area on each graph denotes the range between minimum and maximum values among all six side cases for that year.
U.S. Energy Information Administration www.eia.gov/aeo#AEO2019U.S. Energy Information Administration
• U.S. industrial delivered energy consumption in the Reference case grows 31% from 26 quadrillion British thermal units (Btu) to 34 quadrillion Btu between 2018 and 2050.
• By the mid-2020s, industrial energy consumption is highest in the High Economic Growth case, reaching 39 quadrillion Btu in 2050, a 50% increase from 2018. With a faster growing economy, more industrial output such as in food and fabricated metal products increases industrial energy use.
• Initially, industrial energy consumption in the High Oil Price case exceeds consumption in the other cases as a result of higher demand for U.S. products and increased energy use for natural gas liquefaction. After this period, consumption expenditures and investment decline because higher crude oil prices effectively lower income, as well as output growth and energy consumption growth.
• Energy consumption in the High Oil and Gas Resource Technology case is higher than in the Reference case as a result of increased crude oil and natural gas resources and improved extraction technologies that increase energy demand in the mining industry.
—driven by economic growth and affected by low prices and resource availability
150
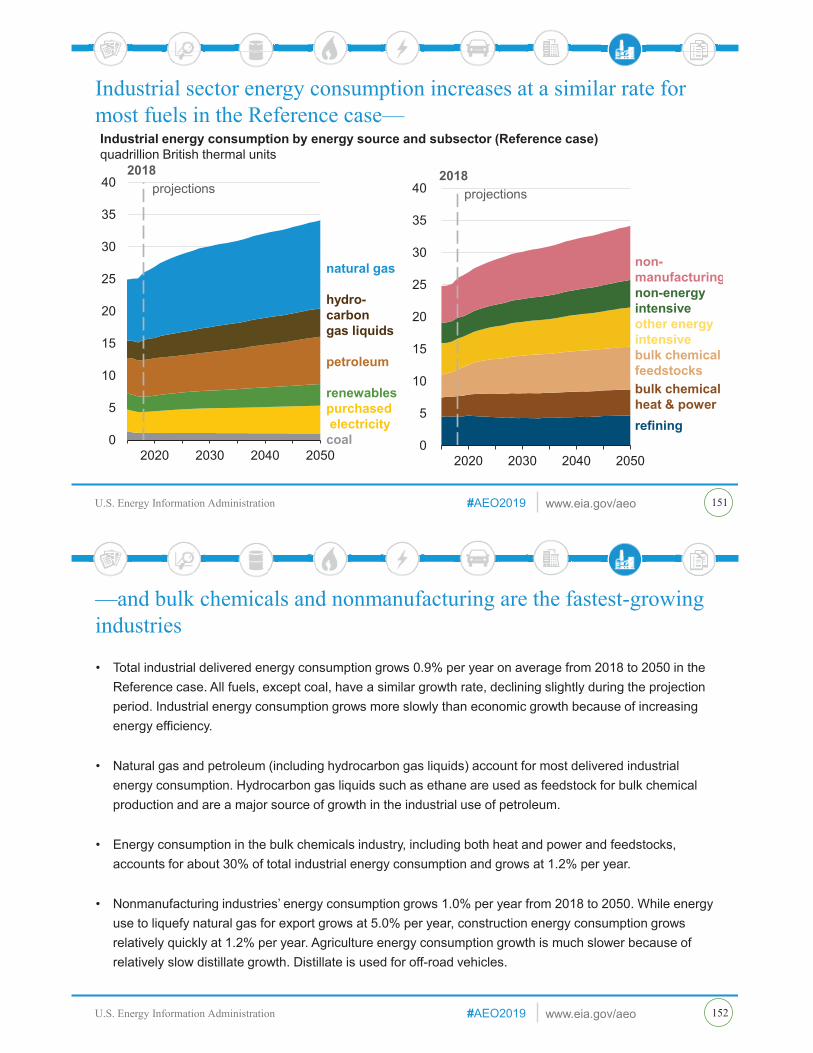
U.S. Energy Information Administration www.eia.gov/aeo#AEO2019U.S. Energy Information Administration 151
Industrial sector energy consumption increases at a similar rate for most fuels in the Reference case—Industrial energy consumption by energy source and subsector (Reference case)quadrillion British thermal units
0
5
10
15
20
25
30
35
40
2020 2030 2040 2050
natural gas
hydro-carbongas liquids
petroleum
renewablespurchasedelectricitycoal
2018projections
0
5
10
15
20
25
30
35
40
2020 2030 2040 2050
non-manufacturingnon-energyintensiveother energy intensivebulk chemical feedstocksbulk chemical heat & powerrefining
2018projections
U.S. Energy Information Administration www.eia.gov/aeo#AEO2019U.S. Energy Information Administration
• Total industrial delivered energy consumption grows 0.9% per year on average from 2018 to 2050 in the Reference case. All fuels, except coal, have a similar growth rate, declining slightly during the projection period. Industrial energy consumption grows more slowly than economic growth because of increasing energy efficiency.
• Natural gas and petroleum (including hydrocarbon gas liquids) account for most delivered industrial energy consumption. Hydrocarbon gas liquids such as ethane are used as feedstock for bulk chemical production and are a major source of growth in the industrial use of petroleum.
• Energy consumption in the bulk chemicals industry, including both heat and power and feedstocks, accounts for about 30% of total industrial energy consumption and grows at 1.2% per year.
• Nonmanufacturing industries’ energy consumption grows 1.0% per year from 2018 to 2050. While energy use to liquefy natural gas for export grows at 5.0% per year, construction energy consumption grows relatively quickly at 1.2% per year. Agriculture energy consumption growth is much slower because of relatively slow distillate growth. Distillate is used for off-road vehicles.
152
—and bulk chemicals and nonmanufacturing are the fastest-growing industries

U.S. Energy Information Administration www.eia.gov/aeo#AEO2019U.S. Energy Information Administration 153
In the Reference case, energy intensities decline in almost all energy-intensive industries—
0 2 4 6 8 10
non-energy intensivemanufacturing
energy-intensivemanufacturing
non-manufacturing
total manufacturing
total industrial sector
20182050
Energy intensity by subsector and energy intensive manufacturing industry (Reference case)trillion British thermal units per billion 2009 dollar shipments
0 6 12 18 24 30
food
aluminum
glass
bulk chem. heat and power
bulk chem. feedstocks
paper
refining
iron and steel
cement and lime
20182050
U.S. Energy Information Administration www.eia.gov/aeo#AEO2019U.S. Energy Information Administration
• Energy intensity in the industrial sector (energy consumption per dollar of output) declines by 0.9% per year on average from 2018 to 2050 in the Reference case. In manufacturing, energy intensity declines as a result of increased energy efficiency of new capital equipment and a shift in the share of production away from energy-intensive industries toward non-energy intensive industries, such as metal-based durables.
• Although the energy-intensive manufacturing industries’ energy intensity declines by a little more than 10%, the non-energy-intensive manufacturing industries see a decline three times faster between 2018 and 2050 because these non-energy intensive manufacturing industries use less heat. Cement and lime intensity declines the most during the projection period, because, to some extent, the dry cement manufacturing process replaces the more energy-intensive wet process during the projection period.
• For some industries, large amounts of combined heat and power generation (CHP) may mask some efficiency gains. CHP generation losses are included in industry energy consumption, but purchased electricity generation losses are included in the electricity sector.
154
—reflecting efficiency gains in existing capacity and implementation of new, more energy-efficient technologies
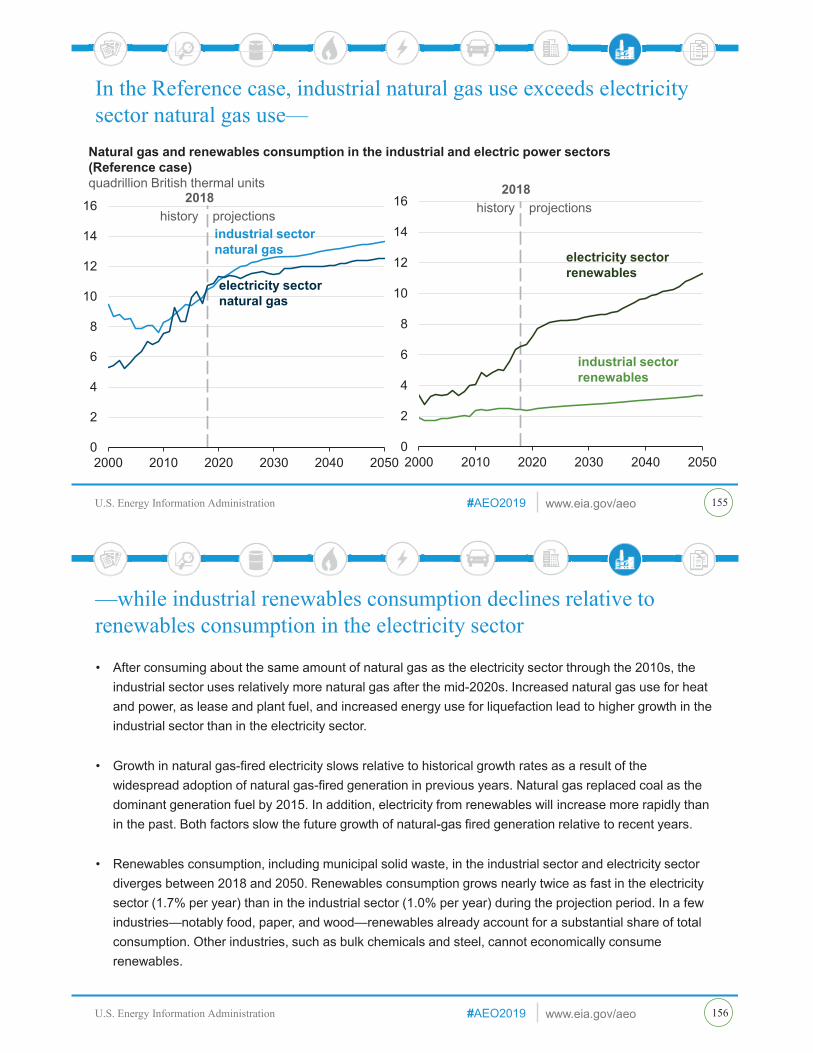
U.S. Energy Information Administration www.eia.gov/aeo#AEO2019U.S. Energy Information Administration 155
In the Reference case, industrial natural gas use exceeds electricity sector natural gas use—
Natural gas and renewables consumption in the industrial and electric power sectors (Reference case)quadrillion British thermal units
0
2
4
6
8
10
12
14
16
2000 2010 2020 2030 2040 2050
electricity sector natural gas
industrial sector natural gas
2018history projections
0
2
4
6
8
10
12
14
16
2000 2010 2020 2030 2040 2050
industrial sector renewables
2018history projections
electricity sector renewables
U.S. Energy Information Administration www.eia.gov/aeo#AEO2019U.S. Energy Information Administration
• After consuming about the same amount of natural gas as the electricity sector through the 2010s, the industrial sector uses relatively more natural gas after the mid-2020s. Increased natural gas use for heat and power, as lease and plant fuel, and increased energy use for liquefaction lead to higher growth in the industrial sector than in the electricity sector.
• Growth in natural gas-fired electricity slows relative to historical growth rates as a result of the widespread adoption of natural gas-fired generation in previous years. Natural gas replaced coal as the dominant generation fuel by 2015. In addition, electricity from renewables will increase more rapidly than in the past. Both factors slow the future growth of natural-gas fired generation relative to recent years.
• Renewables consumption, including municipal solid waste, in the industrial sector and electricity sector diverges between 2018 and 2050. Renewables consumption grows nearly twice as fast in the electricity sector (1.7% per year) than in the industrial sector (1.0% per year) during the projection period. In a few industries—notably food, paper, and wood—renewables already account for a substantial share of total consumption. Other industries, such as bulk chemicals and steel, cannot economically consume renewables.
—while industrial renewables consumption declines relative to renewables consumption in the electricity sector
156

U.S. Energy Information Administration www.eia.gov/aeo#AEO2019U.S. Energy Information Administration
0% 25% 50% 75% 100%
glass
bulk chemicals heatand power
food
aluminum
non-energy intensivemanufacturing
mining
20182050
Natural gas share of energy used for high relative natural gas consumers (Reference case)percent of total
0% 25% 50% 75% 100%
construction
bulk chemicalfeedstocks (inc. HGL)
agriculture
refining
20182050
Petroleum share of energy used for high relative petroleum consumers (Reference case)percent of total
157
Several industries continue to use natural gas for a large share of their energy needs in the Reference case—
U.S. Energy Information Administration www.eia.gov/aeo#AEO2019U.S. Energy Information Administration
• In the Reference case, four energy-intensive manufacturing industries, the entire non-energy intensive manufacturing subsector, and the mining industry used natural gas for more than 40% of their fuel needs. Combined, these industries consumed 7.2 quadrillion British thermal units (Btu) in 2018, or about 70% of total industrial natural gas consumption. These industries consume 10.0 quadrillion Btu of natural gas in 2050.
• These industries use natural gas in different ways. The glass industry uses natural gas for high temperature furnaces. Food and bulk chemicals heat and power use natural gas for heating, steam production, and power generation. The aluminum industry uses natural gas in electric arc furnaces. Non-energy intensive industries use natural gas for heating and cooling buildings. Mining uses natural gas for lease and plant fuel and for a new use—energy to liquefy natural gas for export.
• Four industries use petroleum for more than 40% of their energy needs. Combined, these industries consume 8.8 quadrillion Btu of petroleum in 2018, or about 90% of total industrial consumption, and consumption grows to 11.8 quadrillion Btu in 2050. Agriculture and construction use petroleum mostly for off-road vehicles, while refining uses petroleum, such as still gas, for heat and power. More than 75% of total bulk chemical feedstocks are petroleum products (including hydrocarbon gas liquids).
—while fewer industries rely more on petroleum
158

U.S. Energy Information Administration www.eia.gov/aeo#AEO2019U.S. Energy Information Administration
0
50
100
150
200
250
300
2020 2030 2040 2050
CHP generationbillion kilowatthours
2018projections
bulk chemical
refining
paper0
50
100
150
200
250
300
2020 2030 2040 2050
2018projections
Purchased electricity consumption billion kilowatthours
bulk chemical
refining
paper
159
Self-generation from combined heat and power (CHP), especially for bulk chemicals, grows—
CHP and purchased electricity consumption for three industries with most installed CHP (Reference case)
U.S. Energy Information Administration www.eia.gov/aeo#AEO2019U.S. Energy Information Administration
• Electricity generation from CHP in bulk chemicals, refining, and paper—industries with the most CHP—grows 1.3% per year, from 120 billion kilowatthours (kWh) in 2018 to 181 billion kWh in 2050.
• Bulk chemicals, refining, and paper use the most CHP because they are large industries with high heating needs, and steam is available to use for generation. In 2018, the ratio of CHP generation to purchased electricity is approximately 50% in these industries. By 2050, this ratio climbs to 65%, largely as a result of CHP growth in the bulk chemicals industry.
• While the bulk chemicals industry CHP generation is 90% natural gas-fired or more, the refining and paper industries use sizeable quantities of other fuels. Most paper industry CHP generation is fired by renewables such as black liquor (a byproduct of the pulping process). The refinery industry also uses still gas, a byproduct fuel, for CHP generation. About two-thirds of refining generation is natural gas-fired.
• Of the remaining industries, food and steel have substantial, but much less, CHP than bulk chemicals, paper, and refining. Most other industries have little or no CHP.
—even though electricity purchases for major CHP users remain flat during the projection period in the Reference case
160

U.S. Energy Information Administration www.eia.gov/aeo#AEO2019U.S. Energy Information Administration
References
U.S. Energy Information Administration www.eia.gov/aeo#AEO2019U.S. Energy Information Administration
Commonly used acronyms and abbreviations in this report
162
AEO = Annual Energy Outlookb = barrel(s)BEV = battery-electric vehicleb/d = barrels per daybkWh = billion kilowatthoursBtu = British thermal unit(s)CFL = compact fluorescent lamp CHP = combined heat and powerCO2 = carbon dioxideEIA = U.S. Energy Information Administrationgal = gallon(s)GDP = gross domestic productGW = gigawatt(s)HGL = hydrocarbon gas liquid(s)ITC = Investment Tax Credit
kWh = kilowatthour(s)LED = light-emitting diode LNG = liquefied natural gasMARPOL = marine pollution, the International Convention for the Prevention of Pollution from ShipsMMBtu = million British thermal unitsMMst = million short tonsNEMS = National Energy Modeling SystemNGPL = natural gas plant liquidsPHEV = plug-in hybrid electric vehiclePTC = production tax creditPV = photovoltaic Tcf = trillion cubic feetZEV = zero-emission vehicle

U.S. Energy Information Administration www.eia.gov/aeo#AEO2019U.S. Energy Information Administration
In general:
• Projected values are sourced from:
– Short-Term Energy Outlook, October 2018
– Projections: EIA, AEO2019 National Energy Modeling System (runs: ref2019.d111618a, highprice.d111618a, lowprice.d111618a, highmacro.d111618a, lowmacro.d111618a, highrt.d111618a, lowrt.d111618a)
• Historical data are sourced from:
– Monthly Energy Review (and supporting databases), September 2018
– IHS Markit, Macroeconomic, Industry, and Employment models, May 2018
The history in some graphs are based off of other sources. For source information for specific graphs published in this document, contact [email protected].
Graph sources
163
U.S. Energy Information Administration www.eia.gov/aeo#AEO2019U.S. Energy Information Administration 164
Contacts
AEO Working Groups https://www.eia.gov/outlooks/aeo/workinggroup/
AEO Analysis and Forecasting Expertshttps://www.eia.gov/about/contact/forecasting.php#longterm

U.S. Energy Information Administration www.eia.gov/aeo#AEO2019U.S. Energy Information Administration
AEO2019 Contact Information
165
Topic Subject matter expert contact informationGeneral questions [email protected] dioxide emissions Perry Lindstrom 202-586-0934 [email protected] supply and prices David Fritsch 202-287-6538 [email protected] demand Meera Fickling 202-586-0765 [email protected] activity Vipin Arora 202-586-1048 [email protected] generation, capacity Jeffrey Jones 202-586-2038 [email protected] generation, emissions Laura Martin 202-586-1494 [email protected] prices Lori Aniti 202-586-2867 [email protected] and biodiesel Steve Hanson 202-287-5826 [email protected] demand Kelly Perl 202-586-1743 [email protected] oil demand Ari Kahan 202-586-4058 [email protected] oil production Laura Singer 202-586-4787 [email protected] Energy Modeling System Paul Kondis 202-586-1469 [email protected] gas markets Katie Dyl 202-287-5862 [email protected] energy Michael Scott 202-586-0253 [email protected] and natural gas production Meg Coleman 202-586-1724 [email protected] Oil refining and markets James Preciado 202-586-8769 [email protected] energy Chris Namovicz 202-586-7120 [email protected] demand Kevin Jarzomski 202-586-3208 [email protected] demand John Maples 202-586-1757 [email protected] oil prices Vipin Arora 202-586-1048 [email protected]
U.S. Energy Information Administration www.eia.gov/aeo#AEO2019U.S. Energy Information AdministrationU S. Energy Information Administration www.eia.gov/aeo#AEO2019U.S. Ene gy Information AdministrationU.S. Energy Information AdmU.S. Energy Information Adm
U.S. Energy Information Administration homepage | https://www.eia.gov/
Short-Term Energy Outlook | https://www.eia.gov/outlooks/steo/report/
Annual Energy Outlook | https://www.eia.gov/outlooks/aeo/
International Energy Outlook | https://www.eia.gov/outlooks/ieo/
Monthly Energy Review | https://www.eia.gov/totalenergy/data/monthly/
Today in Energy | https://www.eia.gov/todayinenergy/
For more information
January 24, 2019www.eia.gov/aeo#AEO2019