winter fuels outlook - eia.gov
TRANSCRIPT

U.S. Energy Information Administration | Winter Fuels Outlook October 2021 1
October 2021
Winter Fuels Outlook As we head into the winter of 2021–22, retail prices for energy are at or near multiyear highs in the United States. The high prices follow changes to energy supply and demand patterns in response to the COVID-19 pandemic. We expect that households across the United States will spend more on energy this winter compared with the past several winters because of these higher energy prices and because we assume a slightly colder winter than last year in much of the United States.
Even when we vary weather expectations, we expect the increase in energy prices as the United States returns to economic growth to mean higher residential energy bills this winter:
• We expect that the nearly half of U.S. households that heat primarily with natural gas will spend 30% more than they spent last winter on average—50% more if the winter is 10% colder-than-average and 22% more if the winter is 10% warmer-than-average.
• We expect the 41% of U.S. households that heat primarily with electricity will spend 6% more—15% more in a colder winter and 4% more in a warmer winter.
• The 5% of U.S. households that heat primarily with propane will spend 54% more—94% more in a colder winter and 29% more in a warmer winter.
• The 4% of U.S. households that heat primarily with heating oil will spend 43% more—59% more in a colder winter and 30% more in a warmer winter.
Forecast expenditures can also vary significantly across U.S. regions and fuels for this winter (see Winter Fuels Outlook table).
Background. Our expectation of a colder winter is based on forecasts from the National Oceanic and Atmospheric Administration (NOAA). NOAA’s expectation is a key input to our energy consumption forecast and contributes to our expectation of increases in winter energy consumption.
For this outlook, we define the winter heating season as October through March. The average household winter energy expenditures discussed in this supplement are broad measures for comparing recent winters and reflect energy expenditures for all uses, not just heating. Fuel expenditures for individual households depend on the size and energy efficiency of individual homes and their heating equipment, along with thermostat settings and weather conditions. Each fuel also has its own market structure, physical infrastructure, regulations, and limitations that can affect the connection between wholesale and retail market events.

U.S. Energy Information Administration | Winter Fuels Outlook October 2021 2
We use our Residential Energy Consumption Survey (RECS) as a baseline to estimate average energy consumption during the winter in each region. To develop our forecast household expenditures for natural gas, heating oil, electricity, and propane in this report, we group households by their primary space heating fuel. We forecast total winter expenditures for all uses for each primary heating fuel, not just the portion attributable to heating. For example, the expenditures included for households that heat primarily with electricity in this report would also include electricity used for appliances and lighting. Because electricity has the widest range of uses among the fuels, electricity consumption tends to be less sensitive to changes in temperatures than other fuels.
On average across the United States, we expect prices for all fuels to be higher than in recent winters. Rising wholesale commodity prices for natural gas, crude oil, and petroleum products are being passed through to retail prices. Although we attribute price increases over the past year to several factors, the main reason wholesale prices of natural gas, crude oil, and petroleum products have risen is that fuel demand has increased from recent lows faster than production. This dynamic has led to falling inventories, as in the case of crude oil and several petroleum products, and inventories increasing by less during the summer than historical averages, as in the case of natural gas and propane.
For petroleum products, commodity price changes are passed to consumers quickly. On October 1, benchmark Brent crude oil spot prices were $79 per barrel (b), which was up 51% from last winter’s average, and we expect average retail prices this winter for propane to be about 49% higher and heating oil to be 33% higher than last winter’s average.
Commodity price changes affect residential prices for natural gas and, particularly, electricity prices over relatively longer periods because these costs are incorporated into regulated rates. Even with a lag, increases in spot commodity prices over the past year are pushing up retail prices this winter. Henry Hub natural gas spot prices were $5.61 per million British thermal units (MMBtu) on October 1, which is up 84% from last winter’s average. This price increase contributes to our forecast that residential natural gas prices this winter will be 27% higher than last winter and that residential electricity prices will be 5% hgher than last winter.
Based on NOAA’s most recent winter forecast, we assume temperatures for the winter of 2021–22 will be slightly colder than last winter’s for most of the country and more similar to the average winter of the previous 10 years. We use heating degree days (HDDs) as a measure of how cold temperatures are compared with a base temperature—more HDDs indicate colder temperatures. On average, we expect 3% more population-weighted HDDs for the winter of 2021–22 across the United States than last winter and 1% more than the previous 10-winter average. Regionally, changes from last winter are fairly consistent. We forecast that the Northeast, Midwest, and West will all have 3% to 4% more HDDs this winter than winter 2020-21, and that HDDs in the South will be about the same as last winter.
Because weather is a significant source of uncertainty in these forecasts, the Winter Fuels Outlook includes scenarios where, measured in HDDs, all regions are 10% colder or 10% warmer
U.S. Energy Information Administration | Winter Fuels Outlook October 2021 3
than the baseline forecast. As last year demonstrated, even in close-to-average winter, severe energy market disruptions can occur. Earlier this year, a cold snap in February affected much of the country, particularly Texas, and caused disruptions to energy supplies that continue to affect energy markets. Although these weather events are inherently unexpected, the prevailing high prices and low inventory levels across a range of fuels heading into this winter mean that even short spells of severe weather have the potential to affect energy markets.
Cold weather can affect household heating expenditures in two ways. First, it raises the amount of energy required to keep a house at a specific temperature. Second, because it raises demand and could cause supply disruptions, cold weather can cause energy prices to rise, a development that can be more acute in a time of low fuel inventories.
Although this effect exists across all fuels, the effects are likely to be most acute for propane, for which wholesale-to-retail price pass-through occurs quickly and cold weather can significantly affect market dynamics and prices. For example, in the Midwest, the market where cold weather has caused propane supply issues in past winters, we expect that in a 10% colder-than-forecast scenario, propane retail prices would be about 12% higher and households would consume 12% more propane, leading to expenditures that are 26% higher than in our base case.
For natural gas, however, the immediate effects of a cold winter come more from the consumption side. In a 10% colder-than-forecast scenario, we forecast U.S. natural gas retail prices would be 2% higher, with 13% more consumption, leading to expenditures that are 15% higher than in our base case.
Natural Gas. Nearly half of all U.S. households heat primarily with natural gas. We expect households that use natural gas as their primary space heating fuel will spend $746 this winter, 30% more than they spent last winter. This increase in natural gas expenditures comes from both higher expected prices and higher expected consumption.
We forecast that an average of 20.8 billion cubic feet per day (Bcf/d) will be consumed by U.S. residences this winter. For households that use natural gas as their primary space heating fuel, we expect average household consumption for the winter to total 58 thousand cubic feet (Mcf), up 2% from last winter. We forecast a 3% increase in average natural gas consumption per household in the Northeast, Midwest, and West. We expect residential natural gas consumption in the South to be about the same as last year.
We forecast that the residential natural gas price for homes in the United States that heat primarily with natural gas will average $12.92/Mcf, up from an average of $10.17/Mcf last winter. We forecast higher residential prices because of higher commodity prices for natural gas in much of 2021 compared with 2020, when we had historically low natural gas prices.
Changes in natural gas spot prices generally pass through to residential customers relatively slowly. Some state utility commissions set the rates that utilities can charge for natural gas deliveries a year or more in advance of billing to reflect the cost of wholesale natural gas that utilities purchased over many months. In addition, residential prices include charges to cover
U.S. Energy Information Administration | Winter Fuels Outlook October 2021 4
utility operating costs and the cost to transport and distribute natural gas, which are not directly linked to wholesale commodity natural gas prices. However, given the increases in natural gas commodity prices over the past year, we expect consumers to experience larger increases in retail prices than they have in previous winters. If spot prices continue to rise, retail prices this winter could be even higher than our forecast.
Regional natural gas spot prices reached record-high levels following the February 2021 cold snap, especially in the Midwest. Following the price spike, spot prices quickly returned to pre-cold snap levels. Although a spike in wholesale natural gas prices is not immediately reflected in retail prices, the additional cost of natural gas for utilities is typically passed on as smaller increases in retail prices over time. For example, the Henry Hub spot price in January 2021 was 34% higher than in the previous year, but by February, it reached 180% higher before declining in March. Following this spike in the wholesale price, the U.S. average retail price for residential natural gas averaged 2% higher year-over-year during January and February 2021, before reaching 7% higher in March, the month following the cold snap, and 18% higher during the second quarter of the year.
We forecast that residential natural gas prices will increase in all regions of the United States this winter. We expect the largest increase to occur in the Midwest, where we forecast that prices will average 45% higher than last winter. We expect residential natural gas prices to increase by 22% in the South and 20% in the West. The Northeast, where much of the country’s natural gas is now produced, will see a relatively smaller residential price increase of 14%.
We forecast natural gas spot prices at the U.S. benchmark Henry Hub to average $5.67/MMBtu this winter, an 86% increase from last winter. A combination of flat U.S. natural gas production and record-high levels of liquefied natural gas (LNG) exports have resulted in below-average storage levels and upward pressure on prices. U.S. production of dry natural gas averaged 91.6 Bcf/d in the first half of 2021, an increase of 0.1 Bcf/d from annual 2020 production. Natural gas exports in the first half of 2021 averaged 18.0 Bcf/d, an increase of 3.7 Bcf/d from the same period in 2020, and 2.8 Bcf/d of that increase came from LNG exports. We expect U.S. exports of LNG to exceed pipeline exports of natural gas for the first time on an annual basis in 2021. Imports of natural gas, however, did not increase at the same rate as exports. Natural gas imports increased 0.8 Bcf/d from the first half of 2020 to the first half of 2021. Most U.S. imports of natural gas are pipeline imports from Canada.
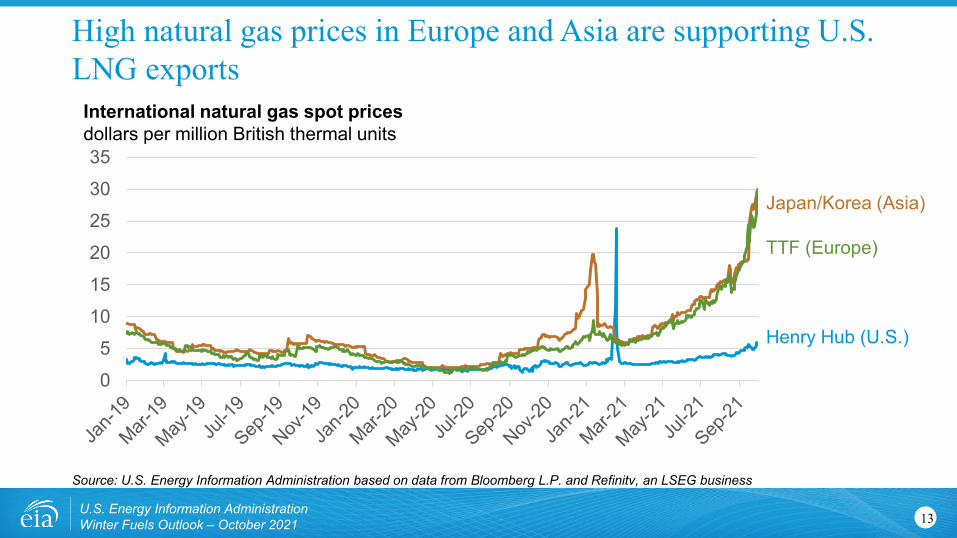
Despite the high U.S. natural gas prices, futures prices for Henry Hub have traded at steep discounts to prices in Asia and Europe. In September, the Henry Hub spot price averaged $5.16/MMBtu. In contrast, the LNG spot price in Asia averaged $23.35/MMBtu in September, and the price at Europe’s natural gas benchmark Title Transfer Facility in the Netherlands averaged $23.02/MMBtu, according to data from Bloomberg Finance, L.P. This price difference has led to record volumes of U.S. LNG exports, especially to destinations in Asia and Europe. In addition, high prices in Europe and Asia have contributed to upward price pressure for U.S. natural gas, as those markets import more U.S. LNG cargoes.

U.S. Energy Information Administration | Winter Fuels Outlook October 2021 5
We forecast that working natural gas inventories in the United States will reach almost 3.6 trillion cubic feet (Tcf) at the end of October, or 5% below the previous five-year average. U.S. natural gas storage injections usually take place from April 1 to October 31, although injections often occur in early November, depending on temperatures and market conditions. Storage withdrawals typically take place from November through March and decrease the overall level of natural gas in U.S. storage. Because of above-average withdrawals of natural gas from storage during the November—March period last year, working natural gas inventories in the United States began the injection season 2% below the five-year average for that time of year. The above-average withdrawals last winter, combined with below-average injections into storage this summer, high levels of LNG exports, and flat production all contribute to our forecast of below-average inventories of U.S. natural gas for this coming winter.
Under the baseline temperature scenario for Winter 2021–22, we expect draws in natural gas inventories to outpace the five-year average. By the end of March 2022, we expect natural gas inventories to fall below 1.5 Tcf, which would be 12% below the previous five-year (2017–21) average for that time of year. In addition to the assumption that temperatures will be colder than last winter, leading to more space heating demand, we expect increased LNG exports to result in larger natural gas storage draws this winter. We forecast U.S. exports of LNG will average 10.7 Bcf/d this winter, a 19% increase, or 1.7 Bcf/d, from last winter.
In a 10% colder-than-forecast scenario, we expect natural gas inventories to end March 2022 at less than 1.0 Tcf, which is 44% below the five-year average. In this scenario, Henry Hub spot prices would likely rise significantly above our forecast levels. In a 10% warmer-than-forecast scenario, inventories end March 2022 at 1.9 Tcf, which is 10% more than the five-year average.
In the colder-than-forecast scenario, we expect 15% more U.S. residential natural gas consumption on average than last winter, 30% higher natural gas prices, and 50% higher resulting household expenditures. In a colder-than-forecast winter, we would expect Henry Hub spot prices to be higher than our baseline forecast. However, because of the delay in the link between wholesale and residential natural gas prices, we expect the biggest effect on expenditures in this scenario to come from higher consumption. Compared with the base case, forecast natural gas retail prices would be 2% higher in the cold scenario, and consumption would be 13% higher, leading to expenditures that are 15% higher than in our base case.
In a 10% warmer-than-forecast scenario, we forecast natural gas consumption would be 3% lower than last winter, and prices would be 26% higher than last winter, resulting in household expenditures that would be 22% higher than last winter.
We expect natural gas supplies to be adequate to meet winter demand. However, wholesale price volatility and localized wholesale price spikes could occur during severely cold temperatures. Wholesale price spikes resulting from constrained natural gas supplies can also have ripple effects through energy distribution systems. Higher wholesale prices or curtailments to electric power generators can cause electric generators to turn to other fuels during cold periods.
U.S. Energy Information Administration | Winter Fuels Outlook October 2021 6
Heating Oil. We expect that the 4% of U.S. households that use heating oil as the primary space heating fuel will spend $1,734 on average this winter, up 43% from last winter. These higher heating oil expenditures primarily reflect higher retail heating oil prices, which we forecast will be 33% higher than last winter. These higher heating oil prices are driven by higher crude oil prices and higher refining margins than last winter. In addition, with a colder winter, we expect the average house that uses heating oil as a primary heating fuel to use 8% more fuel this winter than last winter.
Customers in the Northeast rely on heating oil more than in any other region. About 18% of households in this region use heating oil as a primary space heating fuel, down from 27% a decade ago. An increasing number of homes in the Northeast have switched to natural gas or electricity for primary space heating needs.
We expect retail heating oil prices to be 84 cents per gallon (gal), or 33%, higher than last winter. In our forecast, the Brent crude oil price, which is the most relevant crude oil price in determining U.S. petroleum product prices, will average $80/barrel (b), or $1.90/gal this winter, which would be 65 cents/gal (52%) higher than last winter. Heading into the winter last year, the average price of Brent crude oil in September 2020 was $41/b, though the price of Brent increased to $65/b in March 2021 as global economic and travel activity generally increased throughout the winter. The higher forecast Brent crude oil price this winter primarily reflects a decline in global oil inventories compared with last winter as a result of global oil demand that has risen amid restrained production levels from OPEC+ countries.
Any deviation in crude oil prices from our forecast would cause a similar deviation in retail heating oil prices and consumer expenditures. Changes in prices of crude oil and wholesale heating oil pass through to the retail heating oil price much more quickly than changes in the wholesale natural gas price passes through to retail natural gas prices. In addition, many heating oil users buy supplies ahead of the winter and refill as needed. When forecasting expenditures, our analysis does not account for heating oil that consumers purchase ahead of its use. We assume that consumers pay the prevailing retail price at the time the heating oil is consumed.
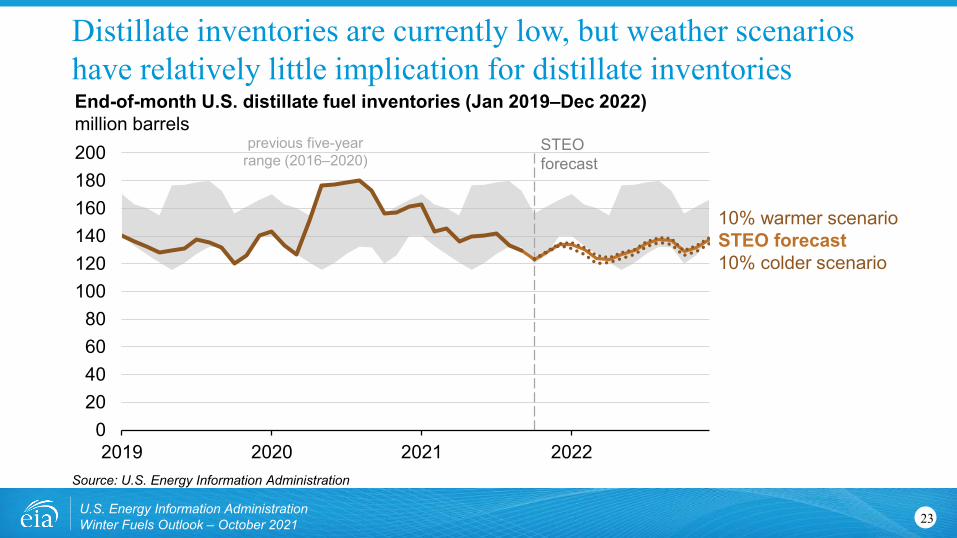
Distillate fuel inventories (which include heating oil and diesel fuel) in the Northeast totaled 27.4 million barrels on October 1, 2021, which is 30% less than the five-year (2016–20) average for that week and 21.4 million barrels (44%) less than at the same time last year, when low distillate fuel demand in 2020 contributed to high inventory levels. Distillate inventories in the Northeast began 2021 above the five-year average but generally declined over the first five months of the year, when refineries ran at reduced rates because of a decline in petroleum consumption related to the COVID-19 pandemic and weather-related outages. Distillate inventories in the Northeast have remained below the previous five-year average since the week of April 23, 2021, and then on May 7 (when Northeast distillate inventories were already 18% below the five-year average), Colonial Pipeline halted operations because of a cyberattack. Distillate inventories in the Northeast hit a 2021 low of 24.7 million barrels the week of May 21. After operations on Colonial Pipeline were restored, distillate inventories in the Northeast increased, but they have remained below the five-year average.

U.S. Energy Information Administration | Winter Fuels Outlook October 2021 7
The low inventory levels are likely to put upward pressure on heating oil prices. However, a number of supply options are available in the Northeast, including pipeline shipments from other U.S. regions, imports from international markets, and coastwise shipments from other U.S. ports. As a result, we do not expect significant supply disruptions in the Northeast. However, periods of severe cold weather could lead to more withdrawals from inventories and higher distillate prices, which could encourage more shipments from other regions or imports from other countries. But encouraging imports from other international markets may require higher prices than in past years because of relatively low distillate stock levels in other Atlantic Basin markets.
Relatively low global natural gas and coal supplies can also affect U.S. distillate markets because certain international markets use distillate fuel for power generation if prices of natural gas or coal become uneconomical or if supplies of those fuels are unavailable.
We expect that low inventory levels will be reflected in higher refinery margins for distillate fuel (the price difference between wholesale distillate fuel oil and Brent crude oil). For winter 2021–22, we forecast that distillate wholesale margins will average 44 cents/gal, which would be 14 cents/gal higher than last winter and 5 cents/gal higher than the previous five-winter (2016–17 through 2020–21) average. We expect that margins will be higher this winter as a result of an overall increase in global oil demand, including for distillate fuel.
We forecast more U.S. distillate production this winter because of these higher margins. We forecast crude oil refinery inputs will average 15.2 million b/d this winter, a 10% increase compared with the last winter. This winter, we expect refinery and blender production of distillate fuel will average 4.6 million b/d, which would be 6% more than last winter. Margins could be higher than our forecast if cold weather causes heating oil demand to rise sharply or other factors cause distillate demand to rise beyond our expectations. Also, as the severely cold weather in Texas in February 2021 showed, weather-related disruptions can reduce fuel supplies from refineries and put upward pressure on refining margins.
This winter, we expect that the number of U.S. households using heating oil as the primary space heating fuel will total 5.1 million, down from 5.3 million last winter. However, we expect heating oil consumption per household to increase this winter compared with last winter. We forecast heating oil consumption per household to average 511 gallons this winter due to colder weather, a nearly 8% increase. In the Northeast United States, where home heating with heating oil is most prevalent, our forecast assumes this winter will be 4% colder than last winter.
If the United States experiences a 10% colder-than-forecast winter, we expect that average household expenditures for heating oil would be 59% higher than last winter. In that case, we forecast 35% higher heating oil prices and 18% more consumption. Because heating oil is a relatively small part of the global distillate market, cold weather tends to have less of an effect on distillate and crude oil market conditions than for fuels such as propane and natural gas. However, cold weather can affect local retail heating oil markets if supply conditions become constrained and could put upward pressure on retail margins. Because of high natural gas prices

U.S. Energy Information Administration | Winter Fuels Outlook October 2021 8
worldwide, cold weather could affect retail heating oil prices more than in recent years if distillate fuel is substituted for natural gas in power generation, leading to upward pressure on distillate refining margins.
In the 10% warmer scenario, we forecast expenditures will be 30% more than last winter, resulting from heating oil prices that are 32% higher than last winter and consumption that is 2% lower than last winter.
Electricity. We forecast that U.S. households that heat primarily with electricity will spend an average of $1,268 this winter on their electricity bills, which is 6% more than last winter. This increase is a result of our forecast of 1% more electricity consumption and 5% higher residential electricity prices. Nearly all U.S. households use electricity in some form, but 41% rely on electric heat pumps or electric resistance heaters as their primary source for space heating. Nearly two-thirds of homes in the South heat primarily with electricity. Electric heaters are also commonly used as a secondary heating source in many U.S. homes.
In the South, we forecast 7% higher winter electricity expenditures, primarily because of expected higher prices. In the West, where just over one-third of homes use electricity for heating, we forecast winter expenditures will average almost 3% more than last year, primarily because of expected colder winter weather.
We expect U.S. residential retail electricity prices will average 13.8 cents per kilowatthour this winter, which would be 5% higher than last winter. For context, year-over-year growth in nominal electricity prices during the past five winters has averaged about 1% each year.
Our forecast of winter residential electricity consumption reflects all types of electricity use such as lighting, appliances, and electronics. However, in those homes that primarily heat with electricity, overall winter temperatures can have a significant effect on the amount of electricity consumed by residential households. In the South, where most households heat with electricity, we forecast that electricity consumption will be almost unchanged from last winter. In the Northeast, West, and Midwest, we forecast that residential electricity consumption will be 2% higher this winter.
Last winter, many U.S. households were under stay-at-home orders, most children attended school virtually, and many people worked from home. Although economic activity has been returning to pre-pandemic levels over the past year, some virtual learning continues and a considerable number of office employees continue to work from home. We estimate about 3% more residential electricity demand as a result of these changing social patterns. Our forecast assumes increased usage will continue this winter.
Retail electricity prices reflect the cost of providing the electricity, especially the cost of fuel for power generation and wholesale electricity prices. During the first seven months of this year, the cost of natural gas delivered to U.S. electric generators averaged $4.97/MMBtu, which is more than double the average cost in 2020. Wholesale power prices have similarly increased. Changes in electricity supply costs can take time to translate to changes in retail rates. High

U.S. Energy Information Administration | Winter Fuels Outlook October 2021 9
costs pass through to customers quicker in areas of the country with deregulated retail markets and consumer choice of electricity providers. We expect residential electricity prices in the Northeast this winter to increase more than 7% while retail electricity prices in the West increase 1% above last winter.
The mix of energy sources used to generate electricity in the U.S. electric power sector this winter is different from last year as a result of changes in expected fuel costs and changes in available generating capacity. We forecast that the price of natural gas delivered to electric generators in December 2021 will average $6.38/MMBtu, which would be 101% higher than last December. As a result of higher forecast fuel costs, we expect the share of U.S. electricity generation fueled by natural gas this winter to decline from 35% to 32%, while the share of electricity generated by coal rises from 23% to 24% of U.S. generation. However, our expectation of these fuel shares of electricity generation are more uncertain this winter than in past years. Over the past few months, natural gas fueled more generation at certain price levels than we expected, which probably reflected less availability of coal as an alternative source of power. If this situation continues into the winter, we may have more natural gas-fired generation than we expect, less coal-fired generation, and consequently, higher natural gas spot prices than our current forecast.
In the scenario that assumes a 10% colder-than-forecast winter, we forecast expenditures for electricity that are 15% higher than last winter. In this case, electricity prices will be 4% higher than last winter with 10% more consumption. In the scenario that assumes a 10% warmer-than-forecast winter, we forecast expenditures for electricity that are 4% higher than last winter. In this case, electricity prices would be 6% higher than last winter with 2% less consumption.
Propane. About 5% of all U.S. households use propane as their primary space heating fuel. Because of increased data availability, beginning this year, the Winter Fuels Outlook will now include propane forecasts for the South in addition to the Northeast and Midwest. We forecast that households in these regions will spend $631 (54%) more on average for propane this winter compared with last winter, driven mostly by higher propane prices this year.
We expect that households heating with propane in the Northeast will spend an average of $2,012, which would be 47% more than last winter. This increase in expenditures for propane-fueled heating is a result of our forecast of 42% higher propane prices and 3% more household consumption on average, compared with last winter. We expect households in the Midwest to spend an average of $1,805, which would be 69% more this winter, reflecting propane prices that are 65% higher than last winter and 2% more consumption. In the South, we expect households to spend an average of $1,643, which would be 43% more this winter, reflecting average propane prices that are 42% higher than last winter and a similar level of consumption.
Similar to heating oil, changes in wholesale propane prices pass through relatively quickly to retail propane prices, and many propane users buy supplies ahead of the winter and refill as needed. When forecasting expenditures, our calculations do not account for propane that consumers purchase ahead of its use or propane that was contracted at prices set before the
U.S. Energy Information Administration | Winter Fuels Outlook October 2021 10
start of the winter. We assume consumers pay the prevailing retail price at the time the fuel is consumed.
Propane markets are experiencing low inventory levels and high prices heading into the winter heating season. As of October 1, wholesale propane spot prices at the Mont Belvieu hub, near Houston, were up $1.00/gal (204%) from the same time in 2020. Propane spot prices have recently been at their highest levels since February 2014 as a result of increased global demand for propane, relatively flat U.S. propane production, and less global propane production because of limited oil supplies from OPEC+ countries. These factors have contributed to U.S. propane inventories building at a slower pace than the previous five-year average over the summer. The significant increase in wholesale propane prices is subsequently pushing up retail propane prices. We expect residential propane prices this winter to be the highest since the winter of 2013–14.
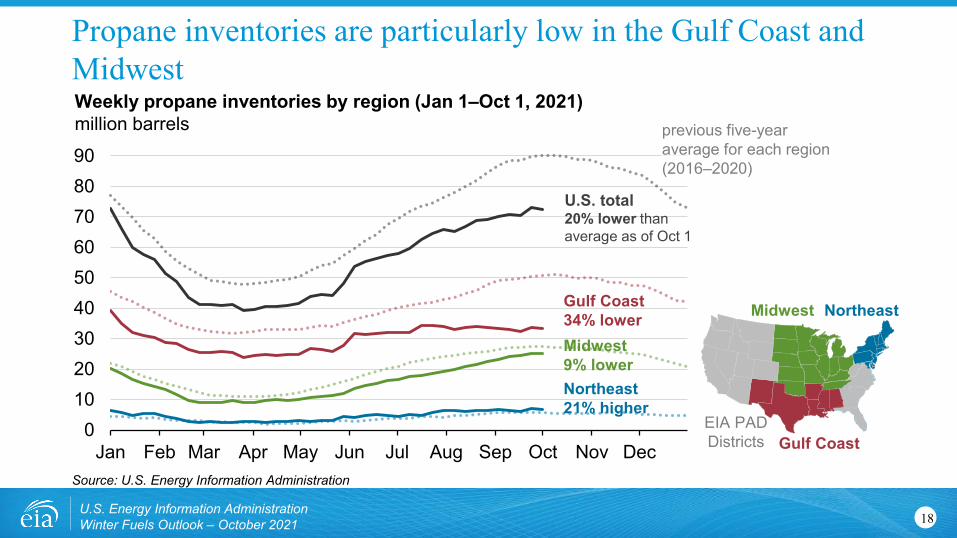
Propane inventories typically build in the United States between April and October and begin drawing down in late-September or October, when agricultural use of propane rises and temperatures begin to fall. U.S. propane (including propylene) inventories were 72.3 million barrels on October 1, or 20% less than the five-year average and 29% less than at the same time last year. U.S. propane inventories are lower at the major storage centers in the Gulf Coast and the Midwest, which together account for about 80% of all U.S. propane inventories. At the beginning of October, inventories in the U.S. Gulf Coast region were 34% below the five-year average and in the Midwest 9% lower. However, inventory levels in the Northeast and West Coast/Mountain regions were above their five-year averages.
Propane inventory builds in the United States, and particularly on the Gulf Coast, were limited this summer as a result of global propane market dynamics. U.S. propane exports averaged more than 1.3 million b/d during the first seven months of 2021, the most on record during that period. Global demand of U.S. propane was high because of rising consumption in the petrochemical sector. However, global propane supplies have been limited because of the OPEC+ crude oil production cuts, which have reduced associated supply of hydrocarbon gas liquids (HGLs), including propane. U.S. propane production has also been relatively flat, remaining mostly unchanged through July 2021 compared with the same period in 2020.
Given relatively low inventory levels heading into winter, weather will be a key determinant of propane market outcomes and consumer expenditures this winter. In the base temperature case, we forecast 11% more U.S. propane production at natural gas plants and refineries this winter, 1% more domestic consumption, and net exports that are 4% higher than last winter.
Our forecast increase in total U.S. propane consumption reflects our expectation of higher demand for propane as a heating fuel because of slightly colder forecast weather this winter compared with last winter and because of increased demand for propane as a petrochemical feedstock. Propane is also used as a fuel for drying agricultural crops early in the winter heating season. For this outlook, we assume agricultural consumption to dry grain will fall below last year’s level. The corn crop achieved maturity two weeks ahead of the five-year average,

U.S. Energy Information Administration | Winter Fuels Outlook October 2021 11
allowing the crop to dry in the field, requiring less drying in propane-fueled commercial grain dryers.
We forecast U.S. propane exports this winter will be similar to last winter’s high levels. Propane production outside of the United States remains below last year’s levels because of ongoing OPEC+ crude oil production cuts and high global demand for propane as a petrochemical feedstock. Both of these factors have kept international propane prices at a premium relative to U.S. wholesale prices. However, we expect global propane supplies will increase somewhat this winter as OPEC+ continues to increase production, which could lessen demand for U.S. exports. Propane inventory levels in Western Canada, which are currently below the previous five-year average, may limit the quantity of propane available for import into the Midwest. In addition, producers in Canada now have two marine terminals that provide direct access to overseas propane markets, reducing exports to the United States by rail.
We forecast that propane inventories will remain at their lowest levels in more than five years, but inventory deficits to the five-year average will likely not widen significantly further during the heating season. However, in a scenario that is 10% colder than forecast, propane inventories would fall to 16 million barrels at the end of March, which would be the lowest on record in data going back to 1973. We expect this situation to put significant upward pressure on wholesale propane prices that would quickly be passed along to retail prices and affect consumer expenditures. Even in cases where temperatures are 10% warmer, we expect higher expenditures for propane this winter because of higher retail prices.
In the 10% colder scenario, we forecast that U.S. household expenditures for propane will be 85% higher than last winter in the Northeast, reflecting 59% higher propane prices and 16% more consumption. Forecast expenditures in the colder scenario are 113% higher than last winter in the Midwest, reflecting 85% higher propane prices and 15% more consumption. Forecast expenditures in the colder scenario are 78% higher than last winter in the South, reflecting 59% higher propane prices and 12% more consumption.
In the 10% warmer scenario, our forecast expenditures are 23% higher than last winter in the Northeast, reflecting 25% higher propane prices and 2% less consumption. Forecast expenditures are 41% higher than last winter in the Midwest in the warmer scenario, reflecting 39% higher propane prices and 3% less consumption. Forecast expenditures are 20% higher than last winter in the South, reflecting 25% higher propane prices and 4% less consumption.
Wood. We estimate that almost 1.7 million U.S. households, or 1.3% of the total, will use cord wood or wood pellets as their primary fuel for residential space heating during this winter. However, we estimate another 8% of households use wood as a secondary source of heat, making wood second to electricity as a supplemental heating fuel for U.S. households.
As of 2015, one in four rural U.S. households used wood for primary or secondary space heating, compared with 6% of urban households, according to our Residential Energy Consumption Survey (RECS). Wood use was most common in New England, where 21% of households used wood as either a primary or secondary source of heat.

U.S. Energy Information Administration | Winter Fuels Outlook October 2021 12
\ This report was prepared by the U.S. Energy Information Administration (EIA), the statistical and analytical agency within the U.S. Department of Energy. By law, EIA's data, analyses, and forecasts are independent of approval by any other officer or employee of the U.S. Government. The views in this report therefore should not be construed as representing those of the U.S. Department of Energy or other federal agencies.

U.S. Energy Information Administration | Short-Term Energy Outlook - October 2021
14-15 15-16 16-17 17-18 18-19 19-20 20-21 21-22 % Change
Natural Gas Northeast Consumption (Mcf**) 72.2 57.4 61.5 65.3 66.8 61.1 62.1 64.2 3.4 Price ($/mcf) 10.80 10.18 10.70 11.37 11.67 11.72 11.77 13.46 14.4 Expenditures ($) 780 584 659 742 779 716 731 865 18.2 Midwest Consumption (Mcf) 79.1 63.6 64.8 73.9 76.9 69.7 70.6 72.5 2.7 Price ($/mcf) 8.54 7.55 8.28 7.83 7.82 7.44 7.80 11.28 44.7 Expenditures ($) 676 480 536 578 601 519 551 818 48.6 South Consumption (Mcf) 50.9 40.3 38.0 45.6 46.0 41.5 44.9 44.8 -0.2 Price ($/mcf) 10.75 10.72 12.04 11.23 10.61 11.03 11.40 13.90 21.9 Expenditures ($) 548 432 457 512 488 458 512 623 21.6 West Consumption (Mcf) 40.1 44.7 45.7 43.9 48.9 47.5 46.5 47.8 2.7 Price ($/mcf) 10.71 9.92 10.68 10.25 10.14 10.44 11.38 13.69 20.3 Expenditures ($) 430 444 488 450 496 496 530 654 23.5 U.S. Average Consumption (Mcf) 60.7 51.8 53.0 57.6 60.3 55.5 56.3 57.7 2.4 Price ($/mcf) 9.89 9.28 10.06 9.82 9.72 9.72 10.17 12.92 27.1 Expenditures ($) 601 481 533 565 586 540 573 746 30.2
Heating Oil U.S. Average Consumption (gallons) 548.2 436.6 468.3 495.6 512.0 467.9 474.8 511.1 7.7 Price ($/gallon) 3.04 2.06 2.41 2.78 3.07 2.89 2.55 3.39 33.1 Expenditures ($) 1,668 900 1,128 1,376 1,570 1,353 1,210 1,734 43.3
Electricity Northeast Consumption (kWh***) 8,927 7,705 8,050 8,345 8,481 8,014 8,172 8,346 2.1 Price ($/kwh) 0.168 0.164 0.165 0.169 0.169 0.171 0.172 0.184 7.3 Expenditures ($) 1,501 1,263 1,324 1,407 1,435 1,374 1,404 1,538 9.6 Midwest Consumption (kWh) 10,816 9,366 9,480 10,383 10,711 10,006 10,157 10,336 1.8 Price ($/kwh) 0.118 0.122 0.124 0.124 0.123 0.124 0.126 0.130 3.0 Expenditures ($) 1,274 1,138 1,173 1,289 1,320 1,245 1,284 1,346 4.9 South Consumption (kWh) 10,306 8,786 8,516 9,550 9,544 8,901 9,460 9,498 0.4 Price ($/kwh) 0.111 0.110 0.111 0.112 0.113 0.115 0.116 0.123 6.4 Expenditures ($) 1,142 968 949 1,065 1,074 1,021 1,098 1,173 6.8 West Consumption (kWh) 7,836 8,448 8,568 8,339 8,998 8,824 8,772 8,939 1.9 Price ($/kwh) 0.127 0.130 0.132 0.136 0.136 0.138 0.147 0.149 0.9 Expenditures ($) 993 1,096 1,129 1,131 1,224 1,218 1,294 1,330 2.8
U.S. Average Consumption (kWh) 9,421 8,459 8,428 9,054 9,261 8,767 9,079 9,193 1.3 Price ($/kwh) 0.123 0.124 0.125 0.126 0.127 0.129 0.131 0.138 5.0 Expenditures ($) 1,159 1,045 1,056 1,143 1,174 1,128 1,192 1,268 6.3
Table WF01. Average Consumer Prices and Expenditures for Heating Fuels During the Winter
Fuel / RegionForecastWinter of

U.S. Energy Information Administration | Short-Term Energy Outlook - October 2021
14-15 15-16 16-17 17-18 18-19 19-20 20-21 21-22 % Change
Table WF01. Average Consumer Prices and Expenditures for Heating Fuels During the Winter
Fuel / RegionForecastWinter of
Propane Northeast Consumption (gallons) 629.7 505.7 542.6 569.2 585.7 538.4 545.0 563.7 3.4 Price* ($/gallon) 3.00 2.71 3.03 3.24 3.19 2.50 2.51 3.57 42.2 Expenditures ($) 1,889 1,370 1,644 1,844 1,869 1,346 1,368 2,012 47.1 Midwest Consumption (gallons) 756.0 618.3 629.0 715.2 747.0 679.5 685.4 702.2 2.5 Price* ($/gallon) 1.91 1.47 1.58 1.82 1.72 1.53 1.56 2.57 64.7 Expenditures ($) 1,444 909 994 1,302 1,285 1,040 1,069 1,805 68.8 South Consumption (gallons) 560.7 449.0 428.1 504.6 504.5 459.2 493.8 496.2 0.5 Price* ($/gallon) 2.98 2.27 2.45 2.59 2.63 2.31 2.33 3.31 42.3 Expenditures ($) 1,671 1,020 1,047 1,308 1,326 1,063 1,148 1,643 43.0
Number of households by primary space heating fuel (thousands) Northeast Natural gas 11,705 11,802 11,918 12,063 12,183 12,349 12,516 12,670 1.2 Heating oil 5,097 4,923 4,774 4,724 4,610 4,448 4,304 4,144 -3.7 Propane 856 884 933 977 1,019 1,039 1,042 1,077 3.3 Electricity 3,093 3,253 3,326 3,387 3,482 3,585 3,713 3,818 2.8 Wood 569 511 471 469 462 351 218 162 -26.0 Other/None 437 433 433 441 447 469 508 533 4.9
Midwest Natural gas 18,206 18,241 18,236 18,319 18,372 18,211 18,045 18,063 0.1 Heating oil 319 301 286 278 273 262 247 234 -5.2 Propane 2,085 2,077 2,057 2,115 2,184 2,218 2,248 2,274 1.2 Electricity 5,514 5,747 5,871 5,978 6,027 6,221 6,507 6,681 2.7 Wood 617 587 552 527 507 471 426 378 -11.4 Other/None 351 354 359 361 349 362 395 405 2.7
South Natural gas 13,919 13,948 13,913 13,970 14,037 14,160 14,321 14,380 0.4 Heating oil 681 653 619 609 583 553 534 508 -4.9 Propane 1,925 1,899 1,858 1,852 1,862 1,893 1,908 1,891 -0.9 Electricity 28,843 29,509 29,873 30,326 30,708 30,965 31,360 31,910 1.8 Wood 593 552 509 484 475 464 452 446 -1.3 Other/None 407 413 426 434 454 483 506 540 6.7
West Natural gas 15,227 15,312 15,427 15,570 15,650 15,646 15,613 15,637 0.2 Heating oil 225 219 214 214 217 204 187 180 -3.6 Propane 915 923 935 963 987 967 943 941 -0.1 Electricity 8,927 9,228 9,351 9,490 9,646 9,847 10,104 10,309 2.0 Wood 749 719 700 689 677 666 666 664 -0.2 Other/None 1,075 1,087 1,058 1,089 1,091 1,121 1,223 1,282 4.9
U.S. Totals Natural gas 59,057 59,303 59,494 59,922 60,241 60,366 60,495 60,751 0.4 Heating oil 6,322 6,095 5,893 5,825 5,683 5,466 5,272 5,066 -3.9 Propane 5,781 5,783 5,784 5,906 6,053 6,117 6,140 6,183 0.7 Electricity 46,377 47,737 48,420 49,180 49,863 50,617 51,685 52,718 2.0 Wood 2,528 2,369 2,232 2,170 2,121 1,953 1,763 1,650 -6.4 Other/None 2,271 2,287 2,277 2,326 2,340 2,436 2,632 2,761 4.9
Heating degree days Northeast 5,647 4,320 4,699 5,014 5,165 4,656 4,738 4,928 4.0 Midwest 6,003 4,689 4,792 5,577 5,846 5,228 5,297 5,457 3.0 South 2,692 2,015 1,884 2,353 2,361 2,074 2,284 2,293 0.4 West 2,570 2,958 3,043 2,890 3,300 3,190 3,106 3,214 3.5 U.S. Average 3,890 3,209 3,264 3,622 3,801 3,444 3,529 3,620 2.6
* Prices exclude taxes ** thousand cubic feet*** kilowatthour
Note: Winter covers the period October 1 through March 31. Fuel prices are nominal prices. Fuel consumption per household is based only on households that use that fuel as the primary space-heating fuel. Included in fuel consumption is consumption for water heating, appliances, electronics, and lighting (electricity). Per-household consumption based on EIA's 2015 Residential Energy Consumption Surveys corrected for actual and projected heating degree days. Number of households using heating oil includes kerosene.

www.eia.govU.S. Energy Information Administration Independent Statistics & Analysis
Winter Fuels Outlook 2021-2022

Findings• Winter energy expenditures are likely to be higher than previous winter
across all fuels and all regions, which mostly reflects higher retail prices
• U.S. retail energy prices are starting the winter at multi-year highs
• Winter temperatures are currently forecast to be slightly colder than previous winter
• Propane and natural gas inventories—which are already lower than normal—could fall to record lows, especially in a colder weather scenario
• High fuel prices in global markets provide incentive to continue exporting propane and natural gas
U.S. Energy Information AdministrationWinter Fuels Outlook – October 2021 2

U.S. Energy Information AdministrationWinter Fuels Outlook – October 2021
We expect energy expenditures to increase for all heating fuels, primarily driven by higher prices
Note: Propane price reflects the average of Northeast and Midwest regions through winter 2013–14 and average of Northeast, Midwest, and South regions after winter 2013–14.
3
$0
$500
$1,000
$1,500
$2,000
$2,500
winter2011–2012
2013–2014
2015–2016
2017–2018
2019–2020
winter2021–2022
Average winter household energy expenditures (winter = Oct–Mar, 2011–2022)dollars STEO
forecast Expenditures forall energy uses in households primarily heating with: propane (+54%)heating oil (+43%)electricity (+6%)
natural gas (+30%)
Source: U.S. Energy Information Administration

Because of higher prices in the forecast, even in a warmer than forecast scenario, expenditures are up from last winter
U.S. Energy Information AdministrationWinter Fuels Outlook – October 2021 4
U.S. average household expenditures
Base Case(Oct–Mar total)
U.S. average household expenditures
10% Colder(Oct–Mar total)
U.S. average household expenditures
10% Warmer(Oct–Mar total)
winter 2021–22
Change fromlast winter
winter 2021–22
Change fromlast winter
winter 2021–22
Change fromlast winter
Natural Gas $746 +30% $859 +50% $700 +22%
Heating Oil $1734 +43% $1925 +59% $1573 +30%
Electricity $1268 +6% $1370 +15% $1237 +4%
Propane $1789 +54% $2246 +94% $1497 +29%
Source: U.S. Energy Information Administration

Key notes and definitions• EIA defines the winter season as October through March, and we provide forecast
expenditures for households grouped by their primary space heating fuel
• Fuel expenditures for individual households depend on the size and energy efficiency of individual homes and their heating equipment, along with thermostat settings and weather conditions.
• Each fuel also has its own market structure, physical infrastructure, regulations, and limitations that can affect the connection between wholesale and retail market events.
• This analysis uses the Residential Energy Consumption Survey (RECS) as a baseline for the average amount of energy that homes use for space heating and other appliances.
• The reported expenditures in the report are for the total bill for a given primary heating fuel, not just for heating use.
U.S. Energy Information AdministrationWinter Fuels Outlook – October 2021 5

U.S. Energy Information AdministrationWinter Fuels Outlook – October 2021
For most fuels, residential consumption is concentrated in winter
Note: Reflects consumption in all households, not just those using the fuel for primary space heating.
6
05
10152025303540
Jul Oct Jan Apr
Natural gasbillion cubic feet per day
The winter months of October through March account for 79% of annual residential natural gas consumption…
0
50
100
150
200
250
300
350
Jul Oct Jan Apr
Electricitybillion kilowatthours
…48% of annual residential electricity consumption…
range and average of previous ten years
(2011–2021)
0100200300400500600700800900
1,000
Jul Oct Jan Apr
Propanethousand barrels per day
…74% of annual residential propane consumption…
0
100
200
300
400
500
600
700
Jul Oct Jan Apr
Distillate fuel oilthousand barrels per day
…and 65% of annual residential distillate fuel oil consumption.
Source: U.S. Energy Information Administration, Monthly Energy Review

U.S. Energy Information AdministrationWinter Fuels Outlook – October 2021
Actual heating degree days tend to be within 10% of the forecast
Source: U.S. Energy Information Administration based on data from NOAA
7
2,500
3,000
3,500
4,000
4,500
11–12 12–13 13–14 14–15 15–16 16–17 17–18 18–19 19–20 20–21 21–22
forecast +10%(colder than expected)
NOAA forecast
forecast -10%(milder than expected)actual heating
degree days
U.S. population-weighted winter heating degree days (winter = Oct–Mar, 2011–2022)heating degree days
colder weather
milder weather

naturalgas
U.S. Energy Information AdministrationWinter Fuels Outlook – October 2021
Almost 90% of U.S. homes are primarily heated by natural gas or electricity; heating oil and propane are regionally concentrated
Source: U.S. Energy Information Administration based on data from the U.S. Census Bureau, American Community Survey 2019
8
Most prevalent home heating fuel by state (2019)
Presenter name, Presentation location, Presentation date
DC
natural gas (48%) electricity (39%)heating oil (4%)propane (5%)other / none (3%)
Primary home heating fuel by state (2019)
0% 10% 25% 50%
natural gaselectricity
heating oil propane
propaneheatingoil
electricity
share of U.S. households
from 2019 ACS

U.S. Energy Information AdministrationWinter Fuels Outlook – October 2021
Prices across all fuels and all regions in the forecast are higher compared with recent winters
Source: U.S. Energy Information Administration
9
$0
$2
$4
$6
$8
$10
$12
$14
$16
14–1
515
–16
16–1
717
–18
18–1
919
–20
20–2
121
–22
Natural gasdollars per thousand cubic feet
U.S. average
Census regions$0.00
$0.50
$1.00
$1.50
$2.00
$2.50
$3.00
$3.50
$4.00
14–1
515
–16
16–1
717
–18
18–1
919
–20
20–2
121
–22
Heating oildollars per gallon
U.S.average
02468
101214161820
14–1
515
–16
16–1
717
–18
18–1
919
–20
20–2
121
–22
Electricitycents per kilowatthour
$0.00
$0.50
$1.00
$1.50
$2.00
$2.50
$3.00
$3.50
$4.00
14–1
515
–16
16–1
717
–18
18–1
919
–20
20–2
121
–22
Propanedollars per gallon
West
South
MidwestNortheast

Natural gas summary
U.S. Energy Information AdministrationWinter Fuels Outlook – October 2021 10
Householdsprimarily heating with
natural gas
Average household
Consumption(million cubic feet)
Average household Retail price
($ / million cubic feet)
Average householdExpenditures
(Oct–Mar total)
millionsfuel share of region
winter 2021–22 change
winter 2021–22 Change
winter 2021–22 Change
Northeast 12.7 57% 64 +3% $13.46 +14% $865 +18%
Midwest 18.1 64% 73 +3% $11.28 +45% $818 +48%
South 14.4 29% 45 0% $13.90 +22% $623 +22%
West 15.6 54% 48 +3% $13.69 +20% $654 +24%
U.S. total 60.8 47% 58 +2% $12.92 +27% $746 +30%
Source: U.S. Energy Information Administration

U.S. Energy Information AdministrationWinter Fuels Outlook – October 2021
Natural gas inventories are likely to be lower than the five-year average
11
0.00.51.01.52.02.53.03.54.04.5
2019 2020 2021 2022
End-of-month U.S. working natural gas in storage (Jan 2019–Dec 2022)trillion cubic feet
previous five-year range and average
(2016–2020)
10% warmer scenarioSTEO forecast10% colder scenario
STEOforecast
Source: U.S. Energy Information Administration

U.S. Energy Information AdministrationWinter Fuels Outlook – October 2021
Weather could reduce or increase natural gas storage deficit to the five-year average
12
-1,000
-800
-600
-400
-200
0
200
400
2019 2020 2021 2022
End-of-month U.S. working natural gas in storage (Jan 2019–Dec 2022)Difference from previous five-year average (2016–2020)billion cubic feet
10% warmer scenarioSTEO forecast
10% colder scenario
STEOforecast
more natural gas in storage than 2016–
2020 average
less natural gas in storage than 2016–2020 average
Source: U.S. Energy Information Administration
U.S. Energy Information AdministrationWinter Fuels Outlook – October 2021
High natural gas prices in Europe and Asia are supporting U.S. LNG exports
Source: U.S. Energy Information Administration based on data from Bloomberg L.P. and Refinitv, an LSEG business
13
0
5
10
15
20
25
30
35
Japan/Korea (Asia)
TTF (Europe)
Henry Hub (U.S.)
International natural gas spot pricesdollars per million British thermal units

U.S. Energy Information AdministrationWinter Fuels Outlook – October 2021
Futures and options markets data implies the 95% confidence interval for Henry Hub prices in early 2022 ranges from $2-$21
Sources: U.S. Energy Information Administration based on data from the CME Group and Refinitiv, an LSEG Business
14
$0$2$4$6$8
$10$12$14$16$18$20$22
2016 2017 2018 2019 2020 2021 2022
Henry Hub natural gas price and NYMEX confidence intervalsdollars per million British thermal units
upper bound95% NYMEX futures price confidence interval
lower bound95% NYMEX futures price confidence interval
NYMEX futures priceSTEO forecast
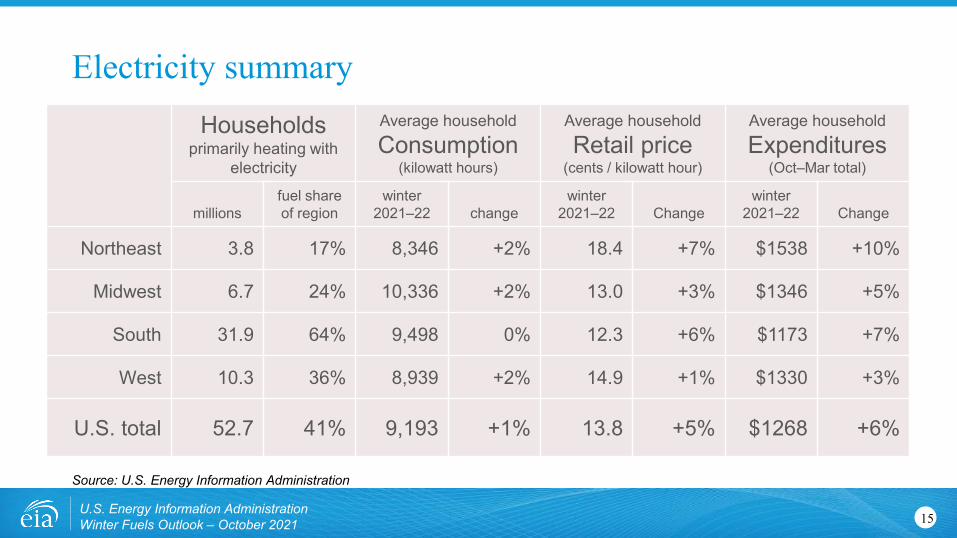
Electricity summary
U.S. Energy Information AdministrationWinter Fuels Outlook – October 2021 15
Households primarily heating with
electricity
Average household Consumption
(kilowatt hours)
Average household Retail price
(cents / kilowatt hour)
Average household Expenditures
(Oct–Mar total)
millionsfuel share of region
winter 2021–22 change
winter 2021–22 Change
winter 2021–22 Change
Northeast 3.8 17% 8,346 +2% 18.4 +7% $1538 +10%
Midwest 6.7 24% 10,336 +2% 13.0 +3% $1346 +5%
South 31.9 64% 9,498 0% 12.3 +6% $1173 +7%
West 10.3 36% 8,939 +2% 14.9 +1% $1330 +3%
U.S. total 52.7 41% 9,193 +1% 13.8 +5% $1268 +6%
Source: U.S. Energy Information Administration

Propane summary
U.S. Energy Information AdministrationWinter Fuels Outlook – October 2021 16
Households primarily heating with
propane
Average household Consumption
(gallons)
Average household Retail price
($ / gallon)
Average household Expenditures
(Oct–Mar total)
millionsfuel share of region
winter 2021–22 change
winter 2021–22 Change
winter 2021–22 Change
Northeast 1.1 5% 564 +3% $3.57 +42% $2012 +47%
Midwest 2.3 8% 702 +2% $2.57 +65% $1805 +69%
South 1.9 4% 496 0% $3.31 +42% $1643 +43%
Source: U.S. Energy Information Administration

U.S. Energy Information AdministrationWinter Fuels Outlook – October 2021
Propane inventories, already low, could fall to record low in colder scenario
17
0
20
40
60
80
100
120
2019 2020 2021 2022
End-of-month U.S. propane and propylene inventories (Jan 2019–Dec 2022)million barrels
previous five-year range
(2016–2020) 10% warmer scenarioSTEO forecast10% colder scenario
STEOforecast
record low 21.8 million barrelsset March 1993
Source: U.S. Energy Information Administration
U.S. Energy Information AdministrationWinter Fuels Outlook – October 2021
Propane inventories are particularly low in the Gulf Coast and Midwest
18
0102030405060708090
Jan Feb Mar Apr May Jun Jul Aug Sep Oct Nov Dec
Weekly propane inventories by region (Jan 1–Oct 1, 2021)million barrels previous five-year
average for each region(2016–2020)
U.S. total20% lower than average as of Oct 1
Gulf Coast34% lowerMidwest9% lowerNortheast 21% higher
Gulf Coast
Midwest Northeast
EIA PADDistricts
Source: U.S. Energy Information Administration

U.S. Energy Information AdministrationWinter Fuels Outlook – October 2021
International propane prices are encouraging propane exports from the United States
Source: U.S. Energy Information Administration based on data from Bloomberg L.P.
19
$0.00$0.20$0.40$0.60$0.80$1.00$1.20$1.40$1.60$1.80
2015 2016 2017 2018 2019 2020 2021
Propane spot prices at selected hubs (Jan 2015–Oct 2021)dollars per gallon
East AsiaNorthwest EuropeMont Belvieu, Texas

U.S. Energy Information AdministrationWinter Fuels Outlook – October 2021
U.S. exports of propane remain relatively high through winter in our forecast
20
-0.4
0.0
0.4
0.8
1.2
1.6
2014 2015 2016 2017 2018 2019 2020 2021 2022
Monthly U.S. propane and propylene trade (Jan 2014–Mar 2022)million barrels per day
net trade
gross exports
gross imports
STEOforecast(net trade only)
Source: U.S. Energy Information Administration

Heating oil summary
U.S. Energy Information AdministrationWinter Fuels Outlook – October 2021 21
Households primarily heating with
heating oil
Average householdConsumption
(gallons)
Average household Retail price
($ / gallon)
Average household Expenditures
(Oct–Mar total)
millionsfuel share of region
winter 2021–22 change
winter 2021–22 Change
winter 2021–22 change
U.S. total 5.1 4% 511 +8% $3.39 +33% $1734 +43%
Source: U.S. Energy Information Administration

U.S. Energy Information AdministrationWinter Fuels Outlook – October 2021
Forecast heating oil prices are higher than last winter because of higher crude oil prices and wholesale margins
22
$0.00$0.50$1.00$1.50$2.00$2.50$3.00$3.50$4.00
Q1 Q2 Q3 Q4 Q1 Q2 Q3 Q4 Q1
2020 2021 2022
STEOforecast
Estimated components of U.S. heating oil retail price (Jan 2020–Mar 2022)dollars per gallon
retail margin and taxes
wholesale margin
Brent crude oil
Source: U.S. Energy Information Administration based on data from Refinitiv, an LSEG Business
U.S. Energy Information AdministrationWinter Fuels Outlook – October 2021
Distillate inventories are currently low, but weather scenarios have relatively little implication for distillate inventories
23
020406080
100120140160180200
2019 2020 2021 2022
End-of-month U.S. distillate fuel inventories (Jan 2019–Dec 2022)million barrels
previous five-year range (2016–2020)
10% warmer scenarioSTEO forecast10% colder scenario
STEOforecast
Source: U.S. Energy Information Administration

U.S. Energy Information AdministrationWinter Fuels Outlook – October 2021
Changes in wholesale heating oil and propane prices quickly appear in retail prices
Sources: EIA State Heating Oil and Propane Program (SHOPP) for retail prices, Oil Price Information Service for wholesale prices
24
16–17 17–18 18–19 19–20 20–21$0.00
$0.50
$1.00
$1.50
$2.00
$2.50
$3.00
$3.50
Weekly wholesale and retail heating oil pricesdollars per gallon
winters (Oct–Mar)
retail
wholesale
16–17 17–18 18–19 19–20 20–21$0.00
$0.50
$1.00
$1.50
$2.00
$2.50
$3.00
$3.50
Weekly wholesale and retail propane pricesdollars per gallon
winters (Oct–Mar)
retail
wholesale

SHOPP / other winter heating fuels resources at EIA
U.S. Energy Information AdministrationWinter Fuels Outlook – October 2021 25
• www.eia.gov/special/heatingfuels• Availability and pricing for the four principals heating fuels
• Propane
• Heating oil
• Natural gas
• Electricity
• Data for each state are available on the clickable map
• Links to resources for each state
• Current week and three-month weather forecasts from NOAA
• Downloadable graphs as an image or as a spreadsheet
• New England Dashboard - https://www.eia.gov/dashboard/newengland/electricity
For more information on EIA products go to:
U.S. Energy Information AdministrationWinter Fuels Outlook – October 2021 26
U.S. Energy Information Administration home page | www.eia.gov
Annual Energy Outlook | www.eia.gov/forecasts/aeo
Short-Term Energy Outlook | www.eia.gov/forecasts/steo
Consumption and Efficiency Data | www.eia.gov/consumption
Today in Energy | www.eia.gov/todayinenergy
Monthly Energy Review | www.eia.gov/totalenergy/data/monthly
State Energy Portal | www.eia.gov/state