annual energy outlook 2013wnew. · oil and gas supply module (ogsm) 5 office of petroleum, gas, and...
TRANSCRIPT
www.eia.gov U.S. Energy Information Administration Independent Statistics & Analysis
AEO2013 Oil and Gas Supply Working Group Meeting Office of Petroleum, Gas, and Biofuels Analysis July 31, 2012 | Washington, DC WORKING GROUP PRESENTATION FOR DISCUSSION PURPOSES DO NOT QUOTE OR CITE AS RESULTS ARE SUBJECT TO CHANGE
Assumptions and Expectations for Annual Energy Outlook 2013: Oil and Gas Working Group

Overview
2 Office of Petroleum, Gas, and Biofuels Analysis Working Group Presentation for Discussion Purposes Washington, DC, July 31, 2012 DO NOT QUOTE OR CITE as results are subject to change
• Introduction/background
• Oil and natural gas supply assumptions – Offshore
– CO2 EOR
– Lower 48 continuous plays
• Side cases/Issues in focus

Introduction/Background
3 Office of Petroleum, Gas, and Biofuels Analysis Working Group Presentation for Discussion Purposes Washington, DC, July 31, 2012 DO NOT QUOTE OR CITE as results are subject to change
• Working group (history, purpose)
• National Energy Modeling System (NEMS) – Annual Energy Outlook
– Requested service reports
– Assumptions/Documentation
– Model code and data input files
• Natural gas, petroleum, and biofuels modules – Oil and Gas Supply Module (OGSM)
– Natural Gas Transmission and Distribution Module (NGTDM)
– Liquid Fuels Market Module (LFMM)
• Formerly Petroleum Market Module (PMM)
• Discussed in earlier working group
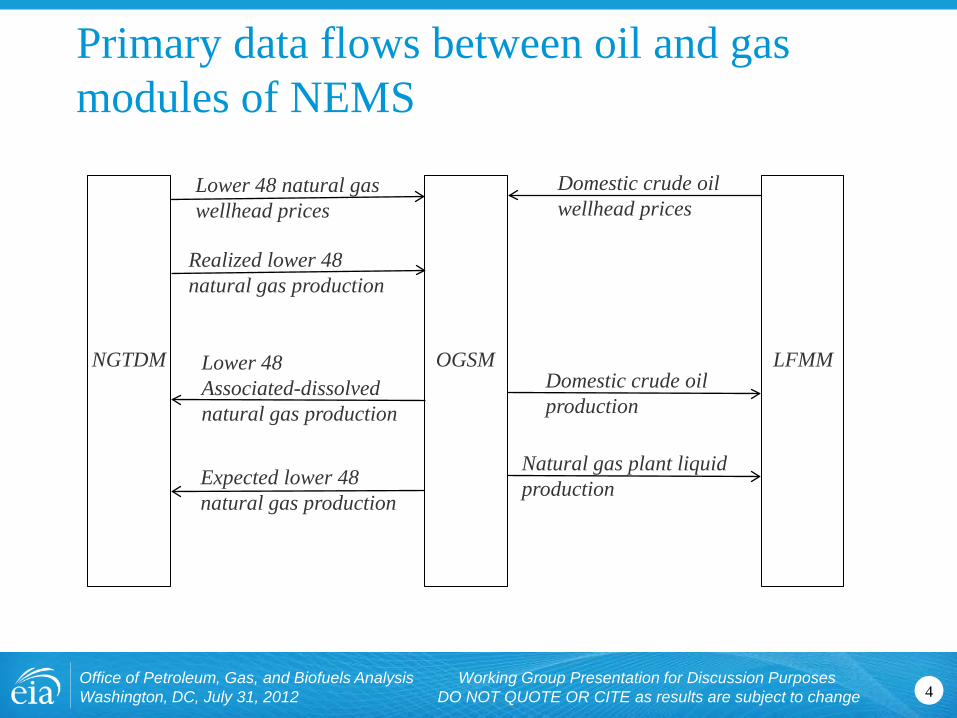
Primary data flows between oil and gas modules of NEMS
4 Office of Petroleum, Gas, and Biofuels Analysis Working Group Presentation for Discussion Purposes Washington, DC, July 31, 2012 DO NOT QUOTE OR CITE as results are subject to change
OGSM NGTDM LFMM
Lower 48 natural gas wellhead prices
Domestic crude oil wellhead prices
Domestic crude oil production
Natural gas plant liquid production
Realized lower 48 natural gas production
Lower 48 Associated-dissolved natural gas production
Expected lower 48 natural gas production
Assumptions Oil and Gas Supply Module (OGSM)
5 Office of Petroleum, Gas, and Biofuels Analysis Working Group Presentation for Discussion Purposes Washington, DC, July 31, 2012 DO NOT QUOTE OR CITE as results are subject to change

Lower 48 Offshore
Office of Petroleum, Gas, and Biofuels Analysis Working Group Presentation for Discussion Purposes Washington, DC, July 31, 2012 DO NOT QUOTE OR CITE as results are subject to change 6

Lower 48 offshore leasing availability
7 Office of Petroleum, Gas, and Biofuels Analysis Working Group Presentation for Discussion Purposes Washington, DC, July 31, 2012 DO NOT QUOTE OR CITE as results are subject to change
AEO2012 AEO2013
North Atlantic none None
Mid Atlantic 2018 2018
South Atlantic 2018 2018
Northern & Central California none none
Southern California 2023 2023
Eastern GOM 2022 2022

Lower 48 offshore deepwater projects
8 Office of Petroleum, Gas, and Biofuels Analysis Working Group Presentation for Discussion Purposes Washington, DC, July 31, 2012 DO NOT QUOTE OR CITE as results are subject to change
•Currently producing
BOEM Field Name Nickname
Water Depth
Field Size
(MMBoe) Discovery
Year
Start Year of
Production
BOEM Field Name Nickname
Water Depth
Field Size
(MMBoe) Discovery
Year
Start Year of
Production AC815 Silvertip 9226 89 2004 2011* KC875 Lucius 7168 182 2009 2014 AC815 Tobago 9627 89 2004 2011* MC725 Tubular Bells 4334 89 2003 2014 MC460 Appaloosa 2805 372 2008 2011* WR678 St. Malo 7036 372 2003 2014 MC800 Gladden 3116 89 2008 2011* WR759 Jack 6963 372 2004 2014 GC448 Condor 3266 89 2008 2011* KC964 Hadrian South 7586 182 2009 2014 MC754 Anduin West 2696 45 2008 2011* DC048 Dalmatian 5876 89 2008 2015 GB515 Ozona 3000 89 2008 2011* DC004 Axe 5822 89 2010 2015 MC876 Callisto 7788 45 2001 2011* GB605 Winter 3400 45 2009 2015 EW998 EW998 1000 2009 2011* GC432 Samurai 3400 89 2009 2015 GC238 Little Burn 2600 2005 2011* GC468 Pony 3497 372 2006 2015 MC503 Who Dat 3100 2007 2011* MC771 Kodiak 4986 182 2008 2015 WR250 Cascade 8143 372 2002 2012* GB427 Cardamom Deep 2720 182 2010 2015 GC683 Caesar 4457 45 2006 2012* MC762 Deimos South 3122 2010 2015 GC726 West Tonga 4674 372 2007 2012* MC792 West Boreas 3112 2004 2015 MC241 MC241 2427 45 1987 2012* GC955 Mission Deep 7300 182 1999 2016 MC292 Raton South 3400 12 2008 2012* KC102 Tiber 4132 691 2009 2016 LL400 Cheyenne East 9200 12 2011 2012* KC292 Kaskida 5860 691 2006 2016 MC199 Mandy 2478 182 2010 2012* MC984 Vito 4038 182 2009 2016 MC562 Isabela 6535 45 2007 2012* WR508 Stones 9556 89 2005 2016 MC563 Santa Cruz 6515 2009 2012* MC948 Gunflint/Freedom 6095 691 2008 2016 MC519 Santiago 6500 2011 2012* GC859 Heidelberg 5000 182 2009 2016 GB293 Pyrenees 2100 89 2009 2012* WR052 Shenandoah 5750 182 2009 2017 WR469 Chinook 8831 372 2003 2012 KC872 Buckskin 6920 182 2009 2018 GB463 Bushwood 2700 89 2009 2012 LL370 Diamond 9975 45 2008 2018 GC299 Clipper 3452 45 2005 2012 WR627 Julia 7087 89 2007 2018 GC490 Wide Berth 3700 89 2009 2012 KC736 Moccasin 6759 2011 2018 MC751 Goose 1624 45 2003 2012 DC353 Vicksburg 7457 372 2007 2019 GB506 Danny II 2800 2012 2012 MC392 Appomattox 7217 691 2009 2019 GC512 Knotty Head 3557 372 2005 2013 WR848 Hal 7657 45 2008 2019 GB782 Entrada 4690 372 2000 2014 DC004 Dalmatian N 5831 89 2010 2020 WR029 Big Foot 5235 182 2005 2014 KC919 Hadrian North 7000 372 2010 2020
9 Office of Petroleum, Gas, and Biofuels Analysis Working Group Presentation for Discussion Purposes Washington, DC, July 31, 2012 DO NOT QUOTE OR CITE as results are subject to change
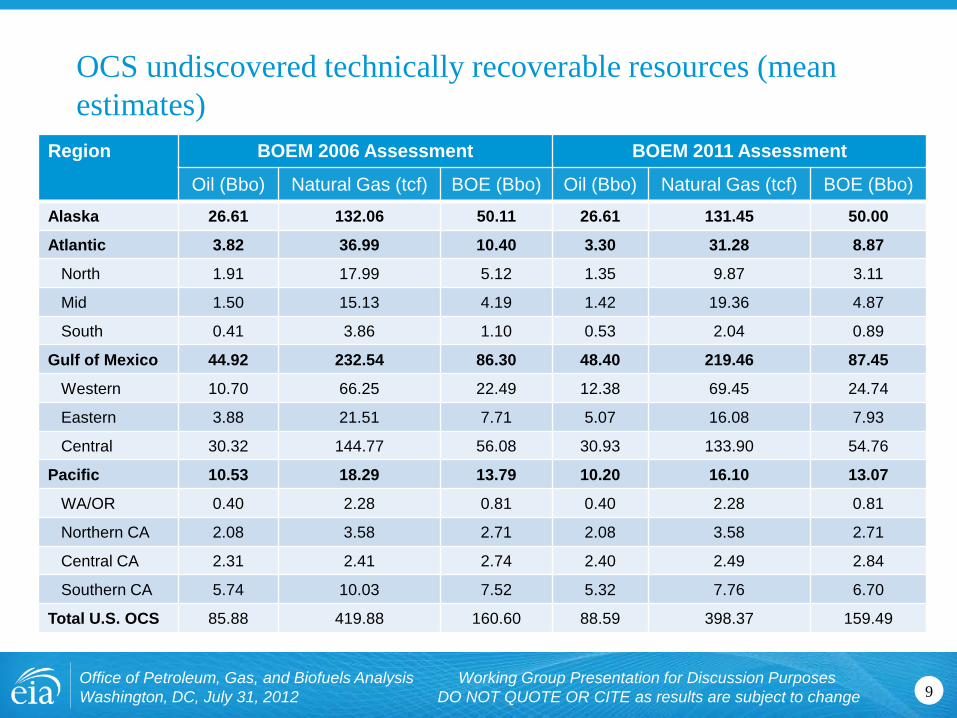
OCS undiscovered technically recoverable resources (mean estimates)
Region BOEM 2006 Assessment BOEM 2011 Assessment
Oil (Bbo) Natural Gas (tcf) BOE (Bbo) Oil (Bbo) Natural Gas (tcf) BOE (Bbo) Alaska 26.61 132.06 50.11 26.61 131.45 50.00
Atlantic 3.82 36.99 10.40 3.30 31.28 8.87
North 1.91 17.99 5.12 1.35 9.87 3.11
Mid 1.50 15.13 4.19 1.42 19.36 4.87
South 0.41 3.86 1.10 0.53 2.04 0.89
Gulf of Mexico 44.92 232.54 86.30 48.40 219.46 87.45
Western 10.70 66.25 22.49 12.38 69.45 24.74
Eastern 3.88 21.51 7.71 5.07 16.08 7.93
Central 30.32 144.77 56.08 30.93 133.90 54.76
Pacific 10.53 18.29 13.79 10.20 16.10 13.07
WA/OR 0.40 2.28 0.81 0.40 2.28 0.81
Northern CA 2.08 3.58 2.71 2.08 3.58 2.71
Central CA 2.31 2.41 2.74 2.40 2.49 2.84
Southern CA 5.74 10.03 7.52 5.32 7.76 6.70
Total U.S. OCS 85.88 419.88 160.60 88.59 398.37 159.49
CO2 EOR
Office of Petroleum, Gas, and Biofuels Analysis Working Group Presentation for Discussion Purposes Washington, DC, July 31, 2012 DO NOT QUOTE OR CITE as results are subject to change 10

Recoverable EOR/ASR resources
11 Office of Petroleum, Gas, and Biofuels Analysis Working Group Presentation for Discussion Purposes Washington, DC, July 31, 2012 DO NOT QUOTE OR CITE as results are subject to change
(Vertical & Horizontal) (Vertical & Horizontal)
-
5
10
15
20
25
30
35
40
45
CO2 EOR Steam Flood Polymer Infill Profile Modification
billion barrels
Technical $50/Bbl $80/Bbl $125/Bbl
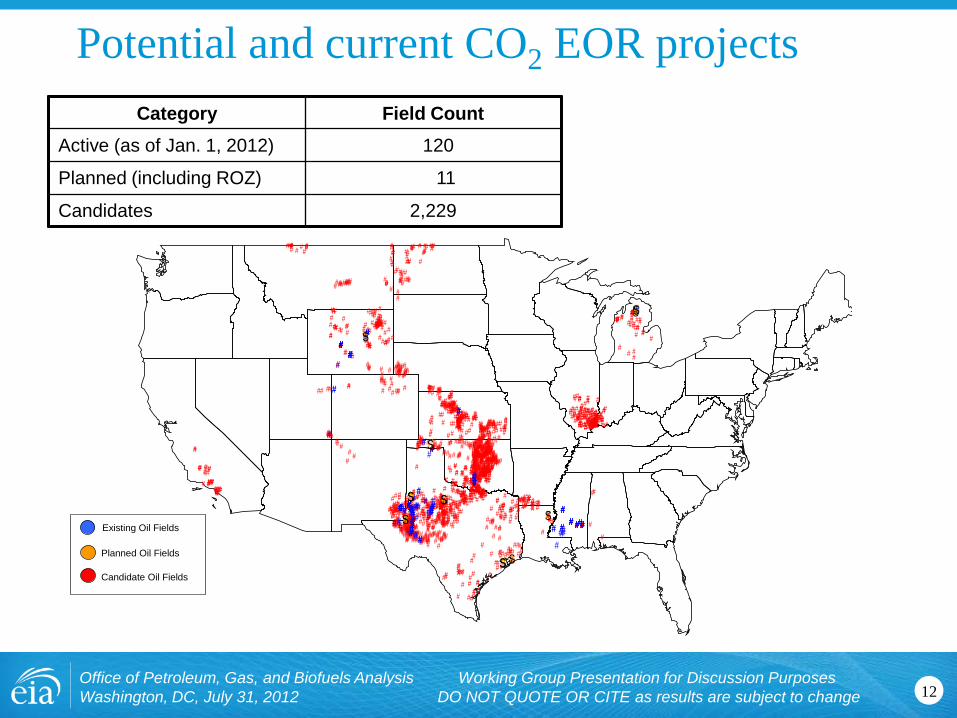
Potential and current CO2 EOR projects
12 Office of Petroleum, Gas, and Biofuels Analysis Working Group Presentation for Discussion Purposes Washington, DC, July 31, 2012 DO NOT QUOTE OR CITE as results are subject to change
Category Field Count Active (as of Jan. 1, 2012) 120
Planned (including ROZ) 11
Candidates 2,229
##
######## ##
###
#
### #
#
## ##
# ##
#
##
##
##
##
####
## #
#
##
##
##
# ##
#
#
#
#
#
##
#
#
#####
## #
##
####### ###
##
#
###
#
###
####
#
##
#
#####
#
##
##
##
# ######
#### ##
#
##
#####
#
#
## ##
# ##
##
#
#
##
##
#
#########
#
#
#
#
######
## ##
# #
#####
################ ##
##
# #####
##### ##
### #####
# ######### ##
#
#### ### ###
# # ##
###
#
#
# ############### #
#######
####
###### #######
#### ##
#
#####
# ## #### #
##
####
#####
#
# ###
#### # ## #
#
#
##
## #
###
### ## ## #
############# ###########
###
########## #####
# ##
##
####
####
################
##
###
# ########
# ##### ####
# #
######
####
#
#
### ##
# #
####
#
#
######
############
####
## ####
#################
####
####
###
######
##
###
##
## ##### ### #######
### ###
#
#
#
###
# ####
###
#
####
#
########
########### #### ## #### ##########
#####
###
####
#####
######
#
##
#####
###
####
###
######## ###
###
#
#
##
#
##
#
#####
#
#####
####
##
###
#
# ##
##
### ## ###
##
###
#
#
####
#
##########
#
####
# ###
##
#####
#
#
#
##
###
# #
#
#
#
######
##
#
####
####
##
#####
##
# ###
###
###
##
##
#
###
###
#
#
##
#
# ###
#
####
#
##
##
#
##
###
##
##
####
###
#####
## #
#
#####
###
##
#
####
#
###
#
#
#
#
### ## #
####
##
#
#
#
#
#
#
####
###
##
##
#
###
##
## #
#
### # ##
# ##
##
#####
## # #
##
#
#
#
#
## ## ## #
#
#
###
#
#
# ##
#
#
# ##
##
##
#
#
##
#
##
## ####
## ###
###
### ###### ###### ######### #
########
###########
################
# ##
####
#######
##
# #
###
##########
#
## ####
######
## ###
#
###
#########
#
###
#
##
###
#
###
#
###
##
####
#
#####
#
#
#####
# #####
#
#
#
# ####
#
#
###
###
##
###
##
##
###
##
####
###
##
# ##
###
##
#
#
#
#### ##### ######
#
#
###
###
#
##
#
#
#
###
#
#
#
##
#
# ##
#
##
## ##
##
#
##
##
# #
#
###
####
# ##
##
# #### ####
####### ## #
# ## ##########
## #
#
##
###
##
##
#
# ######
#####
##
##
##
## ##
##
##
#
# ####
#
#####
# ######
##
##
###
######
###
#
#
##
# ##
##
# ###### #######
###
# ### ###
############# #
#
##
##
#
#####
#
#
#########
#
##
#
##
#
#
####
##
#
### #
##
####
##
##
## #
##
######
#
##
##
###
#
#
###
#
#
# ##
##
## #
#
#
#
#
#
# ###
#
#### ###
##
#
##
#
##
###
#
###
#
##
###
##
# #####
### #
###
## #####
#
#
####
####
#
#
#
#
## ###
#
##
###
##
#
#
#
#
#
####
#
##
#
####
# # # ##
# ##
#
#
## #
#
###
#
#
#
### ## #
##
#
##
#
#
#
#
##
## #
##
# #
## ###
#
#
#
###
#
#
####
###
#
#
#
## ###
###
#
###
#
# ####
#
#
#
#
#
###
#
#
#
#
####
##
##
#
####
#
##
#
#
#
#
#
####
#
#
# #
##
##
##
#
#
## #
###
#
#
#
##
#
#
#
#
##
## ##
#
#
# #
#
####
#
##
# #
#
##
#
#
#
##
#
#
## ###
#
##
##
#
#
##
##
#
#
#
##
#
##
###
##
#
#
#
## #
# ##
#
#
#
##
##
#
#
#
#
#
#
#
##
##
##########
#
#
#
#
##
# ## ###
#### # #
# ##### #### ## ###
# ### ##
#
### #
##
##
##
#
#### ##
###############
###
# ######
#
#
#
### ##
#
########
###
###
#### #
##
# ###
#############
##
#
#### #
#
##
#####
## #
###
#######
##
#
#
#
#
###
# #
##
############
#
##
#
## ##### #
#
##
##
#
#######
###
##
## ### ######## ####
#############
####
##### ######### ############
#
##
#####
##########
#####
###
#########
#
###
#############
##################
######## #
########
##
##
#
#
##### #####
#
###
#####
##
#####
##################
#######
#
##
#S#S#S #S
#S
#S#S#S
#S
#S#S#S#S
#S#S#S#S
#S
Existing Oil Fields
Planned Oil Fields
Candidate Oil Fields
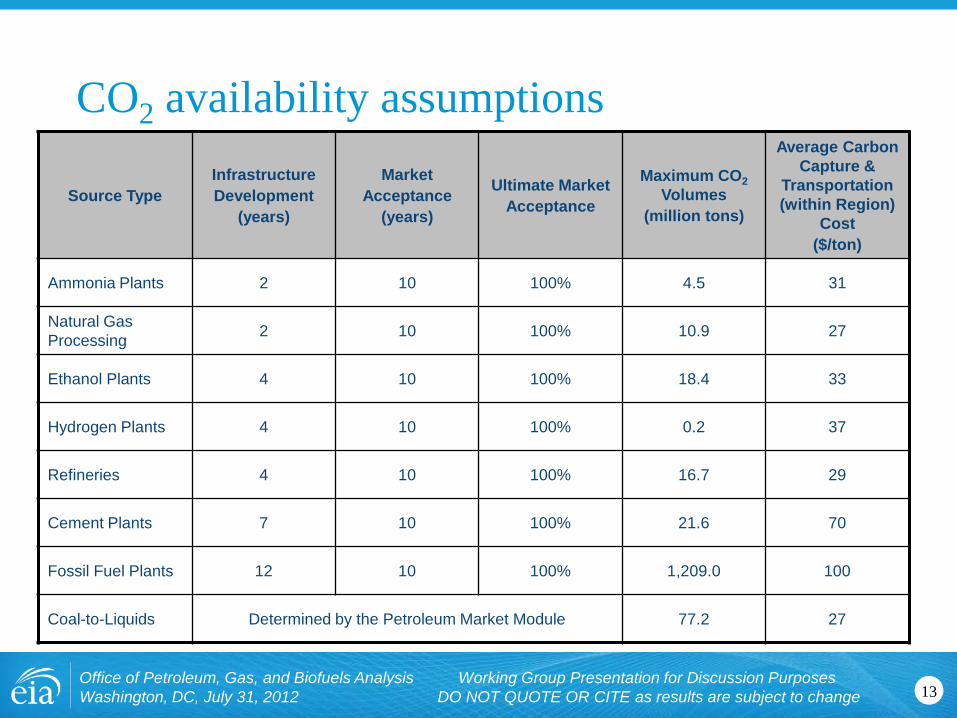
CO2 availability assumptions
13 Office of Petroleum, Gas, and Biofuels Analysis Working Group Presentation for Discussion Purposes Washington, DC, July 31, 2012 DO NOT QUOTE OR CITE as results are subject to change
Source Type Infrastructure Development
(years)
Market Acceptance
(years)
Ultimate Market Acceptance
Maximum CO2 Volumes
(million tons)
Average Carbon Capture &
Transportation (within Region)
Cost ($/ton)
Ammonia Plants 2 10 100% 4.5 31
Natural Gas Processing 2 10 100% 10.9 27
Ethanol Plants 4 10 100% 18.4 33
Hydrogen Plants 4 10 100% 0.2 37
Refineries 4 10 100% 16.7 29
Cement Plants 7 10 100% 21.6 70
Fossil Fuel Plants 12 10 100% 1,209.0 100
Coal-to-Liquids Determined by the Petroleum Market Module 77.2 27

Estimated Ultimate Recovery – continuous plays
Office of Petroleum, Gas, and Biofuels Analysis Working Group Presentation for Discussion Purposes Washington, DC, July 31, 2012 DO NOT QUOTE OR CITE as results are subject to change 14
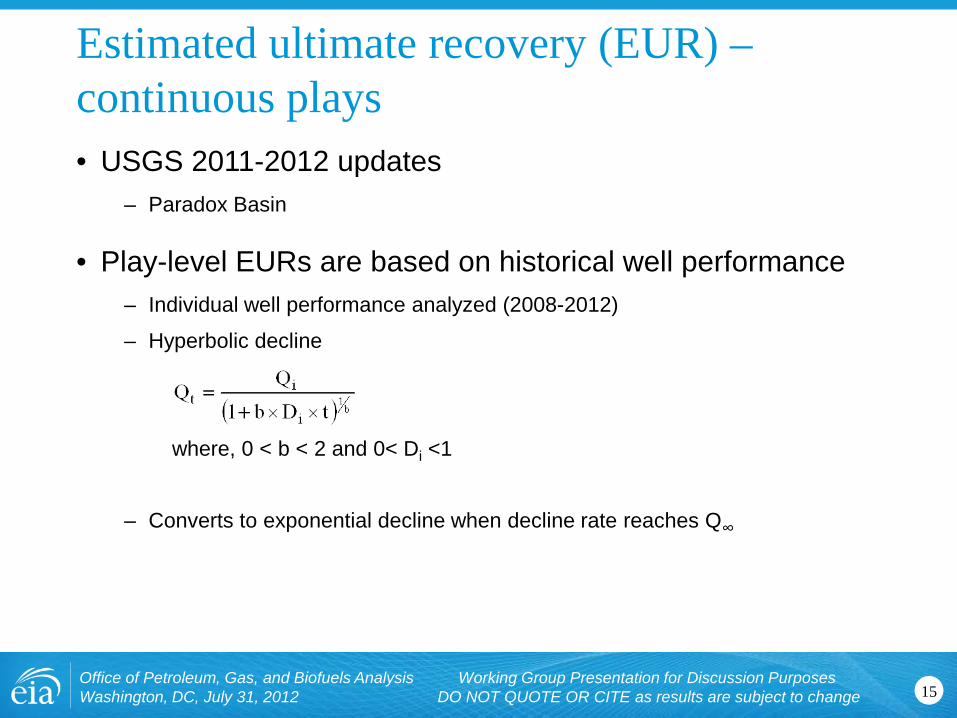
Estimated ultimate recovery (EUR) – continuous plays
15 Office of Petroleum, Gas, and Biofuels Analysis Working Group Presentation for Discussion Purposes Washington, DC, July 31, 2012 DO NOT QUOTE OR CITE as results are subject to change
• USGS 2011-2012 updates – Paradox Basin
• Play-level EURs are based on historical well performance – Individual well performance analyzed (2008-2012)
– Hyperbolic decline
where, 0 < b < 2 and 0< Di <1
– Converts to exponential decline when decline rate reaches Q∞
16 Office of Petroleum, Gas, and Biofuels Analysis Working Group Presentation for Discussion Purposes Washington, DC, July 31, 2012 DO NOT QUOTE OR CITE as results are subject to change
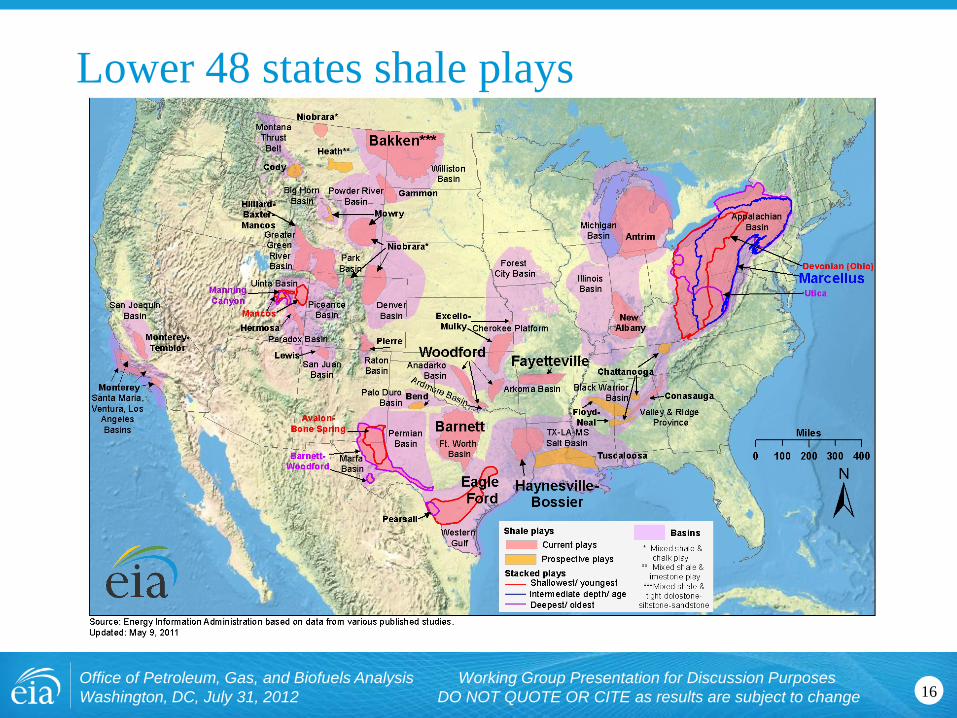
Lower 48 states shale plays

Lower 48 states major tight gas plays
17 Office of Petroleum, Gas, and Biofuels Analysis Working Group Presentation for Discussion Purposes Washington, DC, July 31, 2012 DO NOT QUOTE OR CITE as results are subject to change

18 Office of Petroleum, Gas, and Biofuels Analysis Working Group Presentation for Discussion Purposes Washington, DC, July 31, 2012 DO NOT QUOTE OR CITE as results are subject to change
Basin/Play
AEO2013 AEO2012
Area (mi2)
Average Well Spacing
(wells/mi2) % of area untested
% of area with
potential Average EUR
(bcf/well) TRR (bcf)
Average EUR
(bcf/well) TRR (bcf) Appalachian Marcellus 104,067 5 99% 19% 1.65 148,857 1.56 140,565
Utica 16,590 4 100% 21% 1.13 15,712 1.13 15,712
Arkoma
Woodford 3,000 8 98% 23% 1.97 10,669 1.97 10,678
Fayetteville 5,853 8 93% 23% 1.09 11,088 1.30 13,240
Chattanooga 696 8 100% 29% 0.99 1,617 0.99 1,617
Caney 2,890 4 100% 29% 0.34 1,135 0.34 1,135
TX-LA-MS Salt
Haynesville/Boosier 9,320 8 98% 34% 3.25 80,076 2.67 65,860
Western Gulf
Eagle Ford 18,451 6 99% 43% 1.05 49,473 2.36 50,219
Pearsall 1,420 6 100% 85% 1.22 8,817 1.22 8,817
Anadarko
Woodford 3,350 4 99% 41% 2.30 12,616 2.89 10,981
Sum of select plays 340,060 318,825
Total U.S. shale 490,277 481,783
Unproved technically recoverable shale gas

19 Office of Petroleum, Gas, and Biofuels Analysis Working Group Presentation for Discussion Purposes Washington, DC, July 31, 2012 DO NOT QUOTE OR CITE as results are subject to change
Region Basin Play
AEO2013 AEO2012
Area (mi2)
Average Well
Spacing (wells/mi2)
% of area untested
% of area with
potential
Average EUR
(mmb/well) TRR
(mmb)
Average EUR
(mmb/well) TRR
(mmb)
Gulf Coast West Gulf Austin Chalk 16,078 3 72% 46% 0.043 687 0.127 2,688
Gulf Coast West Gulf Eagle Ford Shale 12,500 5 97% 25% 0.197 2,980 0.284 2,461
Midcontinent Anadarko Woodford Shale 3,120 6 100% 88% 0.036 590 0.024 393
Southwest Permian Avalon/Bone Springs Shale 1,313 4 100% 78% 0.067 274 0.390 1,593
Southwest Permian Spraberry 1,085 6 99% 72% 0.031 144 0.110 510
Rocky Mountains Paradox 471 -- --
Rocky Mountains Rocky Mountain basins Niobrara 20,385 8 97% 80% 0.062 7,902 0.051 6,500
Rocky Mountains Williston Bakken Shale 39,000 2 96% 54% 0.221 8,955 0.550 5,372
West Coast San Joaquin/Los Angeles
Monterey/Santos Shale 2,520 12 98% 93% 0.497 13,709 0.497 13,709
35,710 33,226
Unproved technically recoverable tight oil
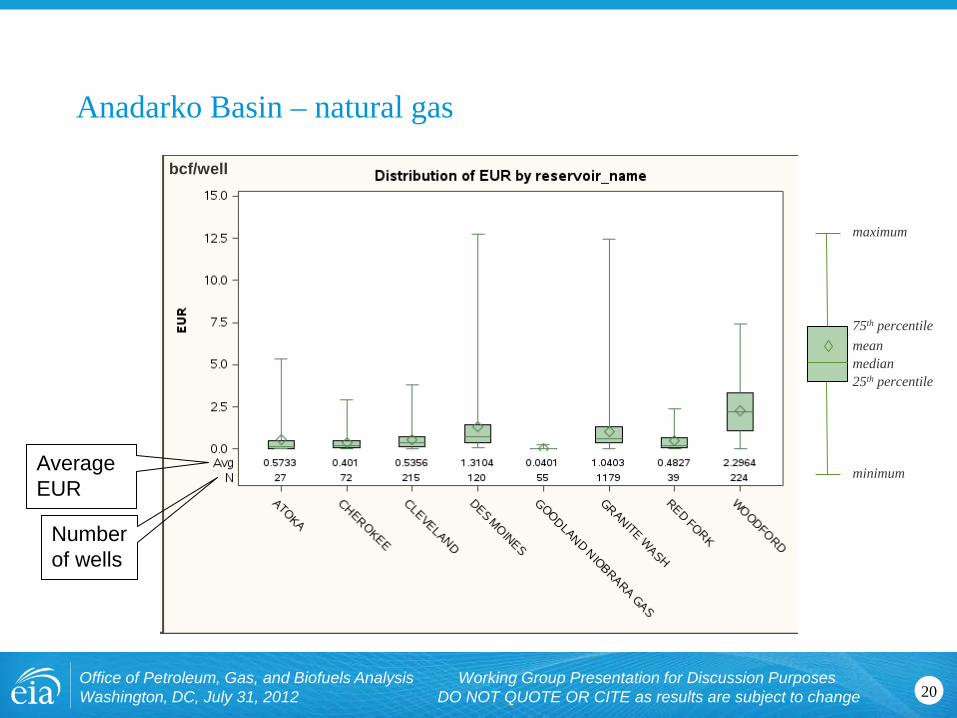
Anadarko Basin – natural gas
20 Office of Petroleum, Gas, and Biofuels Analysis Working Group Presentation for Discussion Purposes Washington, DC, July 31, 2012 DO NOT QUOTE OR CITE as results are subject to change
bcf/well
Number of wells
Average EUR
minimum
maximum
25th percentile
mean median
75th percentile

Anadarko Basin – crude oil/condensate
21 Office of Petroleum, Gas, and Biofuels Analysis Working Group Presentation for Discussion Purposes Washington, DC, July 31, 2012 DO NOT QUOTE OR CITE as results are subject to change
mbbls/well
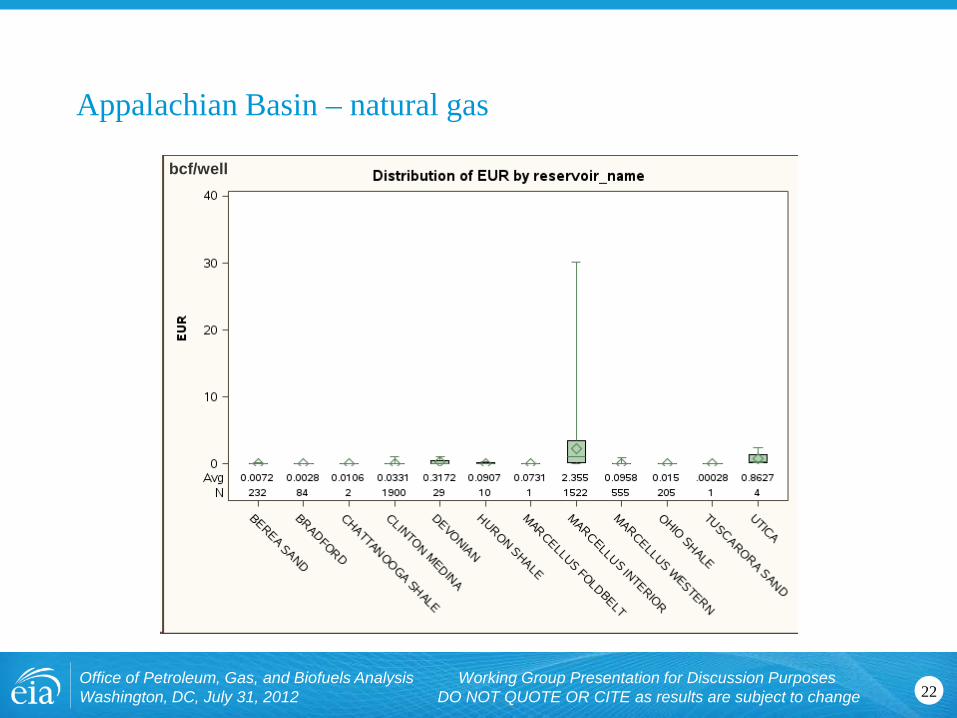
Appalachian Basin – natural gas
22 Office of Petroleum, Gas, and Biofuels Analysis Working Group Presentation for Discussion Purposes Washington, DC, July 31, 2012 DO NOT QUOTE OR CITE as results are subject to change
bcf/well

Appalachian Basin – crude oil/condensate
23 Office of Petroleum, Gas, and Biofuels Analysis Working Group Presentation for Discussion Purposes Washington, DC, July 31, 2012 DO NOT QUOTE OR CITE as results are subject to change
mbbls/well

Arkoma Basin – natural gas
24 Office of Petroleum, Gas, and Biofuels Analysis Working Group Presentation for Discussion Purposes Washington, DC, July 31, 2012 DO NOT QUOTE OR CITE as results are subject to change
bcf/well

Arkoma Basin – crude oil/condensate
25 Office of Petroleum, Gas, and Biofuels Analysis Working Group Presentation for Discussion Purposes Washington, DC, July 31, 2012 DO NOT QUOTE OR CITE as results are subject to change
mbbls/well

Denver Basin – natural gas
26 Office of Petroleum, Gas, and Biofuels Analysis Working Group Presentation for Discussion Purposes Washington, DC, July 31, 2012 DO NOT QUOTE OR CITE as results are subject to change
bcf/well

Denver Basin – crude oil/condensate
27 Office of Petroleum, Gas, and Biofuels Analysis Working Group Presentation for Discussion Purposes Washington, DC, July 31, 2012 DO NOT QUOTE OR CITE as results are subject to change
mbbls/well

Fort Worth Basin – natural gas
28 Office of Petroleum, Gas, and Biofuels Analysis Working Group Presentation for Discussion Purposes Washington, DC, July 31, 2012 DO NOT QUOTE OR CITE as results are subject to change
bcf/well
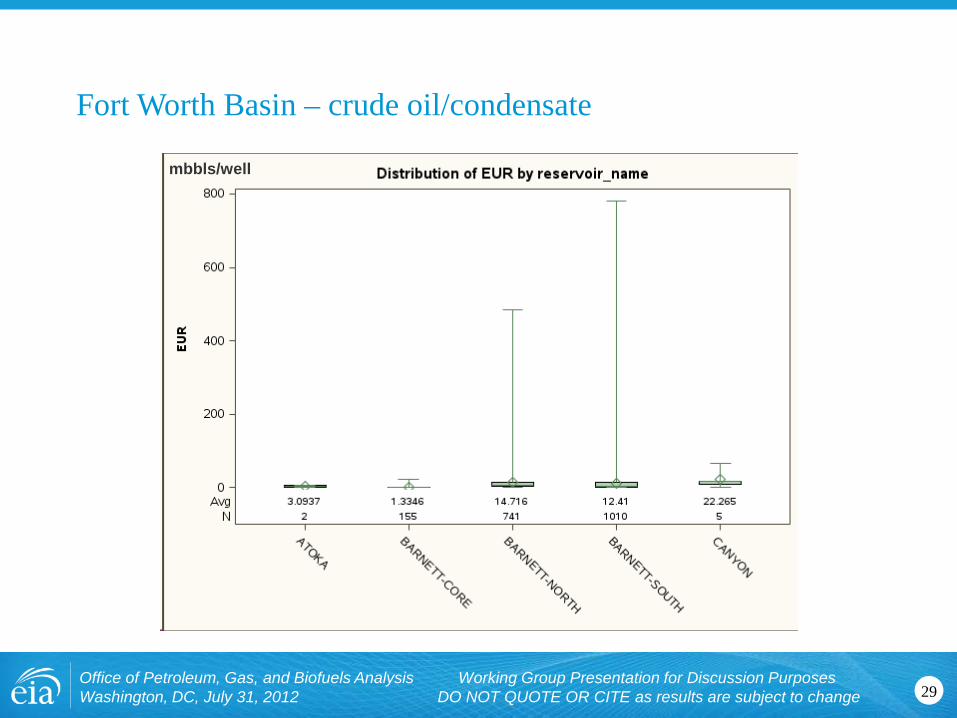
Fort Worth Basin – crude oil/condensate
29 Office of Petroleum, Gas, and Biofuels Analysis Working Group Presentation for Discussion Purposes Washington, DC, July 31, 2012 DO NOT QUOTE OR CITE as results are subject to change
mbbls/well
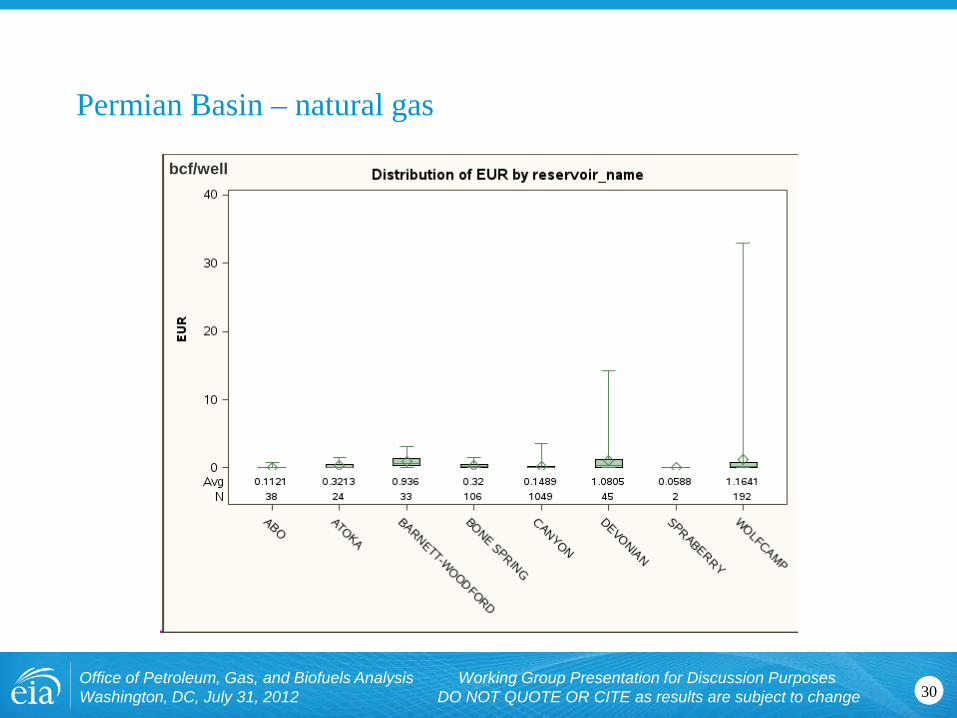
Permian Basin – natural gas
30 Office of Petroleum, Gas, and Biofuels Analysis Working Group Presentation for Discussion Purposes Washington, DC, July 31, 2012 DO NOT QUOTE OR CITE as results are subject to change
bcf/well
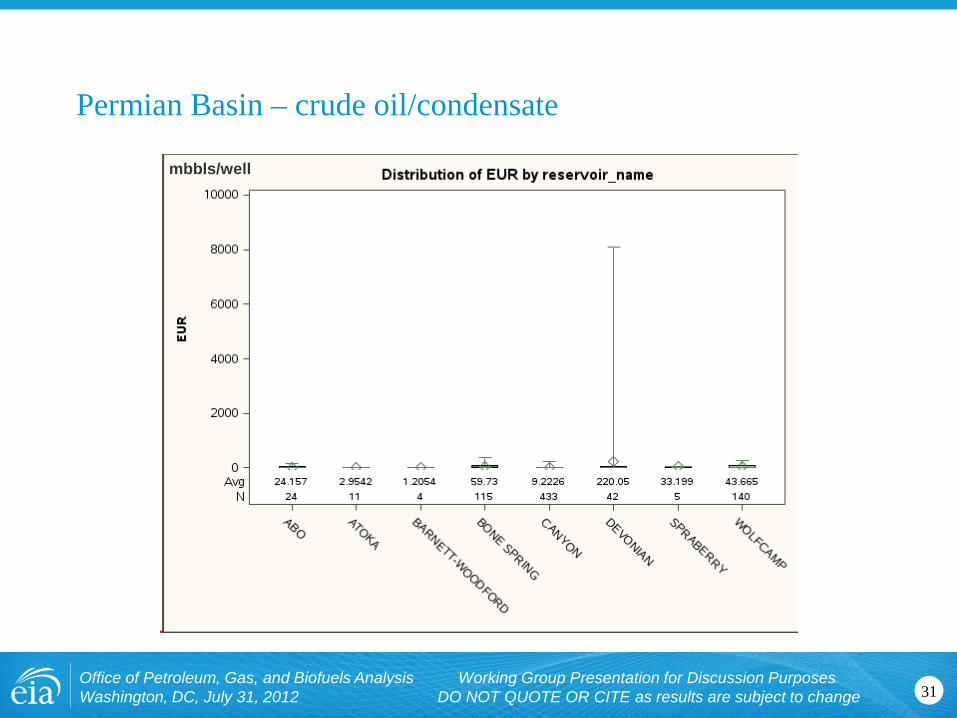
Permian Basin – crude oil/condensate
31 Office of Petroleum, Gas, and Biofuels Analysis Working Group Presentation for Discussion Purposes Washington, DC, July 31, 2012 DO NOT QUOTE OR CITE as results are subject to change
mbbls/well

San Juan Basin – natural gas
32 Office of Petroleum, Gas, and Biofuels Analysis Working Group Presentation for Discussion Purposes Washington, DC, July 31, 2012 DO NOT QUOTE OR CITE as results are subject to change
bcf/well

San Juan Basin – crude oil/condensate
33 Office of Petroleum, Gas, and Biofuels Analysis Working Group Presentation for Discussion Purposes Washington, DC, July 31, 2012 DO NOT QUOTE OR CITE as results are subject to change
mbbls/well

Southwestern Wyoming Basin – natural gas
34 Office of Petroleum, Gas, and Biofuels Analysis Working Group Presentation for Discussion Purposes Washington, DC, July 31, 2012 DO NOT QUOTE OR CITE as results are subject to change
bcf/well

Southwestern Wyoming Basin – crude oil/condensate
35 Office of Petroleum, Gas, and Biofuels Analysis Working Group Presentation for Discussion Purposes Washington, DC, July 31, 2012 DO NOT QUOTE OR CITE as results are subject to change
mbbls/well

TX-LA-MS Salt Basin – natural gas
36 Office of Petroleum, Gas, and Biofuels Analysis Working Group Presentation for Discussion Purposes Washington, DC, July 31, 2012 DO NOT QUOTE OR CITE as results are subject to change
bcf/well
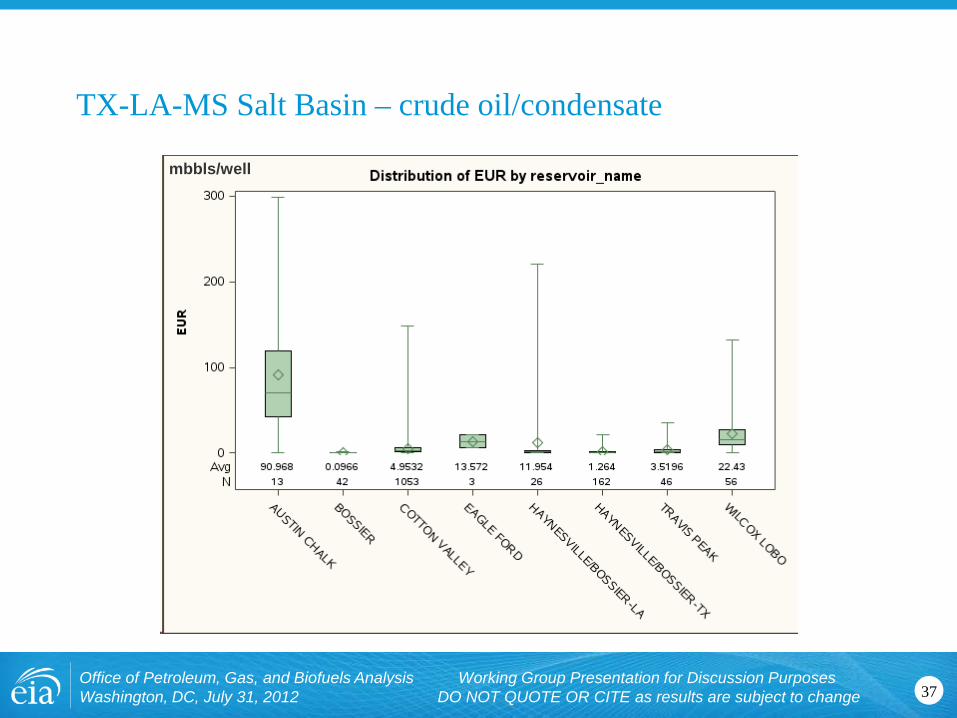
TX-LA-MS Salt Basin – crude oil/condensate
37 Office of Petroleum, Gas, and Biofuels Analysis Working Group Presentation for Discussion Purposes Washington, DC, July 31, 2012 DO NOT QUOTE OR CITE as results are subject to change
mbbls/well
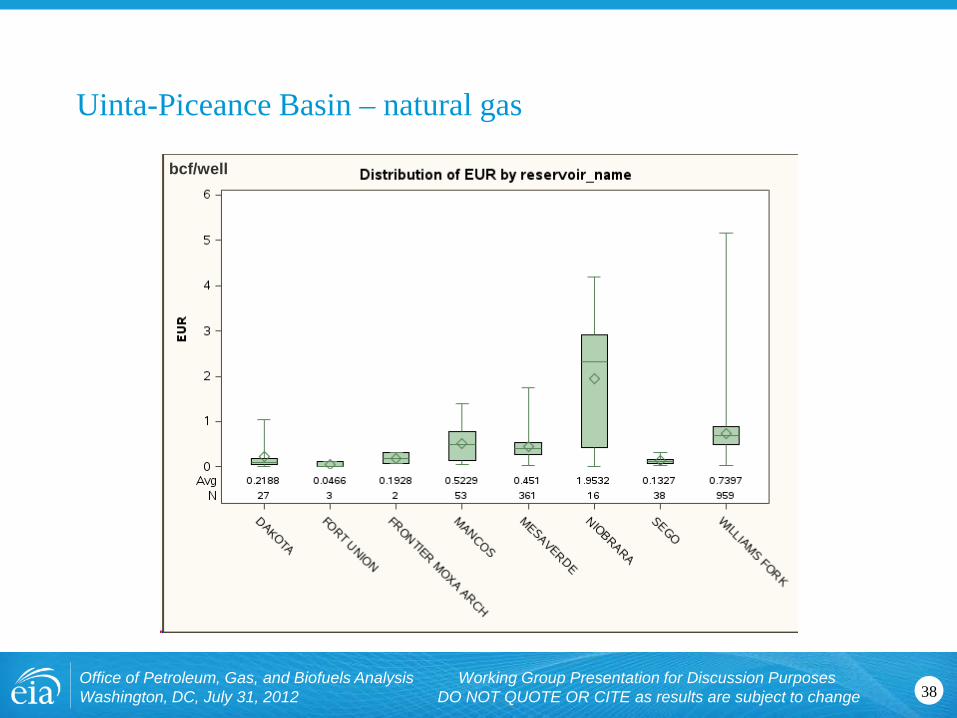
Uinta-Piceance Basin – natural gas
38 Office of Petroleum, Gas, and Biofuels Analysis Working Group Presentation for Discussion Purposes Washington, DC, July 31, 2012 DO NOT QUOTE OR CITE as results are subject to change
bcf/well

Uinta-Piceance Basin – crude oil/condensate
39 Office of Petroleum, Gas, and Biofuels Analysis Working Group Presentation for Discussion Purposes Washington, DC, July 31, 2012 DO NOT QUOTE OR CITE as results are subject to change
mbbls/well

Western Gulf Coast Basin – natural gas
40 Office of Petroleum, Gas, and Biofuels Analysis Working Group Presentation for Discussion Purposes Washington, DC, July 31, 2012 DO NOT QUOTE OR CITE as results are subject to change
bcf/well

Western Gulf Coast Basin – crude oil/condensate
41 Office of Petroleum, Gas, and Biofuels Analysis Working Group Presentation for Discussion Purposes Washington, DC, July 31, 2012 DO NOT QUOTE OR CITE as results are subject to change
mbbls/well

Williston Basin – natural gas
42 Office of Petroleum, Gas, and Biofuels Analysis Working Group Presentation for Discussion Purposes Washington, DC, July 31, 2012 DO NOT QUOTE OR CITE as results are subject to change
bcf/well

Williston Basin – crude oil/condensate
43 Office of Petroleum, Gas, and Biofuels Analysis Working Group Presentation for Discussion Purposes Washington, DC, July 31, 2012 DO NOT QUOTE OR CITE as results are subject to change
mbbls/well
Side cases
44 Office of Petroleum, Gas, and Biofuels Analysis Working Group Presentation for Discussion Purposes Washington, DC, July 31, 2012 DO NOT QUOTE OR CITE as results are subject to change
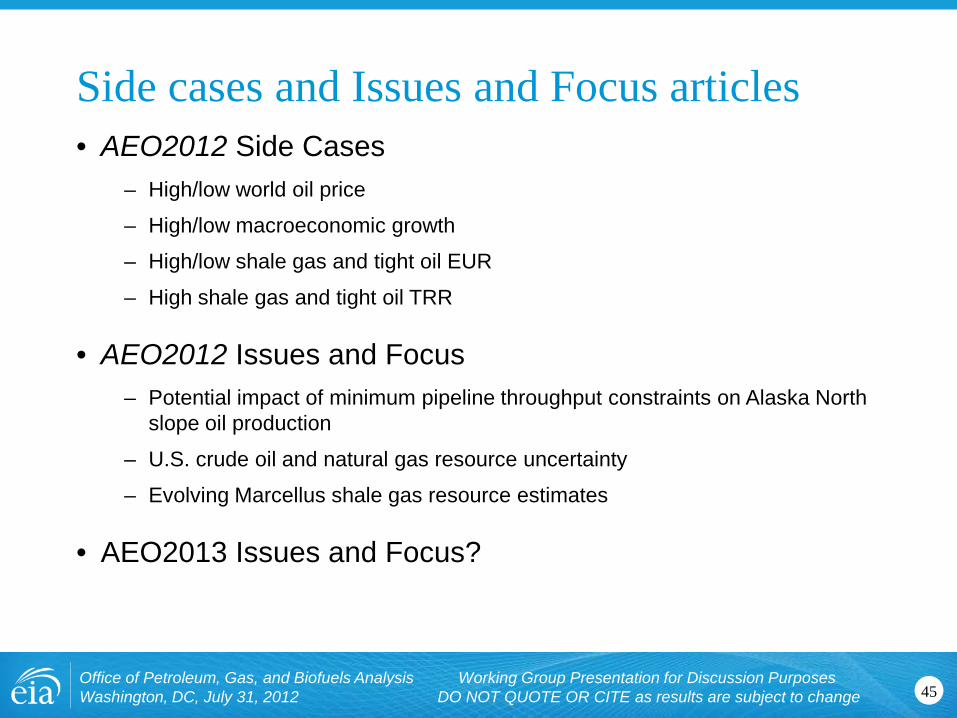
Side cases and Issues and Focus articles
45 Office of Petroleum, Gas, and Biofuels Analysis Working Group Presentation for Discussion Purposes Washington, DC, July 31, 2012 DO NOT QUOTE OR CITE as results are subject to change
• AEO2012 Side Cases – High/low world oil price
– High/low macroeconomic growth
– High/low shale gas and tight oil EUR
– High shale gas and tight oil TRR
• AEO2012 Issues and Focus – Potential impact of minimum pipeline throughput constraints on Alaska North
slope oil production
– U.S. crude oil and natural gas resource uncertainty
– Evolving Marcellus shale gas resource estimates
• AEO2013 Issues and Focus?
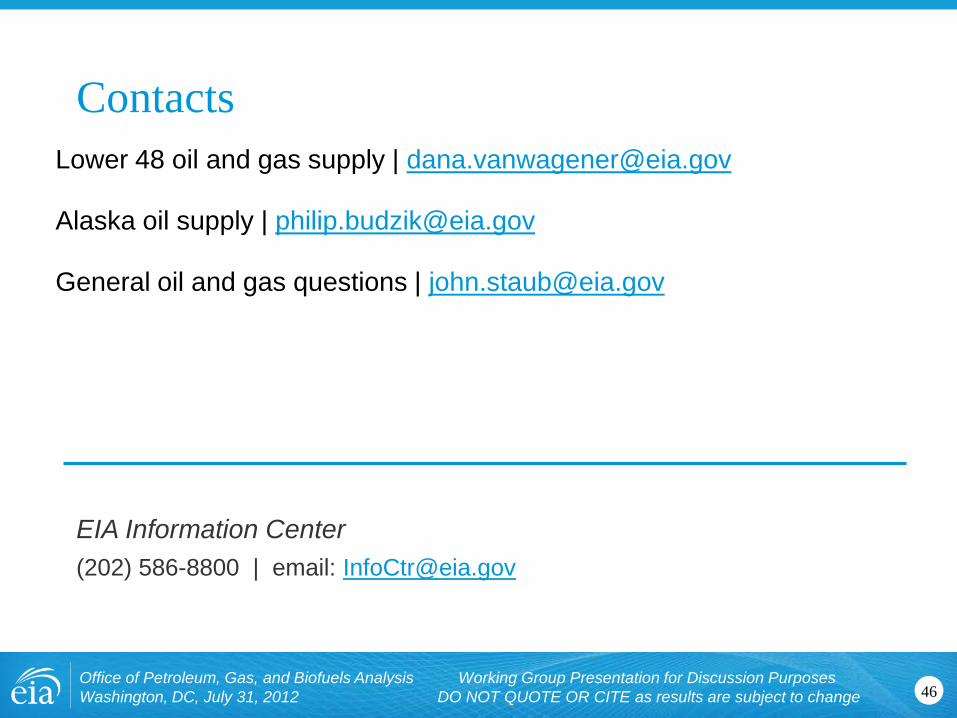
Contacts
46 Office of Petroleum, Gas, and Biofuels Analysis Working Group Presentation for Discussion Purposes Washington, DC, July 31, 2012 DO NOT QUOTE OR CITE as results are subject to change
Lower 48 oil and gas supply | [email protected]
Alaska oil supply | [email protected]
General oil and gas questions | [email protected]
EIA Information Center (202) 586-8800 | email: [email protected]

For more information
47 Office of Petroleum, Gas, and Biofuels Analysis Working Group Presentation for Discussion Purposes Washington, DC, July 31, 2012 DO NOT QUOTE OR CITE as results are subject to change
U.S. Energy Information Administration home page | www.eia.gov
Short-Term Energy Outlook | www.eia.gov/steo
Annual Energy Outlook | www.eia.gov/aeo
International Energy Outlook | www.eia.gov/ieo
Monthly Energy Review | www.eia.gov/mer
EIA Information Center (202) 586-8800 | email: [email protected]
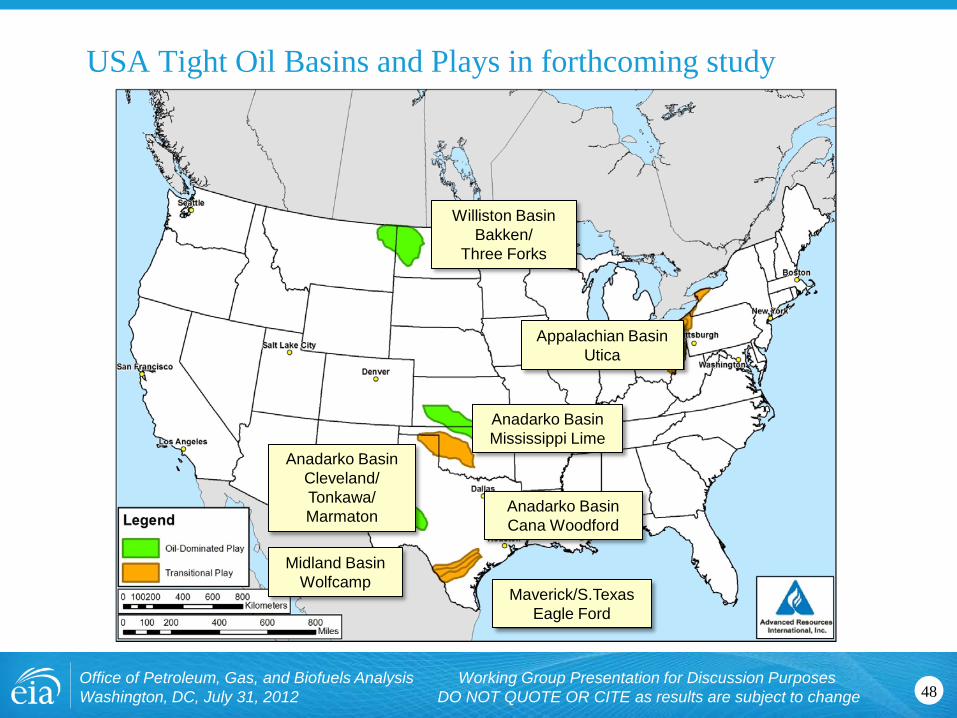
Anadarko Basin Cleveland/ Tonkawa/ Marmaton
Anadarko Basin Mississippi Lime
Williston Basin Bakken/
Three Forks
Midland Basin Wolfcamp
Appalachian Basin Utica
48
USA Tight Oil Basins and Plays in forthcoming study
Anadarko Basin Cana Woodford
Maverick/S.Texas Eagle Ford
Office of Petroleum, Gas, and Biofuels Analysis Working Group Presentation for Discussion Purposes Washington, DC, July 31, 2012 DO NOT QUOTE OR CITE as results are subject to change