annual financial analysis 2018 - chicago.gov · the city of chicago’s 2018 annual financial...
TRANSCRIPT

C i t y o f C h i c a g o
Annual Financial Analysis2018
Mayor Rahm Emanuel


A n n u a l F i n a n c i a l A n a l y s i s 2 0 1 8
Table of Contents
Disclaimer ................................................................................................... 5
Letter from the Mayor ......................................................................... 7
Executive Summary ................................................................................11
Financial Forecast .................................................................................15
• Introduction .......................................................................17
• Methodology .......................................................................17
• General Economic Considerations ........................................17
• General Expense Conditions ................................................18
• 2018 Corporate Fund Year-End Estimates ............................20
• 2019 Corporate Fund Projections .........................................21
• 2020 - 2021 Corporate Fund Outlooks ...............................24
• Outlook for Special Revenue Funds ......................................27
• Outlook for Enterprise Funds ...............................................28
Historic Revenue and Expense Review..........................................31
• Corporate Fund ..................................................................33
• Special Revenue Funds ........................................................54
• Enterprise Funds .................................................................62
• Grant Funds ......................................................................69
Property Tax Funds ...................................................................73
Pension Benefits Provided By The City ..................................81
Debt ..............................................................................................................91
Capital Investments ...................................................................99
Tax Increment Financing ........................................................105
Appendices ...............................................................................................113
• Budgeting, Financial Management and Controls ................115
• Tables of Funds by Type .....................................................120


A n n u a l F i n a n c i a l A n a l y s i s 2 0 1 8
5
Disclaimer and Advice to Readers
The City of Chicago (“City”) is pleased to present this Annual Financial Analysis (“AFA”). The purpose of this document is to provide general information about the history and future of major components of the City’s overall finances and City budget. Information presented only speaks as of the date of publication or, if such information is dated, as of its date.
Throughout this document, specific items of revenue and/or expenditure are grouped together with other items of revenue and/or expenditure for purposes of presentation. The manner in which such items are grouped and labeled is consistent with the groups and labels in the City’s appropriation ordinance and not in the City’s Comprehensive Annual Financial Report (“CAFR”). Therefore, the manner of grouping and labeling herein may not match the manner in which such revenues and or expenditures are grouped and labeled in the CAFR.
This discussion includes forward-looking statements based on current beliefs and expectations about future events. Those events are uncertain; their outcome may differ from current expectations which may in turn significantly affect expected results.
Where information is presented that has come from sources other than the City, the City presents that information only for convenience. Specifically, the projections set forth in the pension section rely on information produced by the Retirement Funds’ independent actuaries (except where specifically noted otherwise) and were not prepared with a view toward complying with the guidelines established by the American Institute of Certified Public Accountants with respect to prospective financial information. The City does not undertake to verify any of that information.
Where the tables present aggregate information, such combined information results solely from the application of arithmetic to the data presented from the source information and may not conform to the requirements for the presentation of such information by the Governmental Accounting Standards Board (“GASB”).
Readers are cautioned not to place undue reliance on the prospective financial information. Neither the City, the City’s independent auditors, nor any other independent accountants have compiled, examined, or performed any procedures with respect to the prospective financial information contained herein, nor have they expressed any opinion or any other form of assurance on such information or its achievability, and assume no responsibility for, and disclaim any association with, the prospective financial information.
The discussion of City revenues and debt does not include conduit debt (debt issued by the City to finance privately owned projects and repayable solely from loan repayments from the project owners) or revenues received from such project owners and used to repay the conduit debt.
The AFA has not been prepared to give information for making decisions on buying or selling securities and should not be relied upon by investors in making investment decisions. With respect to any bonds, notes, or other debt obligations of the City, please refer to information in the City’s ordinances and notifications of sale and the related disclosure documents, if any, or continuing disclosure filings, if any, for such bonds, notes, or other debt obligations.
The information is provided “as is” without warranty of any kind. Neither the City nor any of its agencies nor any of its officers or employees shall be held liable for any use of the information described and/or contained in this document.


A n n u a l F i n a n c i a l A n a l y s i s 2 0 1 8
7
The City of Chicago’s 2018 Annual Financial Analysis provides an overview of the City’s revenue and expenditures and shares a picture of the City’s overall financial health. The City of Chicago is on firmer financial footing today because of the progress we have made together to eliminate the risky financial practices of the past, address our pension challenges, and reduce our structural budget deficit.
In 2012, our structural budget deficit was $635 million and all four of Chicago’s pension funds were on the road to insolvency. Today, the City’s finances are in a much different place. The projected shortfall for 2019 is $97.9 million, which marks the eighth consecutive year of reducing the structural budget deficit and the lowest point since 2008.
We achieved this significant reduction in the structural deficit through our hard work together to better match our expenditures to revenues and eliminate the financial practices that hid the true cost of government. Since 2011, we have:
• Achieved over $650 million in savings, reforms and efficiencies through the last seven budget cycles;
• Stopped using proceeds from the sale of City assets to balance the budget;
• Identified sustainable revenue growth through economic expansion, enhancements to revenues, and elimination of tax loopholes;
• Imposed greater fiscal discipline on our borrowing practices by phasing-out the use of long-term debt to pay for certain working capital expenses, like library books;
• Converted all the taxpayer-backed variable-rate debt to fixed-rate debt and terminated the corresponding swaps; and
• Eliminated the practice of “scoop and toss,” a practice akin to using your credit card to pay your mortgage payments.
We achieved this all while developing funding plans for, and making substantial contributions to, all four of our pension funds. As recently reflected in the City’s annual audit, due to our hard work to achieve pension funding reform, the City’s total pension liability decreased by $8.5 billion.
Today, Chicago is on stronger financial footing, and our structural budget deficit has declined by 85 percent since 2012 and represents less than three percent of our overall expected Corporate Fund revenue for 2019. This low structural budget deficit is expected and manageable in a government with a nearly $4 billion operating budget.
Together, we have created a better future, but we must remain focused on the financial reforms that achieved the lowest budget deficit in more than a decade - at the same time our economy was growing and adding good jobs. We must build on those reforms to ensure we can continue to grow our investments in neighborhoods.
Sincerely,
Rahm EmanuelMayor
Letter from the Mayor


Executive Summary
Annual Financial Analysis2018


A n n u a l F i n a n c i a l A n a l y s i s 2 0 1 8
11
Executive Summary
Mayor Rahm Emanuel’s Executive Order No. 2011-7 directs the City of Chicago’s Office of Budget and Management to issue, each year, a long-term financial analysis that provides a framework for the development of the City’s annual budget and guides the City’s financial and operational decisions.
The City’s Annual Financial Analysis (“AFA”) is completed based on the critical understanding that in order to protect the health and safety of all Chicagoans, strengthen neighborhoods, maintain infrastructure and public spaces, and to foster a vibrant local economy, the City must be in strong financial health. In order to secure and maintain its fiscal health, the City must plan for the future with a clear view of the past.
The 2018 AFA takes an informed approach to financial planning, evaluating the City’s past revenues, expenditures, policies, and programs in light of conditions driving the broader economy and other factors impacting the City’s future finances.
The AFA includes the history of each major component of the City’s overall finances. It closely examines the strategic financial decisions and operational efficiencies the City has made to improve its economic security, while also providing
a financial forecast of both short-term and long-term liabilities and investment opportunities the City faces now and into the future.
Forecast
This section discusses the City’s 2018 year-end estimates, 2019 preliminary revenue and expense projections, and three revenue and expense scenarios for the years 2020 and 2021 – a base outlook, a negative outlook, and a positive outlook. These projections are based on historical revenue and expenditure data, current economic trends and conditions, and other known factors that are anticipated to have an impact on the City’s finances. The purpose of this analysis is to ensure that the 2019 budget is formulated within the context of the City’s current financial state, and with an informed view of future conditions and the long-term fiscal consequences of today’s decisions.
This forecast focuses primarily on the Corporate Fund, which not only accounts for many of the basic services provided by the City, but also has historically experienced the largest disparity between revenues and expenditures. Projections for the City’s major special revenue and enterprise funds are also included in this section.

A n n u a l F i n a n c i a l A n a l y s i s 2 0 1 8
12
Corporate Fund
The Corporate Fund is the City’s general operating fund, supporting basic City operations and services, such as public safety, public health, refuse collection and tree trimming. Revenue within the Corporate Fund is derived from local taxes, intergovernmental taxes, non-tax revenue, proceeds and transfers and prior year available resources. This section discusses historic trends over the past ten years of Corporate Fund revenues and expenditures.
Special Revenue Funds
Special Revenue Funds are established to account for the operations of specific activities and the revenues generated for carrying out that activity. Special Revenue Funds are used to account for the proceeds of specific revenue sources (other than special assessments, expendable trust, or major capital projects) requiring separate accounting because of legal or regulatory provisions or administrative action. This section discusses historic trends over the past ten years of Special Revenue Funds revenues and expenditures.
Enterprise Funds
Enterprise Funds are established to account for acquisition, operation, and maintenance of government services, such as operating the water and sewer systems and the airports. These self-supporting funds operate like commercial enterprises, in that each pays expenses with revenue derived from charges and user fees for the services it supports. The
City’s four Enterprise Funds are the Water Fund, Sewer Fund, O’Hare International Airport Fund, and Midway International Airport Fund. This section discusses historic trends over the past ten years of Enterprise Funds revenues and expenditures.
Grants
The City receives Grant Funds from federal and state agencies, private foundations, and other entities. These Funds are designated by grantors for specific purposes and support City services, programs, and capital improvements. Grant Funds are often received throughout a given fiscal year, and many grants are awarded to the City for multiple years. This section discusses historic trends over the past ten years of the City’s Grant Funds.
Property Tax Funds
Property Tax is a tax levied on the equalized assessed valuation of real property in the City of Chicago. Cook County collects the tax with assistance from the Illinois Department of Revenue. Authorization for the City’s property tax levy occurs through bond ordinances and property tax levy ordinances in connection with the annual appropriation ordinance. This section provides a general summary of the current procedures for real property assessment, tax levy, and tax collection in Cook County along with expenses paid for with property tax revenue.
Executive Summary

A n n u a l F i n a n c i a l A n a l y s i s 2 0 1 8
13
Pension
The City’s employees are covered under four defined-benefit retirement plans established by State statute and administered by independent pension boards. These plans are the Municipal Employees’ Annuity and Benefit Fund, the Laborers’ Annuity and Benefit Fund, the Policemen’s Annuity and Benefit Fund, and the Firemen’s Annuity and Benefit Fund. This section provides a discussion of the pension liabilities of the City’s four pension funds, legislative changes to the pension system, and the impact on City finances.
Debt
The debt service section discusses the resources and payments of long-term debt service and related costs as well as certain short-term debt instruments. This section provides an overview of the City’s total outstanding debt, including general obligation bonds, revenue bonds, and short-term debt instruments. It also explains the City’s debt service payments over the past ten years and future payments.
Capital
This section examines the City’s Capital Improvement Program (“CIP”) which funds the physical improvement or replacement of City-owned infrastructure and facilities with long useful lives, such as roads, bridges and green spaces. The City’s CIP outlines planned capital improvements on a five-year schedule. It is updated annually and lists the planned and proposed projects with identified funding sources and construction schedule for citywide capital improvement projects including, water, sewer, transportation, neighborhood infrastructure, and aviation projects.
Tax Increment Financing
Tax Increment Financing (“TIF”) is a funding tool used to improve neighborhood infrastructure and promote investment in communities across the City. The program is governed by State law, which allows municipalities to capture property tax revenues derived from the amount of incremental equalized assessed value (“EAV”) above the base EAV that existed when an area was designated as a TIF district. This section discusses property-tax derived revenue for the City’s TIF program, including project bonds and notes, expenditures, and TIF surplus.
Executive Summary


Annual Financial Analysis2018
Financial Forecast


A n n u a l F i n a n c i a l A n a l y s i s 2 0 1 8
17
Financial Forecast
1 The economic considerations in this section are developed from sources including the Bureau of Labor Statistics (www.bls.gov), Crain’s Chicago Business (www.chicagobusiness.com), The Real Deal (www.therealdeal.com), the Office of Illinois State Comptroller (www.illinoiscomptroller.gov), The Federal Reserve (www.federalreserve.gov), Illinois Association of Realtors (www.illinoisrealtor.com), World Business Chicago (www.worldbusinesschicago.com) and Choose Chicago (https://www.choosechicago.com/)
INTRODUCTION
This section discusses the City’s 2018 year-end estimates, 2019 preliminary revenue and expense projections, and three revenue and expense scenarios for the years 2020 and 2021 – with a base outlook, a negative outlook, and a positive outlook. These projections are based on historical revenue and expenditure data, current economic and expense trends and conditions, and other known factors that are anticipated to have an impact on the City’s finances. The purpose of this analysis is to ensure that the 2019 budget is formulated within the context of the City’s current financial state, and with an informed view of future conditions and the long-term fiscal consequences of today’s decisions.
The forecast focuses primarily on the Corporate Fund, which not only accounts for many basic services provided by the City, but also has historically experienced the largest disparity between revenues and expenditures. Projections for the City’s major Special Revenue and Enterprise Funds are included at the end of this section.
Methodology
The City of Chicago develops revenue and expenditure estimates for the current fiscal year in order to identify the structural budget deficit for the upcoming budget as well as to examine how economic trends and expense conditions may positively or negatively impact future budgets. When developing the forecast, the City considers current and historical revenue as well as events and actions that could cause revenues to deviate positively or negatively from those trends. The City also examines economic forecasts produced by government agencies, industry groups, and other entities. For expenditures, the City develops historic growth assumptions and makes any necessary adjustments to expenditures based on input from departments and other known expense changes. The forecast process also relies on input from City departments as well as consultation with outside entities including industry groups, government agencies, and others.
Positive and negative scenario estimates are based on a range of revenue that could be generated from fees and taxes as well as a review of historic year-over-year percentage increases
and decreases for each revenue source. Assumptions under each scenario vary by revenue source but consider factors such as lower than anticipated growth, accelerated decline, or flat revenues. The scenarios also consider actions or events that could adversely or favorably impact such as changes in the law at the state and federal level as well state and federal budgets and their impact on intergovernmental revenue distributed to the City.
The preliminary revenue and expense projections for 2019 reflect the City’s structural budget deficit, which is any structural budget imbalance between existing revenues and expenses for that budget year. This projection does not reflect new revenue sources, new investments to be added in the upcoming budget, or long-term liabilities for future years as these are not structural budget imbalances. As it relates to long-term, future liabilities, the City has regularly identified sustainable, dedicated revenue sources to fund these future liabilities, often times years in advance. Therefore, they do not directly impact future years’ projections of the City’s structural budget deficit. The structural budget deficit is closed each year along with funding any new investments as part of the City’s annual budget process. The structural budget deficit along with new investments represent the City’s annual operating budget gap, which is closed each year with savings, reforms, efficiencies, and revenue enhancements. The City’s annual budget is presented each October with revenues and expenditures balanced. Future years’ structural budget deficits included in this document are projections for the City’s Corporate Fund based on positive, negative, or base economic scenarios based on existing revenues and existing expenditures. These figures assume that no substantive changes are made to City operations, revenue or the cost of City services as part of the 2019 budget and beyond.
General Economic Considerations1
Chicago has one of the world’s most robust and diverse economies with no single industry employing more than 14 percent of the City’s workforce. This diversity provides financial stability from mature industries such as financial services, manufacturing, transportation and warehousing, education and healthcare, and enables the City to support

A n n u a l F i n a n c i a l A n a l y s i s 2 0 1 8
18
Financial Forecast
growth of emerging businesses in sectors like technology, tourism, biotech, and life sciences. Chicago has more than 400 major corporate headquarters with at least 1,000 employees located in the Chicago metropolitan area, including 34 Fortune 500 companies. In 2017, and for the fifth year in a row, the Chicago area was recognized by Site Selection Magazine as having more new and expanded corporate facilities than any other metro area with a population over one million. Additionally, with ongoing investments in City services and infrastructure, the City has remained competitive with other emerging and established technology hubs across the country. Chicago was recently rated the #1 top tech hot spot of the future and boasts the highest venture capital returns of any U.S. startup hub.
Business growth and expansion has translated into an improved employment picture for Chicago and the metro area. The City’s unemployment rate declined to 5.3 percent in 2017 from 6.5 percent in 2016, and figures for May 2018 suggest continued improvement with an unemployment rate of 3.6 percent. Since 2011, Chicago has experienced significant job and wage growth, adding 145,000 private sector jobs and leading to the lowest rate of unemployed residents (3.6 percent) since 1990. Moreover, between 2011 to 2016, Chicago’s median household income grew by 14.1 percent, outpacing the growth of each of the five largest U.S. cities.
Consumer and business spending continue to help drive the economy at the local and national levels. Preliminary estimates indicate the U.S. gross domestic product (“GDP”) grew at an annual rate of 4.1 percent in the second quarter of 2018 following 2.2 percent annualized growth in the first quarter.
Chicago’s real estate market is reflective of the strong local and national economy. The Chicago real estate market ended 2017 with one of the strongest years of home sales since before 2008, although year-to-date home sales for 2018 are down 3.8 percent compared to the same time last year. Demand for homes remains strong, despite low inventories of units available for first-time home buyers, helping to drive up the average sale price in the first six months of 2018 by 4.0 percent compared to the same period in 2017. The downtown commercial vacancy rate increased 0.1% in the second quarter of 2018 to 13.0 percent as more than 1 million square feet of new office space came on line, reflecting the strong economy and demand for space as more
companies relocate or expand operations in the City.
Chicago continues to serve as a major transportation and tourism hub. Chicago’s aviation system was ranked the #1 best-connected in the country and the #4 best-connected in the world, and Chicago’s O’Hare International Airport saw a 2.4 percent increase in passenger volume in 2017 compared to 2016. In addition, 55 million visitors traveled to the City in 2017, which was the seventh consecutive year of record tourism and a 40.0 percent increase over 2010 figures.
While the City anticipates modest and steady economic growth in the coming years, lingering uncertainty around government spending and policies at the State and federal level may result in short-term negative impacts on the local, regional, and national economy. Nationally, rising interest rates and the uncertainty regarding the federal government’s trade policy, tariffs on exports, and escalating trade wars could impact the local economy. Since the adoption of the State’s first budget in two years in 2017, the State has reduced the total of unpaid bills from $16.7 billion to $7.6 billion. Further, as part of recent State budgets, the City has seen a diversion in certain intergovernmental taxes for state expenses, which may continue into the future. Additionally, upcoming state and local elections could impact future policies that affect the region.
These broader economic factors are accounted for in the following projections. The 2019 projections and the base outlook for 2020-2021 present what is currently viewed as the most likely scenario. The positive and negative outlooks for 2020 and 2021 provide insight into how changes in the economy and other related factors could affect the City’s finances over the next three years.
General Expense Conditions2
Personnel-related expenditures, including salaries and wages, pensions, healthcare, overtime pay, workers’ compensation, and unemployment compensation has accounted for roughly 80.0 percent of total Corporate Fund expenditures in recent years and is the largest driver of expense growth in the past, and we expect this trend to continue into future years.
Over the past ten years, the City’s workforce has decreased from 40,108 budgeted Full Time Equivalents (“FTEs”) in
2 Expenditure analysis within this section is based on the 2017 CAFR, 2018 annual appropriation ordinance, and other publicly available data including the 2017 Employer Health Benefits Survey by the Kaiser Family Foundation and Health Research and Education Trust

A n n u a l F i n a n c i a l A n a l y s i s 2 0 1 8
19
Financial Forecast
2008 to 36,232 budgeted FTEs in 2018. While the number of FTEs has decreased, the City’s overall personnel-related costs are significantly higher than they were ten years ago due to contractual and prevailing wage increases and growing pension contributions.
The increase in personnel expenses is due primarily to salary increases resulting from contractual obligations under collective bargaining agreements (“CBAs”) with approximately 90.0 percent of total city employees covered by a CBA. As the overall number of City positions has decreased over the last ten years, the relative proportion of union positions has increased. The City has CBAs with more than 40 different unions. The CBAs with each of these unions include cost of living increases, resulting in higher personnel costs year-over-year. Additionally, these cost of living increases are often in addition to raises based on time in service that many employees receive. For trades unions, some positions receive a negotiated rate, while others are compensated pursuant to the prevailing rate. From July 2007 through July 2017, Fraternal Order of Police (“FOP”), the Coalition of Union Public Employees (“COUPE”) – which represents trades unions – the Chicago Firefighters
Union (“Local 2”), and the American Federation of State, County, and Municipal Employees (“AFSCME”) received salary adjustments between 21.0 percent and 26.0 percent depending on the CBA. The City is currently in contract negotiations for many CBAs, and any negotiated increases will further grow future personnel-related costs.
A significant share of the City’s annual budget is spent on healthcare coverage annually, including medical, dental and vision care, for current City employees, a certain portion of City retirees, and spouses and dependents of both. According to the 2017 Annual Survey by Kaiser Family Foundation and Health Research & Education Trust on Employer Health Benefits, the average annual premiums for employer-sponsored health insurance for family coverage have increased 19.0 percent since 2012 and 55.0 percent since 2007. While the City slowed the growth of healthcare costs relative to national averages in recent years, growing healthcare costs and general healthcare trends may put additional pressure on City budgets in future years.
By way of comparison, the average cost-per-employee (includes salary/wages, benefits and pensions) was
CITY WORKFORCE AND COST PER EMPLOYEE
2008
2009
2010
2011
2012
2013
2014
2015
2016
2017
2018
0
10,000
20,000
30,000
40,000
50,000
Full-
Tim
e E
quiv
alen
ts
$0
$20,000
$40,000
$60,000
$80,000
$100,000
Cos
t per
Em
ploy
ee
40,1
08
37,4
85
36,9
70
36,6
17
33,7
44
33,5
54
34,0
45
34,1
29
34,3
27
35,6
55
36,2
32
FTEs Cost/Employee
The previous AFA included a higher cost per employee in 2015 than is currently reflected in the chart. The City passed legislation (Senate Bill1922), which would have increased employer contributions significantly to the Municipal and Laborers funds beginning in 2015 and previous costper employee was based on the increased pension contribution. In July 2015, the Circuit Court of Cook County determined that Senate Bill 1922was unconstitutional, and the City’s contributions reverted to the lower contribution amount. Therefore, the City’s cost per employee for 2015 wasrecalculated to reflect the lower contribution amount and is reported in this chart.

A n n u a l F i n a n c i a l A n a l y s i s 2 0 1 8
20
Financial Forecast
approximately $83,255 in 2008; the average cost-per -employee has increased to approximately $106,810 in 2018.
While personnel related expenses are anticipated to have the largest impact on future expenditures within the City’s budgets, non-personnel related expenses, such as fuel, energy purchases and other commodities, may be impacted by the global economy, tariffs, and access to low-cost options. As it relates to energy procurement, the City utilizes price hedging, which is discussed further in the Corporate Fund section of this document, to take advantage of favorable market pricing without sacrificing budget certainty.
These broader expenditure factors are accounted for in the following projections. The 2019 projections and the base outlook for 2020-2021 present what is currently viewed as the most likely scenario. The positive and negative outlooks for 2020 and 2021 provide insight into how changes in employment, salary and wages, benefits and other related factors could affect the City’s finances over the next three years.
2018 CORPORATE FUND YEAR-END ESTIMATES
The City currently projects the Corporate Fund to end 2018 with a $20.2 million surplus due to strong performance in certain revenue areas and many personnel expenditures projected to end the year below budget.
2018 Year-End Revenues
The total Corporate Fund revenue for 2018 is projected to end 2018 approximately $7.0 million above budgeted levels at $3,798.2 million. Total revenues for 2018 are projected to end the year on target, while certain revenues are expected to end below budget. Major categories of revenue and trends are discussed below, and more detail for each revenue source is included in the Historic Revenue and Expense Review section of the 2018 AFA.
Transaction tax revenues are expected to total $441.2 million, or $18.6 million more than originally budgeted. Real Property Transfer Tax collections are projected to total $166.1 million or $4.0 million less than originally estimated for 2018. This is offset by Personal Property Lease Transaction Tax revenues, which are projected to end the year 9.2 percent, or $22.6 million, above 2018 budget
expectations due to growth across various business sectors.
In October 2017, the City Council passed an ordinance authorizing the creation of a Sales Tax Securitization Corporation (“STSC”). Under this agreement, the City receives the proceeds of bonds issued by the STSC as well as residual sales tax revenues not used to make debt service payments. The State-collected portion of the City’s Sales Tax (Home Rule Occupation Tax and Use Tax or “HROT”) and the City’s share of the State’s Sales and Use Taxes (Municipal Retailer Occupation Tax or “MROT”) are sold to the STSC and any remaining revenue not used for debt service are now in ‘Proceeds and Transfers’ in the chart on the following pages. Certain sales taxes imposed by the City and collected by the City were not sold to the STSC and therefore do not flow to the STSC. These revenues continue to be reflected in ‘Sales and Use Taxes’ in the chart on the following pages. In total, the City’s Sales Tax revenue – state and city collected – shows an increase in 2018 over budget expectations, but this growth is offset due to the timing of debt service payments. The total transfer from the STSC to the City is expected to be approximately $587.2 million. Additional information regarding the STSC can be found in the Corporate Fund history section of the AFA.
Reflective of continued employment growth, wage gains, and business growth, State Income Tax revenues are expected to end 2018 at budgeted amounts of $252.5 million or $12.6 million over 2017 State Income Tax revenues, while the City’s share of Personal Property Replacement Tax (“PPRT”) revenue is estimated to finish the year nearly $9.2 million above budget at $143.4 million. Year-to-date PPRT revenues have been greater than originally forecast due in part to increased corporate profits resulting from the 2017 federal tax reform, which help offset additional diversions of PPRT revenue in the State of Illinois FY 2019 budget which will impact PPRT revenues in the second half of 2018 and the first half of 2019.
Ground Transportation Tax and the Amusement Tax are expected to meet original budget estimates of $125.0 million and $189.0 million respectively. These revenue totals are reflective of changes to the structure of both taxes adopted by the City Council as part of the FY 2018 budget. Beginning January 1, 2018, the Ground Transportation Tax applied to rides provided through transportation network providers increased to $0.55 per trip from $0.40. This increase is

A n n u a l F i n a n c i a l A n a l y s i s 2 0 1 8
21
Financial Forecast
expected to generate $16.0 million in additional revenue, which the City is providing annually to the Chicago Transit Authority to support critical track upgrades and safety modernizations. As part of the 2018 budget, the Amusement Tax was amended to close an existing loophole and better align the tax structure with the City’s cultural, theatrical, and musical performance goals. The City eliminated the 5.0 percent tax on live-cultural performances in venues of 1,500 or less and applied the existing 9.0 percent tax (previously only paid by movie theaters, sporting events and other non-live cultural events) to all events, including live cultural events in venues with a capacity of more than 1,500 people. This change is projected to generate approximately $15.8 million in 2018.
Non-tax revenues are expected to end the year within 1.0 percent of the 2018 budget. Decreases in other revenue sources are offset by increased fines, forfeitures, and penalty collections. Fines, forfeitures, and penalties are expected to end 2018 $16.0 million above the original budget of $326 million due to improved enforcement efforts .
2018 Year-End Expenditures
The 2018 Corporate Fund expenditures are currently expected to end the year slightly below budget at $3,778.0 million. These estimates are based on year-to-date spending, incorporating payroll trends, market pricing for commodities, and known changes or events that have or are anticipated to occur, during the remainder of 2018.
The year-end projections in 2018 reflect lower than expected expenses in certain personnel-related expenses. Salary and wages are relatively down due to normal position turnover. Healthcare costs are estimated to end 2018 slightly below budget due to realizing greater value in pharmaceutical rebates, continued trend of greater utilization of generic drugs and lower enrollment.
Additionally, the year-end expenditure projections reflect minor variations from the 2018 budget due to small adjustments in certain non-personnel expense categories, including lower than budgeted costs related to diesel, gasoline and other commodities. This is due to favorable diesel and gasoline prices and a milder winter. Claims, refunds, judgments and legal fees are expected to end the year above budget, but these costs are offset in part by expense reductions in other areas.
While Corporate Fund revenues and expenses are anticipated to end 2018 with a slight surplus, numerous factors can impact the City’s revenues and expenditures, and these estimates may change as the year progresses. Decisions are made throughout the course of the year in response to new or changing needs and citywide priorities, and the City will continue to closely monitor its revenues and expenses.
2019 CORPORATE FUND PROJECTIONS
The difference between revenues and expenditures anticipated by the City in its preliminary Corporate Fund budget estimates each year is the structural budget deficit, commonly referred to as the ‘gap’. Based on current revenue and expenditure projections of existing operations, the City estimates a 2019 Corporate Fund gap of $97.9 million.
The $97.9 million gap for 2019 is less than three percent of total projected Corporate Fund resources for 2019 and an 85.0 percent decrease from 2012 when the City first began publishing the AFA. In 2012, the projected structural budget deficit was nearly 25.0 percent of Corporate Fund revenue. Additionally, this gap is substantially smaller than what was projected for 2018 in both the 2016 and 2017 AFA. This decrease is a direct result of sustainable and balanced revenue growth coupled with lasting savings and reforms made in
Category 2018 YE Est 2019 ProjectedRevenue $3,798.2M $3,743.2MExpenditure $3,778.0M $3,841.1MBudget Surplus/(Deficit) $20.2M ($97.9M)
EXPENDITURES AND REVENUES

A n n u a l F i n a n c i a l A n a l y s i s 2 0 1 8
22
Financial Forecast
the past seven budgets. Savings and efficiencies resulting from strategic energy and utility purchasing, reduction of duplicative operations across departments, transition of garbage collection and other city services to a grid model, and healthcare cost savings have combined to reduce the City’s structural deficit year-over-year. The City achieved this progress while concurrently phasing out the use of one-time revenue sources, like selling city assets, that had been used to balance the budget in the past.
The following is a detailed outline of the City’s operating revenue and expenditure projections for 2019. These expenditure and revenue projections do not assume any substantive changes to City operations in 2019. No cost-saving initiatives are incorporated into these estimates as the 2019 projections reflect the structural gap in the City’s operating budget related to existing expenses and revenues. As in all previous years, revenue and expense initiatives are developed by the City and will be included in the 2019 budget recommendation submitted to the City Council in October.
2019 Projected Corporate Fund Revenues
Corporate Fund resources in 2019 are projected to decrease from 2018 year-end estimates by 1.4 percent or $55.0
million to $3,743.2 million. Local tax revenue is projected to increase 1.1 percent or $23.1 million over the 2018 year-end estimates; however, this increase is offset by decreased non-tax revenues.
Intergovernmental revenues are expected to grow 3.4 percent, or $13.4 million over the 2018 budgeted amounts. State income tax collections are projected to total $260.2 million, an increase of $7.7 million over the year-end projections. PPRT revenues in 2019 are projected to total $140.0 million an increase from the 2018 budget total of $134.2 million; however, this represents a $3.4 million decrease from the revised 2018 budget estimate of $143.4 million. This decrease is largely attributed to diversions of PPRT revenues by the State of Illinois to fund other state operations, such as community colleges.
Sales tax collections from the City’s portion of the state’s sales tax (“MROT”) and the City’s sales tax (“HROT”) are projected to grow 2.8 percent or $19.0 million over the 2018 year-end estimate; however, this increase is offset by the timing of increased STSC debt service payments. These increased debt service payments will result in a $10.6 million decrease in residual revenue transferred to the City from the STSC for a total transfer of $576.6 million.
2005
2006
2007
2008
2009
2010
2011
2012
2013
2014
2015
2016
2017
2018
2019
($97.9M)
($220.4M)
($94.1M)($64.5M)
($217.7M)
($420.0M)
($519.7M)
($654.7M)($635.7M)
($369.0M)($338.7M)
($297.3M)
($232.6M)
($114.2M)
($137.6M)
$0
Historical Gap Projected Gap - 2018 AFA
CORPORATE FUND PRELIMINARY GAP

A n n u a l F i n a n c i a l A n a l y s i s 2 0 1 8
23
Financial Forecast
Amusement Tax revenue is projected to increase approximately 2.0 percent or $3.5 million over the 2018 budgeted amount of $189.0 million. Business growth and compliance trends are expected to continue in 2019, and Personal Property Lease Tax collections are expected to total $274.2 million, a $5.4 million increase over the revised 2018 year-end estimate with business growth across various sectors. Revenue from Real Property Transfer tax is estimated to decrease by $1.7 million compared to 2017 actual revenues on the expectation of fewer large property transfers compared to prior years.
Ground Transportation Tax revenue for 2019 is expected to increase 14.3 percent, or $17.8 million over 2018 due to ongoing growth in ridership and the $0.05 increase per ride applied to Transportation Network Providers. This increase was adopted in November 2017 by the City Council as part of the 2018 budget.
Business tax revenue is projected to increase by $4.3 million
to $137.7 million in 2019 compared to year-end 2018 estimates of $133.4 million. This growth is from the Hotel Accommodations Tax. The City’s Hotel Accommodation Tax receipts continue to benefit from the increase in tourism and business travel in recent years which is also helping to increase the supply of rooms from both traditional hotels as well as vacation rentals or shared housing units. This expanding market is helping to increase the base of businesses that pay this tax.
The significant increases in tax revenue in 2019 compared to 2018 year-end estimates are offset by reductions in certain non-tax revenues. Non-tax revenue is expected to decrease by 6.3 percent compared to 2018 year-end estimates. Specifically, in 2019, the City is currently projecting less Tax Increment Financing (“TIF”) surplus in 2019 compared to 2018 levels, due to multiple capital projects currently underway that are funded by TIF. The City also expects to see a reduction in land sales as well as revenue available from the sweep of aging or inactive funds.
YE Est
2018
Projected
2019
Tax Revenue Business Taxes
Income Tax, PPRT & Other Intergovernmental
Recreation Taxes
Sales and Use Taxes
Transaction Taxes
Transportation Taxes
Utility Taxes and Fees
Total
Non-Tax Revenue Charges for Services
Fines, Forfeitures and Penalties
Leases, Rentals and Sales
Licenses, Permits and Certificates
Municipal Parking
Reimbursement, Interest & Other
Total
Proceeds and Transfers In Proceeds and Transfers In
Total
Appropriated Prior Year Fund Balance Appropriated Prior Year Fund Balance
Total
Grand Total
$2,037.5M
$432.7M
$310.8M
$441.2M
$49.6M
$267.9M
$401.9M
$133.4M
$2,060.6M
$430.0M
$328.1M
$440.4M
$48.1M
$270.1M
$406.2M
$137.7M
$1,111.0M
$470.9M
$7.6M
$133.0M
$35.5M
$342.0M
$122.0M
$1,041.0M
$395.6M
$7.6M
$135.4M
$34.3M
$345.0M
$123.1M
$612.7M
$612.7M
$604.6M
$604.6M
$37.0M
$37.0M
$37.0M
$37.0M
$3,798.2M $3,743.2M
-15.99% 8.00%% Change
REVENUE – CORPORATE FUND

A n n u a l F i n a n c i a l A n a l y s i s 2 0 1 8
24
Financial Forecast
2019 Projected Corporate Fund Expenditures
The 2019 expenditures are forecast to grow by approximately $49.9 million over the 2018 budget to $3,841.1 million. These projections are based on the 2018 budget and 2017 actuals, adjusted for anticipated growth trends and known changes to existing expenses such as normal increases in contractual services, commodities and materials costs, and salary increases resulting from contractual obligations under collective bargaining agreements.
Much of the projected expense increases for 2019 are personnel costs, primarily wages and other related expenses. The 2019 projection for these expenses assumes salary and wages will grow based on required contractual wage and prevailing rate increases for current CBAs as well as routine increase for time in service. Healthcare costs are expected to grow at a rate of 2.1 percent in 2019, which is well below national trends, due to employee contribution increases implemented as part of recent CBAs and healthcare initiatives designed to reduce growth in the costs of the City’s employee healthcare plan. The employer contributions for the Police, Fire, and Laborers’ Pension Funds increase in 2019, and these employer contributions will be funded as part of the regular budget process. The Municipal Employees’ Pension Funds employer contribution is fully funded with existing revenue sources, and is not contributing to the growth in the 2019 structural budget deficit.
Most non-personnel expenditures are expected to grow at a nominal rate, 2.0 percent or less, in 2019, while delegate agency and other program costs will decrease by $6.0 million. This is due to the elimination of the one-time grant to Chicago Public Schools to support security related expenses as Chicago Public Schools’ financial position has significantly improved in their most recent fiscal year. There is also a reduction in the transfers out expenditures due to the timing of certain payments.
As discussed at the start of this section and consistent with previous years, the 2019 structural budget deficit does not include any significant new investments to be added in the 2019 budget, such as public safety reform costs associated with the recently released draft consent decree for the Chicago Police Department. The final first year costs associated with consent decree are not yet available, but elements of reforms identified in the consent decree will be included in the 2019 budget. Additionally, the structural budget deficit does not include contractual wage and salary increases for CBAs currently under negotiation.
2020-2021 CORPORATE FUND OUTLOOKS
The following three scenarios project budget gaps for the years 2020 and 2021 for the City’s Corporate Fund based
YE Est
2018
Projected
2019
Expenditures Personnel Services
Benefits
Contractual Services
Commodities and Equipment
Claims, Refunds, Judgments, and Legal Fees
Delegate Agencies and Other Program Costs
Reimbursements and Financial Expenses
Miscellaneous
Transfers Out
Pension
Grand Total
$101.0M
$137.6M
$6.1M
$16.1M
$138.5M
$99.8M
$75.9M
$343.3M
$453.2M
$2,406.3M
$140.6M
$86.7M
$6.3M
$16.4M
$132.0M
$45.1M
$79.4M
$362.9M
$480.5M
$2,491.2M
$3,778.0M $3,841.1M
-30.00% 30.00%% Change
EXPENDITURES – CORPORATE FUND

A n n u a l F i n a n c i a l A n a l y s i s 2 0 1 8
25
on different revenue and expenditure outlooks. While the City shows growth in the gap for 2020 and 2021, these numbers assume that no substantive changes are made to City operations, revenue or the cost of City services as part of the 2019 budget and beyond.
Over the past seven budgets, savings initiatives and revenue growth have steadily decreased the Corporate Fund gap and the out-year projected budget gaps. For example, as part of the 2016 AFA, the City projected a $324.2 million base outlook structural budget gap for 2019, and this year, the 2019 projected gap is $97.9 million.
City services are delivered through its workforce with unionized employees comprising more than 90.0 percent of the total City workforce. Similar to previous years, the majority of the projected expense increases in 2019 are personnel-related. These personnel costs are the primary driver of Corporate Fund expenses in 2020 and 2021 as detailed in the gap projections for those years. The projected gap in each of one of the scenarios highlights the expenditure growth relative to revenue growth.
Under State law, beginning in budget year 2020, the Police and Fire pension contributions will be actuarially determined. While the 2020 and 2021 contributions will increase the structural budget deficit in those years, the final amounts are not yet available and are highly dependent on interest returns as well as other factors. The exact amount of the 2020 contribution will not be known until the pension funds make their 2020 funding requests in the summer of 2019. The City previously secured ongoing and sustainable funding sources to match these growing contributions, and the funding sources for these increased contributions will be determined through the annual budget process. Because these increases will be coupled with dedicated funding, the Police and Fire 2020 and 2021 contributions are presented separately from the structural budget deficits
discussed below which is consistent with past practice and the purpose of projecting a structural budget deficit. Further, the Laborers’ pension fund contributions will grow at less than $10 million in 2020 and 2021, which will be funded as part of the annual budget process with available Corporate Fund resources and are also presented separately from the structural budget deficit. Lastly, annual Municipal Employees’ pension contributions have a dedicated funding source through budget year 2022, and is, therefore, presented separately as well.
Base Outlook
The base outlook projects overall Corporate Fund revenue growth to be relatively flat compared to the prior year in both 2020 and 2021, resulting in total Corporate Fund revenues of $3,701.9 million and $3,707.9 million, respectively. As in past years, the City takes a conservative approach to these projections under the assumption that the economy will continue to experience modest growth going forward.
These projections are based on the continuation of similar revenue trends as discussed with respect to 2019, including a nearly 1.0 percent annual growth in recreation taxes in 2020 and 2021. Transaction taxes are expected to remain relatively flat, similar to 2018 levels. The City’s portion of the State’s Sales Tax (MROT) and State-collected portion of the City’s Sales Tax (HROT) are projected to grow in 2020 and 2021; however, this growth is offset by increased debt service payments through the Sales Tax Securitization Corporation. Non-tax revenue, such as TIF surplus and fund sweeps, are also expected to decrease relative to 2019 projections in 2020 and 2021 further decreasing available revenue in those years.
Corporate Fund expenditures are projected to outpace Corporate Fund revenue growth during this period, due largely to normal growth in wages and other personnel related costs. In 2020 and 2021, expenditures are projected
Financial Forecast
FY2012 FY2013 FY2014 FY2015 FY2016 FY2017 FY2018 FY2019 FY2020 FY20212011 AFA $(635.7M) $(741.4M) $(790.7M)2012 AFA $(369.0M) $(466.0M) $580.0M)2013 AFA $(338.7M) $(400.9M) $(528.6M)2014 AFA $(297.3M) $(430.2M) $(587.7M)2015 AFA $(232.6M) $(334.9M) ($(436.0M)2016 AFA $(137.6M) $(233.2M) $(324.2M)2017 AFA $(114.2M) $(212.7M) $(330.3M)2018 AFA $(97.9M) $(251.7M) $(362.2M)
HISTORIC PROJECTED GAPS
A n n u a l F i n a n c i a l A n a l y s i s 2 0 1 8
26
Financial Forecast
to increase by approximately 3.0 percent annually over 2019 costs. In 2020, the projected expenditures reach $3,953.5 million, and in 2020, expenditures are projected to increase to $4,070.1 million.
Under the base outlook, most non-personnel categories of expenditures, including motor fuel and other miscellaneous expenses are assumed to grow at historical average rates. Salary and wages and healthcare expenditures – the largest portion of the City’s operating expenses – are projected based on the assumption that the number of full-time equivalent positions will remain stable and that the costs associated with these positions will experience growth in line with long-term, historical trends.
Under the base outlook and assuming that no substantive changes are made to City operations, revenue or the cost of City services, the City would experience a structural budget deficit of $251.65 million and $362.2 million in 2020 and 2021, respectively.
Negative Outlook
The negative outlook presents a picture of City finances under stagnant to declining economic conditions in which revenues do not grow and actually decrease in some cases with expenditures growing at a significantly higher rate. Total Corporate Fund revenues in 2020 under this scenario are projected to be $3,569.2 million and $3,563.0 million in 2021.
Slow economic growth coupled with cautious consumer sentiment would limit spending on retail goods, entertainment, and tourism impacting most economically sensitive revenues from amusement taxes to transaction taxes. Economic factors, such as rising unemployment and contractions in the real estate market as well as across various business sectors would impact transaction tax revenue as well.
Assuming a similarly negative outlook for expenditures, in
which City spending increases more rapidly over the next three years, Corporate Fund operating expenditures are driving the large operating shortfall. Costs in 2020 and 2021 would significantly outpace revenues, growing at an average annual rate of roughly 8.0 percent to $4,216.5 million in 2020 and $4,422.8 million in 2021. Most categories of expenditures are assumed to grow at the rates seen during their fastest period of historical growth in the past decade.Under the negative outlook, the City’s operating budget shortfall would grow to $647.4 million in 2020 and $859.8 million in 2021.
Positive Outlook
The positive outlook assumes that the economy will grow at a slightly faster rate over the next three years resulting in modest revenue growth in corresponding revenues and slower average annual growth rate in expenses.
The positive outlook projects a smaller Corporate Fund revenue reduction in 2020 and stronger growth in 2021, resulting in total Corporate Fund revenues of $3,779.8 million in 2020 and $3,797.2 million in 2021. Under these projections, there is greater growth in 2019 where more moderate to flat growth was predicted under the base outlook. Transaction Taxes and Sales Tax revenues grow in this scenario as the economy continues to expand, tourism increases, and consumer confidence and spending also increase. In addition, wages grow, and Income Tax revenues increase. As a result, Transaction Taxes would grow at a rate of nearly 6.0 percent annually, while Income Tax is projected to grow by approximately 4.2 percent in 2020 and another 2.3 percent in 2021.
Under this positive outlook, the City can limit its future average annual growth rate, keeping expenditures lower than the base outlook. Total Corporate Fund expenditures grow to $3,887.7 million in 2020 and $3,967.2 million in 2021. Under this scenario, wage and salary costs experience a lower rate of growth, and healthcare costs grow at a lower rate than
Scenario 2020 2021Positive Outlook $(107.9M) $(170.0M)Base Outlook $(251.7M) $(362.2M)Negative Outlook $(647.4M) $(859.8M)
2020-2021 PROPOSED BUDGET SUMMARY

A n n u a l F i n a n c i a l A n a l y s i s 2 0 1 8
27
in the base outlook. Spending on contractual services and commodities and materials grows slightly over current levels and favorable pricing is assumed for motor fuel and utilities, allowing the City to take further advantage of lower fuel prices through hedging.
Under a positive outlook with the ability to control expenditures coupled with moderate revenue growth, the budget deficit in 2020 is projected to be $107.9 million and $170.0 million in 2021.
OUTLOOK FOR SPECIAL REVENUE FUNDS
Vehicle Tax Fund
The City anticipates revenue from the sale of vehicle stickers and other revenues in the Vehicle Tax Fund will finish 2018 at $207.9 million, or 1.4 percent above budgeted expectations. The year-end revenue estimate for vehicle stickers is $130.2 million, which is $2.5 million above budgeted expectations.
Projected fund revenue for 2019 through 2021 is expected to remain relatively flat. Beginning in 2016, mandated increases in vehicle sticker tax rates based on Consumer Price Index (“CPI”) changes went into effect. Rates increased 0.84 percent over prior rates in July 2016 and rates increased by 1.3 percent effective July 1, 2018. Despite the CPI adjustment, vehicle sticker revenue is estimated to remain flat as revenue from penalties has declined as residents have become accustomed to the process of year-round sales as well as the option of a 24-month vehicle sticker.
Other revenues to this fund, including impoundment fees, pavement cut fees, and reimbursements, are expected to remain approximately even with 2018 year-end revenue levels through 2021.
Motor Fuel Tax Fund
Revenues in the Motor Fuel Tax Fund are projected to end 2018 near budgeted levels at $57.1 million. Overall, revenues are expected to remain relatively flat over the next few years.
Financial Forecast
2018 YE Est 2019 2020 2021
$44.
3M
$72.
9M
$145
.6M
$207
.9M
$45.
6M
$73.
6M
$147
.1M
$204
.4M
$46.
1M
$74.
0M
$143
.7M
$206
.4M
$46.
6M
$74.
3M
$140
.3M
$205
.7M
Special Events and Municipal Hotel Operators' Occupation Tax FundMotor Fuel Tax FundEmergency Communications FundVehicle Tax Fund
PROJECTED REVENUE – SPECIAL REVENUE FUNDS

A n n u a l F i n a n c i a l A n a l y s i s 2 0 1 8
28
The chart “Projected Revenue - Special Revenue Funds,” reflects projected revenues in the Motor Fuel Tax Fund, which includes the City’s distributive share of Motor Fuel Tax revenues from the State of Illinois and other revenues related to the Chicago Riverwalk. Revenue from Chicago Riverwalk concessions and tour boat operations as well as Motor Fuel Tax revenues have been pledged to pay debt service on both outstanding Motor Fuel Tax bonds and a loan issued by the U.S. Department of Transportation under the Transportation Infrastructure Finance Innovation Act (“TIFIA”). The City used proceeds from the TIFIA loan to fund expansion of the Chicago Riverwalk.
Special Events and Municipal Hotel Operators’ Oc-cupation Tax Fund
Further growth in business travel and tourism to Chicago will help Hotel Tax revenue and festival-related revenues grow modestly in 2018 and beyond. The year-end estimate for 2018 for Hotel Tax revenue is $24.7 million while the City’s special events and festivals are expected to generate $11.8 million.
The outlook for growth in tourism, convention, and business travel over the three-year forecast period remains positive. The City anticipates growth in both occupancy and room rates over the forecast period which should contribute to steady growth in Hotel Tax revenue through 2021, while event fees are expected to remain constant over the same period.
Emergency Communications Fund
In 2018, the City began to make strategic investments in citywide safety through the Office of Emergency Management and Communications (“OEMC”) by replacing the City’s twenty-year-old 911 system, which includes the City’s Computer Automated Dispatch (“CAD”) system. The new system will upgrade and modernize the technology base of the City’s 911 system through dynamic improvements to the operating technology and outreach systems between callers, operators, and first responders. These upgrades will also help to ensure the City is compliant with the State of Illinois Next Generation 9-1-1 network which is required to be implemented by 2020. To cover the cost of these upgrades, a portion of funds generated from the 911 Surcharge is being used to pay for the new 911 system modernization.
The City’s current 911 monthly surcharge of $5.00 for wireless and landline connections allows the City to fully fund the City’s 911 operations using surcharge funds as well as invest in a new 911 system. The year-end estimate for the 2018 Emergency Communications Fund is $124.0 million, 2.1 percent above budgeted expectations. Revenues are expected to decrease slightly through 2021 tracking with long-term trends in the reducing number of lines used by businesses and consumers.
OUTLOOK FOR ENTERPRISE FUNDS
Water and Sewer Funds
Revenues to the Water and Sewer Funds are expected to slightly decrease over the next three years, primarily due to the continued conversion of non-metered accounts to metered accounts. These three-year projections also account for collection loss and current trends in water usage.
The year-end estimate for 2018 Water Fund revenue is $764.0 million and $359.8 million for Sewer Fund revenue. Over the next three years, the Water and Sewer Funds are estimated to decrease by approximately 0.5 percent annually reflecting current trends in conservation efforts and meter installations.
Aviation Funds
Estimates for the O’Hare and Midway International Airport Funds anticipate that revenue is set at a level necessary to pay debt service and support the operations of the airports. The year-end estimate for 2018 for Midway Fund revenue is $276.0 million and $1,228.3 million for O’Hare Fund revenue.
In 2019, revenue will increase from 2018 levels by approximately 5.1 percent for O’Hare Airport and 8.0 percent for Midway Airport. The City projects continued growth in 2020 and 2021 as the airports move forward with large scale capital projects and other improvements necessary to accommodate increased tourism and business travel.
Financial Forecast

A n n u a l F i n a n c i a l A n a l y s i s 2 0 1 8
29
Financial Forecast
2018 YE Est 2019 2020 2021$3
59.8
M
$764
.0M
$357
.5M
$759
.8M
$355
.2M
$755
.7M
$352
.9M
$751
.6M
Sewer Fund Water Fund
PROJECTED WATER FUND AND SEWER FUND REVENUES
PROJECTED AVIATION FUND REVENUES
2018 YE Est 2019 2020 2021
$276
.0M
$1,2
28.3
M
$298
.2M
$1,2
90.9
M
$306
.9M
$1,3
28.7
M
$316
.0M
$1,3
67.9
M
Midway Airport Fund O'Hare Airport Fund


Historic Revenue and Expense Review
Annual Financial Analysis2018


A n n u a l F i n a n c i a l A n a l y s i s 2 0 1 8
33
Historic Revenue and Expense Review
CORPORATE FUND
The Corporate Fund is the City’s general operating fund and supports many essential City services and activities, such as police and fire protection, tree trimming, and public health programs.
The goal of this section is to discuss the factors that impact revenues and expenditures, as well as to provide insight on how those factors are reflected in the Corporate Fund. This section focuses on revenues and expenditures that represent more than $5 million of the Corporate Fund. While a narrative is not provided for revenues or expenditures that do not represent a significant portion of the Corporate Fund and have not experienced notable change over time, all Corporate Fund revenue and expenditure data is included in the appendices.
Review of Corporate Fund Resources
This section provides a ten-year trend analysis of the revenues and collections in the City’s Corporate Fund. The revenue information contained here is based primarily on the City’s Comprehensive Annual Financial Report (“CAFR”). The
revenue information presented herein may vary slightly from that printed in the City’s CAFR due to rounding.
Corporate Fund revenues are reported as a major governmental fund within the general fund in the City’s basic financial statements. The Corporate Fund is the City’s primary operating fund. The general fund, and not the Corporate Fund, is included in the City’s CAFR.
Corporate Fund revenues are derived from the following sources:
• Local tax revenue, which consists of taxes collected by the City, including utility, transportation, transaction, recreation, and business taxes.
• Intergovernmental tax revenue, which consists of the City’s share of State Income Tax, Personal Property Replacement Tax and Municipal Auto Rental Tax.
• Local non-tax revenue, which consists of charges for licenses, permits and services; fees and fines; the proceeds from land and material sales and leases; and transfers to the Corporate Fund from the City’s special revenue and enterprise funds for services provided.
CORPORATE FUND RESOURCES
2008
2009
2010
2011
2012
2013
2014
2015
2016
2017
$3,1
35.0
M
$3,0
37.7
M
$3,1
29.9
M
$3,2
48.9
M
$3,0
79.6
M
$3,1
28.8
M
$3,2
61.3
M
$3,5
20.5
M
$3,6
36.2
M
$3,6
75.7
M
Local Tax RevenueLocal Non-Tax RevenueIntergovernmental Tax Revenue
Proceeds and TransfersPrior Year Available Resources

A n n u a l F i n a n c i a l A n a l y s i s 2 0 1 8
34
Historic Revenue and Expense Review
• Proceeds and transfers consist of amounts transferred into the Corporate Fund from outside sources, including residual sales tax revenues received from the Sales Tax Securitization Corporation (“STSC”), proceeds from financing transactions, and transfers from the City’s asset lease reserve funds.
• Prior year available resources consist of available Corporate Fund balances from prior years as a result of savings, sustainable revenue growth, spending controls and other efficiencies.
Local Tax Revenue
Local taxes include taxes on the purchase of utility services, real estate and other transactions, fuel and garage parking, and certain recreation and business activities.
Municipal Public Utility Taxes and Fees
Municipal public utility taxes consist of taxes on the purchase of telecommunications services, electricity, natural gas, and cable television. Numerous factors impact utility
tax revenues including weather, natural gas prices, rate changes, and evolving technologies that affect energy use and customer behavior.
In 2008, utility taxes comprised 16.7 percent of Corporate Fund resources or $524.8 million. In 2017, this was reduced to 11.9 percent of Corporate Fund resources or $439.0 million due to billing rates, conservation efforts, weather, and technological changes that impact usage and thus the revenue generated from these taxes.
Natural Gas Use and Occupation Taxes: The City imposes two natural gas-related taxes: (1) the Natural Gas Occupation Tax, an 8.0 percent tax imposed on gross receipts for gas and delivery charges; and (2) the Natural Gas Use Tax, a 6.3 cents per therm charge on entities not subject to the natural gas occupation tax. Natural gas tax collections are highly dependent on weather conditions and price. Colder weather generally results in increased consumption and associated tax revenues, as natural gas is used to heat homes and buildings. In 2008, natural gas-related taxes generated $153.2 million, accounting for 4.9 percent of
2008
2009
2010
2011
2012
2013
2014
2015
2016
2017
$524
.8M
$481
.3M
$467
.4M
$467
.6M
$462
.5M
$456
.9M
$473
.5M
$437
.8M
$434
.4M
$439
.0M
Telecommunication TaxNatural Gas Use and Occupation Taxes
Electricity TaxesCable Television Franchise Fee
MUNICIPAL PUBLIC UTILITY TAXES AND FEES

A n n u a l F i n a n c i a l A n a l y s i s 2 0 1 8
35
total Corporate Fund resources. It has since been reduced to $124.7 million in 2017, accounting for 3.4 percent of total Corporate Fund resources, due to the annual variances of price and weather.
Electricity Taxes (Electricity Infrastructure Maintenance Fee and Electricity Use Tax): The Electricity Infrastructure Maintenance Fee is imposed on electricity deliverers as compensation for using the public right-of-way in the City of Chicago. The rate is based on kilowatt hours used or consumed each month, and ranges from $0.0026 per kilowatt-hour to $0.0053 per kilowatt-hour. The Electricity Use Tax is a tax imposed on the privilege of using or consuming electricity purchased at retail and used or consumed within the City of Chicago. The tax rate varies based on the number of kilowatt-hours used or consumed. The tax ranges from $0.30 per kilowatt-hour to $0.61 per kilowatt-hour.
Revenues from electricity taxes are dependent on both consumption and weather conditions. Warmer summer temperatures generally result in increased consumption and associated tax revenues as higher amounts of electricity are needed to cool homes and buildings. Electricity rates, conservation efforts, and technological changes that contribute to energy efficiency may affect the amount of electricity used and thus the revenues derived from these taxes. In 2008, electricity-related taxes generated $191.6 million, accounting for 6.1 percent of total Corporate Fund resources, and $183.7 million in 2017, accounting for 5.0 percent of total Corporate Fund resources.
Telecommunication Tax: Revenue from the Telecommunication Tax is derived from charges for telephone services in the city and reflects trends in the industry and consumer preferences. The Telecommunication Tax applies to telecommunication retailers for all gross charges, at a rate of 7.0 percent of receipts or charges. In 2008, telecommunications tax revenue was $159.0 million and made up 5.1 percent of Corporate Fund resources. In 2017, Telecommunications Tax revenue decreased to $101.9 million, accounting for 2.8 percent of total Corporate Fund resources. The overall decline in revenues was due in part to the continuing reduction in the use of landline phones as more customers rely solely on wireless services. In addition, federal law exempts most wireless data services, such as mobile broadband, from taxation. Consequently, growth
in the market for such wireless services has not resulted in increased Telecommunication Tax revenue for the City.
Cable Television Franchise Fee: The Cable Television Franchise Fee is a fee imposed on the privilege of operating cable television systems within the City of Chicago. The fee is 5.0 percent on annual gross revenues. In 2008, Cable Television Franchise Fee revenue was $21.0 million and made up 0.67 percent of Corporate Fund resources. In 2017, fee revenue increased to $28.7 million, accounting for 0.78 percent of total Corporate Fund resources. The phase-out of the partial tax exemption that cable television companies previously received was eliminated in 2014, and has resulted in increases in Cable Television Franchise Fee revenue each year.
Transportation Taxes
Transportation taxes consist of taxes on vehicle fuel, garage parking, and hired ground transportation.
In 2008, transportation taxes comprised 4.7 percent of Corporate Fund resources or $148.7 million. In 2017, that grew to 7.5 percent of Corporate Fund resources or $275.0 million due to the licensing of the rideshare industry in the City and subsequent growth of this emerging industry.
Parking Garage Tax: The City’s Parking Garage Tax is imposed on parking garage operators and is consistently the largest portion of this category of revenues. Rate adjustments over the past ten years have increased revenue from this tax. In 2013, the City changed this tax from a tiered flat-rate structure to a percentage-based structure. This change reduced the effective tax rate for economy parking while increasing the effective rate for premium garages and valet services. Prior to the State law change allowing for the percentage based structure, the City adjusted the flat-rate charges in 2009 and 2012. The City further increased parking garage taxes by 2.0 percent in 2015. The current Parking Garage Tax rate is 22.0 percent on total charges for daily parking Monday through Friday, weekly, and monthly parking, and 20.0 percent on total charges for daily parking on the weekends. In 2016, the City made additional adjustments to the parking garage tax to clarify its application for companies that aggregate and sell spaces across the City, including those selling spaces through mobile applications.
In 2008, Parking Garage Tax revenue was $85.3 million
Historic Revenue and Expense Review

A n n u a l F i n a n c i a l A n a l y s i s 2 0 1 8
36
and made up 2.7 percent of Corporate Fund resources. In 2017, Parking Garage Tax revenue increased to $135.4 million, accounting for 3.7 percent of total Corporate Fund resources, reflecting the revenue growth due to rate increases.
Vehicle Fuel Tax: The Vehicle Fuel Tax is a $0.05 per gallon tax on the sale of vehicle fuel to a retailer doing business in the City, or an entity who purchases fuel for use in the City. In 2008, Vehicle Fuel Tax revenue was $54.9 million and made up 1.8 percent of Corporate Fund resources. In 2017, Vehicle Fuel Tax revenue decreased to $54.2 million, accounting for 1.5 percent of total Corporate Fund resources. Historically, Vehicle Fuel Tax revenue has been on the decline due to higher fuel prices impacting consumer spending.
Ground Transportation Tax: In 2008, Ground Trans-portation Tax comprised 0.27 percent of Corporate Fund resources or $8.6 million. In 2017, it accounted for 2.3 percent of the Corporate Fund budget, or $85.4 million, due to licensing of the rideshare industry in the City and subsequent growth of this emerging industry. Prior to 2014, Ground Transportation Tax was collected
primarily from taxi medallion holders and livery providers. Beginning in 2014, Ground Transportation Tax revenue included collection from rideshare operations for the first time as the industry entered the Chicago market. In late 2015, Ground Transportation Tax revenue increased due largely to a tax surcharge imposed on rideshare pick-ups and drop-offs at the City’s airports, Navy Pier and McCormick Place.
Revenue growth in 2016 resulted from a number of revisions to the Ground Transportation Tax and other fees that impact both the taxi industry and the rideshare industry which were implemented in the same year.
Changes for the rideshare industry in late 2015 and 2016 included:
• A $5.00 per trip surcharge on all rideshare pick-ups and drop-offs at both airports, Navy Pier, and McCormick Place. This per trip surcharge went into effect in November 2015. Prior to November 2015, rideshare companies were not authorized to pick up at Chicago airports, though they were authorized to pick up at Navy Pier and McCormick Place with no surcharge.
Historic Revenue and Expense Review
2008
2009
2010
2011
2012
2013
2014
2015
2016
2017
$148
.7M
$155
.9M
$150
.7M
$151
.9M $1
77.9
M
$182
.5M
$185
.1M
$197
.9M
$247
.1M $2
75.0
M
Vehicle Fuel Tax Parking Garage Tax Ground Transportation Tax ("GTT")
The revenue collected for the Accessibility Fund is not reflected in these GTT revenue numbers. TNPs began collecting and paying GTT in 2014.
TRANSPORTATION TAXES

A n n u a l F i n a n c i a l A n a l y s i s 2 0 1 8
37
• A $0.40 per trip ground transportation tax for trips that begin or end in Chicago. Prior to January 2016, this tax rate was $0.20 per trip.
• A $0.10 per trip Accessibility Fund payment for trips that begin or end in Chicago. There is no change from previous years.
Changes for the taxi industry in 2016 included:
• A $20 increase to $98 per month ground transportation tax on medallion licensees.
• A $22 per month Accessibility Fund payment on medallion licensees.
Tax rate changes for 2018 are discussed in the forecast section of this document. Please note the revenue collected for the Accessibility Fund Fee is not included in the chart as that revenue is recorded in a separate fund and is used solely to support the expansion of wheelchair-accessible vehicles. In 2017, the Accessibility Fund Fees collected were $9.4 million. Transaction Taxes
Transaction taxes consist of taxes on the transfer of real
estate, the lease or rental of personal property, and the short-term lease of motor vehicles within the City. Fluctuations in these revenue sources track closely with the real estate market and the economy. In 2008, transaction taxes comprised 7.8 percent of the Corporate Fund resources or $245.1 million. In 2017, this grew to 11.8 percent of Corporate Fund resources or $434.2 million due to growth in Lease Transaction Tax and Real Property Transfer Tax revenue.
Real Property Transfer Tax: Real Property Transfer Tax is imposed upon the privilege of transferring title to, or beneficial interest in, real property located in the City, whether or not the agreement or contract providing for the transfer is entered into within the City. The City portion of the transfer tax is $3.75 per $500.00 of the transfer price rate of the real property or the beneficial interest in real property to be paid by the buyer.
In 2009, collections of Real Property Transfer Tax declined approximately 48.2 percent from 2008 to $61.9 million as a result of the Great Recession. While commercial real estate activity increased in 2010 and continued to improve in 2011, the residential real estate market did not show sustained growth until 2012. By 2013, home sales increased
Historic Revenue and Expense Review
2008
2009
2010
2011
2012
2013
2014
2015
2016
2017
$245
.1M
$179
.6M
$195
.1M
$215
.3M
$241
.1M $2
88.4
M
$316
.2M
$390
.3M
$463
.6M
$434
.2M
Personal Property Lease Transaction TaxReal Property Transfer Tax
Motor Vehicle Lessor Tax
TRANSACTION TAXES

A n n u a l F i n a n c i a l A n a l y s i s 2 0 1 8
38
19.0 percent and median home prices increased by 10.0 percent from 2012, bringing overall Real Property Transfer Tax revenues to $141.9 million. During 2014, median home prices increased by 11.0 percent from the previous year, while home sales decreased by 7.0 percent due largely to inventory shortages. Due to the increase in office tower sales, 2014 revenues increased to $157.2 million, of which, $6.0 million was generated from a single transaction – 300 N. LaSalle. The recovering housing market, in combination with continued strong commercial real estate activity, drove real property transfer tax revenues up to $191.1 million in 2015, boosted by the sale of Willis Tower, and $197.1 million in 2016, which was impacted by the transfer of the Skyway and Millennium Park garages. In 2017, Real Property Transfer Tax revenues were $161.7 million, or 4.4 percent of total Corporate Fund resources.
Personal Property Lease Transaction Tax: As with other transaction and consumer-driven tax revenues, Personal Property Lease Transaction Tax revenue was impacted by the recession’s effect on personal and business consumption. In recent years, revenues have increased with consumer confidence and continued economic growth. Lease Tax revenues reached $192.5 million in 2015 following an increase in the tax rate from 8.0 percent to 9.0 percent. Lease Tax revenues were $265.7 million, or 7.2 percent of Corporate Fund resources, in 2017.
Historically, the City assessed a tax on companies for leasing software and computers that perform various business functions. Over time, companies have accessed certain services through cloud applications and technology. To reflect these changing behaviors, in 2016 the City restructured the tax covering leased software and computers. Specifically, the City reduced the rate on non-possessory leases of certain cloud products to 5.25 percent effective January 1, 2016. This reduction applies to instances where the customer is using such products to work with its own data. The City maintained the 9.0 percent tax rate for traditional database services used for financial and legal research. As part of this change, the City exempted small companies from paying or collecting the lease tax for up to five years after start-up.
For reasons stated at the beginning of the Corporate Fund section, Motor Vehicle Lessor Tax figures appear in the appendices of this document and are not discussed here.
Recreation Taxes
Recreation taxes include taxes on amusement activities and devices, the mooring of boats, liquor, cigarettes, non-alcoholic beverages, and off-track betting. Driven by growth in Amusement Tax revenue, recreation taxes have increased from $148.0 million in 2008 to $253.1 million in 2017. The percentage of Corporate Fund resources derived from recreation taxes have increased from 4.7 percent in 2008 to 6.9 percent in 2017.
Amusement Tax: The Amusement Tax applies to most large sporting events, theater and musical performances in the City. Amusement Tax revenues vary significantly from year-to-year due to a variety of factors, including tourism and the cost of attending live performances and sporting events. The Amusement Tax rate changed to a single rate as part of the 2018 budget as discussed in the financial forecast section, but prior to the change, the City had a bifurcated tax rate. A 5.0 percent tax was applied to charges to view live theatrical, live musical, or other live cultural performances that take place in a venue with a capacity of more than 750 people; there was no Amusement Tax for live theatrical, live musical or other live cultural performances in venues with a capacity of 750 people or fewer. For all other types of amusement activities, the tax rate was 9.0 percent. The rate was increased by 1.0 percent in 2009.
Amusement Tax revenue is impacted by ticket prices to professional sporting events as well as any post-season play; the popularity of certain shows and theater performances opening in Chicago; economic factors; rate changes; and elimination of certain special exemptions. The phase-out of the partial tax exemption cable television companies received was completed in 2014, and 2015 was the first year that special seating areas, such as skyboxes, were taxed at the full rate. In 2008, Amusement Tax comprised 2.2 percent of Corporate Fund resources or $69.0 million. In 2017, this has grown to 4.7 percent of Corporate Fund resources or $172.6 million due to rate changes and the elimination of exemptions. Cigarette Tax: Cigarette Tax revenues declined from 2008 to 2013, consistent with an overall decline in smoking and a decrease in cigarette purchases in Chicago as the federal, State and Cook County governments increased their tax rates in 2009, 2012 and 2013, respectively. Revenue increased in 2014 due to a City tax increase to one of the highest rates in
Historic Revenue and Expense Review

A n n u a l F i n a n c i a l A n a l y s i s 2 0 1 8
39
the nation, a tax of $1.18 per pack of twenty cigarettes. The ongoing decline of purchases in Chicago was offset by the increased rate and a new tax on e-cigarettes. In 2016, the City started taxing liquid nicotine or “e-cigarettes.” The tax has two parts: a $0.55 per milliliter of e-liquid and a $0.80 per container of e-liquid. A container includes single-use e-cigarettes, replacement cartridges, and bottles of e-liquid. Cigarette Tax revenues were $21.3 million, or 0.58 percent of Corporate Fund resources in 2017.
Liquor Tax: Similar to Cigarette Tax revenue, Liquor Tax revenues are also impacted by changes in usage, but unlike the Cigarette Tax, revenues are not as impacted by the price sensitivity of purchasers after rate increases. This is due to the variety of price and alcohol options available relative to cigarettes. Liquor Tax revenues reached $32.6 million, or 0.89 percent of Corporate Fund resources in 2017, basically flat from $32.0 million in 2008.
Non-Alcoholic Beverage Tax: Revenue from taxes on the purchase of non-alcoholic beverages includes a tax on bottled water, prepackaged soft-drinks, and fountain syrup. Non-
Alcoholic Beverage Tax revenues reached $24.3 million, or 0.66 percent of Corporate Fund resources in 2017, an increase from $18.8 million in 2008.
For reasons stated at the beginning of the Corporate Fund section, automatic amusement, boat mooring and off-track betting tax figures appear in the appendices of this document and are not discussed here.
Business Taxes
The City’s business tax revenues currently consist of revenue from a tax on hotel accommodations, Foreign Fire Insurance tax, and the Checkout Bag Tax. Through 2013, the City also received revenue from the Employers’ Expense Tax.
Business tax revenue is primarily driven by revenue from the City’s Hotel Accommodations Tax. In 2008, business taxes comprised 2.9 percent of Corporate Fund resources or $92.3 million. In 2017, this grew to 3.9 percent of Corporate Fund resources or $142.9 million, impacted by both the phasing out of the Employers’ Expense Tax and the increase in the Hotel Accommodations Tax rate.
Historic Revenue and Expense Review
2008
2009
2010
2011
2012
2013
2014
2015
2016
2017
$148
.0M
$154
.0M
$158
.4M
$159
.4M
$163
.2M
$169
.1M $1
93.7
M
$227
.5M
$246
.6M
$253
.1M
Amusement TaxLiquor TaxCigarette Tax
Non-Alcoholic Beverage TaxOff Track Betting TaxBoat Mooring Tax
Automatic Amusement Tax
RECREATION TAXES

A n n u a l F i n a n c i a l A n a l y s i s 2 0 1 8
40
Hotel Accommodations Tax: The City’s hotel tax receipts have historically benefited from growth in tourism and business travel, as well as changes to the tax rate and the implementation of a surcharge on vacation rentals and shared housing units. The recession significantly decreased hotel tax revenue as revenue per available room (“RevPAR”) – a key metric that accounts for both occupancy and room price – dropped precipitously to $109 in 2009 from $144 in 2008.
Since 2012, the City has made a number of adjustments to the hotel tax rate and its application to new industries to significantly grow tax revenue. The City increased the Hotel Accommodations Tax rate in 2012 from 3.5 percent to 4.5 percent, increasing tax revenue from $60.1 million in 2011 to $85.6 million in 2012. In February 2015, the City began requiring website booking facilitators, also called home sharing facilitators, to collect the Hotel Accommodations Tax on transactions facilitated by their websites. Additionally, starting in July 2016, the City implemented a 4.0 percent surcharge on rental of licensed vacation rentals and home sharing units.
Despite a dip in RevPAR from $158 in 2015 to $156 in 2016, the first decline since the recession, Hotel Accommodation Tax revenue reached $131.6 million, 3.6 percent of Corporate Fund resources in 2017. This is due to the resolution of a decade-long litigation related to payment of the City’s hotel tax by internet hotel booking websites. In May 2017, the City received a net settlement payment of over $12 million, which contributed to the increase from $64.3 million in 2008. Checkout Bag Tax: As part of the 2017 budget, the City passed a $0.07 per bag tax on all disposable bags used in Chicago with $0.05 per bag paid to the City and $0.02 remaining with the retailer. In 2017, Checkout Bag Tax revenue was $5.6 million, or 0.15 percent of Corporate Fund resources.
Foreign Fire Insurance Tax: Foreign Fire Insurance Tax is imposed on any business not incorporated in the State of Illinois that is engaged in selling fire insurance in the City of Chicago. Revenue from the tax is used to support the operations of the Chicago Fire Department. The tax rate
Historic Revenue and Expense Review
2008
2009
2010
2011
2012
2013
2014
2015
2016
2017
$92.
3M
$79.
6M
$83.
0M
$88.
2M
$108
.3M
$105
.7M
$104
.8M
$115
.8M
$118
.9M
$142
.9M
Hotel Accommodations TaxEmployers' Expense Tax
Foreign Fire Insurance TaxCheckout Bag Tax
BUSINESS TAXES

A n n u a l F i n a n c i a l A n a l y s i s 2 0 1 8
41
is 2.0 percent of the gross receipts received for premiums. In 2017, Foreign Fire Insurance Tax revenue reached $5.6 million, or .015 percent of Corporate Fund resources, an increase from $4.1 million in 2008.
Employers’ Expense Tax: Prior to 2012, the Employers’ Expense Tax, otherwise known as the “head tax”, was applied to businesses with more than 50 employees at a rate of $4 per employee per month. The rate was reduced in 2012 and eliminated by 2014.
Sales Tax
Sales and use tax revenues (“Sales Tax”) have been the largest single revenue source in the City’s Corporate Fund. As further described below, in December 2017, the City sold to the STSC the City’s rights to receive Sales Tax revenues collected by the State. Prior to the sale, Sales Tax consisted of revenue from two sources: The Home Rule Occupation Tax (“HROT”) and the Illinois Municipal Retailers’ Occupation and Use Tax (“MROT”) and HROT was recorded as local tax revenue and MROT as intergovernmental revenue. Currently residual revenue received from the STSC is recorded in proceeds and transfers in. Certain Sales Taxes imposed by the City and collected by the City were not sold to the STSC and therefore do not flow to the STSC. The City-collected Sales Taxes consist of the use tax on non-titled personal property and the use tax on titled personal property on sales outside of the six-county area. These revenues are included as local tax revenues. The tax rate charged on an item purchased in Chicago varies by the type of product and transaction. Occupation taxes are assessed to the retailer and collected from the purchaser at the point of sale, while use taxes are imposed on the consumer for the privilege of using certain types of personal property within the City. The City of Chicago receives tax revenue through the Chicago HROT and the MROT. The City imposes the HROT at a rate of 1.25 percent on the retail sale of general merchandise, excluding most sales of food and medicine. The HROT also applies to tangible personal property purchased for use in the City from a vendor located outside the City at a rate of 1.25 percent for titled personal property and 1.0 percent for non-titled personal property. The MROT is imposed by the State and 1.0 percent is shared with municipalities.
Unlike the HROT, the MROT applies to qualifying food and drug purchases. Additionally, in many instances, when consumers purchase an item online, the MROT rate applies, but the HROT rate is not always applied. Sales tax revenue has increased significantly since the recession, but in recent years, the HROT revenue has softened. HROT revenue for 2017 decreased to $229.9 million compared to $308.1 million in 2016, while MROT distributions from the State also decreased from $366.4 million in 2016 to $270.5 million in 2017. Part of the decrease in 2017 HROT revenue is due to a 2.0 percent administrative charge that was applied to local sales tax collections administered by the State of Illinois.
As of fourth quarter 2017, the City-collected Sales Taxes, which consist of the use tax on non-titled personal property authorized by the Home Rule Municipal Use Tax Act of the State and the use tax on titled personal property on sales outside the six-county area authorized by the Home Rule Municipal Use Tax Act of the State, as well as Restaurant Tax and Private Vehicle Use Tax, are included as local tax revenues. Please see the discussion on the Sales Tax Securitization Corporation Residual Revenues in the Proceeds and Transfers In section of this document for information on the changes to MROT.
Intergovernmental Tax Revenue
Intergovernmental tax revenue consists of the City’s share of Illinois state sales and use taxes, income tax, and Personal Property Replacement Tax. In total, intergovernmental taxes comprised 21.0 percent or $659.3 million of Corporate Fund resources in 2008, and 18.1 percent of Corporate Fund resources or $665.4 million in 2017.
State Income Tax: State Income Tax revenues are impacted by a combination of factors, including employment levels, wage growth, business profits, federal rules, investment returns, and the timing of State distributions. The City’s share of State Income Tax revenues vary with changes in the State’s Personal and Corporate Income Tax rates and/or changes to the percentage of total Income Tax receipts paid into the Local Government Distributive Fund (“LGDF”). The LGDF is the fund from which all municipalities in Illinois are paid their share of State Income Tax revenue.
The City’s Income Tax revenues can also vary with changes
Historic Revenue and Expense Review

A n n u a l F i n a n c i a l A n a l y s i s 2 0 1 8
42
in the State’s Personal and Corporate Income Tax rates, which have been adjusted three times by the State of Illinois since State fiscal year 2011.
In 2011, the State increased the Personal Income Tax rate from 3.0 percent to 5.0 percent and the Corporate Income Tax rate from 4.8 percent to 7.0 percent. However, municipalities did not receive a share of this increase because the State, concurrently with increasing tax rates, reduced the percentage of total Income Tax receipts that flow into the LGDF. Distributions to the LGDF decreased from 10.0 percent of both Personal and Corporate Income Tax revenue to 6.0 percent of Personal Income Tax receipts and 6.86 percent of Corporate Income Tax receipts.
In 2015, the State’s Income Tax rate increase ended, and the Personal Income Tax rate decreased to 3.75 percent and the Corporate Income Tax rate decreased to 5.25 percent. As part of the sunset provision, distributions to the LGDF increased to 8.0 percent for Personal Income Tax and to 9.14 percent for Corporate Income Tax receipts, instead of the earlier 10.0 percent share. The sunset of the higher tax rates and changes to LGDF distributions did not happen concurrently. As a result, some 2014 Income Tax payments (at higher tax rates) received in 2015 were distributed to the LGDF based on a higher distribution rate and subsequently
paid to municipalities. The timing of these changes increased income tax distributions to the City in the first two quarters of 2015.
Since then, individual Income Tax receipts have declined due in part to shifts in the stock market and fewer capital gains, and shrinking corporate income tax receipts. Despite employment and wage gains in 2016 and 2017, Income Tax revenue has declined relative to the early 2010s.
Beginning in July 2017, the Personal Income Tax rate increased to 4.95 percent and the Corporate Income Tax rate increased to 7.0 percent. The State adjusted the distribution to the LGDF by decreasing the percentage of Income Tax revenue distributed to the LGDF to 6.06 percent for individual Income Tax and 6.85 percent to Corporate Income Tax. The State reduced the amount deposited into the LGDF by another 10.0 percent for State fiscal year 2018.
State Income Tax revenue was $239.9 million in 2017, or $14.1 million lower than 2016 actual revenue of $254.0 million, and accounted for 6.5 percent of total 2017 Corporate Fund resources.
Personal Property Replacement Tax: The Personal Property Replacement Tax (“PPRT”) is levied on corporations,
Historic Revenue and Expense Review
2008
2009
2010
2011
2012
2013
2014
2015
2016
2017
$268.8M
$201.0M
$231.5M
$200.3M
$245.2M
$276.0M
$250.3M
$286.5M
$254.0M
$239.9M
STATE INCOME TAX

A n n u a l F i n a n c i a l A n a l y s i s 2 0 1 8
43
partnerships, and utility companies, and total revenues typically fluctuate with corporate profits. The tax is collected by the State and paid to local governments in order to replace revenues that were lost when the State eliminated the authority of local governments to collect personal property taxes on business entities and individuals.
Of the PPRT revenue provided to local units of government, Chicago receives 11.56 percent. Prior to 2015, a large portion of PPRT revenue was paid directly to pension funds as part of the City’s employer contribution. After satisfying this payment, the remaining balance of PPRT was deposited into the Corporate Fund. This practice ended in 2015, and since 2016, all PPRT revenues are deposited in the Corporate Fund, and pension contributions are made directly from the Corporate Fund and recorded as expenses. This appropriation change more clearly reflects the allocation of pension expenses.
In 2016, the Illinois Department of Revenue (“IDOR”) notified local taxing districts that IDOR had misclassified $168.0 million of income tax revenue as PPRT between April 2014 and March 2016. This error resulted in overpayments to local taxing districts such as the City, Chicago Public Schools, and Chicago Park District, among others, and meant that the State’s PPRT distribution estimates were inflated. As a corrective measure, the State advised local taxing districts that it would reduce distributions for the remainder of 2016 to prevent further overpayment until final tax returns were filed in October 2016.
In lieu of repayment, the State’s fiscal year 2017 stop-gap budget diverted PPRT revenue from municipalities to community colleges throughout Illinois. PPRT revenue was $148.3 million in 2017, or $11.4 million lower than 2016 actual revenue of $159.7 million, and accounted for 4.0 percent of total 2017 Corporate Fund resources.
For reasons stated at the beginning of the Corporate Fund section, State auto rental tax figures appear in the appendices of this document but are not discussed here.
Local Non-Tax Revenues
Local non-tax revenues consist of license and permits; fines, forfeitures and penalties; charges for service; municipal parking; leases, rentals and sales; and reimbursements, interest and other revenue.
Licenses, Permits, and Certificates: License and permit-related revenue is generated through fees for business licenses, building permits, and various other licenses and permits. License and permit activity often reflects economic health, with more construction commencing and new business growth when the economy is strong. As the real estate market has rebounded, license and permit activity and related revenues began to recover in 2012. License and permit revenues in 2017 were $133.5 million, or 3.6 percent of total Corporate Fund resources.
Fines, Forfeitures and Penalties: Fines, forfeitures, and penalties includes parking tickets, red-light and speed camera tickets, and fines for items such as building code violations. These revenues have increased steadily from $257.5 million in 2008 to $344.9 million in 2017 and accounted for 9.4 percent of total 2017 Corporate Fund resources. This steady increase in revenues is partly a result of the increased use of technology, including the implementation of on-line bill payment systems and additional parking enforcement field technology, including red light and speed camera automated violation technology. Increases in fine and penalty rates and improved debt collection have also impacted overall fine, forfeiture and penalty revenues.
Charges for Services: Revenues from charges for services are generated by charging for activities such as inspections, public information requests and other services for private benefit. In 2008, charges for services generated $76.9 million, increasing to $118.2 million in 2017. The increase in revenues is primarily due to public safety charges, including a $30.0 million increase in emergency medical services from 2008 to 2017.
Leases, Rentals and Sales: Revenues generated by the lease or sale of City-owned land, impounded vehicles, and other personal property account for a small percentage of the overall Corporate Fund resources. In recent years, the City implemented an online auction system for the sale of unneeded surplus materials and equipment. These revenues vary from year-to-year based on the inventory of the City property to be leased or sold and the market for such property and ranged from $10.7 million to $26.1 million over the last ten years. In 2017, lease and sale income was $25.9 million, slightly above historic averages.
Municipal Enterprise: In 2017, the City received $7.7
Historic Revenue and Expense Review

A n n u a l F i n a n c i a l A n a l y s i s 2 0 1 8
44
million from municipal parking – an increase of 2.7 percent from the prior year. This additional revenue came from the implementation of a pilot converting current business-paid loading zones to commercial user-paid loading zones.
Internal Service Earnings, Interest Income and Other: Internal service earnings include transfers to the Corporate Fund for services provided to other City agencies, such as police, fire and sanitation services. Other revenues include multiple different revenue sources such as reimbursements, Tax Increment Financing (“TIF”) surplus and revenue from sweeping aging revenue accounts. These activities generated $425.9 million in 2017.
Proceeds and Transfers In
Proceeds and transfers in revenues consist of residual sales and use tax revenues, and investment income on the long-term asset lease service concession reserves.
Long-term Asset Lease Reserves Investment Income: Transfers into the Corporate Fund from outside sources came largely from investment income on the long-term
asset lease reserves. When the recession negatively impacted economically sensitive revenues, the City increasingly used non-recurring revenue sources to fill the annual Corporate Fund budget gap. Beginning with the 2012 budget, the City stopped using the principal of the reserve funds to subsidize the operating budget. Since then, the City made significant progress towards aligning expenses with revenues utilizing only investment income from the long-term asset lease reserves as Corporate Fund revenue. Investment income revenue in 2017 was $24.2 million.
Sales Tax Securitization Corporation Residual Revenues: In October 2017, the City Council passed an ordinance authorizing the creation of a Sales Tax Securitization Corporation (“STSC”). This revenue securitization structure was developed because of legislation passed by the Illinois General Assembly, allowing all home rule municipalities to create a special purpose corporation organized for the sole purpose of issuing bonds paid for from revenues collected by the State. In December 2017, the City entered into a sale agreement (“Agreement”) with the STSC. Under the Agreement, the City sold to the STSC the City’s rights to receive Sales Tax revenues collected by the State. In return,
Historic Revenue and Expense Review
2008
2009
2010
2011
2012
2013
2014
2015
2016
2017
$814
.0M
$777
.8M
$773
.3M
$921
.1M
$907
.8M
$929
.4M
$998
.0M
$1,0
88.6
M
$1,0
23.4
M
$1,0
56.1
M
Internal Service EarningsCharges for ServicesFines, Forfeitures and Penalties
Licenses, Permits and CertificatesOther RevenueMunicipal Enterprises
Leases, Rentals and SalesInterest Income
LOCAL NON-TAX REVENUES

A n n u a l F i n a n c i a l A n a l y s i s 2 0 1 8
45
the City received the proceeds of bonds issued by the STSC as well as a residual certificate. Sales Tax revenues received by the STSC are paid first to cover the STSC’s operating expenses and debt service on the STSC’s bonds. All remaining Sales Tax revenues are then paid to the City as the holder of the residual certificate. Based on this structure, the Sales Tax revenues received by the City from the STSC are recorded in the City’s Corporate Fund as a transfer. The chart below provides a summary of the Sales Tax revenues sold to the STSC. The Home Rule Sales Taxes and the State Sales Taxes currently are measured on the gross receipts from the retail sale or the cost price of the tangible personal property transferred by the service provider and are generally collected by the seller from the purchaser. The Home Rule Sales Taxes are generally measured on the same basis, and are subject to the same exemptions, as the State Sales Taxes. The Home
Rule Sales Taxes are collected by the Department of Revenue pursuant to the Home Rule Sales Tax Statutes and applicable sections of the Municipal Code of Chicago. Each of the State Sales Tax Statutes provides that the applicable State Sales Tax will be collected by the Department of Revenue. Taxpayers with an average monthly sales tax liability more than $20,000 are required to file returns and remit payments to the Department of Revenue four times per month. In some cases, use taxes are paid directly by the purchaser to the Department of Revenue. The City received $229.9 million in sales and use tax revenue and $150.8 million in STSC residual revenue in 2017.
Prior Year Available Resources
Prior years’ savings and sustainable revenue growth, along with spending controls and other efficiencies, resulted in healthy growth of the Corporate Fund balance, referred to as
Historic Revenue and Expense Review
Tax Items Taxed Tax Rate
% of Net Tax Collections Payable to STSC
Subject to Annual State Appropriation
Home Rule Sales Taxes
Municipal Retailers’
Occupation Tax
Tax imposed on persons selling in the City at retail most items of nontitled tangiblepersonal property ─ The amount of tax is based on the gross receipts
1.25% 100% No
Municipal Service Occupation Tax
Tax imposed on persons making sales in the City of services where tangible personalproperty or real estate is transferred─ The amount of tax is based on the selling price
1.25% 100% No
Municipal Use Tax on Titled Personal
Property
Tax imposed on the privilege of using within the City titled personal property that is purchased at retail from a retailer and that is titled or registered in the City ─ The amount of tax is based on the selling price
Collected on sales in Cook County and five contiguous counties
1.25% 100% No
State Sales Taxes
Illinois Retailers’ Occupation Tax
Tax imposed on persons engaged in the business of selling at retail tangible personalproperty (other than grocery food, drugs and medical appliances)─ The amount of tax is based on the gross receipts
6.25% 16%1 No
─ Tax on grocery food, drugs and medical appliances 1.00% 100%1 No
Illinois Service Occupation Tax
Tax imposed on persons making sales of service where tangible personal property is transferred (other than grocery food, drugs and medical appliances)─ The amount of tax is based on the selling price
6.25% 16%1 No
─ Tax on grocery food, drugs and medical appliances 1.00% 100%1 No
Illinois Use Tax
Tax imposed on the privilege of using in the State most items of titled tangiblepersonal property purchased outside the State─ The amount of tax is based on the selling price or fair market value
6.25% 16%1 No
Tax imposed on the privilege of using in the State most items of nontitled tangiblepersonal property purchased outside the State─ The amount of tax is based on the selling price or fair market value
6.25% 4% Yes
─ Tax on grocery food, drugs and medical appliances purchased outside of the State 1.00% 20% Yes
Illinois Service Use Tax
Tax imposed on the privilege of using in the State most items of tangible personalproperty transferred as an incident to the sale outside the State of a service from a service provider─ The amount of tax is based on the selling price
6.25% 4% Yes
─ Tax on grocery food, drugs and medical appliances transferred as an incident to the sale outside the State of a service from a service provider 1.00% 20% Yes
1 Represents tax revenues collected on transactions occurring in the City or, with respect to the Illinois Use Tax, personal property titled in the City.
SUMMARY OF SALES TAX REVENUES

A n n u a l F i n a n c i a l A n a l y s i s 2 0 1 8
46
prior year available resources. In 2017, $53.0 million prior year available resources were budgeted, but were not needed to fund costs due to cost savings realized in other areas.
Review of Corporate Fund Expenditures
This section provides a ten-year trend analysis of the City’s Corporate Fund. The expenditure information contained here is based primarily on the City’s CAFR. Corporate Fund expenditures are reported as a major governmental fund within the general fund in the City’s basic financial statements. The expenditure information presented herein may vary slightly from that printed in the CAFR due to rounding.
Total Corporate Fund expenditures have increased from $3,127.1 million in 2008 to $3,642.1 million in 2017. Generally, the relative proportions of Corporate Fund spending devoted to different activities by expense type have remained fairly consistent from year-to-year.
Personnel
Corporate Fund personnel expenditures are comprised of employee pay, employee benefits, workers’ compensation and pension allocation. Across all departments and City services, personnel-related expenditures (including salaries and wages and employee healthcare costs) make up the largest portion of the Corporate Fund budget, averaging 84.4 percent of total Corporate Fund expenditures from 2008 through 2017.
Personnel expenditures comprised $2,965.7 million, or 81.4 percent of all Corporate Fund expenditures in 2017.
Employee Pay
Employee pay is comprised of the following: payroll; overtime; scheduled wage increments and adjustments; retroactive salary payments; miscellaneous salaries and wages; furlough; holiday and vacation; duty availability; specialty pay; uniform allowance; stipends; work study and student trainees. Corporate Fund expenditures for employee pay
Historic Revenue and Expense Review
2008
2009
2010
2011
2012
2013
2014
2015
2016
2017
$3,1
27.1
M
$3,0
26.3
M
$3,0
42.5
M
$3,0
51.9
M
$3,1
06.2
M
$3,1
13.7
M
$3,2
35.6
M
$3,4
39.1
M
$3,5
10.6
M
$3,6
42.1
M
Personnel Non-Personnel Other
Amounts have been modified from previous year AFAs due to the inclusion of operating transfers out of the fund.
CORPORATE FUND EXPENDITURES

A n n u a l F i n a n c i a l A n a l y s i s 2 0 1 8
47
have increased between 2008 and 2017 by $236.0 million, or 10.8 percent. In 2017, Corporate Fund expenditures for payroll were $2,084.4 million and overtime expenditures were $239.0 million. Total 2017 employee pay was $2,426.0 million which includes employee pay dictated by collective bargaining agreements, or 66.6 percent of total Corporate Fund expenditures.
Employee Benefits
Employee benefits encompasses employee healthcare, fringe benefits, life insurance, Medicare and social security contributions, tuition reimbursement and unemployment insurance claims expenditures. Employee benefits in 2017 were $341.7 million, or 9.4 percent of total Corporate Fund expenditures. This is a decrease of $5.8 million or 1.7 percent since 2008.
Employee healthcare is comprised of expenditures related to medical, dental and vision care for current City employees, a certain portion of City retirees, and spouses and dependents of both. The City self-funds its health plans, meaning that it pays for covered healthcare services rather than pay
premiums to a third-party insurer.
In 2014, the City began a three-year phase-out of City funding for healthcare benefits for certain retirees. The final year of the phase-out of City-subsidized healthcare coverage for employees who retired on or after August 23, 1989 and their dependents was in 2016. Retirees who retired from the City prior to August 23, 1989, will continue in a City plan with support of up to 55.0 percent of the cost of the plan.
Employee healthcare Corporate Fund expenditures in 2017 were $287.5 million, or 7.9 percent of total Corporate Fund expenditures. This is a decrease of $14.5 million or 4.8 percent since 2008. Note that total City employee health care expenditures span multiple funds and these numbers only represent those from the Corporate Fund.
Workers’ Compensation
The City’s workers’ compensation costs include medical expenses, payments for lost time for non-sworn employees, and the costs of case resolution associated with City employees who are injured while on duty. A number of
Historic Revenue and Expense Review
2008
2009
2010
2011
2012
2013
2014
2015
2016
2017
$2,6
23.6
M
$2,5
91.0
M
$2,5
78.6
M
$2,6
32.8
M
$2,6
37.6
M
$2,6
78.5
M
$2,7
69.8
M
$2,9
17.2
M
$2,8
52.7
M
$2,9
65.7
M
Employee Pay Employee Benefits Workers' Compensation Pension Allocation
Amounts have been modified from previous year AFAs due to the inclusion of operating transfers out of the fund.
PERSONNEL EXPENDITURES

A n n u a l F i n a n c i a l A n a l y s i s 2 0 1 8
48
factors contributed to growth in workers’ compensation costs over the past decade. Medical costs nationwide have risen significantly over the past decade, increasing the cost of treating injured employees. Further, salary and wages have grown over time as well, driving up the price of lost time that must be compensated by the City.
Over the past several years, the City has identified a number of opportunities to reform the policies and practices surrounding workers’ compensation to reduce these costs. The City has re-assessed its medical billing review process, worked to increase investigations to prevent fraud, implemented successful return-to-work programs for injured employees, and pursued more active case management.
Workers’ compensation Corporate Fund expenditures in 2017 were $58.8 million, or 1.6 percent of total Corporate Fund expenditures. This is an increase of $6.3 million or 12.0 percent since 2008.
Pension Allocation
Pension allocations include those expenditures made to the City’s pension funds from the Corporate Fund.
In 2015, the City changed the way it budgets its non-property tax pension contributions to more clearly reflect the allocation of these expenses across funds. Historically, the non-property tax share of the City’s pension contributions was paid from Personal Property Replacement Tax (“PPRT”) and no pension expenses showed on the Corporate Fund. Instead PPRT revenues were diverted from the Corporate Fund. PPRT revenues are now recorded in the Corporate Fund and pension contributions made directly from the Corporate Fund are recorded as expenses to the Corporate Fund. This change appears to have increased the Corporate Fund revenues and expenditures; however, this is simply an appropriation change which more clearly reflects the allocation of pension expenses.
The total Corporate Fund pension contribution in 2017 was $106.2 million, 2.9 percent of total Corporate Fund expenditures. This includes $92.1 million for the Municipal Pension Fund, $12.5 million for the Laborers’ Pension Fund, and $1.6 million for the Fire Pension Fund. In 2016, the pension contribution from the Corporate Fund was $11.6 million.
Non-Personnel
Corporate Fund non-personnel expenditures are comprised of contractual services, commodities, delegate agencies, utilities, legal costs, and miscellaneous expenses which include delegate agency matching funds, employee travel expenses and certain other contingency spending.
Non-personnel expenditures comprised $495.4 million, or 13.6 percent of all Corporate Fund expenditures in 2017.
Contractual Services
Contractual service expenditures include the cost of information technology systems, maintenance, and licensing; tipping fees for waste disposal; property rental; custodial services for City facilities; and landscaping, engineering, and other professional service contracts.
As governments, businesses, and residents increasingly utilize technology to conduct business and communicate, the City’s technology-related costs have increased. A significant portion of the increase in technology costs on the Corporate Fund is not due to an overall increase in expenses, but is the result of the City shifting the cost of certain technology expenses from general obligation bond proceeds to the operating budget. The City still utilizes proceeds of general obligation bonds to finance certain information technology expenses. Additionally, property rental and building services expenses have steadily decreased as the City reduces the number of properties that it leases. The City is maximizing the utilization of City-owned space, such as City Hall, and reducing long-term rental expenses. Since 2011, the City has vacated 19 leases. Space consolidations are on-going and the City estimates that the cost of these relocations and related renovations will be fully recouped with lease savings once completed.
Contractual services expenditures in the Corporate Fund were $291.5 million, or 9.4 percent of total Corporate Fund expenditures in 2008, and increased to $315.0 million, or 8.6 percent of total Corporate Fund expenditures in 2017.
Commodities
Expenditures for commodities and materials followed a similar pattern as those for contractual services, but on a much smaller scale. These expenditures include spending on office supplies, postage, small tools, electrical supplies, and
Historic Revenue and Expense Review

A n n u a l F i n a n c i a l A n a l y s i s 2 0 1 8
49
repair parts for vehicles and other equipment. Corporate Fund commodities expenditures were $40.7 million in 2017, a decrease of $6.3 million or 13.4 percent from 2008.
Delegate Agencies
Expenditures for delegate agencies includes grant costs for contracted delegate agencies in the Corporate Fund, as well as other intergovernmental agreements, such as those between the City and Chicago Public Schools or the Chicago Transit Authority. Delegate agencies Corporate expenditures were $26.3 million in 2017, an increase from $14.9 million spent in 2008. Other delegate agency expenditures can be found in contractual services and grant allocations.
Utilities
Utilities expenditures include electricity, natural gas, diesel fuel, and gasoline. Market prices have been the primary driver of the City’s utility expenditures. Significant year-over-year increases were due largely to rising energy prices, which drove up the City’s electricity and natural gas costs. As energy prices decreased, so have the City’s utility expenditures.
In order to reduce its utility costs, energy use, and environmental footprint, the City has undertaken a number of initiatives in recent years to improve its energy efficiency. In 2014, the City implemented Retrofit One, a self-funded comprehensive energy efficiency program that reduces utility costs. Under the program, 60 municipal buildings were retrofitted to replace lighting, energy systems, and windows. This and other energy efficiency initiatives together with broader trends in the market, resulted in a decline in Corporate Fund utilities expenditures.
Further, the City takes a two-pronged approach to energy procurement by taking advantage of favorable market pricing without sacrificing budget certainty. After assessing supply and demand, along with seasonal conditions for each commodity, technical and statistical analysis is conducted on price trends and various purchase scenarios. The City’s strategy is to be 80.0 percent hedged with 20.0 percent of purchases made on the spot market. The 20.0 percent spot market provides a buffer in the event that utilization is less than predicted and provides flexibility in making advantageous purchases given market price fluctuations.
Historic Revenue and Expense Review
2008
2009
2010
2011
2012
2013
2014
2015
2016
2017
$460
.8M
$407
.4M
$428
.1M
$398
.8M
$433
.2M
$416
.0M
$438
.5M $4
87.1
M
$530
.3M
$495
.4M
Contractual ServicesUtilitiesRefunds, Rebates & Legal Costs
CommoditiesDelegate AgenciesEmployee Travel Expenses
Contingencies
Amounts have been modified from previous year AFAs due to the inclusion of operating transfers out of the fund.
NON-PERSONNEL EXPENDITURES

A n n u a l F i n a n c i a l A n a l y s i s 2 0 1 8
50
The City’s fuel expenditures have also been primarily driven by market prices over the past decade. Spikes in the oil market have affected City costs, much as they have increased gasoline prices for individuals and businesses. While in recent years fuel costs have declined, the City has implemented multiple strategies to reduce the potential impact fluctuating fuel prices may have on the City’s expenditure by reducing the City’s vehicle fleet and curtailing fuel usage. The City has increased the proportion of its fleet that operates on alternative fuels. Currently, the City utilizes electric, hybrid, and alternative fuel vehicles, including police vehicles, light-duty trucks for street work, and larger trucks for completing electrical work and tree trimming.
Due to several improved efficiencies and cost savings, Corporate Fund expenditures for utilities were $67.9 million in 2008 and $45.6 million in 2017, a decrease of $22.3 million, or 32.8 percent.
Refunds, Rebates and Legal Costs
Expenditures for refunds, rebates and legal costs include court settlements, claims for damage and liability, settlement of
non-tort judgments, condo rebates, claims and professional and technical services related to court cases. Corporate Fund expenditures for refunds, rebates and legal costs were $66.3 million in 2017, a portion of which is reflected in settlements and judgments in the Corporate Fund.
Settlements and Judgments
Each year, the City uses both Corporate Fund and Enterprise Fund resources, as well as bond proceeds, to pay for expenses incurred in connection with settlements and judgments against the City. Expenses in excess of the amount paid from the local funds are paid with bond proceeds.
The City’s total settlement and judgment-related expenses vary from year-to-year depending upon the volume and nature of claims filed and settled, the value of judgments entered, and the extent to which the City utilizes outside legal counsel to address these claims. Settlements related to one year are often not settled until years later, and judgments are often paid out over a number of years, so the distribution of expenses is not necessarily representative of the events or activities of that year.
Historic Revenue and Expense Review
2008
2009
2010
2011
2012
2013
2014
2015
2016
2017
$167
.6M
$90.
3M
$90.
8M
$81.
6M
$188
.3M
$197
.6M
$107
.0M
$154
.8M
$115
.6M
$115
.2M
Bond General Funds Enterprise Funds
The general fund and enterprise fund amounts shown above vary slightly from prior years due to changes made in the 2016 AFA that provideadditional expense detail. As a result, certain non-settlement related legal expenses have been reclassified.
SETTLEMENTS AND JUDGMENTS

A n n u a l F i n a n c i a l A n a l y s i s 2 0 1 8
51
The City has increased the amount of Corporate Fund resources available to pay for routine settlements and judgments costs. General Fund expenditures for settlements and judgments were $64.9 million in 2017.
For reasons stated at the beginning of the Corporate Fund section, employee travel and contingencies appear in the appendices of this document and are not discussed here.
Other
Items included in the other expenditure category include grant cash match, financing costs, transfers out, indirect costs, and scoop and toss payments. The other expenditure category for 2017 was $181.0 million.
The City maintains a segregated fund to support the maintenance and operations of the Chicago Public Library (“CPL”) system. Revenue to this fund comes primarily from property taxes and an annual subsidy from the City’s Corporate Fund. As the Library Fund expenses increased in recent years, so has the Corporate Fund subsidy. The CPL Corporate Fund subsidy in 2017 was $19 million.
The City committed to eliminating the need for the practice of “scoop and toss” – in which the City restructures its near-term debt payments with long-term debt – by 2019. In 2016, the City transferred $85.6 million from the Corporate Fund to CPL, as well as to take the first step toward eliminating “scoop and toss”. The 2017 payment for eliminating “scoop and toss” of $123 million is reflected as a Corporate Fund expense in the other expenditure category above.
Spending by City Service
Corporate Fund expenditures for City services remained relatively consistent from 2008 through 2014, but in recent years, expenses have increased to support additional investments in public safety departments, expanded community service programs and growth in citywide costs, including pensions.
Over the years, a number of City departments have been combined or merged into new or existing departments. References in this section to specific existing departments and the resources dedicated to them include predecessor departments and the resources dedicated to those functions in the past. Activities and spending patterns by City service are
discussed in detail below.
Public Safety
Each year, the largest portion of Corporate Fund spending is dedicated to public safety functions, including services provided through the Chicago Police Department, the Chicago Fire Department, the Office of Emergency Management and Communications, the Police Board, and the Civilian Office of Police Accountability (previously called the Independent Police Review Authority). Public safety departments have not experienced reductions to the extent that other segments of the workforce have over the past ten years. Over the last ten years, public safety positions have made up approximately 60.0 percent of total Corporate Fund expenditures each year.
Infrastructure Services
Infrastructure services are provided by the Department of Streets and Sanitation (“DSS”) and the Chicago Department of Transportation (“CDOT”). Corporate funds are used to provide City services – recycling and garbage collection; trim tree trimming and graffiti removal; building, repair, and maintenance of Chicago’s streets, sidewalks, and bridges; and the planning and engineering behind this infrastructure. DSS is primarily funded through the Corporate Fund with additional expenditures, including garbage collection, towing and vehicle impoundment, and snow removal funded with special revenue funds.
Much of the City’s major infrastructure construction performed by CDOT is funded through special revenue funds, State and federal grants, TIF, and bond financings, and thus is not represented as a Corporate Fund expenditure.
City Development
City development activities provided through the Department of Planning and Development (“DPD”) include planning and zoning; the promotion of retail, industrial, and commercial projects; and affordable housing support. While these activities are mostly funded through state and federal grants, the corporate budget in 2017 included $13.3 million in funding for DPD. Grant funding for DPD and the projects they support are discussed in more detail in the grants section. The Department of Cultural Affairs and Special Events, which manages the promotion of tourism, cultural planning, and the coordination of special events,
Historic Revenue and Expense Review

A n n u a l F i n a n c i a l A n a l y s i s 2 0 1 8
52
is supported almost solely by the City’s Special Events and Municipal Hotel Operators’ Occupation Tax Fund.
Community Services
Community services are provided through the Department of Family and Support Services, the Chicago Department of Public Health, CPL, and the Mayor’s Office for People with Disabilities (“MOPD”). These departments are heavily grant-funded and the services provided through this funding are discussed in greater detail in the grants section. While the CPL receives some corporate funding subsidy, it is primarily funded through its dedicated property tax levy.
Regulatory Services
Regulatory services include the activities of six departments. The Department of Buildings ensures the safety of residential and commercial buildings in Chicago by enforcing design, construction, and maintenance standards and promoting
conservation and rehabilitation through permitting and inspection. The Department of Business Affairs and Consumer Protection is responsible for business licensing and consumer protection activities, including the regulation of minimum wage compliance, ground transportation, and food trucks. Additional regulatory departments include, the Board of Ethics, Animal Care and Control, Office of the Inspector General and License Appeal Commission.
Legislative and Elections
The Legislative and Elections departments manage the City’s legislative and election functions, while also maintaining and promoting the efficient and accurate administration of all local, State, and federal elections. This includes City Council and its staff, committees and legislative offices, and the Board of Election Commissioners. The City Council is the legislative body of the City of Chicago, consisting of the Mayor, the City Clerk, and the aldermen elected from each of the 50 wards to serve four-year terms. The Board
Historic Revenue and Expense Review
2008
2009
2010
2011
2012
2013
2014
2015
2016
2017
$3,1
27.1
M
$3,0
26.3
M
$3,0
42.5
M
$3,0
51.9
M
$3,1
06.2
M
$3,1
13.7
M
$3,2
35.6
M
$3,4
39.1
M
$3,5
10.6
M
$3,6
42.1
M
Public SafetyFinance GeneralFinance and Administration
Infrastructure ServicesCommunity ServicesRegulatory Services
Legislative and ElectionsCity Development
Amounts have been modified from previous year AFAs due to the inclusion of operating transfers out of the fund.
SPENDING BY CITY SERVICE

A n n u a l F i n a n c i a l A n a l y s i s 2 0 1 8
53
of Election Commissioners registers voters and administers local, State, and federal elections within Chicago.
Finance and Administration
Finance and administration functions include essential City services, such as accounting, contract management, legal and administrative services, and technology and systems expertise. The departments that perform these functions include the City Clerk, the City Treasurer, Department of Finance, Department of Human Resources, Department of Innovation and Technology, Department of Law, Department of Procurement Services, Office of Budget and Management, and the Office of the Mayor.
Additionally, the Department of Fleet and Facility Management oversees the repair and maintenance of City vehicles, such as police cars, snow plows, and street sweepers, and facilities, such as libraries, fire stations, and City Hall.
Finance General (Citywide Expenses)
Citywide expenses include citywide contract and information technology costs, payments for legal costs and settlements and judgments, pension payments, employee benefits and other costs that are budgeted separately from the City’s operating departments. These expenses are largely citywide personnel-related expenses such as healthcare costs and workers compensation.
Historic Revenue and Expense Review

A n n u a l F i n a n c i a l A n a l y s i s 2 0 1 8
54
Historic Revenue and Expense Review
SPECIAL REVENUE FUNDS
The City’s Special Revenue Funds account for revenue from specific sources that by law must be used to finance specific functions, such as road repair, libraries, 911 services, special events, and tourism promotion. This section describes the revenue sources of the City’s Special Revenue Funds and a description of the operations funded with the revenue.
Vehicle Tax Fund
The Vehicle Tax Fund includes revenue from vehicle sticker sales, impoundment fees, abandoned auto sale fees, pavement cut fees, and beginning in 2015, $10.0 million from the garage parking tax for the maintenance of the public way. Vehicle Tax Fund revenues are reported as a non-major special revenue fund in the City’s basic financial statements.
Proceeds from the sale of City vehicle stickers have consistently made up the largest portion of the Vehicle Tax Fund revenues. In 2014, the City transitioned to year-round sticker sales and began indexing vehicle sticker rates
to the rate of inflation with adjustments every two years. During the transition, vehicle owners were given the option of purchasing stickers valid for periods of one month up to 24 months with pricing on a pro rata basis. Because many owners chose to purchase stickers valid for 12 months or longer, sticker sales had a one-time boost, reaching a record high in 2014 with an increase of nearly 12.0 percent, and then decreasing by 11.0 percent in 2015. Additionally, City ordinance requires an adjustment to the price of vehicle stickers every other year based on the current Consumer Price Index (“CPI”). As a result, a 1.3 percent adjustment occurred in January 2018.
Since 2008, vehicle sticker revenue has increased by 43.8 percent ending 2017 at $128.3 million reflecting the multiple increases in the cost per City sticker over the past ten years. Other revenues, including impoundment fees, abandoned auto sales fees and pavement cut fees, were $87.2 million in 2017, and accounted for 39.3 percent of total 2017 Vehicle Tax Fund resources at year-end.
Vehicle Tax Fund expenditures are dependent on the amount, type, and cost of performing street repair and maintenance
2008
2009
2010
2011
2012
2013
2014
2015
2016
2017
$143.4M
$146.9M
$148.6M
$140.3M $157.5M
$165.1M
$188.9M
$182.7M $2
02.0M
$216.2M
VEHICLE TAX FUND REVENUE

A n n u a l F i n a n c i a l A n a l y s i s 2 0 1 8
55
activities in a given year. The relative proportion of total spending on non-personnel activities and expense types in this fund has remained relatively consistent over the years.
Historic year-to-year variations in total expenditures also reflect the resources available to complete such work. In recent years, the City has worked to stabilize this fund, keeping spending relatively constant and more closely in line with revenues.
Personnel costs, including employee pay, employee benefits and workers’ compensation have increased between 2008 and 2017 by $39.1 million, or 51.5 percent. In 2017, personnel expenditures were $115.15 million, or 55.6 percent of total Vehicle Tax Fund expenditures.
Motor Fuel Tax Fund
The Motor Fuel Tax Law, enacted in 1929 and subsequently amended, imposes a tax upon the privilege of operating motor vehicles on public highways and recreational type watercraft in the State, based upon the consumption of motor fuel within the State. Under current law, all revenue received by the Illinois Department of Revenue under the
Motor Fuel Tax Law must be deposited in a special fund in the State Treasury known as the Motor Fuel Tax Fund. The State Motor Fuel Tax Fund is comprised of revenues received from the motor fuel tax of 19 cents per gallon and an additional 2.5 cents per gallon tax imposed on the consumption of diesel fuel.
Motor Fuel Tax (“MFT”) Fund revenues are reported as a non-major special revenue fund in the City’s basic financial statements, while the debt service portion is reported in the Bond, Note Redemption and Interest portion.
The City generally receives MFT revenues in the month following the State’s collection of the State MFT funds. State motor fuel tax funds are generally collected by the State in the month following the month the MFT liabilities are incurred by motor fuel distributors and suppliers. The City, therefore, generally receives MFT revenues in the second month following the month in which distributors incur the tax.
MFT revenues allocated to the City have been declining annually. From 2010 through 2014, the City received $12.5 million each year from the State’s “Illinois Jobs Now!”
Historic Revenue and Expense Review
2008
2009
2010
2011
2012
2013
2014
2015
2016
2017
$133
.8M
$139
.7M
$136
.8M
$132
.5M $151
.6M
$163
.2M $182
.9M
$196
.2M
$186
.9M $206
.8M
Personnel Non-Personnel Other
VEHICLE TAX FUND EXPENDITURES

A n n u a l F i n a n c i a l A n a l y s i s 2 0 1 8
56
program, which was allocated to the MFT fund. That program terminated at the end of 2014. In addition, the City received a $12.5 million supplement in 2014 which was dedicated to specific projects. The MFT revenues for 2017 increased by $0.6 million compared to prior year revenues.
Beginning in 2014, revenue from fees charged to tour boat operators and beginning in 2015, revenues related to vendors along the new Riverwalk were dedicated to making Transportation Infrastructure Finance and Innovation Act loan repayments. In 2017, $68.9 million, or 95.2 percent, of MFT revenue came from the State’s distributive share of motor fuel tax revenues.
MFT Fund expenses include costs associated with streetlight energy, salt purchases for snow removal, street pavement and bridge maintenance, and the personnel costs that support these activities. In addition, for decades, $3 million of these funds annually are transferred to the CTA to support the Chicago transportation system.
Special Events and Municipal Hotel Operators’ Occupation Tax Fund
The Special Events and Municipal Hotel Operators’ Occupation Tax Fund consists of revenues from the Municipal Hotel Operators’ Occupation Tax, a one percent State-imposed tax on gross receipts of hotel operators, revenue from special events and related recreation fees and revenue from the City’s contract for street furniture maintenance and advertising. Monies in the Special Events and Municipal Hotel Operators’ Occupation Tax Fund are used to support the promotion of tourism, cultural and recreational activities in Chicago. Revenues and expenditures from this fund are highly economically sensitive due to annual market conditions and broader tourism trends.
Special Events and Municipal Hotel Operators’ Occupation Tax Fund revenues are reported as a non-major special revenue fund in the City’s basic financial statements.
Historic Revenue and Expense Review
2008
2009
2010
2011
2012
2013
2014
2015
2016
2017
$50.2M
$43.3M
$40.9M
$31.2M
$37.2M $39.6M
$39.8M
$40.8M
$44.4M
$44.2M
SPECIAL EVENTS AND MUNICIPAL HOTEL OPERATORS’ OCCUPATION TAX FUND REVENUE

A n n u a l F i n a n c i a l A n a l y s i s 2 0 1 8
57
Municipal Hotel Operators’ Occupation Tax revenues decreased in 2009 with the downturn in the economy. Hotel tax revenue began to pick up again in 2012, as the Chicago tourism industry grew. Despite a 5.1 percent dip from 2016, Municipal Hotel Operators’ Occupation Tax revenue ended 2017 with $24.8 million, or 56.0 percent of Special Events and Municipal Hotel Operators’ Occupation Tax Fund revenues.
Revenue from special events recreation fees decreased in 2011 as the operation of the Taste of Chicago was transferred to the Chicago Park District for that year. The Taste of Chicago returned to City operations in 2012, and at the same time, the festival was reduced in length from ten to five days; accordingly, revenues did not return to 2010 levels. From 2012 to 2017, special events recreation fees have averaged $11.0 million, or 26.9 percent of Special Events and Municipal Hotel Operators’ Occupation Tax Fund.
Other revenue includes municipal marketing in the public way. Expenditures from Special Events and Municipal Hotel Operators’ Occupation Tax Fund reflect the City’s evolving approach to events and tourism promotion, as well as broader factors that have affected City spending generally. Major fluctuations in the amounts spent on special events and tourism-related activities can be tied to specific changes in City operations.
Choose Chicago has received $32.5 million in City funding from the Special Events and Municipal Hotel Operators’ Occupation Tax Fund since 2008.
Special Events and Municipal Hotel Operators’ Occupation Tax Fund 2017 personnel costs were $6.7 million, or 15.0 percent of total fund expenditures. Contractual services and other non-personnel costs associated with tourism promotion and event production have averaged $30.7 million, or 74.9 percent, of the Special Events, Tourism and Festivals Fund for the period of 2008 through 2017.
Historic Revenue and Expense Review
2008
2009
2010
2011
2012
2013
2014
2015
2016
2017
$51.8M
$48.3M
$40.2M
$24.4M
$34.1M $36.9M
$41.9M
$40.5M
$47.2M
$44.6M
Non-Personnel Personnel Other
SPECIAL EVENTS AND MUNICIPAL HOTEL OPERATORS’ OCCUPATION TAX FUND EXPENDITURES

A n n u a l F i n a n c i a l A n a l y s i s 2 0 1 8
58
Library Fund
The City maintains a segregated fund to support the maintenance and operations of the Chicago Public Library system and its central, regional, and branch locations. Revenue to this fund comes primarily from an annual library operations property tax levy and an annual subsidy from the City’s Corporate Fund. Library Fund revenues are reported as a non-major special revenue fund in the City’s basic financial statements.
Budgeted revenue derived from the annual property tax levy for library operations has remained relatively flat since 2008 increasing from $83 million in 2008 to $89.9 million 2017. Property tax revenue consistently has made up the largest portion of the Library Fund’s annual revenue.
In 2015, the City’s Corporate Fund provided a $6.5 million subsidy and has increased that subsidy to $19 million in 2017. The growth in the Corporate Fund subsidy is partially the result of the City moving the cost of new books and
subscriptions, approximately $7.5 million annually, into the operating budget and off long-term bonds.
Other revenue to the Library Fund comes primarily from library fines, interest earnings, and income from the rental of library facilities. Library Fund expenditures are comprised of personnel, contractual services, utilities and commodities. Personnel costs make up the largest portion of Library Fund expenses. Total expenditures for the Library Fund in 2017 were $95.0 million, a $2.8 million decrease over 2016.
For the period of 2008 through 2017, personnel costs, including employee pay, employee benefits and workers’ compensation, have increased slightly from $61.5 million in 2008 to $62.2 million in 2017. These costs have generally increased over the past ten years due in part to salary increases under collective bargaining agreements and other benefits. These costs have been offset by various efficiencies achieved by the Chicago Public Libraries.
Historic Revenue and Expense Review
2008
2009
2010
2011
2012
2013
2014
2015
2016
2017
$92.0M
$88.3M
$86.8M
$87.7M
$81.3M
$83.6M
$83.6M
$84.8M
$99.6M
$98.2M
LIBRARY FUND REVENUE

A n n u a l F i n a n c i a l A n a l y s i s 2 0 1 8
59
Non-personnel expenditures, including contractual services, have remained relatively constant in recent years and consist largely of property rental costs for library facilities that are not City-owned and property maintenance and building services expenses for the Harold Washington Library Center and branch libraries.
In 2017, financing costs related to the payments on the line of credit, were $2.1 million, remaining the same as 2016. This is reflected in “Other” expenditures.
Emergency Communication Fund
Revenue to the Emergency Communications Fund comes through the collection of the emergency communication surcharge (“911 surcharge”) on all billed subscribers of telecommunications services in Chicago. Each year, the City uses revenue from the 911 surcharge for expenses specifically related to the 911 and emergency preparedness related activities of the Office of Emergency Management and Communication (“OEMC”). The City maintains
two segregated funds to support the 911 and emergency preparedness related functions of the OEMC – one fund for operational expenses and one fund to pay debt service on bonds issued for the construction of the City’s 911 call center. Emergency Communications Fund revenues are reported as a non-major governmental fund within the City’s basic financial statements while the debt service portion is reported in the Bond, Note Redemption and Interest.
Since September 2014, the surcharge is levied at a rate of $3.90 per month per landline or wireless connection and since October 2014, 9.0 percent of the cost of prepaid wireless services. Beginning in 2018, the surcharge was increased to $5.00 per line per month. Revenue from the 911 surcharge decreased to $122.8 million in 2017, or 1.0 percent from the previous year as residents continue to move away from paying for both residential landlines and cellular devices.
Up to and including 2017, costs were budgeted in the Corporate Fund and 911 surcharge revenues were transferred from a segregated revenue fund to the Corporate Fund to
Historic Revenue and Expense Review
2008
2009
2010
2011
2012
2013
2014
2015
2016
2017
$84.0M
$84.6M
$84.9M
$84.8M
$81.5M
$80.2M $84.4M
$85.5M
$97.8M
$98.1M
Personnel Non-Personnel Other
LIBRARY FUND OPERATING EXPENDITURES

A n n u a l F i n a n c i a l A n a l y s i s 2 0 1 8
60
pay for eligible expenses and the remaining costs were paid with Corporate Fund revenue. In 2017, the amount of this transfer was $93.8 million.
CTA Real Property Transfer Tax Fund
In 2008, a supplemental tax on real estate transfers was adopted for the purpose of providing financial assistance to the CTA, and this fund was established to receive the proceeds from that tax, which are then transferred to the CTA. Because this fund’s revenue is generated through real estate transfers, it has followed the same trends as other economically sensitive and transaction-based tax revenues.
Revenues remained relatively stagnant due to slow real estate activity during the first two years following this fund’s inception, averaging $27.9 million annually. Reflecting the improving economy and recovery in the real estate market, these revenues started growing significantly from $32.7 million in 2010 to $63.9 million in 2017.
CTA Real Property Transfer Tax fund revenues are reported as a non-major special revenue fund within the miscellaneous fund in the City’s basic financial statements.
Garbage Collection Fund
Starting in 2016, Chicago residences receiving City-provided garbage collection services pay a $9.50 monthly fee per dwelling unit. City garbage collection services collect refuse from single family homes and multi-family buildings with four units or fewer. The Garbage Fee is included as a separate line on the City’s unified water, sewer, and garbage utility bill. The City began collecting the fee in April 2016 and collected $54.4 million for that portion of 2016. Full year Garbage Fee revenue collections for the 2017 were $64.0 million.
The City spends over $200 million a year to collect garbage at over 600,000 residential households. Garbage Fee Fund expenditures for 2017 included $64.0 million in personnel costs related to solid waste collection and disposal. The remaining costs for garbage collection are charged to the Corporate Fund.
Garbage Fee Fund revenues are reported as a major governmental fund within the general fund in the City’s basic financial statements.
Affordable Housing Opportunity Fund
The City first included the Affordable Housing Opportunity Fund (“AHOF”) in the 2016 budget. The revenue in this fund is collected through the City’s density bonus program and the Affordable Requirements Ordinance (“ARO”). ARO requires residential developments that are downtown Planned Developments or that receive increased density to provide a percentage of units at affordable rents or to contribute to affordable housing elsewhere. These revenues are used to meet permanent housing needs of Chicago’s low-income residents.
Reforms put in place in 2015 to the ARO help to create more resources for affordable housing and increased affordable housing built on-site as part of market-rate developments. The ARO requires certain private market residential developers to designate a percentage of units on site as affordable and/or pay an in-lieu fee to the City. These fees, receipted in the AHOF are used to advance affordable housing development in Chicago.
In 2017, $18.3 million was collected to support affordable housing. Since 2016, AHOF revenue has allowed the City to allocate nearly $28.1 million for rental subsidies and Multi-Year Affordability through Upfront Investment (“MAUI”) for 1,656 affordable rental units through the Chicago Low Income Housing Trust Fund.
AHOF revenues are reported as agency funds in the City’s basic financial statements.
Neighborhood Opportunity Fund
Neighborhood Opportunity Fund (“NOF”) revenue is generated from collection of the Neighborhood Opportunity Bonus. Since 2016, payments are received in exchange for density bonuses that allow developers to exceed zoning limits for a specific development site. Neighborhood Opportunity Bonus reforms the City’s zoning system to allow larger buildings to be built downtown and thereby generates resources to support economic activity in the City neighborhoods most in need.
Eighty percent of the revenue from the Neighborhood Opportunity Bonus is dedicated towards the NOF for commercial development and job creation in neighborhoods where the need is the greatest; ten percent of funding goes
Historic Revenue and Expense Review

A n n u a l F i n a n c i a l A n a l y s i s 2 0 1 8
61
toward the Landmarks Fund to improve and maintain landmarks throughout the City. An additional ten percent of funds go towards the Local Improvement Fund for local infrastructure improvements within one mile of the contributing development.
Neighborhood Opportunity Bonus fees are paid when developers pull permits for construction. In 2017, $8.5 million of revenue was collected. To date, Neighborhood Opportunity Bonus-funded grants of $3.0 million were made to 32 grantees across the south, southwest and west sides of the City. The NOF revenues are reported as agency funds in the City’s basic financial statements
Historic Revenue and Expense Review

A n n u a l F i n a n c i a l A n a l y s i s 2 0 1 8
62
ENTERPRISE FUNDS
The City’s Enterprise Funds support the operation, maintenance, and capital programs of the City’s water and sewer systems and Chicago O’Hare International Airport (“O’Hare”) and Chicago Midway International Airport (“Midway”). These funds are self-supporting, in that each fund derives its revenues from charges and associated user fees. The cost of capital improvements for the City’s Enterprise Funds are included in the overall budgets of these self-supporting funds. Enterprise Fund revenues are reported as major proprietary funds in the City’s basic financial statements.
Water Fund
Revenues from the sale of water provides funds for the operations and maintenance of the water system and debt service of the water bonds and loans. The Water Fund receives no share of any State, local property or income taxes. The City receives water system operating revenues only from the users of the water system. The operating revenues from users of the water system do not flow through the State or any other political subdivision, but are paid directly to the City.
Water system rates are set by City Council. No regulation by any administrative agency applies to water system rates. The rates for metered accounts are based on a dollar rate per thousand cubic feet or per thousand gallons of water used. The assessment of non-metered users is based on a formula primarily involving the front width of the building and the number of stories therein. Additional charges are assessed for an outside hose connection and large water-using devices such as water-cooled air conditioners.
By ordinance, annual water system rates are automatically adjusted by applying to the previous year’s rates the rate of inflation, calculated based on the Consumer Price Index (“CPI”) published by the United States Bureau of Labor Statistics for the 365-day period ending on the most recent January 1. Such increases do not require further action by the City Council. Any such automatic annual increase, however, is capped at 5 percent of the previous year’s rate. Effective June 1, 2018, the water rate is $3.95 per 1,000 gallons. The Water Fund’s operating and non-operating revenues for 2017 of $772.5 million increased by more than $9.8 million compared to prior year operating revenues. This increase of
Historic Revenue and Expense Review
2008
2009
2010
2011
2012
2013
2014
2015
2016
2017
$379
.8M
$413
.8M
$462
.3M
$458
.4M
$577
.7M $6
38.1
M
$692
.6M $7
72.7
M
$762
.6M
$772
.5M
Water Service Other Non-Operating Revenues
WATER FUND REVENUE

A n n u a l F i n a n c i a l A n a l y s i s 2 0 1 8
63
1.3 percent is primarily due to the increase in penalties and other revenues related to water fees, which has offset the slight decline in water service revenues due to the continued conversion of non-metered accounts to metered accounts.
Other operating revenue includes penalties and revenues related to providing water service. Non-operating revenues are composed of net interest income, internet convenient fees for water fee payments and net revenue that relates to construction done by the Department of Water Management for other City departments and private companies.
The Water Fund’s operating expenses before depreciation and amortization for 2017 increased $8.8 million from 2016. Operating expenses exclusive of pension expense decreased by $3.2 million in 2017, primarily due to the elimination of the Swap Termination Fee. Prior to 2015, the direct pension expense was recorded as reimbursements to the Corporate Fund. Beginning with the 2015 budget, the Water Fund’s direct pension expenses were budgeted as a defined budget item.
Sewer Fund
Revenues from sewer service charges provide funds for the operation and maintenance of the sewer system and debt service on sewer bonds and loans. The City obtains sewer system operating revenues only from the users of the sewer system. The Sewer Fund receives no share of any State or local property or income tax. The operating revenues from users of the sewer system do not flow through the State or any other political subdivision, but are paid directly to the City.
Sewer system rates are set by City Council. The sewer service charge is established in an amount designed to pay for the costs of sewer system operations and capital improvements, including any related debt service. The current charge for sewer service is an amount equal to 100 percent of the gross amount charged for water service, whether such service is metered or nonmetered.
By ordinance, annual water system rates are automatically adjusted by applying to the previous years’ rates the rate of inflation, calculated based on the CPI published by the
Historic Revenue and Expense Review
2008
2009
2010
2011
2012
2013
2014
2015
2016
2017
$325
.6M
$333
.4M
$339
.3M
$354
.7M
$352
.9M
$367
.4M
$398
.5M
$420
.6M
$520
.4M
$427
.9M
Source of SupplyPension ExpenseCustomer Accounting & CollectionAdministrative & GeneralTransmission & Distribution
Power & PumpingPurificationNon-Operating ExpensesCentral Services & General Fund Reimbursements
Non-cash expenses are excluded from this chart as there is no budgetary impact. See the debt service section for informationregarding annual debt service payments.
WATER FUND EXPENDITURES

A n n u a l F i n a n c i a l A n a l y s i s 2 0 1 8
64
2008
2009
2010
2011
2012
2013
2014
2015
2016
2017
$161
.0M
$175
.5M $2
19.7
M
$206
.7M
$255
.0M $2
94.5
M $326
.0M
$379
.8M
$370
.1M
$352
.0M
Sewer Service Non-Operating Revenues Other
SEWER FUND REVENUES
Historic Revenue and Expense Review
2008
2009
2010
2011
2012
2013
2014
2015
2016
2017
$137
.3M $1
67.7
M
$162
.0M
$169
.1M
$168
.4M
$190
.3M
$188
.9M
$281
.4M
$209
.2M
$220
.0M
Pension ExpenseEngineeringAdministrative & General
MaintenanceGeneral Fund ReimbursementsRepairs
Non-Operating Expenses
Non-cash expenses are excluded from this chart as there is no budgetary impact. See the debt service section for informationregarding annual debt service payments.
SEWER FUND EXPENDITURES

A n n u a l F i n a n c i a l A n a l y s i s 2 0 1 8
65
Historic Revenue and Expense Review
United States Bureau of Labor Statistics for the 365-day period ending on the most recent January 1. Such increases do not require further action by the City Council. Any such automatic annual increase, however, is capped at 5 percent of the previous year’s rate. Effective June 1, 2018, the sewer rate is $3.95 per 1,000 gallons.
The Sewer Fund’s operating and non-operating revenues for 2017 of $352.0 million decreased by $18.1 million compared to 2016 operating revenues. This decrease of 4.9 percent is primarily due to the continued conversion of non-metered accounts to metered accounts. Other operating revenue primarily consists of inspection fees, house drain fees drain layers license fees, and fines and penalties. Non-operating revenues include investment income, revenue from the sale of materials and salvage, miscellaneous income from items directly related to construction funds, and the loss or gain of capital items.
The Sewer Fund’s operating expenses before depreciation and amortization for 2017 increased $11.2 million from the year ended 2016. Operating expenses exclusive of pension expenses increased by $6.1 million in 2017, primarily due to increases in repair and maintenance costs. Prior to 2015, the direct pension expense was recorded as reimbursements to the Corporate Fund. Beginning with the 2015 budget, the Sewer Fund’s direct pension expenses were budgeted as a defined budget item.
Airport Funds
O’Hare and Midway airport operations are funded through landing fees, terminal and other rent, fueling systems fees and other fees paid by airlines, as well as non-airline sources, such as charges for parking and revenues from concessions.
2008
2009
2010
2011
2012
2013
2014
2015
2016
2017
$920
.9M
$808
.9M $9
19.1
M
$939
.0M
$978
.0M $1
,110
.4M
$1,1
21.5
M
$1,1
46.5
M
$1,2
40.6
M
$1,3
15.1
M
Landing Fees, Terminal Area Use ChargesRents, Concessions, and Other
Non-Operating RevenuesCapital Grants
O’HARE AIRPORT FUND REVENUE
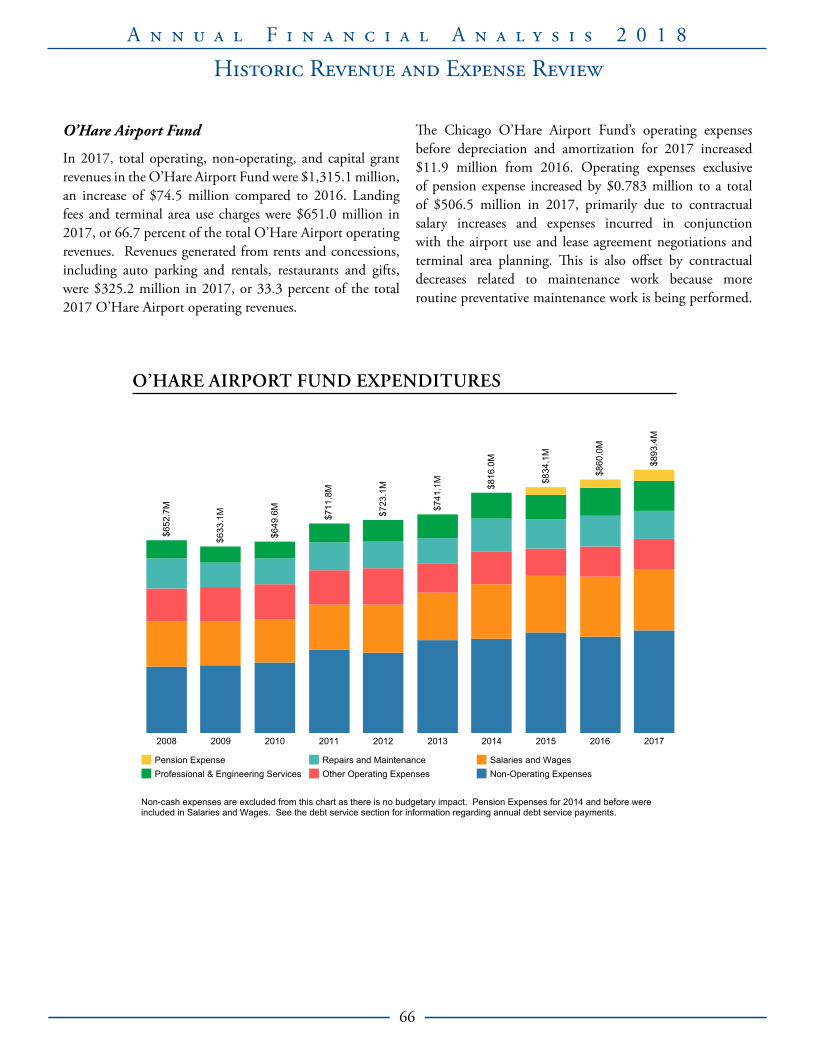
A n n u a l F i n a n c i a l A n a l y s i s 2 0 1 8
66
Historic Revenue and Expense Review
O’Hare Airport Fund
In 2017, total operating, non-operating, and capital grant revenues in the O’Hare Airport Fund were $1,315.1 million, an increase of $74.5 million compared to 2016. Landing fees and terminal area use charges were $651.0 million in 2017, or 66.7 percent of the total O’Hare Airport operating revenues. Revenues generated from rents and concessions, including auto parking and rentals, restaurants and gifts, were $325.2 million in 2017, or 33.3 percent of the total 2017 O’Hare Airport operating revenues.
The Chicago O’Hare Airport Fund’s operating expenses before depreciation and amortization for 2017 increased $11.9 million from 2016. Operating expenses exclusive of pension expense increased by $0.783 million to a total of $506.5 million in 2017, primarily due to contractual salary increases and expenses incurred in conjunction with the airport use and lease agreement negotiations and terminal area planning. This is also offset by contractual decreases related to maintenance work because more routine preventative maintenance work is being performed.
2008 2009 2010 2011 2012 2013 2014 2015 2016 2017
$652
.7M
$633
.1M
$649
.6M
$711
.8M
$723
.1M
$741
.1M
$816
.0M
$834
.1M
$860
.0M
$893
.4M
Pension ExpenseProfessional & Engineering Services
Repairs and MaintenanceOther Operating Expenses
Salaries and WagesNon-Operating Expenses
Non-cash expenses are excluded from this chart as there is no budgetary impact. Pension Expenses for 2014 and before wereincluded in Salaries and Wages. See the debt service section for information regarding annual debt service payments.
O’HARE AIRPORT FUND EXPENDITURES

A n n u a l F i n a n c i a l A n a l y s i s 2 0 1 8
67
Historic Revenue and Expense Review
Prior to 2015, the direct pension expense was recorded as a reimbursement to the Corporate Fund. Beginning with the 2015 budget, the O’Hare Airport Fund’s direct pension expenses were budgeted as a defined budget item.
Midway Airport Fund
In 2017, total operating, non-operating, and capital grant revenues in the Midway Airport Fund were $281.8 million, an increase of $21.0 million from 2016. Landing fees were
$95.4 million in 2017, or 48.9 percent of total Midway Airport operating revenues. Revenues from rents and concessions, including auto parking and rentals, restaurants and gifts, were $99.6 million in 2017, or 51.1 percent of total 2017 Midway Airport operating revenues.
The Chicago Midway Airport Fund’s operating expenses before depreciation and amortization for 2017 decreased $1.1 million from the year ended 2016. Operating expenses exclusive of pension expense decreased by $3.9 million in
2008
2009
2010
2011
2012
2013
2014
2015
2016
2017
$179
.2M
$170
.3M $1
93.1
M $221
.7M
$210
.8M
$227
.3M
$226
.6M
$238
.6M $260
.8M
$281
.8M
Rents, Concessions, and OtherLanding Fees, Terminal Area Use Charges
Non-Operating RevenuesCapital Grants
MIDWAY AIRPORT FUND REVENUES
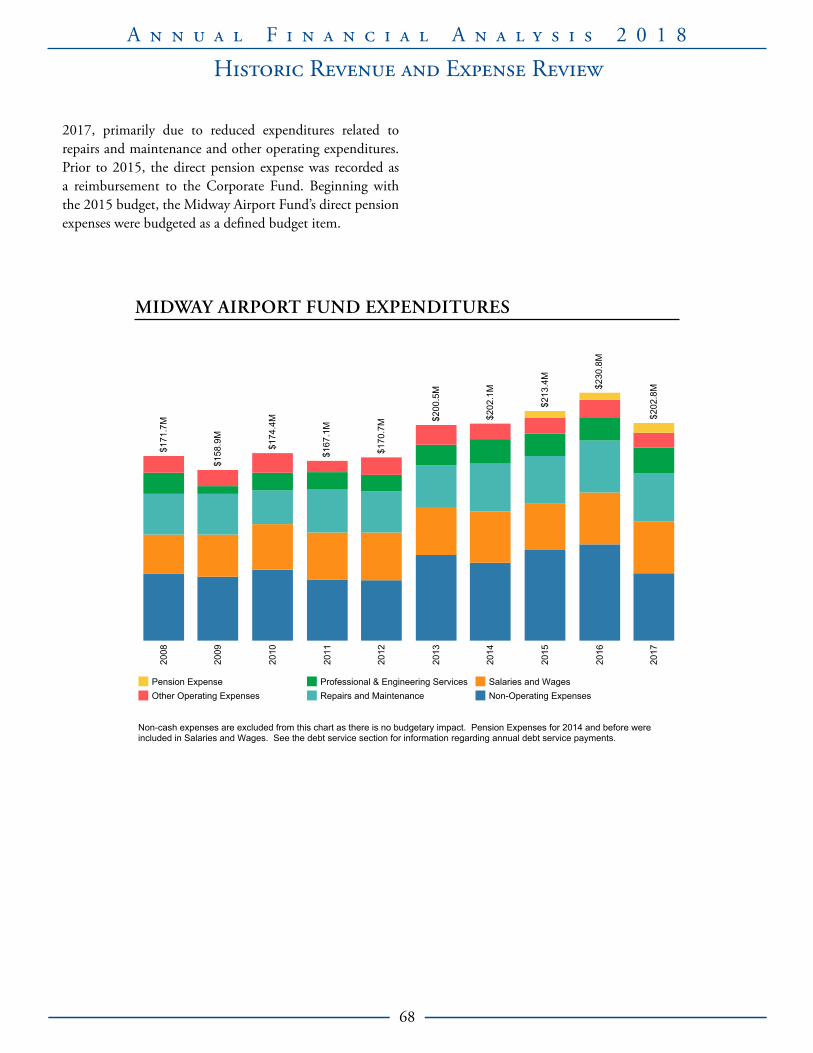
A n n u a l F i n a n c i a l A n a l y s i s 2 0 1 8
68
Historic Revenue and Expense Review
2017, primarily due to reduced expenditures related to repairs and maintenance and other operating expenditures. Prior to 2015, the direct pension expense was recorded as a reimbursement to the Corporate Fund. Beginning with the 2015 budget, the Midway Airport Fund’s direct pension expenses were budgeted as a defined budget item.
2008
2009
2010
2011
2012
2013
2014
2015
2016
2017
$171
.7M
$158
.9M
$174
.4M
$167
.1M
$170
.7M $2
00.5
M
$202
.1M
$213
.4M
$230
.8M
$202
.8M
Pension ExpenseOther Operating Expenses
Professional & Engineering ServicesRepairs and Maintenance
Salaries and WagesNon-Operating Expenses
Non-cash expenses are excluded from this chart as there is no budgetary impact. Pension Expenses for 2014 and before wereincluded in Salaries and Wages. See the debt service section for information regarding annual debt service payments.
MIDWAY AIRPORT FUND EXPENDITURES

A n n u a l F i n a n c i a l A n a l y s i s 2 0 1 8
69
GRANT FUNDS
The City receives grant funds from federal and State agencies along with foundations, and other private entities. Grant funding supports a wide array of City services and functions. These revenues are reported as a major governmental fund in the City’s basic financial statements.
Grants are received throughout the year with varying expenditure deadlines depending on the goals and fiscal calendar of the grantor. For example, grants from the federal government often follow an October to September fiscal year and are intended to be used to support programs for a specific period of time. State grant funds typically follow a July to June fiscal year.
The City allocates grant funds in adherence with grantor timetables and specifications. Therefore, although grant dollars are awarded in a specific year, grants that are intended for use over a longer period of time, such as infrastructure grants, may not fully be expended in the year the grant was awarded. The City budgets the entire grant award in the year
it is anticipated to be awarded, and the amounts remaining at the end of that year are carried over into the next year’s budget; this funding is called carryover funding. Typically, infrastructure funding, certain public safety grants, and public health grants are multi-year appropriations from the federal and state governments; while many community development and community service grants are annual appropriations.
While the level of grant funding varies from year-to-year with the availability of grants that meet the City’s needs as well as the City’s ability to obtain those grants, the overall level of grant funding has decreased in recent years. This is primarily a result of the phase out of federal stimulus funding in 2013. From 2009 to 2013, the City received over $1.35 billion in stimulus funding from the American Recovery and Reinvestment Act, which provided one-time grants to be used for a variety of job assistance programs and other community needs. Grant fund revenues for 2017 increased by $156.0 million compared to prior year revenues. This increase of 12 percent is primarily due to increases in federal funding from the United States Department of
Historic Revenue and Expense Review
2008
2009
2010
2011
2012
2013
2014
2015
2016
2017
$1,4
21.1
M $1,6
87.3
M $1,9
71.3
M
$1,7
01.7
M
$1,7
89.0
M
$1,5
54.8
M
$1,3
33.6
M
$1,3
34.4
M
$1,2
77.2
M
$1,4
33.1
M
Federal State Stimulus Federal Public /Private Program Income
Please note the amounts listed above reflect actual grant funding received through 2017. The amounts include both new grant funds for the yearand any carryover amounts from previous years. Please see the Expenditure section for how funds were spent.
GRANT FUNDING SOURCES

A n n u a l F i n a n c i a l A n a l y s i s 2 0 1 8
70
Transportation for the Surface Transportation Construction program, Transportation Alternatives program, and Major Bridge programs, as well as State Only Chicago Commitment funding from the Illinois Department of Transportation. Other increases are attributed to funding from the Federal Aviation Administration to support various Airport Improvement programs.
Expenditure amounts reflected in the chart and discussed below include any carryover grant funding. The expenditures provided below reflect the grant funding actually spent in a given year, whether carryover or new grant funds.
Grant funding provides a portion of the funding needed to support programs and services delivered by the City. It is often paired with corporate funding or other City dollars and is used to leverage private dollars to fund critical investments in community services, affordable housing, public safety and infrastructure.
Community Services
Many community service programs provided through the Department of Family and Support Services (‘DFSS”), the Chicago Department of Public Health (“CDPH”), the Chicago Public Library, and the Mayor’s Office for People with Disabilities are funded through federal, State and private grants. Approximately 33 percent of the City’s annual grant funding supports community service programs.
Community service grant funding supports a wide range of activities, including job training and workforce development, childcare and early learning services, homeless shelters and other homeless services, prisoner re-entry programs, bioterrorism preparedness, HIV/AIDS prevention, senior support services, programs for people with disabilities, and funding for library renovations and library programs. For example, the DFSS Homeless Division receives federal and State grants along with City tax and non-tax revenues. DFSS utilizes $28.7 million in grant funds annually to provide over 3,000 beds in overnight and interim housing shelters, outreach and engagement to approximately 5,000
Historic Revenue and Expense Review
2008
2009
2010
2011
2012
2013
2014
2015
2016
2017
$1,4
21.1
M $1,6
87.3
M $1,9
71.3
M
$1,7
01.7
M
$1,7
89.0
M
$1,5
54.8
M
$1,3
33.6
M
$1,3
34.4
M
$1,2
77.2
M
$1,4
33.1
M
Infrastructure Services (Aviation)Infrastructure Services (Non-Aviation)Community Services
City DevelopmentPublic SafetyRegulatory
Finance and Administration
Please note the amounts listed above reflect actual grant funding spent through 2017. The amounts include both new grant spending for the yearand any carryover amounts from previous years. Beginning in 2012, the Chicago Department of Aviation grants are broken out from all otherinfrastructure services grant funding to better account for this funding.
GRANT FUNDING USES

A n n u a l F i n a n c i a l A n a l y s i s 2 0 1 8
71
individuals living on the streets, emergency rental assistance, services for homeless prevention, and permanent housing services.
Additionally, the CDPH receives multiple federal grants to support various HIV/AIDS programs providing outreach, testing, medical assistance, and housing for people living with HIV/AIDS. The $27.5 million Ryan White Part A program funded by the U.S. Department of Health and Human Services is an example of one of the grants providing 3,600 Chicagoans living with HIV with access to primary care and support services annually.
Infrastructure Services
Infrastructure Services includes grant expenditures related to the Department of Aviation, Chicago Department of Transportation (“CDOT”), Department of Water Management, and Department of Streets and Sanitation. Approximately 28 percent of the City’s annual grant funds support infrastructure work administered by these departments.
CDOT receives the most grant funding of any City department, and many Chicago transportation-related projects are funded, at least in part, through State or federal grants. In 2017, CDOT utilized $18.7 million from the Transportation Investments Generating Economic Recovery grants – a highly competitive federal grant program – to support construction of the 41st Street Pedestrian and Bicycle Bridge at Lake Shore Drive. Additionally, CDOT annually receives $160.0 million in federal Surface Transportation Program (“STP”) funds for transportation improvement projects in the City. STP funds are the primary source of funding used to pay for resurfacing of arterial streets and constructing the associated sidewalk accessibility ramps throughout Chicago.
Aviation
In the Grant Funding Uses chart, all aviation grant funds were included as part of total infrastructure grant funding until 2012. Given the size and scope of aviation related grants, beginning in 2012, the City separated out aviation grant funds from other infrastructure grants. Aviation grants make up 17 percent of the City’s annual grant funding. While the majority of these grants pay for infrastructure projects such as airport improvements and noise mitigation,
O’Hare and Midway airports combined receive nearly $53 million annually from the Transit Security Administration (“TSA”) for public safety purposes.
City Development
The Department of Planning and Development (“DPD”) and the Department of Cultural Affairs and Special Events are the primary recipients of grant funding for city development functions. City development grants make up 8.0 percent of the City’s total annual grant awards.
In 2017, DPD utilized $7.6 million in funds from the Resilient Corridors Project to construct landscapes designed for stormwater collection funded through the U.S. Department of Housing and Urban Development’s Community Development Block Grant Disaster Recovery program. This large-scale construction project will create jobs and protect neighborhoods from flooding. Additionally, through the Conservation Innovation Grant (CIG) program, DPD received $1 million in funding from the US Department of Agriculture to create an urban farming system based in Englewood. CIG aims to help potential farmers establish businesses in the agricultural industry and expand farming as a career option for Chicago residents.
Public Safety
Collectively, the Office of Emergency Management and Communications, the Chicago Police Department (“CPD”), and the Chicago Fire Department receive a significant portion of the City’s overall grant funding, approximately 12 percent annually.
The Department of Homeland Security grant programs, including the Urban Area Security Initiative, Transit Security Grant Program, Port Security Grant Program, and the National Explosives Detection Canine Team Program, provided $126.1 million in new and carryover grant funding for public safety expenses in 2017. This grant funding is for equipment purchases, training, and personnel that support public safety activities.
A $1.39 million Department of Justice grant helped to pay for the initial expansion of body cameras in CPD. This grant funding, coupled with City tax revenue, allowed the City to fully expand body cameras to every police district in Chicago by the end of 2017.
Historic Revenue and Expense Review

A n n u a l F i n a n c i a l A n a l y s i s 2 0 1 8
72
Regulatory Functions
The majority of the City’s regulatory grant funding supports conservation and environmental programs, including weatherization, electrical vehicle support, and alternative fuel development, and is managed largely by the Department of Fleet and Facility Management. Smaller amounts of grant funding are dedicated to code enforcement and vacant building demolition activities administered by the Department of Buildings. Approximately 1.0 percent of the City’s annual grant funding supports these types of programs.
Finance and Administration
The Office of Budget and Management, the Department of Innovation and Technology, the Department of Finance, and the Department of Law receives 1.0 percent of the City’s annual grant budget and is funded through indirect cost recovery necessary to fulfill finance and administrative functions for the management of the City’s grant funds.
Community Development Block Grant
The Community Development Block Grant (“CDBG”) program provides grant funding each year to support community development services targeted to low- and moderate-income neighborhoods. The City’s 2017 budget included $81.1 million in CDBG funding. Approximately 49 percent of CDBG’s annual grant funding supports critical public services to individuals in need, including homeless prevention, workforce development, domestic violence, mental health, and senior and disability services. In addition, 34 percent of the funding supports housing initiatives that help residents find and maintain affordable housing. While CDBG is less than 10 percent of the City’s annual grant budget, it helps to support many critical programs throughout Chicago. In 2017, the CDBG program supported:
• Code enforcement activities to inspect vacant and abandoned buildings, to identify deteriorating properties or properties with building code violations, to prevent public safety hazards, and to preserve the affordable housing stock. These activities are supported by $7 million in CDBG funding.
• Homeless services for persons and families experiencing homelessness or at imminent risk of homelessness. These programs assist in attaining or maintaining safe and secure housing to achieve self-sufficiency; $4.2 million in CDBG funds support this effort.
• The Neighborhood Lending program provides $3.5 million to increase units of permanent affordable housing across the city.
• Domestic violence services provides $2.5 million in assistance and advocacy to those who have been victims of domestic violence (physical, sexual, or emotional abuse), including teens who have been victimized in an intimate relationship.
Historic Revenue and Expense Review

Property Tax Funds
Annual Financial Analysis2018


A n n u a l F i n a n c i a l A n a l y s i s 2 0 1 8
75
Property Tax Funds
PROPERTY TAX
The City levies ad valorem real property taxes pursuant to its authority as a home rule unit of local government under the Illinois Constitution of 1970. Real property taxes represent the single largest revenue source for the City. As part of the City’s budget process each year, the City determines the aggregate property tax levy that will be levied in the next fiscal year and collected in the following year.
A portion of the revenues the City receives from its general property tax levy is derived within the City’s TIF districts. The TIF section of this document discusses property-tax-derived revenue for the City’s TIF program, project bonds and notes, expenditures, and TIF surplus.
Real Property Assessment, Tax Levy and Collection Procedures
The City’s aggregate property tax levy is divided by the equalized assessed valuation, (“Equalized Assessed Valuation” or “EAV”) of all property in the City to determine the tax rate that will be applied to an individual taxpayer’s property. The tax rate is then applied to the EAV of the taxpayer’s property to determine the City portion of an individual taxpayer and property tax bill. Changes in EAV do not affect the amount of the City’s property tax revenue because the City’s property taxes are levied at a flat dollar amount.
Information under this caption provides a general summary of the current procedures for real property assessment, tax levy and tax collection in Cook County (“County”). The following is not an exhaustive discussion, nor can there be any assurance that the procedures described under this caption will not be changed either retroactively or prospectively. The Illinois laws relating to real property taxation are contained in the Illinois Property Tax Code (“Property Tax Code”).
Substantially all (approximately 99.99 percent) of the Equalized Assessed Valuation of taxable property in the City is located in the County. The remainder of the City’s Equalized Assessed Valuation is located in DuPage County. Unless otherwise indicated, the information set forth under this caption with respect to taxable property in the City does not reflect the portion situated in DuPage County.
Assessment
The Cook County Assessor (“Assessor”) is responsible for the assessment of all taxable real property within the County, except for certain railroad property and pollution control equipment assessed directly by the State. One-third of the real property in the County is reassessed each year on a repeating triennial schedule established by the Assessor. The suburbs in the northern and northwestern portions of the County were reassessed in 2016. The suburbs in the western and southern portions of the County were reassessed in 2017. The City is being reassessed in 2018.
Real property in the County is separated into various classifications for assessment purposes. After the Assessor establishes the fair cash value of a parcel of land, that value is multiplied by one of the classification percentages to arrive at the assessed valuation (“Assessed Valuation”) for the parcel. Beginning with the 2009 tax year, the classification percentages range from 10.0 to 25.0 percent depending on the type of property (e.g., residential, industrial, commercial) and whether it qualifies for certain incentives for reduced rates. For prior years, the classification percentages ranged from 16.0 to 38.0 percent.
The Cook County Board of Commissioners has adopted various amendments to the County’s Real Property Assessment Classification Ordinance (“Classification Ordinance”), pursuant to which the Assessed Valuation of real property is established. Among other things, these amendments have reduced certain property classification percentages, lengthened certain renewal periods of classifications and created new property classifications.
The Assessor has established procedures enabling taxpayers to contest the Assessor’s tentative Assessed Valuations. Once the Assessor certifies final Assessed Valuations, a taxpayer can seek review of its assessment by the Cook County Board of Review (“Board of Review”). The Board of Review has powers to review and adjust Assessed Valuations set by the Assessor. Owners of property are able to appeal decisions of the Board of Review to the Illinois Property Tax Appeal Board (“PTAB”), a State-wide administrative body, or to the Circuit Court of Cook County (“Circuit Court”). The PTAB has the power to determine the Assessed Valuation of real property based on equity and the weight of the evidence. Based on the amount of the proposed change in assessed valuation, taxpayers may appeal decisions of the PTAB to

A n n u a l F i n a n c i a l A n a l y s i s 2 0 1 8
76
either the Circuit Court or the Illinois Appellate Court under the Illinois Administrative Review Law.
As an alternative to seeking review of Assessed Valuations by the PTAB, taxpayers who have first exhausted their remedies before the Board of Review may file an objection in the Circuit Court. The City filed a petition to intervene in certain of these proceedings for the first time in 2003, but the Circuit Court denied the City’s petition in early 2004. The City appealed the Circuit Court decision. On appeal, the Circuit Court decision was reversed and the matter was remanded to the Circuit Court with instructions to allow the City to proceed with its petitions to intervene. In addition, in cases where the Assessor agrees that an assessment error has been made after tax bills have been issued, the Assessor can correct the Assessed Valuation, and thus reduce the amount of taxes due, by issuing a Certificate of Error.
Equalization
After the Assessed Valuation for each parcel of real estate in a county has been determined for a given year including any revisions made by the Board of Review, the Illinois Department of Revenue reviews the assessments and determines an equalization factor (“Equalization Factor”), commonly called the “multiplier,” for each county. The purpose of equalization is to bring the aggregate assessed
value of all real property, except farmland, wind turbines with a nameplate capacity of at least 0.5 megawatts and undeveloped coal, in each county to the statutory requirement of 33-1/3 percent of estimated fair cash value. Adjustments in Assessed Valuation made by the PTAB or the courts are not reflected in the Equalization Factor. The Assessed Valuation of each parcel of real estate in the County is multiplied by the County’s Equalization Factor to determine the parcel’s Equalized Assessed Valuation.
The Equalized Assessed Valuation for each parcel is the final property valuation used for determination of tax liability. The aggregate Equalized Assessed Valuation for all parcels in any taxing body’s jurisdiction, after reduction for all applicable exemptions, plus the valuation of property assessed directly by the State, constitutes the total real estate tax base for the taxing body and is the figure used to calculate tax rates (“Assessment Base”). The Equalization Factor for a given year is used in computing the taxes extended for collection in the following year.
Exemptions
The Illinois Constitution allows homestead exemptions for residential property. Pursuant to the Illinois Property Tax Code, property must be occupied by the owner as a principal residence on January 1 of the tax year for which
Property Tax Funds
Tax Levy Year (2) Class 2 (3) Class 3 (4) Class 5 (5) Other (6) Total
State Equalization Factor (7)
Total Equalized Assessed Value (8)
Total District Tax Rate
Total Estimated Fair Cash Value (9)
Total Equalized Assessed Value as a Percentage of Total
Estimated Fair Cash Value2007 $18,937,256 $1,768,927 $12,239,086 $678,196 $33,623,465 2.8439 $73,645,316 1.044 $320,503,503 23.02008 19,339,574 1,602,768 12,359,537 693,239 33,995,118 2.9786 80,977,543 1.030 310,888,609 26.12009 18,311,981 1,812,850 10,720,244 592,364 31,437,439 3.3701 84,685,258 0.986 280,288,730 30.22010 18,074,177 1,416,863 10,467,682 606,941 30,565,663 3.3000 82,087,170 1.020 231,986,396 35.42011 17,932,671 1,116,175 10,456,103 588,672 30,093,621 2.9706 75,122,914 1.110 222,856,064 33.72012 15,529,678 1,208,620 10,233,051 498,310 27,469,659 2.8056 65,250,387 1.279 206,915,723 31.52013 15,410,659 1,236,401 10,172,186 494,714 27,313,960 2.6621 62,363,876 1.344 236,695,475 26.32014 15,390,835 1,298,776 10,124,569 512,390 27,326,570 2.7253 64,908,057 1.327 255,639,792 25.32015 17,296,324 1,532,714 11,269,605 592,903 30,691,546 2.6685 70,963,289 1.672 278,027,604 25.52016 17,191,167 1,598,117 11,369,258 603,849 30,762,391 2.8032 74,016,506 1.752 293,121,793 25.3
(1)(2)(3)(4)(5)(6)(7)(8)
(9)
Assessed Value (1)
Taxes for each year become due and payable in the following year. For example, taxes for the 2016 tax levy became due and payable in 2017.Residential, six units and under.Residential, seven units and over and mixed use.Industrial/commercial.Vacant, not-for-profit and industrial/commercial incentive classes.Source: Illinois Department of Revenue.
railroad property.Source: The Civic Federation. Excludes railroad property, pollution control facilities and portion of the City in DuPage County.
ASSESSED, EQUALIZED ASSESSED AND ESTIMATED VALUE OF ALL TAXABLE PROPERTY 2007 – 2016$ Thousands

A n n u a l F i n a n c i a l A n a l y s i s 2 0 1 8
77
the exemption will be claimed.
The Property Tax Code specifies a variety of exemptions available to property owners in the County. Such exemptions include a general homestead exemption available to all homeowners, exemptions available to senior citizens, veterans of the armed forces and their spouses and persons with disabilities and exemptions for homes that have been improved and homes damaged by natural disasters.
Aside from homestead exemptions, upon application, review and approval by the Board of Review, or upon an appeal to the Illinois Department of Revenue, there are exemptions generally available for properties of religious, charitable (including qualifying not-for-profit hospitals), and educational organizations, as well as units of federal, State and local governments.
Finally, pursuant to authority granted to counties to grant special property tax exemptions in long-established residential areas or in areas of deteriorated, vacant or abandoned homes and properties, the County enacted the Longtime Homeowner Exemption Ordinance, which provides property tax relief from dramatic rises in property taxes directly or indirectly attributable to gentrification in the form of an exemption.
Tax Levy
There are over 800 units of local government (“Units”) located in whole or in part in the County that have taxing power. The major Units having taxing power over property within the City are the City, the Chicago Park District, the Board of Education of the City of Chicago, Community College District No. 508, the Metropolitan Water Reclamation District of Greater Chicago, the County and the Forest Preserve District of Cook County.
Each Unit annually determines the amount of real estate taxes it will levy each year and certifies its real estate tax levy to the County Clerk’s Office. The remaining administration and collection of the real estate taxes is statutorily assigned to the County Clerk and the County Treasurer, who is also the County Collector.
After the Units file their annual tax levies, the County Clerk computes the annual tax rate for each Unit by dividing the levy of each Unit by the Assessment Base of the respective
Unit. If any tax rate thus calculated or any component of such a tax rate (such as a levy for a particular fund) exceeds any applicable statutory rate limit, the County Clerk disregards the excessive rate and applies the maximum rate permitted by law.
The County Clerk then computes the total tax rate applicable to each parcel of real property by aggregating the tax rates of all the Units having jurisdiction over the particular parcel. This information is provided to the County Collector and is used by the County Collector as the basis for issuing tax bills to all property owners.
Collection
Property taxes are collected by the County Collector, who remits to each Unit its share of the collections. Taxes levied in one year become payable during the following year in two installments, the first due on March 1 and the second on the later of August 1 or 30 days after the mailing of the tax bills. The first installment is an estimated bill calculated at 55 percent of the prior year’s tax bill. The second installment is for the balance of the current year’s tax bill, and is based on the current levy, Assessed Valuation and Equalization Factor and applicable tax rates, and reflects any changes from the prior year in those factors. Taxes on railroad real property used for transportation purposes are payable in one lump sum on the same date as the second installment.
The following table sets forth the second installment penalty date for the tax years 2008 to 2017; the first installment penalty date has been March 1, 2 or March 3 for all years.
The Property Tax Code sets forth a process for collecting unpaid property taxes. At the end of each collection year, the County Collector applies to the Circuit Court for a
Property Tax Funds
Second InStallment
tax Year PenaltY date
2017 August 1, 20182016 August 1, 20172015 August 1, 20162014 August 3, 20152013 August 1, 20142012 August 1, 20132011 November 1, 20122010 November 1, 20112009 November 13, 20102008 December 1, 2009

A n n u a l F i n a n c i a l A n a l y s i s 2 0 1 8
78
judgment for all unpaid taxes. The court order resulting from the application for judgment provides for an annual sale of all unpaid taxes shown on the year’s Warrant Books. The Annual Tax Sale is a public sale which allows tax buyers to pay the unpaid taxes plus penalties on a property and, if no redemption of the property is made within the applicable time period under the Property Tax Code, to receive the deed to the property. If the property is not sold at the Annual Tax Sale, the taxes are forfeited and eligible to be purchased at any time thereafter at an amount equal to all delinquent taxes, interest and certain other costs to the date of purchase (subject to the same redemption period as applicable to properties sold at the Annual Tax Sale).
A scavenger sale (“Scavenger Sale”), like the Annual Tax Sale, is a sale of unpaid taxes. A Scavenger Sale must be held, at a minimum, every two years on all property in which taxes are delinquent for two or more years. The sale price of the unpaid taxes is the amount bid at the Scavenger Sale, which may be less than the amount of the delinquent taxes. Redemption periods vary from six months to two and one-half years depending upon the type and occupancy of the property.
The annual appropriation ordinance of the City has a
provision for an allowance for uncollectible taxes. The City reviews this provision annually to determine whether adjustments are appropriate. For tax year 2017, collectible in 2018, the allowance for uncollectible taxes is approximately four percent of the estimated gross tax levy. For financial reporting purposes, uncollected taxes are written off by the City after four years, but are fully reserved after one year.
Property Tax Limit Considerations
Illinois law provides certain limitations on the levy of taxes and the issuance of debt by units of government. However, as a home rule unit of government, many of these limitations do not apply to the City. Specifically, under the Constitution and current law, the City is not subject to limitations on the amount of debt that it may issue payable from ad valorem property taxes and (ii) the City is not subject to the provisions of the Property Tax Extension Limitation Law of the State of Illinois (“State Tax Cap”) which limits the extension of real property taxes by certain Illinois units of government.
In 1993, the City Council of Chicago adopted an ordinance (“Chicago Property Tax Limitation Ordinance”) limiting, beginning in 1994, the City’s aggregate property tax levy to an amount equal to the prior year’s aggregate property tax levy (subject to certain adjustments) plus the lesser of (a)
Property Tax Funds
Tax Levy Year (2)
Total Tax Levy for Fiscal Year
(3)(4) AmountPercentage of
Levy
Collections in Subsequent
Years Amount
Percent of Total Tax Collections
to Tax Levy
Estimated Allowance for Uncollectible
Taxes
Net Outstanding
Taxes Receivable
2008 $834,152 $776,522 93.1 $31,942 $808,464 96.9 $25,6882009 834,109 700,579 84.0 99,463 800,042 95.9 34,0672010 834,089 790,141 94.7 14,576 804,717 96.5 29,3722011 833,948 800,582 96.0 3,443 804,025 96.4 29,9232012 834,636 804,245 96.4 9,129 813,374 97.5 21,2622013 838,254 807,985 96.4 11,876 819,861 97.8 18,3932014 861,416 832,042 96.6 14,757 846,799 98.3 14,354 $2632015 1,186,625 1,156,428 97.5 18,446 1,174,874 99.0 11,516 2352016 1,296,899 1,271,653 98.1 1,271,653 98.1 24,489 7572017 1,357,988 N/A N/A 54,190 1,303,798
(1)(2)(3)(4)
Collected Within Fiscal Year Total Collections to Date
Source: .Taxes for each year become due and payable in the following year. For example, taxes for the 2017 tax levy become due and payable in 2018.Does not include levy for Special Service Areas and Tax Increment Projects.Does not include the levy for the Schools Building and Improvement Fund, which is accounted for in an agency fund.
PROPERTY TAXES FOR ALL CITY FUNDS, COLLECTIONS AND ESTIMATED ALLOWANCE FOR UNCOLLECTIBLE TAXES 2008–2017 (1) $ Thousands

A n n u a l F i n a n c i a l A n a l y s i s 2 0 1 8
79
five percent or (b) the percentage increase in the annualized Consumer Price Index for all urban consumers for all items, as published by the United States Department of Labor, during the 12-month period most recently announced prior to the filing of the preliminary budget estimate report. The Chicago Property Tax Limitation Ordinance also provides that such limitation shall not reduce that portion of each levy attributable to the greater of: (i) for any levy year, interest and principal on general obligation notes and bonds of the City outstanding on January 1, 1994, to be paid from collections of the levy made for such levy year, or (ii) the amount of the aggregate interest and principal payments on the City’s general obligation bonds and notes during the 12-month period ended January 1, 1994, subject to annual increase in the manner described above for the aggregate levy (“Safe Harbor”). Additional Safe Harbors are provided for portions of any levy attributable to payments under installment contracts or public building commission leases or attributable to payments due as a result of the refunding of general obligation bonds or notes or of such installment contracts or leases.
Use of City Property Tax Levy
Revenue from the City’s property tax levy has been utilized primarily to pay the City’s debt service and employer pension contributions. A small amount of the levy is allocated to the library system.
The amounts and tax rates of the City’s property tax levy for debt service and employer pension contribution by pension fund are set forth in the following tables for the years indicated.
The aggregate property tax levies over the period 2008 through 2013 remained relatively constant. The increase in 2014 was primarily due to property tax surpluses from TIF district terminations and did not represent an increase in the total tax levy for that year. The majority, $318 million, of the tax levy increase in 2015 reflects the first year of a $543 million 4-year phase in of higher property taxes to fund for the City’s retirement systems.
The City is one of several taxing districts reflected on a Chicago resident’s property tax bill. The amount of property taxes collected by Cook County is divided among these districts, with the City allocated approximately 24 percent of the typical bill.
Overlapping Taxing Districts
Various governmental entities operate as separate, independent units of government and have authority to issue bonds and levy taxes on real property within the City. These governmental entities, or overlapping taxing districts, are the Board of Education of the City of Chicago; the County; the Metropolitan Water Reclamation District of Greater Chicago; the Chicago Park District; Community College District Number 508; County of Cook and State of Illinois; and the Cook County Forest Preserve District.
Most of the overlapping taxing districts lack home rule status; accordingly, the amount by which they can increase their annual property tax levy is limited by the State Tax Cap unless they obtain voter approval and/or State legislative authorization.
Property Tax Funds
2008 2009 2010 2011 2012 2013 2014 2015 2016 2017
Note Redemption and Interest(3) $73,363 $73,363 $73,377 $73,377 $73,481 $74,231 $97,061 $97,708 $80,359 $80,412
Bond Redemption and Interest 414,853 409,512 409,979 411,905 411,489 411,807 412,139 411,730 430,584 438,576
PABF 139,640 141,741 140,165 143,785 143,865 138,146 136,680 361,987 455,355 490,636MEABF 131,344 130,026 132,531 126,997 129,138 122,066 123,239 124,706 124,706 124,694FABF 65,426 66,140 64,323 66,125 65,461 81,518 81,363 179,424 194,825 212,601LABF 9,526 13,327 13,714 11,759 11,202 10,486 10,934 11,070 11,070 11,069Total $834,152 $834,109 $834,089 $833,948 $834,636 $838,254 $861,416 $1,186,625 $1,296,899 $1,357,988
(1)(2) Does not include the levy for the School Building and Improvement Fund which is accounted for in an agency fund.(3) Includes Corporate, Chicago Public Library Maintenance and Operations, Chicago Public Library Building and Sites, and City Relief Funds.
PROPERTY TAX LEVIES 2008-2017 (1)(2)$ Thousands

A n n u a l F i n a n c i a l A n a l y s i s 2 0 1 8
80
Property Tax Funds
Tax Levy Year
Tax Extension (2) (3)
Bond, Note Redemption
and Interest (3)Annuity and
Benefit
Municipal
Annuity and Benefit
Annuity and Benefit
Retirement Board
Annuity and Benefit Total
2008 $834,152 $0.602842 $0.172426 $0.162182 $0.080787 $0.011763 $1.0302009 834,109 0.570806 0.167552 0.153704 0.078184 0.015754 0.9862010 834,089 0.588774 0.170734 0.161435 0.078352 0.016705 1.0162011 833,948 0.645918 0.191381 0.169036 0.088014 0.015651 1.1102012 834,636 0.743170 0.220459 0.197892 0.100313 0.017166 1.2792013 838,254 0.779280 0.221494 0.195703 0.130700 0.016813 1.3442014 861,416 0.784415 0.210554 0.189848 0.125339 0.016844 1.3272015 1,186,625 0.717817 0.510054 0.175716 0.252815 0.015598 1.6722016 1,296,899 0.690240 0.615146 0.168467 0.263192 0.014955 1.7522017 1,357,987 0.676071 0.639138 0.162434 0.276949 0.014419 1.769
(1)(2) Does not include levy for Special Service Areas and net of collections for TIF districts.(3) Does not include the levy for the Schools Building and Improvement Fund, which is accounted for in an agency fund.(4) Includes rates from the Chicago Public Library Bond, Note Redemption and Interest Fund.
PROPERTY TAX RATES PER $100 OF EQUALIZED ASSESSED VALUATION 2008-2017 (1) $ Thousands
Tax Levy Year City
City of Chicago School Building & Improvement Fund
Chicago School Finance Authority
Chicago Board of
EducationCity Colleges
of ChicagoChicago Park
DistrictMetropolitan Water Reclamation District
Forest Preserve District of Cook
CountyCook
County Total2008 $1.030 $0.117 $0.000 $2.472 $0.156 $0.323 $0.252 $0.051 $0.415 $4.8162009 0.986 0.112 - 2.366 0.15 0.309 0.261 0.049 0.394 4.6272010 1.016 0.116 - 2.581 0.151 0.319 0.274 0.051 0.423 4.9312011 1.11 0.119 - 2.875 0.165 0.346 0.32 0.058 0.462 5.4552012 1.279 0.146 - 3.422 0.19 0.395 0.37 0.063 0.531 6.3962013 1.343 0.152 - 3.671 0.199 0.42 0.417 0.069 0.56 6.8322014 1.327 0.146 - 3.66 0.193 0.415 0.43 0.069 0.568 6.8082015 1.672 0.134 - 3.455 0.177 0.382 0.426 0.069 0.552 6.8672016 1.752 0.128 - 3.726 0.169 0.368 0.406 0.063 0.533 7.1452017 1.769 0.124 - 3.89 0.164 0.352 0.402 0.062 0.496 7.259
(1)
COMBINED PROPERTY TAX RATES OF THE CITY AND OTHER MAJOR GOVERNMENTAL UNITS PER $100 OF EQUALIZED ASSESSED VALUATION 2008-2017(1)$ Thousands

Pension Benefits Provided By The City
Annual Financial Analysis2018


A n n u a l F i n a n c i a l A n a l y s i s 2 0 1 8
83
Pension Benefits Provided By The City
PENSION BENEFITS PROVIDED BY THE CITY
Pursuant to the Illinois Pension Code, as revised from time to time (“Pension Code”), the City contributes to four retirement funds (“Retirement Funds”), which provide benefits upon retirement, death or disability to members of the Retirement Funds and their beneficiaries. The Retirement Funds are, in order from largest to smallest membership: (i) the Municipal Employees’ Annuity and Benefit Fund of Chicago (“MEABF”); (ii) the Policemen’s Annuity and Benefit Fund of Chicago (“PABF”); (iii) the Firemen’s Annuity and Benefit Fund of Chicago (“FABF”); and (iv) the Laborers’ and Retirement Board Employees’ Annuity and Benefit Fund of Chicago (“LABF”). The Retirement Funds’ membership consists primarily of current and former employees of the City and their beneficiaries.
The Retirement Funds are established, administered and financed under the Pension Code, as separate corporate bodies and for the benefit of the members of the Retirement Funds and their beneficiaries. The City’s contributions to the Retirement Funds, and benefits for members of the Retirement Funds and their beneficiaries, are governed by the provisions of the Pension Code. No assurance can be made that the Pension Code will not be amended in the future.
The information contained in this section relies in part on information produced by the Retirement Funds, their independent accountants and their independent actuaries (the “Source Information”). Neither the City nor the City’s independent auditors have independently verified the Source Information and make no representations nor express any opinion as to the accuracy of the Source Information.
Furthermore, where the tables in this section present aggregate information regarding the Retirement Funds, such combined information results solely from the application of arithmetic to the data presented in the Source Information and may not conform to the requirements for the presentation of such information by the Governmental Accounting Standards Board (“GASB”).
Certain of the audited financial statements or comprehensive annual financial reports of the Retirement Funds (each a “Retirement Fund Audit” and together the “Retirement
Fund Audits”), and certain of the actuarial valuations of the Retirement Funds (each, an “Actuarial Valuation” and together, the “Actuarial Valuations”), may be obtained by contacting the Retirement Funds. Certain of these reports may also be available on the Retirement Funds’ websites (www.meabf.org; www.chipabf.org; www.labfchicago.org; and www.fabf.org); provided, however, that the contents of these reports and of the Retirement Funds’ websites are not incorporated herein by such reference.
The Retirement Funds typically release their Actuarial Valuations in the April or May following the close of their respective fiscal years on December 31. All of the Retirement Funds have released their Actuarial Valuations and Retirement Fund Audits for the fiscal year ended December 31, 2017.
Background Information Regarding the Retirement Funds
Each of the Retirement Funds is a single-employer, defined-benefit public employee retirement system. To fund the benefits to be paid by a defined-benefit pension plan, both employees and employers make contributions to the plan. The benefits available under the Retirement Funds accrue throughout the time an employee is employed by the City. Although the benefits accrue during employment, certain age and service requirements must be achieved by an employee to generate a retirement or survivor’s periodic defined benefit payment upon retirement or termination from the City. The Retirement Funds also provide certain disability benefits and retiree healthcare benefits to eligible members.
Section 5 of Article XIII of the Illinois Constitution (“Pension Clause”) provides as follows:
“Membership in any pension retirement system of the State, any unit of local government or school district, or any agency or instrumentality thereof, shall be an enforceable contractual relationship, the benefits of which shall not be diminished or impaired.”
The members of the Retirement Funds are divided into separate tiers based on the date on which they became a member of a Retirement Fund. Employees who became members of the Retirement Funds prior to January 1, 2011, are referred to as “Tier One Members,” while employees who became members after January 1, 2011 are referred

A n n u a l F i n a n c i a l A n a l y s i s 2 0 1 8
84
to as “Tier Two Members.” Tier Two Members receive less generous benefits than Tier One Members.
Public Act 100-023, which became effective on July 6, 2017 (“P.A. 100-23”), created an additional tier of members within MEABF and LABF (“Tier Three Members”). Tier Three Members consist of MEABF and LABF employees who became members on or after July 6, 2017 as well as certain Tier Two Members who elected (“Tier Three Election”) to be considered Tier Three Members. The Tier Three Election had to be made between October 1, 2017 and November 15, 2017. Tier Three Members are subject to different provisions for the calculation of benefits under the Pension Code, including, but not limited to, a reduction in the age at which a member is eligible for a minimum formula annuity with 10 years of service, and separate contribution rates from those for Tier One Members and Tier Two Members. P.A. 100-23 further provides that, following the adoption of an ordinance by the City Council deeming MEABF or LABF an “affected pension fund” under P.A. 100-23, Tier Three Members will have the option to opt-in to additional benefit and contribution changes from those currently applicable to Tier Three Members, as described in P.A. 100-23 (“Future Tier Election”). As of the date hereof, the City Council has not adopted such an ordinance. The City provides no assurances as to whether such an ordinance providing for the Future Tier Election will be adopted in the future, nor can the City project the impact of the adoption of such ordinance on MEABF or LABF or the City’s contributions to such Retirement Funds.
References in this Section to “member” are references to the active, inactive and retired employees of the City and their beneficiaries, the active, inactive and retired employees of the Retirement Funds participating in the Retirement Funds and their beneficiaries, and, with regard to MEABF, certain
employees of the Board of Education who are members of MEABF as described below, and their beneficiaries.
References in this Section to the term “contribution” or “payment” when used in reference to any year refers to the actual payment of moneys by the City to a Retirement Fund. References to the term “levy year” reflect the year in which property tax levies, such as the Pension Levy (as hereinafter defined), are filed with the Cook and DuPage County Clerks (the same being the counties in which the City is located). Such levies will be collected by the Counties, remitted to the City and contributed to the Retirement Funds in the calendar year following the levy year.
Determination of City’s Contributions
The provisions of the Pension Code mandate the amounts the City must contribute to the Retirement Funds, and the City is bound to contribute, and historically has contributed, the amounts required by the Pension Code. Historically, the Pension Code required the City to contribute to a Retirement Fund a statutory multiple of the amount contributed to such Retirement Fund by the employees who are members in such Retirement Fund two years prior to the year in which the property tax used to generate the contribution was levied (“Multiplier Funding System”). The statutory multiple applicable to a Retirement Fund was set forth in the Pension Code article applicable to such Retirement Fund. The Multiplier Funding System did not adjust for changes in the funding level of such Retirement Fund and, as such, the contributions determined in accordance with the Multiplier Funding System did not relate to, and in many years, were substantially less than, the contribution amounts that would have resulted from an actuarial determination of such contribution (“Actuarially Required Contribution”).
Pension Benefits Provided By The City
Retirement Fund Active MembersInactive/ Entitled to
Benefits Retirees and Beneficiaries TotalsMEABF 30,922 17,549 25,383 73,854PABF 12,633 640 13,628 26,901FABF 4,613 77 4,878 9,568LABF 2,794 1,469 3,703 7,966Total 50,962 19,735 47,232 118,289
Source: Retirement Fund Audits for the fiscal year ended December 31, 2017.
MEMBERSHIP

A n n u a l F i n a n c i a l A n a l y s i s 2 0 1 8
85
The City’s contributions to the Retirement Funds are no longer calculated in accordance with the Multiplier Funding System. Public Act 96-1495 (“P.A. 96-1495”), as modified by Public Act 99-506 (“P.A. 99-506” and, together with P.A. 96-1495, “FABF/PABF Funding Legislation”), modified the articles of the Pension Code applicable to FABF and PABF to provide for calculation of the respective contributions to such Retirement Funds in accordance with the FABF/PABF Funding Plan (as hereinafter defined and described). P.A. 100-23 modified the articles of the Pension Code applicable to LABF and MEABF to provide for calculation of the respective contributions to such Retirement Funds in accordance with the LABF/MEABF Funding Plan (as hereinafter defined and described). Prior to the passage of P.A. 100-23, the General Assembly enacted Public Act 98-641 (“P.A. 98-641”). Public Act 98-641 made substantial changes to the articles of the Pension Code applicable to LABF and MEABF, including a change
to the manner in which contributions were made to such Retirement Funds. The Illinois Supreme Court determined that P.A. 98-641 was unconstitutional, which caused the City to continue contributing to LABF and MEABF in accordance with the Multiplier Funding System until the contributions required by P.A. 100-23 became effective. Pursuant to the FABF/PABF Funding Legislation, beginning in fiscal year 2021, the City must contribute to FABF and PABF annually the amount necessary to achieve a Funded Ratio (as described below) of 90 percent in such Retirement Funds by the end of fiscal year 2055 (“FABF/PABF Actuarial Funding”). For fiscal years 2016 through 2020, the FABF/PABF Funding Legislation specifies the amounts contributed by the City in gradually increasing amounts ahead of the FABF/PABF Actuarial Funding (“FABF/PABF Phase-in Funding” and, together with the FABF/PABF Actuarial Funding, “FABF/PABF Funding Plan”). During the FABF/PABF Phase-in Funding, the City will contribute
Pension Benefits Provided By The City
Fiscal Year
Actuarially Required Contribution/ADC
Actual Employer
Contribution(2)
Percentage of Actuarially Required Contribution
Contributed2008 $886,215 $416,130 47.0%2009 990,381 423,929 42.82010 1,112,626 425,552 38.22011 1,321,823 416,693 31.52012 1,470,905 440,120 29.92013 1,695,278 442,970 26.12014 1,740,973 447,400 25.72015(3) 1,866,097 973,669 52.2
2016(3) 2,198,449 590,262 26.9
2017(3) 2,413,466 1,020,254 42.3
Sources:*
(1)
(2) (3)
The Retirement Fund Audits.Beginning in fiscal year 2015, the Annually Required Contribution is no longer calculated. The Annually Required Contribution was a requirement of the Prior GASB Standards and is not a disclosure item under the New GASB Standards.
Data is presented in the aggregate for the Retirement Funds and uses assumptions and methods employed by each of the Retirement Funds.
Includes the portion of the PPRT contributed to the Retirement Funds in each year.The New GASB Standards (as defined herein) no longer require the calculation of the Actuarially Required Contribution. Under the
set forth in its Actuarial Valuation.
INFORMATION REGARDING CITY’S CONTRIBUTIONS(1) - AGGREGATED $ Thousands

A n n u a l F i n a n c i a l A n a l y s i s 2 0 1 8
86
the following amounts pursuant to the FABF/PABF Funding Legislation: in payment year 2018, $727 million; in payment year 2019, $792 million; and in payment year 2020, $824 million.
Pursuant to P.A. 100-23, beginning in fiscal year 2018, the City must contribute to LABF and MEABF annually the amount necessary to achieve a Funded Ratio (as described below) of 90 percent in such Retirement Funds by the end of fiscal year 2058 (“LABF/MEABF Actuarial Funding”). For fiscal years 2018 through 2022, P.A. 100-23 specifies the amounts contributed by the City in gradually increasing amounts ahead of the LABF/MEABF Actuarial Funding (“LABF/MEABF Phase-in Funding” and, together with the LABF/MEABF Actuarial Funding, “LABF/MEABF Funding Plan”). During the LABF/MEABF Phase-in Funding, the City will contribute the following amounts pursuant to P.A. 100-23: in payment year 2018, $302 million; in payment year 2019, $392 million; in payment year 2020, $481 million; in payment year 2021, $571 million; and in payment year 2022, $660 million. The City’s contributions to the Retirement Funds have historically been made primarily from the proceeds of an annual levy of property taxes for each of the Retirement Funds (“Pension Levy”) by the City solely for such purpose, as provided by the Pension Code. However, the Pension Code allows the City to use any other legally available funds ( “Other Available Funds,” as described below) in lieu of the Pension Levy to make its contributions to the Retirement Funds. The amount of the Pension Levy, like any City property tax levy, must be approved by the City Council. The Pension Levy is exclusive of and in addition to the amount of property taxes which the City levies for other purposes.
The portion of the City’s contribution presently made from Other Available Funds consists of several revenue sources, including (i) general Corporate Fund revenues, and (ii) revenues of the enterprise systems (with respect to the portion of the contribution allocable to the employees of the respective enterprise systems). Historically, the City used a portion of the Personal Property Replacement Tax revenues to pay a portion of the City’s contributions. The City has identified additional revenue sources to assist in making the increased contributions to LABF and MEABF as a result of the enactment of P.A. 100-23. With respect to LABF, the
City expects that a portion of such increased contribution will be made from funds in the Corporate Fund made available as a result of an increase in the 911 surcharge. With respect to MEABF, the City intends to utilize revenues generated from a tax on water and sewer usage which was imposed by the City Council in 2016 to fund a portion of the increase in the City’s contributions to MEABF.
The City’s contributions to the Retirement Funds in accordance with the Pension Code have not been sufficient, when combined with employee contributions and investment returns, to offset increases in the Retirement Funds’ liabilities, which has contributed to the significant underfunding of the Retirement Funds. Moreover, the contributions to the Retirement Funds in accordance with the Pension Code have had the effect of deferring the funding of the Retirement Funds’ liabilities, which increases the costs of such liabilities and the associated financial risks, including the risk that each Retirement Fund will not be able to pay its obligations when due. Furthermore, increases in the City’s contributions to the Retirement Funds caused the City to increase its revenues and may require the City to further increase its revenues, reduce its expenditures, or some combination thereof.
Funded Status of the Retirement Funds
The Schedule of Funding Progress table presents certain financial information describing the historical level of funding of the Retirement Funds in the aggregate. Certain of this information is derived from the Actuarial Valuations. To produce the Actuarial Valuations, the Retirement Funds’ actuaries use demographic data (including employee age, salary and service credits), economic assumptions (including estimated future salary and interest rates), and decrement assumptions (including employee turnover, mortality and retirement rates) to produce the information required by the GASB. The Retirement Funds’ Actuarial Valuations are publicly available and may be obtained from the Retirement Funds.
Beginning with the fiscal year ending December 31, 2014, GASB introduced new standards (“New GASB Standards”) for accounting for pensions which required the production of a variety of new statistics for measuring the health of pension plans. The following table sets forth information concerning the Retirement Funds prepared in accordance with the New GASB Standards. Additional information regarding the New GASB Standards is set forth in the City’s CAFR.
Pension Benefits Provided By The City

A n n u a l F i n a n c i a l A n a l y s i s 2 0 1 8
87
For additional information with respect to the calculation of the amounts set forth in this section, including, but not limited to, the actuarial methods and assumptions employed by the actuaries of the Retirement Funds, see the Actuarial Valuations.
Projection of Funded Status
The table Projection of Future Funding Status - All Retirement Funds Combined (“Projections”) are based upon numerous variables that are subject to change. The Projections are provided to indicate expected trends in the future funded status of the Retirement Funds. The Projections are forward-looking statements regarding future events based on the current provisions of the Pension Code, the Retirement Funds’ actuarial assumptions and
assumptions made regarding such future events, including the assumption that all projected contributions to the Retirement Funds are made as required. No assurance can be given that these assumptions will be realized or that actual events will not cause material changes to the data presented in this subsection. The Projections reflect the current provisions of the Pension Code and are based on data as of December 31, 2017. The Projections provided in this section with respect to MEABF combine pension and other post-employment benefits (“OPEB”) liabilities together in a single projection, whereas the projections with respect to the other Retirement Funds exclude OPEB liabilities. Therefore, with respect to MEABF, such projections overstate the Actuarial Accrued
Pension Benefits Provided By The City
Fiscal YearActuarial Accrued
Liability(1)Actuarial Value of
AssetsFair Value of Net
Assets UAAL (Actuarial)(2) UAAL (Fair Value)(3) Funded Ratio
(Actuarial)(2)Funded Ratio
(Fair Value)(3)
2008 $24,092,325 $13,797,344 $9,843,386 $10,294,981 $14,248,939 57.3% 40.9%2009 24,970,808 13,051,349 10,876,846 11,919,459 14,093,962 52.3 43.62010 26,723,773 12,449,863 11,408,555 14,273,910 15,315,218 46.6 42.72011 27,820,098 11,521,138 10,536,135 16,298,960 16,696,869 41.4 37.92012 29,883,532 10,531,448 10,799,603 19,352,084 19,083,929 35.2 36.12013 30,623,493 10,513,564 11,261,254 20,109,929 19,362,239 34.3 36.82014 30,087,596 10,339,208 10,665,597 19,748,388 19,421,999 34.4 35.42015 33,432,850 10,391,269 10,084,136 23,041,581 23,348,714 31.1 30.22016 35,467,062 9,980,946 9,488,001 25,486,116 25,979,061 28.1 27.42017 37,537,450 9,929,270 10,069,793 27,608,180 27,467,657 26.5 26.8
Source:
Note:
(1) (2) (3)
2008 through 2010 data is from the Actuarial Valuations of the Retirement Funds as of December 31, 2010, and the Retirement Fund Audits for the fiscal year ended December 31, 2010. 2011 through 2017 data is from the Retirement Fund Audits for the fiscal years 2011 through 2017. Table may not add due to rounding.
value of the benefits such Retirement Fund must pay to members as a result of past employment and participation in such Retirement Fund, calculated based on demographic and other data (such as employee age, salary and service credits) and various assumptions (such as estimated salary
value of the investments and other assets held by each Retirement Fund, calculated in accordance with the asset smoothing method, which smooths investment gains and losses over a period of five years by recognizing 20% of the investment gain or less experienced in a current year in that year and
Assets by the Actuarial Accrued Liability.
SCHEDULE OF FUNDING PROGRESS$ Thousands

A n n u a l F i n a n c i a l A n a l y s i s 2 0 1 8
88
Liability with respect to pension benefits by the amount of such OPEB liability. In addition, the City believes that the liability related to OPEB may be reduced based upon the outcome of the Lawsuit (as hereinafter defined).
Diversion of Grant Money to the Retirement Funds
The Pension Code allows the State Comptroller to divert State grant money intended for the City to the Retirement Funds to satisfy contribution shortfalls by the City (“Recapture Provisions”). If the City fails to contribute to the Retirement Funds as required by the Pension Code, the City will be subject to a reallocation of grants of State funds to the City if: (i) the City fails to make the required payment as set forth in the respective statute, (ii) the subject Retirement Fund gives notice of the failure to the City, and (iii) such Retirement Fund certifies to the State Comptroller that such payment has not been made. Upon the occurrence of these events, the State Comptroller will withhold grants of State funds from the City in an amount not in excess of the delinquent payment amount. Should the Recapture Provisions of the Pension Code be invoked as a result of the City’s failure to contribute all or a portion of its required contribution, a reduction in State grant money may have a significant adverse impact on the City’s finances.
Other Post-Employment Benefits Provided to Members
Certain Retirees’ Health Plan
As of January 1, 2014, the City of Chicago agreed to provide a healthcare plan with a subsidy of 55% of the cost of that plan to those City annuitants who retired prior to August 23, 1989, for their lifetimes. The cost of these health benefits is recognized as an expenditure in the accompanying financial statements as claims are reported and are funded on a pay-as-you-go basis.
Pension Fund Subsidies
Applicable State law authorized the four respective Pension Funds, Policemen’s, Firemen’s, Municipal Employees’, and Laborers’ (“Pension Funds”) to provide a fixed monthly dollar subsidy to each annuitant who had elected coverage under any City health plan through December 31, 2016. After that date, no Pension Fund subsidies were authorized by State law.
However, in the Underwood litigation, the Illinois Appellate Court held in June 2017, that current and future annuitants hired prior to the execution of a court approved settlement agreement in 2003 in the City of Chicago v. Korshak
Pension Benefits Provided By The City
Total Pension Liability
Plan Net PositionNet Pension
Liability
Plan Net Position as a Percentage of
Total Pension Liability
2014 $30,756,189 $10,665,601 $20,090,590 34.70%2015 43,930,302 10,084,134 33,846,168 23.00%2016 45,247,266 9,488,001 35,759,265 21.00%2017 38,113,115 10,069,791 28,043,324 26.40%
Source: The Actuarial Valuations of the Retirement Funds for the fiscal year ended December 31, 2017.Note: that are attributed to past periods of employee service calculated pursuant to the methods and assumptions set forth in the New GASB Standards. value of a pension plans assets. Pension Liability and the Plan Net Position. If this number was negative, it would be referred to
.
NET PENSION LIABILITY $ Thousands

A n n u a l F i n a n c i a l A n a l y s i s 2 0 1 8
89
Pension Benefits Provided By The City
Fiscal YearActuarial Accrued
Liability (a)Fair Value Assets
(b)
UAAL (Fair Value)
(a-b)
Funded Ratio (Fair Value)
(b/a)
Employer
Contribution(1)
2018 $38,570,076 $9,990,519 $28,579,557 25.90% $1,024,512 2019 39,588,474 9,950,357 29,638,117 25.10% 1,184,0002020 40,585,192 10,185,320 30,399,872 25.10% 1,305,0002021 41,556,294 10,455,534 31,100,760 25.20% 1,674,6692022 42,499,066 10,989,960 31,509,106 25.90% 1,791,1642023 43,415,032 11,519,910 31,895,122 26.50% 2,130,5792024 44,296,269 12,042,212 32,254,057 27.20% 2,181,1572025 45,145,711 12,551,554 32,594,157 27.80% 2,230,9542026 45,948,527 13,044,259 32,904,268 28.40% 2,280,3182027 46,703,413 13,521,674 33,181,739 29.00% 2,329,7602028 47,411,495 13,987,636 33,423,859 29.50% 2,379,8442029 48,072,203 14,445,122 33,627,081 30.00% 2,433,7212030 48,683,976 14,894,515 33,789,461 30.60% 2,487,6782031 49,246,944 15,338,846 33,908,098 31.10% 2,540,8012032 49,762,560 15,783,609 33,978,951 31.70% 2,593,7422033 50,233,134 16,236,326 33,996,808 32.30% 2,647,8592034 50,660,855 16,703,675 33,957,180 33.00% 2,703,9022035 51,049,840 17,192,263 33,857,577 33.70% 2,760,8262036 51,403,512 17,704,234 33,699,278 34.40% 2,792,1352037 51,725,537 18,245,917 33,479,620 35.30% 2,847,3822038 52,033,126 18,838,588 33,194,538 36.20% 2,898,2762039 52,318,486 19,480,136 32,838,350 37.20% 2,946,6802040 52,585,708 20,180,642 32,405,066 38.40% 2,995,4932041 52,840,451 20,953,147 31,887,304 39.70% 3,044,9032042 53,088,106 21,809,872 31,278,234 41.10% 3,095,9222043 53,334,055 22,764,157 30,569,898 42.70% 3,149,6862044 53,580,626 23,824,102 29,756,524 44.50% 3,204,7622045 53,830,176 25,009,206 28,820,970 46.50% 3,261,9472046 54,085,553 26,323,435 27,762,118 48.70% 3,319,6782047 54,350,345 27,783,726 26,566,619 51.10% 3,379,6462048 54,627,308 29,404,336 25,222,972 53.80% 3,441,8792049 54,915,946 31,196,700 23,719,246 56.80% 3,506,3082050 55,217,906 33,174,505 22,043,401 60.10% 3,573,0572051 55,533,662 35,351,494 20,182,168 63.70% 3,640,9472052 55,865,662 37,744,369 18,121,293 67.60% 3,729,4922053 56,216,216 40,370,978 15,845,238 71.80% 3,800,7212054 56,582,974 43,245,466 13,337,508 76.40% 3,873,6582055 56,969,027 46,387,908 10,581,119 81.40% 3,948,240
Source:
Note:
(1)
The Actuarial Valuations of the Retirement Funds as of December 31, 2017.
Pursuant to the FABF/PABF Funding Legislation, the City projects that FABF and PABF will each reach a Funded Ratio of 90% by the end of the calendar year ended 2055. Pursuant to the provisions of P.A. 100-23, the City projects that MEABF and LABF will each reach a funded ratio of 90% by the end of the calendar year ended 2058.
Represents contributions expected to be made by the City during the fiscal year.
PROJECTION OF FUTURE FUNDING STATUS - ALL RETIREMENT FUNDS COMBINED$ Thousands

A n n u a l F i n a n c i a l A n a l y s i s 2 0 1 8
90
litigation, and subject to certain eligibility requirements, are entitled to receive lifetime fixed rate monthly subsidies equal to the subsidy amounts provided in the 1983 and 1985 amendments to the Pension Code. Those subsidies are, for Policemen and Firemen’s Funds, $21 per month or $55 per month, depending on the annuitant’s Medicare eligibility, and for Municipal Employees and Laborers’ Funds, $25 per month for those annuitants who are 65 or older with at least 15 years of service. The issue of whether the Pension Funds or the City is obligated to make the subsidy payments to the annuitants is still subject to litigation. The 1983 and 1985 statutes state that the Pension Funds are obligated to make the payments but none of the Pension Funds included the liability for the monthly subsidies in their respective actuarial valuation reports under GASB 43. For that reason, the City has included the liability for the monthly fixed subsidies for this limited group under GASB 45 and it is reported together with the Retirees’ Settlement Health Plan liability.
CBA Special Benefits
Under the terms of the latest collective bargaining agreements (“CBAs”) for the Fraternal Order of Police and the International Association of Fire Fighters, certain employees who retire after attaining age 55 with the required years of service are permitted to enroll themselves and their dependents in the healthcare benefit program offered to actively employed members. The former City employee may keep this coverage until they reach the age of Medicare eligibility.
An extension of the CBA was negotiated (and finalized in 2014), governing the contract period (through June 30, 2016 for Police Captains, Sergeants and Lieutenants, and June 30, 2017 for remaining Police and Fire). As of the date of this report, negotiations are ongoing regarding new agreements which cover the retiree health benefits. Under the “maintenance of effort” protocols, the provisions of the prior agreement are honored until a new agreement is signed. It is not known whether the CBA special health benefits will be specifically eliminated, modified, or extended at this time. Therefore the actuarial valuation assumes the expiration of the early retirement special benefits as of the December of the contract expiration year, but includes the liabilities for continuation of payments to those members who would have already retired under the CBA as of December 31 of that year. Based upon prior history, the negotiations are
assumed to be concluded by December 31, 2019. Certain CBA retirees were required to contribute 2.0 percent of their pension for health care coverage beginning at the end of 2017
The benefits provided to members of the Retirement Funds as described in this section are referred to herein as the“Health Benefits” (“OPEB Benefits”).
City Financing of the OPEB Benefits
Each of the Health Benefits and the CBA Special Benefits described above are funded on a pay-as you-go basis, which means no assets are accumulated to pay for the liabilities with respect to the OPEB Benefits . The City’s contributions to the Retirement Funds are made in accordance with the Pension Code.
For additional information regarding the OPEB Benefits, including information regarding the accrued liability of the OPEB Benefits and the actuarial assumptions and methods used in calculating the accrued liability, see the CAFR of the City.
Pension Benefits Provided By The City

Debt
Annual Financial Analysis2018


A n n u a l F i n a n c i a l A n a l y s i s 2 0 1 8
93
DEBT
This section examines the City’s total outstanding debt, including General Obligation Bonds (“G.O. Bonds”), Revenue Bonds (“Revenue Bonds”), short-term debt instruments and loans. It also outlines the City’s long-term debt service payments over the past ten years and future years.
Long-Term Debt
The section below provides an overview of the sources and uses of the City’s long-term debt.
General Obligation
A significant portion of the City’s long-term G.O. Bonds are backed by the full faith and credit of the City. With respect to the City’s G.O. Bonds, all taxable property within the City is subject to the levy of taxes, without regard to rate or amount, to pay the principal of and interest on such G.O. Bonds. However, as described below, certain G.O. Bonds of the City do not have a property tax levy in place for their repayment.
The City has three types of long-term General Obligation Bonds outstanding: (i) G.O. Bonds for which an annual property tax levy has been established to pay debt service on such G.O. Bonds (“Tax Levy Bonds”), (ii) G.O. Bonds for which an annual property tax levy has been established but is annually abated if certain other specified revenues are available that year for payment of debt service (“Alternate Revenue Bonds”), and (iii) G.O. Bonds for which an annual property tax levy has not been established for debt service and payments of debt are appropriated from sources of revenue other than property taxes (“Pledge Bonds”). Alternate Revenue Bonds make up a small subset of the City’s G.O. Bonds and include the City’s General Obligation (Modern Schools Across Chicago Program), Series 2007A-K, Series 2010A and Series 2010B, and General Obligation Bonds (Emergency Telephone System), Series 1999 and Series 2004. Pledge Bonds consist of the City’s General Obligation Building Acquisition Certificates (Limited Tax), Series 1997 and the general obligation note issued by the City in connection with the acquisition by the City of the former Michael Reese Hospital campus (MRL Note). All other long-term G.O. Bonds of the City are Tax Levy Bonds.
Over the last several years, the City has issued long-term G.O. Bonds to fund capital improvements, equipment, legal judgments and settlements, and refunded bonds for debt service savings. For the last several years, G.O. Bond proceeds have been used to restructure a portion of the near-term debt service on outstanding G.O. Bonds reducing the property tax levy in those years. The City intends to eliminate by 2019 the use of refunding bonds to restructure near-term debt service.
Sales Tax and Motor Fuel Tax
The Sales Tax Securitization Corporation (“STSC”) was organized by the City in 2017 for the limited purpose of purchasing certain sales tax revenues (“Sales Tax Revenues”) and issuing bonds, notes or other obligations for the benefit of the City. Bonds issued by the STSC in 2017 provided funds for the STSC to purchase from the City all of the City’s right title and interest in and the Sales Tax Revenues. Such funds were applied by the City to refund all of the outstanding City of Chicago sales tax revenue bonds as well as certain outstanding G.O. Bonds for debt service savings. Motor Fuel Tax revenue bonds are issued to pay for eligible transportation projects. Additionally, in 2013 the City closed on a Transportation Infrastructure Finance Innovation Act (“TIFIA”) loan from the U.S. Department of Transportation to complete the Chicago Riverwalk along the main branch of the Chicago River. Motor Fuel Tax (“MFT”) revenue bonds and the TIFIA loan are secured by motor fuel tax revenue and additional City revenues including revenues received from the licensing of docks for tour boat operations at designated locations on the Chicago River and revenues received from the leasing of space, concession sales and advertising and sponsorship along the Riverwalk. The outstanding principal on the Riverwalk TIFIA loan as of December 31, 2017 was $96.7 million.
Tax Increment Allocation
Tax Increment Allocation Bonds are limited obligations of the City payable solely from available incremental tax revenues collected from the related project redevelopment area and are issued to fund or reimburse redevelopment and infrastructure projects in Tax Increment Financing (TIF) districts.
Debt

A n n u a l F i n a n c i a l A n a l y s i s 2 0 1 8
94
Debt
Budget Year
2008
2009
2010
2011
2012
2013
2014
2015
2016
2017
2018
2019
2020
2021
$16,476.9M
$16,904.0M
$19,004.4M
$20,196.3M
$20,267.8M
$21,342.8M
$22,786.2M
$22,546.1M
$23,202.3M
$24,235.7M
$24,457.6M
$23,712.1M
$22,918.4M
$22,120.9M
G.O. Tax LevyO'Hare RevenueWater RevenueMidway Revenue
Sewer RevenueSales Tax SecuritizationG.O. Alternate RevenueSales Tax Revenue
Motor Fuel Tax RevenueG.O. PledgeTIF
BudgetYear
G.O. TaxLevy
O'HareRevenue
WaterRevenue
MidwayRevenue
SewerRevenue
Sales TaxSecuritization
G.O.AlternateRevenue
Sales TaxRevenue
Motor FuelTax Revenue G.O. Pledge TIF
20082009201020112012201320142015201620172018201920202021 $7.7M
$12.1M$16.2M$22.2M$27.9M$33.5M$60.7M$70.0M$80.1M
$105.7M$124.0M$153.3M$174.8M$194.9M
$19.9M$33.1M$46.3M$59.6M$72.8M$75.1M$77.2M$88.3M$99.4M
$101.2M$102.9M$104.6M$106.1M$107.6M
$233.7M$239.4M$244.8M$249.8M$249.9M$234.1M$207.4M$183.8M$181.0M$187.2M$193.0M$198.6M$203.9M$208.9M
$0.0M$0.0M$0.0M$0.0M$0.0M
$514.7M$528.5M$541.6M$554.1M$566.0M$577.3M$355.1M$355.6M$343.5M
$67.0M$122.9M$179.4M$243.6M$300.9M$355.0M$426.4M$472.6M$514.8M$554.9M$593.0M$629.5M$660.4M$535.0M
$1,390.8M$1,417.9M$1,421.0M$1,424.0M
$743.7M
$1,683.9M$1,742.9M$1,801.9M$1,863.0M$1,861.4M$1,692.8M$1,686.2M$1,638.9M$1,369.5M$1,363.8M$1,112.1M$1,126.0M
$902.8M$924.0M
$1,594.8M$1,646.2M$1,692.8M$1,727.9M$1,755.8M$1,755.8M$1,482.9M$1,506.3M$1,412.6M$1,383.2M$1,435.3M$1,461.5M$1,184.8M$1,207.4M
$2,165.5M$2,263.3M$2,359.2M$2,456.2M$2,401.0M$2,468.4M$2,391.4M$2,381.8M$1,996.9M$2,030.2M$1,721.2M$1,753.8M$1,464.8M$1,503.9M
$7,428.3M$7,664.4M$7,939.3M$8,233.4M$8,531.5M$6,970.6M$7,245.3M$7,466.5M$7,476.3M$6,970.9M$7,259.8M$6,403.8M$5,505.9M$5,602.7M
$7,529.3M$7,776.3M$8,011.1M$8,178.1M$8,290.6M$9,102.4M$8,440.4M$8,436.3M$7,658.1M$7,004.8M$7,077.6M$6,818.2M$6,344.8M$5,849.0M
OUTSTANDING LONG-TERM DEBT
Source - Comprehensive Annual Financial Report, Table 25 Budget Years 2018-2021 as of June 30, 2018

A n n u a l F i n a n c i a l A n a l y s i s 2 0 1 8
95
Debt
Water and Wastewater Revenue
Water revenue and wastewater revenue bonds are secured by revenues of the Water and Sewer Systems, respectively, and are primarily issued to fund capital projects for such systems.
The City applies for and receives funding from the Illinois Environment Protection Agency (“IEPA”) State Revolving Loan Funds Program. The City has entered into fixed rate loan agreements with the IEPA to fund water and sewer system projects. The outstanding principal as of December 31, 2017 was $248.7 million of water loans and $165.7 million of sewer loans.
O’Hare and Midway Revenue
The City issues bonds to fund capital improvements for Chicago O’Hare International Airport that are secured by general airport revenues, passenger facility charge revenues and customer facility charge revenues secured by customer facility charges paid by customers of the rental car companies operating at O’Hare and special facility revenue bonds secured by payments made by individual airlines and other tenants and licensees pursuant to separate special facility agreements with the City. In 2013, the City closed on a TIFIA loan from the U.S. Department of Transportation to fund a portion of a new intermodal facility at O’Hare International Airport. The intermodal facility, scheduled to open in 2018, will combine car rentals, public parking, and airport transit system connections in a single facility. When interest and principal payments become due, they will be paid by customer facility charge revenues. The outstanding principal on the intermodal facility TIFIA loan as of December 31, 2017 was $159.8 million.
Chicago Midway Airport revenue bonds are backed by revenue from landing fees, terminal rent, and other fees paid by airlines. These revenue bonds are issued to pay for airfield and terminal improvements and related facilities.
Short-Term Debt
In addition to the long-term debt discussed above, the City issues certain types of short-term debt to address various operating, liquidity, and capital needs. The City currently has commercial paper and lines of credit programs for O’Hare, Midway and general obligation debt. These financial tools are used to satisfy short-term funding needs until long-term bonds are issued as well as to satisfy interim cash flow and liquidity needs of the City.
General Obligation Short-Term Borrowing Program
Under its General Obligation Short-Term Borrowing Program, the City may issue general obligation commercial paper notes and borrow under general obligation lines of credit which are general obligations of the City but do not have a designated property tax levy in place for their repayment. The General Obligation Short-Term Borrowing Program is used by the City for working capital in anticipation of receipt of other revenue, to fund capital projects, debt refinancings or restructuring and to pay non-capital expenditures, such as settlements and judgments or retroactive payment of employment salaries and wages.
The authorizing ordinance for the General Obligation Short-Term Borrowing Program allows for a maximum outstanding amount of general obligation commercial paper notes and/or general obligation lines of credit in the aggregate principal amount of $1.0 billion. The City has sized its borrowing capacity for interim funding in anticipation of receiving revenues or issuing long-term general obligation bonds and to cover operating expenses.
Water System Commercial Paper Notes and Line of Credit Notes
The City has authorized the issuance of Water System Commercial Paper Notes and Line of Credit Notes for the purposes of financing or refinancing capital improvements to the Water System or providing funds to meet the cash flow needs of the Water System. The maximum aggregate principal amount of all Water System Commercial Paper Notes and Water System Line of Credit Notes outstanding at any one time may not exceed $200 million. There are no Water System Commercial Paper Notes or Line of Credit Notes outstanding.

A n n u a l F i n a n c i a l A n a l y s i s 2 0 1 8
96
Debt
LONG-TERM DEBT SERVICE PAYMENTS
BudgetYear
G.O. TaxLevy
O'HareRevenue
WaterRevenue
MidwayRevenue
SewerRevenue
Sales TaxSecuritization
G.O.AlternateRevenue
Sales TaxRevenue
Motor FuelTax Revenue G.O. Pledge TIF
20082009201020112012201320142015201620172018201920202021 $4.9M
$4.8M$7.0M$6.9M$7.1M$6.5M
$15.2M$23.5M$32.0M$24.3M$38.4M$31.8M$31.6M
$102.5M
$14.3M$14.8M$15.2M$15.7M$5.0M$5.2M
$16.1M$16.6M$25.0M$2.4M$2.4M$2.3M$2.4M$2.4M
$16.1M$15.9M$15.8M$15.5M$15.1M$14.3M$14.4M$12.0M$15.6M$15.7M$15.5M$15.6M$15.6M$11.2M
$0.0M$0.0M$0.0M$0.0M
$24.9M$39.4M$36.9M$38.6M$38.6M$32.6M$15.5M$5.2M
$13.1M$25.2M
$62.1M$65.8M$76.6M$72.8M$72.3M$97.8M$70.3M$68.3M$67.2M$67.1M$67.1M$54.8M$53.7M$51.0M
$84.3M$60.6M$60.6M$54.7M
$0.0M
$150.8M$150.8M$148.2M$147.1M$138.3M$126.8M$135.0M$109.4M$100.8M
$83.4M$82.4M$63.8M$64.4M$58.1M
$126.0M$123.6M$113.6M$107.5M$90.4M
$102.2M$91.9M$69.0M$80.4M
$113.7M$90.6M$81.8M$77.2M$74.4M
$204.4M$212.0M$216.9M$217.9M$206.4M$184.6M$179.2M$158.7M$158.2M$129.4M$127.8M$110.3M$110.3M$96.6M
$613.5M$664.8M$697.7M$713.4M$620.5M$607.8M$592.6M$521.0M$432.9M$731.9M$401.2M$380.5M$292.3M$326.2M
$725.8M$719.2M$659.4M$538.4M$498.6M$399.1M$394.7M$382.0M$367.7M$386.7M$367.8M$310.6M$381.2M$390.4M
Budget Year
2008
2009
2010
2011
2012
2013
2014
2015
2016
2017
2018
2019
2020
2021
$1,137.9M
$1,041.9M
$1,056.7M
$1,208.6M
$1,587.1M
$1,318.4M
$1,399.0M
$1,546.2M
$1,583.9M
$1,678.6M
$1,889.9M
$2,010.9M
$2,032.2M
$2,002.3M
G.O. Tax LevyO'Hare RevenueWater RevenueMidway Revenue
Sewer RevenueSales Tax SecuritizationG.O. Alternate RevenueSales Tax Revenue
Motor Fuel Tax RevenueG.O. PledgeTIF
Source - Comprehensive Annual Financial Report, Table 25 Budget years 2018-2021 as of June 30, 2018

A n n u a l F i n a n c i a l A n a l y s i s 2 0 1 8
97
Sewer System Commercial Paper Notes and Line of Credit Notes
The City has authorized the issuance of Sewer System Commercial Paper Notes and Line of Credit Notes for the purposes of financing or refinancing capital improvements to the Sewer System or providing funds to meet the cash flow needs of the Sewer System. The maximum aggregate principal amount of all Sewer System Commercial Paper Notes and Sewer System Line of Credit Notes outstanding at any one time may not exceed $150 million. There are no Sewer System Commercial Paper Notes or Line of Credit Notes outstanding.
Chicago O’Hare International Airport Commercial Paper Notes and Credit Agreement Notes
The City has authorized the issuance of Chicago O’Hare International Airport Commercial Paper Notes and Credit Agreement Notes in a combined aggregate principal amount outstanding at any one time of up to $1.0 billion. The City has established a $420 million Commercial Paper Notes program and a $180 million Credit Agreement Note program.
The Commercial Paper and Credit Agreement Notes are used by the airport for working capital in anticipation of receipt of other revenue, to fund capital projects, and for debt refinancings or restructuring.
The City has sized its borrowing capacity for interim funding in anticipation of receiving revenues or issuing long-term revenue bonds and to cover operating expenses.
Chicago Midway Airport Commercial Paper Notes
The City has authorized the issuance of Chicago Midway Airport Commercial Paper Notes in an aggregate principal amount outstanding at any one time of up to $150 million. The City has established an $85 million Commercial Paper Notes program available to support cashflow needs at Midway, to fund capital projects, and for debt refinancings or restructuring.
The City has sized its borrowing capacity for interim funding in anticipation of receiving revenues or issuing long-term revenue bonds and to cover operating expenses.
Debt


Capital Investments
Annual Financial Analysis2018


A n n u a l F i n a n c i a l A n a l y s i s 2 0 1 8
101
CAPITAL INVESTMENTS
The City’s Capital Improvement Program (“CIP”) funds the physical improvement or replacement of City-owned infrastructure and facilities with long useful lives, such as roads, buildings and green spaces. Each year, the City updates the CIP, producing a spending “blueprint” based upon the most current revenue projections and project priorities. Continued investments in infrastructure and facilities are critical to support and enhance neighborhoods, stimulate the economy, and improve services. Funding Sources
The CIP is primarily funded through the following sources:
• General obligation bonds, which are backed by property tax revenue and are used for a variety of City infrastructure and facility projects.
• Motor Fuel Tax (“MFT”) revenue bonds, which are backed by taxes on fuel, and are used for the construction of road-related improvements such as streets, lighting, and traffic signals.
• Water and sewer revenue bonds, which are backed by water and sewer user fees, respectively, and are used for the construction and repair of water and sewer lines and related facilities.
• O’Hare and Midway revenue bonds, which are backed by airport revenues, are used to fund airfield and terminal improvements and related facilities. The City also uses other airport operating revenues to fund capital improvements at both O’Hare and Midway Airport.
• Tax Increment Financing (“TIF”), which is used to fund infrastructure such as roads, lighting, libraries, bridges, schools, and CTA stations. The uses of TIF are discussed further in the TIF section.
The projects funded in the CIP are grouped into five major categories: infrastructure, greening, facilities, sewer/water, and aviation.
Infrastructure
Infrastructure projects include the construction and maintenance of streets, viaducts, alleys, lighting, ramps, sidewalks, bridge improvements, traffic signals, bike lanes,
streetscapes and shoreline work, as well as neighborhood improvements and the Aldermanic Menu Program.
The Aldermanic Menu Program is an annual allotment of $1.32 million per ward to be programmed from a “menu” of capital improvements in each ward. Historically, these funds have been used primarily for sidewalks, residential street resurfacing, street lighting, and curb and gutter replacements, with portions of these funds contributed to the Chicago Park District, Chicago Board of Education, and the Chicago Transit Authority. Greening
Historically, greening projects were funded primarily with bonds, and included projects such as greenways, medians, trees, fountains, community gardens, neighborhood parks, wetlands and other natural areas. In recent years, the City has transitioned projects such as greening, from long-term borrowing to operating revenue.
Facilities
Facility improvement includes the construction and repair of City buildings, police and fire stations, health clinics, senior centers, and libraries. Continued investment in these facilities is critical to minimize operating and maintenance costs and prolong the useful life of City assets.
Water and Sewer
In 2012, the City launched a ten-year capital improvement program to modernize and rebuild the City’s aging water and sewer systems. Through this initiative, the Department of Water Management (“DWM”) will replace 880 miles of century-old water pipes, reline or rebuild more than 750 miles of sewer lines, reline 14,000 sewer structures, and upgrade four of the original steam-powered pumping stations. These ongoing DWM projects will ensure continued economical and reliable delivery of water.
Water and sewer capital projects include water main replacement, meter installations for Chicago’s MeterSave program, rehabilitation and construction of sewer pipes, and facility upgrades like modernizing pumping stations from steam to efficient electric power.
The water and sewer capital improvement programs are
Capital Investments

A n n u a l F i n a n c i a l A n a l y s i s 2 0 1 8
102
primarily funded by bond proceeds, grants and loans, and water and sewer revenue. Any debt payments, including revenue bonds and loans, are paid with revenue from each system’s charge for service. The City has received funding from the Illinois Environmental Protection Agency (“IEPA”) State Revolving Loan Funds program, which provides loans with lower interest rates and shorter repayment schedules than long-term bonds.
Aviation
The operation and maintenance of both airports require capital investments to repair and replace aging facilities and infrastructure. The capital improvement programs of O’Hare International Airport and Midway International Airport include projects that improve runways, taxiways and aprons, terminal buildings, access roadways, and parking lots.
Aviation capital is presented separately from other capital funds to provide a clear picture of funding sources and distribution of funding. Aviation capital funding is used exclusively for projects at the City’s airports and is typically funded through general airport revenue bonds, passenger charge bonds and customer facility charge bonds. Both airports also utilize available federal grant funding and airport revenues.
In spring 2018, the City and airlines signed a new Airline Use and Lease Agreement for O’Hare that includes an $8.7 billion Terminal Area Plan (“TAP”). The TAP provides a new Global Terminal, a new Global Concourse and two new satellite concourses as well as enhancements throughout other existing terminals. The TAP will provide an additional three million square feet to outfit the Airport with new technology and security enhancements as well as 25 percent more gate capacity. Construction of the major elements of TAP will be completed over the next eight years. The City has received authorization of $4 billion of bonds by City Council to fund the initial portions of the TAP.
The Midway modernization program is focused on the ongoing repair, capital maintenance, and demand-driven expansion and upgrades of Midway Airport. The projects, funded in part by the 2016 bond issue, includes expansion to both passenger security checkpoint areas, a terminal parking garage, and a complete renovation and expansion of Midway’s concessions.
Capital Investments Going Forward
The City’s CIP includes a total of $8.7 billion in planned capital improvements from 2018 through 2022. The chart below presents the anticipated sources of capital funding for this five-year period. Details regarding the allocation, funding source, timing, and scope of each planned capital improvement project are available on the City’s Office of Budget and Management website.
Capital Investments

A n n u a l F i n a n c i a l A n a l y s i s 2 0 1 8
103
Capital Investments
3.8%6.2%
3.4%
8.4%
10.1%
31.3%
36.8%
Water/Sewer Debt & Other RevenueAviation Debt & Other RevenueGO Debt & Other RevenueFederal FundsCity & Other FundsTIF FundsState Funds
CAPITAL FUNDING SOURCES (2018-2022)
2.7%
0.1%
28.9%
31.4%36.9%
Sewer/WaterInfrastructureGreeningFacilitiesAviation
CAPITAL FUNDING USES (2018-2022)


Tax Increment Financing
Annual Financial Analysis2018


A n n u a l F i n a n c i a l A n a l y s i s 2 0 1 8
107
TAX INCREMENT FINANCING
Chicago’s Tax Increment Financing (“TIF”) program began in 1984 with the goal of promoting business, industrial, and residential development in areas that struggled to attract or retain housing, jobs, or commercial activity.
The following section discusses property-tax-derived revenue for the City’s TIF program, project bonds and notes, expenditures, and TIF surplus.
TIF is a funding tool used to improve neighborhood infrastructure and promote investment in communities across the city. The program is governed by a State law, allowing municipalities to capture property tax revenues derived from the amount of incremental equalized assessed value (“EAV”) above the base EAV that existed before an area was designated as a TIF district. These incremental revenues are deposited in a special fund for each TIF district and used solely to provide assistance for redevelopment projects in that district or adjacent districts.
TIF Districts
There have been a total of 181 TIF designations in Chicago since the start of the TIF program in 1984. The number of active TIF districts peaked in 2011 at 163 but has since declined to 144 currently active in the city. Since the start of the TIF program, 20 districts have been terminated, 12 districts have expired, and five have been repealed. Most recently, the 126th/Torrence TIF expired in 2017 and the Chicago/Lakeside TIF was terminated in 2017. In addition, the City designated the Foster/Edens TIF in 2018.
TIF Revenue
TIF revenues are generated from incremental property taxes within a designated district over a period of 23 or 24 years, or up to 36 years if extended by State legislation, with the exception of transit TIFs which have a maximum 36-year life. TIF revenues are used to fund community projects, public improvements, and provide incentives to attract private investment to the area. Funds are used to build and repair neighborhood streets, alleys, bridges, and lighting; modernize and improve schools; construct and upgrade the transit system; build and improve parks; increase affordable housing; and promote neighborhood economic development.
Fluctuations in TIF revenue year-over-year can be attributed to a combination of factors including but not limited to changes in property tax levies enacted by the taxing districts, changes in EAV and changes in the total number of active TIF districts. In each TIF district, the amount of TIF revenue depends on the amount of incremental EAV in the district and the composite tax rate, which is applied to that EAV.
EAV in the City’s TIFs declined steadily after 2009 in part due to the expiration of the Central Loop TIF, which had been the largest revenue producing TIF at the time. Due to the timing of the County’s triannual reassessments, EAVs did not begin to reflect recessionary sales and valuations following the economic downturn until 2011. In 2011, on a citywide basis, the increase in the tax rate outweighed any decrease in EAV in the City’s TIF districts, resulting in increased TIF revenues. In 2012 however, the relative impact of the decrease in EAVs began to outweigh the impact of the increase in the tax rate, and overall TIF revenues decreased. The EAV in the City’s TIFs began showing modest growth in 2014 with more substantial growth in 2016 as the result of the triennial reassessment and the increasing property tax levies due to increased contributions to police and fire pensions.
City TIF revenue increased in 2017 as the result of a significant increase in the equalization factor, reflecting the continued recovery in the Chicago real estate market, and new construction in certain TIF districts, combined with an increase in the composite tax rate. During 2017, the City received incremental Property Tax revenue from 134 of the 145 TIF districts that were active during the year, totaling $528.8 million. This trend is expected to continue as property values grow and the tax rates continue to increase. The 2017 TIF revenue also includes a net $20.7 million in interest income in these TIF funds.
TIF Commitments
The chart below presents TIF funds committed from 2008 through 2017 as follows:
• Infrastructure - including the construction, repair, and maintenance of City streets, sewers, bridges, bike lanes, and other critical infrastructure
• Sister Agencies - including projects undertaken by Chicago Public Schools (“CPS”), Chicago Park District, and the Chicago Transit Authority (“CTA”)
Tax Increment Financing

A n n u a l F i n a n c i a l A n a l y s i s 2 0 1 8
108
Tax Increment Financing
2008
2009
2010
2011
2012
2013
2014
2015
2016
2017
$0.0M
$10,000.0M
$20,000.0M
$30,000.0M
$40,000.0M
$50,000.0M
$60,000.0M
$70,000.0M
$80,000.0M
$90,000.0M
$100,000.0M
0.0%
2.0%
4.0%
6.0%
8.0%
10.0%
12.0%
% o
f EA
V in
TIF
$76,
765.
3M
$74,
016.
5M
$70,
968.
5M
$64,
908.
1M
$62,
363.
9M
$65,
250.
4M
$75,
122.
9M
$82,
087.
2M
$84,
586.
8M
$80,
977.
5M
$8,9
97.9
M
$7,7
92.0
M
$6,6
49.5
M
$5,4
03.2
M
$6,1
27.2
M
$7,0
75.1
M$8,2
07.0
M
$10,
183.
1M
$11,
079.
6M
$10,
183.
8M
City TIF % of EAV in TIF
EAV CITYWIDE AND IN TIF DISTRICTS
2008
2009
2010
2011
2012
2013
2014
2015
2016
2017
$567
.4M
$481
.9M
$475
.1M
$549
.3M
$467
.2M
$421
.3M
$408
.7M
$373
.0M
$493
.9M
$515
.1M
Tax RevenueInterest
Other RevenueLand Sales & Rental Revenue
The amounts referenced in this chart are those recognized in the TIF Annual Reports. The 2017 numbers are preliminary and subject to change.
TIF REVENUE BY SOURCE

A n n u a l F i n a n c i a l A n a l y s i s 2 0 1 8
109
• Planning and Administration - including the cost of studies, program administration, and professional services for the TIF program
• City Facilities - including the construction and renovation of City facilities such as libraries, police stations, and fire stations
• Economic Development - including redevelopment projects throughout the City
• SBIF/NIP/TIF Works - including small business improvement, neighborhood improvement programs, and job training programs
• Residential Development - including the construction of low income and affordable housing, rehabilitation of homes, and funds for the Chicago Housing Authority
Under certain circumstances, the City may transfer TIF revenue from one TIF district to an immediately adjacent TIF district. Transfers have been used to pay debt service on bonds issued to fund school construction, including Modern Schools Across Chicago (“MSAC”) projects which
are discussed further below, as well as to fund major Chicago Park District projects, CTA track and station improvements and other neighborhood development projects. Between 2007 and 2017, a total of $692.3 million was transferred between TIFs.
Expenditure data, categorized at a high level into financing, public improvement, site preparation, administration, development, and job training costs, can be found online in the audited annual financial reports for each TIF.
TIF Funding Provided to Sister Agencies
Since the start of the TIF program, the City has provided $1.36 billion for school related projects, $377.0 million to the Chicago Park District for park and open space projects, and $931.0 million to the CTA for track and station renovation and related projects. TIF funding has also been committed directly to CPS for 142 school-related projects using funds from 57 TIF districts citywide. A significant portion of the TIF funds provided by the City to CPS has been through MSAC, a capital improvement program established to fund the construction and renovation of 23 schools over seven
Tax Increment Financing
City Facilities$208.7M
Economic Development$672.0M
Planning and Administration$14.2M
Infrastructure$749.7M
Residential Development$236.9M
SBIF, NIP TIF Works$136.7M
Sister Agencies - CPS$355.8M
Sister Agencies - CTA$796.2M
Sister Agencies - Park District$129.6M
TIF COMMITMENTS, 2009-2017

A n n u a l F i n a n c i a l A n a l y s i s 2 0 1 8
110
years. The City has committed to providing $781.4 million in TIF funds to MSAC over the life of the program.
TIF funding from 47 TIF districts citywide to date has been committed to the Chicago Park District for 81 parks and open-space projects. The City has committed funding from 19 TIF districts for 31 CTA projects, including station and track construction and repairs, not including the Transit TIF.
Transit TIF
The Red Purple Modernization (RPM) Transit TIF was designated in late 2016 to help provide funding for repairs and reconstruction of the nearly 100 year old Red and Purple CTA lines. Phase One of the RPM project includes modernizing stations from Lawrence to Bryn Mawr, and constructing a flyover bypass north of the Belmont Station that allows more trains to run per hour and decreases the number of delays. The Transit TIF funding and project work are separate from the other CTA transit work that is funded with TIF. The Transit TIF enabling legislation passed by the Illinois General Assembly in June 2016 permits the creation of a TIF narrowly tailored for the sole purpose of renovating and expanding capacity of certain transit facilities. The term of the TIF is up to 36 years, and the boundaries can only extend up to a half-mile from specific transit facilities.
The distributive share of Transit TIF incremental revenue is different than traditional TIFs; of the total increment, CPS retains its share of the aggregate the property tax levy. Of the remaining Transit TIF incremental revenue, 20.0 percent is distributed to the remaining overlapping taxing districts based on their share of the aggregate property tax levy, while the Transit TIF receives 80.0 percent of the remainder for projects.
TIF Surplus, Downtown Freeze and Closings
The TIF Surplus table indicates the proportionate share of property tax revenues returned to the City’s overlapping taxing districts since the 2009 budget. The overlapping taxing districts receive released revenues as a result of TIF district expiration, termination, or repeal. In addition, as discussed below, the City annually identifies excess or “surplus” revenues within active TIF districts to be returned to the overlapping taxing districts.
Surplus Declaration
On an annual basis, the City declares a portion of the funds in an active TIF as surplus, which is then distributed on a proportionate basis to each of the overlapping taxing districts. Surplus declaration occurs during the budget process and is pursuant to State law which requires that any incremental revenues not identified as designated for eligible costs be declared as surplus. In addition, Mayor Emanuel issued Executive Order No. 2013-3, which sets forth a policy to regularly return unneeded TIF revenues to the taxing districts according to set criteria. Under Executive Order No. 2013-3, the City declares a surplus in TIF districts that are older than three years, were not created for a single redevelopment project, do not support debt service costs on MSAC bonds, and have a balance of at least $1 million. The amount of the surplus is at least 25.0 percent of the available cash balance of TIF funds anticipated for future use in the TIF, after accounting for current and future project commitments and contingencies, revenue volatilities, tax collection losses and current and future tax liabilities. Also, in July of 2015, the City froze new spending in downtown TIFs and will terminate them when the current and committed projects are paid off. This policy does not apply to major infrastructure projects in imminent need of repair. This policy affects seven TIF districts and returns approximately $250.0 million in surplus over the subsequent five years. This downtown TIF freeze accounts for the majority of the TIF surplus in 2017.
TIF ClosingsThere are a number of ways in which TIF districts come to a close:
• A TIF district expires automatically after 24 or 23 years, depending on when it was established, or 36 years if it was extended pursuant to State law.
• The City can terminate a TIF district before its planned expiration if it has achieved its initial goals, if no outstanding commitments or obligations are owed, or if an extended period of inactivity or lack of investment has indicated that additional development is unlikely.
• The City must repeal a TIF district if no substantial redevelopment activity has been initiated during the first seven years of the district’s existence.
Tax Increment Financing

A n n u a l F i n a n c i a l A n a l y s i s 2 0 1 8
111
The City continues to evaluate the performance of each TIF district and will consider additional terminations as appropriate going forward. After a TIF district ends, surplus funds are returned to the taxing districts, and the incremental EAV of the district becomes part of the aggregate EAV that is available to all taxing districts. Taxing districts, including the City, have the ability to recover their portion of the revenue from the incremental EAV by adding it to their levy following a TIF district’s dissolution. Amounts recovered through this practice are outside of the State-mandated property tax cap that applies to certain taxing districts, including CPS.
TIF Administration Fund
The TIF Administration Fund accounts for all administrative expenses incurred by the City to operate and maintain its Tax Increment Financing program. In 2017, $8.9 million of such expenses were reimbursed to this fund from the City’s TIF funds, which is a slight increase from 2016 year-end levels but is in line with program costs. In 2018, the budget for the TIF Administration Fund is $10.7 million.
Tax Increment Financing
2009
2010
2011
2012
2013
2014
2015
2016
2017
2018
$24.61
M
$0.04M
$276
.44M
$96.49
M
$43.55
M $65.18
M
$84.39
M $113
.16M
$176
.71M
$171
.10M
Termination Repeal Expiration Declared
TIF SURPLUS BY TYPE

Appendices
Annual Financial Analysis2018


A n n u a l F i n a n c i a l A n a l y s i s 2 0 1 8
115
CITY BUDGETING, FINANCIAL MANAGEMENT AND CONTROLS
Annual Budget
Each year, the City prepares an annual budget that accounts for revenue from taxes and other sources and sets forth a plan for how the City intends to utilize those resources over the course of the following year. In accordance with the Illinois Municipal Code, the City produces a balanced budget, meaning that its appropriated expenditures do not exceed the amount of resources it estimates will be available for that year.
The budget process begins each summer, when City departments inform the Office of Budget and Management (“OBM”) of their personnel and non-personnel needs for the upcoming year. Departments begin the budget process using a zero-based spending plan that encourages strategic and creative thinking to provide top quality services while cutting extraneous costs. OBM then prepares a preliminary budget based on the requests submitted by the departments and the resources OBM expects will be available to fund those needs.
OBM estimates the Citywide expenses such as pension contributions, employee healthcare, and debt service. The Office also prepares estimates on the amount of revenue that the City will collect the following year.
In the Fall, the Mayor’s Office and OBM work with departments to develop a final budget for the entire City government. OBM then compiles and balances the Mayor’s proposed budget, which is introduced to the City Council on or before October 15 of each year. Once announced, the proposed budget is available to the public. The City Council holds committee meetings and public hearings on the Mayor’s proposed budget and may submit amendments to it. Once the proposed budget, as amended, is adopted by the City Council, and approved by the Mayor, it becomes the Annual Appropriation Ordinance. The Annual Appropriation Ordinance is implemented on January 1 of the following year and represents the City’s operating budget for that year.
Budget Documents
The documents prepared as part of the City’s budget process are set forth below. Such documents are not prepared for investors in securities issued by the City, or intended to be a basis for making investment decisions with respect to any bonds, notes, or other debt obligations of the City.
• Annual Financial Analysis – Provides a review of the City’s revenues and expenditures for the past ten years, a forecast of the City’s finances for the next three years, and analysis of the City’s pension contributions, debt obligations, capital improvement program and tax increment finance program.
• Budget Overview – Provides a summary of the proposed budget and detailed information on the City’s anticipated revenues, expenditures and personnel.
• Budget Recommendation – Constitutes the Mayor’s proposed budget to the City Council in accordance with Illinois state law.
• Consolidated Plan – The five-year plan setting forth priorities for the City’s housing and non-housing community needs based on housing and community development assessments.
• Annual Appropriation Ordinance – The City’s line-item budget as passed by City Council.
• Capital Improvement Program – A comprehensive list of capital improvements scheduled to occur over the next five years.
Budget Calendar
July/August
Departments submit preliminary revenue and expense estimates to OBM.
August through September
OBM receives detailed budget requests from City departments and holds a series of meetings with each department regarding its needs for the coming year. OBM works with the Mayor’s Office to match expenses with available resources and balance the next year’s budget.
October
On or before October 15, the Mayor submits a proposed
Appendices

A n n u a l F i n a n c i a l A n a l y s i s 2 0 1 8
116
budget to the City Council, and the City Council conducts hearings on the budget, including the solicitation of public comments, to gather comments on the proposed budget.
November/December
Additions or changes to the proposed budget are considered. The City Council must approve a balanced budget by December 31, at which point the Budget Recommendations, with any amendments, becomes the Annual Appropriation Ordinance. The Final Action Plan is submitted annually to the U.S. Department of Housing and Urban Development for funding consideration.
January
The City’s Annual Appropriation Ordinance goes into effect.
Throughout The Year
Throughout the year, OBM manages the resources allocated through the Annual Appropriation Ordinance. OBM regularly reviews revenues, expenditures, and any trends or events that may affect City finances. City departments provide information about the performance of budgeted programs to ensure that City resources are used in a manner that maximizes taxpayer value and provides the highest quality of services.
City Fund Structure
The City’s Annual Financial Analysis (“AFA”) and Annual Appropriation Ordinance organize budgeted activities by funds, each of which is accounted for separately. Each fund has a specific set of revenue sources, which are utilized to support City services and functions. The revenue sources of the Federal, State and Local Grants Fund and the Enterprise Funds are restricted as to use by law. The Special Revenue Funds are largely dedicated to specific services and functions. The revenues from these funds are not otherwise available to pay for general Citywide expenses, including debt service on the City’s general obligation bonds and the City’s pension costs exceeding amounts properly allocable to the funds. The Funds described in the AFA and Annual Appropriation Ordinance differ from the City’s Comprehensive Annual Financial Report (“CAFR”). For Fund descriptions as presented in the CAFR, please see the 2017 CAFR which is available online.
Fund Stabilization
The City’s policy is to maintain sufficient unrestricted fund balances to mitigate current and future risks, emergencies, or unanticipated budget shortfalls. As part of its financial and budget practices, the City establishes and maintains three sources of unrestricted budgetary fund balance: (i) Asset Lease and Service Concession Reserves, (ii) Operating Liquidity Fund, and (iii) Unassigned Fund Balance. Current City policy states that the City will maintain an unrestricted fund balance equivalent to no less than two months of operating expenses.
Asset Lease and Concession Reserves
In 2005, the City entered into a 99-year lease of the Chicago Skyway, under which a private company was granted the right to operate and collect tolls from the Skyway. In return, the City received an upfront payment of $1.83 billion. Approximately $850 million of this amount was used to pay off existing debt, including $446.3 million to refund the outstanding Skyway bonds at the time of the transaction.
In 2009, the City entered into a 75-year concession agreement for its metered parking system, under which a private company was granted the right to operate and collect revenue from the parking meter system and the City received an upfront payment of $1.15 billion.
Both of these transactions resulted in the establishment of a long-term reserve fund, a mid-term reserve fund, and a human infrastructure fund.
The City established a $500 million long-term reserve with a portion of the proceeds of the Chicago Skyway lease. The principal of this fund was intended to supplement Corporate Fund reserves, with interest earnings to be used for City operating expenses. These funds have been utilized as planned - the principal balance remains $500 million and the earned interest has been transferred to the Corporate Fund each year, with the dollar amount of the transfer reflecting variations in interest rates.
The City established a $400 million long-term reserve with a portion of the proceeds of the parking meter concession. This fund was created to replace revenues that would have been generated from parking meters by transferring interest earnings to the Corporate Fund, with the principal remaining
Appendices

A n n u a l F i n a n c i a l A n a l y s i s 2 0 1 8
117
intact at $400 million. However, starting in 2009, the City began utilizing these long-term reserve funds to subsidize the City’s operating budget. Utilizing these funds reduced the principal balance substantially below the initial deposit and accordingly reduced the interest earnings generated by the fund. The original ordinance establishing the fund directed that an annual transfer of $20 million be made from the fund into the Corporate Fund to replace lost meter revenue. However, in order to maintain these important reserves, the City amended the ordinance in 2012 to state that only interest generated from the fund, and not principal, must be transferred for this purpose. In addition, the City began to rebuild these reserves in 2012, with $40 million deposited into the reserves from 2012 to 2014 ($20 million deposited in 2012, $15 million deposited in 2013, and $5 million deposited in 2014) and another $15 million deposited into the operating liquidity fund from 2015 through 2017 ($5 million deposited each of those years). The City intends to deposit another $5 million into the operating liquidity fund in 2018. The City also established mid-term reserve funds of $375 million and $325 million, respectively, with proceeds from the Skyway lease and parking meter concession. Both of these funds were created to supplement Corporate Fund revenues. The Skyway mid-term reserve fund has been drawn upon as scheduled, with the principal depleted in 2010 and the approximately $50 million in accumulated interest transferred from this fund to the Corporate Fund in 2011. The parking meter mid-term reserve was established to assist the City in weathering the national economic downturn occurring at the time of the closing of the parking meter concession. Initially $326.4 million was deposited into the fund and the principal was fully utilized by the end of 2010. A small amount (approximately $600,000) of interest remained in the fund and was transferred to the parking meter long term reserve fund in 2012.
The City set aside $100 million of the proceeds from each of the Skyway and the parking meter concession transactions to be used to fund programs to improve the quality of life in Chicago neighborhoods. The principal of the Skyway human infrastructure fund was fully utilized by the end of 2009 and the remaining interest in the fund was utilized in 2011. The remaining balance of the parking meter human infrastructure fund was used in 2014.
In 2008, the City entered into an agreement with a private company for the long-term lease of Midway International Airport. The private company failed to carry out the transaction and surrendered its $126.1 million security deposit to the City in 2009; $13.1 million of this amount was used to pay various fees associated with the proposed lease transaction, $33 million was used to pay off existing debt, and $40 million was transferred to the Corporate Fund for use in that year. The remaining $40 million was transferred to the Corporate Fund in two $20 million transfers, one in 2010 and the second in 2011.
The chart below provides the year-end balance as recorded annually in the CAFR for the City’s asset lease and service concession reserves.
Operating Liquidity Fund
In 2016, the City created the Operating Liquidity Fund for purposes of financial management. The Operating Liquidity Fund is expected to function as recurring short-term funding for the City operations that are funded from a dedicated revenue source (e.g., Chicago Public Library property tax revenue), to mitigate against temporary shortfalls caused by timing differences in the receipt of certain revenue. The Operating Liquidity Fund is not intended to provide one-time revenue to the General Fund budget or provide an indefinite line of credit. The City has set aside $5 million in 2015, 2016 and 2017 for the Operating Liquidity Fund, which is reflected in the CAFR in the assigned fund balance. As of December 31st, 2017, the City has $15 million in
Appendices
ASSET LEASE AND SERVICE CONCESSION RESERVE BALANCE

A n n u a l F i n a n c i a l A n a l y s i s 2 0 1 8
118
the assigned fund balance for the Operating Liquidity Fund. The City plans to deposit another $5 million in the Operating Liquidity Fund in 2018.
Unassigned Fund Balance
Surplus resources identified through the annual financial audit process make up the unassigned fund balance. The City’s unassigned fund balance was $33.8 million in 2013, $51.6 million in 2014, $93.0 million in 2015, $153.7 million in 2016 and $155.3 million in 2017. The growth has been due in part to the improving economy, enhancements in revenue systems, including debt collection and investment strategies, and ongoing savings and efficiencies.
Current City policy states that the City will not appropriate more than one percent of the value of the annual corporate budget from the prior year’s audited unassigned fund balance in the current year’s budget. Water and Sewer Rate Stabilization Accounts
The City’s Water Fund and Sewer Fund both maintain rate stabilization accounts. These accounts ensure that the City’s water and sewer systems will remain financially solvent in the case of a catastrophic event. In such an event, the accounts would be used to finance operations and make necessary repairs for a short period of time. Contributions to the water and sewer rate stabilization accounts are projected in amounts necessary to maintain an account balance equal to three months of operating expenses. Any net revenues remaining after providing sufficient funds for all required
deposits into the bond accounts may be transferred to the water and sewer rate stabilization accounts upon the direction of the City to be used for any lawful purpose of the water and sewer systems, respectively. Set forth in the following tables are the historical transfers to (from) and the balances of the Water and Sewer Rate Stabilization Accounts. Diverse Revenue System and Evaluation of Costs
The City maintains a diversified and stable revenue system that is responsive to the changing economy and is designed to protect the City from short-term fluctuations in any individual revenue source. The City does not use revenue from volatile sources in an amount that exceeds normal growth rates for ongoing operating costs. User fees are evaluated to determine appropriate levels to support in part or in full the cost of the service. Where possible, tax and fee reductions and waivers are also evaluated to determine their value and impact on City services and finances. Where appropriate, the cost of City services is benchmarked against similar providers of such services so that the City can accurately evaluate opportunities to improve efficiency and reduce costs associated with service delivery.
Declaring a TIF Surplus
Pursuant to Mayoral Executive Order No. 2013-3, the City must declare a surplus in those TIF districts that are older than three years, were not created for single redevelopment projects, are not transferring funds to other TIF districts to pay debt service costs, and have a balance of at least $1 million. The amount of the surplus is at least 25.0 percent
Appendices
WATER AND SEWER RATE STABILIZATION ACCOUNTS

A n n u a l F i n a n c i a l A n a l y s i s 2 0 1 8
119
of the available cash balance in the TIF, after accounting for current and future project commitments and contingencies, revenue volatilities, tax collection losses, and tax liabilities.
Debt Management Policy
Pursuant to Section 2-32-031(d) of the Municipal Code of Chicago, the Chief Financial Officer is authorized to adopt the City of Chicago Debt Management Policy which establishes guidelines for the issuance and management of all City-issued debt and any new financing types related to existing City debt. The Chief Financial Officer has the day-to-day responsibility and authority to structure, implement, and manage the City’s debt program.
City Investment Policy
The investment of City funds is governed by the Municipal Code. Pursuant to the Municipal Code, the City Treasurer has adopted a Statement of Investment Policy and Guidelines to establish written cash management and investment guidelines for the investment of City funds.
Amounts in a variety of funds of the City’s, including the General Fund, are invested on a commingled basis, and are referred to as the City’s “consolidated cash.” Consolidated cash may be used for interfund borrowings among various funds of the City, including, but not limited to, the General Fund, and such use reduces the need for external borrowing by the City to meet the needs of its funds. The City has maintained its consolidated cash, including interfund borrowing, to meet the obligations of its funds, including the General Fund, in a timely manner.
Appendices

A n n u a l F i n a n c i a l A n a l y s i s 2 0 1 8
120
CO
RP
OR
ATE
FU
ND
- R
EV
EN
UE
S
Appendices

A n n u a l F i n a n c i a l A n a l y s i s 2 0 1 8
121
AppendicesC
OR
PO
RAT
E F
UN
D -
RE
VE
NU
ES

A n n u a l F i n a n c i a l A n a l y s i s 2 0 1 8
122
CO
RP
OR
ATE
FU
ND
– E
XP
EN
DIT
UR
ES
Appendices

A n n u a l F i n a n c i a l A n a l y s i s 2 0 1 8
123
CO
RP
OR
ATE
FU
ND
– E
XP
EN
DIT
UR
ES
– B
Y D
EPA
RT
ME
NT
Appendices

A n n u a l F i n a n c i a l A n a l y s i s 2 0 1 8
124
CO
RP
OR
ATE
FU
ND
– E
XP
EN
DIT
UR
ES
– B
Y D
EPA
RT
ME
NT
Appendices

A n n u a l F i n a n c i a l A n a l y s i s 2 0 1 8
125
AppendicesSP
EC
IAL
RE
VE
NU
E F
UN
DS
– R
EV
EN
UE
S
SPE
CIA
L R
EV
EN
UE
FU
ND
S –
EX
PE
ND
ITU
RE
S

A n n u a l F i n a n c i a l A n a l y s i s 2 0 1 8
126
EN
TE
RP
RIS
E F
UN
DS
– R
EV
EN
UE
S Appendices

A n n u a l F i n a n c i a l A n a l y s i s 2 0 1 8
127
EN
TE
RP
RIS
E F
UN
DS
– E
XP
EN
DIT
UR
ES
Appendices


C i t y o f C h i c a g oMayor Rahm Emanuel
w w w . c i t y o f c h i c a g o . o r g