annual general meeting 2017 imperial brands plc · annual general meeting 2017 imperial brands plc...
TRANSCRIPT
ANNUAL GENERAL MEETING 2017
Imperial Brands PLC
1 February 2017
Mark Williamson
Chairman

3 |
DELIVERING ON OUR PRIORITIES IN FY16Track record of consistent delivery
Strengthen
Portfolio
Develop
Footprint
Drive Cost
Optimisation
Embed Capital
Discipline
• Quality of revenue improved
• Growth Brand share and
revenue growth
• Building stronger equity and
technology in e-vapour
• Realising opportunities in
Growth Markets
• Improving quality of growth
in Returns Markets
• Strong results from ITG
Brands in the USA
• Savings programme on
track
• Reducing portfolio
complexity
• Continuing to improve ways
of working
• Cash conversion 95%
• Adjusted net debt reduced
by £1bn at constant
currency
Net revenue Operating profit Operating margin EPS Dividend
+10% +10% +60bps +12% +10%
ALISON COOPER
Chief Executive
5 |
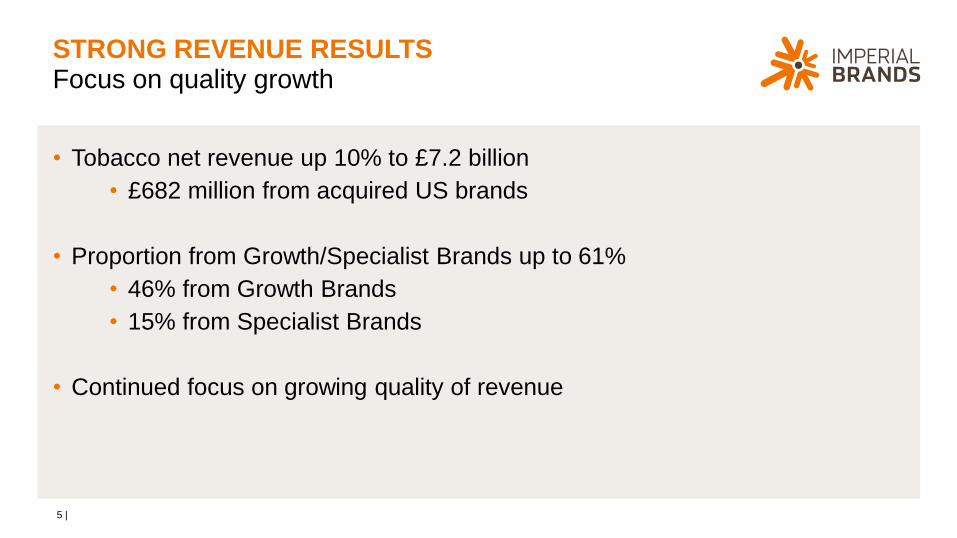
STRONG REVENUE RESULTS
• Tobacco net revenue up 10% to £7.2 billion
• £682 million from acquired US brands
• Proportion from Growth/Specialist Brands up to 61%
• 46% from Growth Brands
• 15% from Specialist Brands
• Continued focus on growing quality of revenue
Focus on quality growth
6 |
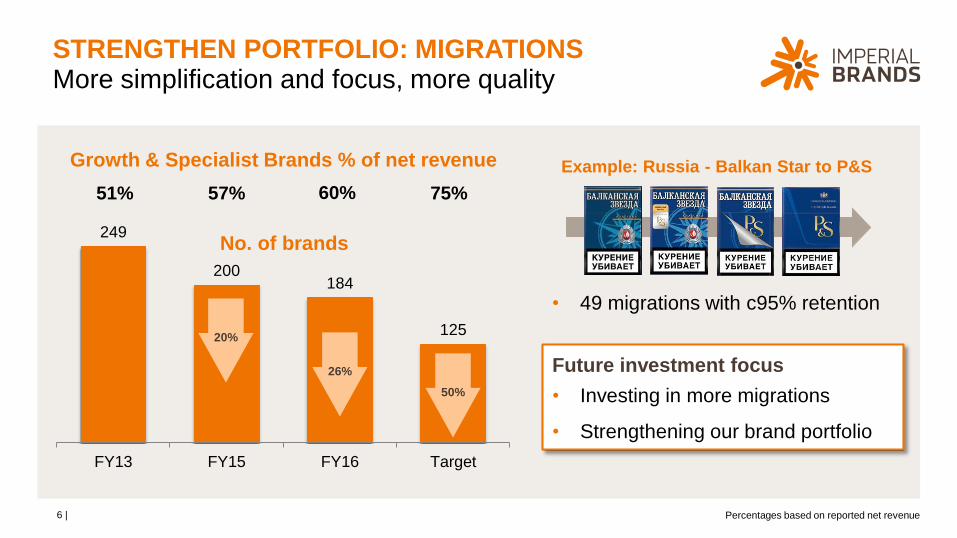
STRENGTHEN PORTFOLIO: MIGRATIONSMore simplification and focus, more quality
Percentages based on reported net revenue
• 49 migrations with c95% retention
249
200184
125
FY13 FY15 FY16 Target
No. of brands
26%
50%
20%
51% 57% 60% 75%
Growth & Specialist Brands % of net revenue Example: Russia - Balkan Star to P&S
Future investment focus
• Investing in more migrations
• Strengthening our brand portfolio
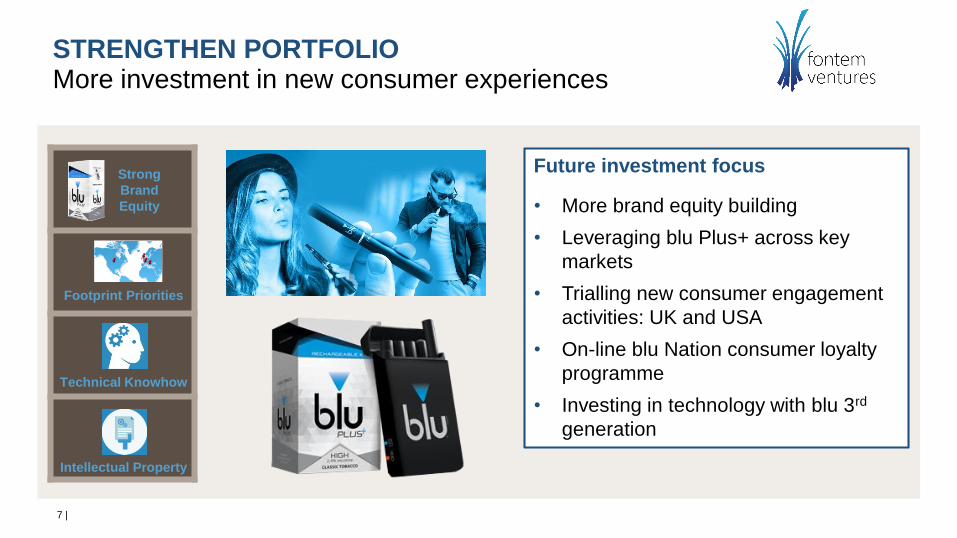
STRENGTHEN PORTFOLIOMore investment in new consumer experiences
Future investment focus
• More brand equity building
• Leveraging blu Plus+ across key
markets
• Trialling new consumer engagement
activities: UK and USA
• On-line blu Nation consumer loyalty
programme
• Investing in technology with blu 3rd
generation
7 |
Include icons
from LHS of
Interims slide
Other blu
images?
Strong
Brand
Equity
Footprint Priorities
Technical Knowhow
Intellectual Property
8 |
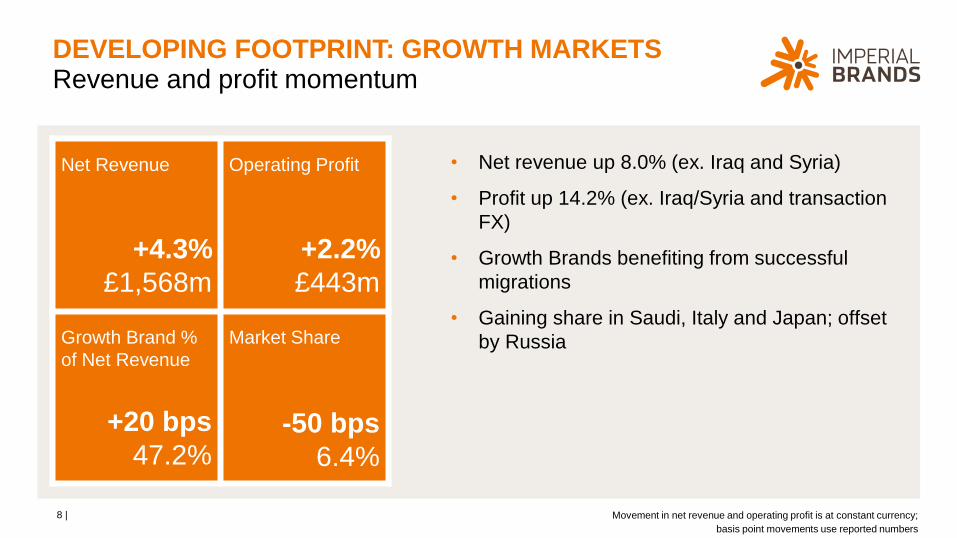
DEVELOPING FOOTPRINT: GROWTH MARKETSRevenue and profit momentum
• Net revenue up 8.0% (ex. Iraq and Syria)
• Profit up 14.2% (ex. Iraq/Syria and transaction
FX)
• Growth Brands benefiting from successful
migrations
• Gaining share in Saudi, Italy and Japan; offset
by Russia
Movement in net revenue and operating profit is at constant currency;
basis point movements use reported numbers
Net Revenue
+4.3%
£1,568m
Operating Profit
+2.2%
£443m
Growth Brand %
of Net Revenue
+20 bps
47.2%
Market Share
-50 bps
6.4%

9 |
DEVELOPING FOOTPRINT: USA MARKETStrong results from ITG Brands
Net Revenue
+92.9%
£1,477m
Operating Profit
+102.4%
£823m
Growth Brand %
of Net Revenue
+490 bps
18.6%
Market Share
9.2%
• ITG Brands performing strongly; in line with our
expectations
• Retail merchandising programme delivering:
• Shelf space and improved visibility
• Interior/exterior advertising
• New distribution model benefiting mass market
cigar
Movement in net revenue and operating profit is at constant currency;
basis point movements use reported numbers
10 |
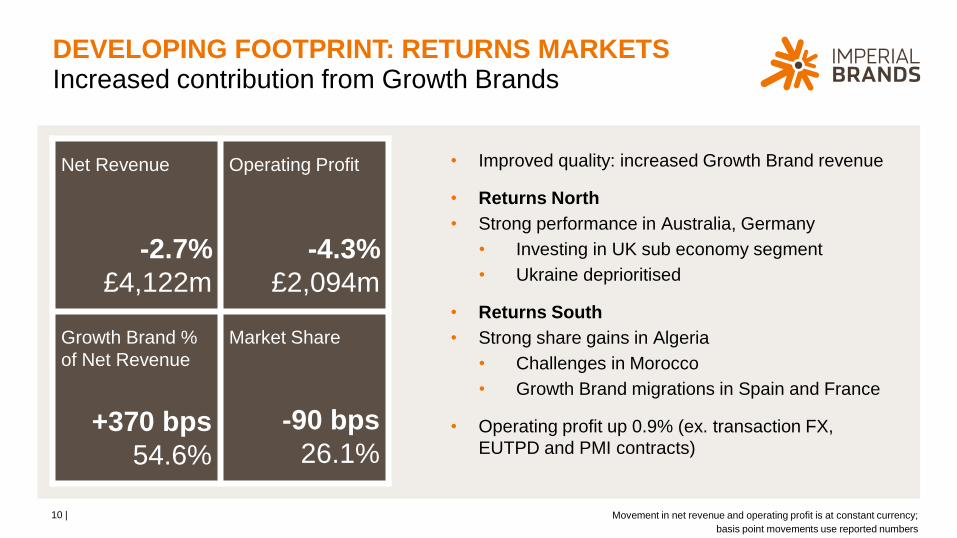
DEVELOPING FOOTPRINT: RETURNS MARKETSIncreased contribution from Growth Brands
• Improved quality: increased Growth Brand revenue
• Returns North
• Strong performance in Australia, Germany
• Investing in UK sub economy segment
• Ukraine deprioritised
• Returns South
• Strong share gains in Algeria
• Challenges in Morocco
• Growth Brand migrations in Spain and France
• Operating profit up 0.9% (ex. transaction FX,
EUTPD and PMI contracts)
Movement in net revenue and operating profit is at constant currency;
basis point movements use reported numbers
Net Revenue
-2.7%
£4,122m
Operating Profit
-4.3%
£2,094m
Growth Brand %
of Net Revenue
+370 bps
54.6%
Market Share
-90 bps
26.1%
11 |
COST AND CASH
• On track to deliver £300 million savings a year by 2018
• £240 million delivered so far, including £65 million in 2016
• Cash conversion strong at 95%
• Adjusted net debt reduced by £1 billion
• £2.1 billion reduction over two years
• Eighth consecutive year of 10% dividend growth
Key drivers of growth strategy
12 |
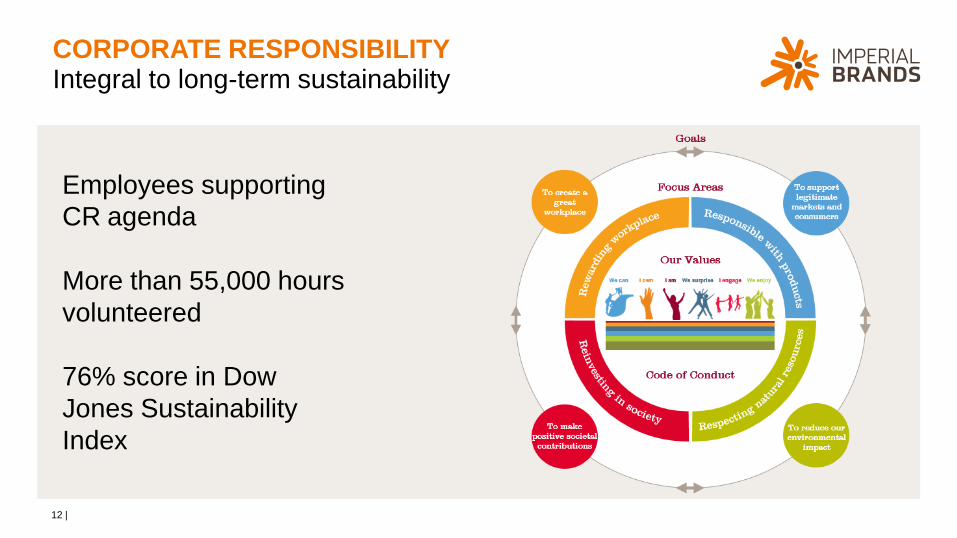
CORPORATE RESPONSIBILITYIntegral to long-term sustainability
Employees supporting
CR agenda
More than 55,000 hours
volunteered
76% score in Dow
Jones Sustainability
Index
13 |
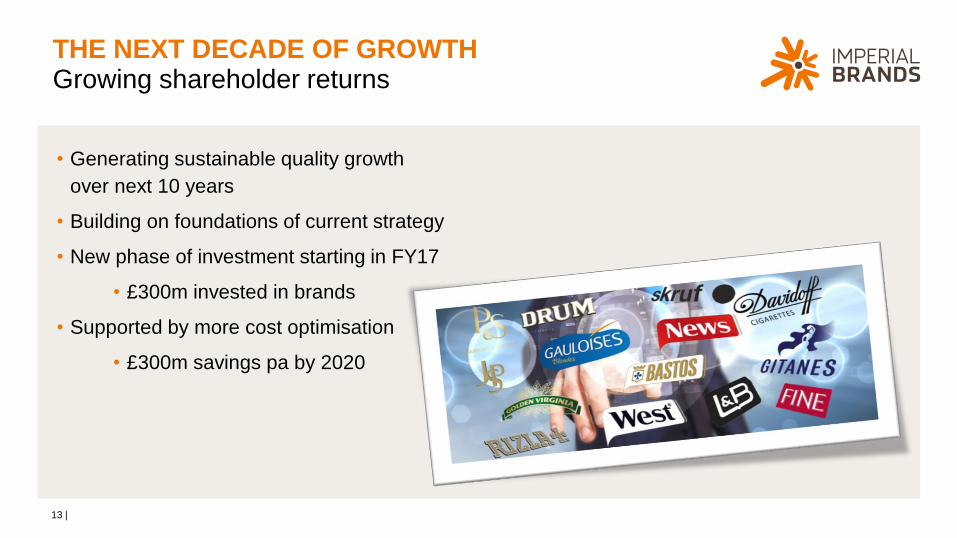
THE NEXT DECADE OF GROWTH
• Generating sustainable quality growth
over next 10 years
• Building on foundations of current strategy
• New phase of investment starting in FY17
• £300m invested in brands
• Supported by more cost optimisation
• £300m savings pa by 2020
Growing shareholder returns

14 |
OUR PRIORITIES FOR FY17On track to deliver
Deliver at least 10% increase in dividend
Strengthen
Portfolio
Develop
Footprint
Drive Cost
Optimisation
Embed Capital
Discipline
• More portfolio simplification
• Migrations and SKU reduction
• Increase Growth and
Specialist Brands contribution
• e-vapour/blu development and
adjacencies
• More prioritisation
• Build on Growth Market
opportunities
• Maintain momentum at ITG
Brands
• Optimise performance in key
Returns Markets
• More operating efficiencies
• Deliver £90m savings in
FY17
• Deliver benefits from new
ways of working
• More capital discipline
• Maintain cash conversion
focus
• Ongoing debt reduction