trinity mirror plc trinity mirror plc annual report & accounts 2010 regionals our regionals...
TRANSCRIPT

Trinity Mirror plcAnnual Report & Accounts 2010

Our strategic goal is to build a growing multi-platform media business, by developing and sustaining strong positions across print and digital, with products and services which meet the needs of our customers, both readers and advertisers.

Wh
o w
e a
reB
usin
ess r
evie
wG
ove
rna
nc
eF
ina
nc
ials
Trinity Mirror plc Annual Report & Accounts 2010 1
During 2010 we continued to focus on the delivery of our clear and consistent strategy and this has enabled the Group to deliver a strong financial performancewith operating profit* up 17.0% and operating margin*increasing to 16.2% from 13.8%. While revenue trendshave improved they remain under pressure due to the economic environment.
The Group has further strengthened its balance sheet during the year, with strong cash generation despite thechallenging revenue environment and continued pension deficit funding. The Group has significant financial flexibility and is trading well within its covenants.
Our acquisition of GMG Regional Media, in March, hasproved very successful, delivering a strong revenueand profit performance during the year. The acquisitionextends the Group’s reach across print and digital in the North West and the South providing further scale in these key geographies.
Our investment in the modernisation of business processes and structures throughout the Group, via the implementation of the new operating model,continues to reap sustainable efficiencies whilesupporting our strategic goal of building a multimedia business of scale. New IT systems have enabled usto re-engineer how we publish across editorial, advertising and pre-press. This has resulted in a stepchange in the way content is gathered and published across print and digital. Importantly we are not trying to do the same things with fewer people. Instead,the technology enables fundamental changes to theentire publishing process, achieving efficiencies at asignificantly lower cost base without detriment to quality. The business is leaner and fitter and well positioned for any upturn in market conditions.
2010 in context Who we are
1 2010 in context
2 Group at a glance
4 Regionals
8 Nationals
12 Chairman and
Chief Executive statement
18 Board and management team
Business review
20 Group activities
20 Group strategy
20 Our marketplace
21 Group performance
23 Regionals division
25 Nationals division
26 Central
27 Balance sheet
29 Risks and uncertainties
30 Employees
Governance
31 Corporate responsibility report
40 Corporate governance
46 Remuneration at a glance
47 Remuneration report
53 Directors’ report
Financials
56 Group consolidated accounts
57 Consolidated income statement
57 Consolidated statement of
comprehensive income
58 Consolidated statement of changes
in equity
59 Consolidated balance sheet
60 Consolidated cash fl ow statement
61 Notes to the consolidated fi nancial
statements
100 Parent company accounts
110 Group fi ve year summary
111 Shareholder information
112 Investor relations
* The adjusted results on pages 1 to 17 exclude the impact of non-recurring items, the amortisation of intangible assets, the retranslation of foreign currency borrowings, the impact of fair value changes on derivative financial instruments and the impact of tax legislation changes. A reconciliation between the adjusted results and the statutory results is provided in note 38 on page 99.
On a statutory basis revenue decreased from £763.3 million to £761.5 million, operating profitincreased from £87.0 million to £138.0 million and earnings per share increased from 11.5 penceto 44.6 pence.
Trinity Mirror plc 2 Annual Report & Accounts 2010
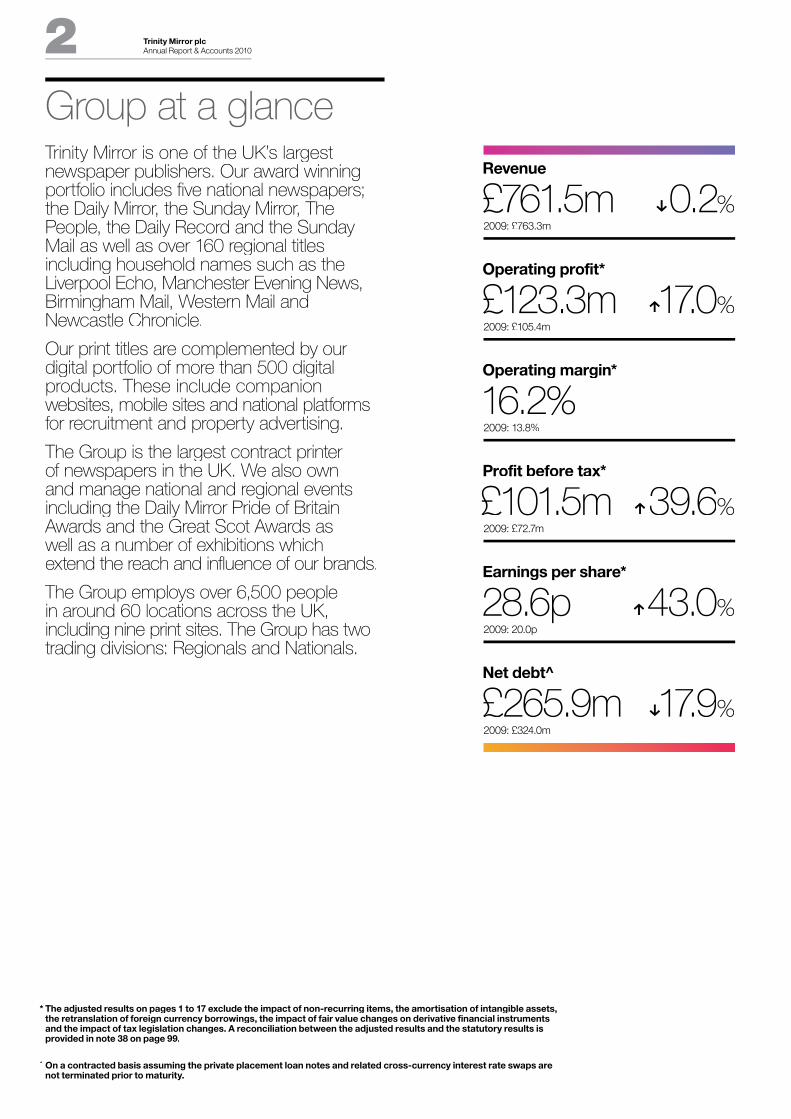
Group at a glanceTrinity Mirror is one of the UK’s largest newspaper publishers. Our award winning portfolio includes five national newspapers; the Daily Mirror, the Sunday Mirror, The People, the Daily Record and the Sunday Mail as well as over 160 regional titles including household names such as the Liverpool Echo, Manchester Evening News,Birmingham Mail, Western Mail and Newcastle Chronicle.
Our print titles are complemented by our digital portfolio of more than 500 digital products. These include companionwebsites, mobile sites and national platforms for recruitment and property advertising.
The Group is the largest contract printer of newspapers in the UK. We also own and manage national and regional events including the Daily Mirror Pride of Britain Awards and the Great Scot Awards as well as a number of exhibitions whichextend the reach and influence of our brands.
The Group employs over 6,500 peoplein around 60 locations across the UK, including nine print sites. The Group has two trading divisions: Regionals and Nationals.
Revenue
£ £761.5m x0.2%2009: £763.3m
O Operating profit*
£ £123.3m h17.0%2009: £105.4m
O Operating margin*
16.2%2009: 13.8%
Profit before tax*
£ £101.5m h39.6%2009: £72.7m
Earnings per share*
2 28.6p h43.0%2009: 20.0p
Net debt^
£ £265.9m x17.9%2009: £324.0m
^ On a contracted basis assuming the private placement loan notes and related cross-currency interest rate swaps are not terminated prior to maturity.
* The adjusted results on pages 1 to 17 exclude the impact of non-recurring items, the amortisation of intangible assets, the retranslation of foreign currency borrowings, the impact of fair value changes on derivative financial instruments and the impact of tax legislation changes. A reconciliation between the adjusted results and the statutory results isprovided in note 38 on page 99.

Wh
o w
e a
reB
usin
ess r
evie
wG
ove
rna
nc
eF
ina
nc
ials
Trinity Mirror plc Annual Report & Accounts 2010 3
RegionalsOur Regionals division publishes a vibrant and diverse portfolio of market leading brands inprint and digital media across the UK. 2010 saw a return to profit growth, with strong margin recovery and an improvement in revenue trends in the year.
Revenue £m
(including acquisitions)
h9.3% 2009 2010
302.9 331.2
Operating profit* £m
(including acquisitions)
h44.440%
Revenue £m
(including acquisitions)
Operating margin* %
(including acquisitions)
2009 2010
35.9
51.7
2009 2010
11.915.6
1
3
2
1. Advertising £222.5m
2. Circulation £73.2m
3. Other £35.5m
NationalsOur Nationals division publishes five national newspaper titles which are among the UK’s leading media brands complemented by a strong, multi-platform portfolio of digitalbusinesses, events and exhibitions. During 2010 the business demonstrated resilient profitability and margins.
Revenue £m
x6.5% 2009 2010
460.4 430.3
Operating profit* £m
h3.0%
Revenue £m
Operating margin* %
2009 2010
83.6 86.1
2009 2010
18.2 20.0
1
3
2
1. Advertising £128.8m
2. Circulation £244.2m
3. Other £57.3m
Trading divisions

Trinity Mirror plc 4 Annual Report & Accounts 2010
RegionalsOur Regionals division publishes a vibrant and diverse portfolio of market leading brands across the UK with more than 160 regionaldaily and weekly titles and over 500 digital products.
A strong portfolio of regional daily and weekly titlesreaches the length and breadth of the country and serves some of the UK’s biggest cities and metropolitan areas. We have a strong presence in the North West of England and North Wales, theNorth East, the Midlands, South Wales, Scotlandand the South of England.
In our key markets, our brands have a significant reach amongst the adult population reaching 58% on a weekly basis in Scotland, 73% in the NorthEast, 86% in the North West, 70% in the Midlands, 71% in South Wales and 56% in the South.
We publish 13 paid-for daily newspapers across the UK which have a circulation of just under half a million copies. We have three of the UK’s top 10 regional evening newspapers with the Manchester Evening News, Liverpool Echo and Newcastle Chronicle.We publish over 70 paid-for weekly titles whichincludes three of the top 10 regional Sunday titles:Sunday Sun in Newcastle, the Sunday Mercury in Birmingham and the Wales on Sunday. In additionwe publish around 80 free weekly titles and six metro titles. Overall our regional newspapers have a weekly circulation figure of 6.4 million copies and readershipof 7.7 million.
Our digital portfolio complements our print titles and extends our reach across our markets. We publisha wide range of digital products including companion websites to our key newspaper titles, hyperlocal sites serving specific communities and local and national recruitment and property websites.
In the recruitment category, we publish a network of specialist job sites, including leading brands such as GAAPweb, totallylegal, totallyfinancial, PlanetRecruit,SecsintheCity and The Career Engineer andgeneralist brands such as fish4. Our property websites include Smartnewhomes and email4property. Our websites attract 11.1 million unique users every month, up 17% year on year.
Revenue
2009: £302.9m
Operating profit*
£51.7m 2009: £35.9m
Operating margin*
15.6% 2009: 11.9%
Number of titles
160+Websites
500+
trinitymirror.com/our-portfolio/regionals
* The adjusted results on pages 1 to 17 exclude the impact of non-recurring items, the amortisation of intangible assets, the retranslation of foreign currency borrowings, the impact of fair value changes on derivative financial instruments and the impact of tax legislation changes. A reconciliation between the adjusted results and the statutory results isprovided in note 38 on page 99.

Wh
o w
e a
reB
usin
ess r
evie
wG
ove
rna
nc
eF
ina
nc
ials
Trinity Mirror plc Annual Report & Accounts 2010 5

Trinity Mirror plc 6 Annual Report & Accounts 2010

Regionals readership
7.7m Unique users
11.1m per month
Wh
o w
e a
reB
usin
ess r
evie
wG
ove
rna
nc
eF
ina
nc
ials
Trinity Mirror plc Annual Report & Accounts 2010 7

Trinity Mirror plc 8 Annual Report & Accounts 2010
NationalsThe Nationals division publishes the Daily Mirror, the Sunday Mirror and The People across the UK and the Daily Record and the Sunday Mail predominantly in Scotland.
Our national titles provide news and analysis readers can trust, delivered in a package that is easy to consume and popular with advertisers. From news and sport to politics and showbiz, our newspapers provide our readers with compelling value-for-money content and campaigning journalism every day of the week. At the heart of our business lies our proud journalistic heritage which provides the cornerstonefor our multi-platform development as we takeour brands, content and expertise across excitingnew media platforms.
The strength of our newspapers is clear from thesignificant paid-for circulation volumes of our titlesand the mass audience reach they provide in a fragmenting media landscape. The Daily Mirror and Daily Record achieved a joint circulation in excessof 1.5 million copies per day during 2010 withreadership per issue of 3.9 million. Our national Sunday titles – the Sunday Mirror, The People and the Sunday Mail – achieved a joint circulation of 2.0 million copies per week in 2010 with readership per issue of 6.1 million. The Sunday Mail continues to be the biggest selling newspaper in Scotland, with a circulation which is nearly 100,000 copieslarger than the next best-selling title.
Our newspaper titles are complemented by a growing multi-platform digital businesses. Our digital portfolio comprises the established companion websites to our national titles and also standalone websites such as mirrorfootball.co.uk and 3am.co.uk and a range of mobile sites. Interactive services suchas Mirror Bingo add to the rich consumer experience. The national websites attract 10.7 million unique users every month.
We own and manage over 15 annual events and anumber of exhibitions which extend the reach andinfluence of our brands into a range of commercial markets. Events include the Daily Mirror Pride of Britain Awards – the most watched award ceremony of its kind on British television – Great Scot Awards and the Scottish PLC Awards.
trinitymirror.com/our-portfolio/nationals
Revenue
£430.3m 2009: £460.4m
Operating profit*
£86.1m 2009: £83.6m
Operating margin*
20.0% 2009: 18.2%
Number of titles
5 Websites
10
* The adjusted results on pages 1 to 17 exclude the impact of non-recurring items, the amortisation of intangible assets, the retranslation of foreign currency borrowings, the impact of fair value changes on derivative financial instruments and the impact of tax legislation changes. A reconciliation between the adjusted results and the statutory results isprovided in note 38 on page 99.

Wh
o w
e a
reB
usin
ess r
evie
wG
ove
rna
nc
eF
ina
nc
ials
Trinity Mirror plc Annual Report & Accounts 2010 9

Trinity Mirror plc 10 Annual Report & Accounts 2010

Nationals readership
10.0m Unique users
10.7m per month
Wh
o w
e a
reB
usin
ess r
evie
wG
ove
rna
nc
eF
ina
nc
ials
Trinity Mirror plc Annual Report & Accounts 2010 11

Investment to grow core print and digital revenuesInvestment in new initiatives presents opportunities to drive diversified revenue streams across multiple media channels.
Acquisition of GMG Regional MediaHighly successful acquisition of GMG Regional Media, including Manchester Evening News, Surrey Advertiser and weekly titles and websites in the North West and Southof England.
Strong financial performanceResilient portfolio of newspaper and digital brands, delivering strong operating profit* growth of 17% in 2010, despite challenging revenue environment.
Contract printingLargest contract printer of newspapers in the UK through leveraging our network of nine high quality, full colour, printing facilities across the UK.
Strong balance sheetStrong cash generation, low levels of debt and reduced pension obligations ensuring lower leverage and increased financial flexibility.
Efficient operating modelInvestment in state-of-the-art IT systemshas resulted in a step change to the entire publishing process, achieving efficiencies without detriment to quality across multimedia platforms.
Investment in peopleLaunch of Inspirational Leadership and Talent Development Programmes tailored to develop, support and enhance the capabilities of staff across the Group.
Trinity Mirror plc 12 Annual Report & Accounts 2010
Wh
o w
e a
reB
usin
ess r
evie
wG
ove
rna
nc
eF
ina
nc
ials
Trinity Mirror plcAnnual Report & Accounts 2010 13
Chairman and Chief Executive statement
The Group delivered a strong financialperformance for 2010 with operating profit growing by 17.0%. The improved operating profit and reduced interest costs resultedin earnings per share increasing by 43.0%.The Group remained highly cash generativewith net debt falling by £58.1 million to £265.9 million.
The strong performance in a fragile economic environment, which saw low GDP growth, high unemployment and continued pressure on revenues, demonstrates the resilience of our strong portfolio of businesses. Management’s focus on maximising revenues in thesechallenging trading conditions, coupled with a strong revenue performance of £50.9 million from GMG Regional Media, ensuredthe Group achieved revenues broadly in line with 2009. Importantlythe revenues from GMG Regional Media did not require significant investment as the acquisition was completed for a cash considerationof only £7.4 million.
Group revenues were marginally down from £763.3 million to£761.5 million. Excluding the acquisition of GMG Regional Media, Group revenues were down by 6.9% to £710.6 million providing clearevidence of an improvement in revenue trends when compared to the decline of 12.4% experienced during 2009. The year-on-year revenue trends in 2010 have been adversely impacted by the additional week of trading in 2009 which contributed £9.9 million and by the impact of the severe weather conditions across the UK during December 2010.
A strong operating profit performance was achieved as management continued to tightly manage the cost base. The underlying cost base fell by £64.7 million in the year including structural cost savings of £25 million, £5 million ahead of the target we set at the beginning of the year.
The Group generated cash flows from operating activities of £110.1 million after paying £31.9 million to fund deficits in our defined benefit pension schemes. The strong financial performance of the Group enabled continued investment in our business and the acquisition of GMG Regional Media.
Our investment in the modernisation of business processes andstructures throughout the Group, via the implementation of the newoperating model, continues to reap sustainable efficiencies while supporting our strategic goal of building a multimedia business of scale. New IT systems have enabled us to re-engineer how wepublish across editorial, advertising and pre-press. This has resultedin a step change in the way content is gathered and published acrossprint and digital. Importantly we are not trying to do the same things with fewer people. Instead, the technology enables fundamentalchanges to the entire publishing process, achieving efficiencies at a significantly lower cost base without detriment to quality.
Investment in our printing presses over the past five years has provided full colour and enhanced quality for our portfolio of titles whilst improving resilience across our print network. In addition, wehave been able to utilise our spare capacity across the print network to increase contract print revenues with the Group now the largest contract printer of newspapers in the UK. Our print network wasfurther enhanced with the acquisition of a print plant in Reading as part of the acquisition of GMG Regional Media providing the Groupwith increased capacity and flexibility. The Reading plant providedadded resilience for our print network and was key to securing the print contract for the ‘i’ newspaper following its launch in October2010. Contract print revenues are more stable and resilient to the business cycle, with contracts typically running over several years. During the year the Group delivered contract print revenues of £45.1 million and continuing to grow revenues in this area is a key management objective. We do not anticipate a requirement for anyfurther material capital investment in the Group’s print network.
2010 has seen continued strengthening of the Group’s balance sheet,ensuring we exit the year with significant financial flexibility, lowleverage and no refinancing risk. The strong cash flow generatedby the Group contributed to net debt falling by £58.1 million from £324.0 million to £265.9 million.
The strong cash generation of the business provides the Boardwith confidence that the Group is making progress towards thereinstatement of dividends. Nevertheless, the Board believes itprudent to maintain financial flexibility for the time being and thereforethe Board is not proposing a dividend until such time that we see an improvement in the trading environment.
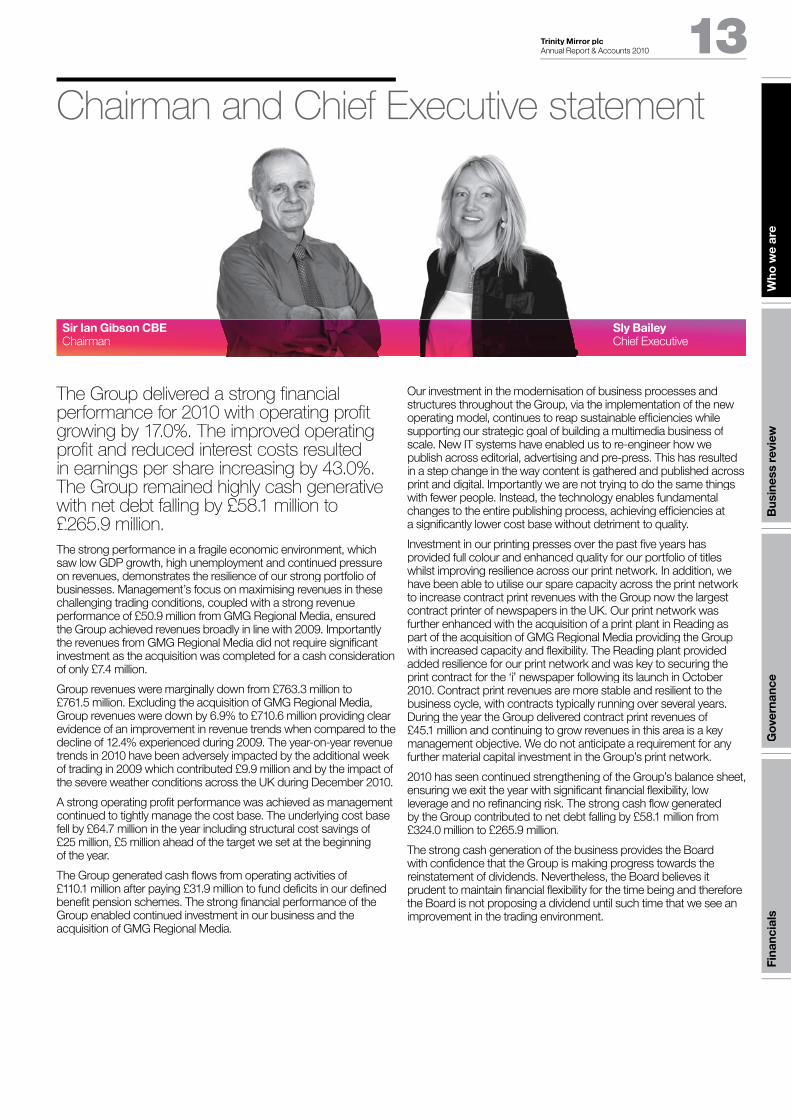
Sly BaileyChief Executive
Sir Ian Gibson CBEChairman

Trinity Mirror plc 14 Annual Report & Accounts 2010
Following an extensive consultation process the Group closed all its defined benefit pension schemes to future accrual on 31 March 2010.
The much improved financial position provides the Group with headroom for investment in growing our print and digital revenues. A number of investment initiatives have already commenced andonce fully implemented will present multiple opportunities to driverevenues. The investments already underway include:
– A new customer relationship management system which will provide opportunities to drive advertising revenues through bettercustomer data and insight. The new system will provide tools formore effective targeting of marketing initiatives and improvecustomer service. Key areas of focus will include increasingcustomer numbers, improving customer retention and increasingcustomer value;
– Implementation of a new digital content management system (dcms). This system will increase the functionality of our websites and enable the development of audience-growth initiatives. These include the integration of social media, an improvement ineditorial speed around breaking news and the flexibility to managethe publication of our content on any device i.e. PC, mobile, smartphone or tablet. The dcms will be fully integrated with the recently implemented Contentwatch editorial production system and together with our contextual and behavioural targeting systems will drive new advertising revenue opportunities; and
– Investment in our digital marketing services offering. The investment, in both staff and infrastructure, will enable the development of new digital products and services in order to widen the customer base and increase revenues. Examples include website design and development, search engine optimisation, e-mail marketing andsocial media.
These investments will provide the appropriate platform for the business to drive more diversified revenue streams across multiple media channels. Whilst these investments will, in the short termincrease operating costs during 2011, they support our strategic objective of building a multimedia business of scale to deliver significant value enhancement for shareholders. The capital investment for these initiatives will be funded within the £15 million per annum targeted capital expenditure, with incremental operating costs of some £5 million.
Regionals Division2010 has proven to be another challenging year for the regionalnewspaper industry against the backdrop of a difficult economic environment. However management’s continued focus on strongportfolio management, the implementation of the new operating model, the acquisition of GMG Regional Media and the strong national advertising performance from our Metro titles has resulted in a substantial increase in operating profit and strong margin recovery.Operating profit increased by 44.0% from £35.9 million to £51.7 million with operating margin increasing by 3.7 percentage points from11.9% to 15.6%.
Revenues for the Regionals division increased by 9.3% reflecting the benefit of the acquisition of GMG Regional Media, partially offset by an underlying decline in revenues. We were encouraged by thecontinued improvement in revenue trends which saw underlyingrevenues during the year fall by 7.5% representing a significant improvement compared to the 23.5% decline during 2009. In 2010digital activities represented 9.8% of revenue and 18.2% of operating profit for the division.
The underlying revenue performance reflects the impact of the fragileeconomic environment with falling public sector spending, high levelsof unemployment, a sluggish property market and low levels of consumer confidence. Whilst the acute cyclical pressures have most adversely impacted our classified advertising categories of recruitment, property and motors, these categories now representa smaller proportion of our advertising revenues.
For the Regionals division in 2010, recruitment, property and motors represented 34.2% of advertising revenues with 26.1% of theserevenues being digital. The impact on the division from thesecategories is much reduced and they are well placed to benefit from a combination of cyclical recovery and any structural changes whenmarket conditions improve. In recent months our national recruitment websites have returned to growth. This improved performance combined with our taking full control of fish4 is forecast to see digitalrepresent some 45% of recruitment advertising revenue in 2011.
‘‘Revenues for the Regionals division increased by 9.3% reflecting the benefit of the acquisition of GMG Regional Media.
’’
Chairman and Chief Executive statement

Wh
o w
e a
reB
usin
ess r
evie
wG
ove
rna
nc
eF
ina
nc
ials
Trinity Mirror plc Annual Report & Accounts 2010 15
‘‘Our Nationals division performed strongly in 2010, demonstrating the resilience of the businesses.
’’GMG Regional MediaThe acquisition of GMG Regional Media, completed on 28 March2010, has proved highly successful. The acquisition included MEN Media and S&B Media. MEN Media comprises the Manchester Evening News and a number of weekly titles and associated websites in the North West of England. S&B Media comprises a number of weekly titles and associated websites in the South of England.The acquisition has been fully integrated into our Regionals divisionand extends the Group’s reach across print and digital providingfurther scale in these key geographies. Our management teams haveensured that best practice is shared between existing and acquired businesses and equipped them with the Group’s revenue generating tools such as Local Mole, our local business directory and ouradvertising self serve product.
MEN Media relocated to our freehold building at our print plant in Chadderton, Greater Manchester, in September 2010, though the business retains a city centre presence in Manchester. Investment in the acquired business saw MEN Media launch a new free weeklybusiness magazine ‘Greater Manchester Business Week’ and companion website covering the Greater Manchester area in November 2010.
Since completion of the acquisition, the business has delivered strongoperating results with revenues of £50.9 million and operating profit of £5.7 million, achieving a margin of 11.2%.
fish4On 13 October 2010, the Group took control of the 50% of fish4 notpreviously controlled. fish4 sits alongside the brands in our digitalportfolio including GAAPweb, totallylegal, SecsintheCity and SmartNewHomes. Launched in 1999, fish4 operates one of the UK’s best known websites for jobs, cars and homes. fish4jobs was one of the UK’s first mass-market recruitment websites. fish4 strengthens the Group’s position in the important generalist recruitment marketand will boost digital recruitment advertising revenues by around £3 million in the first full year of control.
Nationals DivisionOur Nationals division performed strongly in 2010, demonstratingthe resilience of the businesses through the downturn. The division delivered operating profit growth of 3.0% with operating marginimproving by 1.8 percentage points from 18.2% to 20.0%. Revenuedeclines of 6.5% reflect there being no cover price increases during2010 partially mitigated by a significant improvement in the advertisingrevenue performance.
Each of our national titles broadly maintained advertising volumemarket share during the year, thereby continuing to demonstrate therelevance and importance of our national brands to advertisers andtheir agencies. The strong market positions of our UK brands inparticular ensured that their advertising revenues grew for most months during 2010 although we have seen continued month onmonth volatility.
Following the investment and implementation of the Contentwatcheditorial production system, we have created more efficientmultimedia newsrooms for our titles. Changes to editorial processes and structures have eliminated outdated working practices delivering efficiencies without compromising quality. Editorial headcount hasbeen reduced by around 200 positions, including 60 which were filled by casual workers.
The strength of our newspaper titles is clear from the significant paid-for circulation volumes of our titles and the mass audience reachthey provide in a fragmenting media landscape. The Daily Mirrorand Daily Record achieved a joint circulation in excess of 1.5 millioncopies per day on average during 2010 with readership per issue of 3.9 million. Our national Sunday titles, the Sunday Mirror, The Peopleand the Sunday Mail, achieved a joint circulation of 2.0 millioncopies on average in 2010 with readership per issue of 6.1 million.The Sunday Mail continues to be the biggest selling newspaper in Scotland, with a circulation which is nearly 100,000 copies larger thanthe next best-selling title. The Sunday Mail is also market leader inreadership terms reaching 46% more readers than the next best-read Sunday title. The websites of our national titles and brands have 10.7 million average monthly unique users.
Across the national popular newspaper market, circulationscontinued to decline year on year. The circulation performance of our five national titles reflects our policy of not chasing short-term circulation volume through cover price discounting, or through levelsof marketing spend which do not provide a return on investment. Our titles have a higher proportion of full rate sales within their auditedABC circulation figures than any of their national competitors.
‘‘We remained committed to attracting and retaining a talented workforce and have continued to invest in supporting and developing staff.
’’
16 Annual Report & Accounts 2010
Chairman and Chief Executive statement
RegulationWhilst we are disappointed that the Government decided not toprogress with the pilots for Independently Funded News Consortia, we await with interest their final plans for local TV. We also note the Government is progressing with its plans to relax all local cross mediaownership regulations. Any increase in flexibility provided by relaxation in media ownership rules presents potential opportunities to react to market changes and consider cross-platform options in an erawhen traditional platform distinctions are increasingly irrelevant to consumers and advertisers.
The Group believes that scale in regional media can be an importantdriver of value for shareholders and the acquisition of GMG Regional Media during the year was a compelling demonstration of this.The Group will consider further regional consolidation opportunities where there is a strong financial case and a good commercial and strategic fit.
Capital ExpenditureWe continued to tightly manage our capital expenditure during the year. Capital expenditure in the year was £14.2 million againstdepreciation of £33.9 million. Proceeds from the sale of two freeholdproperties amounted to £2.7 million. Net capital expenditureamounted to £11.5 million.
Capital expenditure is expected to be maintained at around £15 million per annum for the foreseeable future and will remain below depreciation as the Group has already invested in new presses.
Cash Flow and Net DebtThe Group continued to generate strong cash flows during the year which enabled net debt on a contracted basis to fall by £58.1 millionfrom £324.0 million to £265.9 million. On a statutory basis, net debt fell by £62.5 million from £299.8 million to £237.3 million.
Our strong cash flows and prudent management of our financingfacilities ensured that the Group maintained significant financingflexibility with no drawings on the Group’s £178.5 million bank facility which is committed until June 2013. The Group holds a significant cash balance which at the year end amounted to £116.2 million,in order to provide ready funds for the next repayment of the privateplacement loan notes which is due in October 2011 and is expectedto be repaid substantially through cash balances and cash generated in 2011.
PensionsFollowing an extensive consultation process the Group closed all its defined benefit pension schemes to future accrual on 31 March 2010.All former members were given the option to join the Group’s definedcontribution pension scheme. The closure of the defined benefit pension schemes to future accrual ensures that the Group is nolonger increasing pension obligations with the potentially uncapped and increasing costs associated with the provision of defined benefitpensions. This step will also eliminate the volatility in the incomestatement operating profit charge for pensions as this will be based on the actual contributions to the Group’s defined contributionpension schemes.
The defined benefit pension net deficit has fallen materially duringthe year by £135.6 million from £296.6 million to £161.0 million(£117.5 million net of deferred tax). The fall in the net deficit largely reflects the benefit of increasing assets values. Liabilities haveincreased marginally, with the significant reduction following theGovernment change to link state pension increases to CPI instead of RPI, which has impacted most of our deferred pensions, being morethan offset by a reduction in the real discount rate and other changes.

‘‘Managements drive to maximise revenues and tightly manage costs while investing for growth will help support profitability in 2011.
’’ Wh
o w
e a
reB
usin
ess r
evie
wG
ove
rna
nc
eF
ina
nc
ials
Trinity Mirror plc Annual Report & Accounts 2010 17
EmployeesWe remained committed to attracting and retaining a talented workforce during 2010 and have continued to invest in supporting and developing our staff. At the beginning of 2010 we established aGroup Training and Development Steering Committee chaired by theChief Executive to ensure that resources were channelled to best support the Group’s strategic goal. It is particularly pleasing to reportthat during 2010 strong progress has been made on a number of keyinitiatives:
– An Inspirational Leadership Programme was launched to develop the skills and capabilities of senior managers across the Group. Over 90 managers took part in the three day programme in 2010;
– A Talent Development Programme was designed to develop the skills of the next level of managers. These and other trainingprogrammes contributed to 90% of the management teambenefiting from training during 2010; and
– A Customer Service Promise was introduced to all employees outlining our commitment to customers. During the year, over 1,800 members of staff received training specific to this initiative.
DividendThe Board continues to see an improvement in the cash flowsgenerated by the Group which has contributed to net debt falling by £58.1 million to £265.9 million. This continued improvement in the Group’s financial position has been achieved against the backdropof a challenging trading environment.
The strong cash generation of the business provides the Boardwith confidence that the Group is making progress towards the reinstatement of dividends. Nevertheless, the Board believes itprudent to maintain financial flexibility for the time being and thereforethe Board is not proposing a dividend until such time that we see an improvement in the trading environment.
The consistent key factors that the Board will consider in assessing the trading environment are:
– Year on year stability and improved visibility in advertising revenues; and
– Clear evidence that the economy has returned to a sustainable period of growth.
Key Operating Trends and OutlookThe highly successful acquisition of GMG Regional Media enabled Group revenue to increase by 3% in January and February. Excluding GMG Regional Media, revenues fell by 6% with advertising revenuesfalling by 10% and circulation revenues falling by 5%. Advertisingrevenues for Regionals, excluding GMG Regional Media, fell by 11% and for Nationals fell by 9%.
In 2010 the Group delivered a reduction in the underlying cost base of £64.7 million with structural cost savings of £25 million. The Group’s focus on maximising revenues and tight management of the cost base enabled profit to grow in 2010. In 2011 we will continue to tightlymanage the cost base and expect at least £10 million structural costsavings, although this will be more than offset by general inflationary price increases, average increase in newsprint prices in excess of 20% and investment in our businesses. We expect restructuringcosts in 2011 to be around £10 million.
The Board envisages a volatile and slow recovery in the UK economyas public sector spending cuts and taxation increases continue toimpact consumer confidence, unemployment and the propertymarket. However, the Board remains confident that management’sdrive to maximise revenues and tightly manage costs while investing for growth will help support profitability in 2011 whilst positioning theGroup for growth when market conditions improve.
Sir Ian Gibson CBE Sly BaileyChairman Chief Executive

12103 413 12
Trinity Mirror plc 18 Annual Report & Accounts 2010
Board and management team
1. Sly Bailey (49)
Chief ExecutiveSly was appointed Chief Executive in February 2003. She started her media career in advertising sales at The Guardian and thenThe Independent. In 1989 she joined IPC Media Limited as Headof Classified Advertising Sales and joined their Board in 1994 as Advertising Director. In 1997 Sly was appointed Managing Director of IPC tx, the TV listings division. In December 1999 she was appointedChief Executive of IPC Media Limited and subsequently led the sale of the business to AOL Time Warner.
Sly is a non-executive director and Remuneration Committeemember of Ladbrokes plc. She is also a Governor of The English National Ballet School and is a non-executive director of the PressAssociation and President of NewstrAid, a charity for the wholesale and retail news trade. Sly was previously Senior IndependentDirector and Remuneration Committee Chairman of EMI plc and a non-executive director of Littlewoods Plc.
2. Sir Ian Gibson CBE (64)
ChairmanSir Ian joined the Board of Trinity Mirror and was appointed Chairmanin May 2006. He is non-executive Chairman of Wm Morrison Supermarkets plc. In September 2010, Sir Ian was appointed non-executive member of the Public Interest Board for PricewaterhouseCoopers LLP. Previously he was President of Nissan Europe and Senior Vice President of Nissan Group. Sir Ian was Chairman of BPB plc, was on the Court of the Bank of England, was Deputy Chairman of Asda Group plc, Senior non-executive director of Northern Rock plc and a non-executive director of GKN plc and Greggs plc.
3. Gary Hoffman (50)
Non-Executive DirectorGary joined the Board in March 2005 and has been Senior Independent Director since May 2007. Gary has been appointed as Chief Executive of NBNK Investments plc (effective May 2011). He is a director of Visa Europe. Previously Gary has been Chief Executive of Northern Rock plc, Vice-Chairman of Coventry City Football Cluband Group Vice-Chairman and Executive Director of Barclays plc.
4. Jane Lighting (54)
Non-Executive DirectorJane joined the Board as a non-executive director in January 2008 and was appointed Chairman of the Remuneration Committee in 2009. Jane was Chief Executive of Five and of Flextech plc and isa Trustee and Fellow of the Royal Television Society and Council Member of the British Screen Advisory Council. Jane was appointedas a non-executive director of Paddy Power plc in September 2009.
5. Kathleen O’Donovan (53)
Non-Executive DirectorKathleen joined the Board in May 2007. She is Chairman of the Audit and Risk Committee. Kathleen is the senior independent director of ARM Holdings plc and is a non-executive director at Prudential plc.Previously she was on the Court of the Bank of England and heldnon-executive directorships at O2 plc and EMI plc. Between 1998and 2002 she was CFO of Invensys plc, having previously been theFinance Director of its legacy company BTR plc which merged withSiebe plc to create Invensys.
6. Vijay Vaghela (44)
Group Finance DirectorVijay qualified as a chartered accountant and worked in privatepractice with Deloitte. He joined Mirror Group in 1994 as an Internal Auditor. He was subsequently Group Treasurer and then Director of Accounting and Treasury. He was appointed Group Finance Directorand joined the Board in May 2003.
7. Paul Vickers (51)
Secretary and Group Legal DirectorPaul joined the Board in September 1999 having been a director of Mirror Group since 1994. He originally qualified as a barrister and was in private practice at the Bar. He was legal manager of the LondonDaily News, which he left to join the breakfast television companyTV-am where he subsequently became Assistant Managing Director. He was previously a non-executive director of Virgin Radio. Paul is a director of the Press Standards Board of Finance, the body that funds and sets the remit for the PCC.
8. Laura Wade-Gery (45)
Non-Executive DirectorLaura joined the Board in August 2006. Laura has been appointed as executive director, Multi-channel E-commerce at Marks and Spencerplc and will take up that role during the course of the year. PreviouslyLaura has been Chief Executive of Tesco.com, Director of TescoBank and Group Strategy Director, Tesco plc. Prior to joining Tesco in 1997, Laura held positions with Gemini Consulting andKleinwort Benson.

5 7 9 11 86
Wh
o w
e a
reB
usin
ess r
evie
wG
ove
rna
nc
eF
ina
nc
ials
Trinity Mirror plcAnnual Report & Accounts 2010 19
Executive CommitteeSly Bailey, Chief ExecutiveVijay Vaghela, Group Finance DirectorPaul Vickers, Secretary and Group Legal Director
9. Nick Fullagar
Director of Corporate CommunicationsNick was appointed Director of Corporate Communications in 2001. He started his career in journalism on local and regional newspapers,including the Western Mail in Cardiff, before joining the Daily Mirror in 1980. After a number of roles, including news editing, Nick movedinto communications in 1993 as Head of Public Relations for MirrorGroup. Nick is a trustee of the Child Growth Foundation and agovernor of Grove Park school, East Sussex.
10. Georgina Harvey
Managing Director, RegionalsGeorgina joined the Company in February 2005. She started her media career at Express Newspapers where she was appointed Advertising Director in 1994. She joined IPC Media in 1995 as Group Advertising Sales Director for SouthBank and went on to form IPC Advertising in 1998, where she was Managing Director. Georgina became a member of the Board of IPC Media in 2000 and was subsequently appointed Managing Director of Wallpaper* Groupin 2003. Georgina was appointed as President of the NewspaperSociety in July 2010.
11. Mark Hollinshead
Managing Director, NationalsMark was appointed as Managing Director of our Nationals division in September 2008. From 1998 he was Managing Director of the Scottish Daily Record and Sunday Mail Ltd, prior to which he was Managing Director of Midland Weekly Media Ltd. He was previously Business Development Director at Thomson Regional NewspapersLtd, Marketing Director at MIN plc and Research Manager at theWolverhampton Express & Star, having entered the newspaper industry in advertising sales at the Midland News Association Ltd in the mid 1980s. Mark spent the early part of his career working in advertising agencies. He is a director of the Newspaper Publishers Association Ltd and former Chairman of Scottish Athletics Ltd.
12. Rupert Middleton
Director of ManufacturingRupert joined Trinity Mirror as Group Director of Manufacturing inMarch 2004. He is responsible for Trinity Mirror Printing, the integratedmanufacturing division that prints all Trinity Mirror newspaper titles and a significant volume of copies for external publishers includingthe Daily Mail and The Independent. Prior to joining Trinity Mirror,Rupert has previously been Managing Director of a division withinThe Stationery Office, and Managing Director of Westferry Printers.Rupert is Chair of Governors at Tower Hamlets Further EducationCollege and President of the British Printing Industry Federation.
13. Tony Pusey
Group Information Technology DirectorTony was appointed Group IT Director in December 2000. Prior to joining Trinity Mirror, he was Group CIO and Business ChangeDirector at Storehouse plc, which incorporates Bhs and Mothercare.

Trinity Mirror plc 20 Annual Report & Accounts 2010
The Business review unless otherwise stated, is presented on an adjusted basisto provide a more meaningful comparisonof the Group business performance between 2009 and 2010. Adjusted resultsexclude the impact of non-recurring items, the amortisation of intangible assets, the retranslation of foreign currency borrowings, the impact of fair value changes on derivative financial instruments and the impact of tax legislation changes. The Business review has been prepared for the 52 weeksended 2 January 2011 and the comparative period has been prepared for the 53 weeks ended 3 January 2010. The additional week of trading in 2009 contributedrevenue of £9.9 million and operating profit of £4.2 million. A reconciliation between the adjusted results and the statutory results is provided in note 38 on page 99.
Group activitiesTrinity Mirror is one of the UK’s largest newspaper publishers with an award winning portfolio including five national newspapers, over 160regional newspapers and more than 500 digital products. The Group employs over 6,500 people in around 60 locations across the UK, including nine print sites. The Group has two trading divisions: Regionals and Nationals.
Group strategyOur strategic goal is to build a growing multi-platform media business, by developing and sustaining strong positions across print and digital, with products and services which meet the needs of our customers,both readers and advertisers.
Our marketplaceThe UK economy remained fragile in 2010 with further pressure created by the implications of the announced public sector spending cuts and tax rises and increasing uncertainty regarding the financialstability of a number of major European countries. The ongoing fragility in the UK economy led to only marginal growth in GDP,high unemployment and a sluggish and volatile property market. The challenging economic environment continued to place pressureon the Group’s key advertising and circulation revenues.
The severe weather conditions in December 2010 contributedto a more marked slowdown in advertising revenues as advertisers cancelled spend and also impacted circulation volumes dueto the difficulties in getting our newspapers to retailers andtherefore consumers.
The Group continues to manage the implications of mediafragmentation coupled with the highly competitive nationalnewspaper market characterised by ongoing price cutting in the tabloid marketplace, although we have seen some moderationin cover price cutting as we have moved into 2011.
Whilst the market conditions remained challenging, the strengthof our portfolio of brands ensured that we saw an improvement inthe rate of decline in advertising revenues during the year and we continued to provide significant reach across the UK through our mass circulation national newspapers portfolio, our market leadingregional newspapers and our national and local websites.
Business review

Wh
o w
e a
reB
usin
ess r
evie
wG
ove
rna
nc
eF
ina
nc
ials
Trinity Mirror plc Annual Report & Accounts 2010 21
Group performance
Statutory resultsThe statutory results for the 52 weeks ended 2 January 2011 (2010) compared to the 53 weeks ended 3 January 2010 (2009) representsa significant improvement in performance due to the management action taken in 2009 and 2010 and the benefit from the GMG Regional Media acquisition despite 2010 having one less week of trading.
2010£m
2009£m
Variance£m
Revenue 761.5 763.3 (1.8)
Operating costs (638.9) (658.4) 19.5
Amortisation of intangibles (6.0) (7.1) 1.1
Share of results of associates 0.7 0.5 0.2
Non-recurring items 20.7 (11.3) 32.0
Operating profit 138.0 87.0 51.0
Finance items (14.3) (45.0) 30.7
Profit before tax 123.7 42.0 81.7
Tax charge (10.4) (12.7) 2.3
Profit after tax 113.3 29.3 84.0
Earnings per share 44.6p 11.5p 33.1p
Group revenue in 2010 fell marginally by £1.8 million from £763.3 million to £761.5 million.
On a statutory basis operating profit improved by £51.0 million from£87.0 million to £138.0 million. The material increase in operating profitis driven by the improved underlying profitability of the Group together with the operating profit of GMG Regional Media of £5.7 million and the benefit of a non-recurring credit of £20.7 million compared to a non-recurring charge of £11.3 million in the prior year.
Profit before tax on a statutory basis increased by £81.7 million from£42.0 million to £123.7 million. This reflects increased operating profit, lower interest costs and the benefit from the retranslation of foreign currency borrowings and fair value changes on derivative financialinstruments which were a credit of £7.5 million compared to a chargeof £12.3 million in the prior year.
The statutory tax charge for the period was £10.4 million reflecting a current year charge of £25.8 million partially offset by a prior year credit of £4.0 million and a credit of £11.4 million relating to the impact on deferred tax balances of the change in the rate of corporation tax from 28% to 27% which was substantively enacted in the year and iseffective in April 2011. The statutory tax charge represents 8.4% of the statutory profit before tax. This is lower than the statutory rate of 28%primarily due to the accounting gain on the acquisition of GMGRegional Media not being taxable and the impact of the tax rate change.
Profit after tax on a statutory basis improved by £84.0 million from £29.3 million to £113.3 million. Earnings per share on a statutory basis increased by 33.1 pence from 11.5 pence to 44.6 pence.
Non-recurring items2010
£m2009
£m
Gain on acquisition of business 27.3 –
Restructuring charges (11.1) (17.9)
Release of accruals 3.6 –
Profit on disposal of land and buildings 1.3 5.1
Defined benefit pension schemes (0.4) 9.9
Impairment of receivables – (6.0)
Loss on disposal of business – (2.4)
Non-recurring items 20.7 (11.3)
During 2010, the Group had a net non-recurring credit of £20.7 million(2009: £11.3 million charge).
On 28 March 2010 the Group acquired GMG Regional Media resulting in an accounting gain of £28.4 million representing negativegoodwill of £23.6 million and a gain on a cancelled print contract of £4.8 million partially offset by transaction costs of £1.1 million.
Restructuring charges in connection with the delivery of cost reduction measures and implementation of the new operatingmodel for the Group amounted to £11.1 million (2009: £17.9 million).We expect total restructuring charges in 2011 to be around £10 million.
The Group released accruals of £3.6 million (2009: £nil) for which no further costs are expected.
The Group received cash proceeds of £2.7 million from the sale of two freehold buildings giving rise to a profit of £1.3 million (2009: £5.1 million gain on the disposal of a property in Birmingham).
The defined benefit pension schemes’ non-recurring loss of £0.4 million comprises a past service cost of £8.3 million in relationto the clarification of certain members’ benefits less a curtailment gainof £7.9 million relating to the Group closing the schemes to futureaccrual and the impact of redundancies (2009: £9.9 million gain in respect of a curtailment gain relating to redundancies and the Groupindicating that it will no longer exercise discretion in providing enhancements to past service on redundancy).
Finance items2010
£m2009
£m
Investment revenues 1.4 0.2
Pension finance charge (7.1) (10.5)
Interest expense (16.1) (22.4)
Fair value gain/(loss) on derivative financialinstruments 16.4 (45.6)
Foreign exchange (loss)/gain on retranslation of borrowings (8.9) 33.3
Total finance items charge (14.3) (45.0)
Investment revenues increased to £1.4 million (2009: £0.2 million) reflecting higher net cash balances and interest on a VAT refund oncosts incurred on the issue of shares in prior periods.
The pension finance charge which represents an assumed return on assets and the unwinding of the discount on liabilities withinthe Group’s defined benefit pension schemes was £7.1 million (2009: £10.5 million).
The interest expense decreased to £16.1 million (2009: £22.4 million)reflecting lower average interest rates.

Trinity Mirror plc 22 Annual Report & Accounts 2010
Business review
advertising revenues, £7.2 million circulation revenues and £3.4 millionother revenues during 2010. Excluding GMG Regional Media,revenues declined by 6.9% with advertising revenue falling by 6.3%,circulation revenue falling by 8.6% and other revenue falling by 3.0%.The overall decline in revenues reflects the fragility of the UK economy which continues to adversely affect our customers, both readers andadvertisers. However, we have seen a marked improvement in therate of decline in advertising revenue which is down 6.3% in 2010compared to a decline of 22.2% during 2009. Lower circulation revenues reflect lower circulation volumes only marginally mitigated bylimited cover price increases in the Regionals and no cover priceincreases in the Nationals. The fall in other revenue is driven by the impact of contract print services previously charged to GMG Regional Media which are now classified as internal charges. Excluding all charges to GMG Regional Media for 2009 and in 2010 prior to the acquisition, other revenues increased by 3.2% due to new third-party contract print revenues.
Group digital revenue, included in advertising and other revenue,increased by £1.5 million from £35.6 million to £37.1 million. ExcludingGMG Regional Media, Group digital revenue fell marginally by £0.7 million from £35.6 million to £34.9 million. This reflects ongoing declines in recruitment and property advertising revenues drivenby high levels of unemployment and a sluggish property market,in particular the new homes market. Encouragingly we continue to see growth in other digital revenues such as motors and directories.Audience growth remains strong with average monthly unique usersfor the year increasing by 19% year on year to reach 21.6 million forthe year. We remain committed to growing our digital revenue andhave continued to invest in new launches.
Group revenue by division, including and excluding GMG Regional Media, is set out below:
G GIncluding GMG Regional Media G GExcluding GMG Regional Media
2010£m
2009£m
Variance%
2010£m
2009£m
Variance%
Regionals 331.2 302.9 9.3 280.3 302.9 (7.5)
Nationals 430.3 460.4 (6.5) 430.3 460.4 (6.5)
Total revenue 761.5 763.3 (0.2) 710.6 763.3 (6.9)
Revenue for the Regionals increased by 9.3% to £331.2 million andfor the Nationals fell by 6.5% to £430.3 million. Excluding GMGRegional Media, Regionals revenue fell by 7.5%.
Group operating profit analysisGroup operating profit by division, including and excluding GMGRegional Media, is set out below:
G GIncluding GMG Regional Media G GExcluding GMG Regional Media
2010£m
2009£m
Variance%
2010£m
2009£m
Variance%
Regionals 51.7 35.9 44.0 46.0 35.9 28.1
Nationals 86.1 83.6 3.0 86.1 83.6 3.0
Central (14.5) (14.1) (2.8) (14.5) (14.1) (2.8)
Total operatingprofit 123.3 105.4 17.0 117.6 105.4 11.6
Group operating profit increased by 17.0% from £105.4 million to£123.3 million despite revenue being under pressure. Both Regionalsand Nationals increased operating profit by 44.0% and 3.0% respectively. Excluding GMG Regional Media, Regionals operatingprofit grew by 28.1%.
The impact of fair value changes in derivative financial instruments and the retranslation of foreign denominated borrowings resulted in a net credit of £7.5 million (2009: £12.3 million net charge).
Adjusted results2010
£m2009
£mVariance
%
Revenue 761.5 763.3 (0.2)
Labour (248.8) (255.6) 2.7
Newsprint (105.0) (114.5) 8.3
Depreciation (33.9) (36.8) 7.9
Other costs (251.2) (251.5) 0.1
Operating costs (638.9) (658.4) 3.0
Share of results of associates 0.7 0.5 40.0
Operating profit 123.3 105.4 17.0
Pension finance charge (7.1) (10.5) 32.4
Net interest costs (14.7) (22.2) 33.8
Profit before tax 101.5 72.7 39.6
Tax charge (28.9) (21.6) (33.8)
Profit after tax 72.6 51.1 42.1
Earnings per share 28.6p 20.0p 43.0
Group revenue in 2010 fell marginally by £1.8 million from £763.3 million to £761.5 million. Excluding GMG Regional Media, Group revenues fell by £52.7 million from £763.3 million to £710.6 million. The revenue trends have been adversely impacted by the additional week’s trading in 2009 which contributed revenueof £9.9 million and by the impact of the severe weather conditions across the UK during December 2010.
Group operating profit increased by £17.9 million from £105.4 million to £123.3 million. Operating costs decreased by £19.5 million and excluding GMG Regional Media operating costs fell by £64.7 million. The significant reduction in costs reflects the ongoing tightmanagement of costs, the structural cost savings of £25 million andlower average newsprint prices during the year. Operating marginsincreased by 2.4 percentage points to 16.2%.
Profit before tax improved by £28.8 million from £72.7 million to £101.5 million reflecting the improved operating profit, lower interest costs and a lower pension finance charge. The tax charge of £28.9 million for the year represents 28.5% of profit before tax. Profit after tax improved by £21.5 million from £51.1 million to£72.6 million with earnings per share growing by 43.0% from20.0 pence to 28.6 pence.
Group revenue analysisGroup revenues by type, including and excluding GMG Regional Media, is set out below:
G GIncluding GMG Regional Media G GExcluding GMG Regional Media
2010£m
2009£m
Variance%
2010£m
2009£m
Variance%
Advertising 351.3 331.8 5.9 311.0 331.8 (6.3)
Circulation 317.4 339.3 (6.5) 310.2 339.3 (8.6)
Other 92.8 92.2 0.7 89.4 92.2 (3.0)
Total 761.5 763.3 (0.2) 710.6 763.3 (6.9)
The revenue performance reflects an increase in advertising revenuesof 5.9%, a fall in circulation revenues of 6.5% and an increase in other revenues of 0.7%. GMG Regional Media contributed £40.3 million

Wh
o w
e a
reB
usin
ess r
evie
wG
ove
rna
nc
eF
ina
nc
ials
Trinity Mirror plc Annual Report & Accounts 2010 23
The acquisition of GMG Regional Media, completed on 28 March2010 for a cash consideration of £7.4 million, has proved highly successful. The acquisition is a strong strategic fit with the existingportfolio and has performed ahead of our expectations achievingrevenue of £50.9 million and operating profit of £5.7 million in the firstnine months since acquisition. The acquisition included MEN Media, which comprises the Manchester Evening News and over 20 weeklytitles and associated websites, and S&B Media, which includes the Surrey Advertiser and a number of weekly titles in the South and aprint plant in Reading. The acquisition extends the Group’s reachacross print and digital and adds scale in the North West andthe South.
The GMG Regional Media business has been fully integrated into ourRegionals division. The Group is already seeing advertising revenuebenefits from a broader reach across the North West and South. Our management teams ensured that best practice is shared between existing and acquired businesses, for example equippingthe acquired businesses with new revenue generating tools suchas Local Mole, our local business directory and our advertising self serve product.
MEN Media relocated to our freehold building at our print plant in Chadderton, Greater Manchester in September 2010, though thebusiness retains a city centre presence in Manchester. S&B Mediahas been fully integrated into the Group’s southern region and isoperating on the same IT and operational infrastructure. The print plant in Reading has been fully integrated into our manufacturingnetwork providing increased resilience and flexibility for our portfolioof newspapers whilst providing increased capacity to drive contractprint revenues. We have invested in the business with the launch of a new free weekly business magazine ‘Greater Manchester Business Week’ and a companion website in Greater Manchester.
On 13 October 2010, the Group took control of fish4. fish4 sits alongside the brands in our digital portfolio including GAAPweb, totallylegal, SecsintheCity and SmartNewHomes. Launched in 1999, fish4 operates one of the UK’s best known websites for jobs, carsand homes. fish4Jobs was one of the UK’s first mass-marketrecruitment websites. fish4 strengthens the Group’s position in theimportant generalist recruitment market, with digital recruitment advertising revenues being boosted by circa £3 million in the firstfull year of full control.
fish4 reported revenue during the period of £0.9 million and anoperating loss of £0.4 million. fish4 is now fully integrated within ournational recruitment portfolio and since taking full control, we haveincreased its audience with visits up 53% to 1.4 million, unique usersup 62% to 1.1 million and job applications increasing by 92% to 0.3 million.
The new operating model continues to be implemented across thedivision with investment in IT and changes to the way the businessis organised, increasing efficiency and reducing cost. Pre-press isnow consolidated into two centres in Birmingham and Liverpoolproviding a more resilient service to all regions. Finance has also been consolidated into two centres in Newcastle and Liverpool providing a more efficient and consistent approach to processing and business support.
We continue to rationalise the property portfolio by exiting buildingsand by bringing businesses together. Our national digital recruitmentbusiness has relocated to Canary Wharf and we have announced that Amra, our national sales house, and fish4 will also move intoCanary Wharf in 2011.
Key performance indicatorsThe key performance indicators for the Group are primarily financial.These include revenue, operating profit and operating margin, circulation volumes, unique users and reach. In a declining market, as we have experienced in 2010, the Group seeks to target performance in line with or ahead of competitors or comparators taking account of our publishing strategy and that of our competitors.
Relevant key performance indicators for each division are includedin the respective sections of the Business review.
Regionals divisionThe Regionals division publishes an extensive portfolio of print and digital media brands across the UK. The print portfolio comprises over 160 paid-for and free newspaper titles and includes 31 titles acquiredwith GMG Regional Media. In the majority of our geographical regions, our print titles reach over 70% of the adult population on a weekly basis. Our digital portfolio includes companion websites toour key newspaper titles, hyperlocal sites serving specific postcodes and communities, local sites in the key verticals of recruitment,property and motors and national sites in recruitment and property and a growing digital marketing services offering.
2010 has proven to be another challenging year for the regional newspaper industry with underlying revenue declines, reflecting the impact of low GDP growth, falling public sector spend, limited availability of credit, high levels of unemployment and a sluggish property market which collectively contributed to low levels of consumer and advertiser confidence. Regional media businesseshave been hit particularly hard by the economy due to the higher proportion of advertising revenues relative to circulation revenues and the proportion of advertising revenues coming from the more cyclical classified categories. Whilst revenues remain under pressure, ourRegionals division continued to provide significant audience reach in the markets in which we operate.
Despite the challenging environment, management’s continued focus on cost, the implementation of the new operating model, coupled with the acquisition of GMG Regional Media and the strong nationaladvertising performance from our Metro titles has led to a substantialincrease in operating profit and strong margin recovery.
Whilst the acute cyclical pressures have significantly impacted our classified advertising revenues, these categories now represent 54.6% of advertising revenues. The more resilient display advertising now represents 45.4%. In addition, within the key classified categoriesof recruitment and property, digital revenue accounts for 38.6% and 18.8% respectively of advertising revenues. With recruitment and property revenues now a smaller proportion of advertising and asignificant proportion of these coming from digital, the potential for these categories to adversely impact the business in the short term is much reduced and the business is now better placed to benefit froma combination of cyclical recovery and structural change.
Our regional paid-for and free newspapers have a weekly circulationof 6.4 million copies and readership of 7.7 million. Our websites have 11.1 million average monthly unique users. In our key markets, our brands have a significant reach amongst the adult populationreaching 58% on a weekly basis in Scotland, 73% in the North East,86% in the North West, 70% in the Midlands, 71% in South Walesand 56% in the South. The strength of our brands and highly motivated professional workforce has been recognised by numerousindustry awards during the period, including several awards at the Newspaper Society Awards and the Press Gazette RegionalPress Awards.

Trinity Mirror plc 24 Annual Report & Accounts 2010
Business review
Revenue by typeRevenues by type, including and excluding GMG Regional Media, areset out below:
G GIncluding GMG Regional Media G GExcluding GMG Regional Media
2010£m
2009£m
Variance%
2010£m
2009£m
Variance%
Advertising 222.5 198.9 11.9 182.2 198.9 (8.4)
Circulation 73.2 72.5 1.0 66.0 72.5 (9.0)
Other 35.5 31.5 12.7 32.1 31.5 1.9
Total revenue 331.2 302.9 9.3 280.3 302.9 (7.5)
Total revenue comprises advertising (67.2%), circulation (22.1%) andother (10.7%). All revenue categories have grown during the year.Excluding GMG Regional Media both advertising and circulationrevenues have declined whilst other revenues grew by 1.9%.
Advertising revenuesAdvertising revenue increased by 11.9% including advertising revenueof £40.3 million from GMG Regional Media. Excluding GMG RegionalMedia, advertising revenue fell by 8.4% reflecting a decline of 8.0% inthe first half and 8.9% in the second half. The rate of decline in thesecond half has been adversely impacted by the additional week’strading in 2009 and adjusting for this, advertising revenues in the second half declined by 7.8% which is a marginal improvement on thefirst half. The second half was also impacted by the severe weather conditions in December 2010. Although the advertising environmentremained challenging throughout the year, we are encouraged by the material improvement in the year on year decline from the 29.5% decline in advertising revenues during 2009.
Advertising categoriesRevenues by key advertising category, including and excludingGMG Regional Media, are set out below:
Including GMG Regional Media Excluding GMG Regional Media
2010£m
2009£m
Variance%
2010£m
2009£m
Variance%
Display 101.0 81.6 23.5 81.0 81.6 (1.0)
Recruitment 38.6 39.3 (2.0) 31.8 39.3 (19.4)
Property 23.9 21.4 11.1 19.7 21.4 (8.6)
Motors 13.7 12.6 8.6 11.2 12.6 (11.6)
Other classified 45.3 44.0 4.2 38.5 44.0 (11.1)
Advertisingrevenue 222.5 198.9 11.9 182.2 198.9 (8.4)
Advertising revenue by category year on year was as follows: displayup 23.5%, recruitment down 2.0%, property up 11.1%, motors up8.6% and other classified categories up 4.2%. Excluding GMGRegional Media, display was down 1.0%, recruitment down 19.4%,property down 8.6%, motors down 11.6% and other classifiedcategories down 11.1%. Within display advertising, we areencouraged by the performance of our Metro titles which achievedyear on year growth.
Revenue and operating profitThe revenue and adjusted operating profit for our Regionals division,including and excluding GMG Regional Media, is as follows:
G GIncluding GMG Regional Media G GExcluding GMG Regional Media
2010£m
2009£m
Variance%
2010£m
2009£m
Variance%
Revenue
Print and other related activities 298.8 272.1 9.8 250.1 272.1 (8.1)
Digital activities 32.4 30.8 5.2 30.2 30.8 (1.9)
Total revenue 331.2 302.9 9.3 280.3 302.9 (7.5)
Operating profit
Print and other related activities 42.3 29.3 44.4 37.7 29.3 28.7
Digital activities 9.4 6.6 42.4 8.3 6.6 25.8
Total operatingprofit 51.7 35.9 44.0 46.0 35.9 28.1
Operating margin 15.6% 11.9% 3.7% 16.4% 11.9% 4.5%
Revenue for the Regionals division increased by 9.3% to £331.2 million reflecting the benefit of the acquisition of GMG Regional Media partially offset by a decline in underlying revenues. We are encouraged by the improvement in revenue trends which have seen underlying revenues during the year fall by 7.5%, asignificant improvement compared to the 23.5% decline during 2009.
Operating profit for the Regionals division increased by 44.0% to £51.7 million and operating margin improved by 3.7 percentage pointsfrom 11.9% to 15.6%. The operating profit performance reflects the benefits of management actions to improve efficiencies and the acquisition of GMG Regional Media. Excluding GMG Regional Media, operating profit grew by 28.1% to £46.0 million and operating margin increased by 4.5 percentage points from 11.9% to 16.4%.
Print and other related activities revenue increased by £26.7 million and operating profit increased by £13.0 million. Whilst revenuesexcluding GMG Regional Media remained under pressure we grew underlying operating profits by 28.7% from £29.3 million to£37.7 million.
Digital activities revenue increased by £1.6 million and operating profit increased by £2.8 million. Digital activities now represent 9.8% of revenues and 18.2% of operating profit of the division. Whilstrevenues excluding GMG Regional Media were under pressure wegrew underlying operating profits by 25.8% from £6.6 million to£8.3 million and increased our audience reach. Average monthly unique users across our websites grew by 17% year on year to 11.1 million per month.

Wh
o w
e a
reB
usin
ess r
evie
wG
ove
rna
nc
eF
ina
nc
ials
Trinity Mirror plc Annual Report & Accounts 2010 25
Nationals divisionThe Nationals division publishes five national newspapers which areamong the UK’s leading media brands. Across the UK, we publishthe Daily Mirror, the Sunday Mirror and The People. In Scotland, wepublish the Daily Record and Sunday Mail which combined are readby more readers than any other daily and Sunday package in theScottish market. All our newspapers are complemented by a portfolioof growing digital brands, including companion websites for all ournational newspapers and a number of complementary digital sitessuch as Mirrorfootball.co.uk, 3am.co.uk, Mirrormobile andScotcareers. We also operate a number of other commercial activities which include events, readers’ offers and a market leading business magazine in Scotland.
The national newspaper market remains highly competitive with continued cover price discounting by our competitors during the year, although we have seen some moderation in cover price cutting into 2011. Our titles continued to perform well in a challenging tradingenvironment.
Our national titles provided average daily and Sunday circulation of 1.5 million and 2.0 million respectively with readership of 3.9 millionand 6.1 million respectively.
In 2010 our newspapers once again comprehensively covered the bigstories of the day; our football reporters in South Africa brilliantly captured the colourful emotion of The World Cup, our political teamwon great plaudits for their insightful and incisive reporting of theGeneral Election while the Daily Mirror was on the spot in Chile as the trapped miners emerged from their many days underground.
We continue to develop our brands and content across platformspublishing in print, online and on mobile. We also own and managethe ‘Daily Mirror Pride of Britain’ awards show which was the bestwatched television programme of its kind in Britain in 2010 with an audience of 6.9 million.
The advertising environment for our national newspapers, in particularthe UK National titles, was much improved during the first half of 2010 with marginal growth. During the second half of 2010 we experienced a softening of the market which was further weakened by the severeweather conditions in December 2010. Whilst advertising revenueshave fallen marginally for 2010, each of our UK national titles broadly maintained their advertising volume market share during the year,thereby continuing to demonstrate the relevance and importance of our national brands to advertisers and their agencies. The strongmarket positions of our UK brands in particular ensured that their advertising revenues grew for most months during 2010 although we continue to experience month on month volatility.
During 2010 our new editorial production system, Contentwatch, was fully rolled out across the Nationals division creating a more efficientmultimedia newsroom environment. Changes to the editorial processand structure have eliminated outdated processes, delivering efficiencies without compromising quality. Editorial headcount hasbeen reduced by around 200 positions including 60 which were filled by casual workers. As part of the restructure a proportion of sub-editing for the UK Nationals titles is now outsourced to the Press Association in North Yorkshire.
In 2010, the most cyclical categories of recruitment, property and motors represented 34.2% of advertising revenues and of these 26.1% is coming from digital. The impact on the division from these categories has much reduced over recent years and they are now better placed to benefit from a combination of cyclical recovery and any structural changes when market conditions improve. In recent months our national recruitment websites have returned to growth and this improved performance combined with our taking full control of fish4, digital will represent some 45% of recruitment advertising revenue into 2011.
Circulation revenuesRegionals circulation revenues increased by 1.0% including circulationrevenue of £7.2 million from GMG Regional Media. Excluding GMG Regional Media, circulation revenue fell by 9.0% with only limited cover price increases during the year. Excluding GMG Regional Media, we experienced year on year volume declines of 7.6% for paid-for dailies, 10.6% for paid-for Sundays and 9.0% for paid-for weeklies reflecting the impact of consumers curtailing discretionary spend.
Circulation and readership volumes for our largest titles are set outbelow:
2010Daily
circulation^
2010 Averagereaders*
2009 Daily
circulation^
2009 Averagereaders*
South Wales Echo 33,725 123,984 36,928 137,900
Welsh Daily Post 31,946 114,949 32,864 120,353
Western Mail (Wales) 27,495 107,680 30,133 119,913
The Journal (Newcastle) 27,185 91,272 30,147 102,862
Huddersfield Daily Examiner 20,774 58,660 21,523 61,538
Liverpool Echo 87,198 280,337 88,519 290,321
Birmingham Mail 48,660 131,707 52,752 144,901
Evening Chronicle (Newcastle) 54,874 213,403 60,554 238,792
Coventry Telegraph 35,581 90,629 38,792 100,062
Evening Gazette (Teeside) 40,656 137,404 43,937 149,291
Wales on Sunday 28,613 112,967 32,268 125,133
Sunday Mercury (Birmingham) 43,610 185,449 49,535 135,653
Sunday Sun (Newcastle) 52,216 130,272 58,882 200,711
^ Actual average ABC July to December 2010 and actual average ABC July to December 2009.* JIC REG January to June 2010 and January to June 2009.
The Manchester Evening News had a daily circulation^ (Monday – Saturday) of some 90,000 with average readers* (Thursday – Friday) of some 350,000.
Although we continue to experience year on year declines incirculation volumes we have seen an encouraging improvement in therate of decline for a number of key paid-for titles during the second half of the year.
Other revenuesRegionals other revenues increased by 12.7% including £3.4 millionfrom GMG Regional Media. Excluding GMG Regional Media otherrevenue increased by 1.9% driven by higher contract print revenue.

Trinity Mirror plc 26 Annual Report & Accounts 2010
Business review
Circulation revenuesNationals circulation revenue for the year has fallen by 8.5% from£266.8 million to £244.2 million. Excluding the additional week of trading in 2009, circulation revenues have fallen by 6.9% from £262.2 million to £244.2 million. The decrease in circulation revenuereflects volume declines with no cover price increases during the year.Circulation volumes declines for the year were Daily Mirror down 7.1%,Sunday Mirror down 7.3%, The People down 8.7%, Daily Record down 6.0% and the Sunday Mail down 7.5%.
The average monthly change in circulation volumes for 2010 and the average readership of our national titles were as follows:
2010Volumeactuala
000
2009Volumeactuala
000Change
%
2010 Averagereadersb
000
2009Averagereadersb
000Change
%
Daily Mirror 1,221 1,314 (7.1) 3,012 3,477 (13.4)
Sunday Mirror 1,127 1,216 (7.3) 3,750 3,840 (2.3)
The People 524 574 (8.7) 1,264 1,413 (10.5)
Daily Recordc 296 315 (6.0) 909 1,050 (13.4)
Sunday Mailc 360 389 (7.5) 1,131 1,201 (5.8)
a Average circulation for the 12 months to December 2010 and December 2009.a
b NRS 12 months to September 2010 and September 2009.c Within Scottish market only.c
Other revenuesOther revenue declined by 5.6% from £60.7 million to £57.3 millionreflecting the impact of contract print revenue previously charged to GMG Regional Media which is now classified as internal charges.Excluding all charges to GMG Regional Media for 2009 and in 2010 prior to the acquisition, other revenues increased by 3.9% due to newthird-party contract print revenues.
CentralCentral includes costs not allocated to the operational divisions and the share of results of associates. The result for the year was a loss of £14.5 million compared to £14.1 million in the prior year.Costs not allocated to the operational divisions increased marginally by £0.6 million from £14.6 million to £15.2 million and the share of results of associates increased by £0.2 million from £0.5 millionto £0.7 million.
Revenue and operating profitThe revenue and adjusted operating profit for our Nationals divisionare as follows:
2010£m
2009£m
Variance%
Revenue 430.3 460.4 (6.5)
Operating profit 86.1 83.6 3.0
Operating margin 20.0% 18.2% 1.8%
Revenue declines of 6.5% from £460.4 million to £430.3 million weremore than offset by a fall in costs of 8.7% from £376.8 million to£344.2 million enabling operating profit to increase by 3.0% from £83.6 million to £86.1 million. The cost reductions resulted in operating margin increasing by 1.8 percentage points from 18.2% to20.0%. The additional week’s trading in 2009 contributed revenueand operating profit of £7.5 million and £3.6 million respectively, thereby distorting the year on year revenue and profit performance of the division. Excluding the additional week’s trading in 2009, revenue has fallen by a reduced 5.0% and operating profit has risen by an increased 7.6%.
Digital revenues have declined by £0.1 million from £4.8 million to £4.7 million reflecting a decline in bingo revenues which has been almost fully offset by growth in other digital revenues. Audience reach continues to grow, with average monthly unique users growing by21% year on year to 10.7 million per month.
Revenue by typeThe revenues by type in the Nationals division are as follows:
2010£m
2009£m
Variance%
Advertising 128.8 132.9 (3.1)
Circulation 244.2 266.8 (8.5)
Other 57.3 60.7 (5.6)
Total revenue 430.3 460.4 (6.5)
Total revenue comprises advertising (29.9%), circulation (56.8%) and other (13.3%). All revenue categories have declined during the year. Both advertising and circulation revenues have declined due to the fragile economic conditions. The advertising is much improved on the 7.8% decline experienced in 2009 while circulation has deterioratedfrom the 0.5% decline last year.
Advertising revenuesNationals advertising revenue decreased by 3.1% from £132.9 million to £128.8 million. The year on year trend in advertising revenuesimproved materially during the first half of 2010, with revenues growing by 2.2% compared to declines of 14.4% in the first half of 2009. However, we experienced declines in advertising revenue of 7.8% in the second half due to a weaker advertising market, thesevere weather conditions in December 2010 and the additional week of trading in 2009. Adjusting for the extra week of trading in 2009, advertising revenues in the second half fell by 4.7% and for the fullyear by a much reduced 1.4%. The advertising performance across the year reflects a strong performance from the UK Nationals titles,partially offset by a weaker performance by the Scottish Nationals titles which have a higher proportion of the more cyclical classified advertising revenues.

Wh
o w
e a
reB
usin
ess r
evie
wG
ove
rna
nc
eF
ina
nc
ials
Trinity Mirror plc Annual Report & Accounts 2010 27
Cash flow and net debtCash flow was positive during the year after pension funding payments in excess of the income statement charge of £30.6 million (excluding non-recurring items), net capital expenditure of £11.5 million and the cash consideration of £7.4 million for the acquisition of GMGRegional Media.
Net debt, on a contracted basis, assuming that the private placementloan notes and the cross-currency interest rate swaps are notterminated prior to maturity, decreased by £58.1 million from £324.0 million to £265.9 million during the year as follows:
££m
Net debt on a contracted basis as at 3 January 2010 324.0
Pension funding in excess of the income statement charge(excluding non-recurring items) 30.6
Net capital expenditure 11.5
Acquisition of GMG Regional Media 7.4
Corporation tax and net interest payments 34.0
Net other cash inflows (141.6)
Net debt on a contracted basis as at 2 January 2011 265.9
On a contracted basis, the Group has £382.1 million of drawn debtfunded through the US private placement markets. A repayment of £145.4 million is due in October 2011 and is expected to be repaidsubstantially through cash balances and cash generated in 2011. Repayments on the US private placement loan notes beyond 2011 are £69.7 million in June 2012, £54.5 million in October 2013,£44.2 million in June 2014 and £68.3 million in June 2017.
The net debt, on a statutory basis, is as follows:
2010£m
2009£m
US$ denominated loan notes 337.9 329.0
Sterling denominated loan notes 26.0 26.0
Cross-currency interest rate swaps included in liabilities 2.2 2.9
Cross-currency interest rate swaps included in assets (12.6) –
Interest rate swaps – 3.1
Cash and cash equivalents (116.2) (61.2)
Net debt on a statutory basis 237.3 299.8
Net debt, on a statutory basis, decreased by £62.5 million from£299.8 million to £237.3 million. The fair value of the Group’s cross-currency interest rates swaps at the period end was a netasset of £10.4 million (2009: £2.9 million liability). The year end sterling amount of the US$ denominated and the sterling loan notes was £363.9 million (2009: £355.0 million).
The US$ and sterling denominated loan notes are part of twoUS private placements issued during 2001 and 2002 totalling US$602 million and £32 million. In October 2008, US$80 million and £6 million of these loan notes were repaid on their maturity date.The total sterling repayment was £60.4 million. The capital and interest repayments on the US$ loan notes are hedged to maturity through cross-currency interest rate swaps with the same maturityprofile as the loan notes with fixed US$ interest payments swappedinto sterling variable interest rates payments linked to six month sterling Libor plus a margin. The key financial covenants for the USprivate placements are a minimum interest cover of two times andmaximum debt to EBITDA ratio of four times throughout the term of the loan notes.
Balance sheet2010
£m 2009
£m
Intangible assets 969.9 945.9
Retirement benefit assets 61.1 –
Deferred tax assets 43.8 83.4
Derivative financial instruments 12.6 –
Property, plant and equipment 410.3 423.2
Investment in associates 5.4 6.3
Non-current assets 1,503.1 1,458.8
Cash and cash equivalents 116.2 61.2
Short-term debt (140.0) (3.1)
Medium-term debt (226.1) (357.9)
Retirement benefit obligation (222.1) (296.6)
Deferred tax liabilities (318.3) (318.8)
Provisions (14.5) (17.3)
Net current other liabilities (18.7) (37.1)
Non-current liabilities and net current liabilities (823.5) (969.6)
Net assets 679.6 489.2
Intangible assets2010
£m2009 £m
Publishing rights and titles 887.8 857.8
Customer relationships and domain names 7.6 13.6
Goodwill 74.5 74.5
Intangible assets 969.9 945.9
Publishing rights and titles have increased by £30.0 million reflecting the acquisition of GMG Regional Media. Customer relationships and domain names have reduced by amortisation charged in the periodof £6.0 million.
Property, plant and equipment2010
£m2009 £m
Land and buildings 197.5 202.0
Plant and equipment 209.0 211.3
Assets under construction 3.8 9.9
Property, plant and equipment 410.3 423.2
Property, plant and equipment has decreased due to the depreciationcharge of £33.9 million (2009: £36.8 million), disposals of £1.4 millionand a reclassification of £0.9 million being higher than additions of £13.0 million (2009: £14.0 million) and the acquisition of assets as part of GMG Regional Media of £10.3 million.
Investment in associatesThe carrying value of our 21.54% share in the PA Group Limited has decreased by £0.9 million from £6.3 million to £5.4 million reflecting the profit of £0.7 million offset by actuarial losses of £1.6 million taken directly to equity.

Trinity Mirror plc 28 Annual Report & Accounts 2010
Business review
The mortality assumptions applied in calculating liabilities are consistent with those adopted at 3 January 2010. The life expectancy increases marginally over time as a 1% future improvement has beenassumed in the mortality assumptions. The assumed life expectancyfrom age 65 for members aged 65 and 55 in 2010 is shown below:
Future life expectancy (years) for a pensioner
currently aged 65
Future life expectancy (years) at age 65 for
a non-pensionercurrently aged 55
Male Female Male Female
At 2 January 2011 21.7 24.1 23.5 25.8
At 3 January 2010 21.6 24.0 23.4 25.7
The Group continues to fund pension scheme deficits in accordancewith funding schedules agreed with the pension scheme trustees. Valuations are undertaken on a triennial basis. In 2008, the valuationsof all of the significant schemes, except the Trinity Retirement BenefitScheme, were completed. The Trinity Retirement Benefit Schemevaluation has a valuation date of 30 June 2009 and was agreed inthe year. Pension payments in excess of the income statementcharge (excluding non-recurring items) were £30.6 million (2009: £16.6 million). The estimated deficit payments in 2011are expected to be around £35 million.
Deferred tax assets and liabilitiesThe deferred tax assets have fallen by £39.6 million from £83.4 millionto £43.8 million primarily due to the fall in the retirement benefit obligation included in liabilities.
Deferred tax liabilities have decreased by £0.5 million from£318.8 million to £318.3 million primarily due to the restatement of the opening liability following the reduction in the corporation tax rate from 28.0% to 27.0%, offset by deferred tax on acquisition of businesses.
ProvisionsProvisions have decreased by £2.8 million from £17.3 million to £14.5 million due to the utilisation of restructuring provisions andproperty provisions for vacant property partially offset by additionalcharges during the year.
Net current other liabilitiesNet current other liabilities includes current assets excluding cash and cash equivalents less trade and other payables and current taxliabilities. Net current liabilities have reduced by £18.4 million from£37.1 million to £18.7 million reflecting a reduction in working capitaland current tax.
Net assetsTotal equity at the year end was £679.6 million, an increase of £190.4 million from £489.2 million. The increase reflects the £190.8 million total comprehensive income for the period marginallyoffset by £0.4 million of other movements. These comprise of a charge for the purchase of own shares of £3.5 million less a credit to equity for equity-settled share-based payments of £2.0 million and arefund of VAT on share issue costs of £1.1 million.
The total comprehensive income for the period includes the profit for the period and the actuarial gains on the defined benefitpension schemes.
The contracted net debt repayment profile is as follows:
2010£m
2009 £m
Repayment within one year 145.4 3.1
Between two and five years 168.4 269.6
After five years 68.3 112.5
Cash and cash equivalents (116.2) (61.2)
Net debt on a contracted basis 265.9 324.0
Net debt on a contracted basis is different to the statutory net debt which includes the US$ denominated loan notes at the year end exchange rate and the related cross-currency interest rate swaps at fair value.
The Group had no drawings as at 2 January 2011 on its £178.5 million committed bank facility which expires in June 2013. Net debt is expected to continue to fall further during 2011 and theGroup continues to operate comfortably within the financialcovenants attached to the Group’s financing facilities.
At the year end, committed facilities of £560.6 million (2009: £563.7 million) were available to the Group as set out below:
2010£m
2009£m
Bank facility 178.5 178.5
US private placements 382.1 382.1
Interest rate swap – 3.1
Committed financial facilities 560.6 563.7
Drawn facilities 382.1 385.2
Undrawn facilities 178.5 178.5
Committed financial facilities 560.6 563.7
Retirement benefit assets and obligationRetirement benefit assets of £61.1 million represents the surplusesbefore deferred tax in a number of the defined benefit pensionschemes calculated in accordance with IAS 19.
The Group closed all of its defined benefit pension schemes to future accrual on 31 March 2010. From 1 April 2010 a majority of the members of the defined benefit pension schemes joined theTrinity Mirror Pension Plan, a defined contribution pension scheme.
The operating profit charge (excluding non-recurring items) in theyear for defined benefit and defined contribution pension costs was £15.1 million (2009: £15.7 million). Included in non-recurring items isa loss of £0.4 million (2009: £9.9 million gain) in respect of the defined benefit pension schemes. The pension finance charge in the yearwas £7.1 million (2009: £10.5 million). We estimate there being a pension finance credit of £2.7 million in 2011.
The defined benefit pension deficits have fallen materially during the year by £135.6 million from £296.6 million to £161.0 million.This reflects the impact of an increase in assets of £126.0 million,a reduction in the asset ceiling of £11.6 million partially offsetting an increase in liabilities of £2.0 million. The increase in liabilities includes a £80.1 million benefit due to the government announced changes instate pension increases being linked to CPI instead of RPI which impacts most deferred pensions in the Group’s schemes. This was more than offset by the impact of a fall in the real discount rate from 2.20% to 1.95% due to a fall in the corporate bond rate only partially offset by a fall in inflation and other changes.
Wh
o w
e a
reB
usin
ess r
evie
wG
ove
rna
nc
eF
ina
nc
ials
Trinity Mirror plc Annual Report & Accounts 2010 29
Market and technological changesStructural change in the market or the emergence of new technologies may lead to loss of revenue or profit. In addition to our existing wide portfolio of websites we are making investmentsto provide the appropriate platform for the business to drive morediversified revenue streams across multiple media channels. The investments include a customer relationship management system and a new digital content management system which enables more efficient publication of content across different devices.
PensionsPension deficits may grow at such a rate so that the annual cash funding consumes a disproportionate level of operating cash flow.Although this is carefully monitored and there are regular reviews withtrustees, there are a number of factors which are outside our control,including interest rates, inflation rates, mortality and regulatorychange. This, together with the slowdown in the global economyand its impact on our business and investment returns, has materialimplications for future pension scheme funding and could adversely impact the Group and its ability to fund past service provision. To reduce the volatility of pension scheme liabilities and achieve more certainty in the cost of future pension provision, the Group closed the defined benefit pension schemes to future accrual from 31 March 2010.
Business continuityWe are dependent on our technology, networks and manufacturingcapability and we have invested in our network resilience andmanufacturing infrastructure. Business continuity plans are regularly reviewed and they are updated to reflect changes in operations and systems. We have insurance to cover property damage andbusiness interruption.
EnvironmentalKey risks are described in the Corporate responsibility report on pages 31 to 39.
TreasuryThe key risks arising from our activities and our financing facilities areliquidity, financing and interest rates, foreign currency and covenants. Further details are provided in note 34 to the consolidated financial statements. The treasury policies for managing these risks were approved by the Board in March 2001. An updated Treasury Policywas issued in 2010. The policies are summarised below:
Liquidity riskOur policy is to ensure continuity of funding and flexibility.
Debt maturities are spread over a wide range of dates, thereby ensuring that we are not exposed to excessive refinancing risk in anyone year. The maturity profile of debt outstanding at the year end issummarised on page 28. Our liquidity risk arises from timingdifferences between cash inflows and outflows. These risks aremanaged through unutilised committed and uncommitted creditfacilities. It is our policy to maintain sufficient cash balances andcommitted facilities to meet anticipated funding requirements.These resources, together with the expected future cash flows to be generated by the business, are regarded as sufficient to meet the anticipated funding requirements of the Group for at least the next 12 months.
Risks and uncertaintiesThere is an ongoing process for the identification, evaluation andmanagement of the significant risks faced by the Group. This is described in the internal control section of the Corporate governancereport on page 44.
The key risks are described below:
OperationalWe will maximise the value and profitability of our print brands and have reviewed our portfolio. This has led to the launch of new orenhanced publications and the closure or disposal of unprofitable titles. We continue to strive for growth in our digital audiences by the launch and development of online brands including websites andmobile sites. We are also growing our other revenue streams such as contract print where we utilise spare capacity and are now thelargest contract printer of newspapers in the UK.
Macro economyThe fragile economic environment may have an adverse effect on the Group’s financial performance. We have reviewed all aspects of our business and invested in the modernisation of business processesand structures, including new operating models and technologyto provide a stronger platform for long-term growth. Together withtight management of the cost base, this has placed us in a robustfinancial position.
Organisation and peopleThe ability to execute and implement our strategic and business plans relies on the appropriate Group structure, culture and availability of talent.
We continue to invest in learning and development including a leadership programme for our senior managers and a talent development programme for our managers of the future.
AdvertisingThe loss of major clients or reduction in a sector may adversely affect advertising, which is a significant proportion of our revenue. We arenot overly reliant on any single customer or sector but have been impacted by the downturn being experienced by the UK and by the potential long-term impact on key classified revenues arising from media fragmentation. We are investing in our advertising functions using state-of-the-art technology to improve customer service byoffering increased flexibility such as online booking of advertisements. We have strengthened our online presence through acquisitions andthe continuing launch of new digital brands.
CirculationWe may experience loss of readership due to competitor activity andthe impact of media fragmentation. Our approach is to continue tofocus on sustainable returns and appropriate levels of investment in our titles. We have invested in colour presses giving full colour acrossthe network and continue to invest in editorial content and marketing.
Key suppliersWe have a number of key suppliers (in particular newsprint) whichif they were unable to meet their obligations to the Group could result in disruption. We use a spread and mix of suppliers to reducedependency on specific sources or locations.

Trinity Mirror plc 30 Annual Report & Accounts 2010
Business review
EmployeesThe commitment, innovation and drive of our staff are central to theongoing development and success of our business.
During the year, the voluntary rate of employee turnover increasedyear on year to 7.8% (2009: 6.8%). During the same period theretention rate, defined as employees in the Group’s employmentfor the full 12 months, remains stable at 88% from 89% in the previous year.
During the year the Group’s absenteeism rate, which follows thecommon definition used by the Advisory, Conciliation and Arbitration Service (ACAS), was an average of 1.9% (2009: 2.1%). This compares favourably with the national average level of employee absence of 3.4% (2009: 3.5%). (Source: CIPD Absence Management SurveyOctober 2010.)
The Group is committed to equality of opportunity in all itsemployment practices to ensure we attract and retain the bestpeople. In 2010, women made up 38% of staff (2009: 38%) and the number of women occupying senior managerial roles was 21% (2009: 22%).
In response to trading conditions, the Group took the decisionto freeze salaries throughout the Group in 2009. In 2010 senior management salaries were again frozen, with staff below seniormanagement receiving an annual pay award. In addition to basesalary all our employees have the opportunity to participate in performance related incentive schemes. For many staff this isthrough inclusion in the Group’s Employee Bonus scheme.
We also provide a competitive range of benefits to employees,including the opportunity to join a Group-wide defined contribution pension scheme. We continue to introduce initiatives enabling staff greater flexibility in their work-life choices.
Environmental and socialOur environmental and social policy and statement, together with areview of our performance during 2010, is set out in the Corporate responsibility report on pages 31 to 39.
Key operating trends and outlookThe key operating trends and outlook can be found on page 17 of the Chairman and Chief Executive statement.
Financing and interest rate riskOur exposure to interest rate risk is managed through the use of interest rate swaps, options, caps and forward rate agreements. Hedging transactions are undertaken after a review of the effecton profit after tax of a range of interest rate assumptions andprobabilities, determined by reference to the general economicclimate and market forecasts for interest rates.
Foreign currency riskLess than 2% of the Group’s turnover and operating costs are generated in currencies other than sterling. Given the minimal impact on profit after tax of fluctuations in foreign currencies, we trade foreigncurrencies at spot rates. The payment of interest and capital on borrowings denominated in foreign currencies is fully hedged throughcross-currency interest rate swaps. Whilst a substantial proportion of our newsprint supplies are sourced from outside the UK, the prices are agreed in sterling. The sterling prices are impacted to some extent by foreign currency movements.
Covenants riskWe seek to maintain standard terms for all our financial covenants where possible. Our covenants are monitored on an ongoing basis with formal testing of financial covenants at each reporting date. The Company continues to comply with all borrowing and financial covenant obligations.

Wh
o w
e a
reB
usin
ess r
evie
wG
ove
rna
nc
eF
ina
nc
ials
Trinity Mirror plc Annual Report & Accounts 2010 31Corporate responsibility reportChief Executive’s statement
Community engagement is a phrase thatmany companies use to describe their staff volunteering activities or a small donation to a local charity here or there. For Trinity Mirror we see it differently. In short it is at the very heart of the company and is the soul of our brands both in print and online. They are nothing if they are not from and for thecommunities that they serve. With this in mind we have included an expanded sectionin this report that highlights only some of theactivities that some of our titles have undertaken over the last year.
I am so pleased that for the second year we were awarded the RoSPA Gold Medal for consistently improving health and safety standards. This comes after four successive Gold Awards. I believe that any injury is one too many and our aim is to be able to make azero declaration. We still have some way to go but one only has tolook at the graphs on page 33 to see just how far we have already travelled. This has only been achieved through the efforts of all our staff on the ground. Health and Safety policies can be set by the Board and a general tone created but unless they are lived by our staff they would have failed.
Last year we undertook to achieve accreditation under the ISO 14001Environmental Award and the OHSAS 18001 Health and Safety Award across all our print sites. I am very happy to confirm that we achieved this goal. These standards bring with them the rigourrequired for external verification. The Reading plant that we acquired from GMG did not meet these standards but work is alreadyunderway to bring it up to the level that we now expect for Trinity Mirror.
Finally, in 2010 we became the first company in the UK to be re-awarded the Carbon Trust Standard – the leading independentverification of real and sustained carbon use reduction.
I am pleased that, despite the tough trading conditions that we faced, we maintained throughout 2010 our commitment to the variousstrands of our Corporate Responsibility programme.
Sly Bailey Chief Executive
3 March 2011

Trinity Mirror plc 32 Annual Report & Accounts 2010
Corporate responsibility report
Group health and safety statisticsThe tables below provide statistics for occupational health and safety in 2010, with a comparison to the previous year. Analysis of the datareveals that there has been a further reduction in the total number of accidents, including those reportable under RIDDOR. However, thenumber of working days lost due to accidents has risen, pointing toa possible increase in severity. This represents a considerablechallenge for 2011 when amongst other initiatives behavioural safetyprogrammes will be introduced to secure further improvement in ourperformance. Although there was little change in the total number of accidents involving slips and falls (same level) and materials handling this year, more of the latter resulted in events reportable underRIDDOR. Consequently these items will remain priority areas for improvement in 2011.
Health and safety performance indicator 2010 2009
Fatalities 0 0
RIDDOR major injuries 4 2
RIDDOR over 3 day injuries 12 16
RIDDOR occupational ill health/diseases/conditions 0 0
RIDDOR dangerous occurrences 0 0
Total number of accidents 180 238
RIDDOR events frequency rate† 0.15 0.13
All accidents frequency rate† 1.70 1.84
Total days lost – accidents and occupationalill-health‡ 437 368
(0.03) (0.02)
† Frequency Rate = number of accidents per 100,000 hours worked.‡ Figure in brackets represents the percentage of total days worked by all employees in
the Group.
Breakdown of accidents by typeof event
RIDDORRIDDORaccidents
2010%
AllAll accidents
2010%
RIDDORRIDDORaccidents
2009%
AllAll accidents
2009%
Slips and falls (same level) 25 28 23.5 20
Lifting and handling of materials 44 9.5 17.5 10
Contact with machinery 6 12 17.5 8
Falls from a height 6 3 12 3
Stepping on or striking fixed object 0 11.5 0 16
Struck by moving vehicle 0 2 0 1
Contact with sharp/abrasivematerial 0 13.5 0 19
Struck by flying or falling object 6 4 6 3.5
Contact withhazardous substance 0 3 0 8.5
Contact with hot material/ substance 0 3 6 3
Object collapsing or overturning 0 0 0 0
Use of hand tools 6 2 0 2.5
Contact with electricity 0 0.5 0 0
Others 7 8 17.5 5.5
Total 100 100 100 100
Health and safety 2010 summaryThis was another very challenging year for the Group which resulted in further reorganisation. Nevertheless health and safety standards have been maintained and some considerable improvements were made.
Health and safety initiatives during 2010In pursuit of our goal of continuing improvement, the following initiatives were taken during 2010:
– A programme of internal and external health and safety audits wascarried out at our printing plants to ensure compliance with legislation and with the international health and safety managementsystem specification OHSAS 18001. Scheduled departmentalhealth and safety inspections also continued with follow-up action, where appropriate;
– Good standards of health and safety were maintained during major engineering and refurbishment projects at Glasgow and Oldham.Compliance inspections and audits were also carried out in thenewly acquired GMG Regional businesses comprising MEN Media, Chadderton, Surrey & Berkshire at Stoke Mill and the Readingprinting plant;
– Work to ensure compliance with HSE recommended standards for the management of work-related stress continued with a further 150 managers completing stress awareness training;
– Further work was undertaken to update records of driver licensingand driving risk assessment. Those involved in driving on companybusiness were also issued with a new drivers handbook incorporating road safety advice and guidance;
– Liaison continued through the Group Health and Safety Risk Management Forum and the current policy covering home working was revised and updated;
– The Group has continued its involvement with the HSE Printing Industry Advisory Committee and NewspaperPublishers Association; and
– A review of the arrangements for occupational health was carriedout and recommendations made for improvement in 2011.
Current targets for health and safety – 2011 onwardsTo achieve our goal of continual improvement in 2011 the Group intends to:
– Continue with our work to maintain compliance with OHSAS 18001 and other management systems at all of our printing plants;
– Provide our Health and Safety Managers with specialist training in behavioural safety so that the benefits of introducing such aprogramme can be explored;
– Continue the system of internal regulatory compliance audits issuing reports with recommendations for improvement, where appropriate;
– Continue our involvement with the HSE Printing Industry Advisory Committee in an effort to improve health and safety in the Group and throughout the wider industry sector;
– Continue to develop new policies and procedures relating to the management of work-related stress and safe driving;
– Maintain good health and safety standards in engineering and construction projects that are planned for completion during theyear; and
– Continue to monitor health and safety developments, taking actionto ensure compliance with new legislation and promoting furtherimprovement through the Group Health and Safety Risk Management Forum.

Wh
o w
e a
reB
usin
ess r
evie
wG
ove
rna
nc
eF
ina
nc
ials
Trinity Mirror plc Annual Report & Accounts 2010 33
– Working with our suppliers to ensure wood fibre for newsprint comes from well-managed sustainable forests and using a minimum of 75% newsprint manufactured from fibre using recycled materials or wood from certified sustainable forests;
– Measuring and reporting the energy consumption of the business and where possible reducing energy consumption;
– Measuring and reporting the consumption of Volatile Organic Compounds (VOCs) throughout the Group and substituting these with alternatives wherever possible; and
– Recycling all non-hazardous press waste and striving towards nil general waste to landfill.
Environmental managementThe Group recognises that its business activities have an impact onthe environment and therefore takes careful measures to ensure itmanages and minimises these impacts wherever possible.
The Environmental Steering Committee (ESC) comprises key members with specific day-to-day responsibility for environmentalmanagement, legal, health and safety, procurement andcommunications and reports to the Executive Committee via the Secretary and Group Legal Director. The ESC’s remit is to ensure that the Group’s environmental programme remains aligned with all relevant issues and developments. In addition to the initiatives onenvironmental management systems and climate change, we have continued to pursue targets in specific areas where the Group hasthe potential to affect the environment, notably paper sourcing,sustainable forestry, waste management and recycling, volatileorganic compound emissions from print works and the purchase of contracted printing and product distribution services. Performanceagainst all of these areas is reported below.
Our efforts to implement environmental policy commitments, through the achievement of defined annual targets, have yielded real benefits over the past five years. The Group’s policies are kept under reviewto ensure that it remains aligned with developments in legislation, the expectations of stakeholders and the needs of the business.
During 2010, the Company commissioned an independent review of its corporate responsibility and sustainability policies, programmes and performance. The recommendations of this review will be fullyevaluated during the coming year. The Company acknowledges thatdigital media products also have an environmental impact and intends to work with the relevant industry bodies to investigate thecarbon footprint of such products.
A new procedure for internal environmental review, reporting into the Environmental Steering Committee, is to be implemented during 2011, to reinforce awareness of Group policies and targets and helpto ensure that they are incorporated into local business plans.The core publishing sites, now expanded to include the new Manchester Evening News office at Chadderton, are workingtowards Phase 3 of the BS8555 standard and are tasked to achieve this by the end of 2011.
There were no reported breaches of environmental legislation in 2010.
The full version of our Environmental Policy may be found on theCompany’s website.
The following graphs illustrate the substantial improvement that has been made in occupational health and safety over the last ten years:
ComplianceThere were six visits to our premises by health and safetyenforcement officers in 2010, which is the same number as in the previous two years. These visits were all intended to verify that the Company was meeting its statutory duties for health and safety and in each case where the need for follow up action was identified it was promptly taken. No enforcement action of any kind was required.
The Environment
Environmental policy statementThe Company is committed to:
– Complying with all relevant environmental legislation and continuingto meet or improve upon existing industry standards;
– Avoiding pollution and improving the Company’s environmental performance through progressive environmental managementsystems including the BS8555 and ISO14001 standards;
– Continually reviewing the sustainability of all products throughout the supply chain and endeavouring to prioritise the utilisation of sustainable commodities within the production and publishing businesses;
RIDDOR reportable events 2001–2010
2001
Major injuries
Dangerous occurrences
Combined total Over 3 day injuries
Diseases and conditions
100
90
80
70
60
50
40
30
20
10
2002 2003 2004 2005 2006 20082007 2009 2010
Annual working days lost 2001–2010
2001
Working days lost
2,500
2,000
1,500
1,000
500
2002 2003 2004 2005 2006 2007 2008 2009 2010

Trinity Mirror plc 34 Annual Report & Accounts 2010
Corporate responsibility report
Waste stream Treatment%
recycled
Quantity generated
2010 2009
Aluminium plates
Re-melted and re-used as pure metal
100 987,942 kg 878,682 kg
Solvents(Blanket wash)
Solids separation bygravity, liquid fraction used as low grade fuel
100 758,530 litres
1,044,537 litres
CTPdeveloper
pH adjustment and biodigestion
95 322,020 litres
357,495 litres
Ink Solids separation bygravity, liquid fraction used as low grade fuel
100 24,758 kg 35,575 kg
Fountainsolution
Solids separationand biodigestion
80 5,800litres
13,540 litres
Mineral oil Solids separation bygravity, liquid fraction used as low grade fuel
100 23,870litres
19,220 litres
Our redundant IT equipment was handled through our continuingrelationship with Remploy disabled persons workshops where 87%of IT equipment was recycled and the remaining 13% otherwisereused thereby ensuring none of this equipment ends up inlandfill sites.
Volatile Organic Compound emissions (VOCs)The emission of VOCs (mostly solvent vapours from inks, fountainsand blanket washes) has historically been one of the keyenvironmental concerns associated with printing operations andcontinues to be a main criterion in the statutory regulation of printworks. The availability of new equipment and technologies, usingwater-based chemicals, now offers the printing industry significantopportunities for reducing VOC emissions. Trinity Mirror Printing has taken advantage of these developments and by adopting newtechnology and best practice, our print sites have now reducedconsumption of VOCs to a very low level relative to our productionoutput. The use of VOCs will continue to be reviewed and reduced where possible.
Refrigerant gasesTrinity Mirror’s programme to replace ozone-depleting HCFCrefrigerant gases, across all press and office locations, has continuedto move forward. We remain on track to meet our target of replacingall HCFCs at major press and publishing locations by the end of 2011.
Water consumptionThe water consumption of the Group’s ‘core’ sites during 2010 was102,000 cubic metres (2009: 138,000 cubic metres). Throughout 2011, the Company will review water consumption across its sites,recognising that responsible management of water is an essentialcomponent of an effective environmental management programme.
The Company has set the following environmentaltargets for 2011 onwards:– Achieve certification to Phase 3 of the BS 8555 environmental
management system standard at its major office locations inBirmingham, Cardiff, Central Quay, Chadderton, Glasgow, Hamilton, Liverpool, London, Middlesborough and Newcastle bythe end of 2011;
– Maintain ISO14001 certification at the following print plants: Birmingham, Blantyre, Cardiff, Cardonald, Newcastle, Oldham,Teesside, Watford;
– Review existing environmental management systems at Reading print plant;
– Continue to use a minimum of 75% newsprint manufactured from fibre using recycled materials or wood from certified sustainable forests;
– Continue to recycle 100% of all non-hazardous waste(paper, cores and reel-ends);
– Strive to achieve nil general waste to landfill;
– Replace all HCFC gases held in refrigeration equipment by theend of 2011;
– Review water consumption at all major sites during 2011; and
– Reduce group grid electricity consumption by 2% by the end of 2012.
Paper sourcing and sustainable forestryThe paper used by the Company for newsprint originates from amixture of recycled and virgin fibres. As paper is recycled, the quality of the paper fibre deteriorates. It is necessary to introduce virgin fibres to the mix in order to produce paper of the requisite quality. The virginfibres come from softwood (conifers) not hardwood sources and assuch do not contribute to the deforestation of rainforests.
The Company maintains a clear policy commitment to maximise the newsprint that is produced from recycled fibre, or fibre from forests that have been independently certified as sustainable. Sustainable forests work to a careful management plan which balances extraction with replanting. In 2010, we sourced 89% of newsprint from recycled fibre or certified fibre, against our current target of 75%.
Waste management and recyclingThe Company strives to ensure that, wherever possible, wastematerials (including hazardous wastes) generated by our pressoperations are recycled or otherwise beneficially re-used and that the amount of waste sent to landfill is minimised.
During 2010, the Company has continued to recycle 100% of paper wastes comprising reel ends, cores and printed waste. We have also, by working closely with our main contractor, achieved 80 – 100% recycling rates for the more difficult press wastes that we generateincluding aluminium plates, blanket wash, CTP developer, fountain solutions and waste oil. Where these products cannot be recycled we ensure that they are safely and responsibly disposed of through anapproved and regulated contractor. Treatment routes and recycling rates for our major press wastes in 2010 are summarised in thetable below:
0.19
0.19
0.19
2008
2009
2010
0 0.04 0.08 0.12 0.16 0.2
VOCs (kgs per million pages)87
87
89
2008
2009
2010
0 20 40 60 75Target 100
% recycled or certified newsprint

Wh
o w
e a
reB
usin
ess r
evie
wG
ove
rna
nc
eF
ina
nc
ials
Trinity Mirror plc Annual Report & Accounts 2010 35
Energy consumption and carbon footprintThe Company recognises that climate change is one of the foremostissues affecting the global population today. Reducing energyconsumption and associated carbon footprint is a key priority in theGroup’s environmental management programme. Our success in becoming the first company to achieve re-certification to theGovernment’s Carbon Trust Standard is a measure of thedcommitment that has been shown by our staff in delivering a rolling programme of energy reduction measures over the past five years.
During the year, the Company registered as a participant in the CRCEnergy Efficiency Scheme which introduces a statutory ‘cap-and-trade’ scheme where major electricity users will have to buy permits to emit carbon dioxide. Changes to the CRC Energy Efficiency Scheme were announced in the Government’s Spending Review and our plans for fully complying with the updated requirements of the scheme are well in place, including submission of the first dataevidence pack in 2011 and the first purchase of allowances in 2012.
Our print sites have worked hard to meet their Climate ChangeAgreement targets during this period, through a combination of capital projects and good housekeeping. Our attention is now focusing on our main publishing offices and smaller premises and we will continue to work hard to improve metering and monitoring across the Group in order to identify further energy saving measures.
2008
2008
2009
2009
121
113
113
99
20 40 60 80 100 140120
Grid electricity consumption (million kWh)
2010
2010
107
93
Like for Like
Absolute
As a result of these measures and requirements of the Carbon Trust Standard, we have also improved upon our own target to reduce equivalent carbon dioxide emissions by 10,500 tonnes per annum,versus 2008. Our carbon dioxide emissions have in fact reduced by 13,397 tonnes per annum on an absolute basis. Further information on energy use is shown in the tables below:
Energy consumption and associated CO2 emissions (absolute basis)
GHG emissions (CO2 equivalent tonnes)
Consumption GHG conversion5
factor 2010 2010 2009 2008
SCOPE 1 1
Gas combustion (heating, all Trinity Mirrorpremises) 22,396,127 kWh 0.185 x 10⁻³ 4,143 4,362 5,433
Oil combustion (electricity generation, all Trinity Mirror premises) 124,401 litres 2.542 x 10⁻³ 316 115 384
Refrigerant gas loss (all Trinity Mirror premises 2) 298 kg 1,526 x 10–3 455 3,049 140
Commercial vehicles (all Trinity Mirrorowned vehicles) 1,997,334 km 0.253 x 10⁻³ 505 2,352 2,185
SCOPE 2 3
Grid electricity use (all Trinity Mirror premises) 93,440,845 kWh 0.545 x 10⁻³ 50,925 54,307 61,599
SCOPE 3 4
Business travel (road, not involvingcompany vehicles) 8,525,312 km 0.2119 x 10⁻³ 1,807 2,084 2,760
Business travel (rail) 2,135,713 km 0.0565 x 10⁻³ 121 96 93
Business travel (air) 4,911,513 km 0.1733 x 10⁻³ 851 858 1,017
Electricity for contracted printing 6 5,329,305 kWh 0.544 x 10⁻³ 2,899 2,515 2,514
Gas for contracted printing 6 12,084,489 kWh 0.185 x 10⁻³ 2,236 1,911 1,944
Vehicle fuel for contracted distribution 6 2,030,000 litres 2.672 x 10⁻³ 5,424 5,874 4,997
Total Group 69,682 77,523 83,066
Total Group per million pages ofprinted output 0.46 0.53 0.56
1 Scope 1 covers all direct greenhouse gas emissions, ie emissions from sources that are owned or under the direct management of the Company (Greenhouse Gas Protocol CorporateAccounting and Reporting Standard, 2004).
2 Excluding refrigerant gas loss at Reading print plant.3 Scope 2 covers indirect greenhouse gas emissions associated with imported electricity use.4 Scope 3 covers other indirect greenhouse gas emissions, ie where the emissions are from sources that are not owned by Trinity Mirror and where the Company does not have management control.5 GHG conversion factors have been taken from the latest guidance provided in the Defra/DECC’s GHG Conversion Factors for Company Reporting (Version 1.2.1., 6 October 2010).6 All numbers in italics are based on unaudited numbers provided by contractors.

Trinity Mirror plc 36 Annual Report & Accounts 2010
Corporate responsibility report
This document should be read in conjunction with any specific codeissued to individual groups of employees (eg Financial Dealings byJournalists) or any provisions of individual contracts of employment.
The policy itself is available on the Company’s website and gives guidance on conflicts of interest, the acceptance of gifts and entertainment, confidential information, insider information, and political and civic activities.
The Company is currently reviewing all applicable policies ahead of the enactment of the Bribery Act 2010 which, at the time of writing,has been delayed pending the publication of guidance by theMinistry of Justice.
Charity donationsThe Company’s policy with regard to charitable donations and other such payments is as follows:
‘Trinity Mirror believes that it can best support charities through thepages of its newspapers. This support will either be through appealsto readers for donations or through editorial content, describing theaims and activities of various charities. In every case the decision as to whether or not to support a charity appeal or whether to runeditorial comment will be one for the editor of each newspaper.
Trinity Mirror plc will make direct cash donations to charities in certain limited circumstances. The Company will, at a Group level, support various charities connected with or associated with the newspaper,printing or advertising industries. A second category of direct cash support will be to charities operating in the communities immediately surrounding the Group’s offices and print sites. The charities that are likely to receive support are smaller community based charities wherea modest donation will make a big impact. It is unlikely that a majornational charity that just happens to be based very close to one of ouroffices would receive a donation.
There will be a further limited general pool of funds out of whichdonations will be made to legitimate and supportable causes that fall outside the above two criteria. There will, however, need in each case to be a demonstrable business or commercial reason why such support should be given. Each of our regional newspaper companies have a small budget out of which they will make direct cash donations to charities working in the community in which the newspaper is based. Scottish Daily Record and Sunday Mail Limited will similarly make a number of donations to appropriate charities based in Scotland. The National titles of the Daily Mirror, Sunday Mirror andThe People are most unlikely to make direct cash donations. They willdo so only where they are asked to make a payment to a charity inlieu of a fee for an interview or some form of support.
Any corporate donations requested from the national titles are likely tobe redirected to the Group, as the Company’s headquarters share the same office location as that of the national titles.
All Group donations need the prior agreement of the Secretary andGroup Legal Director. Any local business donations require the prior agreement of the relevant Managing Director. In addition to cash donations, the Company is active in making donations in kind in theform of used computer equipment, furniture, books, etc. Through itscommunity involvement programmes, the Company makes availablemembers of its staff for volunteering and mentoring programmes.’
Environment and the CommunityA number of Trinity Mirror businesses engage with the localcommunity to promote environmental education and awareness.One such example is Go Green, run by Media Wales with thesupport of Welsh Assembly Government, the Carbon Trust, the Energy Saving Trust, The Open University, the University of Wales and other local and national businesses. Go Green provides information for greener living for individuals and businesses as well as providinga valuable source of local and global environmental news. Go Greenwill continue to report on environmental issues throughout 2011 with a focus on the Top 10 environmental issues affecting us all.
Further information: www.walesonline.co.uk/go-green/
Mirror Go Green, working in partnership with ShP Limited, continues to promote recycling by its readers, a trade in scheme for unwanted electronic equipment such as: mobile phones, laptops, MP3 playersand car satellite navigation systems which are restored and sold on to developing markets, thereby diverting it from landfill.
Further information: www.mirrorgogreen.co.uk
The Daily Mirror will celebrate 50 years of support and collaboration with the World Wildlife Fund through a special feature reviewing the last five decades of the Charity’s conservation efforts.
Green 500Trinity Mirror’s head office at Canary Wharf and Trinity Mirror Printing have signed up to the Mayor of London’s Green500 carbonemissions reduction programme and the Green500’s assessors have visited both Canary Wharf and Watford sites. London, along with 70 other major cities worldwide, have pledged to reducecarbon emissions. The Green500 is made up of companies andorganisations with a significant presence in London.
EthicsFor many years the Company has had a policy on Standards of Business Conduct which we regularly review. The introduction to the current policy states:
‘Trinity Mirror plc is one of the largest newspaper publishers in the UK and a major UK plc. The continuing development and well-being of our business depends on all of us maintaining the highest standards of integrity and personal conduct in all matters which involve theCompany. The Company recognises its obligations to those with whom it has dealings, namely its employees, shareholders, readers and advertisers, suppliers and the communities in which its businesses operate. Its reputation is one of the most vital resources of the Company, and depends for its protection upon the honesty and integrity of each and every one of us. This document gives guidance on how the essential standards of integrity and conduct are to be maintained. It is not intended as a statement of new beliefs or the creation of new rules of conduct. Rather, it is a reaffirmation of our continuing values and practices.’
Wh
o w
e a
reB
usin
ess r
evie
wG
ove
rna
nc
eF
ina
nc
ials
Trinity Mirror plc Annual Report & Accounts 2010 37
The Coventry TelegraphThe Coventry Telegraph Charity Snowball Appeal makes donationsto disadvantaged and severely handicapped children in the Coventryand Warwickshire area. It raises funds from local readers,organisations and businesses through a variety of activities.Applications for financial aid have to be supported by medicalprofessionals and in 2010 grants have helped to purchase essentialitems of equipment including specially-adapted wheelchairs, tricyclesand home computers. In addition, 26 local groups and charities benefited from donations totalling £10,000 through the Coventry Telegraph’s ‘Wish’ campaign.
Manchester Evening NewsThe Manchester Evening News and sister paper the StockportExpress joined forces to highlight the story of four year-old, HarleySlack who lost his arms and legs after contracting meningitis.His story of courage went round the world. As Harley spent almostsix months in hospital, a massive fundraising campaign waslaunched to help with his care and last year it reached £600,000.
Harley is doing well and both papers we were there to record his milestones – his first day at school, his first steps and his parents’wedding – where he was the best man. As part of the fundraising, Stockport Express reporter Peter Devine cycled from John O’Groatsto Land’s End.
The Salford AdvertiserThe Salford Advertiser ‘Christie appeal’ reached its target of £250,000 at Christmas. Readers jumped on board with a host of fundraisingevents to help the paper reach the target in just over a year.
Cash from the appeal will equip the proposed radiotherapy unitat Salford Royal Hospital with the ultimate specialist equipment. The facility will mean cancer patients will be able to access first class radiotherapy treatment closer to home. The £17 millionspecialist unit being built at the hospital is due to open next summer.
The JournalIn the North East, the Journal launched ‘Great North Revolution’,‘Go Global’ and ‘Case for the North East’ designed to highlight the region’s difficulties during the recession in terms boosting the region’s prosperity and preserving the identity of the region. High profilelobbying, local business support and collaboration with the CBI andNorth East Chamber of Commerce were highlights of the campaigns.
The Evening ChronicleDuring 2010, the Evening Chronicle Sunshine Fund raised £196,346to support children with disabilities in the North East region. £82,169worth of specialised equipment was purchased for 73 individualchildren and four organisations. The equipment varies from specialistindividual trikes to help with mobility to talking flowers for a sensorygarden. This support benefits the children and also their families and carers.
Evening Gazette and Evening ChronicleAcross the two titles more than 500 community groups have receiveda share of £100,000 through the ‘Wish’ campaign. ‘Wish’ benefitsnot-for-profit organisations that serve the local Teeside and Newcastlecommunities, ranging from schools and sports clubs to charities and community groups.
Community engagement
Campaigns and fundraisingCommunity engagement programmes throughout the Group are so widespread and embedded that we sometimes find it hard to keeptrack ourselves of what we are doing. The main reason for this is thatit is simply ‘what we do’. Our newspapers are integral to the lives of their readers and, particularly for our local and regional titles, aresimply part of the fabric of their local communities.
Activities range from large scale national events, such as the Pride of Britain Awards, to small, but nonetheless important, local projects. This report provides a snapshot of some of the numerous activities undertaken in 2010 across the Group and provides an insight into theability of communities to pull together, which is all the more impressive given these economically challenging times.
Below are some examples from the wide range of fundraising andawareness campaigns carried out during 2010 by our local, regional and national titles:
Local and regional titles
The Huddersfield Daily ExaminerA scheme launched by Adrian Sudbury, the late Huddersfield DailyExaminer journalist, aimed at educating young people about the importance of bone marrow donation has been hailed an‘outstanding success’ by an independent assessor. The ‘Register and Be a Lifesaver’ campaign, run by the Anthony Nolan Trust andNHS Blood and Transplant, was established after Adrian secured funding for a pilot project following a meeting with former PrimeMinister Gordon Brown. Adrian rose to public prominence as the ‘Baldy Blogger’ charting experience of his illness. He spent the lastfew months of his life campaigning for better education and information for young people on the importance of bone marrow donation. His legacy project continues and has so far trained 65volunteers to deliver seminars in sixth forms and colleges with over 120 presentations to 5,000 students. The project is being rolled out on a nationwide basis after a successful pilot in Bristol and South Yorkshire having secured funding for the next two years.
The Liverpool Echo and Daily PostIn the North West, The Liverpool Echo and Daily Post have built on the success of their official charity ‘Liverpool Unites’. Inspired by the way the city came together in support of murdered schoolboy Rhys Jones’ family, Liverpool Unites continues to support local charities and community groups across Merseyside that help young people to break the cycle of crime and poverty. Embodied by the purple ribbon symbol, a mix of the red and blue of the city’s two famous footballclubs, the charity has raised more than £250,000 in its first two years. In 2010, a donation from the Premier League of £20,000 to LiverpoolUnites was given to Fairbridge Merseyside to fund a new media suitefor their young people aged 13 to 25 who are out of education and employment. The Liverpool Unites Awards were held in July 2010 torecognise and reward children’s charities and community groups across Merseyside that positively engage and help vulnerable children and young people.
The Birmingham Mail
In the Midlands, the Birmingham Mail Charity Trust continued toraise funds from local readers and businesses to give out in grants to community groups. Fundraising events in 2010 included the Birmingham Mail Fun Run and the Santa Dash in December. All proceeds were given out in grants ranging from £500 to £2,000, with recipients ranging from inner city playgrounds to deprivedpensioners’ club day-trips.

Trinity Mirror plc 38 Annual Report & Accounts 2010
in the fifties and sixties. The Sunday Mirror continued to fight for the 3,000 surviving veterans and their families whose lives havebeen blighted with cancers, bone deformities and birth defects in their children.
The PeopleThe People raised awareness through their Fuel Poverty campaignby urging the Work and Pensions Department to pass on details to major power suppliers of those entitled to pension credits. As aresult of this campaign, the big six energy companies agreed to a £20 million deal giving 250,000 pensioner households rebateson electricity.
Similarly, The People was highly instrumental in persuading the Ministry of Defence to ensure that military ID can be used by troopsto prevent civilian ID such as passports or driving licences fallinginto the hands of rebel forces.
The Scottish Daily Record and the Sunday MailThe Scottish Daily Record and Sunday Mail supported Glasgow’sfourth annual Santa 5k Dash in January 2011. The fun run had beenscheduled to take place on 12 December but had to be postponedbecause of atrocious weather conditions. More than 3,000 peopledressed in Santa outfits to participate in a 5k around the streets of Glasgow. Daily Record staff participated, along with clients, local celebrities and Santa Dash patrons, Kenny and Marina Dalglish.£45,000 was raised in aid of The Marina Dalglish Appeal which has supports Nordoff-Robbins Music Therapy, The Prince and Princess of Wales Hospice in Glasgow and the Marie Curie Hospice in Stobhill. Kenny Dalglish, who helps organise the race, said: “It was an amazing sight seeing all the Santas running through Glasgow’s city centre on a quiet Sunday morning in January.”
The Group’s titles believe they are nothing if they are not part of the community, in the community and for the community in which theyare published.
Catch 22The Group continued its active support as co-sponsors of Catch 22, an initiative helping youngsters held back by a lack of qualifications orwork experience obtain the opportunities they deserve. In 2010 wegave 12 students work experience in our regional business in ourSouthern region offices and on the Daily Mirror. Further informationof the initiative can be found at www.catch-22.org.uk.
Employee volunteeringThe employee volunteering policy is to support those members of staff across the group who want to – or already do – take part involuntary activities in our local communities. We acknowledge thatvoluntary work with deserving good causes and initiatives is one of the most direct ways that we can engage with the community on alocal level, and we hope this policy will further strengthen ourconnections with the communities in which we operate.
Trinity Mirror Southern titlesA number of Trinity Mirror Southern titles (Surrey Herald Series, Ealing Gazette Series, Harrow Observer Series, Hounslow Chronicle Series and Staines News) partnered with Barclays Bank for a fifth year to runthe ‘Let’s Do It’ Community Awards across their titles. Barclays put up a prize fund across the titles to be awarded to local groups and charities to help them with community projects and events.
The Ealing Gazette ran their ‘Pride in Our People’ Community Awards in partnership with Thames Valley University to honour the unsungheroes across the boroughs of Ealing and Fulham and Hammersmith.
Reading PostThe Pride of Reading awards have gone from strength to strength since they began seven years ago. Hosted by Reading-bornChris Tarrant, the awards recognise community stalwarts, culturalchampions, creative businesses, restaurants and eateries, environmental projects and more. Winners included a small Reading business which joined Google and Microsoft in being the onlycompanies to do a multi-million pound deal to connect with Twitter’s ‘firehose’, BG Group for Business in Action and the organiser of Reading’s gay Pride festival.
National titles
Daily MirrorThe Daily Mirror’s prestigious Pride of Britain Awards 2010 returned for the 12th time in November. The glittering event has firmlyestablished itself as the most popular awards show on television. Almost seven million ITV viewers tuned in to watch the emotionally charged ceremony. The viewing figures were once again much higherthan for the Brits and the Baftas. It also received huge coverage on national and regional TV and radio, newspapers and glossy magazines. Prime Minister David Cameron said the awards “say so many great things about our country. They demonstrate the decency of the British people.”
HRH The Prince of Wales paid tribute to the nation’s incredibleunsung heroes. Children and adults who had performed acts of unbelievable courage, charity fundraisers, teachers, care workers, charity fund-raisers and members of the armed services were among those receiving awards. Sir David Jason even flew to Afghanistan to present a bomb disposal squad with their award. Footage of the visit was screened at the ceremony – which was sponsored by Littlewoods.com for the first time.
The Daily Mirror Youth Achievers Ball celebrated the achievements of marginalised teenagers in Northern Ireland. The black tie ball pays tribute to young people who have lived through trauma andchallenges most adults would baulk at, from health to caring responsibilities, poverty to abuse. Despite this, these youngsters work to make a real difference to their community. The ball at ParliamentBuildings, Stormont – which was held for the third year – recognised their efforts.
The Daily Mirror also became Age UK’s media partner in its Spread The Warmth campaign. The charity – formed after the merger of AgeConcern and Help The Aged – worked with the Daily Mirror to reduce the number of preventable winter deaths and to help more that350,000 older people live safer, healthier and more fulfilling lives.
The Sunday MirrorThe Sunday Mirror continued its long-running campaign for Britain’s forgotten nuclear test veterans. More than 20,000 servicemen witnessed hundreds of atom tests in Australia, US and South Pacific
Corporate responsibility report

Wh
o w
e a
reB
usin
ess r
evie
wG
ove
rna
nc
eF
ina
nc
ials
Trinity Mirror plc Annual Report & Accounts 2010 39
Risks and opportunitiesThe Group is not a multinational nor is it engaged in ‘heavy’ industry.It is not, therefore, exposed to some of the risks faced by those who operate in developing countries or at the sharp end of environmentalexposure. The greatest exposure for the Group would, therefore, be a procedural failure that led to a domestic failure of its environmental,health and safety or ethical policies. It is unlikely that a failure in any of these three areas would be catastrophic. The Group’s principal risksand uncertainties can be found on page 29.
The Board believes that the Group’s main exposure in this area wouldbe one of reputational damage. The procedure that the Group employs to control and manage these risks is through a regular review of its standards and systems and through training of relevantemployees and managers.
The Company’s Standards of Business Conduct are embedded within the culture of the Group. As stated earlier, the Company is currently reviewing all applicable policies prior to the proposed implementation of the Bribery Act 2010.
The Company believes that opportunities in these areas are similarly reputational. We believe that there are advantages to being seen as the employer of choice for those entering our industry, that decision having been made on an assessment, amongst many other things, of our corporate social responsibility programmes. Those programmes will also be key in the retention of staff. We also believe that there are obvious commercial advantages from being seen as a socially responsible company.
Paul VickersSecretary and Group Legal Director
3 March 2011

Trinity Mirror plc 40 Annual Report & Accounts 2010
Corporate governanceThe Board is committed to maintaining high standards of corporategovernance and recognises the importance of good corporate governance. Sound governance is central to achieving the directors’ prime objective of maximising shareholder value and comprises, principally, the processes by which the Group is directed and managed and how risks are identified and controlled.
This statement, together with the Remuneration Report on page 47, the Audit & Risk Committee Report on page 43, the NominationsCommittee Report on page 42 and the Directors’ Report set out on pages 53 to 55, describes how the Company has applied the relevant principles of the June 2008 Combined Code on Corporate Governance as issued by the Financial Reporting Council (FRC Combined Code).
The FRC Combined Code was replaced by the UK Corporate Governance Code (UK Code) which applies to financial years beginning on or after 29 June 2010. The Board has reviewed thecontent of the UK Code and has decided to adopt provision B.7.1 inrespect of directors being subject to annual election by shareholders. Each director will submit themselves for re-election by shareholdersat the 2011 Annual General Meeting to be held on 12 May 2011.
The Board believes that the Company complied with all of the FRC Combined Code provisions during the financial year ended 2 January 2011.
The role of the BoardThe Board is responsible for promoting the long-term success of the Company and for providing leadership within a framework of prudentand effective controls that enable risk to be assessed and managedand is accountable for the Group’s operations.
The Board has a formal schedule of matters reserved to it which includes:
– The Group’s strategic plans;
– Acquisitions or disposals;
– Capital expenditure;
– All financing matters;
– The annual budget and the review of operating and financial performance;
– Annual and half year financial results, annual report and accounts and interim management statements;
– Board, Company Secretary and Committee Chairmanappointments;
– Terms of reference for all Board Committees;
– Directors’ conflicts of interest; and
– Dividend policy.
Other specific responsibilities are delegated to Board committees, each of which has clear written terms of reference. The terms of reference for the Audit & Risk Committee, the Nomination Committee and the Remuneration Committee are available on the Company’s website at www.trinitymirror.com/our-company/corporate-governance.
The Chief Executive is responsible for the day-to-day leadership,operational and performance management of the Company withinthe strategy and plans agreed by the Board. This is implementedthrough the executive directors, Executive Committee and the rest of the management team.
The Board meets regularly and a schedule of attendance is shown below in respect of all Board and committee meetings during the year.
Table of attendance of meetings
Board
Audit& Risk
CommitteeRemuneration
CommitteeNominationCommittee AGM
Sly Bailey 10/10 4/4 5/5 2/2 1/1
Sir Ian Gibson 10/10 4/4 5/5 2/2 1/1
Gary Hoffman 10/10 4/4 5/5 2/2 1/1
Jane Lighting 9/10 4/4 4/5 2/2 1/1
Kathleen O’Donovan 9/10 4/4 4/5 2/2 1/1
Vijay Vaghela 10/10 4/4 – – 1/1
Paul Vickers 10/10 4/4 5/5 – 1/1
Laura Wade-Gery 8/10 4/4 4/5 2/2 1/1
Where a director was unable to attend a meeting, they were provided with all the papers and information relating to that meeting and were able to discuss issues with the Chairman and Chief Executive.
In 2010, the Board was scheduled to meet eight times, additional time was spent reviewing strategy and governance. Additional Board meetings are called as required and in total the Board met 10 times during the year. The Board holds meetings in regional offices which provides a valuable opportunity for the directors to further their understanding of the Group’s operations and key regions.
Board meetings are structured to allow open discussion and all directors participate in the discussion of strategy, trading, financial performance and risk management. Board papers are circulated in sufficient time before a meeting to enable full and informed discussion. Members of the wider Executive Committee attend Board meetings by invitation and make presentations regularly.
Committee membershipThe Board has agreed that all non-executive directors should serve as members of the Audit & Risk, Nomination and Remuneration committees. The Board believes that an increasing amount of work is undertaken by these committees and that a non-executive director can only properly fulfil his or her responsibilities if they are present during committee meetings and are able to follow the detail of discussion and debate held at those meetings. Similarly the Chairman, in addition to chairing the Nomination Committee, is a full member of the Remuneration Committee and attends meetings of the Audit & Risk Committee at the invitation of its chairman.
Chairman and Chief ExecutiveThe roles of the Chairman and Chief Executive are separated and their responsibilities are clearly established, set out in writing and agreed by the Board. The Chairman is responsible for ensuring that the directors receive accurate, timely and clear information and cultivating a boardroom culture for honest and effective debate enabling constructive contribution of all the non-executive directors.
DirectorsThere are currently eight directors: Chairman, Sir Ian Gibson; Chief Executive, Sly Bailey; Senior Independent Director, Gary Hoffman; two other executive directors; and three other non-executive directors. The directors’ biographies are set out on page 18 and illustrate the directors’ breadth of experience, which should ensure an effective Board to lead and direct the Group.
Wh
o w
e a
reB
usin
ess r
evie
wG
ove
rna
nc
eF
ina
nc
ials
Trinity Mirror plc Annual Report & Accounts 2010 41
Appointment and retirement of directorsThe appointment and replacement of directors is governed by the Company’s Articles of Association (the ‘Articles’), the FRC Combined Code, UK Code, the Companies Act 2006 and related legislation. The Articles may be amended by a special resolution approved by shareholders.
In accordance with the FRC Combined Code and the Articles, everydirector is subject to reappointment by shareholders at the firstopportunity following their appointment and subsequently must seek re-election at least once every three years. In support of the new provisions of the UK Code, all directors will seek re-election at the forthcoming Annual General Meeting. Further information is included in the Notice of Meeting.
The non-executive directors are appointed for an initial term of three years and may be invited to serve subsequent terms. Prior to seeking re-election by shareholders at the end of their initial term, the Nomination Committee meets to consider whether his or her performance continues to be effective and whether they demonstratea commitment to the role.
During the year, the Chairman and non-executive directors met without the executive directors being present. It is normal practice forthe non-executive directors to meet without the Chairman being present at least once a year to review the performance of the Chairman and such a meeting took place in 2010.
The Chairman and the non-executive directors have letters of appointment which are available for inspection at the registered office of the Company during normal business hours and at the place of the Annual General Meeting. The executive directors have service contracts which are similarly available for inspection at the registeredoffice and at the Annual General Meeting.
Directors’ indemnity and insuranceAs approved by shareholders at the Annual General Meeting held in 2008, the directors have the benefit of an indemnity which is aqualifying third-party indemnity provision as defined by Section 234 of the Companies Act 2006.
The Company maintains appropriate directors’ and officers’ liabilityinsurance for its directors and officers.
Company SecretaryAll directors have access to the advice and services of the Secretary and Group Legal Director, Paul Vickers, who is responsible for ensuring that Board procedures and applicable rules are observed.
The Company Secretary’s responsibilities include ensuring goodinformation flows to the Board and its committees and betweensenior management and the non-executive directors.
Training An assessment is made of any training needs on a director’s appointment and the appropriate training is provided. New directors are provided with background reading about the Group and detailsof Board procedures and other governance-related matters. A fulland individually tailored induction programme is provided for allnew directors.
Directors receive ongoing updates on relevant issues as appropriate, taking into account their individual qualifications and experience. The Company Secretary helps directors undertake any other professional development they consider necessary to assist them in carrying out their duties.
The Board participate in visits to key operational sites during the yearto gain a deeper insight into the Group’s operating environment.
Independent adviceThe directors may take independent professional advice if necessaryat the Company’s expense.
Director independenceThe Board believes that all its non-executive directors areindependent.
The Board believes that the Chairman was independent at the dateof his appointment. The Chairman has declared to the Company his other significant commitment, which is his Chairmanship of Wm Morrison Supermarkets plc. During the year, the Chairman was appointed as a non-executive member of PricewaterhouseCoopers LLP – Public Interest Board. The Board believes that he devotes sufficient time to the Company to properly and fully fulfil hisresponsibilities.
Gary Hoffman was, until October 2008, Group Vice Chairman of Barclays and an executive director of Barclays plc. Although the Company has connections with Barclays, the Company does not believe that this former connection affects Mr Hoffman’sindependence given the relationships were in areas outside of hisdirect control.
The Board has considered the effect of Paul Vickers’s roles as anexecutive director and Company Secretary and believes thatMr Vickers is able to maintain independence where required.The Chairman reviews Mr Vickers’s performance regularly andappropriate procedures are in place enabling him to perform and fulfil his duties accordingly.
Directors’ conflictsThe Board adopted a Conflicts Policy in October 2008 which provides a formal system for directors to declare conflicts to beconsidered for authorisation by those directors who have no interest in the matter. In deciding whether to authorise a potential or actual conflict, the non-conflicted directors are required to act in the waythey consider would be most likely to promote the success of theCompany and they may impose limits or conditions when givingauthorisation or subsequently if appropriate.
The Board applied the Conflicts Policy throughout 2010 and therelevant procedures for authorisation of potential or actual conflictswere followed. The Board agrees that there is currently nocompromise to the independence of any director arising from anexternal appointment or any outside commercial interest.
In addition to the availability of the Register of Conflicts at each Board meeting for review, an annual review has been conducted and theBoard will continue to monitor and review potential conflicts of intereston a regular basis.
Board performance evaluationThe Board has adopted a policy of engaging with external evaluationevery third year. The last formal external evaluation took place in2008 which was facilitated by Dr Tracy Long of Boardroom Review. This year, the Board participated in a formal evaluation of its ownperformance and that of its committees and individual directors by using an internal questionnaire. The results were presented anddiscussed at a Board meeting as part of a wider corporategovernance review. The review covered the roles and processes of the Board and its committees. Overall, it was concluded that theBoard and its committees continued to operate effectively with appropriate procedures in place.

Trinity Mirror plc 42 Annual Report & Accounts 2010
Corporate governance
Nomination CommitteeThe Nomination Committee is chaired by the Chairman. All thenon-executive directors and the Chief Executive are members.
The Committee meets as required to select and propose to the Board suitable candidates of appropriate calibre for appointment asdirectors. The Committee would normally expect to use the servicesof professional external headhunters to help in the search for and selection of candidates.
The Committee has due regard for the benefits of diversity on theBoard, including gender. The current composition of the Boardreflects this. As part of the board evaluation process, the Committeecontinues to identify and develop short-term contingencies for ensuring the Company maintains an appropriate balance of skills and experience.
The Committee has formal written terms of reference which arepublished on the Company’s website.
Administration CommitteeThe Administration Committee consists of the Chief Executive, Group Finance Director and Secretary and Group Legal Director and meets as necessary to deal with administrative matters of aday-to-day nature.
Accountability and audit operating and financial reviewThrough the reviews of the performance and financial position inthe Chairman and Chief Executive Statement on pages 12 to 17 and the Business review on pages 20 to 30 together with the Directors’report on pages 53 to 55, the Board seeks to present a balancedand understandable assessment of our position and prospects. The directors’ responsibility for the financial statements is set outon page 55.
Corporate governance compliance statementThe Company has complied throughout the financial year with the provisions set out in the FRC Combined Code.
Shareholder communicationsThe Company encourages two way communication with both its institutional and private investors and responds promptly to all queriesreceived orally or in writing. The Chief Executive and the Group Finance Director meet regularly with analysts and institutional shareholders.
The Board receive regular detailed reports on investor relations activities and any related issues concerning major shareholders.
Twice a year, the Investor Relations team produce a formal report forthe Board giving details of comment and feedback received fromanalysts and institutional investors.
The Company’s website is regularly updated and contains a wide range of information of interest to both institutional and private investors, including any announcements made by the Company to the London Stock Exchange as well as presentations of interim andannual presentations made to analysts.
In addition, on notification of a new substantial shareholder in the Company, the Chairman will write to the shareholder to offer ameeting. The Chairman meets with major shareholders as requested.
Audit & Risk CommitteeThe Audit & Risk Committee is chaired by Kathleen O’Donovan.Gary Hoffman, Jane Lighting and Laura Wade-Gery are members.
The Committee meets as required during the year to monitor, review and approve the internal audit plan, direct the internal audit functionand external auditors and to oversee the management of internal financial controls and risk management systems.
The Audit & Risk Committee report on pages 43 to 45 contains a more detailed description of the Committees’ role, responsibilities, activities and effectiveness during the year.
The Group Finance Director, other directors, the Group’s external auditors, internal auditors and other management, as appropriate,attend meetings of the Committee.
The Committee has formal written terms of reference which arepublished on the Company’s website.
Remuneration CommitteeThe Remuneration Committee is chaired by Jane Lighting. Othermembers of the Committee are; Sir Ian Gibson, Kathleen O’Donovan,Gary Hoffman and Laura Wade-Gery.
The Committee meets as required during the year to review the Company’s general policy on executive remuneration, the application of the policy to the remuneration and benefits of the executive directors, and to recommend and monitor the level and structure of remuneration for senior management.
The Remuneration report on pages 47 to 52 contains a more detailed description of the Company’s policies and procedures for executive remuneration. During the year, as appropriate, the Chief Executive and the Secretary and Group Legal Director have attended meetingsof the Committee but they do not participate in discussions on theirown remuneration.
The Committee has formal written terms of reference which arepublished on the Company’s website.

Wh
o w
e a
reB
usin
ess r
evie
wG
ove
rna
nc
eF
ina
nc
ials
Trinity Mirror plc Annual Report & Accounts 2010 43
Audit & Risk Committee report
The Audit & Risk Committee is chaired by Kathleen O’Donovan.Gary Hoffman, Jane Lighting and Laura Wade-Gery are members.
The Committee has identified its Chairman, Kathleen O’Donovan, as its primary member with recent and relevant financial experience.Kathleen is a Chartered Accountant and was a partner at Ernst & Young. She was for 12 years the Finance Director of BTR plc(subsequently Invensys). She has been Chairman of the AuditCommittee of a number of public companies.
Gary Hoffman also has extensive experience of the financial servicesindustry having spent 26 years with the Barclays group. He wasappointed Chief Executive of Northern Rock plc in October 2008 andis the former Group Vice Chairman of Barclays plc. He has recentlybeen appointed Chief Executive of NBNK Investments plc, effectiveon 1 May 2011.
Jane Lighting and Laura Wade-Gery each have considerablecommercial experience. Jane was Chief Executive of both Flextechplc and of the television company Five. Laura was appointed Chief Executive of Tesco.com in January 2004 and a director of TescoPersonal Finance plc. Laura has recently been appointed executive director of multi-channel E-commerce at Marks and Spencer plc.
The Group Finance Director, other directors, the Group’s externalauditors and the internal auditors, as appropriate, attend meetings of the Committee.
During the Board performance evaluation in 2010, the Board reviewed the composition and balance of the Committee and it issatisfied that the appropriate and relevant expertise and resourcesare available to effectively fulfil the accounting, audit and risk issues ithas to address during the year. The terms of reference provide authorisation for obtaining independent external advice at theCompany’s expense.
The website and the Company’s intranet also carry details of theCompany’s ‘whistleblower’ policy, which has been approved andimplemented by the Committee.
The Committee’s principal responsibilities are to:
– Monitor the integrity of the financial statements of the Companyincluding its annual and half year financial results, interimmanagement statements and any other formal announcement relating to its financial performance, reviewing significant financial returns to regulators and any financial information contained in certain other documents, such as announcements of a price sensitive nature;
– Review significant financial reporting issues and judgements;
– Recommend to the Board the appointment of the external auditor and approve their remuneration and terms of engagement;
– Monitor and review the external auditor’s independence, objectivity and effectiveness including considering relevant UK professional and regulatory requirements;
– Develop and implement policy on non-audit services from the external auditors, taking into account relevant ethical guidance;
– Review the Company’s procedures for handling allegations from whistleblowers;
– Review the Company’s internal financial control system and risk management system;
– Monitor and review the effectiveness of the internal audit function;
– Review and approve the remit of the internal audit function and ensure the function has the necessary resources and is able to meet appropriate professional standards for internal auditors;
– Review and approve the internal audit plan; and
– Approve the appointment and termination of the Director of Risk and Audit who is responsible for internal audit (with the agreement of the Committee this approval may be delegated to the Committee Chairman).
Going concern basis In accordance with LR 9.8.6(3) of the Listing Rules, and in determining whether the Group’s annual consolidated financial statements can be prepared on a going concern basis, the directors considered all factors likely to affect its future development, performance and its financial position, including cash flows, liquidity position and borrowing facilities and the risks and uncertainties relating to itsbusiness activities. These are set out in the Chairman and Chief Executive statement on pages 12 to 17, the Business review on pages 20 to 30 and in the notes to the consolidated financial statements, in particular notes 25, 26, 27 and 34.
The key factors considered by the directors were as follows:
– The implications of the challenging economic environment on theGroup’s revenues and profits. The Group undertakes forecasts and projections of trading and cash flows on a regular basis. Whilst this is essential for targeting performance and identifying areas of focus for management to improve performance and mitigate the possibleadverse impact of a deteriorating economic outlook, they also provide projections of working capital requirements;
– The impact of the competitive environment within which theGroup’s businesses operate. In particular, the Nationals operate in a highly competitive marketplace characterised by high levels of marketing expenditure and cover price discounting;
– The impact on our business of key suppliers (in particular newsprint)being unable to meet their obligations to the Group;
– The impact on our business of key customers being unable to meet their obligations for services provided by the Group;
– The continued fragmentation of media and the implications for our business;
– The potential actions that could be taken in the event that revenues are worse than expected, to ensure that operating profit and cash flows are protected; and
– The committed finance facilities available to the Group. The Group has access to overdraft facilities and a committed bank facility to meet day-to-day working capital requirements, which at the year end had undrawn facilities of £178.5 million. The bank facility is committed to June 2013 and drawings can be made with24 hours’ notice.
Having considered all the factors impacting the Group’s businesses, including downside sensitivities, the directors are satisfied that theGroup will be able to operate within the terms and conditions of theGroup financing facilities for the foreseeable future. The Group does not expect to have to refinance or renegotiate its facilities during the next 12 months.
The directors have a reasonable expectation that the Company and the Group have adequate resources to continue in operationalexistence for the foreseeable future. Accordingly, they continue to adopt the going concern basis in preparing the Group’s annualconsolidated financial statements.
Paul VickersSecretary and Group Legal Director
3 March 2011

Trinity Mirror plc 44 Annual Report & Accounts 2010
Corporate governance
The Committee is satisfied that there are no relationships (such as family, employment, investment, financial or business) between the auditor and the Company (other than in the ordinary course of business).
Private meetings were held with Deloitte LLP to ensure there were norestrictions on the scope of their audit and to discuss any items thatthe auditors did not wish to raise with the executive directors present.
The Committee reviewed and agreed the engagement letter from Deloitte LLP confirming their independence and objectivity. It alsoreviewed the scope of non-audit services provided by Deloitte LLP to ensure that there was no impairment of objectivity.
The Committee is satisfied that the level of fees payable in respectof audit services is appropriate for a group of its size and that aneffective audit was conducted during 2010. Further detailsconcerning external audit fees can be found in note 6 to theconsolidated financial statements.
Non-audit servicesThe Board has accepted the Committee’s recommendation on apolicy on the engagement of the external auditors to supply non-auditservices. The policy has been adopted by the Board and as a general rule the auditor will not be engaged to provide any additionalservices other than tax or accountancy advice and circulation audits. There may, however, be circumstances where it could be in theCompany’s and shareholders’ interests if the auditor was engaged.Such circumstances are likely to be relating to either exceptionaltransactions or deemed not to be of a material nature. In all cases, the engagement of the auditor for non-audit work must be approved in advance by the Committee Chairman.
The Board undertook a review of the effectiveness of all its Committees during the year, including the Committee, as part of theannual review related to Board performance as described above.
Internal controlThe directors are responsible for the Group’s established system of internal control and for reviewing its effectiveness. During the year theBoard has not been advised of any failings or weaknesses which were deemed to be significant. No system of internal control canprovide absolute assurance against material misstatement or loss.Such a system is designed to provide the directors with reasonable assurance that problems are identified on a timely basis and dealt with appropriately. The key procedures that have been establishedand designed to provide effective internal financial control are:
Management and organisational structureThe existing organisational structure is considered appropriate tothe size of the Group. This clearly identifies levels of delegated responsibility to operational management. The performance of senior management is regularly evaluated and individual employees’ responsibilities are clearly defined and communicated.
Financial reportingPart of the comprehensive management reporting discipline involvesthe preparation of detailed annual budgets by all operating units. These budgets are reviewed by the Executive Committee and areultimately summarised and submitted to the Board for approval.Weekly revenue and profit forecasts are received from all operatingunits followed by monthly management accounts, which are prepared promptly and reported against the approved budget.Consolidated monthly management accounts, including detailed profit analysis (with comparisons to budget, latest forecasts and prioryear together with a treasury report (including comparison to our financial covenants) are prepared providing relevant, reliable and up to date financial and other information to the Board. Profit and cash flowforecasts for the current year are prepared and submitted to the Board at quarterly intervals during the year.
The Committee receives any required information from managementin a timely manner and in formats which are comprehensible andsufficient to fulfil its responsibilities to shareholders and investors alike.
The Committee monitors and reviews the effectiveness of internalaudit activities, internal controls and risk management systems. The Committee has considered that the appropriate systems are in place, are adequate and are operating properly. The Committee has access to a risk map which details a description of the risks, an assessment of the impact on the business, probability of occurrence, management accountability, applicable policies, sources of assurance, risk factors and associated actions. It is a valuable source of information for reference and is regularly reviewed.
During 2010, principal risks were identified, assessed and reviewed by impact and probability. Further information within this report under the headings Internal Controls and Risk Management. The principal risks and uncertainties facing the business can be found on pages29 and 30 under the heading ‘Risks and uncertainties’.
During 2010, the following items were reviewed at the Audit & Risk Committee meetings:
– Reports and Financial Statements;
– Tax, Treasury and Contingent Liabilities;
– Internal Control and Risk Management;
– Review of External Auditors;
– Risk Map;
– Internal Audit Plan;
– External Audit Plan;
– Review of Accounting Standards Changes; and
– External Audit Fees.
The internal audit function focuses on enhancing the Group’s internal controls. It has a rolling programme of review which is approved by the Committee. The Director of Risk and Audit is highly qualified and has extensive experience of working at a senior level in largecompanies.
The Committee members are also members of the Remuneration Committee. The Committee believes that the Company’s remuneration policy is adequate for a group of this size and nature and that compensation policies and practices are appropriate formaintaining a robust control environment and do not put the Company at risk.
External auditors’ independence and non-audit work
The Committee has primary responsibility for makingrecommendations on the appointment, reappointment and removalof the external auditors.
The Committee recommended the reappointment of Deloitte LLPas external auditors following the annual external audit effectiveness review where the Committee concluded that the audit was fit forpurpose. Deloitte LLP audits all significant subsidiaries of the Group.
The current overall tenure of Deloitte LLP dates from 1999. Any decision to open the external auditor to tender is taken on therecommendation of the Committee based on the effectiveness review described below. There are no contractual obligations that restrict theCompany’s choice of auditor.
The external audit effectiveness review which was carried out by the Committee, with the help of the Director of Risk and Audit, dealt withexternal auditor independence, planning, expertise and resources,audit process and communication. The review was in the form of anextensive questionnaire which was sent to directors and senior managers across the Group. The results were analysed by the Director of Risk and Audit and a full report was submitted for review by the Committee. There were no adverse findings. The report as a whole was discussed with the external auditors.

Wh
o w
e a
reB
usin
ess r
evie
wG
ove
rna
nc
eF
ina
nc
ials
Trinity Mirror plc Annual Report & Accounts 2010 45
Audit & Risk Committee
The role of the Committee includes the review,update and approval of the annual internal audit plan, direction to the internal audit function, to external auditors and to management in the review of internal financial controls.
The Committee alerts the Board to anyemerging issues and considers the draft papers prepared for the annual review of effectiveness of the risk managementprocedures adopted by the Company prior tobeing submitted to the Board for approval.
Risk ManagementGroup
The Risk Management Group is formed of theExecutive Committee together with invited senior executives.
The Secretary and Group Legal Director co-ordinates the risk management activities of the Risk Management Group working closelywith members of the internal auditdepartment.
The agreed objectives for the risk management framework have been achievedduring the year and all significant risks have been reviewed. A risk map has beendeveloped and regularly updated to show the actions taken to minimise risks throughout the Group, the policies in force and the other sources of assurance upon which reliance is placed to mitigate risk.
Divisional and Groupfunctional key risks
To enable consistent and focused monitoring, reporting, evaluation and management of significant Group risks, the ExecutiveCommittee owner of each key risk and the relevant senior managers have reviewed the plans, actions and initiatives which have taken place or are underway and documented themin the risk map.
Year end compliancereporting
A formal process exists for year end risk management compliance reporting, requiring senior operating company, divisional and Group executive management to confirm their responsibilities for risk management andinternal control. Ultimate compliance reporting is required of each and every Board member.
Steps have been taken to embed internal control and risk management further into the operations of the business and todeal with areas of improvement which come to the attention of management and the Board. The Group’s systems of internal control are designed to manage rather than eliminate the risk of failure to achieve business objectives and can only provide reasonable and notabsolute assurance against material misstatement or loss.
Kathleen O’DonovanChairmanAudit & Risk Committee
3 March 2011
Investment appraisalWe have a clearly defined framework for capital expenditure which is controlled centrally. Appropriate authorisation levels and limits beyond which such expenditure requires the prior approval of the Capex Committee, consisting of the three executive directors and the Director of Group IT, or in certain circumstances, the Board, areclearly set. There is a prescribed format for capital expenditureapplications which places a high emphasis on the overall Group strategy or support for the expenditure and requires a comprehensiveand justified financial appraisal of the business case being put forward. All significant corporate acquisitions or investments are controlled by the Board or a Board sub-committee, and are subject to detailed investment appraisal and performance of due diligence procedures prior to approval by the Board.
Functional reporting A number of our key functions, including treasury, taxation, internal audit, risk management, litigation, IT strategy and development, environmental issues and insurance are dealt with centrally. Each of these functions reports to the Board on a regular basis, through the Chief Executive, Group Finance Director or Secretary and Group Legal Director, as appropriate. The treasury function operates within the terms of clearly defined policy statements. The policy statements exist to ensure that we are not exposed to any unnecessary risk and that where appropriate there is hedging against foreign currency and interest rate risks. The Committee reviews reports from management,the internal audit department and the external auditors to provide reasonable assurance that internal control procedures are in placeand are being followed. Formal procedures have been established for instituting appropriate action to correct weaknesses identified from the above reports.
Risk management An ongoing process for identifying, evaluating and managing thesignificant risks we face has remained in place throughout the year and up to the date of approval of this report. The process is subjectto regular review by the Board directly and by the Audit & Risk Committee.
The process accords with the Turnbull Guidance on Internal Control for directors, as applicable for this accounting period. Although the Board’s overall responsibility for internal control is recognised, the positive contribution made by senior management to theestablishment and ongoing development of risk managementwithin the Group is acknowledged.
In reviewing the effectiveness of our system of internal control, theBoard has taken into consideration a number of key elements, whichinclude financial controls, investment controls, management reporting and the various review, steering, policy and Board committees.
The following illustrate how the risk management process and the system of internal control operated during 2010:
Group Internal Audit The Director of Risk and Audit has recruited a skilled and experienced team to enable the agreed strategy to be fulfilled. During the year, the Internal Audit team was strengthened to include an experienced project manager and internal auditor to oversee the Company’s PCIDSS compliance.
The internal audit plan is risk based and has a focus on those areas which are critical to the achievement of business objectives.

Trinity Mirror plc 46 Annual Report & Accounts 2010
Remuneration at a glance Key points in 2010– third consecutive pay freeze for executive directors and senior
managers;
– review of current share scheme arrangements;
– the employee bonus scheme which had a Group operating profit target saw payments of 80% of potential to each participant; and
– senior managers and executive directors received bonus paymentsof up to 80% of potential for significant outperformance of Groupoperating profit targets.
Remuneration policyThe Group aims to provide remuneration packages that comprise competitive fixed pay packages and variable pay which provides the potential for significant rewards related to performance aligned with the Group’s strategic objectives and shareholder interests.
What are the principles of our remuneration policy?
Performance linkedA significant part of executive directors’ reward is determined by the Group’s success. Failure to achieve threshold levels of performanceresults in no payout under short or long-term incentives.
Shareholder alignedAligned with the Group’s strategic objectives, a considerable part of the reward is related to share price performance and is paid in sharesthat have to be retained until minimum shareholding requirementshave been met.
CompetitiveThe Group aims to provide remuneration packages that reward senior executives in relation to other relevant companies. The Company seeks to balance the ‘package’ for senior executives between rewarding short and long-term performance.
Who are our peer group companies?In setting remuneration, the Remuneration Committee, with itsadvisers, currently reviews arrangements for other listed companies and companies of a broadly similar size.
What are the component parts of reward?
Reward elementGroup
employees
SSenior managersand executivedirectors only
Fixed base salary ✓ ✓
Benefits including pensions ✓ ✓
Variable annual bonus ✓ ✓
Share awards ✗ ✓
How has the structure changed year on year for executive directors?
2010 reward
Base salary Held at 2008 levels
Annual cashbonus
No change to maximum % of base of 75% to110% for executive directors and 50% to 75% for
Executive Committee
Share awards LTIP award sizes reduced in 2010 and DSA potential increased. Approximate value
maintained. Should any new remuneration proposals be recommended they will be put to
shareholders at the 2011 AGM.
What did executive directors receive in 2010?
Base salary £’000
Benefits excluding
pension contribution
£’000
Annual cash bonus Total cash and cash
equivalents£’000
Potential£’000
Actual£’000
Sly Bailey 750 12 825 660 1,408
Vijay Vaghela 430 11 430 344 785
Paul Vickers 375 25 281 225 625
G d iGranted in 2010
Pension contributions
£’000Deferred
sharesPerformance
shares
Sly Bailey 248 286,693 600,901
Vijay Vaghela 106 140,046 258,388
Paul Vickers 126 91,600 225,338
How are the rewards structured?The relative weighting of each of the key elements of executive director remuneration for 2010 (excluding pension and benefits) by fairvalue is included in the table below and discussed in greater detail in the remuneration report.
87
Paul Vickers 54 20 11 15
Vijay Vaghela 49 25 13 13
Sly Bailey 46 25 13 16
0 20 40 60 75 100
Reward structure (%)
Base salary Cash Bonus DSA LTIP
Wh
o w
e a
reB
usin
ess r
evie
wG
ove
rna
nc
eF
ina
nc
ials
Trinity Mirror plc Annual Report & Accounts 2010 47
Committee activitiesDuring 2010, the Committee met to consider the followingremuneration issues:
– Review of best practice remuneration policy for executive directors,senior executives and all other staff;
– Review of external remuneration consultants;
– Review of long – and short-term incentive arrangements;
– Review of executive director and senior executive payarrangements;
– Approval of awards to be made under the Long Term Incentive Plan and Deferred Share Award Plan;
– Review of status of performance conditions attaching tooutstanding awards; and
– Approval of 2009 remuneration report.
Basic annual salaryBasic salaries are reviewed annually by the Committee. This reviewtakes into account individual performance, experience and marketcompetitiveness.
In relation to the salaries paid to executive directors and the Executive Committee, we continue to engage with the Committee’s principaladvisers to conduct an annual in-depth review of the competitiveness of total remuneration in comparison to executive directors and seniorexecutives at other listed media companies and other organisationsof a broadly similar size. In considering such data, the Committee isconscious of and keen to avoid the ‘ratchet’ effect that can be created by an over reliance on such comparative work.
In light of the economic climate, the challenging trading environmentand principal risks and uncertainties faced by the Group, a decision was taken not to increase base salaries for 2010. In addition, theexecutive directors requested that they did not receive salary increases in 2011. In 2011, base salaries of the executive directorswill therefore remain at their 2008 levels, of: Sly Bailey £750,000, Vijay Vaghela £430,000 and Paul Vickers £375,000.
Annual bonusThe Group operates an annual performance related bonus schemefor a number of senior executives including executive directors. This provides for annual cash bonuses up to a maximum of 110% of basesalary for Sly Bailey, 100% for Vijay Vaghela and 75% for Paul Vickers. Other members of the Executive Committee participate in the scheme with maximum potential of either 50% or 75%. Thesepayments do not form part of pensionable salary.
In 2010, to reflect the immediate and short-term issues facing the Group, the executive directors’ bonus criteria were linked wholly tobudgeted operating profit with the highly stretching budget figure being set significantly in excess of consensus market expectations at the time that it was approved by the Board. The outturn operatingprofit for 2010 of £123.3 million was approximately 17% in excess of the original consensus market expectations and resulted in a bonuspayment of up to 80% of the maximum potential. The Committee issatisfied that this level of bonus payment is justified by the excellent performance relative to both budget and market expectations.This performance was a result of considerable restructuring – building on the work in 2009 – and was delivered despite a tough trading environment.
The Remuneration CommitteeThe Remuneration Committee consists of Jane Lighting (Chairman),Sir Ian Gibson, Gary Hoffman, Kathleen O’Donovan and Laura Wade-Gery.
The Committee is a committee of the Board of Directors and has been established with formal terms of reference approved by the Board. A copy of the terms of reference are available on theCompany’s website www.trinitymirror.com/our-company/corporate-governance.
The Committee has authority to determine the appropriateremuneration, benefits and employment conditions for the executive directors. The Committee also monitors the level and structure of remuneration for senior management. The Committee sets theremuneration of the Chairman (the Chairman does not participate in any discussion of his remuneration). The Committee leads the Board’s discussion of remuneration issues for all staff.
The Committee fulfils its duties with a combination of both formal meetings and informal consultation with relevant parties internally, including the Chief Executive and the Secretary and Group Legal Director. During 2010, the Committee reviewed the appointment of its principal external consultants. Following a ‘beauty parade’,Kepler Associates were appointed with effect from October 2010. During 2010, the Committee met on five occasions.
The Committee and the Board have continued to pursue their objective to ensure that the remuneration policy is fully consistent with and supportive of the main strategic objectives of the Group, and move the Group further towards a performance culture, whilst ensuring that potential risks arising from remuneration arrangements are appropriately reviewed and controlled. In addition, the Committee is sensitive to the levels of the remuneration packages of otheremployees within the Group when deciding executive director pay.
Remuneration policyThe Company’s policy is to provide remuneration packages whichcomprise competitive fixed pay and variable pay which provides the potential for significant rewards related to performance which arealigned with the Group’s strategic objectives and shareholder interests. The aim is to provide remuneration packages that attract,motivate and retain senior executives by rewarding competitively in relation to other relevant companies.
The main components of each executive director’s remunerationpackage are basic annual salary and benefits, an annual bonusscheme linked to Group profit, share-based incentives linked to the delivery of shareholder value, and pension. Each element of remuneration has a specific role in achieving the aims of the remuneration policy and aligning the interests of executive directors with the interests of shareholders. The combined potential remuneration from annual cash bonus and long-term share-based incentives ensures that the balance of the executive remuneration package is weighted towards ‘at risk’ performance pay.
Remuneration report

Trinity Mirror plc 48 Annual Report & Accounts 2010
For the awards made in 2010, the vesting of the Performance Shareswill be determined by the Company’s three year Total Shareholder Return (TSR) performance compared to a group of 14 other media companies listed below:
Aegis Group plc Moneysupermarket.com Group plcBritish Sky Broadcasting plc Pearson plcDaily Mail and General Trust plc Reed Elsevier plcEuromoney Institutional Investor plc Rightmove plcInforma plc United Business Media plcITE Group plc WPP Group plcITV plc Yell Group plc
To determine whether the performance condition has been met, the TSR of each of the companies will be measured. The companies will then be ranked, in descending order, according to their TSR, and the performance shares will vest depending on the Company’s TSRranking as follows:
TTSR ranking of companyPercentage of
shares vesting (%)
9th to 15th (below median) 0
8th (median) 35
7th 50
6th 65
5th 80
4th 90
1st to 3rd 100
TSR is independently calculated for the Committee by its externaladvisers. Irrespective of TSR performance, before any vesting can occur the Committee must be satisfied that the underlyingperformance of the Company has been satisfactory throughout the relevant performance period.
Directors’ shareholdingA shareholding expectation was placed on the senior executives inconjunction with the LTIP. Within five years of the Annual General Meeting in 2004 or of the date of first appointment, senior executives are expected to build a holding in the Company’s shares equal to the following value of their salaries:
– Chief Executive: 150% of her salary;
– other executive directors: 100% of their salaries; and
– members of the Executive Committee: 30% or 50% of their base salary depending on the level of their bonus potential.
Executive directors are required to retain at least 50% of shares vesting (after tax) under the LTIP and DSAP until guideline is achieved.
The Board expects that non-executive directors will acquire shares equal in value to one times their annual fee during a period of threeyears from the date of their appointment.
Following a review and recognising the challenges facing the Group, the executive directors’ bonuses for 2011 will continue to be linked to Group operating profit. The targets themselves are not beingdisclosed at this stage for reasons of commercial sensitivity. 20% of potential will be payable for threshold performance, 50% of potential will be payable at target with 100% only payable at stretch. Payment of any bonus earned from profit performance is also dependent upon the executive director having achieved a satisfactory level of personal performance during the year in their performance anddevelopment review.
Deferred Share Award Plan (DSAP)An eligible employee may be granted an award of Deferred Sharesbased on a percentage of their previous year’s gross bonus. These shares are held in trust.
In 2010 each executive director received a grant of Deferred Sharesequal in value to 40% of his or her 2009 cash bonus. In 2011, as described in the 2009 Remuneration Report, the executive directors will receive a Deferred Share Grant equal to 60% of their actual cash bonus. The size of the Performance Share grant made under the LTIP in 2010 was reduced as a result. The Committee is currently reviewing the level of DSAP awards (which would normally be made in March 2012) in conjunction with the level of 2011 LTIP awards. Further details will be provided in the Notice of Annual GeneralMeeting.
If the employee remains employed by the Group, their award of Deferred Shares will normally become exercisable on the third anniversary following its date of grant. The DSAP is for key executives with the Company and is designed to help align their interests withthose of shareholders by awarding them a stake in the future success of the Company. At the point of vesting, all Deferred Share awards are capable of exercise at ‘nil cost’ to the participant.
Long Term Incentive Plan (LTIP)The LTIP was originally approved by shareholders at the Annual General Meeting in 2004. Shareholder approval was given at the Annual General Meeting in 2006 to modify and simplify the LTIP.
In any financial year an employee may be granted an award overPerformance Shares, the final vesting of which is subject to continuedemployment within the Group and satisfaction of a performance condition, as set out in the table below.
The normal maximum award of Performance Shares would be anaward over shares not exceeding 100% of that person’s base annual salary. However, in order to facilitate the recruitment of a particular eligible employee that higher figure may be increased to 200% of base annual salary. Following the increase in potential Deferred Shareawards for 2010 outlined above, the standard award policy wasreduced for 2010 with the Chief Executive receiving a Performance Share award worth 80% of base salary and the other executive directors receiving awards worth 60% of base salary.
Remuneration report

Wh
o w
e a
reB
usin
ess r
evie
wG
ove
rna
nc
eF
ina
nc
ials
Trinity Mirror plc Annual Report & Accounts 2010 49
Policy on external appointmentsThe Company acknowledges that its executive directors are likely tobe invited to become non-executive directors of other companies. The Committee believes that these non-executive duties can broaden the directors’ knowledge and experience to the benefit of theCompany. Executive directors are therefore, with the Board’spermission, allowed to accept one such appointment as long as there is no conflict of interest and to retain any fees.
Sly Bailey is a non-executive director and member of theremuneration committee of Ladbrokes plc for which she receives an annual fee of £50,000. Neither Vijay Vaghela or Paul Vickers currently hold any external directorships for which they receive any fees.
Performance graphsThe following graph illustrates the Company’s performancecompared to the FTSE 250 Index, which is considered the most appropriate form of ‘broad equity market index’ against which the Company’s performance should be measured. Performance, asrequired by legislation, is measured by TSR.
As the main comparator group for the Company shares is the FTSE350 Media Index, relative TSR performance compared to that groupis shown below.
Executive directors’ pension arrangementsSly Bailey receives an annual cash sum to use for pension purposes that is equivalent to 33% of base salary.
Until March 2010, Vijay Vaghela participated in the contributory MGN Pension Scheme, and accrued pension at the rate of 1/60th per year of service on salary up to the earnings cap referred to below until itclosed to future accrual on 31 March 2010. Thereafter he participated in the Trinity Mirror Pension Plan (a defined contribution plan) to whichhe contributes 9% and the Company 10% of his salary up to the earnings cap referred to below.
Until March 2010, Paul Vickers participated in the contributory Trinity Retirement Benefit Scheme as well as the non-contributory TrinityMirror plc Retirement Plan until they closed to future accrual on31 March 2010. Thereafter, he participated in the Trinity MirrorPension Plan (a defined contribution plan) to which he contributes 7% and the Company 8% of his salary up to the earnings cap referred to below.
In addition to their pensions, Vijay Vaghela’s and Paul Vickers’s spouses are entitled to pensions and lump sums payable if death occurs in service.
As Vijay Vaghela and Paul Vickers are subject to the earnings cap, they receive an annual cash sum equivalent to 30% of salary in excess of the cap.
Following ‘A’ day on 6 April 2006 the earnings cap applying to the pension benefits of Vijay Vaghela and Paul Vickers has been maintained by amending the rules of their respective pension schemes. The cap, currently £123,600, is normally increased every6 April at the discretion of the Company by reference to the RetailPrices Index (RPI) for September in the previous year.
During 2009, the Committee received legal advice that the obligationto provide Paul Vickers a pension of two thirds pensionable salary at age 60 was a direct contractual commitment on the Company entered into for full consideration by Paul Vickers when hisemployment contract was renegotiated after the merger of Trinity plcand Mirror Group plc. Paul Vickers has agreed that following theclosure of the schemes to future accrual, his pensions benefits are limited to his accrued benefits from the defined benefit schemes referred to above based on pensionable service to date of closure,and his capped final pensionable salary. As part of that arrangement,the Company agreed to pay Paul Vickers a cash supplement of 35%of his annual salary that is below the cap as amended from time to time.
Contracts of serviceEach of the executive directors has a service contract with the Company which can be terminated by either party giving one year’s written notice. If any executive director leaves service at the request of the Company (other than for gross misconduct) they will be entitled to receive predetermined compensation equal to 12 months’ basesalary and pension loss. Sly Bailey’s contract specifies that if the Company terminates her contract after six months of any financialyear the prescribed sum will include an amount equivalent to her pro-rata bonus entitlement for that period (subject to satisfaction of performance criteria and to be paid at the same time as otheremployees).
Paul Vickers’s contract is dated 28 April 2000, Sly Bailey’s contract is dated 9 December 2002 and Vijay Vaghela’s contract is dated 18 April 2003.
Company performance against FTSE 250 index
Trinity Mirror (Total return)
FTSE 250 index (Total return)
0 2005 2006 2007 2008 2009 2010
150
125
100
75
50
25
Company performance against FTSE 350 Media index
Trinity Mirror (Total return)
FTSE 350 Media index (Total return)
0 2005 2006 2007 2008 2009 2010
150
125
100
75
50
25
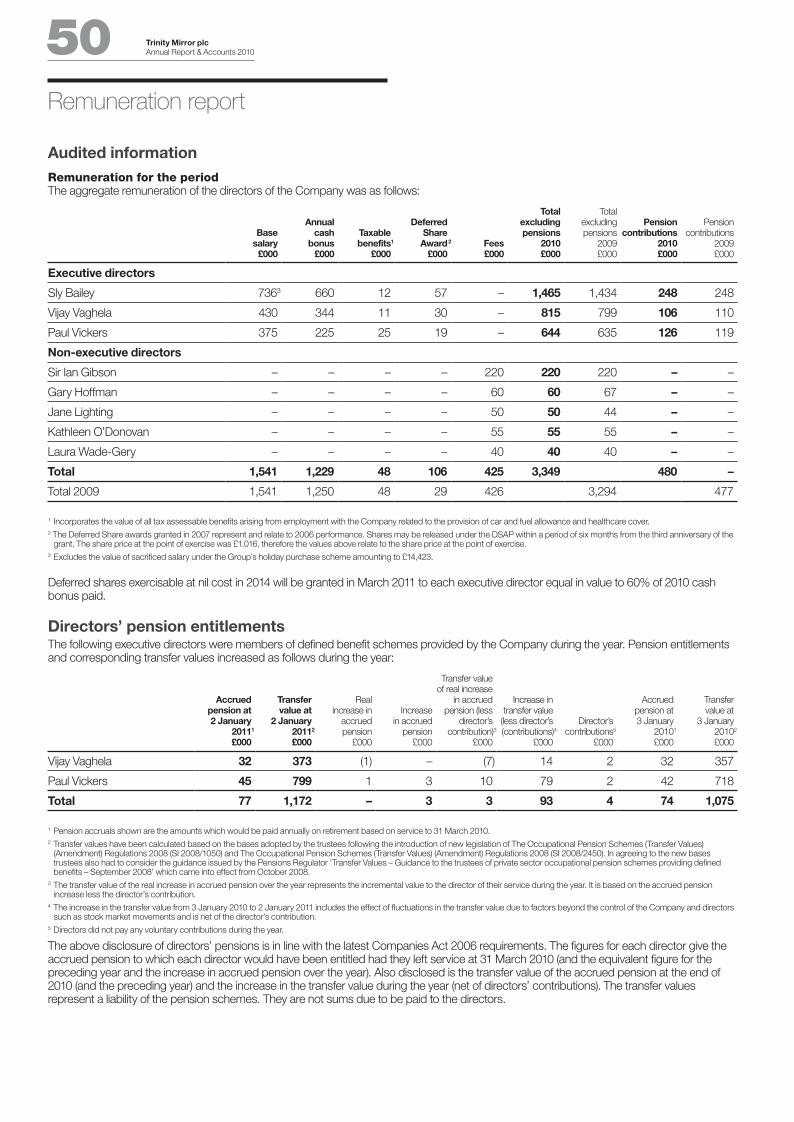
TrinityMirrorplc 50 AnnualReport&Accounts2010
AuditedinformationRemuneration for the periodTheaggregateremunerationofthedirectorsoftheCompanywasasfollows:
Basesalary
£000
Annualcash
bonus£000
Taxablebenefits1
£000
DeferredShareAward2
£000Fees£000
Totalexcludingpensions
2010£000
Totalexcludingpensions
2009£000
Pensioncontributions
2010£000
Pensioncontributions
2009£000
Executivedirectors
SlyBailey 7363 660 12 57 – 1,465 1,434 248 248
VijayVaghela 430 344 11 30 – 815 799 106 110
PaulVickers 375 225 25 19 – 644 635 126 119
Non-executivedirectors
SirIanGibson – – – – 220 220 220 – –
GaryHoffman – – – – 60 60 67 – –
JaneLighting – – – – 50 50 44 – –
KathleenO’Donovan – – – – 55 55 55 – –
LauraWade-Gery – – – – 40 40 40 – –
Total 1,541 1,229 48 106 425 3,349 480 –
Total2009 1,541 1,250 48 29 426 3,294 477
1IncorporatesthevalueofalltaxassessablebenefitsarisingfromemploymentwiththeCompanyrelatedtotheprovisionofcarandfuelallowanceandhealthcarecover.2TheDeferredShareawardsgrantedin2007representandrelateto2006performance.SharesmaybereleasedundertheDSAPwithinaperiodofsixmonthsfromthethirdanniversaryofthe
grant.Thesharepriceatthepointofexercisewas£1.016,thereforethevaluesaboverelatetothesharepriceatthepointofexercise.3ExcludesthevalueofsacrificedsalaryundertheGroup’sholidaypurchaseschemeamountingto£14,423.
Deferredsharesexercisableatnilcostin2014willbegrantedinMarch2011toeachexecutivedirectorequalinvalueto60%of2010cashbonuspaid.
Directors’pensionentitlementsThefollowingexecutivedirectorsweremembersofdefinedbenefitschemesprovidedbytheCompanyduringtheyear.Pensionentitlementsandcorrespondingtransfervaluesincreasedasfollowsduringtheyear:
Accruedpensionat2January
20111
£000
Transfervalueat
2January20112
£000
Realincreasein
accruedpension
£000
Increaseinaccrued
pension£000
Transfervalueofrealincrease
inaccruedpension(less
director’scontribution)3
£000
Increaseintransfervalue
(lessdirector’s(contributions)4
£000
Director’scontributions5
£000
Accruedpensionat3January
20101
£000
Transfervalueat
3January20102
£000
VijayVaghela 32 373 (1) – (7) 14 2 32 357
PaulVickers 45 799 1 3 10 79 2 42 718
Total 77 1,172 – 3 3 93 4 74 1,075
1Pensionaccrualsshownaretheamountswhichwouldbepaidannuallyonretirementbasedonserviceto31March2010.2TransfervalueshavebeencalculatedbasedonthebasesadoptedbythetrusteesfollowingtheintroductionofnewlegislationofTheOccupationalPensionSchemes(TransferValues)
(Amendment)Regulations2008(SI2008/1050)andTheOccupationalPensionSchemes(TransferValues)(Amendment)Regulations2008(SI2008/2450).InagreeingtothenewbasestrusteesalsohadtoconsidertheguidanceissuedbythePensionsRegulator‘TransferValues–Guidancetothetrusteesofprivatesectoroccupationalpensionschemesprovidingdefinedbenefits–September2008’whichcameintoeffectfromOctober2008.
3Thetransfervalueoftherealincreaseinaccruedpensionovertheyearrepresentstheincrementalvaluetothedirectoroftheirserviceduringtheyear.Itisbasedontheaccruedpensionincreaselessthedirector’scontribution.
4Theincreaseinthetransfervaluefrom3January2010to2January2011includestheeffectoffluctuationsinthetransfervalueduetofactorsbeyondthecontroloftheCompanyanddirectorssuchasstockmarketmovementsandisnetofthedirector’scontribution.
5Directorsdidnotpayanyvoluntarycontributionsduringtheyear.
Theabovedisclosureofdirectors’pensionsisinlinewiththelatestCompaniesAct2006requirements.Thefiguresforeachdirectorgivetheaccruedpensiontowhicheachdirectorwouldhavebeenentitledhadtheyleftserviceat31March2010(andtheequivalentfigurefortheprecedingyearandtheincreaseinaccruedpensionovertheyear).Alsodisclosedisthetransfervalueoftheaccruedpensionattheendof2010(andtheprecedingyear)andtheincreaseinthetransfervalueduringtheyear(netofdirectors’contributions).Thetransfervaluesrepresentaliabilityofthepensionschemes.Theyarenotsumsduetobepaidtothedirectors.
Remuneration report
014025_TriMir_31-55_v9.indd 50 06/04/2011 20:34

Wh
o w
e a
reB
usin
ess r
evie
wG
ove
rna
nc
eF
ina
nc
ials
Trinity Mirror plc Annual Report & Accounts 2010 51
Non-executive directorsThe remuneration of non-executive directors is determined by the Board. No director plays a part in any discussion about his or her ownremuneration. The Committee decided that the non-executive directors fees should remain unchanged at the current time.
The Chairman, Senior Independent Director and Committee Chairmen receive additional remuneration for providing these services to theCompany, effective 1 July 2005, as set out below:
£
Base fee 40,000
Additional fee for Chairman 180,000
Additional fee for Senior Independent Director 20,000
Additional fee for chairing committees:
– Audit & Risk Committee 15,000
– Remuneration Committee 10,000
The table below summarises the fee structure for 2010:
Chairman 220,000
Senior Independent Director 60,000
Chairman of Audit & Risk Committee 55,000
Chairman of Remuneration Committee 50,000
Other non-executive directors 40,000
The Chairman and non-executive directors have letters of appointment which set out the terms of their appointment and are available for inspection at the Company’s registered office and at the Annual General Meeting. They cannot participate in the annual bonus scheme or share schemes.
Interest in shares
Directors’ activity 4 January 2010 to 2 January 2011
Share option schemesThe following directors held options to purchase shares under the Group’s share option schemes. No grants have been made under these schemes since 2004 and no further grants will be made.
Options are exercisable between three and 10 years from the date of grant subject to the satisfaction of performance conditions. No optionsare exercisable unless the Group’s earnings per share growth exceeds inflation, measured by reference to the Retail Prices Index, plus an average of 2% per annum over a period of three years. 50% of each grant of an option to each individual is subject to a TSR comparisonagainst the FTSE Mid-250 index of companies on the date of grant. The other 50% is subject to a comparison of TSR with a group of about20 other media companies. No vesting will take place on either measure unless the Company’s ranking is at least median. For executive directors and other senior executives options to the value of 75% of base annual salary become exercisable at median performance with asliding scale to full vesting at 80th percentile performance. If the performance criteria are not fully satisfied after three years then they can be retested over a period of four, five and six years from the date of grant. The calculation of TSR has been performed independently by theexternal principal advisers.
Name Option price
Balance at3 January
2010Lapsed in year
Balance at2 January
2011 Exercisable between1
Sly Bailey 395.5p 184,348 – 184,348 Feb 2006 to Feb 2013
Vijay Vaghela 544.0p 10,951 10,951 – May 2003 to May 2010
470.5p 16,737 – 16,737 Apr 2005 to Apr 2012
Paul Vickers 544.0p 113,970 113,970 – May 2003 to May 2010
470.5p 135,069 – 135,069 Apr 2005 to Apr 2012
1 Exercisable between dates are the first possible exercisable date for these options – this does not mean that the options are exercisable as performance conditions have not necessarilybeen met.

52 52 Trinity Mirror plcTrinity Mirror plcTrinity Mirror plcTrinity Mirror plc 52 Annual Report & Accounts 2010Annual Report & Accounts 2010Annual Report & Accounts 2010Annual Report & Accounts 2010
Long-Term Incentive Plan (LTIP)Sly Bailey, Vijay Vaghela and Paul Vickers held 134,181, 61,340 and 54,439 options respectively to purchase shares under the LTIP relating to the award made in 2007 which lapsed during the year. A total of 249,960 LTIP awards lapsed accordingly.
The following directors held ‘nil cost’ options to purchase sharesunder the LTIP relating to awards made in 2008, 2009 and 2010:
PerformanceShare award
Number ofshares
Sh iShare price atdate of grant
Nominalvesting date
2008 Award
Sly Bailey 270,270 277.5p 14 March 2011
Vijay Vaghela 123,964 277.5p 14 March 2011
Paul Vickers 108,108 277.5p 14 March 2011
2009 Award
Sly Bailey 270,270 28.5p 3 April 2012
Vijay Vaghela 123,964 28.5p 3 April 2012
Paul Vickers 108,108 28.5p 3 April 2012
2010 Award
Sly Bailey 600,901 99.8p 28 May 2013
Vijay Vaghela 258,388 99.8p 28 May 2013
Paul Vickers 225,338 99.8p 28 May 2013
The 2010 award was granted on 28 May 2010. For an explanation concerning the LTIP and performance criteria, further information can be found on page 48.
Deferred Share Award Plan (DSAP)Sly Bailey, Vijay Vaghela and Paul Vickers held 56,174, 29,777 and 18,581 options respectively to purchase shares under the DSAP relating to the award made in 2007 which were exercised at ‘nil cost’ on 27 May 2010 at a share price of £1.016 at a total value of £56,735,£30,075 and £18,767 respectively.
The following directors held options to purchase shares under the Group’s DSAP relating to awards made in 2008 and 2010:
DeferredShare award
Number ofshares
SShare price atdate of grant
Nominalvesting date
2008 Award
Sly Bailey 114,321 277.5p 14 March 2011
Vijay Vaghela 59,387 277.5p 14 March 2011
Paul Vickers 37,553 277.5p 14 March 2011
2010 Award
Sly Bailey 268,693 99.8p 28 May 2013
Vijay Vaghela 140,046 99.8p 28 May 2013
Paul Vickers 91,600 99.8p 28 May 2013
There were no awards granted under the DSAP in 2009 to Sly Bailey, Vijay Vaghela and Paul Vickers. All Deferred Share awards are made at ‘nil cost’ to the participant. For an explanation concerning the DSAP, further information can be found on page 48.
During the year, the Committee agreed to accelerate the vesting date of the 2007 awards by three weeks to enable necessary procedural steps to be completed before Easter and personal income tax rates increased to 50% on 6 April 2010. The Committee decided that thiswas an appropriate step to make as the original vesting date wasprior to 6 April 2010 and that the acceleration was purely foradministrative ease.
Beneficial interestsDuring the year, the following directors completed purchases of ordinary shares in the Company. The table below details the purchases:
DirectorDate of
purchase
Number of shares
purchasedPrice
per share
Total beneficial
holdingfollowing
notification
Sir Ian Gibson 26 June 2010 26,854 £0.741 63,404
Sly Bailey 26 June 2010 33,724 £0.735 168,734
Vijay Vaghela 26 June 2010 13,490 £0.735 69,930
Paul Vickers 26 June 2010 13,490 £0.735 71,309
Gary Hoffman 12 November 2010 25,000 £0.85 37,000
The interests of the directors, all of which are beneficial, in theordinary shares of the Company are shown below:
2 January2011
3 January2010
Executive directors
Sly Bailey 168,734 107,374
Vijay Vaghela 69,930 41,792
Paul Vickers 71,309 48,684
Non-executive directors
Sir Ian Gibson 63,404 36,550
Gary Hoffman 37,000 12,000
Jane Lighting – –
Kathleen O’Donovan – –
Laura Wade-Gery – –
As beneficiaries under the T I H Employee Benefit Trust, the directorsare deemed to be interested in 90,855 ordinary shares held by theemployee benefit trust at 2 January 2011.
There were no movements between the year end and the date of this report.
The lowest price of the shares during the year was 64.5 pence as at 30 June 2010 and the highest price was 171.5 pence as at 11 January 2010. The share price as at 4 January 2011 was74.25 pence.
Approved by the Board of Directors and signed on its behalf by:
Jane LightingChairmanRemuneration Committee
3 March 2011
Remuneration report

Wh
o w
e a
reB
usin
ess r
evie
wG
ove
rna
nc
eF
ina
nc
ials
53 Trinity Mirror plcTrinity Mirror plc Annual Report & Accounts 2010Annual Report & Accounts 2010 53Directors’ report
Business reviewSection 417 of the Companies Act 2006 requires that the directorspresent a Business review in this report to inform shareholders of theCompany and help them assess how the directors have performed their duty to promote the success of the Company. The informationthat fulfils this requirement can be found in the sections set out below and is incorporated by reference into this report:
– the Chairman and Chief Executive statement on pages 12 to 17;
– the Business review including key performance indicators for each business on pages 20 to 30; and
– the statements concerning internal controls and risk management on pages 44 and 45.
These sections have been prepared to provide the Company’sshareholders with a fair review of the business of the Company and adescription of the principal risks and uncertainties facing it. It may notbe relied upon by anyone, including the Company’s shareholders, for any other purpose.
These sections of the annual report contain forward-lookingstatements. By their nature, forward-looking statements involve anumber of risks, uncertainties and future assumptions because theyrelate to events and/or depend on circumstances that may or maynot occur in the future and could cause actual results and outcomesto differ materially from those expressed in or implied by the forward-looking statements. No assurance can be given that the forward-looking statements will be realised. Statements about the directors’expectations, beliefs, hopes, plans, intentions and strategies areinherently subject to change and they are based on expectations and assumptions as to future events, circumstances and otherfactors which are in some cases outside the Company’s control.The information contained in these sections of the annual report have been prepared on the basis of the knowledge and informationavailable to directors at the date of its preparation and the Companydoes not undertake any obligation to update or revise the informationduring the financial year ahead. It is believed that the expectationsset out in these forward-looking statements are reasonable, but theymay be affected by a wide range of variables which could causeactual results or trends to differ materially. The forward-lookingstatements should be read in particular in the context of the specificrisk factors identified.
Shareholders should note that these sections have not been auditedor otherwise independently verified.
Statement of directors’ responsibilitiesThe directors are responsible for preparing the Annual Report and Accounts in accordance with applicable law and regulations.
Company law requires the directors to prepare financial statementsfor each financial year. Under that law the directors are required to prepare the consolidated financial statements in accordance with International Financial Reporting Standards (IFRS) as adopted by the European Union and Article 4 of the IAS Regulation and have electedto prepare the parent company financial statements in accordance with applicable law and United Kingdom Accounting Standards (United Kingdom Generally Accepted Accounting Practice). Under company law the directors must not approve the accounts unlessthey are satisfied that they give a true and fair view of the state of affairs of the Group or Company and of the profit or loss of theGroup or Company for that period.
In preparing the consolidated financial statements, InternationalAccounting Standard 1 requires that directors:
– properly select and apply accounting policies;
– present information, including accounting policies, in a manner that provides relevant, reliable, comparable and understandable information;
– provide additional disclosures when compliance with the specific requirements in IFRS are insufficient to enable users to understand the impact of particular transactions, other events and conditions on the entity’s financial position and financial performance; and
– make an assessment of the Company’s ability to continue as a going concern.
In preparing the parent company financial statements, the directorsare required to:
– select suitable accounting policies and then apply them consistently;
– make judgements and estimates that are reasonable and prudent;
– state whether applicable United Kingdom Accounting Standardshave been followed, subject to any material departures disclosed and explained in the financial statements; and
– prepare the financial statements on the going concern basis unless it is inappropriate to presume that the Company willcontinue in business.
The directors are responsible for keeping adequate accounting records that are sufficient to show and explain the Company’s transactions and disclose with reasonable accuracy at any time the financial position of the Company and enable them to ensure that theparent company financial statements comply with the Companies Act2006. They are also responsible for safeguarding the assets of the Company and hence for taking reasonable steps for the preventionand detection of fraud and other irregularities.
The directors are responsible for the maintenance and integrity of the corporate and financial information included on the Company’s website. Legislation in the United Kingdom governing the preparation and dissemination of financial statements may differ from legislationin other jurisdictions.
Trinity Mirror plc 54 Annual Report & Accounts 2010
Directors’ report
Group companies evolve their own consultative policies. Methods of communication used within the Group include staff forums, advisorycommittee meetings, newsletters, bulletins, pension trustee reports, management briefings and staff surveys.
Since January 2009, Paul Vickers, Secretary and Group LegalDirector, has been identified as the executive director with HumanResource responsibility.
Payment of suppliersWe have a supplier payment policy which provides for payment of allsuppliers (other than those with agreed alternative terms) at the monthend following the month of receipt of invoice. All companies within the Group are encouraged to make payments in accordance with those terms and conditions provided that the supplier has also compliedwith them. At 2 January 2011, the Group had an average of 36 days’ (2009: 33 days’) purchases outstanding in trade creditors.
Share capitalDetails of the movements in the Company’s called-up share capital including purchases of its own shares are included in note 29 to theconsolidated financial statements.
Substantial shareholdingsIn accordance with Rule 5 of the Disclosure and Transparency Rules, as at 3 March 2011, the Company had been notified of the followingbeneficial interests in its ordinary shares:
Number of shares Percentage Nature of holding
Schroders plc 40,923,929 15.88% Indirect interest
Standard LifeInvestments 35,976,036 13.96%
Direct andindirect
Aviva plc 22,194,892 8.61%Direct and
indirect
Royal London AssetManagement Limited 13,609,355 5.28% Direct interest
Blackrock Inc. 12,817,868 4.97% Indirect interest
JPMorgan AssetManagement (UK)Limited 12,666,887 4.92% Indirect interest
Old Mutual AssetManagers (UK) Ltd 12,556,497 4.87% Direct interest
Legal & General Group plc 10,291,384 3.99% Direct interest
Barclays plc 10,023,158 3.78% Indirect interest
Lloyds TSB Group plc 8,931,102 3.46%Direct and
indirect
All percentages are based on date of notification.
Principal activities and future development The principal activity of the Group is the publication and printing of newspapers and a growing portfolio of websites, primarily in the United Kingdom. The analysis of turnover and operating profit areincluded in notes 4 and 5 to the consolidated financial statements.
A review of our business and activities during the period is containedin the Chairman and Chief Executive statement on pages 12 to 17 and the Business review on pages 20 to 30.
Our strategic goal is to build a growing multi-platform media business, by developing and sustaining strong positions across print and digital, with products and services which meet the needs of our customers,both readers and advertisers.
Results and dividends The profit for the period attributable to equity holders of the parentwas £113.3 million (2009: £29.3 million). The directors do not propose a final dividend for the year and no interim dividend was declared(2009: no dividend). Retained profit for the period was £113.3 million (2009: £29.3 million).
Charitable and political donationsDuring the year contributions for charitable purposes totalled £50,000 (2009: £84,000), principally to various charities connected or associated with the newspaper, printing or advertising industries and local charities serving the communities in which we operate. No direct political contributions were paid during the period (2009: £nil). The editorial stance of our national titles, and in particular that of the Daily Mirror and the Daily Record, is politically left of centre and often supportive of the Labour Party. Although we do not make direct political donations, it has been in the best interests of the Daily Mirror and Daily Record to sponsor, on commercial terms, certain events in aid of the Labour Party. This is a practice that has beenfollowed for many years.
At the Company’s Annual General Meeting held in 2010, the Company and its subsidiaries received authority from shareholders under the Companies Act 2006 to make donations to political parties of up to £75,000 in aggregate per annum. In 2010 there were no such payments (2009: £nil).
Employment policies and employeesThe Group employs over 6,500 people in around 60 locations across the UK, including nine print sites. The Company is committed to increasing the service quality, profitability and efficiency of theCompany by attracting and recruiting the people who are best suitedto meet the standards for the role and the Company without regard to race, creed, colour, nationality (subject to legal eligibility), ethnic origin,religion, gender, age, sex change, sexual orientation, marital status, connections with a national minority, membership or non membership of a trade union or, unless justifiable, disability.
We pursue a policy of equal opportunities for all employees and potential employees. We have continued our policy of giving fair consideration to applications for employment made by disabledpersons bearing in mind the requirements for skills and aptitudefor the job. In the areas of planned employee training and career development, we strive to ensure that disabled employees receivemaximum possible benefits including opportunities for promotion.Every effort is made to ensure that continuing employment and opportunities are also provided for employees who become disabled.Within the limitations of commercial confidentiality and security, it is the policy of the Company to take views of employees into account in making decisions and wherever possible, to encourage the involvement of employees in the Group’s performance.

Wh
o w
e a
reB
usin
ess r
evie
wG
ove
rna
nc
eF
ina
nc
ials
55 Trinity Mirror plcTrinity Mirror plc Annual Report & Accounts 2010Annual Report & Accounts 2010 55
AuditorsEach of the persons who is a director at the date of approval of this Annual Report and Accounts confirms that:
– so far as the director is aware, there is no relevant audit information of which the Company’s auditors are unaware; and
– the director has taken all the steps that he or she ought to have taken as a director in order to make himself or herself aware of any relevant audit information and to establish that the Company’s auditors are aware of that information.
This confirmation is given and should be interpreted in accordancewith the provisions of section 418 of the Companies Act 2006.
Deloitte LLP have expressed their willingness to continue in office as auditors of the Company and their reappointment will be put toshareholders at the next Annual General Meeting.
Directors’ responsibility statementThe directors confirm to the best of their knowledge:
– the financial statements, prepared in accordance with the relevant financial reporting framework, give a true and fair view of the assets, liabilities, financial position and profit or loss of the Company and the undertakings included in the consolidation taken as a whole; and
– the Business review, includes a fair review of the development and performance of the business and the position of the Company and the undertakings included in the consolidation taken as a whole, together with a description of the principal risks and uncertainties they face.
By order of the Board
Paul VickersSecretary and Group Legal Director
3 March 2011
Corporate governance statementThe corporate governance statement, in accordance with Rule 7.2 of the Disclosure and Transparency Rules and Rule 9.8.6(5) and (6) of the Listing Rules, on page 42 forms part of this directors’ report.
DirectorsThe directors of the Company who served during the period, unlessstated otherwise, are listed below:
ExecutiveSly BaileyVijay VaghelaPaul Vickers
Non-executiveSir Ian Gibson CBE
Gary HoffmanJane LightingKathleen O’DonovanLaura Wade-Gery
Their remuneration is summarised on page 50 and details of the directors’ beneficial and non-beneficial interests in shares can be found on pages 51 and 52 in the remuneration report. Biographical details of each of the directors can be found on page 18.
The Board has decided to adopt the provision in the new UK Corporate Governance Code, whereby the entire Board should standfor re-election annually. Each director being eligible, therefore offers himself for re-election at the Annual General Meeting to be held on 12 May 2011.
Articles of AssociationThe Company’s Articles of Association may only be amended by a special resolution at a general meeting of the shareholders.
Issued share capitalAs at the date of this report, the Company’s issued share capital consists of 257,690,520 ordinary shares of 10 pence each.
Authorities granted at the Annual General Meeting in 2010At the Annual General Meeting in 2010, shareholders approved an authority for the Company to make market purchases of its own shares up to a maximum of 25,769,052 shares (being approximately 10% of the issued share capital) at prices not less than the nominal value of each share (being 10 pence each) and not exceeding 105%of the average mid-market price for the preceding five business days. No use was made of this authority during the year.
Annual General MeetingThe Annual General Meeting of Trinity Mirror plc will be held at the Hilton London Canary Wharf, Marsh Wall, London E14 9SH on12 May 2011. The Notice is given, together with explanatory notes, in the booklet which accompanies this report.

Trinity Mirror plc 56 Annual Report & Accounts 2010
Opinion on financial statementsIn our opinion the consolidated financial statements:
– give a true and fair view of the state of the Group’s affairs as at 2 January 2011 and of its profit for the 52 weeks then ended;
– have been properly prepared in accordance with IFRS as adopted by the European Union; and
– have been prepared in accordance with the requirements of the Companies Act 2006 and Article 4 of the IAS Regulation.
Opinion on other matter prescribed by the Companies Act 2006In our opinion the information given in the directors’ report for the 52 weeks ended 2 January 2011 for which the financial statements are prepared is consistent with the Group financial statements.
Matters on which we are required to report by exceptionWe have nothing to report in respect of the following:
Under the Companies Act 2006 we are required to report to you if, in our opinion:
– certain disclosures of directors’ remuneration specified by law are not made; or
– we have not received all the information and explanations we require for our audit.
Under the Listing Rules we are required to review:
– the directors’ statement contained within the corporate governancereport in relation to going concern; and
– the part of the corporate governance report relating to theCompany’s compliance with the nine provisions of the June 2008Combined Code specified for our review; and
– certain elements of the report to shareholders by the Board ondirectors’ remuneration.
Other matterWe have reported separately on the parent company financialstatements of Trinity Mirror plc for the 52 weeks ended 2 January2011 and on the information in the directors’ remuneration report thatis described as having been audited.
Panos Kakoullis (Senior Statutory Auditor)
for and on behalf of Deloitte LLP Chartered Accountants and Statutory AuditorLondon, UK
3 March 2011
Independent auditor’s report to the members of Trinity Mirror plcWe have audited the consolidated financial statements of Trinity Mirror plc for the 52 weeks ended 2 January 2011 which comprise the consolidated income statement, the consolidated statement of comprehensive income, the consolidated statement of changes in equity, the consolidated balance sheet, the consolidated cash flowstatement and the related notes 1 to 38. The financial reporting framework that has been applied in their preparation is applicablelaw and International Financial Reporting Standards (IFRS) as adopted by the European Union.
This report is made solely to the Company’s members, as a body, in accordance with Chapter 3 of Part 16 of the Companies Act 2006.Our audit work has been undertaken so that we might state to the Company’s members those matters we are required to state to them in an auditor’s report and for no other purpose. To the fullest extentpermitted by law, we do not accept or assume responsibility to anyone other than the Company and the Company’s members as a body, for our audit work, for this report, or for the opinions we have formed.
Respective responsibilities of directors and auditorAs explained more fully in the statement of directors’ responsibilityon page 53, the directors are responsible for the preparation of the consolidated financial statements and for being satisfied that they give a true and fair view. Our responsibility is to audit and express an opinion on the consolidated financial statements in accordance with applicable law and International Standards on Auditing (UK and Ireland). Those standards require us to comply with the AuditingPractices Board’s Ethical Standards for Auditors.
Scope of the audit of the financial statementsAn audit involves obtaining evidence about the amounts and disclosures in the financial statements sufficient to give reasonable assurance that the financial statements are free from materialmisstatement, whether caused by fraud or error. This includes an assessment of: whether the accounting policies are appropriate to the Group’s circumstances and have been consistently applied and adequately disclosed; the reasonableness of significant accounting estimates made by the directors; and the overall presentation of the financial statements.
Group consolidated accounts
Neither an audit nor a review provides assurance on the maintenance and integrity of the website, including controls used to achieve this, and in particular whether any changes may have occurred to the financial information since first published. These matters are the responsibility of the directors but no control procedures can provide absolute assurance in this area. Legislation in the United Kingdom governing the preparation and dissemination of financial information differs from legislation in other jurisdictions.

Wh
o w
e a
reB
usin
ess r
evie
wG
ove
rna
nc
eF
ina
nc
ials
Trinity Mirror plc Annual Report & Accounts 2010 57Consolidated income statementfor the 52 weeks ended 2 January 2011 (53 weeks ended 3 January 2010)
Notes2010
£m2009
£m
Revenue 4, 5 761.5 763.3
Cost of sales (393.2) (390.4)
Gross profit 368.3 372.9
Distribution costs (80.8) (81.1)
Administrative expenses:
Non-recurring items 8 20.7 (11.3)
Amortisation of intangible assets 15 (6.0) (7.1)
Other administrative expenses (164.9) (186.9)
Share of results of associates 17 0.7 0.5
Operating profit 138.0 87.0
Investment revenues 9 1.4 0.2
Pension finance charge 33 (7.1) (10.5)
Finance costs 10 (8.6) (34.7)
Profit before tax 123.7 42.0
Tax charge 11 (10.4) (12.7)
Profit for the period attributable to equity holders of the parent 113.3 29.3
Notes Pence Pence
Earnings per share
Adjusted earning per share* – basic 13 28.6 20.0
Adjusted earnings per share* – diluted 13 28.5 19.8
Earnings per share – basic 13 44.6 11.5
Earnings per share – diluted 13 44.5 11.4
* Adjusted items relate to the exclusion of non-recurring items, the amortisation of intangible assets, the retranslation of foreign currency borrowings, the impact of fair value changes on derivative financial instruments and the impact of tax legislation changes. A reconciliation between the adjusted result and the statutory result is provided in note 38 on page 99.
Notes2010
£m2009
£m
Profit for the period 113.3 29.3
Actuarial gains/(losses) on defined benefit pension schemes taken to equity 33 112.5 (105.7)
Tax on actuarial gains/(losses) on defined benefit pension schemes taken to equity 11 (30.4) 29.6
Deferred tax charge resulting from future change in tax rate (3.0) –
Share of items recognised in equity by associates 17 (1.6) (1.7)
Other comprehensive income/(costs) for the period 77.5 (77.8)
Total comprehensive income/(costs) for the period 190.8 (48.5)
Consolidated statement of comprehensive incomefor the 52 weeks ended 2 January 2011 (53 weeks ended 3 January 2010)

Trinity Mirror plc 58 Annual Report & Accounts 2010
Sharecapital
£m
ShShareredemption
premium£m
C i lCapitalredemption
reserve£m
Retainedearnings and
other reserves£m
Total£m
At 3 January 2010 (25.8) (1,120.5) (4.3) 661.4 (489.2)
Profit for the period – – – (113.3) (113.3)
Other comprehensive income for the period – – – (77.5) (77.5)
Total comprehensive income for the period – – – (190.8) (190.8)
Credit to equity for equity-settled share-based payments – – – (2.0) (2.0)
Purchase of own shares – – – 3.5 3.5
Refund of VAT on share issue costs – (1.1) – – (1.1)
At 2 January 2011 (25.8) (1,121.6) (4.3) 472.1 (679.6)
for the 53 weeks ended 3 January 2010
Sharecapital
£m
ShShareredemption
premium£m
C i lCapital redemption
reserve£m
Retained earnings and
other reserves£m
Total£m
At 28 December 2009 (25.8) (1,120.5) (4.3) 615.9 (534.7)
Profit for the period – – – (29.3) (29.3)
Other comprehensive costs for the period – – – 77.8 77.8
Total comprehensive costs for the period – – – 48.5 48.5
Credit to equity for equity-settled share-based payments – – – (3.0) (3.0)
At 3 January 2010 (25.8) (1,120.5) (4.3) 661.4 (489.2)
Consolidated statement of changes in equityfor the 52 weeks ended 2 January 2011

Wh
o w
e a
reB
usin
ess r
evie
wG
ove
rna
nc
eF
ina
nc
ials
Trinity Mirror plc Annual Report & Accounts 2010 59
Notes20 02010
£m2009
£m
Non-current assets
Goodwill 14 74.5 74.5
Other intangible assets 15 895.4 871.4
Property, plant and equipment 16 410.3 423.2
Investment in associates 17 5.4 6.3
Retirement benefit assets 33 61.1 –
Deferred tax assets 21 43.8 83.4
Derivative financial instruments 26 12.6 –
1,503.1 1,458.8
Current assets
Inventories 18 7.3 5.9
Trade and other receivables 19 99.4 95.6
Cash and cash equivalents 19 116.2 61.2
222.9 162.7
Total assets 1,726.0 1,621.5
Non-current liabilities
Borrowings 25 (226.1) (355.0)
Retirement benefit obligations 33 (222.1) (296.6)
Deferred tax liabilities 21 (318.3) (318.8)
Provisions 22 (8.1) (7.2)
Derivative financial instruments 26 – (2.9)
(774.6) (980.5)
Current liabilities
Borrowings 25 (137.8) –
Trade and other payables 20 (106.5) (115.6)
Current tax liabilities 11 (18.9) (23.0)
Provisions 22 (6.4) (10.1)
Derivative financial instruments 26 (2.2) (3.1)
(271.8) (151.8)
Total liabilities (1,046.4) (1,132.3)
Net assets 679.6 489.2
Equity
Share capital 28, 29 (25.8) (25.8)
Share premium account 28, 30 (1,121.6) (1,120.5)
Capital redemption reserve 28 (4.3) (4.3)
Retained earnings and other reserves 28 472.1 661.4
Total equity attributable to equity holders of the parent (679.6) (489.2)
These consolidated financial statements were approved by the Board of directors and authorised for issue on 3 March 2011. They weresigned on its behalf by:
Sly Bailey Vijay VaghelaChief Executive Group Finance Director
Consolidated balance sheetat 2 January 2011 (3 January 2010)
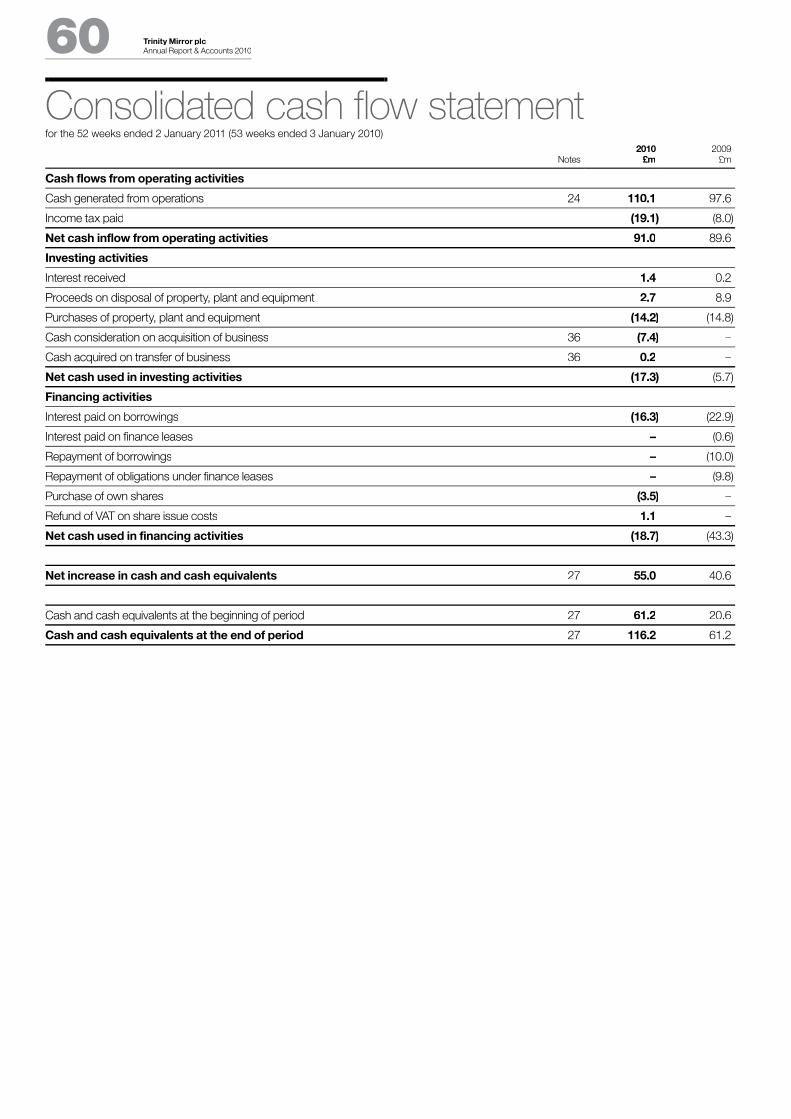
Trinity Mirror plc 60 Annual Report & Accounts 2010
Notes2010
£m2009
£m
Cash flows from operating activities
Cash generated from operations 24 110.1 97.6
Income tax paid (19.1) (8.0)
Net cash inflow from operating activities 91.0 89.6
Investing activities
Interest received 1.4 0.2
Proceeds on disposal of property, plant and equipment 2.7 8.9
Purchases of property, plant and equipment (14.2) (14.8)
Cash consideration on acquisition of business 36 (7.4) –
Cash acquired on transfer of business 36 0.2 –
Net cash used in investing activities (17.3) (5.7)
Financing activities
Interest paid on borrowings (16.3) (22.9)
Interest paid on finance leases – (0.6)
Repayment of borrowings – (10.0)
Repayment of obligations under finance leases – (9.8)
Purchase of own shares (3.5) –
Refund of VAT on share issue costs 1.1 –
Net cash used in financing activities (18.7) (43.3)
Net increase in cash and cash equivalents 27 55.0 40.6
Cash and cash equivalents at the beginning of period 27 61.2 20.6
Cash and cash equivalents at the end of period 27 116.2 61.2
Consolidated cash flow statementfor the 52 weeks ended 2 January 2011 (53 weeks ended 3 January 2010)

Wh
o w
e a
reB
usin
ess r
evie
wG
ove
rna
nc
eF
ina
nc
ials
Trinity Mirror plc Annual Report & Accounts 2010 61
The Group has adopted new, revised and amended standards andinterpretations during the current financial period which have had nomaterial impact on the Group:
IFRS 2 (Revised) Share-Based Payment: Vesting Conditionsand Cancellations
IFRS 5 (Revised) Non-current Assets Held for Sale andDiscontinued Operations
IFRS 7 (Revised) Financial Instruments: DisclosureIAS 7 (Amended) Statement of Cash FlowsIAS 16 (Amended) Property, Plant and EquipmentIAS 17 (Amended) LeasesIAS 19 (Amended) Employee BenefitsIAS 20 (Amended) Government Grants and Disclosure of
Government AssistanceIAS 23 (Amended) Borrowing CostsIAS 27 (Revised) Consolidated and Separate Financial
StatementsIAS 28 (Amended) Investments in AssociatesIAS 29 (Amended) Financial Reporting in Hyperinflationary
EconomiesIAS 31 (Amended) Investments in Joint VenturesIAS 32 (Amended) Financial Instruments: PresentationIAS 36 (Amended) Impairment of AssetsIAS 38 (Amended) Intangible AssetsIAS 39 (Amended) Financial Instruments: Recognition
and MeasurementIAS 40 (Amended) Investment PropertyIAS 41 (Amended) AgricultureIFRIC 14 (Issued) The Limit on a Defined Benefit Asset, Minimum
Funding Requirements and their InteractionIFRIC 15 (Issued) Agreements for the Construction of Real EstateIFRIC 17 (Issued) Distributions of Non-cash Assets to OwnersIFRIC 18 (Issued) Transfers of Assets from Customers
At the date of approval of these consolidated financial statements thefollowing new and revised standards and interpretations, which have not been applied and when adopted will have no material impact on the Group, were in issue but not yet effective:
IFRS 7 (Amendment) ‘Financial Instruments’ – effective forperiods starting on or after 1 July 2011
IFRS 9 (Issued) ‘Financial Instruments’ – effective for periods starting on or after 1 January 2013
IAS 12 (Amendment) ‘Deferred Tax’ – effective date to beconfirmed early 2011
IAS 24 (Revised) ‘Related Party Disclosures’ – effective for periods starting on or after 1 January 2011
IAS 32 (Amended) ‘Classification of Rights Issues’ – effective for periods starting on or after 1 February 2010
IFRIC 14 (Amended) ‘Prepayments of a Minimum Funding Requirement’ – effective for periods starting on or after 1 January 2011
IFRIC 19 (Issued) ‘Extinguishing Financial Liabilities with Equity Instruments’ – effective for periods starting on or after 1 July 2010
In addition, improvements to IFRS (May 2010) is effective for periods starting on or after 1 January 2011, which when adopted will have nomaterial impact on the Group.
1 General informationTrinity Mirror plc is a company incorporated in England and Wales and listed on the London Stock Exchange. The Company’s registered number is 82548. The address of the registered office is One Canada Square, Canary Wharf, London E14 5AP. The principal activities of theGroup are discussed in the Business Review on pages 20 to 30.
These consolidated financial statements were approved for issue by the Board of directors on 3 March 2011. The 2010 Annual Reportand Accounts will be made available on the Company’s website atwww.trinitymirror.com, at the Company’s registered office and sentto shareholders in early April 2011.
2 Adoption of new and revised standardsThe Group has adopted new, revised and amended standards during the current financial period which have had the following impact onthe Group:
IAS 1 (Amended) ‘Presentation of Financial Statements’. This is a presentational change only, affecting the titles and positioning of items within the financial statements. It has no impact on reported profitsor total equity.
IFRS 3 (Revised) ‘Business Combinations’. IFRS 3 introduces a number of changes in a number of areas, including the requirementto recognise changes in contingent consideration in the incomestatement rather than as an adjustment to goodwill, the requirementto recognise contingent liabilities at fair value and the requirement to expense acquisition costs as incurred rather than treating them as part of the costs of the acquisition. Business combinations executedprior to the current financial period and the resolution of related issues, are dealt with under the preceding version of the standardas previously applied by the Group. The revised standard has been applied to acquisitions during the period.
IFRS 8 ‘Operating Segments’. IFRS 8 requires operating segments to be identified on the basis of internal reports about components of the Group that are regularly reviewed by the Board and chief operating decision maker to allocate resources to the segments and to assesstheir performance. This has not led to a change in the operating segments but has impacted disclosure.
Notes to the consolidated financial statements for the 52 weeks ended 2 January 2011 (53 weeks ended 3 January 2010)

Trinity Mirror plc 62 Annual Report & Accounts 2010
3 Accounting policiesThe principal accounting policies adopted in the preparation of these consolidated financial statements are set out below. These policieshave been consistently applied to all years presented except for the changes in note 2 on page 61.
International Financial Reporting Standards (IFRS)The Group has adopted standards and interpretations issued by the International Accounting Standards Board (IASB) and the International Financial Reporting Interpretations Committee (IFRIC) of the IASB thatare relevant to its operations as adopted by the European Union (EU).
Individual standards and interpretations have to be adopted by the EU and the process leads to a delay between the issue and adoption of new standards and interpretations and in some cases amendments by the EU.
The parent company financial statements of Trinity Mirror plc for the 52 weeks ended 2 January 2011, prepared in accordance with applicable law and United Kingdom Accounting Standards, arepresented on pages 100 to 109.
Basis of preparationThese consolidated financial statements have been prepared on a going concern basis as set out on page 43 of the corporate governance report.
For administrative convenience, the consolidated financial statementsare made up to a suitable date near the end of the calendar year.
These consolidated financial statements have been prepared for the 52 weeks ended 2 January 2011 and the comparative period has been prepared for the 53 weeks ended 3 January 2010. The additional weeks trading in the 53 weeks ended 3 January 2010included revenue of £9.9 million and operating profit of £4.2 million.
The Group has revised the classification of items of expenditure between cost of sales, distribution costs and administrative expensesto better reflect the nature of the costs. In the current period, £13 million of costs have been included in cost of sales and £4 million of costs have been included in distribution costs which would havepreviously been reported in administrative expenses.
Basis of accountingThese consolidated financial statements have been prepared inaccordance with International Financial Reporting Standards (IFRS)and IFRIC interpretations as adopted by EU and with those parts of the Companies Act 2006 applicable to groups reporting under IFRS. The consolidated financial statements have been prepared under the historical cost convention as modified by the revaluation of freehold properties which on transition to IFRS were deemed to be the costof the asset. A summary of the more important Group accounting policies is set out below.
Basis of consolidationThe consolidated financial statements incorporate the financial statements of Trinity Mirror plc and all entities controlled by it for the 52 weeks ended 2 January 2011. Control is achieved where the Company has the power to govern the financial and operatingpolicies of an entity so as to obtain benefits from its activities. All intra-group transactions, balances, income and expenses are eliminated on consolidation.
On the acquisition of a business, including an interest in anassociated undertaking or a joint venture, fair values are attributedto the Group’s share of the identifiable assets and liabilities of the business existing at the date of acquisition and reflecting theconditions as at that date. Where necessary, adjustments are made to the financial statements of businesses acquired to bring their accounting policies in line with those used in the preparation of the consolidated financial statements.
Results of businesses are included in the consolidated incomestatement from the effective date of acquisition and in respect of disposals up to the effective date of relinquishing control.
Business combinationsAcquisitions of subsidiaries and businesses are accounted for usingthe acquisition method. The consideration for each acquisition is measured at the aggregate of the fair value (at the acquisition date) of assets given, liabilities incurred or assumed and equity instruments issued by the Group in exchange for control of the acquiree.Acquisition related costs are recognised in the profit or loss account as incurred.
Where applicable, the consideration for the acquisition includesany asset or liability resulting from a contingent considerationarrangement, measured at its acquisition date fair value. Subsequent changes in such fair values are adjusted against the cost of acquisition where they qualify as measurement period adjustments.All other subsequent changes in fair value of contingent consideration classified as an asset or liability are accounted for in accordancewith the relevant IFRS. Changes in the fair value of contingentconsideration classified as equity are not recognised.
Investment in associatesAssociates are all entities over which the Group has significantinfluence but not control and are accounted for by the equity method of accounting, initially recognised at cost. The Group’s share of itsassociates’ post-acquisition profits or losses is recognised in theconsolidated income statement, and its share of post-acquisitionmovements in reserves is recognised in the consolidated statementof comprehensive income.
Joint venturesThe Group has joint venture arrangements where separate entities have been established. In each entity the Group or one of its subsidiaries has an interest and along with other ventures jointlycontrols these entities. When material, the Group reports its interest in jointly controlled entities using equity accounting and its share of the entities’ profit or loss is accounted for as a single entry in theconsolidated income statement. Where the Group transacts with itsjointly controlled entities, unrealised profits and losses are eliminatedto the extent of the Group’s interest in the joint venture.
Notes to the consolidated financial statements continued

Wh
o w
e a
reB
usin
ess r
evie
wG
ove
rna
nc
eF
ina
nc
ials
Trinity Mirror plc Annual Report & Accounts 2010 63
Revenue recognitionRevenue is measured at the fair value of the consideration received,net of applicable discounts and value added tax. Advertising revenueis recognised upon publication. Circulation revenue is recognised at the time of sale. Printing revenue is recognised when the service isprovided. Digital revenue is recognised over the period of the onlinecampaign. Other revenue including leaflets and events revenue is recognised at the time of sale or provision of service. Rentals receivable under operating leases are credited to the consolidated income statement on a straight-line basis over the lease term.Interest income from bank deposits is recognised on an accrualsbasis. Dividend income from investments is recognised when theshareholders’ rights to receive payment have been established.
LeasesLeases are classified as finance leases whenever the terms of the lease transfer substantially all the risks and rewards of ownershipto the Group. All other leases are classified as operating leases. Assets held under finance leases are recognised at their fair value at the inception of the lease or, if lower, the present value of the minimum lease payments. The asset is recognised within property,plant and equipment and the corresponding liability to the lessor is included within obligations under finance leases. Lease payments are apportioned between finance charges which are chargedto the consolidated income statement and reductions in thelease obligation.
Rentals payable under operating leases are charged to theconsolidated income statement on a straight-line basis over the leaseterm. Benefits received as incentives to enter into the agreement arespread on a straight-line basis over the lease term.
Foreign currencyTransactions denominated in foreign currencies are translated atthe rates of exchange prevailing on the date of the transactions. At each reporting date, items denominated in foreign currencies are retranslated at the rates prevailing on the reporting date. Exchange differences arising on settlement and on retranslation are included in the consolidated income statement for the period.
Retirement benefitsThe Group operates a number of defined benefit pension schemes,all of which have been set up under trusts that hold their financialassets separately from those of the Group and are controlled by the trustees.
The amount recognised in the balance sheet in respect of defined benefit pension schemes is the present value of the defined benefitobligation at the reporting date less the fair value of scheme assets, together with adjustments for unrecognised actuarial gains or lossesand past service costs. The resultant liability or asset of each scheme is included in non-current liabilities or non-current assets asappropriate. The defined benefit obligation is calculated at each reporting date by independent actuaries using the projected unitcredit method. The present value of the defined benefit obligation is determined by discounting the estimated future cash outflows using interest rates of high quality corporate bonds approximating to theterms of the related pension liability. Unrealised gains and losses arerecognised in the consolidated statement of comprehensive income.
Payments to defined contribution pension schemes are charged asan expense as they fall due.
3 Accounting policies continued
GoodwillGoodwill arising on the acquisition of an entity represents the excess of the cost of acquisition over the Group’s interest in the fair value of the identifiable assets and liabilities of the entity recognised at the date of acquisition. Goodwill is initially recognised as an asset at cost and is subsequently measured at cost less any accumulated impairment losses. Negative goodwill arising on an acquisition is recogniseddirectly in the consolidated income statement upon acquisition.
Goodwill is reviewed for impairment either annually or more frequently if events or changes in circumstances indicate a possible decline in the carrying value.
For the purpose of impairment testing, assets are grouped at the lowest levels for which there are separately identifiable cash flows,known as cash-generating units. If the recoverable amount of thecash-generating unit is less than the carrying amount of the unit, the impairment loss is allocated first to reduce the carrying amount of any goodwill allocated to the unit and then to the other assets of the unit,pro-rated on the basis of the carrying amount of each asset in the unit, but subject to not reducing any asset below its recoverableamount. An impairment loss recognised for goodwill is not reversed in a subsequent period.
On disposal of a subsidiary, associate or jointly controlled entity, theremaining amount of goodwill is included in the determination of theprofit or loss on disposal.
Other intangible assetsOther intangible assets comprise acquired publishing rights and titlesin respect of print publishing activities and customer relationships and domain names in respect of online activities. On acquisition, the fair value of other intangible assets is calculated based on discounted cash flows. On disposal of an entity or closure of a title, the carrying amount of the related intangible asset is de-recognised and the gain or loss arising from de-recognition, determined as the differencebetween the net disposal proceeds, if any, and the carrying amount of the item, is recognised in the consolidated income statement.
Publishing rights and titles are initially recognised as an asset at fair value with an indefinite economic life. They are not subject toamortisation. For the purpose of impairment testing, assets are grouped at the lowest levels for which there are separately identifiablecash flows, known as cash-generating units. Where the asset does not generate cash flows that are independent from other assets,value in use estimates are made based on the cash flows of the cash-generating unit to which the asset belongs. The publishingrights and titles are reviewed for impairment either at each reporting date or more frequently when there is an indication that the recoverable amount is less than the carrying amount. Recoverable amount is the higher of fair value less costs to sell and value in use. In assessing value in use the estimated future cash flows of the cash-generating unit relating to the asset are discounted to theirpresent value using a post-tax discount rate that reflects currentmarket assessments of the time value of money and risks specific to the asset for which estimates of future cash flows have not beenadjusted. If the recoverable amount of a cash-generating unit is estimated to be less than its carrying amount, the carrying value of the cash-generating unit is reduced to its recoverable amount. An impairment loss is recognised in the consolidated income statement in the period in which it occurs and may be reversed in subsequent periods.
Customer relationships and domain names are amortised using the straight-line method over the expected life over which those assets will generate revenues and profits for the Group and are tested for impairment at each reporting date.
Costs incurred in the development and maintenance of websitesare only capitalised if the criteria specified in IAS 38 Intangible Assetsare met.

Trinity Mirror plc 64 Annual Report & Accounts 2010
InventoriesInventories are stated at the lower of cost and net realisable value. Cost represents materials, direct labour and production overheads.Cost is calculated using the first in first out method.
Financial instrumentsFinancial assets and financial liabilities are recognised in theconsolidated balance sheet when the Group becomes a party tothe contractual provisions of the instrument.
Trade receivablesTrade receivables do not carry any interest. Conversion to a readilyknown amount of cash occurs over a short period and is subjectto an insignificant risk of changes in value. Therefore balances are stated at their nominal value as reduced by appropriate allowancesfor estimated irrecoverable amounts.
Cash and cash equivalentsCash and cash equivalents comprise cash in hand and demanddeposits.
BorrowingsSterling interest bearing loans and bank overdrafts are recorded atthe proceeds received, net of direct issue costs. Foreign currencyinterest bearing loans are recorded at the exchange rate at thereporting date. Finance charges, including premiums payable onsettlement or redemption and direct issue costs, are accounted for on an accruals basis in the consolidated income statement using theeffective interest method and are added to the carrying amount of the instrument to the extent that they are not settled in the periodin which they arise. All other borrowing costs are recognised inthe consolidated income statement in the period in which they are incurred.
Derivative financial instrumentsThe Group uses derivative financial instruments, including currency swaps, cross-currency interest rate swaps, interest rate swaps andother hedging instruments to minimise exposure to the financialrisks of changes in foreign currency exchange rates and interest rates. The Group does not use derivative financial instrumentsfor speculative purposes. The Group has elected not to apply hedge accounting.
Derivative financial instruments are separately recognised at fair valuein the consolidated financial statements. Changes in the fair value of derivative financial instruments are recognised immediately in the consolidated income statement.
Derivatives embedded in commercial contracts are treated as separate derivatives when their risks and characteristics are notclosely related to those of the underlying contract, with unrealisedgains or losses reported in the consolidated income statement.
Trade payablesTrade payables are not interest bearing. Payments occur over ashort period and are subject to an insignificant risk of changes in value. Therefore balances are stated at their nominal value.
3 Accounting policies continued
TaxThe tax expense represents the sum of the corporation tax currentlypayable and deferred tax.
The corporation tax currently payable is based on taxable profit forthe period. Taxable profit differs from profit before tax as reportedin the consolidated income statement because it excludes itemsof income or expense that are taxable or deductible in other years and it further excludes items that are never taxable or deductible. The Group’s liability for current tax is calculated using tax rates thathave been enacted or substantively enacted by the reporting date.
Deferred tax is the tax expected to be payable or recoverable ondifferences between the carrying amounts of assets and liabilities in the consolidated financial statements and the corresponding taxbases used in the computation of taxable profit, and is accounted for using the balance sheet liability method. Deferred tax liabilities are generally recognised for all taxable temporary differences anddeferred tax assets are recognised to the extent that it is probable that taxable profits will be available against which deductibletemporary differences can be utilised.
Deferred tax liabilities are recognised for taxable temporary differences arising on investments in subsidiaries, associates and interests in joint ventures, except where the Group is able to control the reversal of the temporary difference and it is probable that thetemporary difference will not reverse in the foreseeable future.
The carrying amount of deferred tax assets is reviewed at eachreporting date and reduced to the extent that it is no longer probablethat sufficient taxable profits will be available to allow all or part of the asset to be recovered. Deferred tax is calculated at the tax rates that are expected to apply in the period when the liability is settled or theasset is realised.
Deferred tax is charged or credited in the consolidated income statement, except when it relates to items charged or credited directly to equity, in which case the deferred tax is also dealt with in theconsolidated statement of comprehensive income.
Property, plant and equipmentProperty, plant and equipment are stated in the consolidated balance sheet at cost less accumulated depreciation and impairment losses.
Cost includes the purchase price and all directly attributable costs of bringing the asset to its location and condition necessary to operateas intended.
Assets in the course of construction are carried at cost, less any recognised impairment loss. Depreciation commences when the assets are ready for their intended use.
Depreciation is charged so as to write-off the cost, other than freehold land and assets under construction which are notdepreciated, using the straight-line method over the estimated useful lives of buildings (15–67 years) and plant and machinery (3–25 years).
Assets held under finance leases are depreciated over their expecteduseful lives on the same basis as owned assets or, where shorter, over the term of the relevant lease.
The gain or loss arising on the disposal or retirement of an asset is determined as the difference between the sale proceeds and the carrying amount of the asset and is recognised in the consolidated income statement.
Notes to the consolidated financial statements continued

Wh
o w
e a
reB
usin
ess r
evie
wG
ove
rna
nc
eF
ina
nc
ials
Trinity Mirror plc Annual Report & Accounts 2010 65
Dividend distributionsDividend distributions to the Company’s shareholders are recognised as a liability in the consolidated financial statements in the period inwhich the dividends are approved.
Non-recurring itemsItems which are deemed to be non-recurring by virtue of their natureor size are included under the statutory classification appropriate to their nature but are separately disclosed on the face of theconsolidated income statement to assist in understanding the financial performance of the Group.
Critical judgements in applying the Group’saccounting policiesIn the process of applying the Group’s accounting policies, describedabove, management has made the following judgements thathave the most significant effect on the amounts recognised in the financial statements:
Acquisitions and intangible assetsJudgements have been made in respect of the identification of intangible assets based on pre-acquisition forecasts and market analysis. The initial valuations of acquired intangible assets arereviewed for impairment at each reporting date, or more frequently if necessary.
Key sources of estimation uncertaintyThe key assumptions concerning the future and other key sources of estimation uncertainty at the reporting date, that have a significant risk of causing a material adjustment to the carrying amounts of assetsand liabilities within the next financial year, are discussed below:
Impairment of goodwill and other intangible assetsDetermining whether goodwill and other intangible assets are impaired requires an estimation of the value in use of thecash-generating unit to which these have been allocated. The valuein use calculation requires the Group to estimate the future cash flows expected to arise from the cash-generating unit and a suitablediscount rate in order to calculate present value.
Retirement benefitsActuarial assumptions adopted and external factors can significantlyvary the surplus or deficit of defined benefit pension schemes.Advice is sourced from independent actuaries in selecting suitableassumptions.
Derivative financial instrumentsDerivative financial instruments are recognised at fair value and can change significantly from period to period.
3 Accounting policies continued
Credit riskThe Group’s credit risk is primarily attributable to its trade receivables.The amounts presented in the consolidated balance sheet are net of allowances for doubtful receivables, estimated based on priorexperience and assessment of the current economic environment.
The credit risk on liquid funds and derivative financial instruments is limited because the counterparties are banks with high credit ratingsassigned by international credit-rating agencies. The Group has nosignificant concentration of credit risk, with exposure spread over a large number of counterparties and customers.
ProvisionsProvisions are recognised when the Group has a present obligationas a result of a past event, and it is probable that the Group will be required to settle that obligation. Provisions are measured at the directors’ best estimate of the expenditure required to settle theobligation at the reporting date, and are discounted to present valuewhere the effect is material. Accruals are made for legal costs in respect of libel litigation in progress and for estimated damageswhere it is judged probable that damages will be payable. These accruals are included in current liabilities.
Share-based paymentsThe Group issues equity-settled benefits to certain employees. In accordance with the transitional provisions of IFRS 2, the standard has been applied to all grants of equity instruments after 7 November 2002 that had not vested as of 3 January 2005. These equity-settled share-based payments are measured at fair value at the date of grant. The fair value determined at the grant date is expensed on a straight-line basis over the vesting period, based on the Group’sestimate of shares that will eventually vest and adjusted for the effectof non-market based vesting conditions.
Fair value is measured by use of a stochastic (Monte-Carlo binomial)model or a modified Black-Scholes calculation. The expected life used in the model has been adjusted, based on the directors’ best estimates, for the effects of non-transferability, exercise restrictions, and behavioural considerations.
Share capitalOrdinary shares are classified as equity. Incremental costs directly attributable to the issue of new shares or options are shown in equity as a deduction from the proceeds, net of tax.
Where the Group’s own shares are purchased, the consideration paid including any directly attributable incremental costs, net of incometaxes, is deducted from equity attributable to the Group’s equityholders until the shares are cancelled, reissued or disposed of.
Where such shares are cancelled, the nominal value of shares cancelled is shown in the capital redemption reserve. Where such shares are subsequently reissued or disposed of, any consideration received, net of any directly attributable incremental transaction costs and the related income tax effects, is included in equity attributable to the Group’s equity holders.

Trinity Mirror plc 66 Annual Report & Accounts 2010
4 Revenue2010
£m2009
£m
Advertising 351.3 331.8
Circulation 317.4 339.3
Other 92.8 92.2
Total 761.5 763.3
5 Operating segmentsThe Group has adopted IFRS 8 which requires operating segments to be identified on the basis of internal reports about components of the Group that are regularly reviewed by the Board and chief operating decision maker to allocate resources to the segments and to assess theirperformance. The segments reported under IFRS 8 are no different to those previously reported as they reflect the operating segments of the Group about which financial information is regularly reviewed by the Board and chief operating decision maker in assessing performance andallocating resources.
The Regionals division publishes a large portfolio of newspaper and online brands across the UK. The Nationals division publishes twodaily and three Sunday newspapers and related online brands and activities primarily in the UK. Central includes costs not allocated to the operational divisions and the share of results of associates. The revenues and costs of each segment are clearly identifiable and allocated according to where they arise. The Group is not subject to significant seasonality during the year.
The accounting policies used in the preparation of each segment’s revenue and results are the same as the Group’s accounting policesdescribed in note 3 on pages 62 to 65.
Segment revenue and resultsRegionals
2010£m
Nationals2010
£m
CCentral2010
£m
Total2010
£m
Revenue
Segment sales 339.5 443.8 – 783.3
Inter-segment sales (8.3) (13.5) – (21.8)
Total revenue 331.2 430.3 – 761.5
Segment result 51.7 86.1 (14.5) 123.3
Amortisation (6.0)
Non-recurring items 20.7
Operating profit 138.0
Investment revenues 1.4
Pension finance charge (7.1)
Finance costs (8.6)
Profit before tax 123.7
Tax charge (10.4)
Profit for the period 113.3
Notes to the consolidated financial statements continued

Wh
o w
e a
reB
usin
ess r
evie
wG
ove
rna
nc
eF
ina
nc
ials
Trinity Mirror plc Annual Report & Accounts 2010 67
5 Operating segments continued
Segment revenue and results continuedRegionals
2009£m
Nationals2009
£m
CCentral2009
£m
Total2009
£m
Revenue
Segment sales 311.8 467.8 – 779.6
Inter-segment sales (8.9) (7.4) – (16.3)
Total revenue 302.9 460.4 – 763.3
Segment result 35.9 83.6 (14.1) 105.4
Amortisation (7.1)
Non-recurring items (11.3)
Operating profit 87.0
Investment revenues 0.2
Pension finance charge (10.5)
Finance costs (34.7)
Profit before tax 42.0
Tax charge (12.7)
Profit for the period 29.3
The Group’s operations are located in the United Kingdom. The Group’s revenue by location of customers is set out below:
2010 £m
2009 £m
United Kingdom and Republic of Ireland 756.1 757.0
Continental Europe 4.4 5.4
Rest of World 1.0 0.9
Total 761.5 763.3

Trinity Mirror plc 68 Annual Report & Accounts 2010
Notes to the consolidated financial statements continued
6 Result for the year
2010£m
2009 £m
Operating profit for the period is arrived at after (charging)/crediting:
Staff costs (note 7) (244.4) (251.2)
Cost of inventories recognised as a cost of sales (116.8) (120.2)
Depreciation of property, plant and equipment:
– owned assets (33.9) (35.9)
– under finance leases – (0.9)
Amortisation of intangible assets (6.0) (7.1)
Operating lease rentals payable:
– property (6.6) (6.3)
– vehicles, plant and equipment (3.3) (3.8)
Trade receivables impairment (1.6) (8.8)
Net foreign exchange loss (0.1) (0.4)
Non-recurring items (note 8) 20.7 (11.3)
Auditors’ remuneration:
Audit fees payable to the Company’s auditors for:
– the audit of the Company’s annual accounts (0.3) (0.3)
– the audit of the Company’s subsidiaries pursuant to legislation (0.5) (0.5)
Total audit fees (0.8) (0.8)
Non-audit fees payable to the Company’s auditors for:
– other services pursuant to legislation (0.1) (0.1)
– other services relating to taxation (0.2) (0.1)
– other services relating to corporate finance transactions (0.3) –
Total non-audit fees (0.6) (0.2)
In addition to the amounts shown above, the auditors received fees of £21,700 (2009: £20,000) for the audit of two of the Group’s pensionschemes. There were no future services contracted at the reporting date (2009: £nil).
A description of the work of the Audit & Risk Committee is set out in the Corporate Governance Report on pages 40 to 45 and includes an explanation of how auditor objectivity and independence are safeguarded when non-audit services are provided by the auditors.
Total administrative expenses included in operating profit amounted to £150.2 million (2009: £205.3 million) including non-recurring items (note 8) amounting to a credit of £20.7 million (2009: £11.3 million charge) and amortisation of intangible assets of £6.0 million (2009: £7.1 million).
Total share of results of associates amounted to a profit of £0.7 million (2009: £0.5 million).
Total foreign exchange loss during the period was £9.0 million (2009: £32.9 million gain) comprising a net foreign exchange loss of £0.1 million (2009: £0.4 million loss) included in operating profit and a loss on the retranslation of borrowings of £8.9 million (2009: £33.3 million gain) included in finance costs (note 10).

Wh
o w
e a
reB
usin
ess r
evie
wG
ove
rna
nc
eF
ina
nc
ials
Trinity Mirror plc Annual Report & Accounts 2010 69
7 Staff costsThe average number of persons, including executive directors, employed by the Group in the period was:
2010 Number
2009 Number
Production and editorial 3,186 3,452
Sales and distribution 1,888 2,147
Administration 1,576 1,217
6,650 6,816
All employees are employed in the United Kingdom and Republic of Ireland. The above excludes casual employees working for the Group during the period due to the impracticality of determining an average.
Staff costs, including directors’ emoluments, incurred during the period were:
2010 £m
2009 £m
Wages and salaries (210.3) (211.8)
Social security costs (20.4) (19.6)
Share-based payments in the period (note 32) (2.1) (3.2)
Pension costs – defined contribution pension schemes (note 33) (7.0) (1.1)
Pension costs – defined benefit pension schemes (note 33) (4.6) (15.5)
(244.4) (251.2)
Disclosure of individual directors’ remuneration, share options, long-term incentive schemes, pension contributions and pension entitlements required by the Companies Act 2006 and those elements specified for audit by the Financial Services Authority are shown in the tables in the Remuneration report on pages 47 to 52 and form part of these consolidated financial statements.
8 Non-recurring items2010
£m2009
£m
Gain on acquisition of business(a) 27.3 –
Restructuring charges(b) (11.1) (17.9)
Release of accruals(c) 3.6 –
Profit on disposal of land and buildings(d) 1.3 5.1
Defined benefit pension schemes(e) (0.4) 9.9
Impairment of receivables(f) – (6.0)
Loss on disposal of business(g) – (2.4)
Total non-recurring items 20.7 (11.3)
(a) The gain on acquisitions of business consists of an accounting gain of £28.4 million representing negative goodwill of £23.6 million together with a gain on a cancelled contract of £4.8 million less transaction costs £1.1 million.
(b) Restructuring charges of £11.1 million (2009: £17.9 million) were incurred in the delivery of cost reduction measures and implementationof the new operating model for the Group.
(c) The Group released accruals of £3.6 million for which no further costs are expected.
(d) The Group disposed of surplus land and buildings realising a profit on disposal of £1.3 million (2009: £5.1 million).
(e) Defined benefit pension scheme liabilities increased by £0.4 million in respect of a past service cost of £8.3 million in relation to the clarification of certain members’ benefits less a curtailment of £7.9 million relating to the Group closing the schemes to future accrual and the impact on redundancies (2009: £9.9 million reduction in respect of the curtailment gain relating to redundancies and theGroup indicating that it will no longer exercise discretion in providing enhancements to past service on redundancy).
(f) In 2009, there was an impairment of receivables of £6.0 million which related to the write off of circulation receivables following a wholesale distributor going into administration.
(g) In 2009, the Group disposed of Globespan Media Limited incurring a loss on disposal of £2.4 million.

Trinity Mirror plc 70 Annual Report & Accounts 2010
Notes to the consolidated financial statements continued
9 Investment revenues2010
£m2009
£m
Interest income on bank deposits and other interest receipts 1.4 0.2
Other interest receipts include £0.9 million of interest received during the period on the refund of VAT on share issue costs in prior periods.
10 Finance costs2010
£m2009
£m
Interest on bank overdrafts and borrowings (16.1) (21.8)
Interest on obligations under finance leases – (0.6)
Total interest expense (16.1) (22.4)
Fair value gain/(loss) on derivative financial instruments 16.4 (45.6)
Foreign exchange (loss)/gain on retranslation of borrowings (8.9) 33.3
Finance costs (8.6) (34.7)
11 Tax2010
£m2009
£m
Current tax
Corporation tax charge for the period (25.9) (18.0)
Prior period adjustment 4.7 (1.6)
Current tax charge (21.2) (19.6)
Deferred tax (note 21)
Deferred tax credit for the period 0.1 6.0
Deferred tax rate change 11.4 –
Prior period adjustment (0.7) 0.9
Deferred tax credit 10.8 6.9
Tax charge (10.4) (12.7)
( )/Reconciliation of tax (charge)/credit % %
Standard rate of corporation tax 28.0 28.0
Tax effect of items that are not deductible in determining taxable profit/(loss) 1.4 4.9
Tax effect of items that are not taxable in determining taxable profit/(loss) (7.3) (4.0)
Deferred tax rate change (9.3) –
Prior period adjustment (3.2) 1.7
Utilisation of tax losses (0.9) –
Tax effect of share of results of associates (0.3) (0.4)
Tax charge rate 8.4 30.2
The standard rate of corporation tax is the UK prevailing rate of 28% (2009: 28%). The current tax liabilities amounted to £18.9 million (2009: £23.0 million) at the reporting date.
The tax in respect of actuarial gains on defined benefit pension schemes taken to the statement of comprehensive income of £30.4 million(2009: £29.6 million tax in respect of actuarial losses) comprises a current tax credit of £6.2 million (2009: £4.6 million credit) and a deferredtax charge of £36.6 million (2009: £25.0 million credit).
The change in the standard rate of corporation tax from 28% to 27% is effective from 1 April 2011. The impact on the opening deferred tax position being recalculated is a £11.4 million credit in the income statement and a £3.0 million debit in the statement of comprehensive income.

Wh
o w
e a
reB
usin
ess r
evie
wG
ove
rna
nc
eF
ina
nc
ials
Trinity Mirror plc Annual Report & Accounts 2010 71
12 DividendsNo dividend is declared for either period.
13 Earnings per share2010
£m2009
£m
Profit after tax before adjusted items* 72.6 51.1
Adjusted items*:
Non-recurring items (after tax) 28.2 (7.8)
Amortisation of intangibles (after tax) (4.4) (5.1)
Impact of the fair value gain/(loss) on derivative financial instruments (after tax) 12.0 (32.8)
Foreign exchange (loss)/gain on retranslation of borrowings (after tax) (6.5) 23.9
Tax legislation changes 11.4 –
Profit for the period 113.3 29.3
* Adjusted items relate to the exclusion of non-recurring items, the amortisation of intangible assets, the retranslation of foreign currency borrowings, the impact of fair value changes on derivative financial instruments and the impact of tax legislation changes. A reconciliation between the adjusted result and the statutory result is provided in note 38 on page 99.
2010 Thousand
2009 Thousand
Weighted average number of ordinary shares for basic earnings per share 253,736 255,874
Effect of potentially dilutive ordinary shares in respect of share options 718 1,989
Weighted average number of ordinary shares for diluted earnings per share 254,454 257,863
Basic earnings per share is calculated by dividing profit attributable to equity holders of the parent by the weighted average number of ordinary shares during the period. Diluted earnings per share is calculated by adjusting the weighted average number of ordinary shares in issue on theassumption of conversion of all potentially dilutive ordinary shares. The number of potentially dilutive ordinary shares not currently dilutive was 7,339,255 (2009: 5,016,026).
Earnings per share2010
Pence2009
Pence
Adjusted earnings* per share – basic 28.6 20.0
Adjusted earnings* per share – diluted 28.5 19.8
Earnings per share – basic 44.6 11.5
Earnings per share – diluted 44.5 11.4
* Adjusted items relate to the exclusion of non-recurring items, the amortisation of intangible assets, the retranslation of foreign currency borrowings, the impact of fair value changes on derivative financial instruments and the impact of tax legislation changes. A reconciliation between the adjusted result and the statutory result is provided in note 38 on page 99.
The basic earnings per share impact for each category of non-recurring item disclosed in note 8 is as follows:
2010 Pence
2009 Pence
Gain on acquisition of business 12.3 –
Restructuring costs (3.1) (5.0)
Release of accruals 1.4 –
Profit on disposal of land and buildings 0.5 2.0
Defined benefit pension schemes (0.1) 2.8
Impairment of receivables – (1.7)
Loss on disposal of business – (1.1)
Gain/(loss) per share 11.0 (3.0)

Trinity Mirror plc 72 Annual Report & Accounts 2010
Notes to the consolidated financial statements continued
14 Goodwill2010
£m2009
£m
Opening balance 74.5 77.0
Adjustment to deferred consideration – (1.9)
Disposals (note 38) – (0.6)
Closing balance 74.5 74.5
In 2009 the adjustment to deferred consideration related to the reduction in the estimate of the amount payable in respect of acquisitions made in prior periods.
Goodwill is allocated to cash-generating units. The carrying value of goodwill analysed by business segment is as follows:
2010 £m
2009 £m
Regionals 72.3 72.3
Nationals 2.2 2.2
Total 74.5 74.5
The Regionals division comprises nine (2009: eight) cash-generating units. The Nationals division comprises a single cash-generating unit.
The Group tests the carrying value of goodwill at the cash-generating unit level for impairment at each reporting date or more frequently if there are indications that goodwill might be impaired. At the period end reporting date, a review was undertaken on a value in use basis,assessing whether the carrying value of goodwill was supported by the net present value of future cash flows derived from those assets,using cash flow projections in respect of periods to 2020.
The key assumptions used in the value in use calculations are those regarding the discount rate, revenue and cost growth rates and the levelof capital expenditure required. The post-tax discount rate used at the period end reporting date was 7.0% (2009: 7.0%) reflecting a long-termequity and debt mix based on the period end enterprise value assuming a long-term debt to EBITDA ratio of 2.5 times. The equivalent pre-taxdiscount rate is 8.8% (2009: 8.0%). The Group prepares cash flow forecasts derived from the most recently detailed approved annual budgetand two year projections for 2011 to 2013 and high level projections for 2014 to 2020. The cash flow forecasts reflect past experience of and the risk associated with each asset. Cash flows beyond 2020 are extrapolated based on estimated growth rates which do not exceed the average long-term growth rates for the relevant markets. Capital expenditure cash flows have been forecast to reflect the cycle of capitalinvestment required, including printing press replacement. Management believes it is appropriate to forecast for a period of greater than five years to most appropriately reflect the cash flows relating to the cash-generating units and to reflect the recovery from the currentcyclical downturn.
We have assumed our current projected performance for 2011 to 2013 and then revenue growth rates in the 2014 to 2020 projections in the range between 0% and 7% which vary with management’s view of the cash-generating units market position and maturity of the relevantmarket. The perpetuity growth rates used from 2020 vary between 0% and 2.5%.
The impairment review is sensitive to a change in key assumptions used, most notably the discount rate and the perpetuity growth rates. With the exception of the online specialist national recruitment cash-generating unit, based on the Group’s sensitivity analysis, a modestchange in a single factor will not result in a material impairment in any of the Group’s cash-generating units. With the exception of the onlinespecialist national recruitment cash-generating unit, a reasonably possible change of 1% in the discount rate or 1% in the perpetuity growth rates would not change the conclusions of the impairment review. The online specialist national recruitment cash-generating unit has a headroom of £6 million at the reporting date. A change in the discount rate of 7.0% of 0.4% or the perpetuity growth rate of 2.5% by 0.6%would eradicate the headroom.

Wh
o w
e a
reB
usin
ess r
evie
wG
ove
rna
nc
eF
ina
nc
ials
Trinity Mirror plc Annual Report & Accounts 2010 73
15 Other intangible assets
Publishingrights
and titles£m
CCustomerrelationshipsand domain
names£m
Group total
£m
Cost
At 28 December 2008 1,822.8 42.5 1,865.3
Disposals (note 38) – (1.1) (1.1)
At 3 January 2010 1,822.8 41.4 1,864.2
Additions (note 36) 30.0 – 30.0
At 2 January 2011 1,852.8 41.4 1,894.2
Accumulated amortisation
At 28 December 2008 (965.0) (20.7) (985.7)
Amortisation – (7.1) (7.1)
At 3 January 2010 (965.0) (27.8) (992.8)
Amortisation – (6.0) (6.0)
At 2 January 2011 (965.0) (33.8) (998.8)
Carrying amount
At 3 January 2010 857.8 13.6 871.4
At 2 January 2011 887.8 7.6 895.4
The Group tests the carrying value of publishing rights and titles with indefinite economic lives at the cash-generating unit level for impairmentat each reporting date or more frequently if there are indications that publishing rights and titles might be impaired. The directors considerpublishing rights and titles have indefinite economic lives due to the historic longevity of the brands and the ability to evolve the brands in theever changing media landscape. It is not practicable to review individual publishing rights and titles due to the interdependencies of the inflows within the cash-generating units.
The impairment review of the carrying value of the Group’s publishing rights and titles performed at the period end reporting date indicated that no impairment was required (2009: no impairment). The impairment review was based on comparing carrying value with value in use.
The customer relationships and domain names included above have estimated useful lives of between five and 10 years and are tested atthe cash-generating unit level for impairment at each reporting date or more frequently if there are indications that customer relationshipsand domain names might be impaired.

Notes to the consolidated financial statements continued
Trinity Mirror plc 74 Annual Report & Accounts 2010
15 Other intangible assets continuedThe carrying value of other intangible assets analysed by business segment is as follows:
Publishing rights
and titles £m
CCustomerrelationshipsand domain
names£m
Total2010
£m
Publishingrights
and titles£m
CCustomerrelationshipsand domain
names£m
Total 2009
£m
Regionals 240.8 7.6 248.4 210.8 13.6 224.4
Nationals 647.0 – 647.0 647.0 – 647.0
Total 887.8 7.6 895.4 857.8 13.6 871.4
The Regionals division comprises nine (2009: eight) cash-generating units. The Nationals division comprises a single cash-generating unit.
At the period end reporting date a review was undertaken to determine value in use to assess whether the carrying value of publishing rights and titles, customer relationships and domain names were supported. Value in use was based on net present value of future cash flows derived from those assets, using cash flow projections in respect of periods to 2020.
The key assumptions used in the value in use calculations are those regarding the discount rate, revenue and cost growth rates and the levelof capital expenditure required. The post-tax discount rate used at the period end reporting date was 7.0% (2009: 7.0%) reflecting a long-termequity and debt mix based on the period end enterprise value assuming a long-term debt to EBITDA ratio of 2.5 times. The Group prepares cash flow forecasts derived from the most recently approved detailed annual budget and two year projections for 2011 to 2013 and high level projections for 2014 to 2020. The equivalent pre-tax discount rate is 8.8% (2009: 8.0%). The cash flow forecasts reflect past experience of and the risk associated with each asset. Cash flows beyond 2020 are extrapolated based on estimated growth rates which do not exceed the average long-term growth rates for the relevant markets. Capital expenditure cash flows have been forecast to reflect the cycle of capitalinvestment required including printing press replacement. Management believes it is appropriate to forecast for a period of greater thanfive years to most appropriately reflect the cash flows relating to the cash-generating units and to reflect recovery from the current cyclical downturn.
We have assumed our current projected performance for 2011 to 2013 and then revenue growth rates in the 2014 to 2020 projections in the range between 0% and 7% which vary with management’s view of the cash-generating units market position and maturity of the relevantmarket. The perpetuity growth rates used from 2020 vary between 0% and 2.5%.
The sensitivity of the impairment review to changes in key assumptions is set out in note 14.

Wh
o w
e a
reB
usin
ess r
evie
wG
ove
rna
nc
eF
ina
nc
ials
Trinity Mirror plc Annual Report & Accounts 2010 75
16 Property, plant and equipment
Land and buildings
Freehold£m
Leasehold£m
Plant andequipment
£m
Assets underconstruction
£mTotal
£m
Cost
At 28 December 2008 204.6 21.6 387.3 13.7 627.2
Additions 1.2 – 6.2 6.6 14.0
Disposal of subsidiary undertaking – – (0.1) – (0.1)
Disposals (2.2) (0.1) – – (2.3)
Reclassification 7.6 4.4 (1.7) (10.3) –
Write-off of assets – (4.0) (76.0) (0.1) (80.1)
At 3 January 2010 211.2 21.9 315.7 9.9 558.7
Additions 1.0 – 9.3 2.7 13.0
Acquisition of business 2.8 0.1 7.4 – 10.3
Disposals (0.3) (3.1) – – (3.4)
Reclassification (2.0) 0.1 9.8 (8.8) (0.9)
Write-off of assets (0.3) (0.1) (29.9) – (30.3)
At 2 January 2011 212.4 18.9 312.3 3.8 547.4
Accumulated depreciation and impairment
At 28 December 2008 (21.8) (7.4) (149.3) – (178.5)
Charge for the period (4.9) (0.9) (31.0) – (36.8)
Disposal of subsidiary undertaking – – 0.1 – 0.1
Disposals 0.2 – – – 0.2
Write-off of assets – 3.7 75.8 – 79.5
At 3 January 2010 (26.5) (4.6) (104.4) – (135.5)
Charge for the period (4.3) (0.8) (28.8) – (33.9)
Disposals 0.2 1.8 – – 2.0
Write-off of assets 0.3 0.1 29.9 – 30.3
At 2 January 2011 (30.3) (3.5) (103.3) – (137.1)
Carrying amount
At 3 January 2010 184.7 17.3 211.3 9.9 423.2
At 2 January 2011 182.1 15.4 209.0 3.8 410.3
Included within the carrying amount of property, plant and equipment is £nil (2009: £nil) in respect of assets under finance leases.Depreciation for the period on those assets was £nil (2009: £0.9 million).
2010 £m
2009 £m
Capital commitments
Expenditure contracted for but not provided in the consolidated financial statements 0.3 2.4

Notes to the consolidated financial statements continued
Trinity Mirror plc 76 Annual Report & Accounts 2010
17 Investment in associatesThe Group has a 21.54% interest in PA Group Limited, a news agency incorporated in England and Wales.
2010 £m
2009 £m
Opening balance 6.3 7.5
Share of results of associates:
Results recognised in the consolidated income statement 0.7 0.5
Share of actuarial losses recognised in equity (1.6) (1.7)
Closing balance 5.4 6.3
PA Group Limited2010
£m2009 £m
Total assets 58.0 62.0
Total liabilities (32.6) (32.4)
Net assets 25.4 29.6
Group’s share of net assets 5.4 6.3
Revenue 82.8 85.6
Profit for the period 3.4 2.4
Group’s share of results for the period 0.7 0.5
The financial statements of PA Group Limited are made up to 31 December each year. For the purposes of applying the equity method of accounting, the audited financial statements of PA Group Limited for the year ended 31 December 2009 together with the management accounts up to the end of December 2010 have been used with appropriate year end adjustments made.
18 Inventories2010
£m2009
£m
Raw materials and consumables 7.3 5.9
The Group consumed £116.8 million (2009: £120.2 million) of inventories during the period.
19 Other financial assets
Trade and other receivables2010
£m2009
£m
Gross trade receivables 84.5 84.2
Allowances for doubtful receivables (6.0) (5.6)
Net trade receivables 78.5 78.6
Prepayments and accrued income 19.5 15.1
Other receivables 1.4 1.9
99.4 95.6

Wh
o w
e a
reB
usin
ess r
evie
wG
ove
rna
nc
eF
ina
nc
ials
Trinity Mirror plc Annual Report & Accounts 2010 77
19 Other financial assets continued
Net trade receivablesTrade receivables net of allowances for doubtful receivables at the reporting date amounted to £78.5 million (2009: £78.6 million).
The average credit period taken on sales of goods is 40 days (2009: 37 days). No interest is charged on the receivables. The Group has provided fully for all receivables over 120 days because historical experience is such that these receivables are generally not recoverable.Trade receivables less than 60 days and between 60 days and 120 days are provided for based on specific circumstances and by referenceto past default experience.
Before accepting any new customers, the Group, where appropriate, uses an external credit scoring system to assess the potentialcustomer’s credit quality and defines credit limits by customer. Limits attributed to customers are reviewed during the period where appropriate. There are no customers who represent more than 10% of net trade receivables in either period.
Included in net trade receivables balance are debtors with a carrying amount of £2.9 million (2009: £1.7 million) which are past their due date at the reporting date for which the Group has not provided as there has not been a significant change in credit quality and the amounts are still considered recoverable. The Group does not hold any collateral over these balances. The average age of these receivables is 78 days(2009: 82 days).
AAgeing of past due but not impaired receivables2010
£m2009
£m
60–90 days 2.6 1.6
90–120 days 0.3 0.1
Total 2.9 1.7
Movement in allowance for doubtful debts2010 £m
2009 £m
Opening balance 5.6 5.3
Impairment losses recognised 1.6 8.8
Acquisition of businesses 0.8 –
Utilisation of provision (2.0) (8.5)
Closing balance 6.0 5.6
In determining the recoverability of a trade receivable, the Group considers any change in the credit quality of the trade receivable from the date credit was initially granted up to the reporting date. The concentration of credit risk is limited due to the customer base being large and unrelated. Accordingly, there is no further credit provision required in excess of the allowance for doubtful debts.
There are no significant amounts included in the allowance for doubtful debts relating to impaired trade receivables which have been placed under liquidation. The impairment recognised represents the difference between the carrying amount of these trade receivables and thepresent value of the expected liquidation proceeds. The Group does not hold any collateral over these balances.
AAgeing of impaired receivables2010
£m2009
£m
Less than 60 days 1.2 2.1
60–90 days 2.3 0.9
90–120 days 0.8 0.6
120+ days 1.7 2.0
Total 6.0 5.6
The carrying amount of trade and other receivables approximates their fair value.
2010 £m
2009 £m
Cash and cash equivalents 116.2 61.2
Cash and cash equivalents comprise cash held by the Group and short-term bank deposits with an original maturity of one week or less. The carrying amount of these assets approximates their fair value.

Notes to the consolidated financial statements continued
Trinity Mirror plc 78 Annual Report & Accounts 2010
20 Other financial liabilities
Trade and other payables2010 £m
2009 £m
Trade payables (11.2) (13.3)
Social security and other taxes (8.6) (8.4)
Accruals and deferred income (78.7) (84.8)
Other payables (8.0) (9.1)
(106.5) (115.6)
Trade payables principally comprise amounts outstanding for trade purchases and ongoing costs. The average credit period taken for trade purchases is 36 days (2009: 33 days). For most suppliers no interest is charged on the trade payables for the first 60 days from the date of theinvoice. Thereafter, interest is charged on the outstanding balances at various interest rates. The Group has financial risk management policiesin place to ensure that all payables are paid within the credit timeframe. The carrying amount of trade payables approximates to their fair value.
21 Deferred tax assets and liabilitiesThe following are the major deferred tax assets and liabilities recognised by the Group and movements thereon:
Accelerated tax
depreciation £m
O hOther short-term
timing differences
£m
Rolled-over and held-over
gains £mIntangibles
£m
Retirement benefit
obligations £m
Share-based payments
£mTotal
£m
At 28 December 2008 (72.8) (4.9) (1.4) (246.3) 57.9 0.2 (267.3)
Credit to consolidated income statement 2.1 2.2 – 2.3 0.1 0.2 6.9
Credit to equity – – – – 25.0 – 25.0
At 3 January 2010 (at 28% tax rate) (70.7) (2.7) (1.4) (244.0) 83.0 0.4 (235.4)
Change of tax rate applying todeferred tax:
Credit to income 2.5 0.1 0.1 8.7 – – 11.4
Charge to equity – – – – (2.9) (0.1) (3.0)
Revised opening balanceat 4 January 2010 (at 27% tax rate) (68.2) (2.6) (1.3) (235.3) 80.1 0.3 (227.0)
Acquisition of business 0.2 (2.4) – (8.1) – – (10.3)
Credit/(charge) to consolidated incomestatement (0.6) (1.6) – 1.6 – – (0.6)
Charge to equity – – – – (36.6) – (36.6)
At 2 January 2011 (68.6) (6.6) (1.3) (241.8) 43.5 0.3 (274.5)
Certain deferred tax assets and liabilities have been offset. The following is the analysis of the deferred tax balances in the consolidated balance sheet:
2010 £m
2009 £m
Deferred tax liabilities (318.3) (318.8)
Deferred tax assets 43.8 83.4
(274.5) (235.4)
At the reporting date, the Group has unused tax losses of £20.8 million (2009: £11.9 million) available for offset against future profits.No deferred tax asset has been recognised in respect of the tax losses due to the unpredictability of future profit streams. The tax lossescan be carried forward indefinitely. The Group also has unrecognised capital losses of £35.9 million (2009: £37.2 million) at the reporting date.

Wh
o w
e a
reB
usin
ess r
evie
wG
ove
rna
nc
eF
ina
nc
ials
Trinity Mirror plc Annual Report & Accounts 2010 79
22 ProvisionsSShare-based
payments£m
Property £m
Restructuring£m
Total £m
At 28 December 2008 (1.0) (12.9) (11.5) (25.4)
Charged to consolidated income statement (0.2) (2.8) (18.5) (21.5)
Released to consolidated income statement – 1.2 0.4 1.6
Utilisation of provisions – 4.1 23.9 28.0
At 3 January 2010 (1.2) (10.4) (5.7) (17.3)
Charged to consolidated income statement (0.1) (3.8) (12.1) (16.0)
Released to consolidated income statement – 0.2 1.0 1.2
Utilisation of provisions – 3.9 13.7 17.6
At 2 January 2011 (1.3) (10.1) (3.1) (14.5)
The provisions have been analysed between current and non-current as follows:
2010 £m
2009 £m
Current (6.4) (10.1)
Non-current (8.1) (7.2)
(14.5) (17.3)
The share-based payments provision relates to National Insurance obligations attached to the future crystallisation of awards.
The property provision relates to onerous property leases and future committed costs related to occupied, let and vacant properties.This provision will be utilised over the remaining term of the leases.
The restructuring provision relates to the non-recurring restructuring severance incurred in the delivery of cost reduction measures.This provision is expected to be utilised during the next period.
23 Principal subsidiariesA list of the principal subsidiaries, including name, country of incorporation, principal activity and proportion of ordinary shares held is givenin note 14 in the notes to the parent company financial statements.
24 Notes to the consolidated cash flow statement2010 £m
2009 £m
Operating profit 138.0 87.0
Depreciation of property, plant and equipment 33.9 36.8
Amortisation of other intangible assets 6.0 7.1
Share of results of associate (0.7) (0.5)
Charge for share-based payments 2.1 3.2
Profit on disposal of land and buildings (1.3) (5.1)
Loss on disposal of business – 2.4
Gain on acquisition of business (28.4) –
Pension funding in excess of income statement charge* (30.2) (26.5)
Operating cash flows before movements in working capital 119.4 104.4
(Increase)/decrease in inventories (1.1) 1.7
Decrease in receivables 9.1 23.6
Decrease in payables (17.3) (32.1)
Cash flows from operating activities 110.1 97.6
* Including a non-recurring charge of £0.4 million (2009: £9.9 million credit) described in note 8.

Notes to the consolidated financial statements continued
Trinity Mirror plc 80 Annual Report & Accounts 2010
25 Borrowings2010
£m2009
£m
Loan notes (363.9) (355.0)
Derivative financial instruments (note 26) (2.2) (6.0)
(366.1) (361.0)
The borrowings are repayable as follows:
On demand or within one year (140.0) (3.1)
In the second year (65.8) (137.7)
In the third year (51.5) (65.7)
In the fourth year (42.7) (50.2)
In the fifth year – (41.3)
After five years (66.1) (63.0)
(366.1) (361.0)
The borrowings are included in the consolidated balance sheet as follows:
Amount included in non-current liabilities (226.1) (357.9)
Amount included in current liabilities (140.0) (3.1)
(366.1) (361.0)
The amount included in non-current liabilities represents borrowings of £226.1 million (2009: £355.0 million) and derivative financial instruments of £nil (2009: £2.9 million) and in current liabilities represents borrowings of £137.8 million (2009: £nil) and derivative financial instruments of £2.2 million (2009: £3.1 million). Non-current assets include £12.6 million (2009: £nil) relating to derivative financial instruments which is deducted from borrowings to calculate net debt in note 27.
2010 £m
2009 £m
Loan notes movement in the period:
Opening balance (355.0) (388.3)
Foreign exchange (loss)/gain on retranslation (8.9) 33.3
Closing balance (363.9) (355.0)
2010 £m
2009 £m
Composition of loan notes:
US$270 million loan notes (173.3) (168.4)
US$252 million loan notes (164.6) (160.6)
£16 million loan notes (16.0) (16.0)
£10 million loan notes (10.0) (10.0)
(363.9) (355.0)
The US private placement loan notes totalling US$522 million and £26 million were issued in 2001 and 2002. On the issue date the capital repayments and fixed rate interest on the US$ denominated loan notes were swapped into floating rate sterling through the use of cross-currency interest rate swaps. As hedge accounting under IAS 39 has not been applied, the loan notes and cross-currency swaps are shown separately in accordance with IAS 39. The loan notes are disclosed at amortised cost and translated into sterling at the reportingdate exchange rate and the cross-currency interest rate swaps are disclosed at fair value at the reporting date. These values do notrepresent the amounts required to repay the loan notes or cancel the related cross-currency interest rate swaps.
At 2 January 2011 the Group had available £178.5 million (2009: £178.5 million) of undrawn committed borrowing facilities in respect of whichall conditions precedent had been met.
All borrowings are denominated in sterling unless otherwise indicated. The bank facility and US private placement loan notes are unsecured.

Wh
o w
e a
reB
usin
ess r
evie
wG
ove
rna
nc
eF
ina
nc
ials
Trinity Mirror plc Annual Report & Accounts 2010 81
25 Borrowings continuedThe effective interest rates at the reporting date are as follows:
2010 %
2009 %
US$ denominated loan notes 6.75 6.75
£ denominated loan notes 7.22 7.22
The fair value of the Group’s borrowings is estimated by discounting their future cash flows at the market rate. The estimate at the reportingdate is as follows:
2010 £m
2009 £m
US$ denominated loan notes (337.9) (329.0)
£ denominated loan notes (26.0) (26.0)
In estimating the fair value of the loan notes the future cash flows have been discounted using an appropriate discount factor that includes credit risk.
The fair value of other financial assets and liabilities, excluding derivative financial instruments in note 26, are not materially different from thebook values and are not repeated in this analysis.
26 Derivative financial instrumentsThe movement in the derivative financial instruments is as follows:
2010 £m
2009 £m
Opening (liability)/asset (6.0) 39.6
Movement in fair value 16.4 (45.6)
Closing asset/(liability) 10.4 (6.0)
The derivative financial instruments are included in the consolidated balance sheet as follows:
2010 £m
2009 £m
Non-current liabilities – (2.9)
Current liabilities (2.2) (3.1)
Non-current assets 12.6 –
Closing asset/(liability) 10.4 (6.0)
The Group has cross-currency interest rate swaps to manage its exposure to foreign exchange movements and interest rate movements on the US private placement loan notes. Fair value is calculated using discounted cash flows based upon forward rates available to the Group.The cross-currency interest rate swaps are classed in level three of the financial instruments hierarchy.
In October 2008, an interest rate swap was entered into which converted the floating rate interest payments on £180.0 million of principal intofixed for a period of 12 months to October 2009. In April 2009, it was agreed with the counterparties in respect of £135.0 million of principalto extend the settlement date until October 2010. In October 2009, the swap in respect of £45.0 million principal was settled on the due date.In October 2010, the swap in respect of £135.0 million principal was settled on the due date. The fair value change from the prior period end up to the settlement date has been included in the movement in fair value.

Notes to the consolidated financial statements continued
Trinity Mirror plc 82 Annual Report & Accounts 2010
27 Net debtThe statutory net debt for the Group is as follows:
2009 £m
Cash flow£m
Consolidatedincome
statement*£m
Transferto current
£m2010 £m
Non-current liabilities
Loan notes (355.0) – (8.9) 137.8 (226.1)
Derivative financial instruments (2.9) – 2.9 – –
(357.9) – (6.0) 137.8 (226.1)
Current liabilities
Loan notes – – – (137.8) (137.8)
Derivative financial instruments (3.1) – 3.1 (2.2) (2.2)
(3.1) – 3.1 (140.0) (140.0)
Non-current assets
Derivative financial instruments – – 10.4 2.2 12.6
– – 10.4 2.2 12.6
Current assets
Cash and cash equivalents 61.2 55.0 – – 116.2
61.2 55.0 – – 116.2
Statutory net debt (299.8) 55.0 7.5 – (237.3)
* The impact on the loan notes of translation into sterling at the reporting date exchange rate and the impact on the derivative financial instruments of being stated at fair value at the settlement date or at the reporting date are included in the consolidated income statement within finance costs as set out in note 10.
Cash and cash equivalents represent the sum of the Group’s bank balances and cash in hand at the reporting date.
The contracted net debt for the Group, assuming that the private placement loan notes and the cross-currency interest rate swaps are not terminated prior to maturity, is as follows:
2009 £m
Cash flow £m
C lid dConsolidated income
statement*£m
Transfer to current
£m2010
£m
Non-current liabilities
Loan notes (382.1) – – 145.4 (236.7)
(382.1) – – 145.4 (236.7)
Current liabilities
Loan notes – – – (145.4) (145.4)
Derivative financial instruments (3.1) – 3.1 – –
(3.1) – 3.1 (145.4) (145.4)
Current assets
Cash and cash equivalents 61.2 55.0 – – 116.2
61.2 55.0 – – 116.2
Contracted net debt (324.0) 55.0 3.1 – (265.9)
* The impact on the derivative financial instruments of being stated at fair value at the settlement date or at the reporting date are included in the consolidated income statement within financecosts as set out in note 10.

Wh
o w
e a
reB
usin
ess r
evie
wG
ove
rna
nc
eF
ina
nc
ials
Trinity Mirror plc Annual Report & Accounts 2010 83
27 Net debt continuedThe statutory net debt reconciles to the contracted net debt as follows:
2010 £m
2009 £m
Statutory net debt (237.3) (299.8)
Loan notes at period end exchange rate 363.9 355.0
Loan notes at swapped exchange rates (382.1) (382.1)
Cross-currency interest rate swaps (10.4) 2.9
Contracted net debt (265.9) (324.0)
28 Share capital and reserves
Sharecapital
£m
Shareredemption
premium£m
Capitalredemption
reserve£m
Retainedearnings
and otherreserves
£mTotal
£m
At 28 December 2008 (25.8) (1,120.5) (4.3) 615.9 (534.7)
Total comprehensive costs for the period – – – 48.5 48.5
Credit to equity for equity settled share-based payments – – – (3.0) (3.0)
At 3 January 2010 (25.8) (1,120.5) (4.3) 661.4 (489.2)
Total comprehensive income for the period – – – (190.8) (190.8)
Credit to equity for equity-settled share-based payments – – – (2.0) (2.0)
Purchase of own shares – – – 3.5 3.5
Refund of VAT on share issue costs – (1.1) – – (1.1)
At 2 January 2011 (25.8) (1,121.6) (4.3) 472.1 (679.6)
The capital redemption reserve represents the nominal value of the shares purchased and subsequently cancelled under share buy-back programmes.
Shares purchased by the Trinity Mirror Employees’ Benefit Trust (‘the Trust’) are included in retained earnings and other reserves at £12.8 million (2009: £10.6 million), classified as Treasury Shares.
During the period the Trust purchased 4,000,000 shares for a consideration of £4.1 million. The Trust received a payment of £3.5 million from the Company and utilised £0.6 million of cash held by the Trust to purchase these shares. During the period 310,854 shares were released to senior managers relating to the grant made in 2007 under the Deferred Share Award Plan approved in 2006.
Cumulative goodwill written off to reserves in respect of continuing businesses acquired prior to 1998 is £25.9 million (2009: £25.9 million). On transition to IFRS, the revalued amounts of freehold properties were deemed to be the cost of the asset and the revaluation reserve hasbeen transferred to retained earnings and other reserves.

Notes to the consolidated financial statements continued
Trinity Mirror plc 84 Annual Report & Accounts 2010
29 Called-up share capital2010
Number2010 £m
2009 Number
2009 £m
Authorised
Ordinary shares of 10 pence each 450,000,000 (45.0) 450,000,000 (45.0)
2010 Number
2010 £m
2009 Number
2009 £m
Allotted, called-up and fully paid ordinary shares of 10 pence each
Opening balance 257,690,520 (25.8) 257,690,355 (25.8)
Shares issued – – 165 –
Closing balance 257,690,520 (25.8) 257,690,520 (25.8)
The Company has one class of share capital, being ordinary shares with a nominal value of 10 pence each. The Company’s ordinary shares give the shareholders equal rights to vote, receive dividends and to the repayment of capital. There are no restrictions on these shares in relation to the distribution of dividends and the repayment of capital. In 2009, 165 shares were issued under the Group’s Savings-RelatedShare Option Scheme at a price of 453.3 pence per share.
An employee benefit trust administered by the trustee Barclays Wealth Trustees (Guernsey) Limited holds shares of the Company for subsequent transfer to employees under a restricted share plan. At 2 January 2011 the trust held 90,855 shares (2009: 90,855 shares) with a carrying value of £445,523 (2009: £445,523) and a market value of £63,144 (2009: £136,828) in the Company, none of which (2009: none) had options granted over them under the restricted share plan. Dividends on the shares are payable at an amount of 0.01 pence(2009: 0.01 pence) per share in the event that the Group declares any dividends. Shares held by the trust have been excluded from theweighted average number of shares used in the calculation of earnings per share.
The lowest closing price of the shares during the year was 64.5 pence (2009: 19.8 pence) and the highest closing price was 171.5 pence(2009: 192.0 pence). The closing share price as at the reporting date was 69.5 pence (2009: 150.6 pence).
Share option schemesUnder the terms of the Group’s various share option schemes, the following options to subscribe for shares were outstanding:
Scheme Grant datesNumber
of sharesExercise
prices Exercise dates
Executive approved 2000–2003 41,412 396–544p May 2003–Aug 2013
Executive unapproved 2000–2003 612,762 396–544p May 2003–Aug 2013
Long-Term Incentive Plan and Deferred Share Award PlanThe Long-Term Incentive Plan (LTIP) was approved by shareholders at the Annual General Meeting on 6 May 2004 and the Trinity Mirror Employee Benefit Trust (‘the Trust’) was established in Jersey and is administered by the trustee Appleby Trust (Jersey) Limited.An amendment to the LTIP rules was approved by shareholders at the Annual General Meeting on 4 May 2006 and a new plan, the Deferred Share Award Plan (DSAP), was also approved. At the reporting date the Trust holds shares of the Company for subsequent transfer to employees under the terms of the LTIP as Performance Share awards if they vest on 14 March 2011, 3 April 2012 and 28 May 2013 and under the terms of the DSAP as Deferred Share awards if they vest on 14 March 2011, 3 April 2012 and 28 May 2013. The exercise price of the granted awards is £1 for each block of awards granted.
At the reporting date, the Trust held 5,414,484 shares (2009: 1,725,338 shares) with a carrying value of £12,761,217 (2009: £10,582,768)and a market value of £3,763,066 (2009: £2,598,359). In addition, the Trust holds cash to purchase future shares of £7,866 (2009: £554,122). The costs associated with the Trust are included in the consolidated income statement as they accrue. Shares held by the Trust have been excluded from the weighted average number of shares used in the calculation of earnings per share.

Wh
o w
e a
reB
usin
ess r
evie
wG
ove
rna
nc
eF
ina
nc
ials
Trinity Mirror plc Annual Report & Accounts 2010 85
30 Share premium account2010 £m
2009 £m
Opening balance (1,120.5) (1,120.5)
Refund of VAT on share issue costs (1.1) –
Closing balance (1,121.6) (1,120.5)
During the period £1.1 million was credited to share premium for a cash receipt relating to a VAT refund on share issue costs relating toprior periods.
31 Operating lease commitmentsTotal commitments under non-cancellable operating leases:
Vehicles,plant and
equipment2010
£m
Property 2010
£m
Vehicles,plant and
equipment2009
£m
Property2009
£m
Within one year (2.5) (10.1) (1.6) (10.1)
Later than one and less than five years (3.1) (35.2) (1.9) (34.5)
After five years – (19.1) – (25.8)
(5.6) (64.4) (3.5) (70.4)
Total future minimum lease payments with tenants under non-cancellable property operating leases:
2010 £m
2009 £m
Within one year 1.9 2.1
Later than one and less than five years 5.0 4.9
After five years 2.6 3.7
9.5 10.7

Notes to the consolidated financial statements continued
Trinity Mirror plc 86 Annual Report & Accounts 2010
32 Share-based paymentsThe charge related to share-based payments during the period was £2.1 million (2009: £3.2 million).
Executive share option schemeThe Company operates an existing share option scheme under which executive directors and senior management are granted options. Following the introduction of the Long-Term Incentive Plan in 2004, no further options have been granted under this scheme. The Group has applied the requirements of IFRS 2 in accordance with the transitional provisions to all grants of equity instruments after 7 November 2002that had not vested as of 3 January 2005.
Options are exercisable between three and 10 years from the date of grant subject to the continued employment of the participant and achievement of earnings per share performance. In addition, 50% of each grant of an option to each individual is subject to a total shareholder return comparison against the FTSE Mid-250 index of companies on the date of grant. The other 50% is subject to a comparison of totalshareholder return with a group of about 20 other media companies. No vesting of options will take place unless the Company’s ranking is at least median.
Movements in share options granted pre 7 November 2002 are as follows:
2010 Number of options
2009 Number of options
Options outstanding at start of period 798,680 1,992,600
Lapsed during the year (328,854) (1,193,920)
Options outstanding at end of period 469,826 798,680
The weighted average share price at the date of lapse for share options lapsed during the period was 103.7 pence (2009: 74.5 pence).The options outstanding at 2 January 2011 had a weighted average exercise price of 470.5 pence (2009: 497.5 pence) and a weighted average contractual life of one year (2009: one year). There were no share options exercised during the current or prior period.
Details of the share options outstanding and the weighted average exercise price of options granted post 7 November 2002 are as follows:
Number of options Exercise price
Granted post 7 November 2002:
– 28 February 2003 184,348 395.5p
Movements in share options granted post 7 November 2002 are as follows:
OOptions granted 28 February 2003
OOptions granted7 August 2003
2010 2009 2010 2009
Options outstanding at end of period 184,348 505,689 – 653,368
Lapsed during the year – (321,341) – (653,368)
Options outstanding at end of period 184,348 184,348 – –
The options outstanding at 2 January 2011 had a weighted average exercise price of 395.5 pence (2009: 395.5 pence) and a weightedaverage contractual life of two years (2009: three years). No share options were exercised and none lapsed during the current or prior period.The weighted average share price at the date of lapse for share options lapsed during the prior period was 68.5 pence.
The estimated fair values at the date of grant of the share options granted on 28 February 2003 was £375,145. The fair value was calculatedusing a stochastic (Monte-Carlo binomial) model at the date of grant. The inputs to the model were: expected volatility 27.0%, expected life 6.0 years, expected dividend yield 4.4% and risk-free rate 3.9%. Expected volatility was determined by calculating the historical volatility of the Company’s share price over a period prior to the grant date that is commensurate with the length of the expected life of the option. The expected life of the options used in the model is a weighted average driven by simulated share price movements in the model.

Wh
o w
e a
reB
usin
ess r
evie
wG
ove
rna
nc
eF
ina
nc
ials
Trinity Mirror plc Annual Report & Accounts 2010 87
32 Share-based payments continued
Long-Term Incentive Plan and Deferred Share Award PlanUnder these schemes, the Remuneration Committee can recommend the grant of awards of shares to an eligible employee. From 2006, awards have taken the form of Performance Shares or Deferred Shares. Prior to 2006 awards took the form of Performance Shares and Matching Shares. All awards prior to 2008 have lapsed. Full details of how the schemes operate are explained on page 48 of theRemuneration Report.
The vesting period is three years and is subject to continued employment of the participant. The Performance Shares granted in 2008, 2009 and 2010 vest if targets measuring the Company’s total shareholder return against the performance of a comparator group of companies are met. The Deferred Shares have no performance conditions.
The movement in the number of Performance Shares and Deferred Shares during the period was:
2010 Deferred
Shares
2010 Performance
Shares
2009 Deferred
Shares
2009 Performance
Shares
Awards outstanding at start of period 1,008,452 3,301,407 1,199,765 2,769,046
Granted during the period 1,629,900 1,724,886 36,796 1,345,382
Lapsed during the period (22,620) (664,147) (13,357) (813,021)
Exercised during the period (310,854) – (214,752) –
Awards outstanding at end of period 2,304,878 4,362,146 1,008,452 3,301,407
The share price at the date of grant for both the Performance Shares and the Deferred Shares was 99.8 pence (2009: 28.5 pence). The weighted average share price at the date of lapse for awards lapsed during the period was 141.6 pence (2009: 57.1 pence). The weighted average share price at the date of exercise for awards exercised during the period was 120.1 pence (2009: 89.3 pence).
The estimated fair values at the date of grant of the shares awarded are as follows:
Awarded in2010
£
Awarded in2009
£
Awarded in 2008
£
Performance Shares 1,054,000 194,000 1,504,000
Deferred Shares 1,627,000 9,000 1,943,000
The fair values for the Performance Shares were calculated using a stochastic (Monte-Carlo binominal) model and for the Deferred Shares a modified Black-Scholes calculation at the date of grant. The inputs to the model for awards from 2008 were as follows:
Performanceaward
2010
Deferredaward
2010
Performanceaward 2009
Deferredaward 2009
Performanceaward 2008
Deferred award 2008
Expected volatility (%) 101.5 – 80.5 – 22.8 –
Expected life (years) 3.0 3.0 3.0 3.0 3.0 3.0
Expected dividend yield (%) – – – – 8.0 –
Risk-free (%) 1.4 – 2.1 – 3.9 –
Expected volatility has been determined by calculating the historical volatility of the Company’s share price over the three year period prior to the grant date. The exercise price used in the model is £nil as the exercise price of the granted awards is £1 for each block of awards granted.

Notes to the consolidated financial statements continued
Trinity Mirror plc 88 Annual Report & Accounts 2010
32 Share-based payments continued
Savings-Related Share Option SchemeIn 2006, options were granted over 2,917,754 shares at a subscription price of 453.3 pence per share under the terms of the Savings-Related Share Option Scheme. The estimated fair value of the options was £3,706,597. The fair values were calculated using a modified Black-Scholes calculation at the date of grant. The inputs to the model were: expected volatility 20.3%, expected life 3.25 years, expected dividend yield 3.9% and risk free rate 4.4%. Expected volatility has been determined by calculating the historical volatility of the Company’s share price overthe three year period prior to the grant date.
The movement in the number of shares under option during the period was:
2010 £m
2009 £m
Options outstanding at start of period – 1,328,348
Exercised during the period – (165)
Lapsed during the period – (1,328,183)
Awards outstanding at end of period – –
The weighted average share price for the options lapsed during the prior period was 137.9 pence. The weighted average share price for theoptions exercised during the prior period was 70.5 pence.
33 Retirement benefit schemes
Defined benefit pension schemesThe Group operates 10 defined benefit pension schemes for certain employees which were closed to new entrants with effect from 1 January 2003 and closed to future accrual from 31 March 2010. All employees have the option to join the Trinity Mirror Pension Plan,a defined contribution pension scheme.
Formal valuations of the defined benefit pension schemes are carried out regularly. The actuarial methods and assumptions used to calculateeach scheme’s assets and liabilities vary according to the actuarial and funding policies adopted by their respective trustees. All of the schemes are being funded in accordance with the recommendations of the respective actuaries. The most significant of the schemes are the Mirror Group Pension Scheme (the ‘Old Scheme’), the MGN Past Service Pension Scheme (the ‘Past Service Scheme’), the MGN Pension Scheme (the ‘MGN Scheme’), the Trinity Retirement Benefit Scheme (the ‘Trinity Scheme’) and the Midland Independent Newspapers Pension Scheme (the ‘MIN Scheme’) which together represent the majority of the aggregate value of the schemes assets and liabilities.
The Old Scheme and the Past Service Scheme cover the liabilities for service up to 13 February 1992 for employees and former employeeswho worked regularly on the production and distribution of Mirror Group’s newspapers. The Old Scheme was closed on 13 February 1992and the Past Service Scheme was established to meet the liabilities, which are not satisfied by payments from the Old Scheme and theMaxwell Communications Pension Plan or by the State. The last formal valuation of these schemes was completed in October 2008 for valuation date as at 31 December 2007 and showed a deficit of £106.6 million. During 2010, £14.1 million was paid into the schemes (2009: £6.5 million). For 2011, agreement has been reached with the trustees to pay £14.1 million into the schemes. The next full actuarialvaluation of the schemes is 31 December 2010. The valuation of the schemes is likely to be completed in 2011.
The last formal valuations were completed in June 2010 for valuation date as at 30 June 2009 for the Trinity Scheme, in October 2008 for valuation date as at 31 December 2007 for the MGN Scheme and in June 2008 for valuation date as at 31 March 2007 for the MIN Scheme.These valuations showed deficits of £102.2 million, £55.7 million and £28.2 million respectively. During 2010 deficit funding payments were £6.2 million (2009: £2.3 million), £7.0 million (2009: £4.8 million) and £2.5 million (2009: £2.4 million) respectively. For 2011, agreement has been reached with the trustees to pay £6.2 million, £7.0 million and £2.5 million respectively into these schemes. The next full actuarial valuation dates for these schemes are: Trinity Scheme 30 June 2012, the MGN Scheme 31 December 2010 and the MIN Scheme 31 March 2010. The valuations of the MGN Scheme and the MIN Scheme are likely to be completed in 2011.
For the purposes of the Group’s annual consolidated financial statements, valuations have been performed in accordance with the requirements of IAS 19 with scheme liabilities calculated using a consistent projected unit valuation method and compared to the valueof the scheme assets at 31 December 2010, the last day prior to the reporting date for which such values were available. IFRIC 14 has been adopted and has had no impact on the retirement benefit assets or obligations. Following detailed consideration and legal advice on therecoverability of pension scheme surpluses we are no longer applying the asset ceiling.

Wh
o w
e a
reB
usin
ess r
evie
wG
ove
rna
nc
eF
ina
nc
ials
Trinity Mirror plc Annual Report & Accounts 2010 89
33 Retirement benefit schemes continuedThe assets and liabilities of the most significant schemes included above as at the reporting date are:
O S /Old Scheme/Past Service
Scheme£m
MGN Scheme
£m
Trinity Scheme
£m
MIN Scheme
£m
Present value of scheme liabilities (750.1) (381.7) (314.5) (187.7)
Fair value of scheme assets 602.3 323.9 360.7 171.2
Scheme (deficit)/surplus (147.8) (57.8) 46.2 (16.5)
Based on actuarial advice, the assumptions used in calculating the scheme liabilities and the actuarial value of those liabilities and the expected return on scheme assets are:
2010 %
2009 %
Principal annual actuarial assumptions used:
Discount rate 5.40 5.70
Retail price inflation rate 3.45 3.50
Consumer price inflation rate 2.70 –
Expected return on scheme assets 4.80–6.40 5.00–6.90
Expected rate of salary increases – 3.75
Pension increases:
Pre 6 April 1997 pensions 2.60–5.00 3.00–5.00
Post 6 April 1997 pensions 3.10–3.75 3.40–3.75
In deferment 2.70–3.45 3.50
The impact on the defined benefit obligation at the reporting date to variations in key assumptions are: a 0.25% decrease in the discount ratewould increase the obligation by £60 million, a 0.25% increase in the inflation assumptions would increase the obligation by £40 million and the effect of a one year increase in assumed life expectancy would increase the obligation by £60 million.
Post-retirement mortality tables and future life expectancies at age 65 are:
Future life expectancy (years) for a
pensioner currently aged 65
Future life expectancy (years) at age 65 for
a non-pensionercurrently aged 55
Male Female Male Female
At 31 December 2006 18.6 21.3 19.6 22.4
At 30 December 2007 20.1 23.0 21.6 24.4
At 28 December 2008 21.4 23.8 23.2 25.6
At 3 January 2010 21.6 24.0 23.4 25.7
At 2 January 2011 21.7 24.1 23.5 25.8

Notes to the consolidated financial statements continued
Trinity Mirror plc 90 Annual Report & Accounts 2010
33 Retirement benefit schemes continuedThe amount included in the consolidated balance sheet, consolidated income statement and consolidated statement of comprehensive income arising from the Group’s obligations in respect of its defined benefit pension schemes is as follows:
2010 £m
2009 £m
2008 £m
2007 £m
2006 £m
Present value of scheme liabilities (1,685.1) (1,683.1) (1,378.8) (1,538.5) (1,511.0)
Fair value of scheme assets 1,524.1 1,398.1 1,233.6 1,458.9 1,322.9
Effect of asset ceiling – (11.6) (61.7) (45.2) (24.9)
Net scheme deficit (161.0) (296.6) (206.9) (124.8) (213.0)
Non-current asset – retirement benefit assets 61.1 – – – –
Non-current liabilities – retirement benefit obligations (222.1) (296.6) (206.9) (124.8) (213.0)
Net scheme deficit (161.0) (296.6) (206.9) (124.8) (213.0)
Net scheme deficit included in consolidated balance sheet (161.0) (296.6) (206.9) (124.8) (213.0)
Deferred tax included in consolidated balance sheet 43.5 83.0 57.9 34.9 63.9
Net scheme deficit after deferred tax (117.5) (213.6) (149.0) (89.9) (149.1)
2010 £m
2009 £m
Current service cost (4.6) (14.6)
Past service costs – (0.9)
Total included in staff costs (4.6) (15.5)
Curtailment gain 7.9 4.3
Past service costs (8.3) 5.6
Total included in non-recurring items (0.4) 9.9
Expected return on scheme assets 85.5 76.7
Interest cost on pension scheme liabilities (92.6) (87.2)
Pension finance charge (7.1) (10.5)
Total included in the consolidated income statement (12.1) (16.1)
2010 £m
2009 £m
2008 £m
2007£m
2006 £m
Effect of changes in actuarial assumptions on scheme liabilities 16.7 (294.1) 231.9 12.9 68.1
Experience adjustments on scheme liabilities 8.1 2.0 (23.0) 9.1 0.9
Experience adjustments on scheme assets 76.1 136.3 (349.5) (6.0) 15.5
Effect of asset ceiling 11.6 50.1 (16.5) (20.3) (21.8)
Consolidated statement of comprehensive income 112.5 (105.7) (157.1) (4.3) 62.7
The cumulative amount of actuarial gains and losses recognised in the consolidated statement of comprehensive income since adoption of IFRS is losses of £58.7 million (2009: £171.2 million).
Pension schemes assets include no direct investments in the Company’s ordinary shares nor any property assets occupied or other assetsused by the Group for any period.
Up to 31 March 2010, prior to closure of the schemes to future accrual, the contribution rates for the Group’s most significant schemes range from 15.0% to 20.0% of pensionable salaries. The contributions made during the year totalled £35.2 million (2009: £32.1 million). The Group expects to contribute approximately £35 million to its defined benefit pension schemes in 2011.
The movement in liabilities during the period includes a £80.1 million benefit due to the government announced changes in state pensionincreases being linked to CPI instead of RPI which impacts most deferred pensions in the Group’s schemes.

Wh
o w
e a
reB
usin
ess r
evie
wG
ove
rna
nc
eF
ina
nc
ials
Trinity Mirror plc Annual Report & Accounts 2010 91
33 Retirement benefit schemes continued2010 £m
2009 £m
Changes in the fair value of scheme assets:
Opening fair value of scheme assets 1,398.1 1,233.6
Expected return 85.5 76.7
Actuarial gains 76.1 136.3
Contributions by employer 35.2 32.1
Employee contributions 1.2 6.3
Benefits paid (78.0) (86.9)
Annuity contract 6.0 –
Closing fair value of scheme assets 1,524.1 1,398.1
The actual return on scheme assets was £161.6 million (2009: £213.0 million).2010 £m
2009 £m
Changes in the present value of scheme liabilities:
Opening present value of scheme liabilities (1,683.1) (1,378.8)
Current service cost (4.6) (14.6)
Past service costs (8.3) 4.7
Curtailment gain 7.9 4.3
Interest cost (92.6) (87.2)
Actuarial gain/(losses) 24.8 (292.1)
Employee contributions (1.2) (6.3)
Benefits paid 78.0 86.9
Annuity contract (6.0) –
Closing present value of scheme liabilities (1,685.1) (1,683.1)
2010 £m
2009 £m
Fair value of scheme assets:
UK equities 299.4 290.2
US equities 98.3 76.4
Other overseas equities 252.7 227.2
Property 20.6 3.1
Corporate bonds 487.3 461.0
Fixed interest gilts 43.1 31.0
Index linked gilts 231.3 177.4
Cash and other 91.4 131.8
Fair value of scheme assets 1,524.1 1,398.1

Notes to the consolidated financial statements continued
Trinity Mirror plc 92 Annual Report & Accounts 2010
33 Retirement benefit schemes continued2010
%2009
%
Expected nominal rates of return on plan assets:
Equities 8.10 8.00
Property 6.30 6.40
Corporate bonds 5.40 5.70
Fixed interest gilts 4.20 4.50
Index linked gilts 4.00 4.20
Cash 4.10 4.40
For each scheme the expected return on assets has been derived as the weighted average of the expected returns from each of the main asset classes. The expected return for each asset class reflects a combination of historical performance analysis, the forward-looking viewsof the financial markets as suggested by the yields available and the views of investment organisations.
Defined contribution pension schemesThe Group operates two defined contribution pension schemes for qualifying employees, the Southnews Money Purchase Scheme which isclosed to new members and the Trinity Mirror Pension Plan. The assets of the schemes are held separately from those of the Group in fundsunder the control of trustees. The current service cost charged to the consolidated income statement of £7.0 million (2009: £1.1 million) represents contributions payable to these schemes by the Group at rates specified in the scheme rules. Contributions that were due havebeen paid over to the schemes at both reporting dates.
34 Financial instruments
Capital risk managementThe Group manages its capital to ensure that entities in the Group will be able to continue as a going concern while maximising the returnto shareholders through an optimal balance of debt and equity. The capital structure of the Group consists of debt, which includes the borrowings (note 25), cash and cash equivalents (note 19) and equity attributable to equity holders of the parent comprising share capital and reserves (note 28).
Gearing ratioThe Board reviews the capital structure, including the level of gearing and interest cover, as required. As part of this review, the Boardconsiders the cost of capital and the risks associated with each class of capital.
The gearing ratio and interest cover at the reporting date were as follows:
20 02010 £m
2009 £m
Net debt (note 27) (237.3) (299.8)
EBITDA 177.9 130.9
Net debt to EBITDA 1.3 2.3
Operating profit (note 38) 123.3 105.4
Total interest expense (note 10) (16.1) (22.4)
Interest cover 7.7 4.7
Net debt is defined as long-term and short-term borrowings and includes derivative financial instruments less cash and cash equivalents.EBITDA is stated after non-recurring items with the exception of the impairments of intangible assets and fixed assets. Operating profit isbefore non-recurring items and amortisation.
For 2010 the financial covenants attached to the bank facility are a minimum interest cover of 2.5 times and a maximum net debt to EBITDA ratio of 3.75 times. For 2011 the minimum interest cover increases to 2.75 times and net debt to EBITDA decreases to 3.5 times. As a result of the cash generated by the Group during 2010 at the end of the year the Group cash balance increased from £61.2 million to £116.2 million.
The financial covenants in respect of the US$ private placement loan notes remained unchanged during 2010, requiring minimum interest cover of 2.0 times and for net debt to EBITDA a maximum cover of 4.0 times. The financial covenants are the same in 2011.
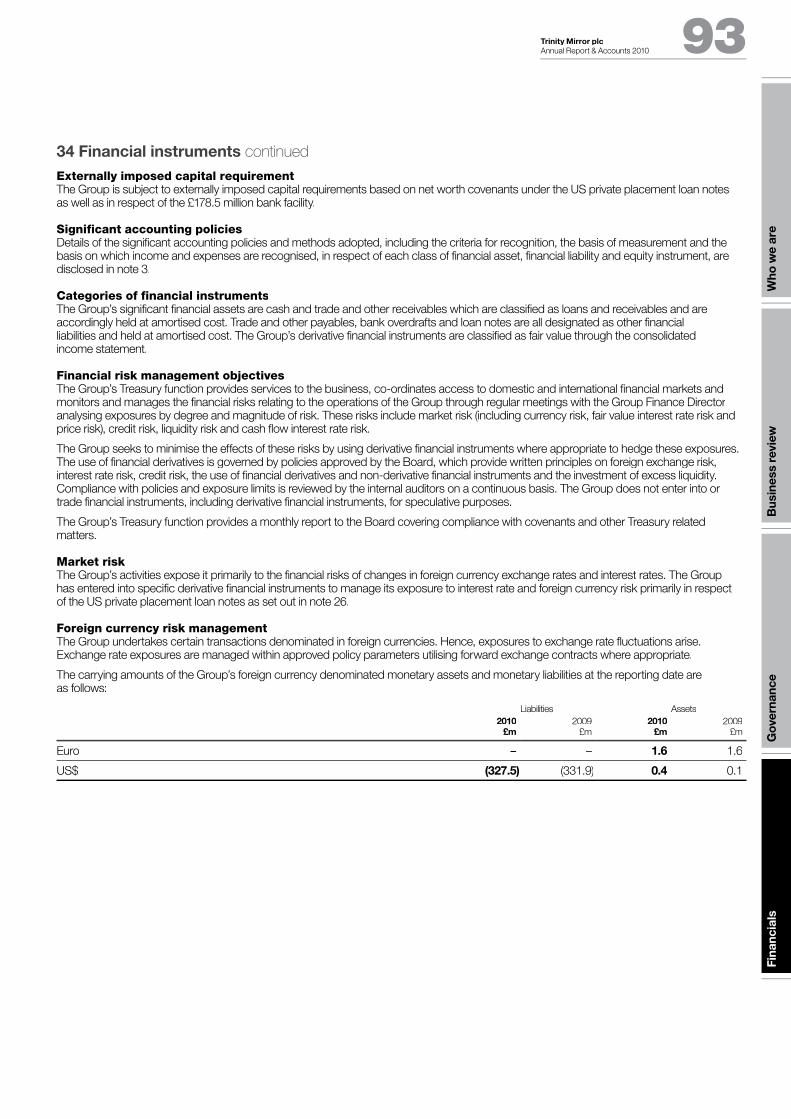
Wh
o w
e a
reB
usin
ess r
evie
wG
ove
rna
nc
eF
ina
nc
ials
Trinity Mirror plc Annual Report & Accounts 2010 93
34 Financial instruments continued
Externally imposed capital requirementThe Group is subject to externally imposed capital requirements based on net worth covenants under the US private placement loan notesas well as in respect of the £178.5 million bank facility.
Significant accounting policiesDetails of the significant accounting policies and methods adopted, including the criteria for recognition, the basis of measurement and the basis on which income and expenses are recognised, in respect of each class of financial asset, financial liability and equity instrument, are disclosed in note 3.
Categories of financial instrumentsThe Group’s significant financial assets are cash and trade and other receivables which are classified as loans and receivables and areaccordingly held at amortised cost. Trade and other payables, bank overdrafts and loan notes are all designated as other financial liabilities and held at amortised cost. The Group’s derivative financial instruments are classified as fair value through the consolidated income statement.
Financial risk management objectivesThe Group’s Treasury function provides services to the business, co-ordinates access to domestic and international financial markets andmonitors and manages the financial risks relating to the operations of the Group through regular meetings with the Group Finance Directoranalysing exposures by degree and magnitude of risk. These risks include market risk (including currency risk, fair value interest rate risk andprice risk), credit risk, liquidity risk and cash flow interest rate risk.
The Group seeks to minimise the effects of these risks by using derivative financial instruments where appropriate to hedge these exposures. The use of financial derivatives is governed by policies approved by the Board, which provide written principles on foreign exchange risk,interest rate risk, credit risk, the use of financial derivatives and non-derivative financial instruments and the investment of excess liquidity. Compliance with policies and exposure limits is reviewed by the internal auditors on a continuous basis. The Group does not enter into ortrade financial instruments, including derivative financial instruments, for speculative purposes.
The Group’s Treasury function provides a monthly report to the Board covering compliance with covenants and other Treasury related matters.
Market riskThe Group’s activities expose it primarily to the financial risks of changes in foreign currency exchange rates and interest rates. The Grouphas entered into specific derivative financial instruments to manage its exposure to interest rate and foreign currency risk primarily in respect of the US private placement loan notes as set out in note 26.
Foreign currency risk managementThe Group undertakes certain transactions denominated in foreign currencies. Hence, exposures to exchange rate fluctuations arise. Exchange rate exposures are managed within approved policy parameters utilising forward exchange contracts where appropriate.
The carrying amounts of the Group’s foreign currency denominated monetary assets and monetary liabilities at the reporting date areas follows:
Liabilities Assets
2010£m
2009 £m
2010 £m
2009 £m
Euro – – 1.6 1.6
US$ (327.5) (331.9) 0.4 0.1

Notes to the consolidated financial statements continued
Trinity Mirror plc 94 Annual Report & Accounts 2010
34 Financial instruments continued
Foreign currency sensitivity analysisThe Group is mainly exposed to the Euro and US$.
The Euro exposure arises on sales of newspapers in Europe. The Euro sales represent less than 1% (2009: 2%) of Group revenue.The Euros are kept on deposit and used to fund Euro costs. When Euros on deposit build to a target balance they are converted into sterling. The Group does not hedge the Euro income or deposits because the risk of foreign exchange movements is not deemed to be significant.
The US$ exposure arises on the US private placement loan notes which are mainly US$ denominated and fixed interest. At the time of theUS private placement loan notes issue the Group entered into cross-currency interest rate swaps to change the US$ principal and US$ fixed interest profile of the debt to sterling principal and sterling floating interest. The timing of the swaps exactly match every private placementprincipal and interest payment due. As a result the Group is not subject to any US$ foreign exchange exposure on its US private placement loan notes and matching swaps. The Group’s consolidated balance sheet shows the US private placement loan notes converted to sterlingat the reporting date currency rate. The matching swaps are carried at fair value which represents the value of the fixed to floating swap, thecurrency element of the principal payments due and the currency element of the interest payments due. The difference between the valuation approaches gives rise to a charge or credit to the consolidated income statement.
The following tables detail the Group’s sensitivity to a 10% increase and decrease in the sterling rate against the Euro and US$ in the currentand prior period. A 10% movement in exchange rates based on the level of foreign currency denominated monetary assets and liabilitiesrepresents the assessment of a reasonably possible change in foreign exchange rates. The sensitivity analysis includes only outstanding foreign currency denominated monetary items including external loans, that are unhedged.
Euro currency impact S$US$ currency impact
10% strengthening of sterling2010
£m2009
£m2010
£m2009
£m
Decrease in profit (0.2) (0.2) – –
Decrease in equity – – – –
Euro currency impact US$ iUS$ currency impact
10% weakening of sterling2010
£m2009 £m
2010£m
2009 £m
Increase in profit 0.2 0.1 – –
Increase in equity – – – –
Forward foreign exchange contractsIt is the policy of the Group to enter into forward foreign exchange contracts only to cover specific foreign currency payments such as significant capital expenditure. During the current and prior period no contracts were entered into.
Interest rate risk managementThe Group is exposed to interest rate risk as it borrows funds at both fixed and floating interest rates. The risk is managed by the Groupby maintaining an appropriate mix between fixed and floating rate borrowings, by the use of interest rate swap contracts and forward interest rate contracts. Hedging activities are evaluated regularly to align with interest rate views and defined risk appetite, ensuring optimal hedging strategies are applied, by either positioning the balance sheet or protecting interest expense through interest rate cycles.
The Group’s exposures to interest rates on the financial assets and liabilities are detailed in the liquidity risk management section of this note.

Wh
o w
e a
reB
usin
ess r
evie
wG
ove
rna
nc
eF
ina
nc
ials
Trinity Mirror plc Annual Report & Accounts 2010 95
34 Financial instruments continued
Interest rate sensitivity analysisThe sensitivity analyses below have been determined based on the exposure to interest rates for both derivatives and non-derivative instruments at the reporting date. For floating rate liabilities, the analysis is prepared using the Group’s monthly cash forecasting model.A 2% increase in interest rates has been used and represents the assessment of a reasonably possible change.
If interest rates had been 2% higher/lower and all other variables were held constant, the Group’s profit for the period would decrease/increase by £7.6 million (2009: £7.6 million). This is mainly attributable to the Group’s exposure to interest rates on its variable rate borrowings.
Interest rate swap contractsUnder interest rate swap contracts, the Group agrees to exchange the difference between fixed and floating rate interest amounts calculated on agreed notional principal amounts. Such contracts enable the Group to mitigate the risk of changing interest rates on the fair value of issued fixed rate debt held and the cash flow exposures on the issued variable rate debt held. The fair value of the interest rate swaps at the reporting date is determined by discounting the future cash flows using yield curves at the reporting date and the credit risk inherent in thecontract and is disclosed below. In calculating fair value, consideration has been given to the turmoil in the financial markets.
In October 2008, an interest rate swap was entered into which converted the floating rate interest payments on £180.0 million of principal intofixed for a period of 12 months to October 2009. In April 2009, it was agreed with the counterparties in respect of £135.0 million of principalto extend the settlement date until October 2010. In October 2009, the swap in respect of £45.0 million principal was settled on the due date. In October 2010, the swap in respect of the outstanding principal of £135.0 million was settled on the due date.
Other price risksThe Group has no listed equity investments and is not directly exposed to equity price risk. The Group does not actively trade theseinvestments. The Group has indirect exposure through its defined benefit pension schemes.
Credit risk managementCredit risk refers to the risk that a counterparty with the Group will default on its contractual obligations resulting in financial loss to the Group. The Group has adopted a policy of only dealing with creditworthy counterparties. The Group only transacts with financial institutions that are rated the equivalent to investment grade and above. This information is supplied by independent rating agencies where available and, if not,the Group uses other publicly available financial information and its own trading records to rate its major customers. The Group’s exposure and credit ratings of its counterparties are reviewed by the Board at appropriate times and the aggregate value of transactions concluded isspread amongst approved counterparties.
Trade receivables consist of a large number of customers spread across diverse sectors. Ongoing credit evaluation is performed on thefinancial condition of trade receivables.
The Group does not have any significant credit risk exposure to any single counterparty or any group of counterparties having similar characteristics. The Group defines counterparties as having similar characteristics if they are connected entities. Concentration of credit risk with a single counterparty is limited by reference to the long-term credit ratings assigned for that counterparty by Standard and Poor’s. The credit risk on liquid funds and derivative financial instruments is limited because the counterparties are banks with high credit ratings assigned by international credit rating agencies.
The carrying amount of financial assets recorded in the financial statements, which is net of impairment losses, represents the Group’smaximum exposure to credit risk.
The table below shows the internal credit limit and amount on deposit with the Group’s major counterparties at the reporting date using the Standard and Poor’s credit rating symbols:
Financial Institution Location Rating
2010Credit limit
£m
2010 Balance
£m
2009 Credit limit
£m
2009 Balance
£m
HSBC London AA 75.0 – 50.0 0.1
Santander UK London AA 75.0 15.2 20.0 15.0
Lloyds TSB Bank plc London A+ 25.0 88.2 50.0 34.1
Barclays Bank plc London A+ 25.0 – 50.0 1.1
National Westminster Bank London A+ 25.0 7.1 50.0 6.0
Royal Bank of Scotland plc London A+ 25.0 4.2 20.0 4.9
Ulster Bank plc Dublin A 5.0 1.5 20.0 –
The Board agreed that due to the risk profile of Lloyds TSB Bank plc with its substantial government stake and it offering a marginally betterrate of interest, the Group would hold the majority of its cash with Lloyds TSB Bank plc. This remains under review and cash balances will fall materially after repayment of the £145.4 million of loan notes due in October 2011.

Notes to the consolidated financial statements continued
Trinity Mirror plc 96 Annual Report & Accounts 2010
34 Financial instruments continued
Liquidity risk managementLiquidity risk results from having insufficient financial resources to meet day-to-day fluctuations in working capital and cash flow. Ultimate responsibility for liquidity risk management rests with the Board. The Group manages liquidity risk by maintaining adequatereserves, banking facilities and reserve borrowing facilities, by continuously monitoring forecast and actual cash flows and by matchingthe maturity profiles of financial assets and liabilities.
Liquidity risk and interest risk tablesThe following tables detail the Group’s remaining contractual maturity for its non-derivative and derivative financial instruments. The tableshave been drawn up based on undiscounted cash flows of financial liabilities based on the earliest date on which the Group could be required to pay. The table includes both principal and interest cash flows. Where the amount payable or receivable is not fixed, the amountdisclosed has been determined by reference to the projected interest and foreign currency rates as illustrated by the yield curves existing at the reporting date.
Less than 1 year
£m1–2 years
£m2–3 years
£m3–4 years
£m4–5 years
£m
More than5 years
£m
2010
Non-derivative financial instruments:
Sterling variable interest rate – – – – – –
Sterling fixed interest rate 17.9 0.7 0.7 10.4 – –
Non-sterling fixed interest rate 145.3 78.2 61.8 37.8 4.7 71.0
Derivative financial instruments:
Financial assets 145.3 78.2 61.8 7.8 4.7 71.0
Financial liabilities (136.2) (73.5) (57.6) (35.6) (2.9) (68.3)
2009
Non-derivative financial instruments:
Sterling variable interest rate – – – – – –
Sterling fixed interest rate 1.9 17.9 0.7 0.7 10.4 –
Non-sterling fixed interest rate 26.3 140.9 75.9 59.9 36.7 73.4
Derivative financial instruments:
Financial assets 26.3 140.9 75.9 59.9 36.7 73.4
Financial liabilities (14.3) (143.8) (77.8) (60.8) (37.8) (75.4)
The non-derivative financial instruments include the US private placement loan notes, bank overdrafts, finance leases and the bank facility. The non-sterling fixed interest rate liabilities arise on the Group’s US private placement loan notes. The related swaps are shown under derivative instruments.
Swaps are gross settled and each leg of the swap is split into either a financial asset or liability. The weighted average effective interest rateis set out in note 25.
The Group has access to financial facilities of which the total unused amount is £178.5 million (2009: £178.5 million) at the reporting date. The Group expects to meet its other obligations from cash held on deposit, operating cash flows and its committed financing facilities.
Fair value of financial instrumentsThe fair value of the Group’s financial liabilities are set out in note 25.

Wh
o w
e a
reB
usin
ess r
evie
wG
ove
rna
nc
eF
ina
nc
ials
Trinity Mirror plc Annual Report & Accounts 2010 97
35 Related party transactionsThe immediate parent and controlling party of the Group is Trinity Mirror plc. Transactions between the Company and its subsidiaries, whichare related parties of the Company, have been eliminated on consolidation and are not disclosed in this note. Transactions with the retirement benefit schemes are disclosed in note 33. Details of other related party transactions are disclosed below.
Trading transactionsThe Group traded with the following associated undertakings and joint ventures: PA Group Limited and fish4 Limited (up to 13 October 2010). This trade generated revenue of £nil (2009: £nil) and the Group incurred charges for services received of £4.5 million (2009: £4.9 million). Financial support of £nil (2009: £0.5 million) was provided during the period.
Sales of goods and services to related parties were made at the Group’s usual list prices less average volume discounts. Purchases weremade at market prices discounted to reflect volume purchase and the relationship between the parties. Any outstanding amounts will be settled by cash payment.
Compensation of key management personnelKey management personnel of the Group comprise the non-executive directors and members of the Executive Committee (which includesall of the executive directors) and their remuneration during the period was as follows:
2010 £m
2009 £m
Short-term employee benefits (5.1) (5.4)
Retirement benefits (0.7) (0.7)
Share-based payments in the period (1.2) (1.4)
Termination of employment payments – (0.3)
(7.0) (7.8)
The remuneration of directors and other key executives is determined by the Remuneration Committee having regard to competitive marketposition and performance of individuals. Further information regarding the remuneration of individual directors is provided in the RemunerationReport on pages 47 to 52.

Notes to the consolidated financial statements continued
Trinity Mirror plc 98 Annual Report & Accounts 2010
36 Acquisitions
GMG Regional MediaOn 28 March 2010 the Group acquired the trade and assets of GMG Regional Media.
2010 £m
Recognised amounts of identifiable assets acquired and liabilities assumed:
Trade and other receivables 12.3
Inventory 0.3
Property, plant and equipment 10.3
Identifiable intangible assets 30.0
Trade and other payables (4.1)
Deferred tax (10.5)
Total identifiable assets 38.3
Negative goodwill (23.6)
Total consideration 14.7
Satisfied by:
Initial cash consideration 7.4
Additional payment for working capital 2.5
Contract cancellation 4.8
Total consideration 14.7
Trade and other receivables include trade receivables with a gross value of £10.1 million reduced by a bad debt provision of £0.4 million and prepayments of £2.6 million.
The negative goodwill of £23.6 million arising on the acquisition has been taken to non-recurring items included in administrative expenses in the consolidated income statement. The negative goodwill arises due to the value of the identifiable assets acquired and liabilities assumedare more than the total consideration. The negative goodwill is not taxable for income tax purposes.
The contract cancellation of £4.8 million relates to the value ascribed to a pre-existing print contract which was terminated as part of theacquisition consideration and has been taken to non-recurring items included in administrative expenses in the consolidated income statement. The accounting gain is not taxable for income tax purposes.
Acquisition related transaction costs, included in non-recurring items within administrative expenses in the consolidated income statement,amounted to £1.1 million.
GMG Regional Media contributed £50.9 million to the Group’s revenue and £5.7 million to the Group’s profit for the period between the dateof acquisition and the reporting date.
fish4The Group took control of the 50% interest in fish4 not previously controlled on 13 October 2010. The consideration was £1 and the fair value of assets transferred was £0.9 million and the fair value of liabilities transferred was £0.9 million. The assets include trade receivables with agross value of £0.6 million reduced by a bad debt provision of £0.4 million, prepayments of £0.2 million, cash of £0.2 million, deferred tax of £0.2 million and other debtors of £0.2 million.
fish4 contributed £0.9 million to the Group’s revenue and a loss of £0.4 million to the Group’s profit for the period between the date of fullcontrol and the reporting date.
Impact on results for the periodIf control of both GMG Regional Media and fish4 had been completed on the first day of the reporting period, the Group’s revenue for theperiod would have been £781.0 million and the Group’s operating profit for the period would have been £136.9 million.

Wh
o w
e a
reB
usin
ess r
evie
wG
ove
rna
nc
eF
ina
nc
ials
Trinity Mirror plc Annual Report & Accounts 2010 99
37 DisposalsThere were no disposals during 2010. During 2009 the Group disposed of Globespan Media Limited realising a loss on disposal of £2.4 million.
2009 £m
Goodwill (0.6)
Other intangible assets (1.1)
Trade and other receivables (0.7)
Net assets (2.4)
Loss on disposal (2.4)
Total consideration –
38 Reconciliation of statutory results to adjusted results
52 weeks ended 2 January 2011SStatutory
results£m
Non-recurring items
£ma
Amortisation£mb
Financecosts
£mc
Tax legislationchanges
£md
Adjustedresults
£m
Revenue 761.5 – – – – 761.5
Operating profit 138.0 (20.7) 6.0 – – 123.3
Profit before tax 123.7 (20.7) 6.0 (7.5) – 101.5
Profit after tax 113.3 (28.2) 4.4 (5.5) (11.4) 72.6
Basic earnings per share (pence) 44.6 (11.0) 1.7 (2.2) (4.5) 28.6
53 weeks ended 3 January 2010SStatutory
results £m
Non-recurring items
£ma
Amortisation£mb
Financecosts
£mc
Tax legislationchanges
£md
Adjustedresults
£m
Revenue 763.3 – – – – 763.3
Operating profit 87.0 11.3 7.1 – – 105.4
Profit before tax 42.0 11.3 7.1 12.3 – 72.7
Profit after tax 29.3 7.8 5.1 8.9 – 51.1
Basic earnings per share (pence) 11.5 3.0 2.0 3.5 – 20.0
a Details of non-recurring items are set out in note 8.a
b Amortisation of other intangible assets.c Impact of the translation of foreign currency borrowings and fair value changes on derivative financial instruments.c
d Tax legislation changes relates to the impact of the change in the tax rate from 28% to 27% on the opening deferred tax position in 2010.

Trinity Mirror plc100 Annual Report & Accounts 2010
Opinion on other matters prescribed by the Companies Act 2006In our opinion:
– the part of the directors’ remuneration report to be audited has been properly prepared in accordance with the Companies Act 2006; and
– the information given in the directors’ report for the 52 weeks ended 2 January 2011 for which the financial statements are prepared is consistent with the parent company financial statements.
Matters on which we are required to report by exceptionWe have nothing to report in respect of the following matters wherethe Companies Act 2006 requires us to report to you if, in our opinion:
– adequate accounting records have not been kept by the parentcompany, or returns adequate for our audit have not been receivedfrom branches not visited by us; or
– the parent company financial statements and the part of the directors’ remuneration report to be audited are not in agreementwith the accounting records and returns; or
– certain disclosures of directors’ remuneration specified by law are not made; or
– we have not received all the information and explanations we require for our audit.
Other matterWe have reported separately on the consolidated financial statements of Trinity Mirror plc for the 52 weeks ended 2 January 2011.
Panos Kakoullis(Senior Statutory Auditor)
for and on behalf of Deloitte LLPChartered Accountants and Statutory AuditorLondon, UK3 March 2011
Independent auditor’s report to the members of Trinity Mirror plcWe have audited the parent company financial statements of Trinity Mirror plc for the 52 weeks ended 2 January 2011 which comprise the parent company balance sheet, and the related notes 1 to 14. The financial reporting framework that has been applied in theirpreparation is applicable law and United Kingdom AccountingStandards (United Kingdom Generally Accepted Accounting Practice).
This report is made solely to the Company’s members, as a body, in accordance with Chapter 3 of Part 16 of the Companies Act 2006. Our audit work has been undertaken so that we might state to the Company’s members those matters we are required to state to them in an auditor’s report and for no other purpose. To the fullest extentpermitted by law, we do not accept or assume responsibility to anyone other than the Company and the Company’s members as a body, for our audit work, for this report, or for the opinions we have formed.
Respective responsibilities of directors and auditorAs explained more fully in the statement of directors’ responsibilitieson page 53, the directors are responsible for the preparation of the parent company financial statements and for being satisfied that theygive a true and fair view. Our responsibility is to audit and express an opinion on the parent company financial statements in accordancewith applicable law and International Standards on Auditing (UK and Ireland). Those standards require us to comply with the AuditingPractices Board’s Ethical Standards for Auditors.
Scope of the audit of the financial statementsAn audit involves obtaining evidence about the amounts and disclosures in the financial statements sufficient to give reasonable assurance that the financial statements are free from materialmisstatement, whether caused by fraud or error. This includes an assessment of: whether the accounting policies are appropriate to the parent company’s circumstances and have been consistently applied and adequately disclosed; the reasonableness of significant accounting estimates made by the directors; and the overall presentation of the financial statements.
Opinion on financial statementsIn our opinion the parent company financial statements:
– give a true and fair view of the state of the Company’s affairs as at 2 January 2011;
– have been properly prepared in accordance with United KingdomGenerally Accepted Accounting Practice; and
– have been prepared in accordance with the requirements of the Companies Act 2006.
Parent company accounts
Neither an audit nor a review provides assurance on the maintenance and integrity of the website, including controls used to achieve this, and in particular whether any changes may have occurred to the financial information since first published. These matters are the responsibility of the directors but no control procedures can provide absolute assurance in this area. Legislation in the United Kingdom governing the preparation and dissemination of financial information differs from legislation in other jurisdictions.

Wh
o w
e a
reB
usin
ess r
evie
wG
ove
rna
nc
eF
ina
nc
ials
Trinity Mirror plc Annual Report & Accounts 2010 101
Notes2010
£m2009
£m
Fixed assets
Investments 4 1,572.9 1,571.6
1,572.9 1,571.6
Current assets
Debtors
– due within one year 5 1,897.0 1,188.1
– due after more than one year 5 12.6 428.3
Cash at bank and in hand 82.3 15.1
1,991.9 1,631.5
Creditors: amounts falling due within one year
Borrowings 7 (140.0) (4.2)
Other creditors 8 (1,945.9) (1,588.7)
(2,085.9) (1,592.9)
Net current (liabilities)/assets (94.0) 38.6
Total assets less current liabilities 1,478.9 1,610.2
Creditors: amounts falling due after more than one year
Borrowings 7 (226.1) (357.9)
Deferred tax liabilities 6 (7.3) (4.9)
(233.4) (362.8)
Net assets before pension scheme assets 1,245.5 1,247.4
Pension scheme assets 9 2.9 –
Net assets 1,248.4 1,247.4
Equity capital and reserves
Called-up share capital 10 25.8 25.8
Share premium account 11 1,121.6 1,120.5
Capital redemption reserve 12 4.3 4.3
Profit and loss account 12 96.7 96.8
Equity shareholders’ funds 1,248.4 1,247.4
These parent company financial statements were approved by the Board of directors and authorised for issue on 3 March 2011. They weresigned on its behalf by:
Sly Bailey Vijay VaghelaChief Executive Group Finance Director
Parent company balance sheetat 2 January 2011 (3 January 2010) Company registration number 82548
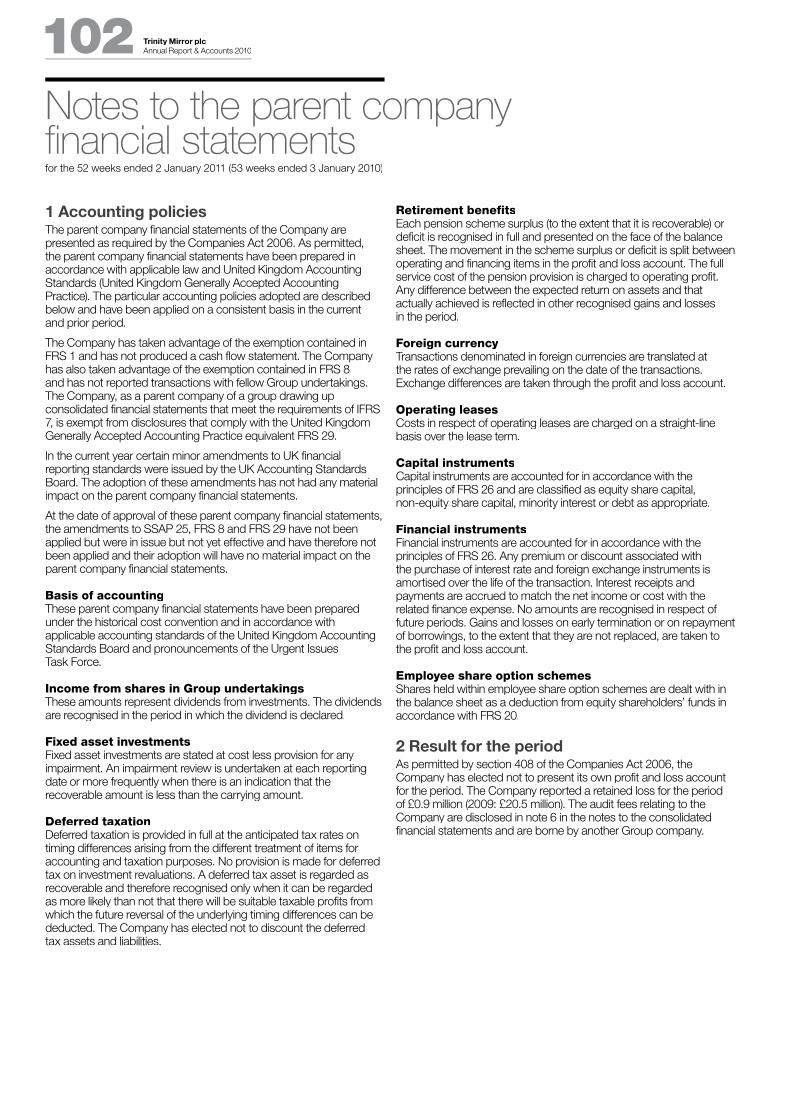
Trinity Mirror plc102 Annual Report & Accounts 2010
Retirement benefitsEach pension scheme surplus (to the extent that it is recoverable) ordeficit is recognised in full and presented on the face of the balancesheet. The movement in the scheme surplus or deficit is split between operating and financing items in the profit and loss account. The full service cost of the pension provision is charged to operating profit.Any difference between the expected return on assets and thatactually achieved is reflected in other recognised gains and lossesin the period.
Foreign currencyTransactions denominated in foreign currencies are translated atthe rates of exchange prevailing on the date of the transactions. Exchange differences are taken through the profit and loss account.
Operating leasesCosts in respect of operating leases are charged on a straight-linebasis over the lease term.
Capital instrumentsCapital instruments are accounted for in accordance with theprinciples of FRS 26 and are classified as equity share capital,non-equity share capital, minority interest or debt as appropriate.
Financial instrumentsFinancial instruments are accounted for in accordance with the principles of FRS 26. Any premium or discount associated with the purchase of interest rate and foreign exchange instruments is amortised over the life of the transaction. Interest receipts andpayments are accrued to match the net income or cost with the related finance expense. No amounts are recognised in respect of future periods. Gains and losses on early termination or on repayment of borrowings, to the extent that they are not replaced, are taken to the profit and loss account.
Employee share option schemesShares held within employee share option schemes are dealt with inthe balance sheet as a deduction from equity shareholders’ funds in accordance with FRS 20.
2 Result for the periodAs permitted by section 408 of the Companies Act 2006, the Company has elected not to present its own profit and loss account for the period. The Company reported a retained loss for the period of £0.9 million (2009: £20.5 million). The audit fees relating to theCompany are disclosed in note 6 in the notes to the consolidatedfinancial statements and are borne by another Group company.
1 Accounting policiesThe parent company financial statements of the Company arepresented as required by the Companies Act 2006. As permitted, the parent company financial statements have been prepared in accordance with applicable law and United Kingdom AccountingStandards (United Kingdom Generally Accepted Accounting Practice). The particular accounting policies adopted are described below and have been applied on a consistent basis in the currentand prior period.
The Company has taken advantage of the exemption contained in FRS 1 and has not produced a cash flow statement. The Company has also taken advantage of the exemption contained in FRS 8 and has not reported transactions with fellow Group undertakings. The Company, as a parent company of a group drawing up consolidated financial statements that meet the requirements of IFRS 7, is exempt from disclosures that comply with the United Kingdom Generally Accepted Accounting Practice equivalent FRS 29.
In the current year certain minor amendments to UK financial reporting standards were issued by the UK Accounting Standards Board. The adoption of these amendments has not had any material impact on the parent company financial statements.
At the date of approval of these parent company financial statements, the amendments to SSAP 25, FRS 8 and FRS 29 have not beenapplied but were in issue but not yet effective and have therefore notbeen applied and their adoption will have no material impact on the parent company financial statements.
Basis of accountingThese parent company financial statements have been prepared under the historical cost convention and in accordance with applicable accounting standards of the United Kingdom Accounting Standards Board and pronouncements of the Urgent Issues Task Force.
Income from shares in Group undertakingsThese amounts represent dividends from investments. The dividendsare recognised in the period in which the dividend is declared.
Fixed asset investmentsFixed asset investments are stated at cost less provision for anyimpairment. An impairment review is undertaken at each reporting date or more frequently when there is an indication that the recoverable amount is less than the carrying amount.
Deferred taxationDeferred taxation is provided in full at the anticipated tax rates ontiming differences arising from the different treatment of items for accounting and taxation purposes. No provision is made for deferredtax on investment revaluations. A deferred tax asset is regarded asrecoverable and therefore recognised only when it can be regardedas more likely than not that there will be suitable taxable profits from which the future reversal of the underlying timing differences can bededucted. The Company has elected not to discount the deferred tax assets and liabilities.
Notes to the parent company financial statementsfor the 52 weeks ended 2 January 2011 (53 weeks ended 3 January 2010)

Wh
o w
e a
reB
usin
ess r
evie
wG
ove
rna
nc
eF
ina
nc
ials
Trinity Mirror plcAnnual Report & Accounts 2010103
3 Staff costsThe average number of persons, including directors, employed by and charged to the Company in the period was:
2010Number
2009Number
Administration 8 8
A number of employees (not directors) who have contracts of employment with the Company are charged to other Group companies and their staff costs are disclosed in those companies’ statutory accounts.
All employees are employed in the United Kingdom.
2010£m
2009£m
Staff costs, including directors’ emoluments, incurred during the period were:
Wages and salaries 3.3 3.3
Social security costs 0.6 0.6
Share-based payments 0.7 1.2
Pension costs 0.5 0.5
5.1 5.6
Disclosure of individual directors’ remuneration, share options, long-term incentive schemes, pension contributions and pension entitlements required by the Companies Act 2006 and those elements specified for audit by the Financial Services Authority are shown in the tables in the Remuneration Report on pages 47 to 52 and form part of these parent company financial statements.
4 InvestmentsS GShares in Group
undertakings£m
Cost
At 3 January 2010 1,951.6
Share-based payments debit in subsidiary undertakings 1.3
At 2 January 2011 1,952.9
Provisions for impairment (380.0)
Net book value
At 3 January 2010 1,571.6
At 2 January 2011 1,572.9
The principal subsidiary undertakings of the Company are set out in note 14.
5 Debtors2010
£m2009
£m
Amounts falling due within one year:
Amounts owed by subsidiary undertakings 1,896.7 1,187.1
Other debtors 0.3 1.0
1,897.0 1,188.1
Amounts falling due after more than one year:
Amounts owed by subsidiary undertakings – 428.3
Derivative financial instruments 12.6 –
12.6 428.3
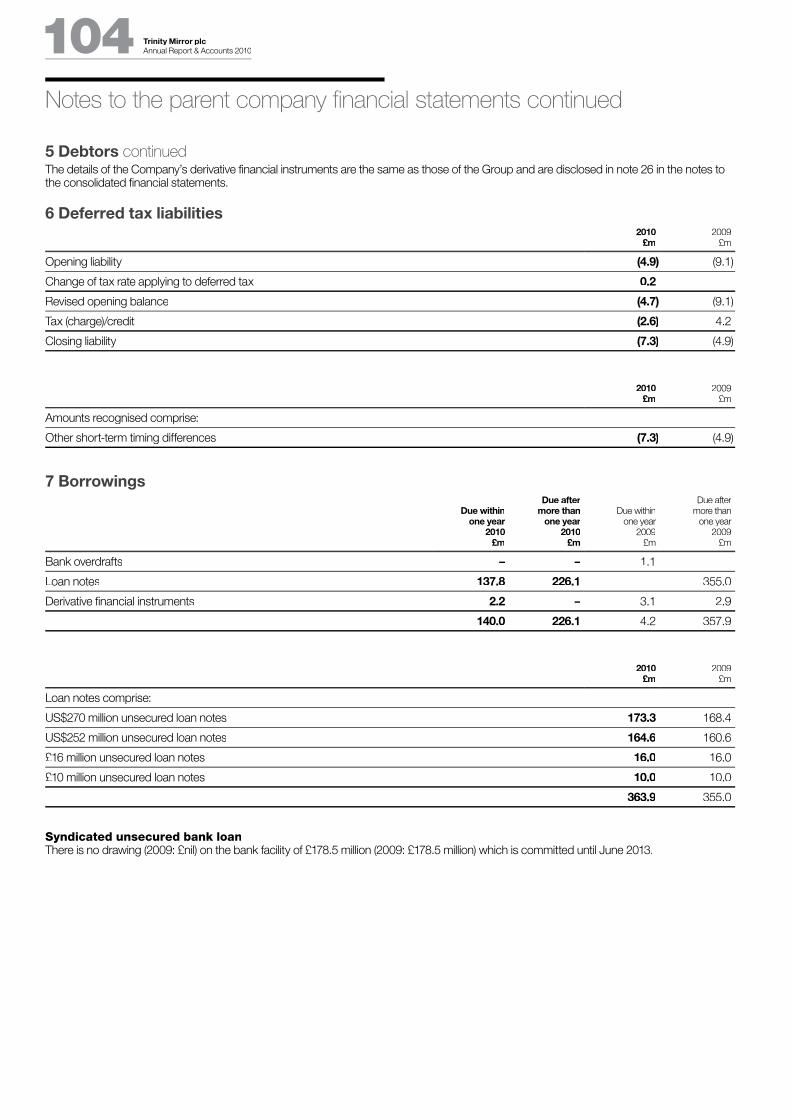
Trinity Mirror plc104 Annual Report & Accounts 2010
5 Debtors continuedThe details of the Company’s derivative financial instruments are the same as those of the Group and are disclosed in note 26 in the notes tothe consolidated financial statements.
6 Deferred tax liabilities2010
£m2009
£m
Opening liability (4.9) (9.1)
Change of tax rate applying to deferred tax 0.2 –
Revised opening balance (4.7) (9.1)
Tax (charge)/credit (2.6) 4.2
Closing liability (7.3) (4.9)
2010£m
2009£m
Amounts recognised comprise:
Other short-term timing differences (7.3) (4.9)
7 Borrowings
Due withinone year
2010£m
Due aftermore than
one year2010
£m
Due withinone year
2009£m
Due aftermore than
one year2009
£m
Bank overdrafts – – 1.1 –
Loan notes 137.8 226.1 – 355.0
Derivative financial instruments 2.2 – 3.1 2.9
140.0 226.1 4.2 357.9
2010£m
2009£m
Loan notes comprise:
US$270 million unsecured loan notes 173.3 168.4
US$252 million unsecured loan notes 164.6 160.6
£16 million unsecured loan notes 16.0 16.0
£10 million unsecured loan notes 10.0 10.0
363.9 355.0
Syndicated unsecured bank loanThere is no drawing (2009: £nil) on the bank facility of £178.5 million (2009: £178.5 million) which is committed until June 2013.
Notes to the parent company financial statements continued

Wh
o w
e a
reB
usin
ess r
evie
wG
ove
rna
nc
eF
ina
nc
ials
Trinity Mirror plc Annual Report & Accounts 2010105
7 Borrowings continued
US$270 million and £16 million unsecured loan notesOn 24 October 2001, the Group issued unsecured loan notes totalling US$350 million and £22 million through a private placing in the United States and United Kingdom respectively. The outstanding balance of the loan notes consist of three series of loan notes totalling US$270 million and £16 million with different interest rates and maturities as follows:
US$190 million 7.04% fixed rate Series B notes due 24 October 2011 £16 million 7.3% fixed rate Series D notes due 24 October 2011US$80 million 7.19% fixed rate Series C notes due 24 October 2013
All the notes are repayable in full on maturity. Both the capital repayments and interest payments under the US$ denominated loan notes have been swapped into floating rate sterling through the use of cross-currency interest rate swaps. At 2 January 2011, £189.3 million (2009: £184.4 million) (net of costs) remains outstanding under these loan notes. The costs of the issue are being written off over the term of the notes.
US$252 million and £10 million unsecured loan notesOn 20 June 2002, the Group issued unsecured loan notes totalling US$252 million and £10 million through a private placing in the United States and United Kingdom respectively. The placing consisted of four series with different interest rates and maturities as follows:
US$102 million 7.17% Series A notes due 20 June 2012US$50 million 7.27% Series B notes due 20 June 2014 £10 million 7.14% Series D notes due 20 June 2014 US$100 million 7.42% Series C notes due 20 June 2017
All the loan notes are repayable in full on maturity. Both the capital repayment and interest payments under the US$ denominated loan notes have been swapped into floating rate sterling through the use of cross-currency interest rate swaps. At 2 January 2011, £174.6 million (2009: £170.6 million) (net of costs) remains outstanding under these loan notes. The costs of the issue are being written off over the term of the notes.
Derivative financial instrumentsThe details of the Company’s derivative financial instruments are the same as those of the Group and are disclosed in note 26 in the notesto the consolidated financial statements.
8 Other creditors2010
£m2009
£m
Amounts owed to subsidiary undertakings 1,936.4 1,579.6
Other creditors 0.6 1.3
Accruals and deferred income 8.9 7.8
1,945.9 1,588.7

Trinity Mirror plc106 Annual Report & Accounts 2010
9 Pension scheme assets and liabilitiesThe Company contributes to a number of the Group’s defined benefit pension schemes which operate for employees of a number of Group companies and is the sponsoring company for the Trinity Mirror plc Retirement Plan (the ‘Scheme’). The Company accounts for the Scheme in these parent company financial statements. The Company has announced the closure of this scheme to future accrual from 31 March 2010. For the schemes where the Company is not the sponsoring company, it is impracticable for the Company to identify its share of theunderlying assets and liabilities and under FRS 17 the actual cost of providing pensions to these schemes is charged to the profit and lossaccount as incurred during the period.
The pension credit before tax in the Company’s profit and loss account in the period was £0.3 million (2009: £0.2 million).
Based on actuarial advice, the financial assumptions used in calculating the Scheme’s liabilities under FRS 17 are:
2010%
2009%
2008%
2007%
2006%
Inflation rate 3.45 3.50 2.75 3.30 3.00
Discount rate 5.40 5.70 6.50 5.80 5.10
Expected return on Scheme’s assets 4.90 5.80 6.20 5.80 5.90
Expected rate of salary increases – 3.75 3.25 4.35 4.00
Rate of pension increases in payment: pre 6/04/97 pensions 3.75 3.75 3.50 3.80 3.00
Rate of pension increases in payment: post 6/04/97 pensions 3.75 3.75 3.50 3.80 3.00
Rate of pension increase in deferment 2.70 3.50 2.75 3.30 3.00
Mortality rates are as follows:
2010Years
2009Years
2008Years
2007Years
2006Years
Future life expectancy for a pensioner currently aged 65:
– male 21.7 21.6 21.4 20.1 18.6
– female 24.1 24.0 23.8 23.0 21.3
Future life expectancy at age 65 for a non-pensioner currently aged 55:
– male 23.5 23.4 23.2 21.6 19.6
– female 25.8 25.7 25.6 24.4 22.4
Expected contributions and deficit payments for 2011 are £nil million and £0.6 million respectively.
The amount included in the balance sheet in respect of the Scheme is as follows:
2010£m
2009£m
2008£m
2007£m
2006£m
Fair value of the Scheme’s assets 24.3 17.1 15.8 16.7 13.6
Actuarial value of the Scheme’s liabilities (20.3) (12.7) (11.2) (14.5) (14.7)
Net surplus/(deficit) 4.0 4.4 4.6 2.2 (1.1)
Irrecoverable surplus – (4.4) (4.6) (2.2) –
Deferred tax (1.1) – – – 0.3
Net surplus/(deficit) 2.9 – – – (0.8)
The movement in liabilities during the period includes a £0.5 million benefit due to the government announced changes in state pension increases being linked to CPI instead of RPI which impacts deferred pensions in the Scheme.
Notes to the parent company financial statements continued

Wh
o w
e a
reB
usin
ess r
evie
wG
ove
rna
nc
eF
ina
nc
ials
Trinity Mirror plc Annual Report & Accounts 2010107
9 Pension scheme assets and liabilities continuedThe movement in the surplus/(deficit) during the period is analysed below:
2010£m
2009£m
2008£m
2007£m
2006£m
Opening surplus/(deficit) in the Scheme 4.4 4.6 2.2 (1.1) (3.6)
Current service cost – (0.1) (0.2) (0.2) (0.2)
Contributions 0.5 1.2 2.1 2.8 1.9
Pension finance credit 0.3 0.3 0.2 – –
Actuarial (losses)/gains (1.2) (1.6) 0.3 0.7 0.8
Net surplus/(deficit) 4.0 4.4 4.6 2.2 (1.1)
The expected rates of return on each class of assets and the market value of assets, in the Scheme are:
Expectedrate of
return at2010
%
Marketvalue at
2010£m
Expectedrate of
return at2009
%
Marketvalue at
2009£m
Expectedrate of
return at2008
%
Marketvalue at
2008£m
Expectedrate of
return at2007
%
Marketvalue at
2007£m
Expectedrate of
return at2006
%
Marketvalue at
2006£m
UK equities 8.10 2.90 8.00 2.90 7.90 2.70 7.90 4.40 8.00 4.20
US equities 8.10 – 8.00 – 7.90 – 7.90 – 8.00 –
Other overseas equities 8.10 1.20 8.00 1.30 7.90 1.30 7.90 1.80 8.00 1.60
Property 6.30 – 6.40 – 7.00 – 6.50 – 6.00 –
Corporate bonds 5.40 6.40 5.70 7.10 6.50 7.60 5.80 0.50 5.10 0.50
Fixed interest gilts 4.20 – 4.50 – 3.90 – 4.60 4.90 4.50 2.40
Index linked gilts 4.00 7.00 4.20 5.70 4.20 3.90 4.50 3.80 4.40 3.50
Cash 4.10 6.80 4.40 0.10 3.60 0.30 4.35 1.30 4.00 1.40
24.3 17.10 15.80 16.70 13.60
The movement in the fair value of Scheme’s assets during the period is analysed below:
2010£m
2009£m
2008£m
2007£m
2006£m
Opening fair value of Scheme’s assets 17.1 15.8 16.7 13.6 11.4
Expected return on Scheme’s assets 0.9 1.0 1.0 0.8 0.7
Actuarial gain/(loss) on Scheme’s assets 1.2 1.4 (2.7) 0.2 0.4
Contributions 0.5 1.2 2.1 2.8 1.8
Benefits paid (1.4) (2.3) (1.3) (0.7) (0.7)
Annuity contract 6.0 – – – –
Closing fair value of Scheme’s assets 24.3 17.1 15.8 16.7 13.6
The profit and loss account is analysed below:
2010£m
2009£m
2008£m
2007£m
2006£m
Profit and loss account excluding pension scheme 93.8 96.8 115.3 608.9 589.3
Pension scheme 2.9 – – – (0.8)
Profit and loss account 96.7 96.8 115.3 608.9 588.5
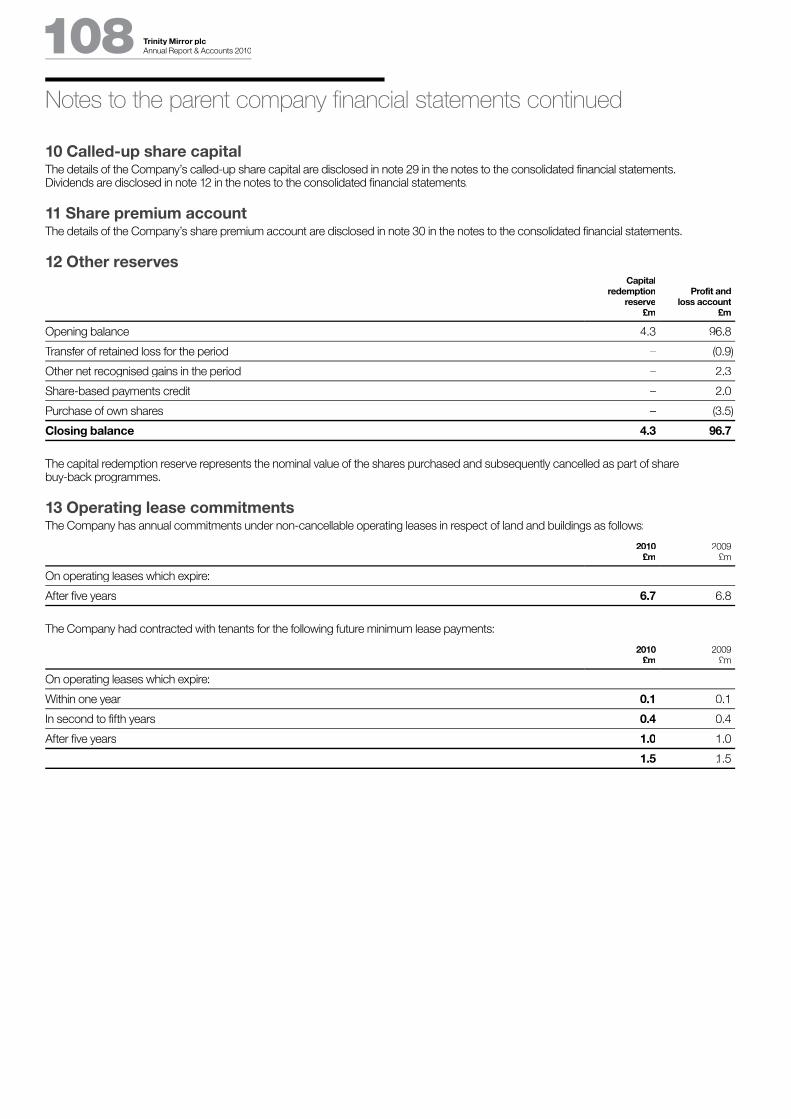
Trinity Mirror plc108 Annual Report & Accounts 2010
10 Called-up share capitalThe details of the Company’s called-up share capital are disclosed in note 29 in the notes to the consolidated financial statements. Dividends are disclosed in note 12 in the notes to the consolidated financial statements.
11 Share premium accountThe details of the Company’s share premium account are disclosed in note 30 in the notes to the consolidated financial statements.
12 Other reservesC i lCapital
redemptionreserve
£m
Profit andloss account
£m
Opening balance 4.3 96.8
Transfer of retained loss for the period – (0.9)
Other net recognised gains in the period – 2.3
Share-based payments credit – 2.0
Purchase of own shares – (3.5)
Closing balance 4.3 96.7
The capital redemption reserve represents the nominal value of the shares purchased and subsequently cancelled as part of share buy-back programmes.
13 Operating lease commitmentsThe Company has annual commitments under non-cancellable operating leases in respect of land and buildings as follows:
2010£m
2009£m
On operating leases which expire:
After five years 6.7 6.8
The Company had contracted with tenants for the following future minimum lease payments:
2010£m
2009£m
On operating leases which expire:
Within one year 0.1 0.1
In second to fifth years 0.4 0.4
After five years 1.0 1.0
1.5 1.5
Notes to the parent company financial statements continued

Wh
o w
e a
reB
usin
ess r
evie
wG
ove
rna
nc
eF
ina
nc
ials
Trinity Mirror plc Annual Report & Accounts 2010109
14 Principal subsidiariesDetails of the Company’s principal subsidiaries, all of which are incorporated in the United Kingdom, at 2 January 2011 are as follows:
Principal activityProportion of ordinary
shares held %
Subsidiary undertakings
MGL2 Limited Holding company 100.00*
Trinity Mirror Regionals plc Holding company 100.00*
Trinity Mirror Digital Limited Holding company 100.00*
MGN Limited Newspaper publishing 100.00
Scottish Daily Record and Sunday Mail Limited Newspaper publishing 100.00
Gazette Media Company Limited Newspaper publishing 100.00
NCJ Media Limited Newspaper publishing 100.00
Trinity Mirror Southern Limited Newspaper publishing 100.00
Media Wales Limited Newspaper publishing 100.00
Trinity Mirror North West & North Wales Limited Newspaper publishing 100.00
Trinity Mirror Cheshire Limited Newspaper publishing 100.00
Trinity Mirror Merseyside Limited Newspaper publishing 100.00
Trinity Mirror North Wales Limited Newspaper publishing 100.00
Trinity Mirror Huddersfield Limited Newspaper publishing 100.00
Trinity Mirror Midlands Limited Newspaper publishing 100.00
Scottish and Universal Newspapers Limited Newspaper publishing 100.00
MEN Media Limited Newspaper publishing 100.00
AMRA Limited National advertising sales house 100.00
Trinity Mirror Printing Limited Contract printers 100.00
Trinity Mirror Printing (Blantyre) Limited Contract printers 100.00
Trinity Mirror Printing (Cardiff) Limited Contract printers 100.00
Trinity Mirror Printing (Midlands) Limited Contract printers 100.00
Trinity Mirror Printing (Newcastle) Limited Contract printers 100.00
Trinity Mirror Printing (Oldham) Limited Contract printers 100.00
Trinity Mirror Printing (Saltire) Limited Contract printers 100.00
Trinity Mirror Printing (Teesside) Limited Contract printers 100.00
Trinity Mirror Printing (Watford) Limited Contract printers 100.00
Trinity Mirror Digital Recruitment Limited Online recruitment 100.00
Trinity Mirror Digital Property Limited Online property 100.00
Rippleffect Studio Limited Digital marketing services 100.00
fish4 Limited Online recruitment 53.55**
* Owned directly by the Company.
** Controlled by the Group.
In addition to the companies shown above, the Company also holds investments in a number of other subsidiary undertakings, which inthe directors’ opinion do not significantly affect the figures in the consolidated financial statements. In accordance with Section 410(2)(a) of the Companies Act 2006, a full list of subsidiaries was annexed to the 2010 annual return and submitted to Companies House. A full list of subsidiaries will be submitted to Companies House during 2011.
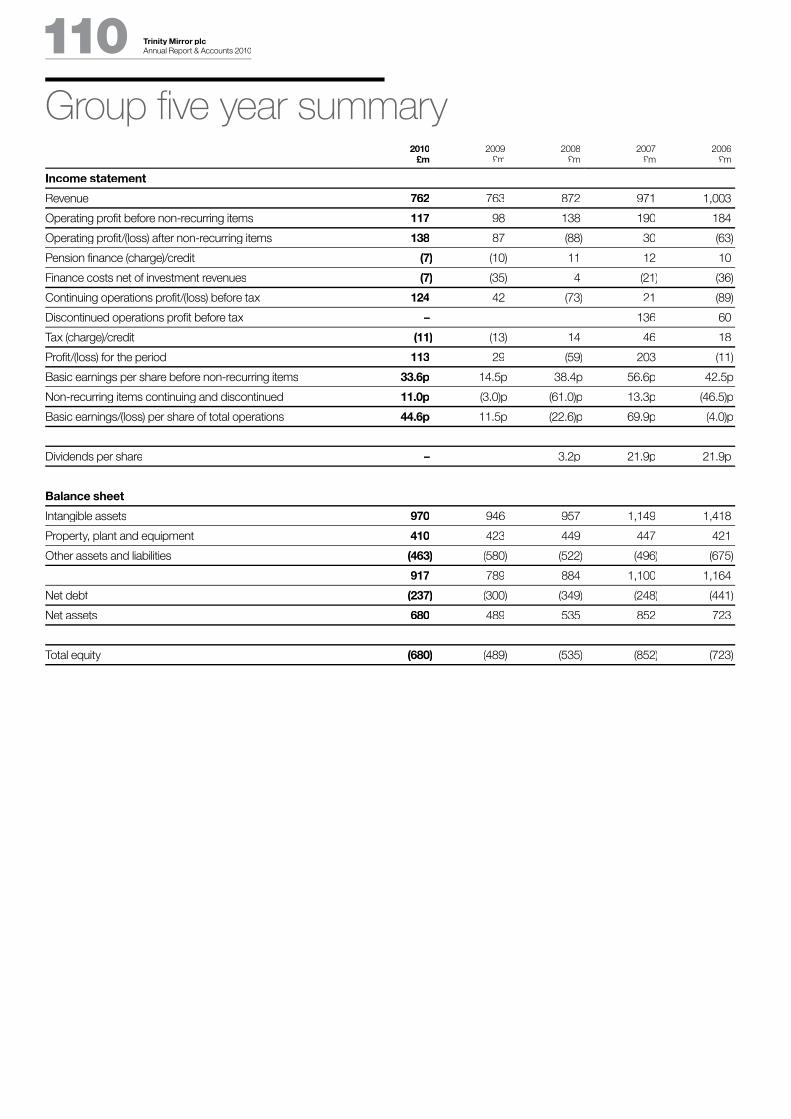
Trinity Mirror plc110 Annual Report & Accounts 2010
2010£m
2009£m
2008£m
2007£m
2006£m
Income statement
Revenue 762 763 872 971 1,003
Operating profit before non-recurring items 117 98 138 190 184
Operating profit/(loss) after non-recurring items 138 87 (88) 30 (63)
Pension finance (charge)/credit (7) (10) 11 12 10
Finance costs net of investment revenues (7) (35) 4 (21) (36)
Continuing operations profit/(loss) before tax 124 42 (73) 21 (89)
Discontinued operations profit before tax – – – 136 60
Tax (charge)/credit (11) (13) 14 46 18
Profit/(loss) for the period 113 29 (59) 203 (11)
Basic earnings per share before non-recurring items 33.6p 14.5p 38.4p 56.6p 42.5p
Non-recurring items continuing and discontinued 11.0p (3.0)p (61.0)p 13.3p (46.5)p
Basic earnings/(loss) per share of total operations 44.6p 11.5p (22.6)p 69.9p (4.0)p
Dividends per share – – 3.2p 21.9p 21.9p
Balance sheet
Intangible assets 970 946 957 1,149 1,418
Property, plant and equipment 410 423 449 447 421
Other assets and liabilities (463) (580) (522) (496) (675)
917 789 884 1,100 1,164
Net debt (237) (300) (349) (248) (441)
Net assets 680 489 535 852 723
Total equity (680) (489) (535) (852) (723)
Group five year summary

Wh
o w
e a
reB
usin
ess r
evie
wG
ove
rna
nc
eF
ina
nc
ials
Trinity Mirror plc Annual Report & Accounts 2010 111Shareholder informationRegistered officeOne Canada SquareCanary WharfLondon E14 5APUnited KingdomTelephone: +44 (0) 207 293 3000Company website: www.trinitymirror.com
Registered in England and Wales No. 82548
Company contactsPaul Vickers, Secretary and Group Legal DirectorClaire Harrison, Investor Relations ManagerNick Fullagar, Director of Corporate CommunicationsVijay Vaghela, Group Finance Director
Annual General MeetingThe Notice of Meeting sets out the resolutions being proposed atthe Annual General Meeting which will be held at 11.00 am onThursday, 12 May 2011 at the Hilton London Canary Wharf, Marsh Wall, London E14 9SH.
AuditorsDeloitte LLP2 New Street SquareLondon EC4A 3BZ
RegistrarsEquiniti LimitedAspect House, Spencer Road,Lancing, West Sussex BN99 6DA
Telephone: 0871 384 2235*For Overseas Shareholders: +44 121 415 7047
* Calls to this number are charged at 8 pence per minute from a BT landline. Calls from other telephone providers may vary. Lines are open from 8.30am to 5.30pm Monday to Friday.
If you have any queries regarding your shareholding, please contact the registrars.
ShareviewShareview is a website operated by Equiniti and gives you access to services over the internet that enable you to check details of yourshareholding at any time. To register for the service, go to www.shareview.co.uk
Share price informationAs well as using the Trinity Mirror website to view details of the current and historical share price, shareholders can find share prices listed in most national newspapers. For a real-time buying or selling price, youshould contact a stockbroker.
ADRsTrinity Mirror has a sponsored Level 1 American Depositary Receipt(ADR) programme for which BNY Mellon acts as Depositary. Each ADR is equivalent to two Trinity Mirror Group ordinary shares.Dividends are paid in US Dollars via the Depositary. Details of theADR programme are as follows:
Exchange: OTC (Over-The-Counter)Symbol: TNMRY CUSIP: 89653Q105Ratio (ADR: Ord) 1:2
For more information, contact:
BNY Mellon, Shareholder ServicesP.O. Box 358516Pittsburgh PA 15252-8516USA
Toll free for US domestic callers: 1-888-BNY-ADRsInternational: 1-201-680-6825Email: [email protected]
Warning to shareholders – boiler room scamsShareholders are advised to be very wary of any unsolicited advice, offers to buy shares at a discount or offers of free company reports.These are typically from overseas based ‘brokers’ who target UK shareholders offering to sell them what often turn out to be worthless or high risk shares in US or UK investments. These operations are commonly known as boiler rooms.
If you receive any unsolicited investment advice:• Make sure you get the correct name of the person and organisation.• Check that they are properly authorised by the FSA before getting involved by visiting www.fsa.gov.uk/pages/register• Report the matter to the FSA either by calling 0300 500 5000 or visiting www.moneymadeclear.fsa.gov.uk• If the calls persist, hang up.
Analysis of share register at 2 January 2011As at 2 January 2011, there were 15,832 holders of ordinary shares whose shareholdings are analysed below:
RangeNumber of
holdingsPercentage of
total holdersTotal number
of sharesPercentage of
ordinary shares
1 – 50 418 2.64% 12,474 0.00%
51 – 100 5,570 35.18% 414,313 0.16%
101 – 500 6,968 44.01% 1,492,192 0.58%
501 – 1,000 1,076 6.80% 788,705 0.31%
1,001 – 10,000 1,462 9.23% 4,161,595 1.61%
10,001 – 50,000 139 0.88% 3,272,655 1.27%
50,001 – 100,000 52 0.33% 3,655,545 1.42%
100,001 – 500,000 73 0.46% 17,812,633 6.91%
500,001 – 1,000,000 29 0.18% 20,594,355 7.99%
1,000,001 + 45 0.28% 205,486,053 79.74%
Totals 15,832 100.00% 257,690,520 100.00%

Trinity Mirror plc112 Annual Report & Accounts 2010
Investor relations
Dividend policyOur dividend policy is to increase dividend progressively whilemaintaining a dividend cover (adjusted earnings per share/dividendper share) of at least 2x if earnings are increasing. However, in light of the challenging trading environment faced by the Group, the Boardconcluded at the 2008 preliminary results that it was prudent to retain maximum financial flexibility for the Group. Therefore, alongsideactions being taken on costs and in other areas of the business, theBoard did not pay a final dividend for 2008 or any dividend for 2009and is not declaring a dividend for 2010.
Online share dealingTrinity Mirror provides an internet-based service called Shareview through Equiniti Limited. The service allows current shareholdersto sign up for e-communication and receive shareholder mailings electronically, buy and sell shares online using Shareview Dealingand send their voting instruction electronically if they have alreadyregistered for Shareview or have received a voting form with an electronic reference. For more information on the service, please see www.trinitymirror.com/ir/services/dealing/
We communicate with the financial community on a regular andongoing basis to support our stakeholders in their investmentdecision process. While the investor relations programme is driven bystatutory reporting requirements, it also contains a strong element of additional communication in the form of meetings and presentations.
Key activitiesIn addition to standard regulatory reporting, key themes in ourcommunications with the financial market in 2010 were themodernisation of business processes and structures throughout theGroup via the implementation of the new operating model, implications of the fragile economic environment, the downturn inadvertising, the acquisition of GMG Regional Media, the strength of our balance sheet, our financing facilities and our pension position.
Key dates in 2010
4 March 2010 Preliminary Results Announcement
13 May 2010 Annual General Meeting
13 May 2010 Interim Management Statement
29 July 2010 Interim Results Announcement
11 November 2010 Interim Management Statement
In 2010, the focus of our investor relations efforts continued to be on institutional investors and analysts. This year we maintained a proactive targeting programme, reaching out to new investors in the UK, Continental Europe and the US. In addition to these marketing efforts, we continued to respond to ad hoc queries and meeting requests from analysts and investors. We held meetings with over40 institutional investors during the year. The largest concentrationof meetings was among UK investors, followed by the US andContinental Europe.
Key dates in 2011
3 March 2011 Preliminary Results Announcement
12 May 2011 Annual General Meeting
12 May 2011 Interim Management Statement
28 July 2011 Interim Results Announcement
10 November 2011 Interim Management Statement
Key contacts
Sly Bailey, Chief Executive
Vijay Vaghela, Group Finance Director
Paul Vickers, Secretary and Group Legal Director
Nick Fullagar, Director of Corporate Communications
Claire Harrison, Investor Relations Equity Analyst
Trinity Mirror share price and traded volumes 2010
Average weekly pry ice Weekly voy lume
200
(p)
180
160
140
120
100
80
60
40
20
0 Jan Feb Mar Apr May Jun Jul Aug Sep Oct Nov Dec 0
40
(m)
36
32
28
24
20
16
12
8
4
Trinity Mirror vs r FTSE 350 Media Index 2010
Trinity Mirror FTSE 350 Media Indexee
0
200
175
150
125
100
75
50
25
Jan Feb Mar Apr May Jun Jul Aug Sep Oct Nov Dec

Design and production: Radley Yeldar www.ry.com

Trinity Mirror plc
Registered offi ce: One Canada SquareCanary WharfLondon E14 5AP+44 (0)20 7293 3000www.trinitymirror.com
Investor Relations
Claire HarrisonTrinity Mirror plcOne Canada SquareCanary WharfLondon E14 5AP+44 (0)20 7510 [email protected]