trinity mirror plc · trinity mirror plc annual report 2016 welcome to the trinity mirror plc...
TRANSCRIPT

Trinity Mirror plcAnnual Report 2016
www.trinitymirror.com
Trinity Mirror p
lc Annual R
eport 2016

Trinity Mirror plc Annual Report 2016
Welcome to the Trinity Mirror plc Annual Report for the 53 weeks ended 1 January 2017
Trinity Mirror is the largest national and regional news publisher in the UK, producing and distributing content through newspapers and associated digital platforms
Strategic Report 02–30Chairman’s introduction 02
Chief Executive’s introduction 03
Our business 04
Strategy and KPIs 09
Our audience 11
Our people 12
Risks and uncertainties 14
Trends and challenges 17
Group financial review 18
Divisional financial review 27
Governance 31–71Chairman’s governance introduction 31
Board of directors 32
Corporate governance report 34
Nomination Committee report 39
Audit & Risk Committee report 40
Remuneration report 45
Corporate responsibility report 62
Directors’ report 68
Financial Statements 72–116Independent auditor’s report 72
Consolidated income statement 76Consolidated statement of comprehensive income 76
Consolidated cash flow statement 77
Consolidated statement of changes in equity 77
Consolidated balance sheet 78
Notes to the consolidated financial statements 79
Parent company balance sheet 112Notes to the parent company financial statements 113
DisclaimerThis Annual Report is sent to shareholders who have elected to receive a hard copy and is available on our website www.trinitymirror.com for those shareholders who have elected to receive a copy electronically. In this document, references to ‘the Group’, ‘the Company’, ‘we’ or ‘our’ are to Trinity Mirror plc and its subsidiaries. A reference to a year expressed as 2016 is to the 53 weeks ended 1 January 2017 and a reference to a year expressed as 2015 is to the 52 weeks ended 27 December 2015. References to ‘the year’ and ‘the current year’ are to 2016 and references to ‘last year’ and ‘the prior year’ are to 2015. The Annual Report contains forward-looking statements. By their nature, forward-looking statements involve a number of risks, uncertainties and future assumptions because they relate to events and/or depend on circumstances that may or may not occur in the future and could cause actual results and outcomes to differ materially from those expressed in or implied by the forward-looking statements. No assurance can be given that the forward-looking statements will be realised. Statements about the directors’ expectations, beliefs, hopes, plans, intentions and strategies are inherently subject to change and they are based on expectations and assumptions as to future events, circumstances and other factors which are in some cases outside the Company’s control. The Annual Report has been prepared on the basis of the knowledge and information available to directors at the date of its preparation and the Company does not undertake any obligation to update or revise the information during the financial year ahead. It is believed that the expectations set out in these forward-looking statements are reasonable, but they may be affected by a wide range of variables which could cause actual results or trends to differ materially. The forward-looking statements should be read in the context of the principal risk factors.
For further information or to read the annual report online, go to www.trinitymirror.com

Strategic Report Governance Financial Statements
Trinity Mirror plc Annual Report 2016 01
In summary
The Group delivered a strong set of results for 2016 despite the print markets remaining challenging throughout the year.
We have refreshed our strategy and have adopted new financial KPIs to ensure an even closer alignment between our strategic initiatives and their financial outcomes. Our four key areas of strategic focus are to grow digital audience and revenue, to build new diversified revenue streams, to protect our strong print brands and to seek out strategic opportunities that drive value. The Board remains confident that our strategy will meet our objective to deliver sustainable growth in revenue, profit and cash flow over the medium term.
Cash generation was also strong providing resilience and financial flexibility to invest, to grow dividends and over time to meet pension obligations.Statutory results
Revenue
£713.0m2015: £592.7m
Operating profit
£93.5m2015: £82.2m
Earnings per share1
24.9p2015: 30.2p
Dividend per share
5.45p2015: 5.15p
Adjusted results2
Like for like revenue3
£699.1m2015: £759.6m
Revenue
£713.0m2015: £592.7m
Operating profit
£137.5m2015: £109.6m
EBITDA4
£159.7m2015: £132.0m
Net debt5
£30.5m2015: £92.9m
Net cash flow6
£62.4m2015: £63.8m
Operating margin
19.3%2015: 18.5%
Earnings per share
38.1p2015: 33.9p
In addition to the financial performance measures above, the Group is focused on a number of other key performance indicators to deliver the Group’s strategy. These are set out in the strategy and key performance indicators section of the Strategic Report on pages 9 and 10.
1 Whilst statutory profit before tax increased, statutory earnings per share has fallen due to a tax charge of £7.0 million compared to a tax credit of £9.8 million in 2015 and an increase in shares in issue as a result of the acquisition of Local World.
2 Alongside the statutory results, the Group presents its performance on an adjusted basis. The adjusted results aim to provide a more meaningful comparison of the trading performance of the Group without the volatility created by non-recurring items and restructuring charges and by non-cash accounting items. The statutory results are adjusted by the exclusion of non-recurring items, restructuring charges in respect of cost reduction measures, the amortisation of intangible assets, the pension administrative expenses, the retranslation of foreign currency borrowings, the impact of fair value changes on derivative financial instruments, the pension finance charge and the impact of tax legislation changes. Set out in note 38 in the notes to the consolidated financial statements is a reconciliation between the statutory results and the adjusted results.
3 Revenue trends are distorted by a number of items in 2016 and 2015. To provide a more meaningful comparison of the Group’s underlying revenue trends, the year on year changes are also presented on a like for like basis. Like for like for 2016 compared to 2015 assumes Local World was owned from the beginning of 2015 (£181.5 million net impact in 2015) and excludes revenue from the Independent print and distribution contract which ceased in April 2016, revenues from Rippleffect which was sold in August 2016, revenue from the contract to publish the Rugby World Cup match day programmes in 2015 (together £4.8 million in 2016 and £14.6 million in 2015) and compares the 52 weeks to 25 December 2016 with the 52 weeks to 27 December 2015 (additional £9.1 million in 2016).
4 Adjusted operating profit (£137.5 million) plus depreciation (£22.2 million).5 On a contracted basis assuming that the private placement loan notes and related cross-currency interest rate swap is not terminated prior to maturity.6 In 2015, the Group generated net cash inflows of £63.8 million before the net cash payments of £137.4 million relating to the acquisition of Local World.
Including these payments, contracted net debt for 2015 increased by £73.6 million.
Strategic Report
Trinity Mirror plc Annual Report 201602
Chairman’s introduction
Last year, I ended my Chairman’s introduction to the Annual Report by saying that we strive to build on the many successes in 2015 to finish 2016 stronger than we started it. I think it is fair to say that despite the significant headwinds in our industry, we delivered a strong financial performance, successfully integrated Local World, and ended the year with a refreshed strategy which positions us well for the opportunities that exist.The Board remains committed to ensuring it drives shareholder value whilst appropriately managing the interests of other key stakeholders such as our pension schemes, our debt providers and, importantly, our staff. We understand that the interests of our stakeholders may sometimes appear to be in conflict but we believe strongly that managing the business well in difficult circumstances, and having clear plans to return your Company to growth, will ultimately be to the benefit of all those whose livelihoods depend on the future success of your Company, whether as pensioners, members of staff or shareholders. I hope that this Annual Report demonstrates that the decisions we are making, and the results we are delivering, are consistent with this goal.
Dividends and share buybackThe future, on which all our stakeholders depend, relies on our ability to access the capital markets and it therefore remains vital that we respect the needs of our shareholders. To this end I am delighted to confirm that the Board proposes a final dividend of 3.35 pence per ordinary share, bringing the total dividend for the year to 5.45 pence per ordinary share, a year on year increase of 5.8%. The Board continues to adopt a progressive dividend policy and expects dividends to increase by at least 5% per annum. You can find details of the Board’s dividend policy on page 8.Our strong cash generation enabled the Board to commence a £10 million share buyback programme in August.
PensionsWe remain totally committed to appropriately funding our long-term pension obligations. We continue to work closely with the Trustees of our pension schemes to balance the need for funding pension deficits, which have increased to £466.0 million, with the need to invest in the business and to ensure we maintain access to the capital markets by providing returns to shareholders. Alongside the £10 million share buyback programme the Board made a £5 million contribution to the pension schemes and have agreed to pay up to £2.5 million when the share buyback is completed in 2017. Total payments to fund historical pension deficits were £40.7 million in 2016.
FinancingI am pleased that the business continues to generate strong operating cash flows which remain a core strength of your Company. In addition to strong operating cash flows we continued to crystallise value from the property portfolio with two property disposals generating net proceeds of £10.6 million.The strong cash flows enabled the Group to fully repay the £80 million term loan procured for the Local World acquisition and secure a new 5 year £110 million revolving credit facility. This presents the business with secure financing and increased financial flexibility.
Historical legal issuesDuring the year, we made good progress on settling civil claims. To maintain momentum in bringing the process to a conclusion, we increased the provision for dealing with these historical matters by £11.5 million in December 2016. The Board remains confident that claims arising from these historical events are manageable and do not undermine the delivery of the Group’s strategy.
Board composition Part of my role as your Chairman is to ensure that your Board has the necessary skills, knowledge and experience to make informed judgements that are in the best interests of all the stakeholders in your Company.You can find details of the membership of the Board on pages 32 and 33. I am confident that the Board’s composition is appropriate and that we can continue to navigate the challenges which 2017 is sure to bring.
In conclusionOn behalf of the Board, I would like to thank our colleagues who did such a stellar job in delivering the Group’s strong performance in 2016. Our business depends on talented people and you can read more about our people on pages 12 and 13.I would also like to thank our shareholders for your continued support and I look forward to speaking with many of you at the forthcoming Annual General Meeting. I remain confident that our refreshed strategy and strong management team will ensure that 2017 will be another year of progress.
David GrigsonChairman
27 February 2017
Key Points 1. Finished the year stronger than we started
2. Strong cash flows and increased financial flexibility
3. Dividend increased by 5.8%
“ The Board is confident that the refreshed strategy coupled with the strong management team will deliver value over time.”David Grigson, Chairman
See page 31 for Chairman’s Governance introduction
Strategic Report Governance Financial Statements
Trinity Mirror plc Annual Report 2016 03
Chief Executive’s introduction
I am delighted that we have delivered a strong financial performance in the year despite the challenging environment we face. I am particularly pleased with the progress we have made in growing our digital audience and revenue, and with the work we have done this year to develop and refine our strategic priorities for the year ahead.
Strategic progressWe have refreshed our strategy during 2016, and adopted new financial KPIs to ensure an even closer alignment between our strategic initiatives and their financial outcomes. Our four key areas of strategic focus are to grow digital audience and revenue, to build new diversified revenue streams, to protect our strong print brands and to seek out strategic opportunities that drive value. Our medium term objective remains to achieve total revenue growth, as digital and new revenue streams outstrip print decline.
We made good progress with our strategy in 2016, and full information on the key achievements against our four key areas of strategic focus is set out on pages 9 and 10.
Our digital revenue saw continued growth, with like for like digital revenue growing by 12.8%. In particular display and transactional revenue grew by 24.7% driven by growth in digital audience with average monthly page views on a like for like basis growing by 15.4% to 636.1 million.
We delivered strong growth in adjusted operating profit of 25.5% and adjusted earnings per share of 12.4% thanks to tight management of the cost base. In 2016 we delivered £25 million of structural (including synergy) cost savings.
We continued to build on our transformative acquisition of Local World. We are making excellent progress on the integration of the businesses, delivering £10 million of synergy savings in 2016. We are forecasting annualised savings of £15 million in 2017 which is £3 million ahead of expectations. We believe we are creating an organisation with the best skills and audience reach in our industry.
We continued to enhance our print brands through the roll-out of new design and content. Alongside enhancing our newspapers we rationalised the portfolio and closed a small number of regional newspapers and handed back four of the eight Metros franchises we operated to DMGT.
Our talented people are the foundation of our business, and we aim to create a dynamic environment that enables our people to embrace their passions and ambitions. I would like to thank everyone who has contributed to our strong performance this year for their hard work and dedication to Trinity Mirror, and I look forward to working with them in the year ahead.
Looking aheadPrint markets, in particular advertising revenue trends, are expected to remain challenging and volatile during 2017 while digital audience and revenue is expected to continue to grow.
In the medium term, growth from digital and new revenue streams will outstrip print declines on an aggregate basis. This, combined with our inbuilt and relentless focus on efficiencies, makes me confident that the delivery of sustainable growth in revenue, profit and cash flow is achievable in the future, for the benefit of all stakeholders.
Simon FoxChief Executive
27 February 2017
Key Points 1. Strong financial performance in challenging
trading environment2. Refreshed strategy to grow, build, protect and
consolidate our strong position in the communities we serve
3. Successful integration of Local World with synergies ahead of expectations
Simon Fox, Chief Executive
“ Our vision is to be an essential part of people’s daily lives by delivering quality content and services that inform, enlighten and enrich.”

Strategic Report
Trinity Mirror plc Annual Report 201604
Our businessHow we create value and what makes us different
Trinity Mirror is the largest national and regional news publisher in the UK, producing and distributing content through newspapers and associated digital platforms
We are the largest news publisher with national and regional newsbrands across the UK, including influential and iconic brands such as the Daily Mirror, Sunday Mirror, Sunday People, Daily Record, Sunday Mail and market leading daily titles in key metropolitan markets across the country.
Our brands have a long heritage of being trusted sources of news and information with our editorial conviction and high standards of journalism providing audiences with timely information and opinion across multiple platforms.
The business is split into four operating segments, each of which is a division: Publishing, Printing, Specialist Digital and Central. The structure of the Group provides flexibility to drive efficiencies, through a unified organisational structure which ensures activity is driven to benefit the Group overall. This helps to support profits and cash flows while print revenue remains under pressure, meaning the Group is able to maximise revenue and drive efficiencies without impacting quality.
Operating segments
PublishingPublishing includes all of our national and regional newspaper titles and associated digital publishing sites. This segment produces and distributes content to mass market audiences across the UK, through paid-for and free newspapers and related multi-platform digital sites (desktop, tablet, mobile).Within our Publishing division, Trinity Mirror Solutions is the commercial team working with media agencies and advertising clients to help them reach the national, regional, print and digital media audiences of the Trinity Mirror newsbrands and other media publishers with tailored marketing solutions and commercial partnerships.This division also holds events and exhibitions related to publishing activities, such as the ‘Pride of…’ series, which includes the Pride of Britain awards. Additionally within the division, Trinity Mirror Sport Media provides contract publishing for football clubs and other sport-related organisations, such as the Rugby World Cup in 2015.
Specialist DigitalSpecialist Digital contains our digital classified recruitment business, Trinity Mirror Digital Recruitment, which comprises digital classified sites including TotallyLegal, GAAPweb and SecsintheCity and our digital communications agency, Communicator.During 2016, Rippleffect, a website design and build business which was in the division was sold.
PrintingTrinity Mirror Printing provides internal print services to the Publishing division and externally to third parties, making it the largest provider of newspaper contract printing services in the UK. This is done through five print sites and 20 full colour presses, all owned by the Group.
CentralCentral includes revenue and costs not allocated to the operational divisions and our share of results of associates. The Group has a 21.53% stake in news agency the PA Group Limited and a 50% stake in Brand Events TM Limited.
Strategic Report Governance Financial Statements
Trinity Mirror plc Annual Report 2016 05
Our businessHow we create value and what makes us different continued
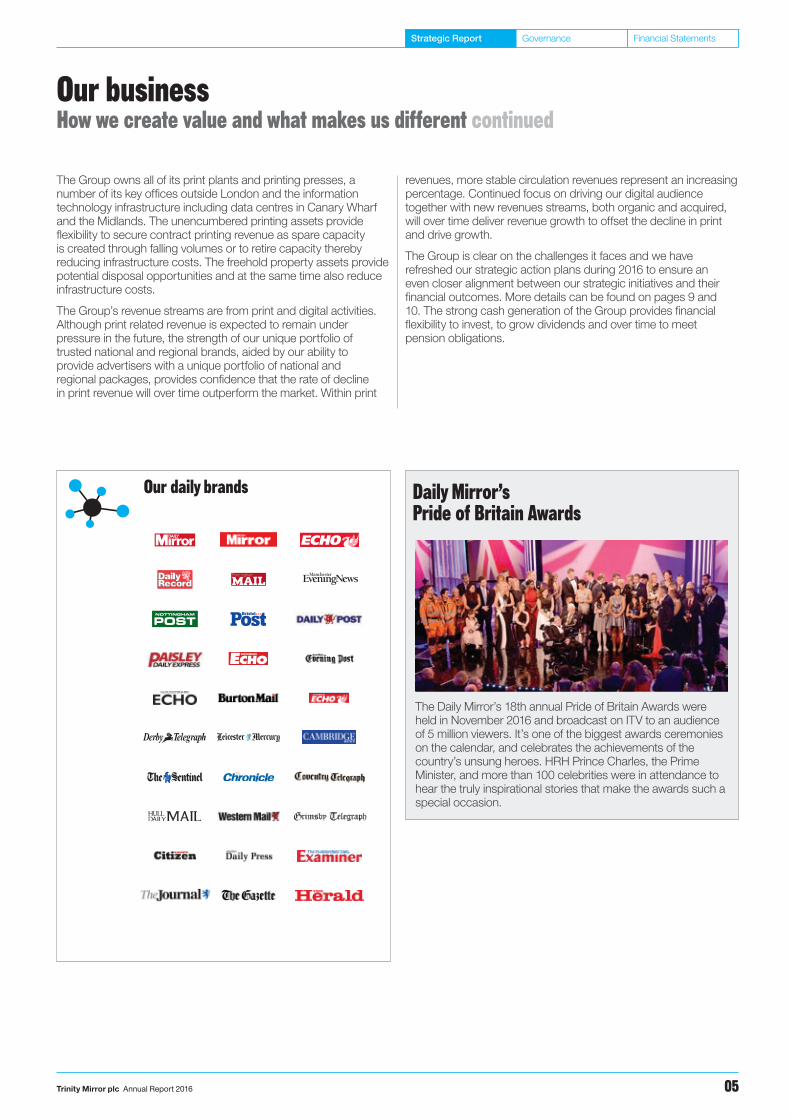
Daily Mirror’s Pride of Britain Awards
The Daily Mirror’s 18th annual Pride of Britain Awards were held in November 2016 and broadcast on ITV to an audience of 5 million viewers. It’s one of the biggest awards ceremonies on the calendar, and celebrates the achievements of the country’s unsung heroes. HRH Prince Charles, the Prime Minister, and more than 100 celebrities were in attendance to hear the truly inspirational stories that make the awards such a special occasion.
The Group owns all of its print plants and printing presses, a number of its key offices outside London and the information technology infrastructure including data centres in Canary Wharf and the Midlands. The unencumbered printing assets provide flexibility to secure contract printing revenue as spare capacity is created through falling volumes or to retire capacity thereby reducing infrastructure costs. The freehold property assets provide potential disposal opportunities and at the same time also reduce infrastructure costs.
The Group’s revenue streams are from print and digital activities. Although print related revenue is expected to remain under pressure in the future, the strength of our unique portfolio of trusted national and regional brands, aided by our ability to provide advertisers with a unique portfolio of national and regional packages, provides confidence that the rate of decline in print revenue will over time outperform the market. Within print
revenues, more stable circulation revenues represent an increasing percentage. Continued focus on driving our digital audience together with new revenues streams, both organic and acquired, will over time deliver revenue growth to offset the decline in print and drive growth.
The Group is clear on the challenges it faces and we have refreshed our strategic action plans during 2016 to ensure an even closer alignment between our strategic initiatives and their financial outcomes. More details can be found on pages 9 and 10. The strong cash generation of the Group provides financial flexibility to invest, to grow dividends and over time to meet pension obligations.
Our daily brands

Strategic Report
Trinity Mirror plc Annual Report 201606
Our businessVision and strategy
Our strategy Grow, build, protect and consolidate
our strong position in the communities that we serve
In the medium term, growth from digital and new revenue streams will outstrip print declines
To be an essential part of people’s daily lives by delivering quality content and services that inform, enlighten and enrich
Engaging, differentiated content is at the heart of our business. It is this content that makes us central to our audience’s daily lives and our context which makes us so valuable to advertisers
Collaboration Imagination Determination
Talented people are the foundation of our business. We create a dynamic environment that embraces their passions and ambitions
In the short term, to support profits and cash flows through revenue and efficiency initiatives. In the medium term, to deliver sustainable growth in revenue, profit and cash flow
Our Financial Objectives
Our Belief
Our Values
Our People
Our Vision
Grow digital audience and revenue through deepening relationships with readers and optimising response for advertisersGrow
Build a diversified product portfolio and sustainable mix of new revenueBuild
Protect our print brands by efficiently delivering quality productsProtect
Seek out strategic opportunities that drive valueConsolidate

Strategic Report Governance Financial Statements
Trinity Mirror plc Annual Report 2016 07
Our businessVision and strategy continued
Vision and strategyDuring 2016, we undertook a detailed review of our vision and strategy to ensure that it continued to support our overriding goal of driving shareholder value whilst over time funding our historical pension obligations. The review concluded that the strategy remained appropriate although the vision and strategic objectives needed to be refreshed to reflect the progress made over the past few years and the fast changing media environment. This section summarises our vision and strategic objective arising from the review.
Our vision is “to be an essential part of people’s daily lives by delivering quality content and services that inform, enlighten and enrich”. To deliver this vision it is clear that quality content is and will remain at the heart of our business.
Our belief is that engaging, differentiated content is at the heart of our business. It is this content that makes us central to our audience’s daily lives and our context which makes us so valuable to advertisers.
Our values were refreshed at the start of 2016 to more accurately reflect the behaviours which we believe are necessary for us to succeed and deliver – collaboration, imagination, determination.
Our talented people are the foundation of our business. We create a dynamic environment that embraces their passions and ambitions.
Our financial objective in the short term is to support profits and cash flows through revenue and efficiency initiatives while in the medium term to deliver sustainable growth in revenue, profit and cash flow.
Our strategy to grow, build, protect and consolidate our strong position in the communities we serve will be delivered through four key areas of strategic focus:
− Grow: Grow digital audience and revenue through deepening relationships with readers and optimising response for advertisers;
− Build: Build a diversified product portfolio and sustainable mix of new revenue;
− Protect: Protect our print brands by efficiently delivering quality products; and
− Consolidate: Seek out strategic opportunities that drive value.Growth from digital and new revenue streams will begin to outstrip print declines on an aggregate basis, leading to a stabilisation of Group revenue and then a return to top-line growth. This, combined with our inbuilt and relentless focus on efficiencies, makes the Board confident that the delivery of sustainable growth in revenue, profit and cash flow is achievable in the future, for the benefit of all stakeholders.
Key highlights of progress on each area of strategic focus and the key performance indicators can be found on pages 9 and 10. The achievement of the Group’s strategic objective and the key performance indicators are all impacted by the risks and uncertainties set out on pages 14 to 16.
The Group delivered a strong set of results for 2016 despite the print markets remaining challenging throughout the year. Cash generation was also strong providing resilience and financial flexibility to invest, to grow dividends and over time to meet pension obligations.
Performance summaryGroup revenue increased by 20.3% to £713.0 million. The increase in revenue includes the benefit of the acquisition of Local World in November 2015 and an additional week of trading in 2016, partly offset by the cessation of the Independent print and distribution contract in April 2016 after the titles were closed and the sale of Rippleffect in August 2016.
On a like for like basis, revenue fell by 8.0% with publishing digital revenue growing by 12.8% and publishing print revenue falling by 10.7%. The challenges in print advertising markets resulted in a decline in display advertising across a number of sectors, in particular retail. Most classified advertising categories also came under pressure, in particular recruitment. Circulation revenues declined 5.2% with volume declines partially mitigated by cover price increases. Strong growth in digital display and transactional revenue of 24.7% was partly offset by digital classified revenue declines of 11.3%, primarily due to falls in recruitment advertising. The growth in digital display and transactional revenue was driven by the growth in digital audience with average monthly page views on a like for like basis growing by 15.4% to 636.1 million.
Good cost control together with the acquisition of Local World and an additional week of trading contributed to adjusted operating profit growing by 25.5% with adjusted EBITDA of £159.7 million. The Group delivered structural (including synergy) cost savings of £25 million, £10 million ahead of the £15 million target for the full year. We have delivered £10 million of synergy savings in 2016 from the integration of Local World and expect annualised synergy savings of £15 million in 2017, £3 million ahead of our original £12 million target at the time of the acquisition. Restructuring charges in respect of cost reduction measures were £15.1 million in 2016 and are expected to be £10 million in 2017.
Adjusted profit before tax grew by 23.9% and adjusted earnings per share grew by 12.4% reflecting the increased revenues and tight management of the business.
The strong cash flows generated by the Group have resulted in a significant decline in leverage since the acquisition of Local World and provide resilience and financial flexibility to invest, to grow dividends and over time meet pension obligations, despite the uncertain economic environment.
In 2016, the Group repaid from cash the £80 million Acquisition Term Loan procured for the acquisition of Local World and replaced the undrawn £60 million bank facility with a new amortising £110 million bank facility which is committed until December 2021. No drawings have been made on the new bank facility.
Net debt on a contracted basis fell by £62.4 million from £92.9 million to £30.5 million. Net debt comprises the outstanding private placement loan notes of £68.3 million and cash balances of £37.8 million. The private placement loan notes are due for repayment in June 2017.
The accounting pension deficit increased by £160.8 million to £466.0 million (£385.1 million net of deferred tax) driven by a fall in long term interest rates and higher inflation expectations. The increase in the accounting pension deficit does not have an immediate impact on the agreed funding commitments. The next valuation date of the schemes is 31 December 2016 and valuations are expected to be finalised by March 2018.

Strategic Report
Trinity Mirror plc Annual Report 201608
DividendsThe Board proposes a final dividend of 3.35 pence per share for 2016, an increase of 6.3%, bringing the total dividend for 2016 to 5.45 pence per share, an increase of 5.8%. The final dividend which is subject to approval by shareholders at the Annual General Meeting on 4 May 2017 will be paid on 9 June 2017 to shareholders on the register on 12 May 2017.
The final dividend for 2015 of 3.15 pence per share was paid in June 2016 and the interim dividend for 2016 of 2.10 pence per share was paid in November 2016. Total dividend payments in 2016 amounted to £14.6 million.
The Board approved a share buyback programme of up to £10 million, which commenced in August 2016. The share buyback programme makes efficient use of the surplus cash in the Group and will enhance earnings per share. It confirms the Board’s confidence in the cash flow generated by the Group and its commitment to generating returns to shareholders. Alongside the share buyback, the Board agreed to contribute a minimum of £5 million or up to a maximum of 75% of the share buyback as additional funding to the defined benefit pension schemes. At the year end the Group had acquired 2.5 million shares for £2.3 million.
The Board continues to adopt a progressive dividend policy which is aligned to the free cash generation of the business. The free cash generation for the purposes of assessing the dividend is the net cash flow generated by the Group before the repayment of debt, dividend payments, other capital returns to shareholders and additional contributions made to the defined benefit pension schemes as a result of any substantial increase in dividends and/or capital returns to shareholders. When setting the level of dividends the Board will ensure that the Group maintains adequate headroom for investment and any unexpected cash flow requirements for historical events or to fund further restructuring. Based on the Board’s expectation of future cash flows, the Board expects dividends to increase by at least 5% per annum.
The Company will also consider the return of capital to shareholders through a share buyback if it has generated surplus cash and sees an opportunity to enhance earnings per share and therefore shareholder value. Prior to initiating a share buyback programme the Company will carefully consider the cash generation of the business, investment requirements and the Group’s obligations to the Group’s defined benefit pension schemes.
Current trading and outlookWe have refreshed our strategy and have adopted new financial KPIs to ensure an even closer alignment between our strategic initiatives and their financial outcomes. Our four key areas of strategic focus are to grow digital audience and revenue, to build new diversified revenue streams, to protect our strong print brands and to seek out strategic opportunities that drive value. The Board remains confident that our strategy will meet our objective to deliver sustainable growth in revenue, profit and cash flow over the medium term.
Revenue in the first two months of 2017 is expected to fall by 9% on a like for like basis. The like for like trends for 2017 exclude from the 2016 comparative: the extra week of trading in 2016, the Independent print and distribution contract which ceased in April 2016, Rippleffect which was sold in August 2016 and the four Metros handed back to DMGT and other portfolio changes. Print markets, in particular advertising revenue trends, are expected to remain challenging and volatile during 2017 while digital audience and revenue is expected to continue to grow.
Mirror Books is the new imprint from Trinity Mirror. With access to stories and significant marketing reach the imprint offers distinct advantages for authors and compelling USPs in the market. Its focus is to publish real stories with authentic voices about subjects that resonate with large audiences. In February 2016, we published Finding Tipperary Mary, by Phyllis Whitsell. Phyllis’ story of adoption first appeared in the Uxbridge Gazette, before the Birmingham Mail and Daily Mirror picked it up. Mirror Books went on to publish her story as a book which became an international and Sunday Times best seller and film rights have been sold to a production company.
Amplifying the value of content
Maximising the value of content
The content we own generates revenue beyond the walls of our brands. Trinity Mirror’s network of journalists and photographers create a steady stream of news and pictures. Following publication in our own products, this content is sold-on across the globe by the syndication and licensing team. With strong demand for quality content, the team has increased revenues from distributed content feeds. In 2016, syndication and licensing revenue grew by 15%. The team syndicates harrowing pictures from the front line, and major political scoops; but, sometimes, you just can’t beat a picture of a baby with crazy hair.
In addition, Trinity Mirror owns the biggest newspaper photographic archive in the UK, containing over 100 million images. Its pictures are sold to a broad spectrum of companies from Yale University to the V&A, with uses as varied as reference points for Madame Tussauds’ artists to props in motion pictures. The archive was part of a documentary on photography: Britain in Focus: A Photographic History, commissioned for BBC4.
Our businessVision and strategy continued

Strategic Report Governance Financial Statements
Trinity Mirror plc Annual Report 2016 09
Strategy and KPIsProgress highlights
Key highlights of progress on each area of strategic focus during 2016 are set out in this section:GrowWe have continued to build on the significant digital audience and revenue we built over the past three years with average monthly page views growing by 15.4% to 636.1 million and digital display and transactional revenue growth of 24.7%, both on a like for like basis.
Our newsrooms across the business are organised and staffed to drive audience growth and engagement to maximise commercial opportunities to grow revenues.
Our digital ambition is supported by continued investment in product development. In 2016 we developed a fully responsive site with increased focus on mobile and video. The new site improves the user experience across all platforms and also presents new and improved ad formats to improve response for our advertisers. We commenced the roll out of the new site in the second half of 2016 and expect a full roll out during 2017.
BuildAlongside ensuring we have great digital sites which build on our core print portfolios we continue to launch new sites. After the successful launch of ‘Belfast Live’ last year, we launched Glasgow Live and Dublin Live. The three ‘Live’ sites delivered 3.0 million monthly browsers and 8.7 million page views in December 2016.
To leverage our print brands and content generation capabilities we have also launched new sites such as football.london and an MUFC app. These sites target niche audiences which are more valuable to advertisers.
During 2017, we will continue to explore new product ideas to leverage our portfolio of print and digital brands whilst seeking to diversify the revenue streams beyond advertising.
ProtectProtecting our print brands through understanding our print readers and delivering a quality product, whilst leveraging our brands, communities and advertisers to maximise our financial performance remains a key area of strategic focus.
Our national newspapers continue to deliver strong financial performance with their core revenue stream being circulation revenue. The success of our titles has been recognised by multiple industry awards during the year. In 2016 we also secured a 5 year sponsorship deal from TSB plc for the Pride of Britain awards alongside all of our ‘Pride of’ events across our portfolio. This re-enforces the strength of our brands and relevance of our audience to advertisers.
During 2016, we continued to enhance our regional print brands through the roll out of a new design with less focus on crime, more reporting on things to do in the city and improved coverage in areas such as football and entertainment. Alongside enhancing our newspapers we continue to rationalise the portfolio and during 2016 we closed a small number of regional newspapers and at the end of 2016 we handed back to DMGT four of the eight Metros franchises we operated.
We are committed to building a loyal reader subscription base for our regional dailies and the regional ‘Plus’ loyalty programme has been rolled out to 14 of our regional dailies with plans to complete the full roll out in 2017. Results so far show high levels of reader engagement and improved order retention.
We launched a new national newspaper, The New Day, on 29 February 2016. Although the title received many supportive reviews, its circulation was below our expectations. As a result, we decided to close the title on 6 May 2016.
Tight management of the cost base remains essential and we have delivered £25 million of structural (including synergy) cost savings. The synergy savings from the acquisition of Local World were £10 million in 2016 and we are now forecasting to deliver annualised synergy savings of £15 million in 2017, £3 million ahead of the original target of £12 million announced at the time of the acquisition in 2015.
Excellent progress has been made during 2016 following the acquisition of Local World through sharing best practices across the Group with a number of non system dependent changes implemented during the year. In addition to relocating all central operations previously located at Local World’s head office to the Group’s operations at Canary Wharf, we have:
− Rationalised regional management structures including the creation of a number of super regions in the South East, East Midlands and South Wales;
− Rolled out best practice operational structures across the functions of advertising, editorial and newspaper sales;
− Began the process of centralising recruitment advertising into Bristol and private advertising into Hull; and
− Combined the national advertising sales across print and digital throughout the entire Group under the umbrella of Trinity Mirror Solutions.
In addition to the Local World synergy savings, initiatives have included the closure of the Newcastle print plant at the end of 2015 and of the Cardiff plant at the end of 2016 and numerous initiatives to drive efficiencies across editorial, advertising, pre press, property and all back office functions.
For 2017 we have targeted a further £15 million of structural cost savings, including the incremental £5 million of synergy savings from the acquisition of Local World.
Consolidate To complement the strategic initiatives listed above we will seek out strategic opportunities that drive value. We will continue to exercise rigorous discipline in considering any acquisition opportunities that enhance our local strategy or brings new diversified revenue streams. We see ourselves as a consolidator in the newspaper industry and will continue to do so subject to tight financial returns.
In October 2016, the Group acquired a 50% stake in Brand Events 1 Limited (renamed to Brand Events TM Limited), one of UK’s leading creators and operators of consumer event formats for £750,000 and has committed to provide further financing of up to £750,000. We will partner with the business in growing and developing events within the Food, Sports and Crafts division, areas that resonate well with our core audience across our regional footprint.

Strategic Report
Trinity Mirror plc Annual Report 201610
Strategy and KPIsProgress highlights continued
Key performance indicatorsTo track delivery of our strategy, the following KPIs will be reported on at each reporting date:
Financial measure Group KPIs
Publishing digital revenue growth At least 15% pa
Circulation revenue Single digit declines
Print advertising revenue At least in line with national market trends
Operating margin Grow operating margin to support profits
Dividend growth At least 5% pa
Had these KPIs been set for 2016, we would have met the circulation revenue, operating margin and dividend growth KPIs. Like for like publishing digital revenue growth in 2016 was 12.8% with digital display and transactional revenue growing by 24.7% offset by an 11.3% decline in classified revenue, primarily due to recruitment. Print advertising revenue was worse than the national market trends.
Prior year follow upOur strategic areas of focus presented last year and how we have performed during 2016 against these are as follows:
Strategic area of focus Progress
Protecting and revitalising our core brands in print
– Continue to ensure our print products reflect the changing needs of our readers and advertisers
We look to outperform print trends (circulation volume and revenue ahead of the market and print advertising volume and revenue ahead of the market) – set out in the Publishing Division review on page 28.
Growing our existing brands onto digital delivery channels
– Continue to focus on building audience of scale across multiple digital platforms and grow digital revenues
We look to deliver digital growth (digital audience growth (unique users and page views) and digital revenue growth (advertising and commercial)) – set out in the Publishing Division review on page 29.
Continuing our relentless focus on efficiency and cost management
– In a challenging print environment we continue to focus on cost efficiency
We seek to deliver targeted cost savings (cost savings and ongoing mitigating cost actions) – material cost savings delivered in the year
Launching, developing, investing in or acquiring new businesses built around distinctive content or audience
– We will continue to consider and evaluate opportunities and will make investments as appropriate
– Investment returns in excess of cost of capital within three years and earnings enhancing by the end of the second year post investment
Continued investment in launching new digital products and investment in Brand Events TM Limited. Our application of clear financial disciplines ensured we launched but subsequently closed a new title, The New Day, which did not meet expectations.

Strategic Report Governance Financial Statements
Trinity Mirror plc Annual Report 2016 11
Our audience
− Our audience is the mass market mainstream which we call Modal Britain: 50% of the population, based on the household incomes that typify mass market Britain.
− Our insight reveals this audience has three key common characteristics: beliefs (inherited values), betterment (achievable aspirations), belonging (tight networks).
− These values and our ongoing research on the views, habits and preferences of our audience inform our editorial approach and help us work with commercial partners to target this audience with relevant activity.
− Trinity Mirror newsbrands reach three in four UK adults each month.
− Our readership is evenly split between national and regional titles.
− The Daily Mirror is the longest-read red top at 36 minutes and has the highest proportion of female readers, main shoppers and home owners in the red-top market.
Sources1 JICREG 1/11/16 and ComScore Jan – June 2016 average, with applied duplication
2 ABC Jan – Dec 2016
3 ComScore December 2016 multi-platform UK only
4 Adobe Analytics 2016, page views excluding apps and galleries for the Publishing division across web and mobile.
Trinity Mirror’s newsbrands aim to be an essential part of the everyday life for millions of people across the UK
Over
140regional
newspapers
5national
newspapers
Total UK reach of our national and regional newsbrands per month1
37.8mOver
70websites
Total UK page views per year4Mobile UK page views per year4
UK monthly online audience3
28.7mTrinity Mirror
27.0mMail Online
20.3mGuardian
19.3mThe Sun
17.1mTelegraph
15.3mIndependent
In 2016 we sold2
national and regional newspapers
540m
5.4 billion +12%
3.3 billion
+26%2015 2016
2.6 billion

Strategic Report
Trinity Mirror plc Annual Report 201612
Employee development
During 2016 over 1900 training days were delivered internally for over 10% of our workforce. The Group launched a new commercial training website ensuring our commercial teams are amongst the best trained in the industry. In addition nine employees nominated by their local departments successfully graduated from an externally validated Media Skills Qualification (MSQ). The MSQ covers in-depth content, analysis and practical learning based around the entire media industry, including agencies, marketing, sales and all media channels.
Mirror Media Ireland participated for the first time in the Professional Enterprise Programme offering an internship in Digital Publishing. Going forward into 2017 as the Group begins to participate in the apprenticeship levy we plan an increased focus on apprenticeships and internal talent development.
Staff numbersAt the year end, Trinity Mirror Group employed 5,362 permanent employees across 76 locations.
In 2016, the voluntary rate of employee turnover was 15.3% and the retention rate, defined as employees in the Group’s employment for the full 12 months was 89.7%. Excluding Local World, the voluntary rate of employee turnover was 9.7% (2015: 9.9%) and the retention rate was 90.4% (2015: 90.9%).In 2016, the Group’s absenteeism rate, which follows the common definition used by the Advisory, Conciliation and Arbitration Service, fell to an average of 1.7%. Excluding Local World, the Group’s absenteeism rate was 1.8% (2015: 1.8%). This compares favourably with the national average level of employee absence of 3.3% (2015: 3.7%) reported by the CIPD.During 2016 we transferred HR support services from Local World into the Trinity Mirror HR service centre and successfully transitioned all staff into one self service HR and payroll system.
Our people
Talented people are the foundation of our business. Trinity Mirror aims to create a dynamic environment that embraces their passions and ambitions.
Highlights• Successfully launched a new digital
employee engagement platform across all businesses
• Continued industry recognition for award winning employees, teams and innovation
• Successful integration of Local World HR and Payroll systems into the group employee services portal
• Expansion of our employee benefits offering for all staff
Employee benefitsOffering an enhanced range of fixed and flexible benefits to our employees to drive engagement and attraction of talent is increasingly important in our market place. The Group, in addition to providing traditional benefits such as the opportunity to join a defined contribution pension scheme, life assurance and sickness benefits, also provide an employee assistance programme for staff and their families giving confidential and impartial advice on a wide range of welfare issues. In addition, all employees are given the opportunity to participate in additional voluntary benefits from child care vouchers, bikes schemes and holiday purchase to staff discounts and offers. In 2016, we launched a group wide salary sacrifice car scheme.
An annual pay award was made to all staff, with the lowest earning employees receiving a higher percentage and we continued our commitment to offering all our employees a true living wage as a minimum standard.
All our employees participate in performance related incentive schemes. For many staff this is through inclusion in the Group’s employee bonus scheme. For management and staff with a bonus based on Group adjusted operating profit and publishing digital revenue growth targets, a bonus of 34.6% of entitlement is payable in respect of the performance of the Group in 2016. For the employee bonus scheme a bonus of 44.0% of entitlement is payable.
86%11%
2% 1%
Total
5,362 Publishing (4,619) Printing (590) Specialist Digital (106) Central (47)
Group by division
Total
4,619 Editorial (2,402) Advertising (1,340) Circulation (185) Production (231)
Publishing by function
Other (461)
52%
29%
10%
4%5%
Strategic Report Governance Financial Statements
Trinity Mirror plc Annual Report 2016 13
Our peopleContinued
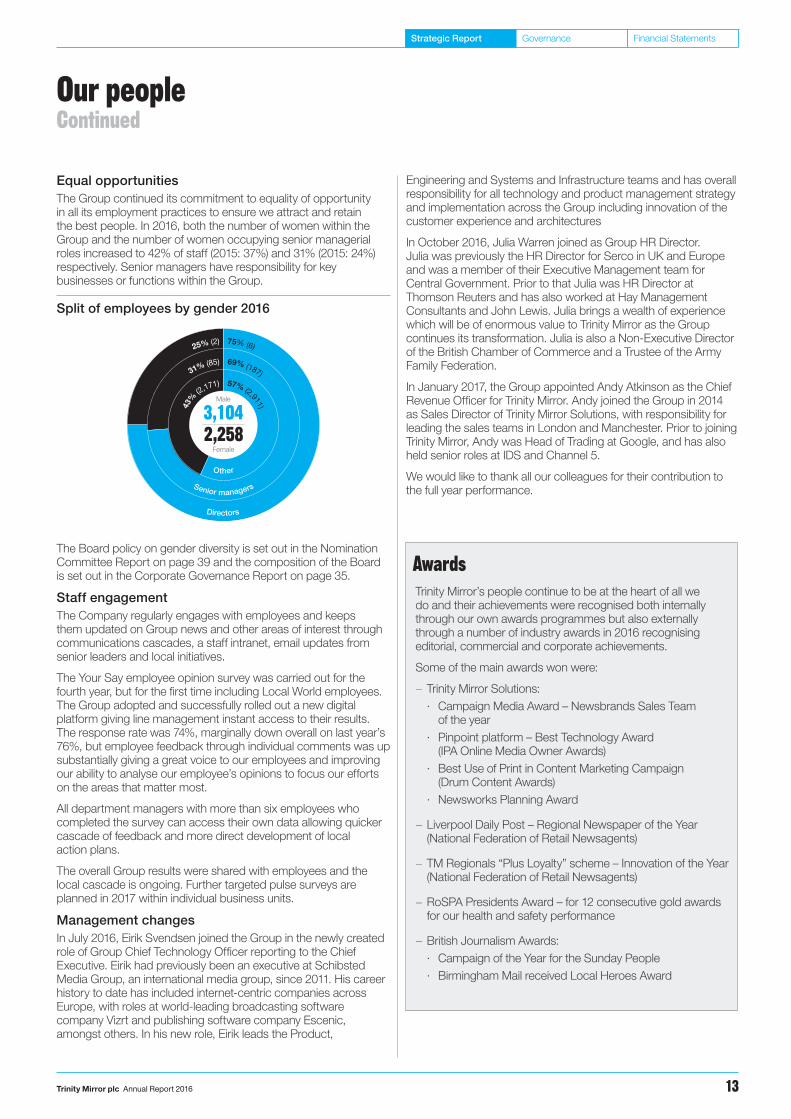
Equal opportunities The Group continued its commitment to equality of opportunity in all its employment practices to ensure we attract and retain the best people. In 2016, both the number of women within the Group and the number of women occupying senior managerial roles increased to 42% of staff (2015: 37%) and 31% (2015: 24%) respectively. Senior managers have responsibility for key businesses or functions within the Group.
The Board policy on gender diversity is set out in the Nomination Committee Report on page 39 and the composition of the Board is set out in the Corporate Governance Report on page 35.
Staff engagementThe Company regularly engages with employees and keeps them updated on Group news and other areas of interest through communications cascades, a staff intranet, email updates from senior leaders and local initiatives.
The Your Say employee opinion survey was carried out for the fourth year, but for the first time including Local World employees. The Group adopted and successfully rolled out a new digital platform giving line management instant access to their results. The response rate was 74%, marginally down overall on last year’s 76%, but employee feedback through individual comments was up substantially giving a great voice to our employees and improving our ability to analyse our employee’s opinions to focus our efforts on the areas that matter most.
All department managers with more than six employees who completed the survey can access their own data allowing quicker cascade of feedback and more direct development of local action plans.
The overall Group results were shared with employees and the local cascade is ongoing. Further targeted pulse surveys are planned in 2017 within individual business units.
Management changesIn July 2016, Eirik Svendsen joined the Group in the newly created role of Group Chief Technology Officer reporting to the Chief Executive. Eirik had previously been an executive at Schibsted Media Group, an international media group, since 2011. His career history to date has included internet-centric companies across Europe, with roles at world-leading broadcasting software company Vizrt and publishing software company Escenic, amongst others. In his new role, Eirik leads the Product,
AwardsTrinity Mirror’s people continue to be at the heart of all we do and their achievements were recognised both internally through our own awards programmes but also externally through a number of industry awards in 2016 recognising editorial, commercial and corporate achievements.
Some of the main awards won were:
− Trinity Mirror Solutions: · Campaign Media Award – Newsbrands Sales Team
of the year · Pinpoint platform – Best Technology Award
(IPA Online Media Owner Awards) · Best Use of Print in Content Marketing Campaign
(Drum Content Awards) · Newsworks Planning Award
− Liverpool Daily Post – Regional Newspaper of the Year (National Federation of Retail Newsagents)
− TM Regionals “Plus Loyalty” scheme – Innovation of the Year (National Federation of Retail Newsagents)
− RoSPA Presidents Award – for 12 consecutive gold awards for our health and safety performance
− British Journalism Awards: · Campaign of the Year for the Sunday People · Birmingham Mail received Local Heroes Award
Split of employees by gender 2016
Directors
Senior managers
Other
Male
3,1042,258
Female
25% (2) 75% (6)
43%
(2,171)
31% (85)
57% (2,911)
69% (187)
Engineering and Systems and Infrastructure teams and has overall responsibility for all technology and product management strategy and implementation across the Group including innovation of the customer experience and architectures
In October 2016, Julia Warren joined as Group HR Director. Julia was previously the HR Director for Serco in UK and Europe and was a member of their Executive Management team for Central Government. Prior to that Julia was HR Director at Thomson Reuters and has also worked at Hay Management Consultants and John Lewis. Julia brings a wealth of experience which will be of enormous value to Trinity Mirror as the Group continues its transformation. Julia is also a Non-Executive Director of the British Chamber of Commerce and a Trustee of the Army Family Federation.
In January 2017, the Group appointed Andy Atkinson as the Chief Revenue Officer for Trinity Mirror. Andy joined the Group in 2014 as Sales Director of Trinity Mirror Solutions, with responsibility for leading the sales teams in London and Manchester. Prior to joining Trinity Mirror, Andy was Head of Trading at Google, and has also held senior roles at IDS and Channel 5.
We would like to thank all our colleagues for their contribution to the full year performance.

Strategic Report
Trinity Mirror plc Annual Report 201614
Risks and uncertainties
Appropriate management actions are in place to minimise the impact of the risks and uncertainties which are identified as part of the risk process.
The principal risks and uncertainties are the same as last year. These principal risks, the risk appetite in relation to these risks, together with progress made during the year are set out on these pages. During the prior year the Board undertook a review of the
There is an ongoing process for the identification, evaluation and management of the principal risks faced by the Group
Risk description Risk factors Risk appetite Risk action and update
StrategyThe overall strategy or elements of the strategy are inappropriate and the delivery of the strategy is badly executed.
The Group is unable to support and then grow revenue, profit and cash flow.
Trinity Mirror has the appetite for taking well balanced risks deemed necessary to develop the business where they are in line with our strategy and do not knowingly compromise our existing brands, reputation or the financial stability of the Group. We recognise the industry-wide trends around print revenue declines and are committed to addressing them through delivery of our strategy.We seek to ensure the successful delivery of the strategy through robust ongoing monitoring systems and processes. We will only implement changes or invest in areas which are key to the delivery of our strategy and that do not compromise our existing brands, reputation or the financial stability of the Group. We recognise that investment decisions taken may not always have the desired outcome and aim to create a high performing environment based on openness and integrity where potential issues are identified and remedied quickly to ensure we continue to move in the right direction.
Actions: Monthly review of specific strategic initiatives at Board meetings and, at least annually, review of overall strategy.Update: The strategy has been refreshed with focus on investment, in digital and in new revenue streams, to drive growth combined with minimising the decline in print revenues and tight management of the cost base.The key objective of the strategy is to deliver continued growth in digital and new revenues from existing brands and from new businesses and to protect print while at the same time seeking out strategic opportunities.
Revenue lossFaster than anticipated loss of revenue from print and failure to deliver new revenue streams to offset print decline and drive growth.
Future print circulation volumes decline at a faster rate than anticipated.Print advertising revenues decline at a faster rate than anticipated and digital revenues do not compensate for declines and drive growth.Other print related publishing revenues and revenue from our contract print operations could be impacted by an accelerated decline in print volumes or the loss of a major print contract customer.
As above. Actions: The rate of print revenue decline remained volatile during the year. To counter this we increased our cost management actions and delivered additional structural cost savings and other cost mitigation initiatives. We did not reduce our investment in digital: people, product and infrastructure; and delivered continued growth in digital revenue.Update: Digital growth is not yet offsetting print declines. We are confident that the refreshed strategy will deliver digital and new revenues which will lead to revenue growth over the medium term and that profits are supported in the short term.
PensionsPension deficits grow at such a rate so as to affect the viability of the Group itself or so that the annual funding costs consume a disproportionate level of cash flow.
Increased mortality impacts liabilities.Reduced returns and investments.Government legislation.Increased funding.
Trinity Mirror has no appetite for taking risks which inhibit financial flexibility in achieving our strategic aims alongside meeting over time our pension obligations.We are fully aware of the challenges faced in meeting over time our pension funding obligations and our focus is on working with Trustees to deliver these in a manner which also enables us to respond to strategic challenges for the benefit of all our stakeholders. We continue to seek opportunities to de-risk our schemes without a material increase in funding obligations.
Actions: Regular reporting to the Board. Good relationship and regular meetings with Trustees. Review of options to de-risk pension liabilities. Update: We remain committed to addressing our historical pension deficits and continue to make payments in accordance with deficit funding schedules agreed at the last valuation. The next triennial valuation date is 31 December 2016 and is required to be completed by March 2018. The deficits have increased significantly during the year driven by falling discount rates and higher inflation rates.
Historical legal issuesDamage to reputation arising from historical events, direct financial impact from legal claims and distraction of senior management time from delivering the strategy.
Potential financial exposures.Reputational damage for Group and brands.Inability to attract people to the Group.
Trinity Mirror has no appetite for past behaviours that constitute a breach of the criminal law. We take historical legal allegations very seriously and are committed to cooperating with relevant authorities as necessary and dealing with civil claims in the appropriate manner. The Board and management continue to give significant management attention to the historical legal issues.
Actions: Standing item on Board agenda. Independent consultant working with external lawyers on civil claims and related investigations.Update: We continue to deal with the historical legal issues in a professional and efficient manner, and although the final outcome of the civil claims remains uncertain, good progress has been made during the year.

Strategic Report Governance Financial Statements
Trinity Mirror plc Annual Report 2016 15
Risks and uncertaintiesContinued
Group’s appetite for risk and how this manifests itself in the way the Group conducts business. How the Group manages risks is set out in the Corporate Governance Report on page 37.
The outcome of the June 2016 UK referendum on EU membership has created increased macroeconomic uncertainty. The impact on the Group has been the reduction in gilt and bond yields and the impact of this on the deficit in the defined benefit schemes.
The weakening of sterling has also contributed to increased newsprint costs in the second half of 2016 and in the first half of 2017. Considerations in relation to the uncertainty and their immediate impacts are included in the principal risks below. Whilst the impact is uncertain and hard to assess there is a risk that our revenues could be lower than expectations.
Risk description Risk factors Risk appetite Risk action and update
StrategyThe overall strategy or elements of the strategy are inappropriate and the delivery of the strategy is badly executed.
The Group is unable to support and then grow revenue, profit and cash flow.
Trinity Mirror has the appetite for taking well balanced risks deemed necessary to develop the business where they are in line with our strategy and do not knowingly compromise our existing brands, reputation or the financial stability of the Group. We recognise the industry-wide trends around print revenue declines and are committed to addressing them through delivery of our strategy.We seek to ensure the successful delivery of the strategy through robust ongoing monitoring systems and processes. We will only implement changes or invest in areas which are key to the delivery of our strategy and that do not compromise our existing brands, reputation or the financial stability of the Group. We recognise that investment decisions taken may not always have the desired outcome and aim to create a high performing environment based on openness and integrity where potential issues are identified and remedied quickly to ensure we continue to move in the right direction.
Actions: Monthly review of specific strategic initiatives at Board meetings and, at least annually, review of overall strategy.Update: The strategy has been refreshed with focus on investment, in digital and in new revenue streams, to drive growth combined with minimising the decline in print revenues and tight management of the cost base.The key objective of the strategy is to deliver continued growth in digital and new revenues from existing brands and from new businesses and to protect print while at the same time seeking out strategic opportunities.
Revenue lossFaster than anticipated loss of revenue from print and failure to deliver new revenue streams to offset print decline and drive growth.
Future print circulation volumes decline at a faster rate than anticipated.Print advertising revenues decline at a faster rate than anticipated and digital revenues do not compensate for declines and drive growth.Other print related publishing revenues and revenue from our contract print operations could be impacted by an accelerated decline in print volumes or the loss of a major print contract customer.
As above. Actions: The rate of print revenue decline remained volatile during the year. To counter this we increased our cost management actions and delivered additional structural cost savings and other cost mitigation initiatives. We did not reduce our investment in digital: people, product and infrastructure; and delivered continued growth in digital revenue.Update: Digital growth is not yet offsetting print declines. We are confident that the refreshed strategy will deliver digital and new revenues which will lead to revenue growth over the medium term and that profits are supported in the short term.
PensionsPension deficits grow at such a rate so as to affect the viability of the Group itself or so that the annual funding costs consume a disproportionate level of cash flow.
Increased mortality impacts liabilities.Reduced returns and investments.Government legislation.Increased funding.
Trinity Mirror has no appetite for taking risks which inhibit financial flexibility in achieving our strategic aims alongside meeting over time our pension obligations.We are fully aware of the challenges faced in meeting over time our pension funding obligations and our focus is on working with Trustees to deliver these in a manner which also enables us to respond to strategic challenges for the benefit of all our stakeholders. We continue to seek opportunities to de-risk our schemes without a material increase in funding obligations.
Actions: Regular reporting to the Board. Good relationship and regular meetings with Trustees. Review of options to de-risk pension liabilities. Update: We remain committed to addressing our historical pension deficits and continue to make payments in accordance with deficit funding schedules agreed at the last valuation. The next triennial valuation date is 31 December 2016 and is required to be completed by March 2018. The deficits have increased significantly during the year driven by falling discount rates and higher inflation rates.
Historical legal issuesDamage to reputation arising from historical events, direct financial impact from legal claims and distraction of senior management time from delivering the strategy.
Potential financial exposures.Reputational damage for Group and brands.Inability to attract people to the Group.
Trinity Mirror has no appetite for past behaviours that constitute a breach of the criminal law. We take historical legal allegations very seriously and are committed to cooperating with relevant authorities as necessary and dealing with civil claims in the appropriate manner. The Board and management continue to give significant management attention to the historical legal issues.
Actions: Standing item on Board agenda. Independent consultant working with external lawyers on civil claims and related investigations.Update: We continue to deal with the historical legal issues in a professional and efficient manner, and although the final outcome of the civil claims remains uncertain, good progress has been made during the year.
Strategic Report
Trinity Mirror plc Annual Report 201616
Significant risksStrategy and revenue lossThe vision and strategy section on page 6 and the strategic and key performance indicators section on pages 9 and 10 give a review of the progress to date and the future expectations of the strategy and revenue loss.
PensionsAn update on pensions is set out in the Group Financial Review on page 25 and in note 33 in the notes to the consolidated financial statements.
Historical legal issuesIn March 2016, the Supreme Court refused the Group’s application to appeal the decision of the Court of Appeal which upheld the findings of Mr Justice Mann in May 2015.
Following the Supreme Court hearing, the Group started to accelerate the resolution of these historical matters. Good progress has been made on settling civil claims with damages for over 80% of claims settled by the year end. To maintain momentum in bringing the process to a conclusion it was clear that costs, in particular the claimants’ legal costs, would be higher resulting in an increase in the provision for dealing with these historical matters by £11.5 million in December 2016 bringing the total amount provided to £52.5 million. During the year, £29.7 million has been charged against the provision and the provision remaining at the end of 2016 was £18.1 million.
As there remains uncertainty in relation to how matters will develop, a contingent liability has been highlighted in note 39 in the notes to the consolidated financial statements. The Board remains confident that the exposures arising from these historical events are manageable and do not undermine the delivery of the Group’s strategy.
Other risks and uncertaintiesAppropriate management actions are in place to minimise the impact of the other risks and uncertainties which are identified as part of the risk process.
Environmental and health and safety risks are set out in the corporate responsibility section opposite.
Going concern and viabilityIn accordance with the Corporate Governance Code 2014 (and Listing Rules), the Board has prepared statements on the Company’s going concern and viability. Details can be found on pages 37 and 38.
Press regulationAlong with the overwhelming majority of publishers in the UK, we remain committed to our membership of The Independent Press Standards Organisation (IPSO) which regulates our journalism and enforces the Editors’ Code Of Practice (The Code). Pursuant to our obligations, we submit an Annual Statement to IPSO, which is published on its website. The Statement sets out our record on editorial compliance during the previous year (including details of complaints upheld against us), our protocols for maintaining editorial standards, our complaints handling process and our training programmes for journalists.
Together with the majority of the UK Publishers we are very concerned about the future of press freedom and the costs that could be incurred by the Group should Section 40 of the Crime and Courts Act 2013 (S.40) be activated by the Government. To this end, we have advocated strongly for the repeal of S.40 in our response to The Department Of Culture Media and Sport’s Consultation on this issue.
Corporate responsibilityThe Group is not a multinational nor is it engaged in heavy industry and therefore is not exposed to significant environmental exposure.
The Group has had no human rights issues and has issued no policies that need to be disclosed for an understanding of the development, performance or position of the Group’s business.
The Group is exposed to the risk of failure by employees to comply with its environmental or health and safety policies. It is unlikely that a failure in these areas would be catastrophic.
The Group’s main exposure in the corporate responsibility area is one of reputational damage which is fundamental to its operations and is dependent upon the honesty and integrity of each and every employee. We acknowledge that the continuing development and well being of our employees depends upon maintaining the highest standards of integrity and personal conduct in all matters which involve the Group.
The procedure that the Group employs to control and manage these risks is through a regular review of its standards and systems and through training of relevant employees and managers. The Group’s Standards of Business Conduct are embedded within the culture of the Group. As part of the integration of Local World, the process to standardise policies across Local World and the Group continues.
The Group has a whistleblowing charter in place where employees may report any concerns about the integrity of the business. From 2014, this has been hosted by an independent third party. The charter is reviewed by the Audit & Risk Committee on a regular basis.
Our Corporate Responsibility Report, on pages 62 to 67, sets out the Group’s:
− Environmental report, which includes the key environmental risks together with a review of our performance during the year and our targets for the future;
− Health and safety report, which includes the initiatives undertaken during the year, our performance during the year and our targets for the future; and
− Social and community matters, including charitable donations, community engagement and fundraising.
The Group is a UK tax payer and complies with all UK taxation requirements. The Group paid corporation tax of £12.2 million (2015: £9.7 million excluding Local World) and paid indirect employment taxes (employer and employee NI and employee PAYE) of £70.5 million (2015: £63.7 million excluding Local World) during the year.
The Group’s main opportunity in the corporate responsibility area is also reputational. We believe that there are advantages to being seen as the employer of choice for those entering our industry, that decision having been made on an assessment, amongst many other things, of our corporate social responsibility programmes. Those programmes will also be key in the retention of staff. We believe that there are obvious commercial advantages from being seen as a socially responsible organisation.
Risks and uncertaintiesContinued

Strategic Report Governance Financial Statements
Trinity Mirror plc Annual Report 2016 17
Trends and challenges
The Group’s businesses operate in the rapidly evolving media sector and face a challenging trading environment which continues to place structural pressure on the Group’s print related revenue while at the same time presenting opportunities to grow the Group’s digital revenue
Circulation revenue will see lower declines than other print revenues due to the benefit of cover price increases even though volume will remain under pressure.
The majority of the Group’s revenue is currently generated from print circulation and print advertising and our strategy is to ensure that declines in print revenue are minimised. At the same time we look to deliver growth in digital revenue by investing in digital capabilities across products, editorial and commercial to grow our digital audience and revenue. Alongside this investment, the Group will seek out new revenues streams, both organic and acquired.
Contract printing revenue grew for a number of years with spare capacity being utilised by third parties. However, as publishers have already retired significant capacity in recent years, there now remains limited scope for growth. The Group will continue to maximise revenue to fill spare capacity or retire capacity if it is more efficient to do so as was seen with the closure of four of our smaller print plants in the last three years.
The Group’s adjusted cost base in 2016 comprised: Labour (41%), Newsprint (12%), depreciation (4%) and other (43%). The most significant elements of other costs are printing (including external printing of magazines), distribution, information technology and property related costs.
As a consequence of the challenging print environment, the Group continues to focus on cost efficiency including the delivery of material structural cost savings.
The print market continues to face challenges with paid-for newspaper sales and print advertising declining. Whilst print advertising revenue will remain under pressure due to continued structural challenges, any improvement in the overall macroeconomic environment will help reduce the impact of the structural challenges.
National newsbrands advertising is estimated to have declined by 9.8% in 2016 (12.5% decline in print and 2.1% increase in digital) with a slower decline of 7.9% forecast for 2017 (source: WARC/AA).
Regional newsbrands advertising is estimated to have declined by 11.9% in 2016 (14.0% decline in print and 1.7% decline in digital) with a slower decline of 8.6% forecast for 2017 (source: WARC/AA).
The Group has experienced advertising declines ahead of these market forecasts which we believe are broadly in line with actual market trends.
Digital portfolio record growth
Trinity Mirror’s digital portfolio has seen record growth in 2016, reaching 100 million monthly unique browsers for the first time. Mirror Online has over 90 million monthly unique browsers, and was the most popular multi-platform news website in the UK (Comscore, Dec 16).

Strategic Report
Trinity Mirror plc Annual Report 201618
Group financial review
Income statement (page 76)
Statutory results Adjusted results
2016£m
2015£m
2016£m
2015£m
Revenue
Publishing 660.0 528.8 660.0 528.8
Print 581.0 485.9 581.0 485.9
Digital 79.0 42.9 79.0 42.9
Printing 36.2 44.9 36.2 44.9
Specialist Digital 12.9 15.4 12.9 15.4
Central 3.9 3.6 3.9 3.6
Revenue 713.0 592.7 713.0 592.7
Costs (620.2) (512.7) (576.6) (489.1)
Associates 0.7 2.2 1.1 6.0
Operating profit 93.5 82.2 137.5 109.6
Financing (17.0) (15.0) (4.3) (2.1)
Profit before tax 76.5 67.2 133.2 107.5
Tax (7.0) 9.8 (27.0) (21.1)
Profit after tax 69.5 77.0 106.2 86.4
Earnings per share 24.9p 30.2p 38.1p 33.9p
The results have been prepared for the 53 weeks ended 1 January 2017 (2016) and the comparative period has been prepared for the 52 weeks ended 27 December 2015 (2015). The additional week contributed revenue of £9.1 million and operating profit of £2.8 million. The results are presented on a statutory and adjusted basis to provide a more meaningful comparison of the Group’s trading performance.
Group revenue is the same on both a statutory and adjusted basis. Statutory costs include non-recurring items, restructuring charges in respect of cost reduction measures, the amortisation of intangible assets and the pension administrative expenses which are excluded from adjusted costs. The adjusted results also exclude the retranslation of foreign currency borrowings, the impact of fair value changes on derivative financial instruments, the pension finance charge and the impact of tax legislation changes.
Set out in note 38 in the notes to the consolidated financial statements is the reconciliation between the statutory results and the adjusted results.
Revenue (note 5) 2016
£m2015
£m
Publishing Print 581.0 485.9
Circulation 310.6 271.7
Advertising 236.6 182.0
Other 33.8 32.2
Publishing Digital 79.0 42.9
Display and transactional 58.4 30.4
Classified 20.6 12.5
Printing 36.2 44.9
Specialist Digital 12.9 15.4
Central 3.9 3.6
Total revenue 713.0 592.7
Group revenue increased by £120.3 million or 20.3% to £713.0 million.
The year on year revenue trends are distorted by the acquisition of Local World on 13 November 2015, revenue from the Independent print and distribution contract which ceased in April 2016, revenues from Rippleffect which was sold in August 2016, revenue from the contract to publish the Rugby World Cup match day programmes in 2015 and 2016 is a 53 week period to 1 January 2017 (2015 being a 52 week period to 27 December 2015). Revenue trends in this report are presented on an actual and a like for like basis after adjusting for these items.

Strategic Report Governance Financial Statements
Trinity Mirror plc Annual Report 2016 19
Revenue continued On a like for like basis, revenue fell by 8.0% with publishing digital revenue growing by 12.8% and publishing print revenue falling by 10.7%. The challenges in print advertising markets resulted in a decline in display advertising across a number of sectors, in particular retail. Most classified advertising categories also came under pressure, in particular recruitment. Circulation revenues declined 5.2% with volume declines partially mitigated by cover price increases. Strong growth in digital display and transactional revenue of 24.7% was partly offset by classified revenue declines of 11.3%, primarily due to falls in recruitment advertising. The growth in digital display and transactional revenue was driven by the growth in digital audience with average monthly page views on a like for like basis growing by 15.4% to 636.1 million.
The graphs that follow show the quarterly year on year like for like revenue trends in print and digital during the year. Print revenue is all advertising, circulation, printing and other revenues generated from activities linked to the publishing and printing of newspapers. Digital revenue is all advertising and other revenue generated by the publishing digital activities and the revenue of the Specialist Digital businesses.
Print revenue like for like year on year (%)
-25
-20
-15
-10
-5
0
Q1 2016 Q2 2016 Q3 2016 Q4 2016
Total print revenue Circulation Advertising
The graph above for print revenue trends has been prepared on a quarterly basis to highlight the overall volatility experienced in the year.
Digital revenue like for like quarter by quarter (£m)
Q1 Q2 Q3 Q4
2015 2016
19.922.4
19.7 20.222.1 22.1 21.9
20.3
Total digital revenues showed good growth during the year. Publishing digital revenues grew all year driven by the strong growth in digital display and transactional revenue as our strategy of building audience continued to deliver. The slowdown in the percentage rate of growth reflects the momentum seen in the prior year and declines in classified advertising revenues.
Group financial reviewContinued

Strategic Report
Trinity Mirror plc Annual Report 201620
Group financial reviewContinued
Costs (notes 6 to 8 )
Statutory results Adjusted results
2016£m
2015£m
2016£m
2015£m
Labour (239.4) (195.8) (239.4) (195.8)
Newsprint (67.4) (63.8) (67.4) (63.8)
Depreciation (22.2) (22.4) (22.2) (22.4)
Other (291.2) (230.7) (247.6) (207.1)
Non-recurring items (26.0) (4.4) – –
Restructuring charges in respect of cost reduction measures (15.1) (15.3) – –
Amortisation of intangible assets (0.3) (1.8) – –
Pension administrative expenses (2.2) (2.1) – –
Other (247.6) (207.1) (247.6) (207.1)
Costs (620.2) (512.7) (576.6) (489.1)
Statutory costs increased by £107.5 million or 21.0% to £620.2 million. Adjusted operating costs increased by £87.5 million or 17.9% to £576.6 million.
Non-recurring items (note 8)
Statutory results
2016£m
2015£m
Contract termination fee (2.0) –
Impairment of goodwill (2.0) –
Provision for historical legal issues (11.5) (29.0)
Closure of print sites and press line (10.7) (3.4)
Profit on disposal of land and buildings 0.2 –
Local World acquisition transaction costs – (5.6)
Gain on deemed disposal of Local World associate interest – 33.6
Non-recurring items included in administrative expenses (26.0) (4.4)
Non-recurring items included in share of results of associates (0.1) (1.3)
Total non-recurring items (26.1) (5.7)
The non-recurring items comprise a £2.0 million charge for terminating a contract to sell certain assets to the Iliffe family following the acquisition of Local World, a £2.0 million non-cash impairment charge against the carrying value of goodwill in our Specialist Digital division, an increase of £11.5 million in the provision for historical legal issues, a £10.7 million charge for the closure of a print plant and a press line (£9.1 million write off of fixed assets and £1.6 million of closure costs) partially offset by a £0.2 million profit on the disposal of properties in Cardiff and Coventry.
The prior year non-recurring items comprised a £29.0 million increase in the provision for dealing with and resolving civil claims arising from phone hacking, a £3.4 million charge related to the closure of two print plants, costs of £5.6 million relating to the acquisition of Local World substantially offset by a £33.6 million gain on the accounting deemed disposal of the 19.98% interest in Local World on 13 November 2015.
Associates (note 17)
The Group has a 21.53% investment in PA Group and a 50% interest in Brand Events TM Limited (which was acquired on 6 October 2016 and changed its name from Brand Events 1 Limited). Up to 13 November 2015, prior to acquiring the entire business, the Group held a 19.98% investment in Local World, accounted for as an associated undertaking.
Statutory results Adjusted results
2016£m
2015£m
2016£m
2015£m
Result before amortisation and non-recurring items 1.1 6.0 1.1 6.0
Amortisation of intangible assets (0.3) (2.5) – –
Non-recurring items (0.1) (1.3) – –
Share of results of associates 0.7 2.2 1.1 6.0
The statutory and adjusted result for associates fell by £1.5 million and £4.9 million respectively. The decline is wholly attributable to Local World which was an associated undertaking until November 2015 prior to it becoming a wholly owned subsidiary.

Strategic Report Governance Financial Statements
Trinity Mirror plc Annual Report 2016 21
Operating profit (note 6)
Statutory results Adjusted results
2016£m
2015£m
2016£m
2015£m
Operating profit pre associates 92.8 80.0 136.4 103.6
Associates 0.7 2.2 1.1 6.0
Operating profit 93.5 82.2 137.5 109.6
Statutory operating profit pre associates increased by £12.8 million or 16.0% to £92.8 million while adjusted operating profit pre associates increased by £32.8 million or 31.7% to £136.4 million. Adjusted operating margin pre associates increased by 1.6 percentage points from 17.5% to 19.1%.
Statutory operating profit increased by £11.3 million or 13.7% to £93.5 million. Adjusted operating profit increased by £27.9 million or 25.5% to £137.5 million. Adjusted operating margin increased by 0.8 percentage points from 18.5% to 19.3%.
Financing (notes 9, 10 and 33)
Statutory results Adjusted results
2016£m
2015£m
2016£m
2015£m
Investment revenues 0.6 0.6 0.6 0.6
Pension finance charge (10.4) (10.9) – –
Finance costs (7.2) (4.7) (4.9) (2.7)
Interest on bank overdrafts and borrowings (4.9) (2.7) (4.9) (2.7)
Fair value gain on derivative financial instruments 11.3 0.3 – –
Foreign exchange loss on retranslation of borrowings (13.6) (2.3) – –
Financing costs (17.0) (15.0) (4.3) (2.1)
Statutory financing costs which include the pension finance charge, the change in derivative financial instruments and the foreign exchange changes on retranslation of foreign currency borrowings increased by £2.0 million to £17.0 million. Adjusted financing costs increased by £2.2 million to £4.3 million reflecting the interest on the £80 million term loan procured to partially fund the acquisition of Local World in November 2015. This loan was repaid in December 2016.
Profit before tax
Statutory results Adjusted results
2016£m
2015£m
2016£m
2015£m
Profit before tax 76.5 67.2 133.2 107.5
Statutory profit before tax increased by £9.3 million or 13.8% to £76.5 million whilst adjusted profit before tax increased by £25.7 million or 23.9% to £133.2 million.
Group financial reviewContinued

Strategic Report
Trinity Mirror plc Annual Report 201622
Tax (note 11)
Statutory results Adjusted results
2016 £m
2015£m
2016£m
2015£m
Tax (charge)/credit (7.0) 9.8 (27.0) (21.1)
Effective tax rate (9.2%) 14.6% (20.3%) (19.6%)
The statutory tax charge of £7.0 million (2015: credit £9.8 million) comprises a current tax charge of £19.2 million (2015: £8.9 million) and a deferred tax credit of £12.2 million (2015: credit £18.7 million).
The statutory effective tax rate is lower than the standard rate of corporation tax for the reasons set out in the reconciliation below:
Reconciliation of tax charge2016
%2015
%
Standard rate of corporation tax (20.0) (20.3)
Items not deductible in determining taxable profit (non-qualifying depreciation/asset disposals) (5.4) (2.6)
Items not taxable in determining taxable profit (utilised tax losses/asset disposals) 1.1 10.9
Prior period adjustment (current and deferred tax) 2.3 0.4
Deferred tax rate change (from future reduction in corporation tax rate) 12.6 25.6
Tax effect of share of results of associates (brought in post-tax) 0.2 0.6
Tax (charge)/credit rate (9.2) 14.6
The 2015 tax credit included the benefit of no tax on the gain on the accounting deemed disposal of the 19.98% interest in Local World and from a higher credit from the change in the future rate of corporation tax.
The adjusted tax charge of £27.0 million (2015: £21.1 million) represents 20.3% (2015: 19.6%) of adjusted profit before tax. The rate is higher than the statutory effective tax rate as it excludes the impact of the rate change and non taxable items.
Dividends (note 12)The Board proposes a final dividend for 2016 of 3.35 pence per share. An interim dividend for 2016 of 2.10 pence per share was paid on 25 November 2016 bringing the total dividend in respect of 2016 to 5.45 pence per share. The 2016 final dividend payment is expected to amount to £9.2 million. The 2016 interim dividend payment amounted to £5.8 million.
On 5 May 2016 the final dividend proposed for 2015 of 3.15 pence per share was approved by shareholders at the Annual General Meeting and was paid on 10 June 2016. 2015 final dividend payment amounted to £8.8 million.
Earnings per share (note 13)
Statutory results Adjusted results
2016£m
2015£m
2016£m
2015£m
Profit after tax 69.5 77.0 106.2 86.4
Weighted average number of shares (000s) 278,895 254,936 278,895 254,936
Earnings per share 24.9p 30.2p 38.1p 33.9p
Statutory earnings per share fell by 5.3 pence or 17.5% to 24.9 pence. Adjusted earnings per share increased by 4.2 pence or 12.4% to 38.1 pence.
The increase in the weighted average number of shares year on year primarily reflects the impact of the 8.7% equity placing on 28 October 2015 and the issue of shares representing 1.3% of equity on 13 November 2015, both relating to the acquisition of Local World partially offset by the shares bought back as part of the share buyback programme.
Group financial reviewContinued

Strategic Report Governance Financial Statements
Trinity Mirror plc Annual Report 2016 23
Cash flow (page 77)2016
£m2015
£m
Adjusted operating profit 137.5 109.6
Depreciation 22.2 22.4
Adjusted EBITDA 159.7 132.0
Restructuring in respect of cost reduction measures (15.4) (16.1)
Historical legal issues (29.7) (4.0)
Pension deficit funding (40.7) (20.0)
Other including other working capital items 17.6 (29.3)
Cash flows from operating activities 91.5 62.6
Income tax paid (12.2) (9.7)
Net interest paid (5.3) (1.1)
Capital expenditure (4.3) (3.6)
Property disposals 10.6 –
Acquisition of associate undertaking (0.8) –
Disposal of subsidiary undertaking 1.8 –
Acquisition of subsidiary undertaking – (160.1)
Issue of shares – 34.5
Dividends received – 16.3
Purchase of own shares (2.3) –
Purchase of shares for LTIP (2.0) –
Dividends paid (14.6) (12.5)
Net cash flow 62.4 (73.6)
Borrowings (repaid)/increased (80.0) 80.0
Net (decrease)/increase in cash (17.6) 6.4
Cash at start of period 55.4 49.0
Cash at end of period 37.8 55.4
Other including other working capital items represent: working capital movements, the share of results of associates, the share-based payments charge, the write-off of fixed assets, the pension administrative expenses and other working capital movements.
Income tax paid increased due to a increase in taxable income partially offset by a fall in the standard rate of corporation tax.
Net interest paid comprised £4.8 million (2015: £1.7 million) interest paid on borrowings and refinancing fees of £1.1 million less £0.6 million (2015: £0.6 million) interest received. The increase in interest payments is due to interest payments relating to the £80.0 million term loan taken out in November 2015.
Capital expenditure was £4.3 million (2015: £3.6 million) against depreciation of £22.2 million (2015: £22.4 million).
Proceeds of £10.6 million (2015: nil) were received from the disposal of properties.
The Group acquired a 50% interest in Brand Events TM Limited for £0.8 million.
The Group disposed of its subsidiary undertaking, Rippleffect Limited, for net proceeds of £1.8 million.
In 2015, the Group completed the acquisition of the 80.02% of Local World not previously owned. Cash outflow amounted to £148.2 million and net debt at the date of acquisition was £11.9 million. Connected with the acquisition a share placing of 22.4 million shares raised £34.5 million net of expenses and a new £80.0 million five year term loan was entered into.
In 2015, dividends received comprise a dividend from PA Group of £4.3 million and a dividend from Local World of £12.0 million.
The Group acquired 2.5 million shares for a consideration of £2.3 million under the share buyback programme.
The Group paid £2.0 million to the Trustees of the Group’s LTIP to enable the Trust to acquire 1.6 million shares.
Dividend payments totalling £14.6 million were paid to shareholders. The 2015 final dividend payment amounted to £8.8 million and the 2016 interim dividend payment amounted to £5.8 million.
Cash balances fell by £17.6 million during the year to £37.8 million.
Group financial reviewContinued

Strategic Report
Trinity Mirror plc Annual Report 201624
Balance sheet (page 78)2016
£m2015
£m
Intangible assets 901.5 904.3
Property, plant and equipment 262.1 300.1
Investment in associates 21.8 19.2
Retirement benefit assets – 29.4
Deferred tax assets 81.5 55.2
Derivative financial instruments – 3.5
Non-current assets 1,266.9 1,311.7
Cash and cash equivalents 37.8 55.4
Short-term debt (81.2) (15.0)
Medium-term debt – (132.6)
Retirement benefit obligation (466.0) (334.6)
Deferred tax liabilities (164.1) (175.9)
Provisions (31.5) (50.7)
Net current other assets 17.5 25.3
Non-current liabilities and net current liabilities (687.5) (628.1)
Net assets 579.4 683.6
Share capital (28.3) (28.3)
Share premium account (606.7) (606.7)
Merger reserve (37.9) (37.9)
Capital redemption reserve (4.4) (4.4)
Retained earnings and other reserves 97.9 (6.3)
Equity (579.4) (683.6)
Intangible assets (notes 14 and 15)2016
£m2015
£m
Goodwill 102.0 104.5
Publishing rights and titles 798.9 798.9
Customer relationships and domain names 0.6 0.9
Intangible assets 901.5 904.3
Goodwill fell by £2.5 million to £102.0 million representing the goodwill associated with Rippleffect which was sold in August 2016. An impairment of £2.0 million was made at the half year and the remaining £0.5 million was included in the profit/(loss) on disposal calculation which was nil.
Customer relationships and domain names have fallen by £0.3 million reflecting amortisation charged in the year.
The impairment review at the reporting date concluded that no impairment was required in respect of the intangible assets.
Group financial reviewContinued

Strategic Report Governance Financial Statements
Trinity Mirror plc Annual Report 2016 25
Property, plant and equipment (note 16)2016
£m2015
£m
Land and buildings 152.4 171.6
Plant and equipment 105.7 123.6
Assets under construction 4.0 4.9
Property, plant and equipment 262.1 300.1
The net book value of property, plant and equipment fell by £38.0 million to £262.1 million during the year. This relates to the depreciation charge of £22.2 million, asset write-offs of £9.6 million, asset disposal of £10.4 million partially offset by additions of £4.2 million.
Investment in associates (note 17)Investment in associates represents our 21.53% investment in PA Group Limited and 50% interest in Brand Events TM Limited. The carrying value of our share in PA Group Limited has increased by £1.8 million being the statutory share of results of the associates included in the consolidated income statement and the consolidated statement of comprehensive income. The investment in Brand Events TM Limited was £0.8 million.
Deferred tax (note 21)Deferred tax assets increased by £26.3 million from £55.2 million to £81.5 million due the increase in the accounting pension deficit partially offset by the recalculation of the opening asset following the future reduction in the corporation tax rate from 18% to 17%.
Deferred tax liabilities fell by £11.8 million from £175.9 million to £164.1 million primarily due to the restatement of the opening liability following the future reduction in the corporation tax rate from 18% to 17%.
Derivative financial instruments (note 26)Derivative financial assets of £14.8 million represent the valuation of the cross-currency interest rate swap calculated in accordance with IAS 39. This swap relates to the loan notes maturing within one year. The use of financial instruments is disclosed in note 34 in the notes to the consolidated financial statements.
Pensions (note 33)The Group operates defined contribution pension schemes with contributions and associated costs charged to operating profit.
The defined benefit pension schemes operated by the Group were closed to future accrual in 2010.
The last actuarial funding valuations of the defined benefit pension schemes were as at 31 December 2013. The valuations were completed in December 2014 with deficit funding contributions agreed of circa £36 million per annum from 2015 to 2023 reducing to circa £21 million for 2024 and 2025. In addition, the Group agreed additional contributions would be paid at 50% of the excess if dividends paid in 2015 were above 5 pence per share and if a greater than 10% annual increase thereafter.
Payments in 2016 were £40.7 million (2015: £20.0 million) comprising £35.7 million (£36.2 million scheduled payment reduced by £0.5 million prepaid in 2014) of deficit funding and alongside the share buyback programme, the Group paid to the defined benefit pension schemes an additional £5.0 million in August 2016 with up to a further £2.5 million payable in 2017.
The accounting pension deficit increased by £160.8 million to £466.0 million (£385.1 million net of deferred tax) driven by a fall in long term interest rates and higher inflation expectations. The increase in the accounting pension deficit does not have an immediate impact on the agreed funding commitments. The next valuation date of the schemes is 31 December 2016 and valuations are expected to be finalised by March 2018.
Net debt (note 27)The Group repaid the £80 million Acquisition Term Loan procured for the acquisition of Local World and replaced the undrawn £60 million bank facility with a new amortising £110 million bank facility which is committed until December 2021. No drawings have been made on the new bank facility.
Net debt on a contracted basis fell by £62.4 million from £92.9 million to £30.5 million. Net debt comprises the outstanding private placement loan notes of £68.3 million and cash balances of £37.8 million. The private placement loan notes are due for repayment in June 2017.
Statutory net debt (which includes the US$ denominated private placement loan notes at the reporting date exchange rate and the related cross-currency interest rate swap at fair value) fell by £60.1 million from £88.7 million to £28.6 million. The fair value of the Group’s cross-currency interest rate swap was an asset of £14.8 million and the sterling equivalent of the US$ denominated private placement loan notes was £81.2 million.
Group financial reviewContinued
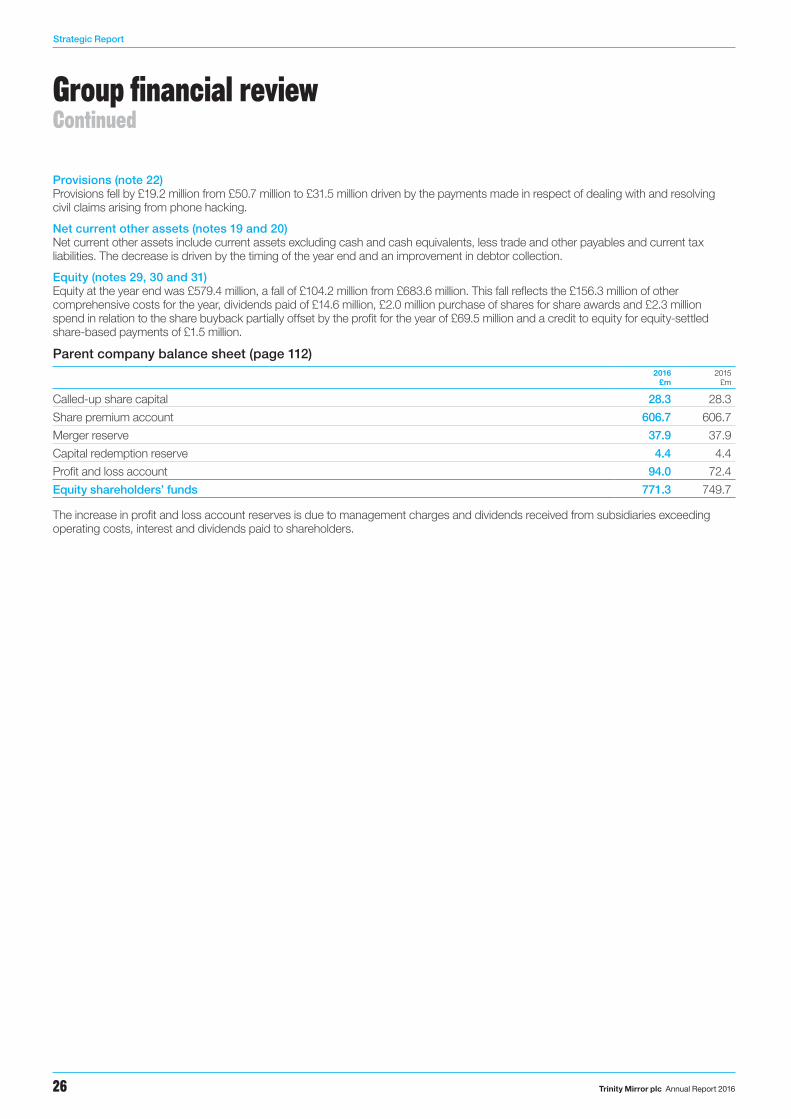
Strategic Report
Trinity Mirror plc Annual Report 201626
Provisions (note 22)Provisions fell by £19.2 million from £50.7 million to £31.5 million driven by the payments made in respect of dealing with and resolving civil claims arising from phone hacking.
Net current other assets (notes 19 and 20)Net current other assets include current assets excluding cash and cash equivalents, less trade and other payables and current tax liabilities. The decrease is driven by the timing of the year end and an improvement in debtor collection.
Equity (notes 29, 30 and 31)Equity at the year end was £579.4 million, a fall of £104.2 million from £683.6 million. This fall reflects the £156.3 million of other comprehensive costs for the year, dividends paid of £14.6 million, £2.0 million purchase of shares for share awards and £2.3 million spend in relation to the share buyback partially offset by the profit for the year of £69.5 million and a credit to equity for equity-settled share-based payments of £1.5 million.
Parent company balance sheet (page 112)2016
£m2015
£m
Called-up share capital 28.3 28.3
Share premium account 606.7 606.7
Merger reserve 37.9 37.9
Capital redemption reserve 4.4 4.4
Profit and loss account 94.0 72.4
Equity shareholders’ funds 771.3 749.7
The increase in profit and loss account reserves is due to management charges and dividends received from subsidiaries exceeding operating costs, interest and dividends paid to shareholders.
Group financial reviewContinued

Strategic Report Governance Financial Statements
Trinity Mirror plc Annual Report 2016 27
The Group has four operating segments, each of which is a division, that are regularly reviewed for the purposes of allocating resources and assessing performance. The divisional review that follows is presented on an adjusted basis and there is no difference between the operating profit by division and the segment result of each operating segment that is shown in note 4 in the notes to the consolidated financial statements.
The operating segments are: Publishing which includes all of our newspapers and associated digital publishing; Printing which provides printing services to the Publishing segment and to third parties; Specialist Digital which includes our acquired digital classified recruitment business and our digital marketing services business; and Central which includes revenue and costs not allocated to the operational divisions and our share of results of associates. After completing the acquisition of the 80.02% of Local World not previously owned on 13 November 2015, Local World is included in the Publishing division. Prior to 13 November 2015 the Group’s 19.98% interest was equity accounted for as an associated undertaking and included in the Central division.
The revenue and adjusted operating profit by operating segment is presented below:2016
£m2015
£mVariance
£mVariance
%
Publishing 660.0 528.8 131.2 24.8%
Printing 36.2 44.9 (8.7) (19.4%)
Specialist Digital 12.9 15.4 (2.5) (16.2%)
Central 3.9 3.6 0.3 8.3%
Revenue 713.0 592.7 120.3 20.3%
Publishing 148.4 113.7 34.7 30.5%
Printing – – – –
Specialist Digital 2.4 2.6 (0.2) (7.7%)
Central (13.3) (6.7) (6.6) (98.5%)
Adjusted operating profit 137.5 109.6 27.9 25.5%
The year on year revenue trends are distorted by the acquisition of Local World in 2015, revenue from the Independent print and distribution contract which ceased in April 2016, revenues from Rippleffect which was sold in August 2016, revenue from the contract to publish the Rugby World Cup match day programmes in 2015 and 2016 is a 53 week period to 1 January 2017 (2015: 52 week period to 27 December 2015). Revenue trends in this report are presented on an actual and a like for like basis after adjusting for these items.
PublishingThe Publishing division publishes paid-for national newspapers and paid-for and free regional newspapers and operates a portfolio of related digital products. Key brands include the Daily Mirror, the Sunday Mirror, the Sunday People, the Daily Record, the Sunday Mail and daily titles in a number of metropolitan cities. At the end of the year we handed back four of the eight Metros we published. The Publishing division also holds events and exhibitions related to its publishing activities and undertakes contract publishing for football clubs and other sports organisations.
The revenue and adjusted operating profit for the Publishing division is as follows:2016
£m2015
£mVariance
£mVariance
%
Print 581.0 485.9 95.1 19.6%
Circulation 310.6 271.7 38.9 14.3%
Advertising 236.6 182.0 54.6 30.0%
Other 33.8 32.2 1.6 5.0%
Digital 79.0 42.9 36.1 84.1%
Display and transactional 58.4 30.4 28.0 92.1%
Classified 20.6 12.5 8.1 64.8%
Revenue 660.0 528.8 131.2 24.8%
Costs (511.6) (415.1) (96.5) (23.2%)
Adjusted operating profit 148.4 113.7 34.7 30.5%
Adjusted operating margin 22.5% 21.5% 1.0% 4.7%
Revenue increased by £131.2 million to £660.0 million with print revenue increasing by £95.1 million and digital revenue increasing by £36.1 million. On a like for like basis revenue fell by 8.4% with print revenue declining by 10.7% and digital revenue growing by 12.8%.
Costs increased by £96.5 million to £511.6 million driven by the acquisition of Local World partially offset by ongoing cost mitigation and structural cost savings.
Operating profit increased by £34.7 million or 30.5% to £148.4 million with operating margin increasing by 1.0 percentage point from 21.5% to 22.5%.
Divisional financial review

Strategic Report
Trinity Mirror plc Annual Report 201628
Print revenuePrint revenue grew by 19.6%. On a like for like basis print revenue fell by 10.7%.
Circulation revenue improved by 14.3%. Like for like circulation revenues fell by 5.2% with volume declines partially mitigated by cover price increases.
The Daily Mirror volume fell by 10.8% compared to a 5.1% fall for the UK national daily tabloid market. The market trends have been distorted by cover price cuts and increased sampling in the market. This is against cover price increases for our titles.
The Sunday Mirror and Sunday People volumes declined by 14.7% and 14.1% respectively in a UK national Sunday tabloid market that fell by 6.6%. The Daily Record was down 11.5% against an overall Scottish daily tabloid market decline of 7.9% and the Sunday Mail was down 13.9% against an overall Scottish Sunday tabloid market decline of 10.0%. The market trends in the national Sunday market and Scotland have been distorted by cover price discounting and changes in sampling.
The average monthly circulation volumes and average readership of our national newspapers were as follows: 2016
Volumeactuala
000
2015Volume
actuala
000Change
%
2016Average
readershipb
000
2015Average
readershipb
000Change
%
Daily Mirror 770 864 (10.8%) 1,818 1,953 (6.9%)
Sunday Mirror 695 815 (14.7%) 1,804 2,061 (12.5%)
Sunday People 268 312 (14.1%) 458 543 (15.7%)
Daily Recordc 158 179 (11.5%) 470 475 (1.1%)
Sunday Mailc 171 199 (13.9%) 544 605 (10.1%)
a Average ABC circulation for the 12 months to December 2016 and December 2015.
b Average NRS readership for the 12 months to September 2016 and September 2015.
c Within Scottish market only.
The market for our regional titles remains difficult with declines of 15.1% for paid for dailies, 17.1% for paid for weeklies and 17.9% for paid for Sundays. All titles are experiencing difficulty and our overall trends remain challenged in the market.
The circulation and readership volumes for our key regional titles are set out below:2016Daily
circulationa
2015Daily
circulationbChange
%
2016AveragereadersC
2015Averagereadersc
Change%
Manchester Evening News< 47,052 52,158 (9.8%) 237,702 256,091 (7.2%)
Liverpool Echo 44,427 52,984 (16.2%) 134,796 154,055 (12.5%)
Hull Daily Mail 27,054 29,940 (9.6%) 79,332 81,006 (2.1%)
Evening Chronicle (Newcastle) 26,811 30,583 (12.3%) 90,584 113,578 (20.2%)
The Sentinel (Stoke) 26,657 30,957 (13.9%) 81,641 85,980 (5.0%)
Leicester Mercury 25,859 28,756 (10.1%) 91,522 85,221 7.4%
Evening Gazette (Teesside) 21,174 23,969 (11.7%) 65,664 66,299 (1.0%)
South Wales Evening Post 21,031 24,310 (13.5%) 63,763 67,913 (6.1%)
Birmingham Mail> 19,548 24,846 (21.3%) 68,822 81,752 (15.8%)
Derby Telelgraph 18,903 21,183 (10.8%) 57,253 58,034 (1.3%)
a Actual average ABC July to December 2016.
b Actual average ABC July to December 2015.
c JICREG January to June 2016 and January to June 2015.
< Daily circulation (Monday – Saturday) with average readers (Thursday – Friday).
> Daily circulation (Monday – Friday) with average readers (Friday only).
Print advertising revenue increased by 30.0% with display and other up by 3.3% and classified up by 75.4%. Like for like print advertising revenue fell by 17.9% with display and other lower by 15.1% and classified lower by 20.5%. Increased challenges in print advertising markets saw declines in display advertising across a number of sectors, in particular retail. Most classified advertising categories also came under pressure, in particular recruitment.
The Daily Mirror print advertising volume market share in the UK national daily tabloid market fell from 18.3% to 17.4%. The Sunday Mirror and Sunday People share fell with the Sunday Mirror share falling from 17.5% to 16.2% and the Sunday People share falling from 11.3% to 10.9%. The Daily Record share improved from 15.9% to 16.8% and the Sunday Mail share improved from 26.6% to 30.5%.
Our regional titles continue to experience difficult advertising markets, particularly national advertising in our metropolitan titles.
Other print revenue increased by 5.0%. Like for like other print revenues decreased by 1.5% with declines in leaflets and business enterprise revenue partially offset by improvements in Sports Media and syndication.
Divisional financial reviewContinued
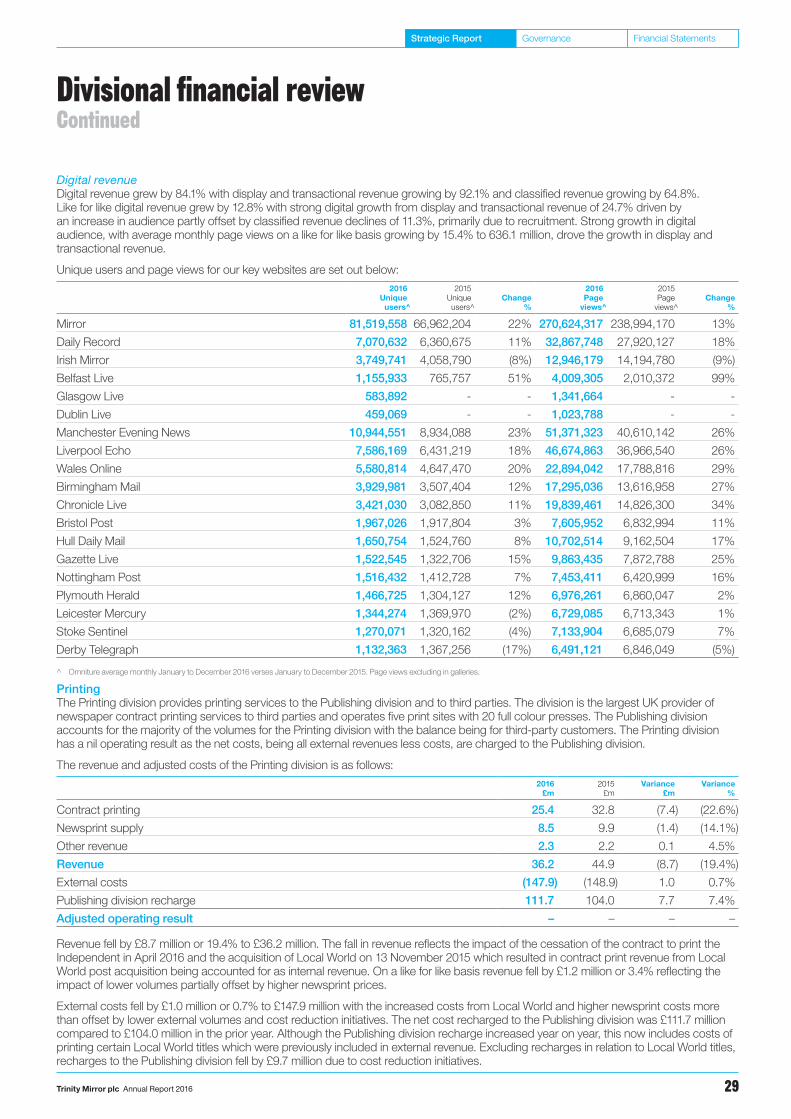
Strategic Report Governance Financial Statements
Trinity Mirror plc Annual Report 2016 29
Digital revenueDigital revenue grew by 84.1% with display and transactional revenue growing by 92.1% and classified revenue growing by 64.8%. Like for like digital revenue grew by 12.8% with strong digital growth from display and transactional revenue of 24.7% driven by an increase in audience partly offset by classified revenue declines of 11.3%, primarily due to recruitment. Strong growth in digital audience, with average monthly page views on a like for like basis growing by 15.4% to 636.1 million, drove the growth in display and transactional revenue.
Unique users and page views for our key websites are set out below:2016
Uniqueusers^
2015Uniqueusers^
Change%
2016Page
views^
2015Page
views^Change
%
Mirror 81,519,558 66,962,204 22% 270,624,317 238,994,170 13%
Daily Record 7,070,632 6,360,675 11% 32,867,748 27,920,127 18%
Irish Mirror 3,749,741 4,058,790 (8%) 12,946,179 14,194,780 (9%)
Belfast Live 1,155,933 765,757 51% 4,009,305 2,010,372 99%
Glasgow Live 583,892 - - 1,341,664 - -
Dublin Live 459,069 - - 1,023,788 - -
Manchester Evening News 10,944,551 8,934,088 23% 51,371,323 40,610,142 26%
Liverpool Echo 7,586,169 6,431,219 18% 46,674,863 36,966,540 26%
Wales Online 5,580,814 4,647,470 20% 22,894,042 17,788,816 29%
Birmingham Mail 3,929,981 3,507,404 12% 17,295,036 13,616,958 27%
Chronicle Live 3,421,030 3,082,850 11% 19,839,461 14,826,300 34%
Bristol Post 1,967,026 1,917,804 3% 7,605,952 6,832,994 11%
Hull Daily Mail 1,650,754 1,524,760 8% 10,702,514 9,162,504 17%
Gazette Live 1,522,545 1,322,706 15% 9,863,435 7,872,788 25%
Nottingham Post 1,516,432 1,412,728 7% 7,453,411 6,420,999 16%
Plymouth Herald 1,466,725 1,304,127 12% 6,976,261 6,860,047 2%
Leicester Mercury 1,344,274 1,369,970 (2%) 6,729,085 6,713,343 1%
Stoke Sentinel 1,270,071 1,320,162 (4%) 7,133,904 6,685,079 7%
Derby Telegraph 1,132,363 1,367,256 (17%) 6,491,121 6,846,049 (5%)
^ Omniture average monthly January to December 2016 verses January to December 2015. Page views excluding in galleries.
PrintingThe Printing division provides printing services to the Publishing division and to third parties. The division is the largest UK provider of newspaper contract printing services to third parties and operates five print sites with 20 full colour presses. The Publishing division accounts for the majority of the volumes for the Printing division with the balance being for third-party customers. The Printing division has a nil operating result as the net costs, being all external revenues less costs, are charged to the Publishing division.
The revenue and adjusted costs of the Printing division is as follows:2016
£m2015
£mVariance
£mVariance
%
Contract printing 25.4 32.8 (7.4) (22.6%)
Newsprint supply 8.5 9.9 (1.4) (14.1%)
Other revenue 2.3 2.2 0.1 4.5%
Revenue 36.2 44.9 (8.7) (19.4%)
External costs (147.9) (148.9) 1.0 0.7%
Publishing division recharge 111.7 104.0 7.7 7.4%
Adjusted operating result – – – –
Revenue fell by £8.7 million or 19.4% to £36.2 million. The fall in revenue reflects the impact of the cessation of the contract to print the Independent in April 2016 and the acquisition of Local World on 13 November 2015 which resulted in contract print revenue from Local World post acquisition being accounted for as internal revenue. On a like for like basis revenue fell by £1.2 million or 3.4% reflecting the impact of lower volumes partially offset by higher newsprint prices.
External costs fell by £1.0 million or 0.7% to £147.9 million with the increased costs from Local World and higher newsprint costs more than offset by lower external volumes and cost reduction initiatives. The net cost recharged to the Publishing division was £111.7 million compared to £104.0 million in the prior year. Although the Publishing division recharge increased year on year, this now includes costs of printing certain Local World titles which were previously included in external revenue. Excluding recharges in relation to Local World titles, recharges to the Publishing division fell by £9.7 million due to cost reduction initiatives.
Divisional financial reviewContinued

Strategic Report
Trinity Mirror plc Annual Report 201630
Specialist DigitalThe Specialist Digital division includes Trinity Mirror Digital Recruitment, our digital classified recruitment business and Communicator, our digital communications agency.
Trinity Mirror Digital Recruitment operates three specialist job boards: GAAPweb, TotallyLegal and SecsintheCity, each offering their clients access to high quality databases of job candidates within their specific niche areas of finance and accounting, legal and secretarial. Communicator is a digital communications agency which develops and manages digital communications across email, mobile, social and web enabling clients to send targeted customer communications on a global scale. Rippleffect, a digital marketing services agency was sold in August 2016.
The revenue and adjusted operating profit of the Specialist Digital division is as follows:2016
£m2015
£mVariance
£mVariance
%
Advertising 4.8 5.0 (0.2) (4.0%)
Other 8.1 10.4 (2.3) (22.1%)
Revenue 12.9 15.4 (2.5) (16.2%)
Costs (10.5) (12.8) 2.3 18.0%
Adjusted operating profit 2.4 2.6 (0.2) (7.7%)
Recruitment advertising revenues reduced by £0.2 million compared to 2015 and our marketing services businesses showed revenue declines of £2.3 million. Communicator Corp revenues were in line with 2015 and the Rippleffect disposal impact was £2.3 million. Operating profit fell marginally by £0.2 million.
CentralThe Central division includes revenue and costs not allocated to the operational divisions and the share of results of associates.
The revenue and adjusted operating loss of the Central division is as follows:2016
£m2015
£mVariance
£mVariance
%
Revenue 3.9 3.6 0.3 8.3%
Costs (18.3) (16.3) (2.0) (12.3%)
Associates 1.1 6.0 (4.9) (81.7%)
Adjusted operating loss (13.3) (6.7) (6.6) (98.5%)
The Central division includes revenue and costs not allocated to the operational divisions and the share of results of associates. Revenue primarily relates to rental income from surplus office space at the Group’s main office at Canary Wharf which increased as more vacant space was leased to third parties. Costs increased by £2.0 million from £16.3 million to £18.3 million reflecting increased central costs predominantly from higher legal costs.
The result for 2016 was a loss of £13.3 million compared to a loss of £6.7 million in 2015. The reduction in associates is from Local World which was an associated undertaking until November 2015 prior to it becoming a wholly owned subsidiary. Excluding associates the adjusted operating loss increased by £1.7 million.
By order of the Board
Simon Fox Chief Executive
27 February 2017
Divisional financial reviewContinued

Strategic Report Governance Financial Statements
Trinity Mirror plc Annual Report 2016 31
Chairman’s governance introduction
“ I am confident that the Board continues to function effectively, with sound, skilled and knowledgeable contributions from all its members.”
Dear Shareholder
On behalf of the Board, I am pleased to introduce our Corporate Governance Report. The Board recognises the importance of ethics, integrity and strong corporate values to the success of the Company. I believe that the values your Board believe in are demonstrably embedded throughout the organisation. We remain committed to maintaining a strong momentum in our pursuit of excellence in the way our Company is governed.
As I discussed in my report last year, we have developed a series of statements around our top corporate risks which aim to articulate our ‘risk appetite’. The Board has overall responsibility for oversight of the Group’s operations, ensuring a robust system of internal control and risk management, and determination of the nature and extent of risks it is willing to take. More detail on the Company’s principal risks and risk appetite is set out on pages 14 to 16.
Olivia Streatfeild joined the Board on 15 January 2016. Outside of Trinity Mirror, Olivia is a Partner with Freston Ventures, and her most recent executive role was as the Commercial Director of TalkTalk’s Consumer Business. Olivia brings with her a wealth of commercial, strategic and consumer centric experience, and has contributed strongly throughout the year. Olivia is a member of the Audit & Risk, Remuneration and Nomination Committees.
I believe that the current makeup of the Board, coupled with a strong senior management team, which presents regularly to the Board, provides us with the right balance of skills, experience and diversity to enable us to achieve effective corporate governance. During the year the Board dedicated significant time in working with the senior management team to refresh our strategy and we believe this provides a strong platform to deliver our strategy for growth. You can read more about the Group’s strategy on pages 9 and 10.
As a Board, we take governance very seriously and we regularly discuss and review our ways of working to ensure we continue to improve our effectiveness. In December 2016 we carried out a comprehensive internal review of our performance which built upon the Corporate Governance conclusions and action plans from our last external Board evaluation in 2014 and our internal evaluation in 2015. We are now working through an action plan to build on our strong foundations and are confident that the Board continues to function effectively, with sound, skilled and knowledgeable contributions from all its members. More information on our board evaluation process is set out on page 36.
Compliance with the UK Corporate Governance CodeAs a premium listed company, Trinity Mirror plc is required to report on how it has applied the main principles of the UK Corporate Governance Code (the ‘Code’).
The Board considers that the Company complied in all material respects with the provisions of the Code for the whole of the 53 weeks ended 1 January 2017. A copy of the Code is available at www.frc.org.uk. We comply with the Corporate Governance Statement requirements pursuant to the Financial Conduct Authority (‘FCA’) Disclosure Guidance and Transparency Rules by virtue of the information included in this Corporate Governance section of the Annual Report together with information contained in the Shareholder Information section on pages 117 and 118.
I believe we enter 2017 with a strong Board well equipped with the skills, experience, independence and knowledge needed to deliver on the Company’s strategy.
David GrigsonChairman
27 February 2017
David Grigson, Chairman

Governance
Trinity Mirror plc Annual Report 201632
Board of directors
“ The Board’s composition is appropriate and we can continue to navigate the challenges which 2017 is sure to bring.”
David GrigsonChairmanAppointment date: May 2012 (Appointed as a non-executive director in January 2012)
Simon FoxChief ExecutiveAppointment date: September 2012
Helen StevensonSenior Independent DirectorAppointment date: January 2014 (Appointed as SID: December 2015)
Lee GinsbergNon-executive director Appointment date: January 2014
Committee membership:
A† N*
R
Committee membership:
A† N R†
Committee membership:
A N R*
Committee membership:
A* N R
Experience:David is a Chartered Accountant and was formerly the CFO of Emap plc, CFO of Reuters Group plc, non-executive Chairman of Creston plc, non-executive director of Carphone Warehouse Group PLC, Chairman of Anobii Limited and was non-executive director, member of the Risk and Capital and Nomination and Governance Committees, and Chairman of the Audit Committee at Standard Life plc. Most recently David was the Senior Independent Director and non-executive director at Ocado Group plc.
Experience:Simon was previously Chief Executive Officer of HMV Group plc. Prior to this, he was Chief Operating Officer for Kesa Electricals plc with responsibility for Kesa’s subsidiaries in the UK and Continental Europe and its e-commerce businesses. Simon began his career as a graduate trainee at Security Pacific Bank and worked at Boston Consulting Group. Thereafter, he founded Office World, the UK’s first out-of-town office supplies retailer. Simon was previously a non-executive director at Guardian Media Group plc.
Experience:Helen was Chief Marketing Officer UK at Yell Group plc from 2006 to 2012 and prior to this she served as Lloyds TSB Group Marketing Director. Helen started her career with Mars Inc where she spent 19 years, culminating in her role as European Marketing Director, leading category strategy development across Europe. Helen has in the past served as a non-executive director on the main Board of the Department of Work and Pensions and Shirlaws Group.
Experience:Lee is a Chartered Accountant by profession and was previously Chief Financial Officer of Domino’s Pizza Group plc. Lee joined Domino’s Pizza in 2004 and retired during April 2014. Prior to his role at Domino’s Pizza, Lee held the post of Group Finance Director at Health Club Holdings Limited, formerly Holmes Place plc, where he also served for 18 months as Deputy Chief Executive. Previously, Lee held the position of Group Finance Director at Etam plc.
External appointments:Non-executive Chairman of Investis Limited and Director/Trustee at the Dolma Development Fund.
External appointments:Non-executive director of PA Group Limited.
External appointments:Non-executive director of St Ives plc and the Skipton Building Society, and non-executive director and Chairman of One Smart Star.
Helen also serves on the Strategic Advisory Board of Henley Business School.
External appointments:Non-executive director and Chairman of the Audit & Risk Committee of Mothercare plc, non-executive Chairman of Oriole Restaurants Limited, non-executive Deputy Chairman, Senior Independent Director and Chairman of the Audit Committee of Patisserie Valerie Holdings plc. Non-executive director and Senior Independent Director of On the Beach Group plc and Softcat plc.
David Grigson, Chairman

Strategic Report Governance Financial Statements
Trinity Mirror plc Annual Report 2016 33
Board of directorsContinued
David KellyNon-executive director Appointment date: December 2014
Steve HatchNon-executive director Appointment date: December 2015
Olivia StreatfeildNon-executive director Appointment date: January 2016
Vijay VaghelaGroup Finance Director and Company SecretaryAppointment date: May 2003
Committee membership:
A N R
Committee membership:
A N R
Committee membership:
A N R
Committee membership:
A† R†
Experience:David was Operations Director of Amazon, COO of lastminute.com, and COO and Vice President Operations of eBay Europe. He was subsequently founder and CEO of mydeco and Senior Vice-President and MD International of Rackspace Hosting.
Experience:Steve is the Regional Director: Northern Europe of Facebook. Prior to joining Facebook in 2014, Steve worked in Y&R, Omnicom and WPP where he spent 15 years, with his final role as CEO of MEC.
Experience:Olivia’s most recent executive role was as the Commercial Director of TalkTalk’s Consumer Business. Olivia is currently a Partner at Sir Charles Dunstone’s investment vehicle Freston Ventures, and was previously an Associate Principal at McKinsey & Company, and a leader in McKinsey & Company’s Consumer Retail practice.
Experience:Vijay is a Chartered Accountant and worked in private practice with Deloitte. He joined Mirror Group in 1994 as an Internal Auditor. He was subsequently Group Treasurer and then Director of Accounting and Treasury.
External appointments:Chairman of Love Home Swap, MBA & Company and Pure360. He is Remuneration Committee Chairman of On the Beach Group plc and The Gym Group plc, and a non-executive director of Holiday Extras, Qliro Group, Camelot UK Lotteries Limited, and Simply Business (trading as Xbridge Ltd).
External appointments: Regional Director: Northern Europe of Facebook.
External appointments: Partner at Freston Ventures.
External appointments: An Independent Member of the Audit Committee of The Football Association.
Key:A Member of the Audit & Risk Committee
N Member of the Nomination Committee
R Member of the Remuneration Committee
* Denotes Committee Chairman
† By invitation of the Committee Chairman

Governance
Trinity Mirror plc Annual Report 201634
Corporate governance report
The Financial Reporting Council (‘FRC’)’s Code sets out specific principles and provisions on how a company should be directed and controlled in order to achieve standards of good corporate governance. The version of the Code applicable to the Company for the 53 weeks ended 1 January 2017 was published in September 2014. A copy of the Code is available at www.frc.org.uk. The FRC made changes to the Code in 2016 for accounting periods commencing after June 2016, and we have incorporated disclosures where appropriate throughout this Corporate Governance Report.
The Board considers that the Company complied in all material respects with the Code for the whole 53 week period ended 1 January 2017 and this is set out in this report.
The role of the Board
The Board is responsible for promoting the long-term success of the Company and for providing leadership within a framework of prudent and effective controls that enable risk to be assessed and managed. The Board sets the Company’s strategic aims
and ensures that the necessary resources are in place to allow the Company’s objectives to be met and to review management performance. The Board sets the Company’s values and standards and ensures that its obligations to shareholders and others are met.
The Board has a formal schedule of matters reserved to it for decision. Other specific responsibilities are delegated to Board Committees, each of which has clear written terms of reference. The terms of reference for the Audit & Risk Committee, the Nomination Committee and the Remuneration Committee are available on the Company’s website at www.trinitymirror.com. The Administration Committee consists of the executive directors, and it meets as necessary to deal with administrative matters of a day-to-day nature.
The current Board composition is six non-executive directors and two executive directors. The Company’s governance framework is set out in the diagram below:
Chairman and Chief ExecutiveThe roles of the Chairman and Chief Executive are separated. Their responsibilities are clearly defined, set out in writing and agreed by the Board. The clear and appropriate delineation of responsibility between Chairman and Chief Executive is considered annually as part of the Board’s annual effectiveness review. It was agreed in respect of 2016 that these roles are clear and appropriate and that there exists a shared understanding of all Board and Committee roles and responsibilities.
Role of the ChairmanThe Chairman, David Grigson, ensures that the directors receive accurate, timely and clear information. He is responsible for cultivating a boardroom culture of honesty and openness which encourages debate, challenge where appropriate and enables non-executive directors to make an effective contribution. The Chairman sets the Board’s agenda and ensures sufficient time is allocated for the discussion of all agenda items. The Chairman also consults with the non-executive directors, in particular the Senior Independent Director, on matters of corporate governance.
Role of the Chief ExecutiveAs Chief Executive, Simon Fox is responsible for the day-to-day leadership, operations, performance and management of the Company within the strategy and plans agreed by the Board. This is implemented through the Group Finance Director and Company Secretary and the senior management team.
Role of non-executive directorsThe non-executive directors bring to the Board independence, along with a broad mix of business skills, knowledge and experience. They provide an external perspective to Board discussions and are responsible for the scrutiny of the executive management on behalf of shareholders. The Board is satisfied that all of the non-executive directors meet the independence criteria as set by the Code. The terms and conditions of each of their appointments are available for inspection at the registered office of the Company during normal business hours and at the Company’s Annual General Meeting.
The non-executive directors, in conjunction with the Chairman, meet at least once annually in order to review the effectiveness of the Board. The details of the latest Board effectiveness review can be found on page 36.
TRINITY MIRROR PLC BOARD
Audit & Risk CommitteeRead the report on
pages 40 to 44
Remuneration CommitteeRead the report on
pages 45 to 61
Nomination CommitteeRead the report on
page 39
Administration CommitteeThe Committee consists of
Simon Fox and Vijay Vaghela. It meets as necessary to deal with administrative matters of
a day-to-day nature.

Strategic Report Governance Financial Statements
Trinity Mirror plc Annual Report 2016 35
Corporate governance reportContinued
Board activityKey areas of focus for the Board in 2016 included:
− Strategy; − Risk reviews; − Editorial Governance; − Historical legal issues; − Digital publishing; − New product development; − Financing; − The integration of Local World following the acquisition in 2015; − Pensions; − Review of property strategy; − Property disposals; − Review of the performance of the Board, and Board evaluation; − Succession planning and Board composition; − Dividend policy and administrative processes; − Regulatory change; and − Matters reserved.
The Board expects that the areas of focus for 2017 will remain the same as 2016.
Committee membershipThe Board has agreed that all non-executive directors, other than the Chairman, should serve as members of the Audit & Risk, Nomination and Remuneration Committees. The Chairman chairs the Nomination Committee and is a member of the Remuneration Committee. He attends the Audit & Risk Committee meetings by invitation of its Chairman.
The Board believes that an increasing amount of work is undertaken by these Committees and that a non-executive director can only properly fulfil his or her responsibilities if they are present during Committee meetings and are able to follow the detail of discussion and debate held at those meetings.
On 15 January 2016 Olivia Streatfeild joined the Board as non-executive director. Olivia joined the Audit & Risk, Remuneration and Nomination Committees on her appointment.
Company SecretaryThe Company Secretary, supported by the Company Secretarial department, ensures that effective communication flows between the Board and its Committees and between senior management and the non-executive directors. The Company Secretary also advises the Board on corporate governance matters and ensures that Board procedures are followed.
During the year, Jeremy Rhodes acted as Company Secretary until stepping down with effect from 21 January 2016. Since that date, Vijay Vaghela has been appointed as Company Secretary in addition to his executive duties, with the support of the Company Secretarial department. The Board has further considered the effect of Vijay Vaghela’s role as an executive director of the Company, and is satisfied that he is able to maintain independence where required.
Senior Independent DirectorHelen Stevenson was appointed as Senior Independent Director with effect from 28 December 2015. The Senior Independent Director is available to shareholders to assist with addressing concerns that may arise. The Senior Independent Director meets with the non-executive directors at least once a year to review the performance of the Chairman. The outcome of this review is then discussed with the Chairman.
The Board’s tenure, composition and diversity as at the date of this report are set out below:
25%
75%
Board composition
Executive
Non-executive
75%
25%
Board diversity
Male
Female
37.5%
50%
12.5%
Board tenure
0–3 years
3–6 years
6+ years

Governance
Trinity Mirror plc Annual Report 201636
Corporate governance reportContinued
The Board held nine scheduled meetings in 2016, six of which were held at the Company’s registered office in London, one off-site at the Company’s Annual General Meeting venue, one at the Company’s Bristol office and one held off-site in conjunction with the strategy day.
The number of Remuneration Committee meetings increased from 2015, as additional meetings were held in conjunction with the Company’s remuneration policy development process. More information on the Remuneration Policy is included within the Remuneration Report on pages 45 to 61.
The Board received presentations and Board members have both formal and informal meetings with senior staff. Where a director was unable to attend a meeting, they were provided with all the papers and information relating to that meeting and were able to discuss issues with the Chairman, Chief Executive and Group Finance Director where appropriate. Board meetings are structured to allow open discussion and all directors participate in the discussion of strategy, trading, financial performance and risk management. Board papers are circulated in sufficient time before a meeting to enable full and informed discussion. Members of the wider senior management team attend Board meetings by invitation and regularly make presentations.
Director independenceThe independence of non-executive directors is considered annually as part of the Board performance evaluation process.
The Board believes that all its non-executive directors continue to demonstrate independence in character and judgement and are independent as defined by section B.1.1 of the Code. The Board believes that the Chairman was independent at the date of his appointment. The Board is satisfied that his external roles do not detract from his ability to devote sufficient time to the Company to properly fulfil his responsibilities and be effective in his role.
Board performance evaluationThe Board’s performance and effectiveness is reviewed annually and the Company, although it is not currently a constituent of the FTSE 350, complies with the Code’s best practice recommendation of holding an externally facilitated Board evaluation every third year. In accordance with the Code, the exercise in respect of 2014 was externally facilitated following a tender process conducted by the Chairman and Company
Secretary. An internal Board evaluation was undertaken in 2015. The outcomes of these evaluations resulted in clear action points which have been implemented. In respect of 2016, and looking forward to challenges in 2017, the Chairman, with assistance from the Company Secretarial department, prepared and circulated a detailed questionnaire in respect of the Board and Committees and followed this with an extensive discussion of the outcomes. The evaluation covered the following key topics and included forward-looking elements:
− Role of the Board and relationships; − Composition, process and structure; − Oversight and strategic developments; − Culture; and − Support and governance requirements.
The directors concluded that the Board was functioning effectively and had the appropriate balance of skills, experience, independence and knowledge of the Company to enable them to discharge their responsibilities. As a result of the 2016 evaluation the Board noted that engagement was high in the strategy process, information management had improved and there were good suggestions for the function of Board meetings going forward. The directors were positive about the current composition of the Board. All directors agreed on actions to be worked through in 2017, including agenda planning and increasing the understanding of the financial and additional challenges posed by the macro environment. The Board further concluded that items identified in the 2015 review had been completed, including refinement of the induction programme and guidance, and no new actions were identified as a result.
In addition to the Board evaluation exercise, the Senior Independent Director reviewed the Chairman’s performance with the other directors and subsequently met him to provide feedback. The Board concluded that the Chairman’s leadership is effective.
The Chairman provided feedback to each director on their individual contribution to the Board and, with each of them, considered their development priorities.
Board and Committee meetings and attendanceThe number of Board and Committee meetings held during the year and directors’ attendance was:
Director Scheduled Audit Remuneration Nomination
David Grigson 9/9 5/5* 7/8*** 1/1
Simon Fox 9/9 5/5* 4/8* 1/1
Lee Ginsberg 9/9 5/5 8/8 1/1
Steve Hatch 7/9 4/5 7/8 1/1
David Kelly 8/9 4/5 8/8 1/1
Helen Stevenson 9/9 5/5 8/8 1/1
Olivia Streatfeild** 9/9 4/5 7/8 1/1
Vijay Vaghela 9/9 5/5* 4/8* –
* Attended meetings at the invitation of the Committee Chairman
** Olivia Streatfeild joined the Board on 15 January 2016.
*** David Grigson was excused from the business of one Remuneration Committee meeting during the year.

Strategic Report Governance Financial Statements
Trinity Mirror plc Annual Report 2016 37
Corporate governance reportContinued
AppointmentsThe appointment of new directors is led by the Nomination Committee. Further details of the appointments process can be found in the Nomination Committee Report on page 39 and biographies of our directors can be found on pages 32 and 33.
Board induction, training and developmentA full, formal and individually tailored induction programme is provided for all new directors upon appointment. This includes an assessment of their training requirements and provision of the appropriate training. During 2016 this included supporting external onboarding and mentoring for our new non-executive director. New directors are provided with background reading about the Group to assist their understanding of the nature of the Group, its business and the markets in which it operates. Details of Board procedures and other governance-related matters are also provided as part of the induction process.
Throughout their tenure, directors receive updates on relevant issues as appropriate, taking into account their individual qualifications and experience. The Company Secretary facilitates any other professional development that directors consider necessary to assist them in carrying out their duties. The Board participates in visits to key operational sites during the year to gain a deeper insight into the Group’s operating environment.
The Board is satisfied that each director has sufficient time to devote to discharging his or her responsibilities as a director of the Company.
Independent adviceThe directors may take independent professional advice, if necessary, at the Company’s expense.
Directors’ conflictsThe Board adopted a Conflicts Policy in October 2008 which provides a formal system for directors to declare conflicts to be considered for authorisation by those directors who have no interest in the matter. In deciding whether to authorise a potential or actual conflict, the non-conflicted directors are required to act in the way they consider would be most likely to promote the success of the Company and they may impose limits or conditions when giving authorisation or subsequently if appropriate.
The Board applied the Conflicts Policy throughout 2016 and the relevant procedures for authorisation of potential or actual conflicts were followed. The Board believes that there is currently no compromise to the independence of any director arising from an external appointment or any outside commercial interest. During 2016, where a potential or actual conflict arose, the director was excused from relevant items of business and did not receive papers or minutes in relation to that business.
In addition to the availability of the Register of Conflicts at each Board meeting, an annual review has been conducted and the Board will continue to monitor and review potential conflicts of interest on a regular basis.
Directors’ indemnity and insuranceAs approved by shareholders at the 2008 Annual General Meeting, the directors have the benefit of an indemnity which is a qualifying third-party indemnity provision as defined by section 234 of the Companies Act 2006.
The Company maintains appropriate directors’ and officers’ liability insurance for its directors and officers which provides cover for any legal action brought against them.
Relations with shareholdersEffective shareholder engagement is essential to the Board and we ensure continuous dialogue throughout the year by way of investor relations programmes through which the Chief Executive and Group Finance Director meet with major shareholders. Additionally the Chairman, Senior Independent Director and Executives meet with major shareholders as and when requested. In 2016, numerous investor meetings and events were held or attended; presentations were made at international conferences as well as at results presentations, which altogether provided for comprehensive and engaging dialogue with shareholders and potential investors.
In 2016, the Company, led by the Remuneration Committee Chairman, conducted a consultation exercise to gather views from shareholders in advance of proposing an updated Remuneration Policy for approval at the 2017 Annual General Meeting. Information on the Remuneration Policy proposals is available in the Remuneration Report on pages 45 to 61.
The Company’s website, www.trinitymirror.com, is regularly updated and contains a wide range of information of interest to both institutional and private investors, including any announcements made by the Company to the London Stock Exchange as well as presentations of interim and annual results made to analysts.
Risk management and internal controlThe Board has overall responsibility for the Company’s system of risk management and internal controls. The Board regularly reviews the Company’s principal risks and its internal controls. The risk management process is supported by our internal audit function reviewing the effectiveness of internal controls.
Further information on internal controls and risk management can be found on pages 43 and 44 of the Audit & Risk Committee Report. The principal risks and uncertainties the Group faced during the year are set out in the Strategic Report on pages 14 to 16.
Going concern and viability statementThe Code and Listing Rules require listed companies to include in their annual report and accounts a going concern and a viability statement. The Audit & Risk Committee reviewed and discussed a report from management and concluded that the financial statements can be prepared on a going concern basis and that there is a reasonable expectation that the Group will be able to continue in operation and meet its liabilities as they fall due over the next three years.
Assessment of the Group’s prospectsThe directors have assessed the Group’s prospects, both as a going concern and its longer term viability.
Going concern statementThe directors consider it appropriate to adopt the going concern basis of accounting in the preparation of the Group’s annual consolidated financial statements.
In accordance with LR 9.8.6(3) of the Listing Rules, and in determining whether the Group’s annual consolidated financial statements can be prepared on a going concern basis, the directors considered all factors likely to affect its future development, performance and its financial position, including cash flows, liquidity position and borrowing facilities and the risks and uncertainties relating to its business activities.

Governance
Trinity Mirror plc Annual Report 201638
Corporate governance reportContinued
The key factors considered by the directors were as follows:
− the implications of the volatile economic environment, uncertainties created by the UK referendum on EU membership and the structural changes in the market on the Group’s revenues and profits. The Group undertakes regular forecasts and projections of trading and identifying areas of focus for management to improve performance and mitigate the impact of any deterioration in the economic outlook and structural challenges;
− the impact of the competitive environment within which the Group’s businesses operate;
− the impact on our business of key suppliers (in particular newsprint) being unable to meet their obligations to the Group;
− the impact on our business of key customers being unable to meet their obligations for services provided by the Group; and
− the committed finance facilities available to the Group. The Group has access to a £110 million committed amortising Revolving Credit Facility (‘RCF’) under which drawings can be made with 24 hours’ notice and the facility was undrawn at the reporting date. The RCF is committed to December 2021 and reduces by £10 million in December 2017 and by £8.333 million every six months until December 2020 and remains at £50 million during 2021.
Having considered all the factors impacting the Group’s businesses, including downside sensitivities, the directors are satisfied that the Group will be able to operate within the terms and conditions of the Group’s financing facilities for the foreseeable future.
The directors have reasonable expectations that the Company and the Group have adequate resources to continue in operational existence for the foreseeable future. Accordingly, they continue to adopt the going concern basis in preparing the Group’s annual consolidated financial statements.
Viability statementThe directors have a reasonable expectation that the Group will be able to continue in operation and meet its liabilities as they fall due over the period of their assessment.
The UK Corporate Governance Code requires that the directors assess the prospects of the Group over an appropriate period of time selected by them.
The directors assessed the prospects of the Group over a three year period which reflects the budget and planning cycle adopted by the Group. A three year period is adopted as it enables the directors to consider the impact of declining print revenues, the investment required to drive growth in digital and to identify the extent to which costs need to be minimised to support profits and cash flows. The assessment takes into account the Group’s current position and principal risks and uncertainties facing the Group included those that would threaten the business model, future performance, solvency or liquidity.
The director’s strategic and budget planning for the Group comprises an annual budget and projections for the subsequent two years. The three year projections are reviewed by the Board at least two times a year and they also form part of the strategy review process. The first year of the projections reflect the annual budget which is approved by the Board.
The annual budget, which provides greater detail, is used to set budget targets for the Group and is used by the Remuneration Committee to set targets for the annual incentive plan. The three
year projections are also used for setting the cash flow target for the Long Term Incentive Plan. Whilst the subsequent two year projections are less detailed, they provide a sensible planning tool against which strategic decisions are made.
A number of key assumptions are made in the three year projections. These are as follows:
− cost reduction initiatives to support profitability as print revenues remain in decline;
− investment to build audience and revenues in the growing digital market;
− capital expenditure requirements across the business and how these are impacted by the trading environment;
− dividend policy; − repayment of maturing debt facilities. The Group has the final repayment of its US private placement loan notes in June 2017 of £68.3 million;
− funding of the historical defined benefit pension obligations based on the recovery plans agreed with the Trustee’s at the last tri-annual valuation (2013 valuation agreed in December 2014) and potential increases in funding following completion of the 2016 valuation (by March 2018); and
− payments in relation to historical legal issues.This and other matters considered (including those noted above) by the Board during the year, form the basis of the Board’s reasonable expectations that the Group will be able to continue in operation and meet its liabilities as they fall due over the three year assessment period.
Sensitivity analysis is applied to the cash flow to model the potential effects should principal risks actually occur, individual or in unison. The Board also assessed the likely effectiveness of any proposed mitigating actions.
It is understood that such future assessments are subject to a level of uncertainty that increases with time and, therefore, future outcomes cannot be guaranteed or predicted with certainty. Also, this assessment was made recognising the principal risks and uncertainties that could have an impact on the future performance of the Group and also the financial risks described in the notes to the consolidated financial statements.
Annual General MeetingShareholders will have the opportunity to meet and put questions to the directors at the Company’s Annual General Meeting (the ‘AGM’), which will be held at the Museum of London Docklands, No.1 Warehouse, West India Dock Road, London E14 4AL on Thursday, 4 May 2017 at 11:30am.
A detailed explanation of each item of business to be considered at the AGM is included in the Notice of Meeting which will either be sent to the shareholders in advance of the AGM or will be available to download from the website www.trinitymirror.com/investors. Shareholders who are unable to attend the AGM are encouraged to vote in advance of the meeting, either online at www.shareview.co.uk or by using the proxy card which will be sent to all shareholders.
David GrigsonChairman
27 February 2017

Strategic Report Governance Financial Statements
Trinity Mirror plc Annual Report 2016 39
Nomination Committee report
Dear Shareholder
I am pleased to present the report of the Nomination Committee (the ‘Committee’) for 2016. The Committee keeps under regular review the structure and composition of the Board and its Committees, and ensures that the Board has the appropriate balance of skills, expertise and experience in order to support the directors and the Company and that the appropriate corporate governance standards and practices are in place.
In 2016, the Committee has taken a very active part in ensuring that the composition of the Board is appropriate for the needs of the Group for the future. The Committee envisages that its activities will increase through 2017.
The Committee is also mindful of the Company’s responsibilities as an employer under the forthcoming Gender Pay Gap Reporting, under the Equality Act 2010 (Specific Duties and Public Authorities) Regulations 2017, and expects that the Company will make appropriate disclosures at the relevant time.
Role of the CommitteeThe role of the Nomination Committee is to:
− Review the Board’s structure, size and composition, including the balance of skills;
− Make recommendations regarding any adjustments to the composition of the Board;
− Assess the time commitment required from non-executive directors and evaluate whether the non-executive directors are committing enough time to fulfil their duties;
− Propose recommendations to the Board for the continuation in service (or not) of each director;
− Ensure that Board membership comprises the best possible mix of skills, knowledge, experience and gender diversity so as to enhance the quality of its deliberations and decisions; and
− Ensure that the Board is well prepared for changes to its composition and is fully supported to ensure orderly and appropriate succession.
The Committee has formal terms of reference which are available on the Company’s website www.trinitymirror.com.
Activities during 2016The Committee met once during 2016 to consider:
− Composition of the Board; − Succession planning for Board and senior management; − Diversity and the talent pipeline; and − Timetable and formal agenda for 2017.
There is a formal and transparent procedure in place for making new appointments to the Board.
Following a search process by The Up Group, further interviews and due diligence, the Committee recommended that Olivia Streatfeild was the most suitable candidate and she joined the Board on 15 January 2016. Helen Stevenson was appointed as the Senior Independent Director on 28 December 2015.
Areas of focus for 2017 − Structure, size and composition of the Board and its Committees;
− Succession planning for the Board and senior management; − Identify future talent pipeline and their development; − Development initiatives for directors; − Group-wide exposure for non-executive directors; and − Reporting to the Board on relevant regulatory and governance responsibilities.
DiversityThe Board recognises the importance of diversity, including gender, in the boardroom and seeks to recruit directors with varied backgrounds, skills and experience. Whilst recognising the importance of diversity in Board composition, it is the Board’s policy that Board appointments are made on merit judged against objective criteria, taking account of the skills, experience and expertise of candidates rather than by the setting of specific targets. There are currently two female members of the Board representing 25%. The Board hopes to retain or improve this level in the future. Our Board composition and size is kept under review in order to retain an appropriate balance of skills, experience, diversity and knowledge of the Group on the part of our non-executive directors.
Hampton-Alexander ReviewThe Committee noted with interest the findings of the Hampton-Alexander Review, namely the extension of the voluntary business-led framework to improve the number of women working at the top of British businesses beyond the boardroom. More information on the Company’s gender representation beyond the Board is set out in the Our People report on pages 12 and 13.
David Grigson Chairman of the Nomination Committee
27 February 2017
Committee membersDavid Grigson (Chairman)
Simon Fox
Lee Ginsberg
Steve Hatch
David Kelly
Helen Stevenson
Olivia Streatfeild (joined 15 January 2016)
Biographical details of the Committee members can be found on pages 32 and 33.
David Grigson, Chairman of the Nomination Committee
“ The Board has the appropriate balance of skills, knowledge and experience to ensure appropriate corporate governance standards.”

Governance
Trinity Mirror plc Annual Report 201640
Audit & Risk Committee report
Dear Shareholder
I am pleased to present the report of the Audit & Risk Committee (the ‘Committee’) for 2016.
Olivia Streatfeild joined the Committee on 15 January 2016.
In accordance with the Committee’s terms of reference, the Chairman, Chief Executive and Group Finance Director are not members of the Committee but are invited to attend meetings of the Committee when appropriate.
All members of the Committee are non-executive directors, who are considered independent, and their biographical details are set out pages 32 and 33. The Board is satisfied that the members of the Committee have a wide range of commercial and financial experience which allows the Committee to fulfil its Terms of Reference. The Terms of Reference of the Committee are reviewed and revised as appropriate to reflect changes made to the Code.
The Code extends the Board’s responsibilities to confirm that it has undertaken a thorough assessment of the principal risks associated with the Group’s business model, future performance, solvency and liquidity; to provide a statement of the longer term prospects and viability of the Group; and to monitor the Company’s risk management and internal control systems on a continuing basis. The Committee also notes the implementation of applicable regulatory requirements, such as the Market Abuse Regulation, and works closely with the Board and its external advisers to ensure that all requirements are implemented and observed.
The Terms of Reference are published on the Company website: www.trinitymirror.com.
The Committee has identified me as the member having recent and relevant financial experience in accounting for the purposes of the Code, and the members as a whole have experience relevant to the industry as a result of their combined biographies.
In 2016, the Board held an evaluation of the Committee’s performance. The same areas were reviewed as for the Board Performance Evaluation, found on page 36. Recommendations included improving the presentation of information to the Committee. All actions will be reviewed throughout 2017 to ensure the Committee runs efficiently. It was deemed that the Committee’s composition continues to remain appropriate and the Committee is functioning effectively.
I conduct regular meetings with the Group Finance Director, the Head of Risk and Audit and the Company’s external auditor,
Deloitte LLP. Meetings of the Committee are also attended by the executive directors, the Chairman, the Head of Risk and Audit and representatives from the Company’s external auditor, Deloitte LLP.
Role and activity of the CommitteeThe Committee’s principal responsibilities are:
− Monitor the integrity of the financial statements of the Company, including its annual and half year financial results. Other formal announcements relating to financial performance or financial information contained in certain other documents is reviewed by the Board and therefore not specifically discussed by the Committee;
− Review and assess the Annual Report in order to determine whether it can advise the Board that, taken as a whole, the Annual Report is fair, balanced and understandable and provides shareholders with the information they need to assess the Company’s position, performance, business model and strategy as required by provision C.1.1 of the Code;
− Review significant financial reporting issues; − Recommend to the Board the appointment of the external auditor and approve their remuneration and terms of engagement;
− Monitor and review the external auditor’s independence, objectivity and the effectiveness of the external audit process including considering relevant UK professional and regulatory requirements;
− Review and approve the external audit plan; − Develop and implement the Company’s policy on non-audit services from the external auditor, taking into account relevant ethical guidance;
− Review the Company’s procedures for handling allegations from whistleblowers;
− Review the Company’s internal control system and risk management system;
− Monitor and review the effectiveness of the internal audit function;
− Review and approve the remit of the internal audit function and ensure the function has the necessary resources and is able to meet appropriate professional standards for internal auditors; and
− Review and approve the internal audit plan. The Board’s responsibility for the assessment of risk is delegated to the Committee.
Committee membersLee Ginsberg (Chairman)
Steve Hatch
David Kelly
Helen Stevenson
Olivia Streatfeild (joined 15 January 2016)
Lee Ginsberg, Chairman of the Audit & Risk Committee
“ The Committee works closely with the Board and its external advisers to fulfil its responsibilities to shareholders and potential investors alike.”

Strategic Report Governance Financial Statements
Trinity Mirror plc Annual Report 2016 41
Audit & Risk Committee reportContinued
The Terms of Reference authorise the Committee to obtain independent legal or other professional advice at the Company’s expense.
The Committee receives any required information from management in a timely manner and in formats which are comprehensible and sufficient to fulfil its responsibilities to shareholders and potential investors alike.
Main activities of the Committee during 2016The Committee had five scheduled meetings in 2016. Items reviewed at the Committee meetings in 2016 were:
Recurring – Reports and financial statements
– Group prospects (going concern and viability)
– Impairment reviews
– Tax and Treasury
– Contingent liabilities
– Internal audit plan
– Review of results of internal audits completed
– Corporate risk assessment including review of the key risks and risk management activities
– External audit plan
– Review of effectiveness of external auditor
– External audit fees
– Accounting regulatory changes
– Assessment of the Committee’s performance
Specific – Amendments to the Code
– Findings from the external auditor on the 2016 interim review
– Findings from the external auditor on the 2015 year end audit
– Consolidation of cash-generating units (CGUs)
– Accounting for the acquisition of Local World
– Digital revenue recognition
– Adoption of FRS 101
– Provision for historical legal issues
– Corporate governance updates
In 2017, to date, the Committee has focused on the 2016 year end.
Annual reportThe Committee has undertaken a review and assessment of the Annual Report in order to determine whether it can advise the Board that, taken as a whole, the Annual Report is fair, balanced and understandable and provides shareholders with the information they need to assess the Company’s position, performance, business model and strategy as required by provision C.1.1 of the Code.
The Committee has:
− Considered the results of an independent review performed by a senior individual outside of the finance function;
− Reviewed and discussed the findings from the external auditor as part of the 2016 year-end audit; and
− Fully discussed the Annual Report at the Committee meetings in February 2017.
Accordingly, the Committee has concluded that the Annual Report, taken as a whole, is fair, balanced and understandable and that it can advise the Board as required by the Code.
Going concern and viability statementThe Code and Listing Rules require listed companies to include in their annual report and accounts a going concern and a viability statement. The Committee reviewed and discussed reports from management and concluded that the financial statements can be prepared on a going concern basis and that there is a reasonable expectation that the Group will be able to continue in operation and meet its liabilities as they fall due over the next three years.
The directors assessed the prospects of the Group over a three year period which reflects the budget and planning cycle adopted by the Group. A three year period is adopted as it enables the directors to consider the impact of declining print revenues, the investment required to drive growth in digital and to identify the extent to which costs need to be minimised to support profits and cash flows. The assessment of the Group’s prospects, together with the Group’s going concern statement and viability statement, are set out in the Corporate Governance Report on pages 37 and 38.
Significant financial issuesThe Committee assesses whether suitable accounting policies have been adopted and whether management have made appropriate estimates and judgements. The Committee reviews accounting papers prepared by management which provide details on the main financial reporting judgements.
The Committee also reviews reports by the external auditor on the full year and half year results which highlight any issues with respect to the work undertaken on the audit.
The Committee considered the following significant issues in relation to the 2016 financial statements:
Impairment reviewEach year a detailed impairment review is undertaken to compare the carrying value of assets held on the consolidated balance sheet and the parent company balance sheet to their value in use. The value in use is calculated using a discounted cash flow model and there are a number of judgements made in setting the assumptions that underpin the model. A paper summarising the conclusions of the review is presented to the Committee. The external auditor also undertakes a review of the detailed model supporting the review.
Both the Committee and external auditor challenge the conclusions of the review and consider any external factors which may change the conclusions of the review.
The key assumptions underpinning the model are as follows:
− The discount rate, based on the weighted average cost of capital (‘WACC’). This is calculated after due consideration to market factors impacting the WACC and items that are specific to the Group such as the current capital structure and the best estimate of future movements in the capital structure;
− Three-year projections which are separately presented to and approved by the Board;
− Long-term growth rates; − The identification of cash-generating units; and − The appropriateness of the indefinite life assumption for publishing rights and titles.
The conclusions of the review and the sensitivity of the review to changes in the key assumptions are disclosed in the notes to the consolidated and parent company financial statements.
Impairment is not considered a principal risk for the Group as it relates to historical transactions with no future cash impact nor is there any impact on the financial covenants for the Group’s debt facilities.
The impairment review in respect of the 2016 year end concluded that no impairment was required to the carrying value of assets held in the consolidated balance sheet and that no impairment was required to the carrying value of investments held in the parent company balance sheet. At the interim review a £2.0 million impairment charge against the carrying value of goodwill in our Specialist Digital division was required. Disclosure of the

Governance
Trinity Mirror plc Annual Report 201642
Audit & Risk Committee reportContinued
impairment reviews are in notes 14 and 15 in the notes to the consolidated financial statements and note 4 in the notes to the parent company financial statements.
The Committee concurred with management’s view that the post-tax discount rate to be used in the year end impairment review should be 10%, a reduction from the 11% used in 2015. This change reflects the current capital structure and the best estimate of future movements in the capital structure taking into consideration the reduction in long-term interest rates.
The Committee also concurred with management’s view that the former Trinity Mirror regional cash-generating unit and the Local World cash generating unit should be consolidated into a single cash-generating unit. This change reflects a number of changes in the Regionals businesses notably: the majority of revenues are packaged and sold centrally, the structure of the management team, the reporting to the Board and the way in which resources are employed in the generation of independent cash inflows. No impairment would have arisen even if this change to cash-generating units was not made and revenue allocations continued to be made to previously defined cash-generating units.
PensionsAt each year end the Group’s actuaries, Willis Towers Watson, undertake a detailed calculation of the IAS 19 valuation of the Group’s defined benefit pension schemes and of the specific financial disclosures in the financial statements. A detailed report prepared by Willis Towers Watson setting out the judgements, assumptions and conclusions is presented to the Committee for review. Full disclosure of the Group’s pension schemes is in note 33 in the notes to the consolidated financial statements.
The assumptions are agreed by management after taking advice from Willis Towers Watson. This includes external benchmarking of the key assumptions by Willis Towers Watson.
The external auditor performs a detailed review of the report prepared by Willis Towers Watson and of the key assumptions used for the valuation, including external benchmarking.
The assumptions regarding the discount rate, inflation rates and mortality rates are given particular attention and challenged by the Committee members and external auditor. Disclosure of the valuation and the sensitivity of the valuation to changes in the key assumptions are disclosed in note 33 in the notes to the consolidated financial statements.
Pension schemes are one of the Group’s four principal risks that are set out in the risks and uncertainties section of the Strategic Report on pages 14 to 16. This sets out the risk and the management action to mitigate the risk.
Historical legal issuesThe Group is exposed to civil claims from individuals in relation to phone hacking. One of the Group’s four principal risks relates to historical legal issues. Management action to mitigate the associated risks and also the disclosure relating to the latest position are set out in the risks and uncertainties section of the Strategic Report on pages 14 to 16.
This is a standing item on the Board agenda and therefore is not specifically an agenda item for the Committee. The Committee does assess the appropriateness of any provisions in relation to these matters and other implications on the consolidated financial statements and that the Annual Report contains sufficient disclosure of such matters. During 2016, management clarified the appropriate treatment of which costs should be charged to
the provision, which the Committee concurred with. The external auditor’s year-end report details the procedures undertaken by them and their discussions with management and this is discussed in detail by the Committee.
Interactions with FRCIn December 2016, the Company received a letter from the Conduct Committee of the FRC, giving advance notice of the FRC’s planned thematic review of pension disclosures in the Annual Report. The purpose of the monitoring activity is to drive continuous improvement in the quality of corporate reporting.
Other financial mattersOther financial matters considered by the Committee in relation to the 2016 financial statements included:
Adoption of FRS 101A new UK GAAP accounting framework introduced by the FRC required the Company to elect to prepare its parent company financial statements on one of the permissible bases. The Committee reviewed a paper prepared by management and agreed to adopt FRS 101, a reduced disclosure regime, for its parent company financial statements for the 53 weeks ended 1 January 2017 and on an ongoing basis. The consolidated financial statements of the Company’s group will continue to be prepared in accordance with EU-adopted IFRS and are unaffected by this new accounting framework. This new accounting framework will also be considered in relation to the accounts of the subsidiaries during 2017.
Digital revenue The Committee received an update from management and the external auditor on the accounting in respect of digital revenue.
External auditorThe Committee has primary responsibility for making recommendations on the appointment, reappointment and removal of the external auditor. The Committee should also maintain an appropriate relationship with the Company’s auditors. There are no contractual obligations that restrict the Company’s choice of external auditor.
Following the annual external audit effectiveness review, the Committee recommended the reappointment of Deloitte LLP as external auditor. The review examined auditor independence, the audit planning process, audit approach and delivery, audit team expertise and experience, resources, responsiveness and communication. The review took the form of an extensive questionnaire which was sent to directors and senior managers across the Group. The results were analysed and a full report was submitted for review by the Committee. The report as a whole was discussed with the external auditor and, in the absence of any adverse findings, the Committee concluded that the audit process was fit for purpose.
Private meetings were held with Deloitte LLP to ensure there were no restrictions on the scope of their audit and to discuss any items that the external auditor did not wish to raise with the executive directors present.
The Committee reviews and agrees the engagement letter from Deloitte LLP and verifies their independence and objectivity. It also reviews the scope of non-audit services provided by Deloitte LLP to ensure that their objectivity was not impaired.
The Committee is satisfied that the level of fees payable in respect of audit services is appropriate for a group of its size and that an effective audit was conducted during 2016. Further details

Strategic Report Governance Financial Statements
Trinity Mirror plc Annual Report 2016 43
Audit & Risk Committee reportContinued
concerning external audit fees can be found in note 6 in the notes to the consolidated financial statements.
The Committee is satisfied that there are no relationships between the Company and the external auditor, its employees or its affiliates that may reasonably be thought to impair the external auditor’s objectivity and independence.
Audit tenderingIn 2014 the European Union (‘EU’) approved regulation that requires all EU public interest entities to mandatorily rotate their external audit every 10 years. If Member States choose to allow it, the period can be extended to a maximum of 20 years if the appointment is tendered after 10 years. This regulation will come into force for the 2017 year end and the UK will take this extension.
The Competition and Markets Authority published their final Order in 2014, effective from 1 January 2015, requiring mandatory tendering every 10 years for FTSE 350 companies.
The Company is not currently a constituent of the FTSE 350 but intends to follow best practice. In this respect, it is the Committee’s current intention to put the external audit out to competitive tender at the expiry of the current audit partner’s tenure (after the year ended 31 December 2018). The directors consider this to be an appropriate time to ensure an effective tendering process can be followed, and any change, if made, would be at a time to minimise disruption. Notwithstanding this intention, the Committee will continue to review the performance of the current external auditor, Deloitte LLP, each year and consider whether an earlier competitive tender is appropriate.
Deloitte LLP audits all of the Group’s subsidiaries and they have been the Company’s external auditor since 1999. In accordance with the Auditing Practices Board standards, the Lead Audit Partner is rotated every five years and the Company’s Lead Audit Partner was changed for the 2014 audit.
Non-audit servicesThe Board has updated its formal policy on the engagement of the external auditor to supply non-audit services to align with the new ethical standard. Generally, the external auditor will not be engaged to provide any additional services other than audit related services, including the review of the interim financial information. There may, however, be circumstances where it could be in the Company’s and shareholders’ interests if the external auditor were engaged. Such circumstances are likely to relate to either exceptional transactions or those deemed not to be of a material nature. In all cases, the engagement of the external auditor for non-audit work must be approved in advance by the Committee Chairman.
In 2016, the only non-audit fee item related to audit-related assurance services provided by Deloitte LLP.
Effectiveness of risk management and internal control systemThe Board has overall responsibility for the Company’s system of risk management and internal controls. In accordance with the Code, the Committee carries out a robust assessment of the principal risks and reviews the effectiveness of the Company’s internal control systems, covering all material controls including financial, operational and compliance controls.
The Committee’s assessment includes a review of the risk management process, a review of the principal risks and uncertainties, significant risks, and the risk map.
The Committee reviews reports from management, the internal audit department and the external auditor to provide reasonable assurance that internal control procedures are in place and are being followed. Formal procedures have been established for instituting appropriate action to correct weaknesses identified from the above reports.
The reviews did not identify any significant failings or weaknesses in the system of risk management and internal control. The Committee confirms that necessary actions have been or are being taken, where failings or weaknesses were identified that were not of a material nature. The principal risks and uncertainties are set out in the Strategic Report on pages 14 to 16. The Committee has considered that the appropriate systems are robust, in place, adequate and are operating properly.
The Committee members are also members of the Remuneration Committee. The Committee believes that the Company’s remuneration policy is adequate for a group of this size and nature and that compensation policies and practices are appropriate for maintaining a robust control environment and do not put the Company at risk.
Risk managementAn ongoing process for identifying, evaluating and managing the significant risks faced by the Company has remained in place throughout 2016 and up to the date of approval of this report. The process is subject to regular review by the Board directly and by the Committee. The process accords with the FRC’s Internal Control: Guidance to Directors for directors, as applicable for this accounting period.
The Committee reviews the risk map at each meeting which details a description of the risks, an assessment of the impact on the business, probability of occurrence, management accountability, applicable policies, sources of assurance, risk factors and associated actions. It is a valuable source of information for reference and is regularly reviewed. During 2016, principal risks were identified, assessed and reviewed by impact and probability and the Board confirmed its review of the Group’s appetite for risk and how this manifests itself in the way the Group conducts its business.
Internal controlsThe directors are responsible for the Group’s established system of internal control and for reviewing its effectiveness. The directors confirm that the actions it considers necessary have been or are being taken to remedy any failings or weaknesses identified from its review of the system of internal control. This has involved considering the matters reported to it and developing plans and programmes that it considers are reasonable in the circumstances. The Board also confirms that it has not been advised of material weaknesses in the part of the internal control system that relates to financial reporting. No system of internal control can provide absolute assurance against material misstatement or loss. Such a system is designed to provide the directors with reasonable assurance that problems are identified on a timely basis and dealt with appropriately.
Although the Board’s overall responsibility for internal control is recognised, the positive contribution made by senior management to the establishment and ongoing development of internal controls within the Group is acknowledged. In reviewing the effectiveness of our system of internal control, the Board has taken into consideration a number of key elements, which include financial

Governance
Trinity Mirror plc Annual Report 201644
Audit & Risk Committee reportContinued
controls, investment controls, management reporting and the various review, steering, policy and Board Committees.
The key procedures that have been established and designed to provide effective internal financial control are:
Financial reportingPart of the comprehensive management reporting discipline involves the preparation of detailed annual budgets by all operating units. These budgets are carefully examined by the executive directors and are then summarised and submitted to the Board for approval. Weekly revenue and profit forecasts are received from all operating units followed by monthly management accounts, which are prepared promptly and reported against the approved budget. Consolidated monthly management accounts, including detailed profit analysis with comparisons to budget, latest forecasts and prior year are prepared providing relevant, reliable and up to date financial and other information to the Board. Profit and cash flow forecasts for the current year together with a treasury report (including comparison to our financial covenants) were prepared and submitted to the Board twice during the year.
Investment appraisalThe Company has a clearly defined framework for capital expenditure which is controlled centrally. Appropriate authorisation levels and limits beyond which such expenditure requires the prior approval of the executive directors, or in certain circumstances, the Board, are clearly established. There is a prescribed format for capital expenditure applications which places a high emphasis on the overall Group strategy or support for the expenditure and requires a comprehensive and justified financial appraisal of the business case being put forward. All significant corporate acquisitions or investments are controlled by the Board or a Board sub-committee, and are subject to detailed investment appraisal and performance of due diligence procedures prior to approval by the Board.
The most significant capital expenditure approved by the Board during 2016 was for the finance system transformation project. The Finance Transformation Team identified new finance systems which would enable a significant improvement in functionality, processing efficiency and integrated reporting. The approval was subject to a detailed tender process and since approval is being managed by its own steering group.
Synergy monitoring A steering committee was established to monitor, report, evaluate and manage the delivering of the synergy savings identified at the time of the acquisition of Local World. Monthly meetings of the steering committee were held during the year. Synergy savings of £10 million have been delivered in 2016, with annualised synergy savings expected to total £15 million in 2017, £3 million ahead of the original £12 million target.
Functional reportingA number of our key functions, including treasury, taxation, internal audit, risk management, litigation, IT strategy and development, environmental issues and insurance are dealt with centrally. Each of these functions reports to the Board on a regular basis, through the Chief Executive or Group Finance Director as appropriate. The treasury function operates within the terms of clearly defined policy statements. The policy statements exist to ensure that we are not exposed to any unnecessary risk and that where appropriate there is hedging against foreign currency and interest rate risks.
Risk management and internal controls complianceThe following illustrate how the risk management process and the system of internal control operated during 2016:
Group Internal AuditThe internal audit function focuses on enhancing the Group’s internal controls. It has an annual plan based on a rolling programme and specific risk based audits which is approved by the Committee annually.
The Head of Risk and Audit is a Chartered Accountant with many years of internal audit experience at the Company. He oversees an internal audit programme using the services of external service providers as necessary. The internal audit plan being risk based, has a focus on those areas which are deemed critical to the achievement of business objectives.
Audit & Risk CommitteeThe role of the Committee includes the review, update and approval of the annual internal audit plan, direction to the internal audit function, to external auditors and to management in the review of internal controls.
Risk Management GroupThe Risk Management Group is formed of the executive directors together with invited senior executives across the key Group functions. The Chief Executive co-ordinates the risk management activities of the Risk Management Group working closely with the Head of Risk and Audit.
In 2016, following the acquisition of Local World and an internal management restructure, the Risk Management Group reviewed its areas of oversight to ensure its composition was appropriate.
The agreed objectives for the risk management framework have been achieved during 2016 and all significant risks have been reviewed. A risk map has been developed and regularly updated to show the actions taken to minimise risks throughout the Group, the policies in force and the other sources of assurance upon which reliance is placed to mitigate risk.
Monitoring of key risksTo enable consistent and focused monitoring, reporting, evaluation and management of significant Group risks, the executive director owner of each key risk and the relevant senior managers have reviewed the plans, actions and initiatives which have taken place or are underway and documented them in the risk map.
Year end compliance reportingA formal process exists for year end risk management compliance reporting, requiring senior operating company, divisional and Group executive management to confirm their responsibilities for risk management and internal control. Ultimate compliance reporting is required of each and every Board member.
Steps have been taken to embed internal control and risk management further into the operations of the business and to deal with areas for improvement which come to the attention of management and the Board.
The Group’s systems of internal control are designed to manage rather than eliminate the risk of failure to achieve business objectives and can only provide reasonable and not absolute assurance against material misstatement or loss.
Lee GinsbergChairman of the Audit & Risk Committee
27 February 2017

Strategic Report Governance Financial Statements
Trinity Mirror plc Annual Report 2016 45
Remuneration report
Dear Shareholder
On behalf of the Board, I am pleased to present to you the Remuneration Report for 2016.
This Report is split into three parts: this Annual Statement, the Policy Report and the Annual Report on Remuneration. This year we will be asking our shareholders to approve a new remuneration policy for Executive Directors at the Annual General Meeting (‘AGM’). The background to, and the reasons for, the proposed changes are set out below.
Review of Remuneration PolicyOur current remuneration policy was approved by shareholders at the 2014 AGM, receiving over 94% support. As foreshadowed in last year’s report, the current policy will expire at the 2017 AGM and during the year the Committee conducted a comprehensive review of our remuneration arrangements, to ensure they continue to reinforce the Company’s business strategy, enable us to attract, motivate and retain high-calibre executives who can produce strong returns for shareholders, provide alignment with shareholder interests and aid simplicity. The Committee has also been mindful of developments in investor thinking on remuneration best practice since the current policy was approved and, to the extent that they have not already been adopted, is now seeking to include these changes as appropriate.
In summary, the Committee considers that the current remuneration structure has served Trinity Mirror well over the last three years and continues to be broadly appropriate. The success of the Company is reinforced through an annual bonus plan, which focuses on Group operating profit and key strategic objectives such as digital revenue growth, and a long-term incentive plan which rewards total shareholder returns and cash flow. In finalising its proposals, the Committee consulted with, and has taken on board feedback from, institutional shareholders holding c.60% of the Company’s issued share capital, and from two investor representative bodies, the Investment Association and ISS.
As you will note opposite, the changes that we are proposing relate primarily to variable pay elements, with no changes to the policy on base salary, pensions and benefits. The Committee believes that the new policy will build on the strengths of the previous policy, providing a strong link between pay and performance and helping align the interests of executives and shareholders.
Summary of proposed changesAnnual bonus
− Increase the maximum annual bonus opportunity in the policy from 75% to 100% of salary (which is the strong norm for FTSE companies of similar market cap). However, annual bonus opportunities for the 2017 financial year will remain at 75% of salary;
− Defer all bonuses over 50% of salary into Trinity Mirror shares for three years; and
− Introduce clawback provisions on bonuses paid.The Committee has sought to balance the current external sentiment regarding executive pay levels with the need to ensure that the Policy provides for competitive total cash remuneration. We were pleased that shareholders consulted recognised the Company’s good track record for setting performance related elements which are transparent, stretching and rigorously applied. This is evidenced by actual bonuses averaging c.28% of maximum vs. an average of c.70% of maximum across the FTSE over the last five years.
Long-Term Incentive Plan (LTIP) − Set policy limit for LTIP grants in normal circumstances at 150% of salary (currently 144%);
− Allow up to 20% LTIP vesting for Threshold performance; − Provide additional flexibility and take account of typical FTSE practice with respect to the selection and weighting of LTIP measures for future cycles etc.; and
− Increase the shareholding guideline for the Finance Director from 133% to 200% of salary.
The Committee intends that 2017 LTIP awards will remain at 144% of salary for the Chief Executive and 120% of salary for the Finance Director. Vesting of 2017 LTIP awards will continue to be based on the Company’s performance over three years, with an additional two-year post-vesting holding period during which clawback provisions apply.
TSR will continue to be the primary long-term incentive measure over the life of the next policy. The proposal to allow up to 20% vesting for Threshold performance will bring our arrangements closer to typical FTSE market practice. The Committee will review the LTIP Threshold vesting level in advance of future LTIP grants, to ensure this is appropriate in the round taking into account factors including, but not limited to, the toughness of Threshold performance over the relevant three-year period.
Helen Stevenson, Chairman of the Remuneration Committee
“ We believe that the new policy will build on the strengths of the previous policy, providing a strong link between pay and performance and helping align the interests of executives and shareholders.”

Governance
Trinity Mirror plc Annual Report 201646
Remuneration reportContinued
Incentive outcomes for 2016 and policy implementation for 2017In light of 2016 performance, executive directors will each receive bonuses of 25.95% of their respective base salaries (out of a maximum of 75% of salary). This outcome reflects the solid operating profit performance with there being no payment for publishing digital revenue growth as the stretching targets were not met. A summary of actual performance against the targets set is included on page 54.
For 2017, the majority (70% weighting) of executive director annual bonuses will continue to be based on Group operating profit, with the remaining 30% split equally between publishing digital revenue growth (15%) and the achievement of strategic objectives (15%) designed to help reinforce the Company’s business strategy.
The Annual Report on Remuneration gives details of LTIP awards granted in 2014 which are due to vest in March 2017, with awards based entirely on Trinity Mirror’s absolute Total Shareholder Return (‘TSR’). The Company’s average share price over the final quarter of the performance period in 2016 was below the Threshold requirement, and accordingly the awards will lapse in full.
In line with a change first implemented for 2015 awards, the Committee intends that 2017 awards will continue to be based 60% on absolute TSR and 40% on Net Cash Flow. The Committee continues to believe that strong underlying cash generation is important as it gives us the capacity to invest for sustainable revenue and profit growth, as well as to fund over time our pension obligations, pay dividends and drive value for our shareholders.
The Committee will increase the salaries of the Chief Executive and Group Finance Director by £1,000 from 1 March 2017, which is in line with the Company’s approach to pay for the 2017 financial year and the executives’ commitment to alignment with other management and staff. For reference, the average salary increase in the 2017 annual pay reviews is 1%, with a minimum of £250 and a maximum of £1,000 increase. The Committee believes that strong alignment with the Company’s stakeholders, including that of its staff, remains of vital importance in the execution of the Company’s strategy.
We continue to value any feedback from shareholders and hope to receive your support at the Company’s forthcoming AGM.
Helen StevensonChairman of the Remuneration Committee
27 February 2017

Strategic Report Governance Financial Statements
Trinity Mirror plc Annual Report 2016 47
Remuneration reportContinued
Policy ReportThis Remuneration Report has been prepared in accordance with the provisions of the Companies Act 2006 and Schedule 8 of the Large and Medium-sized Companies and Groups (Accounts and Reports) (Amendment) Regulations 2013. The report meets the requirements of the FCA Listing Rules and the Disclosure Guidance and Transparency Rules. In this report we describe how the principles of good governance relating to directors’ remuneration, as set out in the Code, are applied in practice. The Committee confirms that throughout 2016 the Company has complied with these governance rules and best practice provisions.
Directors’ Remuneration PolicyThis section of the report sets out the Remuneration Policy for executive directors and non-executive directors, which shareholders will be asked to approve at the Annual General Meeting on 4 May 2017. The Committee intends that the policy will come into effect from the date of the Annual General Meeting and is intended to apply for a period of three years.
The Company’s policy is to provide remuneration packages, which comprise competitive fixed pay and variable pay, which provide the potential for significant rewards related to performance aligned with the Group’s long-term goals and shareholder interests. The aim is to provide remuneration packages that attract, motivate and retain senior executives by rewarding competitively in relation to other relevant companies, whilst emphasising long-term performance-related remuneration.
The main components of each executive director’s remuneration package are base salary, pension and benefits, an annual bonus scheme linked to Group financial performance and share-based incentives linked to the delivery of shareholder value.
Each element of remuneration has a specific role in achieving the aims of the Remuneration Policy and aligning the interests of executive directors with the interests of shareholders. The combined potential remuneration from annual bonus and long-term share-based incentives ensures that the balance of the executive remuneration package is weighted towards ‘at risk’ performance pay with a higher weighting on long-term share-based remuneration.
The Remuneration Policy as set out below is subject to shareholder approval at the Annual General Meeting on 4 May 2017, and will take effect from that date. The prior Policy Report, as approved by shareholders, can be found in the 2013 Annual Report available on our website.
The Remuneration Policy is summarised in the table below:
Revised Executive Director Remuneration Policy TableAs described earlier in this report, the Committee undertook a review of Trinity Mirror’s remuneration policy in 2016 and is proposing some modest changes to the Policy including:
− In respect of the annual bonus: an increase in the maximum annual bonus opportunity under the policy from 75% to 100% of salary (2017 bonuses remain up to 75% of salary); any bonus earned above 50% of salary will be deferred in shares for three years; introduce clawback provisions on cash bonuses.
− In respect of the LTIP: set the Policy for LTIP grants in normal circumstances at 150% of salary (currently 144%); allow up to 20% vesting for Threshold performance; provide greater flexibility with respect to the selection and weighting of LTIP measures for future cycles.
− Increase the shareholding guideline for the Finance Director from 133% to 200% of salary.
Base Salary
Function To attract and retain talent by ensuring base salaries are competitive in the relevant talent market.
Operation Base salaries are reviewed annually, taking into account individual performance, market competitiveness1, the experience of each executive director, and salary increases across the Group.
Opportunity Any base salary increases are applied in line with the outcome of the review.
Percentage salary increases for executive directors will not normally exceed those of the wider workforce on an annualised basis over the period over which this policy will apply. Increases may be above this level if there is an increase in the scale, scope, market comparability or responsibilities of the role. Where increases are awarded in excess of the wider employee population, the Committee will provide an explanation in the relevant year’s Annual Report on Remuneration.
Performance metrics Individual and business performance are considerations in setting base salary.
1 Companies used to assess market pay competitiveness have historically included media comparators and UK-listed companies of similar revenue and market capitalisation. The Committee reviews comparator companies periodically to ensure they remain appropriate and retains the discretion to adjust the reference groups or companies as appropriate.
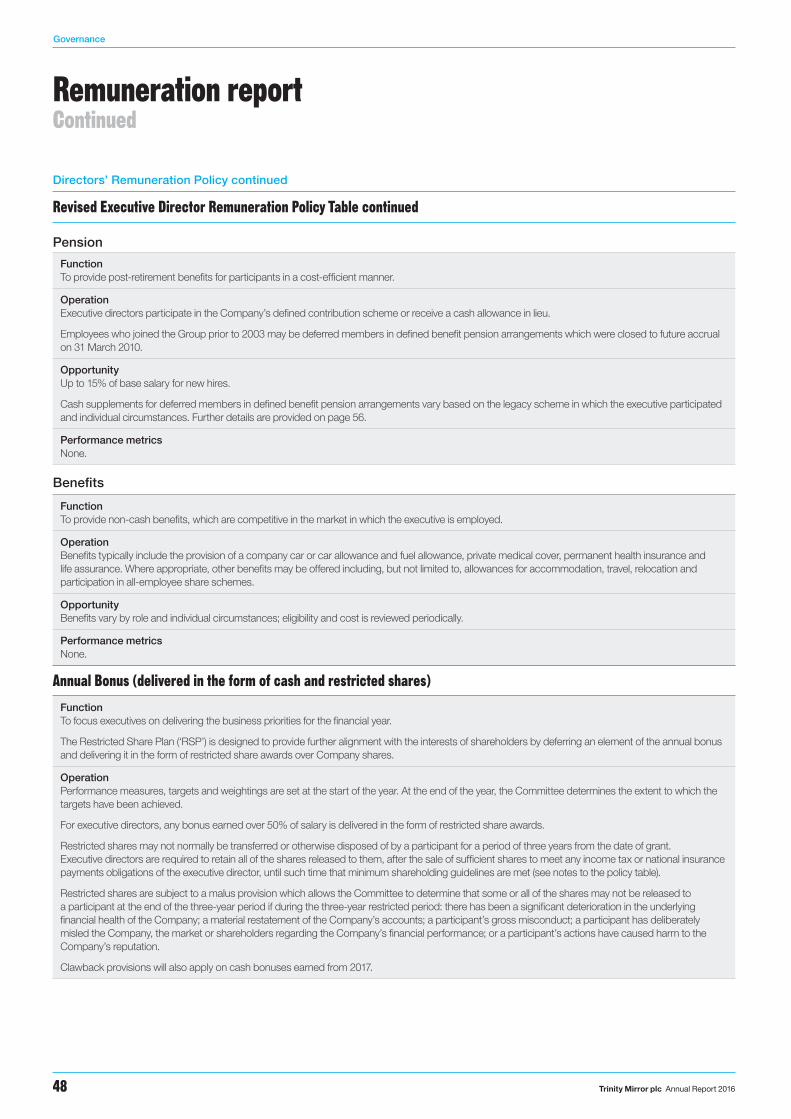
Governance
Trinity Mirror plc Annual Report 201648
Remuneration reportContinued
Directors’ Remuneration Policy continued
Revised Executive Director Remuneration Policy Table continued
Pension
Function To provide post-retirement benefits for participants in a cost-efficient manner.
Operation Executive directors participate in the Company’s defined contribution scheme or receive a cash allowance in lieu.
Employees who joined the Group prior to 2003 may be deferred members in defined benefit pension arrangements which were closed to future accrual on 31 March 2010.
Opportunity Up to 15% of base salary for new hires.
Cash supplements for deferred members in defined benefit pension arrangements vary based on the legacy scheme in which the executive participated and individual circumstances. Further details are provided on page 56.
Performance metrics None.
Benefits
Function To provide non-cash benefits, which are competitive in the market in which the executive is employed.
Operation Benefits typically include the provision of a company car or car allowance and fuel allowance, private medical cover, permanent health insurance and life assurance. Where appropriate, other benefits may be offered including, but not limited to, allowances for accommodation, travel, relocation and participation in all-employee share schemes.
Opportunity Benefits vary by role and individual circumstances; eligibility and cost is reviewed periodically.
Performance metrics None.
Annual Bonus (delivered in the form of cash and restricted shares)
Function To focus executives on delivering the business priorities for the financial year.
The Restricted Share Plan (‘RSP’) is designed to provide further alignment with the interests of shareholders by deferring an element of the annual bonus and delivering it in the form of restricted share awards over Company shares.
Operation Performance measures, targets and weightings are set at the start of the year. At the end of the year, the Committee determines the extent to which the targets have been achieved.
For executive directors, any bonus earned over 50% of salary is delivered in the form of restricted share awards.
Restricted shares may not normally be transferred or otherwise disposed of by a participant for a period of three years from the date of grant. Executive directors are required to retain all of the shares released to them, after the sale of sufficient shares to meet any income tax or national insurance payments obligations of the executive director, until such time that minimum shareholding guidelines are met (see notes to the policy table).
Restricted shares are subject to a malus provision which allows the Committee to determine that some or all of the shares may not be released to a participant at the end of the three-year period if during the three-year restricted period: there has been a significant deterioration in the underlying financial health of the Company; a material restatement of the Company’s accounts; a participant’s gross misconduct; a participant has deliberately misled the Company, the market or shareholders regarding the Company’s financial performance; or a participant’s actions have caused harm to the Company’s reputation.
Clawback provisions will also apply on cash bonuses earned from 2017.

Strategic Report Governance Financial Statements
Trinity Mirror plc Annual Report 2016 49
Remuneration reportContinued
Opportunity For directors, the maximum annual bonus opportunity from 2018 will be 100% of base salary (and any bonus earned above 50% of salary will be deferred in restricted shares). 2017 annual bonus opportunities remain at 75% of salary.
For on-target performance, the bonus opportunity is typically up to 50% of maximum.
For threshold performance, the bonus opportunity is typically up to 20% of maximum.
Additional shares representing reinvested dividends may be released following the vesting of any restricted share award.
Performance metrics Performance is assessed annually based on challenging targets for financial/business performance.
The measures selected may vary each year depending on business context and strategy, and will be weighted appropriately according to business priorities.
Financial measures will represent the majority of the total bonus opportunity and will include, but not be limited to, Group operating profit. The bonus structure since 2014 has incorporated an element on growth in publishing digital revenue. For the 2017 financial year, the bonus will also include an element relating to achievement of strategic objectives. Further details are provided on page 58.
The Committee has discretion in exceptional circumstances to adjust the formulaic bonus outcomes within the limits of the plan to ensure alignment of pay with the underlying performance of the business and to ensure fairness to both shareholders and participants. When assessing whether to exercise its discretion, the Committee will take into account factors including but not limited to strategy execution, revenues, free cash flow and change in net debt over the period.
The Committee also has discretion, in exceptional circumstances, to withhold bonus from an individual if his or her conduct was such that it was detrimental to the customers or reputation of the Group.
Long Term Incentive Plan
Function To align the interests of executives with shareholders in growing the value of the business over the long term.
Operation Awards of Performance Shares may be granted annually with vesting subject to performance over at least three years.
For awards granted in 2014 onwards, the Committee retained a three-year performance period and introduced a two-year holding period on vested LTIP shares, with clawback/malus provisions to provide additional alignment with shareholders.
Executive directors are required to retain 100% of shares vesting, after the sale of sufficient shares to meet any income tax or national insurance obligations of the executive director, until such time that minimum shareholding guidelines are met (see notes to the policy table).
Performance conditions are reviewed before each award cycle to ensure they are appropriate and targets are set to be appropriately stretching over the performance period.
Opportunity The LTIP provides for awards of up to 200% of base salary; however, the Committee intends that this limit will be used only in exceptional circumstances.
LTIP awards in normal circumstances are up to 150% of salary.
2017 LTIP awards are anticipated to be 144% of salary for the Chief Executive and 120% of salary for the Group Finance Director (as per 2016 awards).Further details are provided on page 58.
Additional shares representing reinvested dividends may be released following the end of the holding period.
Performance metrics Vesting of LTIP awards is subject to continued employment and the Company’s performance over a three-year performance period. If no entitlement has been earned at the end of the relevant performance period, awards will lapse.
Since 2012, awards have vested on the achievement of stretching absolute TSR targets underpinned by Committee discretion taking into account relative TSR and key financial metrics. 2015 LTIP awards onwards have incorporated a second internal financial performance measure and this will be continued for the 2017 LTIP awards. Further details are provided in the Annual Report on Remuneration. TSR is anticipated to be the primary performance measure for the term of this Policy.
Threshold performance typically results in up to 20% of LTIP awards vesting, with Stretch performance warranting full vesting. There is no provision for retesting.
As mentioned above, for LTIP awards to vest, the Committee must be satisfied that the Company’s absolute TSR performance is a genuine reflection of the underlying business performance of the Company over the performance period. When assessing this, the Committee will take into account factors including but not limited to relative TSR, revenues, free cash flow and change in net debt over the period.

Governance
Trinity Mirror plc Annual Report 201650
Remuneration reportContinued
Notes to the policy tablePayments from existing awardsExecutive directors are eligible to receive payments from awards made prior to the approval and implementation of the remuneration policy detailed in this report. Such payments may not be within the scope of this policy. Details of these awards, if applicable, are disclosed in the Annual Report on Remuneration.
Performance measure selection and approach to target settingThe measures used under the annual bonus plan are selected annually to reflect the Company’s key strategic priorities for the year and to reinforce financial performance. When setting targets for the annual bonus, the Committee is conscious that the Group operates in a challenging sector which is in transition as a result of disruptive technology. Targets are set to reflect the need to support profits and cash flows in the short term while making progress towards achievement of the Group’s strategic objectives.
The Committee considers that absolute TSR and net cash flow (used in the LTIP) help align executives with shareholder interests, and provide objective and transparent measures of the Company’s performance and shareholder value.
Targets applying to the annual bonus and LTIP are reviewed annually, based on a number of internal and external reference points. Performance targets are set to be stretching but achievable, with regard to the particular strategic priorities and economic environment in a given year.
Shareholding guidelinesThe Committee continues to recognise the importance of executive directors aligning their interests with shareholders through building up a significant shareholding in the Company. During the year the Committee reviewed the policy on shareholding guidelines for the executive directors and decided to increase the guideline for the Group Finance Director and align it with that of the Chief Executive. The minimum shareholding guideline is now 200% of base salary for both the executive directors (increased from 133% of base salary for the Group Finance Director). Executive directors are encouraged to achieve the guidelines within five years of appointment. Until the relevant shareholding levels are acquired, executive directors are required to retain 100% of shares vesting, after the sale of sufficient shares to meet any income tax or national insurance obligations of the executive director, under the LTIP and RSP.
Similarly, the Board expects that non-executive directors will acquire shares in the Company equal in value to one times their annual fee during a period of three years from the date of their appointment.
Details of the executive directors’ current personal shareholdings are provided in the Annual Report on Remuneration on page 59.
Differences in remuneration policy operated for other employees Trinity Mirror’s approach to annual salary reviews is consistent across the Group. All employees are eligible to participate in an annual bonus scheme with similar metrics to those used for the executive directors. Opportunities vary by organisational level with business area-specific metrics incorporated where relevant.
Participation in the LTIP is limited to those individuals who can influence long-term Group performance. Performance conditions are consistent for all participants.
Scenario analysisThe charts below provide an estimate of the potential future reward opportunities for the executive directors, and the potential split between the different elements of remuneration under three different performance scenarios: ‘Minimum’, ‘On-target’ and ‘Maximum’. Potential reward opportunities are based on Trinity Mirror’s Remuneration Policy, applied to latest known base salaries and incentive opportunities. Note that the LTIP awards granted in a year do not normally vest until the third anniversary of the date of grant, and the projected value excludes the impact of share price movement.
The ‘Minimum’ scenario reflects base salary, pension and benefits (i.e. fixed remuneration), being the only elements of the executive directors’ remuneration package not linked to performance.
The ‘On-target’ scenario reflects ‘Minimum’ fixed remuneration as above, plus target bonus and RSP payout (based on 50% of maximum opportunity) and LTIP threshold vesting (20% vesting).
The ‘Maximum’ scenario reflects ‘Minimum’ fixed remuneration, plus maximum payout under all incentives. This could be lower than single figure total remuneration which includes the value of LTIP awards which vested on performance based on the share price at vesting (rather than grant).
Salary, pension and benefits Cash bonus and RSP LTIP
In the event of any change in incentive opportunities in future years, an updated scenario analysis will be provided.
Simon Fox
Minimum
On target
Maximum
£619k100%
£962k16%20%64%
£1,754k43%22%35%
£0.0m £0.5m £1.0m £1.5m £2.0m
Vijay Vaghela
Minimum
On target
Maximum
£565k100%
£839k13%20%67%
£1,435k 37%37%23%40%
£0.0m £0.5m £1.0m £1.5m £2.0m

Strategic Report Governance Financial Statements
Trinity Mirror plc Annual Report 2016 51
Remuneration reportContinued
Recruitment policyExternal appointment In cases of hiring or appointing a new executive director from outside the Company, the Committee may make use of all existing components of remuneration, as follows:
Component Approach Maximum annual grant valueBase salary The base salaries of new appointees will be
determined based on the experience and skills of the individual, internal relativities, relevant market data and their current basic salary. Initial salaries may be set below market and consideration given to phasing any increases over two or three years subject to development in the role.
Not applicable
Pension New appointees will be entitled to become members of the Company’s defined contribution pension scheme or receive a cash alternative.
Not applicable
Benefits New appointees will be eligible to receive benefits in line with the policy.
Not applicable
Annual bonus (cash and restricted shares) The structure described in the policy table will apply to new appointees with the relevant maximum being pro-rated to reflect the portion of the year served.
Up to 100% of base salary
Long Term Incentive Plan New appointees will be granted awards under the LTIP on similar terms as other executives, as described in the policy table.
Up to 200% of base salary
In determining appropriate remuneration structure and levels, the Committee will take into consideration all relevant factors to ensure that arrangements are in the best interests of both the Company and its shareholders. The Committee may make an award in respect of a new appointment to ‘buy out’ incentive arrangements forfeited on leaving a previous employer, i.e. over and above the approach outlined in the table above, and may exercise the discretion available under Listing Rule 9.4.2 R if necessary to do so. In doing so, the Committee will consider relevant factors including any performance conditions attached to these awards, the likelihood of those conditions being met and the proportion of the vesting period remaining. The fair value of any buyout award should generally have a fair value no higher than that of the awards forfeited.
Internal promotionIn cases of appointing a new executive director by way of internal promotion, the policy will be consistent with that for external appointees, as detailed above. Where an individual has contractual commitments made prior to their promotion to executive director level, the Company will continue to honour these arrangements.
Service contracts and exit payment policyService contracts of Executive Directors who served during 2016
Executive Date of contract
Simon Fox 30 August 2012
Vijay Vaghela 18 April 2003
Exit payment policyExecutive director service contracts, including arrangements for early termination, are carefully considered by the Committee and are designed to recruit, retain and motivate directors of the quality required to manage the Company. Each of the executive directors has a service contract with the Company which can be terminated by either party giving one year’s written notice. The Company may reimburse reasonable legal costs incurred in connection with a termination of employment, if the Committee considers it appropriate.
The termination provisions in Mr Fox’s contract provides that should the Company seek to terminate his employment it may do so making a payment in lieu of 12 months’ base salary. Any payment in lieu will not include elements relating to any bonus or benefits. His contract provides that the Company may terminate in breach of the agreement and may require him to mitigate any loss.
Any new executive directors will be engaged on these, or similar, contractual terms.

Governance
Trinity Mirror plc Annual Report 201652
Remuneration reportContinued
Under Mr Vaghela’s contract, entered into prior to 2012, if he should leave service at the request of the Company (other than for gross misconduct) he will be entitled to receive predetermined compensation equal to 12 months’ base salary and pension loss. In the event that he has worked for the full financial year there may be an additional entitlement to a bonus payment based on the achievement of performance targets.
Executive director service contracts are available for inspection at the registered office and at the Annual General Meeting.
In the event that a participant ceases to be an employee of Trinity Mirror, treatment of outstanding awards under the Group’s share plans will be determined based on the relevant plan rules:
− Under the LTIP, unvested LTIP shares normally lapse unless the participant is a good leaver, in which case unvested shares would normally be pro-rated for time and tested for performance over the full performance period, with Committee discretion to treat otherwise. Vested LTIP awards which are subject to an additional holding period will typically be retained and released at the end of the holding period except in cases of summary dismissal. On a change of control, unvested LTIP Shares would normally vest immediately and be pro-rated for time and performance, subject to Committee discretion.
− Under the RSP, outstanding awards held by leavers will normally continue and vest at the usual time, except in cases of summary dismissal or the resignation of a director to join a competitor, in which case unvested awards will lapse. On a change of control, outstanding awards under the RSP would normally vest.
External appointmentsThe Company acknowledges that its executive directors are likely to be invited to become non-executive directors of other companies. The Committee believes that these non-executive duties can broaden the directors’ knowledge and experience to the benefit of the Company. Executive directors are therefore, with the Board’s permission, allowed to accept one such appointment as long as there is no conflict of interest and to retain any fees. Details of external appointments are set out on pages 32 and 33 of the Annual Report. The executive directors did not receive remuneration for these appointments, during the period under review.
Consideration of conditions elsewhere in the companyThe Committee does not currently consult with employees specifically on the effectiveness and appropriateness of the executive remuneration policy and framework. However, the Company seeks to promote and maintain good relationships with employee representative bodies, including trade unions and staff forums, as part of its employee engagement strategy and consults on matters affecting employees and business performance as required in each case by law and regulation in the jurisdictions in which the Company operates. The Committee is mindful of the salary increases applying across the Group when considering salary increases for the executive directors.
Consideration of shareholder viewsThe Committee considers shareholder views received during the year and at the Annual General Meeting each year, as well as guidance from shareholder representative bodies more broadly, in shaping remuneration policy. The Committee continues to keep its remuneration arrangements under regular review, to ensure it continues to reinforce the Company’s long-term strategy and align closely with shareholders’ interests. We will consult shareholders before making any significant changes to our remuneration policy.
In 2016 the Chairman of the Committee met a number of major shareholders, together with two investor representative bodies, the Investment Association and ISS. Following these meetings, the Committee has decided to introduce a number of refinements to the Remuneration Policy, which are described in the Policy Report on pages 47 to 52.
Non-executive director remuneration Non-executive directors do not have service agreements, but are engaged on the basis of a letter of appointment. In line with the UK Corporate Governance Code guidelines, all directors are subject to re-election annually at the AGM. It is the policy of the Board that non-executive directors are not eligible to participate in any of the Company’s bonus, long-term incentive or pension schemes.
Details of the policy on fees paid to our non-executive directors are set out in the table below:
Function To attract and retain non-executive directors of the highest calibre with broad commercial and other experience relevant to the Company and sector.
Operation Fee levels are reviewed annually, with any adjustments generally effective 1 January in the year following review. The fees paid to the Chairman are determined by the Committee and the fees paid to the non-executive directors are determined by the Board. Additional fees are payable for additional Board responsibilities such as acting as Senior Independent Director and as Chairman of the Audit & Risk and Remuneration Committees. When reviewing fee levels, time commitment, responsibilities and the market positioning of fees against sector comparators and FTSE-listed companies of similar size and complexity, are taken into account. Non-executive directors do not participate in any incentive schemes, nor do they receive any pension contributions or benefits (other than nominal expenses).
Opportunity Non-executive director fee increases are applied in line with the outcome of the annual fee review. There is no prescribed maximum. Fees for the year commencing 1 January 2017 are set out in the Annual Report on Remuneration. The maximum aggregate annual fee for all non-executive directors provided in the Company’s Articles of Association is £700,000.
Performance metrics None.

Strategic Report Governance Financial Statements
Trinity Mirror plc Annual Report 2016 53
Remuneration reportContinued
Non-executive directors In recruiting a new non-executive director, the Committee will use the policy as set out in the table on page 52.
Annual Report on RemunerationThe following section provides details of how our Remuneration Policy was implemented during 2016.
Remuneration Committee membershipAs at the date of this report, the Committee comprised six non-executive directors.
− Helen Stevenson (Chairman) − Lee Ginsberg − David Grigson − Steve Hatch − David Kelly − Olivia Streatfeild
Olivia Streatfeild joined the Committee on 15 January 2016 upon her appointment to the Board.
The Committee is a committee of the Board of directors and has been established with formal terms of reference approved by the Board. The Committee’s purpose is to assist the Board in fulfilling its oversight responsibility by ensuring that remuneration policy and practices reward fairly and responsibly; are linked to corporate and individual performance; and take account of the generally accepted principles of good governance. A copy of the terms of reference is available on the Company’s website: www.trinitymirror.com.
The Committee has authority to determine the appropriate remuneration, benefits and employment conditions for the executive directors. The Committee also monitors the level and structure of remuneration for senior management. The Committee sets the remuneration of the Chairman (the Chairman does not participate in any discussion of his remuneration), and leads the Board’s discussion of remuneration issues for all staff more generally.
The Committee fulfils its duties with a combination of both formal meetings and informal consultation with relevant parties internally, including the Chief Executive and Group Finance Director. During the year under review, the Committee, where appropriate, sought advice and assistance from the Chief Executive, Group Finance Director and the HR Director in connection with carrying out its duties.
The Chairman of the Board, together with the Chief Executive, is responsible for evaluating and making recommendations to the Board on the remuneration of the non-executive directors. Members of the Committee and any person attending its meetings do not participate in any discussion or decision on their own remuneration.
The Committee met eight times during the year and details of members’ attendance at meetings are provided in the Corporate Governance Report on page 36.
AdvisersKepler Associates, a brand of Mercer (‘Kepler’), was originally appointed by the Committee in 2010 following a competitive tender process, and was retained during 2016. The Committee evaluates the support provided by its advisers annually and is comfortable that Kepler provides independent remuneration advice to the Committee and does not have any connections with the Company that may impair its independence. The Committee retains the responsibility for appointing any consultants in respect of executive director remuneration. Kepler is a founding member and signatory of the Code of Conduct for Remuneration Consultants, details of which can be found at www.remunerationconsultantsgroup.com. Kepler does not advise the Company on any other matters. Their total fees for the provision of remuneration services to the Committee in 2016 were £72,730 on the basis of time and materials.
Summary of shareholder voting at the 2016 Annual General MeetingThe following table shows the results of the advisory vote on the 2015 Remuneration Report at the 2016 Annual General Meeting:
Resolution text Votes for % for Votes against % against Total votes cast Votes withheld
Approval of Annual Report on Remuneration 225,493,260 98.54 3,347,775 1.46 228,841,035 7,431,732
Trinity Mirror’s Remuneration Policy was last subject to a binding vote at the 2014 Annual General Meeting.
The following table shows the results of the binding vote:
Resolution text Votes for % for Votes against % against Total votes cast Votes withheld
Approve the directors’ Remuneration Policy 193,525,804 93.88 12,621,484 6.12 206,147,288 1,504,693

Governance
Trinity Mirror plc Annual Report 201654
Remuneration reportContinued
Single total figure of remuneration for Executive Directors (audited)The table below sets out a single figure for the total remuneration received by each executive director for 2016 and 2015:
Salary1
£’000Pension benefit2
£’000Taxable benefits3
£’000Single-year variable4
£’000Multiple-year variable5
£’000Total£’000
Executive 2016 2015 2016 2015 2016 2015 2016 2015 2016 2015 2016 2015
Simon Fox 516 499 77 76 22 22 134 132 – 1,531 749 2,2606
Vijay Vaghela 435 429 115 113 12 12 116 114 – 171 678 839
1 Vijay Vaghela’s base salary excludes amount of salary sacrificed for pension contributions.
2 Includes the value of cash supplements received by directors in lieu of pension contributions, the value of any salary sacrificed for pension contributions and the value of contributions made by the Company on behalf of the director direct to the pension scheme.
3 Incorporates the value of all tax assessable benefits arising from employment with the Company related to the provision of car and fuel allowance and healthcare cover.
4 Annual bonus paid for performance over the relevant financial year. Annual bonus was paid 50% in cash and 50% in restricted shares under the RSP. Restricted shares must be held for three years and are subject to forfeiture provisions. Awards may be reduced if the malus rules apply, i.e. in the event of a significant deterioration in the underlying financial health of the Company, conduct harmful to the Company’s reputation, fraud or material misstatement of results. Further details on performance criteria, achievement and resulting awards can be found on page 54, and future annual bonus policy is set out on page 58.
5 Reflects the value of LTIP awards which vested on performance to the relevant financial year end. For 2016, there was nil vesting of 2014 LTIP awards and for 2015, 25.3% of the 2013 LTIP grant vested on performance. The value of the 2013 LTIP has been calculated using the spot share price of 119.25 pence on the date of vesting (17 May 2016) which is lower than the price of 163.76 pence used to estimate the value in last year’s Annual Report. Further details on performance criteria, achievement and resulting awards can be found on pages 54 and 55.
6 The total in respect of Simon Fox for 2015 includes the vesting of his Joining LTIP, which was made under the terms of the 2012 LTIP, with a performance period of 36 months to 30 August 2015. The award vested at 59.4% based on performance and accordingly 944,106 shares became exercisable on 30 August 2015.
Annual bonus in respect of 2016 performance In 2016, executive directors’ bonuses were based 75% on adjusted Group operating profit and 25% on publishing digital revenue. Bonuses of up to 75% of base salary were available for delivering Stretch performance on both metrics.
Based on adjusted Group operating profit and publishing digital revenue growth in 2016, and taking into account factors such as the underlying trading performance of the Group and progress against strategy, the Committee made annual bonus awards of 25.95% of base salary to each of the executive directors payable 50% in cash and 50% in restricted shares.
For adjusted Group operating profit, 75% of potential was payable on a sliding scale from 20% at threshold of £133.4 million, to 45% at target of £140.4 million to 75% at stretch of £147.4 million. Actual performance of £137.5 million had been achieved, which warranted 34.6% of maximum bonus. For publishing digital revenue, 25% of potential was payable on a straight-line sliding scale from 0% at threshold of £82.2m, to 25% payable at stretch of £91.3 million. The stretching digital targets had not been met. Actual performance of £79.0 million was below threshold. In total 34.6% of maximum was achieved, with 50% of bonus deferred in restricted shares.
2014 LTIP AwardsThe performance period for the 2014 LTIP awards ended on 1 January 2017. Vesting of the LTIP awards was dependent on the achievement of absolute TSR targets, as follows:
Closing three-month average adjusted share price at end of performance period % of award which can be exercised
350 pence (or above) 100%
Between 225 pence and 350 pence Straight-line vesting between 100% and 0%
225 pence or below 0%
Satisfaction of the performance condition was determined by reference to the Company’s volume-weighted average share price over the final quarter of the performance period in 2016 which was 93.82 pence and warranted nil vesting. The share price for these purposes includes dividends reinvested over the performance period.
Single total figure of remuneration for non-executive directors (audited)The table below sets out a single figure for the total remuneration received by each non-executive director for the 53 weeks ended 1 January 2017 and the prior period:
Base fee£’000
Other fees£’000
Total£’000
Non-executive1 2016 2015 2016 2015 2016 2015
David Grigson 183 190 – – 183 190
Lee Ginsberg 44 40 13 15 57 55
Steve Hatch 44 3 – – 44 3
David Kelly 44 40 – – 44 40
Jane Lighting2 – 40 – 20 – 60
Donal Smith3 – 17 – – – 17

Strategic Report Governance Financial Statements
Trinity Mirror plc Annual Report 2016 55
Remuneration reportContinued
Single total figure of remuneration for non-executive directors (audited) continuedBase fee
£’000Other fees
£’000Total£’000
Non-executive1 2016 2015 2016 2015 2016 2015
Helen Stevenson4 44 40 27 15 71 55
Olivia Streatfeild5 42 – – – 42 –
Total 401 370 40 50 441 420
1 The fees payable for 2016 reflect the adoption of revised non-executive director fee rates on 1 April 2016.
2 The fees payable to Jane Lighting reflect the period until her departure from the board on 27 December 2015.
3 The fees payable to Donal Smith reflect the period until his departure from the board on 7 May 2015.
4 The fees paid to Helen Stevenson reflect her appointment as Remuneration Committee Chairman from 15 May 2014 and Senior Independent Director from 28 December 2015.
5 The fees paid to Olivia Streatfeild reflect her appointment from 15 January 2016.
The non-executive director fee rates were reviewed during the year and the following changes were made from 1 April 2016:
From 1 April 2016 Prior to 1 April 2016
Chairman base fee £180,000 £190,000
Non-executive director base fee £45,000 £40,000
Additional fee for Senior Independent Director £12,500 £20,000
Additional fee for chairing Audit & Risk Committee £12,500 £15,000
Additional fee for chairing Remuneration Committee £12,500 £15,000
LTIP interests awarded in 2016 (audited)In March 2016, executive directors were granted awards under the 2012 LTIP in the form of Performance Shares. The three-year period over which performance will be measured will end on the last day of the 2018 financial year. To the extent that performance conditions are met, awards will vest on 11 March 2019.
Date of grant
Shares over which awards
granted1 £ % of salary2
Simon Fox11 March
2016 500,851 £745,416 144
Vijay Vaghela11 March
2016 358,943 £534,215 120
1 The base price for calculating the level of awards was 148.83 pence, the average three-day closing price between 08 to 10 March 2016.
2 Based on 2016 base salaries.
Vesting of LTIP awards granted in 2016 is subject to two performance conditions; absolute TSR, accounting for 60% of each award, and cumulative adjusted Net Cash Flow, accounting for the remaining 40%. Further details of the targets applying to these awards are included in the tables below and on the next page.
Absolute TSR condition
Closing three-month average adjusted share price at end of performance period % of total award which can be exercised
280 pence (or above) 60%
Between 180 pence and 280 pence Straight-line vesting between 0% and 60%
180 pence or below 0%
Satisfaction of the absolute TSR performance condition will be determined by reference to the Company’s volume-weighted average share price over the final quarter of the performance period in 2018. The share price for these purposes includes dividends reinvested over the performance period.
In addition, for this part of an award to become exercisable, the Committee must be satisfied that the Company’s share price performance is a genuine reflection of the underlying business performance of the Company over the performance period.
When assessing whether they are satisfied that the Company’s share price performance is a genuine reflection of the Company’s business performance the Committee will take into account factors including revenues, free cash flow and change in net debt as well as the Company’s relative TSR performance over the period. The Committee will be guided in its assessment by a review of performance against these metrics, based on the audited results, which it will undertake prior to vesting. The Committee will consider both a quantitative and qualitative analysis of the performance and will take account of any relevant internal and external factors to help ensure that unexpected events during the period are considered properly.

Governance
Trinity Mirror plc Annual Report 201656
Net Cash Flow condition
Cumulative adjusted Net Cash Flow over the performance period % of total award which can be exercised
£240 million or above 40%
Between £205 million and £240 million Straight-line vesting between 40% and 0%
£205 million or below 0%
Net Cash Flow for the 2016 award is defined as the net cash flows generated by the business before the payment of dividends, and before any cash outflows in relation to items that have been treated as non-recurring in the financial statements. In assessing the Net Cash Flow, the Committee may, if appropriate include or exclude other payments, for example, pension payments over and above the agreed funding plan to better reflect underlying business performance.
The Committee may adjust the Net Cash Flow Condition as it considers appropriate including but not limited to where the Company or Group has bought or sold businesses or companies to maintain the same level of difficulty, and for items which are wholly outside management control.
A two-year holding period applies on vested shares (net of tax) with clawback/malus provisions. The clawback/malus provision allows the Committee to determine that some or all of the shares may not be released to a participant at the end of the two-year holding period if during the holding period: there has been a significant deterioration in the underlying financial health of the Company; there has been a material restatement of the Company’s accounts as a result of a participant’s conduct; a participant has deliberately misled the Company, the market or shareholders regarding the Company’s financial performance; or a participant’s actions have caused harm to the Company’s reputation.
Total pension entitlements (audited)Simon Fox received an annual cash sum to use for pension purposes equivalent to 15% of base salary.
Vijay Vaghela participated in the contributory MGN Pension Scheme, and accrued pension at the rate of 1/60th per year of service on salary up to the earnings cap until it closed to future accrual on 31 March 2010. The normal retirement date for Vijay Vaghela is 65 years.
Pension entitlements are as follows:
Director
Accrued pension at 1 January 20171
£’000
Accrued pension at27 December 20151
£’000
Vijay Vaghela 37 37
1 Pension accruals shown are the amounts which would be paid annually on retirement based on service to 31 March 2010.
The figure for Vijay Vaghela gives the accrued pension to which he would have been entitled based on pensionable service and salary as at 31 March 2010 but assuming he left service at the end of 2016. Vijay Vaghela’s spouse is also entitled to a spouse’s pension.
Further details of pension arrangementsFrom 1 April 2010 until 31 March 2011, Vijay Vaghela participated in the Trinity Mirror Pension Plan (a defined contribution plan) to which he contributed 9% and the Company contributed 10% of his salary up to the earnings cap referred to below. From 1 April 2011, his contributions to the Plan are made under the terms of a salary sacrifice arrangement that was introduced from that date. Since then, contributions have been reduced in accordance with the rules of the scheme. Following ‘A’ day on 6 April 2006, the earnings cap applying to the pension benefits of Vijay Vaghela has been maintained by amending the rules of the pension scheme in which he participates. The cap, currently £123,600, is normally reviewed every 6 April and may be increased at the discretion of the Company by reference to an appropriate index. Contributions are subject to the earnings cap, and therefore an annual cash sum equivalent to 30% of salary in excess of the cap is paid.
Simon Fox and Vijay Vaghela are covered for lump sum death benefits equivalent to four times base salary.
Percentage change in CEO remunerationThe table below shows the percentage change in CEO remuneration from the prior year compared to the average percentage change in remuneration for all other employees.
CEO2016
£’000
CEO2015
£’000
CEO% change
2015–2016
All other employees% change
2015–2016
Base salary 516 510 1% 3%
Taxable benefits 22 22 0% 12%
Annual bonus 134 132 2% 7%
Total 672 664 1% 3%
The CEO’s remuneration includes salary at 31/12/16, taxable benefits and annual bonus. The base salary and taxable benefits for all other employees is calculated using the increase in the earnings of employees taken from salary as at 31/12/16 and 31/12/2015 and P11D data from tax years 2015 and 2016 and is based on a consistent set of employees i.e. the same individuals appear in the 2015 and 2016 populations. The annual bonus is the amount payable in respect of 2016 compared to the amount paid in respect of 2015. The base salary data for part-time employees has been prorated up to the full time equivalent.
Remuneration reportContinued

Strategic Report Governance Financial Statements
Trinity Mirror plc Annual Report 2016 57
Review of past performanceThe following graph illustrates the Company’s performance compared to the FTSE All-Share Index, which is considered the most appropriate form of ‘broad equity market index’ against which the Company’s performance should be measured, and to the FTSE 350 Media Index as the main comparator group for the Company’s shares. Performance, as required by legislation, is measured by TSR.
Eight-year TSR chart
Trinity Mirror plc FTSE 350 Media Index FTSE All-Share Index
Dec 2008 Dec 2011Dec 2010 Dec 2013Dec 2009 Dec 2012 Dec 2014 Dec 2016Dec 2015
500
400
0
100
200
300
Chief Executive’s single figure of remunerationThe table below details the Chief Executive’s single figure of remuneration over the same eight-year period:
2009 2010 2011 2012 2013 2014 2015 2016
Simon Fox
Single figure of remuneration (£’000) 186 710 1,678 2,260 749Annual bonus outcome (% of maximum) 0% 30.0% 45.8% 34.6% 34.6%(£’000) – 113 172 132 134
LTIP vesting (% of maximum) n/a n/a 62.6% 25.3% 0%(£’000) n/a n/a 909 238 –
Joining LTIP vesting (% of maximum) n/a n/a n/a 59.4% n/a(£’000) n/a n/a n/a 1,293 n/a
Vijay Vaghela1
Single figure of remuneration (£’000) 35 Annual bonus outcome (% of maximum) 0%(£’000) –
LTIP vesting (% of maximum) 0%(£’000) –
Sly Bailey
Single figure of remuneration (£’000) 1,935 2,052 1,391 1,354 Annual bonus outcome (% of maximum) 81% 80% 30% 0%(£’000) 939 1,056 396 –
LTIP vesting (% of maximum) 0% 0% 0% 0% (£’000) – – – –
1 Vijay Vaghela acted as CEO on an interim basis between June 2012 and August 2012.
Remuneration reportContinued

Governance
Trinity Mirror plc Annual Report 201658
Remuneration reportContinued
Relative importance of spend on payThe table below shows shareholder distributions (dividends and share buybacks) and total employee pay expenditure for 2015 and 2016, along with the percentage change in both.
2016£’000
2015£’000
% change 2015 – 2016
Shareholder distributions (dividends and share buyback)1 16,900 12,500 35%
Total employee expenditure2 237,900 194,300 22%
1 The Company commenced a share repurchase programme on 1 August 2016.
2 The increase in total employee expenditure is due to the full year impact of the acquisition of Local World.
Exit paymentsThere were no exit payments made to executive directors in the year.
Payments to past directors (audited)As disclosed in last year’s Remuneration Report, Mark Hollinshead ceased to be a director of the Company on 12 December 2014, with the treatment of his outstanding share-based incentive awards in line with the relevant incentive plan rules. Mr Hollinshead retains interests under the RSP which are due to vest in March 2017 and March 2018.
As similarly disclosed last year, Paul Vickers stood down as a director and Company Secretary with effect from 17 November 2014. Mr Vickers left by reason of redundancy, and as such was treated as a good leaver for the purposes of the Company’s incentive plans. During the year, Mr Vickers’ outstanding interests under the 2013 LTIP (77,875 nil-cost options) were released to him on 17 May 2016. Based on performance to the end of the financial year 2016, Mr Vickers’ time pro-rated 2014 LTIP will not vest. Mr Vickers retains interests under the RSP, which are due to vest in March 2017.
Implementation of executive director remuneration policy for 2017Base salaryBase salaries are reviewed taking into account competitive practice for similar roles at sector comparators and at UK-listed companies of similar revenue and market capitalisation. Following its review, the Committee increased the salaries of the Chief Executive and Group Finance Director by £1,000 from 1 March 2017. The basic salaries of the executive directors are as follows:
Base salary at:
Executive director 1 March 2017 1 March 2016 Increase
Simon Fox £518,650 £517,650 0%
Vijay Vaghela £446,179 £445,179 0%
For context, the average salary increase in 2017 annual pay reviews for management and staff across the Group is 1%.
Pension and benefitsNo changes in pension contribution rates or benefit provision.
Annual bonus and RSPFor 2017, the maximum annual bonus opportunity will continue to be 75% of salary for executive directors. The majority of the bonus (70% weighting) will continue to be based on adjusted Group operating profit, with the remaining 30% split equally between publishing digital revenue growth (15% weighting) and the achievement of key strategic objectives (15% weighting) to help reinforce the Company’s business strategy. It is intended that performance against targets will be disclosed in next year’s Annual Report on Remuneration, if no longer deemed by the directors to be commercially sensitive. Any bonus earned in excess of 50% of salary will be deferred in shares under the RSP for three years, subject to shareholder approval of the Company’s Remuneration Policy. Malus and clawback provisions apply.
LTIPAs in recent years, 2017 LTIP awards will be based 60% on absolute TSR and 40% on Net Cash Flow. For awards made from 2017 onwards, Net Cash Flow will be measured before the payment of dividends, before pension deficit funding payments and before any cash outflows in relation to items that are treated as non-recurring in the financial statements. Award sizes are anticipated to be 144% of salary for the Chief Executive and 120% for the Group Finance Director.
The LTIP will continue to have a three-year performance period plus a two-year holding period on vested shares with clawback/malus provisions. Vesting of LTIP awards will be underpinned by Committee discretion taking into account relative TSR and key financial metrics. Absolute TSR and Net Cash Flow targets will be reviewed in advance of grant to ensure they are appropriately stretching over the performance period and will be disclosed at the time of grant, as well as in next year’s Annual Report on Remuneration.
Implementation of non-executive director remuneration policy for 2017Chairman and non-executive director feesThe fees for the Chairman and non-executive directors are expected to remain at the levels as set out on page 55 for 2017.

Strategic Report Governance Financial Statements
Trinity Mirror plc Annual Report 2016 59
Remuneration reportContinued
Directors’ beneficial interests (audited)A table setting out the beneficial interests of the directors and their families in the share capital of the Company as at 1 January 2017 is set out below. None of the directors has a beneficial interest in the shares of any other Group company. Since 1 January 2017, there have been no changes in the directors’ interests in shares.
As beneficiaries under the TIH Employee Benefit Trust, the directors are deemed to be interested in 90,855 ordinary shares held by the trust at 1 January 2017.
The lowest price of the shares during the year was 73.50 pence as at 27 July 2016 and the highest price was 170.00 pence as at 13 January 2016. The share price as at 1 January 2017 (30 December 2016 being the last market date for the financial year) was 106.00 pence.
Director
Ordinary shares at 1 January
2017
Ordinary shares at
27 December 2015
Simon Fox 829,106 811,169
Vijay Vaghela 527,873 527,873
Lee Ginsberg 10,000 10,000
David Grigson 220,000 220,000
Steve Hatch - -
David Kelly 10,000 10,000
Helen Stevenson 35,000 35,000
Olivia Streatfeild - -
Directors’ shareholding requirements (audited)The minimum shareholding guideline is 200% of base salary for the Chief Executive and Group Finance Director, subject to approval of the Remuneration Policy. Executive directors are encouraged to achieve the guidelines within five years of appointment. Until the relevant shareholding levels are attained, executive directors are required to retain 100% of shares vesting, after the sale of sufficient shares to meet any income tax or national insurance obligations of the executive director, under the LTIPs and RSP.
The Board expects that non-executive directors will acquire shares equal in value to one times their annual fee during a period of three years from the date of their appointment.
The Committee has kept these guidelines under review and has determined that the relevant value to take into consideration when assessing whether the guideline has been achieved is the higher of the current market price and the price at the point of purchase or vesting. The table below shows the aggregate value of each current director’s shares for guideline purposes, and their respective shareholding requirement, as at 1 January 2017.
Shares held
DirectorOwned
outright
Unvested and subject to
performance conditions
Unvested but subject
to other conditions2
Value of shares owned outright
Shareholding requirement
Current shareholding (% salary/fee)
Requirement met
Simon Fox 829,1063 1,210,978 114,981 £1,313,560 200 254 Y
Vijay Vaghela 527,8734 867,867 98,883 £942,159 200 211 Y
Lee Ginsberg 10,000 - - £15,800 100 27 N
David Grigson 220,000 - - £245,350 100 136 Y
Steve Hatch - - - -
Requirement not effective until Dec 18 - N/A
David Kelly 10,000 - - £15,800
Requirement not effective until Dec 17 35 N/A
Helen Stevenson 35,000 - - £59,871 100 86 N
Olivia Streatfeild - - -
Requirement not effective until Dec 18 - N/A
1 On 1 January 2017, the mid market closing price of each Trinity Mirror Share was 106.00 pence .
2 Shares awarded under the RSP are subject to a malus provision.
3 This excludes 199,518 vested but unexercised share options.
4 This excludes 142,988 vested but unexercised share options.

Governance
Trinity Mirror plc Annual Report 201660
Remuneration reportContinued
Directors’ and former directors’ interests in shares under the RSP and LTIP (audited)
Director Date of grant
Share price at date of
grant
At 28 December
2015 Granted Exercised Lapsed
At 1 January
2017Performance
periodExercise period (holding period)
Simon Fox
LTIP 30.08.12 £0.3850 33,907 – (33,907) – –30.08.12–29.08.15
30.08.15–30.06.162
17.05.13 £1.0500 788,608 – – (589,090) 199,51831.12.12–27.12.15
17.05.16–17.05.173
19.03.14 £2.1675 322,581 – – – 322,58130.12.13–01.01.17
19.03.17– 19.06.19
(19.03.17–19.03.19)
13.03.15 £1.895 387,546 – – – 387,54629.12.14–31.12.17
13.03.18– 13.06.20
(13.03.18–13.03.20)
11.03.16 £1.4883 – 500,851 – – 500,85128.12.15– 30.12.18
11.03.19– 11.06.21
(11.03.19–11.03.21)
RSP 19.03.14 £2.1675 25,202 – – – 25,202 –restricted until
19.03.17
13.03.15 £1.895 45,317 – – – 45,317 – restricted until
13.03.18
11.03.16 £1.4883 – 44,462 – – 44,692 –restricted until
11.03.19
To be granted in 20171
Shares to the
value of £67,165
Vijay Vaghela
LTIP 17.05.13 £1.0500 565,170 – – (422,182) 142,98831.12.12–27.12.15
17.05.16–17.05.173
19.03.14 £2.1675 231,183 – – – 231,18330.12.13–01.01.17
19.03.17– 19.06.19
(19.03.17–19.03.19)
13.03.15 £1.895 277,741 – – – 277,74129.12.14–31.12.17
13.03.18– 13.06.20
(13.03.18–13.03.20)
11.03.16 £1.4883 – 358,943 – – 358,94328.12.15– 30.12.18
11.03.19– 11.06.21
(11.03.19–11.03.21)
RSP 19.03.14 £2.1675 21,673 – – – 21,673 –restricted until
19.03.17
13.03.15 £1.895 38,973 – – – 38,973 –restricted until
13.03.18
11.03.16 £1.4883 – 38,237 – – 38,237 –restricted until
11.03.19
To be granted in 20171
Shares to the
value of £57,762
1 Awards under the RSP in respect of the 2016 bonus will be made in March 2017. The number of shares awarded will depend on the share price at the date of grant and therefore only the value of the award is given in the above table. Shares will be released in accordance with the rules of the scheme as described on page 61.
2 Due to the Company being in a closed period, the Remuneration Committee resolved to extend the exercise period to 30 June 2016 in respect of this award.
3 Due to the Company being in a closed period, the Remuneration Committee resolved to extend the exercise period to 17 May 2017 in respect of this award.

Strategic Report Governance Financial Statements
Trinity Mirror plc Annual Report 2016 61
Remuneration reportContinued
Details of plansLong-Term Incentive PlanVesting of LTIP awards is subject to continued employment and the Company’s performance over a three-year performance period. If no entitlement has been earned at the end of the relevant performance period, awards will lapse. There is a two-year holding period on vested LTIP shares, with clawback/malus provisions.
Absolute TSR targets NCF targets
Plan WeightingThreshold
(0% vesting)Full vesting
(100% vesting) WeightingThreshold
(0% vesting)Full vesting
(100% vesting)
2014 LTIP 100% 225p 350p n/a n/a n/a
2015 LTIP 60% 225p 300p 40% £196m £227m
2016 LTIP 60% 180p 280p 40% £205m £240m
Restricted Share PlanOn 19 January 2017, the Board approved the renewal of the rules of the Restricted Share Plan, which were originally approved by shareholders on 4 May 2006 and expired on 4 May 2016. The renewal of the RSP is subject to approval by shareholders at the Company’s 2017 AGM. If the renewal of the RSP is approved, it will operate in largely the same way as the RSP has done since 2012 and will be used to defer an element of the annual bonus and deliver it in the form of restricted share awards over Ordinary Shares.
Restricted shares may not be transferred or otherwise disposed of by a participant for the period of three years from the date of grant subject to malus or forfeiture restrictions summarised below.
Participants beneficially own the restricted shares from the date of grant. Legal title is held by the RSP trustees until the restricted shares are released into the participant’s name. Additional shares representing reinvested dividends may be released following the vesting of share awards.
Restrictions on the shares end on the third anniversary of the grant and the shares will be released into the participant’s name unless in the three-year period from grant there has been: a significant deterioration in the underlying financial health of the Company; a material restatement of the Company’s accounts as a result of the participant’s conduct; a participant has deliberately misled the Company, the market or shareholders regarding the Company’s financial performance; or a participant’s actions have caused harm to the Company’s reputation in which case either the award may lapse or the number of shares transferred to a participant may be reduced.
If cessation of employment is by reason of gross misconduct or resignation to a competitor, awards would be forfeited immediately and the participant would have no further interest in or claim to the restricted shares but if cessation of employment is for any other reason, the participant would retain the restricted shares and they would vest in accordance with normal vesting provisions.

Governance
Trinity Mirror plc Annual Report 201662
Corporate responsibility report
Chief Executive’s statementI am pleased to present our Corporate Responsibility Report, which is an area where the Group’s commitment to integrity and ethics becomes quite evident. This year the Company maintained its inclusion in the FTSE4Good Index, which measures the quality and transparency of our environmental, social and ethical disclosures.
In respect of our environmental impact, we again achieved re-certification to the Carbon Trust Standard and all our major print sites maintained their ISO 14001 Environmental Management status, which is a testament to the hard work and commitment of our environmental and facilities teams. We also delivered on the targets we set ourselves in 2015 in respect of improving in areas such as procurement, water consumption and waste management, and we have set ourselves challenging targets for 2017, which are detailed on page 65.
We have applied rigorous health and safety standards across our business and information on these is on page 66.
We continue to care for the communities in which we publish and where our businesses operate and we have tried to give a flavour of the many examples of us doing this in the report that follows. You can read more about social and community work on page 67.
This year, the Daily Mirror’s annual Pride of Britain Awards was produced for the first time in partnership with TSB Bank plc. This was the 18th year of the Pride of Britain awards and we are, as ever, delighted to have the opportunity to celebrate brave and extraordinary achievements.
I am proud of our engagement with the communities in which we work and our role in raising awareness of the many good causes they support and look forward to doing more of this in the year ahead.
Simon FoxChief Executive
27 February 2017
Environmental reportEnvironmental managementTrinity Mirror is committed to protecting the environment. The Environmental Steering Committee, chaired by the Group Finance Director, has oversight of our rolling environmental programme, ensuring that it continues to deliver against the Company’s Environmental Policy objectives.
During 2016 we achieved all of our key environmental targets. Highlights included maintaining the high proportion of sustainable paper we use and further reducing our electricity consumption and associated greenhouse gas emissions.
We also made excellent progress in integrating Local World into the environmental programme. This report includes data on sustainable paper use and core energy consumption by these businesses for the first time.
All of our in-house printing facilities and core publishing sites continue to operate under environmental management systems that are independently certified to the international ISO 14001 standard. A key challenge has been to update our systems to conform with the major revision to ISO 14001 that took place at the end of 2015. Thanks to the efforts of all of our employees, we are confident that all sites will be successfully re-certified to the revised standard by the end of 2017.
We have set a new target to integrate recently acquired sites into our publishing environmental management system, and we expect to complete this work by the end of 2019.
A summary of performance against 2016 Group targets can be found on page 64, together with our new targets for the coming year. The Environmental Policy can be found at: www.trinitymirror.com/our-values
There were no prosecutions or compliance notices for breaches of environmental legislation during 2016.
Energy consumption and carbon footprintThe electricity consumption of our in-house printing facilities and publishing centres (including the publishing sites recently acquired from Local World) fell by 6.1% compared with 2015. On a like for like basis, excluding Local World sites, the annual reduction in electricity consumption was 8.1% (versus the target of a 0.5% reduction). This is the eighth successive year that we have been able to report reductions in our main source of energy consumption.
Overall, the greenhouse gas emissions associated with the activities under our direct management control (Scope 1 and 2 emissions) fell by 14.4% in absolute terms and by 5.8% on a normalised basis (per million printed pages).
The Company has continued to participate in Phase 2 of the Carbon Reduction Commitment (‘CRC’) Energy Efficiency Scheme, and the businesses acquired from Local World have been fully integrated into our reporting.
A breakdown of the Group’s energy consumption and associated greenhouse gas emissions during 2016 is set out in the table below, in accordance with the Companies Act 2006 (Strategic Report and Directors’ Report) Regulations 2013, and following the UK Government’s Environmental Reporting Guidance. Some of the numbers provided were obtained as a result of the Company’s compliance with the Climate Change Agreements (Eligible Facilities) Regulations 2006 and the CRC Energy Efficiency Scheme Order 2010.
The data reported for Scope 1 and 2 include all of the operations that we managed in 2016, including the sites acquired from Local World.
In 2016 we also reported voluntarily on our greenhouse gas emissions data through the international Carbon Disclosure Project for the fifth year running.

Strategic Report Governance Financial Statements
Trinity Mirror plc Annual Report 2016 63
Corporate responsibility reportContinued
Energy consumption and carbon footprint continuedTrinity Mirror energy consumption and associated greenhouse gas emissions (CO2 equivalent)
GHG emissions (CO2 equiv. tonnes)
ConsumptionGHG conversion factor
(2016)4 2016 2015 2014
SCOPE 11
Gas combustion (heating, all Trinity Mirror premises) 17,894,564 kWh 0.18400 x 10⁻³ 3,293 3,184 3,344Oil combustion (electricity generation, all Trinity Mirror premises) 124,146 litres 2.67620 x 10⁻³ 332 131 264
Refrigerant gas loss (all Trinity Mirror premises) 350 kg Various by gas type 734 1,082 464
Commercial vehicles (all Trinity Mirror owned vehicles) 403,352 km 0.26578 X 10⁻³ 107 135 429
Total SCOPE 1 4,466 4,532 4,501
Total SCOPE 1 per million pages printed 0.05 0.05 0.04
SCOPE 22
Generation of Grid electricity used (all Trinity Mirror premises) 63,177,599 kWh 0.41205 x 10⁻³ 26,032 31,107 36,650
Total SCOPE 2 26,032 31,107 36,650
Total SCOPE 2 per million pages printed 0.29 0.32 0.33
SCOPE 33
Transmission and distribution of Grid electricity used (all Trinity Mirror premises) 63,177,599 kWh 0.03727 x 10⁻³ 2,355 2,568 3,205
Business travel (road, not involving company vehicles) 12,631,543 km 0.20033 x 10⁻³ 2,530 1,442 1,901
Business travel (rail) 2,682,488 km 0.04885 x 10⁻³ 131 108 103
Business travel (air) 4,709,387 km 0.27867 x 10⁻³ 1,312 1,639 1,467Electricity for contracted printing (generation, transmission and distribution) 5,910,718 kWh 0.44932 x 10⁻³ 2,656 1,836 2,402
Gas for contracted printing 3,953,077 kWh 0.18400 x 10⁻³ 727 929 934
Vehicle fuel for contracted distribution – long haul 2,293,889 litres 2.61163 x 10⁻³ 5,991 4,907 5,224
Overall Total SCOPE 1, 2 and 3 46,200 49,068 56,387
Overall Total SCOPE 1, 2 and 3 per million pages printed 0.48 0.45 0.46
Notes:
1 Scope 1 covers the annual quantity of emissions in tonnes of carbon dioxide equivalent from emission sources that are under the operational control of the Company. For 2016 this includes the sites acquired from Local World, which accounted for 384 tonnes CO2 equiv (9.2% of the total).
2 Scope 2 covers the annual quantity of emissions in tonnes of carbon dioxide equivalent resulting from the purchase of electricity by Trinity Mirror for its own use. For 2016 this includes the sites acquired from Local World, which accounted for 550 tonnes CO2 equiv (2.1% of the total). In-line with the latest guidance from Defra, emissions from the generation of electricity used are included in Scope 2, whilst emissions associated with the transmission and distribution of electricity used are included in Scope 3. Note: Scope 2 emissions have been calculated on a ‘Location’ rather than a ‘Market’ base (ref: Greenhouse Gas Protocol: A Corporate Accounting and Reporting Standard – Revised Edition).
3 Scope 3 covers other indirect greenhouse gas emissions, i.e. where the emissions are from sources that are not owned by Trinity Mirror and where the Company does not have operational control.
4 UK Government Conversion Factors for Company Reporting (2016) have been used throughout.
5 All numbers in italics are based on un-audited numbers provided by contractors.
Water consumptionWe have continued our programme to review water efficiency and implement good practice across our property portfolio. Independent consultants undertook a survey of the Watford site during 2016, and key recommendations will be implemented building on previous work undertaken at Liverpool and Oldham. The status of water monitoring will be reviewed at all sites during 2017.
The water consumption of the Group’s ‘core sites’ during 2016 was 61,713 m3.
Supply chainPaper sourcing and sustainable forestryTrinity Mirror remains committed to maximising the use of graphic paper that is produced from recycled fibre, or fibre from forests that have been independently certified as sustainable. In 2016 we sourced 89.3% of all of our graphic paper (including the paper used by recently acquired publications) from recycled or certified fibre, against our target of 80%.

Governance
Trinity Mirror plc Annual Report 201664
Corporate responsibility reportContinued
Supply chain continuedContracted printing and product distribution servicesTrinity Mirror takes account of environmental standards when awarding contracts for the printing of magazine supplements and the road distribution of printed products. We expect key contractors to measure and report the energy consumption and carbon emissions associated with the work they undertake on our behalf.
Transparency in supply chainsWe are committed to ensuring that there is no slavery or human trafficking within our supply chains or in any part of our business. We expect our suppliers to adhere to the requirements of the Modern Slavery Act 2015, and we will undertake all reasonable and practical steps to ensure that these standards are implemented within our supply chain. Our modern slavery statement will be published on our website, www.trinitymirror.com, within six months of the financial year end.
Waste management and recyclingDuring 2016 we met our targets to maximise the re-use or recycling of paper waste and hazardous wastes from our print sites. We also met our target that 100% of waste electrical and electronic equipment (‘WEEE’) from publishing sites be either refurbished and re-used, or processed for materials recycling.
Summary of performance vs. 2016 environmental targets
2016 Target Action
Environmental management
Maintain ISO certification covering current core publishing sites. Certification has been maintained
Maintain ISO 14001 certifications at print sites currently under our ownership.
All certifications have been maintained.
Progressively implement the actions necessary to meet the requirements of ISO 14001: 2015 at all certified sites.
Good progress – all sites will be re-certified by end 2017.
Undertake a strategic review during 2016 of how best to bring Local World operations into line with Trinity Mirror’s Environmental Policy.
Data covering energy consumption and sustainable paper usage are now included in Group reporting.
A programme to integrate recently acquired sites into the Group publishing environmental management system is to commence in 2019.
Energy consumption and carbon footprint
Reduce kWh of electricity consumed at all sites in FY 2017 by 0.5% compared with 2015.
Achieved 6.1% reduction in electricity consumption, (8.1% reduction on a like for like basis, i.e. excluding Local World sites).
Continuously monitor business travel to ensure that reductions in carbon emissions associated with business travel are maintained.
Overall business travel increased during 2016, reflecting the additional reporting of travel by Local World staff. On a like for like basis compared with 2015 (excluding Local World) total business miles fell by 10.3%.
Review opportunities for energy savings that have been identified and prioritise for implementation.
Energy audits and energy savings measures have been undertaken, reflecting our compliance with the Energy Savings Opportunity Scheme Regulations 2014 (ESOS).
Water consumption
Undertake a water efficiency survey at the Watford print site and review other current publishing sites for further water efficiency opportunities.
A survey has been undertaken by independent consultants at Watford. The current status of water monitoring is being reviewed at all sites.
Supply chain
Continue to use a minimum of 80% graphic paper (all newsprint and magazine paper grades) manufactured from fibre using recycled materials or wood from certified sustainable forests.
We have continued to work with our suppliers on this issue. In 2016 we sourced 89.3% of our graphic paper from recycled or certified fibre.
Waste management and recycling
Continue to recycle 100% of all non-hazardous paper waste from print sites under our ownership.
Achieved 100% recycling during 2016.
Maximum of 3% of hazardous wastes generated at print sites under our ownership to go to landfill.
2.1% of hazardous wastes generated at print sites went to landfill during 2016.
100% of redundant IT equipment and other WEEE from publishing sites to be either refurbished and re-used, or processed for materials recycling.
100% of redundant IT and other electrical and electronic wastes were reused or recycled in 2016.

Strategic Report Governance Financial Statements
Trinity Mirror plc Annual Report 2016 65
Corporate responsibility reportContinued
Summary of 2017 environmental targets
2017 TARGETS
Environmental management
Maintain ISO certification for Publishing and Print sites by progressively implementing the actions necessary (during the three year certification period) to meet the requirements of ISO 14001:2015 at all certified sites.
Integrate major publishing sites acquired from Local World into Trinity Mirror’s ISO 14001 environmental management system by the end of 2019.
Energy consumption and carbon footprint
Reduce kWh of electricity consumed at all sites in FY 2017 by 0.5% compared with 2016.
Plan to review a transition process replacing a percentage electricity reduction target with a carbon emissions reduction target by the end of 2019.
Actively reduce UK/domestic business travel.
Note: Overseas travel is excluded because the requirement to cover news events fluctuates year on year and is outside the Company’s control.
Water consumption
Undertake a water efficiency survey at the Watford print site and review other current publishing sites for further water efficiency opportunities.
Supply chain
Continue to use a minimum of 80% graphic paper (all newsprint and magazine paper grades) manufactured from fibre using recycled materials or wood from certified sustainable forests.
Waste management and recycling
Continue to recycle 100% of all non-hazardous paper waste from print sites under our ownership.
Maximum of 3% of hazardous wastes generated at print sites under our ownership to go to landfill.
All Trinity Mirror sites to divert 100% WEEE waste away from landfill by 2018.
Health and safety reportIn 2016 the Company again recorded the lowest number of workplace accidents for the Group since detailed records began. This was an excellent achievement given the increase in employees following the acquisition of Local World at the end of 2015. In recognition of the high standards achieved the Company was awarded a RoSPA President’s Award for Occupational Health and Safety.
During the year the health and safety team carried out a benchmarking exercise in the new regional businesses to determine the level of health and safety conformity. From the results obtained an action plan was prepared and is being implemented to achieve a common health and safety approach across the Publishing businesses. This process will continue throughout 2017.
Throughout 2016 the print businesses again achieved continuous certification in the OHSAS 18001 health & safety standard.
Group health and safety statistics
The tables below provide statistics for health and safety in 2016, with a comparison to the previous year. It is pleasing to report that there was a significant reduction in the number of accidents, including those reportable under RIDDOR (Reporting of Injuries, Diseases and Dangerous Occurrences Regulations 2013). The total number of working days lost has also fallen to a lower level.
A more detailed breakdown is given in the following tables.
Health and safety performance indicator 2016 2015
Fatalities 0 0
RIDDOR specified injuries1 0 1
RIDDOR over seven day injuries 22 7
RIDDOR occupational ill health/diseases/conditions 0 0
RIDDOR dangerous occurrences 0 0
Total number of accidents 733 87
RIDDOR events frequency rate4 0.02 0.09
All accidents frequency rate 0.80 1.06
Total days lost due to accidents 56 240
1 RIDDOR – the Regulations include a list of ‘specified injuries’ to workers that require immediate notification to HSE.2 There were no RIDDOR incidents for Local World during 2016.3 Figure includes 15 Local World accidents in 2016.4 Frequency Rate = number of accidents per 100,000 hours worked.

Governance
Trinity Mirror plc Annual Report 201666
Corporate responsibility reportContinued
Breakdown of accidents by type of event
All accidents
2016 (%)
All accidents 2015 (%)
RIDDOR accidents
2016 (%)
RIDDOR accidents 2015 (%)
Slips and falls (same level) 12 22 0 50
Lifting and handling of materials 8 3.5 50 12.5
Contact with machinery 4 3.5 50 25
Falls from a height 1.5 2 0 0
Stepping on or striking fixed object 25 18.5 0 0
Struck by moving vehicle 3 0 0 0
Contact with sharp/abrasive material 11 11.5 0 0
Struck by flying or falling object 11 8 0 0
Contact with hazardous substance 5.5 6 0 0
Contact with hot materials/substance 1.5 3.5 0 0
Object collapsing or overturning 1.5 2 0 0
Use of hand tools 4 7 0 0
Contact with electricity 0 1 0 0
Others 12 11.5 0 12.5
Total 100 100 100 100
(All percentages rounded to the nearest half decimal point)
There was a 54% reduction in the total number of accidents involving slips, trips and falls this year with none reportable under RIDDOR, compared to four in the previous year.
Health and safety enforcement activityThere was no health and safety enforcement action taken at any of the Group businesses during 2016, including Local World.
Future health and safety initiativesTo promote and maintain further improvement in 2017 the Group intends to:
− Continue with the provision of health and safety awareness training for senior executives, managers and operational staff via tutored courses and e-learning modules;
− Continue with the standardisation of health and safety arrangements throughout the Regional publishing businesses; − Closely monitor the health and safety performance of contractors involved in engineering, construction and staff relocation projects; − Continue with internal health and safety inspections, audits and reviews, taking follow up action to maintain standards; − Periodically review and, where necessary, update risk assessments and safe systems of work; − Continue the provision of ‘toolbox talks’ to manufacturing and maintenance staff covering health and safety issues that are relevant to their work;
− Analyse accidents, incidents and near misses in an effort to identify and effectively control potential hazards; − Maintain continual improvement with OHSAS 18001 at print sites, implementing annual health and safety improvement plans; − Continue with behavioural safety initiatives at our print sites in an effort to help identify opportunities for accident prevention and further improvement;
− Maintain the provision of occupational health services through the Group with follow-up action and in appropriate cases support; − Continue the promotion of staff health and wellbeing through training, organisational risk assessment and implementing plans for improvement if required.

Strategic Report Governance Financial Statements
Trinity Mirror plc Annual Report 2016 67
Corporate responsibility reportContinued
Social and community reportTrinity Mirror supports communities across the UK through its editorial work, raising awareness, publicising charities, running campaigns and organising fundraising appeals across all of its national and regional titles.
In 2016 our campaign journalism lead the news agenda and stood up for the values and concerns of our readers. The Liverpool Echo was named Daily Newspaper of the Year at the North West Media Awards for its long running campaign for justice for ‘The 96’. The Daily Record launched a campaign to encourage thousands more people to sign up for the organ donor register, and our Senior Feature Writer for the Mirror was shortlisted for an Amnesty Media Award for his excellence in human rights reporting. These are just some examples of the fantastic work our publications do every day to draw attention to injustices and make a positive difference to society.
Trinity Mirror makes direct cash donations to various charities connected with or associated with the newspaper, printing or advertising industries and to charities operating in the communities immediately surrounding the Group’s offices and sites. The charities that are likely to receive support are smaller community-based charities where a modest donation will make a big impact. Each of our regional newspaper companies have a small budget out of which they can make donations to charities working in the community in which they are based.
We run a large number of award ceremonies across the Group, with the aim of celebrating the exceptional achievements of our readers and communities and raising awareness of their causes, ranging from national televised events to smaller events reported in the local newspaper.
Campaigning for truth and justiceTrinity Mirror’s national and regional titles have been at the forefront of campaign journalism in 2016. The Birmingham Mail received praise for its campaign to resume the Birmingham pub bombing victims’ inquest, including a Local Heroes Award at the British Journalism Awards. The Liverpool Echo was a prominent campaigner for an inquest into the Hillsborough stadium disaster, which delivered its verdicts last April. And the Sunday People won Campaign of the Year at the British Journalism Awards for its campaign exposing shortcomings at North Middlesex Hospital.
Campaign sparks increase in donor register signaturesA series of Daily Record stories highlighting the plight of a dying child sparked a massive increase in the number of registered bone marrow donors. Brave Ava Stark’s story first ran exclusively in the Daily Record on 20 July after a life-saving donor pulled out at the last minute. The story prompted 11,000 new donors to sign the register and a match was eventually found. However, they too pulled out at the last minute so the Daily Record campaigned again, and within 48 hours more than 49,000 donors had signed up. In November, Ava received her long awaited bone marrow transplant and has been given a second chance in life thanks to the kindness and concern shown by all those who signed the register.
Governance
Trinity Mirror plc Annual Report 201668
Statement of directors’ responsibilitiesThe directors are responsible for preparing the Annual Report in accordance with applicable law and regulations.
Company law requires the directors to prepare financial statements for each financial year. The directors are required to prepare the consolidated financial statements in accordance with International Financial Reporting Standards (‘IFRS’) as adopted by the European Union and Article 4 of the IAS Regulation and have elected to prepare the parent company financial statements in accordance with applicable law and United Kingdom Accounting Standards (United Kingdom Generally Accepted Accounting Practice). On 22 December 2016 the Company announced the adoption of FRS 101, a reduced disclosure regime, for its parent company financial statements, which is one of the bases of preparation permitted by the FRC.
Under company law, the directors must not approve the accounts unless they are satisfied that they give a true and fair view of the state of affairs of the Group or Company and of the profit or loss of the Group or Company for that period.
In preparing the consolidated financial statements, International Accounting Standard 1 requires that directors:
− Properly select and apply accounting policies; − Present information, including accounting policies, in a manner that provides relevant, reliable, comparable and understandable information;
− Provide additional disclosures when compliance with the specific requirements in IFRS are insufficient to enable users to understand the impact of particular transactions, other events and conditions on the entity’s financial position and financial performance; and
− Make an assessment of the Company’s ability to continue as a going concern, and its long-term viability.In preparing the parent company financial statements, the directors are required to:
− Select suitable accounting policies and then apply them consistently; − Make judgements and estimates that are reasonable and prudent; − State whether applicable United Kingdom Accounting Standards have been followed, subject to any material departures disclosed and explained in the financial statements; and
− Prepare the financial statements on the going concern basis unless it is inappropriate to presume that the Company will continue in business.
The directors are responsible for keeping adequate accounting records that are sufficient to show and explain the Company’s transactions and disclose with reasonable accuracy at any time the financial position of the Company and to enable them to ensure that the parent company financial statements comply with the Companies Act 2006. They are also responsible for safeguarding the assets of the Company and hence, for taking reasonable steps for the prevention and detection of fraud and other irregularities.
The directors are responsible for the maintenance and integrity of the corporate and financial information included on the Company’s website. Legislation in the United Kingdom governing the preparation and dissemination of financial statements may differ from legislation in other jurisdictions.
Results The profit for the period attributable to equity holders of the parent company was £39.0 million (2015: £37.1 million). Dividend payments amounting to £14.6 million were made during the year ending 1 January 2017 (2015: £12.5 million). After dividends, retained profit for the period was £24.4 million (2015: £24.6 million).
Dividends and share buybackThe Board proposes a final dividend for 2016 of 3.35 pence per share (2015: 3.15 pence per share) which, subject to shareholder approval, will be payable on 9 June 2017 to shareholders on the register on 12 May 2017. The proposed final dividend together with the interim dividend of 2.1 pence per share (2015: 2.00 pence per share) results in a total dividend for 2016 of 5.45 pence per share (2015: 5.15 pence per share).
On 1 August 2016 the Group announced a Share Repurchase Programme of the Company’s 10p Ordinary Shares, up to a maximum consideration of £10 million. The purpose of the Share Repurchase Programme is to reduce the Company’s share capital, with the repurchased shares being held in treasury.
During the year to 1 January 2017 the Company repurchased 2,505,366 10p Ordinary shares with an aggregate nominal value of £250,536.60, representing 0.88% of the issued share capital.
As the Group continues to manage the business through the structural challenges facing print media the Board has adopted a progressive dividend policy which is aligned to free cash generation of the business. The free cash generation for the purposes of assessing the dividend is the net cash flow generated by the Group before the repayment of debt, dividend payments, other capital returns to shareholders and additional contributions made to the defined benefit pension schemes as a result of a substantial increase in dividends and/or capital returns to shareholders. When setting the level of dividends the Board will ensure that the Group maintains adequate headroom for investment and any unexpected cash flow requirements for historical events or to fund further restructuring. Based on the Board’s expectation of future cash flows the Board expects dividends to increase by at least 5% per annum.
Directors’ report

Strategic Report Governance Financial Statements
Trinity Mirror plc Annual Report 2016 69
Directors’ reportContinued
The Company will also consider the return of capital to shareholders through a share buyback if it has generated surplus cash and sees an opportunity to enhance earnings per share and therefore shareholder value. Prior to initiating a share buyback programme the Company will carefully consider the cash generation of the business and the Group’s obligations to the Group’s defined benefit pension schemes.
The risks associated with the delivery of the dividend policy are as follows:
− The availability of distributable reserves: In 2014, as a result of an impairment of the carrying value of investments held by the Company were impaired and this resulted in a negative balance on the profit and loss reserve and therefore the Company had no distributable reserves. This was addressed by undertaking a court approved capital reduction to eliminate the negative balance in the profit and loss reserve and thereafter the distributable reserves have been re built through dividends received from subsidiary companies from profits. The Company would undertake a similar exercise in the future if such an event was to occur as it still has a £606.7 million balance on the share premium account;
− A significant fall in profits and cash flows which materially reduces free cash flow: Under these circumstances the Group would review all the investment requirements, pension obligations and future debt payments. In such circumstances we would seek to hold dividends unless it would place increased pressure on the ability of the Group to fund investment to deliver its strategy or if it was to create any financing issues; and
− The payment of dividends would potentially restrict the ability of the Group to meet payments due under the recovery plans agreed with Group’s defined benefit pension schemes: The Group has agreed recovery plans with the Trustees of the Group’s defined benefit pension schemes which are reviewed at each triennial valuation. The Group has also agreed that additional contributions will be made to the schemes in the event dividends are increased by more than 10% in any one year. The additional contributions to the pension schemes will be equivalent to at least 50% of the amount by which dividend payments are more than the amount they would have been if dividends had been increased by 10%. Further, the Group has agreed that dividend payments or any other return of capital to shareholders in any year will not be in excess of payments to the pension schemes to address past deficits. These obligations may restrict future increases in dividends.
Disclosure of information under Listing Rule 9.8.4Dividend waiversThere is a waiver in place in respect of all or any future right to dividend payments on shares held in the Trinity Mirror Employees’ Benefit Trust (4,307,155 shares as at 1 January 2017), shares held in TIH Employee Benefit Trust (90,855 shares as at 1 January 2017) and shares held in treasury (2,505,366 shares as at 1 January 2017).
For the purposes of compliance with LR 9.8.4R, the following information is included by reference within the Directors’ Report:
LR 9.8.4R Location
Directors’ remuneration Directors’ Remuneration Report, pages 45 to 61
Waiver or agreed waiver of dividends by a shareholder Directors’ Report, page 69
Details of Long-Term Incentive Schemes Directors’ Remuneration Report, pages 45 to 61
Political donationsAt the Company’s Annual General Meeting held on 5 May 2016, the Company and its subsidiaries received authority from shareholders under the Companies Act 2006 to make donations to political parties of up to £75,000 in aggregate per annum. No political donations were made during the period ended 1 January 2017 (2015: nil).
Greenhouse gas emissionsThe disclosure in respect of the greenhouse gas emissions of the Company that are attributable to human activity in tonnes of carbon dioxide equivalent for all six greenhouse gases are set out in the Corporate Responsibility Report on page 63.
Employment policies and employeesThe Company is committed to increasing the service quality, profitability and efficiency of the Company by attracting and recruiting the people who are best suited to meet the standards for the role and the Company without regard to race, creed, colour, nationality (subject to legal eligibility), ethnic origin, religion, gender, age, sex change, sexual orientation, marital status, connections with a national minority, membership or non-membership of a trade union or, unless justifiable, disability.
We pursue a policy of equal opportunities for all employees and potential employees. We have continued our policy of giving fair consideration to applications for employment made by disabled persons bearing in mind the requirements for skills and aptitude for the job. In the areas of planned employee training and career development, we strive to ensure that disabled employees receive maximum possible benefits including opportunities for promotion. Every effort is made to ensure that continuing employment and opportunities are also provided for employees who become disabled. Within the limitations of commercial confidentiality and security, it is the policy of the Company to take views of employees into account in making decisions and wherever possible, to encourage the involvement of employees in the Group’s performance.
Group companies evolve their own consultative policies. Methods of communication used within the Group include staff forums, advisory committee meetings, newsletters, bulletins, pension trustee reports, management briefings and staff surveys.
Simon Fox, Chief Executive, is the executive director with Human Resource responsibility.

Governance
Trinity Mirror plc Annual Report 201670
Directors’ reportContinued
Further information about our employees is set out in the Strategic Report on pages 12 and 13.
Share capital
As at 1 January 2017 the Company’s issued share capital comprised 283,459,571 ordinary shares with voting rights and a nominal value of 10 pence each. The Company held 2,505,366 ordinary shares in treasury. Therefore, the total number of voting rights in the Company was 280,954,205.
As at 24 February 2017, the last practicable date before publication of this report, the Company’s issued share capital comprised 283,459,571 ordinary shares with voting rights and a nominal value of 10 pence each. The Company held 3,329,610 ordinary shares in treasury. Therefore, the total number of voting rights in the Company was 280,129,961. Each share carries the right to one vote at general meetings of the Company with the exception of treasury shares.
As at 1 January 2017, the Trinity Mirror Employees’ Benefit Trust held 4,307,155 shares (2015: 2,845,789). At the same date the TIH Employee Benefit Trust held 90,855 shares (2015: 90,855).
Details of the authorised and issued share capital, share premium account and treasury shares can be found in notes 30 and 31 in the notes to the consolidated financial statements.
Substantial shareholdingsAs at 1 January 2017, the Company had been notified of the following beneficial interests in its ordinary shares:
NameNumber of
shares
Percentage of issued share
capital
Aberforth Partners 35,335,661 12.58
Schroder Investment Mgt 29,812,679 10.61
Standard Life Investments 24,950,499 8.88
Aviva Investors 21,068,376 7.50
Majedie Asset Mgt 20,718,020 7.37
Premier Fund Mgt 14,997,721 5.34
JPMorgan Asset Mgt 13,834,834 4.92
Dimensional Fund Advisors 13,385,734 4.76
Since 1 January 2017 to the date of this report, the Company has not been notified of any changes to the above beneficial interests.
DirectorsThe directors of the Company who served during the period, unless stated otherwise, are listed below:
ExecutiveSimon Fox Vijay Vaghela
Non-executiveLee Ginsberg David Grigson David Kelly Helen Stevenson Steve Hatch Olivia Streatfeild (appointed 15 January 2016)
Details of directors’ remuneration, including details of the beneficial and non-beneficial interests in shares, can be found in the Annual Report on Remuneration on pages 58 to 60. Details in respect of directors’ indemnity and insurance are included in the Corporate Governance Report on page 37.
Biographical details of each of the directors seeking re-election at the Annual General Meeting can be found on pages 32 and 33.

Strategic Report Governance Financial Statements
Trinity Mirror plc Annual Report 2016 71
Articles of AssociationThe Company’s Articles of Association may only be amended by a special resolution at a general meeting of the shareholders.
Purchase of own sharesAt the Company’s Annual General Meeting on 5 May 2016, shareholders approved an authority for the Company to make market purchases of its own shares up to a maximum of 28,345,957 shares (being 10% of the issued share capital) at prices not less than the nominal value of each share (being 10 pence each) and not exceeding 105% of the average mid-market price for the preceding five business days. Use was made of this authority during the period and details can be found on page 68.
AuditorEach of the persons who are a director at the date of approval of this Annual Report confirms that:
− So far as the director is aware, there is no relevant audit information of which the Company’s auditor is unaware; and − The director has taken all the steps that he or she ought to have taken as a director in order to make himself or herself aware of any relevant audit information and to establish that the Company’s auditor is aware of that information.
This confirmation is given and should be interpreted in accordance with the provisions of section 418 of the Companies Act 2006.
Deloitte LLP have expressed their willingness to continue in office as auditor of the Company and their reappointment will be put to shareholders at the next Annual General Meeting.
Directors’ responsibility statementThe directors confirm to the best of their knowledge:
− The financial statements, prepared in accordance with the relevant financial reporting framework, give a true and fair view of the assets, liabilities, financial position and profit or loss of the Company and the undertakings included in the consolidation taken as a whole; and
− The Strategic Report includes a fair review of the development and performance of the business and the position of the Company and the undertakings included in the consolidation taken as a whole, together with a description of the principal risks and uncertainties they face.
The Board confirms that the Annual Report, taken as a whole, is fair, balanced and understandable and it provides the information necessary for shareholders to assess the Company’s position, performance, business model and strategy.
By order of the Board
Vijay VaghelaCompany Secretary
27 February 2017
Directors’ reportContinued

Financial Statements
Trinity Mirror plc Annual Report 201672
Independent auditor’s report to the members of Trinity Mirror plc
Opinion on financial statements of Trinity Mirror plcIn our opinion:
· the financial statements give a true and fair view of the state of the Group’s and of the Parent Company’s affairs as at 1 January 2017 and of the Group’s profit for the 53 week period then ended;
· the Group financial statements have been properly prepared in accordance with International Financial Reporting Standards (IFRSs) as adopted by the European Union;
· the Parent Company financial statements have been properly prepared in accordance with United Kingdom Generally Accepted Accounting Practice, including FRS 101 “Reduced Disclosure Framework”; and
· the financial statements have been prepared in accordance with the requirements of the Companies Act 2006 and, as regards the Group financial statements, Article 4 of the IAS Regulation.
The financial statements comprise the consolidated income statement, the consolidated statement of comprehensive income, the consolidated and parent company balance sheets, the consolidated cash flow statement, the consolidated and parent company statements of changes in equity, the consolidated and parent company accounting policies and the related notes 1 to 39 to the consolidated financial statements and the related notes 1 to 13 of the parent company financial statements.
The financial reporting framework that has been applied in the preparation of the consolidated financial statements is applicable law and IFRSs as adopted by the European Union. The financial reporting framework that has been applied in the preparation of the parent company financial statements is applicable law and United Kingdom Accounting Standards (United Kingdom Generally Accepted Accounting Practice), including FRS 101 “Reduced Disclosure Framework”.
Going concern and the directors’ assessment of the principal risks that would threaten the solvency or liquidity of the GroupAs required by the Listing Rules we have reviewed the directors’ statement regarding the appropriateness of the going concern basis of accounting and the directors’ statement on the longer-term viability of the Group contained within the corporate governance report on pages 37 and 38.
We have nothing material to add or draw attention to in relation to:
· the directors’ confirmation on page 37 that they have carried out a robust assessment of the principal risks facing the Group, including those that would threaten its business model, future performance, solvency or liquidity;
· the disclosures on pages 14 to 16 that describe those risks and explain how they are being managed or mitigated; · the directors’ statement in note 1 to the consolidated financial statements about whether they considered it appropriate to adopt the going concern
basis of accounting in preparing the financial statements and their identification of any material uncertainties to the Group’s ability to continue to do so over a period of at least twelve months from the date of approval of the financial statements; and
· the directors’ explanation on page 38 as to how they have assessed the prospects of the Group, over what period they have done so and why they consider that period to be appropriate, and their statement as to whether they have a reasonable expectation that the Group will be able to continue in operation and meet its liabilities as they fall due over the period of their assessment, including any related disclosures drawing attention to any necessary qualifications or assumptions.
We agreed with the directors’ adoption of the going concern basis of accounting and we did not identify any material uncertainties relating to this conclusion. However, because not all future events or conditions can be predicted, this statement is not a guarantee as to the Group’s ability to continue as a going concern.
IndependenceWe are required to comply with the Financial Reporting Council’s Ethical Standards for Auditors and we confirm that we are independent of the Group and we have fulfilled our other ethical responsibilities in accordance with those standards. We also confirm we have not provided any of the prohibited non-audit services referred to in those standards.
Our assessment of risks of material misstatementThe assessed risks of material misstatement described below are those that had the greatest effect on our audit strategy, the allocation of resources in the audit and directing the efforts of the engagement team.
With the exception of the exclusion of the risks relating to the acquisition of Local World (prior period matter) and the presentation of advertising revenue the risks identified below are the same risks as identified in the prior period.
The description of risks on pages 14 to 16 should be read in conjunction with the significant issues considered by the Audit & Risk Committee, discussed on pages 41 and 42.
These matters were addressed in the context of our audit of the financial statements as a whole, and in forming our opinion thereon, and we do not provide a separate opinion on these matters.
Strategic Report Governance Financial Statements
Trinity Mirror plc Annual Report 2016 73
Independent auditor’s report to the members of Trinity Mirror plc continued
Carrying value of fixed assetsRisk description How the scope of our audit responded to the risk
The assessment of the carrying value of goodwill and other intangible assets (£901.5 million) in the consolidated balance sheet and fixed asset investments (£811.8 million) in the parent company balance sheet
The assessment of the carrying value of goodwill and intangible assets such as the Group’s publishing rights and titles, as described in notes 14 and 15 to the consolidated financial statements, involves considerable judgement due to the challenges in accurately forecasting future cash flows given the uncertain market environment for publishers.
Key assumptions in management’s analysis include:
· the identification of appropriate cash-generating units (CGUs). There are two principal CGU’s (2015 – 3): Nationals and Regionals and there was a change this year to reflect the integration of the Local World business with the existing Trinity Mirror regionals business;
· a detailed future cash flow forecast derived from the 2017 budget and associated 2 year projections. This assumes declines in publishing revenue at or near historical experience, increases in digital revenue based on recent trends and industry estimates and ongoing cost saving activities;
· the long-term growth rates applied to these cash flows of 0% (2015: 0%); and
· the post-tax discount rate of 10% (2015: 11%) applied to the future cash flows.
Similar judgement is required in assessing the carrying value of investments in Trinity Mirror plc (note 4 to the parent company financial statements).
We tested management’s assumptions used in their impairment assessment of the Group’s goodwill and other intangible assets in the consolidated balance sheet and the carrying value of investments in the parent company balance sheet. Our procedures included:
· considering the identification of appropriate cash-generating units, factoring in appropriate evidence such as the relative importance of national advertising and revenues generated from regionally sold packages, centrally co-ordinated distribution arrangements as well as the current management structure and reporting;
· challenging management’s assessment of future operating cash flows with reference to historical evidence, industry and other external data;
· performing a detailed review of management’s model, including looking at reasonably possible sensitivities to highlight what would happen if it proved harder than expected to meet the targets set out, and reporting the results of these sensitivities to those charged with governance;
· comparing the long-term forecasts against historical performance, long-term economic and industry growth rates from external data; and
· comparing the discount rate applied against a broad comparator group as well as consulting with our internal valuation specialists to assess the key components of the discount rate calculation.
In addition, we evaluated the appropriateness of the “reasonable possible change” and other disclosures included in notes 14 and 15 to the consolidated financial statements by reference to the audit procedures outlined above.
Key observationsAs described in note 15 to the consolidated financial statements, the impairment review is sensitive to reasonably possible changes and although headroom exists, it would reduce and an impairment may be required if for example, the sensitivities combined e.g. a combination of a 1% increase in discount rate and a 2% increase in long-term declining growth rate. We noted that the headroom of value in use over carrying value increased for the Nationals CGU, but reduced for the Regionals CGU year on year as a result of the movement in the key assumptions, including the discount rate.
From our procedures performed we conclude that the assumptions applied by management were appropriate, although we did make the following further key observations:
· Cash Generating Units - We believe the change is reasonable and is supported by the evidence such as the level of integration, the revised management structure and the way revenue is generated from national and regional campaigns.
· Operating cash flows - The 5 year Group summary on page 121 of the Annual Report highlights the fact that between 2012 and 2015 (i.e. before Local World), adjusted operating profits were stable between £106 million and £110 million, whilst revenues declined by £114 million to £593m over the same period. Management’s ability to mitigate revenue declines and achieve cost saving targets is also evident from this year’s results.
· Discount rate - The post-tax discount rate of 10% (2015: 11%) is within the range of a broad comparator group, is calculated on a consistent basis in both years and the rate used is within the range of rates calculated by our internal specialists, albeit at the lower end of our range and is in line with industry peers.
Provision arising from historical legal issuesRisk description How the scope of our audit responded to the risk
The assessment of the provision arising from historical legal issues
The Group faces a number of civil claims in relation to suspected phone hacking arising in the past.
As this matter has developed the consideration of the latest information, such as new claims or experience from settling claims, has led to a reappraisal of the amounts provided.
During the period, management reconsidered the sufficiency of the provision held and an additional £11.5 million has been charged to the consolidated income statement for dealing with and resolving these civil claims. The outstanding provision of £18.1 million held at 1 January 2017 is disclosed within the provisions note (note 22) to the consolidated financial statements.
This is recognised as a key source of estimation uncertainty and a contingent liability in notes 3 and 39 to the consolidated financial statements respectively.
The audit procedures we performed in respect of this risk included;
· meetings with management, internal legal counsel and those charged with governance to enquire whether they have knowledge of any actual or possible non-compliance with laws and regulations that could have a material effect on the financial statements;
· assessing the responses received through the process of reviewing relevant supporting documentation;
· understanding and observing in practice the actions that management has taken in response to this risk;
· examining relevant correspondence received by the Group; and · evaluating the provision recognised in the consolidated balance
sheet and the appropriateness of the related disclosures included in notes 3, 22 and 39 to the consolidated financial statements by reference to the audit procedures outlined above.
Key observationsWith over 80% of damages settled, we determine that there is sufficient evidence to support the basis for management’s best estimate and the principal reason for the increase is the notable increase in the amount required to settle claimant’s costs based on more up to date experience.
However, whilst from our procedures performed we concur that the overall provision recognised by management is appropriate, we support the additional contingent liability disclosure as there continues to be uncertainty as to how outstanding matters will progress and be resolved.

Financial Statements
Trinity Mirror plc Annual Report 201674
Independent auditor’s report to the members of Trinity Mirror plc continued
Retirement benefitsRisk description How the scope of our audit responded to the risk
Accounting for retirement benefit obligations – the valuation of the obligations and related actuarial assumptions
The net pension deficit (pre deferred tax) on the consolidated balance sheet is £466.0 million and the gross liability in note 33 to the consolidated financial statements is £2,127.6 million. There is significant judgement involved in the valuation of the retirement benefit obligations, particularly in relation to determining the assumptions, including discount rate, inflation rates and mortality assumptions (disclosed in note 33 to the consolidated financial statements) underlying the valuation of the liabilities of the schemes.
Management include this as a key source of estimation uncertainty in note 3 to the consolidated financial statements.
The audit procedures we performed in respect of this risk included:
· meeting with the Group’s actuary and management to discuss the valuation approach used and the assumptions used in the valuation; and
· consulting with our actuarial specialists to consider and assess the actuarial assumptions adopted by the Group for the valuation of its retirement benefit obligations. This includes benchmarking the assumptions against a relevant comparator group.
Key observationsFrom our procedures performed we are satisfied that all assumption applied by the Group in respect to the valuation of scheme liabilities are appropriate. The group’s assumptions fall within the middle of our expected range based on a relevant comparator group.
As shown in note 33 to the consolidated financial statements, the Group’s pension deficit is sensitive to changes in long term interest rate expectations and inflation. The discount rate used in the calculation has fallen by 1.0 percentage points to 2.65% from the 2015 year end and the inflation rate (RPI) has increased by 0.15 percentage points to 3.20% and it is these two changes that largely cause the £160.8 million increase in the deficit.
Our application of materialityWe define materiality as the magnitude of misstatement in the financial statements that makes it probable that the economic decisions of a reasonably knowledgeable person would be changed or influenced. We use materiality both in planning the scope of our audit work and in evaluating the results of our work.
Based in our professional judgement, we determined materiality for the Group to be £5.3 million (2015: £4.1 million), which equates to 4.5% (2015: 4.7%) of profit before tax, adjusted for non-recurring items, IAS 39 interest charges and IAS 19 pension expenses. The method used to determine materiality, including the adjustments made, is consistent with 2015. It is also below 1% (2015: 1%) of both revenue and equity and equates to 6.9% (2015: 6.1 %) of statutory profit before tax.
We agreed with the Audit & Risk Committee that we would report to the Committee all audit differences in excess of £200,000 (2015: £200,000), as well as differences below that threshold that, in our view, warranted reporting on qualitative grounds. We also report to the Committee on disclosure matters that we identified when assessing the overall presentation of the financial statements.
An overview of the scope of our auditOur Group audit was scoped by obtaining an understanding of the Group and its environment, including Group-wide controls, and assessing the risks of material misstatement at the Group level.
Our Group audit scope focused on all active entities of the Group, which account for all of the Group’s revenue and profit before tax and all of the Group’s total assets. Our audit work at all audit locations was executed at a local component materiality level determined by reference to the scale of the business concerned, with all entities using materiality lower than Group materiality. At the Parent Company level we also tested the consolidation process.
The Group audit team continued to follow a programme of planned visits that has been designed so that the Senior Statutory Auditor or a senior member of the Group audit team visits each of the principal locations where the Group audit scope is performed each period to understand the key issues and audit findings at these locations, attend the component close meetings and review formal reporting from the component auditors. The Senior Statutory Auditor or a senior member of the audit team visited all significant components and met with senior management of all locations as part of the audit process.
Opinion on other matters prescribed by the Companies Act 2006In our opinion, based on the work undertaken in the course of the audit:
· the part of the Directors’ Remuneration Report to be audited has been properly prepared in accordance with the Companies Act 2006; · the information given in the Strategic Report and the Directors’ Report for the financial period for which the financial statements are prepared is
consistent with the financial statements; and · the Strategic Report and the Directors’ Report have been prepared in accordance with the applicable legal requirements.
In the light of the knowledge and understanding of the Group and its environment obtained in the course of the audit, we have not identified any material misstatements in the Strategic Report and the Directors’ Report.

Strategic Report Governance Financial Statements
Trinity Mirror plc Annual Report 2016 75
Independent auditor’s report to the members of Trinity Mirror plc continued
Matters on which we are required to report by exceptionAdequacy of explanations received and accounting records
Under the Companies Act 2006 we are required to report to you if, in our opinion:
· we have not received all the information and explanations we require for our audit; or · adequate accounting records have not been kept by the Parent Company, or returns adequate for our audit have not been received from branches
not visited by us; or · the Parent Company financial statements are not in agreement with the accounting records and returns.
We have nothing to report in respect of these matters.
Directors’ remuneration
Under the Companies Act 2006 we are also required to report if in our opinion certain disclosures of directors’ remuneration have not been made or the part of the Remuneration Report to be audited is not in agreement with the accounting records and returns. We have nothing to report arising from these matters.
Corporate Governance Statement
Under the Listing Rules we are also required to review part of the Corporate Governance Statement relating to the Company’s compliance with certain provisions of the UK Corporate Governance Code. We have nothing to report arising from our review.
Our duty to read other information in the Annual Report
Under International Standards on Auditing (UK and Ireland), we are required to report to you if, in our opinion, information in the Annual Report is:
· materially inconsistent with the information in the audited financial statements; or · apparently materially incorrect based on, or materially inconsistent with, our knowledge of the Group acquired in the course of performing our audit; or · otherwise misleading.
In particular, we are required to consider whether we have identified any inconsistencies between our knowledge acquired during the audit and the directors’ statement that they consider the Annual Report is fair, balanced and understandable and whether the Annual Report appropriately discloses those matters that we communicated to the Audit & Risk Committee which we consider should have been disclosed. We confirm that we have not identified any such inconsistencies or misleading statements.
Respective responsibilities of directors and auditorAs explained more fully in the Directors’ Responsibilities Statement, the directors are responsible for the preparation of the financial statements and for being satisfied that they give a true and fair view. Our responsibility is to audit and express an opinion on the financial statements in accordance with applicable law and International Standards on Auditing (UK and Ireland). We also comply with International Standard on Quality Control 1 (UK and Ireland). Our audit methodology and tools aim to ensure that our quality control procedures are effective, understood and applied. Our quality controls and systems include our dedicated professional standards review team and independent partner reviews.
This report is made solely to the Company’s members, as a body, in accordance with Chapter 3 of Part 16 of the Companies Act 2006. Our audit work has been undertaken so that we might state to the Company’s members those matters we are required to state to them in an auditor’s report and for no other purpose. To the fullest extent permitted by law, we do not accept or assume responsibility to anyone other than the Company and the Company’s members as a body, for our audit work, for this report, or for the opinions we have formed.
Scope of the audit of the financial statementsAn audit involves obtaining evidence about the amounts and disclosures in the financial statements sufficient to give reasonable assurance that the financial statements are free from material misstatement, whether caused by fraud or error. This includes an assessment of: whether the accounting policies are appropriate to the Group’s and the Parent Company’s circumstances and have been consistently applied and adequately disclosed; the reasonableness of significant accounting estimates made by the directors; and the overall presentation of the financial statements. In addition, we read all the financial and non-financial information in the Annual Report to identify material inconsistencies with the audited financial statements and to identify any information that is apparently materially incorrect based on, or materially inconsistent with, the knowledge acquired by us in the course of performing the audit. If we become aware of any apparent material misstatements or inconsistencies we consider the implications for our report.
Mark Lee-Amies FCA (Senior Statutory Auditor)for and on behalf of Deloitte LLP Chartered Accountants and Statutory Auditor London, UK 27 February 2017

Financial Statements
Trinity Mirror plc Annual Report 201676
Consolidated income statementfor the 53 weeks ended 1 January 2017 (52 weeks ended 27 December 2015)
notes2016
£m2015
£m
Revenue 4,5 713.0 592.7
Cost of sales (342.1) (300.3)
Gross profit 370.9 292.4
Distribution costs (76.0) (67.2)
Administrative expenses:
Non-recurring items 8 (26.0) (4.4)
Restructuring charges in respect of cost reduction measures (15.1) (15.3)
Amortisation of intangible assets 15 (0.3) (1.8)
Pension administrative expenses 33 (2.2) (2.1)
Other administrative expenses (158.5) (121.6)
Share of results of associates: 17
Results before non-recurring items and amortisation 1.1 6.0
Non-recurring items (0.1) (1.3)
Amortisation of intangible assets (0.3) (2.5)
Operating profit 93.5 82.2
Investment revenues 9 0.6 0.6
Pension finance charge 33 (10.4) (10.9)
Finance costs 10 (7.2) (4.7)
Profit before tax 76.5 67.2
Tax (charge)/credit 11 (7.0) 9.8
Profit for the period attributable to equity holders of the parent 69.5 77.0
Statutory earnings per share2016
Pence2015
Pence
Earnings per share – basic 13 24.9 30.2
Earnings per share – diluted 13 24.8 29.6
Adjusted* earnings per share2016
Pence2015
Pence
Earnings per share – basic 13 38.1 33.9
Earnings per share – diluted 13 37.8 33.2
* Adjusted items relate to the exclusion of non-recurring items, restructuring charges in respect of cost reduction measures, the amortisation of intangible assets, the pension administrative expenses, the retranslation of foreign currency borrowings, the impact of fair value changes on derivative financial instruments, the pension finance charge and the impact of tax legislation changes. Set out in note 38 is the reconciliation between the statutory results and the adjusted results.
notes2016
£m2015
£m
Profit for the period 69.5 77.0
Items that will not be reclassified to profit and loss:
Actuarial losses on defined benefit pension schemes 33 (188.9) (11.0)
Tax on actuarial losses on defined benefit pension schemes 11 32.1 2.2
Deferred tax charge resulting from the future change in tax rate 11 (0.6) (6.0)
Share of items recognised by associates 17 1.1 (3.2)
Other comprehensive costs for the period (156.3) (18.0)
Total comprehensive (costs)/income for the period (86.8) 59.0
Consolidated statement of comprehensive incomefor the 53 weeks ended 1 January 2017 (52 weeks ended 27 December 2015)

Strategic Report Governance Financial Statements
Trinity Mirror plc Annual Report 2016 77
Consolidated cash flow statementfor the 53 weeks ended 1 January 2017 (52 weeks ended 27 December 2015)
Consolidated statement of changes in equityfor the 53 weeks ended 1 January 2017 (52 weeks ended 27 December 2015)
notes2016
£m2015
£m
Cash flows from operating activities
Cash generated from operations 24 91.5 62.6
Income tax paid (12.2) (9.7)
Net cash inflow from operating activities 79.3 52.9
Investing activities
Interest received 0.6 0.6
Dividends received from associates 17 – 16.3
Proceeds on disposal of subsidiary undertaking 36 1.8 –
Proceeds on disposal of property, plant and equipment 10.6 –
Purchases of property, plant and equipment (4.3) (3.6)
Acquisition of associate undertaking 37 (0.8) –
Acquisition of subsidiary undertaking – (148.2)
Net debt acquired on acquisition of subsidiary undertaking – (11.9)
Net cash received from/(used in) investing activities 7.9 (146.8)
Financing activities
Dividends paid 12 (14.6) (12.5)
Interest paid on borrowings (5.9) (1.7)
(Repayment of)/increase in borrowings (80.0) 80.0
Issue of ordinary share capital – 34.5
Purchase of own shares (2.3) –
Purchase of shares for LTIP (2.0) –
Net cash (used in)/received from financing activities (104.8) 100.3
Net (decrease)/increase in cash and cash equivalents (17.6) 6.4
Cash and cash equivalents at the beginning of the period 19 55.4 49.0
Cash and cash equivalents at the end of the period 19 37.8 55.4
Share capital
£m
Share premium account
£m
Merger reserve
£m
Capital redemption
reserve£m
Retained earnings and
other reserves£m
Total£m
At 28 December 2014 (25.8) (606.7) – (4.4) 42.0 (594.9)
Profit for the period – – – – (77.0) (77.0)
Other comprehensive costs for the period – – – – 18.0 18.0
Total comprehensive income for the period – – – – (59.0) (59.0)
Issue of shares (2.5) – (37.9) – – (40.4)
Credit to equity for equity-settled share-based payments – – – – (1.8) (1.8)
Dividends paid – – – – 12.5 12.5
At 27 December 2015 (28.3) (606.7) (37.9) (4.4) (6.3) (683.6)
Profit for the period – – – – (69.5) (69.5)
Other comprehensive costs for the period – – – – 156.3 156.3
Total comprehensive costs for the period – – – – 86.8 86.8
Credit to equity for equity-settled share-based payments – – – – (1.5) (1.5)
Purchase of shares for LTIP – – – – 2.0 2.0
Purchase of own shares – – – – 2.3 2.3
Dividends paid – – – – 14.6 14.6
At 1 January 2017 (28.3) (606.7) (37.9) (4.4) 97.9 (579.4)
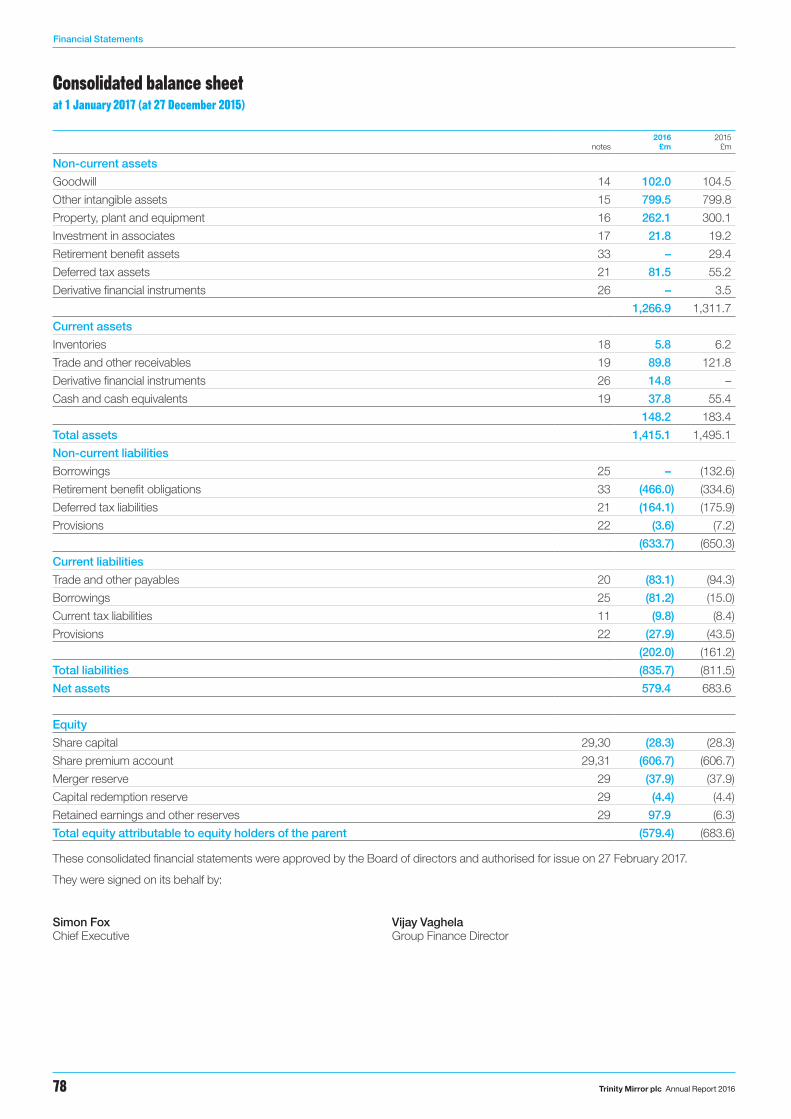
Financial Statements
Trinity Mirror plc Annual Report 201678
Consolidated balance sheetat 1 January 2017 (at 27 December 2015)
notes2016
£m2015
£m
Non-current assets
Goodwill 14 102.0 104.5
Other intangible assets 15 799.5 799.8
Property, plant and equipment 16 262.1 300.1
Investment in associates 17 21.8 19.2
Retirement benefit assets 33 – 29.4
Deferred tax assets 21 81.5 55.2
Derivative financial instruments 26 – 3.5
1,266.9 1,311.7
Current assets
Inventories 18 5.8 6.2
Trade and other receivables 19 89.8 121.8
Derivative financial instruments 26 14.8 –
Cash and cash equivalents 19 37.8 55.4
148.2 183.4
Total assets 1,415.1 1,495.1
Non-current liabilities
Borrowings 25 – (132.6)
Retirement benefit obligations 33 (466.0) (334.6)
Deferred tax liabilities 21 (164.1) (175.9)
Provisions 22 (3.6) (7.2)
(633.7) (650.3)
Current liabilities
Trade and other payables 20 (83.1) (94.3)
Borrowings 25 (81.2) (15.0)
Current tax liabilities 11 (9.8) (8.4)
Provisions 22 (27.9) (43.5)
(202.0) (161.2)
Total liabilities (835.7) (811.5)
Net assets 579.4 683.6
Equity
Share capital 29,30 (28.3) (28.3)
Share premium account 29,31 (606.7) (606.7)
Merger reserve 29 (37.9) (37.9)
Capital redemption reserve 29 (4.4) (4.4)
Retained earnings and other reserves 29 97.9 (6.3)
Total equity attributable to equity holders of the parent (579.4) (683.6)
These consolidated financial statements were approved by the Board of directors and authorised for issue on 27 February 2017.
They were signed on its behalf by:
Simon Fox Vijay VaghelaChief Executive Group Finance Director

Strategic Report Governance Financial Statements
Trinity Mirror plc Annual Report 2016 79
Notes to the consolidated financial statementsfor the 53 weeks ended 1 January 2017 (52 weeks ended 27 December 2015)
1 General informationTrinity Mirror plc is a company incorporated in England and Wales and listed on the London Stock Exchange. The Company’s registered number is 82548. The address of the registered office is One Canada Square, Canary Wharf, London E14 5AP. The principal activities of the Group are discussed in the Strategic Report on pages 2 to 30.
These consolidated financial statements were approved for issue by the Board of directors on 27 February 2017. The 2016 Annual Report will be available on the Company’s website at www.trinitymirror.com and at the Company’s registered office at One Canada Square, Canary Wharf, London E14 5AP on 27 February 2017 and will be sent to shareholders who have elected to receive a hard copy by the end of March 2017.
2 Adoption of new and revised standardsChanges in accounting policy Annual Improvements 2010-2012 cycle and 2011-2013 cycle have been implemented and had no material impact on the Group.
The following standards, which have not been applied and when adopted are not expected to have a material impact on the Group, were in issue and will be effective for periods beginning on are after 1 January 2016 unless stated below:
− IFRS 10 (Amended)’Consolidated Financial Statements’
− IFRS 11 (Amended) ‘Joint Arrangements’
− IFRS 12 (Amended) ‘Disclosure of Interests in Other Entities’
− IAS 1 (Amended) ‘Presentation of Financial Statements’
− IAS 16 (Amended) ‘Property, Plant and Equipment’
− IAS 27 (Amended) ‘Separate Financial Statements’
− IAS 28 (Amended) ‘Investments in Associated and Joint Ventures’
− IAS 38 (Amended) ‘Intangible Assets’
− Annual improvements 2012 – 2014 cycle
− IAS 7 (Amended) ‘Statement of Cash Flows’ - effective for periods beginning on or after 1 January 2017*
− IAS 12 (Amended) ‘Income taxes’ – effective for periods beginning on or after 1 January 2017*
− IFRS 2 (Amended) ‘Share-based Payment’ - effective for periods beginning on or after 1 January 2018*
− IFRS 9 (Amended) ‘Financial Instruments’ - effective for periods beginning on or after 1 January 2018
− IAS 40 (Amended) ‘Investment Property’ - effective for periods beginning on or after 1 January 2018*
− Annual improvements 2014 – 2016 cycle - effective for periods beginning on or after 1 January 2018*
* Not yet endorsed for use in the EU
The following new standards which have not been applied and for which the impact on the Group is being assessed:
− IFRS 15 (Issued)’Revenue from Contracts with Customers’ – effective for periods beginning on or after 1 January 2018
− IFRS 16 (Issued) ‘Leases’ – effective for periods beginning on or after 1 January 2019
3 Accounting policies International Financial Reporting Standards (IFRS)The Group has adopted standards and interpretations issued by the International Accounting Standards Board (IASB) and the International Financial Reporting Interpretations Committee (IFRIC) of the IASB that are relevant to its operations as adopted by the European Union (EU). Individual standards and interpretations have to be adopted by the EU and the process leads to a delay between the issue and adoption of new standards and interpretations and in some cases amendments by the EU.
The parent company financial statements of Trinity Mirror plc for the 53 weeks ended 1 January 2017, prepared in accordance with applicable law and United Kingdom Accounting Standards, are presented on pages 112 to 116.
Basis of preparation These consolidated financial statements have been prepared on a going concern basis as set out in the Corporate Governance Report on pages 37 and 38.
For administrative convenience, the consolidated financial statements are made up to a suitable date near the end of the calendar year. These consolidated financial statements have been prepared for the 53 weeks ended 1 January 2017 and the comparative period has been prepared for the 52 weeks ended 27 December 2015.
The principal accounting policies adopted in the preparation of these consolidated financial statements are set out below. These policies have been consistently applied to all years presented.
Basis of accountingThese consolidated financial statements have been prepared in accordance with IFRS standards and IFRIC interpretations as adopted by the EU and with those parts of the Companies Act 2006 applicable to groups reporting under IFRS. The consolidated financial statements have been prepared under the historical cost convention as modified by the revaluation of freehold properties which on transition to IFRS were deemed to be the cost of the asset and for derivative financial instruments and shared-based payments that have been measured at fair value. A summary of the more important Group accounting policies is set out on page 80 to 83.

Financial Statements
Trinity Mirror plc Annual Report 201680
Notes to the consolidated financial statements continuedfor the 53 weeks ended 1 January 2017 (52 weeks ended 27 December 2015)
3 Accounting policies continuedBasis of consolidationThe consolidated financial statements incorporate the financial statements of Trinity Mirror plc and all entities controlled by it for the 53 weeks ended 1 January 2017. Control is achieved where the Company has the power to govern the financial and operating policies of the investee entity, has the rights to variable returns from its involvement with the investee and has the ability to use its power to affect its returns. All intra-Group transactions, balances, income and expenses are eliminated on consolidation.
On the acquisition of a business, including an interest in an associated undertaking or a joint venture, fair values are attributed to the Group’s share of the identifiable assets and liabilities of the business existing at the date of acquisition and reflecting the conditions as at that date. Where necessary, adjustments are made to the financial statements of businesses acquired to bring their accounting policies in line with those used in the preparation of the consolidated financial statements. Results of businesses are included in the consolidated income statement from the effective date of acquisition and in respect of disposals up to the effective date of relinquishing control.
Business combinationsAcquisitions of subsidiaries and businesses are accounted for using the acquisition method. The consideration for each acquisition is measured at the aggregate of the fair value at the acquisition date of assets given, liabilities incurred or assumed and equity instruments issued by the Group in exchange for control of the acquiree. Acquisition-related costs are recognised in the profit or loss account as incurred.
Where applicable, the consideration for the acquisition includes any asset or liability resulting from a contingent consideration arrangement, measured at its acquisition date fair value. Subsequent changes in such fair values are adjusted against the cost of acquisition where they qualify as measurement period adjustments. All other subsequent changes in fair value of contingent consideration classified as an asset or liability are accounted for in accordance with the relevant IFRS. Changes in the fair value of contingent consideration classified as equity are not recognised.
GoodwillGoodwill arising on the acquisition of an entity represents the excess of the cost of acquisition over the Group’s interest in the fair value of the identifiable assets and liabilities of the entity recognised at the date of acquisition. Goodwill is initially recognised as an asset at cost and is subsequently measured at cost less any accumulated impairment losses. Negative goodwill arising on an acquisition is recognised directly in the consolidated income statement upon acquisition. On disposal of a subsidiary or associate, the remaining amount of goodwill is included in the determination of the profit or loss on disposal.
Goodwill is reviewed for impairment either annually or more frequently if events or changes in circumstances indicate a possible decline in the carrying value. For the purpose of impairment testing, assets are grouped at the lowest levels for which there are separately identifiable cash flows, known as cash-generating units. If the recoverable amount of the cash-generating unit is less than the carrying amount of the unit, the impairment loss is allocated first to reduce the carrying amount of any goodwill allocated to the unit and then to the other assets of the unit, pro-rated on the basis of the carrying amount of each asset in the unit, but subject to not reducing any asset below its recoverable amount. An impairment loss recognised for goodwill is not reversed in a subsequent period.
Other intangible assetsOther intangible assets comprise acquired publishing rights and titles in respect of print publishing activities and other intangible assets in respect of online activities. On acquisition, the fair value of other intangible assets is calculated based on forecast discounted cash flows. On disposal of an entity, the carrying amount of the related intangible asset is de-recognised and the gain or loss arising from de-recognition, determined as the difference between the net disposal proceeds, if any, and the carrying amount of the item, is recognised in the consolidated income statement.
Publishing rights and titles are initially recognised as an asset at fair value with an indefinite economic life. They are not subject to amortisation. For the purpose of impairment testing, assets are grouped at the lowest levels for which there are separately identifiable cash flows, known as cash-generating units. Where the asset does not generate cash flows that are independent from other assets, value in use estimates are made based on the cash flows of the cash-generating unit to which the asset belongs. The publishing rights and titles are reviewed for impairment either at each reporting date or more frequently when there is an indication that the recoverable amount is less than the carrying amount. Recoverable amount is the higher of fair value less costs to sell and value in use.
In assessing value in use the estimated future cash flows of the cash-generating unit relating to the asset are discounted to their present value using a post-tax discount rate that reflects current market assessments of the time value of money and risks specific to the asset for which estimates of future cash flows have not been adjusted. If the recoverable amount of a cash-generating unit is estimated to be less than its carrying amount, the carrying value of the cash-generating unit is reduced to its recoverable amount. An impairment loss is recognised in the consolidated income statement in the period in which it occurs and may be reversed in subsequent periods.
Other intangible assets in respect of online activities are amortised using the straight-line method over the expected life over which those assets will generate revenues and profits for the Group and are tested for impairment at each reporting date or more frequently where there is an indication that the recoverable amount is less than the carrying amount.
Costs incurred in the development and maintenance of websites are only capitalised if the criteria specified in IAS 38 are met.
Strategic Report Governance Financial Statements
Trinity Mirror plc Annual Report 2016 81
Notes to the consolidated financial statements continuedfor the 53 weeks ended 1 January 2017 (52 weeks ended 27 December 2015)
3 Accounting policies continuedInvestment in associatesAssociates are all entities over which the Group has significant influence but not control and are accounted for by the equity method of accounting, initially recognised at cost. The Group’s share of associates post-acquisition profits or losses after tax is recognised in the consolidated income statement and its share of other comprehensive income are recognised in the consolidated statement of comprehensive income.
Revenue recognitionRevenue is measured at the fair value of the consideration received, net of applicable discounts and value added tax. Advertising revenue is recognised upon publication. Circulation revenue is recognised at the time of sale. Printing revenue is recognised when the service is provided. Digital revenue is recognised over the period of the online campaign. Other revenue including leaflets and events revenue is recognised at the time of sale or provision of service. Rentals receivable under operating leases are credited to the consolidated income statement on a straight-line basis over the lease term. Interest income from bank deposits is recognised on an accruals basis. Dividend income from investments is recognised when the shareholders’ rights to receive payment have been established.
LeasesLeases are classified as finance leases whenever the terms of the lease transfer substantially all the risks and rewards of ownership to the Group. All other leases are classified as operating leases. Assets held under finance leases are recognised at their fair value at the inception of the lease or, if lower, the present value of the minimum lease payments. The asset is recognised within property, plant and equipment and the corresponding liability to the lessor is included within obligations under finance leases. Lease payments are apportioned between finance charges which are charged to the consolidated income statement and reductions in the lease obligation. Rentals payable under operating leases are charged to the consolidated income statement on a straight-line basis over the lease term. Benefits received as incentives to enter into the agreement are spread on a straight-line basis over the lease term.
Foreign currencyTransactions denominated in foreign currencies are translated at the rates of exchange prevailing on the date of the transactions. At each reporting date, items denominated in foreign currencies are retranslated at the rates prevailing on the reporting date. Exchange differences arising on settlement and on retranslation are included in the consolidated income statement for the period.
Retirement benefitsThe Group operates a number of defined benefit pension schemes, all of which have been set up under trusts that hold their financial assets independently from those of the Group and are controlled by trustees. The amount recognised in the balance sheet in respect of defined benefit pension schemes is the present value of the defined benefit obligation at the reporting date less the fair value of scheme assets, together with adjustments for unrecognised actuarial gains or losses and past service costs. The resultant liability or asset of each scheme is included in non-current liabilities or non-current assets as appropriate. Any surplus recognised is limited to the present value of any economic benefits available in the form of refunds from the plans or reductions in future contributions. The defined benefit obligation is calculated at each reporting date by independent actuaries using the projected unit credit method. The present value of the defined benefit obligation is determined by discounting the estimated future cash outflows using interest rates of high quality corporate bonds approximating to the terms of the related pension liability.
The Group operates two defined contribution pension schemes which have been set up under a trust that holds the financial assets independently from those of the Group and is controlled by Trustees. Payments to defined contribution pension schemes are charged as an expense as they fall due.
TaxThe tax expense represents the sum of the corporation tax currently payable and deferred tax.
The corporation tax currently payable is based on taxable profit for the period. Taxable profit differs from profit before tax as reported in the consolidated income statement because it excludes items of income or expense that are taxable or deductible in other years and it further excludes items that are never taxable or deductible. The Group’s liability for tax is calculated using tax rates that have been enacted or substantively enacted by the reporting date.
Deferred tax is the tax expected to be payable or recoverable on differences between the carrying amounts of assets and liabilities in the consolidated financial statements and the corresponding tax bases used in the computation of taxable profit and is accounted for using the balance sheet liability method. Deferred tax is calculated at the tax rates that are expected to apply in the period when the liability is settled or the asset is realised. Deferred tax is charged or credited in the consolidated income statement except when it relates to items charged or credited in the consolidated statement of comprehensive income or items charged or credited directly to equity in which case the deferred tax is also dealt with in the consolidated statement of comprehensive income and equity respectively.
Deferred tax liabilities are generally recognised for all taxable temporary differences and deferred tax assets are recognised to the extent that it is probable that taxable profits will be available against which deductible temporary differences can be utilised. Deferred tax liabilities are recognised for taxable temporary differences arising on investments in subsidiaries and associates, except where the Group is able to control the reversal of the temporary difference and it is probable that the temporary difference will not reverse in the foreseeable future. The carrying amount of deferred tax assets is reviewed at each reporting date and reduced to the extent that it is no longer probable that sufficient taxable profits will be available to allow all or part of the asset to be recovered.

Financial Statements
Trinity Mirror plc Annual Report 201682
Notes to the consolidated financial statements continuedfor the 53 weeks ended 1 January 2017 (52 weeks ended 27 December 2015)
3 Accounting policies continuedProperty, plant and equipmentProperty, plant and equipment are stated in the consolidated balance sheet at cost less accumulated depreciation and impairment losses. Cost includes the purchase price and all directly attributable costs of bringing the asset to its location and condition necessary to operate as intended.
Depreciation is charged so as to write-off the cost, other than freehold land and assets under construction which are not depreciated, using the straight-line method over the estimated useful lives of buildings (15–67 years) and plant and machinery (3–25 years). Assets in the course of construction are carried at cost, less any recognised impairment loss. Depreciation commences when the assets are ready for their intended use.
Assets held under finance leases are depreciated over their expected useful lives on the same basis as owned assets or, where shorter, over the term of the relevant lease.
The gain or loss arising on the disposal or retirement of an asset is determined as the difference between the sale proceeds and the carrying amount of the asset and is recognised in the consolidated income statement.
InventoriesInventories are stated at the lower of cost and net realisable value. Cost is calculated using the first in first out method.
Financial instrumentsFinancial assets and financial liabilities are recognised in the consolidated balance sheet when the Group becomes a party to the contractual provisions of the instrument.
Trade receivablesTrade receivables do not carry any interest. Conversion to a readily known amount of cash occurs over a short period and is subject to an insignificant risk of changes in value. Therefore balances are stated at their nominal value as reduced by appropriate allowances for estimated irrecoverable amounts.
Cash and cash equivalentsCash and cash equivalents comprise cash in hand and demand deposits.
BorrowingsSterling interest bearing loans and bank overdrafts are recorded at the proceeds received, net of direct issue costs. Foreign currency interest bearing loans are recorded at the exchange rate at the reporting date. Finance charges, including premiums payable on settlement or redemption and direct issue costs, are accounted for on an accruals basis in the consolidated income statement using the effective interest method and are added to the carrying amount of the instrument to the extent that they are not settled in the period in which they arise. All other borrowing costs are recognised in the consolidated income statement in the period in which they are incurred.
Derivative financial instrumentsThe Group uses derivative financial instruments, including currency swaps, cross-currency interest rate swaps, interest rate swaps and other hedging instruments to minimise exposure to the financial risks of changes in foreign currency exchange rates and interest rates. The Group does not use derivative financial instruments for speculative purposes. The Group has elected not to apply hedge accounting.
Derivative financial instruments are separately recognised at fair value in the consolidated financial statements. Changes in the fair value of derivative financial instruments are recognised immediately in the consolidated income statement.
Derivatives embedded in commercial contracts are treated as separate derivatives when their risks and characteristics are not closely related to those of the underlying contract, with unrealised gains or losses reported in the consolidated income statement.
Trade payablesTrade payables are not interest bearing. Payments occur over a short period and are subject to an insignificant risk of changes in value. Therefore balances are stated at their nominal value.
Credit riskThe Group’s credit risk is primarily attributable to its trade receivables. The amounts presented in the consolidated balance sheet are net of allowances for doubtful receivables, estimated based on prior experience and assessment of the current economic environment.
The credit risk on liquid funds and derivative financial instruments is limited because the counterparties are banks with high credit ratings assigned by international credit-rating agencies. The Group has no significant concentration of credit risk, with exposure spread over a large number of counterparties and customers.
ProvisionsProvisions are recognised when the Group has a present obligation as a result of a past event, and it is probable that the Group will be required to settle that obligation. Provisions are measured at the directors’ best estimate of the expenditure required to settle the obligation at the reporting date, and are discounted to present value where the effect is material. Provisions are made for legal and other costs in respect of historical litigation and other matters in progress and for estimated damages where it is judged probable that damages will be payable.
Share-based paymentsThe Group issues equity-settled benefits to certain employees. These equity-settled share-based payments are measured at fair value at the date of grant taking advice from third party experts. The fair value determined at the grant date is expensed on a straight-line basis over the vesting period, based on the Group’s estimate of shares that will eventually vest and adjusted for the effect of non-market based vesting conditions.

Strategic Report Governance Financial Statements
Trinity Mirror plc Annual Report 2016 83
Notes to the consolidated financial statements continuedfor the 53 weeks ended 1 January 2017 (52 weeks ended 27 December 2015)
3 Accounting policies continuedShare-based payments continuedFair value is measured by use of a stochastic (Monte-Carlo binomial) model or a modified Black-Scholes calculation. The expected life used in the model has been adjusted, based on the directors’ best estimates, for the effects of non-transferability, exercise restrictions, and behavioural considerations.
Share capitalOrdinary shares are classified as equity. Incremental costs directly attributable to the issue of new shares or options are shown in equity as a deduction from the proceeds, net of tax.
Where the Group’s own shares are purchased, the consideration paid including any directly attributable incremental costs, net of income taxes, is deducted from equity attributable to the Group’s equity holders until the shares are cancelled, reissued or disposed of. Where such shares are cancelled, the nominal value of shares cancelled is shown in the capital redemption reserve. Where such shares are subsequently reissued or disposed of, any consideration received, net of any directly attributable incremental transaction costs and the related income tax effects, is included in equity attributable to the Group’s equity holders.
Dividend distributionsDividend distributions to the Company’s shareholders are recognised as a liability in the consolidated financial statements in the period in which the dividends are approved.
Non-recurring itemsItems which are deemed to be non-recurring by virtue of their nature or size are included under the statutory classification appropriate to their nature but are separately disclosed on the face of the consolidated income statement to assist in understanding the financial performance of the Group.
Key sources of estimation uncertaintyThe key assumptions concerning the future and other key sources of estimation uncertainty that have a significant risk of causing a material adjustment to the carrying amounts of assets and liabilities within the next financial year, are discussed below:
Provisions (note 22)There is uncertainty as to liabilities arising from the outcome or resolution of the ongoing historical legal issues. Provisions are measured at the best estimate of the expenditure required to settle the obligation based on the assessment of the related facts and circumstances at each reporting date.
Retirement benefits (note 33)Actuarial assumptions adopted and external factors can significantly impact the surplus or deficit of defined benefit pension schemes. Valuations for funding and accounting purposes are based on assumptions about future economic and demographic variables. This results in risk of a volatile valuation deficit and the risk that the ultimate cost of paying benefits is higher than the current assessed liability value. Advice is sourced from independent and qualified actuaries in selecting suitable assumptions at each reporting date.
Impairment of goodwill and other intangible assets (note 14 and 15)In addition to the areas of judgement outlined below, there are also sources of estimation uncertainty in the value in use calculation. The most significant area of uncertainty relates to expected future cash flows for each cash-generating unit.
Critical judgements in applying the Group’s accounting policiesIn the process of applying the Group’s accounting policies, described above, management has made the following judgements that have the most significant effect on the amounts recognised in the financial statements:
Impairment of goodwill and other intangible assets (note 14 and 15)Determining whether goodwill and other intangible assets are impaired requires an estimation of the value in use of the cash-generating unit to which these have been allocated. It also requires assessment of the appropriateness of the cash-generating unit at each reporting date. The value in use calculation requires the Group to estimate the future cash flows expected to arise from the cash-generating unit and a suitable discount rate in order to calculate present value. Projections are based on both internal and external market information and reflect past experience. The discount rate reflects a long-term equity and debt mix based on the period end enterprise value assuming a long-term debt to EBITDA ratio of 2.5 times.
4 Operating segmentsOperating segments are identified on the basis of internal reports about components of the Group that are regularly reviewed by the Board and chief operating decision maker (Executive directors) to allocate resources to the segments and to assess their performance. The Group has four operating segments that are regularly reviewed by the Board and chief operating decision maker.
The operating segments are: Publishing which includes all of our newspapers and associated digital publishing; Printing which provides printing services to the publishing segment and to third parties; Specialist Digital which includes our acquired digital classified recruitment business and our digital marketing services business; and Central which includes revenue and costs not allocated to the operational divisions and our share of results of associates. After completing the acquisition of the 80.02% of Local World not previously owned on 13 November 2015, Local World is included in the Publishing division. Prior to 13 November 2015 the Group’s 19.98% interest was equity accounted as an associated undertaking and included in the Central division.

Financial Statements
Trinity Mirror plc Annual Report 201684
Notes to the consolidated financial statements continuedfor the 53 weeks ended 1 January 2017 (52 weeks ended 27 December 2015)
4 Operating segments continuedThe accounting policies used in the preparation of each segment’s revenue and results are the same as the Group’s accounting policies. The Board and chief operating decision maker are not provided with an amount for total assets by segment. The Group’s operations are located primarily in the UK and the Group is not subject to significant seasonality during the year.
Segment revenue and results:
53 weeks ended 1 January 2017
Publishing2016
£m
Printing2016
£m
Specialist Digital
2016£m
Central2016
£m
Total2016
£m
Segment sales 660.0 147.9 13.3 3.9 825.1
Inter-segment sales – (111.7) (0.4) – (112.1)
Total revenue 660.0 36.2 12.9 3.9 713.0
Segment result 148.4 – 2.4 (13.3) 137.5
Non-recurring items (26.1)
Restructuring charges in respect of cost reduction measures (15.1)
Amortisation of intangible assets (0.6)
Pension administrative expenses (2.2)
Operating profit 93.5
Investment revenues 0.6
Pension finance charge (10.4)
Finance costs (7.2)
Profit before tax 76.5
Tax charge (7.0)
Profit for the period 69.5
52 weeks ended 27 December 2015
Publishing2015
£m
Printing2015
£m
SpecialistDigital2015
£m
Central2015
£m
Total2015
£m
Segment sales 528.8 148.9 16.2 3.6 697.5
Inter-segment sales – (104.0) (0.8) – (104.8)
Total revenue 528.8 44.9 15.4 3.6 592.7
Segment result 113.7 – 2.6 (6.7) 109.6
Non-recurring items (5.7)
Restructuring charges in respect of cost reduction measures (15.3)
Amortisation of intangible assets (4.3)
Pension administrative expenses (2.1)
Operating profit 82.2
Investment revenues 0.6
Pension finance charge (10.9)
Finance costs (4.7)
Profit before tax 67.2
Tax credit 9.8
Profit for the period 77.0

Strategic Report Governance Financial Statements
Trinity Mirror plc Annual Report 2016 85
Notes to the consolidated financial statements continuedfor the 53 weeks ended 1 January 2017 (52 weeks ended 27 December 2015)
5 Revenue2016
£m2015
£m
Publishing Print 581.0 485.9
Circulation 310.6 271.7
Advertising 236.6 182.0
Other 33.8 32.2
Publishing Digital 79.0 42.9
Display and transactional 58.4 30.4
Classified 20.6 12.5
Specialist Digital 12.9 15.4
Printing 36.2 44.9
Central 3.9 3.6
Total revenue 713.0 592.7
The Group’s operations are located primarily in the UK. The Group’s revenue by location of customers is set out below:2016
£m2015
£m
UK and Republic of Ireland 709.9 589.9
Continental Europe 2.8 2.7
Rest of World 0.3 0.1
Total revenue 713.0 592.7
6 Result for the period2016
£m2015
£m
Operating profit for the period is arrived at after (charging)/crediting:
Staff costs (239.4) (195.8)
Cost of inventories recognised as cost of sales (80.6) (76.4)
Depreciation of property, plant and equipment (22.2) (22.4)
Write-off of fixed assets (9.6) (4.0)
Amortisation of intangible assets
– excluding associates (0.3) (1.8)
– share of associates (0.3) (2.5)
Operating lease rentals payable:
– property (6.0) (5.7)
– vehicles, plant and equipment (3.6) (2.4)
Trade receivables impairment (1.2) (2.4)
Net foreign exchange gain/(loss) 0.3 (0.2)
Pension administrative expenses (2.2) (2.1)
Restructuring charges in respect of cost reduction measures (15.1) (15.3)
Non-recurring items
– excluding associates (26.0) (4.4)
– share of associates (0.1) (1.3)
Auditor’s remuneration:
Fees payable to the Company’s auditor for the audit of the Company’s annual accounts (0.3) (0.3)
Fees payable to the Company’s auditor for the other services to the Group:
– the audit of the Company’s subsidiaries (0.4) (0.5)
Total audit fees (0.7) (0.8)
Non-audit fees payable to the Company's auditors for:
– audit-related assurance services (0.1) (0.1)
– transaction related services – (0.5)
– other taxation advisory services – (0.1)
Total non-audit fees (0.1) (0.7)
Total fees (0.8) (1.5)

Financial Statements
Trinity Mirror plc Annual Report 201686
Notes to the consolidated financial statements continuedfor the 53 weeks ended 1 January 2017 (52 weeks ended 27 December 2015)
6 Result for the period continued
There were no future services for the auditor contracted at the reporting date (2015: nil).
Fees payable to Deloitte LLP for non-audit services to the Company are not required to be disclosed because the consolidated financial statements are required to disclose such fees on a consolidated basis.
A description of the work of the Audit & Risk Committee is set out in the Audit & Risk Committee Report on pages 40 to 44 and includes an explanation of how the objectivity and independence of the auditor is safeguarded when non-audit services are provided by the auditor.
Total administrative expenses included in operating profit amounted to £202.1 million (2015: £145.2 million) including non-recurring items amounting to a charge of £26.0 million (2015: £4.4 million), pension administrative expenses of £2.2 million (2015: £2.1 million), restructuring charges in respect of cost reduction measures of £15.1 million (2015: £15.3 million) and amortisation of intangible assets of £0.3 million (2015: £1.8 million).
Total share of results of associates amounted to a profit of £0.7 million (2015: £2.2 million) comprising share of profit before non-recurring items and amortisation of intangible assets of £1.1 million (2015: £6.0 million), a non-recurring charge of £0.1 million (2015: £1.3 million) and amortisation of intangible assets of £0.3 million (2015: £2.5 million).
Total foreign exchange losses were £13.3 million (2015: £2.5 million) comprising a loss on the retranslation of borrowings of £13.6 million included in finance costs and a net foreign exchange gain of £0.3 million included in operating profit (2015: comprising a loss on the retranslation of borrowings of £2.3 million included in finance costs and a net foreign exchange loss of £0.2 million included in operating profit).
7 Staff costsThe average number of persons, including executive directors, employed by the Group in the period was:
2016Number
2015Number
Production and editorial 3,001 2,490
Sales and distribution 1,912 1,213
Administration 845 749
Total 5,758 4,452
All employees are employed in the United Kingdom and Republic of Ireland. The above excludes casual employees working for the Group during the period due to the impracticality of determining an average.
Staff costs, including directors’ emoluments, incurred during the period were:2016
£m2015
£m
Wages and salaries (203.4) (163.7)
Social security costs (20.9) (17.3)
Share-based payments charge in the period (note 32) (1.5) (1.5)
Pension costs relating to defined contribution pension schemes (note 33) (13.6) (13.3)
Total (239.4) (195.8)
Wages and salaries include bonuses payable in the period. Disclosure of individual directors’ remuneration, share awards, long-term incentive schemes, pension contributions and pension entitlements required by the Companies Act 2006 and those elements specified for audit by the Financial Conduct Authority are shown in the tables in the Remuneration Report on pages 45 to 61 and form part of these consolidated financial statements.
8 Non-recurring items2016
£m2015
£m
Contract termination fee(a) (2.0) –
Impairment of goodwill(b) (2.0) –
Provision for historical legal issues(c) (11.5) (29.0)
Closure of print sites and press line(d) (10.7) (3.4)
Profit on sale of land and buildings(e) 0.2 –
Local World acquisition transaction costs(f) – (5.6)
Gain on deemed disposal of Local World associate interest(g) – 33.6
Non-recurring items included in administrative expenses (26.0) (4.4)
Non-recurring items included in share of results of associates(h) (0.1) (1.3)
Total non-recurring items (26.1) (5.7)

Strategic Report Governance Financial Statements
Trinity Mirror plc Annual Report 2016 87
Notes to the consolidated financial statements continuedfor the 53 weeks ended 1 January 2017 (52 weeks ended 27 December 2015)
8 Non-recurring items continued
(a) In the first quarter of 2016, following extensive work on the separation of certain titles the Group had agreed to dispose to the Iliffe family as part of the acquisition of Local World, the Board concluded that it was in the best interests of the Company not to proceed with the disposal and therefore pay a break fee of £2.0 million to Iliffe Print Cambridge Limited.
(b) In the first half, an impairment review comparing the carrying value of the Group’s assets with the value in use was undertaken in accordance with IAS 36. The review indicated that a £2.0 million charge against the carrying value of goodwill in our Specialist Digital division was required.
(c) Provision of £11.5 million (2015: £29.0 million) to cover the costs of dealing with historical legal issues in relation to phone hacking. It remains uncertain as to how these matters will progress, whether further allegations or claims will be made, and their financial impact. Due to this uncertainty a contingent liability has been highlighted in note 39.
(d) Costs associated with closure of the printing site in Cardiff and a press line in Scotland (Cardonald) including the write off of fixed assets of £9.1 million (2015: costs associated with the closure of the printing sites in Scotland (Blantyre) in June 2015 and Newcastle in December 2015 including the write off of fixed assets of £2.5 million).
(e) Profit on disposal of Cardiff and Coventry properties representing net proceeds of £10.6 million less carrying value of £10.4 million.(f) In 2015, transaction costs incurred by the Group relating to the acquisition of Local World on 13 November 2015.(g) In 2015, gain on the accounting deemed disposal of the 19.98% interest in Local World on 13 November 2015.(h) Group’s share of restructuring costs incurred by PA Group (2015: Group’s share of transaction related costs incurred by Local World and restructuring
costs incurred by PA Group and Local World).
9 Investment revenues2016
£m2015
£m
Interest income on bank deposits and other interest receipts 0.6 0.6
10 Finance costs2016
£m2015
£m
Interest on bank overdrafts and borrowings (4.9) (2.7)
Total interest expense (4.9) (2.7)
Fair value gain on derivative financial instruments 11.3 0.3
Foreign exchange loss on retranslation of borrowings (13.6) (2.3)
Finance costs (7.2) (4.7)
11 Tax2016
£m2015
£m
UK corporation tax charge for the period (20.4) (9.8)
Prior period adjustment 1.2 0.9
Current tax charge (19.2) (8.9)
Deferred tax credit for the period 1.8 2.1
Prior period adjustment 0.6 (0.6)
Deferred tax rate change 9.8 17.2
Deferred tax credit 12.2 18.7
Tax (charge)/credit (7.0) 9.8
Reconciliation of tax (charge)/credit2016
%2015
%
Standard rate of corporation tax (20.0) (20.3)
Tax effect of items that are not deductible in determining taxable profit (5.4) (2.6)
Tax effect of items that are not taxable in determining taxable profit 1.1 10.9
Prior period adjustment 2.3 0.4
Deferred tax rate change 12.6 25.6
Tax effect of share of results of associates 0.2 0.6
Tax (charge)/credit rate (9.2) 14.6

Financial Statements
Trinity Mirror plc Annual Report 201688
Notes to the consolidated financial statements continuedfor the 53 weeks ended 1 January 2017 (52 weeks ended 27 December 2015)
11 Tax continued
Included in the ‘tax effect of items that are not taxable in determining taxable profit’ is the impact of the utilisation of unrecognised losses of £1.7 million (gross) and losses on asset disposal (2015: utilisation of unrecognised losses of £2.1 million (gross) and the impact of the non-taxable gain on the accounting deemed disposal of the 19.98% interest in Local World of £33.6 million).
The standard rate of corporation tax for the year is 20% (2015: blended rate of 20.25% being a mix of 21% up to 31 March 2015 and 20% from 1 April 2015). The current tax liabilities amounted to £9.8 million (27 December 2015: £8.4 million) at the reporting date.
The opening deferred tax position is recalculated in the period in which a change in the standard rate of corporation tax has been enacted or substantively enacted by parliament. The change in rate from 18% to 17% in 2020 has been accounted for in the current year resulting in a £9.8 million credit in the consolidated income statement and a £4.4 million charge in the consolidated statement of comprehensive income (2015: change in rate from 20% to 19% in 2017 and from 19% to 18% in 2020 resulting in a £17.2 million credit in the consolidated income statement and a £6.0 million charge in the consolidated statement of comprehensive income).
The tax on actuarial losses on defined benefit pension schemes taken to the consolidated statement of comprehensive income is a credit of £32.1 million comprising a deferred tax credit of £26.5 million and a current tax credit of £5.6 million (2015: credit of £2.2 million comprising a deferred tax credit of £0.8 million and a current tax credit of £1.4 million). The deferred tax charge including the future change in tax rate of £0.6 million (2015: £6.0 million) comprises a charge of £4.4 million (2015: £6.0 million) from the change in future tax rates and a credit of £3.8 million (2015: nil) from a change in expected reversal of timing differences. The tax on share-based payments taken to equity is nil (2015: credit of £0.5 million comprising a deferred tax charge of £1.1 million and a current tax credit of £1.6 million).
12 Dividends2016
Pence2015
Pence
Dividends paid per share and recognised as distributions to equity holders in the period 5.25 5.00
Dividend proposed per share but not paid nor included in the accounting records 3.35 3.15
The Board proposes a final dividend for 2016 of 3.35 pence per share. An interim dividend for 2016 of 2.10 pence per share was paid on 25 November 2016 bringing the total dividend in respect of 2016 to 5.45 pence per share. The final dividend payment is expected to amount to £9.2 million. The total interim dividend payment amounted to £5.8 million.
On 5 May 2016 the final dividend proposed for 2015 of 3.15 pence per share was approved by shareholders at the Annual General Meeting and was paid on 10 June 2016. 2015 final dividend payment amounted to £8.8 million.
13 Earnings per share2016
£m2015
£m
Profit after tax before adjusted* items 106.2 86.4
Adjusted items:
Non-recurring items (after tax) (22.0) 1.5
Amortisation of intangibles (after tax) (0.5) (3.9)
Pension charges (after tax) (10.1) (10.4)
Restructuring charges (after tax) (12.1) (12.2)
Finance costs (after tax) (1.8) (1.6)
Tax legislation changes 9.8 17.2
Profit for the period 69.5 77.0
* Adjusted items relate to the exclusion of non-recurring items, restructuring charges in respect of cost reduction measures, the amortisation of intangible assets, the pension administrative expenses, the retranslation of foreign currency borrowings, the impact of fair value changes on derivative financial instruments, the pension finance charge and the impact of tax legislation changes. Set out in note 38 is the reconciliation between the statutory results and the adjusted results.
Weighted average number of ordinary shares2016
Thousand2015
Thousand
Weighted average number of ordinary shares for basic earnings per share 278,895 254,936
Effect of potential dilutive ordinary shares in respect of share awards 1,864 5,024
Weighted average number of ordinary shares for diluted earnings per share 280,759 259,960
Basic earnings per share is calculated by dividing profit for the period attributable to equity holders of the parent by the weighted average number of ordinary shares during the period. Diluted earnings per share is calculated by adjusting the weighted average number of ordinary shares in issue on the assumption of conversion of all potentially dilutive ordinary shares. The weighted average number of potentially dilutive ordinary shares not currently dilutive was 2,805,385 (2015: 2,681,295).
Since the reporting date, 0.8 million shares have been purchased under the share buyback programme.

Strategic Report Governance Financial Statements
Trinity Mirror plc Annual Report 2016 89
Notes to the consolidated financial statements continuedfor the 53 weeks ended 1 January 2017 (52 weeks ended 27 December 2015)
13 Earnings per share continued
Statutory earnings per share2016
Pence2015
Pence
Earnings per share – basic 24.9 30.2
Earnings per share – diluted 24.8 29.6
Adjusted* earnings per share2016
Pence2015
Pence
Earnings per share – basic 38.1 33.9
Earnings per share – diluted 37.8 33.2
The basic earnings per share impact for each non-recurring item disclosed in note 8 are as follows:2016
Pence2015
Pence
Contract termination fee (0.7) –
Impairment of goodwill (0.7) –
Provision for historical legal issues (3.3) (9.1)
Closure of print sites and press line (3.5) (1.1)
Profit on disposal of land and buildings 0.2 –
Local World acquisition transaction costs – (1.9)
Gain on deemed disposal of Local World associate interest – 13.2
(Loss)/profit per share – non-recurring items included in administrative expenses (8.0) 1.1
Loss per share – non-recurring items included in share of results of associates – (0.5)
(Loss)/profit per share – total non-recurring items (8.0) 0.6
* Adjusted items relate to the exclusion of non-recurring items, restructuring charges in respect of cost reduction measures, the amortisation of intangible assets, the pension administrative expenses, the retranslation of foreign currency borrowings, the impact of fair value changes on derivative financial instruments, the pension finance charge and the impact of tax legislation changes. Set out in note 38 is the reconciliation between the statutory results and the adjusted results.
14 GoodwillTotal
£m
Cost
At 27 December 2015 159.9
Disposal (2.5)
At 1 January 2017 157.4
Accumulated impairment
At 27 December 2015 (55.4)
Impairment (2.0)
Disposal 2.0
At 1 January 2017 (55.4)
Carrying amount
At 27 December 2015 104.5
At 1 January 2017 102.0
At the reporting date the Publishing division comprises two cash-generating units (Nationals and Regionals) and the Specialist Digital division comprises two cash-generating units (TMDR and Communicator). Goodwill is allocated to cash-generating units as follows:
2016£m
2015£m
Publishing (Regionals £92.5 million) 92.5 92.5
Specialist Digital (TMDR £6.1 million, Communicator £3.4 million) 9.5 12.0
102.0 104.5
Note 15 sets out the results of the impairment review performed at the reporting date which resulted in no impairment (2015: nil). At the interim of 2016, prior to the sale of Rippleffect Limited an impairment review was performed which resulted in a £2.0 million impairment of goodwill relating to Rippleffect Limited. Note 36 sets out details of the disposal of Rippleffect Limited which was previously a cash-generating unit in the Specialist Digital division.

Financial Statements
Trinity Mirror plc Annual Report 201690
15 Other intangible assets
Publishing rights and
titles£m
Customer relationships
and domain names
£mTotal
£m
Cost
At 27 December 2015 1,985.5 37.1 2,022.6
Disposal – (1.8) (1.8)
At 1 January 2017 1,985.5 35.3 2,020.8
Accumulated amortisation
At 27 December 2015 (1,186.6) (36.2) (1,222.8)
Amortisation – (0.3) (0.3)
Disposal – 1.8 1.8
At 1 January 2017 (1,186.6) (34.7) (1,221.3)
Carrying amount
At 27 December 2015 798.9 0.9 799.8
At 1 January 2017 798.9 0.6 799.5
At the reporting date the Publishing division comprises two cash-generating units (Nationals and Regionals) and the Specialist Digital division comprises two cash-generating units (TMDR and Communicator). Other intangible assets are allocated to cash-generating units as follows:
Publishing rights and
titles£m
2016Customer
relationships and domain
names£m
Total2016
£m
Publishing rights and
titles£m
2015Customer
relationships and domain
names£m
2015£m
Publishing (Nationals £544.3 million, Regionals £254.6 million) 798.9 – 798.9 798.9 – 798.9
Specialist Digital (Communicator £0.6 million) – 0.6 0.6 – 0.9 0.9
798.9 0.6 799.5 798.9 0.9 799.8
The directors consider publishing rights and titles have indefinite economic lives due to the longevity of the brands and the ability to evolve the brands in an ever changing media landscape. It is not practicable to review individual publishing rights and titles due to the interdependencies of revenues and cash inflow within the cash-generating units. The customer relationships and domain names have estimated useful lives of between four and ten years.
The Group tests the carrying value of assets at the cash-generating unit level for impairment at each reporting date or more frequently if there are indications that assets might be impaired. The review is undertaken by assessing whether the carrying value of assets is supported by their value in use which is calculated as the net present value of future cash flows derived from those assets, using cash flow projections. If an impairment charge is required this is allocated first to reduce the carrying amount of any goodwill allocated to the cash-generating unit and then to the other assets of the cash-generating unit but subject to not reducing any asset below its recoverable amount.
At the reporting date, the directors revised their assessment of cash-generating units and reduced the number considered in the impairment review from 5 to 4. This change reflects the integration of Local World with the former regionals businesses. The majority of revenues are packaged and sold centrally, the structure of the management team and the reporting to the Board has been combined and resources are combined in the generation of independent cash inflows.
The Group prepares cash flow projections for a cash-generating unit using the Board approved budget for 2017 and the projections for 2018 and 2019. The growth rates for the three-year period are internal projections based on both internal and external market information and reflect past experience of and the risk associated with each asset. Cash flow projections beyond 2019 are extrapolated based on estimated growth rates which do not exceed the average long-term growth rates for the relevant markets. The growth rates for Publishing and for Specialist Digital are 0% and are based on the Board’s view of the cash-generating unit’s market position and maturity of the relevant market. The post-tax discount rate used at the period end reporting date in respect of all cash-generating units was 10.0% (2015: 11.0%) reflecting a long-term equity and debt mix based on the period end enterprise value assuming a long-term debt to EBITDA ratio of 2.5 times. The equivalent pre-tax discount rate is 12.2% (2015: 14.1%).
The impairment review of the carrying value of assets performed at the reporting date resulted in no impairment (2015: nil). The impairment review is sensitive to a change in key assumptions used in the value in use calculations relating to the discount rate and future growth rates. A reasonably possible change of 1% in the discount rate or of 1% in the growth rate beyond 2018 would not change the conclusion of the impairment review. A combination of reasonably possible changes in key assumptions, such as print revenue declining at a faster rate than forecast or digital revenue growth being significantly lower than forecast, could lead to a future impairment. An increase of 2.1 percentage points in the discount rate or a decrease of 2.1 percentage points in the growth rate would remove the headroom in the Nationals cash-generating unit. An increase of 3.9 percentage points in the discount rate or a decrease of 3.9 percentage points in the growth rate would remove the headroom in the Regionals cash-generating unit. For the Specialist Digital cash-generating units the change to remove the headroom is an increase of 25 percentage points in the discount rate or a decrease of 25 percentage points in the growth rate.
Notes to the consolidated financial statements continuedfor the 53 weeks ended 1 January 2017 (52 weeks ended 27 December 2015)

Strategic Report Governance Financial Statements
Trinity Mirror plc Annual Report 2016 91
Notes to the consolidated financial statements continuedfor the 53 weeks ended 1 January 2017 (52 weeks ended 27 December 2015)
16 Property, plant and equipment
Land and buildings
Freehold £m
Leasehold£m
Plant and equipment
£m
Asset under construction
£mTotal
£m
Cost
At 28 December 2014 215.4 15.7 320.1 6.4 557.6
Additions – – 0.4 3.3 3.7
Acquisition of subsidiary – – 11.3 – 11.3
Reclassification – – 4.8 (4.8) –
Write-off of assets (0.6) (0.1) (6.3) – (7.0)
At 27 December 2015 214.8 15.6 330.3 4.9 565.6
Additions – – 1.3 2.9 4.2
Disposals – (13.8) (5.9) – (19.7)
Reclassification 1.8 (1.8) 3.8 (3.8) –
Write-off of assets (4.0) – (6.9) – (10.9)
At 1 January 2017 212.6 – 322.6 4.0 539.2
Accumulated depreciation and impairment
At 28 December 2014 (50.5) (3.5) (185.9) – (239.9)
Charge for the period (4.7) (0.2) (17.5) – (22.4)
Acquisition of subsidiary – – (6.2) – (6.2)
Write-off of assets – 0.1 2.9 – 3.0
At 27 December 2015 (55.2) (3.6) (206.7) – (265.5)
Charge for the period (4.6) (0.2) (17.4) – (22.2)
Disposals – 3.4 5.9 – 9.3
Reclassification (0.4) 0.4 – – –
Write-off of assets – – 1.3 – 1.3
At 1 January 2017 (60.2) – (216.9) – (277.1)
Carrying amount
At 27 December 2015 159.6 12.0 123.6 4.9 300.1
At 1 January 2017 152.4 – 105.7 4.0 262.1
2016£m
2015£m
Capital commitments
Expenditure contracted for but not provided in the consolidated financial statements 0.6 1.0

Financial Statements
Trinity Mirror plc Annual Report 201692
17 Investment in associatesThe Group owns 21.53% (of which 2.26% is owned by the Company) of PA Group Limited a news agency incorporated in England and Wales (2015: 21.53%). The Group acquired a 50% interest in Brand Events TM Limited (renamed from Brand Events 1 Limited), an event organiser incorporated in England and Wales, in October 2016 for an investment of £750,000 (of which nil is owned by the Company) and the Group has agreed to provide a revolving credit facility of £750,000 of which £200,000 was drawn at the reporting date.
PA Group Limited
£m
Brand Events TM Limited
£m
Local World Holdings
Limited£m
Total£m
At 28 December 2014 26.1 – 15.3 41.4
Dividends received (4.3) – (12.0) (16.3)
Non-recurring items (0.1) – (1.2) (1.3)
Amortisation of intangible assets (0.3) – (2.2) (2.5)
Results before amortisation and non-recurring items 0.9 – 5.1 6.0
Share of other comprehensive costs (3.1) – (0.1) (3.2)
Deemed disposal of Local World associate interest – – (4.9) (4.9)
At 27 December 2015 19.2 – – 19.2
Share of results:
Investment in Brand Events TM Limited (note 37) – 0.8 – 0.8
Non-recurring items (0.1) – – (0.1)
Amortisation of intangible assets (0.3) – – (0.3)
Results before amortisation and non-recurring items 1.1 – – 1.1
Share of other comprehensive income 1.1 – – 1.1
At 1 January 2017 21.0 0.8 – 21.8
PA Group Limited2016
£m 2015
£m
Non-current assets 29.8 30.7
Current assets 79.0 75.6
Total assets 108.8 106.3
Current liabilities (11.3) (17.3)
Net assets 97.5 89.0
Group’s share of net assets 21.0 19.2
Revenue 57.9 57.6
Profit for the period 3.3 2.3
Group’s share of results for the period 0.7 0.5
The financial statements of PA Group Limited are made up to 31 December each year. For the purposes of applying the equity method of accounting, the audited financial statements of PA Group Limited for the year ended 31 December 2015 together with the management accounts up to the end of December 2016 have been used with appropriate year end adjustments made. Included in the share of results of associates was a £0.1 million loss on our share of the after tax non-recurring items (2015: £0.1 million loss on our share of the after tax non-recurring items) and a £0.3 million after tax amortisation charge (2015: £0.3 million).
Brand Events TM Limited2016
£m 2015
£m
Current assets 1.0 –
Current liabilities (1.1) –
Net assets (0.1) –
Group's share of net assets – –
Goodwill 0.8 –
Group share of interest in associate 0.8 –
Revenue – –
Profit for the period – –
Group’s share of results for the period – –
The financial statements of Brand Events TM Limited are made up to 31 March each year. For the purpose of applying equity method of accounting, the management accounts up to the end of December 2016 have been used with the appropriate year end adjustments made.
Notes to the consolidated financial statements continuedfor the 53 weeks ended 1 January 2017 (52 weeks ended 27 December 2015)

Strategic Report Governance Financial Statements
Trinity Mirror plc Annual Report 2016 93
Notes to the consolidated financial statements continuedfor the 53 weeks ended 1 January 2017 (52 weeks ended 27 December 2015)
17 Investment in associates continued
On 13 November 2015, the Group purchased the remaining 80.02% shareholding in Local World Holdings Limited. From 13 November 2015 Local World Holdings Limited was accounted for as a wholly owned subsidiary and derecognised as an associate. Included in the share of results of associates up to 13 November 2015 is a £1.2 million after tax non-recurring charge in respect of restructuring charges and a £2.2 million after tax amortisation charge. Up to 13 November 2015, revenue was £187.0 million, profit was £8.5 million and the Group’s share of the results was £1.7 million.
18 Inventories2016
£m2015
£m
Raw materials and consumables 5.8 6.2
19 Other financial assets
Trade and other receivables2016
£m2015
£m
Gross trade receivables 72.2 95.7
Allowances for doubtful receivables (3.5) (4.7)
Net trade receivables 68.7 91.0
Prepayments and accrued income 19.4 29.5
Other receivables 1.7 1.3
89.8 121.8
Net trade receivablesTrade receivables net of allowances for doubtful receivables at the reporting date amounted to £68.7 million (2015: £91.0 million).
The average credit period taken on sales of goods is 37 days (2015: 45 days). No interest is charged on the receivables. The Group has substantially provided fully for all receivables over 120 days because historical experience is such that these receivables are generally not recoverable. Trade receivables less than 120 days are provided for based on specific circumstances and by reference to past default experience.
Before accepting any new customers, the Group, where appropriate, uses an external credit scoring system to assess the potential customer’s credit quality and defines credit limits by customer. Limits attributed to customers are reviewed during the period where appropriate. There are two (2015: nil) customers who individually represent more than 10% of net trade receivables.
Included in the net trade receivables balance are debtors with a carrying amount of £0.8 million (2015: £5.6 million) which are past their due date at the reporting date for which the Group has not provided as there has not been a significant change in credit quality and the amounts are still considered recoverable. The Group does not hold any collateral over these balances. The average age of these receivables is 75 days (2015: 85 days).
Ageing of past due but not impaired receivables2016
£m2015
£m
60–90 days 0.8 3.7
90–120 days – 1.9
0.8 5.6
Movement in allowance for doubtful debts2016
£m2015
£m
Opening balance 4.7 2.8
Impairment losses recognised 1.2 2.4
Recovery of bad debt 0.5 –
Release of provision (2.1) –
Utilisation of provision (0.7) (1.8)
Disposal of subsidiary (0.1) –
Acquisition of subsidiary – 1.3
Closing balance 3.5 4.7
In determining the recoverability of a trade receivable, the Group considers any change in the credit quality of the trade receivable from the date credit was initially granted up to the reporting date. The concentration of credit risk is limited due to the customer base being large and unrelated. Accordingly, there is no further credit provision required in excess of the allowance for doubtful debts.
There are no significant amounts included in the allowance for doubtful debts relating to impaired trade receivables which have been placed under liquidation. The impairment recognised represents the difference between the carrying amount of these trade receivables and the present value of the expected liquidation proceeds. The Group does not hold any collateral over these balances.

Financial Statements
Trinity Mirror plc Annual Report 201694
19 Other financial assets continued
Ageing of impaired receivables2016
£m2015
£m
60–90 days 1.4 –
90–120 days 0.7 0.2
120+ days 1.4 4.5
3.5 4.7
The carrying amount of trade and other receivables approximates their fair value.
Cash and cash equivalents2016
£m2015
£m
Cash and cash equivalents 37.8 55.4
Cash and cash equivalents comprise cash held by the Group and short-term bank deposits with an original maturity of one week or less. The carrying amount of these assets approximates their fair value.
20 Other financial liabilities
Trade and other payables2016
£m2015
£m
Trade payables (11.2) (17.3)
Social security and other taxes (6.8) (10.6)
Accruals and deferred income (56.8) (56.1)
Other payables (8.3) (10.3)
(83.1) (94.3)
Trade payables principally comprise amounts outstanding for trade purchases and ongoing costs. The average credit period taken for trade purchases is 36 days (2015: 33 days). For most suppliers no interest is charged on the trade payables for the first 60 days from the date of the invoice. Thereafter, interest is charged on the outstanding balances at various interest rates. The Group has financial risk management policies in place to ensure that all payables are paid within the credit timeframe. The carrying amount of trade payables approximates to their fair value.
Notes to the consolidated financial statements continuedfor the 53 weeks ended 1 January 2017 (52 weeks ended 27 December 2015)

Strategic Report Governance Financial Statements
Trinity Mirror plc Annual Report 2016 95
Notes to the consolidated financial statements continuedfor the 53 weeks ended 1 January 2017 (52 weeks ended 27 December 2015)
21 Deferred tax assets and liabilitiesThe following are the major deferred tax assets and liabilities recognised by the Group and movements thereon:
Acceleratedtax
depreciation£m
Other short-term
timing£m
Rolled-overand held-over
gains£m
Intangibles£m
Retirementbenefit
obligations£m
Share-basedpayments
£mTotal
£m
At 28 December 2014 (42.8) (0.5) (0.9) (133.8) 60.2 1.9 (115.9)
Change of tax rate applying to deferred tax:
Credit to income 3.7 0.1 0.1 13.3 – – 17.2
Charge to equity – – – – (6.0) – (6.0)
At 28 December 2014 (at 19%/18%) (39.1) (0.4) (0.8) (120.5) 54.2 1.9 (104.7)
Acquisition of subsidiary 0.5 – – (17.7) – – (17.2)
Credit/(charge) to consolidated income statement 1.8 0.2 – 0.1 – (0.6) 1.5
Credit/(charge) to equity – – – – 0.8 (1.1) (0.3)
At 27 December 2015 (36.8) (0.2) (0.8) (138.1) 55.0 0.2 (120.7)
Change of tax rate applying to deferred tax:
Credit to income 1.7 – 0.1 8.0 – – 9.8
Charge to equity – – – – (4.4) – (4.4)
At 27 December 2015 (at 19%/17%) (35.1) (0.2) (0.7) (130.1) 50.6 0.2 (115.3)
Credit/(charge) to consolidated income statement 4.1 0.6 0.7 (3.0) – – 2.4
Credit to equity – – – – 30.3 – 30.3
At 1 January 2017 (31.0) 0.4 – (133.1) 80.9 0.2 (82.6)
Certain deferred tax assets and liabilities have been offset. The following is the analysis of the deferred tax balances in the consolidated balance sheet:
2016£m
2015£m
Deferred tax liabilities (164.1) (175.9)
Deferred tax assets 81.5 55.2
(82.6) (120.7)
At the reporting date, the Group has unused tax losses of nil (2015: £1.7 million) available for offset against future profits. No deferred tax asset has been recognised in respect of the tax losses due to the unpredictability of future profit streams. The tax losses can be carried forward indefinitely. The Group also has unrecognised capital losses of £36.0 million (2015: £34.6 million) at the reporting date.
22 ProvisionsShare-based
payments£m
Property£m
Restructuring£m
Other£m
Total£m
At 28 December 2014 (1.4) (9.0) (3.6) (16.2) (30.2)
Charged to income statement (0.2) (0.1) (15.3) (30.1) (45.7)
Utilisation of provision 1.3 2.4 16.1 9.2 29.0
Acquisition of subsidiary – (2.9) (0.9) – (3.8)
At 27 December 2015 (0.3) (9.6) (3.7) (37.1) (50.7)
Charged to income statement – (2.5) (15.1) (13.4) (31.0)
Utilisation of provision – 4.0 15.4 30.8 50.2
At 1 January 2017 (0.3) (8.1) (3.4) (19.7) (31.5)
The provisions have been analysed between current and non-current as follows:2016
£m2015
£m
Current (27.9) (43.5)
Non-current (3.6) (7.2)
(31.5) (50.7)
The share-based payments provision relates to National Insurance obligations attached to the future crystallisation of awards.

Financial Statements
Trinity Mirror plc Annual Report 201696
22 Provisions continued
The property provision relates to onerous property leases and future committed costs related to occupied, let and vacant properties. This provision will be utilised over the remaining term of the leases.
The restructuring provision relates to restructuring charges incurred in the delivery of cost reduction measures. This provision is expected to be utilised within the next year.
The other provision relates to legal and other costs relating to historical litigation expected to be utilised within the next year.
23 Subsidiary undertakingsA list of the subsidiary undertakings, all of which have been consolidated, is on pages 119 to 120.
24 Notes to the consolidated cash flow statement2016
£m2015
£m
Operating profit 93.5 82.2
Depreciation of property, plant and equipment 22.2 22.4
Amortisation of intangible assets 0.3 1.8
Impairment of goodwill 2.0 –
Share of results of associates (0.7) (2.2)
Charge for share-based payments 1.5 1.5
Gain on deemed disposal of Local World associate interest – (33.6)
Profit on disposal of land and buildings (0.2) –
Write-off of fixed assets 9.6 4.0
Pension administrative expenses 2.2 2.1
Pension deficit funding payments (40.7) (20.0)
Operating cash flows before movements in working capital 89.7 58.2
Decrease in inventories 0.4 1.1
Decrease in receivables 29.7 13.7
Decrease in payables (28.3) (10.4)
Cash flows from operating activities 91.5 62.6
25 Borrowings2016
£m2015
£m
Loan notes (81.2) (67.6)
Term loan – (80.0)
(81.2) (147.6)
The borrowings are repayable as follows:
On demand or within one year (81.2) (15.0)
In the second year – (79.6)
In the third year – (17.7)
In the fourth year – (17.7)
In the fifth year – (17.6)
(81.2) (147.6)
The borrowings are included in the consolidated balance sheet as follows:
Amount included in non-current liabilities – (132.6)
Amount included in current liabilities (81.2) (15.0)
(81.2) (147.6)
The amount included in current liabilities represents borrowings of £81.2 million (2015: £15.0 million) and non-current liabilities represents borrowings of nil (2015: £132.6 million). Current assets include £14.8 million (2015: nil) and non-current assets of nil (2015: £3.5 million) relating to derivative financial instruments which are included in net debt in note 27.
Notes to the consolidated financial statements continuedfor the 53 weeks ended 1 January 2017 (52 weeks ended 27 December 2015)

Strategic Report Governance Financial Statements
Trinity Mirror plc Annual Report 2016 97
Notes to the consolidated financial statements continuedfor the 53 weeks ended 1 January 2017 (52 weeks ended 27 December 2015)
25 Borrowings continued2016
£m2015
£m
Loan movements in the period:
Opening balance (147.6) (65.3)
Term loan repaid /(drawn) 80.0 (80.0)
Foreign exchange loss on retranslation (13.6) (2.3)
Closing balance (81.2) (147.6)
Composition of loans:
US$100 million loan notes (81.2) (67.6)
Term loan – (80.0)
(81.2) (147.6)
Private placement loan notes totalling US$602 million and £32 million were issued in 2001 (US$350 million and £32 million) and 2002 (US$252 million and £10 million). On the issue date the capital repayments and fixed rate interest on the US$ denominated loan notes were swapped into floating rate sterling through the use of cross-currency interest rate swaps. As hedge accounting under IAS 39 has not been applied, the loan notes and cross-currency interest rate swaps are shown separately in accordance with IAS 39. The loan notes are disclosed at amortised cost and translated into sterling at the reporting date exchange rate and the cross-currency interest rate swaps are disclosed at fair value at the reporting date. These values do not represent the amounts required to repay the loan notes or cancel the related cross-currency interest rate swaps.
At the reporting date there were no amounts outstanding in respect of the US$350 million loan notes and £22 million loan notes that were issued in 2001 following repayments made in 2008, 2011 and 2013. At the reporting date there were US$100 million outstanding in respect of the US$252 million loan notes and £10 million loan notes that were issued in 2002 following repayments made in 2012 and 2014. The final payment is due in June 2017.
The Group repaid the £80 million Acquisition Term Loan and replaced the undrawn £60 million bank facility with a new amortising £110 million Revolving Credit Facility which is committed until December 2021. No drawings have been made on the new bank facility.
All borrowings are denominated in sterling unless otherwise indicated and are unsecured.
The effective interest rates at the reporting date are as follows:2016
%2015
%
US$ denominated loan notes 7.42 7.42
£ denominated term loan – 3.57
The fair value of the Group’s borrowings is estimated by discounting their future cash flows at the market rate. The estimate at the reporting date is as follows:
2016£m
2015£m
US$ denominated loan notes (81.2) (67.6)
£ denominated term loan – (80.0)
In estimating the fair value the future cash flows have been discounted using an appropriate discount factor that includes credit risk.
The fair value of other financial assets and liabilities, excluding derivative financial instruments in note 26 are not materially different from the book values and are not repeated in this analysis.
26 Derivative financial instrumentsThe Group has a cross-currency interest rate swap to manage its exposure to foreign exchange movements and interest rate movements on the private placement loan notes. Fair value is calculated using discounted cash flows based upon forward rates available to the Group. The cross-currency interest rate swap is classed in level two of the financial instruments hierarchy. Level two fair value measurements are those derived from inputs other than quoted prices that are observable for the asset or liability, either directly or indirectly.

Financial Statements
Trinity Mirror plc Annual Report 201698
26 Derivative financial instruments continuedThe movement in the derivative financial instruments is as follows:
2016£m
2015£m
Opening asset 3.5 3.2
Movement in fair value 11.3 0.3
Closing asset 14.8 3.5
The derivative financial instruments are included in the consolidated balance sheet as follows:2016
£m2015
£m
Current assets 14.8 –
Non-current assets – 3.5
Closing asset 14.8 3.5
27 Net debtThe statutory net debt for the Group is as follows:
27 December2015
£m
Cashflow
£m
Derivative financial
instruments*£m
Foreign exchange*
£m
Term loanrepaid
£m
Transfer to current
£m
1 January 2017
£m
Non-current liabilities
Loan notes (67.6) – – (13.6) – 81.2 –
Term loan (65.0) – – – 65.0 – –
(132.6) – – (13.6) 65.0 81.2 –
Current liabilities
Loan notes – – – – – (81.2) (81.2)
Term loan (15.0) – – – 15.0 – –
(15.0) – – – 15.0 (81.2) (81.2)
Non-current assets
Derivative financial instruments 3.5 – 11.3 – – (14.8) –
3.5 – 11.3 – – (14.8) –
Current assets
Derivative financial instruments – – – – – 14.8 14.8
Cash and cash equivalents 55.4 62.4 – – (80.0) – 37.8
55.4 62.4 – – (80.0) 14.8 52.6
Net debt (88.7) 62.4 11.3 (13.6) – – (28.6)
* The impact on the loan notes of translation into sterling at the settlement date or at the reporting date exchange rate and the impact on the derivative financial instruments of being stated at fair value at the settlement date or at the reporting date are included in the consolidated income statement within finance costs as set out in note 10.
The contracted net debt for the Group, assuming that the private placement loan notes and the cross-currency interest rate swap is not terminated prior to maturity, is as follows:
27 December 2015
£m
Cashflow
£m
Term loan repaid
£m
Transfer to current
£m
1 January2017
£m
Non-current liabilities
Loan notes (68.3) – – 68.3 –
Term loan (65.0) – 65.0 – –
(133.3) – 65.0 68.3 –
Current liabilities
Loan notes – – – (68.3) (68.3)
Term loan (15.0) – 15.0 – –
(15.0) – 15.0 (68.3) (68.3)
Current assets
Cash and cash equivalents 55.4 62.4 (80.0) – 37.8
55.4 62.4 (80.0) – 37.8
Net debt (92.9) 62.4 – – (30.5)
Notes to the consolidated financial statements continuedfor the 53 weeks ended 1 January 2017 (52 weeks ended 27 December 2015)

Strategic Report Governance Financial Statements
Trinity Mirror plc Annual Report 2016 99
Notes to the consolidated financial statements continuedfor the 53 weeks ended 1 January 2017 (52 weeks ended 27 December 2015)
27 Net debt continuedThe statutory net debt reconciles to the contracted net debt as follows:
2016£m
2015£m
Statutory net debt (28.6) (88.7)
Loan notes at period end exchange rate 81.2 67.6
Loan notes at swapped exchange rate (68.3) (68.3)
Cross-currency interest rate swap (14.8) (3.5)
Contracted net debt (30.5) (92.9)
28 Operating lease commitmentsTotal commitments under non-cancellable operating leases:
Vehicles, plant and
equipment 2016
£m
Property2016
£m
Vehicles, plant and
equipment 2015
£m
Property2015
£m
Within one year (2.7) (9.6) (3.9) (10.0)
Greater than one and less than five years (5.0) (14.8) (4.1) (21.1)
Greater than five years – (17.0) – (19.5)
(7.7) (41.4) (8.0) (50.6)
Total future minimum lease payments with tenants under non-cancellable property operating leases:2016
£m2015
£m
Within one year 2.4 2.5
Greater than one and less than five years 1.7 4.1
4.1 6.6
29 Share capital and reserves
Sharecapital
£m
Sharepremiumaccount
£m
Merger reserve
£m
Capitalredemption
reserve £m
Retained earnings
and otherreserves
£mTotal
£m
At 28 December 2014 (25.8) (606.7) – (4.4) 42.0 (594.9)
Total comprehensive income for the period – – – – (59.0) (59.0)
Issue of shares (2.5) – (37.9) – – (40.4)
Credit to equity for equity-settled share-based payments – – – – (1.8) (1.8)
Dividends paid – – – – 12.5 12.5
At 27 December 2015 (28.3) (606.7) (37.9) (4.4) (6.3) (683.6)
Total comprehensive costs for the period – – – – 86.8 86.8
Credit to equity for equity-settled share-based payments – – – – (1.5) (1.5)
Purchase of shares for LTIP – – – – 2.0 2.0
Purchase of own shares – – – – 2.3 2.3
Dividends paid – – – – 14.6 14.6
At 1 January 2017 (28.3) (606.7) (37.9) (4.4) 97.9 (579.4)
The share capital comprises 283,459,571 allotted, called-up and fully paid ordinary shares of 10p each. The share premium account reflects the premium on issued ordinary shares. The merger reserve comprises the premium on the shares allotted in relation to the acquisition of Local World net of £0.8 million of issue costs. The capital redemption reserve represents the nominal value of the shares purchased and subsequently cancelled under share buyback programmes.
The Company obtained court approval at the end of April 2014 for a reduction in the share premium account of £514.8 million to eliminate the deficit on the Company’s profit and loss account reserve. Profit generated by the Company after 30 April 2014 is available for distribution to shareholders.
In 2015 the Company placed 22,398,041 shares (at 158.0 pence) and issued 3,371,010 shares (at 174.3 pence) relating to the acquisition of Local World. The cash consideration received in the period was £34.5 million and value of the issued shares relating to the acquisition of Local World was £5.9 million.

Financial Statements
Trinity Mirror plc Annual Report 2016100
29 Share capital and reserves continued
Shares purchased by the Trinity Mirror Employee Benefit Trust (the ‘Trust’) are included in retained earnings and other reserves at £5.5 million (2015: £3.7 million). During the period the Trust purchased a net 1,600,000 shares (2015: 22) for a cash consideration of £2.0 million (2015: nil). The Trust received a payment of £2.0 million (2015: nil) from the Company to purchase these shares. During the period, 138,634 shares were released to senior managers relating to grants made in prior years (2015: 5,929,939).
The Board approved a share buyback programme of up to £10 million which commenced in August 2016. At the year end the Group had acquired 2,505,366 shares for £2.3 million. The shares are held as Treasury shares.
Cumulative goodwill written off to reserves in respect of continuing businesses acquired prior to 1998 is £25.9 million (2015: £25.9 million). On transition to IFRS, the revalued amounts of freehold properties were deemed to be the cost of the asset and the revaluation reserve has been transferred to retained earnings and other reserves.
30 Called-up share capital2016
Number2016
£m2015
Number2015
£m
Authorised
Ordinary shares of 10 pence each 450,000,000 (45.0) 450,000,000 (45.0)
2016Number
2016£m
2015Number
2015£m
Allotted, called-up and fully paid ordinary shares of 10 pence each
Opening balance 283,459,571 (28.3) 257,690,520 (25.8)
Issue of shares – – 25,769,051 (2.5)
Closing balance 283,459,571 (28.3) 283,459,571 (28.3)
In 2015 the Company placed 22,398,041 shares (at 158.0 pence) and issued 3,371,010 shares (at 174.3 pence) relating to the acquisition of Local World. The total share capital increased to 283,459,571 allotted, called-up and fully paid ordinary shares of 10 pence each.
The Company has one class of share capital, being ordinary shares with a nominal value of 10 pence each. The Company’s ordinary shares give the shareholders equal rights to vote, receive dividends and to the repayment of capital. There are no restrictions on these shares in relation to the distribution of dividends and the repayment of capital.
The lowest closing price of the shares during the year was 73.5 pence (2015: 128.0 pence) and the highest closing price was 170.0 pence (2015: 206.0 pence). The closing share price as at the reporting date was 106.0 pence (2015: 165.5 pence).
Trinity Mirror Employee Benefit TrustThe Trinity Mirror Employee Benefit Trust (‘the Trust’) is established in Jersey and is administered by the trustee Appleby Trust (Jersey) Limited. The Trust holds shares of the Company for subsequent transfer to employees under the terms of the Group’s share plans.
At the reporting date, the Trust held 4,307,155 shares (2015: 2,845,789 shares) with a carrying value of £5,507,530 (2015: £3,694,247) and a market value of £4,565,584 (2015: £4,709,781). In addition, the Trust holds cash to purchase future shares of £16,255 (2015: £6,639). The costs associated with the Trust are included in the consolidated income statement as they accrue. Shares held by the Trust have been excluded from the weighted average number of shares used in the calculation of earnings per share.
Trinity International Restricted Share PlanAn employee benefit trust administered by the trustee Barclays Wealth Trustees (Guernsey) Limited holds shares of the Company for subsequent transfer to employees under a restricted share plan. At 1 January 2017 the trust held 90,855 shares (2015: 90,855 shares) with a carrying value of £445,523 (2015: £445,523) and a market value of £96,306 (2015: £150,365), none of which (2015: none) had options granted over them under the restricted share plan. Dividends on the shares are payable at an amount of 0.01 pence (2015: 0.01 pence) per share in the event that the Group declares any dividends. Shares held by the trust have been excluded from the weighted average number of shares used in the calculation of earnings per share.
31 Share premium account2016
£m2015
£m
Opening and closing balance (606.7) (606.7)
Notes to the consolidated financial statements continuedfor the 53 weeks ended 1 January 2017 (52 weeks ended 27 December 2015)

Strategic Report Governance Financial Statements
Trinity Mirror plc Annual Report 2016 101
Notes to the consolidated financial statements continuedfor the 53 weeks ended 1 January 2017 (52 weeks ended 27 December 2015)
32 Share-based paymentsThe charge related to share-based payments during the period was £1.5 million (2015: £1.5 million).
Long Term Incentive Plans, Deferred Share Award Plan and Restricted Share PlanUnder these schemes, the Remuneration Committee can recommend the grant of awards of shares to an eligible employee. Full details of how the schemes operate are explained in the Remuneration Report.
The vesting period is three years and is subject to continued employment of the participant. The Performance Shares granted in 2015 and 2016 vest if targets measuring the Company’s share price (2015 and 2016) and Net Cash Flow (2016) are met.
2016Performance
Shares
2015Deferred
Shares
2015Performance
Shares
Awards outstanding at start of period 3,944,945 1,976,178 8,837,109
Granted during the period 2,353,813 – 1,559,160
Lapsed during the period (1,618,467) – (2,497,563)
Exercised during the period (138,634) (1,976,178) (3,953,761)
Awards outstanding at end of period 4,541,657 – 3,944,945
The share price at the date of grant for the Performance Shares was 146.75 pence (2015: 188.3 pence).
The weighted average share price at the date of lapse for awards lapsed during the period was 118.7 pence (2015: 155.9 pence).
The weighted average share price at the date of exercise for awards exercised during the period was 101.8 pence (2015: 159.9 pence).
The estimated fair values at the date of grant of the shares awarded are as follows:Awarded in
2016£
Awarded in2015
£
Awarded in2014
£
Awarded in2013
£
Performance Shares 1,852,280 2,044,059 1,080,744 1,148,113
The fair values for the Performance Shares were calculated using a stochastic (Monte-Carlo binomial) model and for the Deferred Shares a modified Black-Scholes calculation at the date of grant. The inputs to the model for awards from 2013 were as follows:
Performanceaward
2016
Performanceaward2015
Performanceaward2014
Performanceaward2013
Expected volatility (%) 45.0 47.0 50.0 60.0
Expected life (years) 3.0 3.0 3.0 3.0
Risk-free (%) 0.57 0.7 0.9 0.4
Expected volatility has been determined by calculating the historical volatility of the Company’s share price over the three-year period prior to the grant date. The exercise price used in the model is nil as the exercise price of the granted awards is £1 for each block of awards granted.
In 2016, 82,699 (2015: 120,543) Restricted Shares were awarded based on the 2015 bonus award (2015: 2014 bonus award) for certain executives. The award was based on the average share price over the three days prior to the date of the award of 148.8 pence (2015: 189.5 pence).
33 Retirement benefit schemesDefined contribution pension schemesThe Group operates the Trinity Mirror Pension Plan (the ‘TMPP Scheme’), which is a defined contribution pension scheme for qualifying employees. The assets of the TMPP Scheme are held separately from those of the Group in funds under the control of Trustees. The TMPP Scheme has three sections, one for members who elected to join prior to 1 May 2013 which is now closed to new members, one for members who elect to join from 1 May 2013 and one for members from 1 July 2013 who are auto enrolled. Local World operates a Group Personal Pension Plan (the ‘LW Plan’), which is a defined contribution pension scheme for qualifying employees where employees hold a personal pension policy directly with Scottish Widows.
The Group implemented the Auto Enrolment legislation from 1 July 2013. Local World will implement the Auto Enrolment legislation from 1 July 2017.
The current service cost charged to the consolidated income statement of £13.6 million (2015: £13.3 million) represents contributions of £12.3 million (2015: £13.1 million) paid to the TMPP Scheme by the Group at rates specified in the scheme rules and contributions of £1.3 million (2015: £0.2 million) paid into the LW Plan by the Group at rates specified in the scheme rules. All amounts that were due have been paid over to the schemes at all reporting dates.

Financial Statements
Trinity Mirror plc Annual Report 2016102
33 Retirement benefit schemes continuedDefined benefit pension schemesBackgroundThe defined benefit pension schemes operated by the Group were closed to future accrual in 2010. The Group now has three (2015: five) defined benefit pension schemes following the merger of the Mirror Group Pension Scheme and the MGN Past Service Pension Scheme into the MGN Pension Scheme (together the ‘Mirror Schemes’).
The remaining schemes are the MGN Pension Scheme (the ‘MGN Scheme’), the Trinity Retirement Benefit Scheme (the ‘Trinity Scheme’) and the Midland Independent Newspapers Pension Scheme (the ‘MIN Scheme’).
CharacteristicsThe defined benefit pension schemes provide pensions to members which are based on the final salary pension payable normally from age 65 plus surviving spouses or dependents benefits following a member’s death. Benefits increase both before and after retirement either in line with statutory requirements or in accordance with the scheme rules. Such increases are either at fixed rates or in line with retail or consumer prices but subject to upper and lower limits. All of the schemes are independent of the Group with assets held independently of the Group. They are governed by Trustees who administer benefits in accordance with the scheme rules and appropriate UK legislation. The schemes each have a professional independent trustee as their chairman with generally half of the remaining Trustees nominated by the members and half by the Group.
Maturity profile and cash flow Across the schemes, the invested assets are expected to be sufficient to pay the uninsured benefits due up to 2045, based on the reporting date assumptions. The remaining uninsured benefit payments, payable from 2046, are due to be funded by a combination of asset outperformance and the deficit contributions currently scheduled to be paid by 2025. The liabilities related 50% to current pensioners and their spouses or dependants and 50% related to deferred pensioners. The average term from the year end to payment of the remaining uninsured benefits is expected to be around 20 years. Uninsured pension payments in 2016, excluding lump sums and transfer value payments, were £41 million, and these are projected to rise to an annual peak in 2039 of £75 million and reducing thereafter.
Funding arrangementsThe funding of the Group’s schemes is subject to UK pension legislation as well as the guidance and codes of practice issued by the Pensions Regulator. Funding targets are agreed between the Trustees and the Group and are reviewed and revised usually every three years. The funding targets must include a margin for prudence above the expected cost of paying the benefits and so are different to the liability value for IAS 19 purposes. The funding deficits revealed by these triennial valuations are removed over time in accordance with an agreed recovery plan and schedule of contributions for each scheme.
The valuations of the schemes as at 31 December 2013 were completed on 9 December 2014. The valuations showed deficits of £336.7 million for the Mirror Schemes, £31.9 million for the Trinity Scheme and £26.7 million for the MIN Scheme.
As part of the agreement of the valuations, deficit funding contributions were agreed at £36.2 million for 2015, 2016 and 2017. Contributions were agreed at around £36 million from 2018 to 2023 and then reduce to around £21 million for 2024 and 2025 after which contributions were due to cease. The combined deficit was expected to be eradicated by 2027 by a combination of the contributions and asset returns. In December 2014, the Group prepaid contributions for 2015 and 2016 of £16.5 million and £0.5 million respectively.
In addition, the Group agreed that in respect of dividend payments in 2015, 2016 and 2017 that additional contributions would be paid at 50% of the excess if dividends in 2015 were above 5 pence per share. For 2016 and 2017 the threshold increases in line with the increase in dividends capped at 10% per annum.
Payments in 2016 were £40.7 million (2015: £20.0 million) comprising £35.7 million of deficit funding and £5.0 million in connection with the share buyback. Payments due in 2016 were £36.2 million less the prepayment in December 2014 of £0.5 million. Alongside the share buyback programme, the Group paid to the defined benefit pension schemes an additional £5.0 million in August 2016 with up to a further £2.5 million payable in 2017. Payments were £29.6 million (2015: £14.3 million) to the Mirror Schemes, £7.0 million (2015: £3.7 million) to the Trinity Scheme and £4.1 million (2015: £2.0 million) to the MIN Scheme.
The future deficit funding commitments are linked to the three-yearly actuarial valuations. There is no link to the IAS 19 valuations which use different actuarial assumptions and are updated at each reporting date. The next funding valuation of the schemes has an effective date of 31 December 2016 and these valuations, which are currently in progress, are required to be completed by 31 March 2018.
Although the funding commitments do not generally impact the IAS 19 position, IFRIC 14 guides companies to consider for IAS 19 disclosures whether any surplus can be recognised as a balance sheet asset and whether any future funding commitments in excess of the IAS 19 liability should be provisioned for. Based on the interpretation of the rules for each of the defined benefit pension schemes, the Group considers that it has an unconditional right to any potential surplus on the ultimate wind-up of each scheme after all benefits to members have been paid. Under IFRIC 14 it is therefore appropriate to recognise any IAS 19 surpluses which may emerge in future, and not to recognise any potential additional liabilities in respect of future funding commitments. This conclusion was reconsidered and reconfirmed during the year following the issuance of an Exposure Draft of changes to IFRIC14 which provides more detailed guidance on this area.
Notes to the consolidated financial statements continuedfor the 53 weeks ended 1 January 2017 (52 weeks ended 27 December 2015)

Strategic Report Governance Financial Statements
Trinity Mirror plc Annual Report 2016 103
Notes to the consolidated financial statements continuedfor the 53 weeks ended 1 January 2017 (52 weeks ended 27 December 2015)
33 Retirement benefit schemes continuedDefined benefit pension schemes continuedRisksValuations for funding and accounting purposes are based on assumptions about future economic and demographic variables. This results in risk of a volatile valuation deficit and the risk that the ultimate cost of paying benefits is higher than the current assessed liability value.
The main sources of risk are:
− Investment risk: a reduction in asset returns (or assumed future asset returns); − Inflation risk: an increase in benefit increases (or assumed future increases); and − Longevity risk: an increase in average life spans (or assumed life expectancy).
These risks are managed by:
− Investing in insured annuity policies: the income from these policies exactly matches the benefit payments for the members covered, removing all of the above risks. At the reporting date the insured annuity policies covered 17% of total liabilities;
− Investing a proportion of assets in government and corporate bonds: changes in the values of the bonds broadly match changes in the values of the uninsured liabilities, reducing the investment risk, however some risk remains as the duration of the bonds are typically shorter than that of the liabilities and so the values may still move differently. At the reporting date this amounted to 47% of assets excluding the insured annuity policies;
− Investing a proportion in equities: with the aim of achieving outperformance and so reducing the deficits over the long term. At the reporting date this amounted to 51% of assets excluding the insured annuity policies; and
− The gradual sale of equities over time to purchase additional annuity policies or bonds: to further reduce risk as the schemes, which are closed to future accrual, mature.
Pension scheme accounting deficits are snapshots at moments in time and are not used by either the Company or Trustees to frame funding policy. The Company and Trustees are aligned in focusing on the long-term sustainability of the funding policy which aims to balance the interests of the Company’s shareholders and members of the schemes. The Company and Trustees are also aligned in reducing pensions risk over the long term and at a pace which is affordable to the Company.
The Group is not exposed to any unusual, entity specific or scheme specific risks. There were no plan amendments, settlements or curtailments in 2016 or during 2015 which resulted in a pension cost.
Actuarial projections at the 2016 year end showed removal of the accounting deficit by 2024 due to scheduled contributions and asset returns at the current target rate.
ResultsFor the purposes of the Group’s consolidated financial statements, valuations have been performed in accordance with the requirements of IAS 19 with scheme liabilities calculated using a consistent projected unit valuation method and compared to the estimated value of the scheme assets at 1 January 2017.
The assets and liabilities of the schemes as at the reporting date are:
MGN Scheme£m
Trinity Scheme
£mMIN Scheme
£mTotal
£m
Present value of uninsured scheme liabilities (1,249.5) (383.6) (131.2) (1,764.3)
Present value of insured scheme liabilities (174.8) (80.0) (108.5) (363.3)
Total present value of scheme liabilities (1,424.3) (463.6) (239.7) (2,127.6)
Invested and cash assets at fair value 855.4 365.3 77.6 1,298.3
Value of liability matching insurance contracts 174.8 80.0 108.5 363.3
Total value of scheme assets 1,030.2 445.3 186.1 1,661.6
Net scheme deficit (394.1) (18.3) (53.6) (466.0)

Financial Statements
Trinity Mirror plc Annual Report 2016104
33 Retirement benefit schemes continued
Defined benefit pension schemes continued
Based on actuarial advice, the assumptions used in calculating the scheme liabilities and the actuarial value of those liabilities are:
2016 2015
Financial assumptions (nominal % pa)
Discount rate 2.65 3.65
Retail price inflation rate 3.20 3.05
Consumer price inflation rate 2.00 1.85
Rate of pension increase in deferment 2.00 1.85
Rate of pension increases in payment 3.85 3.85
Mortality assumptions – future life expectancies from age 65 (years)
Male currently aged 65 21.8 22.0
Female currently aged 65 23.9 24.0
Male currently aged 55 22.7 22.9
Female currently aged 55 24.8 24.9
The fair values of the insurance policies have been taken as equal to the present values of the liabilities that they insure against and by using the same assumptions as those used to value the liabilities.
The estimated impact on the IAS 19 liabilities and on the IAS 19 deficit at the reporting date, due to a reasonably possible change in key assumptions over the next year, are set out in the table below:
Effect onliabilities
£m
Effect ondeficit
£m
Discount rate +/- 0.5% pa -188/+219 -164/+191
Retail price inflation rate +/- 0.5% pa +30/-28 +24/-22
Consumer price inflation rate +/- 0.5% pa +49/-47 +49/-47
Life expectancy at age 65 +/- 1 year +82/-80 +76/-74
The effect on the deficit is usually lower than the effect on the liabilities due to the matching impact on the value of the insurance contracts held in respect of some of the liabilities. Each assumption variation represents a reasonably possible change in the assumption over the next year but might not represent the actual effect because assumption changes are unlikely to happen in isolation.
The estimated impact of the assumption variations make no allowance for changes in the values of invested assets that would arise if market conditions were to change in order to give rise to the assumption variation. If allowance were made, the estimated impact would likely be lower as the values of invested assets would normally change in the same directions as the liability values.
The amount included in the consolidated income statement, consolidated statement of comprehensive income and consolidated balance sheet arising from the Group’s obligations in respect of its defined benefit pension schemes is as follows:
Consolidated income statement2016
£m2015
£m
Pension scheme administrative expenses (2.2) (2.1)
Pension scheme finance charge (10.4) (10.9)
Defined benefit cost recognised in income statement (12.6) (13.0)
Consolidated statement of comprehensive income2016
£m2015
£m
Actuarial gain due to liability experience 14.0 23.9
Actuarial loss due to liability assumption changes (340.7) (16.0)
Total liability actuarial (loss)/gain (326.7) 7.9
Returns on scheme assets greater/(less) than discount rate 137.8 (18.9)
Total loss recognised in statement of comprehensive income (188.9) (11.0)
Notes to the consolidated financial statements continuedfor the 53 weeks ended 1 January 2017 (52 weeks ended 27 December 2015)

Strategic Report Governance Financial Statements
Trinity Mirror plc Annual Report 2016 105
Notes to the consolidated financial statements continuedfor the 53 weeks ended 1 January 2017 (52 weeks ended 27 December 2015)
33 Retirement benefit schemes continued
Defined benefit pension schemes continued
Consolidated balance sheet2016
£m2015
£m
Present value of uninsured scheme liabilities (1,764.3) (1,481.4)
Present value of insured scheme liabilities (363.3) (352.2)
Total present value of scheme liabilities (2,127.6) (1,833.6)
Invested and cash assets at fair value 1,298.3 1,176.2
Value of liability matching insurance contracts 363.3 352.2
Total value of scheme assets 1,661.6 1,528.4
Net scheme deficit (466.0) (305.2)
Non-current assets – retirement benefit assets – 29.4
Non-current liabilities – retirement benefit obligations (466.0) (334.6)
Net scheme deficit (466.0) (305.2)
Net scheme deficit included in consolidated balance sheet (466.0) (305.2)
Deferred tax included in consolidated balance sheet 80.9 55.0
Net scheme deficit after deferred tax (385.1) (250.2)
Movement in net scheme deficit2016
£m2015
£m
Opening net scheme deficit (305.2) (301.2)
Contributions 40.7 20.0
Consolidated income statement (12.6) (13.0)
Consolidated statement of comprehensive income (188.9) (11.0)
Closing net scheme deficit (466.0) (305.2)
Changes in the present value of scheme liabilities2016
£m2015
£m
Opening present value of scheme liabilities (1,833.6) (1,863.2)
Interest cost (65.3) (67.5)
Actuarial gain – experience 14.0 23.9
Actuarial gain/(loss) – change to demographic assumptions 30.0 (4.5)
Actuarial loss – change to financial assumptions (370.7) (11.5)
Benefits paid 98.0 89.2
Closing present value of scheme liabilities (2,127.6) (1,833.6)
Changes in the fair value of scheme assets2016
£m2015
£m
Opening fair value of scheme assets 1,528.4 1,562.0
Interest income 54.9 56.6
Actual return on assets greater/(less) than discount rate 137.8 (18.9)
Contributions by employer 40.7 20.0
Benefits paid (98.0) (89.2)
Administrative expenses (2.2) (2.1)Closing fair value of scheme assets 1,661.6 1,528.4

Financial Statements
Trinity Mirror plc Annual Report 2016106
33 Retirement benefit schemes continued
Defined benefit pension schemes continued
Fair value of scheme assets2016
£m2015
£m
UK equities 208.2 181.7
US equities 217.2 192.8
Other overseas equities 235.7 210.7
Property 26.9 20.4
Corporate bonds 220.0 308.7
Fixed interest gilts 196.8 70.9
Index linked gilts 192.1 81.2
Cash and other 1.4 109.8
Invested and cash assets at fair value 1,298.3 1,176.2
Value of liability matching insurance contracts 363.3 352.2
Fair value of scheme assets 1,661.6 1,528.4
All of the scheme assets have quoted prices in active markets. Scheme assets include neither direct investments in the Company’s ordinary shares nor any property assets occupied nor other assets used by the Group.
34 Financial instruments
Capital risk managementThe Group manages its capital to ensure that entities in the Group will be able to continue as a going concern while maximising the return to shareholders through an optimal balance of debt and equity. The capital structure of the Group consists of debt, which includes the borrowings (note 25), cash and cash equivalents (note 19) and equity attributable to equity holders of the parent comprising share capital and reserves (note 29).
Gearing ratioThe Board reviews the capital structure, including the level of gearing and interest cover, as required. As part of this review, the Board considers the cost of capital and the risks associated with each class of capital.
The gearing ratio and interest cover at the reporting date were as follows:2016
£m2015
£m
Contracted net debt (note 27) (30.5) (92.9)
EBITDA 159.7 132.0
Net debt to EBITDA 0.2 0.7
Adjusted operating profit (note 38) 137.5 109.6
Total interest expense (note 10) (4.9) (2.7)
Interest cover 28.1 40.6
Contracted net debt is defined as long-term and short-term borrowings excluding derivative financial instruments less cash and cash equivalents. EBITDA and operating profit is before non-recurring items, restructuring costs, amortisation and pension administrative expenses. Total interest expense is interest on bank overdrafts and borrowing.
For the period from 1 January 2016 to 19 December 2016, the financial covenants attached to the £80 million term loan and the £60 million revolving credit facility were a minimum interest cover of 5.0 times and a maximum net debt to EBITDA ratio of 2.0 times. For the period from 20 December 2016 to 31 December 2016, the financial covenants attached to the new £110 million revolving credit facility were a minimum interest cover of 5.0 times and a maximum net debt to EBITDA ratio of 2.0 times.
Externally imposed capital requirementThe Group is subject to externally imposed capital requirements based on financial covenants under the private placement loan notes as well as in respect of the new revolving credit facility.
Significant accounting policiesDetails of the significant accounting policies and methods adopted, including the criteria for recognition, the basis of measurement and the basis on which income and expenses are recognised, in respect of each class of financial asset, financial liability and equity instrument, are disclosed in note 3.
Categories of financial instrumentsThe Group’s significant financial assets are cash and trade and other receivables which are classified as loans and receivables and are accordingly held at amortised cost. Trade and other payables, bank overdrafts and loan notes are all designated as other financial liabilities and held at amortised cost. The Group’s derivative financial instruments are classified as fair value through the consolidated income statement.
Notes to the consolidated financial statements continuedfor the 53 weeks ended 1 January 2017 (52 weeks ended 27 December 2015)

Strategic Report Governance Financial Statements
Trinity Mirror plc Annual Report 2016 107
Notes to the consolidated financial statements continuedfor the 53 weeks ended 1 January 2017 (52 weeks ended 27 December 2015)
34 Financial instruments continued
Financial risk management objectivesThe Group’s Treasury function provides services to the business, co-ordinates access to domestic and international financial markets and monitors and manages the financial risks relating to the operations of the Group through regular meetings with the Group Finance Director analysing exposures by degree and magnitude of risk. These risks include market risk (including currency risk, fair value interest rate risk and price risk), credit risk, liquidity risk and cash flow interest rate risk.
The Group seeks to minimise the effects of these risks by using derivative financial instruments where appropriate to hedge these exposures. The use of financial derivatives is governed by policies approved by the Board, which provide written principles on foreign exchange risk, interest rate risk, credit risk, the use of financial derivatives and non-derivative financial instruments and the investment of excess liquidity. Compliance with policies and exposure limits is reviewed by the internal auditors on a continuous basis.
The Group does not enter into or trade financial instruments, including derivative financial instruments, for speculative purposes. The Group’s Treasury function provides regular updates to the Board covering compliance with covenants and other Treasury related matters.
Market riskThe Group’s activities expose it primarily to the financial risks of changes in foreign currency exchange rates and interest rates. The Group has entered into specific derivative financial instruments to manage its exposure to interest rate and foreign currency risk primarily in respect of the private placement loan notes as set out in note 26.
Foreign currency risk managementThe Group undertakes certain transactions denominated in foreign currencies. Hence, exposures to exchange rate fluctuations arise. Exchange rate exposures are managed within approved policy parameters utilising forward exchange contracts where appropriate.
The carrying amounts of the Group’s foreign currency denominated monetary assets and monetary liabilities at the reporting date are as follows:
Liabilities Assets
2016£m
2015£m
2016£m
2015£m
Euro – – 0.7 1.5
US$ (66.5) (64.1) 0.6 0.8
Foreign currency sensitivity analysisThe Group is mainly exposed to the Euro and US$.
The Euro exposure arises on sales of newspapers in Europe. The Euro sales represent less than 1% (2015: 1%) of Group revenue. Euro balances are kept on deposit and used to fund Euro costs. When Euros on deposit build to a target balance they are converted into sterling. The Group does not hedge the Euro income or deposits because the risk of foreign exchange movements is not deemed to be significant.
The US$ exposure arises primarily on the private placement loan notes which are US$ denominated and fixed interest. At the time of the private placement loan notes issue, the Group entered into cross-currency interest rate swaps to change the US$ principal and US$ fixed interest profile of the debt to sterling principal and sterling floating interest. The timing of the swaps exactly match every private placement principal and interest payment due. As a result the Group is not subject to any US$ foreign exchange exposure on its private placement loan notes and matching swaps. The Group’s consolidated balance sheet shows the private placement loan notes converted to sterling at the reporting date currency rate. The matching swaps are carried at fair value which represents the value of the fixed to floating swap, the currency element of the principal payments due and the currency element of the interest payments due. The difference between the valuation approaches gives rise to a charge or credit to the consolidated income statement.
The following tables detail the Group’s sensitivity to a 10% increase and decrease in the sterling rate against the Euro and US$ in the current and prior period. A 10% movement in exchange rates based on the level of foreign currency denominated monetary assets and liabilities represent the assessment of a reasonably possible change in foreign exchange rates. The sensitivity analysis includes only outstanding foreign currency denominated monetary items including external loans that are unhedged.
Euro currency impact US$ currency impact
10% strengthening of sterling2016
£m2015
£m2016
£m2015
£m
Decrease in profit (0.1) (0.1) (0.1) (0.1)
Decrease in equity – – – –
Euro currency impact US$ currency impact
10% weakening of sterling2016
£m2015
£m2016
£m2015
£m
Increase in profit 0.1 0.2 0.1 0.1
Increase in equity – – – –

Financial Statements
Trinity Mirror plc Annual Report 2016108
34 Financial instruments continued
Forward foreign exchange contractsIt is the policy of the Group to enter into forward foreign exchange contracts only to cover specific foreign currency payments such as significant capital expenditure. During the current and prior period no contracts were entered into.
Interest rate risk managementThe Group is exposed to interest rate risk as it borrows funds at both fixed and floating interest rates. The risk is managed by the Group by maintaining an appropriate mix between fixed and floating rate borrowings, by the use of interest rate swap contracts and forward interest rate contracts.
Hedging activities are evaluated regularly to align with interest rate views and defined risk appetite; ensuring optimal hedging strategies are applied, by either positioning the balance sheet or protecting interest expense through interest rate cycles.
The Group’s exposures to interest rates on the financial assets and liabilities are detailed in the liquidity risk management section of this note.
Interest rate sensitivity analysisThe sensitivity analysis below has been determined based on the exposure to interest rates for both derivatives and non-derivative instruments at the reporting date. For floating rate liabilities, the analysis is prepared using the Group’s monthly cash forecasting model. A 1% increase in interest rates has been used and represents the assessment of a reasonably possible change.
If interest rates had been 1% higher/lower and all other variables were held constant, the Group’s profit for the period would decrease/increase by £0.8 million. This is mainly attributable to the Group’s exposure to interest rates on its variable rate borrowings.
Interest rate swap contractsUnder interest rate swap contracts, the Group agrees to exchange the difference between fixed and floating rate interest amounts calculated on agreed notional principal amounts. Such contracts enable the Group to mitigate the risk of changing interest rates on the fair value of issued fixed rate debt held and the cash flow exposures on the issued variable rate debt held. The fair value of the interest rate swaps at the reporting date is determined by discounting the future cash flows using yield curves at the reporting date and the credit risk inherent in the contract and is disclosed below.
Other price risksThe Group has no significant listed equity investments and is not directly exposed to equity price risk. The Group has indirect exposure through its defined benefit pension schemes.
Credit risk managementCredit risk refers to the risk that a counter-party with the Group will default on its contractual obligations resulting in financial loss to the Group. The Group has adopted a policy of only dealing with creditworthy counterparties, with the exception of exceptional circumstances, such as the financial crisis in the past, the Group only transacts with financial institutions that are rated the equivalent to investment grade and above. This information is supplied by independent rating agencies where available and, if not, the Group uses other publicly available financial information and its own trading records to rate its major customers. The Group’s exposure and credit ratings of its counterparties are reviewed by the Group Finance Director and where material the Board at appropriate times and the aggregate value of transactions concluded is spread amongst approved counterparties.
Trade receivables consist of a large number of customers spread across diverse sectors. Ongoing credit evaluation is performed on the financial condition of trade receivables. The Group does not have any significant credit risk exposure to any single counterparty or any group of counterparties having similar characteristics. The Group defines counterparties as having similar characteristics if they are connected entities. Concentration of credit risk with a single counterparty is limited by reference to the long-term credit ratings assigned for that counterparty by Standard and Poor’s.
The credit risk on liquid funds and derivative financial instruments is limited because the counterparties are banks with high credit ratings assigned by international credit rating agencies.
The carrying amount of financial assets recorded in the financial statements, which is net of impairment losses, represents the Group’s maximum exposure to credit risk.
The table below shows the internal credit limit and amount on deposit with the Group’s major counterparties at the reporting date using the Standard & Poor’s and Moody’s credit rating symbols:
Financial institution Location Rating
2016Credit limit
£m
2016Balance
£m
2015Credit limit
£m
2015Balance
£m
Santander UK London A 5.0 10.1 5.0 15.0
Lloyds Bank plc London A 5.0 7.4 5.0 8.3
National Westminster Bank London BBB+ – 10.4 – 6.2
Royal Bank of Scotland plc London BBB+ – 4.7 – 25.7
Banco de Sabadell (UK) London Baa3 – 5.0 – –
Ulster Bank plc Dublin BBB – 0.2 – 0.2
The Board has agreed that due to the risk profile of and the substantial Government shareholding in Lloyds Bank plc and Royal Bank of Scotland plc/National Westminster Bank plc/Ulster Bank plc that the Group can hold surplus cash in these banks, subject to continued review. The Board has also agreed that the Group can hold surplus cash with Santander UK and Banco de Sabadell (UK) as they are two of the Group’s lending banks.
Notes to the consolidated financial statements continuedfor the 53 weeks ended 1 January 2017 (52 weeks ended 27 December 2015)

Strategic Report Governance Financial Statements
Trinity Mirror plc Annual Report 2016 109
Notes to the consolidated financial statements continuedfor the 53 weeks ended 1 January 2017 (52 weeks ended 27 December 2015)
34 Financial instruments continued
Liquidity risk managementLiquidity risk results from having insufficient financial resources to meet day-to-day fluctuations in working capital and cash flow. Ultimate responsibility for liquidity risk management rests with the Board. The Group manages liquidity risk by maintaining adequate reserves, banking facilities and reserve borrowing facilities, by continuously monitoring forecast and actual cash flows and by matching the maturity profiles of financial assets and liabilities.
Liquidity risk and interest risk tablesThe following tables detail the Group’s remaining contractual maturity for its non-derivative and derivative financial instruments. The tables have been drawn up based on undiscounted cash flows of financial liabilities based on the earliest date on which the Group could be required to pay. The table includes both principal and interest cash flows. Where the amount payable or receivable is not fixed, the amount disclosed has been determined by reference to the projected interest and foreign currency rates as illustrated by the yield curves existing at the reporting date.
Financial institution
Less than1 year
£m1–2 years
£m
2016
Non-derivative financial instruments:
Sterling fixed interest rate – –
Non-sterling fixed interest rate (83.9) –
Derivative financial instruments:
Financial assets 83.9 –
Financial liabilities (81.8) –
2015
Non-derivative financial instruments:
Sterling fixed interest rate – –
Non-sterling fixed interest rate (5.0) (69.4)
Derivative financial instruments:
Financial assets 5.0 69.4
Financial liabilities (1.5) (67.7)
The non-derivative financial instruments include the private placement loan notes. The non-sterling fixed interest rate liabilities arise on the private placement loan notes. The related swap is shown under derivative instruments.
Swaps are gross settled and each leg of the swap is split into either a financial asset or liability. The weighted average effective interest rate is set out in note 25.
At the reporting date the Group has access to financial facilities of which the total unused amount is £110 million (2015: £60.0 million). The facility expires on 19 December 2021.
The Group expects to meet its obligations from cash held on deposit, operating cash flows and its committed financing facilities.
Fair value of financial instrumentsThe fair value of the Group’s financial instruments is set out in notes 25 and 26.

Financial Statements
Trinity Mirror plc Annual Report 2016110
35 Related party transactionsThe immediate parent and controlling party of the Group is Trinity Mirror plc. Transactions between the Company and its subsidiaries, which are related parties of the Company, have been eliminated on consolidation and are not disclosed in this note. Transactions with the retirement benefit schemes are disclosed in note 33. Details of other related party transactions are disclosed below.
Trading transactionsThe Group traded with the following associated undertakings: PA Group Limited and Local World Holdings Limited (up to 13 November 2015).
PA Group LimitedThe Group earned revenue of nil (2015: nil) and the Group incurred charges for services received of £1.9 million (2015: £1.9 million). The amount outstanding at the reporting date amounted to nil (2015: nil) owed to PA Group Limited.
Local World Holdings LimitedIn 2015 the Group earned revenue of £5.7 million and the Group incurred charges for services received of nil.
Sales of goods and services to related parties would be made at the Group’s usual list prices less average volume discounts. Purchases were made at market prices discounted to reflect volume purchase and the relationship between the parties. Any outstanding amounts will be settled by cash payment.
Compensation of key management personnelKey management includes the non-executive directors, the executive directors and the direct reports of the Chief Executive.
2016£m
2015£m
Short-term employee benefits (4.6) (4.6)
Retirement benefits (0.4) (0.4)
Share-based payments in the period (1.4) (1.1)
(6.4) (6.1)
The remuneration of directors and other key executives is determined by the Remuneration Committee having regard to competitive market position and performance of individuals. Further information regarding the remuneration of individual directors is provided in the Remuneration Report.
36 Disposal of subsidiary undertakingIn August 2016, the Group disposed of Rippleffect Limited. The net assets at the date of disposal were as follows:
£m
Goodwill 0.5
Trade and other receivables 2.3
Trade and other payables (1.0)
Net assets 1.8
Profit on disposal –
Total consideration 1.8
Satisfied by:
Cash consideration received 2.0
Transaction costs (0.2)
Total consideration 1.8
Net cash flow arising on disposal:
Cash consideration less transaction costs 1.8
Net cash inflow 1.8
37 Acquisition of associate undertakingOn 6 October 2016, the Group acquired a 50.0% equity interest in Brand Events TM Limited (renamed from Brand Events 1 Limited) for a cash consideration of £0.8 million
Notes to the consolidated financial statements continuedfor the 53 weeks ended 1 January 2017 (52 weeks ended 27 December 2015)

Strategic Report Governance Financial Statements
Trinity Mirror plc Annual Report 2016 111
Notes to the consolidated financial statements continuedfor the 53 weeks ended 1 January 2017 (52 weeks ended 27 December 2015)
38 Reconciliation of statutory results to adjusted resultsFor the 53 weeks ended 1 January 2017
Statutoryresults
£m
Non-recurring items(a)
£mAmortisation(b)
£m
Pensioncharges(c)
£m
Restructuringcharges(d)
£m
Finance costs(e)
£m
Taxitems(f)
£m
Adjustedresults
£m
Revenue 713.0 – – – – – – 713.0
Operating profit 93.5 26.1 0.6 2.2 15.1 – – 137.5
Profit before tax 76.5 26.1 0.6 12.6 15.1 2.3 – 133.2
Profit after tax 69.5 22.0 0.5 10.1 12.1 1.8 (9.8) 106.2
Basic EPS (p) 24.9 8.0 0.2 3.6 4.3 0.6 (3.5) 38.1
For the 52 weeks ended 27 December 2015Statutory
results£m
Non-recurring items(a)
£mAmortisation(b)
£m
Pensioncharges(c)
£m
Restructuringcharges(d)
£m
Finance costs(e)
£m
Taxitems(f)
£m
Adjustedresults
£m
Revenue 592.7 – – – – – – 592.7
Operating profit 82.2 5.7 4.3 2.1 15.3 – – 109.6
Profit before tax 67.2 5.7 4.3 13.0 15.3 2.0 – 107.5
Profit after tax 77.0 (1.5) 3.9 10.4 12.2 1.6 (17.2) 86.4
Basic EPS (p) 30.2 (0.6) 1.5 4.1 4.8 0.6 (6.7) 33.9
(a) Non-recurring items relate to the items charged or credited to operating profit as set out in note 8.
(b) Amortisation of the Group’s intangible assets and amortisation included in share of results of associates as set out in notes 15 and 17.
(c) Pension finance charge and pension administrative expenses relating to the defined benefit pension schemes as set out in note 33.
(d) Restructuring charges in respect of cost reduction measures as set out in note 22.
(e) Impact of the translation of foreign currency borrowings and fair value changes on derivative financial instruments as set out in note 10.
(f) Tax items relate to the impact of tax legislation changes due to the change in the future corporation tax rate on the opening deferred tax position and prior year tax adjustments included in the taxation credit or charge as set out in note 11.
39 Contingent liabilitiesThere is potential for further liabilities to arise from the outcome or resolution of the ongoing historical legal issues. Due to the present uncertainty in respect of the nature, timing or measurement of any such liabilities it is too soon to be able to reliably estimate how these matters will proceed and their financial impact.

Financial Statements
Trinity Mirror plc Annual Report 2016112
Parent company balance sheetat 1 January 2017 (at 27 December 2015) Company registration number 82548
notes2016
£m2015
£m
Fixed assets
Investments in subsidiary undertakings 4 811.8 980.1
811.8 980.1
Current assets
Debtors
– due within one year 5 21.8 5.6
– due after more than one year 5 – 3.5
Cash at bank and in hand 20.1 43.7
41.9 52.8
Creditors: amounts falling due within one year
Borrowings 7 (81.2) (15.0)
Other creditors 8 (0.9) (134.9)
(82.1) (149.9)
Net current liabilities (40.2) (97.1)
Total assets less current liabilities 771.6 883.0
Creditors: amounts falling due after more than one year
Borrowings 7 – (132.6)
Deferred tax liabilities 6 (0.3) (0.7)
(0.3) (133.3)
Net assets 771.3 749.7
Equity capital and reserves
Called-up share capital 9 28.3 28.3
Share premium account 10 606.7 606.7
Merger reserve 11 37.9 37.9
Capital redemption reserve 11 4.4 4.4
Profit and loss account 11 94.0 72.4
Equity shareholders’ funds 771.3 749.7
The Company reported a retained profit for the period after dividends of £24.4 million (2015: £24.6 million). These parent company financial statements were approved by the Board of directors and authorised for issue on 27 February 2017.
They were signed on its behalf by:
Simon Fox Vijay VaghelaChief Executive Group Finance Director
Parent company statement of changes in equityfor the 53 weeks ended 1 January 2017 (52 weeks ended 27 December 2015)
Called-up share capital
£m
Share premium account
£mMerger reserve
£m
Capital redemption
reserve£m
Profit and loss account
£mTotal
£m
At 28 December 2014 25.8 606.7 – 4.4 46.5 683.4
Profit for the period – – – – 37.1 37.1
Issue of shares 2.5 – 37.9 – – 40.4
Credit to equity for equity-settled share-based payments – – – – 1.3 1.3
Dividends paid – – – – (12.5) (12.5)
At 27 December 2015 28.3 606.7 37.9 4.4 72.4 749.7
Profit for the period – – – – 39.0 39.0
Credit to equity for equity-settled share-based payments – – – – 1.5 1.5
Purchase of shares for LTIP – – – – (2.0) (2.0)
Purchase of own shares – – – – (2.3) (2.3)
Dividends paid – – – – (14.6) (14.6)
At 1 January 2017 28.3 606.7 37.9 4.4 94.0 771.3

Strategic Report Governance Financial Statements
Trinity Mirror plc Annual Report 2016 113
1 Basis of preparationThe financial statements of Trinity Mirror plc have been prepared in accordance with Financial Reporting Standard 101, ‘Reduced Disclosure Framework’ (FRS 101). The financial statements have been prepared under the historical cost convention and in accordance with the Companies Act 2006. The preparation of financial statements in conformity with FRS 101 requires the use of certain key accounting estimates. It also requires management to exercise its judgement in the process of applying the Company’s accounting policies.
Profit for the financial yearAs permitted by section 408 of the Companies Act 2006, the Company has elected not to present its own profit and loss account for the period. The Company reported a retained profit for the period after dividends of £24.4 million (2015: £24.6 million). The audit fees relating to the Company are disclosed in note 6 in the notes to the consolidated financial statements and are borne by another Group company.
Impact of amendments to accounting standardsNone of the standards, interpretations and amendments effective for the first time from 28 December 2015 have had a material effect on the financial statements. The impact of the conversion to FRS 101 is disclosed in note 13.
The Company has applied the exemption available under FRS 101 in relation to paragraphs 30 and 31 of IAS 8 ‘Accounting policies, changes in accounting estimates and errors’ (requirement for the disclosure of information when an entity has not applied a new IFRS that has been issued and is not yet effective).
2 Significant accounting policiesFixed asset investmentsFixed asset investments are stated at cost less provision for any impairment. An impairment review is undertaken at each reporting date or more frequently when there is an indication that the recoverable amount is less than the carrying amount. Recoverable amount is the higher of fair value less costs to sell and value in use. In assessing value in use the estimated future cash flows of the cash-generating units relating to the investment are discounted to their present value using a post-tax discount rate that reflects current market assessments of the time value of money and risks specific to the asset for which estimates of future cash flows have not been adjusted. If the recoverable amount of the cash-generating units relating to the investment is estimated to be less than its carrying amount, the carrying value of the investment is reduced to its recoverable amount. An impairment loss is recognised in the income statement in the period in which it occurs and may be reversed in subsequent periods.
Foreign currencyTransactions denominated in foreign currencies are translated at the rates of exchange prevailing on the date of the transactions. At each reporting date, items denominated in foreign currencies are retranslated at the rates prevailing on the reporting date. Exchange differences arising on settlement and on retranslation are included in the consolidated income statement for the period.
Tax Corporation tax payable is based on taxable profit for the period. Taxable profit differs from profit before tax as reported in the profit and loss account because it excludes items of income or expense that are taxable or deductible in other years and it further excludes items that are never taxable or deductible. The Company’s liability for tax is calculated using tax rates that have been enacted or substantively enacted by the reporting date. Deferred tax is the tax expected to be payable or recoverable on differences between the carrying amounts of assets and liabilities in the parent company’s financial statements and the corresponding tax bases used in the computation of taxable profit and is accounted for using the balance sheet liability method. Deferred tax is calculated at the tax rates that are expected to apply in the period when the liability is settled or the asset is realised. Deferred tax is charged or credited in the profit and loss account except when it relates to items charged or items charged or credited directly to equity in which case the deferred tax is also dealt with in equity. Deferred tax liabilities are generally recognised for all taxable temporary differences and deferred tax assets are recognised to the extent that it is probable that taxable profits will be available against which deductible temporary differences can be utilised. Deferred tax liabilities are recognised for taxable temporary differences arising on investments in subsidiaries and associates, except where the Company is able to control the reversal of the temporary difference and it is probable that the temporary difference will not reverse in the foreseeable future. The carrying amount of deferred tax assets is reviewed at each reporting date and reduced to the extent that it is no longer probable that sufficient taxable profits will be available to allow all or part of the asset to be recovered.
Financial instrumentsFinancial assets and financial liabilities are recognised in the parent company balance sheet when the Company becomes a party to the contractual provisions of the instrument.
Cash and cash equivalentsCash and cash equivalents comprise cash in hand and demand deposits.
BorrowingsSterling interest bearing loans and bank overdrafts are recorded at the proceeds received, net of direct issue costs. Foreign currency interest bearing loans are recorded at the exchange rate at the reporting date. Finance charges, including premiums payable on settlement or redemption and direct issue costs, are accounted for on an accruals basis in the profit and loss account using the effective interest method and are added to the carrying amount of the instrument to the extent that they are not settled in the period in which they arise. All other borrowing costs are recognised in profit and loss account in the period in which they are incurred.
Derivative financial instrumentsThe Company uses derivative financial instruments, including currency swaps, cross-currency interest rate swaps, interest rate swaps and other hedging instruments to minimise exposure to the financial risks of changes in foreign currency exchange rates and interest rates. The Company does not use derivative financial instruments for speculative purposes. The Company has elected not to apply hedge accounting. Derivative financial instruments are separately recognised at fair value in the parent company financial statements. Changes in the fair value of derivative financial instruments are recognised immediately in the profit and loss account. Derivatives embedded in commercial contracts are treated as separate derivatives when their risks and characteristics are not closely related to those of the underlying contract, with unrealised gains or losses reported in the profit and loss account.
Notes to the parent company financial statementsfor the 53 weeks ended 1 January 2017 (52 weeks ended 27 December 2015)

Financial Statements
Trinity Mirror plc Annual Report 2016114
Notes to the parent company financial statements continuedfor the 53 weeks ended 1 January 2017 (52 weeks ended 27 December 2015)
2 Significant accounting policies continuedShare-based paymentsThe Company issues equity-settled benefits to certain employees. These equity-settled share-based payments are measured at fair value at the date of grant taking advice from third party experts. The fair value determined at the grant date is expensed on a straight-line basis over the vesting period, based on the Company’s estimate of shares that will eventually vest and adjusted for the effect of non-market based vesting conditions. Fair value is measured by use of a stochastic (Monte-Carlo binomial) model or a modified Black-Scholes calculation. The expected life used in the model has been adjusted, based on the directors’ best estimates, for the effects of non-transferability, exercise restrictions, and behavioural considerations.Share capitalOrdinary shares are classified as equity. Incremental costs directly attributable to the issue of new shares or options are shown in equity as a deduction from the proceeds, net of tax. Where the Company’s own shares are purchased, the consideration paid including any directly attributable incremental costs, net of income taxes, is deducted from equity attributable to the Company’s equity holders until the shares are cancelled, reissued or disposed of. Where such shares are cancelled, the nominal value of shares cancelled is shown in the capital redemption reserve. Where such shares are subsequently reissued or disposed of, any consideration received, net of any directly attributable incremental transaction costs and the related income tax effects, is included in equity attributable to the Company’s equity holders.LeasesLeases are classified as finance leases whenever the terms of the lease transfer substantially all the risks and rewards of ownership to the Company. All other leases are classified as operating leases. Rentals payable under operating leases are charged to the profit and loss account on a straight-line basis over the lease term. Benefits received as incentives to enter into the agreement are spread on a straight-line basis over the lease term.Financial instruments – disclosuresThe Company has taken advantage of the exemption provided in IFRS 7 ‘Financial Instruments: Disclosures’ and included disclosures relating to financial instruments in the notes to the consolidated financial statements.Cash flow statementThe Company has utilised the exemption provided under IAS 7 ‘Statement of Cash Flows’ and has not presented a cash flow statement. A consolidated cash flow statement has been presented in the Group’s consolidated financial statements.Related party transactionsThe Company have taken advantage of the exemptions of IAS 24 ‘Related Party Disclosures’ and included disclosures relating to related parties in the notes to the consolidated financial statements.Key sources of estimation uncertainty The key assumptions concerning the future and other key sources of estimation uncertainty that have a significant risk of causing a material adjustment to the carrying amounts of assets and liabilities within the next financial year, are discussed below: Impairment of investments (note 4) In addition to the areas of judgement outlined below, there are also sources of estimation uncertainty in the value in use calculation. The most significant area of uncertainty relates to expected future cash flows for each cash-generating unit.Critical judgements in applying the Company’s accounting policies In the process of applying the Company’s accounting policies, described above, management has made the following judgements that have the most significant effect on the amounts recognised in the financial statements: Impairment of investments (note 4) Determining whether investments are impaired requires an estimation of the value in use of the cash-generating unit to which these have been allocated. It also requires assessment of the appropriateness of the cash-generating unit at each reporting date. The value in use calculation requires the Company to estimate the future cash flows expected to arise from the cash-generating unit and a suitable discount rate in order to calculate present value. Projections are based on both internal and external market information and reflect past experience. The discount rate reflects a long-term equity and debt mix based on the period end enterprise value assuming a long-term debt to EBITDA ratio of 2.5 times.
3 Staff costsThe average number of persons, including directors, employed by and charged to the Company in the period was:
2016Number
2015Number
Administration 8 8
A number of employees (not directors) who have contracts of employment with the Company are charged to other Group companies and their staff costs are disclosed in those companies’ statutory accounts.
All employees are employed in the United Kingdom.2016
£m2015
£m
Staff costs, including directors’ emoluments, incurred during the period were:
Wages and salaries 1.5 1.7
Social security costs 0.2 0.3
Share-based payments charge 1.5 1.5
Pension benefit 0.2 0.2
3.4 3.7

Strategic Report Governance Financial Statements
Trinity Mirror plc Annual Report 2016 115
Notes to the parent company financial statements continuedfor the 53 weeks ended 1 January 2017 (52 weeks ended 27 December 2015)
3 Staff costs continuedDisclosure of individual directors’ remuneration, share options, long-term incentive schemes, pension contributions and pension entitlements required by the Companies Act 2006 and those elements specified for audit by the Financial Conduct Authority are shown in the tables in the Remuneration Report on pages 45 to 61 and form part of these parent company financial statements. Further details of share-based payments are contained in note 32 in the notes to the consolidated financial statements.
4 Investments in subsidiary undertakingsShares in
subsidiaryundertakings
£m
Cost at beginning of period 1,680.1
Disposals (168.3)
Cost at end of period 1,511.8
Provisions for impairment at beginning and end of period (700.0)
Net book value at beginning of period 980.1
Net book value at end of period 811.8
On 23 December 2016, the Company transferred the entire issued share capital of Local World Holdings Limited to Trinity Mirror Regionals Limited for book value of £168.3 million settled through intercompany.
At the period end reporting date an impairment review was undertaken which indicated that no impairment in the investments held by the Company was required (2015: nil). The impairment review was performed using the same assumptions used in the impairment review performed in relation to the Group’s assets which are disclosed in note 15 in the notes to the consolidated financial statements. The impairment review is sensitive to a change in key assumptions used in the value in use calculations relating to the discount rate and future growth rates.
A reasonably possible change of 1% in the discount rate or of 1% in the growth rate beyond 2018 would not change the conclusion of the impairment review.
A combination of reasonably possible changes in key assumptions, such as print revenue declining at a faster rate than forecast or digital revenue growth being significantly lower than forecast, could lead to a future impairment. An increase of 1.5 percentage points in the discount rate or a decrease of 1.5 percentage points in the growth rate would remove the headroom.
Details of the Company’s subsidiary undertakings at 1 January 2017 are set out on pages 119 and 120.
5 Debtors2016
£m2015
£m
Amounts falling due within one year:
Other debtors 7.0 5.6
Derivative financial instruments 14.8 –
21.8 5.6
Amounts falling due after more than one year:
Derivative financial instruments – 3.5
The details of the Company’s derivative financial instruments are the same as those of the Group and are disclosed in note 26 in the notes to the consolidated financial statements.
6 Deferred tax liabilities2016
£m2015
£m
Opening liability (0.7) (1.1)
Change of tax rate applying to deferred tax 0.1 0.1
Revised opening balance (0.6) (1.0)
Tax credit 0.3 0.3
Closing liability (0.3) (0.7)
7 Borrowings
The details of the Company’s borrowings are the same as those of the Group and are disclosed in note 25 in the notes to the consolidated financial statements.

Financial Statements
Trinity Mirror plc Annual Report 2016116
8 Other creditors2016
£m2015
£m
Amounts owed to subsidiary undertakings (0.4) (133.1)
Share-based payments (0.3) (0.3)
Accruals and deferred income (0.2) (1.5)
(0.9) (134.9)
The share-based payments provision relates to National Insurance obligations attached to the future crystallisation of awards.
9 Called-up share capitalThe details of the Company’s called-up share capital and dividends are disclosed in notes 29 and 12 respectively in the notes to the consolidated financial statements.
10 Share premium accountThe details of the Company’s share premium account are disclosed in note 31 in the notes to the consolidated financial statements.
11 Other reserves
Merger reserve
£m
Capital redemption
reserve£m
Profit and loss account
£m
Opening balance 37.9 4.4 72.4
Transfer of retained profit for the period before dividends – – 39.0
Purchase of shares for LTIP – – (2.0)
Purchase of own shares – – (2.3)
Share-based payments credit – – 1.5
Dividends paid – – (14.6)
Closing balance 37.9 4.4 94.0
The merger reserve comprises the premium on the shares allotted in relation to the acquisition of Local World net of £0.8 million of issue costs. The capital redemption reserve represents the nominal value of the shares purchased and subsequently cancelled as part of share buyback programmes.
12 Operating lease commitmentsThe Company has total commitments under non-cancellable operating leases in respect of land and buildings as follows:
2016£m
2015£m
Within one year 7.0 7.0
Greater than one and less than five years 12.0 16.8
Greater than five years 17.0 19.2
36.0 43.0
The Company has total future minimum lease payments with tenants under non-cancellable property operating leases:2016
£m2015
£m
Within one year 2.2 2.2
Greater than one and less than five years 1.0 3.2
3.2 5.4
13 First time adoption of FRS 101This is the first year which the Company has prepared its financial statements under FRS 101. The previous financial statements for the year ended 27 December 2015 were prepared under old UK GAAP. The date of transition to FRS 101 for the Company is 29 December 2014.
The impact of the changes in accounting policies as a result of the transition from old UK GAAP as previously reported and FRS 101 were immaterial so none of the prior year balances have required restatement.
Notes to the parent company financial statements continuedfor the 53 weeks ended 1 January 2017 (52 weeks ended 27 December 2015)

Strategic Report Governance Financial Statements
Trinity Mirror plc Annual Report 2016 117
Shareholder information
Registered officeOne Canada Square Canary Wharf, London E14 5AP, United Kingdom Telephone: +44 (0) 207 293 3000 Company website: www.trinitymirror.com Registered in England and Wales No. 82548
Annual General MeetingThe Notice of Meeting sets out the resolutions being proposed at the Annual General Meeting which will be held at 11.30 am on Thursday 4 May 2017 at the Museum of Docklands, No.1 Warehouse, West India Dock Road, London E14 4AL.
AuditorDeloitte LLP 2 New Street Square, London EC4A 3BZ
Registrar (the ‘Registrar’)Equiniti Limited Aspect House, Spencer Road, Lancing, West Sussex BN99 6DA Telephone: 0371 384 2235* For overseas shareholders: +44(0) 121 415 7047* Lines are open from 8.30 am to 5.30 pm, Monday to Friday, excluding UK bank holidays.
If you have any queries regarding your shareholding, please contact the Registrar.
Share price informationAs well as using the Trinity Mirror website to view details of the current and historical share price, shareholders can find share prices listed in most national newspapers. For a real-time buying or selling price, you should contact a stockbroker.
E-communicationsTrinity Mirror encourages its shareholders to consider receiving shareholder information electronically. Electing to receive shareholder communications in this way allows shareholders to access information quickly and securely. It also reduces company costs by decreasing the amount of paper it needs to use and minimises its environmental impact.
To register for this service please visit www.shareview.co.uk.
Share dealing and ShareviewThe Company’s shares can be traded through most banks, building societies and stockbrokers. Additionally, shareholders can buy and sell shares through a telephone and internet service provided by the Company’s Registrar, Equiniti.
Shareview, a website operated by Equiniti, allows shareholders to view the details of their shareholding, register for e-communications and send voting instructions electronically if they have received a voting form with an electronic reference or signed up for Shareview. For more information about both services log on to www.shareview.co.uk or call 03456 037037** for Shareview Dealing.** Lines are open Monday to Friday from 8.00 am to 4.30 pm for Shareview Dealing and until 6.00 pm for any other Shareview Dealing enquiries.
ADRsTrinity Mirror has a sponsored Level 1 American Depositary Receipt (ADR) programme for which BNY Mellon acts as Depositary. Each ADR is equivalent to two Trinity Mirror Group ordinary shares. Dividends are paid in US dollars via the Depositary. Details of the ADR programme are as follows:
Exchange: OTC (Over-The-Counter) Symbol: TNMRY, CUSIP: 89653Q105, Ratio (ADR: Ord) 1:2
For more information, contact: BNY Mellon Shareholder Services P.O. Box 358516 Pittsburgh PA 15252-8516 USA Toll free for US domestic callers: 1–888–BNY–ADRs International: 1–201–680–6825 Email: [email protected]

Financial Statements
Trinity Mirror plc Annual Report 2016118
Warning to shareholders – boiler room scamsIn recent years, many companies have become aware that their shareholders have received unsolicited phone calls or correspondence concerning investment matters. These are typically from overseas based ‘brokers’ who target UK shareholders, offering to sell them what often turn out to be worthless or high risk shares in US or UK investments. These operations are commonly known as ‘boiler rooms’. These ‘brokers’ can be very persistent and extremely persuasive. A 2006 survey by the Financial Services Authority reported that the average amount lost by investors is around £20,000.
It is not just the novice investor that has been duped in this way; many of the victims had been successfully investing for several years. Shareholders are advised to be very wary of any unsolicited advice, offers to buy shares at a discount or offers of free company reports.
How to avoid share fraud1. Keep in mind that firms authorised by the FCA are unlikely to contact you out of the blue with an offer to buy or sell shares.
2. Do not get into a conversation, note the name of the person and firm contacting you and then end the call.
3. Check the Financial Services Register from www.fca.org.uk to see if the person and firm contacting you is authorised by the FCA.
4. Beware of fraudsters claiming to be from an authorised firm, copying its website or giving you false contact details.
5. Use the firm’s contact details listed on the Register if you want to call it back.
6. Call the FCA on 0800 111 6768 if the firm does not have contact details on the Register or you are told they are out of date.
7. Search the list of unauthorised firms to avoid at www.fca.org.uk/scams.
8. Consider that if you buy or sell shares from an unauthorised firm you will not have access to the Financial Ombudsman Service or Financial Services Compensation Scheme.
9. Think about getting independent financial and professional advice before you hand over any money.
10. Remember: if it sounds too good to be true, it probably is!
Report a scamIf you are approached about an investment scam you should tell the FCA using the share fraud reporting form at www.fca.org.uk/scams, where you can find out more about investment scams. You can also call the FCA Consumer Helpline on 0800 111 6768.
If you have already paid money to share fraudsters you should contact Action Fraud on 0300 123 2040.
Details of any share dealing facilities that the Company endorses will be included in Company mailings.
Analysis of share register at 1 January 2017As at 1 January 2017, there were 12,861 holders of ordinary shares whose shareholdings are analysed below:
RangeTotal number
of holdingsPercentage of
total holdersTotal number
of sharesPercentage of
ordinary shares
1–50 389 3.02% 11,457 0.00%
51–100 4,759 37.01% 353,565 0.12%
101–500 5,590 43.46% 1,181,924 0.42%
501–1,000 814 6.33% 589,844 0.21%
1,001–10,000 1,022 7.95% 2,904,330 1.02%
10,001–50,000 117 0.91% 2,508,907 0.89%
50,001–100,000 39 0.30% 2,766,040 0.98%
100,001–500,000 68 0.53% 15,206,935 5.36%
500,001–1,000,000 24 0.19% 17,399,515 6.14%
1,000,001+ 39 0.30% 240,537,054 84.86%
Totals 12,861 100.00% 283,459,571 100.00%
Investor relationsWe communicate with the financial community on a regular and ongoing basis to support our stakeholders in their investment decision process. While the investor relations programme is driven by statutory reporting requirements, it also contains a strong element of additional communication in the form of meetings and presentations.
Shareholder information continued

Strategic Report Governance Financial Statements
Trinity Mirror plc Annual Report 2016 119
Subsidiary undertakings
The following subsidiary undertakings are 100% owned and incorporated in the United Kingdom, with a registered office at One Canada Square, Canary Wharf, London, E14 5AP.
Subsidiary name
0800 Recruit Limited
08000 Recruit Limited
Ad-Mag (North East) LimitedAdvertiser North London Group (Holdings) Limited
Advertiser North London Limited
AMRA Limited
Arrow Interactive Limited
Birmingham Live Limited
Birmingham Post & Mail (Exhibitions) Limited
Birmingham Post & Mail Trustees LimitedBlackmore Vale Publishing Company Limited
BPM Media (Midlands) Limited
Buy Sell Limited
Camberry Limited
CDE Services Limited
Century Communications Ltd.
Channel One Liverpool Limited
Chargestake Limited
Charles Elphick Limited
City Television Network Limited
Community Magazines Limited
Conrad & Partners Limited
Coventry Newspapers Limited
Daily Post Investments Limited
Daily Post Overseas Limited
Denitz Investments Limited
Echo Press (1983) Limited
Enterprise Magazines LimitedExaminer News & Information Services Limited
Financial Jobs Online Limited
Fish4 Limited
Fish4 Trading Limited
Fish4Cars Limited
Fish4Homes Limited
Fish4Jobs Limited
Gazette Media Company Limited
Gimmejobs Limited
Gisajob Limited
High Street Direct Limited
Hot Exchange Limited
Hot Flats Limited
Hot Flights Limited
Hotrecruit Limited
Huddersfield Examiner Limited
Huddersfield Newspapers Limited
Subsidiary name
I.T. Trade Publishing Limited
Informer Publications Limited
Internet Recruitment Solutions Limited
Isle of Wight Newspapers Limited
Job Search Limited
Jobsfinancial Limited
Jobsin Limited
JobsinHRSolutions Limited
Jobsinlaw Limited
JobsinUK Limited
Joseph Woodhead & Sons Limited
Just London Jobs Limited
Kennyhill Limited
Kent Regional Newspapers LimitedLancashire & Cheshire County Newspapers Limited
Legionstyle Limited
Live TV Limited
Liverpool Web Offset Limited
Liverpool Weekly Newspaper Group Limited
Llandudno Advertiser Limited
Local World Holdings Limited
Local World LimitedLondon and Westminster Newspapers Limited
London Newspaper Group Limited
Mainjoy Limited
Manchester Morning News Limited
Markstead Limited
Mayfair Celebs Limited
Midland Weekly Media Limited
Midland Weekly Newspapers LimitedMirror Colour Print (London No. 1 Plant) Limited
Mirror Colour Print (London) Limited
Mirror Colour Print (North) LimitedMirror Colour Print Services (London) Limited
Mirror Colour Print Services Limited
Mirror Financial Services Limited
Mirror Group Music Limited
Mirror Group Newspapers LimitedMirror Group Newspapers North (1986) Limited
Mirror Projects Limited
Media Wales Limited
Medpress Limited
Meilin Limited
MEN Investment Limited
Subsidiary name
MEN Media Limited
Mercury Distribution Services Limited
Merseymart Limited
MG Estates Limited
MG Guarantee Co Limited
MG6 Limited
MGL2 Limited
MGN (86) Limited
MGN (AW) Limited
MGN (Canada Square) Limited
MGN (Services) Ltd
MGN Limited
MGN Pension Trustees Limited
MGN Property Developments Limited
Micromart (UK) Limited
Middlesex County Press Limited
Midland Independent Magazines LimitedMidland Independent Newspaper & Media Sales LimitedMidland Independent Weekly Newspapers Limited
Midland Leaflet Services Limited
Midland Newspapers LimitedMidland Newspapers Pension Trustees Limited
Midland Newspapers Printers Limited
Midland United Newspapers Limited
Midland Weekly Media (Birmingham) LimitedMidland Weekly Media (Wolverhampton) Limited
MirrorAd Limited
Mirrorair Limited
Mirrorgroup Limited
MirrorNews Limited
MirrorTel Limited
NCJ Media Limited
Net Recruit UK Limited
Newcastle Chronicle and Journal Limited
North Eastern Evening Gazette Limited
North Wales Independent Press Limited
North Wales Weekly News
Northern Print Services Limited
Nunews Limited
Odhams Newspapers Limited
Official Starting Prices Ltd.
Parkside Accountancy Limited
Parkside Consulting Limited
Planet Recruitment Limited
Financial Statements
Trinity Mirror plc Annual Report 2016120
Subsidiary undertakings continued
Subsidiary name
Planetrecruit Limited
Quids-In (North West) Limited
R.E. Jones & Bros. Limited
R.E. Jones Graphic Services Limited
R.E. Jones Newspaper Group Limited
Reliant Distributors Limited
RH1 Limited
Scene Magazines Limited
Scene Newspapers Limited
Scene Printing (Midlands) Limited
Scene Printing Web Offset Limited
Scottish and Universal Newspapers LimitedScottish Daily Record and Sunday Mail Limited
Smart Media Services Limited
Southnews Trustees Limited
Sunday Brands Limited
Sunday People Limited
Surrey & Berkshire Media Limited
Syndication International (1986) Limited
Syndication International Limited
T M Directors Limited
T M S Pension Trustee Limited
T M Secretaries Limited
The Adscene Group Limited
The Advertiser LimitedThe Associated Catholic Newspapers (1912) Limited
The Birmingham Boat Shows Limited
The Birmingham Post & Mail Limited
The Career Engineer LimitedThe Chester Chronicle and Associated Newspapers Limited
The Communicator Corporation Limited
The Daily Mirror Newspapers Limited
The Echo Press Limited
The Graduate Group Ltd
The Hinckley Times Limited
The Hotgroup Limited
The Liverpool Daily Post And Echo Limited
The People Limited
This Is Britain Limited
TIH (Belfast) (Nominees) Limited
TIH (Cardiff) Limited
TIH (Chester) Limited
TIH (Newcastle) Limited
TIH (Properties) Limited
TIH (Teesside) Limited
TIH (Trustee) Limited
Subsidiary name
TM Mobile Solutions Limited
TM Regional New Media Limited
Totallyfinancial.com Ltd
Totallylegal.com Limited
Trinity 100 Limited
Trinity 102 Limited
Trinity Limited
Trinity Mirror (L I) Limited
Trinity Mirror Acquisitions (2) Limited
Trinity Mirror Acquisitions Limited
Trinity Mirror Cheshire Limited
Trinity Mirror Digital Limited
Trinity Mirror Digital Media Limited
Trinity Mirror Digital Recruitment Limited
Trinity Mirror Distributors Limited
Trinity Mirror Group Limited
Trinity Mirror Huddersfield Limited
Trinity Mirror Marketing Direct Limited
Trinity Mirror Merseyside Limited
Trinity Mirror Midlands Limited
Trinity Mirror North Wales LimitedTrinity Mirror North West & North Wales Limited
Trinity Mirror Pension Trustees Limited
Trinity Mirror Printing (Cardiff) Limited
Trinity Mirror Printing (Liverpool) Limited
Trinity Mirror Printing (Midlands) Limited
Trinity Mirror Printing (Newcastle) Limited
Trinity Mirror Printing (Oldham) Limited
Trinity Mirror Printing (Teesside) Limited
Trinity Mirror Printing (Watford) Limited
Trinity Mirror Printing Limited
Trinity Mirror Publishing Limited
Trinity Mirror Regional Newspapers Limited
Trinity Mirror Regionals Limited
Trinity Mirror Shared Services Limited
Trinity Mirror Southern Limited
Trinity Mirror Subsidiary 100 Limited
Trinity Newspaper Group Limited
Trinity Newspapers Southern Limited
Trinity Publications Limited
Trinity Retirement Benefit Scheme Limited
Trinity Shared Services Limited
Trinity Weekly Newspapers Limited
Vectis Innovations Limited
Vibrant Limited
Vivid Group Limited
Vivid Limited
Wandsworth Independent Limited
Subsidiary name
Websalvo.com Limited
Welsh Universal Holdings Limited
Welshpool Web-Offset Co. Limited
Western Mail & Echo Limited
Whitbread Walker Limited
Wire TV Limited
Wirral Newspapers Limited
Wood Lane One Limited
Wood Lane Two Limited
Workthing Limited
The following subsidiary undertakings are 100% owned and incorporated in Scotland, with a registered office at One Central Quay, Glasgow, G3 8DA.
Subsidiary name
Aberdonian Publications Limited
Anderston Quay Printers Limited
Dundonian Publications Limited
First Press Publishing Limited
Glaswegian Publications Limited
icScotland Limited
Insider Group Limited
Insider Publications Limited
Media Scotland Limited
Metropolitan Free Newspapers Limited
Newsday Limited
Saltire Press Limited
Scotfree LimitedScottish Daily Record and Sunday Mail Limited
The Edinburgh and Lothians Post Limited
Trinity Mirror Printing (Blantyre) Limited
Trinity Mirror Printing (Saltire) Limited
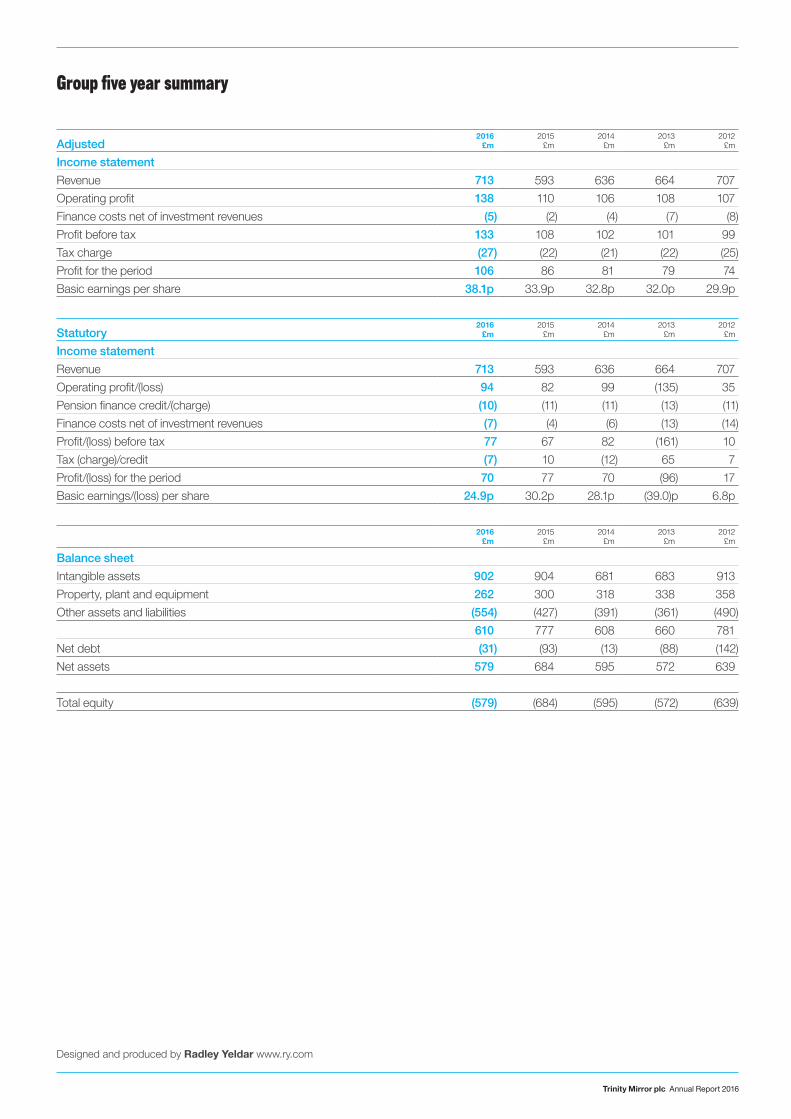
Trinity Mirror plc Annual Report 2016
Group five year summary
Designed and produced by Radley Yeldar www.ry.com
Adjusted2016
£m2015
£m2014
£m2013
£m2012
£m
Income statement
Revenue 713 593 636 664 707
Operating profit 138 110 106 108 107
Finance costs net of investment revenues (5) (2) (4) (7) (8)
Profit before tax 133 108 102 101 99
Tax charge (27) (22) (21) (22) (25)
Profit for the period 106 86 81 79 74
Basic earnings per share 38.1p 33.9p 32.8p 32.0p 29.9p
Statutory2016
£m2015
£m2014
£m2013
£m2012
£m
Income statement
Revenue 713 593 636 664 707
Operating profit/(loss) 94 82 99 (135) 35
Pension finance credit/(charge) (10) (11) (11) (13) (11)
Finance costs net of investment revenues (7) (4) (6) (13) (14)
Profit/(loss) before tax 77 67 82 (161) 10
Tax (charge)/credit (7) 10 (12) 65 7
Profit/(loss) for the period 70 77 70 (96) 17
Basic earnings/(loss) per share 24.9p 30.2p 28.1p (39.0)p 6.8p
2016£m
2015£m
2014£m
2013£m
2012£m
Balance sheet
Intangible assets 902 904 681 683 913
Property, plant and equipment 262 300 318 338 358
Other assets and liabilities (554) (427) (391) (361) (490)
610 777 608 660 781
Net debt (31) (93) (13) (88) (142)
Net assets 579 684 595 572 639
Total equity (579) (684) (595) (572) (639)

Registered office: One Canada Square Canary Wharf London E14 5AP +44 (0)20 7293 3000 www.trinitymirror.com
Trinity Mirror p
lc Annual R
eport 2016