annual performance planning and review report fiscal year
TRANSCRIPT

Louisiana Department Of State Civil Service
Annual Performance Planning and Review Report Fiscal Year 2007-2008
(Submitted to the Director of Civil Service and the Civil Service Commission on November 19, 2008)
In accordance with Civil Service Rule 10.12 (c), state agencies are required to submit an annual
Performance Planning and Review (PPR) report to the Director of Civil Service. The final annual
report for fiscal year 2007‐2008 is attached to this memo.
The data is organized so that columns one and two indicate the name of the agency. The reports are
as follows:
First Report ‐ Alphabetical Order by Agency
This report lists all agencies by major department, in alphabetical order. The third column
indicates the total number of employees for whom ratings were reported by the agency. The
fourth column indicates the percentage of employees who were Un‐Rated for fiscal year 2007‐
2008. The fifth and sixth columns indicate the percentage of employees who were Un‐Rated for
the two prior fiscal years—2006‐2007 and 2005‐2006. Data provided on this main report for the
Housing Authorities, and Ports/Levee Districts reflects the combined totals reported for each
group.
Second Report ‐ Descending Order by Un‐Rated Rate
November 19, 2008 Page 1

The second report sorts the agencies in descending order according to the percentage of
employees who were not rated for fiscal year 2007‐2008. Agencies appearing at the top of the
list have the highest Un‐Rated rates, starting at 100% Un‐Rated for Workforce Commission. The
agencies appearing near the end of the list, with 0.00% Un‐Rated, reported having rated all of
their employees during this period. When viewing the Un‐Rated rates for each agency, please
also note the number of employees per agency, which appears in the third column, “Calculated
No. of Ratings 07‐08.” As has been discussed in past years, although we would be concerned by a
high Un‐Rated rate at a small agency, such as a board or commission, even if there were only a
handful of classified employees, we are more alarmed by a lower Un‐Rated rate of 15‐30 percent
at an agency having a significantly greater number of employees—50 or more.
In the Program Assistance Division, we have concluded that the larger the agency, the greater
the impact of a high Un‐Rated rate. It is our experience that a lack of a strong performance
management program adversely impacts the morale of employees, productivity, and business
operations and mission of the agency.
Agencies appearing at the very bottom of the list, with no percentage value in the column, did
not report or no longer report under that agency title. As in the first report, the third column in
this report indicates the total number of employees for whom ratings were reported by the
agency. The fifth and sixth columns provide the percentage of Un‐Rated employees for the
previous two fiscal years.
NOTE: Statewide grand totals are presented at the bottom of each of the columns, on page 5.
Agencies reported PPR ratings for 57,275 classified employees in fiscal year 2007‐2008, and the
overall Un‐Rated rate was 4.44%, down from last fiscal year’s rate of 5.01%.
Chart #1 ‐‐ PPR Ratings For Last 3 Fiscal Years Including Involuntary/Probational Separations
Chart #1 shows the actual numbers of PPR Ratings reported for each of the past three fiscal
years. This chart presents the number of ratings in each of the rating categories. Additionally, in
November 19, 2008 Page 2

the first column, the report provides the number of Involuntary Separations/Probational
Separations, which includes those employees who were separated from probation, resigned to
avoid dismissal, or were dismissed. It is reasonable to assume that these dismissed employees
were ones who most likely did receive, or would have received, ratings of Poor or Needs
Improvement.
(It is important to note that this number does not include those employees who were laid off or
those who chose to retire.)
Chart #2 ‐‐ PPR Ratings For Last 3 Fiscal Years by %
Chart # 2 shows the percentage of ratings in each category over a three‐year period.
Chart #3 ‐‐ Meets Requirements vs. Less Then Meets Requirements
This chart represents the percentage of employees whose performance was less than “Meets
Requirements” versus those whose performance was deemed to be “Meets Requirements” or
higher. The percentage of employees whose performance was less than “Meets Requirements”
includes those who were actually rated “Poor” or “Needs Improvement,” as well as those who
were separated while on probation or involuntarily, which we have concluded are employees
who either did receive, or would have received, ratings of less than “Meets Requirements” if
they had remained in state service. The percentage of Un‐Rated employees is not shown in this
chart.
Decrease in Statewide Un‐Rated Rate in FY 07/08
For Fiscal Year 2007‐2008, there was a slight decrease in the statewide percentage of Un‐Rated
employees of over half of one percent, although there were 1,539 more state workers this fiscal year
to rate than last fiscal year.
November 19, 2008 Page 3

November 19, 2008 Page 4
Agencies Reporting Un‐Timely
The following agencies failed to report by the reporting deadline and were not included in the main
report.
Agency Agency Calculated No. of Ratings 07‐08
Un‐Rated Rate for 07‐08
Un‐Rated Rate for 06‐07
Un‐Rated Rate for 05‐06
LSU System Agriculture Center 495 14.14% 6.96% 3.33%LSU System Baton Rouge 1472 13.65% 11.21% 8.54%Health & Hospitals Nursing, Board of 36 5.56% 21.43% 69.23%
Table 1
Agencies Not Reporting
The following agencies did not report and appear shaded in orange at the bottom of the Descending
Order report.
Agency Agency No. of Classified
Employees Labor Board of Plumbing 4
Culture, Rec & Tourism Council on Dvlpmt of French in LA (CODOFIL) No positions in ISIS
Treasury Firefighters Retirement System No positions in ISIS Health & Hospitals Metropolitan Human Service District 145 Governor's Office Military 3 Economic Development Motor Vehicle Commission 10 Culture, Rec & Tourism New Orleans City Park 7 Health & Hospitals RadiolTech Board 1 Community Colleges River Parishes Comm College 9 Education Special School District One 10 Treasury State Police Retirement System 2
Total 191 Table 2

November 19, 2008 Page 5
Louisiana Technical Colleges (LTC)
The Louisiana Technical College has failed to report for the last three years. The entities in the LTC
system which did report for the 2007‐2008 Fiscal Year were the Board of Supervisors and Region 1,
which consists of the West Jefferson, Slidell, Sidney N. Collier, and Jefferson campuses. Below is a list
of the LTC Campuses which failed to report.
LTC Campus No. of Classified
Employees
LTC Campus No. of Classified
Employees Acadian 5 Mansfield 3 Alexandria 8 Natchitoches 5 Ascension 5 North Central 4 Avoyelles 8 Northeast LA 4 Bastrop 4 Northwest 10 Baton Rouge 16 Oakdale 5 Coreil 2 Resource Center 4 Delta Ouachita 12 River Parishes 10 Evangeline 4 Ruston 4 Florida Parishes 5 Sabine Valley 5 Folkes 2 Shelby M. Jackson 4 Gulf Area 4 Shreveport 15 Hammond 8 Sullivan 11 Huey P. Long 4 T. H. Harris 9 Jumonville Memorial 3 Tallulah 7 Lafayette Campus 18 Teche Area 5 Lafourche 11 Westside 1 Lamar Salter 7 Young Memorial 23 M. Smith 4
Total 259 Table 3

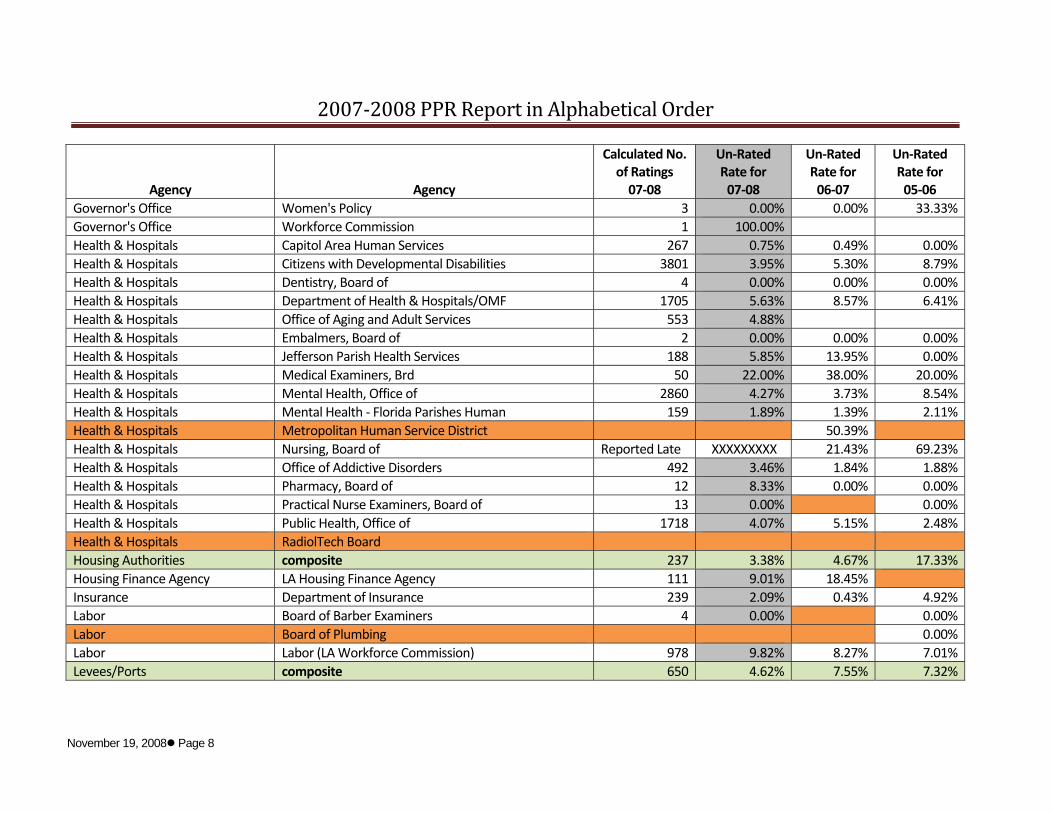
2007‐2008 PPR Report in Alphabetical Order
Agency Agency
Calculated No. of Ratings 07‐08
Un‐Rated Rate for 07‐08
Un‐Rated Rate for 06‐07
Un‐Rated Rate for 05‐06
Agriculture Department of Agriculture 781 7.04% 5.64% 9.50%Civil Service Department of Civil Service 93 0.00% 4.30% 1.19%Civil Service Division Of Administrative Law 26 0.00% 11.54% 7.69%Civil Service Ethics 21 0.00% 15.00% 5.00%Civil Service Municipal Fire and Police 18 0.00% 0.00% 0.00%Community Colleges Baton Rouge Community College 46 6.52% 22.00% 4.88%Community Colleges Bossier Parish Community College 99 0.00% 0.00% 0.00%Community Colleges Delgado Community College 175 17.71% 65.94% 39.06%Community Colleges L.E. Fletcher Tech Community College 14 7.14% 0.00% 0.00%Community Colleges LA Delta Community College 6 0.00% 0.00%Community Colleges Nunez Community College 29 0.00% 0.00% 25.00%Community Colleges River Parishes Comm College 0.00% Community Colleges South LA Community College 4 0.00% Community Colleges Sowela Tech Community College 26 0.00% 3.57% 0.00%Culture, Rec & Tourism Council on Dvlpmt of French in LA (CODOFIL) 0.00% 0.00%Culture, Rec & Tourism Dept of Culture, Recreation & Tourism 708 0.71% 2.78% 0.00%Culture, Rec & Tourism New Orleans City Park 63.64%Economic Development Department of Economic Development 71 4.23% 10.34% 12.28%Economic Development Motor Vehicle Commission 0.00%Economic Development CPA Board 5 0.00% 0.00% 0.00%Education Department of Education 573 2.44% 1.49% 0.69%Education School for Math, Science & Arts 13 0.00% 0.00% 0.00%Education School for the Deaf 144 4.86% 4.86% 4.24%Education School for the Visually Impaired 47 0.00% 0.00% 5.88%Education Special Education Center 170 7.06% 10.39% 7.89%Education Special School District One 5.00%
November 19, 2008 Page 6

2007‐2008 PPR Report in Alphabetical Order
Un‐Rated Un‐Rated
Agency Agency
Calculated No. of Ratings 07‐08
Rate for Rate for 06‐07
Un‐Rated Rate for 05‐06 07‐08
Educational TV Auth LETA 76 1.32% 1.30% 18.67%Environmental Quality Department of Environmental Quality 927 2.27% 3.28% 3.72%Governor's Office Architectural Examiners 2 0.00% Governor's Office BESE 7 0.00% 0.00% 0.00%Governor's Office Board of Regents 15 0.00% 6.67% 0.00%Governor's Office Commission on Law Enforcement 41 2.44% 0.00% 0.00%Governor's Office Cosmetology, Board of 24 4.17% 4.17% 17.39%Governor's Office Department of Veterans Affairs 677 0.15% 0.00% 0.22%Governor's Office Division of Administration 653 1.84% 0.84% 0.60%Governor's Office Administrative Services 46 2.17% Governor's Office Elderly Affairs 57 3.51% 1.89% 1.75%Governor's Office Federal Property Assistance Agency 13 0.00% Governor's Office Louisiana Property Assistance Agency 45 2.22% Governor's Office Manufactured Housing Commission 6 16.67% 57.14% 80.00%Governor's Office Mental Health Advocacy 21 80.95% 60.00% 78.57%Governor's Office Military 0.00% Governor's Office Office of Aircraft Services 3 0.00% Governor's Office Office of Financial Institutions 112 0.89% 5.79% 0.00%Governor's Office Office of Risk Management 126 0.79% Governor's Office Office of Telecomm Management 105 3.81% Governor's Office Patient's Compensation Fund 40 0.00% 0.00% 2.50%Governor's Office Racing Commission 18 0.00% 0.00% 0.00%Governor's Office Real Estate Commission 25 0.00% 0.00% 0.00%Governor's Office State Employees Group Benefits 321 0.00% 0.00% 0.00%Governor's Office State Licensing Board for Contractors 60 5.00% 11.32% 14.55%Governor's Office Used Vehicle Commission 21 0.00% 0.00% 0.00%
November 19, 2008 Page 7
2007‐2008 PPR Report in Alphabetical Order
Un‐Rated Un‐Rated
Agency Agency
Calculated No. of Ratings 07‐08
Rate for Rate for 06‐07
Un‐Rated Rate for 05‐06 07‐08
Governor's Office Women's Policy 3 0.00% 0.00% 33.33%Governor's Office Workforce Commission 1 100.00% Health & Hospitals Capitol Area Human Services 267 0.75% 0.49% 0.00%Health & Hospitals Citizens with Developmental Disabilities 3801 3.95% 5.30% 8.79%Health & Hospitals Dentistry, Board of 4 0.00% 0.00% 0.00%Health & Hospitals Department of Health & Hospitals/OMF 1705 5.63% 8.57% 6.41%Health & Hospitals Office of Aging and Adult Services 553 4.88% Health & Hospitals Embalmers, Board of 2 0.00% 0.00% 0.00%Health & Hospitals Jefferson Parish Health Services 188 5.85% 13.95% 0.00%Health & Hospitals Medical Examiners, Brd 50 22.00% 38.00% 20.00%Health & Hospitals Mental Health, Office of 2860 4.27% 3.73% 8.54%Health & Hospitals Mental Health ‐ Florida Parishes Human 159 1.89% 1.39% 2.11%Health & Hospitals Metropolitan Human Service District 50.39% Health & Hospitals Nursing, Board of Reported Late XXXXXXXXX 21.43% 69.23%Health & Hospitals Office of Addictive Disorders 492 3.46% 1.84% 1.88%Health & Hospitals Pharmacy, Board of 12 8.33% 0.00% 0.00%Health & Hospitals Practical Nurse Examiners, Board of 13 0.00% 0.00%Health & Hospitals Public Health, Office of 1718 4.07% 5.15% 2.48%Health & Hospitals RadiolTech Board Housing Authorities composite 237 3.38% 4.67% 17.33%Housing Finance Agency LA Housing Finance Agency 111 9.01% 18.45% Insurance Department of Insurance 239 2.09% 0.43% 4.92%Labor Board of Barber Examiners 4 0.00% 0.00%Labor Board of Plumbing 0.00%Labor Labor (LA Workforce Commission) 978 9.82% 8.27% 7.01%Levees/Ports composite 650 4.62% 7.55% 7.32%
November 19, 2008 Page 8

2007‐2008 PPR Report in Alphabetical Order
Un‐Rated Un‐Rated
Agency Agency
Calculated No. of Ratings 07‐08
Rate for Rate for 06‐07
Un‐Rated Rate for 05‐06 07‐08
Louisiana Tech Colleges composite 12 41.67% LSU System Administration 2 0.00% 0.00%LSU System Agriculture Center Reported Late XXXXXXXX 6.96% 3.33%LSU System Alexandria 95 8.42% 10.11% 9.09%LSU System Baton Rouge Reported Late XXXXXXXX 11.21% 8.54%LSU System Eunice 66 0.00% 0.00% 0.00%LSU System Hebert Law Center 15 0.00% 0.00% 0.00%LSU System Pennington Biomedical 66 0.00% 0.00% 0.00%LSU System Shreveport 110 0.00% 0.00% 1.82%LSU System University of New Orleans 247 1.21% 19.38% 17.02%LSU/HCSD Bogalusa Medical Center (fmr. Wash‐St. Tamm.) 449 1.78% 2.14% 0.49%LSU/HCSD E. K. Long 936 16.56% 24.27% 34.44%LSU/HCSD Health Care Services Division 131 0.00% 0.00% 0.00%LSU/HCSD L. J. Chabert 808 0.62% 0.76% 0.38%LSU/HCSD Lafayette ‐ University Medical Center 902 3.66% 12.18% 11.92%LSU/HCSD Lallie Kemp 349 1.15% 0.56% 0.55%LSU/HCSD LSU Interim Hospital (formerly MCLNO) 1929 35.36% 11.16% 13.22%LSU/HCSD W. O. Moss 350 4.86% 12.69% 6.90%LSU/HSC/NO New Orleans 515 26.21% 30.20% 0.00%LSU/HSC/S H. P. Long 517 0.39% 0.55% 0.19%LSU/HSC/S E. A. Conway 778 0.90% 1.59% 0.12%LSU/HSC/S Shreveport 2874 7.03% 6.80% 8.03%N O Ctr for Creative Arts/Riverfront NOCCA 8 0.00% 0.00% 0.00%Natural Resources Department of Natural Resources 502 0.20% 0.00% 0.00%Pub Safety & Corr/CorrSrv Corrections Services 135 0.00% 0.00% 2.24%
November 19, 2008 Page 9

2007‐2008 PPR Report in Alphabetical Order
Un‐Rated Un‐Rated
Agency Agency
Calculated No. of Ratings 07‐08
Rate for Rate for 06‐07
Un‐Rated Rate for 05‐06 07‐08
Pub Safety & Corr/CorrSrv Phelps Correctional Center ‐ PCC 309 0.00% 0.00% 0.00%Pub Safety & Corr/CorrSrv LA State Penitentiary ‐ LSP 1619 0.06% 0.13% 0.12%Pub Safety & Corr/CorrSrv Avoyelles ‐ AVC 379 0.26% 0.00% 0.59%Pub Safety & Corr/CorrSrv LA Correctional Inst for Women ‐ LCIW 276 0.72% 7.58% 0.36%Pub Safety & Corr/CorrSrv Dixon Correctional ‐ DCI 527 0.76% 0.39% 0.94%Pub Safety & Corr/CorrSrv Dabadie ‐ JLDCC 164 0.61% 0.00% 0.00%Pub Safety & Corr/CorrSrv Elayn Hunt Correctional ‐ EHCC 703 1.14% 1.25% 2.41%Pub Safety & Corr/CorrSrv DWCC/SHRC/FWCC 784 0.64% 1.53% 1.46%Pub Safety & Corr/CorrSrv Probation & Parole ‐ P & P 815 0.61% 0.53% 0.52%
Pub Safety & Corr/CorrSrv Rayburn Correctional Institute ‐ RCI (Formerly Washington CI) 352 0.00% 0.00% 0.00%
Pub Safety & Corr/CorrSrv Prison Enterprises ‐ PE 75 2.67% 2.82% 1.43%Pub Safety & Corr/Pub Safety Srv Private Investigator Brd 10 0.00% Pub Safety & Corr/Pub Safety Srv Dept. of Public Safety 1799 3.95% 2.47% 0.93%Pub Safety & Corr/Youth Dev Bridge City Pub Safety & Corr/Youth Dev Jetson Pub Safety & Corr/Youth Dev Juvenile Probation and Parole Pub Safety & Corr/Youth Dev Swanson‐Madison Pub Safety & Corr/Youth Dev Swanson‐Monroe Pub Safety & Corr/Youth Dev All facilities 1032 3.10% 11.46% 16.46%Public Svc. Commission Public Service Commission 82 4.88% 3.26% 9.47%Revenue Department of Revenue 814 3.32% 4.15% 1.89%Social Services Department of Social Services 5154 1.61% 2.59% 3.20%Southern Univ. System Baton Rouge 515 10.68% 11.44% 1.72%Southern Univ. System New Orleans 81 0.00% 0.00% 93.33%Southern Univ. System Shreveport/Bossier 71 2.82% 21.31% 6.90%
November 19, 2008 Page 10

2007‐2008 PPR Report in Alphabetical Order
Un‐Rated Un‐Rated
Agency Agency
Calculated No. of Ratings 07‐08
Rate for Rate for 06‐07
Un‐Rated Rate for 05‐06 07‐08
State Department of State 390 0.26% 3.72% 5.19%Student Financial Assistance, LA LOSFA 130 0.00% 1.71% 0.00%Transportation & Dev. Brd. Prof Engineers 7 57.14% Transportation & Dev. DOTD 4493 1.05% 0.76% 0.97%Transportation & Dev. Sabine River Authority 44 0.00% Treasury Department of Treasury 51 0.00% 0.00% 6.25%Treasury Firefighters Retirement System Treasury School Employees Retirement 42 4.76% 0.00% 5.71%Treasury State Employees Retirement System (LASERS) 123 0.81% 1.54% 2.21%Treasury State Police Retirement System Treasury Teacher's Retirement System 191 1.57% 1.14% 0.49%University System Grambling State University 255 9.41% 48.45% University System Louisiana Tech University 473 1.06% 0.43% 1.28%University System McNeese State University 279 0.72% 3.68% 2.57%University System Nicholls State University 264 0.38% 0.36% 0.37%University System Northwestern State University 242 2.07% 2.21% 0.00%University System Southeastern LA University 478 0.42% 0.22% 0.00%University System University of LA‐Monroe 376 0.53% 1.87% 1.08%University System University of LA‐Lafayette 769 0.39% 0.27% 0.28%Wildlife & Fisheries Department of Wildlife & Fisheries 754 1.33% 1.89% 1.63% Total Ratings Reported 57275 Statewide Un‐Rated Rate 4.44% 5.01% 4.97%Composite data Did not report
November 19, 2008 Page 11

2007‐2008 PPR Report in Descending Order
Agency Agency
Calculated No. of Ratings 07‐08
Un‐Rated Rate for 07‐08
Un‐Rated Rate for 06‐07
Un‐Rated Rate for 05‐06
Governor's Office Workforce Commission 1 100.00% Governor's Office Mental Health Advocacy 21 80.95% 60.00% 78.57%Transportation & Dev. Professional Engineers, Board of 7 57.14% Louisiana Tech Colleges composite 12 41.67% LSU/HCSD LSU Interim Hospital (formerly MCLNO) 1929 35.36% 11.16% 13.22%LSU/HSC/NO New Orleans 515 26.21% 30.20% 0.00%Health & Hospitals Medical Examiners, Board of 50 22.00% 38.00% 20.00%Community Colleges Delgado Community College 175 17.71% 65.94% 39.06%Governor's Office Manufactured Housing Commission 6 16.67% 57.14% 80.00%LSU/HCSD E. K. Long 936 16.56% 24.27% 34.44%Southern Univ. System Baton Rouge 515 10.68% 11.44% 1.72%Labor Labor (LA Workforce Commission) 978 9.82% 8.27% 7.01%University System Grambling State University 255 9.41% 48.45% Housing Finance Agency LA Housing Finance Agency 111 9.01% 18.45% LSU System Alexandria 95 8.42% 10.11% 9.09%Health & Hospitals Pharmacy, Board of 12 8.33% 0.00% 0.00%Community Colleges L.E. Fletcher Tech Community College 14 7.14% 0.00% 0.00%Education Special Education Center 170 7.06% 10.39% 7.89%Agriculture Department of Agriculture 781 7.04% 5.64% 9.50%LSU/HSC/S Shreveport 2874 7.03% 6.80% 8.03%Community Colleges Baton Rouge Community College 46 6.52% 22.00% 4.88%Health & Hospitals Jefferson Parish Health Services 188 5.85% 13.95% 0.00%Health & Hospitals Department of Health & Hospitals/OMF 1705 5.63% 8.57% 6.41%Governor's Office State Licensing Board for Contractors 60 5.00% 11.32% 14.55%Health & Hospitals Office of Aging and Adult Services 553 4.88%
November 19, 2008 Page 12

2007‐2008 PPR Report in Descending Order
Agency Agency
Calculated No. of Ratings 07‐08
Un‐Rated Un‐Rated Rate for Rate for
06‐07
Un‐Rated Rate for 05‐06 07‐08
Public Svc. Commission Public Service Commission 82 4.88% 3.26% 9.47%Education School for the Deaf 144 4.86% 4.86% 4.24%LSU/HCSD W. O. Moss Regional Medical Center 350 4.86% 12.69% 6.90%Treasury School Employees Retirement 42 4.76% 0.00% 5.71%Levees/Ports composite 650 4.62% 7.55% 7.32%Health & Hospitals Mental Health, Office of 2860 4.27% 3.73% 8.54%Economic Development Department of Economic Development 71 4.23% 10.34% 12.28%Governor's Office Cosmetology, Board of 24 4.17% 4.17% 17.39%Health & Hospitals Public Health, Office of 1718 4.07% 5.15% 2.48%Pub Safety & Corr/Pub Safety Srv Department of Public Safety 1799 3.95% 2.47% 0.93%Health & Hospitals Citizens with Developmental Disabilities 3801 3.95% 5.30% 8.79%Governor's Office Office of Telecomm Management 105 3.81% LSU/HCSD Lafayette ‐ University Medical Center 902 3.66% 12.18% 11.92%Governor's Office Elderly Affairs 57 3.51% 1.89% 1.75%Health & Hospitals Office of Addictive Disorders 492 3.46% 1.84% 1.88%Housing Authorities composite 237 3.38% 4.67% 17.33%Revenue Department of Revenue 814 3.32% 4.15% 1.89%Pub Safety & Corr/Youth Dev All facilities 1032 3.10% 11.46% 16.46%Southern Univ. System Shreveport/Bossier 71 2.82% 21.31% 6.90%Pub Safety & Corr/CorrSrv Prison Enterprises ‐ PE 75 2.67% 2.82% 1.43%Education Department of Education 573 2.44% 1.49% 0.69%Governor's Office Comm on Law Enforcement 41 2.44% 0.00% 0.00%Environmental Quality Department of Environmental Quality 927 2.27% 3.28% 3.72%Governor's Office Louisiana Property Assistance Agency 45 2.22% Governor's Office Administrative Services 46 2.17% Insurance Department of Insurance 239 2.09% 0.43% 4.92%
November 19, 2008 Page 13

2007‐2008 PPR Report in Descending Order
Agency Agency
Calculated No. of Ratings 07‐08
Un‐Rated Un‐Rated Rate for Rate for
06‐07
Un‐Rated Rate for 05‐06 07‐08
University System Northwestern State 242 2.07% 2.21% 0.00%Health & Hospitals Mental Health ‐ Florida Parishes Human 159 1.89% 1.39% 2.11%Governor's Office Division of Administration 653 1.84% 0.84% 0.60%LSU/HCSD Bogalusa Medical Center (fmr. Wash‐St. Tamm.) 449 1.78% 2.14% 0.49%Social Services Department of Social Services 5154 1.61% 2.59% 3.20%Treasury Teacher's Retirement System 191 1.57% 1.14% 0.49%Wildlife & Fisheries Department of Wildlife & Fisheries 754 1.33% 1.89% 1.63%Educational TV Authority LETA 76 1.32% 1.30% 18.67%LSU System University of New Orleans 247 1.21% 19.38% 17.02%LSU/HCSD Lallie Kemp 349 1.15% 0.56% 0.55%Pub Safety & Corr/CorrSrv Elayn Hunt Correctional ‐ EHCC 703 1.14% 1.25% 2.41%University System Louisiana Tech University 473 1.06% 0.43% 1.28%Transportation & Development. DOTD 4493 1.05% 0.76% 0.97%LSU/HSC/S E. A. Conway 778 0.90% 1.59% 0.12%Governor's Office Office of Financial Institutions 112 0.89% 5.79% 0.00%Treasury State Employees Retirement System (LASERS) 123 0.81% 1.54% 2.21%Governor's Office Office of Risk Management 126 0.79% Pub Safety & Corr/CorrSrv Dixon Correctional ‐ DCI 527 0.76% 0.39% 0.94%Health & Hospitals Capitol Area Human Services 267 0.75% 0.49% 0.00%Pub Safety & Corr/CorrSrv LA Correctional Inst for Women ‐ LCIW 276 0.72% 7.58% 0.36%University System McNeese State University 279 0.72% 3.68% 2.57%Culture, Rec & Tourism Dept of Culture, Recreation & Tourism 708 0.71% 2.78% 0.00%Pub Safety & Corr/CorrSrv DWCC/SHRC/FWCC 784 0.64% 1.53% 1.46%LSU/HCSD L. J. Chabert 808 0.62% 0.76% 0.38%Pub Safety & Corr/CorrSrv Probation & Parole ‐ P & P 815 0.61% 0.53% 0.52%Pub Safety & Corr/CorrSrv Dabadie ‐ JLDCC 164 0.61% 0.00% 0.00%
November 19, 2008 Page 14

2007‐2008 PPR Report in Descending Order
Agency Agency
Calculated No. of Ratings 07‐08
Un‐Rated Un‐Rated Rate for Rate for
06‐07
Un‐Rated Rate for 05‐06 07‐08
University System University of LA‐Monroe 376 0.53% 1.87% 1.08%University System Southeastern LA University 478 0.42% 0.22% 0.00%University System University of LA‐Lafayette 769 0.39% 0.27% 0.28%LSU/HSC/S H. P. Long 517 0.39% 0.55% 0.19%University System Nicholls State University 264 0.38% 0.36% 0.37%Pub Safety & Corr/CorrSrv Avoyelles ‐ AVC 379 0.26% 0.00% 0.59%State Department of State 390 0.26% 3.72% 5.19%Natural Resources Department of Natural Resources 502 0.20% 0.00% 0.00%Governor's Office Department of Veterans Affairs 677 0.15% 0.00% 0.22%Pub Safety & Corr/CorrSrv LA State Penitentiary ‐ LSP 1619 0.06% 0.13% 0.12%LSU System Administration 2 0.00% 0.00%Governor's Office Architectural Examiners 2 0.00% Governor's Office BESE 7 0.00% 0.00% 0.00%Labor Board of Barber Examiners 4 0.00% 0.00%Governor's Office Board of Regents 15 0.00% 6.67% 0.00%Community Colleges Bossier Parish Community College 99 0.00% 0.00% 0.00%Pub Safety & Corr/CorrSrv Corrections Services 135 0.00% 0.00% 2.24%Economic Development CPA Board 5 0.00% 0.00% 0.00%Health & Hospitals Dentistry, Board of 4 0.00% 0.00% 0.00%Civil Service Department of Civil Service 93 0.00% 4.30% 1.19%Treasury Department of Treasury 51 0.00% 0.00% 6.25%Civil Service Division of Administrative Law 26 0.00% 11.54% 7.69%Health & Hospitals Embalmers, Board of 2 0.00% 0.00% 0.00%Civil Service Ethics 21 0.00% 15.00% 5.00%LSU System Eunice 66 0.00% 0.00% 0.00%Governor's Office Federal Property Assistance Agency 13 0.00%
November 19, 2008 Page 15

2007‐2008 PPR Report in Descending Order
Agency Agency
Calculated No. of Ratings 07‐08
Un‐Rated Un‐Rated Rate for Rate for
06‐07
Un‐Rated Rate for 05‐06 07‐08
LSU/HCSD Health Care Services Division 131 0.00% 0.00% 0.00%LSU System Hebert Law Center 15 0.00% 0.00% 0.00%Community Colleges LA Delta Community College 6 0.00% 0.00%Student Financial Assistance, LA LOSFA 130 0.00% 1.71% 0.00%Civil Service Municipal Fire and Police 18 0.00% 0.00% 0.00%Southern University System New Orleans 81 0.00% 0.00% 93.33%N O Ctr for Creative Arts/Riverfront NOCCA 8 0.00% 0.00% 0.00%Community Colleges Nunez Community College 29 0.00% 0.00% 25.00%Governor's Office Office of Aircraft Services 3 0.00% Governor's Office Patient's Compensation Fund 40 0.00% 0.00% 2.50%LSU System Pennington Biomedical 66 0.00% 0.00% 0.00%Pub Safety & Corr/CorrSrv Phelps Correctional Center ‐ PCC 309 0.00% 0.00% 0.00%Health & Hospitals Practical Nurse Examiners, Board of 13 0.00% 0.00%Pub Safety & Corr/Pub Safety Srv Private Investigator Board 10 0.00% Governor's Office Racing Commission 18 0.00% 0.00% 0.00%
Pub Safety & Corr/CorrSrv Rayburn Correctional Institute ‐ RCI (Formerly Washington CI) 352 0.00% 0.00% 0.00%
Governor's Office Real Estate Commission 25 0.00% 0.00% 0.00%Transportation & Development Sabine River Authority 44 0.00% Education School for Math, Science & Arts 13 0.00% 0.00% 0.00%Education School for the Visually Impaired 47 0.00% 0.00% 5.88%LSU System Shreveport 110 0.00% 0.00% 1.82%Community Colleges South LA Community College 4 0.00% Community Colleges Sowela Tech Community College 26 0.00% 3.57% 0.00%Governor's Office State Employees Group Benefits 321 0.00% 0.00% 0.00%Governor's Office Used Vehicle Commission 21 0.00% 0.00% 0.00%
November 19, 2008 Page 16

2007‐2008 PPR Report in Descending Order
Agency Agency
Calculated No. of Ratings 07‐08
Un‐Rated Un‐Rated Rate for Rate for
06‐07
Un‐Rated Rate for 05‐06 07‐08
Governor's Office Women's Policy 3 0.00% 0.00% 33.33%LSU System Agriculture Center Reported Late XXXXXXXX 6.96% 3.33%LSU System Baton Rouge Reported Late XXXXXXXX 11.21% 8.54%Labor Board of Plumbing 0.00%Pub Safety & Corr/Youth Dev Bridge City Culture, Rec & Tourism Council on Dvlpmt of French in LA (CODOFIL) 0.00% 0.00%Treasury Firefighters Retirement System Pub Safety & Corr/Youth Dev Jetson Pub Safety & Corr/Youth Dev Juvenile Probation and Parole Health & Hospitals Metropolitan Human Service District 50.39% Governor's Office Military 0.00% Economic Development Motor Vehicle Commission 0.00%Culture, Rec & Tourism New Orleans City Park 63.64%Health & Hospitals Nursing, Board of Reported Late XXXXXXXXX 21.43% 69.23%Health & Hospitals RadiolTech Board Community Colleges River Parishes Comm College 0.00% Education Special School District One 5.00%Treasury State Police Retirement System Pub Safety & Corr/Youth Dev Swanson‐Madison Pub Safety & Corr/Youth Dev Swanson‐Monroe Total Ratings Reported 57275
November 19, 2008 Page 17

November 19, 2008 Page 18

November 19, 2008 Page 19

November 19, 2008 Page 20