annual poll 2020 - paul simon public policy institute
TRANSCRIPT

1 2 3 1 L I N C O L N D R I V E - M A I L C O D E 4 4 2 9 S O U T H E R N I L L I N O I S U N I V E R S I T Y CA R B O N DA L E CA R B O N DA L E , I L 6 2 9 0 1
T: 6 1 8 / 4 5 3 - 4 0 0 9 F : 6 1 8 / 4 5 3 - 7 8 0 0
W W W. PAU L S I M O N I N S T I T U T E . O R GPAU L S I M O N I N S T I T U T E @ S I U . E D U
ANNUAL POLL 2020

1 Simon PollTM
paulsimoninstitute.org
Contact:
Charlie Leonard
618-303-9099
John Jackson
618-453-3106
Illinois Voters Favor Graduated Income Tax, Wide Range of Reforms
By a two-to-one margin, Illinois voters favor an amendment to the Illinois Constitution that
would allow for a graduated income tax, replacing the state’s flat income tax rate. That is one of
the highlights of the latest statewide Simon PollTM from the Paul Simon Public Policy Institute at
Southern Illinois University Carbondale.
The poll of 1,000 registered voters was conducted between February 10 and 17. It has a margin
of error of plus or minus 3.1 percentage points.
Graduated Income Tax
Two-thirds (65 percent) of respondents said they favored a constitutional change “to allow a
graduated income tax—that is, tax rates would be lower for lower-income taxpayers and higher
for upper-income taxpayers.” Support was robust, with 44 percent strongly favoring and 21
percent somewhat favoring the proposal. About a third (32 percent) opposed the proposal, 24
percent strongly and 8 percent somewhat opposed.
Support for the graduated income tax proposal reached majority levels in all three of the major
geographic breakdowns in Illinois: 73 percent in favor in the City of Chicago, 68 percent
favorable in the Chicago suburbs and 55 percent favorable downstate. Partisan differences were
more stark with 83 percent of Democrats favoring the graduated tax system, compared with only
half that level of support among Republicans (41 percent). Roughly six in ten (59 percent)
Independents favor the graduated tax.
“Millionaire’s Tax”
Similarly, 68 percent favored a so-called “millionaire’s tax,” a 3 percent tax on all income above
$1 million a year, which was the subject of an advisory referendum in November of 2014, when
it passed with 60 percent in favor. Half (51 percent) strongly favored the proposal, and another
17 percent were somewhat in favor. Three in ten respondents (30 percent) opposed the proposal,
22 percent strongly, and 8 percent only somewhat.
FOR IMMEDIATE RELEASE
March 3, 2020

2 Simon PollTM
Like the graduated income tax proposal, the surtax on million-dollar-plus incomes is popular
across Illinois’ major regions: 72 percent favorable in Chicago, 69 percent in the Chicago
suburbs, and 63 percent were in favor Downstate. As before, the proposal is widely popular
among Democrats (84 percent favorable), less popular among Republicans (about evenly
divided, with 48 percent in favor, 50 percent opposed), with Independents in the middle, 62
percent favoring the “millionaire’s tax.”
Redistricting Reform
By almost three-to-one, voters are in favor of redistricting reform, which has been the subject of
two ultimately unsuccessful statewide petition drives. More than six in ten (64 percent) favor
having “legislative district maps created and recommended by a commission that is independent
of the elected representatives.” Four in ten (40 percent) strongly favored redistricting reform,
with 24 percent favoring it somewhat. Two in ten respondents (22 percent) were opposed.
Voters across partisan and regional groupings were in favor of the redistricting commission idea:
67 percent of Chicago city voters, 66 percent of suburban Chicago voters, and 58 percent of
Downstate voters in support. Likewise, the redistricting commission was supported by 68 percent
of Democrats, 67 percent of Independents, and 60 percent of Republicans.
“The proposal for redistricting by an independent commission is now quite popular as it has been
in all of our earlier Simon polls. There seems to be a very active grassroots movement
supporting a change, and this year there is an unusual number of legislators from both parties
who have signed on,” noted John S. Jackson, one of the co-directors of the poll.
Lobbying Reform
Concern over influence-peddling in Springfield may be driving support for lobbying reform
proposals. By a wide margin (85 percent in favor, only 11 percent opposed), voters support a so-
called “revolving door” proposal that would force lawmakers “to wait at least one year after
leaving office before accepting jobs with firms that lobby their state legislatures.” Support is
uniformly robust—in the mid- to high 80 percent range across demographic and geographic
categories.
Six in ten (61 percent) support a ban on state legislators being paid for lobbying local
governments—46 percent strongly in favor and 15 percent somewhat in favor. A third (33
percent) oppose the proposal. As in the “revolving door” question, there is little meaningful
variation according to party or region, with support approaching or exceeding 60 percent
throughout.
Pension System Reform
A bare majority (51 percent) favored a constitutional amendment that would allow a reduction in
retirement benefits earned in the future by state workers. About a quarter (24 percent) strongly
favored, and 27 percent somewhat favored a proposal that “would preserve state retirement

3 Simon PollTM
benefits already earned by public employees, but would also allow a reduction in the benefits
earned in the future, whether by current or future employees.” More than a third (37 percent)
opposed the proposal.
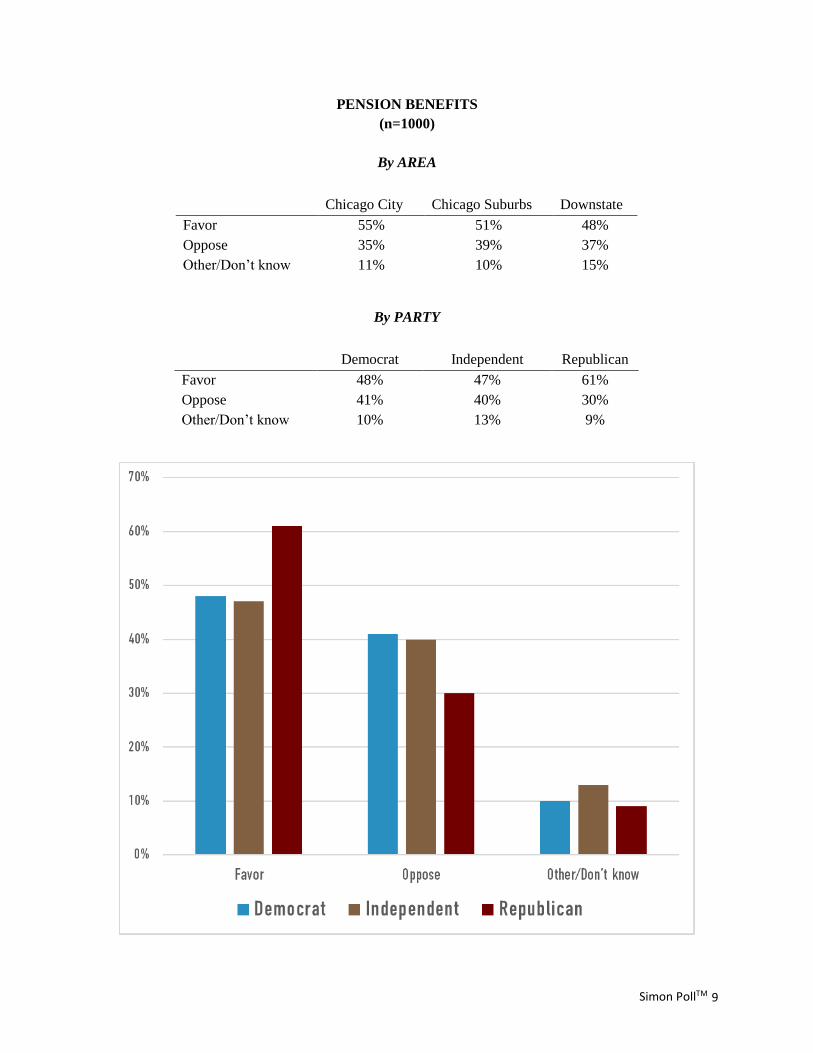
The pension-reduction question received majority support in Chicago (55 percent) and its
suburbs (51 percent), and plurality support Downstate (48 percent). The variation occurs among
partisan groups: below a majority among Democrats (48 percent) and independents (47 percent),
with much more enthusiasm among Republicans (61 percent favor).
###
The margin of error for the entire sample of 1,000 voters is plus or minus 3.1 percentage points.
This means that if we conducted the survey 100 times, in 95 of those instances, the population
proportion would be within plus or minus the reported margin of error for each subsample. For
subsamples, the margin of error increases as the sample size goes down. The margin of error was
not adjusted for design effects.
Live telephone interviews were conducted by Customer Research International of San Marcos,
Texas using the random digit dialing method. The telephone sample was provided to Customer
Research International by Scientific Telephone Samples. Potential interviewees were screened
based on whether they were registered voters and quotas based on area code and sex (<60
percent female). The sample obtained 56 percent male and 44 percent female respondents.
Interviewers asked to speak to the youngest registered voter at home at the time of the call. Cell
phone interviews accounted for 60 percent of the sample. A Spanish language version of the
questionnaire and a Spanish-speaking interviewer were made available.
Field work was conducted from February 11 to 17. No auto-dial or “robo” polling is included.
Customer Research International reports no Illinois political clients. The survey was paid for
with non-tax dollars from the Institute’s endowment fund. The data were not weighted in any
way. Crosstabs for the referenced questions will be on the Institute’s polling web site,
simonpoll.org.
The Paul Simon Public Policy Institute is a member of the American Association for Public
Opinion Research’s (AAPOR) Transparency Initiative. AAPOR works to encourage objective
survey standards for practice and disclosure. Membership in the Transparency Initiative reflects
a pledge to practice transparency in reporting survey-based findings.
The Institute’s polling data are also archived by four academic institutions for use by scholars
and the public. The four open source data repositories are: The Roper Center for Public Opinion
Research (http://ropercenter.cornell.edu/polls/), The University of Michigan’s Inter-university
Consortium for Political and Social Research (http://openicpsr.org), the University of North
Carolina’s Odum Institute Dataverse Network (http://arc.irss.unc.edu/dvn/dv/PSPPI), and the
Simon Institute Collection at OpenSIUC (http://opensiuc.lib.siu.edu/ppi/).

4 Simon PollTM
Note: The “Simon Poll” and the “Southern Illinois Poll” are the copyrighted trademarks of the
Board of Trustees of Southern Illinois University. Use and publication of these polls is
encouraged- but only with credit to the Paul Simon Public Policy Institute at SIU Carbondale.

5 Simon PollTM
Frequency Tables1
Reforms
Some people have proposed an amendment to the Illinois Constitution that would preserve state
retirement benefits already earned by public employees, but would also allow a reduction in the benefits
earned in the future, whether by current or future employees?
Response Percent (n=1000)
Favor 51%
Strongly favor 24%
Somewhat favor 27%
Oppose 37%
Somewhat oppose 17%
Strongly oppose 20%
Other/don’t know 12%
It has been proposed that Illinois ban state legislators from lobbying for local governments if they get
paid for the lobbying. Would you favor or oppose this proposal?
Response Percent (n=1000)
Favor 61%
Strongly favor 46%
Somewhat favor 15%
Oppose 33%
Somewhat oppose 11%
Strongly oppose 22%
Other/don’t know 6%

6 Simon PollTM
Most states surrounding Illinois require lawmakers to wait at least one year after leaving office before
accepting jobs with firms that lobby their state legislatures after leaving office. Illinois does not. Should
Illinois require lawmakers to wait at least a year before registering as a lobbyist?
Response Percent (n=1000)
Yes 85%
No 11%
Other/don’t know 5%
Would you favor or oppose a proposal to change the Illinois Constitution to allow a graduated income
tax – that is, tax rates would be lower for lower-income taxpayers and higher for upper-income
taxpayers?
Response Percent (n=1000)
Favor 65%
Strongly favor 44%
Somewhat favor 21%
Oppose 32%
Somewhat oppose 8%
Strongly oppose 24%
Other/don’t know 3%

7 Simon PollTM
Do you favor or oppose a proposal to impose an extra 3 percent state tax on all income above $1 million
a year?
Response Percent (n=1000)
Favor 68%
Strongly favor 51%
Somewhat favor 17%
Oppose 30%
Somewhat oppose 8%
Strongly oppose 22%
Other/don’t know 2%

8 Simon PollTM
Demographic Crosstabs
REDISTRICTING
(n=1000)
By AREA
By PARTY
Chicago City Chicago Suburbs Downstate
Favor 67% 66% 58%
Oppose 21% 21% 25%
Other/Don’t know 13% 13% 17%
Democrat Independent Republican
Favor 68% 67% 60%
Oppose 21% 18% 27%
Other/Don’t know 11% 15% 13%
9 Simon PollTM
PENSION BENEFITS
(n=1000)
By AREA
By PARTY
Chicago City Chicago Suburbs Downstate
Favor 55% 51% 48%
Oppose 35% 39% 37%
Other/Don’t know 11% 10% 15%
Democrat Independent Republican
Favor 48% 47% 61%
Oppose 41% 40% 30%
Other/Don’t know 10% 13% 9%

10 Simon PollTM
PAID LOBBYING
(n=1000)
By AREA
By PARTY
WAIT BEFORE LOBBYING
(n=1000)
By AREA
By PARTY
Chicago City Chicago Suburbs Downstate
Favor 66% 59% 61%
Oppose 28% 36% 32%
Other/Don’t know 7% 5% 6%
Democrat Independent Republican
Favor 63% 62% 59%
Oppose 32% 33% 34%
Other/Don’t know 5% 4% 7%
Chicago City Chicago Suburbs Downstate
Yes 85% 84% 87%
No 10% 12% 8%
Other/Don’t know 6% 4% 5%
Democrat Independent Republican
Yes 84% 86% 88%
No 11% 10% 9%
Other/Don’t know 5% 4% 3%

11 Simon PollTM
TAXES
(n=1000)
HISTORIC TREND
GRADUATED
By AREA
By PARTY
0
20
40
60
80
100
2015 2016 2017 2018 2019 2020
% Favor Proposal
Millionaires tax Graduated income tax
Chicago City Chicago Suburbs Downstate
Favor 73% 68% 55%
Oppose 25% 30% 40%
Other/Don’t know 3% 2% 5%
Democrat Independent Republican
Favor 83% 59% 41%
Oppose 15% 37% 55%
Other/Don’t know 2% 4% 3%

12 Simon PollTM
MILLIONAIRES
By AREA
By PARTY
Chicago City Chicago Suburbs Downstate
Favor 72% 69% 63%
Oppose 26% 28% 35%
Other/Don’t know 3% 2% 2%
Democrat Independent Republican
Favor 84% 62% 48%
Oppose 14% 36% 50%
Other/Don’t know 2% 3% 2%