annual poll 2020 results - paul simon public policy …
TRANSCRIPT

ANNUAL POLL 2020 RESULTS
John S. Jackson, Visiting Professor at the Paul Simon Public Policy InstituteCharles W. Leonard, Executive Director of the Grawemeyer Awards at the University of Louisville
Shiloh Deitz, Research Associate at the Paul Simon Public Policy InstituteMorgan Christie, Celia M. Howard Fellow at the Paul Simon Public Policy InstituteJorden Thomas, Celia M. Howard Fellow at the Paul Simon Public Policy Institute

Copyright © 2020 PAUL SIMON PUBLIC POLICY INSTITUTE. All rights reserved. Except for brief quotations, no part of this book may be reproduced in any manner without prior written permission from the Institute. Write to: Paul Simon Public Policy Institute, Southern Illinois Unversity, 1231 Lincoln Drive, Mail Code 4429, Carbondale, IL 62901.
Cover design and layout by Cary Day, Paul Simon Public Policy Institute.

INTRODUCTION
The Paul Simon Public Policy Institute is pleased to present the results of the 2020 Simon Poll™. The Simon Poll™ was established in 2008 and is conducted annually tobetter understand the opinion of registered voters in Illinois. The Simon Poll™ surveys public opinion on current public policy issues facing Illinois and the nation. The purpose of the Simon Poll™ is to provide critical insight into the opinion of registered voters in the state for policy makers, elected officials, and media.
Today, the nation is deeply polarized by partisanship, ideology, region, race and other important dimensions. This study examines some of those major divisions and documents the views of Illinois voters especially on the two divisions which are most salient in Illinois, partisanship and region. The report also provides longitudinal data from previous Simon Polls™, which now cover thirteen years.
This report is based on a statewide survey of 1,000 registered Illinois voters conducted between February 10 and 17, 2020. The margin of error is ±3.1%. The Simon Poll™ survey was conducted by Customer Research International in conjunction with the Paul Simon Public Policy Institute at Southern Illinois University Carbondale. Further methodological detail can be found in Appendix A. The Institute believes the Simon Poll™ is sound and credible; however, we acknowledge that some have criticized aspects of our methodology. We took those criticisms seriously, commissioned an independent review and are making technical adjustments to our methodology to strengthen future editions of the Simon Poll™. View the report online: paulsimoninstitute.org/opinion-polls/simon-institute-poll.php
For media inquiries please contact:
Dr. John S. Jackson Dr. Charles W. [email protected] [email protected]/453-4009 618/303-9099
3

TABLE OF CONTENTS
4
1 - SUMMARY OF THE MAJOR RESULTS
2 - GENERAL OUTLOOK AND JOB APPROVAL
2.1 GENERAL OUTLOOK2.2 JOB APPROVAL FOR MAJOR OFFICE HOLDERS
3 - PUBLIC POLICY ISSUES3.1 THE GRADUATED INCOME TAX3.2 THE MILLIONAIRES TAX3.3 REDISTRICTING REFORM3.4 LOBBYING REFORM3.5 PENSION SYSTEM REFORM3.6 DIVIDING ILLINOIS3.7 RESTORE THE DEATH PENALTY3.8 MINIMUM WAGE INCREASE3.9 GAS TAX INCREASE3.10 BROADEN THE SALES ON SERVICES
4 - POLITICAL IDEOLOGY AND PARTY IDENTIFICATION5 - REPORTS OF THE 2019-2020 CELIA M. HOWARD FELLOWS
5.1 PLASTIC WASTE IN LANDFILLS5.2 WOMEN’S HEALTH IN ILLINOIS
APPENDIX AREFERENCES
7
11
1119
2525262830313234363739
424545525658

FIGURES AND TABLES
LIST OF FIGURESFigure 1 - Right Direction/ Illinois and United States LongitudinalFigure 2 - Historical Job Approval Figure 3 - Millionaires Tax and Graduated Income Tax Historic TrendFigure 4 - Plastic Bag Ban Figure 5 - Plastic Bag Ban by PartyFigure 6 - Plastic Bag Ban by Region Figure 7 - Tax on Plastic Bags Figure 8 - Plastic Bag Tax by Party Figure 9 - Plastic Bag Tax by Region
LIST OF TABLES
Table 1 - Direction of the United States Table 2 - Direction of the United States by Region Table 3 - Direction of the United States by Political PartyTable 4 - Direction of Illinois Table 5 - Direction of Illinois by Region Table 6 - Direction of Illinois by Political Party Table 7 - Direction of Local Area Table 8 - Direction of Local Area by Political Party Table 9 - Direction of Local Area by Region Table 10 - Quality of Life Table 11 - Pritzker Job Approval Table 12 - Pritzker Job Approval by Political Party Table 13 - Pritzker Job Approval by Region Table 14 - Historic Governor Approval Table 15 - Durbin Job Approval Table 16 - Durbin Job Approval by Political Party Table 17 - Durbin Job Approval by Region Table 18 - U.S. President Job Approval Table 19 - Trump Job Approval by Political Party Table 20 - Trump Job Approval by Region Table 21 - Trump Historic Job Approval Table 22 - Graduated Income Tax Table 23 - Graduated Income Tax by Region Table 24 - Graduated Income Tax by Political Party Table 25 - Millionaires Tax Table 26 - Millionaires Tax by Region
5

Table 27 - Millionaires Tax by Political Party Table 28 - Redistricting Reform Table 29 - Redistricting Reform by Region Table 30 - Redistricting Reform by Political Party Table 31 - Legislators and Lobbying Table 32 - Legislators Wait Before Lobbying Table 33 - Legislators Wait Before Lobbying Table 34 - State Pension Reform by Region Table 35 - State Pension Reform by Political Party Table 36 - Divide Illinois? Table 37 - Divide Illinois by Region Table 38 - Divide Illinois by Political Party Table 39 - Restore the Death Penalty Table 40 - Restore the Death Penalty by Region Table 41 - Restore the Death Penalty by Political Party Table 42 - Minimum Wage Increase Table 43 - Minimum Wage Increase by Region Table 44 - Minimum Wage Increase by Political Party Table 45 - Gas Tax Table 46 - Gas Tax by Region Table 47 - Gas Tax Increase by Political Party Table 48 - Broaden Sales Tax Table 49 - Broaden Sales Tax by Region Table 50 - Broaden Sales Tax by Political Party Table 51 - Ideology Table 52 - Ideology by Region Table 53 - Ideology by Political Party Table 54 - Political Party Identification Table 55 - Political Party Identification by Region Table 56 - Plastic Bag Ban by Political Party Table 57 - Plastic Bag Ban by Region Table 58 - Plastic Bag Ban by Gender Table 59 - Plastic Bag Tax by Party Table 60 - Plastic Bag Tax by Region Table 61 - Plastic Bag Tax by Gender Table 62 - Resources to Maternal Care Table 63 - Resources to Care by Political Party Table 64 - Resources to Care by Region and Political Party Table 65 - Midwifery-led Model of Care Table 66 - Midwifery-led Model by Political Party
6
PAUL SIMON PUBLIC POLICY INSTITUTE SIMON POLL 2020 ANNUAL RESULTS

1 - SUMMARY OF THE MAJOR RESULTS
General Outlook In general Illinois voters are not positive about the direction of the United States. This is the con-clusion which can be drawn from the right track/wrong track questions the Simon Poll™ posed for the national, state, and local governments. In the most recent Simon Poll™ the voters chose wrong direction over right direction by a 60 to 34% margin. They also chose wrong direction by a slightly lower 58 to 31% margin for the state of Illinois.
However, it has long been recognized that the way people view the direction of the nation or the state is significantly influenced by their partisanship and place of residence. When the president or governor is of their party, voters’ evaluations of the direction is much more positive than when the other party is in control. This proved to be true in the 2020 Simon Poll™ as well as in previous edi-tions of the Simon Poll™. Also, the views of voters who live in rural, suburban, or urban areas vary systematically on this question according to the party identification of the Chief Executive.
Job ApprovalThe traditional job approval questions show significant variations for the major job holders. Gov-ernor J.B. Pritzker’s job approval rate is 51% approve compared to 38% who disapprove. This is a net positive of 13%, a notable improvement by 11% over the Simon Poll™ results for the same time in 2019 when Governor Pritzker had just taken office. 77% of Democrats approved of the job Governor Pritzker is doing as governor compared to 44% of independents and 20% of Republicans who approved. 73% of Republicans disapproved as did 43% of independents, but 44% of indepen-dents approved. Governor Pritzker had a high approval rate in Chicago (68%) and a majority in the suburbs (53%). Downstate 38% approved and 52% disapproved.
Senator Richard Durbin has a 52% approval score compared to 36% disapproval for a net positive of 16%. This is very similar to the senator’s scores in our earlier polls. Not surprisingly 79% of Demo-crats approved of the job Senator Durbin is doing as senator while 70% of Republicans disapproved. The independents were evenly divided with 42% who approved and 43% disapproved. Senator Durbin received a 64% rating in Chicago and a 54% approval in the suburbs. Downstate 39% ap-proved and 47% disapproved.
President Trump has a 40% approval score compared to a 59% disapproval rate, or is “underwa-ter” by 19% with Illinois voters. This result is comparable to earlier ratings the president received from Illinois voters in the Simon Poll™. 87% of Republicans approved and 92% of Democrats disap-prove of the job President Trump is doing with independents divided at 52% who disapprove and 43% who approve. The president’s job disapproval rate is very high at 73% in Chicago and 62% in the suburbs. Downstate the divide is 56% who approve and 41% who disapprove. This partisan and regional division vividly underscores the deep polarization that exists throughout the country.
Graduated Income TaxGovernor Pritzker’s graduated income tax proposal will be on the ballot in the November general election. If the proposal passes, it will be the most significant change to the Illinois tax system since 1969 when Illinois initially adopted the individual and corporate income tax system. The most
7
recent Simon Poll™ found the plan supported by 65% of registered voters and opposed by 32%. The approval rating for the graduated income tax is consistent with the previous seven years of results. As expected, Democrats heavily supported the plan by an 83 to 15% margin. Republicans oppose the graduated income tax by a 55 to 41% margin and independents fell in between with a 59% majority who support Governor Pritzker’s plan and 37% who oppose the plan.
The Millionaires TaxA closely related plan for raising more revenue is the millionaires tax, which would add a surcharge of 3% on all annual incomes of one million dollars or more in the state of Illinois. This proposal was on the ballot as an advisory referendum with strong support from the Speaker of the House, Mike Madigan in the fall of 2014. It passed with 60% support. In the most recent Simon Poll™, 68% of respondents supported the plan and 30% opposed the idea.
RedistrictingThe proposal to allow an independent commission, rather than the state legislature, draw new con-gressional and legislative district maps has been an issue for several years, and it recently received new attention from reform groups. 64% of Illinois voters favor this change, which would require a constitutional amendment, and 23% opposed. This pattern is consistent with the six previous Simon Poll™ findings where this question was asked. Voters across all partisan and regional lines are very supportive of this proposed measure.
Lobbying Reform
It is clear from this year’s Simon Poll™ there is a substantial amount of support for lobbying reform in Illinois. By the margin of 85% in favor and only 11% opposed, Illinois voters support a “revolving door” proposal which as the question specifies would require lawmakers “to wait at least one year after leaving office before accepting jobs with firms that lobby the state legislature.” Over the years, support for this idea is consistently in the mid to high 80% range across both partisan and geographic divides.
In Illinois currently state legislators can be paid for lobbying on behalf of various local governments. More than six in ten (61%) of Illinois voters support enacting a ban on this practice while one-third (33%) are opposed.
Pension System ReformThe state’s pension systems and their significant accumulated liabilities have been prominently discussed in the news for decades. There are various proposed remedies to this issue. One of the most discussed proposals would allow a reduction in retirement benefits earned in the future by state workers. In the Simon Poll™ a bare majority (51%) favored such an amendment. 37% of the respondents opposed this plan. The plan received majority support in Chicago (55%) and in the suburbs (51%) and a plurality (48%) downstate. Across partisan lines, the proposal received 61% ap-proval among Republicans, 48% among Democrats and 47% among independents.
8
PAUL SIMON PUBLIC POLICY INSTITUTE SIMON POLL 2020 ANNUAL RESULTS

Dividing IllinoisThe 2020 Simon Poll™ asked respondents about the possibility of dividing Illinois into two states, one centered in Chicago, and the other downstate. This discussion has taken place for decades in parts of the state and it is only one of the many manifestations of a rampant form of regionalism which perennially divides Illinois. The idea recently received new impetus from a group aggressively advocating such a division with the support from several downstate legislators. Three central and southern Illinois County Boards put the proposal on their February 2020 primary ballots. The Simon Poll™ found statewide 28% of voters favored this plan while two-thirds (66%) opposed the idea. The proposal received its highest level of support, although not a majority, from downstate and Republican respondents. It received strong opposition from Chicago and suburban voters and state-wide opposition from Democrats and independents.
Death PenaltyThe question of restoring the death penalty in Illinois was placed on the agenda by the federal government’s 2019 decision to restore the death penalty for federal crimes. A bare majority of 51% oppose the reinstatement of the death penalty in Illinois with 45% in favor. The restoration was opposed by 67% in Chicago and by 54% in the suburbs. It was supported by 57% downstate. Demo-crats opposed the restoration by 70% and 55% of independents opposed, while it was supported by 71% of Republicans.
Minimum WageThe state increased the minimum wage to $9.25/hour on January 1, 2020, and it will go to $10.00/hour on July 1, 2020 progressing its way to $15.00/hour in 2025. A strong majority favored the increase. The plan was strongly supported by 81% in Chicago and in the suburbs by 72%, and it received majority support downstate. Nine in ten Democrats and 64% of independents favored the increase while 59% of Republicans opposed the increase.
Motor Fuel Tax IncreaseThe 2019 General Assembly, by a bipartisan majority, approved Governor J. B. Pritzker’s plan to double the state’s motor fuel tax from $0.19 to $0.38 in order to address the state’s capital budget needs. The gasoline tax was supported by 42% and opposed by 67% of Illinois voters. The increase was supported in Chicago by 54% and opposed in the suburbs by 59% and opposed downstate by 62%. 54% of Democrats favored the increase while 73% of Republicans and 56% of independents opposed the idea.
Broaden the Sales Tax on Services
Budget reform groups in Illinois have long advocated for a proposal to broaden the number of ser-vices covered by the state sales tax. The 2020 Simon Poll™ found that only 20% of the respondents favored this idea while it was opposed by more than three-fourths (76%) of Illinois voters. The opposition is so widespread there were no major differences by regions or political parties.
Ideology and Party Identification The nation is deeply polarized by both ideology and partisanship. These are the two most important
9
PAUL SIMON PUBLIC POLICY INSTITUTE SIMON POLL 2020 ANNUAL RESULTS

attitudes impacting a wide range of political behavior. The Simon Poll™ included both of these indi-cators in its results as it has done for over a decade.
The results from the poll show the ideology of respondents is relatively equal with 34% of the respondents identifying themselves as conservatives, 33% as liberals, and 28% as moderates. Thus Illinois, not surprisingly, is somewhat more liberal than the nation as a whole.
On party identification, 47% of respondents identified as being Democrats or leaning toward the Democratic Party. 30% were Republicans, or leaned Republican leaving 16% as pure indepen-dents. Both results on ideology and party identification display why Illinois is considered to be a de-pendable Democratic state, although a Republican can win statewide under the right circumstances.
Plastic Bag Ban or TaxThe issue of plastic bags and their impact on the environment is an important issue in Illinois. Three cities, Chicago, Oak Park, and Evanston, enacted regulations on bags taken from retail outlets like grocery stores. Others advocate outright bans on the use of plastic bags. The Simon Poll™ found that 45% of registered voters said that there should be a ban on the retail use of plastic bags; 24% favored a small fee for each bag used and 29% opposed any regulation. Democrats (50%) and independents (49%) said that there should be a ban while 35% of Republicans favored a ban. There were no significant differences by regions.
Maternal Mortality and MidwivesIn 2019 Governor J. B. Pritzker signed a bill to address the maternal mortality rates in Illinois. Some experts advocate for greater use of midwives as a way to reduce the mortality rates and associated costs. The 2020 Simon Poll™ found that 53% of the voters surveyed said the state should allocate more resources to maternal care, including the use of midwives; 12% said allocate more resources to maternal care, but not use midwives; and 18% did not believe any additional steps should be taken to address the motherhood maternity rate. Higher proportions of Democrats (63%) and in-dependents (50%) said they supported Illinois allocating more resources to maternal care including midwives. Republican voters were least likely to support this proposition at 38%. Voters in Chicago were more likely to take this position (61%) followed by the suburbs (51%) and downstate (49%).
10
PAUL SIMON PUBLIC POLICY INSTITUTE SIMON POLL 2020 ANNUAL RESULTS

The Simon Poll™ provided a comprehensive overview of the opinions of Illinois voters on some of the most important issues facing the state. It also underscored the polarization of the state by partisanship and area on many issues and provides comparative results from previous Simon Polls™. The respon-dents were asked, “First, we’d like to know what you think about the direction of the United States of America. Generally speaking, do you think things in our country are going in the right direction, or are they off track and heading in the wrong direction?” The question is then repeated for the state and local area in which the respondent lives. Table 1 indicates the results for the nation as a whole and the longitudinal comparisons.
2 - GENERAL OUTLOOK AND JOB APPROVAL
2.1 GENERAL OUTLOOK
Table 1 shows the “wrong direction” response was chosen by an almost two to one margin. 60% chose wrong while 34% chose the right direction answer. This is fairly representative of the national polls, which show similar margins of disapproval of the general direction of the nation’s course1.
There are many reasons people might believe the country is going in the wrong direction, including economic stress, social and cultural conflicts, war and threats of war, etc. It could also be a surrogate for a sense of threat, alarm, malaise, alienation, or apathy in the national mood. However, the item is often linked to how people rate and rank the job being done by their political leaders, particularly the chief executives - the president or the governor.
1According to a Gallup poll in March 2020, 57% of Americans are dissatisfied with the way things are going in the United States.
Region is clearly an important factor in the respondents’ views of the direction of the nation, although this may reflect the political party make-up of Illinois’ regions. Only 26% of Chicago voters thought the
11

This gulf of partisan views on this question is not a new finding. Previous Simon Polls™ found similar deep divisions and concerns about the general direction of the nation; however, those evaluations are directly dependent on who is in the White House. When the president is a Republican, his own partisans are very positive about the nation’s direction. When the Democrats control the presidency, they are similarly pleased about the way things are going. The independents are consistently in
U.S. was on the right track while 68% chose the wrong track option, with 6% who don’t know. Down-state was much more sanguine about the nation’s direction, with 42% believing it is moving in the right direction and 48% choosing wrong direction. 10% downstate weren’t sure. The suburbs were in the middle with 32% choosing right track as opposed to double that, or 64% who chose wrong track. Schol-ars have consistently documented the pattern that where you live also has an impact on your evalua-tion of the nation’s course and many other political issues (Bishop, 2006; Gelman, 2008; Levendusky, 2008; Cramer, 2016).
Party identification produced even more marked differences in how the respondents viewed the na-tion’s direction. 86% of Democrats chose wrong track compared to 72% of Republicans who chose right track. Only 23% of Republicans chose wrong track and only 9% of Democrats chose the right track. The independents were in the middle but leaning closer to the Democrats’ views, with 56% who chose wrong track and 35% who chose right track.
12
PAUL SIMON PUBLIC POLICY INSTITUTE SIMON POLL 2020 ANNUAL RESULTS

This continued to be true in the 2020 Simon Poll™, but to a more limited extent. Only 31% of respon-dents thought the state was going in the right direction, compared to 58% who chose wrong direction with 12% who said “don’t know.” Again, 60% of the respondents chose “wrong direction” for the na-tion, and 34% chose right direction –the state differences are small. The state is essentially tied with the national ratings and both are poor. This is a slight improvement compared to earlier poll results which showed the state rated much more critically than the national results. In fact, the 58% wrong direction is the lowest it has been and the 31% right direction is the highest it has been since the Simon Poll™ was established in 2008.
In 2017 and 2018 the Simon Poll™ showed 84% of respondents thought the state was going in the wrong direction and only 7-9% believed Illinois was moving in the right direction. This was considerably worse than the 64% who chose wrong direction for the nation in 2018 and the 27% who chose right direction. Interestingly, the results from the spring 2019 poll showed an improvement in the right direc-tion/wrong direction ratio for Illinois with 67% selecting the wrong direction option and 22% the right direction option. This was only three months into the new Pritzker Administration and represented the first improvement in years. This trend continued downward for the wrong direction and upward for the right direction in the 2020 poll, perhaps indicating a modest vote of confidence in the Pritzker Admin-
between the two parties on this measure.
This general view is turned upside down when the White House changes hands. For example, when George W. Bush left office and Barack Obama took over in 2009, the partisan evaluations flipped imme-diately. The same thing happened in reverse in 2017 when Donald Trump was elected. This shows the power of party identification as an independent variable, not only directly influencing voting behavior, but also indirectly providing a perceptual screen which colors other important political attitudes (Camp-bell, et al., 1960).
The results are similar to the evaluation of the nation’s general direction when discussing the direction of the state of Illinois. Previous polling results for the state consistently were more negative than for the nation. The difference between the national and state evaluations is somewhat unusual – typically as the area of interest becomes closer to home the evaluations grow increasingly positive. But in Illinois, earlier Simon Poll™ results suggested that between the nation, state, and local area respondents gener-ally have the worst view of the state.
13
PAUL SIMON PUBLIC POLICY INSTITUTE SIMON POLL 2020 ANNUAL RESULTS

istration. As previously noted, this rating is usually influenced by the voters’ perceptions of the chief executive, a point further discussed.
Illinois has certainly had its share of problems throughout history and in recent past. The state is plagued by a culture of political corruption and has seen too many public officials, including four past governors, convicted of various crimes and sentenced to federal prisons. The recent pardon President Trump gave to former Governor Rod Blagojevich simply brought that troubled history back to the fore-front in Illinois and the nation. For decades, Illinois has been a strong-party state, with party organiza-tions on both sides following the traditional party model. This meant the parties were well organized and powerful at the grassroots level, and material benefits such as patronage jobs and control over the rewarding of contracts were major incentives for party work. The epitome of the strong urban party was the famous Professional Party machine headed by the late Chicago Mayor Richard J. Daley, who led the Cook County party organization through much of the 1950s, all of the ‘60s and through the mid-70s, when he died in office.
The Chicago tradition, which predated Daley by decades, slowly became less powerful and less relevant in a reform era. The final demonstration of the weakening of the traditional Professional Party model came in the April 2019 elections, when the Chair of the Cook County Board and Chair of the Cook County Democratic Party, Toni Preckwinkle, was defeated for mayor of Chicago by a wide margin by the reformist candidate Lori Lightfoot, who reflected the newer Reform Party model.
14
PAUL SIMON PUBLIC POLICY INSTITUTE SIMON POLL 2020 ANNUAL RESULTS

Nevertheless, the much discussed “culture of corruption” label is a blot on Illinois’s national reputation and is repeatedly invoked in discussing its politics. It hasn’t helped that several public officials, includ-ing state legislators and members of the Chicago City Council were indicted or convicted of crimes in federal court over the past few years. All of this history hangs over Illinois, so it is not particularly sur-prising that the state typically gets a more negative rating than even the federal government, which is usually the object of greater distrust in other states. The improvement in the 2019 and 2020 polls is an interesting variation on that long-term trend.
15
PAUL SIMON PUBLIC POLICY INSTITUTE SIMON POLL 2020 ANNUAL RESULTS

As is often the case in Illinois politics, there is a direct relationship between the independent variables of region and partisanship and the voters’ perceptions of their government and its politics. In the case of region, Table 5 shows voters in Chicago are the most positive about the direction of the state. 40% chose the right direction and 48% chose wrong direction. The suburban voters were next with 33% choosing right direction and 56% choosing wrong direction. The downstate voters were by far the most critical with two-thirds (67%) opting for wrong direction and only one quarter (21%) taking the more positive view.
The same distinct division is found among partisans in Table 6. Democrats were by far the most positive with 50% taking the right direction option and only 36% choosing the wrong direction. The indepen-dents were next with 22% taking right direction and 65% taking wrong direction. The Republicans were by far the most critical with 88% choosing the wrong direction and only 9% choosing the right direction option. These stark differences underline just how important party identification is in providing a pow-erful perceptual screen on political evaluations. It also provides another data point documenting how polarized the nation is on a wide range of political issues and perceptions that matter profoundly for how the government and political system work, or in many instances do not work in the current politi-cal environment.
Finally, respondents were asked “how things are going in your city or area of the state?” Thomas Jeffer-son was famous for asserting that the government closest to home, closest to the people is likely to be the best government. This is what the noted political scientist, V. O. Key, Jr. termed “friends and neigh-bors government” (Key, 1949).
In a smaller government structure closer to home, the citizen can know local officials and interact sometimes routinely with them as they meet in everyday settings. They can also know personally some of those officials through county or city governments or in school boards and township governments. Jefferson’s faith seems to be well placed in the findings for Illinois as shown in Table 7.
Here at the local level, over a majority (53%) say their city or area are going in the right direction, com-pared to only 38% who choose the wrong direction. This is a substantial improvement over the generally negative reactions both the national and state governments received in the most recent poll findings and usually received in earlier polls.
16
PAUL SIMON PUBLIC POLICY INSTITUTE SIMON POLL 2020 ANNUAL RESULTS

In addition, satisfaction with the local area was generally shared across regional and partisan divides, as can be seen from Tables 8 and 9, although more modest differences remain when compared to state and national ratings.
On region, the city of Chicago voters rated their direction more positive than negative, but by a mod-est plurality of 47% right direction and 41% wrong direction. They were followed by suburban Chicago voters, who rated their city or area positively at 55% right direction and 36% wrong direction. Downstate respondents were a similar 53% right direction and 38% wrong direction.
17
PAUL SIMON PUBLIC POLICY INSTITUTE SIMON POLL 2020 ANNUAL RESULTS

Democrats are the most positive about how things were going in their local areas by a two to one mar-gin, with 61% saying right direction and only 30% saying wrong direction. This is followed by a majority of independents who chose right direction (50%) compared to 40% wrong direction. Republicans were the only group who had more negatives than positives with 45% saying right direction and 48% saying wrong direction.
In summarizing the longitudinal data for the Simon Polls™ conducted between 2008 and 2019, a paper published in July 2019 as part of The Simon Review series concluded the following:
“For all the negative news voters consistently hear about the state of Illinois and how badly it is do-ing, and how frequently its government and politics get bashed, often by those in leadership positions themselves… this consistently positive outlook at the local level is always overlooked. Local governments certainly have their problems and challenges in Illinois, often related to the economy, to their budgets and occasionally to scandals; however, those local officials laboring in relatively obscure and out of the way places and small offices should take some satisfaction from our consistent findings that a majority of Illinois voters believe their local cities and areas are moving in the right direction” (Jackson, Leonard, and Deitz, 2019).
The 2020 Simon Poll™ posed a similar question: “Regardless of what you think about how things are go-ing in your part of the state, please tell me what you think about the overall quality of life in your area. Taking everything into account, would you say the overall quality of life in your area is excellent, good, average, not so good, or poor?” Table 10 provides those results.
Continuing the Jeffersonian tradition discussed earlier, these results show that people feel good about the quality of life in their local areas in Illinois. Exactly half (50%) of the respondents rated it excellent or good while only 15% rated it not so good or poor with the remaining 34% rated their quality of life as average. Perhaps this positive assessment of the quality of life in their own locale is why they chose to live there originally, or since they are there, they are generally satisfied with their situations. Either way, this re-sult, indicates that the general “culture of criticism” which attaches to both the state and national governments does not carry over to the voters’ sense of satisfaction with where they live now. That
18
PAUL SIMON PUBLIC POLICY INSTITUTE SIMON POLL 2020 ANNUAL RESULTS

2.2 JOB APPROVAL FOR MAJOR OFFICE HOLDERS
Respondents of the 2020 Simon Poll™ were asked questions regarding job approval ratings for the major public officials that dominate state and federal government. In the poll this rating included Illinois Gov-ernor J.B. Pritzker, U.S. Senator Richard Durbin, and President Donald J. Trump. Table 11 provides the results for Governor Pritzker’s job approval rating among registered voters.
For Governor Pritzker, who is not up for reelection this year, 51% approve of the job he is doing, and 38% disapprove. The governor, in his second year in office, holds a net positive approval rating of 13%. Some of the reasons for the systematic differences by partisanship and places of residence are evident in the findings presented in Tables 12 and 13.
would seem to be a good finding in face of the polarization and divisiveness that so starkly mark and mar our national discourse and political culture.
19
PAUL SIMON PUBLIC POLICY INSTITUTE SIMON POLL 2020 ANNUAL RESULTS
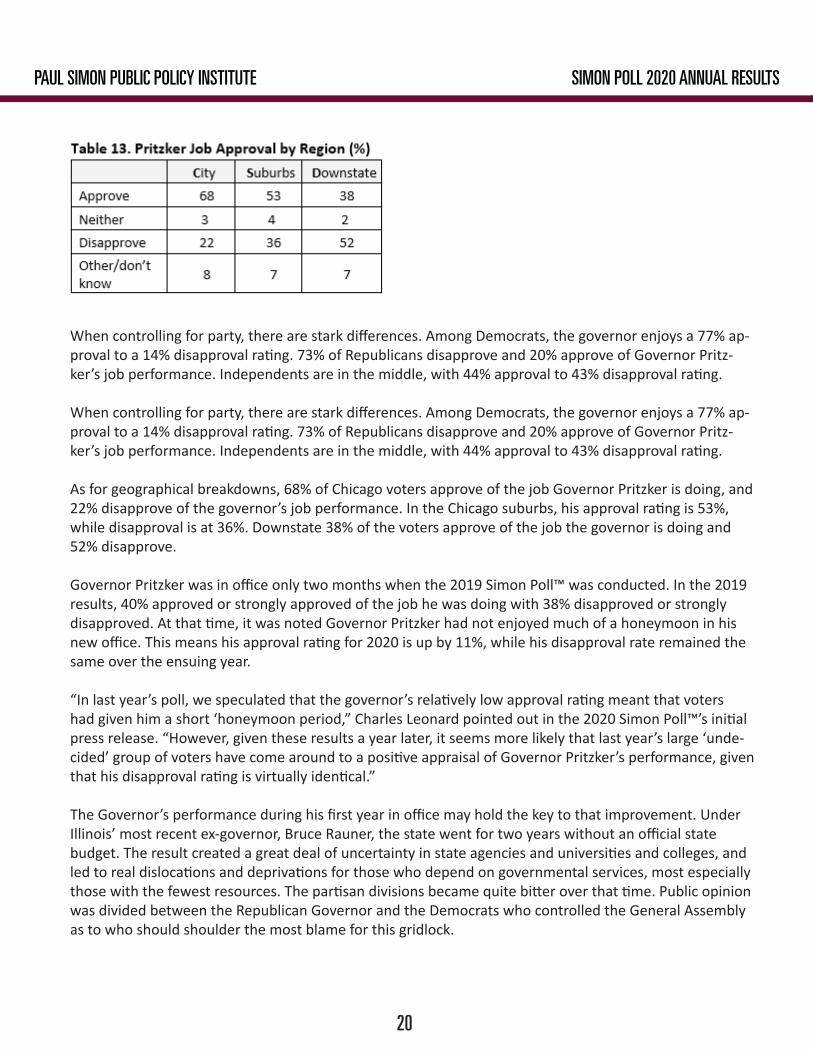
When controlling for party, there are stark differences. Among Democrats, the governor enjoys a 77% ap-proval to a 14% disapproval rating. 73% of Republicans disapprove and 20% approve of Governor Pritz-ker’s job performance. Independents are in the middle, with 44% approval to 43% disapproval rating.
When controlling for party, there are stark differences. Among Democrats, the governor enjoys a 77% ap-proval to a 14% disapproval rating. 73% of Republicans disapprove and 20% approve of Governor Pritz-ker’s job performance. Independents are in the middle, with 44% approval to 43% disapproval rating.
As for geographical breakdowns, 68% of Chicago voters approve of the job Governor Pritzker is doing, and 22% disapprove of the governor’s job performance. In the Chicago suburbs, his approval rating is 53%, while disapproval is at 36%. Downstate 38% of the voters approve of the job the governor is doing and 52% disapprove.
Governor Pritzker was in office only two months when the 2019 Simon Poll™ was conducted. In the 2019 results, 40% approved or strongly approved of the job he was doing with 38% disapproved or strongly disapproved. At that time, it was noted Governor Pritzker had not enjoyed much of a honeymoon in his new office. This means his approval rating for 2020 is up by 11%, while his disapproval rate remained the same over the ensuing year.
“In last year’s poll, we speculated that the governor’s relatively low approval rating meant that voters had given him a short ‘honeymoon period,” Charles Leonard pointed out in the 2020 Simon Poll™’s initial press release. “However, given these results a year later, it seems more likely that last year’s large ‘unde-cided’ group of voters have come around to a positive appraisal of Governor Pritzker’s performance, given that his disapproval rating is virtually identical.”
The Governor’s performance during his first year in office may hold the key to that improvement. Under Illinois’ most recent ex-governor, Bruce Rauner, the state went for two years without an official state budget. The result created a great deal of uncertainty in state agencies and universities and colleges, and led to real dislocations and deprivations for those who depend on governmental services, most especially those with the fewest resources. The partisan divisions became quite bitter over that time. Public opinion was divided between the Republican Governor and the Democrats who controlled the General Assembly as to who should shoulder the most blame for this gridlock.
20
PAUL SIMON PUBLIC POLICY INSTITUTE SIMON POLL 2020 ANNUAL RESULTS

Senator Richard Durbin, who is running for re-election in 2020, garnered a 52% job approval rating, while 36% disapproved (Table 15). This gave the senator a net positive approval rate of 16%—slightly higher than the governor’s.
All of this background contributed heavily to the results of the 2018 election when the challenger, J.B. Pritzker, ousted Governor Rauner by the large margin of 16% age points (55:39). Since that time, the governor and the General Assembly, not surprisingly, were able to reach an understanding without the deep rancor that marked the previous administration, and things in Illinois seemed to return to a more normal budgeting and legislative process. It may be that this “return to normalcy” has helped improve the citizens’ overall attitude toward how well their state is functioning. The comparisons between Gov-ernor Rauner and Governor Pritzker’s job approval ratings at similar points in their tenure are provided in Table 14 and Figure 2.
21
PAUL SIMON PUBLIC POLICY INSTITUTE SIMON POLL 2020 ANNUAL RESULTS

79% of Democrats approve or strongly approve of the job Senator Durbin is doing (Table 16). Those figures are almost reversed for Republicans, among whom 70% disapprove and 20% approve. The inde-pendents are in the middle, with 42% who approve and 43% who disapprove of the senator’s job perfor-mance.
The geographic distribution for Senator Durbin finds that 64% of Chicago voters approve and 26% disap-prove (Table 17). In the Chicago suburbs 54% approve and 34% disapprove of the job Senator Durbin is doing. Downstate, 39% approve and 47% disapprove. These partisan and geographic divisions are similar to those found for Governor Pritzker and simply indicate just how consistently the polarized divisions in the nation mark the same populations.
22
PAUL SIMON PUBLIC POLICY INSTITUTE SIMON POLL 2020 ANNUAL RESULTS

Not surprisingly, the job approval scores are heavily dependent on partisanship. 87% of Republicans ap-proved and only 12% disapproved of the job the president is doing (Table 19). Among Democrats, 92% disapprove while only 7% approve. Among the all-important independent category, 43% approved and 52% disapproved. President Trump was nine points underwater among Illinois independents and eighty-five points underwater among Democrats while being up by seventy-five points among Republicans.
In contrast with Governor Pritzker and Senator Durbin, who held job approval ratings above the majority mark, President Trump’s approval falls well below a majority. This year’s poll shows just 40% of Illinois voters approved of the president’s job performance while 59% disapproved. This is a net negative job approval rate of 19% age points demonstrated in Table 18.
23
PAUL SIMON PUBLIC POLICY INSTITUTE SIMON POLL 2020 ANNUAL RESULTS

Charlie Leonard summarized this comparison in the 2020 Simon Poll™ press release from February 20, 2020. “Our results are generally in line with what national polls have shown for most of Trump’s three years in office. However, in more recent polls, Trump’s Real Clear Politics polling average has been 45% approval to 52% disapproval. Given Illinois’ status as a Blue state, our more negative view of Trump is not surprising.”
One could hardly find another more graphic demonstration of the deep partisanship that divides the nation, especially where President Trump is concerned.
It is interesting to note the job approval results for President Trump are almost identical to those ob-tained by the Simon Poll™ in March 2019, when his approval rate was 39% and his disapproval rate was 59% thus producing a 20% underwater mark for the president in Illinois. This lack of difference in the two years’ results indicates great stability in how Illinois voters evaluate the job President Trump is doing (Table 21).
24
PAUL SIMON PUBLIC POLICY INSTITUTE SIMON POLL 2020 ANNUAL RESULTS

3 - PUBLIC POLICY ISSUES
3.1 THE GRADUATED INCOME TAXThe proposed graduated income tax is the most hot-button policy issue in Illinois since J. B. Pritzker started his run for the governor’s office in 2017. He made the advocacy of a graduated income tax one of the major planks for his 2018 platform. Since the current constitution came into effect in 1971 (and even before), Illinois has had a flat rate income tax structure, currently 4.95%. Only eight other states have a flat rate income tax out of the forty-one states who have an income tax. In addition, the federal income tax system is a (moderately) progressive tax. The graduated-rate proposal was passed through the Illinois General Assembly with strong support from Governor Pritzker and unanimous opposition from the Republicans in the spring session of 2019. It will be voted on in the November 3, 2020, general election.
The question was worded as follows: “Would you favor or oppose a proposal to change the Illinois Con-stitution to allow a graduated income tax—that is, tax rates would be lower for lower-income taxpayers and higher for upper-income taxpayers? Do you strongly (favor/oppose) or just somewhat (favor/op-pose) this proposal?” Table 22 provides the results.
Illinois voters favored the proposed amendment by a two to one margin. Two-thirds (65%) said they favored the graduated income tax proposal with 44% strongly favoring and 21% somewhat favoring the proposal. About a third (32%) opposed the proposal, 24% strongly and 8% somewhat opposed. Support for the graduated income tax proposal reached majority levels in all three of the major geo-graphic breakdowns in Illinois: 73% in favor in the City of Chicago, 68% favorable in the Chicago suburbs and 55% favorable downstate (Table 23).
25
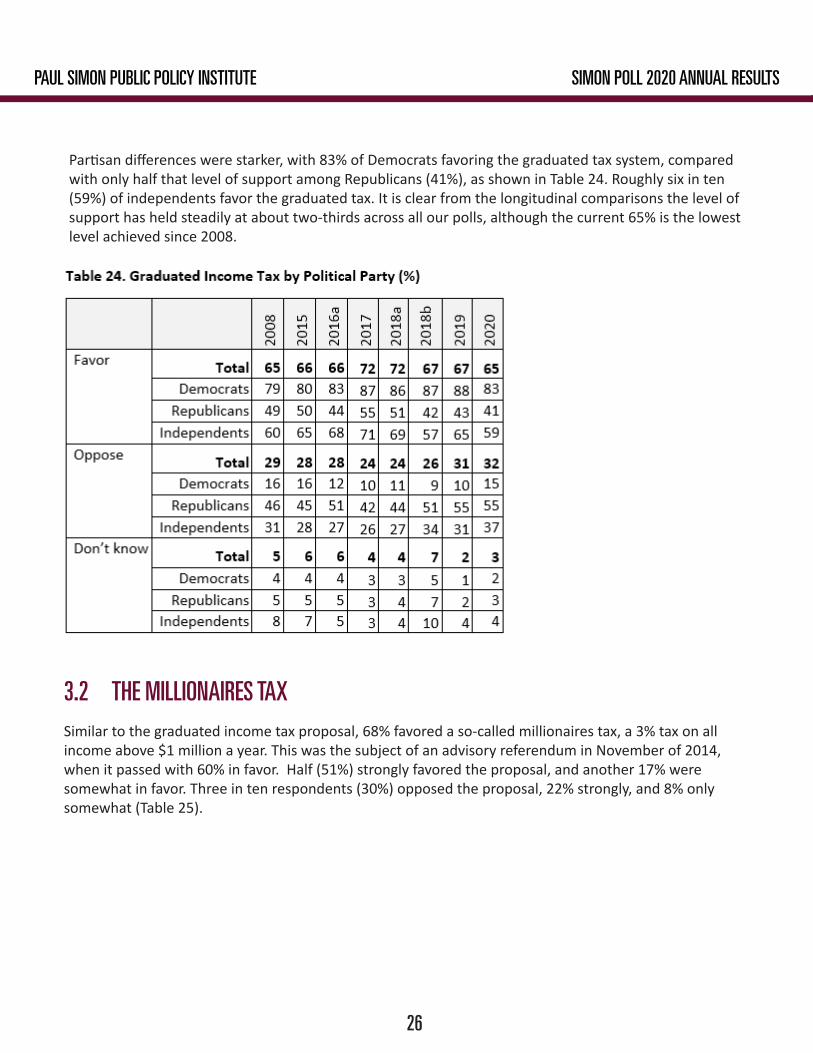
Partisan differences were starker, with 83% of Democrats favoring the graduated tax system, compared with only half that level of support among Republicans (41%), as shown in Table 24. Roughly six in ten (59%) of independents favor the graduated tax. It is clear from the longitudinal comparisons the level of support has held steadily at about two-thirds across all our polls, although the current 65% is the lowest level achieved since 2008.
3.2 THE MILLIONAIRES TAXSimilar to the graduated income tax proposal, 68% favored a so-called millionaires tax, a 3% tax on all income above $1 million a year. This was the subject of an advisory referendum in November of 2014, when it passed with 60% in favor. Half (51%) strongly favored the proposal, and another 17% were somewhat in favor. Three in ten respondents (30%) opposed the proposal, 22% strongly, and 8% only somewhat (Table 25).
26
PAUL SIMON PUBLIC POLICY INSTITUTE SIMON POLL 2020 ANNUAL RESULTS

27
PAUL SIMON PUBLIC POLICY INSTITUTE SIMON POLL 2020 ANNUAL RESULTS

Comparable to the graduated income tax proposal, the surtax on million-dollar-plus incomes is popular across Illinois’ major regions: 72% favorable in Chicago, 69% in Chicago suburbs, and 63% were in favor downstate.
As before, the proposal is widely popular among Democrats (84% favorable), less popular among Re-publicans (about evenly dived, with 48% in favor, 50% opposed), and independents in the middle, 62% favoring the millionaires tax and 36% opposed. This idea, too, has been consistently favored by a wide margin across all of our polls.
3.3 REDISTRICTING REFORMThe issue of partisan redrawing of the legislative and congressional district maps has been on the agen-da for well over a generation. Critics argue the current system amounts to “legislators selecting their constituents rather than the constituents selecting their legislators,” as it is supposed to be. There have been a number of reform movements trying to get this changed, but none have been successful so far.
By almost three-to-one, voters are in favor of redistricting reform, which has been the subject of two ultimately unsuccessful statewide petition drives. More than six in ten (64%) favor having “legislative district maps created and recommended by a commission that is independent of the elected representa-
28
PAUL SIMON PUBLIC POLICY INSTITUTE SIMON POLL 2020 ANNUAL RESULTS

tives.” Four in ten (40%) strongly favored redistricting reform, with 24% favoring it somewhat. Two in ten respondents (23%) were opposed (Table 28).
Voters across partisan and regional groupings were in favor of the redistricting commission idea: with 67% of Chicago voters, 66% of suburban Chicago voters, and 58% of downstate voters in support. Likewise, 68% of Democrats, 67% of independents, and 60% of Republicans supported the redistricting commission.
The proposal for redistricting by an independent commission continues to be quite popular, as shown in earlier Simon Poll™ findings (Table 30). There seems to be a very active grassroots movement supporting a change, and this year an unusual number of legislators from both parties have signed onto this movement.
2The question asked: “Some people have proposed an amendment to the Illinois Constitution that would have legislative district maps created and recommended by a commission that is independent of the elected representatives. Would you favor or oppose this proposal?”
29
PAUL SIMON PUBLIC POLICY INSTITUTE SIMON POLL 2020 ANNUAL RESULTS
2

3.4 LOBBYING REFORMConcern over influence peddling in Springfield may be driving support for the lobbying reform propos-als. Recently this practice is producing an abuse of power and prerogatives of office ensnarling several state legislators and members of the Chicago City Council.
By a wide margin (85% in favor, only 11% opposed), voters support a so-called “revolving door” pro-posal that would force lawmakers “to wait at least one year after leaving office before accepting jobs with firms that lobby their state legislatures.” Support is uniformly robust—in the mid-to high 80% range across partisan and geographic categories.
Six in ten (61%) support a ban on state legislators being paid for lobbying local governments- 46% strongly in favor and 15% somewhat in favor. A third (33%) oppose the proposal (Table 31). As in the “revolving door” question, there is little meaningful variation according to party or region, with support approaching or exceeding 60% throughout.
30
PAUL SIMON PUBLIC POLICY INSTITUTE SIMON POLL 2020 ANNUAL RESULTS

3.5 PENSION SYSTEM REFORMA bare majority (51%) favored a constitutional amendment that would allow a reduction in retirement benefits earned in the future by state workers. About a quarter (24%) strongly favored, and 27% some-what favored a proposal that “would preserve state retirement benefits already earned by public em-ployees, but would also allow a reduction in the benefits earned in the future, whether by current or future employees.” More than a third (37%) opposed or strongly opposed the proposal.
3It has been proposed that Illinois ban state legislators from lobbying for local governments if they get paid for the lobbying. Would you favor or oppose this proposal?4Most states surrounding Illinois require lawmakers to wait at least one year after leaving office before accepting jobs with firms that lobby their state legislatures after leaving office. Illinois does not. Should Illinois require lawmakers to wait at least a year before registering as a lobbyist?5Some people have proposed an amendment to the Illinois Constitution that would preserve state retirement benefits already earned by public employees, but would also allow a reduction in the benefits earned in the future, whether by current or future employees? Note: the question was worded somewhat differently in previous years.
31
PAUL SIMON PUBLIC POLICY INSTITUTE SIMON POLL 2020 ANNUAL RESULTS
3
4
5

The pension reduction question received majority support in Chicago (55%) and its suburbs (51%), and plurality support downstate (48%). The variation occurs among partisan groups: below a majority among Democrats (48%) and Independents (47%), with much more enthusiasm for this proposal among Repub-licans (61%).
3.6 DIVIDING ILLINOIS
For several decades there has been an on-going conflict in Illinois rooted in culture of deep sectional-ism. In any big state with one or more urban centers there are likely to be sectional divisions and cultural conflicts between urban and rural areas. California, New York, Wisconsin, and Oregon are other examples of such sectional divisions, some of which have led to proposals for separating the state into two - or in the case of California, four different states.
32
PAUL SIMON PUBLIC POLICY INSTITUTE SIMON POLL 2020 ANNUAL RESULTS

6A group of legislators from Central Illinois has introduced a bill which would separate Illinois into two different states, one composed of Chicago and the rest composed of downstate. Would you favor or oppose this proposal?
Such proposals usually originate in the rural areas and are a manifestation of what Katherine Cramer terms “rural resentment” (Cramer, 2016). In addition, careful analysis of the geographic distributions of the vote between Donald Trump and Hillary Clinton in the 2016 presidential race dramatically demon-strates just how deeply divided the nation is between its rural and urban regions. This division was at the core of the anomalous election results, in which Clinton won the popular vote by nearly three mil-lion votes and Trump won the Electoral College vote by a 306 to 232 margin.
While Illinois is not alone in experiencing a deep cultural and geographic divide between urban and rural areas, it is a long-standing division. An earlier manifestation of this same division was the desire in western Illinois some 30 years ago to have that region, which they called “Forgot-tonia,” recognized as a separate state.
More recently a similar drive arose in central and eastern Illinois, centered in the Effingham County region. The County Boards of Effingham, Fayette, and Jefferson Counties put a referendum on their March 17 Illinois Primary ballot asking their voters to weigh in on the proposal to divide Illinois into two states. In addition, four central and eastern Illinois legislators introduced a bill into the General Assembly to start that process. Public hearings and rallies were held in Effingham, Mount Vernon, and other sur-rounding cities in support of this bill.
In short, while it is a populist movement with some considerable interest and support in some geo-graphic areas, the bill itself is not likely to gain nearly the support in the General Assembly necessary to get it passed—and even if it did, the U.S. Congress would almost certainly not pass the bill. This is more of a cultural phenomenon indicating the deep and often fairly bitter distrust, hostility and long-simmer-ing resentment that some rural and small-town Illinoisans feel toward Chicago. It breaks out frequently in political campaigns in rural southern, central and western Illinois, where legislators run aggressively against Chicago and the now declining “machine politics” it represents to them.
33
PAUL SIMON PUBLIC POLICY INSTITUTE SIMON POLL 2020 ANNUAL RESULTS
6

One in five (19%) Illinois voters are strongly in favor and another 9% are somewhat in favor of creating two separate states out of Chicago and the rest of the state. A total of two-thirds (66%) are strongly or somewhat opposed to the idea.
The “two state” idea is widely opposed in Chicago (74%) and the suburbs (71%). Even among downstate respondents a smaller majority (51%) oppose the idea, although 43% were in favor there. This proposal is roundly opposed by Democrats (80%) and independents (67%). The proposal is essen-tially tied among Republican identifiers (48% in favor, 46% oppose). It’s interesting to note that just over a quarter of the voters in the sample appear willing to entertain the idea of separating the economic engine of Illinois from the rest of the state. This is probably more about cultural or political signaling, and emblematic of the deep polarization seen around the country.
3.7 RESTORE THE DEATH PENALTYAnother hot-button issue is the potential for restoration of the death penalty in Illinois, which was banned under Republican Governor George Ryan over his concerns about the potential for irreversible error. A number of states still use the death penalty, with Texas, Virginia, and Oklahoma being the lead-ing states where it is applied.
The federal government also helped to re-ignite the controversy over the death penalty when it re-started its application for capital crimes at the federal level. Respondents were asked: “In 2019 the U.S. Department of Justice announced that the government would resume capital punishment at the federal level for the first time since 2003. The death penalty has also been banned in Illinois during all of this period. Some have proposed that the death penalty be reinstated in Illinois. Do you strongly favor, favor, oppose or strongly oppose reintroducing capital punishment at the state level in Illinois?” Tables 39-41 provide the results.
34
PAUL SIMON PUBLIC POLICY INSTITUTE SIMON POLL 2020 ANNUAL RESULTS

A majority of 51% oppose the reinstatement of the death penalty, with 38% strongly opposed and 13% somewhat opposed. On the other side, 45% were in favor, with 27% strongly in favor and another 18% somewhat favoring the reinstatement.
Not surprisingly, this proposal divided Illinois both geographically and by partisanship as Tables 40 and 41 demonstrate. Two thirds (67%) of Chicago respondents opposed the restoration and only 30% sup-ported the idea. 51% strongly opposed. In the suburbs, 54% opposed and 43% supported the restoration of the death penalty. Downstate the picture was quite different from Chicago and the suburbs; a clear majority of 57% supported and 38% opposed restoring the death penalty.
The results for partisanship follow predictably. Democrats opposed the return to the death penalty by a 70 to 27 margin. Republicans supported it by a 71% support and 25% opposed margin. The indepen-dents were in between, but closer to the Democrats, with 55% opposing and 42% supporting the return to the death penalty.
35
PAUL SIMON PUBLIC POLICY INSTITUTE SIMON POLL 2020 ANNUAL RESULTS

3.8 MINIMUM WAGE INCREASEIn the spring of 2019, one of the first items the new Pritzker Administration introduced, and the General Assembly passed, was a significant minimum wage increase. It passed the General Assembly with over-whelming support by the Democrats and strong opposition by the Republicans. The bill went into effect on January 1, 2020, when the minimum increased to $9.25 with another increase to $10.00 due on July 1, 2020. The bill provided for incremental increases until it reaches $15.00 per hour in 2025.
However, the controversy over the new law is not entirely subsided, and several Republican legislators introduced a bill this year that adopts the original Republican position which was that downstate would be allowed to have a separate, and lower, minimum wage in recognition of their lower level of living expenses, according to the bill’s proponents. Respondents were asked: “Do you favor or oppose incre-mental increases in the state’s minimum wage, which is currently $9.25 an hour, up to $15 per hour by January 1, 2025?” Tables 42-44 provide the results.
7Do you favor or oppose incremental increases in the state’s minimum wage, which is currently $9.25 an hour, up to $15 per hour by January 1, 2025?
36
PAUL SIMON PUBLIC POLICY INSTITUTE SIMON POLL 2020 ANNUAL RESULTS

Statewide, Governor Pritzker’s plan to increase the minimum wage at the state level was popular in Illinois. Overall, 68% either favored or strongly favored the increase, and of that group, a majority (50%) strongly favored the increase. A total of 29% opposed or strongly opposed the increase. Not surprisingly, this level of support made it fairly easy for the governor and his allies to power this bill through the Gen-eral Assembly, and it even gathered some Republican votes.
The regional and partisan divisions on the minimum wage increase are the familiar ones that typically divide the public in Illinois. Regionally in the city of Chicago, 81% favored or strongly favored, with 62% in the strongly favor category. In the suburbs, almost three-fourths (72%) supported, with 25% in the opposed or strongly opposed category. Downstate there was also a majority (54%) who supported or strongly supported the increase, while 43% opposed.
With respect to partisanship, on the Democratic side, 91% of party identifiers supported this policy with only 7% opposed. They were followed by independents, almost two-thirds of whom (64%) supported or strongly supported the increase. On the Republican side, 39% of Republican voters favored the increase and 59% opposed.
3.9 GAS TAX INCREASEAnother issue addressed by the governor and the General Assembly in the spring session of 2019, but which has not entirely disappeared from the public discourse and political agenda in Illinois, is the increase in the state’s motor fuel tax. The increase took the tax from $0.19 per gallon to $0.38, begin-ning July 1, 2019. The revenue generated was designated for repair and upgrades for the state’s streets, highways, bridges and mass transit, and for some new construction. It was the key part of the Pritzker Administration’s capital improvements bill of 2019.
While the capital projects were popular and well received by the legislators and interest groups alike, the tax increase attendant to the bill was not especially popular, as is always the case. For some state legislators, particularly downstate and Republican legislators, it was a hard vote, which some gave only very reluctantly and others refused to deliver. The bill was so unpopular in some quarters that some of the Republican legislators who voted for it drew opponents in the Republican primaries on March 17, 2020. For example, in 117th district in deep southern Illinois, Dave Severin, a conservative Republican was challenged in the primary by a candidate whose major issue was that Severin voted for the capital bill; however, Severin won handily.
37
PAUL SIMON PUBLIC POLICY INSTITUTE SIMON POLL 2020 ANNUAL RESULTS
The 2020 Simon Poll™ asked the following question: “Do you favor or oppose the recent increase to the state’s gasoline tax to fund improvements to Illinois highways, roads, and bridges?” The results are provided in Tables 45-47.

8Do you favor or oppose the recent increase to the state’s gasoline tax to fund improvements to Illinois highways, roads, and bridges?9In 2015 the question asked, “Would you favor or oppose raising the state gasoline tax by 10 cents per gallon?” While in 2016 the question was just asked about a general gas tax.
38
PAUL SIMON PUBLIC POLICY INSTITUTE SIMON POLL 2020 ANNUAL RESULTS
3.10 BROADEN THE SALES TAX ON SERVICES
Previous findings from the Simon Poll™ show considerable opposition among voters to broadening the sales tax on services. There seems to be little support currently in the General Assembly, although in Bruce Rauner’s first campaign for governor he tentatively advocated for broadening the tax base by including more services; however, he then quickly backed off the idea when significant criticism ensued. Early in J. B Pritzker’s 2018 race for governor, he listed this as one possibility for where Illinois might find increased revenue, only to have his staff immediately dissuade him from advocating this idea, essentially repeating the Rauner example of four years before.
The idea is not dead, and it continues to be a part of the political discourse surrounding Illinois’ needs for new revenue to pay its unpaid bills and to find new revenue sources that fit the 21st Century econo-my. A variety of Illinois think tanks, ranging across the entire political spectrum, point out that the Illinois
As is evident in Table 45, the gasoline tax increase is still not popular even though the overall price of gas has not increased appreciably because of the vagaries of the international market (and in recent months has declined significantly). Overall 42% either favored or strongly favored the increase, whereas 57% opposed or strongly opposed.
The breakdowns by geography and party also followed a familiar pattern. Regionally in the city of Chi-cago, a majority (54%) either favored or strongly favored the gasoline tax increase, while 43% opposed. In suburban Chicago, 39% favored and 59% opposed. The negative sentiment was even more lopsided downstate, with only 36% in support and 62% opposed. The partisan differences are equally predictable. 54% of the Democrats favored the tax increase while 44% opposed or strongly opposed. Almost three-quarters (73%) of Republican respondents opposed or strongly opposed the increase and only 26% supported. Independents were in their familiar location be-tween the two parties, with 40% favoring and 56% opposing the tax on motor fuel. Table 47 shows the increase has consistently been unpopular over the years, although its unpopularity has declined recently from the almost three-fourths opposition level in 2015. In general, many voters want a modern transportation system with well-maintained and safe streets, highways, and bridges, functioning storm and sanitary sewers, levees that protect them from floods, ef-ficient mass transit systems, and adequate building and maintenance funds for K-12 schools, community colleges and universities. They simply want someone else to pay for them. Interestingly enough, at the end of the 2019 spring legislative session, a coalition of legislators, including crucial votes from Republi-can and downstate legislators (where, as we have seen, support was not very strong) reluctantly decided they had to support Governor Pritzker’s capital bill, since it was the first one in ten years to have a real chance at passing. This could have been considered a moment of truth, even a call to statesmanship, for these legislators, and many of them answered the call. The capital bill, including its tax increases, passed with a comfortable bi-partisan majority. This was one of the most significant accomplishments of the first year of Governor Pritzker’s administration.
39
PAUL SIMON PUBLIC POLICY INSTITUTE SIMON POLL 2020 ANNUAL RESULTS

tax system was designed when manufacturing and agriculture were the backbones of the economy. Now the state and nation have significantly shifted to a high-tech and services-oriented economy, although agriculture is still crucial in Illinois. The analysts point out that there are 168 total categories of services being taxed in some states in the U.S., with the average being 56 categories. Illinois taxes only 17 of the total services taxed in other states. Thus, Illinois’ tax system has simply not kept up with the facts of life regarding the 21st Century economy. This proposal would be an attempt to fundamentally realign taxes and revenues with the budget realities of the state. Respondents were asked: “Do you favor or oppose expanding the sales tax to cover the same services as Wisconsin currently taxes, such as a sales tax on entertainment tickets, cable and internet services, landscaping, and parking, which are not currently taxed?”. The results are provided in Tables 48-50.
40
PAUL SIMON PUBLIC POLICY INSTITUTE SIMON POLL 2020 ANNUAL RESULTS

Note the question only asked about matching the services already taxed in our neighbor to the north. Nevertheless, only 20% favored or strongly favored the proposal while fully 76% opposed or strongly opposed. In addition, 57% strongly opposed while only 7% strongly favored. No matter the argument for this idea for new revenue, the results indicate advocates for such a proposal would have a hard sell before it became law in Illinois.
Tables 49 and 50 provide the familiar geographic and partisan breakouts. On the sectional breakouts there are no major differences. City of Chicago voters were negative on this proposal with 67% opposed or strongly opposed compared to only 28% who favored. In suburban Chicago 78% opposed and 19% fa-vored. The most opposition was downstate, with an overwhelming 81% opposed and only 16% in favor of this fundamental change in the state’s tax system.
This is one question where the partisan differences were in a predictable direction, but the differences here were not great. Among the Democratic voters, who are usually more supportive of tax increases, 69% opposed and only 26% approved this idea. Among independents 76% opposed and 21% approved. Finally, over four fifths (85%) of the Republican respondents opposed or strongly opposed the concept of expanding the sales tax base. With these kinds of results, it is not surprising when the last two governors tentatively advanced this idea the blowback was so immediate and so overwhelming that each one, one Republican and one Democrat, quickly abandoned the idea. Governor Pritzker subsequently has not pursued the proposal as a viable option for addressing the revenue needs of his cash-strapped state.
41
PAUL SIMON PUBLIC POLICY INSTITUTE SIMON POLL 2020 ANNUAL RESULTS

4 - POLITICAL IDEOLOGY AND PARTY IDENTIFICATION
Political ideology and party identification are the two most important variables for explaining why people behave as they do politically. They have been important since the inception of modern public opinion polling in the late 1930s. They became crucial to the systematic explanations for voting behav-ior, a research tradition that essentially started in the 1940s and reached maturity in the 1950s and 1960s. In the post 2000 world, deep polarization rests firmly on the party and ideological differences that continue to organize the public’s perceptions and strongly impact the way they vote and participate in a variety of other political behavior, such as giving to and participating in political campaigns. Tables 51-53 demonstrate the distribution of ideology among the voters of Illinois.
42
Respondents were asked: “Generally speaking in politics today, do you consider yourself to be very lib-eral, liberal, moderate, somewhat conservative, or very conservative?” The results presented in Table 51 shows almost a tie with 34% choosing the conservative mantle; 33% choosing the liberal category, and 28% in the moderate middle. This illustrates that Illinois is somewhat more liberal than the nation as a whole since Gallup’s national poll data shows national conservatives are 37%; liberals 24% and moder-ates were 35% average for the year of 2019 (Saad, January 2020).
The breakdown of the data by geography and partisanship show some interesting variations (Tables 52 and 53). On region, 42% of Chicago respondents chose the liberal label; 33% chose moderate and 22% conservative. In the suburbs 37% were liberal, 28% moderate, and 31% conservative. Downstate, 48% were conservative, 26% moderate and 20% were liberal.
On ideology by party identification, for Democrats, 57% were liberal, 29% moderate, and 10% were conservative. For the Republicans, fully 80% were self-identified conservatives, leaving 16% who were moderates and only 3% were self-identified liberals. For independents, 23 were liberal, 26% were con-servative, and not surprisingly 44% were moderates.
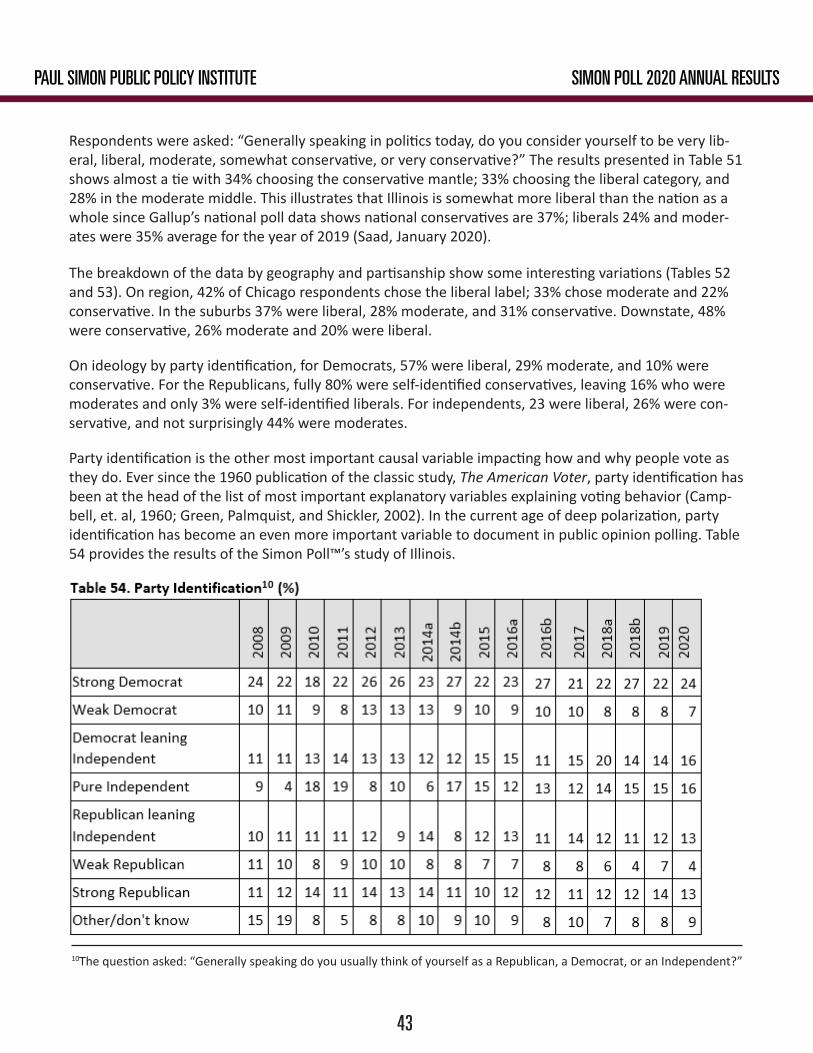
Party identification is the other most important causal variable impacting how and why people vote as they do. Ever since the 1960 publication of the classic study, The American Voter, party identification has been at the head of the list of most important explanatory variables explaining voting behavior (Camp-bell, et. al, 1960; Green, Palmquist, and Shickler, 2002). In the current age of deep polarization, party identification has become an even more important variable to document in public opinion polling. Table 54 provides the results of the Simon Poll™’s study of Illinois.
10The question asked: “Generally speaking do you usually think of yourself as a Republican, a Democrat, or an Independent?”
43
PAUL SIMON PUBLIC POLICY INSTITUTE SIMON POLL 2020 ANNUAL RESULTS

Table 54 shows Democrats have a clear and consistent advantage statewide in Illinois. In 2020 24% of all respondents called themselves strong Democrats, and an additional 7% not so strong Democrats for a total of 31%. Scholars ordinarily now combine these two categories with those who profess to be inde-pendents but lean to one party or the other by fairly consistently voting for that party’s candidates. The “leans Democrat” category attracted an additional 16% for a total of 47% in all Democratic categories.
The strong Republicans were 13% and not-so-strong Republicans were 4%, and the leans Republican added an additional 13% for a total of 30% total Republicans. The pure independents were at 16% and an additional 4% identified with some other party while 5% refused to answer the question or don’t know.
These results illustrate the fact that the Democrats start every statewide race in Illinois with a built-in advantage that reaches to almost a majority on party identification. If Democrats can get their party base out and add the leans Democratic group, they only need another three or four percentage points from the independents and cross-overs to prevail. This built in advantage is evident in the fact that all of the state’s constitutional officers currently are Democrats as are both U.S. Senators. The state’s U.S. House delegation is 13 Democrats and 5 Republicans, and both houses of the General Assembly have solid majority control by the Democrats. This does not mean Republicans cannot win statewide races. Illinois’ last governor, Bruce Rauner, was a case in point, as were a series of Republican governors in an unbroken string, starting with Jim Thomp-son in 1976 and ending with George Ryan in 2002. A strong Republican candidate, particularly one run-ning in the right context (as was the case of Bruce Rauner in 2014) can still win in Illinois, but he or she must build on a narrower Republican base and be amply supported by independents and disgruntled Democrats. In addition, turnout is always crucial for influencing whichever party’s candidate will have the best chance in November.
44
PAUL SIMON PUBLIC POLICY INSTITUTE SIMON POLL 2020 ANNUAL RESULTS

5 - REPORTS OF THE 2019-2020 CELIA M. HOWARD FELLOWS
Each year the Paul Simon Public Policy Institute hosts two Celia M. Howard Fellows. The Celia M. Howard Fellowship is awarded by the Celia M. Howard Foundation. The recipients are Southern Illinois University Carbondale graduate students completing masters or doctoral degrees in social and behavioral sciences or law. The 2019-2020 recipients are Jorden Thomas, who is pursuing a Master of Public Administration, and Morgan Christie, who is a Ph.D. candidate in the Counseling Psychology program.
Celia M. Howard Fellows are contributing staff members at the Paul Simon Public Policy Institute while they are in the program and are provided the opportunity and resources to complete specific research projects, including their master’s theses and doctoral dissertations. The students, with guidance from their advisors, choose a research subject in the field of governmental policy. The fellows are also pro-vided the opportunity to include questions in the Simon Poll™ in relation to their research project. The fellows’ research is often turned into papers, which are published in The Simon Review series and can be found on the Paul Simon Public Policy Institute’s website.
5.1 PLASTIC WASTE IN LANDFILLSResearch conducted by Jorden Thomas, Celia M. Howard Fellow
It is estimated that the annual global consumption of plastic bags ranges from 500 billion to 2 trillion, with the United States accounting for roughly 100 billion of this total (Knoblauch, Mederake, and Stein, 2018; United States Environmental Protection Agency, 2018). In relation to the nation’s annual gener-ated waste, plastics make up 13% of the total waste (EPA, 2018). While the United States does have recycling infrastructures in place that other developing countries do not have, the country is not able to recycle all waste that is generated by citizens. The use of incinerators and landfills is common practice across the nation. The United States’ reactionary perspective, instead of a proactive perspective, has resulted in a need for a major ideological shift from creating items from new material to the need for manufacturers to create items from recycled material (Illinois Recycling Association, 2015).
In 2015, Illinois had an estimated average of 33,000 tons of plastic retail shopping bags in 27 landfills across the state (Ibid). There are currently three municipalities in Illinois that have regulatory plastic bag legislation in place: the City of Chicago, Oak Park, and Evanston. In order to address the presence of plastic bags at the state-level, two new laws have been proposed: The Checkout Bag Tax Act (SB1240) and The Carryout Bag Fee Act (HB3335).
The Checkout Bag Tax Act (SB1240) was introduced to the Illinois Senate by Senator Terry Link on Feb-ruary 6, 2019. This bill would impose a seven-cent tax on each plastic bag used from a retail establish-ment across the state, but not for municipalities who have policies in place prior to February 1, 2018 (i.e. Chicago, Oak Park, and Evanston). Two cents of the tax will be kept by the retailer; two cents will be provided to the wholesaler of the plastic bags; and the remaining three cents will be put into the Check-out Bag Tax Fund. This fund would be utilized in a joint municipality action agency in order to clean up hazardous waste, create education programs to reduce pollution, and to increase citizen participation in recycling and composting programs. Those citizens who utilize the Supplemental Nutrition Assistance Program (SNAP) will not be required to pay the tax.
45
The Carryout Bag Fee Act (HB3335) was introduced in the Illinois House of Representatives by Repre-sentative Ann M. Williams on February 15, 2019 and has since gained more traction with the addition of more co-sponsors. This bill would impose a ten-cent fee on each carryout bag used by a customer in any retail establishment across the state, except in municipalities with a population greater than one million. Three cents would be returned to the retail establishment, four cents would be placed into the Carryout Bag Fee Fund, one cent would be given to the Prairie Research Institute of the University of Illinois, one cent would be placed into the Solid Waste Management Fund, and one cent would be placed into the Partners for Conservation Fund. Those citizens who utilize the Supplemental Nutrition Assistance Pro-gram (SNAP) will not be required to pay the tax. Additionally, it mandates that a county or municipality may not ban, place a fee or tax, or regulate in any other manner the use, disposition, content, taxation, or sale of carryout bags. This also limits the applicability of the provisions as they relate to a county or municipality that charged a fee or tax on carryout bags on February 1, 2018 (i.e. City of Chicago, Oak Park, and Evanston). Lastly, it limits home rule powers with respect to this subject.
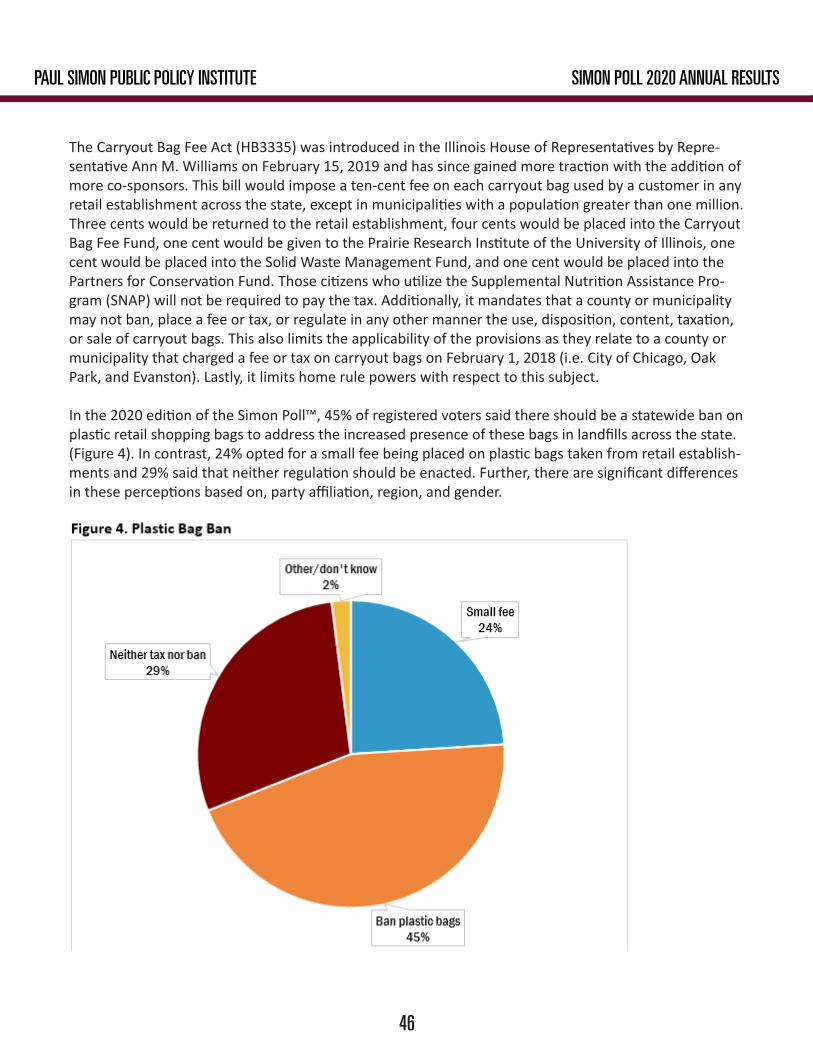
In the 2020 edition of the Simon Poll™, 45% of registered voters said there should be a statewide ban on plastic retail shopping bags to address the increased presence of these bags in landfills across the state. (Figure 4). In contrast, 24% opted for a small fee being placed on plastic bags taken from retail establish-ments and 29% said that neither regulation should be enacted. Further, there are significant differences in these perceptions based on, party affiliation, region, and gender.
46
PAUL SIMON PUBLIC POLICY INSTITUTE SIMON POLL 2020 ANNUAL RESULTS

Democrats are more likely to support regulations on plastic bags (Table 56). Higher proportions of Democratic (50%) and independent (49%) voters said they believe Illinois should ban plastic bags from retail establishments rather than tax or have no regulations in place. Republican voters were least likely to support a ban on plastic bags at 35%. Democrats were also more likely to support a small regulatory fee on plastic bags (29%), with 19% of independents supporting this measure and 21% of Republicans supporting a small fee on plastic bags. 41% of Republicans indicated that no regulations (i.e. neither tax nor ban) should be placed on plastic bags, with 29% of independent voters holding the same sentiments. Democrats show the least support of no regulation on plastic bags with 20% of their respondents choosing this opinion.
11The question read: In 2015, the State of Illinois had an estimated 33,000 tons of grocery and retail plastic bags in landfills across the state. In order to address the amount of plastic in landfills, some cities have passed a checkout plastic bag tax of 7 to 10 cents per bag. Other jurisdictions are considering banning such bags altogether. Which would you support at retail establishments in Illinois: charging a small fee for plastic bags, banning them altogether, or neither?
47
PAUL SIMON PUBLIC POLICY INSTITUTE SIMON POLL 2020 ANNUAL RESULTS

There are slight differences regarding region. Voters located in the City of Chicago (31%) represent the highest support for a small fee to be placed on plastic bags, whereas downstate voters represent the lowest support for a small fee (18%). There are roughly even amounts of support for the banning of plastic bags (i.e. 45% for city, 44% for suburbs, and 47% for downstate). Lastly, downstate voters (33%) and suburban voters (31%) were more likely to favor neither a tax nor ban on plastic bags, whereas city voters (22%) were least likely to favor no regulations.
Small gender differences were found with female voters (47%) preferring a ban on plastic bags, and male voters (43%) taking that position.
48
PAUL SIMON PUBLIC POLICY INSTITUTE SIMON POLL 2020 ANNUAL RESULTS

The second question asked whether the voters favored or opposed a tax of 7 cents on each checkout bag used by a customer at a retail establishment in Illinois. This question is in line with the proposed Checkout Bag Tax Act. Figure 7 provides the results.
12The question read: Specifically, the proposed Checkout Bag Tax Act imposes a tax of 7 cents on each checkout bag used by a customer at a retail establishment in Illinois. Would you strongly favor, favor, oppose, or strongly oppose such a plastic bag tax being imposed by the state?
As is clear from the figure, 40% of statewide respondents either strongly favored (22%) or favored (18%) that proposal for a tax on plastic bags. They were firmly outnumbered by the total of 58% who opposed the measure with 41% strongly opposed and 17% opposed. Perhaps this rejection of the idea is at least partially because it is a new tax and many people just automatically react against the imposition of new taxes. Some cities in other states have tackled this problem by providing that the entire tax revenue goes
49
PAUL SIMON PUBLIC POLICY INSTITUTE SIMON POLL 2020 ANNUAL RESULTS

back to the store and is earmarked for their costs of providing bags or providing alternatives to the plas-tic bags and this helps defuse the idea that the bag fee is just another new tax. But the proposition as it currently stands in Illinois will probably face determined opposition in the state legislature. The sources of both support for and opposition to the tax idea are found in the predictable divisions of party, geogra-phy, and gender in Illinois as is evident from the tables and charts below. Republicans are more likely to strongly oppose a statewide tax on plastic bags. (Table 58 and Figure 8). 52% of Republican voters indicated that they would strongly oppose a statewide tax on plastic bags. Independents followed the Republicans, with 43% reporting they would strongly oppose this tax. Lastly, Democrats (30%) were the least likely to strongly oppose a statewide tax. Democrats (29%) and inde-pendent voters (26%) were more likely to strongly favor the implementation of a statewide tax on plastic bags, with only 12% of Republican voters strongly favoring a tax. Downstate (45%) and suburban voters (43%) were more likely to strongly oppose a statewide tax on plastic bags, with only 32% of City voters strongly opposing such taxation.
50
PAUL SIMON PUBLIC POLICY INSTITUTE SIMON POLL 2020 ANNUAL RESULTS

City voters (32%) are more likely to strongly favor a statewide tax, with 24% of suburban voters and 14% of downstate voters strongly favoring a statewide tax on plastic bags. (Table 59 and Figure 9). Male voters (45%) were more likely to strongly oppose the statewide tax, and only 36% of female voters strongly oppose (Table 60).
51
PAUL SIMON PUBLIC POLICY INSTITUTE SIMON POLL 2020 ANNUAL RESULTS
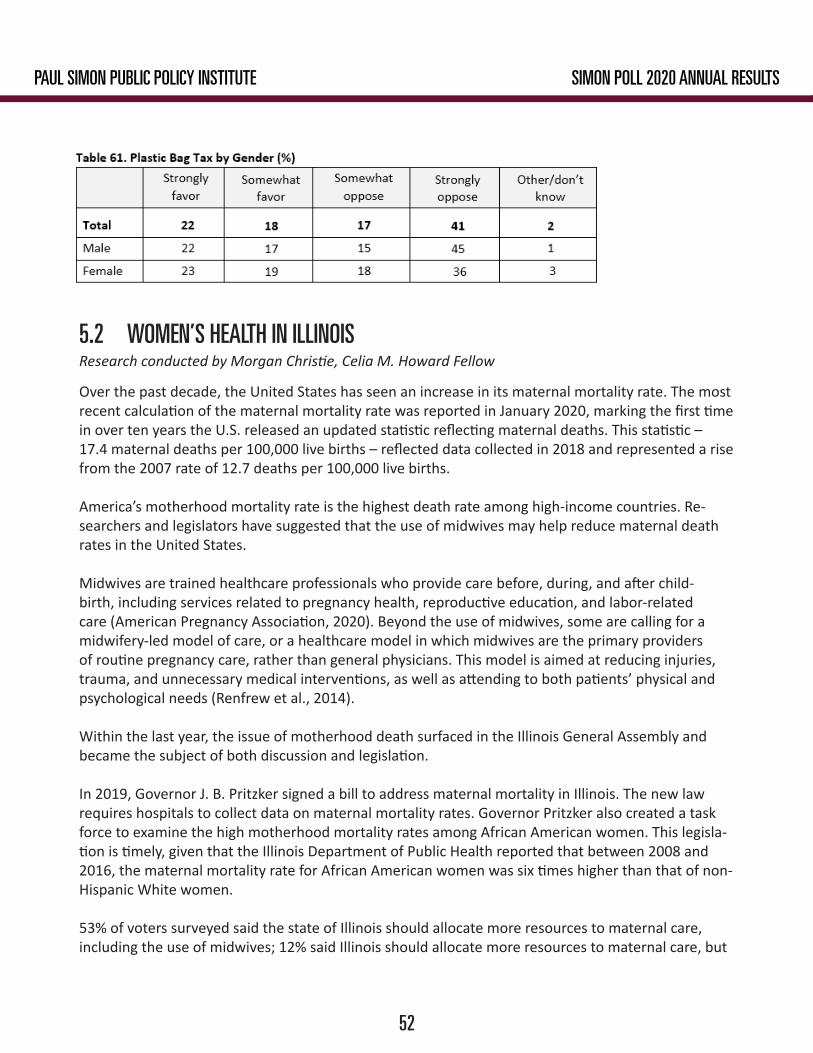
5.2 WOMEN’S HEALTH IN ILLINOISResearch conducted by Morgan Christie, Celia M. Howard Fellow
Over the past decade, the United States has seen an increase in its maternal mortality rate. The most recent calculation of the maternal mortality rate was reported in January 2020, marking the first time in over ten years the U.S. released an updated statistic reflecting maternal deaths. This statistic – 17.4 maternal deaths per 100,000 live births – reflected data collected in 2018 and represented a rise from the 2007 rate of 12.7 deaths per 100,000 live births.
America’s motherhood mortality rate is the highest death rate among high-income countries. Re-searchers and legislators have suggested that the use of midwives may help reduce maternal death rates in the United States.
Midwives are trained healthcare professionals who provide care before, during, and after child-birth, including services related to pregnancy health, reproductive education, and labor-related care (American Pregnancy Association, 2020). Beyond the use of midwives, some are calling for a midwifery-led model of care, or a healthcare model in which midwives are the primary providers of routine pregnancy care, rather than general physicians. This model is aimed at reducing injuries, trauma, and unnecessary medical interventions, as well as attending to both patients’ physical and psychological needs (Renfrew et al., 2014).
Within the last year, the issue of motherhood death surfaced in the Illinois General Assembly and became the subject of both discussion and legislation.
In 2019, Governor J. B. Pritzker signed a bill to address maternal mortality in Illinois. The new law requires hospitals to collect data on maternal mortality rates. Governor Pritzker also created a task force to examine the high motherhood mortality rates among African American women. This legisla-tion is timely, given that the Illinois Department of Public Health reported that between 2008 and 2016, the maternal mortality rate for African American women was six times higher than that of non-Hispanic White women.
53% of voters surveyed said the state of Illinois should allocate more resources to maternal care, including the use of midwives; 12% said Illinois should allocate more resources to maternal care, but
52
PAUL SIMON PUBLIC POLICY INSTITUTE SIMON POLL 2020 ANNUAL RESULTS

should not use midwives; and 18% did not believe any additional provisions should be used to ad-dress the motherhood mortality rate. 17% of voters did not know or declined to answer as indicated in Table 62.
13The question read: I’m going to ask you a couple questions on the midwifery-led model of care, a model in which mid wives, rather than physicians perform routine maternal care activities based on individual needs before, during, and after delivery. Some have suggested that this reduces death rates or injury during child delivery. The United States has the highest motherhood mortality rate among high-income countries. I’m going to read three statements about reproductive health in the U.S. In order to address the high mortality rate, the state of Illinois should:
Democrats are more likely to support the use of midwives (Table 63). Higher proportions of Demo-cratic (63%) and independent (50%) voters said they believe Illinois should allocate more resources to maternal care, including the use of midwives. Republican voters were least likely to support the use of midwives at 38%.
Democrats were also more likely to support the allocation of resources to maternal care, but not for midwives, at 16%. Independents and Republicans had similar proportions of voters supporting Il-linois allocating more resources to maternal care but opposing the use of midwives at 10% and 11%, respectively.
Based on party affiliation, Republicans (30%) were most likely to believe Illinois should not enact any additional provisions to address motherhood mortality, including the use of midwives. 23% of Inde-pendents did not believe any additional provisions should be in place. Democrats followed the Inde-pendents with only 9% reporting they did not believe any additional provisions should be in place.
53
PAUL SIMON PUBLIC POLICY INSTITUTE SIMON POLL 2020 ANNUAL RESULTS

Some differences existed based on region (Table 64). 61% of voters in the city supported the alloca-tion of more resources to maternal care, including midwives, with 51% of suburban voters and 49% of downstate voters taking this same view. There were no major differences across gender.
The second question pertained to whether respondents strongly favored, favored, opposed, or strongly opposed adopting the midwifery-led model of care. This was an attempt to get at the inten-sity of support or opposition to this concept. Overall, more than half of the voters polled (55%) reported they would favor a midwifery-led model of care (Table 65). Of these, 21% strongly favored, and 34% somewhat favored.
Voters identifying as Democrats, 62%, were most inclined to say they would favor a midwifery-led model of care (Table 66). Independents followed the Democrats, with 55% reporting they would favor a midwifery-led model of care. Republicans represented the smallest proportion of voters with nearly half (46%) favoring this healthcare model.
14The question read: Generally speaking, do you favor or oppose the midwifery-led model of care?
54
PAUL SIMON PUBLIC POLICY INSTITUTE SIMON POLL 2020 ANNUAL RESULTS
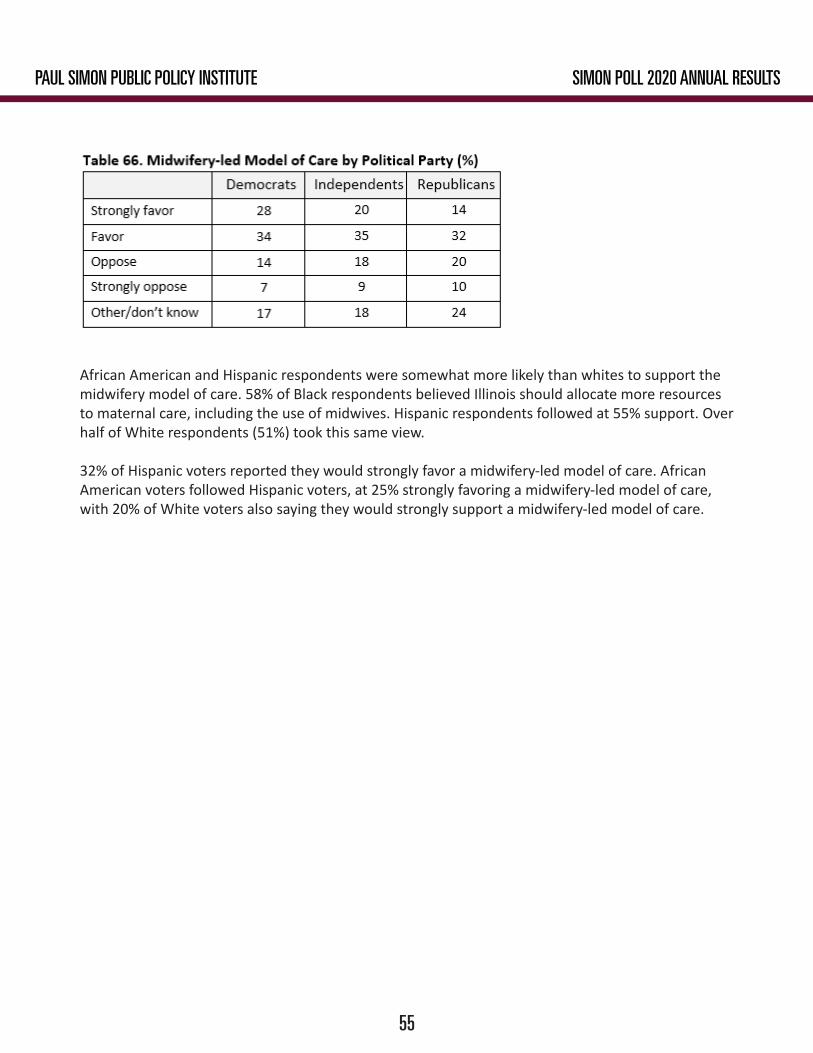
African American and Hispanic respondents were somewhat more likely than whites to support the midwifery model of care. 58% of Black respondents believed Illinois should allocate more resources to maternal care, including the use of midwives. Hispanic respondents followed at 55% support. Over half of White respondents (51%) took this same view.
32% of Hispanic voters reported they would strongly favor a midwifery-led model of care. African American voters followed Hispanic voters, at 25% strongly favoring a midwifery-led model of care, with 20% of White voters also saying they would strongly support a midwifery-led model of care.
55
PAUL SIMON PUBLIC POLICY INSTITUTE SIMON POLL 2020 ANNUAL RESULTS

APPENDIX A
56
PAUL SIMON PUBLIC POLICY INSTITUTE SIMON POLL 2020 ANNUAL RESULTS

The margin of error for the entire sample of 1,000 voters is ± 3.1 percentage points. The margin of error for the Republican sample (n=232) is 6.4 percentage points and the margin of error for Demo-crats (n=475) is 4.5 percentage points. This means that if we conducted the survey 100 times, in 95 of those instances, the population proportion would be within plus or minus the reported margin of error for each subsample. For subsamples, the margin of error increases as the sample size goes down. The margin of error was not adjusted for design effects.
Live telephone interviews were conducted by Customer Research International of San Marcos,Texas using the random digit dialing method. The telephone sample was provided to CustomerResearch International by Scientific Telephone Samples. Potential interviewees were screenedbased on whether they were registered voters and quotas based on area code and sex (<60percent female). The sample obtained 56 percent male and 44 percent female respondents.Interviewers asked to speak to the youngest registered voter at home at the time of the call. Cellphone interviews accounted for 60 percent of the sample. A Spanish language version of thequestionnaire and a Spanish-speaking interviewer were made available.
Field work was conducted from February 10 to 17, 2020. No auto-dial or “robo” polling is included.Customer Research International reports no Illinois political clients. The survey was paid forwith non-tax dollars from the Institute’s endowment fund. The data was not weighted in anyway. Crosstabs for the referenced questions will be on the Institute’s polling web site,simonpoll.org.
The Paul Simon Public Policy Institute is a member of the American Association for PublicOpinion Research’s (AAPOR) Transparency Initiative. AAPOR works to encourage objectivesurvey standards for practice and disclosure. Membership in the Transparency Initiative reflectsa pledge to practice transparency in reporting survey-based findings.
The Institute’s polling data results are also archived by four academic institutions for use by scholarsand the public. The four open source data repositories are: The Roper Center for Public OpinionResearch (http://ropercenter.cornell.edu/polls/), The University of Michigan’s Inter-universityConsortium for Political and Social Research (http://openicpsr.org), the University of NorthCarolina’s Odum Institute Dataverse Network (http://arc.irss.unc.edu/dvn/dv/PSPPI), and theSimon Institute Collection at OpenSIUC (http://opensiuc.lib.siu.edu/ppi/).
Note: The “Simon Poll” and the “Southern Illinois Poll” are the copyrighted trademarks of theBoard of Trustees of Southern Illinois University. Use and publication of these polls isencouraged- but only with credit to the Paul Simon Public Policy Institute at SIU Carbondale.
57
PAUL SIMON PUBLIC POLICY INSTITUTE SIMON POLL 2020 ANNUAL RESULTS

American Pregnancy Association. (2020). Midwives. Retrieved from: https://american pregnancy.org/labor-and-birth/midwives/
Abramowitz, Alan. 2010. “How Large a Wave?” Using the Generic Ballot to Forecast the 2010 Mid-term Elections.” Political Science & Politics. 43, no. 4: 633; Abramowitz, Alan. January 16, 2020.
“Don’t Believe the Washington C. W.: Trump is no Shoe-In for Reelection”. in Larry Sabato, ed. Report of the University of Virginia Center for Politics.
Bishop, Bill. 2006. The Big Sort: Why the Clustering of Like-Minded America is Tearing Us Apart. New York; Houghton-Mifflin Harcourt. Campbell, Angus, Philip E. Converse, Warren E. Miller, and Donald E. Stokes. 1960. The American Voter. New York: John Wiley & Sons.
Cramer, Katherine J. 2016. The Politics of Resentment. Chicago: The University of Chicago Press. Gelman, Andrew. 2008. Red State Blue State Rich State Poor State: Why Americans Vote as They Do. New Haven: Yale University Press.
Green, Donald, Bradley Palmquist, and Erick Shickler. 2002. Partisan Hearts and Minds: Political Par-ties and the Social Identities of Voters. New Haven: Yale University Press.
Jackson, John S., Charles Leonard, and Shiloh Deitz. July 2019. “The Climate of Opinion in Illinois: Gridlock Broken?” The Simon Review. Paper #56. The Paul Simon Public Policy Institute.
Key, V. O. 1949. Southern Politics in State and Nation. New York: Knopf. Chapter 3.
Knoblauch, D., Mederake, L., and Stein, U. 2018. “Developing Countries in the Lead: What Drives the Diffusion of Plastic Bag Policies?”. Sustainability. Volume 10.
Levendusky, Matthew. 2009. The Partisan Sort: How Liberals Became Democrats and Conservatives Became Republicans. Chicago: The University of Chicago Press.
Renfrew, M. J., et al. 2014. Midwifery and quality care. The Lancet. 384. 1129-45.
Saad, Lydia, January 2020 “The U.S. Remained Center-Right, Ideologically, in 2019”. The Gallup Poll.
United States Environmental Protection Agency, 2018. Advancing sustainable materials management. 2015 Fact Sheet: Assessing trends in material generation.
REFERENCES
58
PAUL SIMON PUBLIC POLICY INSTITUTE SIMON POLL 2020 ANNUAL RESULTS

59
PAUL SIMON PUBLIC POLICY INSTITUTE SIMON POLL 2020 ANNUAL RESULTS

Paul Simon Public Policy Institute Southern Illinois University Mail Code 4429 1231 Lincoln DriveCarbondale, Illinois 62901
618/[email protected] www.paulsimoninstitute.org