annual report 2005 - dolphindrilling.no · bideford dolphin continued operations offshore norway...
TRANSCRIPT

Annual Report 2005

Contents
Financial Summary 2001-2005 3 A Brief Presentation 4 Major Events 2005 5 Board of Directors’ Report 2005 7-11 Accounts Fred. Olsen Energy Group 13-45
Income Statement 13
Balance Sheet 14-15
Cash Flow 16
Notes 17-45 Accounts Fred. Olsen Energy ASA 46-63
Income Statement 46
Balance Sheet 47
Cash Flow 48
Notes 49-60
Auditor’s Report 61 Investor Information 62-65 Corporate Governance 66-67 Contract Overview 68-69 The Offshore Drilling Market 70-71 Management Report 72-75
Offshore drilling 72-74
Engineering and fabrication 75 Quality, Health, Safety and Environment 76 Addresses 78 . . .at a glance
Fred. Olsen Energy ASA - Annual Report 20052
2

Financial Summary 2001-2005
IFRS NGAAP
Income Statement Data All amounts in NOK mill 2005 2004 2003 2002 2001
Revenues 2 882.9 2 345.8 1 696.6 2 528.0 3 066.2
Operating profit before depreciation and other items (EBITDA) 920.7 566.4 389.8 581.3 1 050.5
Net result after tax (15.7) 419.8 (464.3) (969.5) 8.7
Assets
Current assets 1 700.2 1 257.6 937.2 991.7 1 800.0
Non-current assets 5 539.6 5 180.6 8 271.2 9 244.3 11 525.3
Net assets discontinued operations 51.9 203.5 383.2
Total assets 7 239.8 6 438.2 9 260.3 10 439.5 13 708.5
Liabilities and equity
Interest bearing debt 3 295.3 3 164.0 3 498.5 4 575.8 6 438.9
Total liabilities 4 289.2 4 196.4 4 281.4 5 141.2 7 155.4
Equity 2 950.6 2 241.8 4 978.9 5 298.3 6 472.7
Total liabilities and equity 7 239.8 6 438.2 9 260.2 10 439.5 13 708.5
Key Figures Definitions 2005 2004 2003 2002 2001
Market capitalization 1 14 864.1 5 276.3 1 718.6 572.9 2 653.2
Net interest bearing debt 2 2 578.2 2 565.3 3 139.5 4 027.8 5 196.6
Enterprise value 3 17 442.3 7 841.6 4 858.1 4 600.6 7 849.8
Debt/Book equity ratio 1.12 1.41 0.70 0.86 0.98
Debt/Market capital ratio 0.22 0.62 2.04 7.99 2.43
Current ratio 4 1.30 1.37 0.73 0.69 1.45
EBITDA margin 5 31.9 % 24.1 % 23.0% 23.0% 34.3%
Average number of shares outstanding 61.2 mill 57.4 mill 57.3 mill 57.5 mill 59.8 mill
Share price at year end 6 243.0 87.5 28.5 9.5 44.0
Basic earnings per share (EPS) 7 (0.3) 7.3 (8.1) (16.9) 0.1
Net investment per share (8.8) 2.0 9.4 (6.2) (6.3)
Price/Basic earnings 8 neg. 12.0 neg. neg. 302.4
Price/Book 9 5.0 2.4 0.3 0.1 0.4
EV/EBITDA 18.9 13.8 12.5 7.9 7.5
1 Closing price * number of shares at year-end
2 Short-term debt+Long-term debt-Cash and cash equivalents
3 Market capitalisation+Net interest bearing debt
4 Current assets/Current liabilities
5 EBITDA /Revenues
6 Last trade on last trading day of the year
7 Net profit/average number of shares outstanding
8 Closing price/Basic EPS
9 Closing price/Book value per share
Fred. Olsen Energy ASA - Annual Report 2005�
�
Fred. Olsen Energy – Group
A Brief Presentation
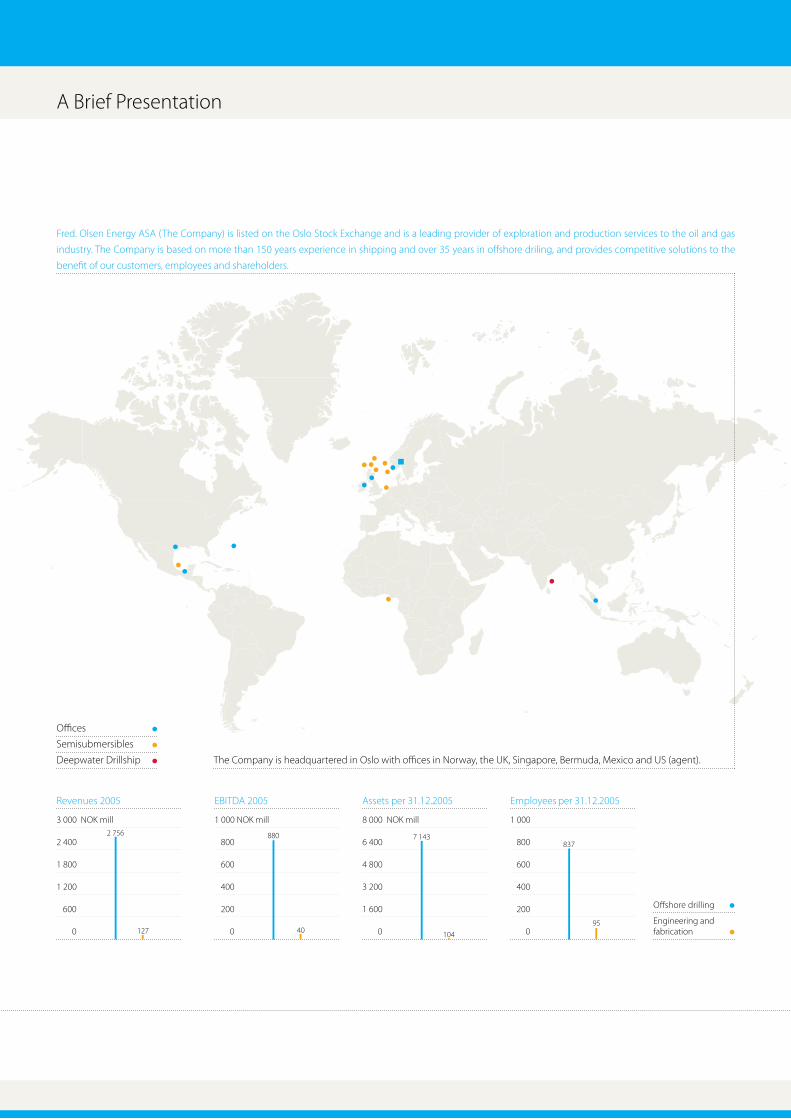
Fred. Olsen Energy ASA (The Company) is listed on the Oslo Stock Exchange and is a leading provider of exploration and production services to the oil and gas
industry. The Company is based on more than 150 years experience in shipping and over 35 years in offshore driling, and provides competitive solutions to the
benefit of our customers, employees and shareholders.
The Company is headquartered in Oslo with offices in Norway, the UK, Singapore, Bermuda, Mexico and US (agent).
Revenues 2005
3 000 NOK mill
2 400
1 800
1 200
600
0
Offices
Semisubmersibles
Deepwater Drillship
EBITDA 2005
1 000 NOK mill
800
600
400
200
0
Assets per 31.12.2005
8 000 NOK mill
6 400
4 800
3 200
1 600
0
Employees per 31.12.2005
1 000
800
600
400
200
0
2 756
127
880
40 104
837
95
7 143
Offshore drilling
Engineering and fabrication

March 05
Five months drilling contract with Peak Well Management Ltd. for Bredford Dolphin.
Five months drilling contract with Chevron Texaco North Sea Ltd. for Borgsten Dolphin.
Two months drilling contract with Total for Bredford Dolphin.
April 05
Six months accommodation contract with Shell U.K. Ltd. for Borgholm Dolphin.
June 05
Acquisition of Ocean Liberator, renamed Blackford Dolphin.
August 05
5 wells drilling contract, estimated to 210 days, with Equator for Bulford Dolphin.
September 05
Three years drilling contract with Anadarko Petroleum Corporation for Belford Dolphin.
Three months drilling contract with CNR for Borgsten Dolphin.
Three years drilling contract with Statoil for Borgsten Dolphin.
October 05
12 months drilling contract with Equator for Bulford Dolphin.
November 05
275 days drilling contract with CNR for Byford Dolphin.
720 days drilling contract with Tullow/Nexen for Borgsten Dolphin.
December 05
260 days accommodation contract with Shell/Talisman for Borgholm Dolphin.
3 wells drilling contract, estimated to 90 days, for Bredford Dolphin.
Events after 31.12.05
January 06
Three years drilling contract with Drilling Production Technology as for Bredford Dolphin.
March 06
Secured contract with Keppel FELS for upgrading of Blackford Dolphin.
Two months drilling contract with Peak Well Management Ltd. for Bredford Dolphin.
Three years drilling contract with Reliance Industries Ltd. for Blackford Dolphin.
Early redemption of NOK 760 million bonds 2004/09
Established new credit facility of USD 600 million.
Major Events in 2005
�
�
Fred. Olsen Energy ASA - Annual Report 2005

Fred. Olsen Energy ASA - Annual Report 2005�
�

�
�Fred. Olsen Energy ASA - Annual Report 2005
�
Board of Directors’ Report 2005
The operating activities of Fred. Olsen Energy
ASA and its subsidiaries (“The Group”) consist
of offshore drilling as well as engineering and
fabrication services. The Group has its corporate
headquarters located in Oslo, Norway. The par-
ent company of the Group is Fred. Olsen Energy
ASA (“The Company”). The Group manages its
activities from offices in Norway, the UK, Singa-
pore, Bermuda and Mexico and has a branch
office in India. Engineering and fabrication serv-
ices consist of activities related to the Harland &
Wolff (H&W) shipyard located in Belfast, North-
ern Ireland.
Gross revenues in 2005 were NOK 2 883 million,
an increase of NOK 540 million from the previ-
ous year. The Group achieved earnings before
interest, taxes, depreciation and amortization
(EBITDA) and other items of NOK 921 million
compared to an EBITDA before other items of
NOK 568 million in 2004.
Net interest bearing debt at 31.12.2005 for the
Group was NOK 2 578 million.
Markets and prospects
The market for offshore services continues
to be strong. Globally, the balance between
supply and demand for offshore drilling units
tightened in all segments. This development
has been reflected in significant increases in
day rates. The high demand for offshore drilling
services is expected to continue during the next
few years as a result of renewed focus on reserve
replacement supported by high demand for oil
and gas and expectations of continued high
energy prices.
During 2005 a number of contracts for construc-
tion of new floating drilling units have been
signed. Several of these new builds have been
Oil Price
70 USD/Barrel
60
50
40
30
01.01.2004 31.03.200630
40
50
60
70
contracted on speculative basis, i.e. there are no
drilling contracts in place before construction
commences. During 2006-2008 the new units
will actively seek drilling contracts to secure cash
flow, which is expected to cause an impact on
the day rates.
The deepwater upgrade of Blackford Dolphin will
make a profitable addition to the Group’s fleet of
drilling units. When the upgrade has been com-
pleted mid 2007, the offshore fleet will consist
of two deepwater units and six mid water semi
submersible drilling rigs in addition to an ac-
commodation unit. Two of the semi submersible
units are considerably upgraded and qualified for
operations in Norway. By late 2006 the Group will
have three units operating in Norwegian waters.
Geographically, the Group currently operates in
Norway, the UK, India, Mexico and West Africa.
From 2007 the deepwater region of the US Gulf
will also be an area of operation.
The Group will continuously explore investment
opportunities to enhance shareholders’ value.
To the extent economically viable investment
projects are not found and to the extent per-
mitted by the financial situation of the Group,
dividend payments as well as share buy back
programmes will be considered.
At year-end, all of the Group’s operated units,
except Blackford Dolphin, which is being up-
graded, were on contract. During the last 15
months, the Group has secured new contracts
with a total value of approximately USD 2 200
million. At the beginning of 2006, the average
contract length of the Group’s offshore fleet was
approximately 27 months. Three units are avail-
able for new contracts in 2007, comprising Bid-
eford Dolphin, Bulford Dolphin and Borgholm
Dolphin.
Offshore Drilling
The drilling activities generated revenues of NOK
2 756 million compared to NOK 2 130 million in
2004. Within this segment, the Group achieved
an EBITDA before other items of NOK 880 mil-
lion. In 2004, the corresponding profit was NOK
576 million.
Borgland Dolphin continued operations off-
shore Norway under the current contract with
Statoil, expiring at the end of December 2006. In
September 2005 a new contract for the rig was
entered into with Statoil ASA for operations in
the Tampen area on the Norwegian continental
shelf. The contract period is for three years expir-
ing at the end of 2009.
Bideford Dolphin continued operations offshore
Norway under a contract with Norsk Hydro esti-
mated to expire in mid 2007.
The deepwater drill ship Belford Dolphin con-
tinued operations under a three-year drilling
contract with ONGC in India, expiring in early
2007. In September 2005 a contract was entered
into with Anadarko Petroleum Corporation for
three years. The new contract will follow in direct
continuation from the present Belford Dolphin
contract with ONGC.
Borgny Dolphin continued operations under a
contract with Pemex in Mexico, expiring early
2008.
Bulford Dolphin (owned by First Olsen Lim-
ited and being operated in pool with four of
the Group’s own units) commenced a drilling
programme for Equator Exploration Ltd. offshore
West Africa in November 2005. The contract is
estimated to expire in September 2007.
Fred. Olsen Energy ASA - Annual Report 2005�
�
Fred. Olsen Energy ASA - Annual Report 2005
Board of Directors’ Report 2005
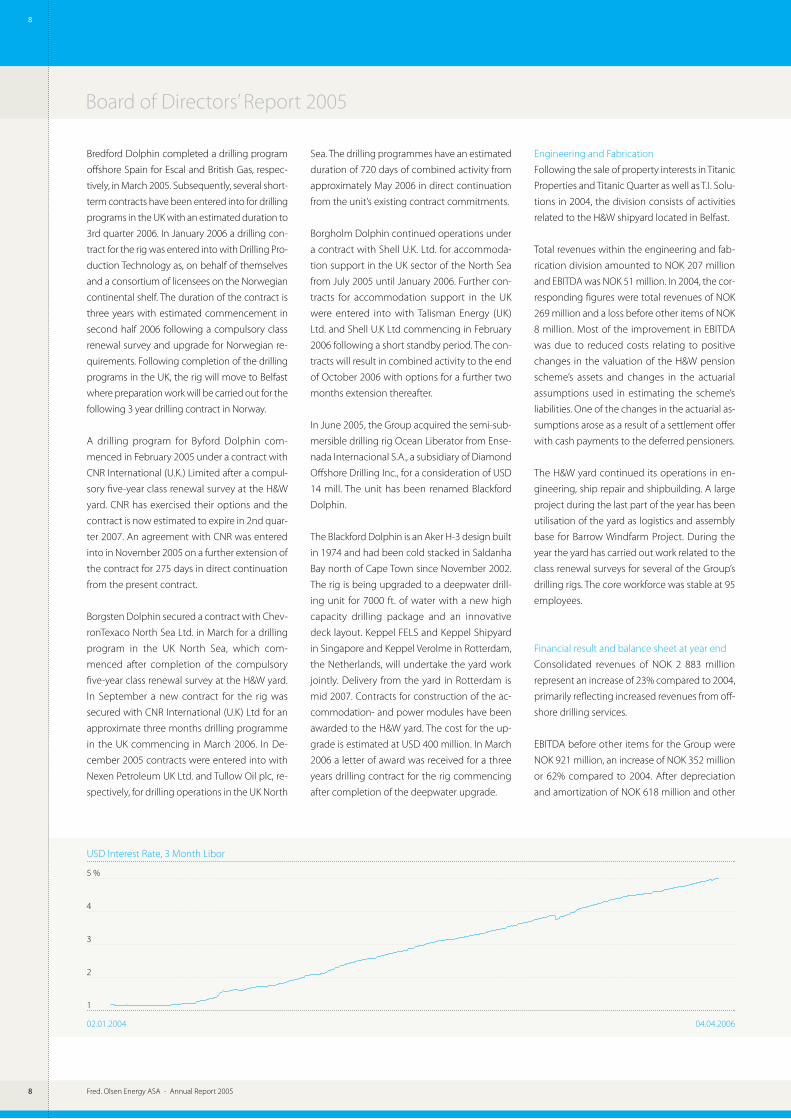
USD Interest Rate, 3 Month Libor
5 %
4
3
2
1
02.01.2004 04.04.20061
2
3
4
5
Bredford Dolphin completed a drilling program
offshore Spain for Escal and British Gas, respec-
tively, in March 2005. Subsequently, several short-
term contracts have been entered into for drilling
programs in the UK with an estimated duration to
3rd quarter 2006. In January 2006 a drilling con-
tract for the rig was entered into with Drilling Pro-
duction Technology as, on behalf of themselves
and a consortium of licensees on the Norwegian
continental shelf. The duration of the contract is
three years with estimated commencement in
second half 2006 following a compulsory class
renewal survey and upgrade for Norwegian re-
quirements. Following completion of the drilling
programs in the UK, the rig will move to Belfast
where preparation work will be carried out for the
following 3 year drilling contract in Norway.
A drilling program for Byford Dolphin com-
menced in February 2005 under a contract with
CNR International (U.K.) Limited after a compul-
sory five-year class renewal survey at the H&W
yard. CNR has exercised their options and the
contract is now estimated to expire in 2nd quar-
ter 2007. An agreement with CNR was entered
into in November 2005 on a further extension of
the contract for 275 days in direct continuation
from the present contract.
Borgsten Dolphin secured a contract with Chev-
ronTexaco North Sea Ltd. in March for a drilling
program in the UK North Sea, which com-
menced after completion of the compulsory
five-year class renewal survey at the H&W yard.
In September a new contract for the rig was
secured with CNR International (U.K) Ltd for an
approximate three months drilling programme
in the UK commencing in March 2006. In De-
cember 2005 contracts were entered into with
Nexen Petroleum UK Ltd. and Tullow Oil plc, re-
spectively, for drilling operations in the UK North
Sea. The drilling programmes have an estimated
duration of 720 days of combined activity from
approximately May 2006 in direct continuation
from the unit’s existing contract commitments.
Borgholm Dolphin continued operations under
a contract with Shell U.K. Ltd. for accommoda-
tion support in the UK sector of the North Sea
from July 2005 until January 2006. Further con-
tracts for accommodation support in the UK
were entered into with Talisman Energy (UK)
Ltd. and Shell U.K Ltd commencing in February
2006 following a short standby period. The con-
tracts will result in combined activity to the end
of October 2006 with options for a further two
months extension thereafter.
In June 2005, the Group acquired the semi-sub-
mersible drilling rig Ocean Liberator from Ense-
nada Internacional S.A., a subsidiary of Diamond
Offshore Drilling Inc., for a consideration of USD
14 mill. The unit has been renamed Blackford
Dolphin.
The Blackford Dolphin is an Aker H-3 design built
in 1974 and had been cold stacked in Saldanha
Bay north of Cape Town since November 2002.
The rig is being upgraded to a deepwater drill-
ing unit for 7000 ft. of water with a new high
capacity drilling package and an innovative
deck layout. Keppel FELS and Keppel Shipyard
in Singapore and Keppel Verolme in Rotterdam,
the Netherlands, will undertake the yard work
jointly. Delivery from the yard in Rotterdam is
mid 2007. Contracts for construction of the ac-
commodation- and power modules have been
awarded to the H&W yard. The cost for the up-
grade is estimated at USD 400 million. In March
2006 a letter of award was received for a three
years drilling contract for the rig commencing
after completion of the deepwater upgrade.
Engineering and Fabrication
Following the sale of property interests in Titanic
Properties and Titanic Quarter as well as T.I. Solu-
tions in 2004, the division consists of activities
related to the H&W shipyard located in Belfast.
Total revenues within the engineering and fab-
rication division amounted to NOK 207 million
and EBITDA was NOK 51 million. In 2004, the cor-
responding figures were total revenues of NOK
269 million and a loss before other items of NOK
8 million. Most of the improvement in EBITDA
was due to reduced costs relating to positive
changes in the valuation of the H&W pension
scheme’s assets and changes in the actuarial
assumptions used in estimating the scheme’s
liabilities. One of the changes in the actuarial as-
sumptions arose as a result of a settlement offer
with cash payments to the deferred pensioners.
The H&W yard continued its operations in en-
gineering, ship repair and shipbuilding. A large
project during the last part of the year has been
utilisation of the yard as logistics and assembly
base for Barrow Windfarm Project. During the
year the yard has carried out work related to the
class renewal surveys for several of the Group’s
drilling rigs. The core workforce was stable at 95
employees.
Financial result and balance sheet at year end
Consolidated revenues of NOK 2 883 million
represent an increase of 23% compared to 2004,
primarily reflecting increased revenues from off-
shore drilling services.
EBITDA before other items for the Group were
NOK 921 million, an increase of NOK 352 million
or 62% compared to 2004. After depreciation
and amortization of NOK 618 million and other
Fred. Olsen Energy ASA - Annual Report 2005 �
�
Fred. Olsen Energy ASA - Annual Report 2005
Board of Directors’ Report 2005
items of NOK 34 million, the operating profit was
NOK 269 million, compared with an operating
profit of NOK 77 million the previous year.
Net financial expense was NOK 281 million. The
corresponding items in 2004 resulted in a profit
of NOK 36 million. Net loss before taxes was NOK
12 million compared to a profit of NOK 113 mil-
lion in 2004 for continuing operations. The net
result for the year was a loss of NOK 16 million
against a profit of NOK 420 million in 2004.
At year-end, the Group had consolidated assets
of NOK 7 240 million. The ratio of net interest
bearing debt to total assets was 36 % compared
to 40 % at the beginning of the year. Book value
of the equity was NOK 2 951 million. Cash flow
generated from continuing operations was NOK
369 million against NOK 85 million in 2004. Cash
and cash equivalents increased by NOK 118 mil-
lion during the year, from NOK 599 million to
NOK 717 million at the end of the year.
Fred. Olsen Energy ASA provides holding com-
pany and management services for the subsidi-
ary companies within the Group. The Company
had NOK 1 million in revenues – the same as in
2004. EBITDA for the year was a loss of NOK 40
million compared with NOK 37 million in 2004.
Net loss was NOK 32 million compared to a loss
of NOK 106 million in 2004.
The annual accounts of the parent company
and the consolidated accounts are based on
the assumption of continued operation.
International Financial Reporting
Standards (IFRS)
The consolidated financial statements have
been prepared in accordance with the Norwe-
gian Accounting Act and International Financial
Reporting Standards (IFRS) as adopted by EU and
interpretations adopted by the International Ac-
counting Standards Board (IASB). These are the
Group’s first consolidated financial statements in
accordance with IFRS and IFRS 1: First-time Adop-
tion of International Financial Reporting Standards
has been applied. An explanation of how the
transition to IFRS has affected the reported fi-
nancial position, financial performance and cash
flows of the Group, is provided in note 27.
Investment and capital resources
Capital expenditures amounted to NOK 519 mil-
lion in the year compared to NOK 355 million
in 2004. The capital expenditures were mainly
related to the upgrade of Blackford Dolphin,
including the purchase of the rig and engineer-
ing work and the class renewal surveys of Byford
Dolphin, Borgsten Dolphin and Belford Dolphin,
respectively.
The Group’s debt consists of several loans. The
largest is a USD 300 million credit facility, which
was established in 2004 with final maturity in
2008. The outstanding amount under the credit
facility at year-end was USD 273 million. In
addition, a short-term credit facility of USD 30
million was established in 2005 with matu-
rity in March 2006. Further, the Company has
outstanding unsecured senior debt notes
totalling NOK 869 million, of which NOK 109
million are due in 2006 and NOK 760 million
in 2009. In addition, the Company has issued
NOK 435 million in subordinated convertible
bonds, due in 2009. The holders of the convert-
ible bonds have the right to convert bonds into
shares in the Company at a conversion price
of NOK 68 per share. Following conversion of
bonds into shares in Fred. Olsen Energy ASA
during 2005, the outstanding amount under
the convertible bond loan at year-end was NOK
373 million. The loan agreements contain opera-
tional and financial covenants typical for credit
arrangements of this nature.
In March 2006 the USD 300 million credit facility
will be replaced by a new 7 years credit facility
of USD 600 million. The new credit facility will
also refinance the NOK 760 million senior debt
notes mentioned above, following the exercise
of an early redemption option, and the short-
term credit facility of USD 30 million.
As per 22 March 2006, the Group is in com-
pliance with all covenants in the loan agree-
ments.
Financial risks
The Group is exposed to certain financial risks
related to its activities. These are mainly foreign
exchange risks, interest rate risks and credit risks.
The Group continually monitors its financial risks
and applies from time to time financial deriva-
tives to hedge its exposure.
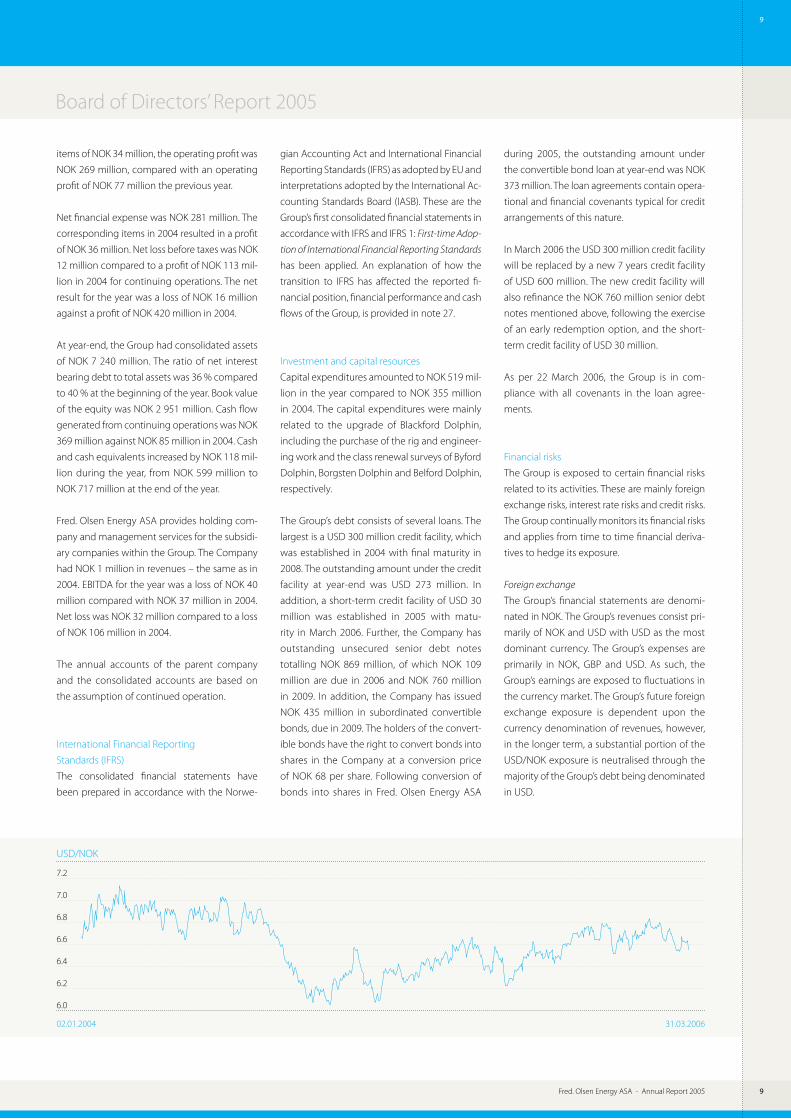
Foreign exchange
The Group’s financial statements are denomi-
nated in NOK. The Group’s revenues consist pri-
marily of NOK and USD with USD as the most
dominant currency. The Group’s expenses are
primarily in NOK, GBP and USD. As such, the
Group’s earnings are exposed to fluctuations in
the currency market. The Group’s future foreign
exchange exposure is dependent upon the
currency denomination of revenues, however,
in the longer term, a substantial portion of the
USD/NOK exposure is neutralised through the
majority of the Group’s debt being denominated
in USD.
USD/NOK
7.2
7.0
6.8
6.6
6.4
6.2
6.0
02.01.2004 31.03.20066,0
6,2
6,4
6,6
6,8
7,0
7,2
Fred. Olsen Energy ASA - Annual Report 200510
10
Fred. Olsen Energy ASA - Annual Report 2005
Board of Directors’ Report 2005
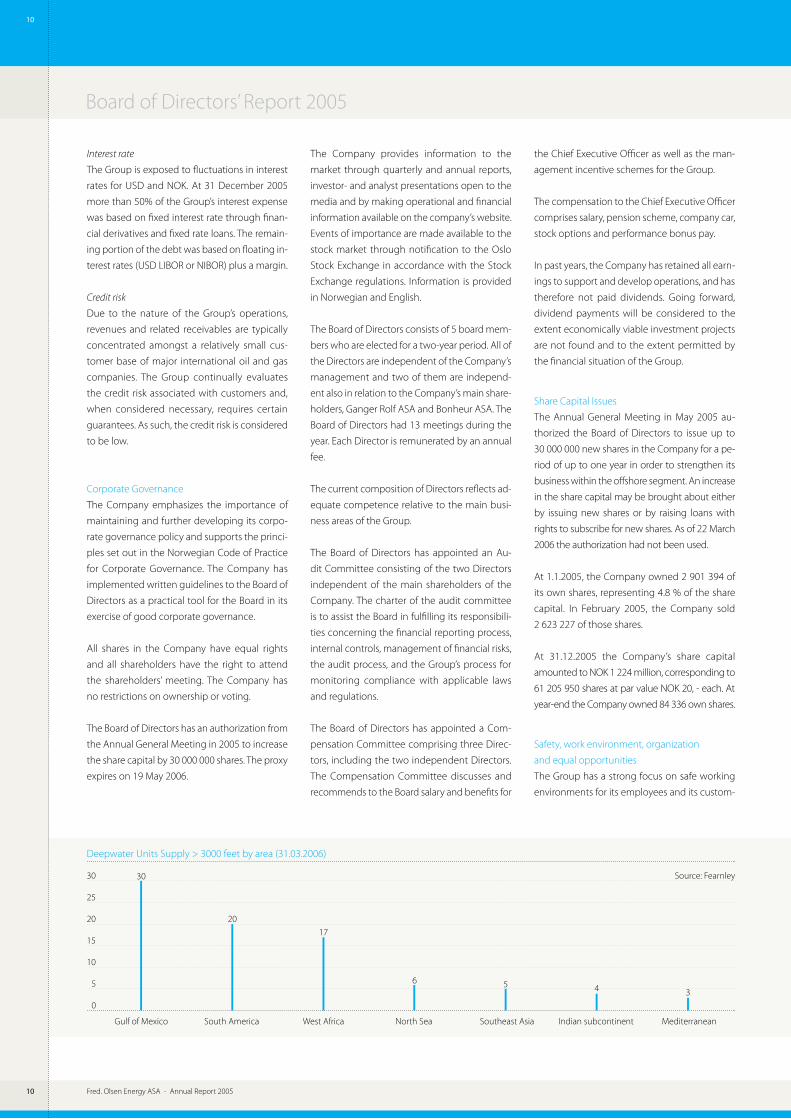
Deepwater Units Supply > 3000 feet by area (31.03.2006)
30 Source: Fearnley
25
20
15
10
5
0
Gulf of Mexico South America West Africa North Sea Southeast Asia Indian subcontinent Mediterranean
30
20
17
6 5 4 3
Interest rate
The Group is exposed to fluctuations in interest
rates for USD and NOK. At 31 December 2005
more than 50% of the Group’s interest expense
was based on fixed interest rate through finan-
cial derivatives and fixed rate loans. The remain-
ing portion of the debt was based on floating in-
terest rates (USD LIBOR or NIBOR) plus a margin.
Credit risk
Due to the nature of the Group’s operations,
revenues and related receivables are typically
concentrated amongst a relatively small cus-
tomer base of major international oil and gas
companies. The Group continually evaluates
the credit risk associated with customers and,
when considered necessary, requires certain
guarantees. As such, the credit risk is considered
to be low.
Corporate Governance
The Company emphasizes the importance of
maintaining and further developing its corpo-
rate governance policy and supports the princi-
ples set out in the Norwegian Code of Practice
for Corporate Governance. The Company has
implemented written guidelines to the Board of
Directors as a practical tool for the Board in its
exercise of good corporate governance.
All shares in the Company have equal rights
and all shareholders have the right to attend
the shareholders’ meeting. The Company has
no restrictions on ownership or voting.
The Board of Directors has an authorization from
the Annual General Meeting in 2005 to increase
the share capital by 30 000 000 shares. The proxy
expires on 19 May 2006.
The Company provides information to the
market through quarterly and annual reports,
investor- and analyst presentations open to the
media and by making operational and financial
information available on the company’s website.
Events of importance are made available to the
stock market through notification to the Oslo
Stock Exchange in accordance with the Stock
Exchange regulations. Information is provided
in Norwegian and English.
The Board of Directors consists of 5 board mem-
bers who are elected for a two-year period. All of
the Directors are independent of the Company’s
management and two of them are independ-
ent also in relation to the Company’s main share-
holders, Ganger Rolf ASA and Bonheur ASA. The
Board of Directors had 13 meetings during the
year. Each Director is remunerated by an annual
fee.
The current composition of Directors reflects ad-
equate competence relative to the main busi-
ness areas of the Group.
The Board of Directors has appointed an Au-
dit Committee consisting of the two Directors
independent of the main shareholders of the
Company. The charter of the audit committee
is to assist the Board in fulfilling its responsibili-
ties concerning the financial reporting process,
internal controls, management of financial risks,
the audit process, and the Group’s process for
monitoring compliance with applicable laws
and regulations.
The Board of Directors has appointed a Com-
pensation Committee comprising three Direc-
tors, including the two independent Directors.
The Compensation Committee discusses and
recommends to the Board salary and benefits for
the Chief Executive Officer as well as the man-
agement incentive schemes for the Group.
The compensation to the Chief Executive Officer
comprises salary, pension scheme, company car,
stock options and performance bonus pay.
In past years, the Company has retained all earn-
ings to support and develop operations, and has
therefore not paid dividends. Going forward,
dividend payments will be considered to the
extent economically viable investment projects
are not found and to the extent permitted by
the financial situation of the Group.
Share Capital Issues
The Annual General Meeting in May 2005 au-
thorized the Board of Directors to issue up to
30 000 000 new shares in the Company for a pe-
riod of up to one year in order to strengthen its
business within the offshore segment. An increase
in the share capital may be brought about either
by issuing new shares or by raising loans with
rights to subscribe for new shares. As of 22 March
2006 the authorization had not been used.
At 1.1.2005, the Company owned 2 901 394 of
its own shares, representing 4.8 % of the share
capital. In February 2005, the Company sold
2 623 227 of those shares.
At 31.12.2005 the Company’s share capital
amounted to NOK 1 224 million, corresponding to
61 205 950 shares at par value NOK 20, - each. At
year-end the Company owned 84 336 own shares.
Safety, work environment, organization
and equal opportunities
The Group has a strong focus on safe working
environments for its employees and its custom-

Fred. Olsen Energy ASA - Annual Report 2005 11
11
Fred. Olsen Energy ASA - Annual Report 2005
Board of Directors’ Report 2005
Oslo, 31 December 2005 / 22 March 2006
Fred. Olsen Energy ASA
Anette S. Olsen John C. Wallace Ivar J. Saunes Mårten Lunde Øivin Fjeldstad Helge Haakonsen
Chairman Chief Executive Officer
ers. Continuous efforts involve planning, training
of personnel and careful selection of subcon-
tractors. The Group maintains a “zero accident”
objective and is closely monitoring its estab-
lished procedures for operations, projects and
worksites both onshore and offshore.
The lost time accident frequency (LTA) for off-
shore drilling and related services in 2005 was
1.8 per million working hours. In 2004 LTA was 5,
of which 4 were minor injuries.
In order to maintain and continuously improve
the working environment the Group in 2005
performed several activities related to HSE train-
ing, HSE trend analyses and established HSE
goals with corresponding improvement action
plans.
In 2005 further measures have been taken in order
to prevent spills to the external environment. The
international environmental standard ISO 14001
has been implemented whereas environmental
goals, aspects, update of management systems
and technical actions are key measures.
It is the Group’s policy to conduct business in
accordance with the letter and spirit of the law
and with the overriding ethical standards of ac-
cepted business conduct. The working environ-
ment both offshore and onshore is considered
to be good. Absence due to illness was 3.71 %
and 1.70 % for the group and the parent com-
pany, respectively. The Group continues to focus
on reducing absence due to illness.
The Group aims to be a workplace with equal
opportunities, offering challenging and motivat-
ing jobs to all personnel, regardless of national-
ity, culture, religion and gender. The division of
genders within the Group reflects the available
recruitment base for offshore work, which tradi-
tionally is dominated by men, being the nature
of the offshore industry worldwide. However,
the Group’s policy is to offer equal opportuni-
ties for males and females and in connection
with new employments efforts are made to at-
tract females for technical positions. Assuming
all other qualifications equal, the Group gives
priority to the underrepresented gender within
each job category.
One out of five Board Directors is a female, be-
ing the Chairman of the Board. At year-end 2005
the Group had 932 employees, including 10 in
the parent company. 75 of the employees were
women. Ten percent of leading personnel within
the Group are female.
Legal matters
In December 2005 the final tranche of the Navis
ASA share purchase in 2000-2001 was settled by
a final assessment of Borgarting lagmannsrett
(a Norwegian Court of Appeals) in the dispute
between the Company and an assignee to the
position of a previous minority shareholder in
Navis ASA who did not accept the offer related
to the compulsory redemption made in Febru-
ary 2001. The minority shareholder claimed dur-
ing the hearings that approximately NOK 21,-
per share would be a fair price, whilst Borgarting
lagmannsrett arrived at a redemption price of
NOK 14.50 per share. The minority shareholder
represented 8 848 140 shares, corresponding to
6.6% of the total shares in Navis ASA.
After having commenced proceedings in the
redemption case the previous minority share-
holder in 2003 commenced separate proceed-
ings against the Company seeking damages on
the basis of the Company’s mandatory bid for
Navis shares in November 2000. In December
2005 the Oslo tingrett (a Norwegian City Court)
ruled against these claims following which the
plaintiff in January 2006 appealed the ruling. See
Note 22 for further information.
External Environment
The Group’s operations may involve activities
that entail potential risks to the external environ-
ment. The discharge produced from processes
and operations in the offshore oil-and gas-drill-
ing industry, directly and indirectly through
chemical interaction can upset the balance
of our environment. The Group is careful in its
approach to the environment and continually
strives to reduce the use of hazardous chemi-
cals and materials to minimize negative effects
and continually seeks alternative products to
safeguard the environment.
Allocation of profit
The Board does not propose a dividend for 2005.
The net loss of the parent company of NOK
32 million has been covered by other equity. The
parent company’s unrestricted equity was NOK
3 175 million at year-end.
Annual General Meeting
The date of the Annual General Meeting is 29
May 2006.
Events after year-end
Operational events after year-end are included
above. For further information see note 28.

Fred. Olsen Energy ASA - Annual Report 200512
12

1�Fred. Olsen Energy ASA - Annual Report 2005
1�
Consolidated Income Statement
For the years ended 31 December 2005 2004
Continuing Continuing Discontinued
Amounts in NOK 000’s Note operations operations operations Total
Revenues 2,3,20,24 2 882 880 2 342 834 2 950 2 345 784
Materials (53 564) (129 624) 0 (129 624)
Salaries and other personnel costs 3,4 (749 848) (635 929) (1 321) (637 250)
Other operating expenses 3,5,20 (1 158 812) (1 009 230) (3 246) (1 012 476)
Operating profit before depreciation, amortisation, other
items and financing costs 920 656 568 051 (1 617) 566 434
Navis Settlement 6 (33 683) 0 0 0
Reversal of restructuring charge 6 0 20 771 0 20 771
Depreciation and amortisation 3,9,10 (618 265) (511 416) (111) (511 527)
Operating profit before financing costs 268 708 77 406 (1 728) 75 678
Financial income 118 311 414 002 0 414 002
Financial expense (398 878) (378 026) 37 (377 989)
Net financing costs 3,7,11 (280 567) 35 976 37 36 013
Profit/(loss) before tax and gain on discontinued operation (11 859) 113 382 (1 691) 111 691
Income tax expense 8 (3 820) (47 376) 0 (47 376)
Profit/(loss) after tax before gain on discontinued operation (15 679) 66 006 (1 691) 64 315
Gain on sale of discontinued operation 3 0 0 355 500 355 500
Profit/(loss) for the period (15 679) 66 006 353 809 419 815
Attributable to:
Equity holder of the parent (15 679) 66 006 353 809 419 815
Profit/(loss) for the period 14 (15 679) 66 006 353 809 419 815
Basic earnings per share 26 (0.26) 1.15 6.17 7.32
Diluted earnings per share 26 (0.26) 1.15 6.15 7.30
Consolidated statement of recognised income and expense
For the years ended 31 December
Amounts in NOK 000’s Note 2005 2004
Exchange differences on translation of foreign operations 395 385 (234 405)
Net income/(expense) recognised directly in equity 395 385 (234 405)
Profit/(loss) for the period (15 679) 419 815
Total recognised income and expense for the period 379 706 185 410
Attributable to:
Equity holders of the parent 379 706 185 410
Total recognised income and expense for the period 14 379 706 185 410
The notes represent an integral part of the financial statements.
Fred. Olsen Energy – Group

Fred. Olsen Energy ASA - Annual Report 200514
14
Fred. Olsen Energy ASA - Annual Report 2005
Consolidated Balance Sheet
As at 31 December
Amounts in NOK 000’s Note 2005 2004
Assets
Property, plant and equipment 9,16 5 391 018 4 930 495
Intangible assets 10 98 577 119 600
Other investments 17,20 8 084 973
Financial instruments 11 38 692 127 717
Deferred taxes 12 3 211 1 838
Total non-current assets 5 539 582 5 180 623
Inventories and consumable spare parts 9 177 174 129 801
Financial instruments 11 0 7 657
Trade and other receivables 20 805 946 521 499
Cash and cash equivalents 13 717 110 598 675
Total current assets 1 700 230 1 257 632
Total assets 7 239 812 6 438 255
The notes represent an integral part of the financial statements.
Fred. Olsen Energy – Group
Fred. Olsen Energy ASA - Annual Report 2005 1�
1�
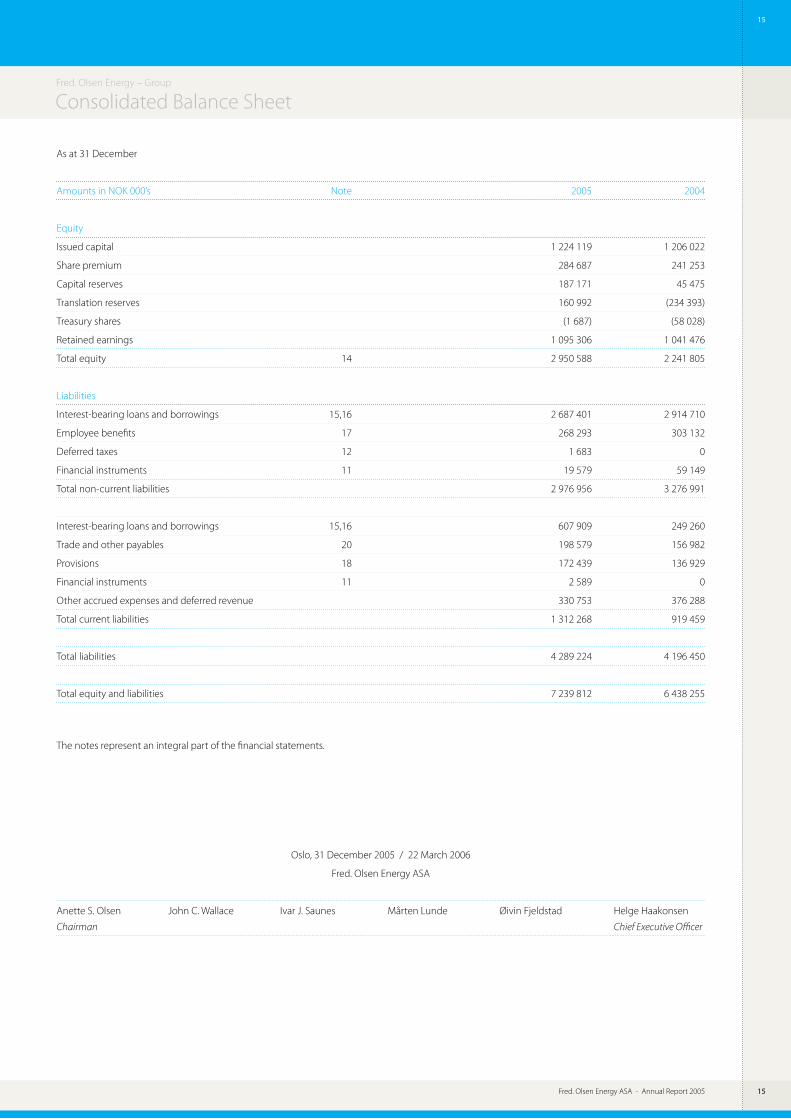
Fred. Olsen Energy ASA - Annual Report 2005
Consolidated Balance Sheet
As at 31 December
Amounts in NOK 000’s Note 2005 2004
Equity
Issued capital 1 224 119 1 206 022
Share premium 284 687 241 253
Capital reserves 187 171 45 475
Translation reserves 160 992 (234 393)
Treasury shares (1 687) (58 028)
Retained earnings 1 095 306 1 041 476
Total equity 14 2 950 588 2 241 805
Liabilities
Interest-bearing loans and borrowings 15,16 2 687 401 2 914 710
Employee benefits 17 268 293 303 132
Deferred taxes 12 1 683 0
Financial instruments 11 19 579 59 149
Total non-current liabilities 2 976 956 3 276 991
Interest-bearing loans and borrowings 15,16 607 909 249 260
Trade and other payables 20 198 579 156 982
Provisions 18 172 439 136 929
Financial instruments 11 2 589 0
Other accrued expenses and deferred revenue 330 753 376 288
Total current liabilities 1 312 268 919 459
Total liabilities 4 289 224 4 196 450
Total equity and liabilities 7 239 812 6 438 255
The notes represent an integral part of the financial statements.
Fred. Olsen Energy – Group
Oslo, 31 December 2005 / 22 March 2006
Fred. Olsen Energy ASA
Anette S. Olsen John C. Wallace Ivar J. Saunes Mårten Lunde Øivin Fjeldstad Helge Haakonsen
Chairman Chief Executive Officer

Fred. Olsen Energy ASA - Annual Report 20051�
1�
Fred. Olsen Energy ASA - Annual Report 2005
For the year ended 31 December
Amounts in NOK 000’s Note 2005 2004
Cash flows from operating activities
Profit/(loss) before income tax (11 859) 113 382
Adjustment for:
Depreciation and amortisation 9 618 265 511 416
Interest expense 7 201 277 202 397
(Gain)/Loss on sale of property, plant and equipment 0 (247)
Unrealised currency (gains)/losses 0 (242 744)
Changes in trade and other receivables (268 296) 34 995
Changes in trade and other payables (2 949) 12 506
Changes in other balance sheet items 13 634 (415 109)
Cash generated from operations 550 072 216 596
Interest paid (178 165) (127 812)
Income taxes paid (2 579) (3 968)
Net cash from operating activities 369 328 84 816
Cash flows from investing activities
Purchases of property, plant and equipment (535 390) (277 149)
Proceeds from sale of equipment 0 4 388
Proceeds from sale of discontinued operation 0 386 780
Net cash (used)/from investing activities (535 390) 114 019
Cash flows from financing activities
Proceeds from interest bearing loans 196 239 2 805 400
Proceeds from the issue of convertible notes 0 435 000
Repayments of interest bearing loans (254 942) (3 214 073)
Sale of treasury shares 273 542 3 054
Net cash from financing activities 214 839 29 381
Net cash flow discontinued operations 0 (4 370)
Net increase in cash and cash equivalents 48 777 228 216
Cash and cash equivalents at 1 January 598 675 358 998
Effect of exchange rate fluctuations on cash held 69 658 11 461
Cash and cash equivalents at 31 December 717 110 598 675
The notes represent an integral part of the financial statements.
Fred. Olsen Energy – Group
Consolidated Statement of Cash Flows under indirect method

Fred. Olsen Energy ASA - Annual Report 2005 1�
1�
Fred. Olsen Energy ASA - Annual Report 2005
Notes to the Consolidated Financial StatementsFred. Olsen Energy – Group
Note 1 – Significant accounting policies
Fred. Olsen Energy ASA (the “Company”) is a
company domiciled in Norway.
The consolidated financial statements of the
Company for the year ended 31 December
2005 comprise the Company and its subsidiar-
ies (together referred to as the “Group”).
The financial statements were authorised for is-
sue by the directors on 22 March 2006.
Statement of compliance
The consolidated financial statements have
been prepared in accordance with the Nor-
wegian Accounting Act, International Financial
Reporting Standards (IFRS) and interpretations
adopted by the International Accounting Stand-
ards Board (IASB) and the European Union. These
are the Group’s first consolidated financial state-
ments in accordance with IFRS and IFRS 1: First-
time Adoption of International Financial Report-
ing Standards has been applied.
An explanation of how the transition to IFRSs
has affected the reported financial position,
financial performance and cash flows of the
Group is provided in note 27.
Basis of preparation
The financial statements are presented in Nor-
wegian Kroner (NOK), rounded to the nearest
thousand. They are prepared on the historical
cost basis except that derivative financial instru-
ments and financial instruments held for trading
are stated at their fair value and the rig values
have been measured at the fair value (Broker
Assessments) at the date of transition and used
as the deemed cost.
The preparation of financial statements in con-
formity with IFRS requires management to make
judgements, estimates and assumptions that
affect the application of policies and reported
amounts of assets and liabilities, income and
expenses. The estimates and associated as-
sumptions are based on historical experience
and various other factors that are believed to be
reasonable under the circumstances. The esti-
mates and underlying assumptions are reviewed
regularly. Actual results may differ from these
estimates.
Judgements made by management in the appli-
cation of IFRSs that have significant effect on the
financial statements and estimates with a signifi-
cant risk of material adjustment in the next year
are discussed below.
The accounting policies set out below have been
applied consistently to all periods presented in
these consolidated financial statements and in
preparing an opening IFRS balance sheet at 1
January 2004 for the purposes of the transition
to IFRSs. See note 27 for discussion of the transi-
tion to IFRS.
The accounting policies have been applied con-
sistently by Group entities.
Basis of consolidation
Subsidiaries
Subsidiaries are entities controlled by the Com-
pany. Control exists when the Company has the
power, directly or indirectly, to govern the finan-
cial and operating policies of an entity so as to
obtain benefits from its activities.
Transactions eliminated in consolidation
All material intercompany transactions, any
unrealised gains and losses and intragroup bal-
ances have been eliminated in preparing the
consolidated financial statements.
Minority Interest
Minority interests in the net assets of consoli-
dated subsidiaries are identified separately from
the Group’s equity therein. Minority interests
consist of those interests at the date of the
original transaction and the minority’s share of
changes in equity since that date. Losses appli-
cable to the minority in excess of the minority’s
interest in the subsidiary’s equity are allocated
against the interests of the Group as there is no
obligation to make an additional investment to
cover the losses.
Foreign currency
Foreign currency transactions
The individual financial statements of each
Group entity are presented in the currency of
the primary economic environment in which
the entity operates (its functional currency).
For the purpose of the consolidated financial
statements, the results and financial position
of each entity are presented in NOK, which is
the functional currency of the Company, and
the presentation currency of the consolidated
financial statements. During 2005, certain of the
Company’s subsidiaries changed their functional
currencies due a re-evaluation of the underlying
economic environments in which the subsidiar-
ies operate. As a result, the functional currencies
changed from NOK to USD for Dolphin Interna-
tional AS and Fred. Olsen Drilling AS (now merged
into Dolphin International AS) and for Dolphin
Drilling Ltd and Perforadora Dolphin Mexicana
from GBP to USD as from 1 January 2005.
In preparing the financial statements of the in-
dividual entities, transactions in foreign curren-
cies are translated at the foreign exchange rate
at the date of the transaction. Monetary assets
and liabilities denominated in foreign curren-
cies are translated to the functional currency at
the foreign exchange rate at the balance sheet
date. Foreign exchange differences arising on
translation are recognised in the income state-
ment. Non-monetary assets that are measured
in terms of historical cost in a foreign currency
are translated using the exchange rate at the
date of the transactions. Non-monetary assets
and liabilities denominated in foreign currencies
that are stated at fair value are translated using
the exchange rates ruling at the dates the fair
value was determined.
Financial statements of foreign operations
The assets and liabilities of foreign subsidiaries
are translated into NOK at the foreign exchange
rate at the balance sheet date. The revenues
and expenses of foreign subsidiaries are trans-
lated using average monthly foreign exchange
rate, which approximates the foreign exchange
rates on the dates of the transactions. Foreign
exchange differences arising on translation are
recognised directly as a separate component of
equity.
Financial Instruments
Financial assets and financial liabilities are rec-
ognized on the Group’s balance sheet when the
Group becomes a party to the contractual provi-
sions of the instruments.
Derivative financial instruments
The Group uses derivative financial instruments
to manage its exposure to foreign exchange
and interest rate risks arising from operational,
financing and investment activities. In accord-
ance with its treasury policy, the Group does not
hold or issue derivative financial instruments for

Fred. Olsen Energy ASA - Annual Report 20051�
1�
Fred. Olsen Energy ASA - Annual Report 2005
Fred. Olsen Energy – Group
Notes
trading purposes. However, derivates that do
not qualify for hedge accounting are accounted
for as trading instruments.
Derivative financial instruments are recognised
initially at cost. Subsequent to initial recognition,
derivative financial instruments are stated at fair
value. The gain or loss on re-measurement to
fair value is recognised in profit or loss. There
are no derivatives to which hedge accounting
is applied.
The fair value of interest rate swaps is the esti-
mated amount that the Group would receive
or pay to terminate the swap at the balance
sheet date. The fair value of forward exchange
contracts is their quoted market price at the bal-
ance sheet date, being the present value of the
quoted forward price.
Trade and other receivables
Trade and other receivables are stated at their
amortised cost less impairment losses.
Cash and cash equivalents
Cash and cash equivalents include cash, bank
deposits and other short-term highly liquid
assets that are readily convertible to known
amounts of cash and which are subject to insig-
nificant changes in value.
Financial liabilities and equity
Financial liabilities and equity instruments issued
by the Group are classified according to the sub-
stance of the contractual arrangements entered
into and the definitions of a financial liability and
an equity instrument. An equity instrument is
any contract that evidences a residual interest
in the assets of the Group after deducting all of
its liabilities. The accounting policies adopted
for specific financial liabilities and equity instru-
ments are set out below as applicable.
Interest-bearing borrowings
Interest-bearing borrowings are recognised
initially at fair value less attributable transaction
costs. Subsequent to initial recognition, interest-
bearing borrowings are stated at amortised cost
with any difference between cost and redemp-
tion value being recognised in the income state-
ment over the period of the borrowings on an
effective interest basis.
Convertible bonds
Convertible bonds that can be converted to
share capital at the option of the holder, where
the number of shares issued does not vary with
changes in their fair value, are accounted for as
compound financial instruments consisting of a
liability component and an equity component.
The equity component of the convertible bonds
is calculated as the excess of the issue proceeds
over the present value of the future interest and
principal payments, discounted at the market
rate of interest applicable to similar liabilities that
do not have a conversion option. The interest ex-
pense recognised in the income statement then
reflects the market rate for bonds without con-
version. Converted options during the year are
split between liability and equity accordingly.
The interest expense on the liability component
is calculated by applying the prevailing market
interest rate at the time of transaction for similar
non-convertible debt to the liability component
of the instrument at the time of transaction. The
difference between this amount and the inter-
est paid is added to the carrying amount of the
convertible bond.
Trade and other payables
Trade and other payables are stated at cost.
Equity instruments
Equity instruments issued by the Group are
recorded at the proceeds received, net of direct
issue costs.
Property, plant and equipment
Owned assets
Property, plant and equipment are stated at
cost less accumulated depreciation and impair-
ment losses. The cost of self-constructed assets
and modifications includes the cost of material,
direct labour and other direct attributable cost
to bring the asset to a working condition for its
intended use.
The rig values have been revalued to fair value
on 1 January 2004, the date of transition to IFRS,
and are measured on the basis of deemed cost,
being the revalued amount at the transition
date.
Where components of an item of property, plant
and equipment have different useful lives, they
are accounted for separately.
Subsequent expenditures are capitalised when
it is probable that they will give rise to future
economic benefits. Other costs are recognised
in the income statement as incurred.
Leased assets
Leases in terms of which the Group assumes
substantially all the risks and rewards of the
ownership are classified as finance leases. All
other leases are classified as operating leases.
Assets recorded under finance leases are stated
at an amount equal to the lower of its fair value
and the present value of the minimum lease
payments at inception of the lease, less accumu-
lated depreciation and any impairment losses.
Depreciation
Depreciation is charged to the income state-
ment on a straight-line basis over the estimated
useful life of each component of property, plant
and equipment. The estimated useful lives,
residual values and decommissioning costs
are reviewed at each financial year end. No
decommissioning costs have been recorded to
date, and the presence of any obligations is re-
viewed at each financial year end. Any changes
are accounted for prospectively as a change in
accounting estimate.
The estimated useful lives are as follows:
Rigs 15 to 25 years
Deepwater Drillship 25 years
Major components 5 to 15 years
Plant and Buildings 5 to 50 years
Machinery and Equipment 3 to 10 years
Repairs and Maintenance
Costs for special periodic surveys/class renewal
surveys (SPS/RS) on offshore units required by
classification societies are capitalised and de-
preciated over the anticipated period between
surveys, generally five years. Other maintenance
and repair costs are expensed as incurred.
Intangible assets
Goodwill
All business combinations are accounted for by
applying the purchase method. Goodwill rep-
resents amounts arising on the acquisition of
subsidiaries, and is the difference between the
cost of the acquisition and the fair value of the
net assets acquired.
In respect of acquisitions prior to the transition
to IFRS, goodwill is included on the basis of its
deemed cost, which represents the amount re-
corded under previous GAAP. The classification
and accounting treatment of business combi-
nations that occurred prior to the transition to
IFRS has not been reconsidered in preparing the
Group’s opening IFRS balance sheet at 1 Janu-
ary 2004.
Fred. Olsen Energy ASA - Annual Report 2005 1�
1�
Fred. Olsen Energy ASA - Annual Report 2005
NotesFred. Olsen Energy – Group
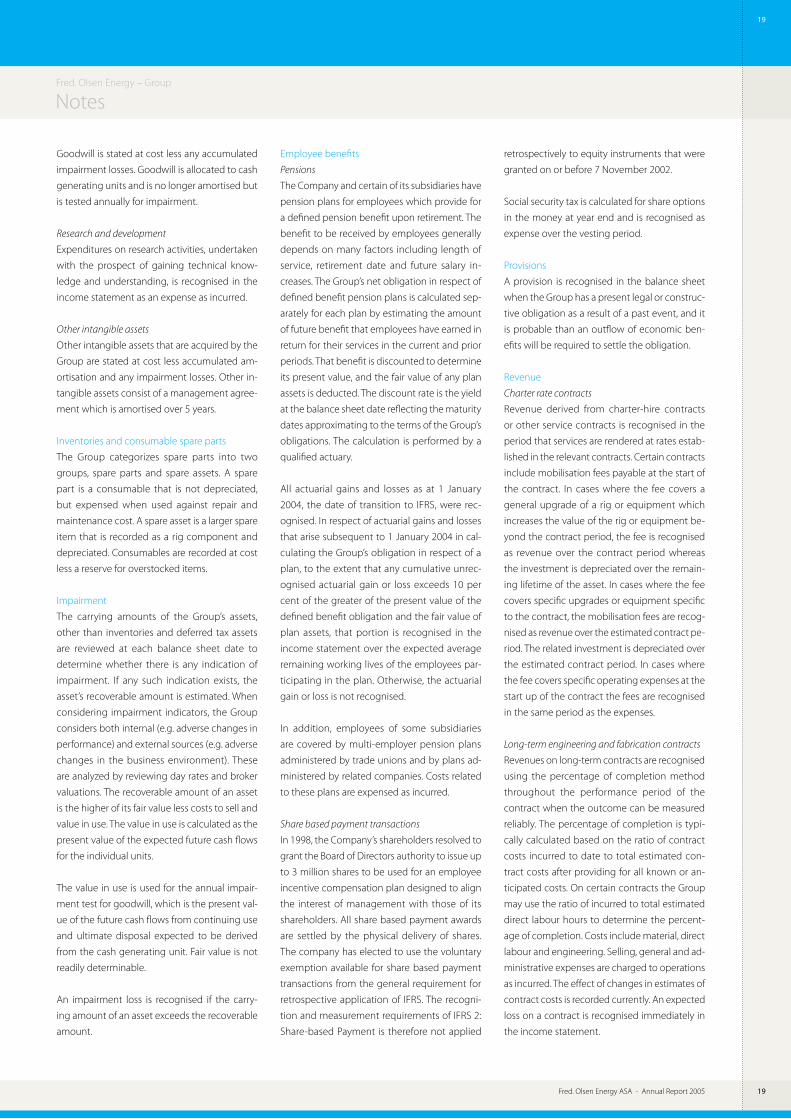
Goodwill is stated at cost less any accumulated
impairment losses. Goodwill is allocated to cash
generating units and is no longer amortised but
is tested annually for impairment.
Research and development
Expenditures on research activities, undertaken
with the prospect of gaining technical know-
ledge and understanding, is recognised in the
income statement as an expense as incurred.
Other intangible assets
Other intangible assets that are acquired by the
Group are stated at cost less accumulated am-
ortisation and any impairment losses. Other in-
tangible assets consist of a management agree-
ment which is amortised over 5 years.
Inventories and consumable spare parts
The Group categorizes spare parts into two
groups, spare parts and spare assets. A spare
part is a consumable that is not depreciated,
but expensed when used against repair and
maintenance cost. A spare asset is a larger spare
item that is recorded as a rig component and
depreciated. Consumables are recorded at cost
less a reserve for overstocked items.
Impairment
The carrying amounts of the Group’s assets,
other than inventories and deferred tax assets
are reviewed at each balance sheet date to
determine whether there is any indication of
impairment. If any such indication exists, the
asset’s recoverable amount is estimated. When
considering impairment indicators, the Group
considers both internal (e.g. adverse changes in
performance) and external sources (e.g. adverse
changes in the business environment). These
are analyzed by reviewing day rates and broker
valuations. The recoverable amount of an asset
is the higher of its fair value less costs to sell and
value in use. The value in use is calculated as the
present value of the expected future cash flows
for the individual units.
The value in use is used for the annual impair-
ment test for goodwill, which is the present val-
ue of the future cash flows from continuing use
and ultimate disposal expected to be derived
from the cash generating unit. Fair value is not
readily determinable.
An impairment loss is recognised if the carry-
ing amount of an asset exceeds the recoverable
amount.
Employee benefits
Pensions
The Company and certain of its subsidiaries have
pension plans for employees which provide for
a defined pension benefit upon retirement. The
benefit to be received by employees generally
depends on many factors including length of
service, retirement date and future salary in-
creases. The Group’s net obligation in respect of
defined benefit pension plans is calculated sep-
arately for each plan by estimating the amount
of future benefit that employees have earned in
return for their services in the current and prior
periods. That benefit is discounted to determine
its present value, and the fair value of any plan
assets is deducted. The discount rate is the yield
at the balance sheet date reflecting the maturity
dates approximating to the terms of the Group’s
obligations. The calculation is performed by a
qualified actuary.
All actuarial gains and losses as at 1 January
2004, the date of transition to IFRS, were rec-
ognised. In respect of actuarial gains and losses
that arise subsequent to 1 January 2004 in cal-
culating the Group’s obligation in respect of a
plan, to the extent that any cumulative unrec-
ognised actuarial gain or loss exceeds 10 per
cent of the greater of the present value of the
defined benefit obligation and the fair value of
plan assets, that portion is recognised in the
income statement over the expected average
remaining working lives of the employees par-
ticipating in the plan. Otherwise, the actuarial
gain or loss is not recognised.
In addition, employees of some subsidiaries
are covered by multi-employer pension plans
administered by trade unions and by plans ad-
ministered by related companies. Costs related
to these plans are expensed as incurred.
Share based payment transactions
In 1998, the Company’s shareholders resolved to
grant the Board of Directors authority to issue up
to 3 million shares to be used for an employee
incentive compensation plan designed to align
the interest of management with those of its
shareholders. All share based payment awards
are settled by the physical delivery of shares.
The company has elected to use the voluntary
exemption available for share based payment
transactions from the general requirement for
retrospective application of IFRS. The recogni-
tion and measurement requirements of IFRS 2:
Share-based Payment is therefore not applied
retrospectively to equity instruments that were
granted on or before 7 November 2002.
Social security tax is calculated for share options
in the money at year end and is recognised as
expense over the vesting period.
Provisions
A provision is recognised in the balance sheet
when the Group has a present legal or construc-
tive obligation as a result of a past event, and it
is probable than an outflow of economic ben-
efits will be required to settle the obligation.
Revenue
Charter rate contracts
Revenue derived from charter-hire contracts
or other service contracts is recognised in the
period that services are rendered at rates estab-
lished in the relevant contracts. Certain contracts
include mobilisation fees payable at the start of
the contract. In cases where the fee covers a
general upgrade of a rig or equipment which
increases the value of the rig or equipment be-
yond the contract period, the fee is recognised
as revenue over the contract period whereas
the investment is depreciated over the remain-
ing lifetime of the asset. In cases where the fee
covers specific upgrades or equipment specific
to the contract, the mobilisation fees are recog-
nised as revenue over the estimated contract pe-
riod. The related investment is depreciated over
the estimated contract period. In cases where
the fee covers specific operating expenses at the
start up of the contract the fees are recognised
in the same period as the expenses.
Long-term engineering and fabrication contracts
Revenues on long-term contracts are recognised
using the percentage of completion method
throughout the performance period of the
contract when the outcome can be measured
reliably. The percentage of completion is typi-
cally calculated based on the ratio of contract
costs incurred to date to total estimated con-
tract costs after providing for all known or an-
ticipated costs. On certain contracts the Group
may use the ratio of incurred to total estimated
direct labour hours to determine the percent-
age of completion. Costs include material, direct
labour and engineering. Selling, general and ad-
ministrative expenses are charged to operations
as incurred. The effect of changes in estimates of
contract costs is recorded currently. An expected
loss on a contract is recognised immediately in
the income statement.

Fred. Olsen Energy ASA - Annual Report 200520
20
Fred. Olsen Energy ASA - Annual Report 2005
Fred. Olsen Energy – Group
Notes
Costs and estimated earnings in excess of bill-
ings on uncompleted contracts represent rev-
enues earned under the percentage of comple-
tion method but not yet billable under the terms
of the contract. Amounts billed in advance of
satisfying revenue recognition criteria on long
term contracts are classified as billings in excess
of costs and estimated earnings on uncomplet-
ed contracts.
Generally, contract revenues become billable
upon the Group attaining certain contract mile-
stones. The Group typically does not require
collateral from customers except in situations
where warranted due to assessments of risk
factors.
Government grants
Governmental grants related to capital expen-
ditures are deferred and recognised as income
over the useful lives of related capital expendi-
ture. Grants related to specific contracts are
recognised as income over the period contract
work is performed.
Expenses
Pool income/expense
Certain rig owning subsidiaries have entered
into a five-rig pool agreement with the owner
of the Bulford Dolphin, where net earnings be-
fore depreciation are equalised amongst the rig
owners. The net pool income or pool expenses
from the Group’s four rigs included in the pool
are netted against the bareboat/time charter
fees paid to the owner of the Bulford Dolphin.
Operating lease expenses
Payments made under operating leases are rec-
ognised in the income statement on a straight-
line basis over the term of the lease.
Finance lease payments
Minimum lease payments are apportioned be-
tween the finance charge and the reduction of
the outstanding liability. The finance charge is
allocated to each period during the lease term so
as to produce a constant periodic rate of interest
on the remaining balance of the liability.
Net financing costs
Net financing costs comprise interest payable
on borrowings calculated using the effective
interest rate method, interest receivable, foreign
exchange gains or losses, and gains and losses
on financial instruments.
Income tax
Income tax on the profit or loss for the year
comprises current and deferred tax. Income tax
is recognised in the income statement except
to the extent that it relates to items recognised
directly in equity, in which case it is recognised
in equity.
Current tax is the expected tax payable on the
taxable income for the year and any adjustment
to tax payable in respect of previous years.
Deferred tax is provided using the balance
sheet liability method. Deferred tax assets and
liabilities are recognised for the future tax conse-
quences attributable to differences between the
carrying amounts of existing assets and liabilities
in the financial statements and their respective
tax bases. The amount of deferred tax provided
is based on the expected manner of realisation
or settlement of the carrying amount of assets
and liabilities, using tax rates enacted or enacted
at the balance sheet date.
A deferred tax asset is recognised only to the
extent that it is probable that future taxable
profits will be available against which the asset
can be utilised. Deferred tax assets are reduced
to the extent that it is no longer probable that
the related tax benefit will be realised.
Segment reporting
A segment is a distinguishable component of
the Group that is engaged in either providing
products or services (business segment), or in
providing goods or services within a particular
economic environment (geographical seg-
ment), which is subject to the risks and rewards
that are different from those of other segments.
The Group provides services and operates within
the two business segments; offshore drilling and
engineering and fabrication.
Borrowing Costs
Under IFRS, borrowing costs may be capitalized
as part of the cost on certain qualifying assets,
however, the Group has not applied this op-
tion.
Earnings per share
Basic
Basic earnings per share is calculated by dividing
the profit attributable to equity holders of the
Company by the weighted average number of
ordinary shares in issue during the year, exclud-
ing ordinary shares purchased by the Company
and held as treasury shares.
Diluted
Diluted earnings per share is calculated by ad-
justing the weighted average number of ordi-
nary shares outstanding to assume conversion
of all dilutive potential ordinary shares. The Com-
pany has two categories of dilutive potential
ordinary shares: convertible bonds and share
options. The convertible bonds are assumed to
have been converted into ordinary shares and
the net profit is adjusted to eliminate the interest
expense less the tax effect. For the share options,
a calculation is done to determine the number
of shares that could have been acquired at fair
value (determined as the average annual mar-
ket share price of the Companies shares) based
on the monetary value of the rights attached
to outstanding share options. The number of
shares calculated as above is compared with
the number of shares that would have been is-
sued assuming the exercise of the share options.
Potential ordinary shares that are anti-dilutive
are excluded from the calculation.
New accounting pronouncements
At the date of authorization of these financial
statements, the following standards and inter-
pretations that were potentially applicable to
the Group were issued but not yet effective:
IAS 19 (Amendment), Employee Benefits
(effective from 1 January 2006)
This amendment introduces the option of an
alternative recognition approach for actuarial
gains and losses. It may impose additional rec-
ognition requirements for multi-employer plans
where insufficient information is available to ap-
ply defined benefit accounting. It also adds new
disclosure requirements. As the Group does not
intend to change the accounting policy adopt-
ed for recognition of actuarial gains and losses
and does not participate in any multi-employer
plans, adoption of this amendment will only
impact the format and extent of disclosures
presented in the accounts. The Group will apply
this amendment from annual periods beginning
1 January 2006.
IAS 39 (Amendment), The Fair Value Option
(effective from 1 January 2006)
This amendment changes the definition of finan-
cial instruments classified at fair value through
profit or loss and restricts the ability to designate
Fred. Olsen Energy ASA - Annual Report 2005 21
21
Fred. Olsen Energy ASA - Annual Report 2005
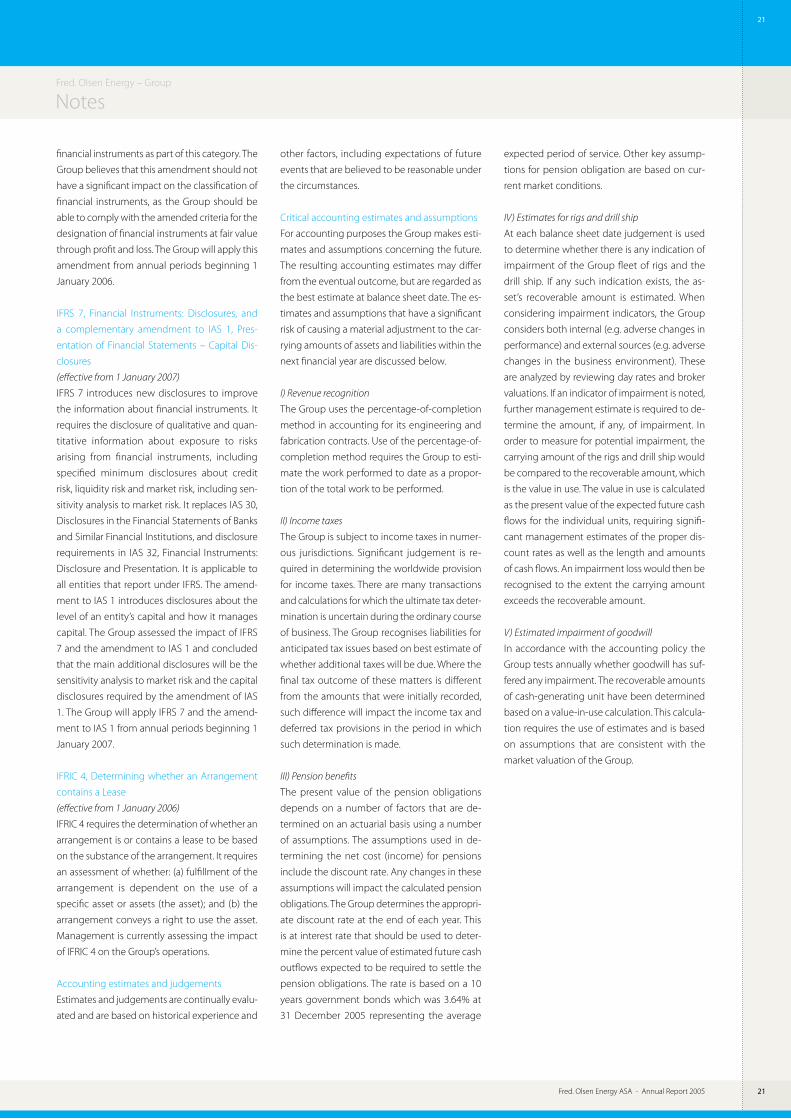
NotesFred. Olsen Energy – Group
financial instruments as part of this category. The
Group believes that this amendment should not
have a significant impact on the classification of
financial instruments, as the Group should be
able to comply with the amended criteria for the
designation of financial instruments at fair value
through profit and loss. The Group will apply this
amendment from annual periods beginning 1
January 2006.
IFRS 7, Financial Instruments: Disclosures, and
a complementary amendment to IAS 1, Pres-
entation of Financial Statements – Capital Dis-
closures
(effective from 1 January 2007)
IFRS 7 introduces new disclosures to improve
the information about financial instruments. It
requires the disclosure of qualitative and quan-
titative information about exposure to risks
arising from financial instruments, including
specified minimum disclosures about credit
risk, liquidity risk and market risk, including sen-
sitivity analysis to market risk. It replaces IAS 30,
Disclosures in the Financial Statements of Banks
and Similar Financial Institutions, and disclosure
requirements in IAS 32, Financial Instruments:
Disclosure and Presentation. It is applicable to
all entities that report under IFRS. The amend-
ment to IAS 1 introduces disclosures about the
level of an entity’s capital and how it manages
capital. The Group assessed the impact of IFRS
7 and the amendment to IAS 1 and concluded
that the main additional disclosures will be the
sensitivity analysis to market risk and the capital
disclosures required by the amendment of IAS
1. The Group will apply IFRS 7 and the amend-
ment to IAS 1 from annual periods beginning 1
January 2007.
IFRIC 4, Determining whether an Arrangement
contains a Lease
(effective from 1 January 2006)
IFRIC 4 requires the determination of whether an
arrangement is or contains a lease to be based
on the substance of the arrangement. It requires
an assessment of whether: (a) fulfillment of the
arrangement is dependent on the use of a
specific asset or assets (the asset); and (b) the
arrangement conveys a right to use the asset.
Management is currently assessing the impact
of IFRIC 4 on the Group’s operations.
Accounting estimates and judgements
Estimates and judgements are continually evalu-
ated and are based on historical experience and
other factors, including expectations of future
events that are believed to be reasonable under
the circumstances.
Critical accounting estimates and assumptions
For accounting purposes the Group makes esti-
mates and assumptions concerning the future.
The resulting accounting estimates may differ
from the eventual outcome, but are regarded as
the best estimate at balance sheet date. The es-
timates and assumptions that have a significant
risk of causing a material adjustment to the car-
rying amounts of assets and liabilities within the
next financial year are discussed below.
I) Revenue recognition
The Group uses the percentage-of-completion
method in accounting for its engineering and
fabrication contracts. Use of the percentage-of-
completion method requires the Group to esti-
mate the work performed to date as a propor-
tion of the total work to be performed.
II) Income taxes
The Group is subject to income taxes in numer-
ous jurisdictions. Significant judgement is re-
quired in determining the worldwide provision
for income taxes. There are many transactions
and calculations for which the ultimate tax deter-
mination is uncertain during the ordinary course
of business. The Group recognises liabilities for
anticipated tax issues based on best estimate of
whether additional taxes will be due. Where the
final tax outcome of these matters is different
from the amounts that were initially recorded,
such difference will impact the income tax and
deferred tax provisions in the period in which
such determination is made.
III) Pension benefits
The present value of the pension obligations
depends on a number of factors that are de-
termined on an actuarial basis using a number
of assumptions. The assumptions used in de-
termining the net cost (income) for pensions
include the discount rate. Any changes in these
assumptions will impact the calculated pension
obligations. The Group determines the appropri-
ate discount rate at the end of each year. This
is at interest rate that should be used to deter-
mine the percent value of estimated future cash
outflows expected to be required to settle the
pension obligations. The rate is based on a 10
years government bonds which was 3.64% at
31 December 2005 representing the average
expected period of service. Other key assump-
tions for pension obligation are based on cur-
rent market conditions.
IV) Estimates for rigs and drill ship
At each balance sheet date judgement is used
to determine whether there is any indication of
impairment of the Group fleet of rigs and the
drill ship. If any such indication exists, the as-
set’s recoverable amount is estimated. When
considering impairment indicators, the Group
considers both internal (e.g. adverse changes in
performance) and external sources (e.g. adverse
changes in the business environment). These
are analyzed by reviewing day rates and broker
valuations. If an indicator of impairment is noted,
further management estimate is required to de-
termine the amount, if any, of impairment. In
order to measure for potential impairment, the
carrying amount of the rigs and drill ship would
be compared to the recoverable amount, which
is the value in use. The value in use is calculated
as the present value of the expected future cash
flows for the individual units, requiring signifi-
cant management estimates of the proper dis-
count rates as well as the length and amounts
of cash flows. An impairment loss would then be
recognised to the extent the carrying amount
exceeds the recoverable amount.
V) Estimated impairment of goodwill
In accordance with the accounting policy the
Group tests annually whether goodwill has suf-
fered any impairment. The recoverable amounts
of cash-generating unit have been determined
based on a value-in-use calculation. This calcula-
tion requires the use of estimates and is based
on assumptions that are consistent with the
market valuation of the Group.

Fred. Olsen Energy ASA - Annual Report 200522
22
Fred. Olsen Energy ASA - Annual Report 2005
Fred. Olsen Energy – Group
Notes
Note 2 – Segment reporting
Segment information is presented in respect of the Group’s business and geographical segments. The primary format, business segments, is based on the
Group’s management and internal reporting structure.
Inter-segment pricing is determined on an arm’s length basis.
Business segments
The Group comprises the following main business segments:
Offshore drilling provides exploration drilling services to the offshore oil and gas industry. The operating expenses within Fred.Olsen Energy ASA is
included within the offshore drilling segment.
Engineering and fabrication provides engineering, fabrication and repair services for various offshore and transportation industries.
Geographical segments
The offshore drilling segment provides drilling services on a worldwide basis while engineering and fabrication segments provides services in UK. The seg-
ment revenue is based on the geographical location of customers.
Business segments
Engineering
Amounts in NOK 000’s Offshore drilling and fabrication Eliminations Consolidated
2005 2004 2005 2004 2005 2004 2005 2004
Revenues from external customers 2 755 797 2 129 626 127 083 213 208 0 0 2 882 880 2 342 834
Inter-segment revenues 0 0 79 861 56 105 (79 861) (56 105) 0 0
Total revenues 2 755 797 2 129 626 206 944 269 313 (79 861) (56 105) 2 882 880 2 342 834
Operating expenses before depreciation
and amortisation (1 909 075) (1 553 230) (155 673) (256 887) 68 841 56 105 (1 995 907) (1 754 012)
Segment result before depreciation
and amortisation 846 722 576 396 51 271 12 426 (11 020) 0 886 973 588 822
Depreciation and amortisation (614 395) (507 430) (3 870) (3 986) 0 0 (618 265) (511 416)
Segment result 232 327 68 966 47 401 8 440 (11 020) 0 268 708 77 406
0 0
Net financing costs (280 567) 35 976 0 0 0 0 (280 567) 35 976
Income tax expense (3 820) (47 376) 0 0 0 0 (3 820) (47 376)
Gain on sale of discontinued operation, net of tax 0 0 0 0 0 353 809 0 353 809
Profit/(loss) for the period (52 060) 57 566 47 401 8 440 (11 020) 353 809 (15 679) 419 815
Segments assets 7 143 482 6 231 716 104 294 136 700 (47 023) (57 878) 7 200 753 6 310 538
Unallocated assets 0 39 059 127 717
Total assets 7 143 482 6 231 716 104 294 136 700 (47 023) (57 878) 7 239 812 6 438 255
Segments liabilities 4 018 997 3 817 414 314 426 377 770 (47 023) (57 878) 4 286 400 4 137 306
Unallocated liabilities 2 824 59 144
Total liabilities 4 018 997 3 817 414 314 426 377 770 (47 023) (57 878) 4 289 224 4 196 450
Capital expenditure 515 735 352 691 3 379 2 752 0 0 519 114 355 443
Geographical segments
Europe Asia Americas Other regions Consolidated
2005 2004 2005 2004 2005 2004 2005 2004 2005 2004
Revenues from
external customers 1 823 217 1 122 379 764 384 826 735 205 604 281 952 89 675 111 768 2 882 880 2 342 834
Capital expenditure 184 436 323 758 334 678 31 685 0 0 0 0 519 114 355 443

Fred. Olsen Energy ASA - Annual Report 2005 2�
2�
Fred. Olsen Energy ASA - Annual Report 2005
NotesFred. Olsen Energy – Group
Note 3 – Discontinued operation
In February 2004, the Group completed the sale of property interests in Belfast, Northern Ireland to Titanic Island Limited, an associated company of the
Dublin based property development company, Harcourt Developments Ltd. On completion, the Group received GBP 37.3 million, being the remaining
part of the gross purchase price of GBP 47 million less net debt obligations and an initial payment of GBP 4.7 million which was received in 2003.
In connection with the completion, Fred.Olsen Energy ASA exercised the option to re-acquire Channel Commercial Park (CCP) following the sale of CCP to a
subsidiary of AS Borgå (wholly owned by Ganger Rolf ASA and Bonheur ASA) in 2003 for an amount of GBP 14 million, less assumption of debt obligations.
CCP was transferred to Titanic Island Limited as part of the overall transaction.
The Group recorded a gain on disposal of NOK 465 million, of which NOK 356 million was recognised in 2004. Upon completion of the sale, the Group has
no remaining real estate operations. The real estate operations were reported within Engineering and fabrication segment.
Note 4 – Salaries and other personnel costs
Amounts in NOK 000’s 2005 2004
Salary 598 446 462 766
Social security costs 68 930 66 506
Pension costs (5 894) 40 906
Other 88 367 65 751
Total 749 848 635 929
Average number of employees 861 687
Number of employees at year end 932 708
The pension costs of (NOK 5 894) include the pension settlement at Harland and Wolff of NOK 42.9 million (see note 17).
Salaries and other personnel costs to the Chief Executive Officer (CEO), the Board of Directors for the parent company and Senior Management of the
Group are as follows:
Chief Executive Officer 2005 2004
Salary 2 351 2 276
Pension costs 1 999 1 461
Other 139 533
Total 4 489 4 270
Board of directors 2005 2004
Renumeration 1 080 1 080
Pension costs 0 0
Other 281 287
Total 1 361 1 367
Senior Management 2005 2004
Renumeration 7 991 7 575
Pension costs 2 204 2 134
Other 2 936 2 367
Total 13 131 12 075
Senior Management consists of Group management, excluding the Chief Executive Officer who is disclosed separately above, and the Managing Directors
of the subsidiaries, for a total of 5 employees.
The management share option scheme implemented in 1997 was terminated from and including 2004 and replaced with a management cash bonus
scheme from 2005. The beneficiaries of the scheme are senior management and certain key personnel. Annual payments under the scheme, maximised
to one year’s salary, are subject to the Group achieving certain pre-defined financial criteria, including achieved budget goals and development of the
Company’s share price. For 2005 the Group made an accrual for the bonus scheme of NOK 16 million which at 31 December 2005 was unpaid. The accrued
bonus is not included above.
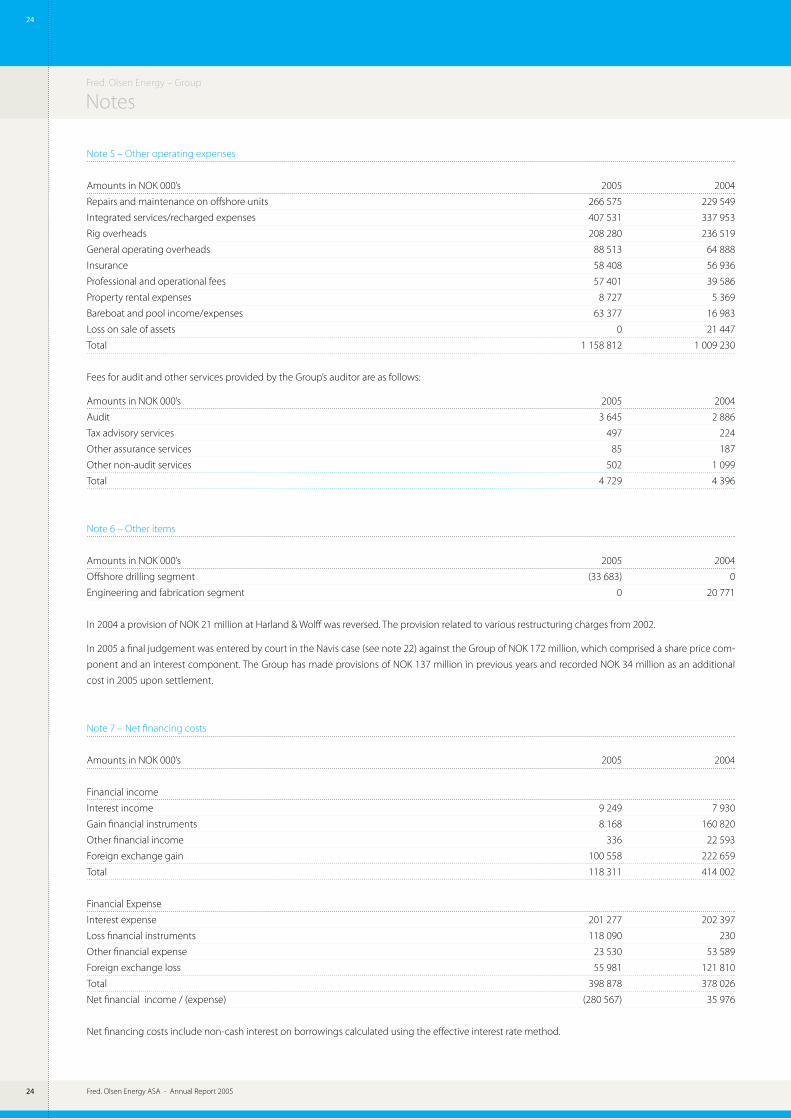
Fred. Olsen Energy ASA - Annual Report 200524
24
Fred. Olsen Energy ASA - Annual Report 2005
Fred. Olsen Energy – Group
Notes
Note 5 – Other operating expenses
Amounts in NOK 000’s 2005 2004
Repairs and maintenance on offshore units 266 575 229 549
Integrated services/recharged expenses 407 531 337 953
Rig overheads 208 280 236 519
General operating overheads 88 513 64 888
Insurance 58 408 56 936
Professional and operational fees 57 401 39 586
Property rental expenses 8 727 5 369
Bareboat and pool income/expenses 63 377 16 983
Loss on sale of assets 0 21 447
Total 1 158 812 1 009 230
Fees for audit and other services provided by the Group’s auditor are as follows:
Amounts in NOK 000’s 2005 2004
Audit 3 645 2 886
Tax advisory services 497 224
Other assurance services 85 187
Other non-audit services 502 1 099
Total 4 729 4 396
Note 6 – Other items
Amounts in NOK 000’s 2005 2004
Offshore drilling segment (33 683) 0
Engineering and fabrication segment 0 20 771
In 2004 a provision of NOK 21 million at Harland & Wolff was reversed. The provision related to various restructuring charges from 2002.
In 2005 a final judgement was entered by court in the Navis case (see note 22) against the Group of NOK 172 million, which comprised a share price com-
ponent and an interest component. The Group has made provisions of NOK 137 million in previous years and recorded NOK 34 million as an additional
cost in 2005 upon settlement.
Note 7 – Net financing costs
Amounts in NOK 000’s 2005 2004
Financial income
Interest income 9 249 7 930
Gain financial instruments 8 168 160 820
Other financial income 336 22 593
Foreign exchange gain 100 558 222 659
Total 118 311 414 002
Financial Expense
Interest expense 201 277 202 397
Loss financial instruments 118 090 230
Other financial expense 23 530 53 589
Foreign exchange loss 55 981 121 810
Total 398 878 378 026
Net financial income / (expense) (280 567) 35 976
Net financing costs include non-cash interest on borrowings calculated using the effective interest rate method.
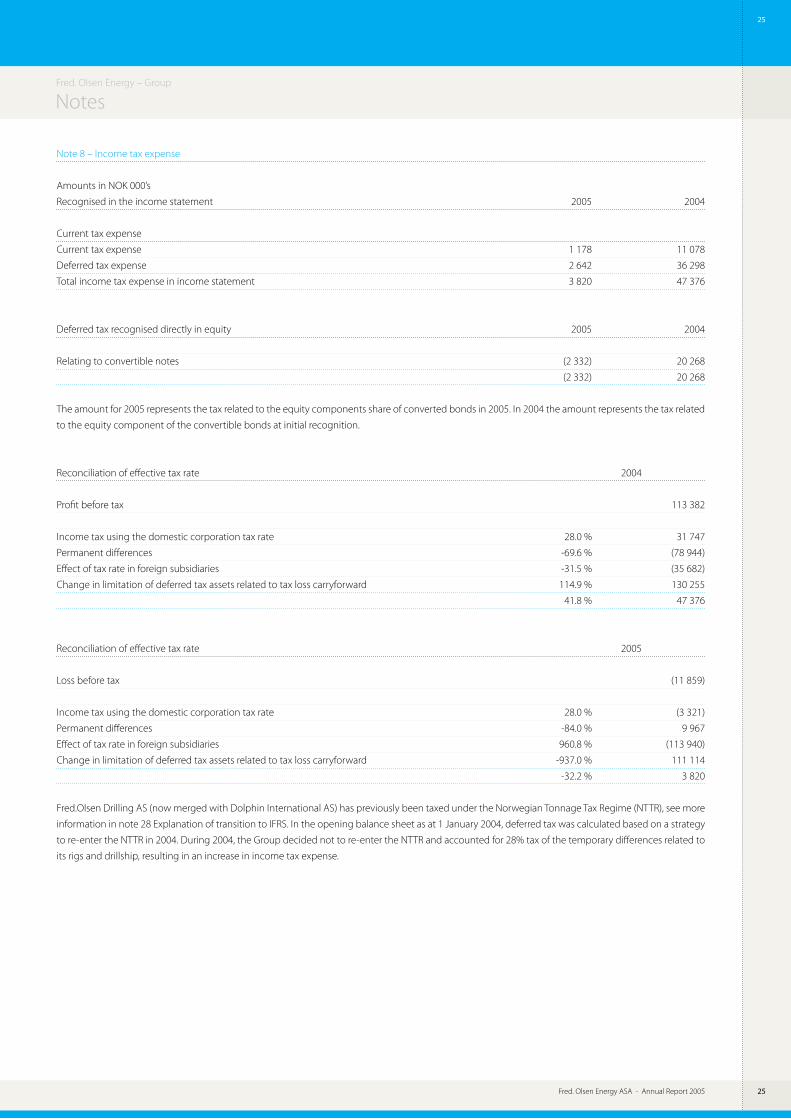
Fred. Olsen Energy ASA - Annual Report 2005 2�
2�
Fred. Olsen Energy ASA - Annual Report 2005
NotesFred. Olsen Energy – Group
Note 8 – Income tax expense
Amounts in NOK 000’s
Recognised in the income statement 2005 2004
Current tax expense
Current tax expense 1 178 11 078
Deferred tax expense 2 642 36 298
Total income tax expense in income statement 3 820 47 376
Deferred tax recognised directly in equity 2005 2004
Relating to convertible notes (2 332) 20 268
(2 332) 20 268
The amount for 2005 represents the tax related to the equity components share of converted bonds in 2005. In 2004 the amount represents the tax related
to the equity component of the convertible bonds at initial recognition.
Reconciliation of effective tax rate 2004
Profit before tax 113 382
Income tax using the domestic corporation tax rate 28.0 % 31 747
Permanent differences -69.6 % (78 944)
Effect of tax rate in foreign subsidiaries -31.5 % (35 682)
Change in limitation of deferred tax assets related to tax loss carryforward 114.9 % 130 255
41.8 % 47 376
Reconciliation of effective tax rate 2005
Loss before tax (11 859)
Income tax using the domestic corporation tax rate 28.0 % (3 321)
Permanent differences -84.0 % 9 967
Effect of tax rate in foreign subsidiaries 960.8 % (113 940)
Change in limitation of deferred tax assets related to tax loss carryforward -937.0 % 111 114
-32.2 % 3 820
Fred.Olsen Drilling AS (now merged with Dolphin International AS) has previously been taxed under the Norwegian Tonnage Tax Regime (NTTR), see more
information in note 28 Explanation of transition to IFRS. In the opening balance sheet as at 1 January 2004, deferred tax was calculated based on a strategy
to re-enter the NTTR in 2004. During 2004, the Group decided not to re-enter the NTTR and accounted for 28% tax of the temporary differences related to
its rigs and drillship, resulting in an increase in income tax expense.
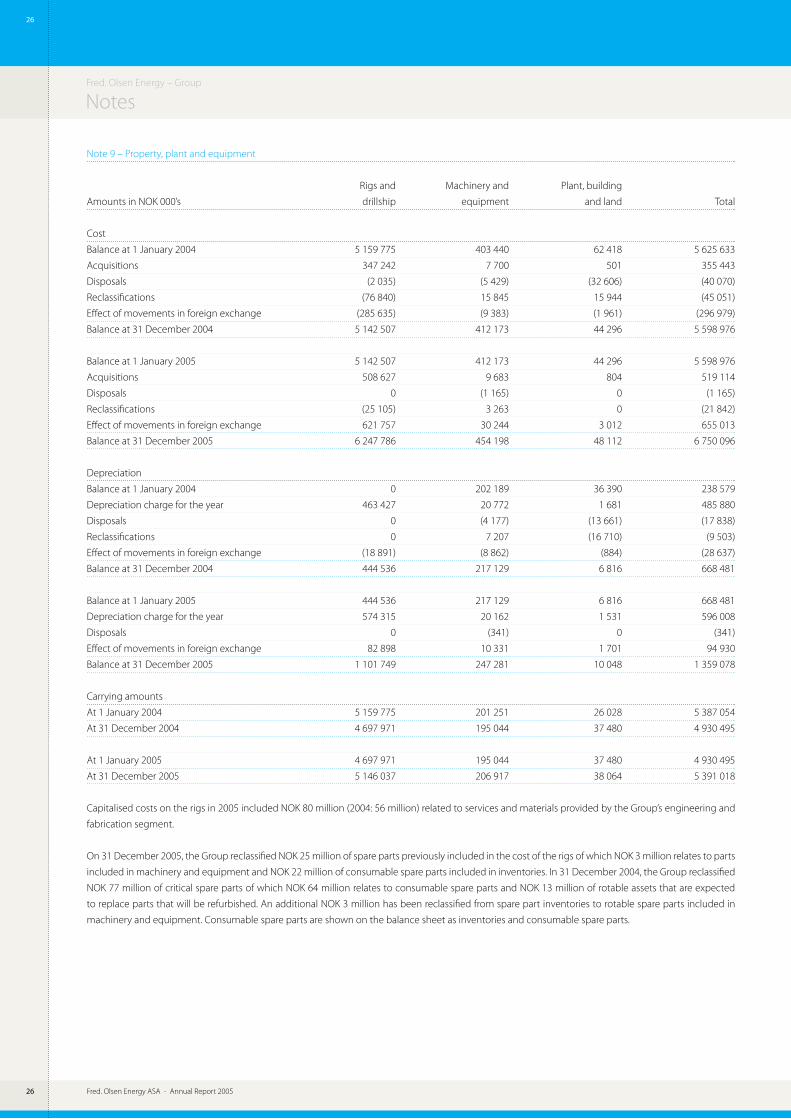
Fred. Olsen Energy ASA - Annual Report 20052�
2�
Fred. Olsen Energy ASA - Annual Report 2005
Fred. Olsen Energy – Group
Notes
Note 9 – Property, plant and equipment
Rigs and Machinery and Plant, building
Amounts in NOK 000’s drillship equipment and land Total
Cost
Balance at 1 January 2004 5 159 775 403 440 62 418 5 625 633
Acquisitions 347 242 7 700 501 355 443
Disposals (2 035) (5 429) (32 606) (40 070)
Reclassifications (76 840) 15 845 15 944 (45 051)
Effect of movements in foreign exchange (285 635) (9 383) (1 961) (296 979)
Balance at 31 December 2004 5 142 507 412 173 44 296 5 598 976
Balance at 1 January 2005 5 142 507 412 173 44 296 5 598 976
Acquisitions 508 627 9 683 804 519 114
Disposals 0 (1 165) 0 (1 165)
Reclassifications (25 105) 3 263 0 (21 842)
Effect of movements in foreign exchange 621 757 30 244 3 012 655 013
Balance at 31 December 2005 6 247 786 454 198 48 112 6 750 096
Depreciation
Balance at 1 January 2004 0 202 189 36 390 238 579
Depreciation charge for the year 463 427 20 772 1 681 485 880
Disposals 0 (4 177) (13 661) (17 838)
Reclassifications 0 7 207 (16 710) (9 503)
Effect of movements in foreign exchange (18 891) (8 862) (884) (28 637)
Balance at 31 December 2004 444 536 217 129 6 816 668 481
Balance at 1 January 2005 444 536 217 129 6 816 668 481
Depreciation charge for the year 574 315 20 162 1 531 596 008
Disposals 0 (341) 0 (341)
Effect of movements in foreign exchange 82 898 10 331 1 701 94 930
Balance at 31 December 2005 1 101 749 247 281 10 048 1 359 078
Carrying amounts
At 1 January 2004 5 159 775 201 251 26 028 5 387 054
At 31 December 2004 4 697 971 195 044 37 480 4 930 495
At 1 January 2005 4 697 971 195 044 37 480 4 930 495
At 31 December 2005 5 146 037 206 917 38 064 5 391 018
Capitalised costs on the rigs in 2005 included NOK 80 million (2004: 56 million) related to services and materials provided by the Group’s engineering and
fabrication segment.
On 31 December 2005, the Group reclassified NOK 25 million of spare parts previously included in the cost of the rigs of which NOK 3 million relates to parts
included in machinery and equipment and NOK 22 million of consumable spare parts included in inventories. In 31 December 2004, the Group reclassified
NOK 77 million of critical spare parts of which NOK 64 million relates to consumable spare parts and NOK 13 million of rotable assets that are expected
to replace parts that will be refurbished. An additional NOK 3 million has been reclassified from spare part inventories to rotable spare parts included in
machinery and equipment. Consumable spare parts are shown on the balance sheet as inventories and consumable spare parts.
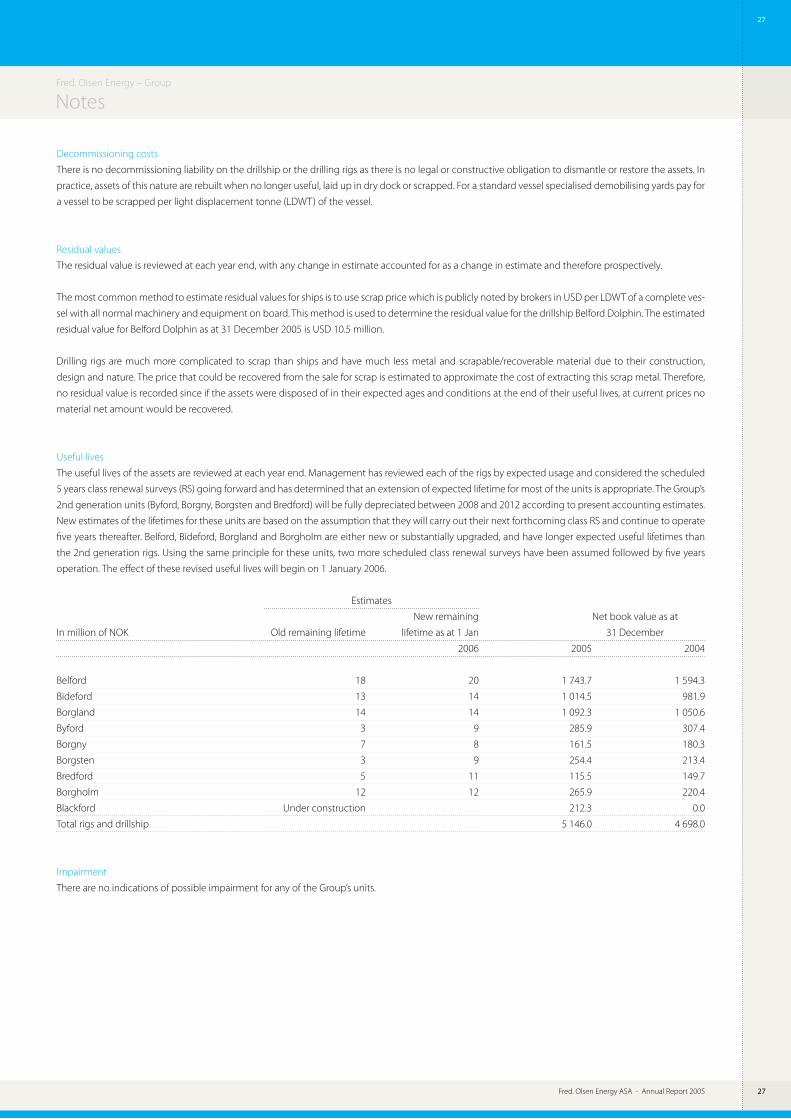
Fred. Olsen Energy ASA - Annual Report 2005 2�
2�
Fred. Olsen Energy ASA - Annual Report 2005
NotesFred. Olsen Energy – Group
Decommissioning costs
There is no decommissioning liability on the drillship or the drilling rigs as there is no legal or constructive obligation to dismantle or restore the assets. In
practice, assets of this nature are rebuilt when no longer useful, laid up in dry dock or scrapped. For a standard vessel specialised demobilising yards pay for
a vessel to be scrapped per light displacement tonne (LDWT) of the vessel.
Residual values
The residual value is reviewed at each year end, with any change in estimate accounted for as a change in estimate and therefore prospectively.
The most common method to estimate residual values for ships is to use scrap price which is publicly noted by brokers in USD per LDWT of a complete ves-
sel with all normal machinery and equipment on board. This method is used to determine the residual value for the drillship Belford Dolphin. The estimated
residual value for Belford Dolphin as at 31 December 2005 is USD 10.5 million.
Drilling rigs are much more complicated to scrap than ships and have much less metal and scrapable/recoverable material due to their construction,
design and nature. The price that could be recovered from the sale for scrap is estimated to approximate the cost of extracting this scrap metal. Therefore,
no residual value is recorded since if the assets were disposed of in their expected ages and conditions at the end of their useful lives, at current prices no
material net amount would be recovered.
Useful lives
The useful lives of the assets are reviewed at each year end. Management has reviewed each of the rigs by expected usage and considered the scheduled
5 years class renewal surveys (RS) going forward and has determined that an extension of expected lifetime for most of the units is appropriate. The Group’s
2nd generation units (Byford, Borgny, Borgsten and Bredford) will be fully depreciated between 2008 and 2012 according to present accounting estimates.
New estimates of the lifetimes for these units are based on the assumption that they will carry out their next forthcoming class RS and continue to operate
five years thereafter. Belford, Bideford, Borgland and Borgholm are either new or substantially upgraded, and have longer expected useful lifetimes than
the 2nd generation rigs. Using the same principle for these units, two more scheduled class renewal surveys have been assumed followed by five years
operation. The effect of these revised useful lives will begin on 1 January 2006.
Estimates
New remaining Net book value as at
In million of NOK Old remaining lifetime lifetime as at 1 Jan 31 December
2006 2005 2004
Belford 18 20 1 743.7 1 594.3
Bideford 13 14 1 014.5 981.9
Borgland 14 14 1 092.3 1 050.6
Byford 3 9 285.9 307.4
Borgny 7 8 161.5 180.3
Borgsten 3 9 254.4 213.4
Bredford 5 11 115.5 149.7
Borgholm 12 12 265.9 220.4
Blackford Under construction 212.3 0.0
Total rigs and drillship 5 146.0 4 698.0
Impairment
There are no indications of possible impairment for any of the Group’s units.
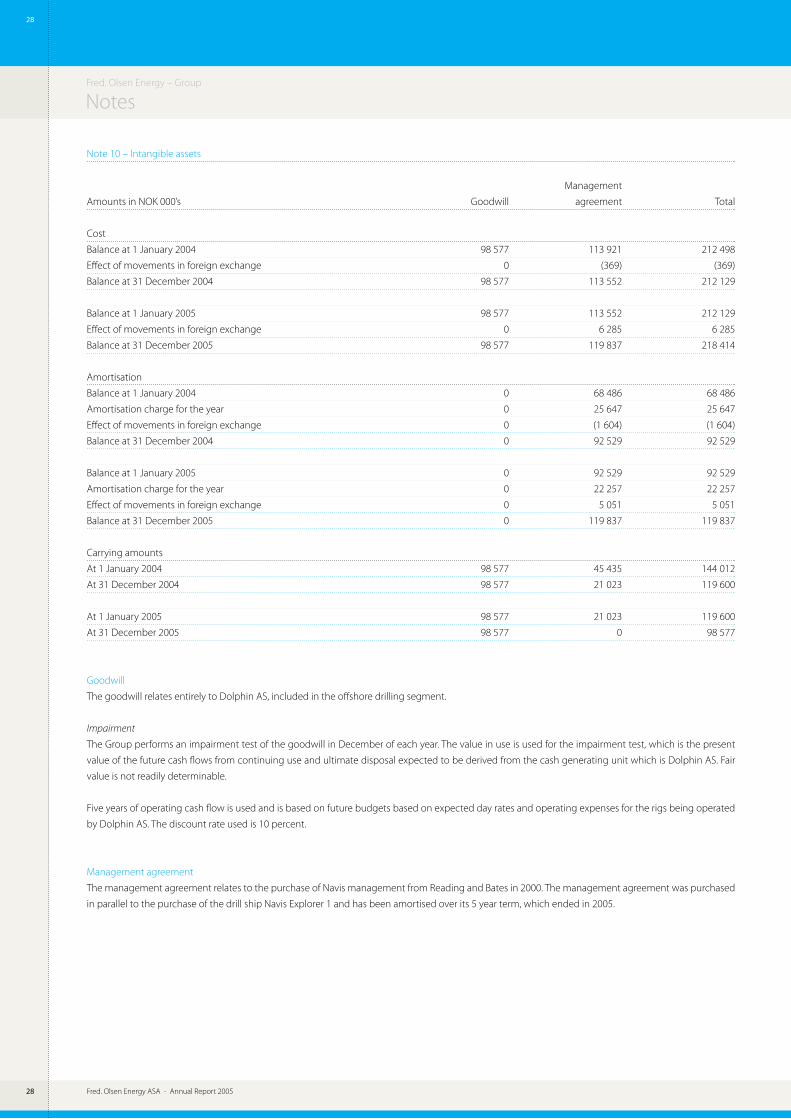
Fred. Olsen Energy ASA - Annual Report 20052�
2�
Fred. Olsen Energy ASA - Annual Report 2005
Fred. Olsen Energy – Group
Notes
Note 10 – Intangible assets
Management
Amounts in NOK 000’s Goodwill agreement Total
Cost
Balance at 1 January 2004 98 577 113 921 212 498
Effect of movements in foreign exchange 0 (369) (369)
Balance at 31 December 2004 98 577 113 552 212 129
Balance at 1 January 2005 98 577 113 552 212 129
Effect of movements in foreign exchange 0 6 285 6 285
Balance at 31 December 2005 98 577 119 837 218 414
Amortisation
Balance at 1 January 2004 0 68 486 68 486
Amortisation charge for the year 0 25 647 25 647
Effect of movements in foreign exchange 0 (1 604) (1 604)
Balance at 31 December 2004 0 92 529 92 529
Balance at 1 January 2005 0 92 529 92 529
Amortisation charge for the year 0 22 257 22 257
Effect of movements in foreign exchange 0 5 051 5 051
Balance at 31 December 2005 0 119 837 119 837
Carrying amounts
At 1 January 2004 98 577 45 435 144 012
At 31 December 2004 98 577 21 023 119 600
At 1 January 2005 98 577 21 023 119 600
At 31 December 2005 98 577 0 98 577
Goodwill
The goodwill relates entirely to Dolphin AS, included in the offshore drilling segment.
Impairment
The Group performs an impairment test of the goodwill in December of each year. The value in use is used for the impairment test, which is the present
value of the future cash flows from continuing use and ultimate disposal expected to be derived from the cash generating unit which is Dolphin AS. Fair
value is not readily determinable.
Five years of operating cash flow is used and is based on future budgets based on expected day rates and operating expenses for the rigs being operated
by Dolphin AS. The discount rate used is 10 percent.
Management agreement
The management agreement relates to the purchase of Navis management from Reading and Bates in 2000. The management agreement was purchased
in parallel to the purchase of the drill ship Navis Explorer 1 and has been amortised over its 5 year term, which ended in 2005.
Fred. Olsen Energy ASA - Annual Report 2005 2�
2�
Fred. Olsen Energy ASA - Annual Report 2005
NotesFred. Olsen Energy – Group
The Group is exposed to credit-, interest rate-
and foreign currency risks in its operations. De-
rivative financial instruments are from time to
time entered into to hedge against fluctuations
in foreign currency rates and interest rate levels.
Credit risk
Due to the nature of the Group’s operations, rev-
enues and related receivables are typically con-
centrated amongst a relatively small customer
base of international oil and gas companies. The
Group continually evaluates the credit risk as-
sociated with customers and, when considered
necessary, requires certain guarantees, either in
the form of parent company guarantees, bank
guarantees or cash collateral. The Group’s short-
term investments are limited to reputable money
market funds and cash deposits in the Group’s re-
lationship banks. Derivative financial instruments
are normally entered into with the Group’s main
relationship banks. As such, the Group considers
its exposure to credit risk to be low.
At 31 December 2005 there was no significant
concentration of credit risk. Maximum exposure
to credit risk is reflected in the carrying value of
each financial asset, including derivative finan-
cial instruments, in the balance sheet.
Interest rate risk
The Group is exposed to fluctuations in interest
rates for USD and NOK. The Group has used inter-
est rate derivatives to achieve a satisfactory mix
of exposure to fixed and floating interest rate on
its debt instruments. During the recent years, the
Group has had between 50% and 70% of its inter-
est expenses based on fixed rates, either as fixed
rate loans or through interest rate derivatives.
At 31 December 2005, the Group’s USD denomi-
nated debt amounted to USD 421 million, of
which USD 85 million is based on fixed interest
rates through financial derivatives, USD 34 mil-
lion are fixed rate loans and USD 110 million is
related to a fixed rate bond loan of NOK 760 mil-
lion which has been swapped into USD through
currency derivatives agreements. The remaining
portion of the USD debt, amounting to USD 192
million, is based on floating interest rates (USD LI-
BOR) plus a margin. The Group’s NOK debt consist
of a bond loan of NOK 108,5 million maturing in
2006, a bond loan of NOK 760 million maturing in
2009 which has been swapped into USD, and a
convertible bond loan maturing in 2009. The NOK
108,5 million bond loan carries interest based
on floating interest rate (NIBOR) plus a margin
of 1.5% p.a. The NOK 760 million bond loan car-
ries a fixed interest rate of 8.75% p.a. to maturity;
however, the fixed USD based interest rate of the
swapped loan is 9.01% p.a. The NOK 760 million
bonds have been called for redemption on 26
March 2006 including a call premium of 4.5%. The
corresponding currency swaps will be terminated
at the time of the redemption. The convertible
bond loan of approximately NOK 373 million car-
ries a fixed interest rate of 4.5% p.a. to maturity.
At 31 December 2005 the Group had interest rate
derivatives in the aggregate of USD 285 million
(2004: USD 510 million). All interest rate derivatives
as per 31 December 2005 mature in November
2007. When entered into, the duration of the inter-
est rate derivatives were aligned to the duration of
the Group’s major loans, however, following exten-
sions of the maturity of the corresponding loans,
the interest rate derivatives mature earlier.
The fair value of interest rate swaps is the esti-
mated amount that the Group would receive or
pay to terminate the swap at the balance sheet
date. Net fair market value of interest rate deriv-
atives at 31 December 2005 was NOK 20 million
(2004: NOK 59 million) recorded as a liability, of
which none was recorded as current.
Foreign currency risk
The Group is exposed to foreign currency risks re-
lated to its operations and debt instruments. The
Group’s financial statements are denominated in
Norwegian kroner (NOK) and some of the sub-
sidiaries use US dollar (USD) as their functional
currency. Some subsidiaries also used the British
Pound (GBP) as their functional currency in 2004.
The Group’s revenues consist primarily of NOK
and USD with USD as the most dominant cur-
rency. The Group’s expenses are primarily in NOK,
GBP and USD. As such, the Group’s earnings are
exposed to fluctuations in the foreign currency
market. The Group’s future foreign currency ex-
posure is dependent upon the currency denomi-
nation of future operating contracts. In 2005,
approximately 75% of revenues and 49% of op-
erating expenses are in USD. In the longer term,
a substantial portion of the USD/NOK exposure
is neutralised due to the majority of the Group’s
debt being denominated in USD. At 31 Decem-
ber 2005, approximately 62% of the outstanding
debt was in USD. In addition, the Group has en-
tered into currency swaps totalling NOK 760 mil-
lion of debt denominated in NOK into USD. These
currency swaps increase the USD denominated
portion of total debt to approximately 85% as per
31 December 2005. The market value of the cur-
rency swaps was NOK 39 million at 31 December
2005 (2004: NOK 128 million) recorded as an as-
set, of which none was recorded as current.
At 31 December 2005 the Group had outstand-
ing currency derivative contracts for forward sale
of USD 25 million, of which USD 20 million were
against GBP at an average rate of 1.73 and USD 5
million were against NOK at the spot rate as long
as the spot rate does not exceed 6.98, in which
case the forward rate will be 6.20. All outstand-
ing foreign exchange contracts expire in 2006.
The fair value of forward exchange contracts is
their quoted market price at the balance sheet
date, being the present value of the quoted
forward price. Net fair market value of currency
forward contracts as per 31 December 2005 was
NOK 2.6 million (2004: NOK 7.7 million recorded
as asset) recorded as a liability, of which NOK 2.6
million as current.
Sensitivity analysis
In managing interest- and currency risks the
Group aims to reduce the impact on its earnings
from short-term fluctuations in interest rates and
currency exchange rates. Over the longer-term
permanent changes in currency exchange rates
and interest rate levels will have an impact on
the Group’s earnings.
At 31 December 2005 it is estimated that 1 – one
percent incremental change in USD LIBOR and
NIBOR is estimated to have an effect on the net
result before tax of approximately NOK 10 mil-
lion (2004:17 million), taking into account the
impact of interest rate derivatives.
Based on the 2005 year-end results and opera-
tions of the Group, 10 – ten percent incremental
change in the NOK/USD exchange rate is esti-
mated to have an effect on the operating result
of NOK 121 million and on the net result before
tax of approximately NOK 35 million (2004: 44
million). 10 – ten percent incremental change
in the NOK/GBP exchange rate is estimated to
have an effect on the operating result of NOK
26 million and on the net result before tax of ap-
proximately NOK 26 million (2004: 24 million).
Note 11 – Financial instruments

Fred. Olsen Energy ASA - Annual Report 2005�0
�0
Fred. Olsen Energy ASA - Annual Report 2005
Fred. Olsen Energy – Group
Notes
At 31 December 2005, the Group had the following interest rate and currency derivative positions:
Amount Type Level Expiring
Currency contracts
$5 000 000 Forward USD against NOK 6.2 26.05.2006 Spot up to 6.98
$5 000 000 Forward USD against GBP 1.7536 18.10.2006
$5 000 000 Forward USD against GBP 1.7537 18.10.2006
$2 500 000 Forward USD against GBP 1.70635 28.02.2006
$2 500 000 Forward USD against GBP 1.70745 31.05.2006
$2 500 000 Forward USD against GBP 1.7096 31.08.2006
$2 500 000 Forward USD against GBP 1.7112 30.11.2006
Notional amount Receive rate Pay rate Duration
Currency swap agreements
$13 571 000 NOK 95 000 000 8.75 % 9.08 % March 2009
$13 792 000 NOK 95 000 000 8.75 % 8.98 % March 2009
$18 202 000 NOK 126 667 000 8.75 % 8.94 % March 2009
$36 582 000 NOK 253 333 000 8.75 % 9.08 % March 2009
$14 245 000 NOK 95 000 000 8.75 % 8.97 % March 2009
$13 571 000 NOK 95 000 000 8.75 % 9.05 % March 2009
Fixed rate agreements
$25 000 000 3 month LIBOR 5.195 % Nov 2007
$10 000 000 3 month LIBOR 4.73 % Nov 2007
$25 000 000 3 month LIBOR 4.88% Nov 2007
$25 000 000 3 month LIBOR 4.93% Nov 2007
$25 000 000 3 month LIBOR 5.01% Nov 2007
$50 000 000 3 month LIBOR 5.02% Nov 2007
Floating rate agreements with addendum
$50 000 000 6 month LIBOR 12 month LIBOR Nov 2007
$25 000 000 5.01 % 3 month LIBOR +1.84% Nov 2007
$50 000 000 5.02 % 3 month LIBOR +1.84% Nov 2007
Amounts in NOK 000’s 2005 2004
Non-current assets
Currency swap agreements 38 692 127 717
Current assets
Currency contracts 0 7 657
Total assets 38 692 135 374
Non-current liabilities
Interest rate swaps 19 579 59 149
Current liabilities
Currency contracts 2 589 0
Total liabilities 22 168 59 149
All the above financial instruments are stated at their fair values. The gain or loss on re-measurement to fair value is recognized in profit or loss.
Fair values
Financial assets and liabilities in the balance sheet have carrying values equal to their fair values except for financial lease obligations and convertible debt.
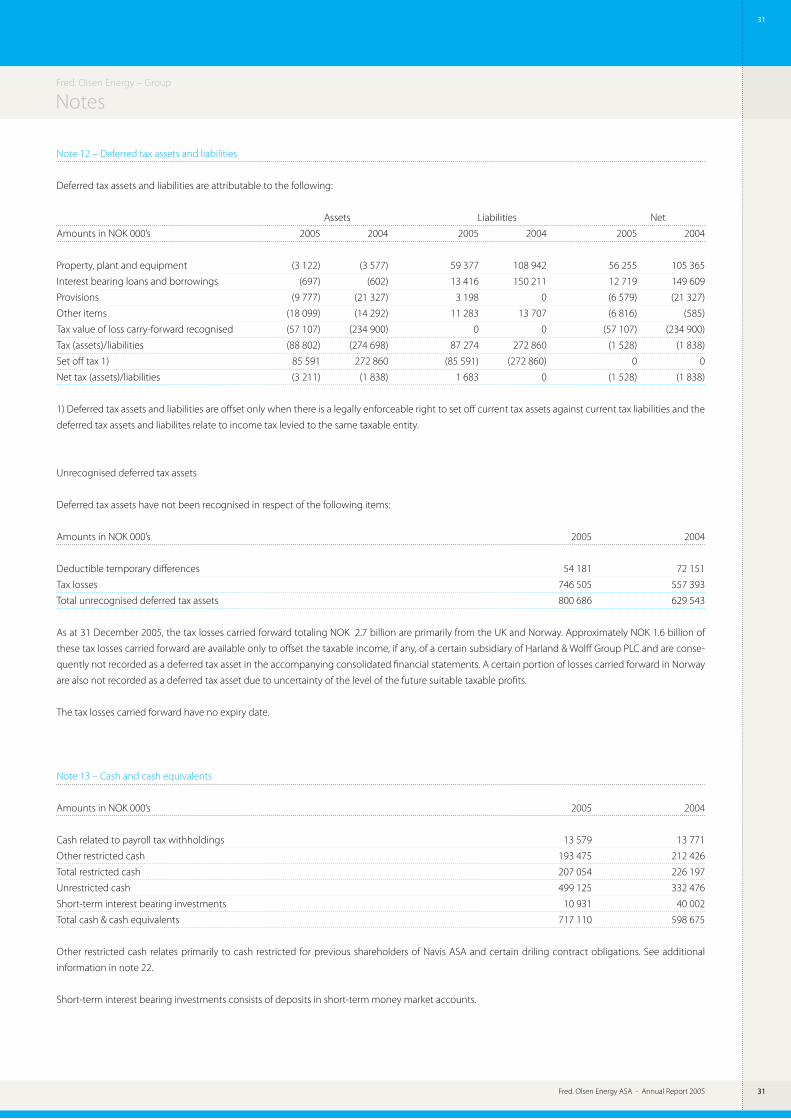
Fred. Olsen Energy ASA - Annual Report 2005 �1
�1
Fred. Olsen Energy ASA - Annual Report 2005
NotesFred. Olsen Energy – Group
Note 12 – Deferred tax assets and liabilities
Deferred tax assets and liabilities are attributable to the following:
Assets Liabilities Net
Amounts in NOK 000’s 2005 2004 2005 2004 2005 2004
Property, plant and equipment (3 122) (3 577) 59 377 108 942 56 255 105 365
Interest bearing loans and borrowings (697) (602) 13 416 150 211 12 719 149 609
Provisions (9 777) (21 327) 3 198 0 (6 579) (21 327)
Other items (18 099) (14 292) 11 283 13 707 (6 816) (585)
Tax value of loss carry-forward recognised (57 107) (234 900) 0 0 (57 107) (234 900)
Tax (assets)/liabilities (88 802) (274 698) 87 274 272 860 (1 528) (1 838)
Set off tax 1) 85 591 272 860 (85 591) (272 860) 0 0
Net tax (assets)/liabilities (3 211) (1 838) 1 683 0 (1 528) (1 838)
1) Deferred tax assets and liabilities are offset only when there is a legally enforceable right to set off current tax assets against current tax liabilities and the
deferred tax assets and liabilites relate to income tax levied to the same taxable entity.
Unrecognised deferred tax assets
Deferred tax assets have not been recognised in respect of the following items:
Amounts in NOK 000’s 2005 2004
Deductible temporary differences 54 181 72 151
Tax losses 746 505 557 393
Total unrecognised deferred tax assets 800 686 629 543
As at 31 December 2005, the tax losses carried forward totaling NOK 2.7 billion are primarily from the UK and Norway. Approximately NOK 1.6 billion of
these tax losses carried forward are available only to offset the taxable income, if any, of a certain subsidiary of Harland & Wolff Group PLC and are conse-
quently not recorded as a deferred tax asset in the accompanying consolidated financial statements. A certain portion of losses carried forward in Norway
are also not recorded as a deferred tax asset due to uncertainty of the level of the future suitable taxable profits.
The tax losses carried forward have no expiry date.
Note 13 – Cash and cash equivalents
Amounts in NOK 000’s 2005 2004
Cash related to payroll tax withholdings 13 579 13 771
Other restricted cash 193 475 212 426
Total restricted cash 207 054 226 197
Unrestricted cash 499 125 332 476
Short-term interest bearing investments 10 931 40 002
Total cash & cash equivalents 717 110 598 675
Other restricted cash relates primarily to cash restricted for previous shareholders of Navis ASA and certain driling contract obligations. See additional
information in note 22.
Short-term interest bearing investments consists of deposits in short-term money market accounts.
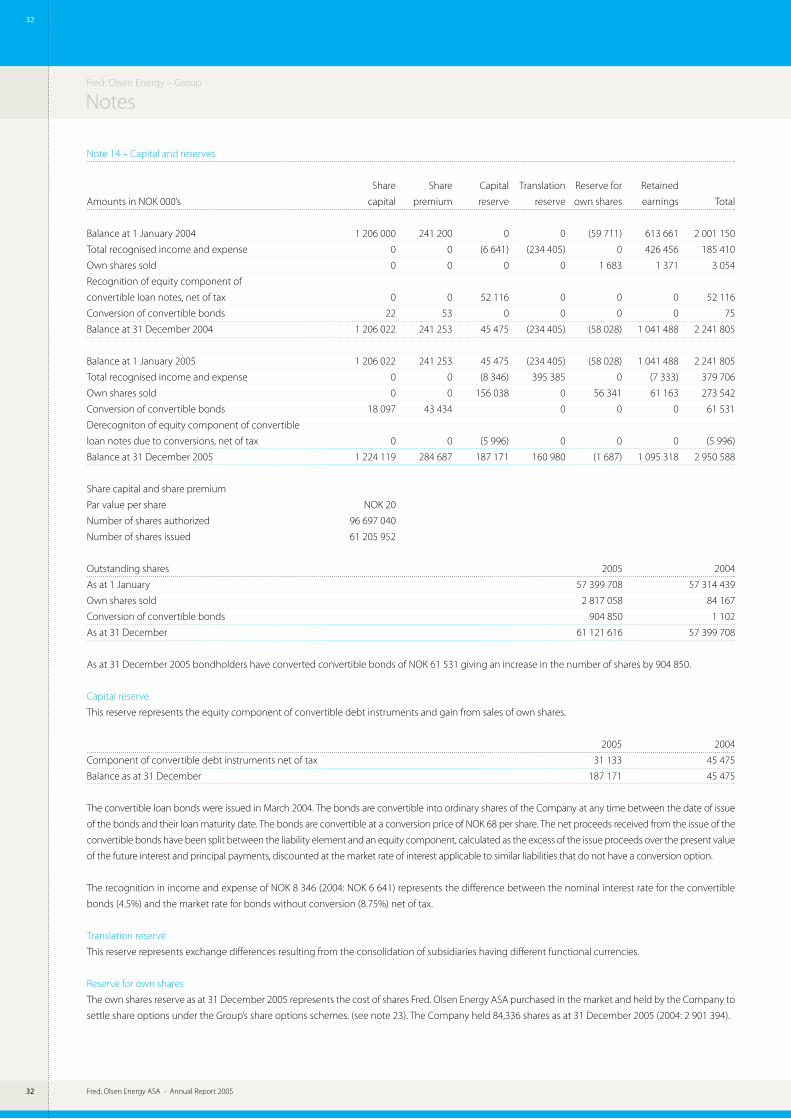
Fred. Olsen Energy ASA - Annual Report 2005�2
�2
Fred. Olsen Energy ASA - Annual Report 2005
Fred. Olsen Energy – Group
Notes
Note 14 – Capital and reserves
Share Share Capital Translation Reserve for Retained
Amounts in NOK 000’s capital premium reserve reserve own shares earnings Total
Balance at 1 January 2004 1 206 000 241 200 0 0 (59 711) 613 661 2 001 150
Total recognised income and expense 0 0 (6 641) (234 405) 0 426 456 185 410
Own shares sold 0 0 0 0 1 683 1 371 3 054
Recognition of equity component of
convertible loan notes, net of tax 0 0 52 116 0 0 0 52 116
Conversion of convertible bonds 22 53 0 0 0 0 75
Balance at 31 December 2004 1 206 022 241 253 45 475 (234 405) (58 028) 1 041 488 2 241 805
Balance at 1 January 2005 1 206 022 241 253 45 475 (234 405) (58 028) 1 041 488 2 241 805
Total recognised income and expense 0 0 (8 346) 395 385 0 (7 333) 379 706
Own shares sold 0 0 156 038 0 56 341 61 163 273 542
Conversion of convertible bonds 18 097 43 434 0 0 0 61 531
Derecogniton of equity component of convertible
loan notes due to conversions, net of tax 0 0 (5 996) 0 0 0 (5 996)
Balance at 31 December 2005 1 224 119 284 687 187 171 160 980 (1 687) 1 095 318 2 950 588
Share capital and share premium
Par value per share NOK 20
Number of shares authorized 96 697 040
Number of shares issued 61 205 952
Outstanding shares 2005 2004
As at 1 January 57 399 708 57 314 439
Own shares sold 2 817 058 84 167
Conversion of convertible bonds 904 850 1 102
As at 31 December 61 121 616 57 399 708
As at 31 December 2005 bondholders have converted convertible bonds of NOK 61 531 giving an increase in the number of shares by 904 850.
Capital reserve
This reserve represents the equity component of convertible debt instruments and gain from sales of own shares.
2005 2004
Component of convertible debt instruments net of tax 31 133 45 475
Balance as at 31 December 187 171 45 475
The convertible loan bonds were issued in March 2004. The bonds are convertible into ordinary shares of the Company at any time between the date of issue
of the bonds and their loan maturity date. The bonds are convertible at a conversion price of NOK 68 per share. The net proceeds received from the issue of the
convertible bonds have been split between the liability element and an equity component, calculated as the excess of the issue proceeds over the present value
of the future interest and principal payments, discounted at the market rate of interest applicable to similar liabilities that do not have a conversion option.
The recognition in income and expense of NOK 8 346 (2004: NOK 6 641) represents the difference between the nominal interest rate for the convertible
bonds (4.5%) and the market rate for bonds without conversion (8.75%) net of tax.
Translation reserve
This reserve represents exchange differences resulting from the consolidation of subsidiaries having different functional currencies.
Reserve for own shares
The own shares reserve as at 31 December 2005 represents the cost of shares Fred. Olsen Energy ASA purchased in the market and held by the Company to
settle share options under the Group’s share options schemes. (see note 23). The Company held 84,336 shares as at 31 December 2005 (2004: 2 901 394).

Fred. Olsen Energy ASA - Annual Report 2005 ��
��
Fred. Olsen Energy ASA - Annual Report 2005
NotesFred. Olsen Energy – Group
Note 15 – Interest-bearing loans and borrowings
Current Non-Current Liability
Interest rate Liability 2010 and
Amounts in NOK 000’s 2005 31.12.05 2006 2007 2008 2009 thereafter
Parent company facilities
FOE Bonds (NOK) 108 500 3.99 % 108 500 0 0 0 0
FOE Bonds (NOK) 760 000 8.75 % 0 0 0 760 000 0
FOE Convertible Bonds (NOK) 373 394 4.50 % 0 0 0 373 394 0
Discount related to the equity component
Convertible Bonds (43 240) 0.00 % 0 0 0 0 0
Total Parent company facilities 1 198 654 108 500 0 0 1 133 394 0
Project / Asset financing
Fleet loans (USD) 1 616 986 6.15 % 240 323 261 091 1 115 572 0 0
Fleet loan (USD) 227 485 6.20 % 33 810 36 731 156 944 0 0
Fleet loan (USD) 203 061 5.22 % 203 061 0 0 0 0
Slender-Well (USD) 59 155 5.42 % 17 640 18 133 18 642 4 740 0
Total Project / Asset financing 2 106 687 494 833 315 956 1 291 158 4 740 0
Government loan stock (GBP) 7 050 0.00 % 3 554 1 748 1 748 0 0
Other 9 665 5.00 % 1 022 8 643 0 0 0
Capitalised transaction costs (26 746) 0.00 % 0 0 0 0 0
Total Interest bearing loan and borrowings 3 295 310 607 909 326 347 1 292 906 1 138 134 0
Current interest bearing loans and borrowings 607 909
Non-Current interest bearing loan and borrowings 2 687 401
Total interest bearing loans and borrowings 3 295 310
Of the interest bearing debt of the Group at 31 December 2005, NOK 2 106 million or USD 311 million is denominated in US dollars. USD 272.5 million of
the amount is related to a USD 300 million credit facility (“the Facility”).
The Group’s debt portfolio consists of several loans, both secured, unsecured and subordinated. The most significant are the Facility agreement and the
senior unsecured bonds totaling NOK 108.5 million and NOK 760 million, maturing in June 2006 and March 2009, respectively. The NOK 760 million loan has
a call option in March 2006. These bonds carry interest at NIBOR plus a margin of 1.5% p.a. for the NOK 108.5 million bonds and an interest rate of 8.75% p.a.
for the NOK 760 million bonds. In March 2004, the Group issued NOK 435 million in 5-year subordinated, convertible bonds. The convertible bonds carry
interest at 4.5% p.a. and a right to convert into shares at a conversion price of NOK 68 per share. The various loan agreements contain several covenants
typical for credit arrangements of this nature. All project/asset financing and capital leases are secured in the related assets.
As of 31 December 2005, the Group was in compliance with its loan covenants.
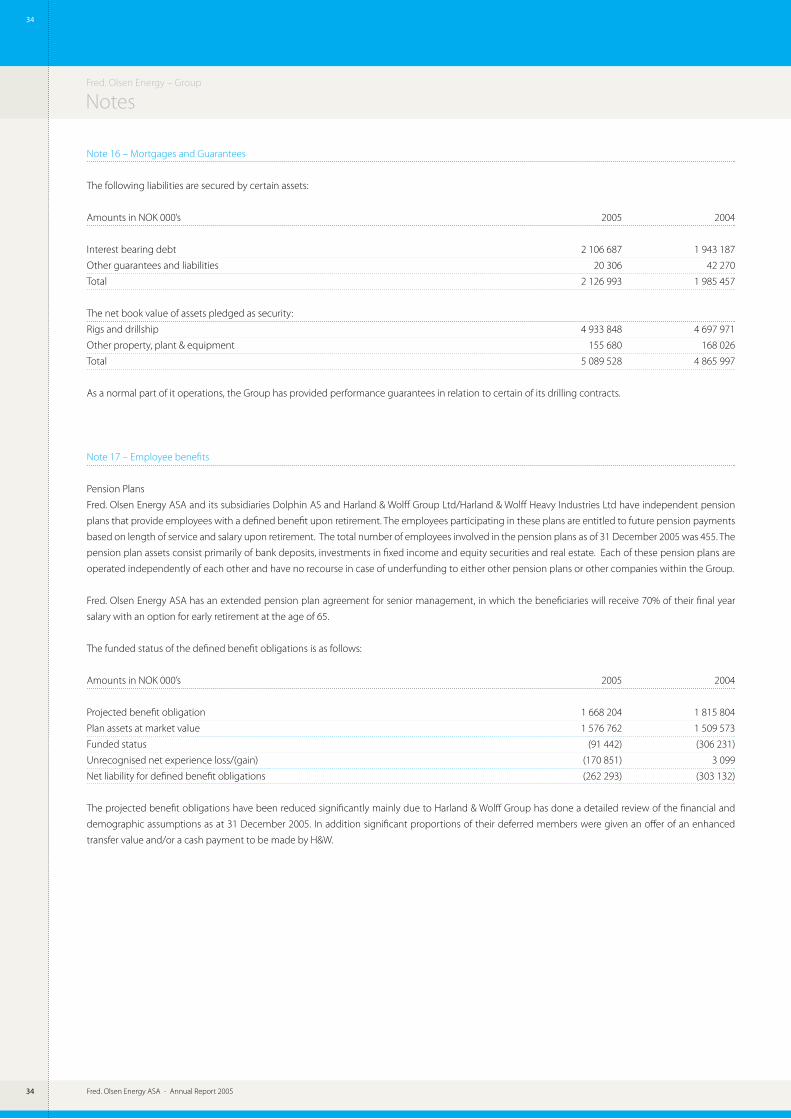
Fred. Olsen Energy ASA - Annual Report 2005�4
�4
Fred. Olsen Energy ASA - Annual Report 2005
Fred. Olsen Energy – Group
Notes
Note 16 – Mortgages and Guarantees
The following liabilities are secured by certain assets:
Amounts in NOK 000’s 2005 2004
Interest bearing debt 2 106 687 1 943 187
Other guarantees and liabilities 20 306 42 270
Total 2 126 993 1 985 457
The net book value of assets pledged as security:
Rigs and drillship 4 933 848 4 697 971
Other property, plant & equipment 155 680 168 026
Total 5 089 528 4 865 997
As a normal part of it operations, the Group has provided performance guarantees in relation to certain of its drilling contracts.
Note 17 – Employee benefits
Pension Plans
Fred. Olsen Energy ASA and its subsidiaries Dolphin AS and Harland & Wolff Group Ltd/Harland & Wolff Heavy Industries Ltd have independent pension
plans that provide employees with a defined benefit upon retirement. The employees participating in these plans are entitled to future pension payments
based on length of service and salary upon retirement. The total number of employees involved in the pension plans as of 31 December 2005 was 455. The
pension plan assets consist primarily of bank deposits, investments in fixed income and equity securities and real estate. Each of these pension plans are
operated independently of each other and have no recourse in case of underfunding to either other pension plans or other companies within the Group.
Fred. Olsen Energy ASA has an extended pension plan agreement for senior management, in which the beneficiaries will receive 70% of their final year
salary with an option for early retirement at the age of 65.
The funded status of the defined benefit obligations is as follows:
Amounts in NOK 000’s 2005 2004
Projected benefit obligation 1 668 204 1 815 804
Plan assets at market value 1 576 762 1 509 573
Funded status (91 442) (306 231)
Unrecognised net experience loss/(gain) (170 851) 3 099
Net liability for defined benefit obligations (262 293) (303 132)
The projected benefit obligations have been reduced significantly mainly due to Harland & Wolff Group has done a detailed review of the financial and
demographic assumptions as at 31 December 2005. In addition significant proportions of their deferred members were given an offer of an enhanced
transfer value and/or a cash payment to be made by H&W.

Fred. Olsen Energy ASA - Annual Report 2005 ��
��
Fred. Olsen Energy ASA - Annual Report 2005
NotesFred. Olsen Energy – Group
Movements in the net liability for defined benefit obligations recognised in the balance sheet
Amounts in NOK 000’s 2005 2004
Net liability for defined benefit obligations at 1 January (303 132) (300 189)
Pension contribution 24 592 29 283
Net benefit/(expense) recognised in the income statement 16 506 (30 330)
Foreign currency translation (258) (1 896)
Net liability for defined benefit obligations at 31 December (262 293) (303 132)
Other investments 6 000 0
Employee benefits (268 293) (303 132)
Net liability for defined benefit obligations at 31 December (262 293) (303 132)
Major categories of plan assets
2005 2004
Equity instruments 50 % 50 %
Bonds 30 % 26 %
Annuities 19 % 24 %
Other assets 1 % 0 %
Plan assets 100 % 100 %
Expense recognised in the income statement
Amounts in NOK 000’s 2005 2004
Current service costs 24 487 23 048
Interest on obligations 87 766 92 912
Expected return of plan assets (87 096) (85 630)
Amortisation expense 1 247 0
Deferred pensioner settlement (42 910) 0
Net pension cost/(benefit) for defined benefit plans (16 506) 30 330
The expense is recognised in the line for personnel expenses in the income statement.
The deferred pension settlement of NOK 42.9 million is the result of an irrevocable settlement offer made by the Board and Pension Trustees at Harland
and Wolff to plan participants. Letters were issued to deferred members offering them the option of being transferred out of the pension scheme either by
cash payment or move of their value to an alternative external scheme. An estimate was made by H&W Group of the probable number of participants that
will ultimately accept the offer, and the resulting impact on the pension plan. The estimate was made by the plan actuary based on the responses received
and experience with other similar plans.
Assumptions used in the calculation of pension obligations are as follows:
2005 2004
Assumed salary increases 2.5-3.0% 2.9-3.0%
Discount rates 4.3-4.7% 5.2-5.5%
Interest rates 4.3-4.7% 5.-5.5%
Expected rates of return on pension plan assets 5.3-6.2% 6.5%
The Norwegian group companies have used a discount rate of 4.3% for the calculation of the benefit obligations. The rate is based on 10 years government
bonds which was 3.64% at 31 December 2005 and estimated the discount rate for longer maturity representing the average expected period of pension
commitments.
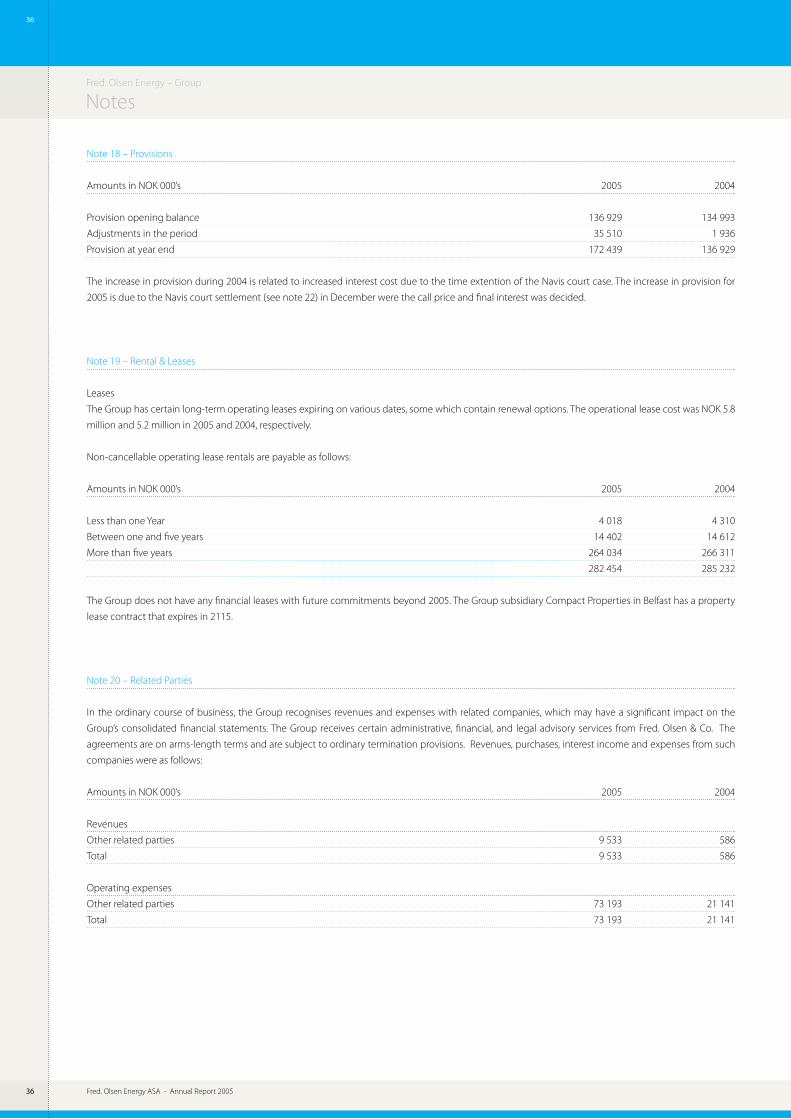
Fred. Olsen Energy ASA - Annual Report 2005��
��
Fred. Olsen Energy ASA - Annual Report 2005
Fred. Olsen Energy – Group
Notes
Note 18 – Provisions
Amounts in NOK 000’s 2005 2004
Provision opening balance 136 929 134 993
Adjustments in the period 35 510 1 936
Provision at year end 172 439 136 929
The increase in provision during 2004 is related to increased interest cost due to the time extention of the Navis court case. The increase in provision for
2005 is due to the Navis court settlement (see note 22) in December were the call price and final interest was decided.
Note 19 – Rental & Leases
Leases
The Group has certain long-term operating leases expiring on various dates, some which contain renewal options. The operational lease cost was NOK 5.8
million and 5.2 million in 2005 and 2004, respectively.
Non-cancellable operating lease rentals are payable as follows:
Amounts in NOK 000’s 2005 2004
Less than one Year 4 018 4 310
Between one and five years 14 402 14 612
More than five years 264 034 266 311
282 454 285 232
The Group does not have any financial leases with future commitments beyond 2005. The Group subsidiary Compact Properties in Belfast has a property
lease contract that expires in 2115.
Note 20 – Related Parties
In the ordinary course of business, the Group recognises revenues and expenses with related companies, which may have a significant impact on the
Group’s consolidated financial statements. The Group receives certain administrative, financial, and legal advisory services from Fred. Olsen & Co. The
agreements are on arms-length terms and are subject to ordinary termination provisions. Revenues, purchases, interest income and expenses from such
companies were as follows:
Amounts in NOK 000’s 2005 2004
Revenues
Other related parties 9 533 586
Total 9 533 586
Operating expenses
Other related parties 73 193 21 141
Total 73 193 21 141
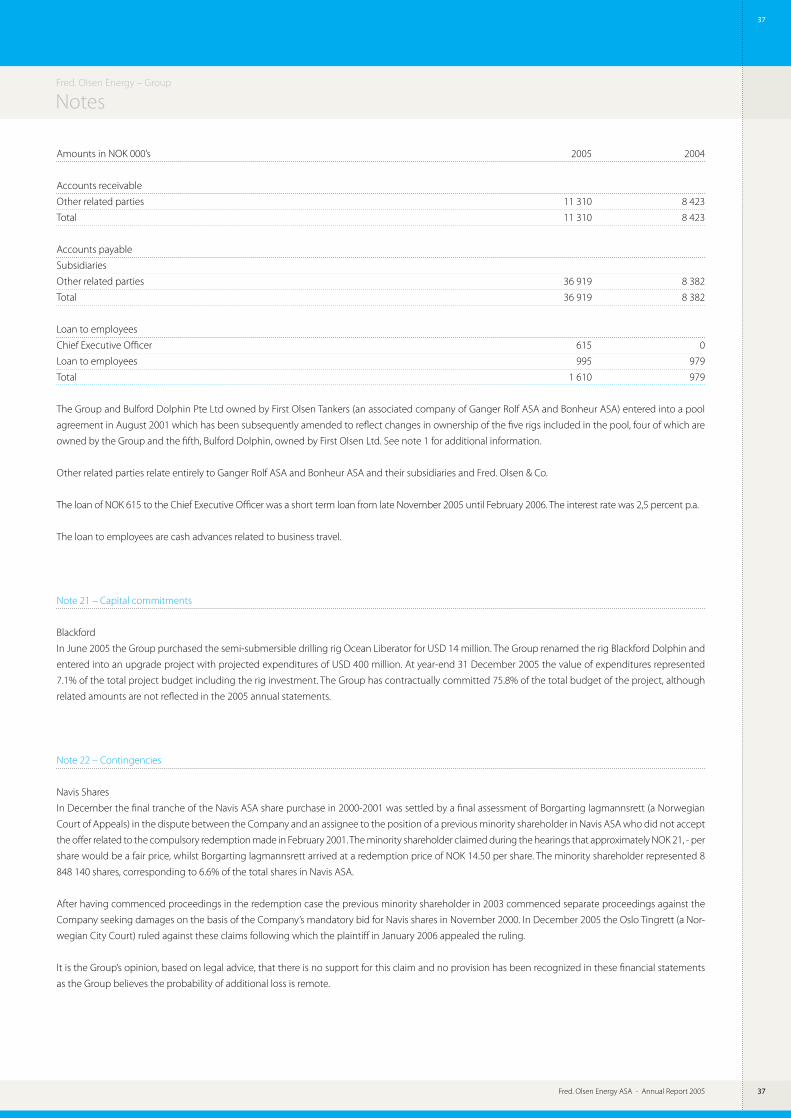
Fred. Olsen Energy ASA - Annual Report 2005 ��
��
Fred. Olsen Energy ASA - Annual Report 2005
NotesFred. Olsen Energy – Group
Amounts in NOK 000’s 2005 2004
Accounts receivable
Other related parties 11 310 8 423
Total 11 310 8 423
Accounts payable
Subsidiaries
Other related parties 36 919 8 382
Total 36 919 8 382
Loan to employees
Chief Executive Officer 615 0
Loan to employees 995 979
Total 1 610 979
The Group and Bulford Dolphin Pte Ltd owned by First Olsen Tankers (an associated company of Ganger Rolf ASA and Bonheur ASA) entered into a pool
agreement in August 2001 which has been subsequently amended to reflect changes in ownership of the five rigs included in the pool, four of which are
owned by the Group and the fifth, Bulford Dolphin, owned by First Olsen Ltd. See note 1 for additional information.
Other related parties relate entirely to Ganger Rolf ASA and Bonheur ASA and their subsidiaries and Fred. Olsen & Co.
The loan of NOK 615 to the Chief Executive Officer was a short term loan from late November 2005 until February 2006. The interest rate was 2,5 percent p.a.
The loan to employees are cash advances related to business travel.
Note 21 – Capital commitments
Blackford
In June 2005 the Group purchased the semi-submersible drilling rig Ocean Liberator for USD 14 million. The Group renamed the rig Blackford Dolphin and
entered into an upgrade project with projected expenditures of USD 400 million. At year-end 31 December 2005 the value of expenditures represented
7.1% of the total project budget including the rig investment. The Group has contractually committed 75.8% of the total budget of the project, although
related amounts are not reflected in the 2005 annual statements.
Note 22 – Contingencies
Navis Shares
In December the final tranche of the Navis ASA share purchase in 2000-2001 was settled by a final assessment of Borgarting lagmannsrett (a Norwegian
Court of Appeals) in the dispute between the Company and an assignee to the position of a previous minority shareholder in Navis ASA who did not accept
the offer related to the compulsory redemption made in February 2001. The minority shareholder claimed during the hearings that approximately NOK 21, - per
share would be a fair price, whilst Borgarting lagmannsrett arrived at a redemption price of NOK 14.50 per share. The minority shareholder represented 8
848 140 shares, corresponding to 6.6% of the total shares in Navis ASA.
After having commenced proceedings in the redemption case the previous minority shareholder in 2003 commenced separate proceedings against the
Company seeking damages on the basis of the Company’s mandatory bid for Navis shares in November 2000. In December 2005 the Oslo Tingrett (a Nor-
wegian City Court) ruled against these claims following which the plaintiff in January 2006 appealed the ruling.
It is the Group’s opinion, based on legal advice, that there is no support for this claim and no provision has been recognized in these financial statements
as the Group believes the probability of additional loss is remote.

Fred. Olsen Energy ASA - Annual Report 2005��
��
Fred. Olsen Energy ASA - Annual Report 2005
Fred. Olsen Energy – Group
Notes
Note 23 – Share based payments
In 1998, the Group’s shareholders resolved to grant the Board of Directors authority to issue up to 3 million shares to be used for an employee incentive
compensation plan designed to align the interest of management with those of its shareholders. All share based payment awards are settled by the physi-
cal delivery of shares. The Group has elected to use the voluntary exemption available for share based payment transactions from the general requirement
for retrospective application of IFRS’s. The recognition and measurement requirements of IFRS2: Share-based Payment is therefore not applied retrospec-
tively to equity instruments that were granted on or before 7 November 2002. The fair value of options granted after the adoption of IFRS2: Share-based
Payment, determined using a Black-Sholes option pricing model, has been insignificant taking into account the terms and conditions upon which the
options were granted. The stock option plan was discontinued in 2004, and no grants have been made under the plan in 2004 or 2005. All options carry an
exercise price which was determined by the market price of the stock price on the date of grant. A summary of options granted is as follows:
Stock options plans 2003 2002 2001 2000 Total
Options awarded 141 000 193 000 167 500 102 500 604 000
Outstanding as of 31.12.05 45 336 35 000 0 0 80 336
Strike price 7.90 40.00 85.00 61.00
Expiry date 05.02.2007 02.02.2006 01.03.2005 Expired
Under the terms of the 2000 plan, the options are not exercisable until one year after grant at which point one third of the options become exercisable and
expire in each of the subsequent 3 years. As of February 2004, all remaining shares expired in accordance with the terms of the 2000 plan.
Under the terms of the 2003, 2002 and 2001 plans, the options are not exercisable until one year after grant at which point one third of the options become
exercisable in each of the subsequent years and expire on the 4th anniversary from the date of grant.
During 2005, 35 998, 55 333 and 102 500 options were exercised by management in accordance with the terms of the 2003, 2002 and 2001 plans respec-
tively. During 2004, 41 667, 38 334 and 22 500 options were exercised by management in accordance with the terms of the plans.
The number and weighted average exercise prices of share options are as follows:
Weighted Weighted
average Number average Number of
exercise prices of options exercise prices options
2005 2005 2004 2004
Outstanding at the beginning of the period 46.55 279 501 38.22 497 832
Forfeited during the period 7.90 5 334 40.79 54 998
Exercised during the period 57.83 193 831 36.83 102 501
Expired during the period - 61.00 60 832
Oustanding at the end of period 21.89 80 336 46.55 279 501
Exercisable at the end of the period 40.00 45 000 73.19 133 833
The weighted average share price at the date of exercise was NOK 97.20 and NOK 60.22 during 2005 and 2004, respectively.
The company does not have any agreement with its senior corporate management that would result in any benefit accruing to them upon termination
of employment.
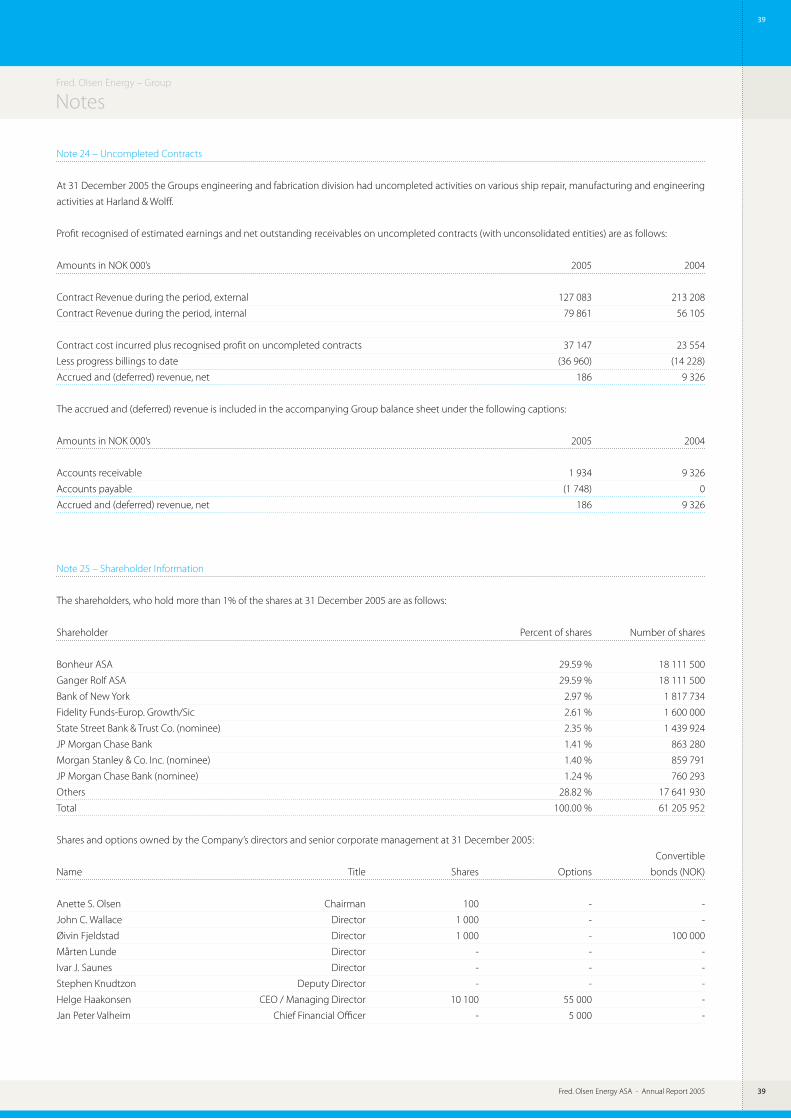
Fred. Olsen Energy ASA - Annual Report 2005 ��
��
Fred. Olsen Energy ASA - Annual Report 2005
NotesFred. Olsen Energy – Group
Note 24 – Uncompleted Contracts
At 31 December 2005 the Groups engineering and fabrication division had uncompleted activities on various ship repair, manufacturing and engineering
activities at Harland & Wolff.
Profit recognised of estimated earnings and net outstanding receivables on uncompleted contracts (with unconsolidated entities) are as follows:
Amounts in NOK 000’s 2005 2004
Contract Revenue during the period, external 127 083 213 208
Contract Revenue during the period, internal 79 861 56 105
Contract cost incurred plus recognised profit on uncompleted contracts 37 147 23 554
Less progress billings to date (36 960) (14 228)
Accrued and (deferred) revenue, net 186 9 326
The accrued and (deferred) revenue is included in the accompanying Group balance sheet under the following captions:
Amounts in NOK 000’s 2005 2004
Accounts receivable 1 934 9 326
Accounts payable (1 748) 0
Accrued and (deferred) revenue, net 186 9 326
Note 25 – Shareholder Information
The shareholders, who hold more than 1% of the shares at 31 December 2005 are as follows:
Shareholder Percent of shares Number of shares
Bonheur ASA 29.59 % 18 111 500
Ganger Rolf ASA 29.59 % 18 111 500
Bank of New York 2.97 % 1 817 734
Fidelity Funds-Europ. Growth/Sic 2.61 % 1 600 000
State Street Bank & Trust Co. (nominee) 2.35 % 1 439 924
JP Morgan Chase Bank 1.41 % 863 280
Morgan Stanley & Co. Inc. (nominee) 1.40 % 859 791
JP Morgan Chase Bank (nominee) 1.24 % 760 293
Others 28.82 % 17 641 930
Total 100.00 % 61 205 952
Shares and options owned by the Company’s directors and senior corporate management at 31 December 2005:
Convertible
Name Title Shares Options bonds (NOK)
Anette S. Olsen Chairman 100 - -
John C. Wallace Director 1 000 - -
Øivin Fjeldstad Director 1 000 - 100 000
Mårten Lunde Director - - -
Ivar J. Saunes Director - - -
Stephen Knudtzon Deputy Director - - -
Helge Haakonsen CEO / Managing Director 10 100 55 000 -
Jan Peter Valheim Chief Financial Officer - 5 000 -
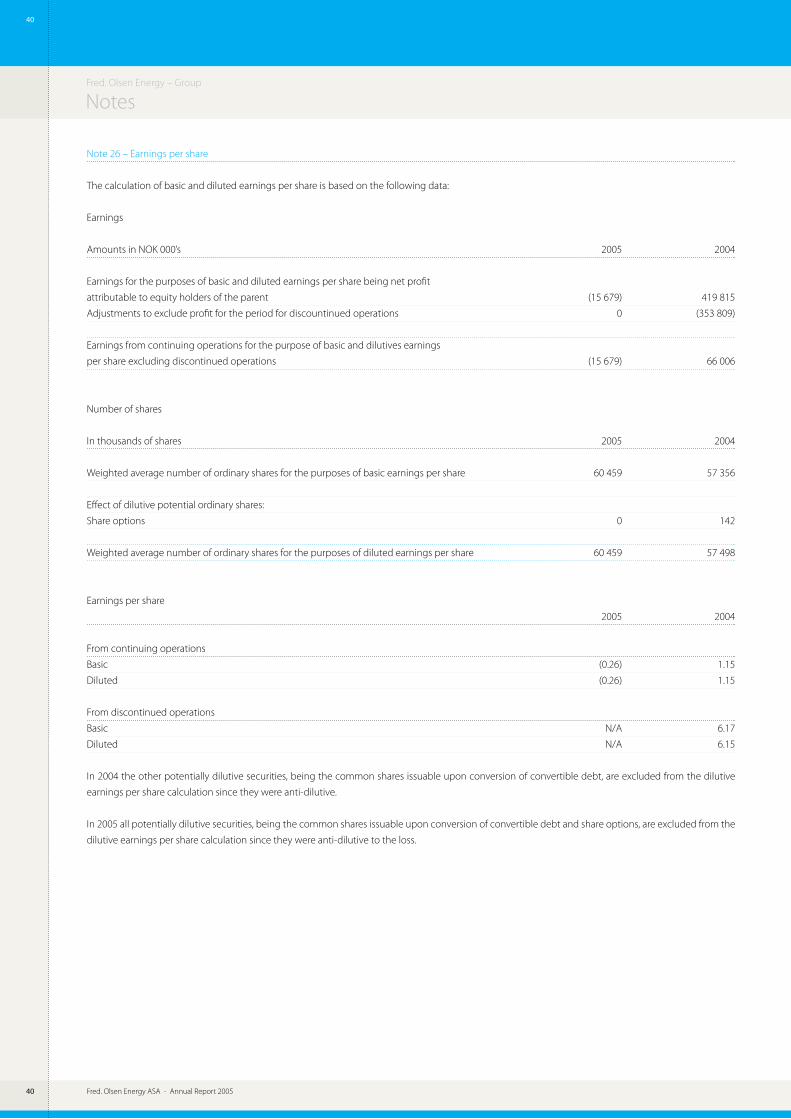
Fred. Olsen Energy ASA - Annual Report 200540
40
Fred. Olsen Energy ASA - Annual Report 2005
Fred. Olsen Energy – Group
Notes
Note 26 – Earnings per share
The calculation of basic and diluted earnings per share is based on the following data:
Earnings
Amounts in NOK 000’s 2005 2004
Earnings for the purposes of basic and diluted earnings per share being net profit
attributable to equity holders of the parent (15 679) 419 815
Adjustments to exclude profit for the period for discountinued operations 0 (353 809)
Earnings from continuing operations for the purpose of basic and dilutives earnings
per share excluding discontinued operations (15 679) 66 006
Number of shares
In thousands of shares 2005 2004
Weighted average number of ordinary shares for the purposes of basic earnings per share 60 459 57 356
Effect of dilutive potential ordinary shares:
Share options 0 142
Weighted average number of ordinary shares for the purposes of diluted earnings per share 60 459 57 498
Earnings per share
2005 2004
From continuing operations
Basic (0.26) 1.15
Diluted (0.26) 1.15
From discontinued operations
Basic N/A 6.17
Diluted N/A 6.15
In 2004 the other potentially dilutive securities, being the common shares issuable upon conversion of convertible debt, are excluded from the dilutive
earnings per share calculation since they were anti-dilutive.
In 2005 all potentially dilutive securities, being the common shares issuable upon conversion of convertible debt and share options, are excluded from the
dilutive earnings per share calculation since they were anti-dilutive to the loss.

Fred. Olsen Energy ASA - Annual Report 2005 41
41
Fred. Olsen Energy ASA - Annual Report 2005
NotesFred. Olsen Energy – Group
As stated in note 1, these are the Group’s first
consolidated financial statements prepared in
accordance with IFRSs.
The accounting policies set out in note 1 have
been applied in preparing the financial state-
ments for the year ended 31 December 2005,
the comparative information presented in these
financial statements for the year ended 31 De-
cember 2004 and in the preparation of an open-
ing balance sheet at 1 January 2004 (the Group’s
date of transition).
In preparing its opening IFRS balance sheet, the
Group has adjusted amounts reported previ-
ously in financial statements prepared in accord-
ance with its old basis of accounting (Norwegian
GAAP). An explanation of how the transition
from Norwegian GAAP to IFRS has affected the
Group’s financial position, financial performance
and cash flows is set out in the following tables
and the notes that accompany the tables.
a) Under IFRS 1: First-time Adoption of Interna-
tional Financial Reporting Standards, the Group
has elected to recognise the cumulative actuarial
gains and losses for defined benefit plans at the
date of transition. This effect is an increase in
employee benefit liabilities accrued in the con-
solidated balance sheet at 1 January 2004 of NOK
290 989 and reduced salaries and other person-
nel costs of NOK 4 490 for the year ended 31 De-
cember.
b) In the past, the Group has measured its rigs
and drillship at historical costs and depreciated
the units over their economic useful lives. Under
IFRS 1, the Group has elected to use the fair mar-
ket value (brokers’ valuation) of the units at the
date of transition as deemed cost. The brokers’
valuation reflects expected sales price in a trans-
action between a willing buyer and a willing
seller. These independent valuations are usu-
ally used within offshore- and shipping. The ag-
gregated fair value used as of 1 January is NOK
5 159 775. The effect is a reduction in property,
plant and equipment as of 1 January 2004 of
NOK 2 698 819 and a reduction of depreciation
expense of NOK 188 300 for the year ended 31
December 2004.
c) IFRS 3 prohibits the amortisation of goodwill
acquired in a business combination an instead
requires the goodwill to be tested for impairment
annually. The effect is a reduced amortisation of
NOK 8 146 for the year ended 31 December 2004.
The impairment test at 1 January and 31 Decem-
ber 2004 showed that there was no need for
impairment.
d) Currency swap agreements entered into
in 2004 are classified as financial assets at fair
value through profit and loss and resulted in an
increase in financial income of NOK 31 745 for
the year ended 31 December 2004 and a corre-
sponding increase in other investments as of 31
December 2004. The fair value as at 31 Decem-
ber 2004 was NOK 127 717 while the nominal
value was NOK 95.973.
e) Borrowing costs have previously been amor-
tised on a straight line basis. According to IAS 39
these costs should be amortised using the effec-
tive interest rate method. The effect is a reduc-
tion in other investments of NOK 39 006 as of 1
January 2004, a decrease in interest-bearing debt
and borrowings of NOK 22 663 as of 1 January
2004 and a reduction in financial expense of NOK
15 018 for the year ended 31 December 2004.
Financial instruments not qualifying for hedge ac-
counting under IAS 39 are classified as financial
instruments measured at fair value through profit
and loss as of 1 January 2004. This resulted in an
increase in other non-current liabilities of NOK
81 249 as of 1 January and a reduction of net fi-
nancing costs by NOK 81 249 for the year ended
31 December 2004.
Convertible bonds issued in 2004 are accounted
for as compound instrument and includes both
liability and equity components. The equity com-
ponent of the convertible notes is calculated as
the excess of the issue proceeds over the present
value of the future interest and principal pay-
ments, discounted at the market rate of interest
applicable to similar instruments without a con-
version option. This was calculated NOK 362 616
as liability and NOK 72 384 as equity at the initial
recognition. The interest expense recognised in
the income statement then reflects the market
rate for notes without conversion resulted in an
increase in financial expense of NOK 9 224 for the
year ended 31 December 2004.
f ) Fred.Olsen Drilling AS has previously been
taxed under the Norwegian Tonnage Tax Regime
(NTTR). The rules of the NTTR provide qualifying
entities, subject to certain conditions, deferral of
corporate income taxes and alternatively levy a
tax based on the net registered tonnage of ap-
plicable vessels. As a result, the calculation of
deferred taxes in prior years included untaxed
profits from entities taxed under the Tonnage Tax
Rules. Due to the estimated time-span until these
profits will be distributed as dividends and thus
become taxable, the related deferred tax liabilities
have been discounted by the Group using a tax
rate of 5%. Under IFRS the full tax at 28% should
be accrued for when there is a legal liability to
pay dividends to shareholders of the Company.
Accordingly, the Group has used 0% until such
dividends are declared. This resulted in a decrease
in deferred tax liability of NOK 76 556 as of 1 Janu-
ary 2004. During 2004, the Group decided not to
re-enter the NTTR and accounted for 28% tax of
the temporary differences related to its rigs and
drillship, resulting in an increase in income tax for
the year ended 31 December 2004.
Deferred tax assets related to pension adjust-
ments as of 1 January 2004 amounts to NOK
5 800. Deferred tax related to adjustments on
financial instruments as of 1 January amounts
to NOK 27 308.
g) Other exemptions from full retrospective ap-
plication elected by the Group
I. Business combinations exemption
The Group has applied the business combina-
tions exemption in IFRS 1. It has not restated
business combinations that took place prior to
the 1 January 2004 transition date.
II. Share-based payment transaction exemption
The Group has elected to apply the share-
based payment exemption. It applied IFRS 2
from 1 January 2004 to those options that were
issued after 7 November 2002 but that have
not vested by 1 January 2005. See note 24.
III. Cumulative translation differences exemption
The Group has elected to set the previously ac-
cumulated cumulative translation to zero at 1
January 2004. This exemption has been applied
to all subsidiaries in accordance with IFRS 1.
h) There is no material change in net cash from
operating, investing or financing activities related
to the transition to IFRSs.
Note 27 – Explanation of transition to IFRSs
...continued

Fred. Olsen Energy ASA - Annual Report 200542
42
Fred. Olsen Energy ASA - Annual Report 2005
Fred. Olsen Energy – Group
Notes
i) Summary of equity adjustments:
Amounts in NOK 000’s Note 1 January 2004 31 December 2004
Equity NGAAP 4 978 886 4 940 548
Pension liabilities a (290 989) (289 923)
Property plant and equipment b (2 698 819) (2 510 558)
Intangible assets 0 8 146
Borrowing cost e (16 343) (1 325)
Financial instruments e (81 249) 31 745
Convertible bonds e 0 63 160
Tax f 109 664 12
Equity IFRS 2 001 150 2 241 805
Reconciliation of the consolidated income statement for 2004
Effect of
Continuing operations NGAAP transition to IFRS IFRS
Amounts in NOK 000’s Note Year ended 31 December 2004
Revenues 2 342 834 0 2 342 834
Materials (129 624) 0 (129 624)
Salaries and other personnel costs a (640 419) 4 490 (635 929)
Other operating expenses (1 009 230) 0 (1 009 230)
Operating profit before depreciation, amortisation,
other items and financing costs 563 561 4 490 568 051
Reversal of restructuring charge 20 771 0 20 771
Depreciation and amortisation b,c (707 862) 196 446 (511 416)
Operating profit/(loss) before financing costs (123 530) 200 936 77 406
Financial income 352 761 61 241 414 002
Financial expense (435 573) 57 547 (378 026)
Net financing costs d,e (82 812) 118 788 35 976
Profit/(loss) before tax and gain on discontinued operation (206 342) 319 724 113 382
Income tax (expense)/income f 42 011 (89 387) (47 376)
Profit/(loss) after tax before gain on discontinued operation (164 331) 230 337 66 006
Gain on sale of discontinued operation 0 0 0
Profit/(loss) for the period (164 331) 230 337 66 006
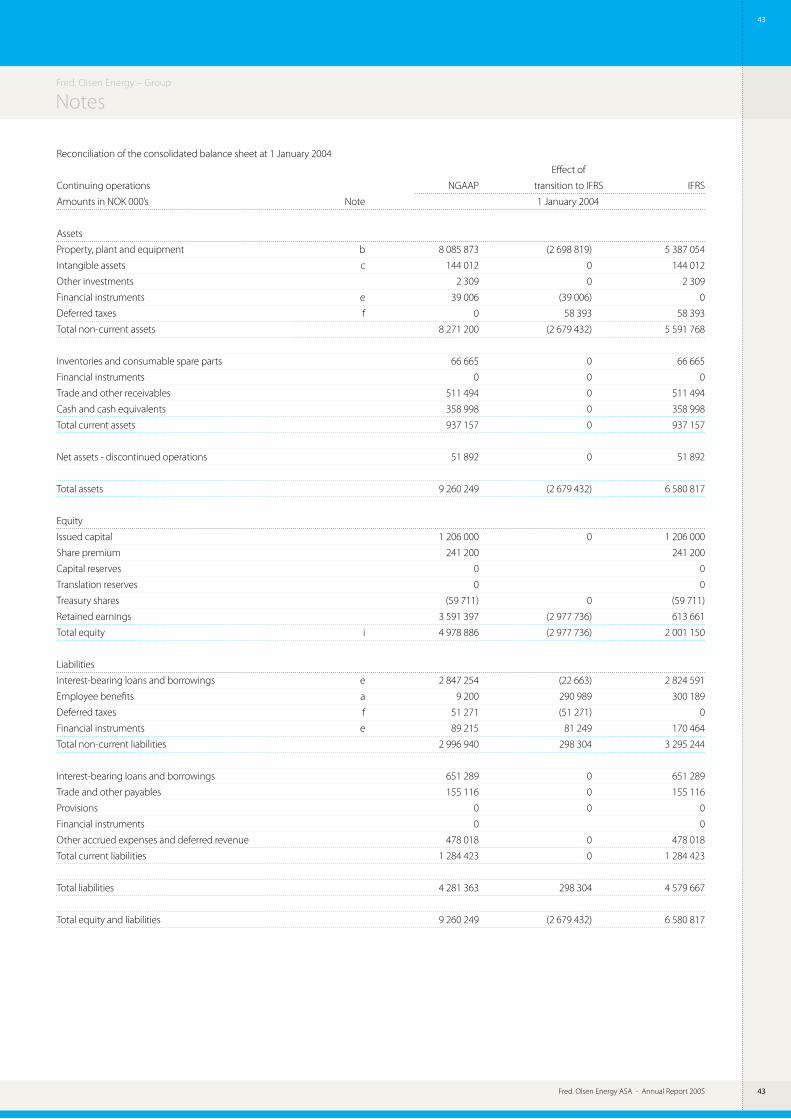
Fred. Olsen Energy ASA - Annual Report 2005 4�
4�
Fred. Olsen Energy ASA - Annual Report 2005
NotesFred. Olsen Energy – Group
Reconciliation of the consolidated balance sheet at 1 January 2004
Effect of
Continuing operations NGAAP transition to IFRS IFRS
Amounts in NOK 000’s Note 1 January 2004
Assets
Property, plant and equipment b 8 085 873 (2 698 819) 5 387 054
Intangible assets c 144 012 0 144 012
Other investments 2 309 0 2 309
Financial instruments e 39 006 (39 006) 0
Deferred taxes f 0 58 393 58 393
Total non-current assets 8 271 200 (2 679 432) 5 591 768
Inventories and consumable spare parts 66 665 0 66 665
Financial instruments 0 0 0
Trade and other receivables 511 494 0 511 494
Cash and cash equivalents 358 998 0 358 998
Total current assets 937 157 0 937 157
Net assets - discontinued operations 51 892 0 51 892
Total assets 9 260 249 (2 679 432) 6 580 817
Equity
Issued capital 1 206 000 0 1 206 000
Share premium 241 200 241 200
Capital reserves 0 0
Translation reserves 0 0
Treasury shares (59 711) 0 (59 711)
Retained earnings 3 591 397 (2 977 736) 613 661
Total equity i 4 978 886 (2 977 736) 2 001 150
Liabilities
Interest-bearing loans and borrowings e 2 847 254 (22 663) 2 824 591
Employee benefits a 9 200 290 989 300 189
Deferred taxes f 51 271 (51 271) 0
Financial instruments e 89 215 81 249 170 464
Total non-current liabilities 2 996 940 298 304 3 295 244
Interest-bearing loans and borrowings 651 289 0 651 289
Trade and other payables 155 116 0 155 116
Provisions 0 0 0
Financial instruments 0 0
Other accrued expenses and deferred revenue 478 018 0 478 018
Total current liabilities 1 284 423 0 1 284 423
Total liabilities 4 281 363 298 304 4 579 667
Total equity and liabilities 9 260 249 (2 679 432) 6 580 817
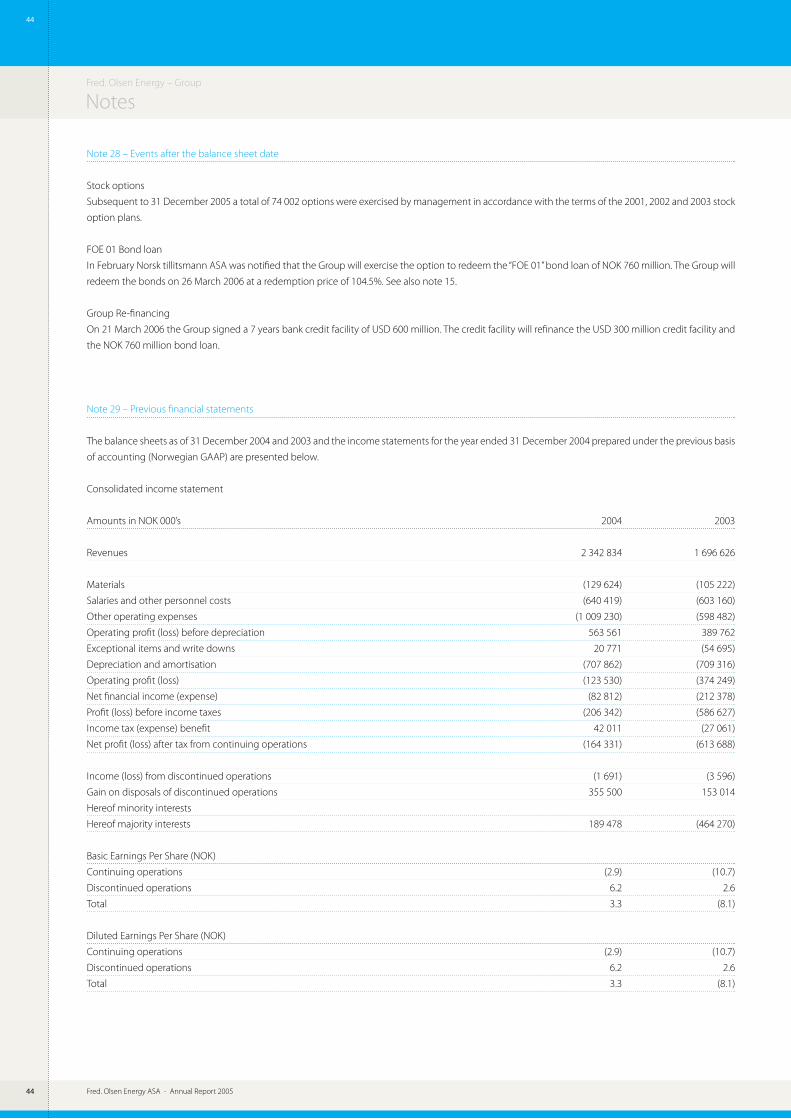
Fred. Olsen Energy ASA - Annual Report 200544
44
Fred. Olsen Energy ASA - Annual Report 2005
Fred. Olsen Energy – Group
Notes
Note 28 – Events after the balance sheet date
Stock options
Subsequent to 31 December 2005 a total of 74 002 options were exercised by management in accordance with the terms of the 2001, 2002 and 2003 stock
option plans.
FOE 01 Bond loan
In February Norsk tillitsmann ASA was notified that the Group will exercise the option to redeem the “FOE 01” bond loan of NOK 760 million. The Group will
redeem the bonds on 26 March 2006 at a redemption price of 104.5%. See also note 15.
Group Re-financing
On 21 March 2006 the Group signed a 7 years bank credit facility of USD 600 million. The credit facility will refinance the USD 300 million credit facility and
the NOK 760 million bond loan.
Note 29 – Previous financial statements
The balance sheets as of 31 December 2004 and 2003 and the income statements for the year ended 31 December 2004 prepared under the previous basis
of accounting (Norwegian GAAP) are presented below.
Consolidated income statement
Amounts in NOK 000’s 2004 2003
Revenues 2 342 834 1 696 626
Materials (129 624) (105 222)
Salaries and other personnel costs (640 419) (603 160)
Other operating expenses (1 009 230) (598 482)
Operating profit (loss) before depreciation 563 561 389 762
Exceptional items and write downs 20 771 (54 695)
Depreciation and amortisation (707 862) (709 316)
Operating profit (loss) (123 530) (374 249)
Net financial income (expense) (82 812) (212 378)
Profit (loss) before income taxes (206 342) (586 627)
Income tax (expense) benefit 42 011 (27 061)
Net profit (loss) after tax from continuing operations (164 331) (613 688)
Income (loss) from discontinued operations (1 691) (3 596)
Gain on disposals of discontinued operations 355 500 153 014
Hereof minority interests
Hereof majority interests 189 478 (464 270)
Basic Earnings Per Share (NOK)
Continuing operations (2.9) (10.7)
Discontinued operations 6.2 2.6
Total 3.3 (8.1)
Diluted Earnings Per Share (NOK)
Continuing operations (2.9) (10.7)
Discontinued operations 6.2 2.6
Total 3.3 (8.1)

Fred. Olsen Energy ASA - Annual Report 2005 4�
4�
Fred. Olsen Energy ASA - Annual Report 2005
NotesFred. Olsen Energy – Group
Consolidated balance sheet - As at 31 December
Amounts in NOK 000’s 2004 2003
Assets
Long term assets:
Deferred tax benefit 1 826 -
Goodwill and other intangible assets 111 454 144 012
Rigs 5 204 692 5 558 277
Deepwater drillship 2 003 837 2 300 317
Machinery and equipment 195 044 201 251
Plant, buildings and land 37 480 26 028
Investments in subsidiary companies - -
Other long-term assets 131 081 41 315
Total long-term assets 7 685 414 8 271 200
Current assets:
Inventories and consumable spare parts 129 801 66 665
Accounts receivable 396 718 449 406
Other receivables 132 438 62 088
Cash and cash equivalents 598 675 358 998
Total current assets 1 257 632 937 157
Net Assets - discontinued operations - 51 892
Total assets 8 943 046 9 260 249
Liabilities and Equity
Equity:
Share Capital 1 206 022 1 206 000
Treasury shares (58 028) (59 711)
Share Premium Reserve 241 200 241 200
Other equity 3 551 354 3 591 397
Minority interests - -
Total equity 4 940 548 4 978 886
Provisions:
Deferred tax liabilities - 51 271
Pension Liabilities 13 209 9 200
Total Provisions 13 209 60 471
Long-term liabilities:
Long-term debt, net of current portion 3 010 681 2 847 254
Other long-term liabilities 59 149 89 215
Total long-term liabilities 3 069 830 2 936 469
Current liabilities:
Accounts payable 156 982 155 116
Short-term and current portion of long-term debt 249 260 651 289
Other accrued expenses and deferred revenue 513 217 478 018
Total current liabilities 919 459 1 284 423
Total liabilities and equity 8 943 046 9 260 249
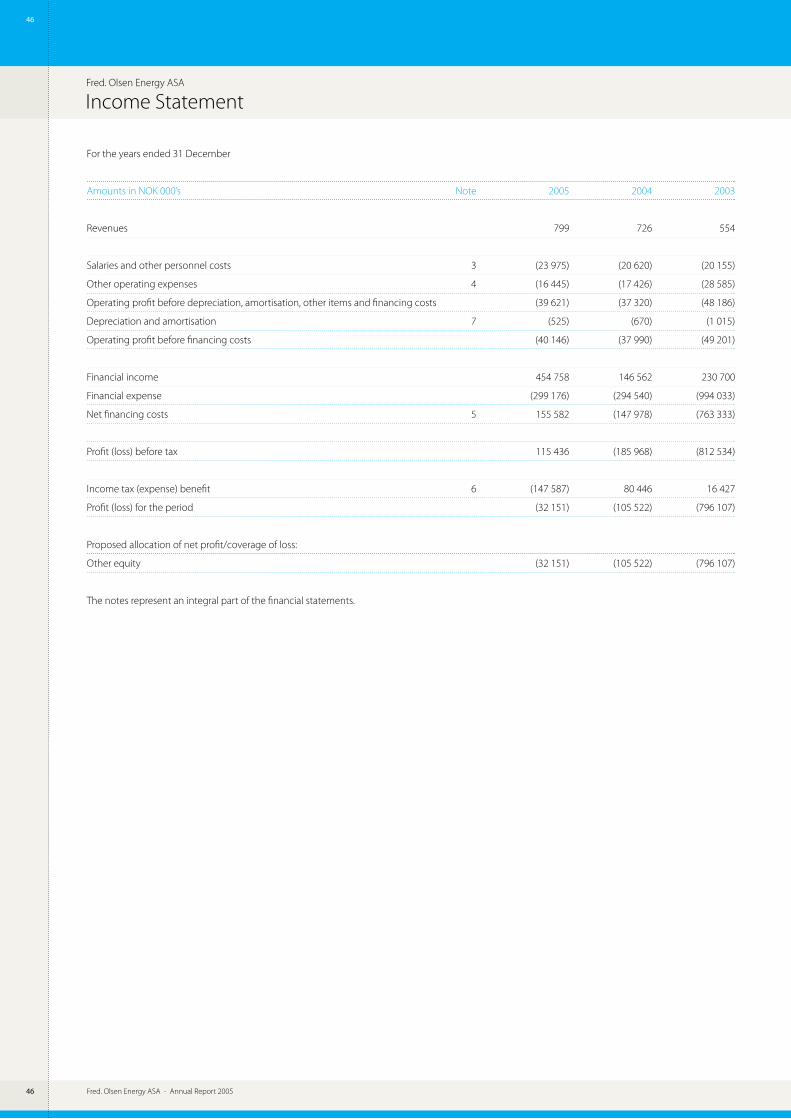
Fred. Olsen Energy ASA - Annual Report 20054�
4�
Fred. Olsen Energy ASA - Annual Report 2005
Income StatementFred. Olsen Energy ASA
For the years ended 31 December
Amounts in NOK 000’s Note 2005 2004 2003
Revenues 799 726 554
Salaries and other personnel costs 3 (23 975) (20 620) (20 155)
Other operating expenses 4 (16 445) (17 426) (28 585)
Operating profit before depreciation, amortisation, other items and financing costs (39 621) (37 320) (48 186)
Depreciation and amortisation 7 (525) (670) (1 015)
Operating profit before financing costs (40 146) (37 990) (49 201)
Financial income 454 758 146 562 230 700
Financial expense (299 176) (294 540) (994 033)
Net financing costs 5 155 582 (147 978) (763 333)
Profit (loss) before tax 115 436 (185 968) (812 534)
Income tax (expense) benefit 6 (147 587) 80 446 16 427
Profit (loss) for the period (32 151) (105 522) (796 107)
Proposed allocation of net profit/coverage of loss:
Other equity (32 151) (105 522) (796 107)
The notes represent an integral part of the financial statements.
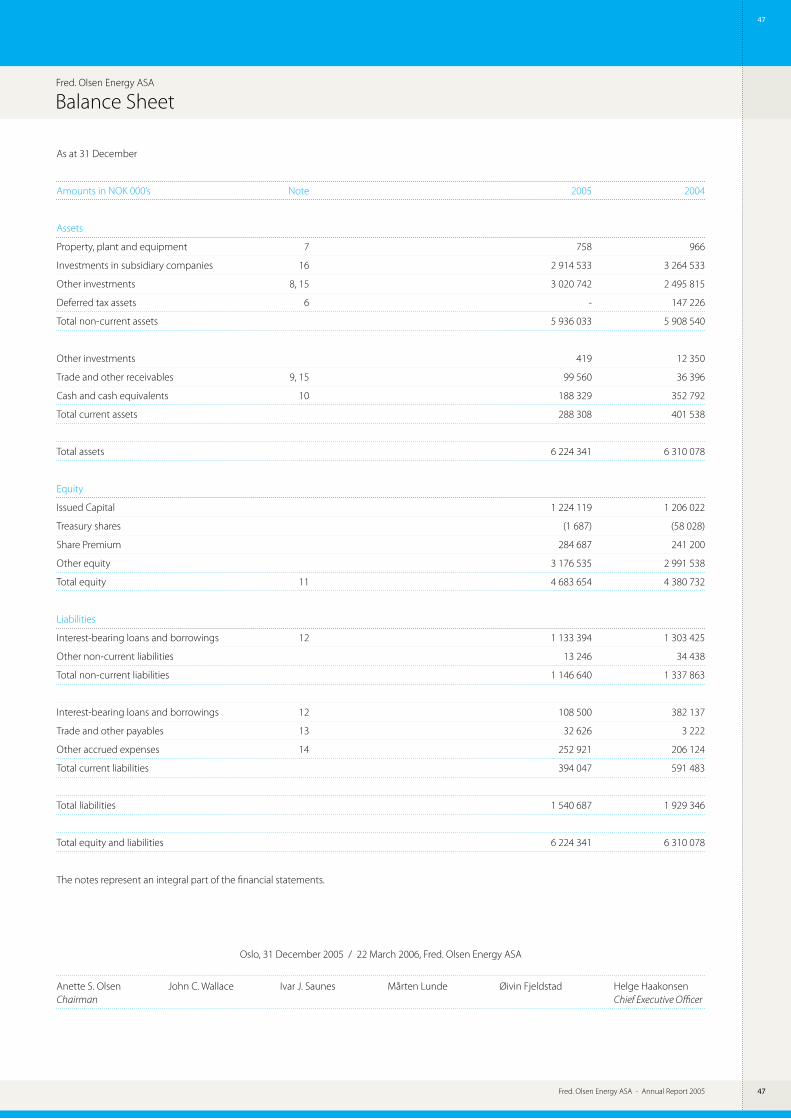
Fred. Olsen Energy ASA - Annual Report 2005 4�
4�
Fred. Olsen Energy ASA - Annual Report 2005
Balance SheetFred. Olsen Energy ASA
As at 31 December
Amounts in NOK 000’s Note 2005 2004
Assets
Property, plant and equipment 7 758 966
Investments in subsidiary companies 16 2 914 533 3 264 533
Other investments 8, 15 3 020 742 2 495 815
Deferred tax assets 6 - 147 226
Total non-current assets 5 936 033 5 908 540
Other investments 419 12 350
Trade and other receivables 9, 15 99 560 36 396
Cash and cash equivalents 10 188 329 352 792
Total current assets 288 308 401 538
Total assets 6 224 341 6 310 078
Equity
Issued Capital 1 224 119 1 206 022
Treasury shares (1 687) (58 028)
Share Premium 284 687 241 200
Other equity 3 176 535 2 991 538
Total equity 11 4 683 654 4 380 732
Liabilities
Interest-bearing loans and borrowings 12 1 133 394 1 303 425
Other non-current liabilities 13 246 34 438
Total non-current liabilities 1 146 640 1 337 863
Interest-bearing loans and borrowings 12 108 500 382 137
Trade and other payables 13 32 626 3 222
Other accrued expenses 14 252 921 206 124
Total current liabilities 394 047 591 483
Total liabilities 1 540 687 1 929 346
Total equity and liabilities 6 224 341 6 310 078
The notes represent an integral part of the financial statements.
Oslo, 31 December 2005 / 22 March 2006, Fred. Olsen Energy ASA
Anette S. Olsen John C. Wallace Ivar J. Saunes Mårten Lunde Øivin Fjeldstad Helge HaakonsenChairman Chief Executive Officer
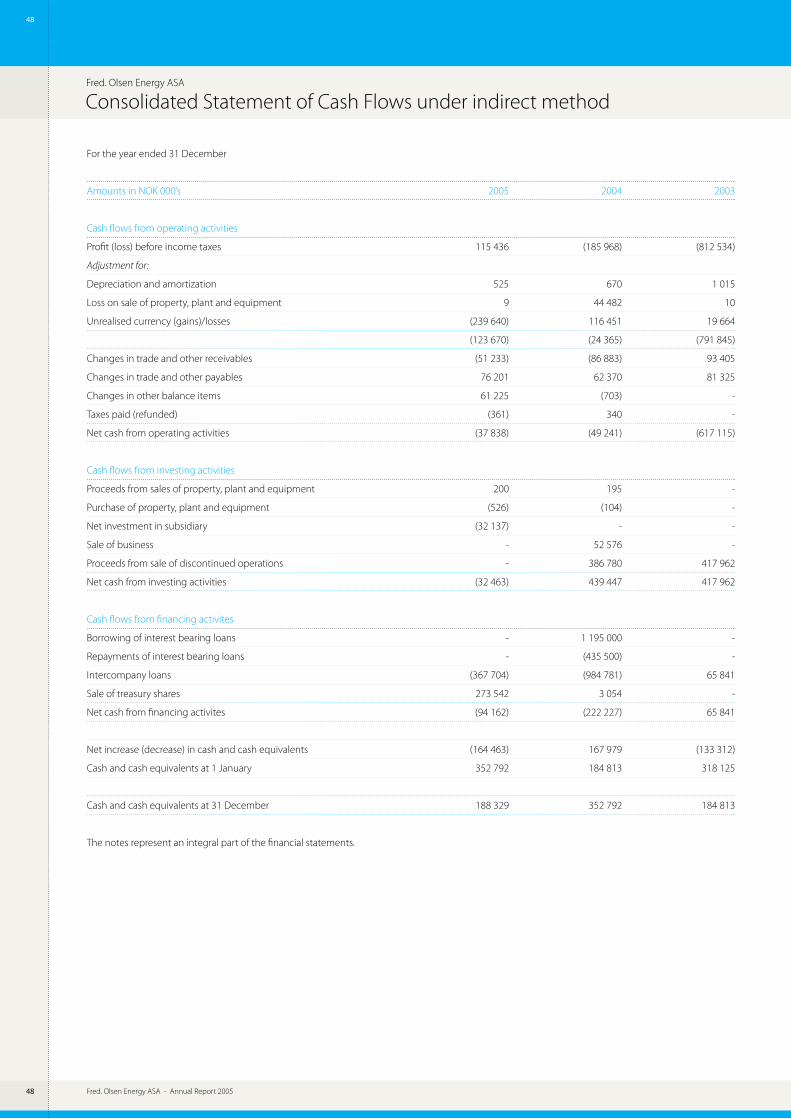
Fred. Olsen Energy ASA - Annual Report 20054�
4�
Fred. Olsen Energy ASA - Annual Report 2005
Fred. Olsen Energy ASA
Consolidated Statement of Cash Flows under indirect method
For the year ended 31 December
Amounts in NOK 000’s 2005 2004 2003
Cash flows from operating activities
Profit (loss) before income taxes 115 436 (185 968) (812 534)
Adjustment for:
Depreciation and amortization 525 670 1 015
Loss on sale of property, plant and equipment 9 44 482 10
Unrealised currency (gains)/losses (239 640) 116 451 19 664
(123 670) (24 365) (791 845)
Changes in trade and other receivables (51 233) (86 883) 93 405
Changes in trade and other payables 76 201 62 370 81 325
Changes in other balance items 61 225 (703) -
Taxes paid (refunded) (361) 340 -
Net cash from operating activities (37 838) (49 241) (617 115)
Cash flows from investing activities
Proceeds from sales of property, plant and equipment 200 195 -
Purchase of property, plant and equipment (526) (104) -
Net investment in subsidiary (32 137) - -
Sale of business - 52 576 -
Proceeds from sale of discontinued operations - 386 780 417 962
Net cash from investing activities (32 463) 439 447 417 962
Cash flows from financing activites
Borrowing of interest bearing loans - 1 195 000 -
Repayments of interest bearing loans - (435 500) -
Intercompany loans (367 704) (984 781) 65 841
Sale of treasury shares 273 542 3 054 -
Net cash from financing activites (94 162) (222 227) 65 841
Net increase (decrease) in cash and cash equivalents (164 463) 167 979 (133 312)
Cash and cash equivalents at 1 January 352 792 184 813 318 125
Cash and cash equivalents at 31 December 188 329 352 792 184 813
The notes represent an integral part of the financial statements.

Fred. Olsen Energy ASA - Annual Report 2005 4�
4�
Fred. Olsen Energy ASA - Annual Report 2005
Notes to the Financial StatementsFred. Olsen Energy ASA
Note 1 – Basis of Presentation
Fred. Olsen Energy ASA (the Company) is domi-
ciled in Norway. The financial statements of the
Company have been prepared in accordance
with generally accepted accounting principles
in Norway.
The financial statements which have been pre-
pared by the Company’s Board of Directors and
management should be read in conjunction
with the report of the board of directors and
the audit report. The financial statements have
been prepared in accordance with the require-
ments of the Norwegian Accounting Act 1998.
The notes and accounting policies refer to the
Company’s financial statements unless specified
otherwise.
Note 2 – Summary of Significant Accounting Policies
Pool Income/Expense
Certain rig owning subsidiaries have entered
into a five-rig pool agreement with the owner
of the Bulford Dolphin, where net earnings be-
fore depreciation are equalised amongst the rig
owners. The Company is established as the pool
manager and is receiving a management fee.
Foreign Currency
Gains and losses on transactions denominated
in foreign currencies are included in financial in-
come (expense). Assets and liabilities are trans-
lated at the exchange rate on the balance sheet
date when they are not hedged or covered by
forward contracts.
Property, plant and equipment
Equipment are recorded at cost and are depre-
ciated on a straigt-line basis over 3-5 years.
Investments in subsidiaries and associates
Investments in subsidiaries are accounted for
using the cost method in the Company’s ac-
counts. The investments are valued at cost less
impairment losses. Write downs to fair value are
recognised when the impairment is considered
not to be temporary.
Classification and valuation of other
balance-sheet items
Current assets and current liabilities include
items due within one year. The rest is classified
as non-current assets or non-current liabilities.
Current assets are valued at the lowest of cost
and fair value. Current liabilities are valued at
nominal value at the time of recognition.
Cash and Cash Equivalents
Cash and cash equivalents includes cash and
bank deposits that are readily convertible to
cash.
Presentation
The Company has in 2005 adapted to a similar
presentation form as the Group accounts. The
impact of this has been to revise the titles of cer-
tain accounts and to present financial income
and financial expense seperately on the face of
the income statement, rather than net, although
this information was previously presented in the
footnotes. There have been no other material re-
classifications or items effecting consistency.
Long-Lived Assets
The carrying amount of the Company’s assets,
other than deferred tax assets, are reviewed at
each balance sheet date to determine whether
there is any indication of impairment. If any
such indication exists, each asset’s recoverable
amount is estimated. An impairment loss is rec-
ognised whenever the carrying amount of an
asset exceeds its recoverable amount. The recov-
erable amount is determined by the higher of
value or estimated future discounted cash flows.
In estimating future discounted cash flows, cer-
tain assumptions are made concerning discount
rates which vary depending on the asset, terms
of relevent contracts, foreign currencies, life of
the assets and market growth. Impairment loss-
es are recognised in the income statement.
Financial Instruments
Interest derivatives
The Company uses derivative financial instru-
ments to manage the Group’s exposure to for-
eign exchange and interest rate risks arising from
operational, financing and investment activities.
In accordance with its treasury policy, the Com-
pany does not hold or issue derivative financial
instruments for trading purposes. However, de-
rivative that do not qualify for hedge accounting
are accounted for as trading instruments. Gains
on interest derivatives agreements are recog-
nised throughout the term of the related agree-
ment as payments are settled. Unrealised gains
are deferred until contract amounts are settled.
Unrealised losses on interest rate derivatives are
recognised currently.
Foreign currency risk
The Company has entered into currency swaps
totalling NOK 760 million of debt denominated
in NOK into USD in 2004. The currency swaps
are recorded at the lowest of nominal value and
fair market value.
Forward exchange contracts
The Company enters into forward currency
contracts throughout the year to reduce the
currency exposure on the day-rate and engi-
neering and fabrication income and expenses
in Great British pounds (GBP) and United States
dollars (USD). Unrealised gain/losses on foreign
exchange contracts used to offset the effect of
anticipated transactions are normally marked to
market and recognised as financial income or
expenses.
Income Taxes
Deferred tax assets and liabilities are recog-
nised for the future tax consequences attrib-
utable to differences between the carrying
amounts of existing assets and liabilities in the
financial statements and their respective tax
bases. Deferred tax assets and liabilities are
measured using enacted tax rates as they ap-
ply to taxable income in the years in which the
differences are expected to be recovered or
settled. Deferred tax assets are recognised in the
balance sheet to the extent that is more likely
than not that benefits will be recognised.
...continued

Fred. Olsen Energy ASA - Annual Report 2005�0
�0
Fred. Olsen Energy ASA - Annual Report 2005
Notes NotesFred. Olsen Energy ASA Fred. Olsen Energy ASA
Note 3 – Salaries and Other Personnel costs
Amounts in NOK 000’s 2005 2004 2003
Salary 14 961 12 917 12 959
Social security costs 2 977 2 463 2 373
Pension costs 3 623 3 284 3 331
Other 2 414 1 956 1 492
Total 23 975 20 620 20 155
Average number of employees 10 12 14
Salaries and other personnel expenses to the Chief Executive Officer (CEO), Board of Directors and Senior management (Chief Financial Officer) for the
Company are as follows:
Chief Executive Officer
Amounts in NOK 000’s 2005 2004 2003
Salary/Remuneration 2 351 2 276 2 028
Pension costs 1 999 1 461 2 024
Other 139 533 122
Total 4 489 4 270 4 174
Board of directors
Amounts in NOK 000’s 2005 2004
Remuneration 1 080 1 080
Pension costs - -
Other 281 287
Total 1 361 1 367
Senior management
Amounts in NOK 000’s 2005 2004
Remuneration 1 342 1 329
Pension costs 118 107
Other 636 408
Total 2 096 1 844
Use of Estimates
In the preparation of the financial statements,
management is required to make estimates and
assumptions affecting reported amounts of as-
sets and liabilities and disclosure of contingent
assets and liabilities at the date of the financial
statements and the reported amounts of reve-
nue and expenses during the reporting period.
Actual results could differ from those estimates.
Pensions
The Company’s pension plans for employees
provide for a defined pension benefit upon
retirement. The benefit to be received by em-
ployees generally depends on many factors in-
cluding length of service, retirement date and
future salary increases. The Company accounts
for defined benefit pension plans in accordance
with the Norwegian standard for accounting for
pensions. Costs related to these plans are ex-
pensed as incurred.
The management stock option scheme imple-
mented in 1997 was terminated from and in-
cluding 2004 and replaced with a management
cash bonus scheme from 2005. The beneficiaries
of the scheme are management and certain key
personnel. Annual payments under the scheme,
maximised to one year’s salary, are subject to the
Group achieving certain pre-defined financial
criteria, including achieved budget goals and
development of the Company’s share price.
For 2005 the Company made an accrual for the
bonus scheme of NOK 6.3 million, which is not
included in the above figures as it has not been
paid.
Pension Plans
Fred. Olsen Energy ASA has pension plans
that provide employees with a defined benefit
upon retirement. The employees participating
in these plans are entitled to future pension
payments based on length of service and sal-
ary upon retirement. The total number of em-
ployees involved in the pension plans as of 31
December 2005 was 11. The pension plan assets
consist primarily of bank deposits, investments
in fixed income and equity securities and real
estate.

Fred. Olsen Energy ASA - Annual Report 2005 �1
�1
Fred. Olsen Energy ASA - Annual Report 2005
The Company has an extended pension plan
agreement for CEO and senior management, in
which the beneficiaries will receive 70% of their
final year salary with an option for early retire-
ment at the age of 65.
The Company is listed, and is therefore required
to present group accounts in accordance with
IFRS as from 2005. In the IFRS opening bal-
ance, the Group used the seperate transition
rules in IFRS for first time use of IAS 19, where
it is allowed to adjust the accumulated actuarial
gain/losses to equity in the opening balance.
According to NRS 6A, an entity can elect to
present pension liabilities in NGAAP accounts in
accordance with IAS 19. The resulting change in
liability can be treated as change in accounting
principle and ajusted to equity. The Company
has used these transitional rules in 2005, which
has resulted in reduction of equity of NOK 9.2
million for 2004 and 2005. Comparable figures
for 2004 have been restated accordingly.
The funded status of the defined pension plans is as follows:
Amounts in NOK 000’s 2005 2004
Projected benefit obligation 39 135 30 366
Plan assets at market value 28 393 25 651
Funded status (10 742) (4 715)
Unrecognised net experience loss 5 173 (1 403)
Net pension asset/(liability) (5 569) (6 118)
At 31 December 2005 the net pension liability is presented in the balance sheet as a pension asset of NOK 6 million and as a pension liability NOK 11.5 million.
Assumptions used in the calculation of pension obligations are as follows:
2005 2004 2003
Assumed salary increases 3.0% 3.0% 3.0-5.0%
Discount rates 4.3% 5.5% 7.0%
Interest rates 4.3% 5.5% 8.0%
Expected rates of return on pension plan assets 5.3% 6.5% 8.0%
Net periodic pension costs for defined benefit plans are as follows:
Amounts in NOK 000’s 2005 2004 2003
This period’s earned pensions 3 568 3 497 3 698
Interest expense on pension liabilities 1 444 1 362 1 584
Earnings on pension funds (1 493) (1 413) (1 512)
Amortisation expense 104 (162) 673
Net pension cost for defined benefit plans 3 623 3 284 4 443
The following loans were outstanding to members of the Board of Directors, CEO, management and employees of the Company:
Amounts in NOK 000’s 2005 2004
Loan to CEO 615 1) -
Loan to employees - -
Total 615 -
1) Repaid in February 2006
Loans comply with company law requirements and are adequately secured, when required.
Share based payment
In 1998 the Company’s shareholders resolved to grant the Board of Directors authority to issue up to 3 million shares to be used for an employee incen-
tive compensation plan designed to align the interest of management with those of its shareholders. All share based payment awards are settled by the
physical delivery of shares.
Notes NotesFred. Olsen Energy ASA Fred. Olsen Energy ASA

Fred. Olsen Energy ASA - Annual Report 2005�2
�2
Fred. Olsen Energy ASA - Annual Report 2005
Notes NotesFred. Olsen Energy ASA Fred. Olsen Energy ASA
Note 4 – Other operating expenses
Amounts in NOK 000’s 2005 2004 2003
General operating overheads 15 276 16 162 27 397
Insurance 11 35 22
Property rental expenses 1 149 1 145 1 156
Loss on sale of assets 9 84 10
Total 16 445 17 426 28 585
Fees for audit and other services provided by the Company’s auditor are as follows:
Amounts in NOK 000’s 2005 2004 2003
Audit 1 060 1 444 932
Other assurance services 57 - -
Tax advisory services 84 151 166
Other non-audit services 310 411 390
Total 1 511 2 005 1 488
Note 5 – Net financing costs
Amounts in NOK 000’s 2005 2004 2003
Financial Income
Interest income 146 466 71 939 44 065
Other financial income 53 968 73 281 181 378
Foreign exchange gains 254 324 1 342 5 257
Total 454 758 146 562 230 700
Financial Expense
Interest expense 111 248 76 196 40 448
Write down of shares in subsidiaries 17 785 - 839 430
Other financial expense 165 070 53 288 36 311
Foreign exchange losses 5 073 165 056 77 844
Total 299 176 294 540 994 033
Net financial income (expense) 155 582 (147 978) (763 333)
Interest income is related to return on cash and cash equivalents and loans to other companies in the Group.
Other financial income and expense relates primarily to realised and unreailsed gains and losses on various financial instruments.
Information regarding interest income and expenses from group companies and other related parties is provided at note 15.

Fred. Olsen Energy ASA - Annual Report 2005 ��
��
Fred. Olsen Energy ASA - Annual Report 2005
Note 6 – Income tax expense
Temporary differences between the book and tax basis of assets and liabilities, and related deferred taxes, are as follows:
Amounts in NOK 000’s 2005 2004
Long-term differences decreasing future taxable income 4 674 (29 914)
Long-term differences increasing future taxable income 0 -
Net temporary difference 4 674 (29 914)
Losses carried forward (393 326) (495 893)
Limitation of deferred tax assets 388 652 -
Basis for deferred tax liabilities 0 (525 807)
Net deferred tax (assets) liabilities 0 (147 226)
A certain portion of tax losses carried forward is not recorded as a deferred tax asset due to uncertainty of the level of future suitable taxable profits.
The provision for income taxes is as follows:
Amounts in NOK 000’s 2005 2004 2003
Income taxes payable (refundable) for the period - - -
Income taxes payable (refundable) from previous year 361 (307) -
Deferred income tax (benefit) expense 147 226 (80 139) (16 427)
Income tax expense (benefit) 147 587 (80 446) (16 427)
Taxes payable are as follows:
Amounts in NOK 000’s 2005 2004 2003
Profit (loss) before income tax 115 436 (185 968) (812 538)
Change in temporary differences (34 588) (16 465) 855 769
Group contribution - - (2 279)
Permanent differences 21 719 (293 460) 275 764
Utilisation of tax loss carryforwards (102 567) - (316 716)
Basis taxes payable 0 (495 893) 0
Tax rate 28 % 28 % 28 %
Effective tax rate:
Amounts in NOK 000’s 2005 2004
Expected income tax expense according to statutory tax rate (28%) 32 322 28 % (52 071) 28 %
Permanent differences 6 081 (82 169)
Reversed temporary differences related to write offs of shares - 58 926
Changes in limitation of deferred tax assets 108 823 -
Corrections from previous year 361 (5 132)
Income tax expense (benefit) 147 587 128 % (80 446) 43 %
Notes NotesFred. Olsen Energy ASA Fred. Olsen Energy ASA

Fred. Olsen Energy ASA - Annual Report 2005�4
�4
Fred. Olsen Energy ASA - Annual Report 2005
Notes NotesFred. Olsen Energy ASA Fred. Olsen Energy ASA
Note 7 – Property, plant and equipment
Amounts in NOK 000’s 2005 2004
Cost
Balance at 1 January 4 618 4 954
Additions during the period 526 104
Disposals during the period (457) (440)
Balance at 31 December 4 687 4 618
Depreciation
Balance at 1 January 3 652 3 143
Depreciation during the period 525 670
Disposals during the period (248) (161)
Balance at 31 December 3 929 3 652
Net book value as of 31 December 758 966
Note 8 – Other non-current assets
Amounts in NOK 000’s 2005 2004
Pension assets (see note 3) 6 000 5 820
Long-term receivables (see note 15) 2 989 562 2 381 602
Financial instruments (see note 18) 15 688 95 972
Capitalised borrowing costs 9 492 12 421
Total 3 020 742 2 495 815
Financial instruments relate to currency swaps of NOK 760 million into USD at an average NOK/USD rate of 6.46. The swaps are aligned with the Company’s
NOK 760 million bond loan (see note 12 for furter information about loans). Capitalised borrowing costs relate to expenses incurred in connection with
establishing the Company’s interest-bearing loans and borrowings.
Note 9 – Trade and other receivables
Amounts in NOK 000’s 2005 2004
Trade and other receivables 1 456 1 399
Related parties (note 15) 98 104 34 997
Total 99 560 36 396
Note 10 – Cash and cash equivalents
Amounts in NOK 000’s 2005 2004
Payroll taxes 566 1 015
Other restricted cash 131 974 130 147
Total restricted cash 132 540 131 162
Unrestricted cash 55 789 181 628
Short-term interest bearing investments 0 40 002
Total cash and cash equivalents 188 329 352 792
Other restricted cash relates primarily to cash restricted for previous shareholders of Navis ASA.
Short-term interest bearing investments consisted of deposits in short-term money market accounts.
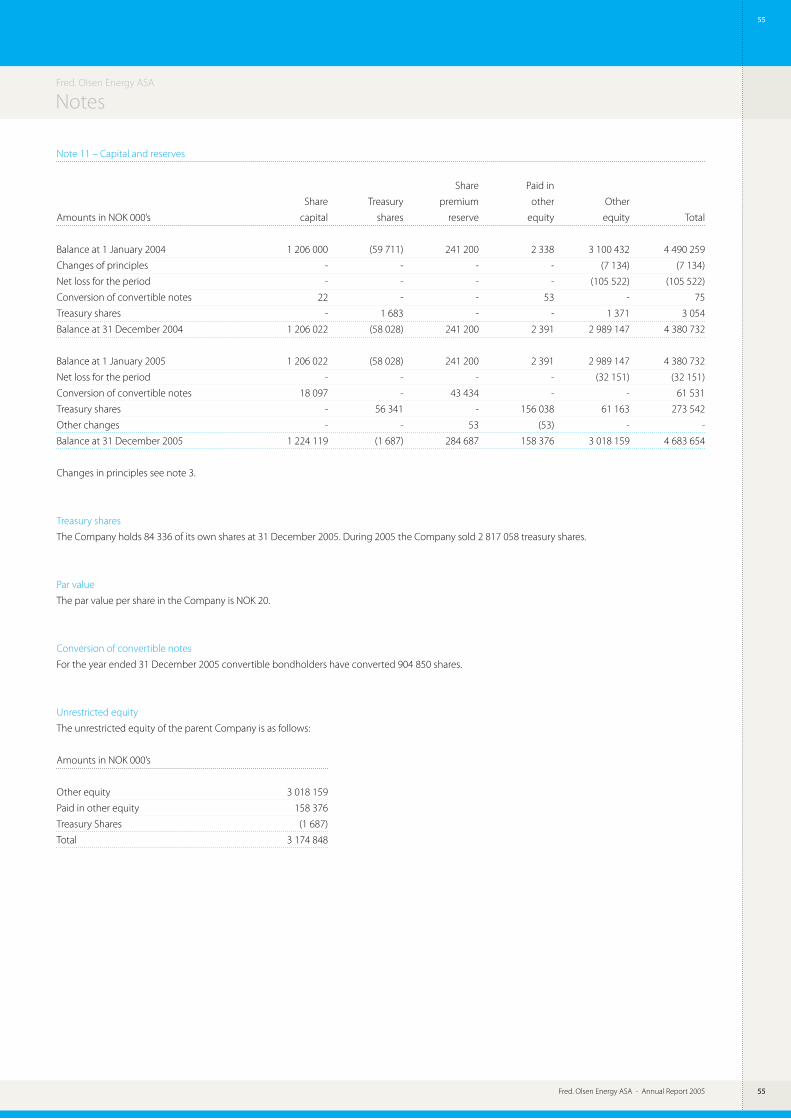
Fred. Olsen Energy ASA - Annual Report 2005 ��
��
Fred. Olsen Energy ASA - Annual Report 2005
Note 11 – Capital and reserves
Share Paid in
Share Treasury premium other Other
Amounts in NOK 000’s capital shares reserve equity equity Total
Balance at 1 January 2004 1 206 000 (59 711) 241 200 2 338 3 100 432 4 490 259
Changes of principles - - - - (7 134) (7 134)
Net loss for the period - - - - (105 522) (105 522)
Conversion of convertible notes 22 - - 53 - 75
Treasury shares - 1 683 - - 1 371 3 054
Balance at 31 December 2004 1 206 022 (58 028) 241 200 2 391 2 989 147 4 380 732
Balance at 1 January 2005 1 206 022 (58 028) 241 200 2 391 2 989 147 4 380 732
Net loss for the period - - - - (32 151) (32 151)
Conversion of convertible notes 18 097 - 43 434 - - 61 531
Treasury shares - 56 341 - 156 038 61 163 273 542
Other changes - - 53 (53) - -
Balance at 31 December 2005 1 224 119 (1 687) 284 687 158 376 3 018 159 4 683 654
Changes in principles see note 3.
Treasury shares
The Company holds 84 336 of its own shares at 31 December 2005. During 2005 the Company sold 2 817 058 treasury shares.
Par value
The par value per share in the Company is NOK 20.
Conversion of convertible notes
For the year ended 31 December 2005 convertible bondholders have converted 904 850 shares.
Unrestricted equity
The unrestricted equity of the parent Company is as follows:
Amounts in NOK 000’s
Other equity 3 018 159
Paid in other equity 158 376
Treasury Shares (1 687)
Total 3 174 848
Notes NotesFred. Olsen Energy ASA Fred. Olsen Energy ASA

Fred. Olsen Energy ASA - Annual Report 2005��
��
Fred. Olsen Energy ASA - Annual Report 2005
Notes NotesFred. Olsen Energy ASA Fred. Olsen Energy ASA
Note 12 – Interest-bearing loans and borrowings
Scheduled repayments
Interest rate 2010 &
Amounts in NOK 000’s 2005 31.12.05 2006 2007 2008 2009 Thereafter
Parent company facilities
FOE Bonds (NOK) 108 500 3.99 % 108 500 - - - -
FOE Bonds (NOK) 760 000 8.75 % - - - 760 000 -
FOE Convertible Bonds (NOK) 373 394 4.50 % - - - 373 394 -
Total parent company facilities 1 241 894 108 500 - - 1 133 394 -
At 31 December 2005 the Company has outstanding unsecured senior bonds totalling NOK 868.5 million, of which NOK 108.5 million are due in June 2006
and NOK 760.0 million in March 2009. In addition, the Company in 2004 issued NOK 435 million in subordinated convertible bonds, due in March 2009.
The holders of the convertible bonds have the right to convert bonds into shares in the Company at a conversion price of NOK 68 per share. Following
conversion of bonds into shares in Fred. Olsen Energy ASA during 2004 and 2005, outstanding amount under the convertible bond loan at 31 December
2005 was NOK 373.4 million.
In March 2006 the NOK 760 million senior bonds were redeemed, following the exercise of an early redemption option. See note 20.
As of 31 December 2005 the Company was in compliance with all covenants in the loan agreements.
Note 13 – Trade and other payables
Amounts in NOK 000’s 2005 2004
Trade 6 093 3 177
Related parties (note 15) 26 533 45
Total 32 626 3 222
See note 15 for additional information on balances with group companies and other related parties.
Note 14 – Other accrued expenses
Amounts in NOK 000’s 2005 2004
Navis settlement (note 24) 172 439 136 929
Accrued interest expense 64 680 62 800
Accrued wages 9 074 3 921
Other 6 728 2 474
Total 252 921 206 124

Fred. Olsen Energy ASA - Annual Report 2005 ��
��
Fred. Olsen Energy ASA - Annual Report 2005
Note 15 – Related Parties
In the ordinary course of business, the Company recognises revenues and expenses with related companies, which may have a significant impact on the
Company’s financial statements. The Company receives certain administrative, financial, and legal advisory services from Fred. Olsen & Co. The agreements
are on arms-length terms and are subject to ordinary termination provisions. Revenues, purchases, interest income and expenses from such companies
were as follows:
Amounts in NOK 000’s 2005 2004 2003
Revenues
Subsidiaries 646 578 416
Other related parties 153 148 138
Total 799 726 554
Operating expenses
Other related parties 4 326 4 158 5 574
Total 4 326 4 158 5 574
Interest income
Subsidiaries 144 757 67 603 38 457
Other related parties - - 81
Total 144 757 67 603 38 538
Interest expenses
Subsidiaries 9 315 777 760
Total 9 315 777 760
See note 4, 5, 9, 13 for further information on transactions with related parties.
Amounts in NOK 000’s 2005 2004 2003
Trade and other receivables
Subsidiaries 89 051 32 294 10 921
Other related parties 9 053 2 703 -
Total 98 104 34 997 10 921
Other non-current assets
Subsidiaries 2 988 946 2 381 602 1 106 585
Other related parties 616 - -
Total 2 989 562 2 381 602 1 106 585
The subsidiaries will pay back the loans based on the “pay-as-you earn” principle.
Trade and other payables
Subsidiaries 26 533 45 721
Other related parties - - 1 087
Total 26 533 45 1 808
Current interest-bearing loans and borrowings
Subsidiaries - 382 137 91 772
Total - 382 137 91 772
Other related parties relate entirely to Ganger Rolf ASA and Bonheur ASA and their subsidiaries and Fred. Olsen & Co.
Notes NotesFred. Olsen Energy ASA Fred. Olsen Energy ASA

Fred. Olsen Energy ASA - Annual Report 2005��
��
Fred. Olsen Energy ASA - Annual Report 2005
Notes NotesFred. Olsen Energy ASA Fred. Olsen Energy ASA
Note 16 – Shares in Subsidiaries and Other Equity Investments
Amounts in NOK 000’s % of holding & Net profit Historical Accumulated Book
Subsidiaries Business Offices voting shares Equity (loss) Cost Write downs Value
Dolphin AS Tananger 100 % 179 659 (8 761) 750 611 555 693 194 918
Dolphin International AS Oslo 100 % 1 441 489 457 475 2 717 264 - 2 717 264
Atlan Shipping Co. Ltd. Hamilton Bermuda 100 % (45 046) (2 170) 855 491 855 491 2 279
Navis Drilling Ltda. Brazil 2 % (333) - 72 - 72
Total 4 323 438 1 411 184 2 914 533
The subsidiary Fred. Olsen Drilling AS has with effect of 1 January 2005 been merged into subsidiary Dolphin International AS.
Note 17 – Shareholder Information
The shareholders, who hold more than 1% of the shares at 31 December 2005 are as follows:
Shareholder Percent of shares Number of shares
Bonheur ASA 29.59 % 18 111 500
Ganger Rolf ASA 29.59 % 18 111 500
Bank of New York 2.97 % 1 817 734
Fidelity Funds-Europ. Growth/Sic 2.61 % 1 600 000
State Street Bank & Trust Co. 2.35 % 1 439 924
JP Morgan Chase Bank 1.41 % 863 280
Morgan Stanley & Co. Inc. 1.40 % 859 791
JP Morgan Chase Bank 1.24 % 760 293
Others 28.82 % 17 641 930
Total 100.00 % 61 205 952
Each share has one vote.
Shares and options owned by the Company’s directors and senior management at 31 December 2005:
Convertible
Name Title Shares Options bonds (NOK)
Anette S. Olsen Chairman 100 - -
John C. Wallace Director 1 000 - -
Øivin Fjeldstad Director 1 000 - 100 000
Mårten Lunde Director - - -
Ivar J. Saunes Director - - -
Stephen Knudtzon Deputy Director - - -
Helge Haakonsen CEO / Managing Director 10 100 55 000 -
Jan Peter Valheim Chief Financial Officer - 5 000 -

Fred. Olsen Energy ASA - Annual Report 2005 ��
��
Fred. Olsen Energy ASA - Annual Report 2005
Note 18 – Financial Instruments
Notes NotesFred. Olsen Energy ASA Fred. Olsen Energy ASA
The Company is exposed to interest rate- and
foreign currency risks in its operations. Deriva-
tive financial instruments are from time to time
entered into to hedge against fluctuations in for-
eign currency rates and interest rate levels.
Interest rate risk
The Company is exposed to fluctations in inter-
est rate for NOK. The Company has used interest
rate derivatives to achieve a satisfactory mix of
exposure to fixed and floating interest rate on it’s
debt instruments.
The Company’s NOK debt as of 31 December
2005 consists of a bond loan of NOK 108.5
million maturing in 2006, a bond loan of NOK
760 million maturing in 2009 which has been
swapped into USD, and a convertible bond loan
maturing in 2009. The NOK 108.5 million bond
loan carries interest based on floating interest
rate (NIBOR) plus a margin of 1.5% p.a. The NOK
760 million bond loan carries a fixed interest
rate of 8.75% p.a. to maturity; however, the fixed
USD based interest rate of the swapped loan is
9.01% p.a. The NOK 760 million bonds have been
called for redemption on 26 March 2006 includ-
ing a call premium of 4.5%. The corresponding
currency swaps may be terminated at the time
of the redemption. The convertible bond loan
of approximately NOK 373 million carries a fixed
interest rate of 4.5% p.a. to maturity.
At 31 December 2005 the Company had interest
rate derivatives of USD 35 million (2004: USD 260
million). The interest rate derivatives mature in
November 2007.
The fair value of interest rate swaps is the es-
timated amount that the Company’s would
receive or pay to terminate the swap at the bal-
ance sheet date. Net fair market value of interest
rate derivatives at 31 December 2005 was NOK
1.7 million (2004: NOK 22.5 million) recorded as a
liability, of which none was recorded as current.
Foreign currency risk
The Company has entered into currency swaps
totalling NOK 760 million of debt denominated
in NOK into USD. The market value of the cur-
rency swaps was NOK 39 million at 31 December
2005 (2004: NOK 128 million). The nominal value
in the Company is NOK 16 million at 31 Decem-
ber 2005 (2004: NOK 95 million) and recorded as
non-current assets in the balance sheet.
Forward exchannge contracts
At 31 December 2005 the Company had out-
standing currency derivative contracts for for-
ward sale of USD 25 million, of which USD 20
million were against GBP at an average rate of
1.73 and USD 5 million were against NOK at the
spot rate as long as the spot rate does not ex-
ceed 6.98, in which case the forward rate will be
6.20. All outstanding foreign exchange contracts
expire in 2006.
The fair value of forward exchange contracts is
their quoted market price at the balance sheet
date, being the present value of the quoted
forward price. Net fair market value of currency
forward contracts at 31 December 2005 was
NOK 2.6 million (2004: NOK 7.7 million recorded
as assets) recorded as a liability, of which NOK 2.6
million is current.
At 31 December 2005 the Company had the following interest rate and currency derivative positions:
Fixed rate agreements
Notional amount Receive rate Pay rate Duration
USD 25 000 000 3 month LIBOR 5.195 % Nov 2007
USD 10 000 000 3 month LIBOR 4.73 % Nov 2007
Currency swap agreements
Notional amount Receive rate Pay rate Duration
USD 13 571 000 NOK 95 000 000 8.75 % 9.08 % March 2009
USD 13 792 000 NOK 95 000 000 8.75 % 8.975 % March 2009
USD 18 202 000 NOK 126 667 000 8.75 % 8.94 % March 2009
USD 36 582 000 NOK 253 333 000 8.75 % 9.08 % March 2009
USD 14 245 000 NOK 95 000 000 8.75 % 8.97 % March 2009
USD 13 571 000 NOK 95 000 000 8.75 % 9.045 % March 2009
Foreign exchange contracts
Notional amount Level Expiring
USD 5 000 000 6.2000 26.05.2006
USD 5 000 000 1.7536 18.10.2006
USD 5 000 000 1.7537 18.10.2006
USD 2 500 000 1.7064 28.02.2006
USD 2 500 000 1.7075 31.05.2006
USD 2 500 000 1.7096 31.08.2006
USD 2 500 000 1.7112 30.11.2006
Fred. Olsen Energy ASA - Annual Report 2005�0
�0
Fred. Olsen Energy ASA - Annual Report 2005
Notes
Note 19 – Contingencies
Navis Shares
Borgarting lagmannsrett (a Norwegian Court of
Appeals) gave their final assessment in the dis-
pute between the Company and an assignee to
the position of a previous minority shareholder
in Navis ASA (Navis) who did not accept the offer
related to the compulsory redemption made in
February 2001.
The minority shareholder was redeemed at NOK
12.49 per share, whilst Borgarting lagmannsrett
arrived at a redemption price of NOK 14.50 per
share.
The minority shareholder represented 8,848,140
shares, corresponding to 6.6% of the total shares
in Navis.
None of the parties have appealed the ruling by
Borgarting lagmannsrett, following which it was
effective as of 4 January 2006.
After having commenced proceedings in the
redemption case described above the previous
minority shareholder in 2003 commenced sepa-
rate proceedings against the Company seeking
damages on the basis of the Company’s manda-
tory bid for Navis shares in November 2000. In
December 2005, the Oslo tingrett (a Norwegian
City Court) ruled against these claims following
which the plaintiff in January 2006 appealed the
ruling.
It is the Company’s opinion, based on legal ad-
vice, that there is no support for this claim and
no provision has been recognized in these finan-
cial statements as the Company belives the pos-
sibility of additional loss is remote.
Note 20 – Subsequents events
Events after the balance sheet date
Stock options
Subsequent to the year-end 2005 a total of
74 002 options were exercised by management
in accordance with the terms of the 2001, 2002
and 2003 stock option plans.
FOE 01 Bond loan
In February Norsk tillitsmann ASA was notified
that the Company will exercise the option to re-
deem the “FOE 01” bond loan of NOK 760 million.
The Company will redeem the bonds on 26th
March 2006 at a redemption price of 104.5%. See
also note 12.
Guarantee
In March 2006 the Company’s 100% owned sub-
sidiary, Dolphin International AS, refinanced its
USD 300 million credit facility, dated 15 July 2004
by raising a new 7 years credit facility of USD 600
million. The new credit facility will also refinance
the NOK 760 million senior debt notes, follow-
ing the exercise of the early redemption option,
and the short-term credit facility of USD 30 mil-
lion. The new USD 600 million Loan Agreement
will be structured similar to the USD 300 million
Loan Agreement, including vessel mortgages,
and will contain a set of undertakings usual for
loan agreements of this nature. The Loan Agree-
ment will have a parent company guarantee
from the Company.
NotesFred. Olsen Energy ASA

Fred. Olsen Energy ASA - Annual Report 2005 �1
�1
Fred. Olsen Energy ASA - Annual Report 2005
Auditor’s Report

Fred. Olsen Energy ASA - Annual Report 2005�2
�2
Fred. Olsen Energy ASA - Annual Report 2005
Investor Information
20 largest shareholders
31.03.2006 Country Shares Interest
1 Bonheur ASA Norway 18 111 500 29.52 %
2 Ganger Rolf ASA Norway 18 111 500 29.52 %
3 Morgan Stanley And Co.Intl.Limited United Kingdom 2 280 750 3.72 %
4 Fidelity Funds-Europ. Growth/Sicav Luxembourg 1 602 000 2.61 %
5 State Street Bank & Trust Co. USA 1 339 462 2.18 %
6 JP Morgan Chase Bank United Kingdom 1 114 404 1.82 %
7 Morgan Stanley & Co. Inc. United Kingdom 664 830 1.08 %
8 Bank Of New York, Brussels Branch Belgium 655 526 1.07 %
9 Folketrygdfondet Norway 597 450 0.97 %
10 Odin Norden Norway 494 300 0.81 %
11 Dresdner Bank AG Germany 489 621 0.80 %
12 Fortis Gobal Custody Neterlands 399 197 0.65 %
13 Fortis Bank Luxembourg Luxembourg 390 188 0.64 %
14 Avanse Norge (II) Norway 379 800 0.62 %
15 Clearstream Banking S.A. Luxembourg 349 562 0.57 %
16 Deutsche Bank AG London United Kingdom 338 687 0.55 %
17 Vital Forsikring ASA Norway 337 200 0.55 %
18 Bnp Parisbas Sec.services Paris France 297 600 0.48 %
19 DnbNOR Norge (IV) V Norway 291 136 0.47 %
20 Bank Of New York, Brussels Branch Belgium 287 100 0.47 %
Total 20 Largest 48 531 813 79.09 %
The FOE share price continued its strong
development in 2005
Shareholder policy
The Company’s long-term objective is to provide
a competitive return for its shareholders. Being
listed on Oslo Stock Exchange the Company
works actively to promote the liquidity of its
shares in the marketplace. Emphasis is placed in
its investor relation activities on creating a good
understanding of the Company and relevant
sector-specific issues, and the Company en-
deavors to make the share attractive to a broad
investor base.
Information policy
The Company aims to provide relevant informa-
tion in a coordinated and effective manner at
the same time to all market participants. The
Company’s management is conscious of the
market requirements for openness and trans-
parency in addition to the compliance require-
ments of Oslo Stock Exchange.
The Company informs the market through
quarterly and annual reports, presentations to
investors and analysts and through publication
of operational and financial information on the
company’s Internet site. Price-sensitive events
are timely reported to the market through stock
exchange notices in accordance with the pro-
visions of the Stock Exchange Regulations. The
Company’s quarterly results are published im-
mediately after they have been considered and
approved by the Company’s Board, followed by
a presentation to the finance market. In addition,
the Company holds presentations at investor
conferences and attends regular meetings with
analysts and investors at which the Company’s
business is reviewed within the limits set by the
Stock Exchange’s recommendations on contact
with analysts.
Share information
The Company has been listed on the Oslo Stock
Exchange since 15 October 1997. In 2005, the
share capital increased by NOK 17,361,720 to
NOK 1,223,383,760, which equals 61,169,188
shares. The change is due to conversion of
868,086 shares from the convertible bond loan
(FOE 02) during the year.
Per 31.12.05
Total issued shares 61 169 188
Nominal value (NOK) 20
Share capital (NOK) 1 223 383 760
Indices (see comments below);
OSEAX Oslo Børs All-share Index
OBX index
OSE10GI Energy
OSE1010GI Energy
The Company’s share is traded on Oslo Stock Ex-
change under the symbol FOE and is included
in Oslo Stock Exchange’s Energy Indices (OS-
E10GI and OSE1010GI), OBX index (OBX) and
the All Share Index (OSEAX). As at year-end 2005
the Company was no. 7 (up from no. 8) largest
measured by market value of the 57 companies
in the energy sector on Oslo Stock Exchange
and ranked no. 14 (up from no. 24) in terms of
market value of all companies on Oslo Stock
Exchange.
Shareholder structure
The 20 largest shareholders of Fred. Olsen En-
ergy ASA owned 79.1 per cent of the outstand-
ing shares in the Company at 31 March 2006,
while the comparable figure for 2004 was 81.6
percent. By the end of March 2006 the Company
owns 6,334 treasury shares.
At 31 March 2006 Fred. Olsen & Co. related com-
panies (Bonheur ASA and Ganger Rolf ASA) con-
trolled a total of 36,223,000 (59%) shares in Fred.
Olsen Energy ASA, which is unchanged since the
listing of the Company on Oslo Stock Exchange
in 1997.
Disregarding the Fred. Olsen & Co. related com-
panies there have been significant changes on
the top 20 list of shareholders from 2004 to 2005.
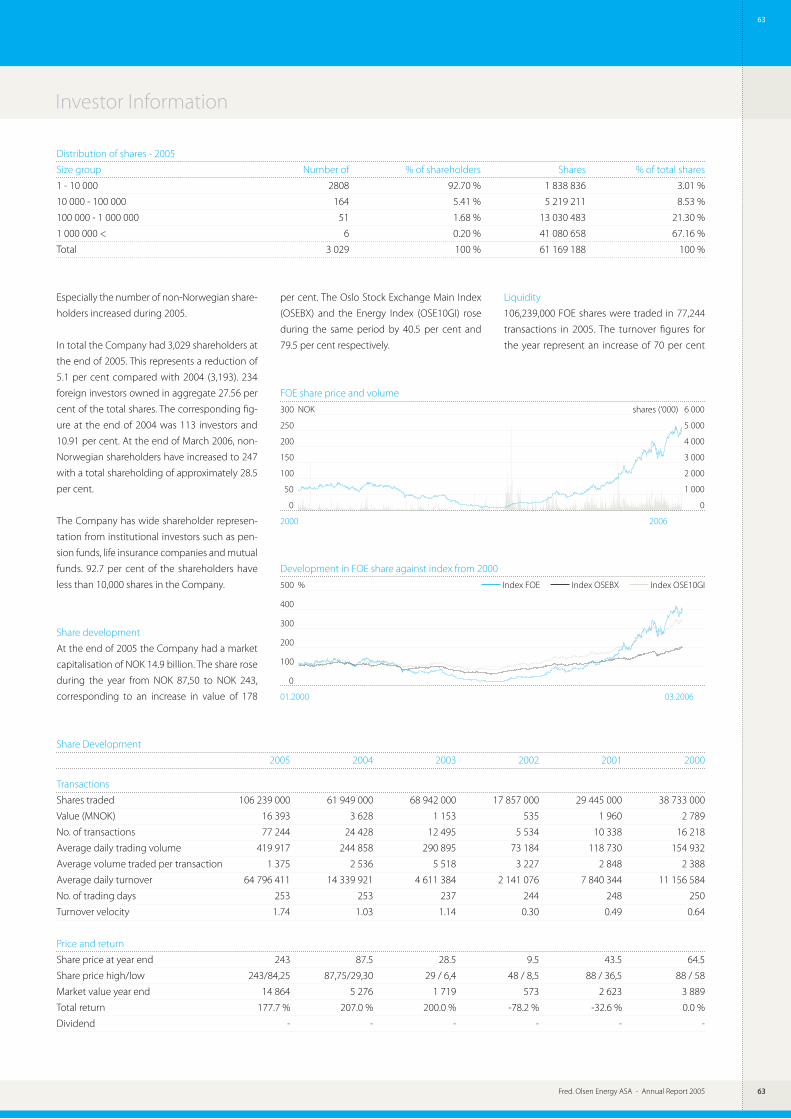
Fred. Olsen Energy ASA - Annual Report 2005 ��
��
Fred. Olsen Energy ASA - Annual Report 2005
Investor Information
Share Development
2005 2004 2003 2002 2001 2000
Transactions
Shares traded 106 239 000 61 949 000 68 942 000 17 857 000 29 445 000 38 733 000
Value (MNOK) 16 393 3 628 1 153 535 1 960 2 789
No. of transactions 77 244 24 428 12 495 5 534 10 338 16 218
Average daily trading volume 419 917 244 858 290 895 73 184 118 730 154 932
Average volume traded per transaction 1 375 2 536 5 518 3 227 2 848 2 388
Average daily turnover 64 796 411 14 339 921 4 611 384 2 141 076 7 840 344 11 156 584
No. of trading days 253 253 237 244 248 250
Turnover velocity 1.74 1.03 1.14 0.30 0.49 0.64
Price and return
Share price at year end 243 87.5 28.5 9.5 43.5 64.5
Share price high/low 243/84,25 87,75/29,30 29 / 6,4 48 / 8,5 88 / 36,5 88 / 58
Market value year end 14 864 5 276 1 719 573 2 623 3 889
Total return 177.7 % 207.0 % 200.0 % -78.2 % -32.6 % 0.0 %
Dividend - - - - - -
Distribution of shares - 2005
Size group Number of % of shareholders Shares % of total shares
1 - 10 000 2808 92.70 % 1 838 836 3.01 %
10 000 - 100 000 164 5.41 % 5 219 211 8.53 %
100 000 - 1 000 000 51 1.68 % 13 030 483 21.30 %
1 000 000 < 6 0.20 % 41 080 658 67.16 %
Total 3 029 100 % 61 169 188 100 %
0
1000000
2000000
3000000
4000000
5000000
6000000
FOE share price and volume
300 NOK shares (‘000) 6 000
250 5 000
200 4 000
150 3 000
100 2 000
50 1 000
0 0
2000 2006
Development in FOE share against index from 2000
500 % Index FOE Index OSEBX Index OSE10GI
400
300
200
100
0
01.2000 03.2006
0
50
100
150
200
250
300
0
100
200
300
400
500
Especially the number of non-Norwegian share-
holders increased during 2005.
In total the Company had 3,029 shareholders at
the end of 2005. This represents a reduction of
5.1 per cent compared with 2004 (3,193). 234
foreign investors owned in aggregate 27.56 per
cent of the total shares. The corresponding fig-
ure at the end of 2004 was 113 investors and
10.91 per cent. At the end of March 2006, non-
Norwegian shareholders have increased to 247
with a total shareholding of approximately 28.5
per cent.
The Company has wide shareholder represen-
tation from institutional investors such as pen-
sion funds, life insurance companies and mutual
funds. 92.7 per cent of the shareholders have
less than 10,000 shares in the Company.
Share development
At the end of 2005 the Company had a market
capitalisation of NOK 14.9 billion. The share rose
during the year from NOK 87,50 to NOK 243,
corresponding to an increase in value of 178
per cent. The Oslo Stock Exchange Main Index
(OSEBX) and the Energy Index (OSE10GI) rose
during the same period by 40.5 per cent and
79.5 per cent respectively.
Liquidity
106,239,000 FOE shares were traded in 77,244
transactions in 2005. The turnover figures for
the year represent an increase of 70 per cent

Fred. Olsen Energy ASA - Annual Report 2005�4
�4
Fred. Olsen Energy ASA - Annual Report 2005
0
5000
10000
15000
20000
25000
30000
35000
96
97
98
99
100
101
102
103
0
3000
6000
9000
12000
15000
18000
21000
50
100
150
200
250
300
350
400
Investor Information
from the previous year. The share turnover velo-
city came in at 174% which is well above the 5
years average of 94%. The total turnover value
increased by 352% to NOK 16,3 billion.
Bond loans
In February Norsk Tillitsmann ASA was notified
that the Company would exercise the option to
redeem the bond loan (FOE 01) NOK 760 million
of unsecured bonds. The Company redeemed
the bond loan FOE 01 on 26th March 2006 at a
redemption price of 104.5%.
After the redemption of FOE 01 the Company
has two bond loans. NOK 435 million of subor-
dinated convertible bonds (FOE 02) issued in
March 2004 and maturing in March 2009 and
NOK 108.5 million of unsecured bonds (FOE 00)
issued in 2001 and maturing in June 2006.
Holders of the convertible bonds (FOE 02) have
the right to convert to shares at a price of NOK
68 per share. If the bonds are fully converted to
shares, the Company will issue 6,397,058 new
shares. The conversion right expires on 28 Febru-
ary 2009. By end March 2006 approximately NOK
72 million had been converted into 1,061,833
shares.
Fred Olsen Energy ASA bonds as per March 2006
Subordinated
Loan Unsecured convertible
Symbol FOE 00 FOE 02
Issue date 21 June 2001 30 March 2004
Outstanding Loan 108 500 000 362 794 000
Interest 3 months NIBOR + 1.5% 4.5%
Interest terms Floating Fixed
Maturity Date 21 June 2006 30 March 2009
Interest rate 31.03.06 3.99% 4.50%
Interest payment Quarterly Yearly
FOE 00
103 % Volume (million) 35
102 30
101 25
100 20
99 15
98 10
97 5
96 0
09.2004 04.2006
FOE 02 Convertilble 4.5%
400 % Volume (million) 21
350 18
300 15
250 12
200 9
150 6
100 3
50 0
09.2004 04.2006
NOK 3m Nibor
2.90 Nibor rate
2.75
2.60
2.45
2.30
2.15
2.00
1.85
09.2004 04.2006
1,85
2,00
2,15
2,30
2,45
2,60
2,75
2,90
Fred. Olsen Energy ASA - Annual Report 2005 ��
��
Fred. Olsen Energy ASA - Annual Report 2005
Investor Information
Risk
Norwegian tax rules require that, in calculating
sales gains, shareholders who are taxable in Nor-
way must adjust the historical cost price of the
shares by a RISK amount (Regulation of open-
ing value by taxed capital). The RISK amount
corresponds to the result for tax purposes after
tax and dividends. In this way double taxation
of that part of the sales gain which relates to
earlier retained taxed profits is avoided. Share-
holders who are not taxable in Norway are not
affected by the rules. Set out below are the RISK
amount per share calculated for 2005 and the 7
previous years:
Year RISK-amount per share
2005 0.00 NOK
2004 0.42 NOK
2003 1.54 NOK
2002 -1.83 NOK
2001 0.39 NOK
2000 0.84 NOK
1999 0.17 NOK
1998 0.00 NOK
Financial calendar
Annual General Meeting
The Annual General Meeting for 2006 is to be
held on 29 May. Notices including proxy forms
will be mailed to the shareholders no later than
14 days prior to that date. All material relevant to
the General Meeting will be posted on the Com-
pany’s home page (www.fredolsen-energy.no).
Quarterly results
Presentations for the finance market are held in
connection with the results. The following dates
have been set for publication of quarterly results
for 2006:
1st quarter 2006: 28 April
Annual General Meeting: 29 May
2nd quarter 2006: 18 July
3rd quarter 2006: 25 October
4th quarter 2006: February 2007
Investor contacts
The Company’s managers responsible for inves-
tor relations maintain an ongoing dialogue with
investors and analysts. Important events for the
group are announced through stock exchange
notices and press releases. Enquiries from share-
holders may be addressed to the Company’s
managers responsible for investor relations.
Jan Peter Valheim
Chief Financial Officer
Telephone: +47 22 34 12 41
e-mail: [email protected]
Hjalmar Krogseth Moe
Finance Manager/IR
Telephone: +47 22 34 12 49
e-mail: [email protected]
Sølvi van Spronsen
Secretary
Telephone: +47 22 34 12 43
e-mail: [email protected]
Fred. Olsen Energy ASA - Annual Report 2005��
��
Fred. Olsen Energy ASA - Annual Report 2005
Corporate Governance
The Company emphasizes the importance of
maintaining and further developing its corporate
governance policy and supports the principles
set out in the Norwegian Code of Practice for
Corporate Governance. The Company has imple-
mented written guidelines to the Board of Direc-
tors as a practical tool for the Board in its exercise
of good corporate governance.
Business
According to the Articles of Association, the Com-
pany’s purpose is to carry on shipping business,
including the ownership and leasing of floating
platforms and everything related thereto, includ-
ing owning shares and interests in companies
with similar or related business. In carrying out
their duties, assignments or appointments for the
Company, all employees are expected to behave
in an ethical and non-discriminatory manner.
Equity and dividends
To the extent it considers it necessary, the Com-
pany may raise new equity in the capital market.
In this connection the Board of Directors has an
authorization from the Annual General Meeting
in 2005 to increase the share capital by 30 000
000 shares. The proxy expires on 19 May 2006.
At 31.12.2005 the Company held 84 336 shares of
the outstanding share capital as treasury shares.
In past years, the Company has retained all earn-
ings to support and develop operations, and
has therefore not paid dividends. Going forward,
dividend payments will be considered to the ef-
fect economic viable investment projects are not
found and to the extent permitted by the finan-
cial situation of the Group.
Equal treatment of shareholders, transactions with
close associates and freely negotiable shares
The Company’s shares are listed on the Oslo Stock
Exchange. Shares have been issued in only one
share class. All shares in the Company have equal
rights and all shareholders have the right to par-
ticipate in general meetings. The Company has
no restrictions on ownership and voting rights. A
competent Board consisting of the independent
Board members deals with matters involving the
Company’s main shareholders, Ganger Rolf ASA
and Bonheur ASA.
General meetings
The annual general meeting is normally held in
May each year. Invitations are sent to sharehold-
ers or to the shareholder’s security deposit bank.
Shareholders registered in VPS (the Norwegian
Registry of Securities) can vote in person or by
proxy. The general meeting of shareholders elects
the Board of Directors, nominates the external
auditor, determines the auditor’s remuneration,
approves the annual result and dividend pro-
posed by the Board of Directors and determines
the remuneration to the Board of Directors.
Nomination committee
In view of the main shareholders of the Company
controlling a majority of the shares, the Company
has decided not to appoint a nomination com-
mittee.
The Board Of Directors
In accordance with Norwegian law, the Board
of Directors is responsible for administering the
Company’s affairs and for ensuring that the Com-
pany’s operations are organised in a satisfactory
manner.
The Company’s Articles of Association provide
that the Board of Directors shall have no fewer
than three members and no more than seven
members. In accordance with Norwegian law,
the CEO and at least half of the members of the
Board must either be resident in Norway, or be
citizens of and resident in an EU/EEA country.
The general meeting of shareholders elects the
members of the Board.
The Board of Directors consists of 5 board mem-
bers who are elected for a two-year period. All of
the Directors are independent of the Company’s
management and two of them are independent
also in relation to the Company’s main share-
holders, Ganger Rolf ASA and Bonheur ASA. In
2005 the Board of Directors had 13 meetings. An
annual fee remunerates each Director.
The Board of Directors consists of:
Anette S. Olsen, Chairman. Ms. Olsen has been
chairman of the Board since the inception of the
company in 1997. Since 1994, Ms. Olsen has been
the sole owner of Fred. Olsen & Co., the manage-
ment company of the stock listed companies
Bonheur ASA and Ganger Rolf ASA, which she
joined in 1981. Ms. Olsen holds chairman and
board positions with a number of companies in-
cluding First Olsen Ltd., Fred. Olsen Renewables
Ltd., Fred. Olsen Cruise Lines Ltd., Timex Corpora-
tion and A/S Norges Handels og Sjøfartstidende.
In addition, she is a member of the Norwegian
Shipping Association’s Advisory Board and the
Council of Det Norske Veritas. Ms. Olsen has a BA
in Business Organization and an MBA. Ms. Olsen
is a Norwegian citizen, resident in Oslo, Norway.
Øivin Fjeldstad, Director. Mr Fjeldstad served as
a deputy to the Board for several years and has
been a director since 2002. He is now active as
an independent consultant and board member.
He was for 4 years senior adviser to HSH Nord-
bank, Hamburg/Kiel. In the period 1993 – 98 he
was Managing Director of DnB Luxembourg SA.
He has previous experience as deputy manag-
ing director of Bergen Bank/Den norske Bank,
and served 4 years as group finance director in
Akergruppen. At present he holds chairman and
board positions with a number of companies
including The Anders Jahre Humanitarian Foun-
dation, AL Industrier ASA and Dextra Musica
AS, and he has previous experience from many
boards both in Norwegian and foreign compa-
nies. Mr. Fjeldstad has political experience as a
former member of the Norwegian parliament.
He is a graduate of the Norwegian School of Busi-
ness and Economics. Mr. Fjeldstad is a Norwegian
citizen, resident in Ringerike, Norway.
Mårten Lunde, Director. Mr. Lunde has been a
member of the Board since 2002 after he resigned
from the position as Chief Financial Officer (CFO)
of the Company and joined Fred. Olsen & Co. as
CFO. Prior to joining FOE in 2001, Mr. Lunde had
been working as a Finance Director at Petroleum
Geo Services ASA from 1994 until 1999 and af-
ter that, as an independent consultant. His past
working experience also includes several years
within banking and finance. Mr. Lunde holds
board positions with a number of Fred. Olsen re-
lated companies including First Olsen Ltd., Fred.
Olsen Cruise Lines Ltd. and Fred. Olsen S.A. Mr.
Lunde is a graduate of the Norwegian School of
Business and Economics and is a Norwegian citi-
zen, resident in Bærum, Norway.
Ivar J. Saunes, Director. Mr. Saunes has been a
member of the board since 1997. Mr. Saunes has
worked as an independent consultant since retir-
ing in 1996 as the chief executive officer of Norsk
Skibs Hypothekbank A/S, which he headed for
seven years. He has previously held the positions
as senior and executive vice president in charge
of shipping, shipyard, offshore and oil exploration
with Den norske Creditbank in Oslo, and senior
positions with Norwegian shipping companies.
Mr. Saunes is presently a member of the boards
of maritime and industrial companies in and
outside Norway,and has served as vice chairman
of the Norwegian Rigowners Association. Mr.
Fred. Olsen Energy ASA - Annual Report 2005 ��
��
Fred. Olsen Energy ASA - Annual Report 2005
Corporate Governance
Saunes is a graduate of the Norwegian School of
Business and Economics and received a Master
of Arts in International Finance from the Univer-
sity of Oregon. Mr. Saunes is a Norwegian citizen,
resident in Bærum, Norway.
John C. Wallace, Director. Mr. Wallace has been a
member of the board since 1997. He is chairman
of Fred. Olsen Limited, London, and a member of
the boards of directors of Ganger Rolf ASA and
Bonheur ASA. Mr. Wallace received a Bachelor of
Commerce degree from McGill University in 1959
and was admitted to the Institute of Chartered
Accountants of Quebec, having qualified with
PricewaterhouseCoopers in Canada in 1963, fol-
lowing which he joined Baring Brothers & Co.
Limited in London. In 2004 he successfully com-
pleted the International Uniform Certified Public
Accountant Qualification Examination for a CPA
in the United States and holds a CPA Certificate
for Illinois. Mr. Wallace is a Canadian citizen resi-
dent in London in the United Kingdom.
The Board of Directors has appointed an Au-
dit Committee consisting of the two Directors
independent of the main shareholders of the
Company. The charter of the audit committee
is to assist the Board in fulfilling its responsibili-
ties concerning the financial reporting process,
internal controls, management of financial risks,
the audit process, and the Company’s proc-
ess for monitoring compliance with applicable
laws and regulations. The Audit Committee has
regular meetings with the management and the
external auditor. Parts of the meetings with the
external auditor are without participation of the
management.
The Board of Directors has appointed a Compen-
sation Committee comprising three Directors,
including the two independent Directors. The
Compensation Committee discusses and recom-
mends to the Board salary and benefits for the
Chief Executive Officer as well as the manage-
ment incentive schemes for the Group.
The Company has implemented guidelines for
the work of the Board of Directors.
The purpose behind these guidelines is to estab-
lish a practical tool for the Board in its exercise of
good corporate governance.
The current composition of Directors reflects
adequate competence relative to the main busi-
ness areas of the Group.
Executive Management
The Chief Executive Officer (CEO) is appointed by
and serves at the discretion of the Board of Direc-
tors. He is responsible for the daily management
and the operations of the Company. The CEO is
not a member of the Board of Directors.
The executive management consists of:
Helge Haakonsen, Chief Executive Officer. Mr.
Haakonsen has been President and Chief Execu-
tive Officer of the Company since 1997. Mr. Haa-
konsen joined Fred. Olsen & Co. in 1972, and has
held a number of senior project and manage-
ment positions within the offshore and tanker
industries, including offshore drilling and floating
production operations. Mr. Haakonsen received a
Bachelor of Science degree in engineering from
the University of Newcastle in 1969 and a degree
in business administration from the Norwegian
School of Management in 1973. Mr. Haakonsen is
a Norwegian citizen, and resides in Oslo, Norway.
Jan Peter Valheim, Chief Financial Officer. Mr. Val-
heim has been Chief Financial Officer since 2002.
He has previously held positions in Scribona
Norge AS, Scribona AB, PC Lan ASA and Saga
Petroleum ASA. Mr. Valheim is a graduate from BI
Norwegian School of Management. He is a Nor-
wegian citizen and resides in Bærum, Norway.
Joakim Kleppe, Chief Executive Officer of Dol-
phin a.s since June 2002. Mr. Kleppe was previ-
ously Snr. Vice President HR/QHS&E & ICT with
Dolphin as and had been working within similar
responsibilities and professions for 16 years for
Kværner/Kværner Oil & Gas. Mr. Kleppe is a gradu-
ate from University of Bergen as well as Personnel
Administration from Rogaland Distriktshøyskole,
Stavanger. Mr. Kleppe is a Norwegian citizen and
resides in Stavanger, Norway.
Per Johansson, Managing Director Dolphin Drill-
ing Ltd. Per Johansson has been Managing Direc-
tor for Dolphin Drilling Ltd since 2003. Mr. Johans-
son has worked in the oil industry since 1977. He
joined Dolphin Drilling Ltd. in 1990 and has been
a member of the management in Dolphin Drill-
ing Ltd. since 1995. Mr. Johansson is a graduate
from Technical School and holds all drilling re-
lated certificates. Mr. Johansson is a Norwegian
citizen and resides in Aberdeen, Scotland.
John A. Sydness, Managing Director Dolphin
Drilling Pte. Ltd. since January 2004. Mr. Sydness
joined Fred. Olsen Energy ASA in May 1999 as SVP
Chief Group Controller, and has previously held
positions in Alvern ASA and Norske Fina AS. Mr.
Sydness is a graduate from Heriot Watt University
in Edinburgh and holds a BA in Business Admin-
istration. Mr. Sydness is a Norwegian citizen, and
resides in Singapore.
Robert J Cooper, Chief Executive Officer, Harland
and Wolff Group Plc. Mr. Cooper was appointed
CEO of Harland and Wolff Group PLC in February
2003. He was appointed financial director in Har-
land and Wolff Group in 1993. Mr. Cooper joined
the Company in 1983 as a trainee accountant,
and after completing his ICMA professional ex-
aminations he held a number of positions within
the finance department. Mr. Cooper is a UK citi-
zen residing in Northern Ireland.
Remuneration of the executive management
In 1998 the Company’s Annual General Meeting
resolved to grant the Board of Directors authority
to issue up to 3 million shares to be used for em-
ployee incentive compensation plans designed
to align the interest of management with those
of its shareholders. Under the terms of the stock
option plan, the options are not exercisable until
one year after grant at which point one third of
the options become exercisable in each of the
subsequent 3 years. All options under the stock
option plan carry a strike price that was deter-
mined by the market price of the stock on the
date of the grant.
At the end of March 2006, 2 key employees had
in total 2 334 options outstanding.
The management share option scheme was ter-
minated from and including 2004 and replaced
with a management cash bonus scheme from
2005. The beneficiaries of the scheme are the ex-
ecutive management and certain key personnel.
Annual payments under the scheme, maximized
to one year’s salary, are subject to the Group
achieving certain pre-defined financial criteria,
including achieved budget goals and develop-
ment of the Company’s share price. See also
notes 4 and 23.
Information and communications
The Company provides information to the mar-
ket through quarterly and annual reports, in-
vestor- and analyst presentations open to the
media and by making operational and financial
information available on the company’s website.
Events of importance are made available to the
stock market through notification to the Oslo
Stock Exchange in accordance with the Stock
Exchange regulations. Information is provided in
Norwegian and English.

Fred. Olsen Energy ASA - Annual Report 2005��
��
Fred. Olsen Energy ASA - Annual Report 2005
Contract Overview
Name/ Built year/ Water
Ownership Type Location upgrade depth Features
ONGCBelford Dolphin Drill ship India 2000 10 000 ft 80 000 barrels storage (100%) 15 000 psi
Deepwater upgradeBlackford Dolphin Aker H-3 1974/-07 7 000 ft 2*85 t deck cranes (100%) 15 000 psi
Norsk HydroBideford Dolphin Aker H-3 Norway, 1975/-99 1 500 ft 1*40 t + 1*50 t deck cranes(100%) North Sea 10 000 psi
StatoilBorgland Dolphin Aker H-3 Norway, 1976/-99 1 500 ft 1*40 t + 1*70 t deck cranes (100%) North Sea 15 000 psi
Tullow/Nexen2)Borgsten Dolphin Aker H-3 UK, 1975 1 500 ft 1*50 t +1*40 t deck cranes (100%) North Sea /-85/-95/-00 10 000 psi
PemexBorgny Dolphin Aker H-3 Mexico 1977 2 300 ft 2*50 t deck cranes (100%) /-85/-91/-92/-97/-02 10 000 psi
CNRByford Dolphin Aker H-3 UK, 1973 1 500 ft 2*40 t deck cranes (100%) North Sea /-85/-90/-96/-98 15 000 psi
Various Peak 1)Bredford Dolphin Aker H-3 UK, 1976 1 500 ft 2*40 t deck cranes (100%) North Sea /-81/-97/-01 10 000 psi
SMC/Pemex ShellBorgholm Dolphin Aker H-3 UK, 1975/-02 2*49 t deck cranes (100%) North Sea
PemexBulford Dolphin Aker H-3 West Africa 1977/-03 1 500 ft 2*40 t deck cranes (Owned by FOL) 10 000 psi

Fred. Olsen Energy ASA - Annual Report 2005 ��
��
Fred. Olsen Energy ASA - Annual Report 2005
Name/ Built year/ Water
Ownership Type Location upgrade depth Features
Contract Overview
20082007200620052004
1) Total 2) ChevronTexaco 3) CNR class renewal survey
ONGCBelford Dolphin Drill ship India 2000 10 000 ft 80 000 barrels storage (100%) 15 000 psi
Deepwater upgradeBlackford Dolphin Aker H-3 1974/-07 7 000 ft 2*85 t deck cranes (100%) 15 000 psi
Norsk HydroBideford Dolphin Aker H-3 Norway, 1975/-99 1 500 ft 1*40 t + 1*50 t deck cranes(100%) North Sea 10 000 psi
StatoilBorgland Dolphin Aker H-3 Norway, 1976/-99 1 500 ft 1*40 t + 1*70 t deck cranes (100%) North Sea 15 000 psi
Tullow/Nexen2)Borgsten Dolphin Aker H-3 UK, 1975 1 500 ft 1*50 t +1*40 t deck cranes (100%) North Sea /-85/-95/-00 10 000 psi
PemexBorgny Dolphin Aker H-3 Mexico 1977 2 300 ft 2*50 t deck cranes (100%) /-85/-91/-92/-97/-02 10 000 psi
CNRByford Dolphin Aker H-3 UK, 1973 1 500 ft 2*40 t deck cranes (100%) North Sea /-85/-90/-96/-98 15 000 psi
Various Peak 1)Bredford Dolphin Aker H-3 UK, 1976 1 500 ft 2*40 t deck cranes (100%) North Sea /-81/-97/-01 10 000 psi
SMC/Pemex ShellBorgholm Dolphin Aker H-3 UK, 1975/-02 2*49 t deck cranes (100%) North Sea
PemexBulford Dolphin Aker H-3 West Africa 1977/-03 1 500 ft 2*40 t deck cranes (Owned by FOL) 10 000 psi
20102009
Anadarko
Reliance Industries Ltd.
Drilling Production Technology as
3)
Talisman/Shell
Equator
Mob.
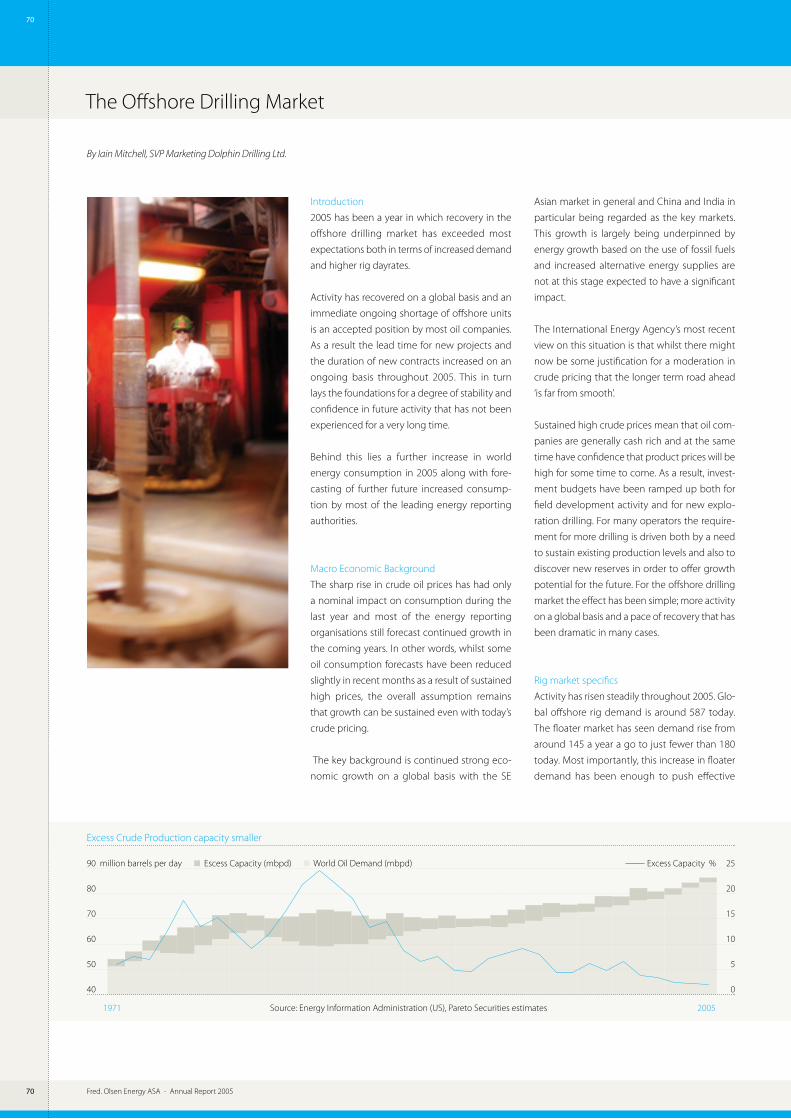
Fred. Olsen Energy ASA - Annual Report 2005�0
�0
Fred. Olsen Energy ASA - Annual Report 2005
40
50
60
70
80
90
0
5
10
15
20
25
The Offshore Drilling Market
By Iain Mitchell, SVP Marketing Dolphin Drilling Ltd.
Excess Crude Production capacity smaller
90 million barrels per day Escess Capacity (mbpd) World Oil Demand (mbpd) Excess Capacity % 25
80 20
70 15
60 10
50 5
40 0
1971 Source: Energy Information Administration (US), Pareto Securities estimates 2005
Introduction
2005 has been a year in which recovery in the
offshore drilling market has exceeded most
expectations both in terms of increased demand
and higher rig dayrates.
Activity has recovered on a global basis and an
immediate ongoing shortage of offshore units
is an accepted position by most oil companies.
As a result the lead time for new projects and
the duration of new contracts increased on an
ongoing basis throughout 2005. This in turn
lays the foundations for a degree of stability and
confidence in future activity that has not been
experienced for a very long time.
Behind this lies a further increase in world
energy consumption in 2005 along with fore-
casting of further future increased consump-
tion by most of the leading energy reporting
authorities.
Macro Economic Background
The sharp rise in crude oil prices has had only
a nominal impact on consumption during the
last year and most of the energy reporting
organisations still forecast continued growth in
the coming years. In other words, whilst some
oil consumption forecasts have been reduced
slightly in recent months as a result of sustained
high prices, the overall assumption remains
that growth can be sustained even with today’s
crude pricing.
The key background is continued strong eco-
nomic growth on a global basis with the SE
Asian market in general and China and India in
particular being regarded as the key markets.
This growth is largely being underpinned by
energy growth based on the use of fossil fuels
and increased alternative energy supplies are
not at this stage expected to have a significant
impact.
The International Energy Agency’s most recent
view on this situation is that whilst there might
now be some justification for a moderation in
crude pricing that the longer term road ahead
‘is far from smooth’.
Sustained high crude prices mean that oil com-
panies are generally cash rich and at the same
time have confidence that product prices will be
high for some time to come. As a result, invest-
ment budgets have been ramped up both for
field development activity and for new explo-
ration drilling. For many operators the require-
ment for more drilling is driven both by a need
to sustain existing production levels and also to
discover new reserves in order to offer growth
potential for the future. For the offshore drilling
market the effect has been simple; more activity
on a global basis and a pace of recovery that has
been dramatic in many cases.
Rig market specifics
Activity has risen steadily throughout 2005. Glo-
bal offshore rig demand is around 587 today.
The floater market has seen demand rise from
around 145 a year a go to just fewer than 180
today. Most importantly, this increase in floater
demand has been enough to push effective

Fred. Olsen Energy ASA - Annual Report 2005 �1
�1
Fred. Olsen Energy ASA - Annual Report 2005
The Offshore Drilling Market
utilisation of actively marketed units to close to
100% during the last year.
Deepwater Floaters
Sustained chartering activity in 2005 means that
the ultra deepwater fleet is already committed
into 2008 and beyond in many cases. Operators
quickly seemed to accept the need for longer
term charters and two to three year commit-
ments have been the norm for some time. At the
high end of the market rates have risen to above
$400,000; and we have actually observed dayrates
above $500,000. Though more recently there ap-
pears to be something of a ‘ceiling’ emerging at
around the $450,000 level for term contracts. In
part this is no doubt linked to the entry of new-
build unit from 2008/2009 onwards.
Key growth areas have been in West Africa and
the US Gulf of Mexico. Other areas have also
played their part including India, Latin America
and to a limited extent in South East Asia.
As the ultra deepwater market tightened there
has been a corresponding uplift in activity for
slightly lower specification mid deepwater units.
This market segment typically covers the 3,000
to 6,000 ft water depth range and in many cases
includes upgraded semis and drillships of vary-
ing capability. As the ultra deepwater fleet has
become increasingly committed, operators
have had little choice but to contract some of
these slightly lower specification units in order
to secure project timetables. This means that
some of the most recent contracts for mid deep-
water units have been in the range $350,000
to $400,000, and in several cases have been at
higher levels than some of the earlier fixtures of
ultra deepwater units.
Now, even this mid deepwater segment is close
to being sold out with few obvious additional
candidates to be reactivated or upgraded to
help satisfy outstanding demand in the coming
one to two years.
One key feature of the deepwater market in
2005 has been the high level of newbuilding
orders that have been placed. Today there are
approximately 24 newbuild units on order of
which only seven or eight have confirmed con-
tracts. This represents the most significant level
of newbuilding activity in over twenty years and
will mark a major expansion in available capacity
from 2008 onwards.
Shallow Water Floaters
The shallow water floater market has to a large
extent followed the trend set by the deepwater
market. Demand has continued to rise led by
the North Sea, SE Asia, West Africa and to an
extent the US Gulf. In particular there was a
significant switch to longer term contracting as
2005 progressed and this has helped accelerate
growing concern about rig availability amongst
operators. Rates for standard water depths semis
rose from around $130,000 per day in the early
part of the year to above $200,000 by late 2005.
These rates have been achieved on a general
international basis with more specific fixtures in
the UK and Norway being set at above $300,000
per day.
To an extent, rising rates have been helped
by some of the earlier consolidation that has
occurred in the drilling contracting business.
Many of the larger established contractors have
been observed to take a disciplined approach to
the market recovery, pushing for rate increases
where possible and not rushing to reactivate
every idle semi at the earliest opportunity.
For a rig owner this combination is of course very
promising and has lead to more than one ana-
lyst writing of the strongest long term outlook
for the offshore drilling business that there has
ever been. Given the long term nature of many
current contracts it is relatively easy to look out
two or three years with some confidence, par-
ticularly for those drilling contractors with a rea-
sonable level of contract backlog.
Dayrates Floaters
500 USD/Day 5G International 3G Norway Standard semis UK
400
300
200
100
0 Source: Pareto
01.2003 03.20060
100
200
300
400
500

Fred. Olsen Energy ASA - Annual Report 2005 Fred. Olsen Energy ASA - Annual Report 2005
Management Report
The Group provides services and operates with-
in the two business segments (i) offshore drill-
ing and (ii) engineering and fabrication. Within
the offshore drilling segment the Group owns
and/or operates one deepwater drill-ship and 9
semi submersible units including one accom-
modation unit. Through its subsidiary Harland
and Wolff plc. in Belfast, the Group is engaged
in ship repair, ship building, steel fabrication and
engineering services.
OFFSHORE DRILLING
Dolphin Drilling Ltd, based in Aberdeen, Scot-
land, Dolphin AS in Stavanger and Dolphin
Drilling Pte. Ltd in Singapore form the Com-
pany’s drilling division (together referred to as
“Dolphin”). Dolphin is recognized as a medium-
sized international drilling contractor and has a
leading position in Europe in providing offshore
drilling services for more than 35 years. The
fleet includes 8 semi-submersible drilling-units,
one semi-submersible accommodation unit
and one ultra-deepwater drill-ship. The semi-
submersible drilling-unit Blackford Dolphin,
will be upgraded to a deepwater unit capable
of operating in up to 7000 feet of water when
the upgrade is completed in mid 2007. One of
the drilling units, Bulford Dolphin, is owned by
First Olsen Ltd. and is operating in a profit shar-
ing pool together with four similar drilling-units
owned by the Company. Two units, Bideford
Dolphin and Borgland Dolphin, respectively,
have received Acknowledge of Compliance
(AOC) certificates qualifying for operations in
Norway. The Bredford Dolphin will receive an
AOC in August/September prior to commenc-
ing a long term drilling contract in Norwegian
waters. As of date, the units operated by the
Company work in the Norwegian and British
sectors of the North Sea, in the Gulf of Mexico,
offshore India and offshore Nigeria.
Bideford Dolphin
The semi-submersible drilling-unit Bideford
Dolphin was built in 1975 and was converted
to fourth generation technological capabilities
in 1999. Bideford Dolphin is specially designed
for completion work in the North Sea and has
a drilling depth capacity of 20,000 feet and
a water depth capability of 1,500 feet, and is
equipped with a Ram Rig, an 8 point mooring
system assisted by two thrusters and a 10,000 psi
blow-out preventer. Bideford Dolphin has been
operating in Norway for Norsk Hydro Produksjon
since 1999. The last contract was entered into in
October 2004 with Norsk Hydro in direct con-
tinuation with the previous contract. The new
contract is currently estimated to last into the
fall of 2007. Bideford Dolphin has been working
for Norsk Hydro for the entire of 2005 and has
primarily carried out drilling and completions
operations on the Oseberg J structure (Tampen
area).
Borgland Dolphin
The semi submersible drilling-unit Borgland
Dolphin was built in 1977 and converted to
fourth generation technological capabilities in
1999. Borgland Dolphin has a drilling depth ca-
pacity of 25,000 feet and a water depth capa-
bility of 1,500 feet, and is equipped with a Ram
Rig, fixed eight point K4 chain anchor mooring
system and a 15,000 psi blow-out preventer.
Borgland Dolphin is specially designed for com-
pletion work in the North Sea and has been op-
erating in Norway for Statoil. The last contract
was signed in 2005 bringing Borgland Dolphin’s
commitment with Statoil until the end of De-
cember 2009. Borgland Dolphin has been work-
ing for Statoil for the entire of 2005. For most of
the year Borgland Dolphin has been located at
the Gullfaks field.
�2
�2

Fred. Olsen Energy ASA - Annual Report 2005 Fred. Olsen Energy ASA - Annual Report 2005
Management Report
Belford Dolphin
Belford Dolphin was built in 2000 as a 5th gen-
eration DP3 ultra deepwater drill-ship with wa-
ter depth capacity of 10,000 feet, drilling depth
capacity of 30,000 feet, a 15,000 psi blow out
preventer and with 80,000 barrels of oil storage.
The Company acquired Belford Dolphin in 2001.
In 2003, Belford Dolphin was awarded a three-
year contract by ONGC in India. The contract
with ONGC is an integrated services contract,
i.e. Dolphin is responsible for all operational co-
ordination activities, such as helicopter services,
supply vessels, mud, logging, well testing, ROV
operations, cementing and well design, includ-
ing delivery of well heads. ONGC supply casing
and drilling bits. Belford Dolphin commenced
the drilling campaign for ONGC in November
2003 on the west coast and drilled several wells
in water depths ranging from 1,200 meters up
to 2,860 meters. The initial drilling campaign on
the west coast was completed late December
2004. Thereafter, the ship moved to the east
coast of India where it has continued its opera-
tion. In September 2005 the Company entered
into a three years drilling contract with Anadarko
commencing early 2007 primarily for operations
in US waters.
Borgny Dolphin
The semi-submersible drilling unit Borgny Dol-
phin was built in 1977 and modified for subsea
development programs and was last upgraded
in 2003. The Borgny Dolphin has a drilling depth
capacity of 25,000 feet and a water depth ca-
pability of 2,300 feet and is equipped with a
12 point mooring system and an active heave
compensation system, making Borgny Dolphin
suitable for subsea field development work. The
blow out preventer has a capacity of 10,000 psi.
Borgny Dolphin was awarded a contract for op-
erations in Mexican waters in 2003 for Pemex for
a period of 4 years until January 2008.
Bulford Dolphin
The semi-submersible drilling unit Bulford Dol-
phin was built in 1977 and was last upgraded
in 2003. The unit has a water depth capacity of
1,500 feet and drilling capacity of 25,000 feet
and is equipped with an 8 point mooring sys-
tem. The blow out preventer has a capacity of
10,000 psi. The unit is owned by First Olsen Ltd.
and is operated by Dolphin in a profit sharing rig
pool with four similar units owned by the Com-
pany. Bulford Dolphin was awarded a contract
in Mexico for Pemex in 2003 for a period of 2
��
��
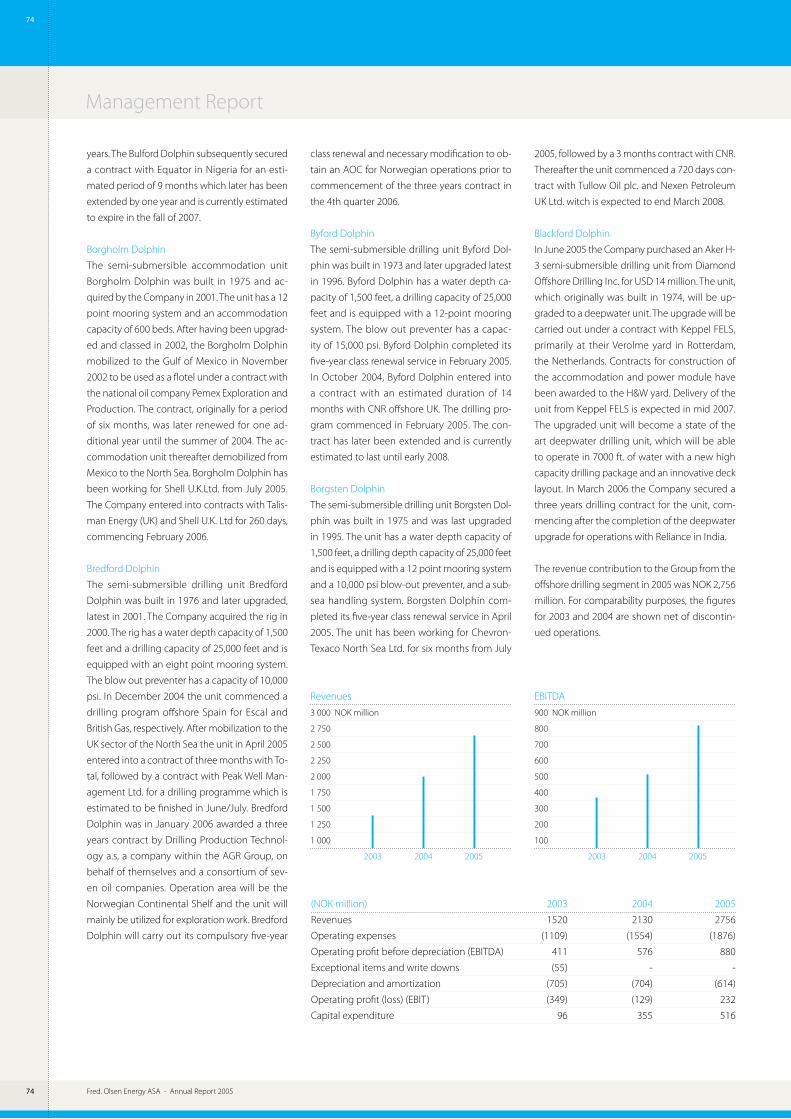
Fred. Olsen Energy ASA - Annual Report 2005�4
�4
Fred. Olsen Energy ASA - Annual Report 2005
Management Report
years. The Bulford Dolphin subsequently secured
a contract with Equator in Nigeria for an esti-
mated period of 9 months which later has been
extended by one year and is currently estimated
to expire in the fall of 2007.
Borgholm Dolphin
The semi-submersible accommodation unit
Borgholm Dolphin was built in 1975 and ac-
quired by the Company in 2001. The unit has a 12
point mooring system and an accommodation
capacity of 600 beds. After having been upgrad-
ed and classed in 2002, the Borgholm Dolphin
mobilized to the Gulf of Mexico in November
2002 to be used as a flotel under a contract with
the national oil company Pemex Exploration and
Production. The contract, originally for a period
of six months, was later renewed for one ad-
ditional year until the summer of 2004. The ac-
commodation unit thereafter demobilized from
Mexico to the North Sea. Borgholm Dolphin has
been working for Shell U.K.Ltd. from July 2005.
The Company entered into contracts with Talis-
man Energy (UK) and Shell U.K. Ltd for 260 days,
commencing February 2006.
Bredford Dolphin
The semi-submersible drilling unit Bredford
Dolphin was built in 1976 and later upgraded,
latest in 2001. The Company acquired the rig in
2000. The rig has a water depth capacity of 1,500
feet and a drilling capacity of 25,000 feet and is
equipped with an eight point mooring system.
The blow out preventer has a capacity of 10,000
psi. In December 2004 the unit commenced a
drilling program offshore Spain for Escal and
British Gas, respectively. After mobilization to the
UK sector of the North Sea the unit in April 2005
entered into a contract of three months with To-
tal, followed by a contract with Peak Well Man-
agement Ltd. for a drilling programme which is
estimated to be finished in June/July. Bredford
Dolphin was in January 2006 awarded a three
years contract by Drilling Production Technol-
ogy a.s, a company within the AGR Group, on
behalf of themselves and a consortium of sev-
en oil companies. Operation area will be the
Norwegian Continental Shelf and the unit will
mainly be utilized for exploration work. Bredford
Dolphin will carry out its compulsory five-year
class renewal and necessary modification to ob-
tain an AOC for Norwegian operations prior to
commencement of the three years contract in
the 4th quarter 2006.
Byford Dolphin
The semi-submersible drilling unit Byford Dol-
phin was built in 1973 and later upgraded latest
in 1996. Byford Dolphin has a water depth ca-
pacity of 1,500 feet, a drilling capacity of 25,000
feet and is equipped with a 12-point mooring
system. The blow out preventer has a capac-
ity of 15,000 psi. Byford Dolphin completed its
five-year class renewal service in February 2005.
In October 2004, Byford Dolphin entered into
a contract with an estimated duration of 14
months with CNR offshore UK. The drilling pro-
gram commenced in February 2005. The con-
tract has later been extended and is currently
estimated to last until early 2008.
Borgsten Dolphin
The semi-submersible drilling unit Borgsten Dol-
phin was built in 1975 and was last upgraded
in 1995. The unit has a water depth capacity of
1,500 feet, a drilling depth capacity of 25,000 feet
and is equipped with a 12 point mooring system
and a 10,000 psi blow-out preventer, and a sub-
sea handling system. Borgsten Dolphin com-
pleted its five-year class renewal service in April
2005. The unit has been working for Chevron-
Texaco North Sea Ltd. for six months from July
2005, followed by a 3 months contract with CNR.
Thereafter the unit commenced a 720 days con-
tract with Tullow Oil plc. and Nexen Petroleum
UK Ltd. witch is expected to end March 2008.
Blackford Dolphin
In June 2005 the Company purchased an Aker H-
3 semi-submersible drilling unit from Diamond
Offshore Drilling Inc. for USD 14 million. The unit,
which originally was built in 1974, will be up-
graded to a deepwater unit. The upgrade will be
carried out under a contract with Keppel FELS,
primarily at their Verolme yard in Rotterdam,
the Netherlands. Contracts for construction of
the accommodation and power module have
been awarded to the H&W yard. Delivery of the
unit from Keppel FELS is expected in mid 2007.
The upgraded unit will become a state of the
art deepwater drilling unit, which will be able
to operate in 7000 ft. of water with a new high
capacity drilling package and an innovative deck
layout. In March 2006 the Company secured a
three years drilling contract for the unit, com-
mencing after the completion of the deepwater
upgrade for operations with Reliance in India.
The revenue contribution to the Group from the
offshore drilling segment in 2005 was NOK 2,756
million. For comparability purposes, the figures
for 2003 and 2004 are shown net of discontin-
ued operations.
(NOK million) 2003 2004 2005
Revenues 1520 2130 2756
Operating expenses (1109) (1554) (1876)
Operating profit before depreciation (EBITDA) 411 576 880
Exceptional items and write downs (55) - -
Depreciation and amortization (705) (704) (614)
Operating profit (loss) (EBIT) (349) (129) 232
Capital expenditure 96 355 516
Revenues
3 000 NOK million
2 750
2 500
2 250
2 000
1 750
1 500
1 250
1 000
2003 2004 2005
EBITDA
900 NOK million
800
700
600
500
400
300
200
100
2003 2004 2005

Fred. Olsen Energy ASA - Annual Report 2005 ��
��
Fred. Olsen Energy ASA - Annual Report 2005
Management Report
ENGINEERING AND FABRICATION
Harland and Wolff was founded as a shipyard
in1852 and became a subsidiary of the Com-
pany in 1997. During recent years, Harland and
Wolff has refocused its operations to a single,
technically led project management offering a
broad range of services to the offshore and ma-
rine industries, with a particular focus on:
Shipbuilding, Ship repair and conversion
Structural engineering
Design engineering
The principal activities of Harland & Wolff are the
design and construction/conversion of floating
production and drilling vessels for the offshore
oil and gas industry, shipbuilding, heavy engi-
neering and ship repair.
In 2005, Harland & Wolff continued to fine tune
its organisation and facilities to better meet its
markets and, in the first half of the year, further
reduced its core employment to 95 people,
while retaining its key core skills and recruiting
on a temporary basis to meet peak workload
requirements.
Shipbuilding, Shiprepair and Offshore
During 2005, the yard provided services to some
forty four vessels ranging from short duration
emergency repairs (both on and off site), normal
maintenance repair dockings and longer dura-
tion major refits.
H&W continued its strong relationship with
Stena, docking two HSS vessels and a standard
ferry, and for the first time, were contracted by
Irish Ferries for the docking of their four cross
channel ferries. It also docked two large coal
carriers for Meridian and increased the number
of vessels being docked and berthed from
various owners operating out of the port of
Belfast.
In the first half of the year, H&W completed the
survey and upgrade work on three offshore drill-
ing rigs, the semi submersible units Borgholm
Dolphin, Byford Dolphin and Borgsten Dolphin.
The main building dock and surrounding areas
were fully occupied from March to the end of
the year as a Logistics and Assembly Base for
MPI’s (‘Marine Project International’) installation
of the Barrow Windfarm.
Heavy Engineering
During the year, four bridges totaling some 1,000
tonnes of steel were fabricated and installed at
locations as diverse as Cork in the Republic of
Ireland, West Taunton in South West England,
Montrose in Scotland and Omagh in Northern
Ireland.
Further steelwork structures were fabricated
and installed in relation to the MPI contract. In
addition, H&W secured and commenced the
(NOK million) 2003 2004 2005
Revenues 177 213 127
Operating expenses (198) (225) (87)
Operating profit before depreciation (EBITDA) (21) (12) 40
Exceptional items and write downs - 21 -
Depreciation and amortization (4) (4) (4)
Operating profit (loss) (EBIT) (25) 5 36
Capital expenditure 14 3 3
Revenues
200 NOK million
175
150
125
100
75
50
25
0
2003 2004 2005
EBITDA
50 NOK million
40
30
20
10
0
(10)
(20)
(30)
2003 2004 2005
contract for the fabrication of a prototype
‘Wavebob’ wave power generator and com-
menced work on the fabrication of large steel
trusses for a major shopping center develop-
ment at Victoria Square in Belfast.
Design
In addition to providing ongoing support for the
marine and heavy engineering projects being
undertaken by the Group, H&W’s design team
continued to secure further external contracts
from existing and new customers.
The ongoing work for Lloyds in relation to
Marspec, Tonnage and Ship Emergency Re-
sponse Service (‘SERS’) was supplemented by
a number of larger design packages. Work also
continued for Thales on the CVF project in Bris-
tol and H&W recommenced its relationship with
Nassco providing on site support in San Diego.
H&W also secured significant work from Gren-
land Framnes of Norway in relation to engineer-
ing work for an oil rig conversion and provided
engineering support to sister companies within
the Fred. Olsen Energy Group.
Financial figures Engineering and Fabrication
The revenue contribution to Fred. Olsen Energy
in 2005 was NOK 127 million. For comparabil-
ity purposes, the figures for 2004 and 2003 are
shown net of discontinued operations.
Fred. Olsen Energy ASA - Annual Report 2005��
��
Quality, Health, Safety and Environment
Dolphin Drilling Ltd, based in Aberdeen, Scot-
land, Dolphin AS in Stavanger and Dolphin Drill-
ing Pte. Ltd in Singapore form the Company’s
drilling division (together referred to as “Dol-
phin”). Quality, Health, Safety and Environmen-
tal (QHS&E) is an integrated part of Dolphin’s
worldwide operations within offshore drilling
and accommodation services.
The standards upon which Dolphin’s QHS&E
Management system are based are the Inter-
national Safety Management (ISM) Code for the
safe operation of ships (including MODU) and
for Pollution Prevention, the International Ship
and Port Security Code (ISPS), Norwegian HSE
Regulations in the Petroleum Industry, Health
and Safety Executive publication HSG 65, the
Safety Case Regulations and ISO 9001:2000. Fol-
lowing these standards a QHS&E Plan is created
annually, defining measurable and time-related
goals to allow for continuous improvement and
development.
Goals
The Company’s goals for every shift, every day
and every week of operation are:
Injury-free day-to-day operations.
No major incidents, which could have caused
injuries.
No spills to sea/ground water.
To operate and maintain equipment in a safe
and efficient manner.
Quality, Health, Safety and Environment (QHS
&E), which include social and environmental
performance, are an integrated part of all the
Company’s activities. The objective of the QHS&E
plan is to establish and maintain a culture where
there is no incident or accident, damage to the
environment, break down or operational losses.
In 2004 Dolphin reviewed the QHS&E Manage-
ment System, completed all necessary changes
to comply in all countries and received BS-EN-
ISO 9001-2000 Management System Certificate
for the Provision, Management and Support of
Deepwater Drillship, Mobile Offshore Drilling
and Accommodation Unit Operations. In Janu-
ary 2006 a scheduled ISO 9001-2000 Periodic
Audit was conducted by the Certifying Author-
ity and no major non-conformances were identi-
fied. During 2005 all Dolphin operating vessels
changed to Singapore flag. Subsequently all
vessels were successfully re-audited in line with
the ISPS International Ship Security Code and
ISM Code.
Dolphin’s combined 2005 goals and objectives
particularly focused on:
Safe, Trouble Free Operations
Achieved through application of our key
QHS&E processes:
1. Hazard Identification and Risk Assessment.
2. Active Monitoring and Audit (Routine, Man-
agement, Worksite Visit Reports).
3. Lifting Operations.
4. Control of Non-conformance and Follow-
up Process.
5. Safety Critical Maintenance.
Leadership – ‘Compliance and Consequence’
Programmes and Procedures.
Understanding, Communication and Enforce-
ment.
External Environment
In order to improve the focus on prevention of
harm to the external environment Dolphin has
decided to develop an Environmental Manage-
ment System in compliance with EN-ISO 14001.
The plan is to obtain the EN-ISO 14001 Certifi-
cate in 2006. The purpose of the Environmen-
tal Management System will be to ensure that
all activities, processes and services in Dolphin,
which may effect the environment, are control-
led and monitored.
Dolphin’s policy is to reduce, reuse and recycle as
far as reasonably practicable. Dolphin’s Disposal
of Waste procedure provides guidance on the
disposal of solid and liquid waste arising from
Dolphin offshore operations. In addition, imple-
mentation ensures consistently high standards
of waste management in order to:
Minimise damage to the environment.
Ensure effective use of resources.
Reduce occupational health and safety risks.
Minimise costs.
Competence
Dolphin’s competence assurance process was
put in place during 2004 to ensure that all em-
ployees, irrespective of position within the Com-
pany, are trained and competent in relation to
individual jobs and Dolphin’s health, safety and
environmental responsibilities.
Identified positions within Dolphin have an ap-
propriate Standard of Competence applying to
all such employees in that position. Additionally,
optional units and/or elements representing
unique operational requirements for that posi-
tion may be defined.
HSE-results
Personal Injuries
Dolphin had during 2005 a positive trend related
to personal injuries. The combined frequency in
2005 was 1.8 compared to the combined fre-
quency for 2004 of 8.5 (statistics measured by
incidents per 1,000,000 working hours).
Serious Incidents
Dolphin had during 2005 a positive trend related
to serious incidents. The combined serious inci-
dent frequency was 5.8 for the rigs at the end of
the year compared to 7.25 for 2004.
Damage to the External Environment
Dolphin had during 2005 a satisfactory result re-
lated to discharge to the external environment.
Only 2 minor spills to the external environment is
registered, however the spills were less than 1m3
and as such not reported to the authorities.
HSE Culture
Dolphin’s internal HSE culture measurements
also show a positive trend.
In 2005 Dolphin AS participated in the Petro-
leum Safety Agency’s HSE culture project. The
results from this project will be available 2nd
quarter of 2006. In order to keep up the good
culture trend Dolphin AS has continued Statoil’s
Safe Behaviour Programme for all employees.
Reduction of chemicals and implementation
of further noise reduction measures have also
been key projects in 2005.
Dolphin Drilling Ltd.’s offshore/onshore employees
have in 2005 and continuing through 2006 partici-
pated in IADC STEP Change programme regard-
ing Personal Responsibility for Safety (PRfs). PRfS
seminars have been developed and delivered by
Dolphin Drilling Ltd with involvement of person-
nel from all levels of the workforce and third parties
e.g. HSE, Client Company Representatives etc.
PRfs is focusing on each individual working
safely as well as the safety of others involved,
emphasizing the need for intervening when
unsafe behaviour or conditions is observed. The
nine key factors are:
Clear Expectations
Effective Communication
Personal Leadership
Personal Risk Awareness
Planning
The Right and Duty to Intervene
Accountability
Self Evaluation
Develop, Encourage and Sustain Safe
Behaviours

��
��Fred. Olsen Energy ASA - Annual Report 2005
��

Annual Report 2005
Reporter Print: RK Grafisk
Fred. Olsen Energy ASAEnterprise number: 977 388 287Fred. Olsens gate 2N-0152 Oslo, NorwayTelephone: +47 22 34 10 00Fax: +47 22 41 18 40E-mail: [email protected]
Helge Haakonsen, Chief Executive Officer
Jan Peter Valheim,Chief Financial Officer
Dolphin a.sEnterprise number: 920 473 210Platformveien 5N-4056 Tananger, NorwayTelephone: + 47 51 69 43 00Fax: + 47 51 69 61 [email protected] www.dolphin.as
Joakim Kleppe, Managing Director
Dolphin Drilling Ltd. UK Registration number: 1017560Howe Moss Dr., Kirkhill Industr. Est.Dyce, Aberdeen AB2 OGL, ScotlandTelephone: +44 1224 411 411Fax: +44 1224 723 267E-mail: [email protected]
Per Johansson, Managing Director
Dolphin Drilling Pte. Ltd.Enterprise number: 200303833E3 Temasek Avenue #34-38 Centennial Tower Singapore 039190Telephone: +65 6549 7739FAX: +65 6549 7575E-mail: [email protected]
John A. Sydness, Managing Director
Harland and Wolff Group Plc.UK Registration number: NI 38422Queen’s Island, Belfast BT3 9DUNorthern IrelandTelephone: +44 2890 458 456Fax: +44 2890 458 515E-mail: [email protected]
Robert Cooper, Managing Director