annual report 2006 - 任天堂ホームページuji-ogura and uji-okubo plants received iso-9002....
TRANSCRIPT

Annual Report 2006


Over the past two decades, the video game industry has grown into a respected
entertainment medium, with annual sales rivaling box office receipts for the movie
industry. Nintendo continues to create unique software - driven entertainment by
ensuring that our hardware and software are created with only one goal in mind,
an enjoyable playing experience for all. This mindset has enabled Nintendo to create
products and characters beloved by people around the world.
The video game industry has grown tremendously, but market expansion efforts have
stalled because the development of games that are more complex and graphically
intense has been the focus of game companies for too long. Declining game software
sales in the North American market last year illustrate that this slowing of game sales
is now problematic outside the Japanese market as well.
With these circumstances in mind, Nintendo has implemented a strategy which
encourages people around the world to play video games regardless of their age,
gender or cultural background. Our goal is to expand the gaming population.
The first tangible product that comes from this strategic direction is the Nintendo DS,
which employs unique features like dual-screens, a touch-screen, wireless communication
and voice recognition technology to take gaming in a new direction. On the software
front, Nintendo has created dedicated game titles, under the heading “Touch!
Generations“, which give veteran game players fresh gaming experiences while
allowing those who have never played video games to easily enjoy the experience.
Message from the President

As a result, one of these tit les, Nintendogs, has sold 6.65 mil l ion copies globally
in the last f iscal year. Also, the total sales of the two Brain Age (Brain Training)
t it les and Big Brain Academy are 5.1 mil l ion units in the Japanese market alone. These
software are being enjoyed by older demographics and female audiences, as well as
traditional game players. Simultaneously, Nintendo created a free, safe and easy-to-
use wire less gaming service exc lus ively for Nintendo DS cal led, Nintendo Wi-F i
Connection. The rapidly expanding popularity of our service is also contributing to
the expansion of the gaming population.
Nintendo wil l continue to leverage our exceptional strength, which is derived from
the combinat ion of our world-c lass hardware design and our unr ival led internal
software development teams, to accelerate market expansion by creating software
for an ever-expanding audience, and intuitive hardware l ike the Nintendo DS and the
upgraded Nintendo DS Lite. In the home console market, Nintendo wil l launch Wii
and establish a new standard in game control using the unprecedented Wii Remote,
which wil l make game control intuitive for al l . Wii also features WiiConnect24, which
al lows Wii to maintain a wireless connection, with extremely low power consumption,
even when the Wii system is not in active use. Nintendo wil l encourage Wii users to
turn their system on every day by delivering a new experience each time the system
is used. This wil l be yet another method to help Nintendo expand the video
game population.
From Wii to DS Lite, Brain Age to Mario, Nintendo is committed to providing video
gaming exper iences that are enjoyable for everybody in the household.
Satoru Iwata
Nintendo Co ., Ltd.Pres ident

Nin tendo DS
©2005 Nintendo.
©2005 Nintendo. ©2005 Nintendo. ©2005 Nintendo.
©2005 Nintendo. ©2005-2006 Toshio Iwai/Nintendo.
33.56 Sold
milillion pcs.4.22
Soldmilillion pcs.
6.65Sold
milillion pcs.
2.01 Sold
million pcs.
* 1.24 Sold
million pcs.
1.18 Sold
million pcs.
*
The numbers shown above are consolidated sales in units (* show sales in units in Japan) for the fiscal year ended in March, 2006.6.65 million pcs. represent the combined total of the entire Nintendogs series.

Nin tendo DS L i te
Titles and package images shown above are for the U.S. market. (Except for ★))
©2005-2006 Nintendo. ©2006 NIKOLI CO., Ltd.
©2006 Nintendo. ©2006 Plato.
©2004 Nintendo.
©2005-2006 Nintendo.
©2005-2006 Nintendo.In collaboration with the Phoenix Country Club (PHOENIX SEAGAIA RESORT).
Tetris ® &©1985~2006 Elorg, a Tetris Holding Company. Licensed to The Tetris Company. Game Design by Alexey Pajitnov. Logo Design by Roger Dean. All Rights Reserved. Certain new game elements developed by Nintendo, and any characters, sounds and video games originally owned by Nintendo: ©2006 Nintendo.
★
3.56 Sold
million pcs.4.22
Soldmillion pcs.
6.65Sold
million pcs.
2.01 Sold
milillion pcs.
* 1.24 Sold
milillion pcs.
1.18 Sold
milillion pcs.
*
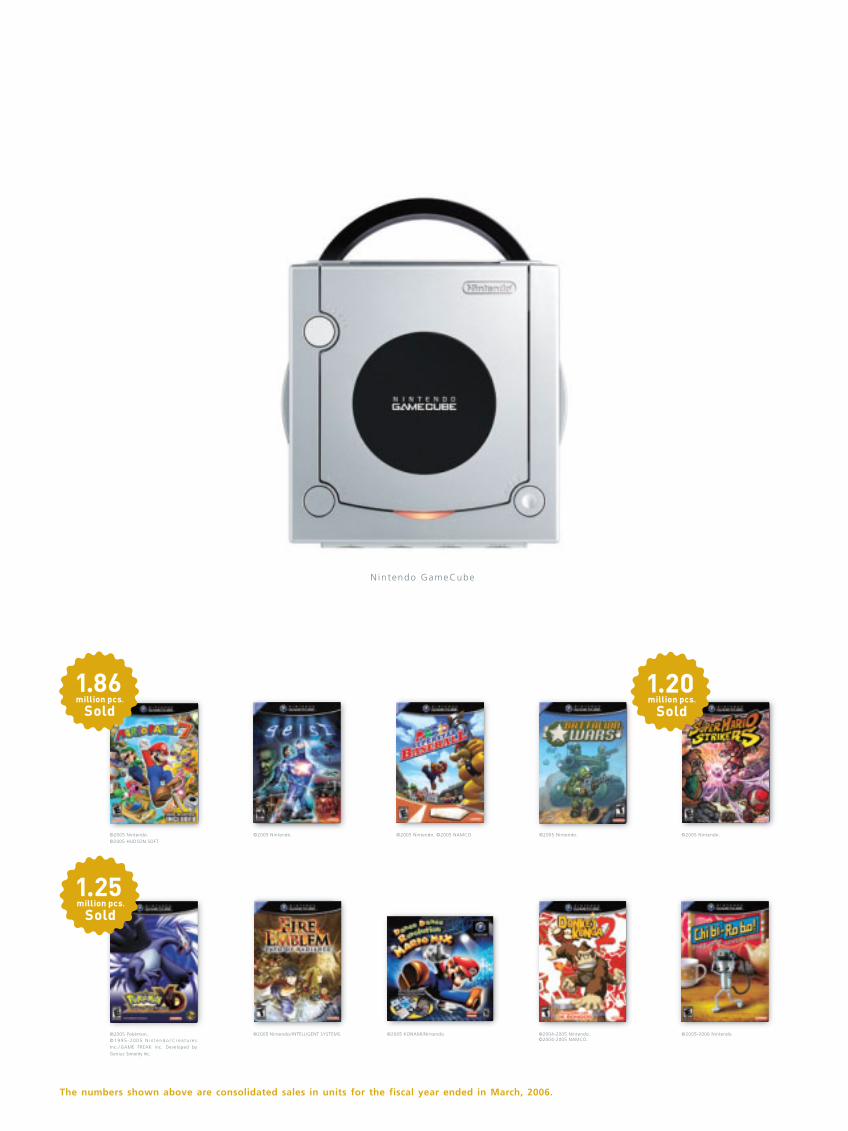
Nin tendo GameCube
3.57 Sold
million pcs.
1.86 Sold
milillion pcs.1.2020
Soldmilillion pcs.
1.25Sold
milillion pcs.
The numbers shown above are consolidated sales in units for the fiscal year ended in March, 2006.
©2005 Nintendo. ©2005 HUDSON SOFT.
©2005 Nintendo. ©2005 Nintendo. ©2005 Nintendo. ©2005 NAMCO. ©2005 Nintendo.
©2005 Nintendo / INTELLIGENT SYSTEMS. ©2005 KONAMI/Nintendo. ©2005-2006 Nintendo.©2005 Pokémon.© 1 9 9 5 - 2 0 0 5 N i n t e n d o / C re a t u r e s Inc. / GAME FREAK inc. Developed by Genius Sonority Inc.
©2004-2005 Nintendo.©2004-2005 NAMCO.
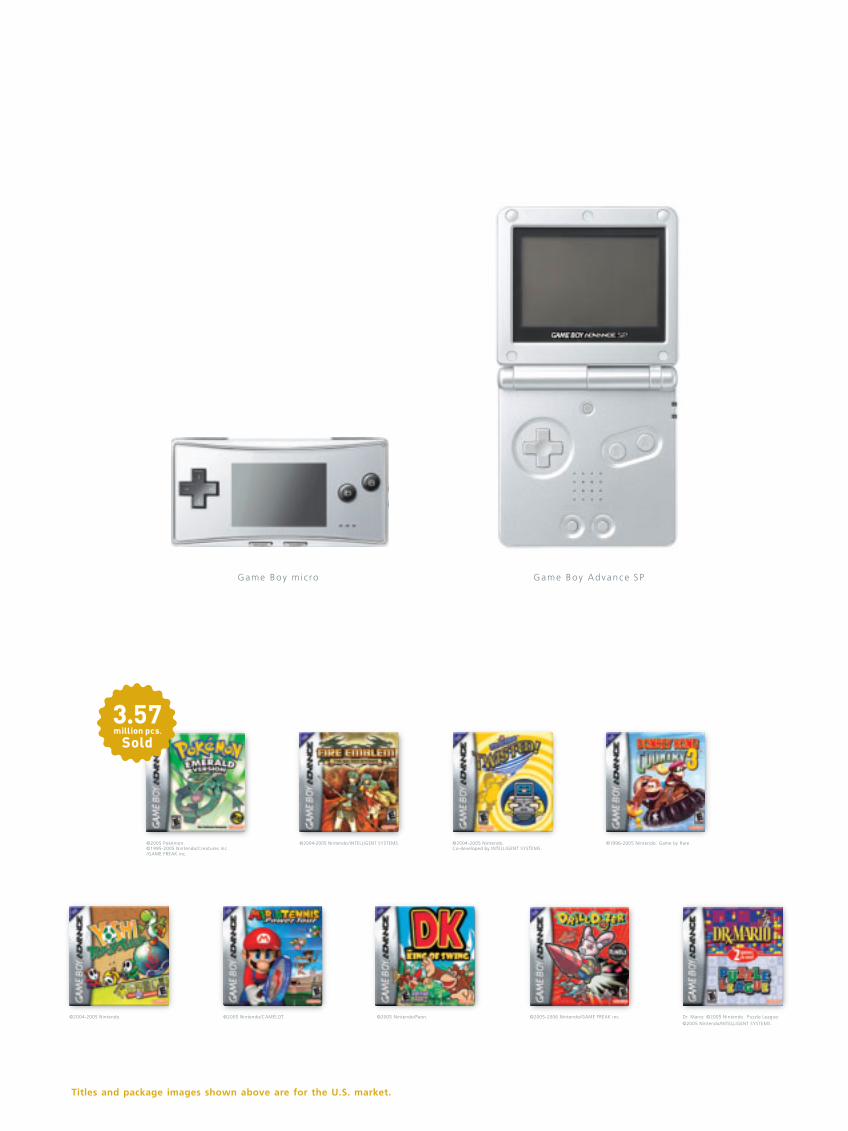
Game Boy mic ro Game Boy Advance SP
33.57 Sold
milillion pcs.
1.86 Sold
million pcs.1.20
Soldmillion pcs.
1.25Sold
million pcs.
Titles and package images shown above are for the U.S. market.
©2005 Pokémon.©1995-2005 Nintendo/Creatures Inc./GAME FREAK inc.
©2004-2005 Nintendo. Co-developed by INTELLIGENT SYSTEMS.
©2004-2005 Nintendo / INTELLIGENT SYSTEMS.
©2004-2005 Nintendo. ©2005 Nintendo/CAMELOT. ©2005 Nintendo/Paon. ©2005-2006 Nintendo/GAME FREAK inc. Dr. Mario: ©2005 Nintendo. Puzzle League: ©2005 Nintendo/INTELLIGENT SYSTEMS.
©1996-2005 Nintendo. Game by Rare.

2006 release

History of Nintendo
Fusajiro Yamauchi, great-grandfather of Hiroshi Yamauchi (the former President and current executive adviser), began manufacturing and sell ing Japanese playing cards, Hanafuda (flower cards), in Kyoto, Japan.
Started manufacturing and selling the first western-style playing cards in Japan.
Established Marufuku Co., Ltd.
Hiroshi Yamauchi took office as President.
Changed company name to Nintendo Playing Card Co., Ltd.
Built headquarters in Kyoto, Japan and consolidated the manufacturing facilities.
Became the first company to succeed in mass-producing plastic playing cards in Japan.
Started selling cards printed with Walt Disney characters, opening a new market for children's playing cards in Japan.
Listed stock on the second section of the Osaka Securities Exchange and on the Kyoto Stock Exchange.
Changed company name to the current Nintendo Co., Ltd. Started manufacturing and selling games and toys in addition to playing cards.
Built Uji plant in Kyoto, Japan.
Stock listing was changed to the first section of the Osaka Securities Exchange. Started sell ing the Beam Gun series, employing opto-electronics.
Developed the Laser Clay shooting-range system to succeed bowling as a major pastime.
Developed image projection system employing 16mm film projector and entered into the arcade business. Began exporting systems to the U.S. and Europe.
Developed Nintendo's first home video game machines, TV Game 15 and TV Game 6.
Established a wholly owned subsidiary, Nintendo of America Inc. in New York. Developed and started selling GAME & WATCH product l ine, the first portable LCD video games with a microprocessor.
Developed and began distribution of the coin-operated video game Donkey Kong.
Established Nintendo of America Inc. in Seattle, Washington and merged the New York subsidiary into it.
Started selling the home video game console Family Computer System employing a custom CPU (Central Processing Unit) and PPU (Picture Processing Unit). Listed stock on the first section of the Tokyo Stock Exchange.
Released the Nintendo Entertainment System (NES), the U.S. version of the Family Computer System, in the U.S. The NES game, Super Mario Bros. became a smash hit around the world.
Started selling the Family Computer Disk Drive System to expand the functions of the Family Computer System in Japan. Released NES in Europe.
Released the Legend of Zelda in the U.S.
On-line stock brokerage services utilizing the Family Computer Network System are started in Japan jointly with Nomura Securities. Enlarged Uji plant and built Uji-Ogura plant in Kyoto, Japan. Nintendo of America Inc. publishes the first issue of Nintendo Power magazine.
Introduced Game Boy, the first portable, hand-held game system with interchangeable game paks, in Japan and the U.S.
Nintendo enters the 16-bit console market with the release of the Super Famicom in Japan. Established Nintendo of Europe GmbH in Frankfurt, Germany. Released Game Boy in Europe.
The 16-bit Super Nintendo Entertainment System (Super NES), along with Super Mario World, is released in the U.S.
Super NES released in Europe. Nintendo of America Inc. develops portable Fun Centers to help the Starlight Children's Foundation bring happiness to hospitalized children by allowing them to enjoy their favorite video games during hospital stays.
1889
1902
1947
1949
1951
1952
1953
1959
1962
1963
1969
1970
1973
1974
1979
1980
1981
1982
1983
1985
1986
1987
1988
1989
1990
1991
1992
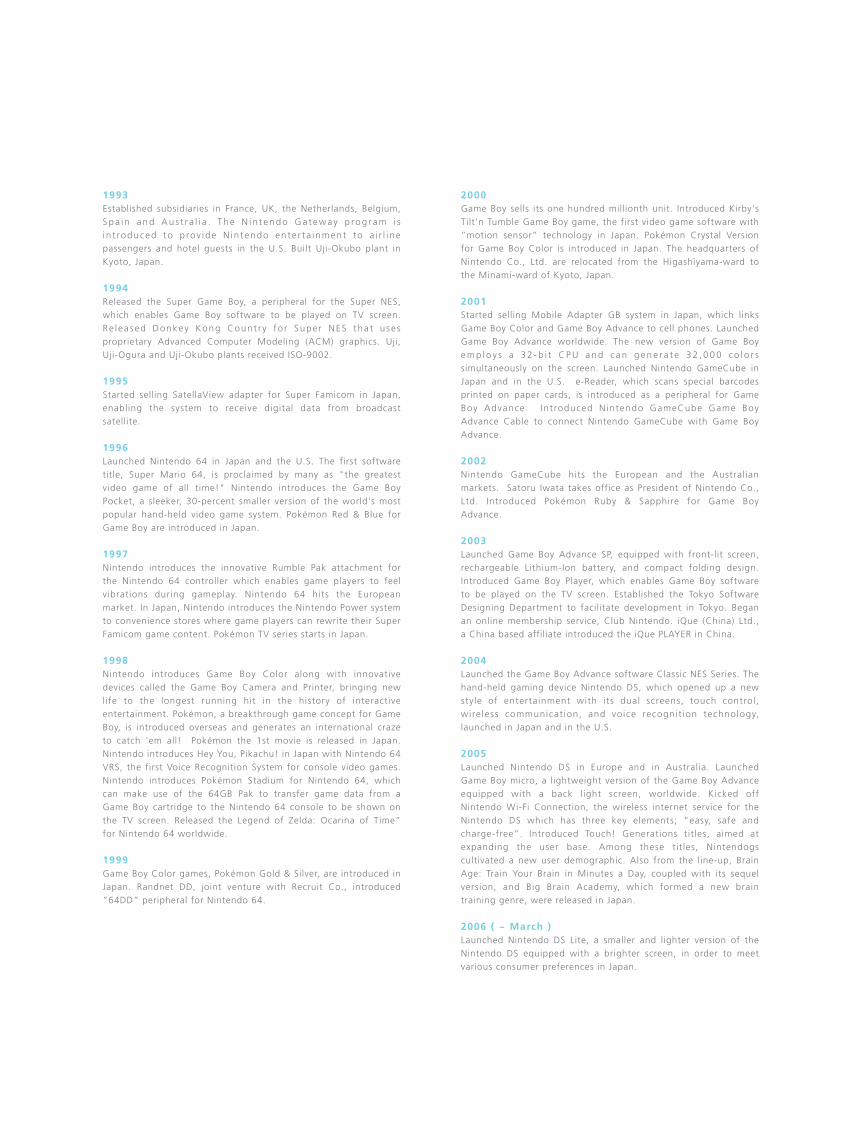
Established subsidiaries in France, UK, the Netherlands, Belgium, S p a i n a n d A u s t r a l i a . T h e N i n t e n d o G a t e w a y p ro g r a m i s i n t roduced to p rov ide N in tendo en te r ta inment to a i r l i ne passengers and hotel guests in the U.S. Built Uji-Okubo plant in Kyoto, Japan.
Released the Super Game Boy, a peripheral for the Super NES, which enables Game Boy software to be played on TV screen. Re l ea sed Donkey Kong Count r y fo r Supe r NES tha t u se s proprietary Advanced Computer Modeling (ACM) graphics. Uji, Uji-Ogura and Uji-Okubo plants received ISO-9002.
Started selling SatellaView adapter for Super Famicom in Japan, enabling the system to receive digital data from broadcast satellite.
Launched Nintendo 64 in Japan and the U.S. The first software title, Super Mario 64, is proclaimed by many as "the greatest video game of all time!" Nintendo introduces the Game Boy Pocket, a sleeker, 30-percent smaller version of the world's most popular hand-held video game system. Pokémon Red & Blue for Game Boy are introduced in Japan.
Nintendo introduces the innovative Rumble Pak attachment for the Nintendo 64 controller which enables game players to feel vibrations during gameplay. Nintendo 64 hits the European market. In Japan, Nintendo introduces the Nintendo Power system to convenience stores where game players can rewrite their Super Famicom game content. Pokémon TV series starts in Japan.
Nintendo introduces Game Boy Color along with innovative devices called the Game Boy Camera and Printer, bringing new life to the longest running hit in the history of interactive entertainment. Pokémon, a breakthrough game concept for Game Boy, is introduced overseas and generates an international craze to catch 'em all! Pokémon the 1st movie is released in Japan. Nintendo introduces Hey You, Pikachu! in Japan with Nintendo 64 VRS, the first Voice Recognition System for console video games. Nintendo introduces Pokémon Stadium for Nintendo 64, which can make use of the 64GB Pak to transfer game data from a Game Boy cartridge to the Nintendo 64 console to be shown on the TV screen. Released the Legend of Zelda: Ocarina of Time” for Nintendo 64 worldwide.
Game Boy Color games, Pokémon Gold & Silver, are introduced in Japan. Randnet DD, joint venture with Recruit Co., introduced ”64DD” peripheral for Nintendo 64.
Game Boy sells its one hundred millionth unit. Introduced Kirby's Tilt'n Tumble Game Boy game, the first video game software with ”motion sensor” technology in Japan. Pokémon Crystal Version for Game Boy Color is introduced in Japan. The headquarters of Nintendo Co., Ltd. are relocated from the Higashiyama-ward to the Minami-ward of Kyoto, Japan.
Started selling Mobile Adapter GB system in Japan, which links Game Boy Color and Game Boy Advance to cell phones. Launched Game Boy Advance worldwide. The new version of Game Boy e m p l o y s a 3 2 - b i t C P U a n d c a n g e n e r a t e 3 2 , 0 0 0 c o l o r s simultaneously on the screen. Launched Nintendo GameCube in Japan and in the U.S. e-Reader, which scans special barcodes printed on paper cards, is introduced as a peripheral for Game Boy Advance. Int roduced Nintendo GameCube Game Boy Advance Cable to connect Nintendo GameCube with Game Boy Advance.
Nintendo GameCube hits the European and the Australian markets. Satoru Iwata takes office as President of Nintendo Co., Ltd. Introduced Pokémon Ruby & Sapphire for Game Boy Advance.
Launched Game Boy Advance SP, equipped with front-lit screen, rechargeable Lithium-Ion battery, and compact folding design. Introduced Game Boy Player, which enables Game Boy software to be played on the TV screen. Established the Tokyo Software Designing Department to facilitate development in Tokyo. Began an online membership service, Club Nintendo. iQue (China) Ltd., a China based affiliate introduced the iQue PLAYER in China.
Launched the Game Boy Advance software Classic NES Series. The hand-held gaming device Nintendo DS, which opened up a new style of entertainment with its dual screens, touch control, wire less communicat ion, and voice recognit ion technology, launched in Japan and in the U.S.
Launched Nintendo DS in Europe and in Australia. Launched Game Boy micro, a lightweight version of the Game Boy Advance equipped with a back light screen, worldwide. Kicked off Nintendo Wi-Fi Connection, the wireless internet service for the Nintendo DS which has three key elements; “easy, safe and charge-free”. Introduced Touch! Generations titles, aimed at expanding the user base. Among these titles, Nintendogs cultivated a new user demographic. Also from the line-up, Brain Age: Train Your Brain in Minutes a Day, coupled with its sequel version, and Big Brain Academy, which formed a new brain training genre, were released in Japan.
Launched Nintendo DS Lite, a smaller and lighter version of the Nintendo DS equipped with a brighter screen, in order to meet various consumer preferences in Japan.
1993
1994
1995
1996
1997
1998
1999
2000
2001
2002
2003
2004
2005
2006 ( ~ March )

Cumulative unit sales on consolidated basis
Hardware Worldwide
NES
Game Boy
SNES
6 1 . 91 1 8 . 7
4 9 . 1Nintendo 64 3 2 . 9
Hardware
As of March 31, 2006Units in Millions
25 3020151050
Other Regions
GBA
GC
DS 4.7
4.7
20.5
Worldwide
Game Boy Advance (GBA)
Game Boy Advance hardware shows the combined tota l of Game Boy Advance, Game Boy Advance SP and Game Boy micro.Nintendo DS hardware shows the combined tota l of Nintendo DS and Nintendo DS L i te .
Nintendo GameCube (GC)
Nintendo DS (DS)
75.1
20.9
16.7
Japan
GBA
GC
DS
4.0
6.9
16.6
The Americas
GBA
GC
DS
12.2
5.1
38.1

Software Worldwide
NES
Game Boy
SNES
5 0 0 . 05 0 1 . 13 7 9 . 1
Nintendo 64 2 2 5 . 0
121. 6
20.8
182.6
27. 0
25.3
69.8
40.5
14.3
75.3
Software
As of March 31, 2006Units in Millions
200 24016012080400
Other Regions
GBA
GC
DS
Worldwide
Game Boy Advance (GBA)
Nintendo GameCube (GC)
Nintendo DS (DS)
327.7
189.1
60.4
Japan
GBA
GC
DS
The Americas
GBA
GC
DS

Financial Review
Five-Year Summary / Common Stock Information
Analysis of Operations and Financial Review
Report of Independent Auditor
Consolidated Balance Sheets
Consolidated Statements of Income
Consolidated Statements of Shareholders' Equity
Consolidated Statements of Cash Flows
Notes to Consolidated Financial Statements
15
16
19
20
22
23
24
25

15 Nintendo Co., Ltd. and consolidated subsidiaries
A : The computations of net income per share of common stock are based on the weighted average number of shares outstanding (excluding treasury stock) during each fiscal year.B : Cash dividends per share represent the amounts applicable to the respective fiscal years including dividends to be paid after the end of each fiscal year.
Japanese Yen¥
U.S. Dollars (Note 1)
$
High Low High Low
2006 2005 2006
First Quarter
Second Quarter
Third Quarter
Fourth Quarter
¥12 ,440
13 ,330
14 ,510
17 ,880
¥13 ,180
13 ,480
13 ,560
13 ,020
$106 .32
113 .93
124 .02
152 .82
$95 .73
95 .21
107 .69
123 .16
¥11 ,200
11 ,140
12 ,600
14 ,410
¥9 ,940
11 ,350
11 ,870
11 ,110
Years ended March 31, High Low
For the periodNet salesOperating incomeNet income
At the period-endTotal assetsProperty, plant and equipment - netShareholders’ equity
Japanese Yen in Millions¥
Years ended March 31,
¥508 ,827 91 ,223 98 ,378
1 ,160 ,703 55 ,969
974 ,091
2006
¥514 ,988 113 ,458
87 ,416
1 ,132 ,492 54 ,420
921 ,467
2005
¥514 ,409 110 ,223
33 ,194
1 ,010 ,031 55 ,085
890 ,248
2004
¥503 ,748 100 ,252
67 ,267
1 ,085 ,519 59 ,369
890 ,370
2003
¥554 ,413 119 ,607 106 ,445
1 ,156 ,716 66 ,681
935 ,075
2002
Per share informationNet incomeA
Cash dividendsB
Japanese Yen¥
Years ended March 31,
¥762 .28 390
2006
¥662 .96 270
2005
¥246 .93 140
2004
¥482 .15 140
2003
¥751 .39 140
2002
U.S. Dollars in Thousands (Note 1)
$
$4 ,348 ,951 779 ,682 840 ,842
9 ,920 ,540 478 ,370
8 ,325 ,568
2006
U.S. Dollars (Note1)
$
$6 .52 3 .33
2006
The preceding table sets forth the high and low sale prices during Fiscal 2006 and 2005 for Nintendo Co., Ltd. common stock, as reported on the Osaka Securities Exchange, Section 1. Nintendo’s stock is also traded on the Tokyo Stock Exchange, Section 1.
Common Stock Information
Five-Year Summary
16Nintendo Co., Ltd. and consolidated subsidiaries
The video game industry has developed as one of the few entertainment fields which was launched and driven by Japan. Success of the industry in the early years was dependent upon increasingly spectacular graphics and more complex games. In recent years, however, the traditional success formula of developing splendid and complex games has become less productive.
Nintendo’s strategy over the past year has been to expand the gaming population by introducing “Nintendo DS”, a handheld gaming device equipped with a touch screen and microphone port that enables intuitive game play, along with wireless communication capability. These features have made it possible to introduce software innovations that expand the definition of video games. New user demographics, including seniors and females, have been cultivated by introducing a software lineup known as “Touch! Generations”. “Touch! Generations” titles offer an entertaining experience that provide a fresh sensation to skilled gamers while at the same time, making the experience easily accessible to those who were not familiar with video games in the past. Nintendo will continue to develop the “Touch! Generations” initiative (which created a new flow in the world of video games) while at the same time expanding its software lineup into various new fields.
“Nintendo Wi-Fi Connection”, a wireless internet service for the “Nintendo DS”, was recently introduced and has three key elements; “easy, safe, and charge-free”. “Nintendo Wi-Fi Connection” quickly gained popularity and has been accepted by a broad range of people.
In addition to the original “Nintendo DS”, Nintendo expects to further increase “Nintendo DS” hardware sales with the addition of “Nintendo DS Lite”. “Nintendo DS Lite” launched in March 2006 in Japan and is a lighter and brighter version of the “Nintendo DS” to meet various consumer preferences.
During the calendar year 2006, a new gaming console “Wii” (pronounced “We”) is scheduled for launch. With its unprecedented controller, “Wii” aims to set a new standard as a video game interface which allows the whole family to enjoy it.
Overview
In the handheld game business, “Nintendo DS” and its new model “Nintendo DS Lite” sold a total of more than 16 million units on a worldwide basis in just over sixteen months since launch. “Nintendo DS” is selling at a faster rate than any other gaming device, especially in Japan. “Nintendo DS” software has also enjoyed a boost in sales as the “Touch! Generations” titles, aimed at expanding the user base, have sold exceptionally well. Among these titles, “Nintendogs”, which allows the player to interact with virtual puppies on the screen, sold 6.65 million units worldwide. Also from the lineup, a new brain training genre, “Brain Age: Train Your Brain in Minutes a Day”, coupled with its sequel version, “Big Brain Academy”, released only in Japan, brought total unit sales of these three “Touch! Generations” titles during the period to 5.10 million. In addition, “Nintendo Wi-Fi Connection” compatible titles such as “Mario Kart DS”, (an action racing game that lets the player compete against other players from around the world) sold 4.22 million units. Also, “Animal Crossing: Wild World”, (a game that lets you communicate with friends) sold 3.56 million units.
In the console business, software titles for the “Nintendo GameCube” such as “Mario Party 7” (a get-together game that lets up to eight players play simultaneously) and the role playing game “Pokémon XD: Gale of Darkness” each sold more than a million units, however, overall console hardware and software sales declined.
As a result, consolidated net sales in Fiscal 2006 were ¥508.8 billion ($4,349 million). Gross margin was ¥215.0 billion ($1,838 million). The gross margin ratio stayed at 42% compared with the previous fiscal year. Selling, general and administrative expenses amounted to ¥123.8 billion ($1,058 million). Operating income was ¥91.2 billion ($780 million). The operating income ratio decreased by 4% compared with the previous fiscal year to 18%. Interest income was ¥22.5 billion ($192 million), while foreign exchange gain was ¥45.5 billion ($389 million) due to Japanese yen depreciation. As a result, net income for Fiscal 2006 was ¥98.4 billion ($841 million). The net income ratio increased by 2% compared with the previous fiscal year to 19%.
Revenue and Expenses
At March 31, 2006, Nintendo’s cash and cash equivalents were ¥617.1 billion ($5,275 million). Net cash provided by operating activities was ¥46.4 billion ($396 million) despite reductions in cash due to a foreign exchange
gain resulting from revaluation of cash and cash equivalents in foreign currencies, payment of ¥74.9 billion ($640 million) for income taxes and also due to a decrease in notes and trade accounts payable.
Net cash used in investing activities was ¥208.8 billion ($1,785 million) as payments into time deposits exceeded withdrawals.Net cash used in financing activities was ¥60.2 billion ($514 million) due to dividend payments and payments for acquiring
treasury stocks.
Cash Flow
Analysis of Operations and Financial Review

Nintendo Co., Ltd. and consolidated subsidiaries17
Nintendo’s financial position continues to be very strong. At March 31, 2006 total liabilities were ¥186.4 billion ($1,593 million), and the current ratio was 5.59 to 1. The balance of
cash and cash equivalents was 3.31 times total liabilities. Working capital was ¥836.5 billion ($7,149 million). The receivable turnover period increased by 6 days compared with the previous fiscal year to 34 days. Inventories were ¥30.8 billion ($264 million). The inventory turnover period was 29 days. The debt-to-equity ratio was 0.19 to 1 at March 31, 2006.
Financial Position
Listed below are the various risks that could significantly affect Nintendo’s operating performance, share price, and financial condition. However, unpredictable risks may exist other than the risks set forth herein.
Note that matters pertaining to the future presented herein are determined by Nintendo as of annual consolidated fiscal period ended March 31, 2006.
(1) Risks around economic environment•Fluctuation in foreign exchange rates
Nintendo distributes its products globally with overseas sales accounting for approximately 70% of total sales. The majority of monetary transactions are made in local currencies. In addition, the Company holds a substantial amount of assets including cash deposits denominated in foreign currencies without exchange contracts. Thus, fluctuation in foreign exchange rates would have a direct influence on earnings not only if foreign currencies were converted to Japanese yen but also if revaluated for financial reporting purposes. Japanese yen appreciation against the U.S. dollar or Euro would have a negative impact on Nintendo’s profitability.
(2) Risks around business activities•Fluctuation of and competition in the market
Nintendo is engaged in a business categorized under the massive entertainment industry. Therefore, the availability of other forms of entertainment affects Nintendo’s business. If consumer preferences shift to other forms of entertainment, it is possible that the video game market may shrink. The emergence of new competitors resulting from technological innovation could have a detrimental impact as well.
In the video game industry, it may become even more difficult to generate profit as more research and development expenses and marketing expenses are required and as price competition intensifies with giant enterprises entering into the market. As a result, Nintendo may find difficulty in maintaining or expanding its market share as well as sustaining profitability.
•Development of new productsAlthough Nintendo continues to develop innovative and appealing products in the field of computer entertainment, the
development process is complicated and includes many uncertainties. Various risks involved are as follows:① Despite the substantial costs and time needed for software development, there is no guarantee that all new products will
be accepted by consumers due to ever shifting consumer preferences. As a result, development of certain products may be suspended or aborted.
② Hardware requires a long term development span. While technological advancements occur continuously, it is possible that the Company may be unable to acquire the necessary technology which can be utilized in entertainment. Furthermore, in the case of a delayed launch, it is possible that market share could be adversely affected.
③ Due to the nature of Nintendo products, it may become difficult to sell or develop the products as planned which could lead to significant variances from income projections.
Risk Factors
During the fiscal year ended March 31, 2006, the Nikkei stock average rose 46% to ¥17,059.66 ($145.81). The stock price of Nintendo Co., Ltd. (“the Company”) rose 50% and ended the year at ¥17,600 ($150.43). The Company raised its annual dividend level by ¥120 ($1.03) to ¥390 ($3.33) per share for Fiscal 2006. On a consolidated basis, the dividend payout ratio was approximately 51%. Foreign shareholders constituted 41% of total outstanding shares at March 31, 2006.
(Note) The amounts presented herein are stated in Japanese yen and have been translated into U.S. dollars solely for the convenience of readers outside Japan at the rate of ¥117 to US$1, the approximate rate of exchange at March 31, 2006.
Common Stock Activity
18Nintendo Co., Ltd. and consolidated subsidiaries
•Product valuation and adequate inventory procurementDemand for products in the video game industry is significantly impacted by consumer preferences as well as seasonality
characterized by short product life cycles and very high demand around the holiday season. Although production is targeted at the equilibrium point of supply and demand, accurate projections are extremely difficult to obtain which may lead to the risk of excessive inventory. In addition, inventory obsolescence could have an adverse effect on Nintendo’s operations and financial position.
•Overseas business expansion and international activities Nintendo engages in business in territories such as the Americas, Europe, Australia, and Asia in addition to Japan.
Expansion of business to these overseas markets involves risks such as ① unpredicted enforcement or changes to laws or regulations, ② emergence of political or economic factors that prove to be a disadvantage, ③ inconsistency of multilateral taxation systems and diversity of tax law interpretation leading to a disadvantaged position, ④ difficulty of recruiting and securing human resources, ⑤ social disruption resulting from terrorist attacks, war, and other events.
•Dependency on outside manufacturersNintendo commissions a number of certain outside manufacturers to produce key components or assemble finished
products. In the event of their commercial failure, these manufacturers may not adequately provide or produce significant components or products. In addition, certain manufacturers may not have the capacity to provide the ordered amount of components. A shortage of key components could lead to issues such as margin decline due to higher pricing as well as insufficient product supply, and quality control. This may impair the relationship between Nintendo and its suppliers.
Furthermore, as there are many production locations overseas used by our suppliers, when production is interfered by events such as riots or natural disasters at the local area, it could have an adverse effect on Nintendo’s operations and financial position.
•Business operations affected by seasonal fluctuationSince a major portion of demand is focused around the holiday season, the demand is influenced by seasonal fluctuations.
Should the Company fail to meet the period of high demand in any of its business activities, including but not restricted to the launch of attractive new products and supplying hardware, it would suffer unfavorable operating performance.
(3) Other risksOther than set forth above, factors such as product liability, limitations of protecting intellectual property, leakage of
personal information and confidential information, changes in accounting standards and taxation system, litigation, uncollectibility of trade accounts receivable and notes receivable, failure of financial institutions, and restrictions regarding environmental protection may adversely affect Nintendo’s future performance and financial position.
Analysis of Operations and Financial Review

19 Nintendo Co., Ltd. and consolidated subsidiaries
To the Board of Directors and Shareholders of Nintendo Co., Ltd.
We have audited the accompanying consolidated balance sheets of Nintendo Co., Ltd. and its subsidiaries as of March 31, 2005 and 2006, and the related consolidated statements of income, shareholders’ equity, and cash flows for the years then ended, all expressed in Japanese Yen. These consolidated financial statements are the responsibility of the Company’s management. Our responsibility is to express an opinion on these consolidated financial statements based on our audits.
We conducted our audits in accordance with auditing standards generally accepted in Japan. Those standards require that we plan and perform the audit to obtain reasonable assurance about whether the consolidated financial statements are free of material misstatement. An audit includes examining, on a test basis, evidence supporting the amounts and disclosures in the consolidated financial statements. An audit also includes assessing the accounting principles used and significant estimates made by management, as well as evaluating the overall consolidated financial statement presentation. We believe that our audits provide a reasonable basis for our opinion.
In our opinion, the consolidated financial statements referred to above present fairly, in all material respects, the consolidated financial position of Nintendo Co., Ltd. and its subsidiaries as of March 31, 2005 and 2006, and the consolidated results of their operations and their cash flows for the years then ended in conformity with accounting principles generally accepted in Japan.
The amounts expressed in U.S. dollars, which are provided solely for the convenience of the reader, have been translated on the basis set forth in Note 1 to the accompanying consolidated financial statements.
ChuoAoyama PricewaterhouseCoopersKyoto, JapanJune 29, 2006
Report of Independent Auditor

20Nintendo Co., Ltd. and consolidated subsidiaries
Japanese Yen in Millions¥
U.S. Dollars in Thousands (Note 1)
$As of March 31, 2006 2005 2006
See notes to consolidated financial statements.
AssetsCurrent Assets
Cash and cash equivalents (Note 3)
Short-term investments (Note 4)
Receivables -
Notes and trade accounts receivable
Allowance for doubtful accounts
Inventories (Note 6)
Deferred income taxes (Note 9)
Other current assets
Total current assets
Property, Plant and Equipment
Land
Buildings and structures
Machinery, equipment and automobiles
Construction in progress
Total
Accumulated depreciation
Property, plant and equipment - net
Investments and Other Assets
Investments in securities (Note 4)
Long-term deposits
Deferred income taxes (Note 9)
Other assets
Total investments and other assets
Total
¥617 ,139
276 ,832
43 ,826
(1 ,515 )
30 ,836
24 ,170
27 ,443
1 ,018 ,731
32 ,604
40 ,508
22 ,041
41
95 ,194
(39 ,225 )
55 ,969
60 ,213
11 ,747
10 ,315
3 ,728
86 ,003
¥1 ,160 ,703
¥792 ,728
54 ,411
51 ,143
(1 ,880 )
49 ,759
19 ,514
28 ,217
993 ,892
32 ,069
38 ,535
20 ,269
411
91 ,284
(36 ,864 )
54 ,420
73 ,393
-
10 ,156
631
84 ,180
¥1 ,132 ,492
$5 ,274 ,696
2 ,366 ,090
374 ,584
(12 ,945 )
263 ,552
206 ,584
234 ,538
8 ,707 ,099
278 ,669
346 ,224
188 ,380
351
813 ,624
(335 ,254 )
478 ,370
514 ,644
100 ,402
88 ,158
31 ,867
735 ,071
$9 ,920 ,540
Consolidated Balance Sheets

21 Nintendo Co., Ltd. and consolidated subsidiaries
Liabilities and Shareholders’ EquityCurrent Liabilities
Notes and trade accounts payable
Accrued income taxes
Other current liabilities
Total current liabilities
Non-current Liabilities
Non-current accounts payable
Reserve for employee retirement and severance benefits (Note 7)
Reserve for directors’ retirement and severance benefits
Total non-current liabilities
Minority Interests
Shareholders’ Equity
Common stock Authorized - 400,000,000 shares Issued and outstanding - 141,669,000 shares
Additional paid-in capital
Retained earnings
Unrealized gains on other securities (Note 4)
Translation adjustments
Total
Treasury stock, at cost 13,754,896 shares in 2006 and 11,591,611 shares in 2005
Total shareholders’ equity
Total
Japanese Yen in Millions¥
U.S. Dollars in Thousands (Note 1)
$As of March 31,
¥99 ,022
53 ,040
30 ,213
182 ,275
862
3 ,299
-
4 ,161
176
10 ,065
11 ,585
1 ,096 ,074
10 ,717
763
1 ,129 ,204
(155 ,113 )
974 ,091
¥1 ,160 ,703
2006
¥128 ,430
51 ,952
25 ,068
205 ,450
462
3 ,075
1 ,816
5 ,353
222
10 ,065
11 ,584
1 ,032 ,835
7 ,195
(10 ,315 )
1 ,051 ,364
(129 ,897 )
921 ,467
¥1 ,132 ,492
2005
$846 ,334
453 ,335
258 ,233
1 ,557 ,902
7 ,368
28 ,198
-
35 ,566
1 ,504
86 ,029
99 ,018
9 ,368 ,152
91 ,601
6 ,515
9 ,651 ,315
(1 ,325 ,747 )
8 ,325 ,568
$9 ,920 ,540
2006
See notes to consolidated financial statements.
22Nintendo Co., Ltd. and consolidated subsidiaries
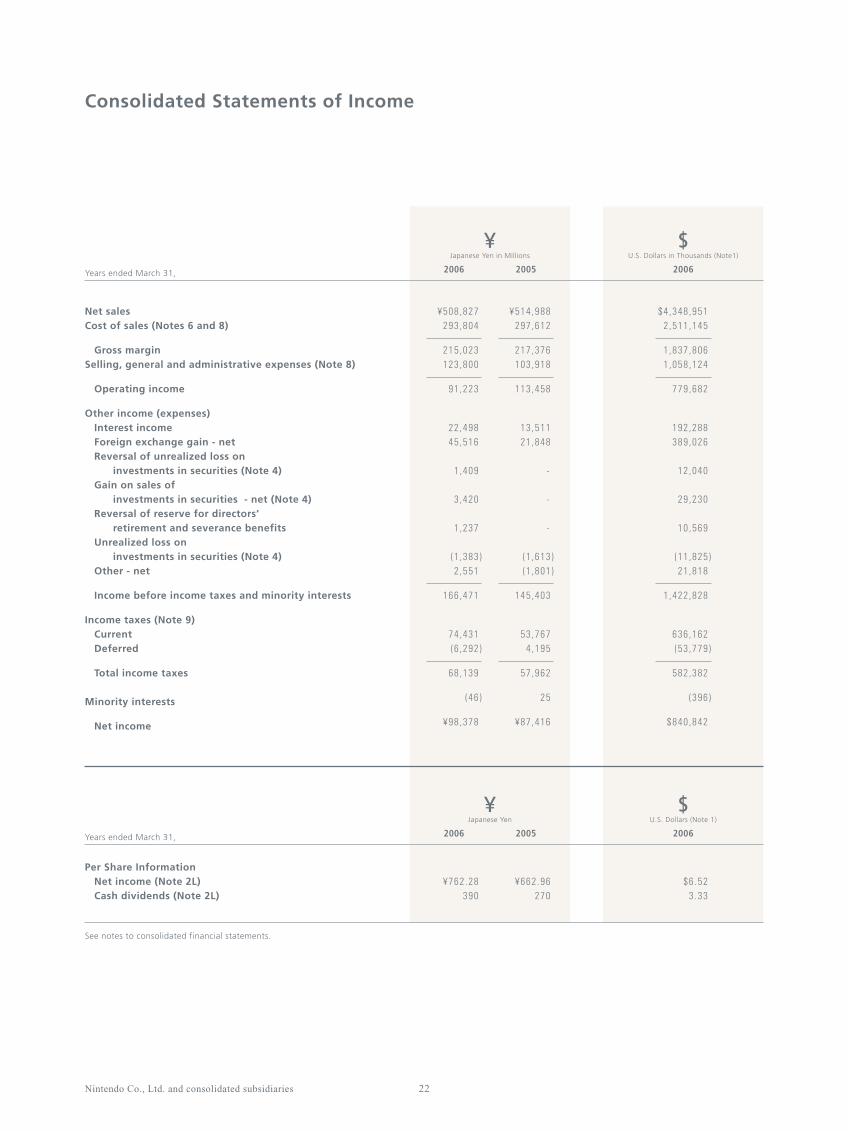
Net salesCost of sales (Notes 6 and 8)
Gross marginSelling, general and administrative expenses (Note 8)
Operating income
Other income (expenses) Interest income Foreign exchange gain - net Reversal of unrealized loss on investments in securities (Note 4) Gain on sales of investments in securities - net (Note 4) Reversal of reserve for directors’ retirement and severance benefits Unrealized loss on investments in securities (Note 4) Other - net
Income before income taxes and minority interests
Income taxes (Note 9) Current Deferred
Total income taxes
Minority interests
Net income
Japanese Yen in Millions¥
U.S. Dollars in Thousands (Note1)
$Years ended March 31,
¥508 ,827 293 ,804
215 ,023 123 ,800
91 ,223
22 ,498 45 ,516
1 ,409
3 ,420
1 ,237
(1 ,383 )2 ,551
166 ,471
74 ,431 (6 ,292 )
68 ,139
(46 )
¥98 ,378
2006
¥514 ,988 297 ,612
217 ,376 103 ,918
113 ,458
13 ,511 21 ,848
-
-
-
(1 ,613 )(1 ,801 )
145 ,403
53 ,767 4 ,195
57 ,962
25
¥87 ,416
2005
$4 ,348 ,951 2 ,511 ,145
1 ,837 ,806 1 ,058 ,124
779 ,682
192 ,288 389 ,026
12 ,040
29 ,230
10 ,569
(11 ,825 )21 ,818
1 ,422 ,828
636 ,162 (53 ,779 )
582 ,382
(396 )
$840 ,842
2006
See notes to consolidated financial statements.
Per Share Information Net income (Note 2L) Cash dividends (Note 2L)
Japanese Yen¥
U.S. Dollars (Note 1)
$Years ended March 31,
¥762 .28 390
2006
¥662 .96 270
2005
$6 .52 3 .33
2006
Consolidated Statements of Income
23 Nintendo Co., Ltd. and consolidated subsidiaries
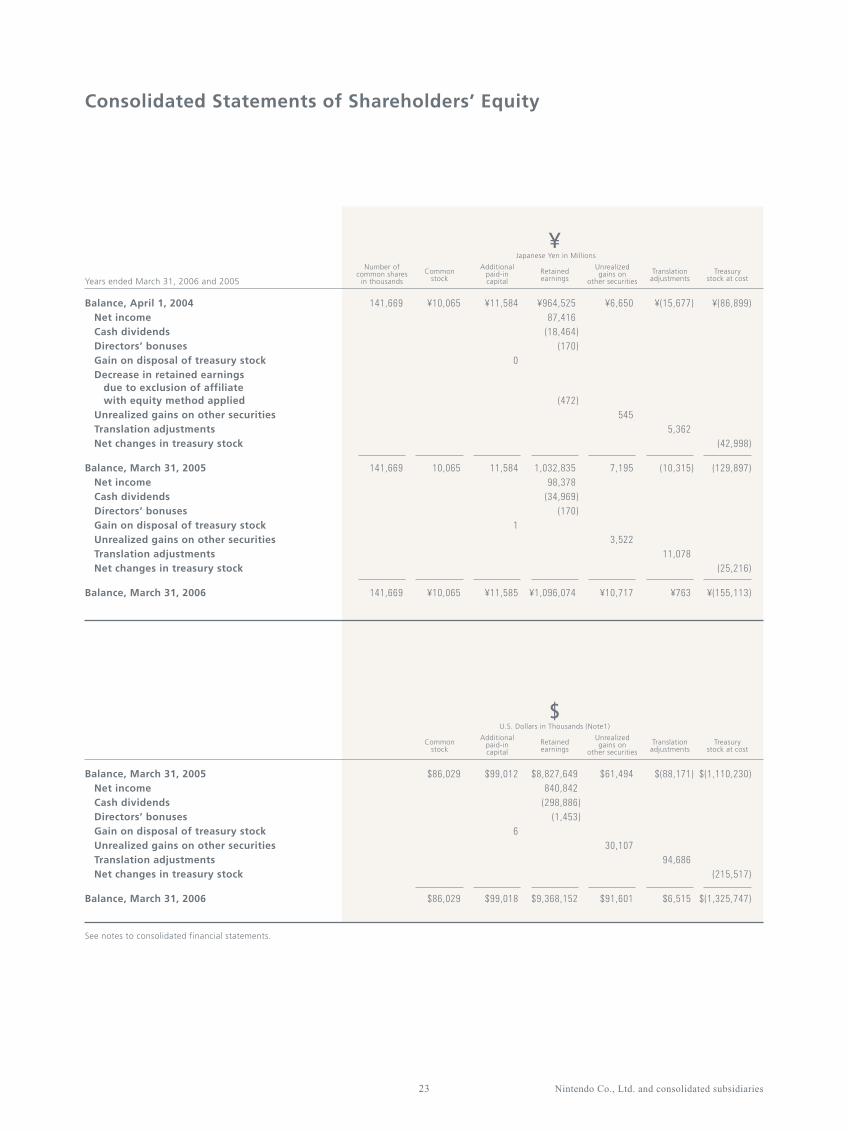
Balance, April 1, 2004 Net income Cash dividends Directors’ bonuses Gain on disposal of treasury stock Decrease in retained earnings due to exclusion of affiliate with equity method applied Unrealized gains on other securities Translation adjustments Net changes in treasury stock
Balance, March 31, 2005 Net income Cash dividends Directors’ bonuses Gain on disposal of treasury stock Unrealized gains on other securities Translation adjustments Net changes in treasury stock
Balance, March 31, 2006
Japanese Yen in Millions¥
Years ended March 31, 2006 and 2005
¥(15,677)
5,362
(10,315)
11,078
¥763
Translationadjustments
¥6,650
545
7,195
3,522
¥10,717
Unrealizedgains on
other securities
¥964,525 87,416
(18,464)(170)
(472)
1,032,835 98,378
(34,969)(170)
¥1,096,074
Retainedearnings
¥11,584
0
11,584
1
¥11,585
Additionalpaid-incapital
¥10,065
10,065
¥10,065
Commonstock
141,669
141,669
141,669
Number ofcommon shares
in thousands
¥(86,899)
(42,998)
(129,897)
(25,216)
¥(155,113)
Treasurystock at cost
See notes to consolidated financial statements.
Balance, March 31, 2005 Net income Cash dividends Directors’ bonuses Gain on disposal of treasury stock Unrealized gains on other securities Translation adjustments Net changes in treasury stock
Balance, March 31, 2006
U.S. Dollars in Thousands (Note1)
$
$(88,171)
94,686
$6,515
Translationadjustments
$61,494
30,107
$91,601
Unrealizedgains on
other securities
$8,827,649 840,842
(298,886)(1,453)
$9,368,152
Retainedearnings
$99,012
6
$99,018
Additionalpaid-incapital
$86,029
$86,029
Commonstock
$(1,110,230)
(215,517)
$(1,325,747)
Treasurystock at cost
Consolidated Statements of Shareholders’ Equity

24Nintendo Co., Ltd. and consolidated subsidiaries
Cash Flows from Operating Activities Net income Depreciation and amortization Decrease in allowance for doubtful accounts Decrease in reserve for employee retirement and severance benefits Deferred income taxes Foreign exchange gain Reversal of unrealized loss on investments in securities Gain on sales of investments in securities - net Unrealized loss on investments in securities Decrease (increase) in notes and trade accounts receivable Decrease (increase) in inventories Increase (decrease) in notes and trade accounts payable Increase (decrease) in accrued income taxes Other, net
Net cash provided by operating activities
Cash Flows from Investing Activities Payments for short-term investments Proceeds from short-term investments Payments for purchase of property, plant and equipment Proceeds from sale of property, plant and equipment Payments for investments in securities Proceeds from investments in securities Payments for investments in affiliates Sales of business entities Other, net
Net cash used in investing activities
Cash Flows from Financing Activities Payments for purchase of treasury stock Cash dividends paid Other, net
Net cash used in financing activities
Effect of exchange rate changes on cash and cash equivalents
Net increase (decrease) of cash and cash equivalents
Cash and cash equivalents at beginning of year
Cash and cash equivalents at end of year
Japanese Yen in Millions¥
U.S. Dollars in Thousands (Note 1)
$Years ended March 31,
¥98 ,378 3 ,592
(511 )
(43 )(6 ,292 )
(46 ,577 )(1 ,409 )(3 ,420 )1 ,383 9 ,141
21 ,554 (28 ,679 )
(423 )(313 )
46 ,381
(533 ,903 )322 ,996
(4 ,140 )92
(9 ,173 )13 ,940
(42 )-
1 ,423
(208 ,807 )
(25 ,227 ) (34 ,943 )
3
(60 ,167 )
47 ,004
(175 ,589 )
792 ,728
¥617 ,139
2006 2005 2006
Additional Cash Flow Information Interest paid Income taxes paid
Japanese Yen in Millions¥
U.S. Dollars in Thousands (Note 1)
$Years ended March 31,
¥1 74 ,854
2006
¥0 13 ,485
2005
$9 639 ,776
2006
See notes to consolidated financial statements.
¥87 ,416 2 ,931
(1 ,226 )
(975 )4 ,196
(27 ,570 )- -
1 ,612 (21 ,063 )
(17 ,735 )48 ,688 40 ,282
16
116 ,572
(96 ,391 )112 ,938
(2 ,061 )13
(24 ,712 )2 ,524
(7 ,251 )1 ,072 2 ,152
(11 ,716 )
(42 ,996 ) (18 ,455 )
4
(61 ,447 )
29 ,205
72 ,614
720 ,114
¥792 ,728
$840 ,842 30 ,698 (4 ,369 )
(367 )(53 ,780 )
(398 ,098 )(12 ,040 )(29 ,230 )11 ,825 78 ,128
184 ,226 (245 ,123 )
(3 ,614 )(2 ,668 )
396 ,430
(4 ,563 ,275 )2 ,760 ,647
(35 ,382 )783
(78 ,401 )119 ,146
(361 )-
12 ,166
(1 ,784 ,677 )
(215 ,619 )(298 ,659 )
32
(514 ,246 )
401 ,741
(1 ,500 ,752 )
6 ,775 ,448
$5 ,274 ,696
Consolidated Statements of Cash Flows

25 Nintendo Co., Ltd. and consolidated subsidiaries
A. Principles of ConsolidationThe accompanying consolidated financial statements include the accounts of the Company and all of its subsidiaries (total 20
in 2006 and 19 in 2005) except for 1 in 2006 and 2 in 2005. The equity method of accounting has been applied to 7 affiliates (out of 8 in 2006 and out of 9 in 2005). The remaining subsidiary and affiliate are immaterial and investments in them are carried at cost in the accompanying consolidated balance sheets.
The principal consolidated subsidiaries and the principal affiliate for which the equity method of accounting was used for the year ended March 31, 2006 were as follows:
The amount of consolidated adjustment account is fully amortized in the same fiscal year as incurred.Valuations of assets and liabilities of consolidated subsidiaries are under market price method.All significant intercompany transactions, accounts and unrealized profits have been eliminated in consolidation.The amounts of certain subsidiaries and affiliates have been included on the basis of fiscal periods ended within three months
prior to March 31.
Note 2. Significant Accounting Policies
The accompanying consolidated financial statements are prepared from the consolidated financial statements issued in Japan for domestic reporting purposes. Nintendo Co., Ltd. (the “Company”) and its subsidiaries in Japan maintain their accounts and records in accordance with the provisions set forth in the Japanese Commercial Code and the Securities and Exchange Law, and in conformity with generally accepted accounting principles and practices in Japan, which are different in certain respects from the application and disclosure requirements of International Financial Reporting Standards. Its overseas consolidated subsidiaries maintain their accounts in conformity with the generally accepted accounting principles and practices prevailing in the respective countries of domicile and no adjustment has been made to their financial statements in consolidation to the extent that significant differences do not occur, as allowed under the generally accepted accounting principles and practices in Japan.
The consolidated financial statements are not intended to present the consolidated financial position, results of operations and cash flows in accordance with accounting principles and practices generally accepted in countries and jurisdictions other than Japan.
In preparing the accompanying consolidated financial statements, certain reclassifications have been made to the consolidated financial statements issued domestically in order to present them in a form which is more familiar to readers outside Japan.
The consolidated financial statements presented herein are stated in Japanese yen, the currency of the country in which the Company is incorporated and operates. The translations of Japanese yen amounts into U.S. dollar amounts are included solely for the convenience of readers outside Japan and have been made at the rate of ¥117 to US$1, the approximate rate of exchange at March 31, 2006. These translations should not be construed as representations that the Japanese yen amounts have been, could have been or could in the future be, converted into U.S. dollars at this or any other rate of exchange.
Note 1. Basis of Presenting Consolidated Financial Statements
Nintendo o f Amer ica Inc .Nintendo Bene lux B .V.Nintendo España , S .A .Nintendo F rance S .A .R .L .
Nintendo Aust ra l ia P ty . L td .Nintendo o f Canada L td .Nintendo o f Europe GmbH
Consolidated subsidiaries
Affiliate
The Pokémon Company
Years ended March 31, 2006 and 2005
Notes to Consolidated Financial Statements
26Nintendo Co., Ltd. and consolidated subsidiaries
B. Translation of Foreign Currency ItemsIn accordance with the Japanese accounting standard, short-term and long-term monetary receivables and payables
denominated in foreign currencies are translated into Japanese yen at the exchange rate in effect at the balance sheet date. The foreign exchange gains and losses from translation are recognized in the statements of income to the extent that they are not hedged by forward exchange contracts.
With respect to financial statements of overseas subsidiaries, the balance sheet accounts are translated into Japanese yen at the exchange rates in effect at the balance sheet date except for shareholders' equity, which are translated at the historical rates. The average exchange rates for the fiscal period are used for translation of revenue and expenses. The differences resulting from translation in this manner are included in “Minority Interests” or “Translation adjustments” in the accompanying consolidated balance sheets.
C. Cash and Cash Equivalents“Cash and cash equivalents” include cash on hand, deposit which can be withdrawn on demand, time deposit with an
original maturity of three months or less and certain investments. Investments are defined as those that are easily accessible, with little risk of fluctuation in value and the maturity date is within three months of the acquisition date.
D. Financial InstrumentsDerivatives
All derivatives are stated at fair value, with changes in fair value included in net profit or loss for the period in which they arise.
SecuritiesHeld-to-maturity debt securities are stated at cost after accounting for premium or discount on acquisition, which is
amortized over the period to maturity.Equity securities of non-consolidated subsidiary and affiliated company with equity method non-applied are stated at cost.Other securities for which market quotations are available are stated at fair value. Unrealized gains on other securities are
reported as “Unrealized gains on other securities” in Shareholders’ Equity at a net-of-tax amount, while unrealized losses on other securities are included in net profit or loss for the period.
Other securities for which market quotations are unavailable are stated at cost, determined by the moving average method except as stated in the paragraph below.
In case where the fair value of held-to-maturity debt securities, equity securities issued by non-consolidated subsidiary and affiliate, or other securities has declined significantly and such impairment of the value is not deemed temporary, those securities are written down to the fair value and the resulting losses are included in net profit or loss for the period.
Under the Japanese accounting standard, trading securities and debt securities due within one year are presented as “current” and all the other securities are presented as “non-current.”
E. Inventories“Inventories” are stated at the lower of cost, determined by the moving average method, or market.
F. Property, Plant and Equipment“Property, plant and equipment” are stated at cost. The Company and its consolidated subsidiaries in Japan compute
depreciation by the declining balance method over the estimated useful lives. The straight-line method of depreciation is used for buildings, except for structures, acquired on or after April 1, 1998. Overseas consolidated subsidiaries compute depreciation of assets by applying the straight-line method over the period of estimated useful lives. Estimated useful lives of the principal assets are as follows:
Buildings and structures: 3 to 60 years
G. Income TaxesDeferred income taxes are recorded to reflect the impact of temporary differences between assets and liabilities recognized
for financial reporting purposes and such amounts recognized for tax purposes. These deferred taxes are measured by applying currently enacted tax laws to the temporary differences.
The enterprise taxes levied in proportion to added value and capital were recognized as “Selling, general and administrative expenses” effective as of the year ended March 31, 2005
Years ended March 31, 2006 and 2005
Notes to Consolidated Financial Statements
27 Nintendo Co., Ltd. and consolidated subsidiaries
H. Retirement and Severance Benefits and Pension PlanThe Company and certain consolidated subsidiaries are calculating the reserve for employee retirement and severance benefits
with actuarially projected amounts on the basis of the cost of retirement benefit and plan assets at the end of fiscal year.Actuarial calculation difference are processed collectively, mainly in the accrued year.In addition, because the Company’s plan assets exceeded the cost of retirement benefits during the current consolidated
accounting period, “Reserve for employee retirement and severance benefits” is booked as “Prepaid plan assets” in “Other assets”.
From the year ended March 31, 2006, the Company adopted the partial amendment of the Japanese Accounting Standards for Employee Retirement and Severance Benefits. The effect by this application for the year ended March 31, 2006 increased “Income before income taxes and minority interests” by ¥2,677 million ($22,882 thousand).
At the Annual General Meeting of Shareholders held on June 29, 2005, the discontinuance of the directors and auditors retirement allowance system was approved along with payment of a final allowance to directors and auditors who took office until that time. Since the final allowances are to be paid at the time of retirement based on each director or auditor’s tenure as of June 29, 2005, the amount is booked as part of “Non-current accounts payable”.
I. Research and Development and Computer SoftwareExpenses relating to research and development activities are charged to income as incurred.Computer software for the internal use included in “Other assets” is amortized using the straight-line method over the
estimated useful lives.
J. Leases All leases are accounted for as operating leases. Under the Japanese accounting standards for leases, finance leases that are
deemed to transfer ownership of the leased assets to the lessee are to be capitalized, while other finance leases are permitted to be accounted for as operating lease transactions if certain “as if capitalized” information is disclosed in the notes to the lessee’s financial statements.
K. Appropriations of Retained EarningsAppropriations of retained earnings are reflected in the consolidated financial statements for the following year upon
shareholders’ approval.
L. Per Share InformationThe computations of net income per share of common stock are based on the weighted average number of shares
outstanding excluding the number of treasury stock during each fiscal year. The average numbers of common stock used in the computation for the years ended March 31, 2006 and 2005 were 128,822 thousand and 131,600 thousand, respectively.
Cash dividends per share represent the amounts applicable to the respective years including dividends to be paid after end of the fiscal year.
The balance of “Cash and cash equivalents” includes loans on repurchase agreement secured by marketable securities with a market value of ¥15,939 million ($136,232 thousand) as of March 31, 2006.
Note 3. Supplemental Information on Cash and Cash Equivalents
28Nintendo Co., Ltd. and consolidated subsidiaries
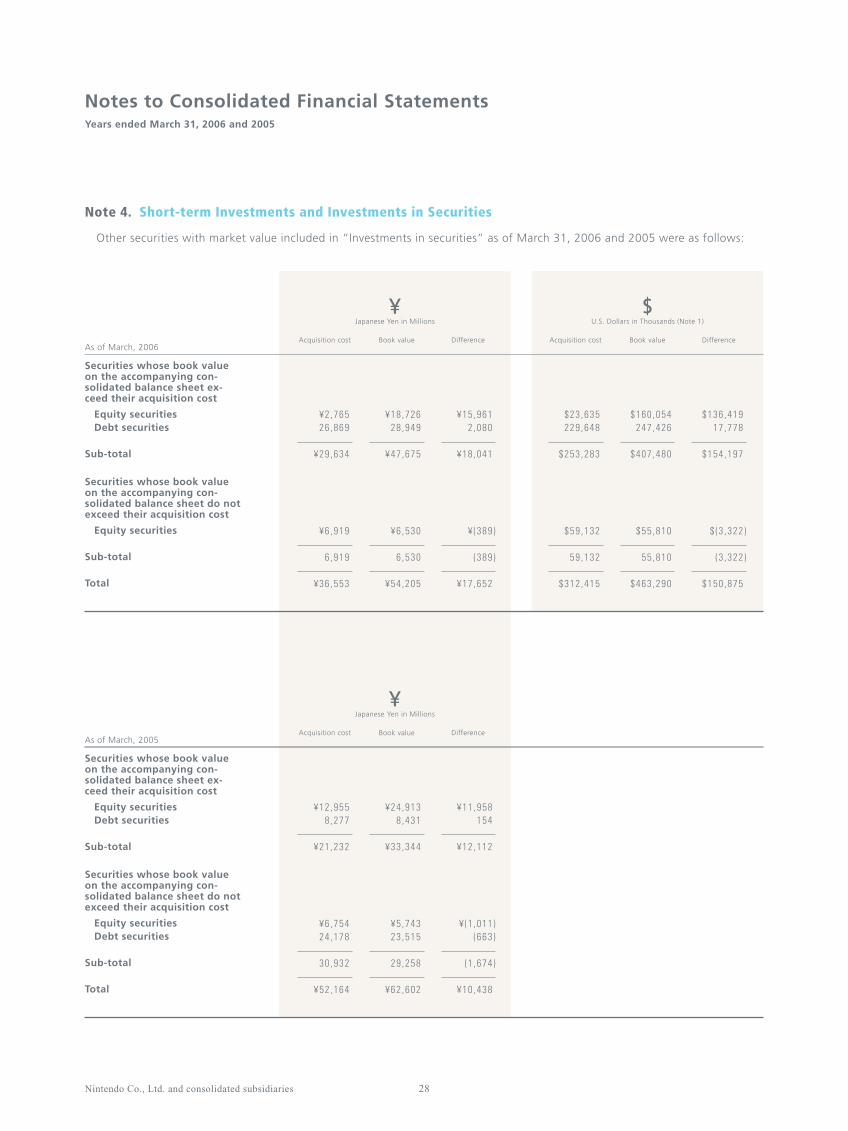
Other securities with market value included in “Investments in securities” as of March 31, 2006 and 2005 were as follows:
Note 4. Short-term Investments and Investments in Securities
Acquisition cost DifferenceBook value
Book value
Japanese Yen in Millions¥
Securities whose book valueon the accompanying con-solidated balance sheet ex-ceed their acquisition cost
Equity securities Debt securities
Sub-total
Securities whose book valueon the accompanying con-solidated balance sheet do not exceed their acquisition cost
Equity securities
Sub-total
Total
¥2 ,765 26 ,869
¥29 ,634
¥6 ,919
6 ,919
¥36 ,553
¥18 ,726 28 ,949
¥47 ,675
¥6 ,530
6 ,530
¥54 ,205
¥15 ,961 2 ,080
¥18 ,041
¥ (389 )
(389 )
¥17 ,652
As of March, 2006Acquisition cost DifferenceBook value
U.S. Dollars in Thousands (Note 1)
$
$23 ,635 229 ,648
$253 ,283
$59 ,132
59 ,132
$312 ,415
$160 ,054 247 ,426
$407 ,480
$55 ,810
55 ,810
$463 ,290
$136 ,419 17 ,778
$154 ,197
$ (3 ,322 )
(3 ,322 )
$150 ,875
Japanese Yen in Millions¥
Securities whose book valueon the accompanying con-solidated balance sheet ex-ceed their acquisition cost
Equity securities Debt securities
Sub-total
Securities whose book valueon the accompanying con-solidated balance sheet do not exceed their acquisition cost
Equity securities Debt securities
Sub-total
Total
¥12 ,955 8 ,277
¥21 ,232
¥6 ,754 24 ,178
30 ,932
¥52 ,164
¥24 ,913 8 ,431
¥33 ,344
¥5 ,743 23 ,515
29 ,258
¥62 ,602
¥11 ,958 154
¥12 ,112
¥ (1 ,011 )(663 )
(1 ,674 )
¥10 ,438
As of March, 2005Acquisition cost Difference
Years ended March 31, 2006 and 2005
Notes to Consolidated Financial Statements

29 Nintendo Co., Ltd. and consolidated subsidiaries
The aggregate maturities of Held-to-maturity debt securities in Short-term investments and Investments in securities as of March 31, 2006 and 2005 were as follows:
Book value of non-marketable securities in “Short-term investments” and “Investments in securities” as of March 31, 2006 and 2005 were summarized as follows:
¥46 ,982
10 ,000 6 ,874
¥11 ,933
11 ,000 -
$401 ,552
85 ,470 58 ,748
Japanese Yen in Millions¥
2006 2005As of March 31,
U.S. Dollars in Thousands (Note 1)
$2006
Japanese Yen in Millions¥
2006 2005As of March 31,
U.S. Dollars in Thousands (Note 1)
$2006
(1) Held-to-maturity debt securities Commercial paper
(2) Other securities Preferred subscription certificate Unlisted bonds
Due within one yearDue after one year
through five years
¥64 ,287
18 ,517
¥20 ,485
24 ,394
$549 ,462
158 ,263
The Company and certain consolidated subsidiaries enter into foreign exchange forward contracts and currency option contracts.It is the Company’s policy to enter into derivative transactions within the limits of foreign currency deposits, and not for
speculative purposes.The Company has foreign exchange forward contracts to reduce risk of exchange rate fluctuations and currency option
contracts to reduce risk of exchange rate fluctuations and yield improvement of short-term financial assets.Foreign exchange forward contracts and currency option contracts bear risks resulting from exchange rate fluctuations.
Counterparties to derivative transactions are limited to high confidence level financial institutions. The Company does not anticipate any risk due to default.
Derivative transactions entered into by the Company and certain consolidated subsidiaries are made by the treasury department or the department in charge of financial matters. They are to be approved by the president and the director in charge of those transactions of the Company. Subject consolidated subsidiaries are to report transaction status on a regular basis to the director in charge.
Note 5. Derivatives
Proceeds from sales of other securities with market value were ¥13,940 million ($119,146 thousand) for the year ended March 31, 2006. Gross realized gains and losses on those sales were ¥3,654 million ($31,229 thousand) and ¥234 million ($2,000 thousand) for the year ended March 31, 2006.
Investments in unconsolidated subsidiaries and affiliates were ¥6,264 million ($53,536 thousand) and ¥5,485 million as of March 31, 2006 and 2005, respectively.
The Company had no derivative contracts outstanding at March 31, 2006.
Derivative contracts the Company had at March 31, 2005 were as follows:
Japanese Yen in Millions¥
Purchased put options: U.S. dollars Euros
Written call options: U.S. dollars Euros
¥23 ,963 14 ,177
71 ,890 14 ,177
¥259 55
442 39
¥ (8 )(8 )
(174 )24
As of March 31, 2005Contract amount Unrealized
gain(loss)Fair value
30Nintendo Co., Ltd. and consolidated subsidiaries
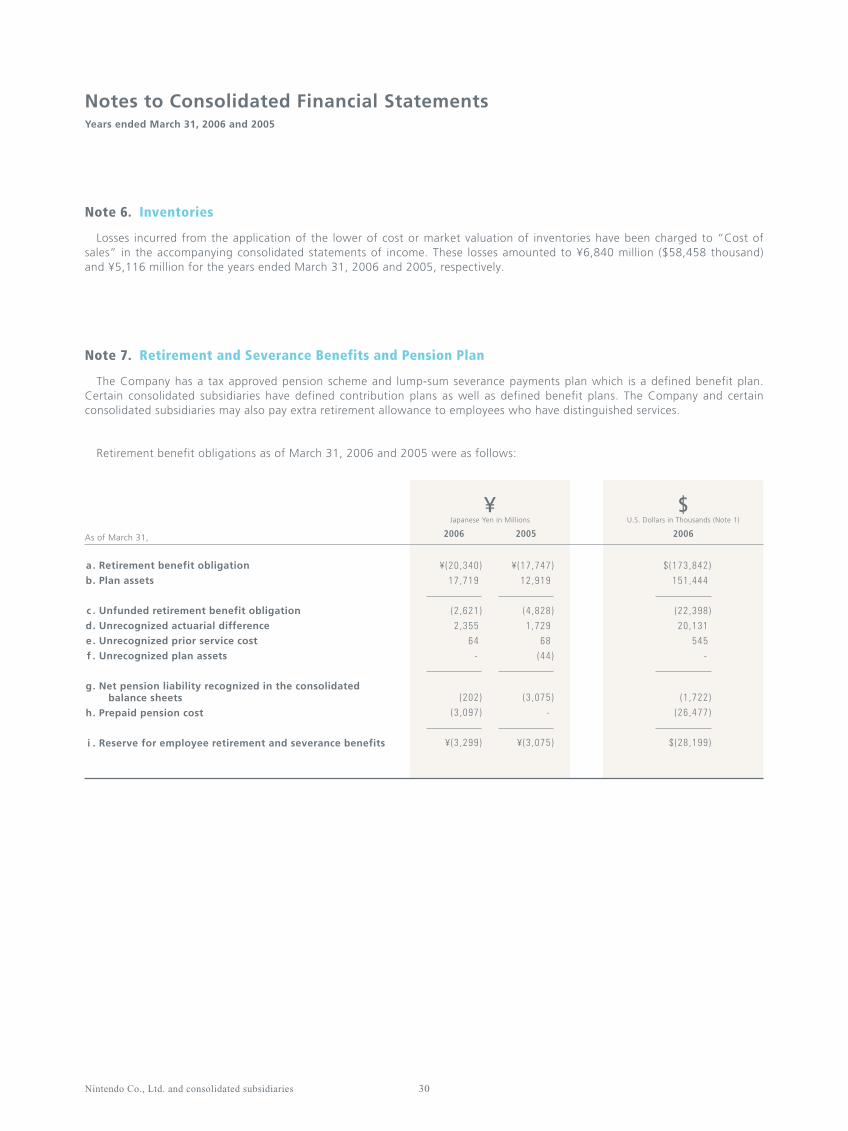
Losses incurred from the application of the lower of cost or market valuation of inventories have been charged to “Cost of sales” in the accompanying consolidated statements of income. These losses amounted to ¥6,840 million ($58,458 thousand) and ¥5,116 million for the years ended March 31, 2006 and 2005, respectively.
Note 6. Inventories
As of March 31,
¥ (20 ,340 )17 ,719
(2 ,621 )2 ,355
64 -
(202 )(3 ,097 )
¥ (3 ,299 )
¥ (17 ,747 )12 ,919
(4 ,828 )1 ,729
68 (44 )
(3 ,075 )-
¥ (3 ,075 )
$ (173 ,842 )151 ,444
(22 ,398 )20 ,131
545 -
(1 ,722 )(26 ,477 )
$ (28 ,199 )
. Retirement benefit obligation
. Plan assets
. Unfunded retirement benefit obligation
. Unrecognized actuarial difference
. Unrecognized prior service cost
. Unrecognized plan assets
. Net pension liability recognized in the consolidated balance sheets
. Prepaid pension cost
. Reserve for employee retirement and severance benefits
a
b
c
d
e
f
g
h
i
Retirement benefit obligations as of March 31, 2006 and 2005 were as follows:
The Company has a tax approved pension scheme and lump-sum severance payments plan which is a defined benefit plan. Certain consolidated subsidiaries have defined contribution plans as well as defined benefit plans. The Company and certain consolidated subsidiaries may also pay extra retirement allowance to employees who have distinguished services.
Note 7. Retirement and Severance Benefits and Pension Plan
Japanese Yen in Millions¥
2006 2005
U.S. Dollars in Thousands (Note 1)
$2006
Years ended March 31, 2006 and 2005
Notes to Consolidated Financial Statements
31 Nintendo Co., Ltd. and consolidated subsidiaries
. Service cost
. Interest cost
. Expected return on plan assets
. Amortization of actuarial difference
. Amortization of prior service cost
. Retirement benefit cost
. Other
. Total
a
b
c
d
e
f
g
h
Years ended March 31,
¥1 ,333 620
(342 )(2 ,237 )
10
(616 )
637 ¥21
¥1 ,292 504
(183 )(1 ,418 )
10
205
607 ¥812
$11 ,394 5 ,296
(2 ,923 )(19 ,116 )
85
(5 ,264 )
5 ,445 $181
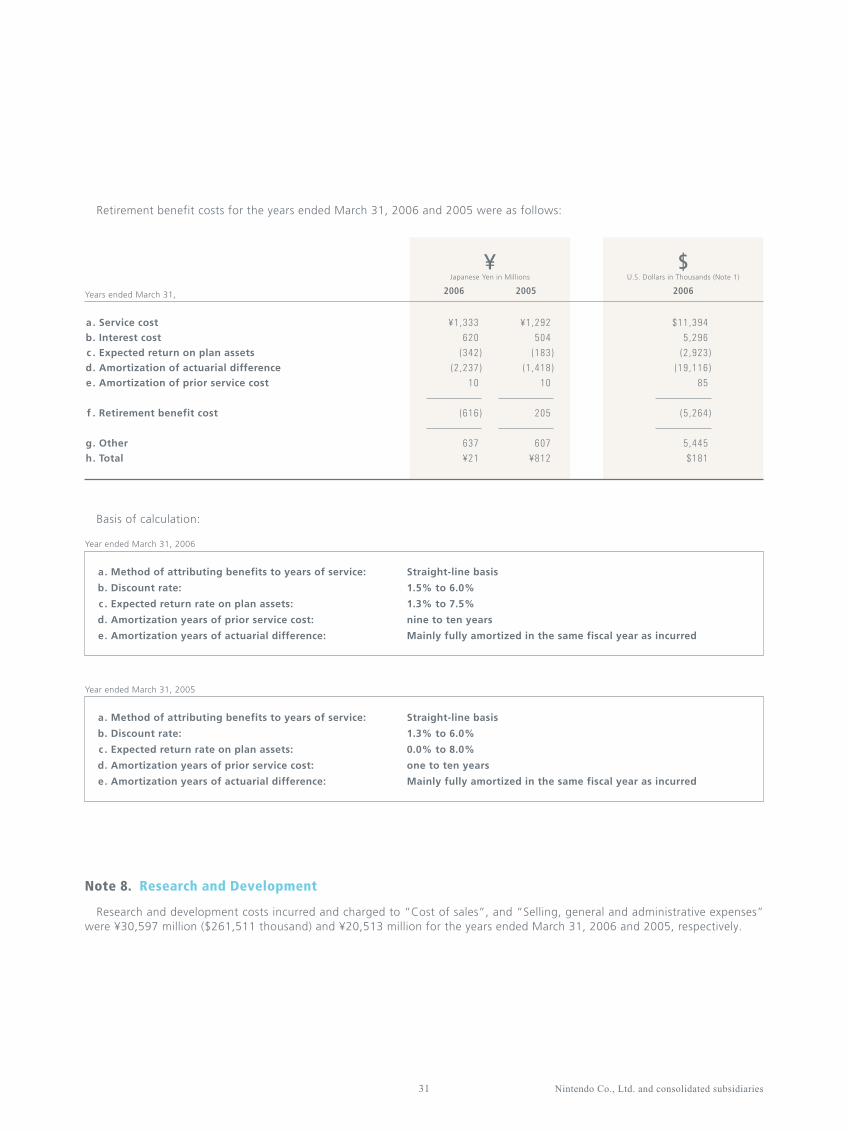
Retirement benefit costs for the years ended March 31, 2006 and 2005 were as follows:
Japanese Yen in Millions¥
2006 2005
U.S. Dollars in Thousands (Note 1)
$2006
Research and development costs incurred and charged to “Cost of sales”, and “Selling, general and administrative expenses” were ¥30,597 million ($261,511 thousand) and ¥20,513 million for the years ended March 31, 2006 and 2005, respectively.
Note 8. Research and Development
a
b
c
d
e
. Method of attributing benefits to years of service:
. Discount rate:
. Expected return rate on plan assets:
. Amortization years of prior service cost:
. Amortization years of actuarial difference:
Straight-line basis
1.5% to 6.0%
1.3% to 7.5%
nine to ten years
Mainly fully amortized in the same fiscal year as incurred
Year ended March 31, 2006
. Method of attributing benefits to years of service:
. Discount rate:
. Expected return rate on plan assets:
. Amortization years of prior service cost:
. Amortization years of actuarial difference:
a
b
c
d
e
Straight-line basis
1.3% to 6.0%
0.0% to 8.0%
one to ten years
Mainly fully amortized in the same fiscal year as incurred
Year ended March 31, 2005
Basis of calculation:

32Nintendo Co., Ltd. and consolidated subsidiaries
The Company is subject to several Japanese taxes based on income, which, in the aggregate, result in a normal statutory tax rates of approximately 40.6% for the years ended March 31, 2006 and 2005.
Note 9. Income Taxes
Significant components of deferred tax assets and liabilities are summarized as follows:
Deferred tax assets:
Research and development costs
Inventory - write-downs and elimination of unrealized profit
Other A/P and accrued expenses
Accrued enterprise tax
Land
Unrealized loss on investments in securities
Depreciation
Reserve for employee retirement and severance benefits
Other
Gross deferred tax assets
Valuation allowance
Total deferred tax assets
Deferred tax liabilities:
Unrealized gains on other securities
Undistributed retained earnings of subsidiaries and affiliates
Other
Total deferred tax liabilities
Net deferred tax assets
As of March 31,
¥6 ,998
7 ,418
5 ,428
3 ,452
2 ,572
1 ,962
1 ,059
1 ,337
7 ,277
37 ,503
(429 )
37 ,074
(4 ,918 )
(1 ,769 )
(717 )
(7 ,404 )
¥29 ,670
¥12 ,157
8 ,513
8 ,083
3 ,375
2 ,572
2 ,050
1 ,398
1 ,187
6 ,583
45 ,918
(731 )
45 ,187
(7 ,325 )
(2 ,111 )
(1 ,267 )
(10 ,703 )
¥34 ,484
$103 ,908
72 ,761
69 ,089
28 ,842
21 ,981
17 ,521
11 ,951
10 ,147
56 ,265
392 ,465
(6 ,253 )
386 ,212
(62 ,604 )
(18 ,045 )
(10 ,832 )
(91 ,481 )
$294 ,731
Reconciliations of the statutory tax rate and the effective tax rate for the years ended March 31, 2006 and 2005 are omitted, since the difference is not more than five one-hundredth of the statutory tax rate.
Japanese Yen in Millions¥
2006 2005
U.S. Dollars in Thousands (Note 1)
$2006
Years ended March 31, 2006 and 2005
Notes to Consolidated Financial Statements

33 Nintendo Co., Ltd. and consolidated subsidiaries
The Company and certain consolidated subsidiaries lease computer equipment and other assets. Total lease payments under finance leases not deemed to transfer ownership of the leased assets to the lessee for the years ended March 31, 2006 and 2005 were ¥209 million ($1,787 thousand) and ¥261 million, respectively.
Pro forma amounts of obligations under finance leases that do not transfer ownership of the leased assets to the lessee on an “as if capitalized” basis as of March 31, 2006 and 2005 were as follows:
Note 10. Leases
Acquisition cost
Accumulated depreciation
Net leased assets
¥637
310
¥327
¥827
478
¥349
$5 ,443
2 ,652
$2 ,791
U.S. Dollars in Thousands (Note 1)
$Japanese Yen in Millions
¥
U.S. Dollars in Thousands (Note 1)
$Japanese Yen in Millions
¥
U.S. Dollars in Thousands (Note 1)
$Japanese Yen in Millions
¥
As of March 31, 2006 2005 2006
Due within one year
Due after one year
Total
¥169
158
¥327
¥207
142
¥349
$1 ,437
1 ,354
$2 ,791
As of March 31, 2006 2005 2006
Due within one year
Due after one year
Total
¥576
3 ,363
¥3 ,939
¥573
3 ,404
¥3 ,977
$4 ,928
28 ,741
$33 ,669
As of March 31, 2006 2005 2006
Pro forma information of leased assets under finance leases that do not transfer ownership of the leased assets to the lessee on an “as if capitalized” basis as of March 31, 2006 and 2005 was as follows:
Depreciation expenses which are not reflected in the accompanying consolidated statement of income, computed by the straight-line method were ¥209 million ($1,787 thousand) and ¥261 million for the years ended March 31, 2006 and 2005, respectively.
The minimum rental commitments under noncancelable operating leases at March 31, 2006 and 2005 were as follows:
34Nintendo Co., Ltd. and consolidated subsidiaries
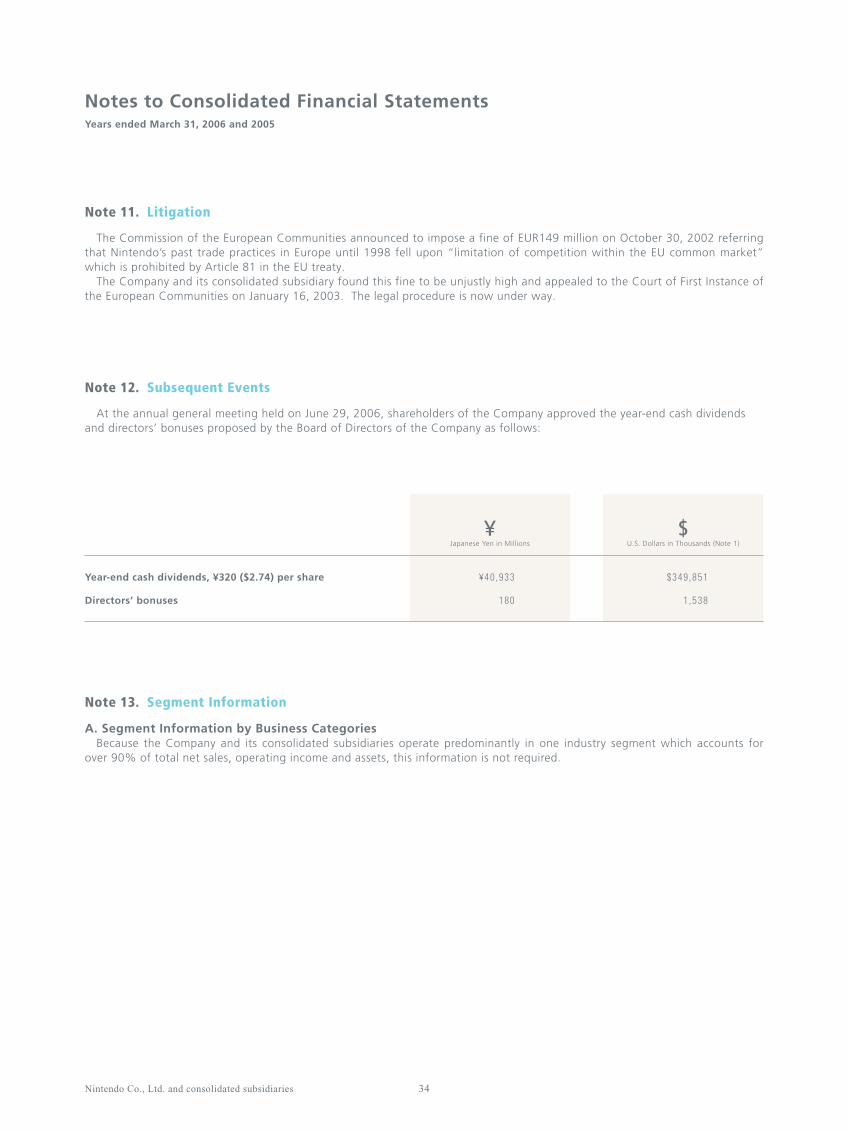
At the annual general meeting held on June 29, 2006, shareholders of the Company approved the year-end cash dividends and directors’ bonuses proposed by the Board of Directors of the Company as follows:
A. Segment Information by Business CategoriesBecause the Company and its consolidated subsidiaries operate predominantly in one industry segment which accounts for
over 90% of total net sales, operating income and assets, this information is not required.
Note 12. Subsequent Events
Note 13. Segment Information
Japanese Yen in Millions¥
Year-end cash dividends, ¥320 ($2.74) per share
Directors’ bonuses
¥40 ,933
180
$349 ,851
1 ,538
U.S. Dollars in Thousands (Note 1)
$
The Commission of the European Communities announced to impose a fine of EUR149 million on October 30, 2002 referring that Nintendo’s past trade practices in Europe until 1998 fell upon “limitation of competition within the EU common market” which is prohibited by Article 81 in the EU treaty.
The Company and its consolidated subsidiary found this fine to be unjustly high and appealed to the Court of First Instance of the European Communities on January 16, 2003. The legal procedure is now under way.
Note 11. Litigation
Years ended March 31, 2006 and 2005
Notes to Consolidated Financial Statements

35 Nintendo Co., Ltd. and consolidated subsidiaries
B. Segment Information by Seller’s Location
Net sales and operating income
Net sales
Sales to third parties
Inter segment sales
Total net sales
Cost of sales and selling, general and administrative expenses
Operating income
Assets
Japanese Yen in Millions¥
Year ended March 31, 2006
-
¥(251,835)
(251,835)
(258,762)
¥6,927
¥(31,964)
Eliminations orunallocated
assets
¥508,827
251,835
760,662
676,366
¥84,296
¥1,192,667
Total
¥6,956
78
7,034
6,922
¥112
¥3,151
Other
¥129,869
9
129,878
128,522
¥1,356
¥68,729
Europe
¥210,494
1,997
212,491
211,151
¥1,340
¥145,475
The Americas
¥161,508
249,751
411,259
329,771
¥81,488
¥975,312
Japan
¥508,827
-
508,827
417,604
¥91,223
¥1,160,703
Consolidated
Net sales and operating income
Net sales
Sales to third parties
Inter segment sales
Total net sales
Cost of sales and selling, general and administrative expenses
Operating income
Assets
Japanese Yen in Millions¥
Year ended March 31, 2005
-
¥(313,836)
(313,836)
(315,009)
¥1,173
¥(67,510)
Eliminations orunallocated
assets
¥514,988
313,836
828,824
716,539
¥112,285
¥1,200,002
Total
¥6,717
100
6,817
6,862
¥(45)
¥3,966
Other
¥121,354
10
121,364
117,778
¥3,586
¥72,591
Europe
¥256,119
1,881
258,000
248,959
¥9,041
¥152,764
The Americas
¥130,798
311,845
442,643
342,940
¥99,703
¥970,681
Japan
¥514,988
-
514,988
401,530
¥113,458
¥1,132,492
Consolidated
36Nintendo Co., Ltd. and consolidated subsidiaries
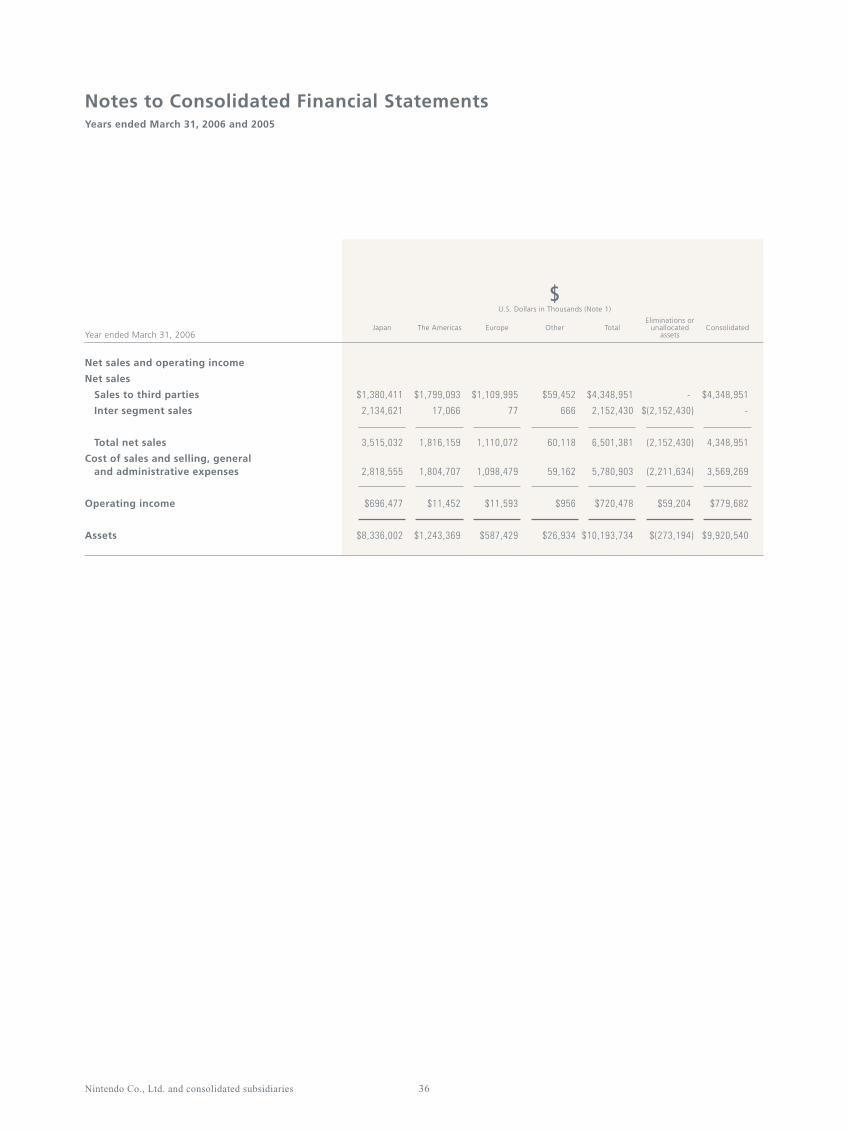
Net sales and operating income
Net sales
Sales to third parties
Inter segment sales
Total net sales
Cost of sales and selling, general and administrative expenses
Operating income
Assets
U.S. Dollars in Thousands (Note 1)
$
Year ended March 31, 2006
-
$(2,152,430)
(2,152,430)
(2,211,634)
$59,204
$(273,194)
Eliminations orunallocated
assets
$4,348,951
2,152,430
6,501,381
5,780,903
$720,478
$10,193,734
Total
$59,452
666
60,118
59,162
$956
$26,934
Other
$1,109,995
77
1,110,072
1,098,479
$11,593
$587,429
Europe
$1,799,093
17,066
1,816,159
1,804,707
$11,452
$1,243,369
The Americas
$1,380,411
2,134,621
3,515,032
2,818,555
$696,477
$8,336,002
Japan
$4,348,951
-
4,348,951
3,569,269
$779,682
$9,920,540
Consolidated
Years ended March 31, 2006 and 2005
Notes to Consolidated Financial Statements
37 Nintendo Co., Ltd. and consolidated subsidiaries
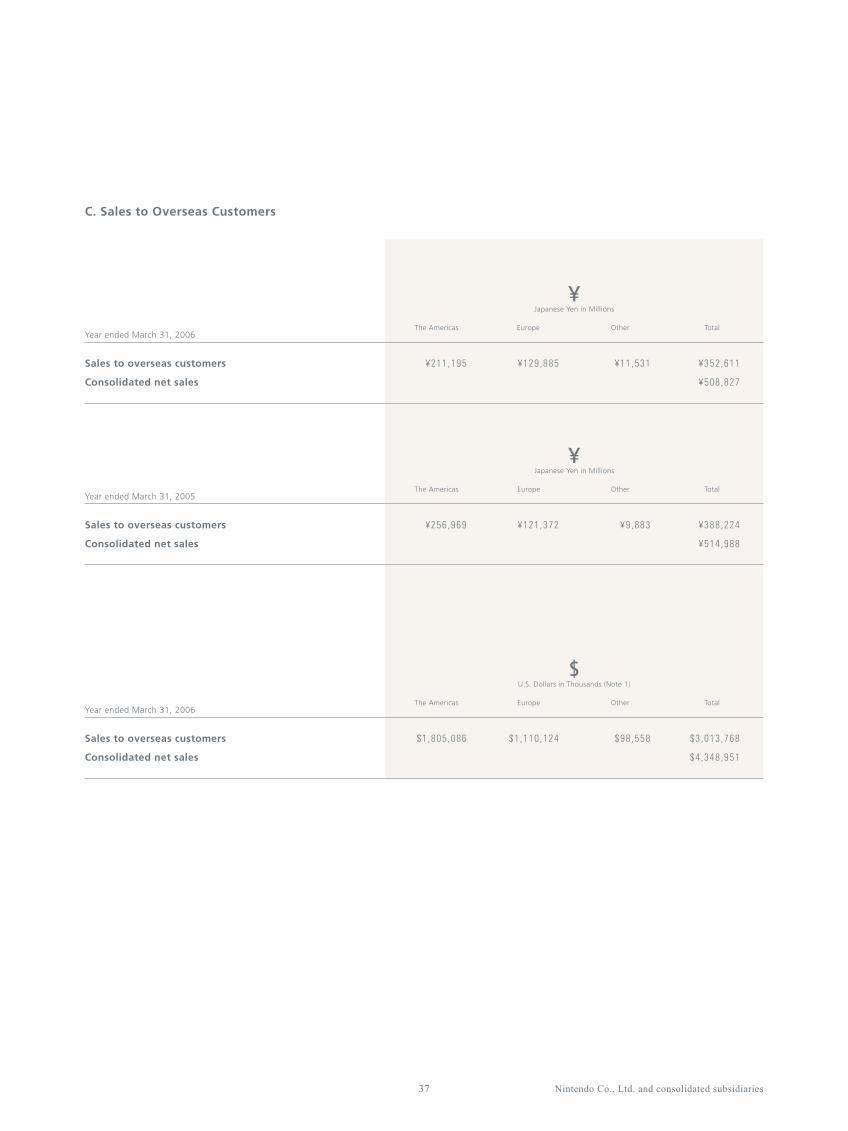
Japanese Yen in Millions¥
Sales to overseas customers
Consolidated net sales
¥211 ,195 ¥129 ,885 ¥11 ,531 ¥352 ,611
¥508 ,827
Year ended March 31, 2006The Americas TotalOtherEurope
Japanese Yen in Millions¥
Sales to overseas customers
Consolidated net sales
¥256 ,969 ¥121 ,372 ¥9 ,883 ¥388 ,224
¥514 ,988
Year ended March 31, 2005The Americas TotalOtherEurope
U.S. Dollars in Thousands (Note 1)
$
Sales to overseas customers
Consolidated net sales
$1 ,805 ,086 $1 ,110 ,124 $98 ,558 $3 ,013 ,768
$4 ,348 ,951
Year ended March 31, 2006The Americas TotalOtherEurope
C. Sales to Overseas Customers

38Nintendo Co., Ltd. and consolidated subsidiaries
Board of DirectorsPresidentSatoru Iwata*
Senior Managing DirectorsYoshihiro Mori*Shinji Hatano*Genyo Takeda*Shigeru Miyamoto*Nobuo Nagai*
Managing DirectorsMasaharu MatsumotoEiichi Suzuki
DirectorsKazuo KawaharaTatsumi KimishimaTakao OhtaKaoru TakemuraKoji Yoshida
Corporate AuditorsIchiro NakajiMinoru UedaYoshiro KitanoKatsuo YamadaNaoki Mizutani
*Representative Director
As of June 29, 2006
Principal offices andfacilities [Domestic]Corporate Headquarters 11-1, Kamitoba hokotate-cho,Minami-ku,Kyoto 601-8501,JapanTel : 81-75-662-9600
PlantsUji PlantUji Okubo PlantUji Ogura Plant
Offices and Distribution CenterTokyo Branch OfficeOsaka Branch OfficeNagoya OfficeOkayama OfficeSapporo OfficeTokyo Distribution Center
Principal consolidatedsubsidiaries [Overseas]Nintendo of America Inc.4820 150th Avenue N.E.Redmond, WA 98052U.S.A.Tel : 1-425-882-2040
Nintendo of Canada Ltd.110-13480 Crestwood PlaceRichmond, B.C. V6V 2J9CanadaTel : 1-604-279-1600
Nintendo of Europe GmbHNintendo Center 63760 Großostheim,GermanyTel : 49-6026-950-0
Nintendo France S.A.R.L.Le Montaigne 6, boulevard de l’Oise 95031, Cergy CedexFranceTel : 33-1-34-35-46-00
Nintendo España, S.A.Azalea, 1-Edificio DMiniparc 1-El Soto de la Moraleja28109 AlcobendasMadrid, SpainTel : 34-917-886-400
Nintendo Benelux B.V.Krijtwal 33, 3432 ZTNieuwegein,The NetherlandsTel : 31-30-6097100
Nintendo Australia Pty. Ltd.804 Stud Road Scoresby,Victoria 3179,AustraliaTel : 61-3-9730-9900
Branch offices [Overseas]Nintendo Benelux B.V.,Belgium BranchFrankrijklei 31-33B-2000 Antwerpen,BelgiumTel : 32-3-2247670
Nintendo of Europe GmbH,UK BranchMansour House,188 Bath Road, SloughBerkshire SL1 3GA,U.K.Tel : 44-1753-472-777
Nintendo of Europe GmbH,Italy BranchVia Pelizza da Volpedo no. 51/53Cinisello Balsamo, 20092 Milano ItalyTel : 39-02-61117-100
Other consolidatedsubsidiariesDomestic:ND CUBE Co., Ltd.Brownie Brown Inc.
Overseas:NES Merchandising Inc.NHR Inc.HFI Inc.Nintendo Phuten Co., Ltd.Nintendo Technology Development Inc.Nintendo Software Technology Corporation SiRAS.com Inc.Retro Studios, Inc.Nintendo (Hong Kong) Ltd.Nintendo Research, Inc.
Non-consolidated subsidiarywith equity method non-appliedDomestic:Fukuei Co., Ltd.
Affiliated companies withequity method appliedDomestic:The Pokémon Company WARPSTAR, Inc.
Overseas:Silicon Knights Inc.iKuni Inc.iQue Ltd.iQue (China) Ltd.The Baseball Club of Seattle, L.P.
Affiliated companies withequity method non-appliedDomestic:Ape inc.
Corporate Directory

39 Nintendo Co., Ltd. and consolidated subsidiaries
Corporate Headquarters
Nintendo Co., Ltd.11-1, Kamitoba hokotate-cho,Minami-ku,Kyoto 601-8501,JapanTel : 81-75-662-9600
Nintendo Co., Ltd. Common Stock
Nintendo Co., Ltd.common stock is listed on theOsaka Securities Exchange, Section 1and the Tokyo Stock Exchange,Section 1.
Annual MeetingThe Annual Meeting ofShareholders for fiscal year ended March 31, 2006was held on Thursday,June 29, 2006at Nintendo Co., Ltd.Kyoto, Japan.
Investor RelationsSecurities analysts, institutionalinvestors, and other members ofthe financial communityrequesting information aboutNintendo Co., Ltd. should contact:
Mr. Yoshihiro MoriSenior Managing DirectorGeneral Manager,Corporate Analysis & Administration Division
Nintendo Co., Ltd.11-1, Kamitoba hokotate-cho,Minami-ku,Kyoto 601-8501,JapanTel : 81-75-662-9614Fax : 81-75-662-9544E-mail: [email protected]
Public Relations
Mr. Reginald Fils-AimePresident and Chief Operating Officer
Mr. George HarrisonSenior Vice President,Marketing & Corporate Communications
Nintendo of America Inc.4820 150th Avenue N.E.Redmond, WA 98052U.S.A.Tel : 1-425-882-2040
Corporate Communication DepartmentNintendo Co., Ltd.11-1, Kamitoba hokotate-cho,Minami-ku,Kyoto 601-8501,JapanTel : 81-75-662-9600Fax : 81-75-662-9540
Independent AuditorChuoAoyama PricewaterhouseCoopersKyoto, Japan
Visit Nintendoon the Internet at
http://www.nintendo.com
Shareholder and Investor Information