annual report 2010 - shionogi
TRANSCRIPT

SONG for the Real Growth
Annual Report 2010Year ended March 31, 2010

The Company Policy of Shionogi
Mission
Vision Value
Shionogi’s Action Guidelines MissionWe will deliver pharmaceuticals that offer an even higher level of satisfaction to patients, their fami-lies, and healthcare providers and improve the quality of life for patients and their families.
VisionA company with a strong presence worldwide A company that has pride and dreams and embraces challenges
ValueCustomer focus, Trust, Professionalism, On-site orientation, Respect for the individual
Shionogi strives constantly to provide medicine of the best possible kind essential for protection of the health of the people.
Shionogi’s purpose
For this purpose, Shionogi will need to
Pursue the search for even better medicine.
Produce even better medicine.
Promote the word of even better medicine to an even greater number of people
so that an even greater number of people will be able to use such medicine.
Pursue, produce, and promote in an even more economical manner.
For this purpose, Shionogi people will need to
Strive ceaselessly day after day to improve their skills.
Strive ceaselessly day after day to improve as human beings.
As a result, Shionogi people will
Find even greater satisfaction in their daily work and in their daily lives.
Find even greater improvement in the quality of their lives.
Find even greater prosperity in their lives.
(Established in 1957)
Editorial PolicyPeriod under ReviewFiscal 2009 (April 1, 2009 - March 31, 2010)Certain activities continuing into fi scal 2009 and thereafter are also included.
Scope and OrganizationThe Annual Report encompasses the activities of Shionogi & Co., Ltd., and its 22 Group companies (17 consolidated subsidiaries and 4 affi liates).
The section entitled Shionogi’s Environmental Activities covers all business facilities of Shionogi & Co., Ltd., and eight of its domestic and overseas subsidiaries. In this report, “Shionogi” refers to Shionogi & Co., Ltd., and all its on-site subsidiaries. “Domestic subsidiaries” refers to the two domestic manufacturing subsidiaries (Bushu Pharmaceuticals Ltd. and Nichia Pharmaceutical Industries Ltd.) and two domestic non-manufacturing subsidiaries (Shionogi General Service Co., Ltd., and Saishin Igaku Co., Ltd.), and “overseas subsidiary” refers to Taiwan Shionogi & Co., Ltd. “Shionogi Group” refers to all the aforementioned companies.
Notes Concerning Numerical Values and GraphsAll numerical values are rounded to the nearest unit, as applicable. Totals may not match due to rounding.

Eleven-Year Consolidated Financial Highlights 2To Our Stakeholders 4
Interview with the President 6
Management 2
Corporate Information 68
Financial Section 41
Corporate Governance System 38Members of the Board 40
Corporate Governance 38
Shionogi’s Environmental Activities 34
Shionogi’s CSR Activities 30
◆ Pharmaceutical Research 16◆ Pharmaceutical Development 18◆ Pipeline 20◆ Manufacturing & Technology 22◆ Quality, Safety and Regulatory Affairs Management 23◆ Human Health Care 24◆ Overseas Business Activities 26◆ Major Products 28
Shionogi’s Business Activities 12
Contents
3rd Medium-Term Business Plan
“SONG for the Real Growth” 12
Fundamental Policy on CSR 30Relationships with Patients and Medical Professionals 31Relationship with Employees 32Community Relations 33Investor Relations 33
Efforts to Preserve the Environment 34Environmental Management Organization 34Activity Results 34Phase 3 Shionogi Group Environmental Protection Plan 36
Forward-Looking StatementsThis report contains forward-looking statements. These statements are based on expectations in light of the information currently available, assumptions that are subject to risks, and uncer-tainties which could cause actual results to differ materially from these statements. Risks and uncertainties include general domestic and international economic conditions, such as general industry and market conditions, and changes of interest rates and currency exchange rates. These risks and uncertainties particularly apply to forward-looking statements concerning existing products and those under development. Product risks and uncertainties include, but are not limited to, completion and discontinuation of clinical trials; obtaining regulatory approvals; claims and concerns about product safety and effi cacy; technological advances; adverse out-come of important litigation; domestic and foreign healthcare reforms; and changes of laws and regulations. For existing products, there are also manufacturing and marketing risks, which include, but are not limited to, inability to build production capacity to meet demand, unavailability of raw materials, and competition with other companies’ products. The Company disclaims any intention or obligation to update or revise any forward-looking statements whether as a result of new information, future events, or otherwise. This report contains information on pharmaceuticals (including compounds under development), but this information is not intended to make any representations or advertisements regarding the effi cacy of these pharmaceuticals nor provide medical advice of any kind.
Financial SectionCorporate Inform
ationM
anagement
Shionogi’s Business Activities
Shionogi’s CSR Activities
Shionogi’s Environmental
Activities
Corporate Governance
1SHIONOGI & CO., LTD. Annual Report 2010

2
Shionogi & Co., Ltd. and Consolidated SubsidiariesYears ended March 31
Eleven-Year Consolidated Financial Highlights
2001 2004200320022000
For the year ended March 31:Net sales .............................................................Cost of sales .......................................................Selling, general and administrative expenses ...Operating income ..............................................Income before income taxes and minority interests ..................................Net income .........................................................Research and development expenses ...............Capital investments ........................................
As of March 31:Property, plant and equipment, net .................Total assets .....................................................Total long-term liabilities .................................Total net assets ...............................................Working capital ..............................................
Per share amounts:Net income .........................................................Net assets ...........................................................Cash dividends applicable to the year ..............
¥200,48579,856
100,33720,292
5,1782,204
29,8084,404
¥ 71,993376,161
49,005292,387179,382
¥ 6.06844.53
8.50
¥285,232153,402112,564
19,266
9,1395,904
31,2849,012
¥ 75,585371,704
49,145274,996162,926
¥ 16.66789.91
8.50
¥420,188273,692130,312
16,184
18,7558,456
30,6028,810
¥ 86,387480,668
58,971281,123155,239
¥ 24.28806.02
8.50
¥412,664263,629125,126
23,909
24,55612,61429,255
8,331
¥ 87,971496,591
67,592288,919197,686
¥ 36.29823.27
8.50
¥400,281253,202121,658
25,421
27,69712,86827,027
9,355
¥ 86,613
442,54750,812
257,596192,656
¥ 37.07735.14
8.50
Millions of yen
Yen
First medium-term business plan
* US dollar fi gures have been calculated, for convenience only, at the rate of ¥93.04 = US$1.00, the approximate rate of exchange on March 31, 2010.* From the fi scal year ended March 31, 2007, the Company has adopted a new accounting standard for the presentation of net assets in the balance sheet, which reclassifi es former shareholders’ equity,
valuation and translation adjustments, and minority interests as total net assets. Figures for fi scal years through the year ended March 31, 2006 have been calculated in conformity with the new standard.
Fiscal 2000April First medium-term
business plan startsFebruary the US subsidiary Shionogi
USA, Inc. established
Fiscal 2001October Agrochemical operations
transferred
October Overseas joint venture Shionogi-GlaxoSmithKline Pharmaceuticals, LLC established
March Clinical testing operations transferred
Fiscal 2002April Animal health operations
transferred
August Anti-allergic product Claritin® 10mg Tablets launched
October Ohmori Co., Ltd. merged with Suzuken Co., Ltd.
Fiscal 2003July Controlled-release oral
analgesic for cancer pain OxyContin® Tablets launched
October Industrial chemical operations transferred
Fiscal 2004November Allergy medication
Claritin® RediTabs® 10mg Tablets launched
Fiscal 2005April Second medium-
term business plan starts
April Hyperlipidemia treatment Crestor® Tablets launched
September Carbapenem antibiotic Finibax® 0.25g IV solution launched
October Capsule operations sold
December New quinolone antibiotic Avelox® Tablet 400mg launched
January Multi-year research and worldwide co-marketing agreement for novel analgesic drug compounds signed with Purdue Pharma L.P.
Fiscal 2006June Rapid BNP test
Shionospot® BNP and associated measurement system Shionospot® Reader launched
June Carbapenem antibiotic Finibax® 0.25g IV solution kit launched
September Premature ovulation inhibitor Cetrotide® 0.25mg and 3mg for injection launched
February Cancer pain analgesic OxiNorm® Powder 0.5% launched
March License agreement concluded with BioCryst Pharmaceuticals, Inc. for anti-infl uenza drug Peramivir
Fiscal 2007April Results of PRIME
Program “Crestor® clinical experience investigation study of approximately 10,000 Japanese patients” reported
May Shionogi’s drug discovery competition started
January Shionogi Analysis Center Co., Ltd. Established
January Allergic diseases treatment Claritin® Dry Syrup 1% launched

Financial SectionCorporate Inform
ationM
anagement
Shionogi’s Business Activities
Shionogi’s CSR Activities
Shionogi’s Environmental
Activities
Corporate Governance
3SHIONOGI & CO., LTD. Annual Report 2010
2010 201020092008200720062005
¥ 214,26868,594
105,27540,399
39,96325,06440,29011,661
¥ 70,378413,704
29,024342,236152,520
¥ 74.211,020.31
22.00
¥ 199,75967,542
103,35428,863
31,72318,59537,45611,411
¥ 67,815429,569
36,282345,752161,355
¥ 54.611,014.73
16.00
¥196,38968,70898,45529,226
38,79822,73532,257
5,386
¥ 64,251427,683
38,371337,434156,449
¥ 66.55989.76
16.00
¥199,36574,06996,56728,729
31,65518,94229,409
5,424
¥ 68,191396,999
27,783300,065152,914
¥ 54.64879.79
12.00
¥227,51270,929
124,568 32,015
30,786 15,661 52,822 10,875
¥ 71,812501,853 114,955 310,094 125,920
¥ 46.75924.43
28.00
¥ 278,50376,264
149,801 52,438
58,541 38,626 51,808 12,547
¥ 62,448540,762 131,956 341,976 183,834
¥ 115.331,019.71
36.00
Thousands of US dollarsMillions of yen
US dollarsYen
Second medium-term business plan Third medium-term business plan
$2,993,368819,690
1,610,071 563,607
629,202 415,155 556,836 134,855
$ 671,1955,812,145 1,418,272 3,675,580 1,975,860
$ 1.2410.96
0.39
Fiscal 2008April Cancer Pain Relief Consortium established
May Joint research facility with Hokkaido University, Shionogi Innovation Center for Drug Discovery, established
July Hypertension treatment Irbetan® 50mg and 100mg Tablets launched
October Sciele Pharma, Inc. acquired
October Acne vulgaris treatment Differin® Gel 0.1% launched
November New facility for formulation and packaging of solid dosage forms completed at Settsu plant
December Idiopathic pulmonary fi brosis treatment Pirespa® 200mg Tablets launched
February Licensing agreement on Peptide vaccines for cancer treatment concluded with OncoTherapy Science, Inc.
February Serum glycan analysis service joint venture Ezose Sciences, Inc. established in the US
Fiscal 2009October Agreement on international industry-academic collaboration
initiative signed with United Kingdom
November Sciele Pharma, Inc. acquires the US specialty pharmaceutical company Addrenex Pharmaceuticals, Inc.
January Sciele Pharma, Inc. changes name to Shionogi Pharma, Inc.
January Anti-viral drug for infl uenza Rapiacta® 300mg Bag for Intravenous Drip Infusion and Rapiacta® 150mg Vial for Intravenous Drip Infusion launched
Fiscal 2010April Third medium-term business
plan startsApril Antidepressant drug Cymbalta®
Capsules 20mg and 30mg launched
July Shionogi Inc. established as the US group headquarters
March Exclusive license agreement concluded with QuatRx Pharmaceuticals Company to market post-menopausal vulvovaginal atrophy treatment Ospemifene
March Bushu Pharmaceuticals Ltd. sold
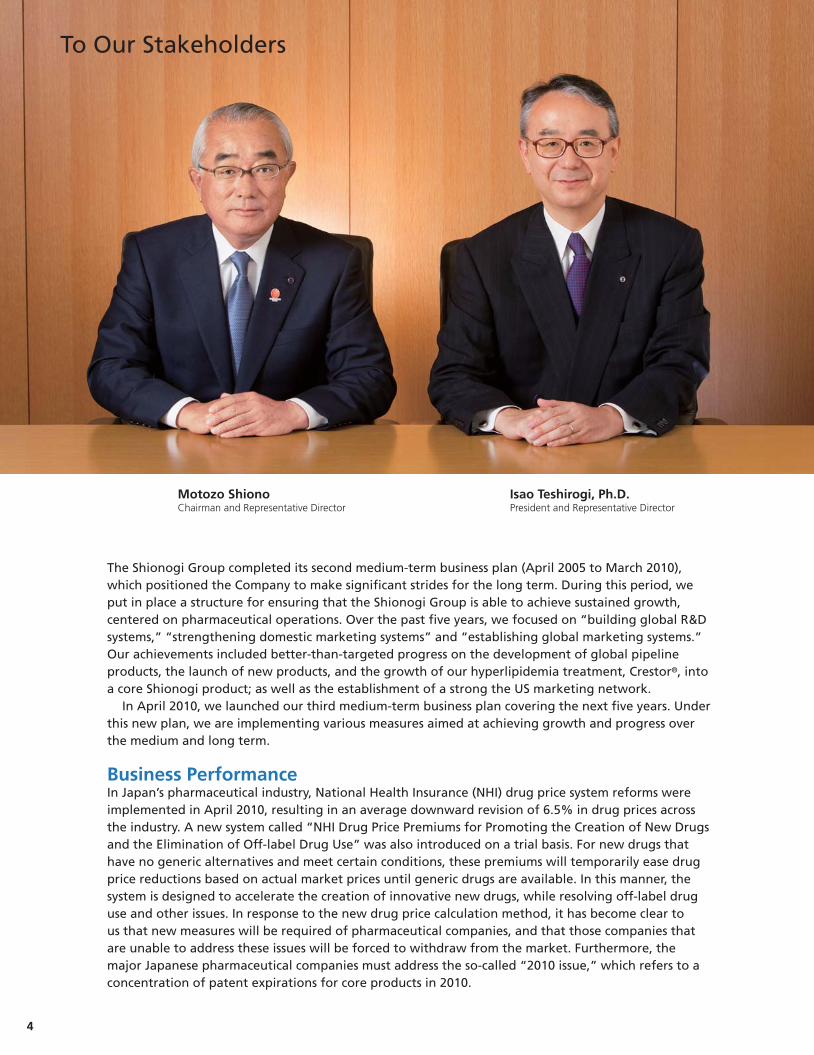
To Our Stakeholders
The Shionogi Group completed its second medium-term business plan (April 2005 to March 2010), which positioned the Company to make significant strides for the long term. During this period, we put in place a structure for ensuring that the Shionogi Group is able to achieve sustained growth, centered on pharmaceutical operations. Over the past five years, we focused on “building global R&D systems,” “strengthening domestic marketing systems” and “establishing global marketing systems.” Our achievements included better-than-targeted progress on the development of global pipeline products, the launch of new products, and the growth of our hyperlipidemia treatment, Crestor®, into a core Shionogi product; as well as the establishment of a strong the US marketing network. In April 2010, we launched our third medium-term business plan covering the next five years. Under this new plan, we are implementing various measures aimed at achieving growth and progress over the medium and long term.
Business PerformanceIn Japan’s pharmaceutical industry, National Health Insurance (NHI) drug price system reforms were implemented in April 2010, resulting in an average downward revision of 6.5% in drug prices across the industry. A new system called “NHI Drug Price Premiums for Promoting the Creation of New Drugs and the Elimination of Off-label Drug Use” was also introduced on a trial basis. For new drugs that have no generic alternatives and meet certain conditions, these premiums will temporarily ease drug price reductions based on actual market prices until generic drugs are available. In this manner, the system is designed to accelerate the creation of innovative new drugs, while resolving off-label drug use and other issues. In response to the new drug price calculation method, it has become clear to us that new measures will be required of pharmaceutical companies, and that those companies that are unable to address these issues will be forced to withdraw from the market. Furthermore, the major Japanese pharmaceutical companies must address the so-called “2010 issue,” which refers to a concentration of patent expirations for core products in 2010.
Isao Teshirogi, Ph.D.President and Representative Director
Motozo ShionoChairman and Representative Director
4
Overseas, newly emerging markets centered in China and India are experiencing substantial growth. Meanwhile, the Health Insurance Reform Bill was enacted in the US, the world’s largest pharmaceutical market. While further expansion in the US market is projected, pharmaceutical companies are expected to face many different challenges, including an increase in rebates and tax obligations commensurate with their market share. In light of these significant shifts in the global pharmaceutical market, a diverse range of responses are now required of pharmaceutical companies.
Shionogi’s Current Status and Initiatives AheadShionogi surpassed its target by launching 11 products in Japan during the five-year period of its second medium-term business plan. The key to maximizing “NHI Drug Price Premiums for Promoting the Creation of New Drugs and the Elimination of Off-label Drug Use,” which were introduced on a trial basis as part of the latest round of drug price system reforms, is to focus on selling new drugs at appropriate prices that justify their product value, and expanding these sales. Seeing this new system as an opportunity, Shionogi will work to achieve growth by expanding new drug sales in the Japanese market. Meanwhile, globalization is crucial to achieving future growth. Pharmaceutical companies must continuously launch a steady stream of products developed internally on a global basis in order to develop overseas business. Crestor® is one of our core products in the domestic market, and is expanding worldwide. However, Shionogi will face the expiration of patents for Crestor® in 2016-2017. In response, we aim to achieve long-term growth by maximizing royalty income from Crestor®, which is currently expanding globally, and to actively invest in R&D activities that will create future growth products for Shionogi. Shionogi has designed its third medium-term business plan as a roadmap for achieving substantial growth in the next five years based on our vision for the company ten years from now, while preparing to maintain growth after the expiration of patents for Crestor®. In terms of concrete strategies, we will first build a strong earnings base by maximizing sales of new products centered on Crestor® in the domestic market, our main growth platform. At the same time, we will pursue the enhancement and development of our pipeline products on a global scale. Furthermore, through the concentration of R&D resources on priority diseases, we aim to develop pipeline products and rapidly bring them to market. We have also started working to explore new priority domains to achieve long-term growth. With regard to establishing global marketing systems, we will enhance our the US business through Shionogi Inc., which was established in July, in order to increase the consolidated overseas sales ratio. Meanwhile, we will bolster our development framework spanning the four regions of Japan, the US, Europe and Asia, and will begin considering entering additional Asian markets. Shionogi is determined to make concerted efforts to advance to a new stage of real growth that is clear for all to see.
We look forward to the continued commitment and support of all our shareholders and other stakeholders.
Isao Teshirogi, Ph.D.President and Representative Director
Motozo ShionoChairman and Representative Director
Financial SectionCorporate Inform
ationM
anagement
Shionogi’s Business Activities
Shionogi’s CSR Activities
Shionogi’s Environmental
Activities
Corporate Governance
5SHIONOGI & CO., LTD. Annual Report 2010

Isao Teshirogi, Ph.D.President and Representative Director
6
The second medium-term business plan was about Shionogi making significant strides for the long term. We set the three targets for the five-year plan of “building global R&D systems,” “strengthening domestic marketing systems” and “establishing global marketing systems.” In research and development, we exceeded our goal by progressing seven compounds as far as Phase II development or beyond. While reinforcing Shionogi’s presence in infectious diseases, where the Company has been traditionally strong, we also bolstered our presence in the therapeutic domains of metabolic syndrome and pain. Most significantly, we were able to achieve sufficient growth to develop global pipeline products.
01Q
In Japan, we exceeded our development goal by launching 11 new products (compared with an initial target of 10). I think we can be proud of this industry-leading achievement, which is testament to the high quality and speed of Shionogi’s R&D capabilities. With regard to strengthening domestic marketing systems, we gradually shifted our marketing focus from acute to chronic diseases. We expanded sales of our hyperlipidemia treatment Crestor® to the point where it is now our top-selling product in Japan, while successfully expanding sales of the hypertension treatment Irbetan®. In overseas developments, we acquired Sciele Pharma, Inc. (now Shionogi Pharma, Inc.)
Interview with the President
First, could you give us an overview of the second medium-term business plan, which ended in fiscal 2009?

Financial SectionCorporate Inform
ationM
anagement
Shionogi’s Business Activities
Shionogi’s CSR Activities
Shionogi’s Environmental
Activities
Corporate Governance
7SHIONOGI & CO., LTD. Annual Report 2010
First, we need to develop a management structure that is not reliant on royalty income. While it is true that we have actively increased R&D expenses in step with growth in royalty income, I believe that our top priority is to shift to a structure that is able to remain profitable without royalties. To this end, we must bolster our domestic marketing base while continuously creating a steady stream of globally competitive products developed internally. In research, our early-stage drug discovery programs to find greater numbers of promising new chemical entities (NCEs) are a bit weak. To boost our success rates with compounds in development, we must achieve greater accuracy in terms of clinical predictability. On the development side, we can proudly say that our domestic development team has grown into one of the strongest in Japan. We must now make our development capabilities as strong on a global scale as they are in Japan. In production technology, we renamed the former Sciele
02Q
Pharma, Inc. in the US to Shionogi Pharma, Inc. and began selling products under the Shionogi brand. We must now develop “Shionogi quality” on a global scale. Furthermore, in domestic sales, while our top priority is to develop systems for achieving sales growth centered on new products, the optimization of selling expenses is just as urgent. In regard to reducing costs, our administrative divisions seek to streamline the head office. I believe there is substantial scope to do this. Finally, I believe that the development of globally competitive human resources is crucial. I had wanted to start doing this much earlier. We stationed around 10 employees at Shionogi Pharma, Inc. from the second half of 2009, and intend to increase their number to several tens of employees going forward. We intend to address all of the issues I have just outlined in the third medium-term business plan, which began in April 2010.
to achieve our long-awaited goal of building a strong the US marketing network. Our exports of antibacterials expanded steadily to Europe, the US and Asia, with sales in fiscal 2009 approximately four times that of fiscal 2004, the final year of the first medium-term business plan. On the other hand, in terms of business performance, we did not achieve our numerical targets of net sales of ¥280.0 billion and operating income of ¥60.0 billion, despite posting higher sales and earnings in fiscal 2009. This was mainly
the result of a drop in seasonal prescription drug sales in Japan, as well as the fact that the full-year sales contribution from Shionogi Pharma, Inc. did not register any year-on-year growth due to the impact of the recession triggered by the bankruptcy of Lehman Brothers. In this manner, although we delivered major achievements during the second medium-term business plan, we recognize that there are still many issues outstanding.
Results of the Second Medium-Term Business Plan (Consolidated)
FY2005 FY2006 FY2007 FY2008 FY2009
199.7196.3 214.2227.5
278.5
Plan 280.0
YoYincrease22.4%
50
0
100
150
200
250
Plan 60.0
29.2 28.840.3
32.0
52.4
YoYincrease63.8%
20
0
40
60
80
FY2005 FY2006 FY2007 FY2008 FY2009
300(Billion yen)
Net Sales
100
(Billion yen)
Operating Income
What issues remain outstanding from the second medium-term business plan?

8
Shionogi launched 11 new drugs during the second medium-term business plan. Therefore, I believe the “NHI Drug Price Premiums for Promoting the Creation of New Drugs and the Elimination of Off-label Drug Use,” which were introduced as part of drug price system reforms in April, provide a strong tail wind for Shionogi even though the system is still at a trial stage. We have positioned three products, namely Crestor®, Irbetan® and Cymbalta®, as our core strategic products, and
When formulating the plan, we first considered our vision for the Company ten years from now. We chose 13 relatively young, general-manager level employees from the Company’s business divisions to think about and debate where Shionogi needed to be in the next 10 years, and report back their conclusions. Naturally, from a 10-year perspective, we realized that the most important issue we face is how to overcome the cliff represented by the expiration of Crestor® patents—that is, the drop in royalty income resulting from these patent expirations in 2016-2017—and restore growth thereafter. In light of this, we formulated three basic strategies for preparing for this transition over the next five years:1. Maximize sales of existing products; 2. Invest in new growth drivers to surmount the cliff represented by the expiration of Crestor® patents; and, 3. Discover the next generation of new molecular entities (NMEs), which must be enhanced when looking ahead ten years from now.
We also established “SONG for the Real Growth” as our slogan for the third medium-term business plan. “SONG” stands for Speed (Quick decision and implementation), Open Mind (Flexible mind and out of box thinking), Never-failing Passion (Persistent passion), and Global Perspective (Higher and broader perspective). These four phrases were chosen taking into consideration the type of corporate culture that we must develop in order for Shionogi to achieve substantial growth over the next five years. On reflection, we believe that the basic strategies of the first and second medium-term business plans were not defined clearly enough within the Company. Therefore we want everybody in Shionogi to feel a part of this third medium-term plan so that it underscores what we do on a daily basis, as we work to achieve its goals.
Crestor® Cliff
Third medium-termbusiness plan
Fourth medium-termbusiness plan
Fifth medium-termbusiness plan
2010 2012 2014 2016 2018 2020
Shionogi’s Medium- to Long-Term Vision
Restored growth era
Challenging era
Consolidated net sales: ¥600 billion Operating margin: More than 25%
Overseas net sales ratio: More than 50%
Steady growth era, mainly through Crestor®
Basic Strategy 1
Steady growth primarily through enriched pipeline
Basic Strategy 2
Investment in new growth drivers
Therapeutic areas of continued focus
Basic Strategy 3
Goals for the next 10 years
03Q
we aim to increase total sales from these three products from ¥27.9 billion in fiscal 2009 to ¥100 billion in fiscal 2014. We have also defined five additional strategic products as Pirespa®, Differin®, Rapiacta®, Finibax® and OxyContin®/ OxiNorm®. We aim to increase combined sales from these 8 strategic products, as a percentage of total domestic sales, from approximately 30% in fiscal 2009 to at least 70% in fiscal 2014. We believe these targets are well within reach
Interview with the President
What are the basic principles underlying the formulation of Shionogi’s third medium-term business plan?
04Q
Please explain the first basic strategy, “steady growth primarily through enriched pipeline.”

Financial SectionCorporate Inform
ationM
anagement
Shionogi’s Business Activities
Shionogi’s CSR Activities
Shionogi’s Environmental
Activities
Corporate Governance
9SHIONOGI & CO., LTD. Annual Report 2010
In order to continue achieving long-term growth, we must accurately identify trends in new therapeutic areas, and discover the seeds of new drugs that satisfy unmet medical
Research facility dedicated to drug discovery (Rendering)
needs. Shionogi’s three priority therapeutic areas at present are metabolic syndrome, infectious diseases and pain. However, we should also note that trends change over time in terms of the types of drugs targeted in R&D and the diseases that require new pharmaceutical therapies. In the third medium-term business plan, Shionogi aims to develop pipeline products and rapidly bring them to market by focusing R&D resources on obesity/diabetes and viral infections. Furthermore, to identify new future trends, we will further advance various joint research programs with various academic institutions, in order to flexibly address medical needs and take on the challenge of budding research in new therapeutic areas.
In order to surmount the cliff represented by the expiry of Crestor® patents, we must continuously develop and bring to market a steady stream of original products. The goal of our first strategy is to maximize sales from existing products. Our second strategy is focused on the creation of new internally developed drugs that can drive future growth. The plan objective is to progress at least five compounds as far as late-stage clinical development (defined as Phase III or Phase IIb clinical trials) on a global basis. We also aim to make submissions for overseas regulatory approval of four compounds that we originally discovered in Japan and launch at least one of these products within the plan period. High-level development portfolio management skills will be
essential to achieve these goals. To conduct effective drug development activities with a limited R&D budget, we will re-evaluate the development potential of each compound every 6 months, and review investment allocation by prioritizing compounds. We will constantly consider back-up strategies, instead of considering the next step only after terminating development activities, while pursuing a proactive in-licensing strategy. In terms of our in-licensing strategy, we unified the business development functions of our the US subsidiaries and head office in Japan in April 2010 to create a dynamic global business development function. Looking ahead, we will establish a Global Development Office to create a global strategic decision-making function.
in view of the characteristics, evaluation and market scale of each product. To achieve these goals, Medical Representative evaluations will be based primarily on these eight products. In this manner, we will vigorously implement the selectivity and concentration of resources. We expect Crestor® sales to continue growing in Japan and overseas markets. Based on the catchphrase of “Challenge 1000,” we are working together with AstraZeneca to reach our target of increasing Crestor® sales to ¥100 billion in Japan. On a standalone basis, Shionogi is targeting Crestor® sales of ¥50 billion, half the combined target, in fiscal 2014. Our conservative projection is that royalty income from Crestor® will reach ¥75 billion in fiscal 2014. Based on this outlook, we will formulate our internal strategies going forward.
05Q
Please explain the second basic strategy, “investment in new growth drivers.” What specific goals will you pursue in this regard?
06Q
Could you please provide a clear explanation of the third basic strategy, “therapeutic areas of continued focus?”

10
budget. Cost controls will be rigorously enforced. Over the course of the plan, we are targeting a reduction in the ratio of selling, general and administrative (SG&A) expenses to net sales of approximately 8 percentage points compared with fiscal 2009. We see the cost of sales remaining mostly unchanged as a percentage of sales. Based on lessons learned from the first and second medium-term business plans, we are focused on achieving our targets one year at a time to ensure that we attain the five-year targets.
In the final year of the plan, fiscal 2014, we are targeting net sales of ¥375 billion and operating income of ¥110 billion. As I mentioned earlier, these targets assume purely organic growth and do not reflect any projected increases from strategic business development initiatives. We basically plan to control R&D expenses between 17% and 18% of net sales, with an R&D budget of ¥65 billion. Naturally, we will continue to actively make investments as deemed necessary for strategic reasons. In principle, however, we will prioritize R&D projects within the scope of our R&D
We are strengthening our the US marketing network by realigning the business model of Shionogi Pharma, Inc. so that it is focused on developing and marketing Shionogi-branded pharmaceuticals in the US In addition, through the establishment of Shionogi Inc. on July 1, 2010, we are working to integrate our the US subsidiaries and centralize local business functions. Furthermore, our aim is to globalize our drug development capabilities by creating a network of development bases across Europe, the US and Asia going forward. In particular, we intend to build up Shionogi’s
development and sales operations in Asia, where the market is growing, during the period covered by the third medium-term business plan. In regard to our numerical targets, we aim to increase overseas sales from ¥49.1 billion in fiscal 2009 to ¥87 billion in fiscal 2014. This increase will be supported mainly by expanded sales at Shionogi Pharma, Inc., the launch of an anti-HIV drug currently under development, an increase in drug exports, and other factors.
In regard to domestic sales, as I mentioned earlier, we are working to expand sales by focusing on our eight strategic products. In Japan, we saw an average industry-wide drug price reduction of 6.5% in the April 2010 NHI drug price revision. The impact across our domestic product range was slightly more than 6%. We plan to absorb the negative impact on revenue with growth in sales of these strategic products. On the development front, in July we reported extremely favorable results in Phase IIb trials of our anti-HIV drug, and plan to commence Phase III trials by the end of the year. In regard to obesity treatments, we expect to obtain the results of clinical trials that are now under way within the current fiscal year. Other drug candidates are also progressing steadily on the whole. Furthermore, we are rigorously enforcing cost controls. The Corporate Planning Department, Financial & Accounting Department and Human Resources Department are engaged in a project that will rigorously control costs through joint monitoring of the operations and costs of each division.
Interview with the President
07Q
Please tell us about Shionogi’s efforts to establish global marketing systems going forward.
08Q
What are the third medium-term business plan’s numerical targets?
09Q
What measures are being taken in fiscal 2010, the first year of the third medium-term business plan?
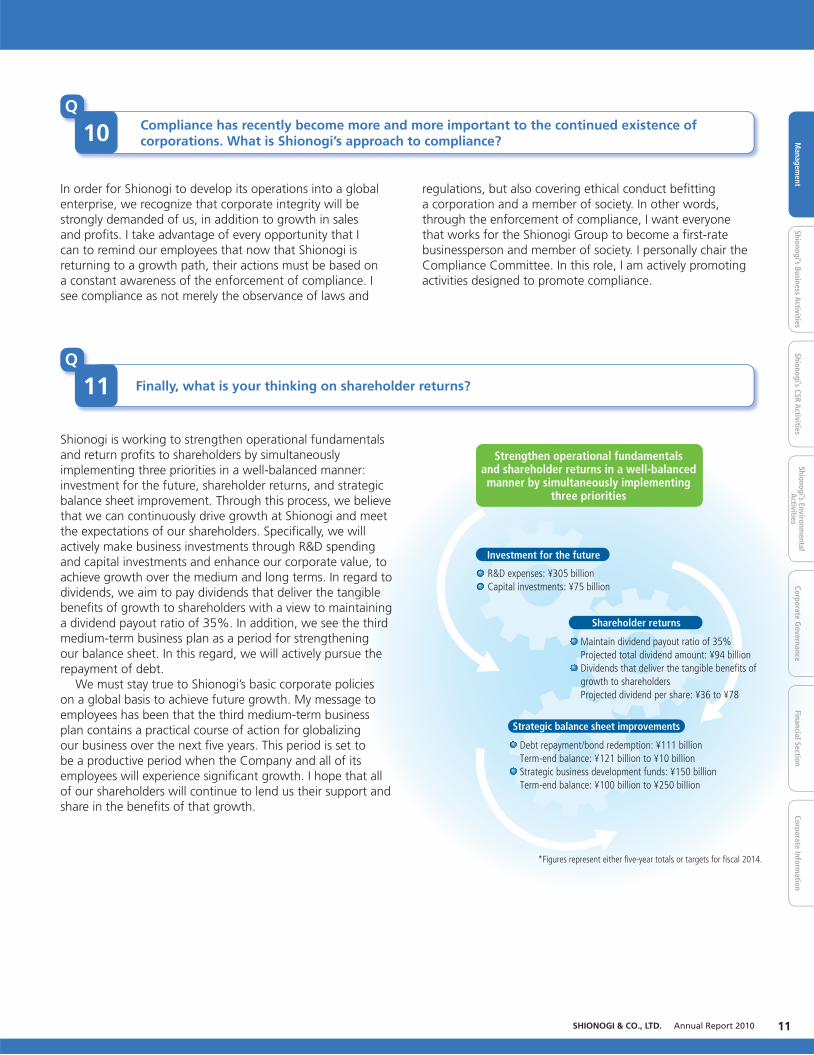
Strengthen operational fundamentalsand shareholder returns in a well-balancedmanner by simultaneously implementing
three priorities
Investment for the future
R&D expenses: ¥305 billionCapital investments: ¥75 billion
Shareholder returns
Maintain dividend payout ratio of 35%Projected total dividend amount: ¥94 billionDividends that deliver the tangible benefits of growth to shareholdersProjected dividend per share: ¥36 to ¥78
Strategic balance sheet improvements
Debt repayment/bond redemption: ¥111 billionTerm-end balance: ¥121 billion to ¥10 billionStrategic business development funds: ¥150 billion Term-end balance: ¥100 billion to ¥250 billion
*Figures represent either five-year totals or targets for fiscal 2014.
Financial SectionCorporate Inform
ationM
anagement
Shionogi’s Business Activities
Shionogi’s CSR Activities
Shionogi’s Environmental
Activities
Corporate Governance
11SHIONOGI & CO., LTD. Annual Report 2010
In order for Shionogi to develop its operations into a global enterprise, we recognize that corporate integrity will be strongly demanded of us, in addition to growth in sales and profits. I take advantage of every opportunity that I can to remind our employees that now that Shionogi is returning to a growth path, their actions must be based on a constant awareness of the enforcement of compliance. I see compliance as not merely the observance of laws and
Shionogi is working to strengthen operational fundamentals and return profits to shareholders by simultaneously implementing three priorities in a well-balanced manner: investment for the future, shareholder returns, and strategic balance sheet improvement. Through this process, we believe that we can continuously drive growth at Shionogi and meet the expectations of our shareholders. Specifically, we will actively make business investments through R&D spending and capital investments and enhance our corporate value, to achieve growth over the medium and long terms. In regard to dividends, we aim to pay dividends that deliver the tangible benefits of growth to shareholders with a view to maintaining a dividend payout ratio of 35%. In addition, we see the third medium-term business plan as a period for strengthening our balance sheet. In this regard, we will actively pursue the repayment of debt. We must stay true to Shionogi’s basic corporate policies on a global basis to achieve future growth. My message to employees has been that the third medium-term business plan contains a practical course of action for globalizing our business over the next five years. This period is set to be a productive period when the Company and all of its employees will experience significant growth. I hope that all of our shareholders will continue to lend us their support and share in the benefits of that growth.
regulations, but also covering ethical conduct befitting a corporation and a member of society. In other words, through the enforcement of compliance, I want everyone that works for the Shionogi Group to become a first-rate businessperson and member of society. I personally chair the Compliance Committee. In this role, I am actively promoting activities designed to promote compliance.
10Q
Compliance has recently become more and more important to the continued existence of corporations. What is Shionogi’s approach to compliance?
11Q
Finally, what is your thinking on shareholder returns?

1st Medium-Term Business Plan(From April 2000 to March 2005)
2nd Medium-Term Business Plan(From April 2005 to March 2010)
Laying the Foundation
Making Significant Stridesfor the Long Term
特 集
3rd Medium-Term Business PlanIn April 2010, under the slogan, “SONG for the Real Growth,” Shionogi redoubled its resolve and launched
the 3rd Medium-Term Business Plan covering the next fi ve years.
Based on the achievements and outstanding issues of the 2nd Medium-Term Business Plan, Shionogi will
work to realize its Company Policy from a global perspective, as follows:
“Shionogi strives constantly to provide medicine of the best possible kind essential for
protection of the health of the people.”
Shionogi has begun measures to advance toward the new stage where we can all feel the Real Growth.
SONG for the Real Growth
AchievementsTargets
• Advance 5 compounds to Phase II andbeyond
• Build-up of priority therapeutic areas• Proactively form alliances
• Maximize the value of Crestor®
• Continuously launch new products(Launch 10 products in Japan)
• Steady overseas business development
2nd Medium-Term Business PlanEnergizing R&
DBeefing up
Dom
estic SalesO
verseas BusinessD
evelopment
• Advanced 7 compounds to Phase II and beyond• In addition to infectious disease, strengthened metabolic
syndrome and pain• Achieved solid results for anti-HIV drug through
co-development with GSK
• Crestor® has grown into the core product with net sales of ¥24.2 billion
• Launched 11 products in Japan
• Established marketing network in the US through acquisition of Sciele Pharma, Inc.
• Expanded export of antibiotics to Europe, the US and Asia
Shionogi’s Business Activities
12

SONG for the Real Growth
3rd Medium-Term Business Plan(From April 2010 to March 2015)
Financial Targets for FY2014 (Consolidated)
*Excluding additional sales through strategic business development deals
FY2009 (Results) FY2014
¥51.8
¥52.4
¥97.9
¥76.2
¥110.0
¥65.0
¥102.0
¥98.0
Operatingincome
R&Dexpenses
Cost ofsales
SG&Aexpenses
Net sales: ¥375.0*
Net sales: ¥278.5
(billion)
Speed:Quick decision and implementation
Open Mind:Flexible mind and out of box thinking
Global Perspective:Higher and broader perspective
Never-Failing Passion:Persistent passion
Financial SectionCorporate Inform
ationM
anagement
Shionogi’s Business Activities
Shionogi’s CSR Activities
Shionogi’s Environmental
Activities
Corporate Governance
13SHIONOGI & CO., LTD. Annual Report 2010

3rd Medium-Term Business Plan 4th Medium-Term Business Plan 5th Medium-Term Business Plan
2010 20142012 20182016 2020
Basic Strategies Under the 3rd Medium-Term Business Plan
Basic Strategy 1
Steady growth primarily through enriched pipeline
Basic Strategy 2
Investment in new growth drivers
Basic Strategy 3
Therapeutic areas of continued focus
Goals for the next 10 years
Consolidated net sales: ¥600 billionOperating margin: More than 25%
Overseas net sales ratio: More than 50%
SONG for the Real GrowthShionogi’s Business Activities
14
Realize Positive Revenue Spiral Through “New Drugs”● Realize steady growth by expanding sales of 8 new products:
Crestor®, Irbetan®, Cymbalta®, Pirespa®, Differin®, Rapiacta®, Finibax®, and OxyContin®/OxiNorm®
● Domestic net sales target: ¥200 billion● Generate more than 70% of net sales from 8 new products
Overseas Sales Expansion
Maximize the Value of Globally Proven Products● Position Crestor®, Irbetan®, and Cymbalta® as the core strategic
products among 8 new products● Net sales target: Total of ¥100 billion from 3 products
● Net sales target for marketed products and products in development: ¥87 billion
● Expand consolidated overseas net sales ratio, excluding royalties, to approximately 30%
Global Growth of Crestor®
● Embracing the challenge of becoming No.1 in the domestic market● FY2011 Establish top share in statin market● FY2014 Net sales target: ¥50 billion
● Increase in royalty income● FY2014 forecast: More than ¥75 billion
Rigorous Management of Development PortfolioContingency Plan
● Globally develop more than 5 products in the late stage (Phase IIb and beyond)
● Achieve NDA submission overseas for 4 products (originating from Shionogi or Japanese research institutes), and launch of at least one product
Basic Strategy 2: Investment in new growth drivers
Basic Strategy 3: Therapeutic areas of continued focus
● Sustainability: Maintain strengths in target areasConcentrate sales capabilities on the 3 priority therapeutic areas, namely metabolic syndrome, infectious diseases and pain, and contribute to medical care by maximizing product potential.
● Flexibility: Adapt to change in each target areaBy focusing R&D capabilities on priority obesity/diabetes and viral infection fi elds, we aim to enrich pipelines and launch them as soon as possible.
● Foresight: Prepare for the waves of next generation
Accurately forecast the waves of next generation and make future investments to discover drug seeds.
Respond to “Multi-Layered Wave Structure” of Diseases
Basic Strategy 1: Steady growth primarily through enriched pipeline

Financial SectionCorporate Inform
ationM
anagement
Shionogi’s Business Activities
Shionogi’s CSR Activities
Shionogi’s Environmental
Activities
Corporate Governance
15SHIONOGI & CO., LTD. Annual Report 2010
Segment Sales Forecast
FY2009 FY2014 FY2009 FY2014
Domesticsales
Crestor®
Irbetan®
Cymbalta®
Royaltyincome
¥200.0 billion
¥152.5 billion
20
0
40
60
80
100
50.0
75.0
50.0
24.2
FY2009 FY2014
50
0
100
150
8 new
pro
du
cts
Pirespa®
Differin®
Rapiacta®
Finibax®
OxyContin®/OxiNorm®
Other regions/export
Shionogi sales in the US
¥87.0 billion
0
50
100
Global Expansion
Global Growth of Crestor® Overseas Sales ForecastDomestic Sales Forecast
Therapeutic Areas of Continued Focus
Metabolic syndrome PainInfectious diseases
Contribute to medicalcare by maximizingproduct potential
Seek to enrich pipelinesand launch them rapidly
Accurately forecast thewaves of next generation and discover drug seeds
Focusing R&D capability
Investment in the future
Concentration of salescapabilities
Waves of next generation
DyslipidemiaHypertension
AtherosclerosisChronic kidney disease
Obesity/Diabetes
Cancer painCommunity-acquired
infection
Viral infectionChronic painSevere infection
¥49.1 billion
200(Billions of yen)
120(Billions of yen) (Billions of yen)
Selection ofbusiness partners in the EU
Establishment of development/business foothold in Asia
Establishment ofEU development foothold
Strengthening ofthe US-marketing network
Functional integrationof the US affiliates

Review of the second medium-term business plan achievementsThe Pharmaceutical Research Division focused on achieving three goals: augmenting our array of drugs for treating infectious diseases, and positioning pain and metabolic syndrome as new strategic drug discovery domains; generating at least five new drug candidates to enter at least Phase II clinical trials by fiscal 2009; and proactively leveraging outside resources to increase the efficiency and success rate of research programs. Our in-house drug discovery efforts resulted in a steady stream of new molecular entities (NMEs) in all three strategic domains. Over the five-year plan period, a total of seven NMEs entered Phase II clinical studies and ten compounds reached the FTIH (First Time in Human) stage. During the final year of fiscal 2009, we reached FTIH with two drug candidates (S-707106 for diabetes and S-234462 for obesity) and also discovered two new molecular entities, including one potential pain medicine. The high level of research productivity we have achieved in a short period of time is due to various factors. These include focusing on strategic therapeutic areas linked to unmet medical needs; achieving high-speed, high-quality revolution of the cycle of synthesis, pharmacological evaluation and ADMET*1, based on the establishment of SAR*2 processes for small molecule drug discovery; and our proactive use of joint global research programs and external resources.
Targeting the goals of the third medium-term business planBased on the drug discovery capabilities we have cultivated to date and our strengths in therapeutic areas, the Pharmaceutical Research Division will focus on rebuilding Shionogi’s strategic research franchise. Over the course of the new plan, we aim to achieve world-class drug discovery research quality and productivity by focusing our resources in three areas: upgrading the early drug discovery portfolio; improving
the level of clinical predictability; and combining functional concentration with enhanced flexibility. We have set two numerical performance targets: first, to generate at least four new development candidates per year; and, second, to demonstrate PoC*3 for molecular entities with a success rate of at least 50%. In terms of rebuilding the strategic research franchise, we will continue to invest our resources primarily in our three core domains, based on an assessment of changes in disease-related needs and our in-house drug discovery platform. In particular, we will focus on expanding the development pipeline for obesity/diabetes and viral infection. At the same time, we will take up the challenge of furthering our nascent research in new therapeutic areas so that we can adapt flexibly to shifts in medical needs over the medium to long term. To upgrade Shionogi’s early drug discovery portfolio, we have been highly proactive in targeting joint research programs with outside institutions. Our aim is to seek out the seeds of innovative drug discovery that are essential to our continued growth. Our network of in-house and joint research projects is expanding around the hub of the Shionogi Innovation Center for Drug Discovery, which we established on the campus of Hokkaido University. The Shionogi’s drug discovery competition program that we began to unearth seeds of research innovation matched to our requirements has led to the germination of five full-scale joint research programs. The FLASH*4 initiative with the Osaka University Graduate School of Medicine that we began in fiscal 2009 to find further drug discovery seeds has also spawned 9 joint research projects. This collaboration between industry and academia promises to generate a steady stream of new research possibilities. Going forward, we plan to seek out new international research partners by expanding the Shionogi’s drug discovery competition initiative. The aim is to pursue various avenues to find seeds of innovative drug discovery while maintaining balance with in-house research.
SONG for the Real Growth
We have entered the third medium-term business plan, in which our core goal is to realize global growth. At this juncture, I believe that it is vital that we reiterate the Company Policy of Shionogi. We must do our utmost to build a deep understanding of unmet medical needs so that we can discover medicines essential for human health and rigorously pursue the search for the best medicines that will give Shionogi a competitive edge. Only then we will attain the goal of providing for the needs of patients. Growth achieved by individual researchers will translate into sustained increases in quality and productivity at the divisional level, which I believe will help the Shionogi Group to realize the “SONG for the Real Growth” plan.
Pharmaceutical Research
Executive General Manager, Pharmaceutical Research Division Kohji Hanasaki, Ph.D.
Shionogi’s Business Activities
16

Intellectual PropertyShionogi recognizes that coordinated R&D and intellectual property (IP) strategies are the foundation of corporate growth and earnings in the pharmaceutical sector. IP activities are conducted on a global basis. Substance patent acquisition efforts continued as efficiently as possible for the broad range of new compounds originated in-house. The future patentability of drug discovery targets and basic research technologies was also given appropriate consideration. A total of approximately 110 patent filings were completed in fiscal 2009 (of which about 60% were for foreign patents). Shionogi reviews its patent portfolio periodically and manages it from a cost-conscious perspective. As of the end of March 2010, Shionogi owned approximately 230 patents in Japan and 140 families of patents in overseas jurisdictions (registered patents based on original invention filings).
To improve clinical predictability, we aim to boost the probability of R&D success by accelerating our translational research programs. In May 2010, we established the PET Molecular Imaging Center at the Osaka University Graduate School of Medicine as a joint institution focusing on molecular imaging technology. We believe that this approach will help yield breakthroughs in this field. Combined with our joint research programs with Osaka University, this facility promises to dramatically improve our capabilities in translational research and help Shionogi to achieve world-class PoC demonstration success rates. Finally, to combine functional concentration with enhanced flexibility, we have begun building a new research complex to bring together the capabilities of various disparate research facilities under one roof. The new building is due to become operational in fiscal 2011, by which time we plan to have established an integrated research set-up spanning molecular screening to CMC*5 research. Enhanced research efficiency and greater coordination among researchers will help to foster industry-leading research productivity at Shionogi. Ahead of this, at the beginning of fiscal 2010 we clarified missions and delineated the organizational set-up between the three research functions of diseases, drug discovery and development. Including the emerging synergy benefits from the Global Research Leader Training program, we are in the process of creating a robust yet flexible drug discovery research set-up with global potential.
*1 ADMET: Absorption, Distribution, Metabolism, Excretion and Toxicity *2 SAR: Structure-Activity Relationship*3 PoC: Proof of Concept*4 FLASH: Pharma-Link between Academia and SHionogi*5 CMC: Chemistry, Manufacturing and Controls
Financial SectionCorporate Inform
ationM
anagement
Shionogi’s Business Activities
Shionogi’s CSR Activities
Shionogi’s Environmental
Activities
Corporate Governance
17SHIONOGI & CO., LTD. Annual Report 2010
2004 2005 2006 2007 2008 2009
(Billions of yen)
0
10
20
30
40
50
60
6.19.8
21.3
32.036.8
53.0
Patent and licensing revenues
(FY)

Review of the second medium-term business plan achievementsNotable achievements in fiscal 2009 included securing world-first manufacturing and marketing approval for Peramivir, a neuraminidase inhibitor that we in-licensed from the US-based BioCryst Pharmaceuticals, Inc. as a treatment for influenza virus infections. We launched this drug in January 2010 under the brand name Rapiacta®. We also gained domestic manufacturing and marketing approval for Duloxetine, a serotonin and noradrenaline reuptake inhibitor (SNRI) in-licensed from the US-based Eli Lilly and Company that we have developed for the treatment of depression and depressive symptoms. This product was launched in Japan in April 2010 under the brand name Cymbalta®. Amid heightened social concerns about the possible threat of pandemic due to new strains of the influenza virus, Rapiacta® has helped to underline our contribution to society as one of the world’s leading makers of drugs to treat infectious diseases. Meanwhile, Cymbalta® is expected to become one of the core strategic products supporting Shionogi’s future growth alongside Crestor® and Irbetan®. Having demonstrated excellent efficacy and tolerability inPhase IIa studies in the US and Europe, our global strategic product S-349572 (integrase inhibitor for treatment of HIV) is currently in Phase IIb trials. This compound is our top-priority clinical development project, and we expect Phase III trials to commence during 2010. S-2367, a neuropeptide Y Y5 (NPY5) receptor antagonist for the treatment of obesity, demonstrated compliance with the US FDA standards for weight management drugs in Phase IIb trials conducted in the US. Based on these results, it is currently undergoing further clinical trials in the US to determine whether co-administration with Orlistat produces additional weight-reduction benefits to meet market needs. A parallel clinical development program is underway in Japan, where S-2367 is in Phase II trials for the treatment of obesity associated with other conditions such as diabetes, dyslipidemia or hypertension.
During the five-year period of the second medium-term business plan, we were able to demonstrate clinical efficacy for three global development compounds that were discovered in-house (the two drugs mentioned above, plus the thrombocytopenia treatment S-888711). We also gained regulatory approval in Japan for no less than 12 products, as listed below. These achievements are the tangible result of efficiency-boosting initiatives such as human resource development programs, the creation of target management systems using time-based PDCA cycles, and an Asian multi-national clinical study that included South Korea and Taiwan. Going forward, we plan to build on these achievements to date. The key issue for us is to strengthen Shionogi’s global development capabilities by expanding and upgrading our worldwide network of clinical development operating bases.
SONG for the Real Growth
I see fi scal 2010, which is the fi rst year of Shionogi’s third medium-term business plan, as a year that holds the key to the company’s future success. We achieved the domestic development goals contained in the second medium-term business plan, but the relatively small number of drug candidates in late-stage global clinical development remains an issue. Going forward, an increased level of collaboration between our division and Shionogi USA, Inc. will be an essential part of accelerating global development. We plan to set up the Global Development Offi ce (GDO) in due course to speed up strategic and operational decision-making.
Pharmaceutical Development
Targeting the goals of the third medium-term business plan(Improved strategic decision-making capabilities and development of tri-regional base network)Under the third medium-term business plan, we aim to build a late-
Main products gaining Japanese regulatory approval
Product name Indication/drug type
Crestor® Hyperlipidemia
Finibax® Bacterial infection
Cetrotide® Premature ovulation inhibitor
OxiNorm® Cancer pain
Irbetan® Hypertension
Differin® Acne vulgaris
Pirespa® Idiopathic interstitial pulmonary fi brosis
Rapiacta® Infl uenza antiviral agent
Cymbalta® Depression and depressive symptoms
Executive General Manager, Pharmaceutical Development Division Takuko Sawada
Shionogi’s Business Activities
18

◆S-349572 (integrase inhibitors for treatment of HIV)This compound is being developed by joint venture Shionogi-ViiV Healthcare LLC., and combines potent antiviral activity with excellent resistance and pharmacokinetic profiles and a low probability of causing drug-drug interactions. S-349572 was shown in Phase IIa trials to suppress HIV plasma virus levels in treatment-naive HIV subjects and was well tolerated. This effect was reproduced in Phase IIb trials. In concurrent trials, antiviral suppression was also observed in treatment-experienced patients resistant to the leading integrase inhibitor Raltegravir, along with an excellent resistance profile. S-349572 is expected to move into Phase III trials during 2010.
◆S-2367/S-234462 (Neuropeptide Y Y5 receptor antagonists for treatment of obesity)In Phase IIb trials in the US, S-2367 demonstrated weight-reduction efficacy along with a serum lipid improving effect. No weight rebound or any significant safety issues, including neurological or psychological symptoms, were observed among patients in the 12-month administration study. S-2367 is now undergoing further trials in combination with Orlistat to gauge additional weight-reduction benefits. In Japan, the drug is in Phase II trials for obesity associated with other conditions such as dyslipidemia and diabetes or dyslipidemia and hypertension. The follow-up compound S-234462, which shows strong efficacy at lower doses than S-2367, is currently in Phase I trials in the US.
Pipeline overview
stage (Phase IIb onwards) global development pipeline of at least five products. Our goal is to file regulatory applications in overseas markets for four drugs discovered in Japan and gain approval for at least one compound during the plan period. This will demand high-level pipeline management skills. We plan to evaluate the potential of the entire development portfolio every six months and re-allocate resources accordingly so that we can accelerate investment of development resources in high-priority projects. To upgrade our global development set-up, we plan to integrate the development functions of Shionogi’s US subsidiaries while also consolidating within the GDO the development strategy functions that to date have been divided between Japan and the US. Separating strategic and operational management functions in this way will help to clarify lines of responsibility. Integrating development strategy functions will promote faster and more flexible decision-making, which in turn will help speed up global clinical development. In addition, to make global development faster and more efficient, we plan to choose the regions where we conduct clinical trials based on the specific development phase. For early-stage clinical studies, we plan to develop a tri-regional global system where we conduct such studies in Japan, the US and Europe. During the period of the second medium-term management plan, we were able to achieve a high success rate with advanced PoM/PoC* studies using our development capabilities in Japan. By tapping into these capabilities, we aim to make go/no go development decisions on compounds at an early stage. In late-stage clinical development, we aim to be able to conduct trials in Japan, the US, Europe and Asia to enable development of pharmaceuticals with high speed and efficiency at relatively low cost.
*PoM: Proof of Mechanism; PoC: Proof of Concept
Financial SectionCorporate Inform
ationM
anagement
Shionogi’s Business Activities
Shionogi’s CSR Activities
Shionogi’s Environmental
Activities
Corporate Governance
19SHIONOGI & CO., LTD. Annual Report 2010

◆S-888711 (non-peptide TPO mimetic for treatment of thrombocytopenia)S-888711 elicited rapid increases in platelet count on once-daily administration in Phase I studies and was well tolerated. It is currently in Phase II dosing studies in the US and Europe for immune thrombocytopenic purpura (ITP). Future plans call for its development for other disorders associated with thrombocytopenia.
◆S-444823 (cannabinoid receptor agonist for atopic dermatitis)This drug is a topical application that is expected to relieve inflammation and itching without any of the side effects of topical steroids. In Phase I studies it demonstrated good tolerability and safety along with high rates of skin absorption. Phase IIa studies are currently underway in Japan.
◆S-297995 (peripheral opioid receptor antagonist for alleviating opioid-induced adverse effects)There are currently no effective medications for treating gastrointestinal side effects of opioids such as constipation, nausea and vomiting.Co-administration of this compound with an opioid promises to relieve the latter’s side effects without altering any of an analgesic effects. Phase IIa studies are currently underway in the US.
◆S-288310 (peptide cancer vaccine for bladder cancer)This vaccine is a peptide derived from genes that are selectively expressed by cells in proliferating bladder cancer. Efficacy was demonstrated in translational research in Japan on patients with bladder cancer. The peptide works by binding to specific HLA on white blood cells, thus stimulating an immune response. Patients with the right type of HLA could benefit from this therapy. Phase I/II studies in Japan are currently underway, targeting patients with bladder cancer.
◆S-707106 (agent for improving insulin resistance to treat Type 2 diabetes)Animal studies have demonstrated improvements in terms of reductions in blood sugar levels, insulin resistance and abnormal lipid metabolism, combined with a lower incidence of side effects observed with existing therapies such as weight gain, edema, abnormal bone metabolism and lactic acidosis. Phase I studies are currently underway in the US, and the compound is expected to enter Phase IIa studies during 2010.
Pipeline overview
Shionogi’s Business Activities
20
Code No. or generic name 【Product name】Areas Category (Administration)
Metab
olic Syn
dro
me
Infectious Diseases
PainPediatrics
Wom
en’sH
ealthO
ther
Pravastatin/Fenofibrate(Pravastatin/fenofibrate combination)
Jenloga XR(Clonidine hydrochloride)
S-474474(Irbesartan/trichlormethiazide combination)
S-2367(Velneperit)
ADX415
S-234462
S-707106
Peramivir 【Rapiacta®】
Doripenem hydrate 【Finibax®】
Doripenem hydrate 【Finibax®】
S-349572/S-265744/S-247303
Duloxetine hydrochloride 【Cymbalta®】
S-811717(Oxycodone hydrochloride)
S-297995
Glycopyrrolate【Cuvposa™】
Clonidine HCL
PSD502 (Lidocaine/prilocaine)
Ospemifene
S-555739
S-888711
S-444823
S-288310
S-222611
S-488410
Statin-HMG-CoA reductase inhibitors/fenofibrate lipid regulating agent combination (Oral)
Alpha 2 specific adrenergic agonist (Oral)
Angiotensin receptor blockerdiuretic combination (Oral)
Neuropeptide Y Y5 receptor antagonist(Oral)
Alpha 2 specific adrenergic agonist (Oral)
Neuropeptide Y Y5 receptor antagonist(Oral)
Insulin sensitizer (Oral)
Neuraminidase inhibitor (Injection)
Carbapenem antibiotic (Injection)
Carbapenem antibiotic (Injection)
Integrase inhibitor (Oral)
SNRI (Serotonin & noradrenaline reuptake inhibitor) (Oral)
Natural opium alkaloids (Injection)
Peripheral opioid receptor antagonist (Oral)
Alpha 2 specific adrenergic agonist (Oral)
Anticholinergic (Oral)
Eutectic mixture of anesthetics(Metered-dose topical aerosol spray)
Selective estrogen receptor modulator
Prostaglandin D2 receptor antagonist (Oral)
Small molecule TPO mimetic (Oral)
Cannabinoid receptor agonist (Topical)
Peptide cancer vaccine (Injection)
Her2/EGFR dual inhibitor (Oral)
Peptide cancer vaccine (Injection)
Carbapenem antibiotic (Injection)
Secretory PLA2 (sPLA2) inhibitor (Oral)
Non-peptide mimetic of TRH (Oral))
Out-Licensing Activity
S-4661(Doripenem hydrate)
S-3013(Varespladib methyl)
S-0373
Pipeline

Financial SectionCorporate Inform
ationM
anagement
Shionogi’s Business Activities
Shionogi’s CSR Activities
Shionogi’s Environmental
Activities
Corporate Governance
21SHIONOGI & CO., LTD. Annual Report 2010
Indication OriginStagePhaseⅠ PhaseⅡa PhaseⅡb PhaseⅢ Submission Approved
Development
USA: NDA filed (November 2009)
USA: Phase Ⅲ
Japan: Phase Ⅲ
USA: Phase Ⅱ
Japan: Phase Ⅱ
USA: Phase Ⅱ (in preparation)
USA: Phase Ⅰ
USA: Phase Ⅰ
Japan: NDA submission (February 2010)
Japan: NDA submission (March 2010)
Japan: Phase Ⅲ
USA, Europe: Phase Ⅱb (the most advanced phase)
Japan: NDA submission (September 2009)
Japan: NDA submission (in preparation)
USA: Phase Ⅱa
Japan: Phase Ⅰ
USA: Approved (July 2010)
USA: SNDA filed (October 2009)
USA, Europe: Phase Ⅲ
USA: Phase Ⅲ
Japan: Phase Ⅱa
Europe: POM (Proof of Mechanism)
USA, Europe: Phase Ⅱ
Japan: Phase Ⅰ
Japan: Phase Ⅱa
Japan: Phase Ⅰ/Ⅱ
Europe: Phase Ⅰb
Japan: Phase Ⅰ/Ⅱ (in preparation)
USA: Approved (October 2007)
USA: NDA submission (June 2007) Hospital-acquired (nosocomial) pneumonia including ventilator-associated pneumonia
Europe: Approved (July 2008)
USA, Europe: Phase Ⅲ
Japan : Phase Ⅱ
Galephar, PR Inc. (Puerto Rico)/SMB Laboratories (Belgium)
Shionogi/ SMB Laboratories
In-house
In-house
In-house
In-house
In-house
In-house
In-house
In-house
In-house
Shionogi-ViiV Healthcare LLC
Shionogi/Eli Lilly Japan K.K.
In-house
In-house
In-house
In-house
Shionogi/Plethora Solutions Holdings PLC
Shionogi/QuatRx Pharmaceuticals Company
In-house
In-house
In-house
In-house
In-house
In-house
In-house
Irbesartan: Sanofi Aventis (France) Trichlormethiazide: Shionogi
In-house
In-house
In-house
In-house
BioCryst Pharmaceuticals, Inc. (USA)
In-house
In-house
Shionogi & GlaxoSmithKline
Eli Lilly and Company (USA)
Napp Pharmaceuticals Limited (UK)
In-house
In-house
In-house
Plethora Solutions Holdings PLC (UK)
QuatRx Pharmaceuticals Company (USA)
In-house
In-house
In-house
OncoTherapy Science, Inc. (Japan)
In-house
OncoTherapy Science, Inc. (Japan)
Johnson & Johnson(USA)In-house
Anthera PharmaceuticalsInc. (USA)
Shionogi/ Eli Lilly and Company (USA)
Kissei Pharmaceutical Co., Ltd.
Lowering non-HDL cholesteroland triglycerides
Hypertension
Hypertension
Obesity
Hypertension
Obesity
Type 2 Diabetes
Pediatric influenza infection
Addition of new dosage regimen(1g t.i.d. for serious infection)
Pediatric infection
HIV infection
Diabetic peripheralneuropathic pain
For the treatment of moderate to severe pain in patients with cancer pain
Alleviation of opioid-induced adverse effect
Chronic severe drooling in pediatric patients
Attention DeficitHyperactivity Disorder
Premature ejaculation
Post-menopausalvaginal atrophy
Allergic rhinitis
Thrombocytopenia
Atopic dermatitis
Bladder cancer
Malignant tumor
Esophageal cancer
Bacterial infection
Acute coronary syndromes Mixed dyslipidemia
Spinocerebellar ataxia In-house
(As of August 2010)
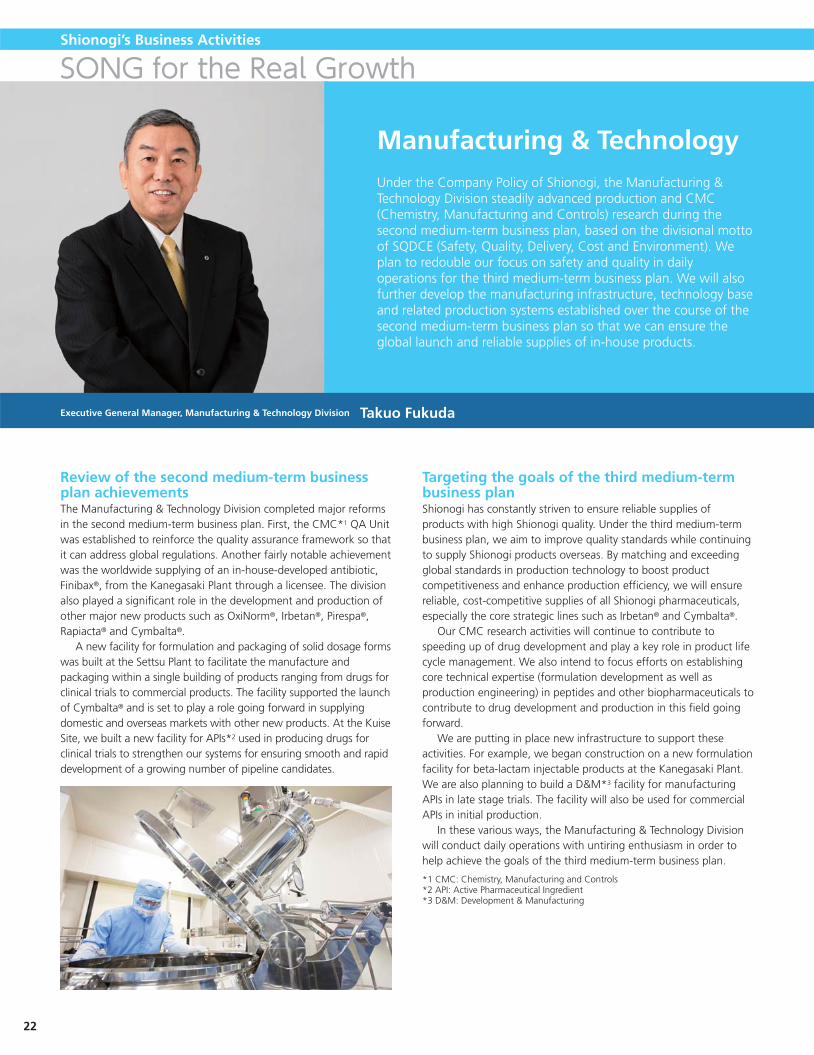
Review of the second medium-term business plan achievementsThe Manufacturing & Technology Division completed major reforms in the second medium-term business plan. First, the CMC*1 QA Unit was established to reinforce the quality assurance framework so that it can address global regulations. Another fairly notable achievement was the worldwide supplying of an in-house-developed antibiotic, Finibax®, from the Kanegasaki Plant through a licensee. The division also played a significant role in the development and production of other major new products such as OxiNorm®, Irbetan®, Pirespa®, Rapiacta® and Cymbalta®. A new facility for formulation and packaging of solid dosage forms was built at the Settsu Plant to facilitate the manufacture and packaging within a single building of products ranging from drugs for clinical trials to commercial products. The facility supported the launch of Cymbalta® and is set to play a role going forward in supplying domestic and overseas markets with other new products. At the Kuise Site, we built a new facility for APIs*2 used in producing drugs for clinical trials to strengthen our systems for ensuring smooth and rapid development of a growing number of pipeline candidates.
Under the Company Policy of Shionogi, the Manufacturing & Technology Division steadily advanced production and CMC (Chemistry, Manufacturing and Controls) research during the second medium-term business plan, based on the divisional motto of SQDCE (Safety, Quality, Delivery, Cost and Environment). We plan to redouble our focus on safety and quality in daily operations for the third medium-term business plan. We will also further develop the manufacturing infrastructure, technology base and related production systems established over the course of the second medium-term business plan so that we can ensure the global launch and reliable supplies of in-house products.
Targeting the goals of the third medium-term business planShionogi has constantly striven to ensure reliable supplies of products with high Shionogi quality. Under the third medium-term business plan, we aim to improve quality standards while continuing to supply Shionogi products overseas. By matching and exceeding global standards in production technology to boost product competitiveness and enhance production efficiency, we will ensure reliable, cost-competitive supplies of all Shionogi pharmaceuticals, especially the core strategic lines such as Irbetan® and Cymbalta®. Our CMC research activities will continue to contribute to speeding up of drug development and play a key role in product life cycle management. We also intend to focus efforts on establishing core technical expertise (formulation development as well as production engineering) in peptides and other biopharmaceuticals to contribute to drug development and production in this field going forward. We are putting in place new infrastructure to support these activities. For example, we began construction on a new formulation facility for beta-lactam injectable products at the Kanegasaki Plant. We are also planning to build a D&M*3 facility for manufacturing APIs in late stage trials. The facility will also be used for commercial APIs in initial production. In these various ways, the Manufacturing & Technology Division will conduct daily operations with untiring enthusiasm in order to help achieve the goals of the third medium-term business plan.
Manufacturing & Technology
*1 CMC: Chemistry, Manufacturing and Controls*2 API: Active Pharmaceutical Ingredient*3 D&M: Development & Manufacturing
SONG for the Real Growth
Executive General Manager, Manufacturing & Technology Division Takuo Fukuda
Shionogi’s Business Activities
22

Review of the second medium-term business plan achievementsIn April 2005, when Shionogi’s second medium-term business plan began, the amended Pharmaceutical Affairs Act came into force. The amended legislation enabled drug manufacturers to outsource the entire production process for the first time, but also put all the responsibility for product quality, safety, stable supply and so forth on the commissioning manufacturer and seller. This led to a decline in the proportion of drugs manufactured in-house, and attached greater importance to the quality assurance function for Shionogi-related bulk pharmaceuticals and formulations manufactured at third-party production facilities both in Japan and overseas. Therefore, we have actively conducted QA audits of our supply chain and taken other steps to ensure product quality. April 2005 also marked the first launch of Crestor®, one of Shionogi’s most important products. Giving top priority to patient safety, we conducted post-marketing surveillance (PMS) studies to gather safety-related data on patients taking the product during its first 18 months on the market. Once the safety evidence was obtained, regular commercial sales commenced in September 2006.
We have entered the critical fi rst year of Shionogi’s third medium-term business plan. As part of its concerted efforts to achieve the plan, the division is targeting three main goals: First, we will build and implement a global quality assurance system. Second, we will upgrade predictive and preventive risk management. Third, we will focus on human resource development. As the entire division takes concrete actions to achieve these goals, we must answer the following questions more clearly: “What must be done, and by when?”; “What must be provided to whom?”; and “What can we voluntarily propose and how can we contribute to the success of the third medium-term business plan?” We are convinced that developing highly reliable QA processes globally, and identifying risks in a predictive and preventive manner, are crucial to Shionogi’s continued advancement.
This marked the first time in Japan that a drug manufacturer gathered PMS data from around 10,000 patients based on a predictive and preventive approach, which was just as difficult as clinical trials. Shionogi received extensive praise from outside the company for this initiative. In December 2008, we completed the Japanese launch of Pirespa®, which is the world’s first drug approved for the treatment of idiopathic pulmonary fibrosis. In this case, we enrolled all patients taking the drug in a PMS study to ensure safety by promoting correct usage. Enrollments were completed in October 2009 and extensive results were obtained from the PMS study by early 2010. In January 2010, we received regulatory approval for Rapiacta®, the world’s first injectable antiviral agent for treating influenza. We plan to enroll all patients taking this drug in a PMS study for a certain period after launch to promote correct usage. In this manner, during the five-year period of the second medium-term business plan, Shionogi proactively worked to ensure drug quality and safety and scored a number of notable achievements in this area.
Targeting the goals of the third medium-term business planIn fiscal 2010, as part of preparations to build global quality assurance systems, we will first deepen our collaboration with Shionogi USA, Inc. and Shionogi Pharma, Inc. for the purpose of sharing information relating to the Shionogi Group’s global safety management and quality assurance framework. In addition, as part of upgrading risk management to adopt a more predictive and preventive approach, we will revise current safety management and quality assurance procedures and formulate a human resources development plan to help us identify global risks based on such an approach. In line with these efforts, we will also formulate Shionogi product policies, strengthen divisional planning functions and begin work on constructing a global quality assurance framework for Shionogi.
Quality, Safety and Regulatory Affairs Management
Executive General Manager, Quality, Safety and Regulatory Affairs Management Division Hirosato Kondo, Ph.D.
Financial SectionCorporate Inform
ationM
anagement
Shionogi’s CSR Activities
Shionogi’s Environmental
Activities
Corporate Governance
23SHIONOGI & CO., LTD. Annual Report 2010
A new facility for formulation and packaging of solid dosage forms
Shionogi’s Business Activities

Review of the second medium-term business plan achievementsUnder the second medium-term business plan, we focused on strengthening our sales and marketing activities in Japan with the aim of reinforcing Shionogi’s overall sales and marketing presence. In the field of metabolic syndrome, in collaboration with AstraZeneca we finished the intermediate endpoint analysis for the PRIME (Post-marketing Surveillance Study for Rosuvastatin: Innovative Medical Experience) PMS study for Crestor® and submitted it for regulatory approval a full six months ahead of schedule. Consequently, we were able to launch regular commercial sales of the drug in September 2006. Since then, we have continued to gather evidence relating to the clinical efficacy and safety of Crestor® via long-term studies such as JUPITER (Justification for the Use of statins in Primary prevention: an Intervention Trial Evaluating Rosuvastatin) and COSMOS (COronary atherosclerosis Study Measuring effects Of rosuvastatin using intravascular ultrasound in Japanese Subjects). Reflecting the fierce competition in the market for cardiovascular drugs, we created new teams to provide additional sales support for our medical representatives. While leveraging Shionogi’s strengths in one-on-one sales activities, we also collected other clinical data from hospitals and joined forces with opinion leaders to share this evidence with a wider audience of health professionals through lectures, seminars and other events. This helped us to further shift Shionogi’s operations from acute disorders to treatment of chronic diseases. By fiscal 2009, the final year of the plan, Crestor® had grown to become Shionogi’s top-selling product. In the field of infectious diseases, we launched new products such as Finibax® and also succeeded in expanding the market presence of Flomox® based on a consistent program of detailing activities. In the field of pain, we introduced OxiNorm® in an immediate-release powder formulation. Combined use of sustained-release and
immediate-release analgesics with the same active ingredient and administration route is a method for treating cancer pain recommended by the World Health Organization and others. We have followed this advice by marketing OxiNorm® Powder in conjunction with sustained-release OxyContin® Tablets for more effective relief of cancer-related pain.
Targeting the goals of the third medium-term business planDuring the second medium-term business plan we developed the cardiovascular field into a new area of strength. Leveraging this strength, we will build up our earnings base by maximizing profits from new drugs. We have positioned three products, namely Crestor®, Irbetan® and Cymbalta®, as our core strategic products, and we aim to increase total sales from these three products to ¥100 billion in fiscal 2014. We also have five additional new products, namely Pirespa®, Differin®, Rapiacta®, Finibax® and OxyContin®/OxiNorm®. We aim to increase combined sales from these 8 new drugs, as a percentage of total domestic sales, to at least 70% in fiscal 2014.
Three core strategic products: Crestor®, Irbetan® and Cymbalta®
In fiscal 2010, we plan to vigorously convey the unique characteristics of our three core strategic products Crestor®, Irbetan® and Cymbalta® by concentrating sales resources on these products and enhancing the impact of detailing activities. In fiscal 2010, we are targeting sales of Crestor®, Irbetan® and Cymbalta® (launched April 2010) of ¥30 billion, ¥8.3 billion and ¥1.8 billion, respectively. In fiscal 2009, Crestor® and Irebetan® sales were ¥24.2 billion and ¥3.8 billion, respectively. To achieve our fiscal 2010 sales targets, we believe that it is important to increase physicians’ understanding of the features of each product. That is why we will actively hold small doctor meetings and other presentation events.
SONG for the Real Growth
Shionogi’s third medium-term business plan starts amid dramatic changes in the pharmaceutical sales and marketing environment in Japan under a new NHI drug pricing system. Our survival as an innovative drug manufacturer depends on our ability to respond fl exibly to these external changes. Rather than relying on off-patent drugs that have been NHI-listed for many years, we need to focus our collective efforts on building a core earnings base primarily by maximizing sales of the three new products Crestor®, Irbetan® and Cymbalta®. Selectivity and focus will be our watchwords as we seek to increase sales productivity while providing customers with high-quality information.
Human Health Care
Executive General Manager, Human Health Care Division Masaaki Goshima
Shionogi’s Business Activities
24

Initiatives for other productsWith Differin®, we plan to continue our public awareness campaign through television and other media to broadly convey that dermatologists can now prescribe a novel therapy for acne. We hope to encourage more acne sufferers to visit a dermatologist as a result. In the case of Pirespa®, our foremost marketing message is that “earlier is better” when it comes to treating pulmonary fibrosis. By promoting the drug’s unique characteristics, we aim to boost prescriptions for Pirespa®. We plan to continue organizing physician seminars hosted by doctors with extensive experience in prescribing the drug. Rapiacta® is an effective influenza treatment based on a single injection received on an outpatient basis. It offers guaranteed medication compliance, and it can also be used widely in severe influenza cases or where oral administration is difficult. Our marketing campaign will emphasize the usefulness of injections in ensuring the correct frequency of administration and dosage, and the role Rapiacta® can play in broadening the range of therapeutic
Measures to fight infectious diseases are a crucial risk management issue at the national level. The Japanese Society for Bacteriology has advocated the importance of promoting the appropriate use of antibiotics along with its significance as a national government policy. However, only a handful of pharmaceutical companies are now directly addressing this issue in their R&D, manufacturing and sales activities. Shionogi believes that part of its social significance lies in contributing to the therapeutic area of infectious diseases. Activities ranging from R&D to sales in the infectious disease area have remained a key focus. In July 2010, we established the Unit for Judicious Use of Antibiotics. This unit was set up for the purpose of conveying information intended to prevent the emergence of antibiotic-resistant bacteria. Our approach is to encourage patients to take the best antibiotic for treating a given infectious disease using the most appropriate method of administration, and thus use antibiotics in a safer manner. Shionogi takes this proposal seriously. The Company will remain actively engaged in awareness-raising activities aimed at promoting the appropriate use of antibiotics, and will make every effort to make a greater contribution to the treatment of infectious diseases.
options for influenza. Finibax® and OxyContin®/OxiNorm® are both products that are mainly prescribed in hospital. Co-prescription is a strong possibility in the case of cancer patients. In our marketing campaign, we plan to derive synergies by focusing on the complete relief from cancer pain that can be achieved while also treating infections early.
Unit for Judicious Use of Antibiotics Established
Financial SectionCorporate Inform
ationM
anagement
Shionogi’s Business Activities
Shionogi’s CSR Activities
Shionogi’s Environmental
Activities
Corporate Governance
25SHIONOGI & CO., LTD. Annual Report 2010
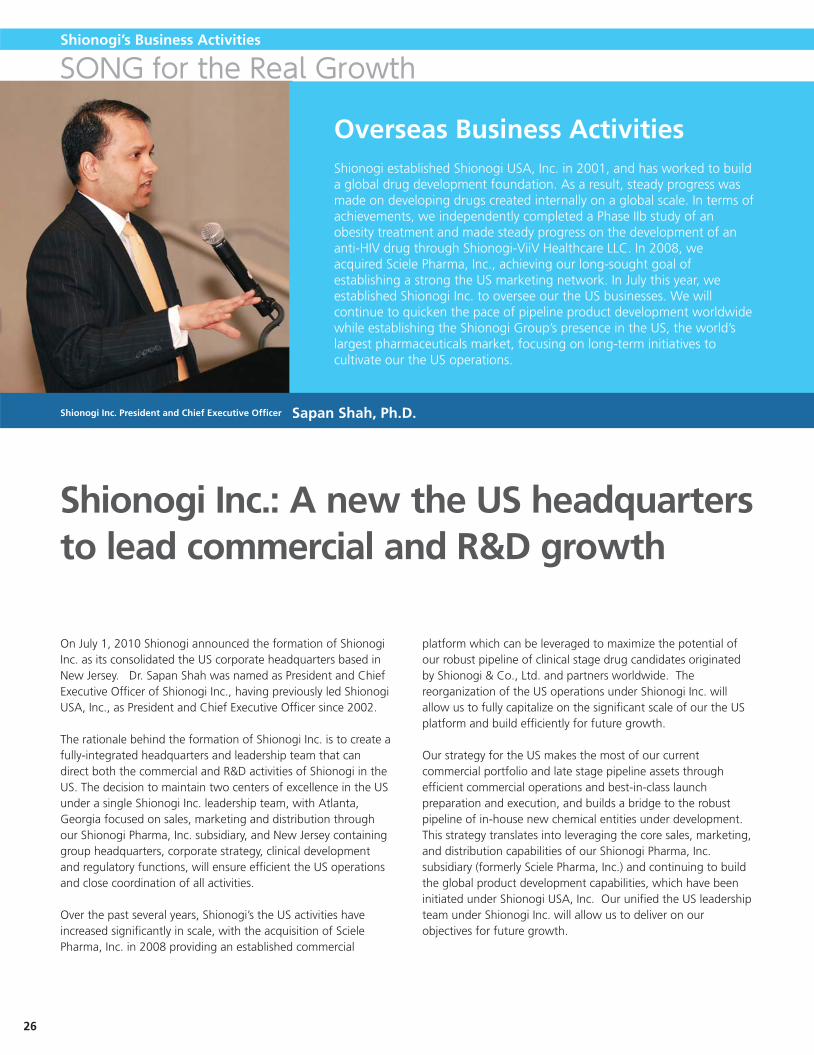
platform which can be leveraged to maximize the potential of our robust pipeline of clinical stage drug candidates originated by Shionogi & Co., Ltd. and partners worldwide. The reorganization of the US operations under Shionogi Inc. will allow us to fully capitalize on the significant scale of our the US platform and build efficiently for future growth.
Our strategy for the US makes the most of our current commercial portfolio and late stage pipeline assets through efficient commercial operations and best-in-class launch preparation and execution, and builds a bridge to the robust pipeline of in-house new chemical entities under development. This strategy translates into leveraging the core sales, marketing, and distribution capabilities of our Shionogi Pharma, Inc. subsidiary (formerly Sciele Pharma, Inc.) and continuing to build the global product development capabilities, which have been initiated under Shionogi USA, Inc. Our unified the US leadership team under Shionogi Inc. will allow us to deliver on our objectives for future growth.
Shionogi Inc.: A new the US headquarters to lead commercial and R&D growth
On July 1, 2010 Shionogi announced the formation of Shionogi Inc. as its consolidated the US corporate headquarters based in New Jersey. Dr. Sapan Shah was named as President and Chief Executive Officer of Shionogi Inc., having previously led Shionogi USA, Inc., as President and Chief Executive Officer since 2002.
The rationale behind the formation of Shionogi Inc. is to create a fully-integrated headquarters and leadership team that can direct both the commercial and R&D activities of Shionogi in the US. The decision to maintain two centers of excellence in the US under a single Shionogi Inc. leadership team, with Atlanta, Georgia focused on sales, marketing and distribution through our Shionogi Pharma, Inc. subsidiary, and New Jersey containing group headquarters, corporate strategy, clinical development and regulatory functions, will ensure efficient the US operations and close coordination of all activities.
Over the past several years, Shionogi’s the US activities have increased significantly in scale, with the acquisition of Sciele Pharma, Inc. in 2008 providing an established commercial
Overseas Business ActivitiesShionogi established Shionogi USA, Inc. in 2001, and has worked to build a global drug development foundation. As a result, steady progress was made on developing drugs created internally on a global scale. In terms of achievements, we independently completed a Phase IIb study of an obesity treatment and made steady progress on the development of an anti-HIV drug through Shionogi-ViiV Healthcare LLC. In 2008, we acquired Sciele Pharma, Inc., achieving our long-sought goal of establishing a strong the US marketing network. In July this year, we established Shionogi Inc. to oversee our the US businesses. We will continue to quicken the pace of pipeline product development worldwide while establishing the Shionogi Group’s presence in the US, the world’s largest pharmaceuticals market, focusing on long-term initiatives to cultivate our the US operations.
SONG for the Real Growth
Shionogi Inc. President and Chief Executive Offi cer Sapan Shah, Ph.D.
Shionogi’s Business Activities
26

In terms of specific activities in fiscal year 2010, the US group will continue to move forward aggressively with efforts to optimize our current the US infrastructure and maximize our current marketed portfolio, including the launch of Glycopyrrolate for chronic drooling Cuvposa™ and Clonidine for ADHD. We will also focus on making further progress towards regulatory approval and launch of near-term products, including PSD502 for premature ejaculation and Ospemifene for vaginal atrophy. These products will provide an important bridge to our clinical pipeline of new chemical entities originated by Shionogi’s research labs in Japan. To that end, in 2010 we will also continue our global clinical development efforts in support of numerous drug candidates, including S-2367/S-234462 for obesity, S-888711 for thrombocytopenia, S-297995 for alleviation of opioid-induced side effects, S-707106 for diabetes, and our integrase inhibitor S-349572 for HIV in collaboration with ViiV Healthcare LLC.
In summary, with the formation of Shionogi Inc. we have taken another important step towards establishing Shionogi & Co., Ltd., as a global pharmaceutical company. The team of dedicated professionals we have assembled under Shionogi Inc. is truly committed to our success as a company, which is firmly grounded in our overall corporate goal of providing important medicines in areas of unmet medical need to patients worldwide.
Financial SectionCorporate Inform
ationM
anagement
Shionogi’s Business Activities
Shionogi’s CSR Activities
Shionogi’s Environmental
Activities
Corporate Governance
27SHIONOGI & CO., LTD. Annual Report 2010

シオノギの事業活動
Major Products
Prescription Drugs
Differin® Gel is the fi rst topical retinoid preparation to be approved for the indication of acne vulgaris in Japan. Marketed since October 2008, it is being jointly promoted by Shionogi in cooperation with Galderma KK, giving top priority to improving the quality of life and satisfaction of patients suffering from acne vulgaris. In guidelines on the treatment of acne vulgaris issued by the Japanese Dermatological Association in 2008, Differin® Gel received an A grade recommendation for the treatment of light to severe symptoms of comedo and infl ammatory skin rashes. Differin® Gel is gaining recognition as a key drug for the treatment of acne vulgaris primarily among dermatologists.
The clinical effectiveness of Crestor® for preventing atherosclerotic diseases has been confi rmed by many large-scale clinical studies in Japan and overseas, such as JUPITER and COSMOS. Crestor® is a statin formulation supported by a broad range of accumulated evidence of effi cacy and safety for patients. Crestor® is particularly attractive due to the current evidence improvement in the ratio of LDL cholesterol to HDL cholesterol, an indicator related to atherosclerosis, and is expected to drive the statin therapy forward.
Irbetan® is a long-acting angiotensin II receptor blocker (ARB) with a superior antihypertensive effect for minor to severe hypertension. Combining superior tissue penetration and a PPAR-gamma activation effect, Irbetan® is a fi rst-choice ARB for treatment of metabolic syndrome, obesity, diabetes and hypertension with chronic kidney disease (CKD). Irbetan® shows evidence of a renoprotective effect and encephalopathy evidence, and is contributing to the treatment of hypertension in 88 countries around the world.
Depression is a disease that causes physical symptoms such as fatigue, headaches and lower back pain, in addition to emotional symptoms such as depressive states, lack of motivation and anxiety. Launched in April 2010 as a dual-action serotonin-norepinephrine reuptake inhibitor (SNRI), Cymbalta® is expected to be a useful drug formulation for relieving symptoms and promoting recovery due to its effectiveness in treating a broad range of depressive symptoms. Overseas, it has been approved in 99 countries since its launch in the US in 2004.
Finibax® is a carbapenem antibacterial agent for infusion with a broad spectrum of superior antibacterial activity against various bacteria. Antibacterial activity especially against Pseudomonas aeruginosa is the most potent among carbapenem antibacterial agents, and it was revealed recently that Finibax® had an inhibitory action on the formation of carbapenem resistance in Pseudomonas aeruginosa. Finibax® is being recognized as a highly useful drug for the treatment of serious infections.
Offering the effect of inhibiting pulmonary fi brosis, Pirespa® is the only drug that is indicated for idiopathic pulmonary fi brosis. Shionogi became the fi rst company in the world to obtain manufacturing and marketing approval of the drug in Japan, and launched the product in December 2008. Shionogi provides information on correct usage primarily to respiratory specialists in order to make some contribution to the treatment and understanding of idiopathic pulmonary fi brosis, which remains an intractable illness.
Rapiacta® is an infl uenza treatment for shortening infection periods and inhibiting severe symptoms that can be administered through a single-dose intravenous drip infusion. Shionogi received the world’s fi rst manufacturing and marketing approval for the drug in Japan and launched the product in January 2010. The emergence of this injectable infl uenza treatment that promises guaranteed medication compliance has expanded treatment options.
The World Health Organization recommends treating cancer-related pain with oral drugs that include immediate-release and extended-release formulations of the same active ingredient. Shionogi’s extended-release OxyContin® Tablets and immediate-release OxiNorm® Powder, both of which are cancer-pain analgesics, are oral drugs that share the same active ingredient, enabling treatment in line with WHO recommendations. Shionogi does its utmost to appropriately promote these products so as to liberate patients from cancer pain.
Pirespa® Tablet (Idiopathic Pulmonary Fibrosis Treatment)
Rapiacta® Bag for Intravenous Drip Infusion Rapiacta® Vial for Intravenous Drip Infusion (Antiviral drug for infl uenza)
Differin® Gel (Acne Vulgaris Treatment)
OxyContin® Tablet OxiNorm® Powder (Cancer Pain Analgesic)
Cymbalta® Capsule(Treatment for depression and depressive symptoms)
Irbetan® Tablet (Antihypertensive)
Crestor® Tablet (Hyperlipidemia Treatment)
Finibax®
Finibax® Kit(Carbapenem Antibiotic)
In the third medium-term business plan, we have positioned three products, namely Crestor®, Irbetan® and Cymbalta®, as our core strategic products. We have also defi ned fi ve additional strategic products as Pirespa®, Differin®, Rapiacta®, Finibax® and OxyContin®/OxiNorm®. With a total of eight strategic drugs, Shionogi is targeting further growth by expanding new drug sales.
Shionogi’s Business Activities
28

OTC Drugs
Shionogi’s OTC drug business will contribute to the promotion of self-medication by returning the benefi ts of pharmaceutical resources developed in the pharmaceutical drugs business to patients, along with providing proper information on each product as required by patients.
The four items in Shionogi’s Sedes® line of analgesic antipyretics allow users to choose the most appropriate product for their pain. In spring 2009, the Company renovated the packaging design for these products. These include New Sedes®, designed for household use in treating fevers and headaches; Sedes®–Hi, which is effective for treating intolerable headaches and toothaches; Sedes® V, which relieves the pain of stiff shoulders and related headaches; and Sedes® Cure, an effective means of countering menstrual pains and sore throats. In this manner, these products are designed to ease the particular form of pain faced by each user.
Offered in redesigned packaging from the summer of 2010, Popon® S is a well-balanced comprehensive vitamin supplement including eight vitamins as well as calcium and magnesium. The Popon® line includes Popon® C White, which helps to moderate blemishes and freckles, and Popon® B Fresh, which helps to relieve muscular fatigue. In addition, in March 2010 Shionogi also launched two products addressing eye problems caused by PC work and other factors: Popon® Pumeri Eye Drop R, which alleviates eye fatigue and Popon® Pumeri Tablets VB, which helps to relieve eye strain.
Hyperlipidemia is known as a risk factor for arteriosclerosis. To mitigate this risk factor and contribute to patients’ future health, Shionogi launched the Locusta® hyperlipidemia treatment in December 2009. By having patients add Locusta® to regular cholesterol-reducing habits such as exercise and a good diet, Shionogi helps patients to properly manage their cholesterol levels.
Sedes® (Analgesic Antipyretics)
Popon® (Vitamin Compounds)
Locusta® (Hyperlipidemia Treatment)
Financial SectionCorporate Inform
ationM
anagement
Shionogi’s Business Activities
Shionogi’s CSR Activities
Shionogi’s Environmental
Activities
Corporate Governance
29SHIONOGI & CO., LTD. Annual Report 2010
Diagnostics
Shionogi’s Diagnostics Division aims to create high value-added diagnostics that make a broad contribution to society, in fi elds ranging from diagnosis to treatment. To this end, we are promoting the development of new testing items in the fi elds of cardiovascular and metabolic syndrome, as well as in the fi elds of immunology and allergies. Efforts are also focused on developing reagents that can be used by not only traditional testing centers and hospitals, but also private practitioners.
Because blood levels of BNP will rise when heart functions are even lightly impaired, BNP is a useful indicator when diagnosing and assessing cardiac insuffi ciency. With recent therapeutic guidelines citing testing of BNP blood levels as a useful means of screening people with hypertension for signs of cardiac insuffi ciency, BNP has gained a strong reputation at the frontlines of medicine. MI02 Shionogi BNP and Shionospot® BNP are reagents used to measure the BNP level, while MI02 and Shionospot® Reader are diagnostic instruments that use those reagents to perform actual measurements.
Allerport® TARC is a reagent used to measure serum levels of TARC, a process that has been covered by Japan’s national health insurance system since July 2008. For patients with atopic dermatitis symptoms, serum levels of TARC rise in step with worsening skin condition. Guidelines for the treatment of atopic dermatitis also refer to the clinical utility of serum TARC diagnosis. Thus, this diagnostic product is a useful indicator for evaluating the severity of atopic dermatitis symptoms.
Quick Chaser® Flu A,B is a reagent for determining whether a patient is infected by the infl uenza virus, featuring a product design that is easy for patients and medical professionals to understand. The reagent was launched in March 2010 around the same time as the release of Rapiacta®, an anti-viral drug for infl uenza, in order to facilitate a full-line of support, ranging from the diagnosis to treatment of infl uenza.
MI02 Shionogi BNPShionospot® BNP(Human BNP Kit)
Allerport® TARC(Th2 Chemokine/TARC Kit)
Quick Chaser® Flu A,B(Infl uenza Virus Diagnostic Kit)

Fundamental Policy on CSR Shionogi’s purpose, as expressed in the beginning of the Company Policy instituted in
1957, is”to strive constantly to provide medicine of the best possible kind essential for
protection of the health of the people.” This enduring and unwavering corporate
philosophy is a statement of our vision and value to society. Our activities as a
pharmaceutical company inherently contribute to society, and we believe that
implementing our corporate philosophy promotes our fulfi llment of social responsibilities.
To help realize the Company Policy, we have created Shionogi’s Action Guidelines, which
all people working at Shionogi share and embrace as norms for daily activities. These
guidelines also describe the ideal nature of all our current and future activities.
By acting in accordance with the Company Policy and the Action Guidelines, we can
contribute to patients, physicians, and other healthcare professionals who need the
medicines we provide as well as to shareholders, other investors, and society as a whole.
We are confi dent that this contribution, in turn, leads to the Company’s development and
to the personal growth of Shionogi employees as fellow human beings.
30
Mission
Vision
Value
Shionogi’s Action Guidelines
The Company Policy of Shionogi
We will deliver pharmaceuticals that offer an even higher level of satisfaction to patients, their families, and healthcare providers and improve the quality of life for patients and their families.
A company with a strong presence worldwide A company that has pride and dreams and embraces challenges
Customer Focus, Trust, Professionalism, On-Site Orientation, Respect for the Individual
●Shionogi understands that the greatest joy comes from bringing joy to patients, their families, and healthcare professionals by relieving their suffering and concerns.
●For this reason, the Company places the highest priority on relationships with these people, and takes meticulous care to meet their demands.
Customer Focus
●Shionogi understands that the only way to gain the trust of society is to steadily provide original medicines in a proper manner to the maximum number of people.
●To do this, employees must build relationships of mutual trust both inside and outside the Company.
Trust
●Shionogi understands that maintaining the highest level of professionalism in attitude and conduct is crucial for ensuring that it provides the best medicines to patients and healthcare professionals.
●For this reason, Shionogi’s employees work steadily, overcoming major challenges with a positive mind-set and accomplishing the goals they have set in order to achieve the highest level of competence in every field.
Professionalism
●Shionogi understands that its laboratories, plants, and the places where it sells its products are a focus of expertise and fact, and that the Company’s activities at these sites reflect whether the Company’ s efforts are benefiting patients, their families, and healthcare professionals.
●For these reasons, Shionogi places a priority on information from these sites, and uses such information as a basis for action.
On-Site Orientation
●Shionogi understands that respect for individuals and the recognition of diversity result in a higher level of creative value, and that this allows the Company to provide patients, their families, and healthcare workers with greater value.
●For this reason, Shionogi’ s employees maintain maximum respect for each other and everyone they deal with.
Respect for the Individual
Shionogi’s CSR Activities

Looking ahead, we will focus on multifaceted analyses of information. For example, we will gauge the extent to which current strategies have become established through the analysis of inquiries related to various product strategies, which will enable us to identify new directions for future strategies. By responding promptly and accurately to inquiries from within and outside the Company, we will work to expand and promote the appropriate use of Shionogi products and contribute to the health of even more patients, while increasing our contribution through the use of information.
◆Cancer Pain Management OutreachA survey of cancer patients in Japan reported that two-thirds of those experiencing pain from cancer did not seek relief (see source below). Oral therapeutic narcotics can eliminate pain in many cases. Therefore, Shionogi is running a pain management campaign that includes television commercials and newspaper advertisements in which actor Shunji Fujimura, himself a cancer survivor, emphasizes that patients do not have to simply tolerate pain. This initiative has proved successful over the past three years, achieving high awareness of its message and increasing visits to our cancer pain therapy website. We participate in the Cancer Pain Relief Consortium, a collaborative initiative of industry entities that promotes pain care. We also support a project promoted by the Ministry of Labour, Health and Welfare called the Orange Balloon Project, which disseminates palliative care information. These and other ongoing initiatives seek to increase overall social interest in cancer pain therapy and improve quality of life. With April 2010 marking the fourth year of publicity in this arena, Shionogi is determined to continue taking diverse steps to help eliminate cancer patients’ pain as swiftly as possible.
Relationships with Patients and Medical Professionals
Measures to Improve Quality of Life
◆Supporting Dermatological Treatment for AcneAcne vulgaris afflicts many in their teens and 20s. It mainly appears on the face and can leave scars, significantly affecting quality of life. Yet despite these consequences, few sufferers seek medical attention. Shionogi provides acne patients with accurate information and encourages them to seek dermatological treatment to restore their confidence and improve their quality of life. On May 21, 2010, we registered that date of the year as Acne Day with the Japan Anniversary Association. The significance is that the numbers 5 (for the month) and 2 and 1 (for the day) can be used to express a reading in Japanese to the effect that acne sufferers should always consult dermatologists. On that day, we began airing a television commercial featuring entertainer Kanako Yanagihara in fiscal 2010 as part of our positive, multifaceted approach to educating the public about the issue of acne.
To respond to various inquiries regarding Shionogi products, Shionogi has two different toll-free telephone numbers—one for medical professionals and the other for general consumers and patients. Inquiries are also accepted at the Company’s website. In fiscal 2009, the total number of inquiries was approximately 87,800, increasing roughly 10% from fiscal 2008. Drug Information Center is our contact point for inquiries. Here, we gather information on not only Shionogi products but also peripheral areas, in order to promptly provide accurate information in response to inquiries. We collect, compile and store as well as analyze information on inquiries received, and provide feedback on this information to the relevant departments. In this way, we strive to share and make good use of information. By sharing this information, we not only monitor current conditions but also conduct company-wide risk management and implement prompt and proper responses to risk. At the same time, these efforts ultimately help us to prevent the materialization of future risks.
Responding to Inquiries
Source: MMJ June 2008, Vol. 4, No.6, p. 534
Pharmacists
Internal (MRs and other personnel)
Wholesalers
General consumers
Doctors and dentists
Nurses
Breakdown ofcustomer inquiries
in fiscal 2009
Financial SectionCorporate Inform
ationM
anagement
Shionogi’s Business Activities
Shionogi’s CSR Activities
Shionogi’s Environmental
Activities
Corporate Governance
31SHIONOGI & CO., LTD. Annual Report 2010
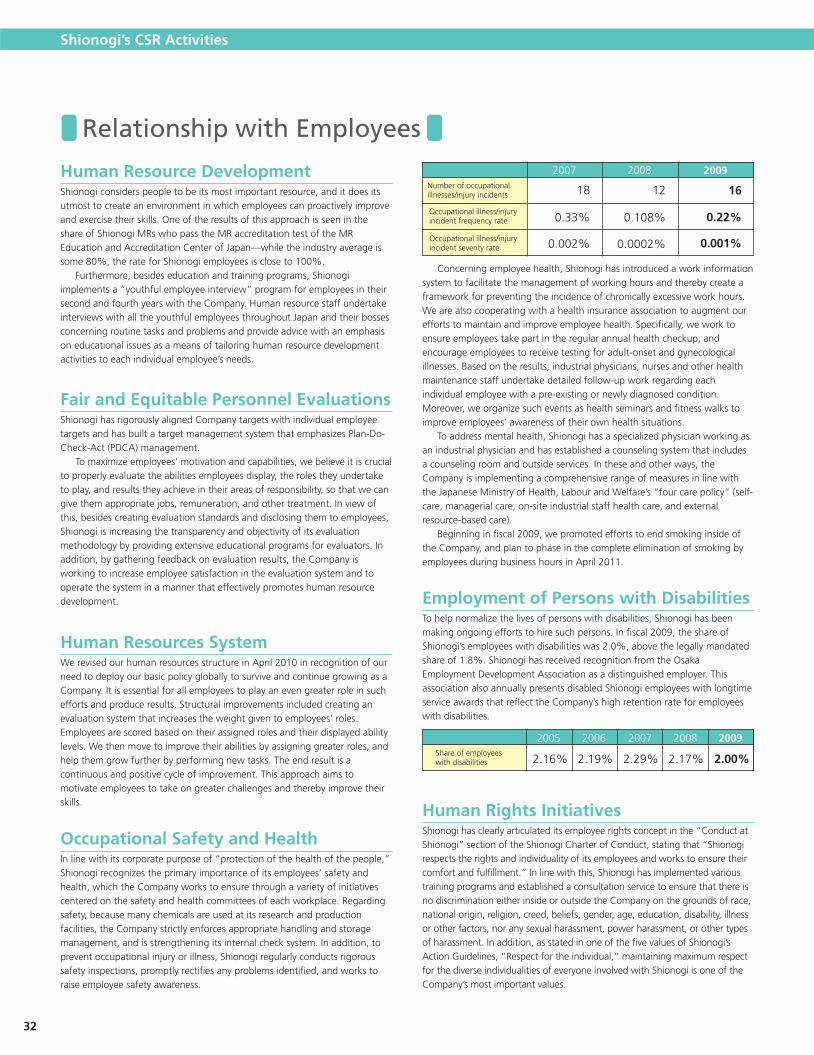
Relationship with Employees
Human Resource DevelopmentShionogi considers people to be its most important resource, and it does its utmost to create an environment in which employees can proactively improve and exercise their skills. One of the results of this approach is seen in the share of Shionogi MRs who pass the MR accreditation test of the MR Education and Accreditation Center of Japan—while the industry average is some 80%, the rate for Shionogi employees is close to 100%. Furthermore, besides education and training programs, Shionogi implements a “youthful employee interview” program for employees in their second and fourth years with the Company. Human resource staff undertake interviews with all the youthful employees throughout Japan and their bosses concerning routine tasks and problems and provide advice with an emphasis on educational issues as a means of tailoring human resource development activities to each individual employee’s needs.
Human Resources SystemWe revised our human resources structure in April 2010 in recognition of our need to deploy our basic policy globally to survive and continue growing as a Company. It is essential for all employees to play an even greater role in such efforts and produce results. Structural improvements included creating an evaluation system that increases the weight given to employees’ roles. Employees are scored based on their assigned roles and their displayed ability levels. We then move to improve their abilities by assigning greater roles, and help them grow further by performing new tasks. The end result is a continuous and positive cycle of improvement. This approach aims to motivate employees to take on greater challenges and thereby improve their skills.
Occupational Safety and HealthIn line with its corporate purpose of “protection of the health of the people,” Shionogi recognizes the primary importance of its employees’ safety and health, which the Company works to ensure through a variety of initiatives centered on the safety and health committees of each workplace. Regarding safety, because many chemicals are used at its research and production facilities, the Company strictly enforces appropriate handling and storage management, and is strengthening its internal check system. In addition, to prevent occupational injury or illness, Shionogi regularly conducts rigorous safety inspections, promptly rectifies any problems identified, and works to raise employee safety awareness.
Concerning employee health, Shionogi has introduced a work information system to facilitate the management of working hours and thereby create a framework for preventing the incidence of chronically excessive work hours. We are also cooperating with a health insurance association to augment our efforts to maintain and improve employee health. Specifically, we work to ensure employees take part in the regular annual health checkup, and encourage employees to receive testing for adult-onset and gynecological illnesses. Based on the results, industrial physicians, nurses and other health maintenance staff undertake detailed follow-up work regarding each individual employee with a pre-existing or newly diagnosed condition. Moreover, we organize such events as health seminars and fitness walks to improve employees’ awareness of their own health situations. To address mental health, Shionogi has a specialized physician working as an industrial physician and has established a counseling system that includes a counseling room and outside services. In these and other ways, the Company is implementing a comprehensive range of measures in line with the Japanese Ministry of Health, Labour and Welfare’s “four care policy” (self-care, managerial care, on-site industrial staff health care, and external resource-based care). Beginning in fiscal 2009, we promoted efforts to end smoking inside of the Company, and plan to phase in the complete elimination of smoking by employees during business hours in April 2011.
Fair and Equitable Personnel EvaluationsShionogi has rigorously aligned Company targets with individual employee targets and has built a target management system that emphasizes Plan-Do-Check-Act (PDCA) management. To maximize employees’ motivation and capabilities, we believe it is crucial to properly evaluate the abilities employees display, the roles they undertake to play, and results they achieve in their areas of responsibility, so that we can give them appropriate jobs, remuneration, and other treatment. In view of this, besides creating evaluation standards and disclosing them to employees, Shionogi is increasing the transparency and objectivity of its evaluation methodology by providing extensive educational programs for evaluators. In addition, by gathering feedback on evaluation results, the Company is working to increase employee satisfaction in the evaluation system and to operate the system in a manner that effectively promotes human resource development. Employment of Persons with Disabilities
To help normalize the lives of persons with disabilities, Shionogi has been making ongoing efforts to hire such persons. In fiscal 2009, the share of Shionogi’s employees with disabilities was 2.0%, above the legally mandated share of 1.8%. Shionogi has received recognition from the Osaka Employment Development Association as a distinguished employer. This association also annually presents disabled Shionogi employees with longtime service awards that reflect the Company’s high retention rate for employees with disabilities.
Human Rights InitiativesShionogi has clearly articulated its employee rights concept in the “Conduct at Shionogi” section of the Shionogi Charter of Conduct, stating that “Shionogi respects the rights and individuality of its employees and works to ensure their comfort and fulfillment.” In line with this, Shionogi has implemented various training programs and established a consultation service to ensure that there is no discrimination either inside or outside the Company on the grounds of race, national origin, religion, creed, beliefs, gender, age, education, disability, illness or other factors, nor any sexual harassment, power harassment, or other types of harassment. In addition, as stated in one of the five values of Shionogi’s Action Guidelines, “Respect for the individual,” maintaining maximum respect for the diverse individualities of everyone involved with Shionogi is one of the Company’s most important values.
2008 20092007
18
0.33%
0.002%
12
0.108%
0.0002%
16
0.22%
0.001%
Number of occupational illnesses/injury incidents
Occupational illness/injury incident frequency rate
Occupational illness/injury incident severity rate
2005
2.16%
2006 2007 2008 2009
2.19% 2.29% 2.00%2.17%Share of employees with disabilities
32
Shionogi’s CSR Activities
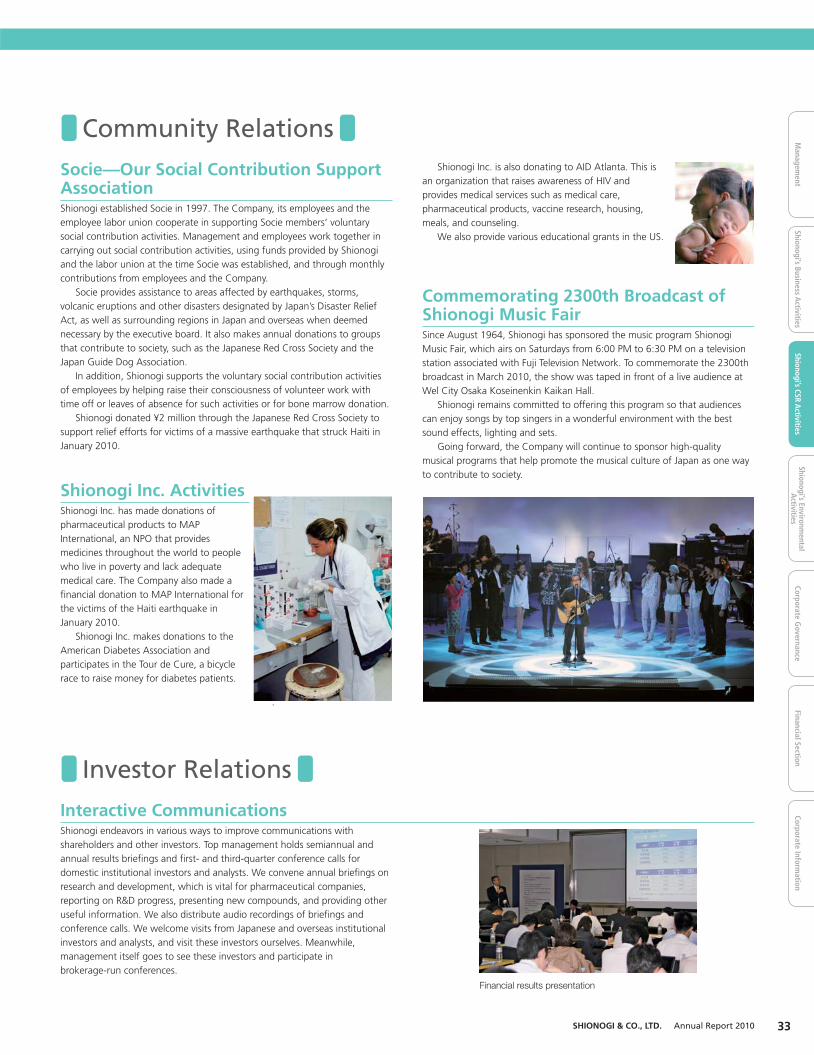
Community Relations
Commemorating 2300th Broadcast of Shionogi Music FairSince August 1964, Shionogi has sponsored the music program Shionogi Music Fair, which airs on Saturdays from 6:00 PM to 6:30 PM on a television station associated with Fuji Television Network. To commemorate the 2300th broadcast in March 2010, the show was taped in front of a live audience at Wel City Osaka Koseinenkin Kaikan Hall. Shionogi remains committed to offering this program so that audiences can enjoy songs by top singers in a wonderful environment with the best sound effects, lighting and sets. Going forward, the Company will continue to sponsor high-quality musical programs that help promote the musical culture of Japan as one way to contribute to society.
Socie—Our Social Contribution Support AssociationShionogi established Socie in 1997. The Company, its employees and the employee labor union cooperate in supporting Socie members’ voluntary social contribution activities. Management and employees work together in carrying out social contribution activities, using funds provided by Shionogi and the labor union at the time Socie was established, and through monthly contributions from employees and the Company. Socie provides assistance to areas affected by earthquakes, storms, volcanic eruptions and other disasters designated by Japan’s Disaster Relief Act, as well as surrounding regions in Japan and overseas when deemed necessary by the executive board. It also makes annual donations to groups that contribute to society, such as the Japanese Red Cross Society and the Japan Guide Dog Association. In addition, Shionogi supports the voluntary social contribution activities of employees by helping raise their consciousness of volunteer work with time off or leaves of absence for such activities or for bone marrow donation. Shionogi donated ¥2 million through the Japanese Red Cross Society to support relief efforts for victims of a massive earthquake that struck Haiti in January 2010.
Shionogi Inc. ActivitiesShionogi Inc. has made donations of pharmaceutical products to MAP International, an NPO that provides medicines throughout the world to people who live in poverty and lack adequate medical care. The Company also made a financial donation to MAP International for the victims of the Haiti earthquake in January 2010. Shionogi Inc. makes donations to the American Diabetes Association and participates in the Tour de Cure, a bicycle race to raise money for diabetes patients.
Investor Relations
Interactive CommunicationsShionogi endeavors in various ways to improve communications with shareholders and other investors. Top management holds semiannual and annual results briefings and first- and third-quarter conference calls for domestic institutional investors and analysts. We convene annual briefings on research and development, which is vital for pharmaceutical companies, reporting on R&D progress, presenting new compounds, and providing other useful information. We also distribute audio recordings of briefings and conference calls. We welcome visits from Japanese and overseas institutional investors and analysts, and visit these investors ourselves. Meanwhile, management itself goes to see these investors and participate in brokerage-run conferences.
Financial results presentation
Financial SectionCorporate Inform
ationM
anagement
Shionogi’s Business Activities
Shionogi’s CSR Activities
Shionogi’s Environmental
Activities
Corporate Governance
33SHIONOGI & CO., LTD. Annual Report 2010
Shionogi Inc. is also donating to AID Atlanta. This is an organization that raises awareness of HIV and provides medical services such as medical care, pharmaceutical products, vaccine research, housing, meals, and counseling. We also provide various educational grants in the US.

34
PharmaceuticalResearch Division
PresidentCorporate Executive
Meeting
Shionogi Group CentralEnvironmental Committee
Environmental ManagementCommittee
Chief EnvironmentalSupervisor
Chief EnvironmentalManagement Supervisor
PharmaceuticalDevelopment Division
Head Office &Branch Offices
Manufacturing &Technology Division Subsidiaries
Efforts to Preserve the Environment
FY2009 Results
Environmental Management Organization
Measures for Resource Conservation and Wastes• Amount of Waste GeneratedIn recent years, the establishment of a recycling-oriented society has become a necessity, partly because there is a limit to the capacity of waste processing plants. In response, Shionogi has worked to reduce the volume of waste products generated and promote the reuse and recycling of resources. Principal waste products included waste oil generated from manufacturing processes, sludge generated from waste-water treatment processes, and plastics used in product containers. In fi scal 2009, the volume of waste products generated rose, mainly refl ecting an increase from expanded production activities accompanying the full-scale operation of a new drug formulation facility, and realignment of exist-ing research facilities in line with construction plans of new research facilities. Going forward, however, we will continue working to reduce wastes. We defi ne the goal of reducing the amount of waste products from our business sites that are directly disposed of in landfi lls to zero as “zero emissions,” and, with this goal in mind, we are working to reduce the amount of waste. Although we fell short of this target in fi scal 2009, we are promoting steps to achieve zero emissions through the incineration of
In promoting its business activities, the Shionogi Group are aware that, as a company, we have an important social responsibility to give appropriate consideration to the global and local environments. To lessen our environmental impact in all of its business activities, we established ”The Shionogi Group’s Basic Environmental Policy.” In line with this policy, we have established the Shionogi Group Environmental Protection Plan and conduct a growing range of environmental preservation activities. Despite increased production activities in fi scal 2009 refl ecting the full-scale operation of a new drug formulation facility, we continued to reduce the environmental impact of all our activities.
We promote environmental preservation activities under the group-wide supervision of the Chief Environmental Supervisor and the Chief Environmental Management Supervisor. All major business sites have environmental committees chaired by the Environmental Supervisor and composed of the Environmental Management Supervisor, environmental supervisors from each department, and others. The committees deliberate on and approve the operations of the environmental management system.
certain waste formerly sent to landfi ll, among other means. In addition, to prevent illegal dumping of waste products, we carefully select the companies to which we consign waste processing and transport tasks, verify-ing their industrial permit acquisition situation as well as their treatment facilities, operational situation, document management situation, and other items listed on company evaluation sheets to provide a basis for deliberations on whether or not to employ a particular company. After work is consigned, we appropriately manage the relevant contracts, permit certifi cates, and manifests, and undertakes an onsite check of the waste processing company one or more times each year.
The Shionogi Group’s Basic Environmental Policy
April 1, 2008Isao Teshirogi, President and Representative DirectorShionogi & Co., Ltd.
1. Environmental Management SystemThe Shionogi Group will promote high-quality environmental protection activities by assigning the Director in charge of the environment to the post of Chief Environmental Supervisor and clarifying organizational responsibili-ties and authority for environmental management.
2. Compliance with Laws and RegulationsThe Shionogi Group will work to protect the environment by complying with environmental laws and regulations as well as setting voluntary management standards.
3. Reduction of Environmental ImpactIn its research and development, manufacturing, distribution, marketing, and other business activities, the Shionogi Group will set and periodically revise targets in areas such as energy and resource conservation, waste reduction, and strengthening management of chemical substances, striving for continual improvement.
4. Education and TrainingThe Shionogi Group will raise the awareness of all employees toward environmental protection by conducting environmental education and training and providing environment-related information.
5. Coexistence with SocietyFrom its standpoint as a corporate citizen, the Shionogi Group will cooper-ate in environmental protection activities of regional communities. In addi-tion, we will disclose our environmental information to promote mutual understanding with society.
6. Disclosure of Our Basic Environmental PolicyThe Shionogi Group will disclose the Basic Environmental Policy both inside and outside the Group.
0
2,000
4,000
6,000
8,000
10,000
Domestic subsidiariesShionogi
20092008200720062005200420031990
(Tons)
(FY)
8,592
5,0314,663 4,965
67749
5,498
1.397
47
6,310
1,199
46
5,964
1,263
56
6,912
1,228
54
476470
Waste Products Generated
8,592
5,5025,139
5,691
6,9427,555 7,283
8,194
Overseas subsidiary Figures in blue are for the Shionogi Group.
0
50
100
150
1,050
1,100
20092008200720062005200420031990
1,072
8.3
5.7
0.0
0.30.1
0.6
0.0
0.01.1
0.3
0.9
0.20.8
1.6
32.6
0.0 0.0 0.0 0.0
1,072
14.00.3
33.2
0.0 1.3 1.1 2.4
Domestic subsidiariesShionogi
(Tons)
(FY)
Waste Products Sent Directly to LandfillsOverseas subsidiary Figures in blue are for the Shionogi Group.
Shionogi’s Environmental Activities

Financial SectionCorporate Inform
ationM
anagement
Shionogi’s Business Activities
Shionogi’s CSR Activities
Shionogi’s Environmental
Activities
Corporate Governance
35SHIONOGI & CO., LTD. Annual Report 2010
• Low-Emission VehiclesWe continue to introduce low-emission vehicles for use by medical representatives (MRs). In fi scal 2009—following the introduction of 86 hybrid vehicles, low-emission vehicles, and other vehicles that meet specifi ed fuel economy standards—all 490 of the Company’s marketing-use cars were low-emission vehicles that have exhaust
emissions 50% or more below the 2005 standard level. Going forward, while focusing mainly on hybrid cars, plans call for partially introducing electric vehicles as well as promoting greater use of public transportation within Tokyo.
• Prevention of Global WarmingIn recent years, a casual relationship has been identifi ed between the increased frequency of abnormal weather events around the world and rising greenhouse gas concentrations in the atmosphere. In response, Shionogi has taken measures to reduce its greenhouse gas emissions. In fi scal 2009, we continued to take systematic steps, including upgrading such equipment as high-voltage transformers, freezers, and lighting equipment to energy-saving models, and reviewing our use of air con-ditioners. However, through expansion of production, such as the start of full-scale operations at a new drug formulation facility the volume of greenhouse gas emissions rose. We will continue considering ways to curb our output of greenhouse gases and improve our environmental effi ciency. Furthermore, plans for new research facilities at our Development Research Laboratories include more extensive measures built in to en-hance energy effi ciency and reduce greenhouse gas emission volume. This initiative has been well received by the public, and culminated in it being named as a “fi scal 2009 model CO2 reduction enterprise” by Japan’s Ministry of Land, Infrastructure, Transport and Tourism.
• Copy Paper and Printing PaperWe are reducing the amount of copy paper and printing paper used by means of various initiatives, including printing double-sided or multiple pages per sheet, shifting to paperless faxing, and promoting the use of scanners and management of docu-ments in electronic form. In fi scal 2009, paper usage increased mainly due to sales promotion activities. Going forward, however, we will continue working to reduce paper usage.
• Environmental AccountingWe have been conducting environmental accounting based on guidelines from Japan’s Ministry of the Environment. The purpose of environmental accounting is to quantitatively manage environmental preservation activities by recognizing their cost and the effect they achieve.
• Green PurchasingRegarding offi ce supplies, we make efforts to purchase environment-friendly products. We have built an intranet-based purchasing system that facilitates green purchasing when ordering by searching for and identifying eco-friendly products. In fi scal 2009, the green purchasing ratio declined partly due to changes in sticker mark standards for environ-mental labels, but we will continue working to enhance this ratio going forward. • Chemical Substance Management
Because many chemical substances have an impact on human health, ecosystems, and the global environment, the pharmaceutical industry is autonomously implementing such measures as those to survey the amount of chemical substances used and reduce atmospheric emissions. We properly manage our emissions of chemical substances into the atmosphere and wastewater and otherwise undertake the appropriate management of harmful chemical substances. In addition, we have a reagent control system in place for appropriate inventory management regarding chemicals used in R&D as well as access controls concerning poisonous and/or hazardous chemicals. In other areas, Shionogi fi les reports based on the Pollutant Release and Transfer Regis-ter (PRTR) Law, which requires companies to measure, compile and announce data on hazardous chemicals released into the environment. Going forward, we will continue to properly monitor the amount of such chemicals we use, release and transfer.
0
20
40
60
80
100
Domestic Shionogi GroupDomestic subsidiariesShionogi
200920082007200620052004
(%)
(FY)
7267
7163
85
6572
88
74 75
89
77 74
92
7671
89
74
Green Purchasing Ratio
*Environmental effi ciency is calculated as net sales divided by the amount of greenhouse gas emissions. Therefore, higher numbers indicate more environment-friendly business activities.
Environmental Management Evaluation ReportExperts at the Institute for Environmental Management Accounting (IEMA) provide us with their opinion on our efforts to improve the reliability and transparency of disclosure of our environmental activities. We also receive advice on our environmental friendliness, environmental management status, and future activities.
For further details on our environmental and other activities, please visit our website at
URL:http://www.shionogi.co.jp/environment/eco/
0
10,000
20,000
30,000
40,000
50,000
36,828
2681,336
37,123
3931,835
34,188
2651,752
33,738
2412,359
31,016
3042,496
34,359
200
38,431 39,35136,205 36,338
33,816 37,775
3,216
200920082007200620052004
Domestic subsidiariesShionogi
(Thousand sheets)
(FY)
Number of Sheets of Paper PurchasedOverseas subsidiary Figures in blue are
for the Shionogi Group.
20092008200720062005200420031990
109,632
85,223
15,366
81,184
17,163
88,091
13,398
900
91,839
16,451
927
94,278
15,094
1,075
94,692
15,439
1,443
99,429
14,635
1,345
109,632
100,58998,347
102,389
109,218 110,447 111,574115,409
70,000
80,000
90,000
100,000
110,000
120,000
* From fiscal 2005, figures for all greenhouse gas emissions are included on a Group-wide basis.
* From fiscal 2006, the Tokyo Branch Office expanded the scope of its calculations.
Domestic subsidiariesShionogi
(Ton-CO2)
(FY)
CO2 and Other Greenhouse Gas EmissionsOverseas subsidiary Figures in blue are
for the Shionogi Group.
• Environmental Effi ciencyEnvironmental effi cien-cy, which is based on greenhouse gas emis-sions and net sales, has been improved. Going forward, we will strive to improve environmental effi -ciency further through effi cient business activities.
0
200
400
600
Hybrid 75% exhaust reduction from 2005 standard levels
50% exhaust reduction from 2005 standard levels
200920082007200620052004
(No. of vehicles)
(FY)
88
6
9
56
88
19
55
88
29
4257
69
23
86
11
Introduction of Low-Emission Vehicles (LEVs)
137
224
315
434493 490
25% exhaust reduction from 2000 standard levels
Figures in blue are for the LEVs (Total)
43
71
153
306 401 393
0
5
10
15
20
25
Shionogi GroupShionogi
2009200820072006200520042003
(Index)
(FY)
Environmental Efficiency Index
21.522.3
20.8 20.221.3 21.8
23.0
24.1
20.419.4
18.319.2
Environmental efficiency
* For fiscal years prior to fiscal 2005, only figures for the CO2 emissions of Shionogi & Co.’s sites are used.
* From fiscal 2005, figures for all greenhouse gas are included on a Group-wide basis.
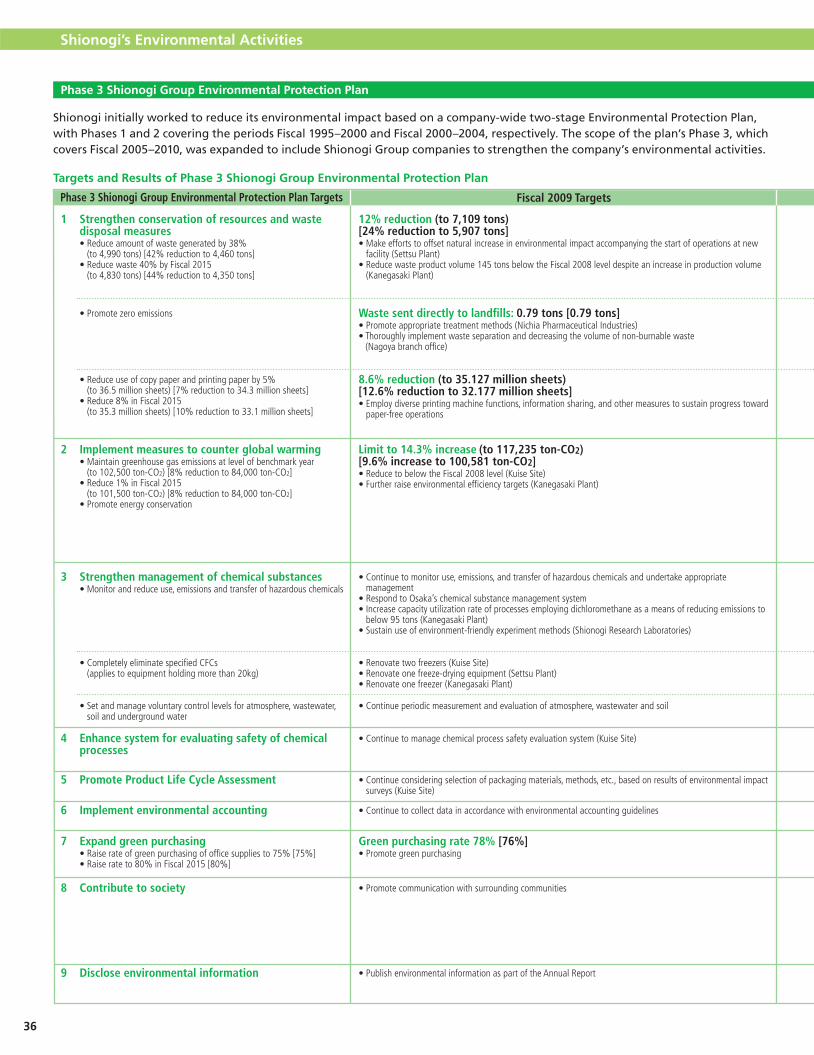
36
Phase 3 Shionogi Group Environmental Protection Plan
Shionogi initially worked to reduce its environmental impact based on a company-wide two-stage Environmental Protection Plan, with Phases 1 and 2 covering the periods Fiscal 1995–2000 and Fiscal 2000–2004, respectively. The scope of the plan’s Phase 3, which covers Fiscal 2005–2010, was expanded to include Shionogi Group companies to strengthen the company’s environmental activities.
Targets and Results of Phase 3 Shionogi Group Environmental Protection Plan
1 Strengthen conservation of resources and waste disposal measures • Reduce amount of waste generated by 38%
(to 4,990 tons) [42% reduction to 4,460 tons] • Reduce waste 40% by Fiscal 2015
(to 4,830 tons) [44% reduction to 4,350 tons]
Phase 3 Shionogi Group Environmental Protection Plan Targets
12% reduction (to 7,109 tons) [24% reduction to 5,907 tons]• Make efforts to offset natural increase in environmental impact accompanying the start of operations at new
facility (Settsu Plant)• Reduce waste product volume 145 tons below the Fiscal 2008 level despite an increase in production volume
(Kanegasaki Plant)
• Promote zero emissions Waste sent directly to landfi lls: 0.79 tons [0.79 tons]• Promote appropriate treatment methods (Nichia Pharmaceutical Industries)• Thoroughly implement waste separation and decreasing the volume of non-burnable waste
(Nagoya branch offi ce)
• Reduce use of copy paper and printing paper by 5%(to 36.5 million sheets) [7% reduction to 34.3 million sheets]
• Reduce 8% in Fiscal 2015(to 35.3 million sheets) [10% reduction to 33.1 million sheets]
8.6% reduction (to 35.127 million sheets) [12.6% reduction to 32.177 million sheets]• Employ diverse printing machine functions, information sharing, and other measures to sustain progress toward
paper-free operations
2 Implement measures to counter global warming • Maintain greenhouse gas emissions at level of benchmark year
(to 102,500 ton-CO2) [8% reduction to 84,000 ton-CO2] • Reduce 1% in Fiscal 2015
(to 101,500 ton-CO2) [8% reduction to 84,000 ton-CO2] • Promote energy conservation
Limit to 14.3% increase (to 117,235 ton-CO2) [9.6% increase to 100,581 ton-CO2]• Reduce to below the Fiscal 2008 level (Kuise Site)• Further raise environmental effi ciency targets (Kanegasaki Plant)
3 Strengthen management of chemical substances • Monitor and reduce use, emissions and transfer of hazardous chemicals
• Continue to monitor use, emissions, and transfer of hazardous chemicals and undertake appropriate management
• Respond to Osaka’s chemical substance management system• Increase capacity utilization rate of processes employing dichloromethane as a means of reducing emissions to
below 95 tons (Kanegasaki Plant)• Sustain use of environment-friendly experiment methods (Shionogi Research Laboratories)
• Completely eliminate specifi ed CFCs (applies to equipment holding more than 20kg)
• Renovate two freezers (Kuise Site)• Renovate one freeze-drying equipment (Settsu Plant)• Renovate one freezer (Kanegasaki Plant)
• Set and manage voluntary control levels for atmosphere, wastewater, soil and underground water
• Continue periodic measurement and evaluation of atmosphere, wastewater and soil
4 Enhance system for evaluating safety of chemical processes
• Continue to manage chemical process safety evaluation system (Kuise Site)
5 Promote Product Life Cycle Assessment • Continue considering selection of packaging materials, methods, etc., based on results of environmental impact surveys (Kuise Site)
6 Implement environmental accounting • Continue to collect data in accordance with environmental accounting guidelines
7 Expand green purchasing • Raise rate of green purchasing of offi ce supplies to 75% [75%] • Raise rate to 80% in Fiscal 2015 [80%]
Green purchasing rate 78% [76%]• Promote green purchasing
8 Contribute to society • Promote communication with surrounding communities
9 Disclose environmental information • Publish environmental information as part of the Annual Report
Fiscal 2009 Targets
Shionogi’s Environmental Activities

Financial SectionCorporate Inform
ationM
anagement
Shionogi’s Business Activities
Shionogi’s CSR Activities
Shionogi’s Environmental
Activities
Corporate Governance
37SHIONOGI & CO., LTD. Annual Report 2010
2% increase (to 8,194 tons) [11% reduction to 6,912 tons]• Rose due to the full-scale operation of new drug formulation facility, but the overall increase was curbed
mainly through a review of manufacturing processes (Settsu Plant)• Waste products increased in line with expanding production volume (Kanegasaki Plant)• Promoted the purchasing of organic solvents in containers and volumes (Shionogi Research Laboratories)• Recycling contract was changed to treat metal scrap waste as valuable materials (Aburahi Laboratories)
21% reduction (to 6,372 tons) [23% reduction to 5,996 tons]• Raise eco-effi ciency targets for waste emissions (Kanegasaki Plant)• Promote re-use of unneeded or underutilized equipment and offi ce supplies
stemming from plans for a new research facility (Aburahi Laboratories)
Waste sent directly to landfi ll: 2.45 tons [0.81 tons]• One-off increase due to disposal of mixed wastes and ion-exchange membranes
(Nichia Pharmaceutical Industries)• Strict waste separation employed and volume of non-combustible waste reduced (Nagoya Branch Offi ce)
Waste sent directly to landfi ll: 0.76 tons [0.76 tons]• Switch to incinerating ion-exchange membranes to reduce landfi ll waste
(Nichia Pharmaceutical Industries)• Use strict waste separation and cut volume of non-combustible waste
(Nagoya Branch Offi ce)
1.7% reduction (to 37.775 million sheets) [6.7% reduction to 34.359 million sheets]• Usage increase due to large number of overseas inspections (Kanegasaki Plant)• Usage increase mainly due to internalization of some copying requests and sales promotion activities
(Settsu Plant, Head Offi ce)
14.2% reduction (to 32.962 million sheets)[12.9% reduction to 32.077 million sheets]• Continue promoting paperless operations using various printer functions,
document sharing and other measures
12.5% increase (to 115,409 ton-CO2) [8.3% increase to 99,429 ton-CO2]• Reduced year on year through change of water coolers and freezers and enhancement of transformer effi ciency (Kuise Site)• Improvement in environmental effi ciency benchmark (Kanegasaki Plant) • Changed the operating hours of production-line air conditioners (Kanegasaki Plant)• Replaced incandescent light bulbs with fl uorescent light bulbs (Kanegasaki Plant)• Thinned windbreak forest (Aburahi Laboratories)• NOx/SOx reducing photo-catalytic and heat-blocking paint used on external walls (Bushu Pharmaceuticals)• Plans for new research facilities adopted as model CO2 reduction enterprise by the Ministry of Land,
Infrastructure, Transport and Tourism (Developmental Research Laboratories)
7.7% reduction (to 94,670 ton-CO2)[0.6% increase to 92,317 ton-CO2]• Raise greenhouse-gas-related environmental effi ciency targets
(Kanegasaki Plant)• Review operation of air-conditioning systems (Aburahi Laboratories)• Establish an Energy Effi ciency Committee and promote energy conservation
and CO2 countermeasures company-wide.
• Hazardous chemicals use, emissions and transfers monitored and managed properly• Submission made on Osaka’s chemical substance management system• Atmospheric dichloromethane emissions rose to 119.5 tons, in line with higher operation rates (Kanegasaki Plant)• Lecture by an outside expert on proper chemicals management performed (Shionogi Research Laboratories)• Format miniaturization promoted for screening of development compounds (Shionogi Research Laboratories)• Warehouse facilities subject to asbestos enclosure work were properly dismantled and removed
(Developmental Research Laboratories)
• Continue monitoring use, emissions and transfers of hazardous chemicals and manage properly
• Cut atmospheric dichloromethane emissions to 91 tons or less (Kanegasaki Plant)
• Sustain use of environment-friendly experiment methods (Shionogi Research Laboratories)
• Two freezers renovated (Kuise Site)• One freeze-drying unit renovated (Settsu Plant)• One freezer renovated (Kanegasaki Plant)
• Renovate one freeze-drying equipment (Settsu Plant)• Renovate four freezers (Kanegasaki Plant)
• Periodic measurement and evaluation of atmosphere, wastewater and soil conducted based on voluntary control levels
• Continue periodic measurement and evaluation of atmosphere, wastewater and soil
• Safety of chemical processes evaluated for 25 development compounds and 49 processes (Kuise Site)• Chemical process safety evaluated for 3 new product manufactures as well as carrying out pre-production training (Nichia Pharmaceutical Industries)
• Continue to manage chemical process safety evaluation system (Kuise Site)• Continue chemical process safety evaluation for new product manufactures as well as carrying out pre-production training (Nichia Pharmaceutical Industries)
• Film usage cut by about 20% by switching from strip packaging to more eco-friendly stick packaging (Kuise Site)
• Continue selecting packaging materials and methods based on environmental impact survey results (Kuise Site)
• Environmental accounting data collected for our Group and individual operating sites in accordance with environmental accounting guidelines
• Continue collecting data in accordance with environmental accounting guidelines
Green purchasing rate 74% [71%]• Rate was decreased due to changes in sticker mark standards for environmental labels and increased usage of
higher-grade paper
Green purchasing rate 75% [75%]• Promote green purchasing
• Participated in cleanup campaigns near sites and main roads in vicinity, as well as environmental activities• Sponsorship of “Kanegasaki Greenery and Flower Bank” (Kanegasaki Plant)• Wastepaper and newspapers donated to local children’s groups (Developmental Research Laboratories)• Cooperation with work experience program for local junior high school students (Aburahi Laboratories)• PET bottle caps donated to the NPO EcoCap Movement (Bushu Pharmaceuticals, Kuise Site)• Began consideration of biodiversity initiatives (Kanegasaki Plant, Shionogi Research Laboratories, Developmental Research Laboratories)
• Promote communications with neighboring communities at operating sites• Promote biodiversity initiatives
• Annual Report published online and as booklet• Contributed article on environmental activities to the Osaka Environmental Management Newsletter (“Naniwa No Kankyo Keiei Kawaraban”) (Shionogi Research Laboratories)
• Publish environmental information in an Annual Report format
Scope of application: Shionogi Group companies (domestic and overseas)Benchmark year: Fiscal 1990 (or Fiscal 2004)Figures in [ ] apply to parent companyFiscal year targets: Fiscal 2010 targets were set in line with expanded production and R&D activity levels, despite Fiscal 2010 being the fi nal year of the medium-term environmental plan.
Fiscal 2009 Results Fiscal 2010 Targets

Corporate Governance
38
The Company has two standing corporate auditors and two outside corporate auditors. The corporate auditors attend meetings of the Board of Directors, Corporate Executive Meetings, and other important meetings, offering opinions when necessary. In addition, by conducting operational and accounting audits in accordance with corporate auditing standards, they check and evaluate the legality and propriety of operations executed by directors and corporate officers and thereby work to enhance the implementation of oversight. While implementing audits and providing advice and suggestions, the corporate auditors work to coordinate their activities with the Internal Control Unit, an internal auditing department. In addition, by regularly exchanging opinions with the representative directors, the corporate auditors endeavor to ensure the appropriateness and effectiveness of audits.
Strengthening the Internal Control System
In accordance with the Basic Policy for Building an Internal Control System approved by the Board of Directors based on theCorporate Law, Shionogi has worked to establish internal control systems throughout the Shionogi Group. The Board of Directors annually evaluates the state of internal control systems and the progress in implementing the basic policy based on consideration of the operational situation during the previous year and continually works to strengthen and augment the internal control systems. Sincere efforts to ensure the reliability of financial statements are necessary for maintaining management transparency and integrity. To comply with the J-SOX internal control report system under the Financial Instruments and Exchange Act, Shionogi has worked to optimize its IT environment and is moving ahead with measures to build and improve internal controls over financial reporting. As part of these efforts, the president of Shionogi has sent a message to all domestic and global Group employees regarding the need to emphasize the reliability of financial reporting, and the Company is working to promote greater and broader-spread awareness of this issue.
Corporate Governance System
Shionogi has adopted a “company with corporate auditors” corporate governance system that includes a board of directors, a board of corporate auditors, and independent accounting auditors. To further enhance the effective functioning of corporate governance, two outside directors were elected to the Board of Directors in fiscal 2009 to promote comprehensive decision-making incorporating an objective, outside perspective. Both directors recognize their role as independent directors in helping the Company to fulfill its corporate responsibilities, making decisions with the interest of general shareholders in mind and contributing to highly transparent management. The Board of Directors is composed of six directors, including the two outside directors. It meets once a month, in principle, to make decisions on important matters affecting management. To facilitate rapid responses to changes in the operating environment and clarify management responsibilities, the directors’ term in office has been set at one year. In addition, to further increase management transparency and accountability to stakeholders, the Company has established a nomination advisory committee and a compensation advisory committee as advisory bodies to the Board of Directors. Both committees are chaired by outside directors, ensuring that management decisions in these areas are examined from a fair and honest perspective, as well as that the human resources selected as directors are vetted and evaluated from multiple angles, including assessment of aptitude, impact on management, and quality of work performance. Moreover, the Company has introduced a corporate officer system to build a flexible operational execution structure able to rapidly respond to changes in the operating environment. The Corporate Executive Meeting is a unit created to conduct deliberations regarding operational execution issues. It is composed of the directors and managers responsible for operation, and, in principle, it meets every week.
In line with the Company Policy of Shionogi, we recognize that it is our social mission to continually discover, develop, and provide effective and safe medicines. Shionogi is also aware that sustaining its implementation of this social mission will increase corporate value. Accordingly, it gives top priority to carrying out sound and transparent management through the corporate governance system it has established.
Corporate Governance Structure
NominatingCommittee
CompensationCommittee
(As of April 2010)
Appointment/Dismissal
Appointment/Dismissal
Appointment/Dismissal
Supervision/Election/Dismissal
Report
Audit
Audit
Internal audits
Board of DirectorsDirectors
ComplianceCommittee
Independentauditors
Corporate Executive Meeting
Corporate officersDepartments/
Group companies
Representativedirectors
Board of CorporateAuditors
Corporate auditors
Annual General Meeting of Shareholders
Internal ControlUnit

Financial SectionCorporate Inform
ationM
anagement
Shionogi’s Business Activities
Shionogi’s CSR Activities
Shionogi’s Environmental
Activities
Corporate Governance
39SHIONOGI & CO., LTD. Annual Report 2010
Compliance Promotion Structure
Report
(As of April 2010)
Cooperation
Cooperation
Compliance Managers (managers of divisions and units)
Compliance Promoters (at least one appointed from each division or unit)
Legal Affairs Department(The Bureau of the Compliance Committee)
President and Representative Director
Compliance Committee
Corporate ExecutiveMeeting
Subsidiaries
Risk Management
Each of the Company’s organizational units recognizes the intrinsic risk factors associated with its activities, determines response strategies in line with the degree of risk related to each factor, and takes measures to avoid or mitigate those risks. Responses to important risks that could significantly impact the Company’s management are discussed at the Corporate Executive Meeting and other meetings and, based on the response policies determined at those meetings, the responsible units cooperate with relevant departments to respond as necessary. Regarding risks associated with disasters, accidents, corporate scandals and other situations requiring emergency responses, Shionogi has formulated a Crisis Management Policy, as well as separate sets of critical measures and contact chains pertaining specifically to disasters, pandemics, and corporate scandals. In this way, Shionogi is promoting crisis management processes that emphasize respect for human lives, demonstrate consideration for and contributions to local communities, and mitigate potential damage to corporate value.
Framework for Information Disclosure
Shionogi has established internal systems for the timely, appropriate, and fair disclosure of accurate corporate information to investors and all other kinds of stakeholders, and the Company continues to make necessary revisions to these systems with the goal of maintaining and improving them.
Thorough Compliance
Shionogi promotes compliance in all departments and units, including domestic and global subsidiaries, through measures centered on those of the Compliance Committee, which is chaired by the president and for which the Legal Affairs Department serves as the secretariat. In line with the formulation of the aforementioned outline of essential countermeasures for corporate scandals, the Corporate Scandal Risk Deliberation Committee was established under the Compliance Committee. The Deliberation Committee analyzes and assesses the possible risks due to such incidents, and is responsible for enacting advance measures to prevent their occurrence. Not limited to conformance with laws and regulations, Shionogi’s broad definition of compliance also requires ethical behavior. Each year,
the Company engages in the following types of activities aimed at promoting outstanding compliance consciousness and compliance performance among all employees.
1. As the designated Compliance Manager, the manager of each department or unit cooperates with an assistant—designated the Compliance Promoter—in undertaking activities that promote comprehensive compliance consciousness, identifying risks and considering related responses, drafting and submitting reports regarding implementation and improvement measures, and taking various other measures.
2. Besides drafting compliance measure proposals, the Legal Affairs Department provides support for promotion activities of each department or unit through such measures as those to implement and facilitate compliance education programs for executives and all Shionogi Group employees, prepare and distribute Shionogi’s Compliance Handbook, disseminate awareness-raising messages, and conduct employee attitude surveys.
3. Shionogi has established an internal reporting system, an internal reporting desk in the Legal Affairs Department, and an external reporting desk at the office of its outside legal counsel, and makes risk management efforts designed to promote the amelioration and prevention of compliance violations through the early discovery of breaches. In conjunction with this system, the Company, in accordance with the intent of Japan’s Whistleblower Protection Act, has established internal protection regulations aimed at preventing whistleblowers from being subjected to disadvantageous situations.
4. Concerning the protection of personal information, Shionogi has established an information management system based on its Information Security Policy and employs this system to manage information assets. In addition, the Company has established a standing committee headed by the General Manager of the Legal Affairs Department that takes various measures to prevent the inappropriate usage or leakage of personal information, including implementation of the Company’s privacy policy, disclosing the scope of personal information usage objectives, establishing a dedicated consulting line to handle personal information-related consultations and complaints, and helping employees who handle personal information to participate in educational programs and acquire related certifications.
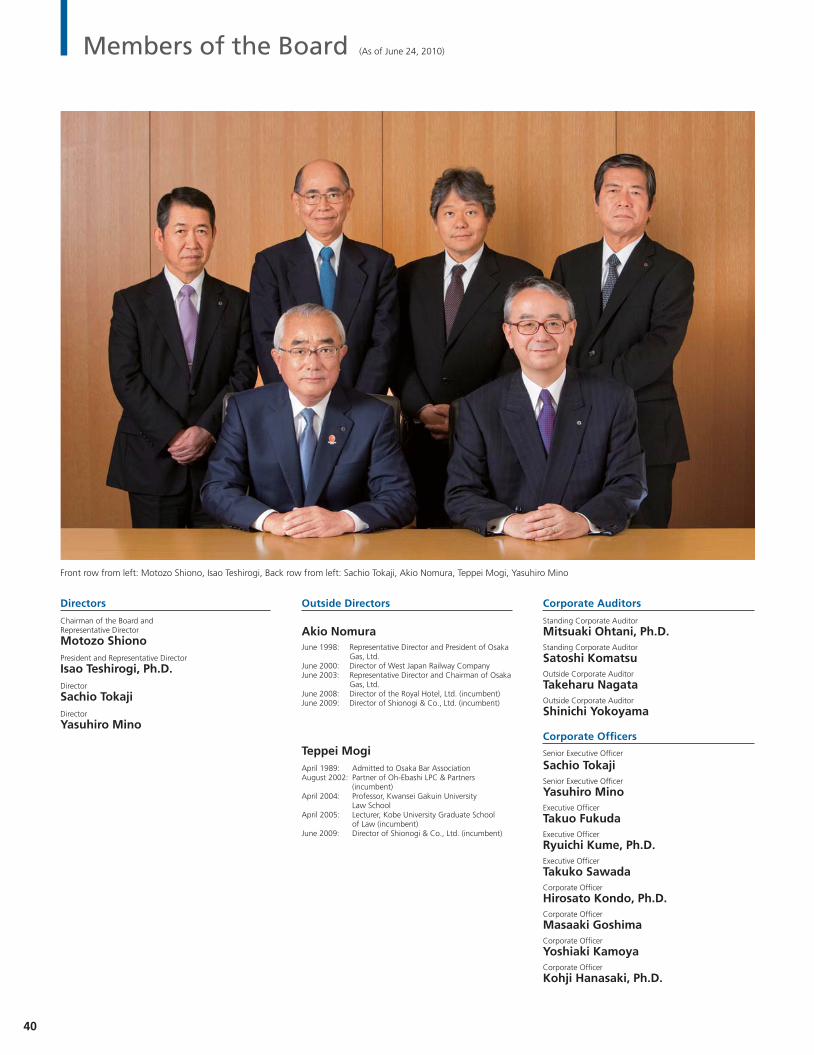
Members of the Board
Front row from left: Motozo Shiono, Isao Teshirogi, Back row from left: Sachio Tokaji, Akio Nomura, Teppei Mogi, Yasuhiro Mino
Directors Corporate Auditors
Corporate Offi cers
Chairman of the Board and Representative Director
Motozo ShionoPresident and Representative Director
Isao Teshirogi, Ph.D.Director
Sachio TokajiDirector
Yasuhiro Mino
Akio NomuraStanding Corporate Auditor
Mitsuaki Ohtani, Ph.D.Standing Corporate Auditor
Satoshi KomatsuOutside Corporate Auditor
Takeharu NagataOutside Corporate Auditor
Shinichi Yokoyama
Senior Executive Officer
Sachio TokajiSenior Executive Officer
Yasuhiro MinoExecutive Officer
Takuo FukudaExecutive Officer
Ryuichi Kume, Ph.D.Executive Officer
Takuko SawadaCorporate Officer
Hirosato Kondo, Ph.D.Corporate Officer
Masaaki GoshimaCorporate Officer
Yoshiaki KamoyaCorporate Officer
Kohji Hanasaki, Ph.D.
Outside Directors
(As of June 24, 2010)
40
June 1998: Representative Director and President of Osaka Gas, Ltd.June 2000: Director of West Japan Railway CompanyJune 2003: Representative Director and Chairman of Osaka Gas, Ltd.June 2008: Director of the Royal Hotel, Ltd. (incumbent)June 2009: Director of Shionogi & Co., Ltd. (incumbent)
Teppei MogiApril 1989: Admitted to Osaka Bar AssociationAugust 2002: Partner of Oh-Ebashi LPC & Partners (incumbent)April 2004: Professor, Kwansei Gakuin University Law SchoolApril 2005: Lecturer, Kobe University Graduate School of Law (incumbent)June 2009: Director of Shionogi & Co., Ltd. (incumbent)
Financial SectionCorporate Inform
ationM
anagement
Shionogi’s Business Activities
Shionogi’s CSR Activities
Shionogi’s Environmental
Activities
Corporate Governance
41SHIONOGI & CO., LTD. Annual Report 2010
Management’s Discussion and Analysis 42
Consolidated Balance Sheets 46
Consolidated Statements of Income 48
Consolidated Statements of Changes in Net Assets 49
Consolidated Statements of Cash Flows 50
Notes to Consolidated Financial Statements 51
Report of Independent Auditors 67
Financial Section

Overview of Results The introduction of the fi scal 2010 reforms to the National Health Insurance (NHI) drug pricing system was a key issue affecting the Japanese pharmaceutical industry in fi scal 2009, the year ended March 31, 2010. As part of these pricing reforms the government introduced on a trial basis new NHI pricing premiums to promote the discovery of new drugs and provide reimbursement for off-label drug use. The actions demanded by these reforms will differ between pharmaceutical manufacturers. Going forward, companies unable to respond to the new challenges may be forced to exit the Japanese market. Overseas, major reforms were introduced to the health insurance system in the US, the world’s largest market for pharmaceuticals. These reforms are expected to affect the market in future in a variety of ways. Amid this operating environment, the Shionogi Group (comprising Shionogi & Co., Ltd. and its consolidated subsidiaries) focused its collective efforts on implementing the second medium-term business plan. Covering the period from April 2005 to March 2010, this plan is positioned as the fi rst stage of the Group’s drive to promote signifi cant long-term growth centered on the core prescription drug business. Steady progress was made in a number of areas, including the establishment of a global drug development pipeline and the acquisition of a sales network in the US based around Shionogi Pharma, Inc. (formerly Shionogi Pharma, Inc.), which has helped form a bridgehead for future global business development. Crestor®, the Group’s mainstay product for treating hypercholesterolemia, generated further growth. The Group also faced a number of headwinds in fi scal 2009, which resulted in fi nancial performance falling short of the targets set for the second medium-term business plan’s fi nal year. In April 2010, the Group embarked on the third medium-term business plan, a fi ve-year plan beginning in fi scal 2010 that targets further signifi cant growth based on the progress made and issues that arose during the second medium-term business plan.
Contract manufacturing subsidiary Bushu Pharmaceuticals Ltd. was sold in March 2010. This divestment was aimed at concentrating Group resources in pharmaceutical operations while also allowing Bushu Pharmaceuticals scope to develop in the future.
Net SalesNet sales of ¥278,503 million were 22.4% ahead of the previous year. The mainstay prescription drugs Crestor® and Irbetan®, a treatment for hypertension, both posted signifi cant increases in sales. Other products contributing to sales growth included the topical acne treatment Differin® and the idiopathic pulmonary fi brosis treatment Pirespa®. Offsetting this, sales of antibiotics and other seasonal drugs were affected by a contraction in the market for winter medications more than normal. Overall, the Group’s sales of prescription drugs were slightly less than in fi scal 2008. However, royalty income rose substantially, refl ecting higher overseas sales of Crestor® by AstraZeneca. Shionogi Pharma, Inc. also made its fi rst full-year contribution to sales.
Gross Profi tThe cost of sales increased by ¥5,335 million in year-on-year terms to ¥76,264 million. The cost of sales ratio declined from 31.2% to 27.4%, refl ecting increased royalty income and the sales contribution by Shionogi Pharma, Inc. As a result, gross profi t increased 29.2% to ¥202,239 million.
Operating Expenses and Operating IncomeSelling, general and administrative (SG&A) expenses increased 20.3% to ¥149,801 million and the ratio of SG&A expenses to net sales fell from 54.7% to 53.8%. Operating income grew 63.8% to ¥52,438 million. This largely refl ected the SG&A expenses of ¥9,669 million that the Group had booked in fi scal 2008 under business combination accounting rules in recognition of intellectual property and in-process R&D expenses arising from the acquisition of Shionogi Pharma, Inc.
300
100
0
200
2005 2006 2007 2008
Net Sales(Billions of yen)
2009 (FY)
196.4 199.8214.3
227.5
278.5
Operating Income
60(Billions of yen)
20
0
40
2005 2006 2007 2008 2009 (FY)
29.2 28.9
40.4
32.0
52.4
Management’s Discussion and Analysis
42

Other Income (Expenses)Net other income amounted to ¥6,103 million in fi scal 2009, compared with net other expenses of ¥1,229 million recorded in the previous year. Net interest and dividend income (after the deduction of interest expense) amounted to ¥66 million, compared with ¥1,634 million in the previous year. In other expenses, gains derived from the sale of Bushu Pharmaceuticals Ltd. and the exchange of shares in affi liates were offset by losses on valuation of investment securities and losses due to asset impairments.
Income before Income Taxes and Minority Interests and Net incomeIncome before income taxes and minority interests rose 90.2% to ¥58,541 million. Including income tax adjustments, income taxes rose 31.9% to ¥19,900 million. Net income increased 146.6% on a year-on-year basis to ¥38,626 million. The net income ratio was 13.9%, compared with 6.9% in the previous year. Net income per share increased from ¥46.75 to ¥115.33.
Segment InformationPerformance by Geographic Segment
JapanNet sales in Japan were ¥238,191 million, an increase of 10.3% compared with fi scal 2008. Operating income rose 31.1% to ¥52,973 million.
North AmericaNet sales and operating income in North America were ¥38,642 million and ¥2,913 million, respectively. Net sales were approximately four times the fi gure recorded in the previous year, mainly because Shionogi Pharma, Inc. only made a three-month contribution to sales in fi scal 2008 following its acquisition. The segment recorded an operating loss in fi scal 2008 due to the recognition of ¥9,669 million in in-process R&D expenses associated with the acquisition of the US operations.
OtherThis segment primarily represents operations in Asia. Net sales fell 4.7% to ¥1,670 million and operating income declined 32.0% to ¥314 million.
Overseas SalesRefl ecting increased royalty income and the full-year sales contribution by Shionogi Pharma, Inc., the ratio of overseas sales to consolidated net sales was 35.8% in fi scal 2009, an increase of 11.9 percentage points compared with the prior year. Overseas sales increased to ¥99,842 million.
Research and Development ExpensesIn Japan, Shionogi received manufacturing and marketing approval in January 2010 for Rapiacta®, an antiviral agent for infl uenza. The product was launched in the same month amid heightened social concerns about infl uenza in this fi eld. Rapiacta® is expected to make a signifi cant contribution to the future treatment of infl uenza. Shionogi also received manufacturing and marketing approval for the antidepressant Cymbalta® in January 2010. This product was launched in April 2010. Shionogi also made a submission for Japanese regulatory approval of Cymbalta® for the additional indication of diabetic neuropathic pain in September 2009. Including the overseas development pipeline, Shionogi is currently developing drugs to treat obesity, HIV/AIDS, thrombocytopenia and atopic dermatitis, among others. R&D facility investments during fi scal 2009 included the start of construction work on a newly planned research facility in Toyonaka, Osaka. On completion in April 2011, the new building will consolidate a number of research functions. This is expected to boost R&D productivity and further enhance the Group’s drug discovery capabilities. As a result of these activities, overall Group R&D expenses totaled ¥51,808 million. This fi gure represented 18.6% of net sales.
40
30
10
0
20
2005 2006 2007 2008
120
100
20
0
60
40
80
2009
22.7 66.5554.61
74.21
46.75
115.33
18.6
25.1
15.7
38.6Net Income (Left scale)Net Income per Share (Right scale)
Net Income and Net Income per Share(Billions of yen) (Yen)
(FY)
20
0
40
2005 2006 2007 2008
R&D Expenses
60
2009
32.337.5
40.3
52.8 51.8
(Billions of yen)
(FY)
Financial SectionCorporate Inform
ationM
anagement
Shionogi’s Business Activities
Shionogi’s CSR Activities
Shionogi’s Environmental
Activities
Corporate Governance
43SHIONOGI & CO., LTD. Annual Report 2010

200
0
400
2005 2006 2007 2008
Total Assets
600(Billions of yen)
2009
427.7 429.6 413.7
501.9540.8
(FY)
Cash FlowsNet cash provided by operating activities of ¥52,902 million represented an increase of ¥23,782 million in year-on-year terms. Major factors in the growth of operating cash fl ow included a signifi cant increase in income before income taxes and minority interests and higher non-cash items such as depreciation and amortization of goodwill. Net cash used in investing activities amounted to ¥826 million. The cash proceeds from the sale of Bushu Pharmaceuticals were offset by facility investments and other factors. Net cash used in fi nancing activities equaled ¥4,979 million. Debt repayments, dividend payments and other items offset funds raised via corporate bond issuance. The balance of cash and cash equivalents at the fi scal year-end was ¥97,663 million, an increase of ¥46,127 million compared with the previous year-end.
Capital InvestmentsCapital investments by the Shionogi Group in fi scal 2009 totaled ¥12.5 billion. The Group made proactive investments mainly in new research facilities and manufacturing facility upgrades, including the construction of a new research building.
Assets, Liabilities and Net AssetsAs of March 31, 2010, total assets equaled ¥540,762 million, an increase of ¥38,908 million from a year earlier. Current assets increased by ¥47,939 million to ¥250,664 million; property, plant and equipment declined by ¥9,363 million to ¥62,448 million; and investments and other assets increased by ¥333 million to ¥227,650 million. Within current assets, cash and cash equivalents increased by ¥46,127 million. Within investments and other assets, investments in securities increased by ¥3,123 million and prepaid pension costs declined by ¥1,561 million.
The growth in cash principally refl ected the receipt of proceeds from the divestment of consolidated subsidiary Bushu Pharmaceuticals. This transaction also resulted in a decline in property, plant and equipment. Total liabilities at the fi scal year-end amounted to ¥198,785 million, an increase of ¥7,026 million compared with a year earlier. Current liabilities decreased by ¥9,974 million to ¥66,830 million, while long-term liabilities increased by ¥17,001 million to ¥131,956 million. Principal factors behind the rise in total liabilities included the issuance of corporate bonds worth ¥30,000 million, which was offset by declines in short-term bank loans and long-term debt of ¥10,000 million and ¥14,000 million, respectively. Net assets totaled ¥341,976 million at the fi scal year-end, an increase of ¥31,882 million compared with a year earlier. Total shareholders’ equity, net unrealized holding gain on securities and translation adjustments all increased compared with a year earlier, by ¥27,828 million, ¥2,154 million and ¥1,887 million, respectively. In addition to higher retained earnings, the principal factors behind the increase in net assets included an increase in net unrealized holding gain on securities due to higher share prices and an increase in translation adjustments that refl ected a weaker yen. Refl ecting these various factors, the ratio of total net assets to total assets increased from 61.7% to 63.2%.
DividendsShionogi aims to raise dividends steadily in line with performance while proactively making business investments to increase corporate value from a medium-to-long-term perspective. The Group has adopted a consolidated dividend payout ratio of 35% as a performance target going forward. Shionogi’s Articles of Incorporation stipulate twice-yearly distributions of retained earnings as interim and fi nal dividends wherever possible. The General Meeting of Shareholders must approve the fi nal dividend, while the Board of Directors approves any interim dividend. Consolidated net income in fi scal 2009 included exceptional profi t items. The gains arising from the exchange of shares between Omwell Co., Ltd. and Toho Holdings Co., Ltd., which were booked in line with Japanese business combination accounting rules, were excluded for the purposes of determining the underlying level of profi ts in fi scal 2009. Taking this and future earnings prospects into consideration, the fi nal dividend was set at ¥18 per share. Including the interim dividend, total dividends in fi scal 2009 were ¥36 per share. The consolidated dividend payout ratio for the year was 31.2%.
44

Business and Other RisksThe main types of risk that might have a signifi cant impact on the Shionogi Group’s management performance and fi nancial condition are listed below. Forward-looking statements in the text refl ect the Group’s judgment as of March 31, 2010.
① Systemic and Regulatory RiskIn the pharmaceutical industry, revisions to the National Health Insurance (NHI) system are being considered, including revisions to the NHI drug price system. These trends could affect the results of the Shionogi Group. In addition, an increase in the strictness of Japanese or overseas regulations concerning such items as the development and manufacture of pharmaceuticals could present the Group with additional expenses or make it diffi cult for its products to comply with regulations, and there is a possibility that this might have an impact on the Group’s performance.
② Risk of Adverse Drug ReactionsPharmaceuticals entail the risk of unanticipated adverse drug reactions that could involve termination of sales, product recalls, and other outcomes that could affect the results of the Shionogi Group.
③ Pharmaceutical R&D RiskPharmaceutical R&D requires substantial commitment of resources and time. In addition, new drugs are subject to numerous uncertainties prior to the start of actual sales.
④ Intellectual Property RiskThe Shionogi Group uses patents as intellectual property to protect the pharmaceuticals it discovers and generate income from them. However, the various types of intellectual property may be unable to provide adequate protection, or may infringe on the intellectual property of third parties.
⑤ Risk of Dependence on Certain ProductsThe Shionogi Group obtains approximately 35% of its product sales and royalty income from two of its products, Crestor® and Flomox® (as of fi scal 2009). If the incidence of an unexpected factor were to cause a drop in or the discontinuation of the sales of one of these products, there is a possibility that this might have an impact on the Group’s performance.
⑥ Intensifi cation of Global CompetitionGlobal competition involving non-Japanese companies in the prescription drug industry’s R&D and sales operations is becoming increasingly intense.
⑦ Risk of Alliances with Other CompaniesThe Shionogi Group engages in diverse forms of alliances with other companies with respect to joint research, joint development, joint marketing, and other activities, including cooperation in such forms as cooperative research projects, cooperative development projects, the in-licensing and out-licensing of technologies, and cooperative marketing projects. If some situation were to change or eliminate these cooperative relationships, it might have an impact on the Group’s performance.
⑧ Plant Closure and Shutdown RiskThe sudden occurrence of natural disasters or other unforeseen incidents could dictate the closure or shutdown of plants, which could affect the results of the Shionogi Group.
⑨ Capital Market and Foreign Exchange RiskFluctuations in stock and foreign exchange markets that exceed the projected range could affect the results and fi nancial position of the Shionogi Group.
⑩ Other RisksIn addition to the above-listed risks, the Shionogi Group’s business activities involve the risk of lawsuits, risks related to regulatory and economic factors, and diverse other risks. The above list of risks does not include all the types of risks the Shionogi Group is exposed to.
Financial SectionCorporate Inform
ationM
anagement
Shionogi’s Business Activities
Shionogi’s CSR Activities
Shionogi’s Environmental
Activities
Corporate Governance
45SHIONOGI & CO., LTD. Annual Report 2010
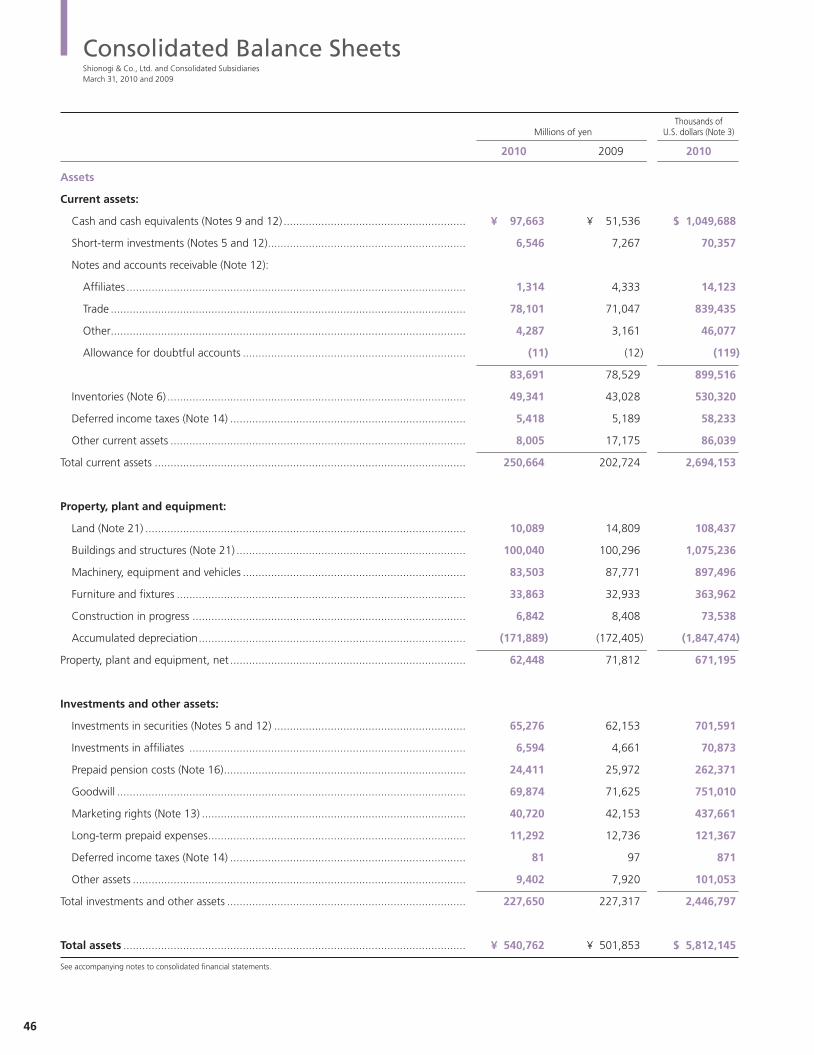
Consolidated Balance Sheets
46
Shionogi & Co., Ltd. and Consolidated SubsidiariesMarch 31, 2010 and 2009
Thousands of Millions of yen U.S. dollars (Note 3)
2010 2009 2010
Assets
Current assets:
Cash and cash equivalents (Notes 9 and 12) .......................................................... ¥ 97,663 ¥ 51,536 $ 1,049,688
Short-term investments (Notes 5 and 12) ............................................................... 6,546 7,267 70,357
Notes and accounts receivable (Note 12):
Affi liates ............................................................................................................ 1,314 4,333 14,123
Trade ................................................................................................................. 78,101 71,047 839,435
Other ................................................................................................................. 4,287 3,161 46,077
Allowance for doubtful accounts ....................................................................... (11) (12) (119)
83,691 78,529 899,516
Inventories (Note 6) ............................................................................................... 49,341 43,028 530,320
Deferred income taxes (Note 14) ........................................................................... 5,418 5,189 58,233
Other current assets .............................................................................................. 8,005 17,175 86,039
Total current assets ................................................................................................... 250,664 202,724 2,694,153
Property, plant and equipment:
Land (Note 21) ...................................................................................................... 10,089 14,809 108,437
Buildings and structures (Note 21) ......................................................................... 100,040 100,296 1,075,236
Machinery, equipment and vehicles ....................................................................... 83,503 87,771 897,496
Furniture and fi xtures ............................................................................................ 33,863 32,933 363,962
Construction in progress ....................................................................................... 6,842 8,408 73,538
Accumulated depreciation ..................................................................................... (171,889) (172,405) (1,847,474)
Property, plant and equipment, net ........................................................................... 62,448 71,812 671,195
Investments and other assets:
Investments in securities (Notes 5 and 12) ............................................................. 65,276 62,153 701,591
Investments in affi liates ........................................................................................ 6,594 4,661 70,873
Prepaid pension costs (Note 16) ............................................................................. 24,411 25,972 262,371
Goodwill ............................................................................................................... 69,874 71,625 751,010
Marketing rights (Note 13) .................................................................................... 40,720 42,153 437,661
Long-term prepaid expenses .................................................................................. 11,292 12,736 121,367
Deferred income taxes (Note 14) ........................................................................... 81 97 871
Other assets .......................................................................................................... 9,402 7,920 101,053
Total investments and other assets ............................................................................ 227,650 227,317 2,446,797
Total assets ............................................................................................................. ¥ 540,762 ¥ 501,853 $ 5,812,145
See accompanying notes to consolidated fi nancial statements.

Financial SectionCorporate Inform
ationM
anagement
Shionogi’s Business Activities
Shionogi’s CSR Activities
Shionogi’s Environmental
Activities
Corporate Governance
47SHIONOGI & CO., LTD. Annual Report 2010
Thousands of Millions of yen U.S. dollars (Note 3)
2010 2009 2010
Liabilities and net assets
Current liabilities:
Notes and accounts payable (Note 12):
Affi liates ............................................................................................................ ¥ 1,699 ¥ 1,728 $ 18,261
Trade ................................................................................................................. 11,706 13,716 125,817
Construction ...................................................................................................... 1,970 2,961 21,174
Short-term bank loans (Note 7) ............................................................................. — 10,000 —
Current portion of long-term debt (Notes 7 and 12) .............................................. 14,000 14,000 150,473
Allowance for employees’ bonuses ........................................................................ 6,473 5,325 69,572
Accrued expenses .................................................................................................. 4,851 10,956 52,139
Accrued income taxes (Note 14) ............................................................................ 13,061 7,929 140,380
Other current liabilities (Notes 8 and 9) .................................................................. 13,070 10,189 140,477
Total current liabilities ............................................................................................... 66,830 76,804 718,293
Long-term liabilities:
Long-term debt (Notes 7 and 12) .......................................................................... 107,000 91,000 1,150,043
Accrued retirement benefi ts for employees (Note 16) ............................................ 8,077 7,793 86,812
Accrued retirement benefi ts for directors and corporate auditors .......................... — 156 —
Deferred income taxes (Note 14) ........................................................................... 15,437 13,999 165,918
Long-term accounts payable – other ...................................................................... 391 891 4,202
Other long-term liabilities ...................................................................................... 1,051 1,116 11,297
Total long-term liabilities ........................................................................................... 131,956 114,955 1,418,272
Contingent liabilities (Note 10)
Net assets:
Shareholders’ equity (Note 11):
Common stock:
Authorized: 1,000,000,000 shares
Issued: 351,136,165 shares in 2010 and 2009 ..................................... 21,280 21,280 228,719
Capital surplus ...................................................................................................... 20,227 20,227 217,401
Retained earnings ................................................................................................. 332,670 304,762 3,575,559
Less treasury stock, at cost ....................................................................................... (19,733) (19,653) (212,092)
Total shareholders’ equity ...................................................................................... 354,444 326,616 3,809,587
Valuation and translation adjustments:
Net unrealized holding gain on securities ........................................................... 10,362 8,208 111,371
Translation adjustments ..................................................................................... (23,302) (25,189) (250,451)
Total valuation and translation adjustments ........................................................... (12,940) (16,981) (139,080)
Minority interests .................................................................................................. 472 459 5,073
Total net assets (Note 24) .......................................................................................... 341,976 310,094 3,675,580
Total liabilities and net assets ............................................................................... ¥540,762 ¥501,853 $5,812,145
See accompanying notes to consolidated fi nancial statements.

Consolidated Statements of Income
48
Thousands of Millions of yen U.S. dollars (Note 3)
2010 2009 2010
Net sales (Notes 21 and 26) ..................................................................................... ¥278,503 ¥227,512 $2,993,368
Cost of sales (Notes 17 and 21) ................................................................................. 76,264 70,929 819,690
Gross profi t ....................................................................................................... 202,239 156,583 2,173,678
Selling, general and administrative expenses (Note 18) ...................................... 149,801 124,568 1,610,071
Operating income (Note 26) .............................................................................. 52,438 32,015 563,607
Other income (expenses):
Interest and dividend income ................................................................................. 1,609 2,336 17,294
Interest expense .................................................................................................... (1,675) (702) (18,003)
Loss on disposal of property, plant and equipment ................................................ (251) (427) (2,698)
Loss on revaluation of inventories .......................................................................... — (89) —
Gain on sale of business ........................................................................................ 5,351 — 57,513
Gain on exchange from business combination ....................................................... 4,900 — 52,666
Gain on sales of investments in securities (Note 5) ................................................. — 213 —
Impairment loss on devaluation of investments in securities (Note 5) ..................... (1,943) — (20,884)
Impairment loss on fi xed assets (Note 13) .............................................................. (200) — (2,150)
Special contract expenses (Note 19) ....................................................................... — (700) —
Special retirement expenses ................................................................................... — (363) —
Casualty losses (Note 20) ....................................................................................... — (254) —
Loss on sales of investments in securities (Note 5) .................................................. — (25) —
Other, net ............................................................................................................. (1,688) (1,218) (18,143)
6,103 (1,229) 65,595
Income before income taxes and minority interests ............................................ 58,541 30,786 629,202
Income taxes (Note 14):
Current ................................................................................................................. 21,146 14,718 227,278
Deferred ................................................................................................................ (1,246) 369 (13,392)
19,900 15,087 213,886
Income before minority interests ........................................................................ 38,641 15,699 415,316
Minority interests .................................................................................................. 15 38 161
Net income (Note 24) ....................................................................................... ¥ 38,626 ¥ 15,661 $ 415,155
See accompanying notes to consolidated fi nancial statements.
Shionogi & Co., Ltd. and Consolidated SubsidiariesYears ended March 31, 2010 and 2009

Consolidated Statements of Changes in Net Assets
Financial SectionCorporate Inform
ationM
anagement
Shionogi’s Business Activities
Shionogi’s CSR Activities
Shionogi’s Environmental
Activities
Corporate Governance
49SHIONOGI & CO., LTD. Annual Report 2010
Millions of yen
Treasury Total Net unrealized Total valuation Common Capital Retained stock, shareholders’ holding gain Translation and translation Minority Total net stock surplus earnings at cost equity on securities adjustments adjustments interests assets
Balance at March 31, 2008 ....... ¥21,280 ¥20,227 ¥297,812 ¥ (19,281) ¥320,038 ¥ 22,068 ¥ (178) ¥ 21,890 ¥308 ¥342,236
Net income........................ — — 15,661 — 15,661 — — — — 15,661
Dividends .......................... — — (8,711) — (8,711) — — — — (8,711)
Purchases of treasury stock....... — — — (372) (372) — — — — (372)
Other changes ................... — — — — — (13,860) (25,011) (38,871) 151 (38,720)
Balance at March 31, 2009 ....... 21,280 20,227 304,762 (19,653) 326,616 8,208 (25,189) (16,981) 459 310,094
Net income........................ — — 38,626 — 38,626 — — — — 38,626
Dividends .......................... — — (10,718) — (10,718) — — — — (10,718)
Purchases of treasury stock....... — — — (80) (80) — — — — (80)
Other changes ................... — — — — — 2,154 1,887 4,041 13 4,054
Balance at March 31, 2010 ....... ¥21,280 ¥20,227 ¥332,670 ¥(19,733) ¥354,444 ¥ 10,362 ¥(23,302) ¥(12,940) ¥472 ¥341,976
Thousands of dollars (Note 3)
Treasury Total Net unrealized Total valuation Common Capital Retained stock, shareholders’ holding gain Translation and translation Minority Total net stock surplus earnings at cost equity on securities adjustments adjustments interests assets
Balance at March 31, 2009 ....... $228,719 $ 217,401 $ 3,275,602 $ (211,232) $ 3,510,490 $ 88,220 $ (270,733) $ (182,513) $4,933 $ 3,332,910
Net income........................ — — 415,155 — 415,155 — — — — 415,155
Dividends .......................... — — (115,198) — (115,198) — — — — (115,198)
Purchases of treasury stock....... — — — (860) (860) — — — — (860)
Other changes ................... — — — — — 23,151 20,282 43,433 140 43,573
Balance at March 31, 2010 ....... $228,719 $217,401 $3,575,559 $(212,092) $3,809,587 $111,371 $(250,451) $(139,080) $5,073 $3,675,580
See accompanying notes to consolidated fi nancial statements.
Shionogi & Co., Ltd. and Consolidated SubsidiariesYears ended March 31, 2010 and 2009

Consolidated Statements of Cash FlowsShionogi & Co., Ltd. and Consolidated SubsidiariesYears ended March 31, 2010 and 2009
50
Thousands of Millions of yen U.S. dollars (Note 3)
2010 2009 2010
Operating activitiesIncome before income taxes and minority interests ................................................... ¥ 58,541 ¥ 30,786 $ 629,202Adjustments for:
Depreciation and amortization .............................................................................. 18,048 13,468 193,981Impairment loss on fi xed assets ............................................................................. 200 — 2,150Amortization of goodwill ....................................................................................... 3,731 907 40,101Gain on sale of business ........................................................................................ (5,351) — (57,513)Impairment loss on devaluation of investment securities ........................................ 1,943 — 20,884Write-off of purchased in-process research and development costs ........................ — 9,669 —Gain on exchange from business combination ....................................................... (4,900) (188) (52,666)Increase (decrease) in accrued retirement benefi ts ................................................. 1,690 (2,802) 18,164Interest and dividend income ................................................................................. (1,609) (2,336) (17,294)Interest expense .................................................................................................... 1,675 702 18,003Other .................................................................................................................... 1,438 938 15,456Changes in operating assets and liabilities:
Notes and accounts receivable ........................................................................... (4,740) (2,419) (50,946)Inventories ......................................................................................................... (7,866) (7,361) (84,544)Other current assets ........................................................................................... 5,614 (2,756) 60,341Notes and accounts payable .............................................................................. (2,096) 1,393 (22,528)Accrued expenses .............................................................................................. (6,418) (3,823) (68,981)Other current liabilities ....................................................................................... 6,607 3,867 71,012
Subtotal ......................................................................................................... 66,507 40,045 714,822Interest and dividends received.................................................................................. 1,646 2,386 17,691Interest paid .............................................................................................................. (1,513) (780) (16,262)Income taxes paid ..................................................................................................... (13,738) (12,531) (147,657)Net cash provided by operating activities ................................................................... 52,902 29,120 568,594
Investing activitiesIncrease in short-term investments ............................................................................ (5,233) (4,233) (56,245)Proceeds from sales and redemption of short-term investments ................................ 9,647 8,094 103,687Increase in investments in securities .......................................................................... (4,395) (5,583) (47,238)Proceeds from sales and redemption of investments in securities ............................... 5,000 18,345 53,740Purchases of property, plant and equipment .............................................................. (13,156) (11,200) (141,402)Increase in investment in an affi liate .......................................................................... (3,203) (1,921) (34,426)Acquisition of investment in subsidiaries resulting in change in scope of
consolidation (Note 23) ......................................................................................... (2,506) (146,767) (26,935)Proceeds from sales of investments in a subsidiary resulting in change
in scope of consolidation (Note 23) ....................................................................... 8,093 — 86,984Other ........................................................................................................................ 4,927 (5,791) 52,957Net cash used in investing activities ........................................................................... (826) (149,056) (8,878)
Financing activities(Decrease) increase in short-term bank loans, net ...................................................... (10,000) 10,000 (107,481)Proceeds from long-term debt................................................................................... 988 105,000 10,619Repayment of long-term debt ................................................................................... (14,000) — (150,473)Proceeds from bond issuance .................................................................................... 30,000 — 322,442Purchases of treasury stock ....................................................................................... (80) (372) (860)Repayment of installment accounts payable .............................................................. (1,032) (746) (11,092)Cash dividends paid .................................................................................................. (10,702) (8,702) (115,026)Issuance of shares of common stock to minority shareholders of
consolidated subsidiaries ....................................................................................... — 116 —Other ........................................................................................................................ (153) (2) (1,644)Net cash (used in) provided by fi nancing activities ..................................................... (4,979) 105,294 (53,515)
Effect of exchange rate changes on cash and cash equivalents ........................ (970) (1,431) (10,425)Net increase (decrease) in cash and cash equivalents ......................................... 46,127 (16,073) 495,776Cash and cash equivalents at beginning of year ................................................. 51,536 67,609 553,912Cash and cash equivalents at end of year ........................................................... ¥ 97,663 ¥ 51,536 $1,049,688See accompanying notes to consolidated fi nancial statements.

Notes to Consolidated Financial StatementsShionogi & Co., Ltd. and Consolidated Subsidiaries
Financial SectionCorporate Inform
ationM
anagement
Shionogi’s Business Activities
Shionogi’s CSR Activities
Shionogi’s Environmental
Activities
Corporate Governance
51SHIONOGI & CO., LTD. Annual Report 2010
1. Basis of Preparation The accompanying consolidated fi nancial statements of Shionogi & Co., Ltd. (the “Company”) and consolidated subsidiaries are prepared on the basis of accounting principles generally accepted in Japan, which are different in certain respects as to the application and disclosure requirements of International Financial Reporting Standards, and are compiled from the consolidated fi nancial statements prepared by the Company as required by the Financial Instruments and Exchange Act of Japan. In addition, the notes to the consolidated fi nancial statements include certain information which is not required under accounting principles generally accepted in Japan but is presented herein as additional information. Certain reclassifi cations of previously reported amounts have been made to conform the consolidated fi nancial statements for the year ended March 31, 2009 to the 2010 presentation. Such reclassifi cations had no effect on consolidated net income or net assets.
2. Summary of Signifi cant Accounting Policies(a) Principles of consolidation and accounting for
investments in affi liates The accompanying consolidated fi nancial statements include the accounts of the Company and all companies controlled directly or indirectly by the Company. Companies over which the Company exercises signifi cant infl uence in terms of their operating and fi nancial policies have been included in the consolidated fi nancial statements on an equity basis. The Company has applied the equity method to its investment in one affi liate and two affi liates for the years ended March 31, 2010 and 2009, respectively. Investments in affi liates not accounted for by the equity method are carried at cost. All signifi cant intercompany accounts and transactions have been eliminated in consolidation. Most of the overseas consolidated subsidiaries close their accounts on December 31 and one closes its accounts on September 30. These year ends differ from that of the Company. The company whose year end date is September 30 prepares the fi nancial statements as of and for the year ended December 31 solely for consolidation purposes. As a result, adjustments have been made for any signifi cant intercompany transactions which took place during the period from January 1 to March 31.
(b) Foreign currency translation All monetary assets and liabilities denominated in foreign currencies are translated into yen at the rates of exchange in effect at the balance sheet date and the gain or loss on each translation is credited or charged to income. Revenue and expense items arising from transactions denominated in foreign currencies are generally translated into Japanese yen at the rates of exchange in effect at the
respective transaction dates. Gain or loss on foreign exchange is credited or charged to income in the period in which such gain or loss is recognized for fi nancial reporting purposes. Assets and liabilities of the overseas subsidiaries are translated into yen at the rates of exchange in effect at the balance sheet date. Revenues and expenses of the overseas subsidiaries are translated into yen at the average exchange rates. The components of net assets excluding minority interests are translated at their historical exchange rates. Adjustments resulting from translating the foreign currency fi nancial statements are not included in the determination of net income and are reported as “Translation adjustments” in net assets in the consolidated balance sheets.
Change in accounting policy Up to the year ended March 31, 2009, revenues and expenses of the overseas subsidiaries were translated into yen at the rates of exchange in effect at the balance sheet dates of the overseas subsidiaries. Effective the year ended March 31, 2010, the Company has changed the translation method of revenues and expenses of overseas subsidiaries using the average exchange rates. This change was made in order to refl ect the substantive results of the transactions of the overseas subsidiaries more accurately in the consolidated statements of income by mitigating unusual effects in the case of rapid changes of foreign currency exchange rates at the balance sheet date. As a result of this change, sales increased by ¥632 million ($6,793 thousand), operating income decreased by ¥67 million ($720 thousand) and income before income taxes and minority interests increased by ¥9 million ($97 thousand) from the corresponding amounts which would have been recorded under the previous method.
(c) Cash and cash equivalents Cash and cash equivalents include cash on hand and in banks and other highly liquid investments with maturities of three months or less when purchased.
(d) Short-term investments and investments in securities Securities are classifi ed into three categories: trading securities, held-to-maturity debt securities or other securities. Trading securities, consisting of debt and marketable equity securities are stated at fair value. Gain and loss, both realized and unrealized, are charged to income. Held-to-maturity debt securities are stated at amortized cost. Marketable securities classifi ed as other securities are carried at fair value with any changes in unrealized holding gain or loss, net of the applicable income taxes, reported as a separate component of net assets. Non-marketable securities classifi ed as other securities are carried at cost determined by the moving average method. Investments in investment partnerships are stated at the amount of net assets attributable to the ownership percentage of the Company.

52
(e) Inventories Inventories are principally stated at lower of cost, determined by the average method, or net selling value.
Change in accounting policy Effective April 1, 2008, the Company and its domestic consolidated subsidiaries adopted “Accounting Standard for Measurement of Inventories” (Accounting Standards Board of Japan (“ASBJ”) Statement No. 9 issued on July 5, 2006). This standard requires that inventories held for sale in the ordinary course of business be measured at the lower of cost or net selling value, which is defi ned as the selling price less additional estimated manufacturing costs and estimated direct selling expenses. The replacement cost may be used in place of the net selling value, if appropriate. As a result of this change, operating income decreased by ¥316 million and income before income taxes decreased by ¥135 million for the year ended March 31, 2009 from the corresponding amounts which would have been recorded under the previous method. (f) Property, plant and equipment (other than leased
assets)Property, plant and equipment are stated at cost. Depreciation of buildings (except for structures attached to the buildings) acquired on or subsequent to April 1, 1998 is calculated principally by the straight-line method over the estimated useful lives of the respective assets. Depreciation of other property, plant and equipment is calculated principally by the declining-balance method over the estimated useful lives of the respective assets. The useful lives of property, plant and equipment are summarized as follows:
Buildings and structures 2 to 60 yearsMachinery, equipment and vehicles 2 to 17 years
Signifi cant renewals and additions are capitalized at cost. Maintenance and repairs are charged to income as incurred.
Supplemental information Effective the year ended March 31, 2009, the Company and its domestic consolidated subsidiaries changed the useful lives of machinery and equipment as allowed under the revisions of the Corporation Tax Law. The effect of this change was to decrease depreciation expense by ¥423 million and increase operating income and income before income taxes by the same amount for the year ended March 31, 2009 from the corresponding amounts which would have been recorded under the previous method.
(g) Intangible assets (other than leased assets) Intangible assets are amortized by the straight-line method.
(h) Leases Finance lease transactions that do not transfer ownership are depreciated to a nil residual value over the period of the lease contract using the straight-line method. The fi nance lease transactions entered into on or before March 31, 2008 that do not transfer ownership continue to be accounted for as operating leases.
Change in accounting policy Effective the year ended March 31, 2009, the Company and its domestic consolidated subsidiaries applied “Accounting Standard for Lease Transactions” (ASBJ Statement No.13 issued on March 30, 2007) and “Guidance on Accounting Standard for Lease Transactions” (ASBJ Guidance No.16 issued on March 30, 2007). Under this accounting standard, fi nance lease transactions that do not transfer ownership, which had previously been accounted for as operating leases, are capitalized and recognized as fi xed assets. As a result, leased assets of ¥3 million, which are included in property, plant and equipment, were recognized. There was no impact on operating income and income before income taxes and minority interests.
(i) Goodwill Goodwill is amortized over 20 years by the straight-line method.
(j) Research and development expenses and computer software
Research and development expenses are charged to income when incurred. Expenditures relating to computer software developed for internal use are charged to income as incurred unless these are deemed to contribute to the generation of future income or cost savings. Such expenditures are capitalized as assets and amortized by the straight-line method over their respective estimated useful lives, generally a period of 5 years.
(k) Income taxes Income taxes are calculated based on taxable income and charged to income on an accrual basis. Certain temporary differences exist between taxable income and income reported for fi nancial statement purposes which enter into the determination of taxable income in a different period. The Company has recognized the tax effect of such temporary differences in the accompanying consolidated fi nancial statements. (l) Allowance for doubtful accounts The Company and its consolidated subsidiaries provide an allowance for doubtful accounts at an amount calculated based on their historical experience of bad debts on ordinary receivables plus an additional estimate of probable specifi c bad debts from customers experiencing fi nancial diffi culties.

Financial SectionCorporate Inform
ationM
anagement
Shionogi’s Business Activities
Shionogi’s CSR Activities
Shionogi’s Environmental
Activities
Corporate Governance
53SHIONOGI & CO., LTD. Annual Report 2010
(m) Allowance for employees’ bonuses Allowance for employees’ bonuses is provided at the estimated amount of bonuses to be paid to the employees in the following year.
(n) Retirement benefi ts The Company has a defi ned benefi t pension plan known as a “cash balance plan,” which allows pension benefi ts to fl uctuate in accordance with market interest rates, and also has a lump-sum payment plan and a defi ned contribution pension plan. Certain domestic consolidated subsidiaries have lump-sum payment plans and defi ned contribution pension plans. In addition, certain consolidated subsidiaries have defi ned contribution pension plans. Accrued retirement benefi ts are provided based on the amount of the projected benefi t obligation reduced by the pension plan assets at fair value at the year end. Prior service cost is amortized by the straight-line method over a period of 10 years, which is within the estimated average remaining years of service of the eligible employees. Actuarial gain or loss is amortized each year following the year in which the gain or loss is recognized, principally by the straight-line method over a period of 10 years, which falls within the estimated average remaining years of service of the eligible employees.
Supplemental information The retirement benefi ts system for directors and corporate auditors was abolished in June 2004 and the shareholders’ meeting of the Company held on June 25, 2009 approved a resolution to pay the remaining balance of retirement benefi ts to directors and corporate auditors. As a result, accrued retirement benefi ts for directors and corporate auditors of ¥110 million ($1,182 thousand) was reclassifi ed to other long-term liabilities at March 31, 2010.
Change in accounting policy Effective from the year ended March 31, 2010, the Company has adopted “Partial Amendments to Accounting Standard for Retirement Benefi ts” (Part 3) (ASBJ Statement No. 19, July 31, 2008). The adoption of this accounting standard had no effect on operating income or income before income taxes and minority interest. In addition, the adoption of this accounting standard had no effect on the unrecognized actuarial gain or loss.
(o) Hedge accounting The Company utilizes derivative transactions for mitigating the fl uctuation risks of foreign currency assets and liabilities and interest rates of loans. Hedging instruments are forward foreign currency exchange contracts and interest rate swap agreements. Hedged items are foreign currency assets and liabilities and interest rates on loans from fi nancial institutions. Gain or loss on derivatives positions designated as hedges is deferred until the loss or gain on the respective underlying hedged items is recognized. Interest-rate swaps which meet certain
conditions are accounted for as if the interest rates applied to the swaps had originally applied to the underlying debt. Forward foreign exchange contracts which meet certain criteria are accounted for by the allocation method, which requires that recognized foreign currency receivables or payables be translated at the corresponding contract rates.
(p) Distribution of retained earnings Under the Corporation Law of Japan, the distribution of retained earnings with respect to a given fi nancial period is made by resolution of the shareholders at a general meeting held subsequent to the close of the fi nancial period. The accounts for the period do not refl ect such distributions. (Refer to Note 29.)
3. U.S. Dollar Amounts The translation of yen amounts into U.S. dollar amounts is included solely for convenience, as a matter of arithmetic computation only, at ¥93.04 = U.S.$1.00, the approximate rate of exchange in effect on March 31, 2010. This translation should not be construed as a representation that yen have been, could have been, or could in the future be, converted into U.S. dollars at the above or any other rate.
4. Changes in Accounting Policies(a) Application of accounting standards for business
combinations Effective the year ended March 31, 2010, the Company has applied the following revised accounting standards for business combinations and business divestitures: “Accounting Standard for Business Combinations” (ASBJ Statement No. 21, issued on December 26, 2008), “Accounting Standard for Consolidated Financial Statements” (ASBJ Statement No. 22, issued on December 26, 2008), “Partial Amendments to Accounting Standard for Research and Development Costs” (ASBJ Statement No. 23, issued on December 26, 2008), “Accounting Standard for Business Divestitures” (ASBJ Statement No. 7, issued on December 26, 2008), “Accounting Standard for Equity Method of Accounting for Investments” (ASBJ Statement No. 16, issued on December 26, 2008), and “Guidance on Accounting Standard for Business Combinations and Accounting Standard for Business Divestitures” (ASBJ Guidance No. 10, issued on December 26, 2008).
(b) Accounting treatment of overseas subsidiaries Effective the year ended March 31, 2009, the Company and its consolidated subsidiaries applied “Practical Solution on Unifi cation of Accounting Policies Applied to Foreign Subsidiaries for the Consolidated Financial Statements” (ASBJ Practical Issues Task Force (PITF) No.18, May 17, 2006) and made necessary adjustments in the consolidation process. The effect of this change was to decrease operating income and income before income taxes by ¥906 million for the year ended March 31, 2009 from the corresponding amounts which would have been recorded under the previous method.
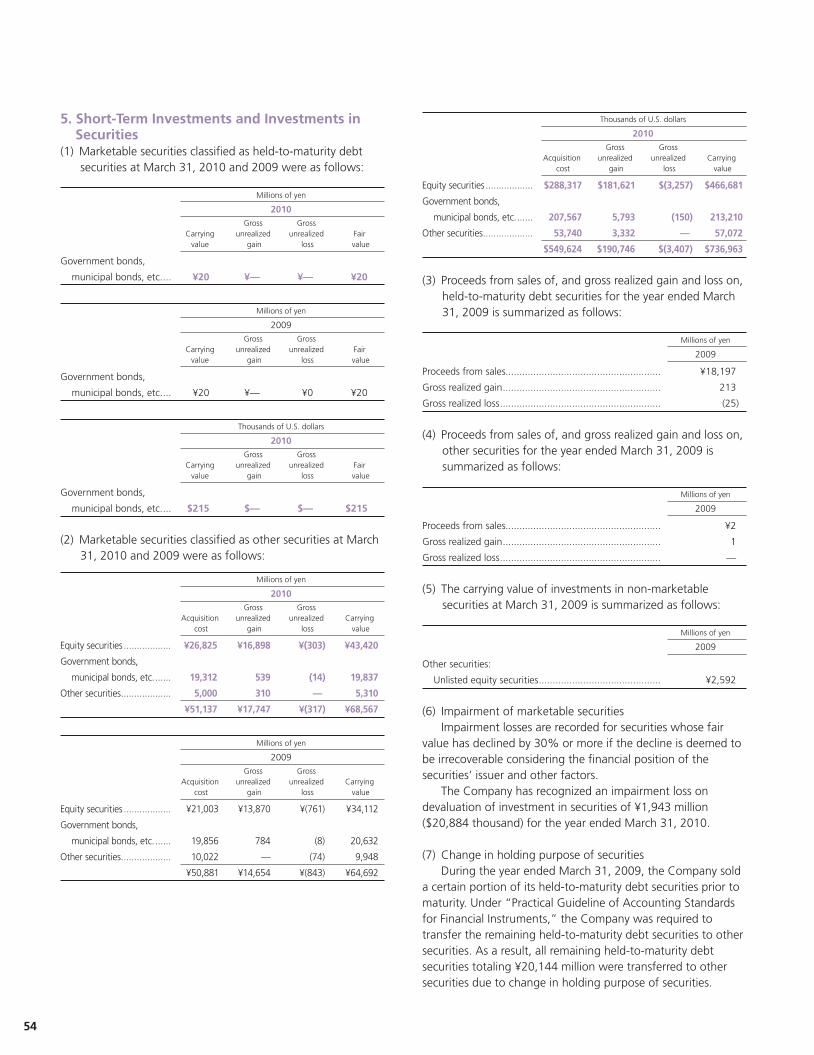
54
5. Short-Term Investments and Investments in Securities
(1) Marketable securities classifi ed as held-to-maturity debt securities at March 31, 2010 and 2009 were as follows:
Millions of yen
2010 Gross Gross Carrying unrealized unrealized Fair value gain loss value
Government bonds,
municipal bonds, etc. ... ¥20 ¥— ¥— ¥20
Millions of yen
2009 Gross Gross Carrying unrealized unrealized Fair value gain loss value
Government bonds,
municipal bonds, etc. ... ¥20 ¥— ¥0 ¥20
Thousands of U.S. dollars
2010 Gross Gross Carrying unrealized unrealized Fair value gain loss value
Government bonds,
municipal bonds, etc. ... $215 $— $— $215
(2) Marketable securities classifi ed as other securities at March 31, 2010 and 2009 were as follows:
Millions of yen
2010 Gross Gross Acquisition unrealized unrealized Carrying cost gain loss value
Equity securities .................. ¥26,825 ¥16,898 ¥(303) ¥43,420
Government bonds,
municipal bonds, etc. ...... 19,312 539 (14) 19,837
Other securities ................... 5,000 310 — 5,310
¥51,137 ¥17,747 ¥(317) ¥68,567
Millions of yen
2009 Gross Gross Acquisition unrealized unrealized Carrying cost gain loss value
Equity securities .................. ¥21,003 ¥13,870 ¥(761) ¥34,112
Government bonds,
municipal bonds, etc. ...... 19,856 784 (8) 20,632
Other securities ................... 10,022 — (74) 9,948
¥50,881 ¥14,654 ¥(843) ¥64,692
Thousands of U.S. dollars
2010 Gross Gross Acquisition unrealized unrealized Carrying cost gain loss value
Equity securities .................. $288,317 $181,621 $(3,257) $466,681
Government bonds,
municipal bonds, etc. ...... 207,567 5,793 (150) 213,210
Other securities ................... 53,740 3,332 — 57,072
$549,624 $190,746 $(3,407) $736,963
(3) Proceeds from sales of, and gross realized gain and loss on, held-to-maturity debt securities for the year ended March 31, 2009 is summarized as follows:
Millions of yen
2009
Proceeds from sales........................................................ ¥18,197
Gross realized gain ......................................................... 213
Gross realized loss .......................................................... (25)
(4) Proceeds from sales of, and gross realized gain and loss on, other securities for the year ended March 31, 2009 is summarized as follows:
Millions of yen
2009
Proceeds from sales........................................................ ¥2
Gross realized gain ......................................................... 1
Gross realized loss .......................................................... —
(5) The carrying value of investments in non-marketable securities at March 31, 2009 is summarized as follows:
Millions of yen
2009
Other securities:
Unlisted equity securities ............................................ ¥2,592
(6) Impairment of marketable securities Impairment losses are recorded for securities whose fair value has declined by 30% or more if the decline is deemed to be irrecoverable considering the fi nancial position of the securities’ issuer and other factors. The Company has recognized an impairment loss on devaluation of investment in securities of ¥1,943 million ($20,884 thousand) for the year ended March 31, 2010.
(7) Change in holding purpose of securities During the year ended March 31, 2009, the Company sold a certain portion of its held-to-maturity debt securities prior to maturity. Under “Practical Guideline of Accounting Standards for Financial Instruments,” the Company was required to transfer the remaining held-to-maturity debt securities to other securities. As a result, all remaining held-to-maturity debt securities totaling ¥20,144 million were transferred to other securities due to change in holding purpose of securities.
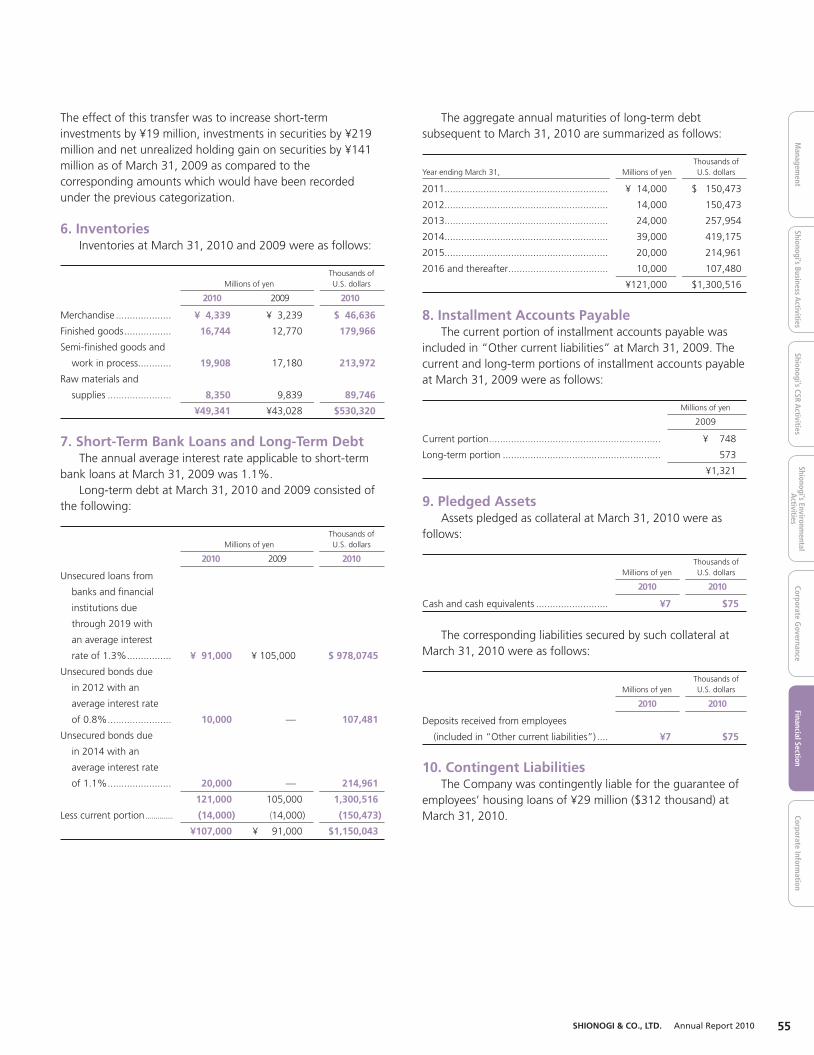
Financial SectionCorporate Inform
ationM
anagement
Shionogi’s Business Activities
Shionogi’s CSR Activities
Shionogi’s Environmental
Activities
Corporate Governance
55SHIONOGI & CO., LTD. Annual Report 2010
The effect of this transfer was to increase short-term investments by ¥19 million, investments in securities by ¥219 million and net unrealized holding gain on securities by ¥141 million as of March 31, 2009 as compared to the corresponding amounts which would have been recorded under the previous categorization.
6. Inventories Inventories at March 31, 2010 and 2009 were as follows:
Thousands of Millions of yen U.S. dollars
2010 2009 2010
Merchandise .................... ¥ 4,339 ¥ 3,239 $ 46,636
Finished goods ................. 16,744 12,770 179,966
Semi-fi nished goods and
work in process ............ 19,908 17,180 213,972
Raw materials and
supplies ....................... 8,350 9,839 89,746
¥49,341 ¥43,028 $530,320
7. Short-Term Bank Loans and Long-Term Debt The annual average interest rate applicable to short-term bank loans at March 31, 2009 was 1.1%. Long-term debt at March 31, 2010 and 2009 consisted of the following:
Thousands of Millions of yen U.S. dollars
2010 2009 2010
Unsecured loans from
banks and fi nancial
institutions due
through 2019 with
an average interest
rate of 1.3% ................ ¥ 91,000 ¥ 105,000 $ 978,0745
Unsecured bonds due
in 2012 with an
average interest rate
of 0.8% ....................... 10,000 — 107,481
Unsecured bonds due
in 2014 with an
average interest rate
of 1.1% ....................... 20,000 — 214,961
121,000 105,000 1,300,516
Less current portion .............. (14,000) (14,000) (150,473)
¥107,000 ¥ 91,000 $1,150,043
The aggregate annual maturities of long-term debt subsequent to March 31, 2010 are summarized as follows:
Thousands of Year ending March 31, Millions of yen U.S. dollars
2011........................................................... ¥ 14,000 $ 150,473
2012........................................................... 14,000 150,473
2013........................................................... 24,000 257,954
2014........................................................... 39,000 419,175
2015........................................................... 20,000 214,961
2016 and thereafter .................................... 10,000 107,480
¥121,000 $1,300,516
8. Installment Accounts Payable The current portion of installment accounts payable was included in “Other current liabilities” at March 31, 2009. The current and long-term portions of installment accounts payable at March 31, 2009 were as follows:
Millions of yen
2009
Current portion .............................................................. ¥ 748
Long-term portion ......................................................... 573
¥1,321
9. Pledged Assets Assets pledged as collateral at March 31, 2010 were as follows:
Thousands of Millions of yen U.S. dollars
2010 2010
Cash and cash equivalents .......................... ¥7 $75
The corresponding liabilities secured by such collateral at March 31, 2010 were as follows:
Thousands of Millions of yen U.S. dollars
2010 2010
Deposits received from employees
(included in “Other current liabilities”) .... ¥7 $75
10. Contingent Liabilities The Company was contingently liable for the guarantee of employees’ housing loans of ¥29 million ($312 thousand) at March 31, 2010.

56
11. Shareholders’ Equity The Corporation Law of Japan (the “Law”) provides that an amount equal to 10% of the amount to be disbursed as distributions of capital surplus (other than the capital reserve) and retained earnings (other than the legal reserve) be transferred to the capital reserve and the legal reserve, respectively, until the sum of the capital reserve and the legal reserve equals 25% of the capital stock account. Such distributions can be made at any time by resolution of the shareholders, or by the Board of Directors if certain conditions are met. The Company’s legal reserve included in retained earnings at March 31, 2010 and 2009 amounted to ¥5,388 million ($57,911 thousand). Under the Law, upon the issuance and sale of new shares of common stock, the entire amount of the proceeds is required to be accounted for as common stock, although a company may, by resolution of the Board of Directors, account for an amount not exceeding one-half of the proceeds of the sale of new shares as additional paid-in capital included in capital surplus. Movements in issued shares of common stock and treasury stock during the years ended March 31, 2010 and 2009 are summarized as follows:
Number of shares
2010 March 31, 2009 Increase Decrease March 31, 2010
Issued shares of
common stock ... 351,136,165 — — 351,136,165
Treasury stock ....... 16,189,825 41,420 — 16,231,245
Number of shares
2009 March 31, 2008 Increase Decrease March 31, 2009
Issued shares of
common stock ... 351,136,165 — — 351,136,165
Treasury stock ....... 16,013,128 176,697 — 16,189,825
The Company has purchased 41,420 shares and 176,697 shares of common stock from shareholders who had fractional shares of less than one unit for the years ended March 31, 2010 and 2009, respectively.
12. Financial Instruments(1) Overview(a) Policies for fi nancial instruments The Company obtains necessary funding principally by bank borrowings and bond issuance under the business plan for its main business, the production and sales of pharmaceuticals. Temporary surplus funds are managed by low-risk fi nancial assets. Derivatives are utilized for mitigating risks described in the later part of this note and not utilized for speculative purpose.
(b) Types of fi nancial instruments and related risk Trade receivables, notes and accounts receivable, are exposed to the credit risk of customers. Trade receivables denominated in foreign currencies are exposed to the fl uctuation risk of foreign currencies. Short-term investments and investments in securities are exposed to fl uctuation risk of market price. Trade payables, notes and accounts payable, are due within one year. Certain trade payables denominated in foreign currencies for the import of raw materials are exposed to the fl uctuation risk of foreign currencies. Loans and bonds are utilized principally for necessary fi nancing under the business plan and those maturity dates are due in nine years, at the longest, subsequent to March 31, 2010. Derivative transactions are made for hedging foreign currency fl uctuation risk of trade receivables and trade payables denominated in foreign currencies by using forward foreign exchange contracts and for hedging interest rate fl uctuation risk of loans by using interest rate swap agreements. Refer to “Hedge accounting” in Note 2 “Summary of Signifi cant Accounting Policies” for information on hedge accounting such as hedging instruments, hedged items, hedging policy and so forth.
(c) Risk management for fi nancial instruments(i) Monitoring of credit risk (the risk that customers or
counterparties may default) In accordance with the procedures determined in the Company, the Accounting and Finance Department and related sections of the Company periodically monitor the conditions of major customers, manage collection due dates and balances of each customer and try to identify credit risk of customers with worsening fi nancial conditions at the early stage and mitigate the risk. Consolidated subsidiaries perform the similar credit management in accordance with the internal rules of the Company. The Company enters into derivative transactions with fi nancial institutions with high credit ratings to mitigate the counterparty risk. The maximum amount of credit risk at March 31, 2010 is represented as the carrying value of fi nancial assets exposed to the credit risk.

Financial SectionCorporate Inform
ationM
anagement
Shionogi’s Business Activities
Shionogi’s CSR Activities
Shionogi’s Environmental
Activities
Corporate Governance
57SHIONOGI & CO., LTD. Annual Report 2010
(ii) Monitoring of market risks (the risks arising from fl uctuations in foreign exchange rates, interest rates and others)
The Company utilizes forward foreign currency exchange contracts for hedging to mitigate fl uctuation risk identifi ed by each foreign currency of trade receivables payables. The Company also utilizes interest rate swap agreements to control the fl uctuation risk of interest rates on loans. The Company continuously reviews securities holdings by monitoring periodically the market and fi nancial condition of the securities’ issuers (companies with business relationships with the Group) and also reviews holding conditions for securities other than held-to-maturities by evaluating the relationship of those companies. The Accounting and Finance Department enters into derivative transactions under the rules determined in the Company and utilizes forward foreign exchange contracts and interest rate swap agreements within the normal range of transactions. The Accounting and Finance Department manages information on transactions by reporting periodically to the Board of Directors’ meetings. Consolidated subsidiaries do not utilize derivative transactions.
(iii) Monitoring of liquidity risk (the risk that the Group may not be able to meet its obligations on scheduled due dates)
The Company manages liquidity risk with the Accounting and Finance Department preparing and updating cash fl ow plans on a timely basis and keeping necessary funds based on the reports prepared by each department.
(d) Supplementary explanation of the estimated fair value of fi nancial instruments
The fair value of fi nancial instruments is based on their quoted market price, if available. When there is no quoted market price available, fair value is reasonably estimated. Since various assumptions and factors are refl ected in estimating the fair value, different assumptions and factors could result in different fair value. In addition, the notional amounts of derivatives in Note 25 do not necessarily indicate the market risk of the derivative transactions.
(e) Concentration of credit risk 53 percent of outstanding trade receivables at March 31, 2010 represented receivables due from a specifi c and large-scale customer.
(2) Fair value of fi nancial instruments Carrying values of fi nancial instruments on the consolidated balance sheet as of March 31, 2010, their fair values and their differences are shown in the following table. The following table does not include fi nancial instruments for which it is extremely diffi cult to determine the fair value.
Millions of yen
2010 Carrying value Fair value Difference
Cash and cash equivalents ....... ¥ 97,663 ¥ 97,663 ¥ —
Notes and accounts
receivable-trade and
affi liates ............................... 79,415 79,322 (93)
Short-term investments and
investments in securities....... 70,656 70,656
Total assets .......................... ¥247,734 ¥247,641 ¥ (93)
Notes and accounts
payable-trade ...................... ¥ 11,706 ¥11,706 ¥ —
Current portion of
long-term debt .................... 14,000 14,003 3
Long-term debt:
Bonds payable ......................... 30,000 30,404 404
Long-term loans ....................... 77,000 77,049 49
Total liabilities ..................... ¥132,706 ¥133,162 ¥456
Thousands of U.S. dollars
2010 Carrying value Fair value Difference
Cash and cash equivalents ....... $1,049,688 $1,049,688 $ —
Notes and accounts
receivable-trade and
affi liates ............................... 853,558 852,558 (1,000)
Short-term investments and
investments in securities....... 759,415 759,415
Total assets ........................... $2,662,661 $2,661,661 $(1,000)
Notes and accounts
payable-trade ...................... $ 125,817 $ 125,817 $ —
Current portion of
long-term debt .................... 150,473 150,505 32
Long-term debt:
Bonds payable ......................... 322,442 326,784 4,342
Long-term loans ....................... 827,601 828,128 527
Total liabilities ..................... $1,426,333 $1,431,234 $ 4,901
(a) Methods to determine the fair value of fi nancial instruments, short-term investments and investments in securities and derivative transactions
Assets• Cash and cash equivalents
Since these items are settled in a short time period, their carrying value approximates fair value.
• Notes and accounts receivable-trade and affi liatesThe fair value of accounts receivable that require a longer

58
period for collection is determined based on the present value by each group of receivables classifi ed by collection term computed by interest rates in consideration of the credit risk corresponding to the collection term. Since other accounts receivable are settled in a short time period, their carrying value approximates fair value.
• Short-term investments and investments in securitiesWith regard to short-term investments and investments in
securities, fair value of debt securities is determined by quoted market price or price offered by fi nancial institutions and that of equity securities is determined by quoted market price. Refer to Note 5 “Short-Term Investments and Investments in Securities” for the information of securities by holding purpose.
Liabilities• Notes and accounts payable-trade
Since these items are settled in a short time period, their carrying value approximates fair value.
• Current portion of long-term debt and Long-term debtThe fair value of the current portion of long-term debt and
long-term debt is based on the present value of the total of principal and interest discounted by the estimated interest rates to be applied if similar new loans are made. Long-term debt with fl oating interest is hedged by interest rate swap agreements and accounted for as loans with fi xed interest rates. The fair value of this long-term debt is based on the present value of the total of principal, the interest and cash fl ows of interest rate swap agreements discounted by the reasonably estimated interest rates to be applied if similar new loans are made.
• Bonds payableThe fair value of bonds payable is based on quoted market
prices.
Derivative transactionsPlease refer to Note 25 “Derivative Transactions.”
(b) Financial instruments for which it is extremely diffi cult to determine the fair value
Thousands of Millions of yen U.S. dollars
2010 2010
Unlisted equity securities, exclusive of
over-the-counter securities ...................... ¥7,760 $83,405
Because no quoted market price is available and it is extremely diffi cult to determine the fair value, these fi nancial instruments are not included in the preceding table.
(c) The redemption schedule for monetary assets and marketable securities with maturities at March 31, 2010.
Millions of yen
Due after Due after Due in 1 year 1 year through 5 years through Due after or less 5 years 10 years 10 years
Cash and
cash equivalents ............. ¥ 97,663 ¥ — ¥ — ¥ —
Notes and accounts
receivable-trade
and affi liates .................. 75,950 2,310 1,155 —
Short-term investments
and investments in
securities:
Bonds held to maturity .... 20 — — —
Other securities with
maturity dates ............. 6,527 10,238 5,142 —
Total ................................... ¥180,160 ¥12,548 ¥6,297 ¥ —
Thousands of U.S. dollars
Due after Due after Due in 1 year 1 year through 5 years through Due after or less 5 years 10 years 10 years
Cash and
cash equivalents ............. $1,049,688 $ — $ — $ —
Notes and accounts
receivable-trade
and affi liates .................. 816,316 24,828 12,414 —
Short-term investments
and investments in
securities:
Bonds held to maturity .... 215 — — —
Other securities with
maturity dates ............ 70,152 110,039 55,267 —
Total ................................... $1,936,371 $134,867 $67,681 $ —
Effective from the year ended March 31, 2010, the Company and its consolidated subsidiaries have adopted “Accounting Standard for Financial Instruments” (ASBJ Statement No. 10, issued on March 10, 2008) and “Guidance on Disclosures about Fair Value of Financial Instruments” (ASBJ Guidance No. 19, issued on March 10, 2008).
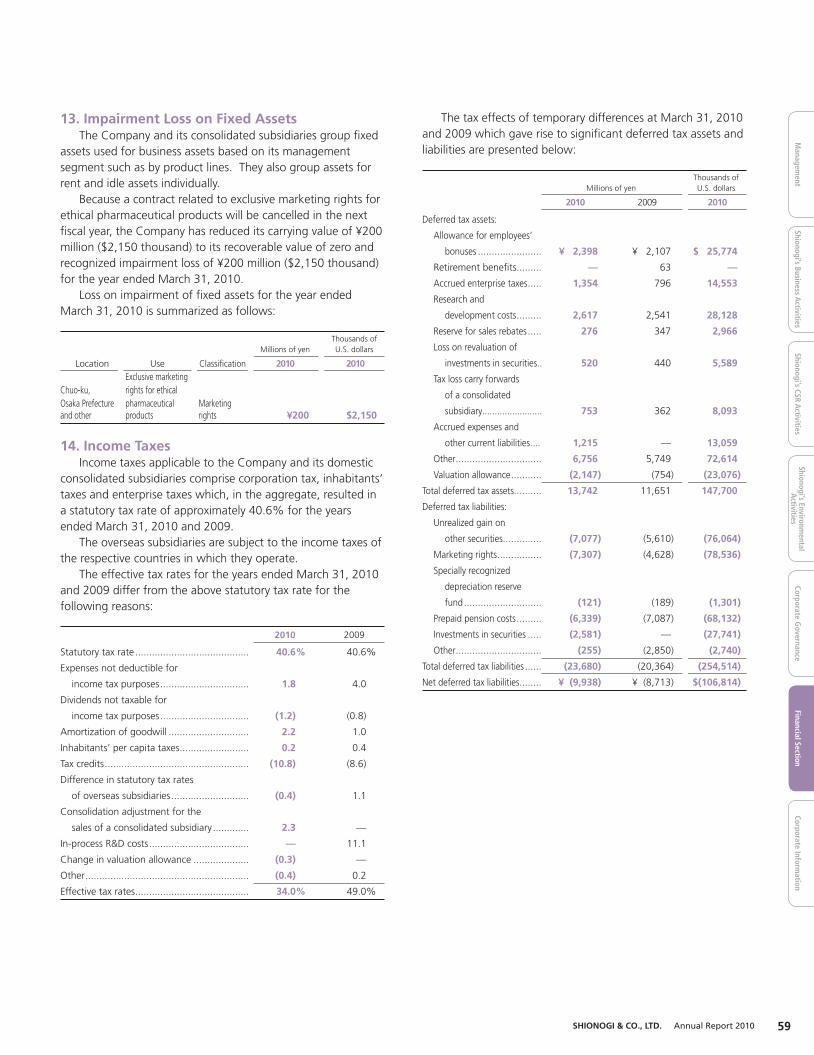
Financial SectionCorporate Inform
ationM
anagement
Shionogi’s Business Activities
Shionogi’s CSR Activities
Shionogi’s Environmental
Activities
Corporate Governance
59SHIONOGI & CO., LTD. Annual Report 2010
The tax effects of temporary differences at March 31, 2010 and 2009 which gave rise to signifi cant deferred tax assets and liabilities are presented below:
Thousands of Millions of yen U.S. dollars
2010 2009 2010
Deferred tax assets:
Allowance for employees’
bonuses ....................... ¥ 2,398 ¥ 2,107 $ 25,774
Retirement benefi ts ......... — 63 —
Accrued enterprise taxes ..... 1,354 796 14,553
Research and
development costs ......... 2,617 2,541 28,128
Reserve for sales rebates ..... 276 347 2,966
Loss on revaluation of
investments in securities.. 520 440 5,589
Tax loss carry forwards
of a consolidated
subsidiary........................ 753 362 8,093
Accrued expenses and
other current liabilities .... 1,215 — 13,059
Other ............................... 6,756 5,749 72,614
Valuation allowance ........... (2,147) (754) (23,076)
Total deferred tax assets.......... 13,742 11,651 147,700
Deferred tax liabilities:
Unrealized gain on
other securities.............. (7,077) (5,610) (76,064)
Marketing rights ................ (7,307) (4,628) (78,536)
Specially recognized
depreciation reserve
fund ............................ (121) (189) (1,301)
Prepaid pension costs ......... (6,339) (7,087) (68,132)
Investments in securities ..... (2,581) — (27,741)
Other ............................... (255) (2,850) (2,740)
Total deferred tax liabilities ...... (23,680) (20,364) (254,514)
Net deferred tax liabilities........ ¥ (9,938) ¥ (8,713) $(106,814)
13. Impairment Loss on Fixed Assets The Company and its consolidated subsidiaries group fi xed assets used for business assets based on its management segment such as by product lines. They also group assets for rent and idle assets individually. Because a contract related to exclusive marketing rights for ethical pharmaceutical products will be cancelled in the next fi scal year, the Company has reduced its carrying value of ¥200 million ($2,150 thousand) to its recoverable value of zero and recognized impairment loss of ¥200 million ($2,150 thousand) for the year ended March 31, 2010. Loss on impairment of fi xed assets for the year ended March 31, 2010 is summarized as follows:
Thousands of Millions of yen U.S. dollars
Location Use Classifi cation 2010 2010 Exclusive marketingChuo-ku, rights for ethicalOsaka Prefecture pharmaceutical Marketingand other products rights ¥200 $2,150
14. Income Taxes Income taxes applicable to the Company and its domestic consolidated subsidiaries comprise corporation tax, inhabitants’ taxes and enterprise taxes which, in the aggregate, resulted in a statutory tax rate of approximately 40.6% for the years ended March 31, 2010 and 2009. The overseas subsidiaries are subject to the income taxes of the respective countries in which they operate. The effective tax rates for the years ended March 31, 2010 and 2009 differ from the above statutory tax rate for the following reasons:
2010 2009
Statutory tax rate ......................................... 40.6% 40.6%
Expenses not deductible for
income tax purposes ................................ 1.8 4.0
Dividends not taxable for
income tax purposes ................................ (1.2) (0.8)
Amortization of goodwill ............................. 2.2 1.0
Inhabitants’ per capita taxes ......................... 0.2 0.4
Tax credits .................................................... (10.8) (8.6)
Difference in statutory tax rates
of overseas subsidiaries ............................ (0.4) 1.1
Consolidation adjustment for the
sales of a consolidated subsidiary ............. 2.3 —
In-process R&D costs .................................... — 11.1
Change in valuation allowance .................... (0.3) —
Other ........................................................... (0.4) 0.2
Effective tax rates ......................................... 34.0% 49.0%

60
15. Leases The Company and its consolidated subsidiaries lease principally equipment and vehicles and have entered into a number of fi nance lease contracts that do not transfer the ownership of the leased property to the Company and its consolidated subsidiaries. The following pro forma amounts represent the acquisition costs, accumulated depreciation and net book value of the property leased to the Company and its consolidated subsidiaries at March 31, 2010 and 2009, for lease contracts entered into on or before March 31, 2008, that would have been refl ected in the accompanying consolidated balance sheets if the fi nance leases that do not transfer the ownership of the leased property to the Company and its consolidated subsidiaries (which were accounted for as operating leases) had been capitalized:
Millions of yen
2010 Acquisition Accumulated Net book costs depreciation value
Machinery, equipment
and vehicles ................. ¥29 ¥27 ¥ 2
Other ............................... 47 31 16
Total ................................ ¥76 ¥58 ¥18
Millions of yen
2009 Acquisition Accumulated Net book costs depreciation value
Machinery, equipment
and vehicles ................. ¥ 800 ¥ 674 ¥126
Other ............................... 1,397 1,004 393
Total ................................ ¥2,197 ¥1,678 ¥519
Thousands of U.S. dollars
2010 Acquisition Accumulated Net book costs depreciation value
Machinery, equipment
and vehicles ................. $312 $290 $ 21
Other ............................... 505 333 172
Total ................................ $817 $623 $193
Depreciation of the leased assets, which is computed by the straight-line method over the respective lease terms assuming a nil residual value, amounted to ¥476 million ($5,116 thousand) and ¥501 million for the years ended March 31, 2010 and 2009, respectively.
Finance lease payments of the Company and its consolidated subsidiaries for the years ended March 31, 2010 and 2009 were as follows:
Thousands of Millions of yen U.S. dollars
2010 2009 2010
Lease payments ............... ¥476 ¥501 $5,116
Future minimum lease payments (including the interest portion thereon) subsequent to March 31, 2010 under fi nance lease transactions that do not transfer the ownership of the leased property to the Company and its consolidated subsidiaries are summarized as follows:
Thousands of Millions of yen U.S. dollars
Due within one year .................................... ¥ 9 $ 97
Due after one year ...................................... 9 97
Total ........................................................... ¥18 $194
The acquisition costs and future minimum lease payments under fi nance leases presented in the above tables include the imputed interest expense. There are no losses on impairment of leased assets for the years ended March 31, 2010 and 2009.
16. Retirement Benefi ts The following table sets forth the retirement benefi t obligation, plan assets and the funded status of the Company’s and its consolidated subsidiaries’ defi ned benefi t pension plans at March 31, 2010 and 2009:
Thousands of Millions of yen U.S. dollars
2010 2009 2010
Retirement benefi t
obligation at
end of year .................... ¥(86,498) ¥(88,167) $(929,686)
Fair value of plan assets
at end of year ................ 89,013 80,639 956,717
Plan assets in excess of
retirement benefi t
obligation ...................... 2,515 — 27,031
Unfounded status .............. — (7,528) —
Unrecognized
actuarial loss .................. 22,101 36,663 237,543
Unrecognized prior
service costs ................... (8,282) (10,956) (89,015)
Net retirement benefi t
obligation ........................ 16,334 18,179 175,559
Prepaid pension costs ......... 24,411 25,972 262,371
Accrued retirement
benefi ts for employees ... ¥ (8,077) ¥ (7,793) $ (86,812)

Financial SectionCorporate Inform
ationM
anagement
Shionogi’s Business Activities
Shionogi’s CSR Activities
Shionogi’s Environmental
Activities
Corporate Governance
61SHIONOGI & CO., LTD. Annual Report 2010
The components of retirement benefi t expenses for the years ended March 31, 2010 and 2009 are outlined as follows:
Thousands of Millions of yen U.S. dollars
2010 2009 2010
Service cost ........................ ¥ 1,865 ¥ 1,828 $ 20,045
Interest cost ....................... 1,763 1,788 18,949
Expected return
on plan assets ................ (2,530) (3,891) (27,193)
Amortization of
actuarial loss .................. 5,857 2,869 62,951
Amortization of
prior service costs .......... (2,674) (2,674) (28,740)
Contributions to the
defi ned contribution
pension plan .................. 1,045 825 11,232
Retirement benefi t
expenses ........................ ¥ 5,326 ¥ 745 $ 57,244
The assumptions used in accounting for the defi ned benefi t pension plans for the years ended March 31, 2010 and 2009 were as follows:
2010 2009
Discount rate ............................................... 2.0% 2.0%
Expected rates of return on plan assets ........ 3.1% 3.6%
17. Cost of Sales Cost of sales included loss on devaluation of inventories of ¥474 million ($5,095 thousand) and ¥317 million for the years ended March 31, 2010 and 2009, respectively.
18. Research and Development Expenses Research and development expenses included in selling, general and administrative expenses for the years ended March 31, 2010 and 2009 amounted to ¥51,808 million ($556,836 thousand) and ¥52,822 million, respectively.
19. Special Contract Expenses Special contract expenses represented payment for the extension of a sales license contract that stipulates the release of the obligation to dispose of the licensed products.
20. Casualty Losses Casualty losses included construction costs for recovery and loss on disposal of inventories and fi xed assets damaged by earthquakes.
21. Investment and Rental Properties The Company and its consolidated subsidiaries own offi ce buildings including land for lease mainly in Tokyo and other areas. Rental income, net of related expenses relevant to these real estate properties, amounted to ¥1,652 million ($17,756 thousand) for the year ended March 31, 2010. The rental income is principally recorded in net sales and the rental expenses are principally recorded in cost of sales. The carrying value in the consolidated balance sheets and corresponding fair value of those properties were as follows:
Millions of yen
Carrying value Fair value
March 31, 2009 Net change March 31, 2010 March 31, 2010
¥6,398 ¥(164) ¥6,234 ¥25,960 Thousands of U.S. dollars
Carrying value Fair value
March 31, 2009 Net change March 31, 2010 March 31, 2010
$68,766 $(1,763) $67,003 $279,020
Carrying value in the table above is presented as the amount of acquisition costs less accumulated depreciation. Fair value at March 31, 2010 is primarily calculated based on real estate appraisal standards and, in some cases, the adjusted amounts using indices and other methods.
Supplemental information Effective the year ended March 31, 2010, the Company and its consolidated subsidiaries have adopted “Accounting Standard for Disclosures about Fair Value of Investment and Rental Property” (ASBJ Statement No. 20, issued on November 28, 2008) and “Guidance on Accounting Standard for Disclosures about Fair Value of Investment and Rental Property” (ASBJ Guidance No. 23, issued on November 28, 2008).
22. Related Party Transactions Principal transactions between a subsidiary and a related party for the years ended March 31, 2010 and 2009 are summarized as follows:Transaction with a director
Thousands of Millions of yen U.S. dollars
2010 2009 2010
Shunjusha Co., Ltd.:
Rent received —
land and offi ce building ¥ 45 ¥ 45 $ 484
Rent expense–building 143 143 1,537
Management fee for
leased property 3 4 32
Shunjusha Co., Ltd. is 99.9% directly owned by a relative of a director of the Company and has been engaged in the real estate leasing business. Shunjusha Co., Ltd. is located in Chuo-ku, Osaka with a capital amount of ¥701 million ($7,534 thousand) and ¥701 million as of March 31, 2010 and 2009, respectively.

62
The prices for the above related party transactions were determined with reference to market value, transactions made in the same area and so on. There were no outstanding balances in connection with related party transactions above as of March 31, 2010 and 2009. Effective the year ended March 31, 2009, the Company adopted “Accounting Standard for Related Party Disclosures” (ASBJ Statement No.11 issued on October 17, 2006) and “Guidance on Accounting Standard for Related Party Disclosures” (ASBJ Guidance No.13 issued on October 17, 2006). As a result of the adoption of this accounting standard, transactions involving the Company, its consolidated subsidiaries or affi liates and any related parties were disclosed effective the year ended March 31, 2009.
23. Supplementary Cash Flow Information On November 13, 2009, the Company purchased shares of Addrenex Pharmaceuticals, Inc. (“Addrenex”) and initially consolidated the accounts of Addrenex as of and for the year ended March 31, 2010. The assets and liabilities included in consolidation are summarized as follows:
Thousands of Millions of yen U.S. dollars
2010 2010
Current assets .............................................. ¥ 47 $ 505
In-process research and development costs .. 2,829 30,406
Goodwill ...................................................... 1,063 11,425
Current liabilities .......................................... (141) (1,515)
Non-current liabilities ................................... (770) (8,276)
Interest which the Company
already owned ......................................... (330) (3,547)
Acquisition cost ........................................... ¥2,698 $ 28,998
Net of advance payments ............................. (146) (1,569)
Cash and cash equivalents of Addrenex ....... (46) (494)
Cash disbursement .................................. ¥2,506 $ 26,935
Effective February 22, 2010, Bushu Pharmaceuticals Ltd. (“Bushu”) was excluded from the scope of consolidation because the Company’s investment in Bushu had been sold. The assets and liabilities as of the date of the sale, and proceeds from sale and gain on the sale were as follows:
Thousands of Millions of yen U.S. dollars
2010 2010
Current assets .............................................. ¥ 4,187 $ 45,002
Non current assets ....................................... 11,556 124,205
Current liabilities .......................................... (2,378) (25,559)
Non-current liabilities ................................... (10,599) (113,919)
Expenses for sale of shares of Bushu ............ 438 4,708
Gain on sale of business ............................... 5,351 57,513
Sales amount of shares of Bushu .................. ¥ 8,555 $ 91,950
Cash and cash equivalents of Bushu ............. (462) (4,966)
Proceeds from sale of investment ............. ¥ 8,093 $ 86,984
On October 9, 2008, the Company purchased shares of Sciele Pharma, Inc. (“Sciele” currently, Shionogi Pharma, Inc.)
and initially consolidated the accounts of Sciele as of and for the year ended March 31, 2009. The assets and liabilities included in consolidation were summarized as follows:
Millions of yen
2009
Current assets ......................................................................... ¥ 27,051
Intangible assets ..................................................................... 44,525
In-process research and development costs ............................. 9,669
Goodwill ................................................................................. 79,664
Other non-current assets ......................................................... 2,228
Current liabilities ..................................................................... (13,446)
Non-current liabilities .............................................................. (5,076)
Foreign currency translation adjustment .................................. 11,998
Acquisition cost ...................................................................... ¥156,613
Cash and cash equivalents of Sciele ........................................ (9,846)
Cash disbursement ............................................................. ¥146,767
24. Amounts per Share Amounts per share as of and for the years ended March 31, 2010 and 2009 were as follows:
Yen U.S. dollars
2010 2009 2010
Net income ........................ ¥ 115.33 ¥ 46.75 $ 1.24
Net assets .......................... 1,019.71 924.43 10.96
Cash dividends applicable
to the year ..................... 36.00 28.00 0.39
Diluted net income per share has not been presented since no potentially dilutive securities have been issued. Net income per share has been computed based on the net income available for distribution to shareholders of common stock and the weighted-average number of shares of common stock outstanding during the year. The amounts per share of net assets have been computed based on the number of shares of common stock outstanding at the year end. Cash dividends per share represent the cash dividends proposed by the Board of Directors as applicable to the respective years together with the interim cash dividends paid. The fi nancial data used in the computation of basic net income per share for the years ended March 31, 2010 and 2009 in the table above is summarized as follows:
Thousands of Millions of yen U.S. dollars
2010 2009 2010
Information used in
computation of basic
net income per share:
Net income ............... ¥38,626 ¥15,661 $415,155
Thousands of shares
2010 2009
Weighted-average number of shares of
common stock outstanding ................... 334,915 335,022

Financial SectionCorporate Inform
ationM
anagement
Shionogi’s Business Activities
Shionogi’s CSR Activities
Shionogi’s Environmental
Activities
Corporate Governance
63SHIONOGI & CO., LTD. Annual Report 2010
The fi nancial data used in the computation of net assets per share at March 31, 2010 and 2009 in the above table is summarized as follows:
Thousands of Millions of yen U.S. dollars
2010 2009 2010
Total net assets .................. ¥341,976 ¥310,094 $3,675,580
Amounts deducted from
total net assets
(Amounts attributed to
minority interests in
total net assets): ............ 472 459 5,073
Net assets used in the
calculation of net
assets per share ............. ¥341,504 ¥309,635 $3,670,507
Thousands of shares
2010 2009
Number of shares used in the calculation
of net assets per share ............................ 334,904 334,946
25. Derivative Transactions1. Derivative transactions for which hedge accounting
does not apply Information on derivative transactions for which hedge accounting does not apply has been omitted since all outstanding derivative positions were qualifi ed for hedge accounting.
2. Derivative transactions to which hedge accounting applies
(i) Currency-related transactions
Millions of yen
2010 Contract value
Method of hedge Principal Notional More than accounting Transaction hedged item amount one year Fair value
Forwardforeign Forwardcurrency foreignexchange currencyrates exchange applied to contracts Accountsunderlying Buying: payable-transactions EUR trade ¥133 ¥— (*)
Thousands of U.S. dollars
2010 Contract value
Method of hedge Principal Notional More than accounting Transaction hedged item amount one year Fair value
Forwardforeign Forwardcurrency foreignexchange currencyrates exchange applied to contracts Accountsunderlying Buying: payable-transactions EUR trade $1,429 $— (*)
(*): Since the forward foreign currency exchange contracts were accounted for by the allocation method (refer to Note 2(o)), their fair value is included in that of the accounts payable – trade disclosed in Note 12 “Financial Instruments.”
(ii) Interest rate-related transactions
Millions of yen
2010 Contract value
Method of hedge Principal Notional More than accounting Transaction hedged item amount one year Fair value
Swap rates Interest rate applied to swaps underlying Pay: fi xed/ Long-term debt Receive: fl oating debt ¥25,000 ¥25,000 (*)
Thousands of U.S. dollars
2010 Contract value
Method of hedge Principal Notional More than accounting Transaction hedged item amount one year Fair value
Swap rates Interest rate applied to swaps underlying Pay: fi xed/ Long-term
debt Receive: fl oating debt $268,702 $268,702 (*)
(*): Since interest rate swap agreements are accounted for as if the interest rates applied to the swaps had originally applied to the underlying debt (refer to Note 2(o)), their fair value is included in that of the long-term debt disclosed in Note 12 “Financial Instruments.”

64
26. Segment Information The Company and its consolidated subsidiaries are engaged primarily in the manufacture and sale of pharmaceutical products and in related marketing activities in Japan and overseas, principally in North America and Asia, in two major segments. The pharmaceuticals and related businesses includes more
Millions of yen
2010 Eliminations or Japan North America Other Total corporate Consolidated
I. Sales and operating income:
Sales to third parties ......................................... ¥238,191 ¥38,642 ¥1,670 ¥278,503 ¥ — ¥278,503
Intragroup sales and transfers ........................... 413 2,927 58 3,398 (3,398) —
Net sales .......................................................... 238,604 41,569 1,728 281,901 (3,398) 278,503
Operating expenses .......................................... 185,631 38,656 1,414 225,701 364 226,065
Operating income ........................................... ¥ 52,973 ¥ 2,913 ¥ 314 ¥ 56,200 ¥ (3,762) ¥ 52,438
II. Total assets .................................................... ¥287,603 ¥85,803 ¥3,818 ¥377,224 ¥ 163,538 ¥540,762
Millions of yen
2009 Eliminations or Japan North America Other Total corporate Consolidated
I. Sales and operating income (loss):
Sales to third parties ......................................... ¥215,875 ¥ 9,885 ¥1,752 ¥227,512 ¥ — ¥227,512
Intragroup sales and transfers ........................... 436 3,253 56 3,745 (3,745) —
Net sales .......................................................... 216,311 13,138 1,808 231,257 (3,745) 227,512
Operating expenses .......................................... 175,916 21,072 1,348 198,336 (2,839) 195,497
Operating income (loss) .................................... ¥ 40,395 ¥ (7,934) ¥ 460 ¥ 32,921 ¥ (906) ¥ 32,015
II. Total assets ....................................................... ¥276,221 ¥ 67,846 ¥3,741 ¥347,808 ¥154,045 ¥501,853
Thousands of U.S. dollars
2010 Eliminations or Japan North America Other Total corporate Consolidated
I. Sales and operating income:
Sales to third parties ......................................... $2,560,092 $415,327 $17,949 $2,993,368 $ — $2,993,368
Intragroup sales and transfers ........................... 4,439 31,459 624 36,522 (36,522) —
Net sales .......................................................... 2,564,531 446,786 18,573 3,029,890 (36,522) 2,993,368
Operating expenses .......................................... 1,995,174 415,477 15,198 2,425,849 3,912 2,429,761
Operating income ........................................... $ 569,357 $ 31,309 $ 3,375 $ 604,041 $ (40,434) $ 563,607
II. Total assets .................................................... $3,091,176 $922,216 $41,036 $4,054,428 $1,757,717 $5,812,145
than 90% of the total sales, operating income and total assets of all business segments. Therefore, the disclosure of business segment information has been omitted for the years ended March 31, 2010 and 2009. The geographical segment information of the Company and its consolidated subsidiaries for the years ended March 31, 2010 and 2009 are outlined as follows:
The above categories are based on geographic proximity. “North America” mainly represents the United States of America, and “Other” mainly represents Asian countries. As described in Note 2(b), up to the year ended March 31, 2009, revenues and expenses of the overseas subsidiaries were translated into yen at the rates of exchange in effect at balance sheet dates of the overseas subsidiaries. Effective the year ended March 31, 2010, the Company has changed the
translation method of revenues and expenses of overseas subsidiaries using the average exchange rate for the fi scal year. The effect of this change was to increase sales in the “North America” segment by ¥644 million ($6,922 thousand) and to decrease sales in the “Other” segment by ¥11 million ($118 thousand). In addition, this change was to increase operating expenses in the “North America” segment by ¥644 million ($6,922 thousand), “Eliminations or corporate” by ¥62
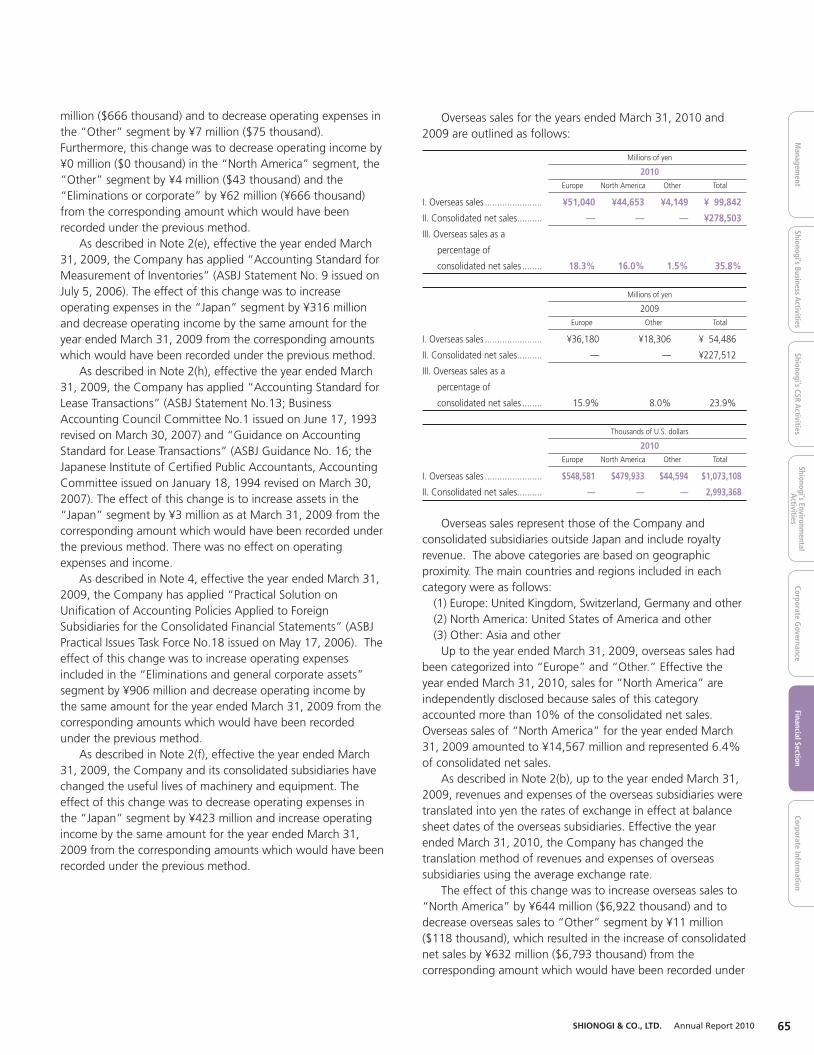
Financial SectionCorporate Inform
ationM
anagement
Shionogi’s Business Activities
Shionogi’s CSR Activities
Shionogi’s Environmental
Activities
Corporate Governance
65SHIONOGI & CO., LTD. Annual Report 2010
million ($666 thousand) and to decrease operating expenses in the “Other” segment by ¥7 million ($75 thousand). Furthermore, this change was to decrease operating income by ¥0 million ($0 thousand) in the “North America” segment, the “Other” segment by ¥4 million ($43 thousand) and the “Eliminations or corporate” by ¥62 million (¥666 thousand) from the corresponding amount which would have been recorded under the previous method. As described in Note 2(e), effective the year ended March 31, 2009, the Company has applied “Accounting Standard for Measurement of Inventories” (ASBJ Statement No. 9 issued on July 5, 2006). The effect of this change was to increase operating expenses in the “Japan” segment by ¥316 million and decrease operating income by the same amount for the year ended March 31, 2009 from the corresponding amounts which would have been recorded under the previous method. As described in Note 2(h), effective the year ended March 31, 2009, the Company has applied “Accounting Standard for Lease Transactions” (ASBJ Statement No.13; Business Accounting Council Committee No.1 issued on June 17, 1993 revised on March 30, 2007) and “Guidance on Accounting Standard for Lease Transactions” (ASBJ Guidance No. 16; the Japanese Institute of Certifi ed Public Accountants, Accounting Committee issued on January 18, 1994 revised on March 30, 2007). The effect of this change is to increase assets in the “Japan” segment by ¥3 million as at March 31, 2009 from the corresponding amount which would have been recorded under the previous method. There was no effect on operating expenses and income. As described in Note 4, effective the year ended March 31, 2009, the Company has applied “Practical Solution on Unifi cation of Accounting Policies Applied to Foreign Subsidiaries for the Consolidated Financial Statements” (ASBJ Practical Issues Task Force No.18 issued on May 17, 2006). The effect of this change was to increase operating expenses included in the “Eliminations and general corporate assets” segment by ¥906 million and decrease operating income by the same amount for the year ended March 31, 2009 from the corresponding amounts which would have been recorded under the previous method. As described in Note 2(f), effective the year ended March 31, 2009, the Company and its consolidated subsidiaries have changed the useful lives of machinery and equipment. The effect of this change was to decrease operating expenses in the “Japan” segment by ¥423 million and increase operating income by the same amount for the year ended March 31, 2009 from the corresponding amounts which would have been recorded under the previous method.
Overseas sales for the years ended March 31, 2010 and 2009 are outlined as follows:
Millions of yen
2010 Europe North America Other Total
I. Overseas sales ....................... ¥51,040 ¥44,653 ¥4,149 ¥ 99,842
II. Consolidated net sales .......... — — — ¥278,503
III. Overseas sales as a
percentage of
consolidated net sales ........ 18.3% 16.0% 1.5% 35.8%
Millions of yen
2009 Europe Other Total
I. Overseas sales ....................... ¥36,180 ¥18,306 ¥ 54,486
II. Consolidated net sales .......... — — ¥227,512
III. Overseas sales as a
percentage of
consolidated net sales ........ 15.9% 8.0% 23.9%
Thousands of U.S. dollars
2010 Europe North America Other Total
I. Overseas sales ....................... $548,581 $479,933 $44,594 $1,073,108
II. Consolidated net sales .......... — — — 2,993,368
Overseas sales represent those of the Company and consolidated subsidiaries outside Japan and include royalty revenue. The above categories are based on geographic proximity. The main countries and regions included in each category were as follows:
(1) Europe: United Kingdom, Switzerland, Germany and other(2) North America: United States of America and other(3) Other: Asia and other
Up to the year ended March 31, 2009, overseas sales had been categorized into “Europe” and “Other.” Effective the year ended March 31, 2010, sales for “North America” are independently disclosed because sales of this category accounted more than 10% of the consolidated net sales. Overseas sales of “North America” for the year ended March 31, 2009 amounted to ¥14,567 million and represented 6.4% of consolidated net sales. As described in Note 2(b), up to the year ended March 31, 2009, revenues and expenses of the overseas subsidiaries were translated into yen the rates of exchange in effect at balance sheet dates of the overseas subsidiaries. Effective the year ended March 31, 2010, the Company has changed the translation method of revenues and expenses of overseas subsidiaries using the average exchange rate. The effect of this change was to increase overseas sales to “North America” by ¥644 million ($6,922 thousand) and to decrease overseas sales to “Other” segment by ¥11 million ($118 thousand), which resulted in the increase of consolidated net sales by ¥632 million ($6,793 thousand) from the corresponding amount which would have been recorded under

66
the previous method. The share of overseas sales in consolidated net sales increased by 0.2% in “North America” and the impact on “Europe” and “Other” was immaterial.
27. Business Combinations On October 9, 2008, the Company acquired all the outstanding shares of Sciele for $1,446 million in cash. Sciele was engaged in research, development and sales of pharmaceuticals. The Company determined that the acquisition would enable it to enhance the market presence as well as sales structure in the United States of America, which would contribute to realizing the value of the Company’s original products and ensure long-term growth in the future. The acquisition was accounted for using the purchase method of accounting. Goodwill of $718 million was recognized and to be amortized during the period of 20 years. The assets acquired and liabilities assumed as of the acquisition date were as follows:
Thousands of Millions of yen U.S. dollars
Current assets ............................................. ¥ 27,051 $ 270,553
Non-current assets ...................................... 126,418 1,264,309
Total assets ................................................. ¥153,469 $1,534,862
Current liabilities ......................................... 13,446 134,478
Non-current liabilities .................................. 5,076 50,765
Total liabilities ............................................. ¥ 18,522 $ 185,243
The transaction was made in U.S. dollars and the amounts in yen in the above table represent amounts booked in the consolidated fi nancial statements. In connection with this acquisition, the Company allocated $96 million and $445 million from acquisition cost (see Note 23) to research and development cost and marketing rights, respectively. Marketing rights are being amortized over a period of 3 to 12 years. The effect on the consolidated statement of income for the year ended March 31, 2009, assuming that this acquisition had been completed at April 1, 2008, was as follows:
Millions of Millions of yen U.S. dollars
(Unaudited)
Net sales ..................................................... ¥36,780 $404
Operating income ....................................... 7,283 80
Income before income taxes and
minority interest ...................................... 6,646 73
These amounts represent the consolidated statement of income for the year ended December 31, 2008 of Sciele and its consolidated subsidiaries. The exchange rate to Japanese yen amounts was ¥91.04 = U.S.$1.00, the approximate rate of exchange in effect on December 31, 2008.
28. Litigation In December 2007, the Company brought a patent infringement action jointly with AstraZeneca against seven generic drug companies (another company was added later) including Cobalt Pharmaceuticals, Inc. and Apotex, Inc., which had fi led Abbreviated New Drug Applications for generic drugs of “Crestor,” to prevent such companies from selling any generic drugs under the patent owned by the Company in the U.S.A. The trial was conducted from late February to early March 2010. A decision is expected to be made around June or July 2010. Furthermore, in September 2009, the Company brought, in collaboration with AstraZeneca Canada, a patent infringement action against two companies, namely Novopharm Limited and Apotex, Inc., which had fi led Abbreviated New Drug Applications for generic drugs of “Crestor” in Canada, to prevent such companies from selling any generic drugs under the patent owned by the Company in Canada. In May 2008, a suit was brought against the Company in Osaka District Court by Cellectis SA who is the exclusive licensee of the patent owned by Institute Pasteur claiming that the use of the technology relating to the genetically modifi ed mice for research would infringe the patent and the Company should pay ¥970 million ($10,426 thousand). The suit is pending in court. In February 2009, the Company brought a patent infringement action under its patent of the crystal of Cefcapene Pivoxil Hydrochloride monohydrate, the active ingredient of Flomox®, an antibiotic developed by the Company, against ITOCHU CHEMICAL FRONTIER Corporation, who is the importer of such active ingredient and simultaneously initiated the procedures to petition for a provisional deposition order thereunder. Furthermore, in August 2009, the Company brought a patent infringement action against Sawai Pharmaceutical Co., Ltd. which had been selling a generic version of Flomox® since May 2009 and simultaneously initiated the procedures to petition for a provisional deposition order thereunder. Since the Osaka District Court made a judgment to repeal the series of claims by the Company in April 2010, the Company fi led an appeal to the Intellectual Property High Court with the above-mentioned two companies as appellants.
29. Subsequent Event The following distribution of retained earnings of the Company, which has not been refl ected in the accompanying consolidated fi nancial statements for the year ended March 31, 2010, was approved at a shareholders’ meeting held on June 24, 2010:
Thousands of Millions of yen U.S. dollars
Cash dividends
(¥18.00 = U.S.$0.19 per share) ...................... ¥6,028 $64,789
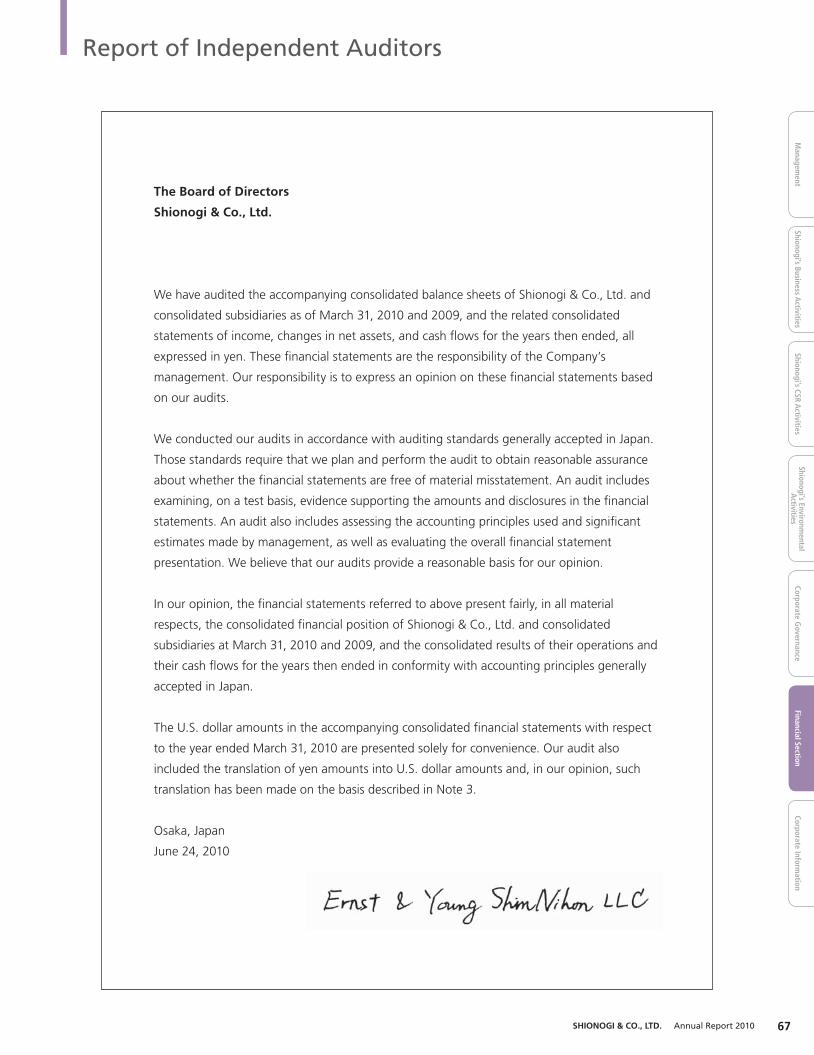
Report of Independent Auditors
Financial SectionCorporate Inform
ationM
anagement
Shionogi’s Business Activities
Shionogi’s CSR Activities
Shionogi’s Environmental
Activities
Corporate Governance
67SHIONOGI & CO., LTD. Annual Report 2010
The Board of Directors
Shionogi & Co., Ltd.
We have audited the accompanying consolidated balance sheets of Shionogi & Co., Ltd. and
consolidated subsidiaries as of March 31, 2010 and 2009, and the related consolidated
statements of income, changes in net assets, and cash fl ows for the years then ended, all
expressed in yen. These fi nancial statements are the responsibility of the Company’s
management. Our responsibility is to express an opinion on these fi nancial statements based
on our audits.
We conducted our audits in accordance with auditing standards generally accepted in Japan.
Those standards require that we plan and perform the audit to obtain reasonable assurance
about whether the fi nancial statements are free of material misstatement. An audit includes
examining, on a test basis, evidence supporting the amounts and disclosures in the fi nancial
statements. An audit also includes assessing the accounting principles used and signifi cant
estimates made by management, as well as evaluating the overall fi nancial statement
presentation. We believe that our audits provide a reasonable basis for our opinion.
In our opinion, the fi nancial statements referred to above present fairly, in all material
respects, the consolidated fi nancial position of Shionogi & Co., Ltd. and consolidated
subsidiaries at March 31, 2010 and 2009, and the consolidated results of their operations and
their cash fl ows for the years then ended in conformity with accounting principles generally
accepted in Japan.
The U.S. dollar amounts in the accompanying consolidated fi nancial statements with respect
to the year ended March 31, 2010 are presented solely for convenience. Our audit also
included the translation of yen amounts into U.S. dollar amounts and, in our opinion, such
translation has been made on the basis described in Note 3.
Osaka, Japan
June 24, 2010

Corporate Information
68
121110987654 121110987654321 121110987654321 121110987654321 321
121110987654 121110987654321 121110987654321 121110987654321 321
3,000
1,000
0
2,000
500
1,500
2,500
100
20
0
60
40
80
1006 07 08 09
1006 07 08 09
Monthly stock price range
Monthly trading volume
TOPIX Price Index closeCommon stock price range (Yen)
(Million shares)
(As of March 31, 2010)
Japan Trustee Services Bank, Ltd. (trust account) 21,609 6.45
The Master Trust Bank of Japan, Ltd. (trust account) 20,261 6.04
Sumitomo Life Insurance Company 18,604 5.55
Nippon Life Insurance Company 13,138 3.92
JP Morgan Chase Bank 385147 10,126 3.02
JP Morgan Chase Bank 380055 10,109 3.01
Japan Trustee Services Bank, Ltd.(Trust Account Re-entrusted by The Sumitomo Trust & Banking Co., Ltd., 9,485 2.83The Sumitomo Mitsui Banking Corporation Retirement Trust Account)
NIPPONKOA Insurance Co., Ltd. 7,551 2.25
State Street Bank and Trust Company 6,657 1.98
Japan Trustee Services Bank, Ltd. (trust account 9) 6,596 1.96
Number of shares (Thousands)
Percentage oftotal sharesName
Stock Price Range and Trading Volume (Tokyo Stock Exchange)
Major Shareholders
Company Name Shionogi & Co., Ltd.
Established March 17, 1878
Incorporated June 5, 1919
Paid-in Capital ¥21,279,742,717
Website http://www.shionogi.co.jp/
Head Offi ce 1-8, Doshomachi 3-chome, Chuo-ku, Osaka 541-0045, JapanTel: +81-6-6202-2161Fax: +81-6-6229-9596
Number of Employees Consolidated: 5,887Non-consolidated: 4,124
Category of Business Marketing and manufacturing of drugs
Type of Business Manufacture and sale of pharmaceutical products, diagnostics, and other related products
Fiscal Year-End March 31
Net Sales Consolidated: ¥278,502 million,Non-consolidated: ¥228,585 million(Year ended March 31, 2010)
Stock (Securities) Listings Osaka, Tokyo (#4507)
Common Stock Authorized: 1,000,000,000 sharesIssued: 351,136,165 sharesNumber of shareholders: 29,439
Transfer Agent The Sumitomo Trust & Banking Co., Ltd.Stock Transfer Agency Department,5-33, Kitahama 4-chome,Chuo-ku, Osaka 541-0041, Japan
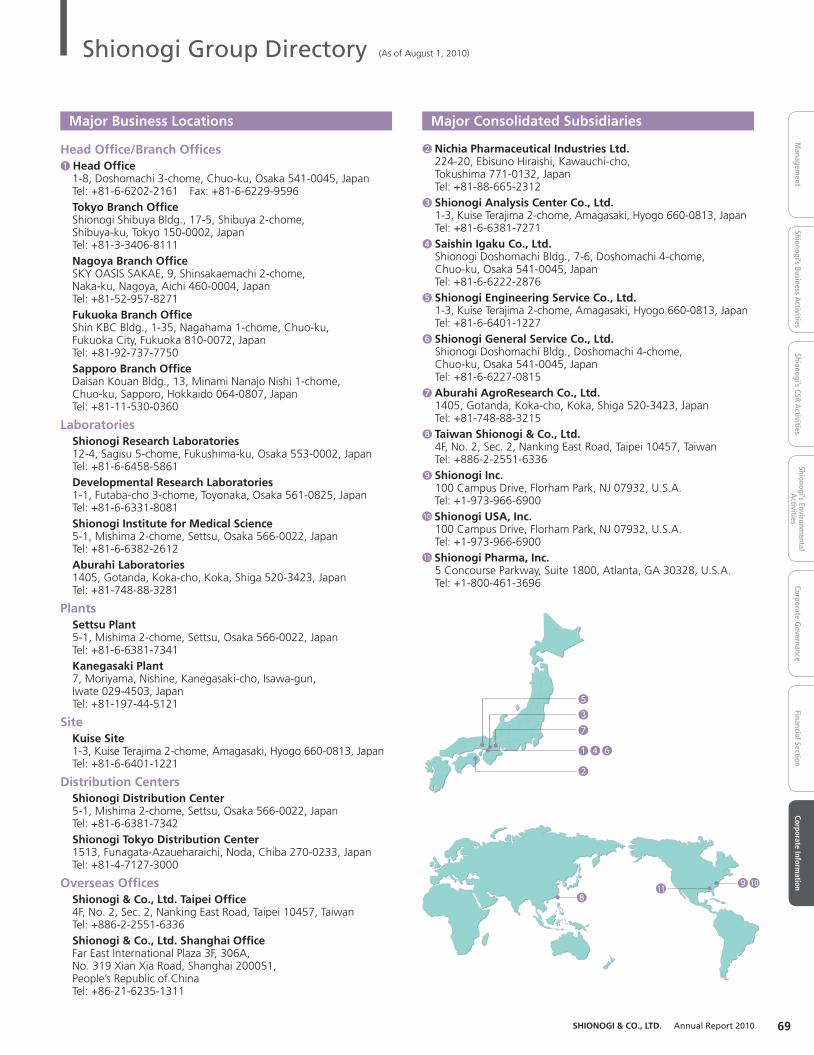
Shionogi Group Directory
Financial SectionCorporate Inform
ationM
anagement
Shionogi’s Business Activities
Shionogi’s CSR Activities
Shionogi’s Environmental
Activities
Corporate Governance
69SHIONOGI & CO., LTD. Annual Report 2010
(As of August 1, 2010)
❽❾
❶
❷
❹❻
❸❺
❼
1011
Head Offi ce/Branch Offi ces❶ Head Offi ce
1-8, Doshomachi 3-chome, Chuo-ku, Osaka 541-0045, JapanTel: +81-6-6202-2161 Fax: +81-6-6229-9596Tokyo Branch Offi ceShionogi Shibuya Bldg., 17-5, Shibuya 2-chome,Shibuya-ku, Tokyo 150-0002, JapanTel: +81-3-3406-8111Nagoya Branch Offi ceSKY OASIS SAKAE, 9, Shinsakaemachi 2-chome,Naka-ku, Nagoya, Aichi 460-0004, JapanTel: +81-52-957-8271Fukuoka Branch Offi ceShin KBC Bldg., 1-35, Nagahama 1-chome, Chuo-ku,Fukuoka City, Fukuoka 810-0072, JapanTel: +81-92-737-7750Sapporo Branch Offi ceDaisan Kouan Bldg., 13, Minami Nanajo Nishi 1-chome,Chuo-ku, Sapporo, Hokkaido 064-0807, JapanTel: +81-11-530-0360
LaboratoriesShionogi Research Laboratories12-4, Sagisu 5-chome, Fukushima-ku, Osaka 553-0002, JapanTel: +81-6-6458-5861Developmental Research Laboratories1-1, Futaba-cho 3-chome, Toyonaka, Osaka 561-0825, JapanTel: +81-6-6331-8081Shionogi Institute for Medical Science5-1, Mishima 2-chome, Settsu, Osaka 566-0022, JapanTel: +81-6-6382-2612Aburahi Laboratories1405, Gotanda, Koka-cho, Koka, Shiga 520-3423, JapanTel: +81-748-88-3281
PlantsSettsu Plant5-1, Mishima 2-chome, Settsu, Osaka 566-0022, JapanTel: +81-6-6381-7341Kanegasaki Plant7, Moriyama, Nishine, Kanegasaki-cho, Isawa-gun, Iwate 029-4503, JapanTel: +81-197-44-5121
SiteKuise Site1-3, Kuise Terajima 2-chome, Amagasaki, Hyogo 660-0813, JapanTel: +81-6-6401-1221
Distribution CentersShionogi Distribution Center5-1, Mishima 2-chome, Settsu, Osaka 566-0022, JapanTel: +81-6-6381-7342Shionogi Tokyo Distribution Center1513, Funagata-Azaueharaichi, Noda, Chiba 270-0233, JapanTel: +81-4-7127-3000
Overseas Offi cesShionogi & Co., Ltd. Taipei Offi ce4F, No. 2, Sec. 2, Nanking East Road, Taipei 10457, TaiwanTel: +886-2-2551-6336Shionogi & Co., Ltd. Shanghai Offi ceFar East International Plaza 3F, 306A,No. 319 Xian Xia Road, Shanghai 200051,People’s Republic of ChinaTel: +86-21-6235-1311
❷ Nichia Pharmaceutical Industries Ltd.224-20, Ebisuno Hiraishi, Kawauchi-cho, Tokushima 771-0132, JapanTel: +81-88-665-2312
❸ Shionogi Analysis Center Co., Ltd.1-3, Kuise Terajima 2-chome, Amagasaki, Hyogo 660-0813, JapanTel: +81-6-6381-7271
❹ Saishin Igaku Co., Ltd.Shionogi Doshomachi Bldg., 7-6, Doshomachi 4-chome,Chuo-ku, Osaka 541-0045, JapanTel: +81-6-6222-2876
❺ Shionogi Engineering Service Co., Ltd.1-3, Kuise Terajima 2-chome, Amagasaki, Hyogo 660-0813, JapanTel: +81-6-6401-1227
❻ Shionogi General Service Co., Ltd.Shionogi Doshomachi Bldg., Doshomachi 4-chome,Chuo-ku, Osaka 541-0045, JapanTel: +81-6-6227-0815
❼ Aburahi AgroResearch Co., Ltd.1405, Gotanda, Koka-cho, Koka, Shiga 520-3423, JapanTel: +81-748-88-3215
❽ Taiwan Shionogi & Co., Ltd.4F, No. 2, Sec. 2, Nanking East Road, Taipei 10457, TaiwanTel: +886-2-2551-6336
❾ Shionogi Inc.100 Campus Drive, Florham Park, NJ 07932, U.S.A.Tel: +1-973-966-6900
10 Shionogi USA, Inc.100 Campus Drive, Florham Park, NJ 07932, U.S.A.Tel: +1-973-966-6900
11 Shionogi Pharma, Inc.5 Concourse Parkway, Suite 1800, Atlanta, GA 30328, U.S.A.Tel: +1-800-461-3696
Major Business Locations Major Consolidated Subsidiaries

Printed in Japan with soy ink on recycled paper
http://www.shionogi.co.jp/