annual report 2011 - s3.eu-central-1.amazonaws.com · our approach to corporate social...
TRANSCRIPT
ANNUALREPORT 2011

Vision, mission and values� 4Chairman’s letter� 6CEO’s letter� 8Consolidated figures – highlights� 10Corporate governance� 12 At a glance
Contents
01Management’s report of activities
Consolidated financial statements
Sustainability
Spanning the world
02030405
Financial review and analysis� 18Overall business review 22Compliance 30Maintenance and Engineering 32Flight Operations 34
Consolidated income statement 38Consolidated statement of comprehensive income 39Consolidated balance sheet 40Consolidated statement of cash flows 41Consolidated statement of changes in equity 42Notes to the consolidated financial statements 44Report of the Réviseur d’entreprises agréé 81
Environmental responsibility 84Social responsibility 92Reporting process and GRI 102
European trucking network 108Global route map 110
At a glance01
401 | Vision, mission and values
ANNUAL REPORT 2011 4 // 5
Vision, mission and values
Our visionTo become the undisputed global leader in air cargo
Our mission• To secure the profitability of our Company by providing freight forwarders with unrivaled competitive
advantage in their operations worldwide
• To secure and strengthen the Company’s position in a growing and changing air cargo market
• To add value for customers, shareholders and employees
Living our values: dedication, respect, integrityDedication
• We act as a team
• We perform to high standards
• We deliver on promises
Respect
• We live diversity and respect
• We respect personal privacy
• We provide a healthy and safe environment for others and ourselves
• We care for the environment
• We live our responsibility as a global corporate citizen
Integrity
• We compete fairly
• We avoid conflicts of interest
• We respect the law and act accordingly
• We protect our assets
• We handle information adequately
• We value our business partners
601 | Chairman’s letter
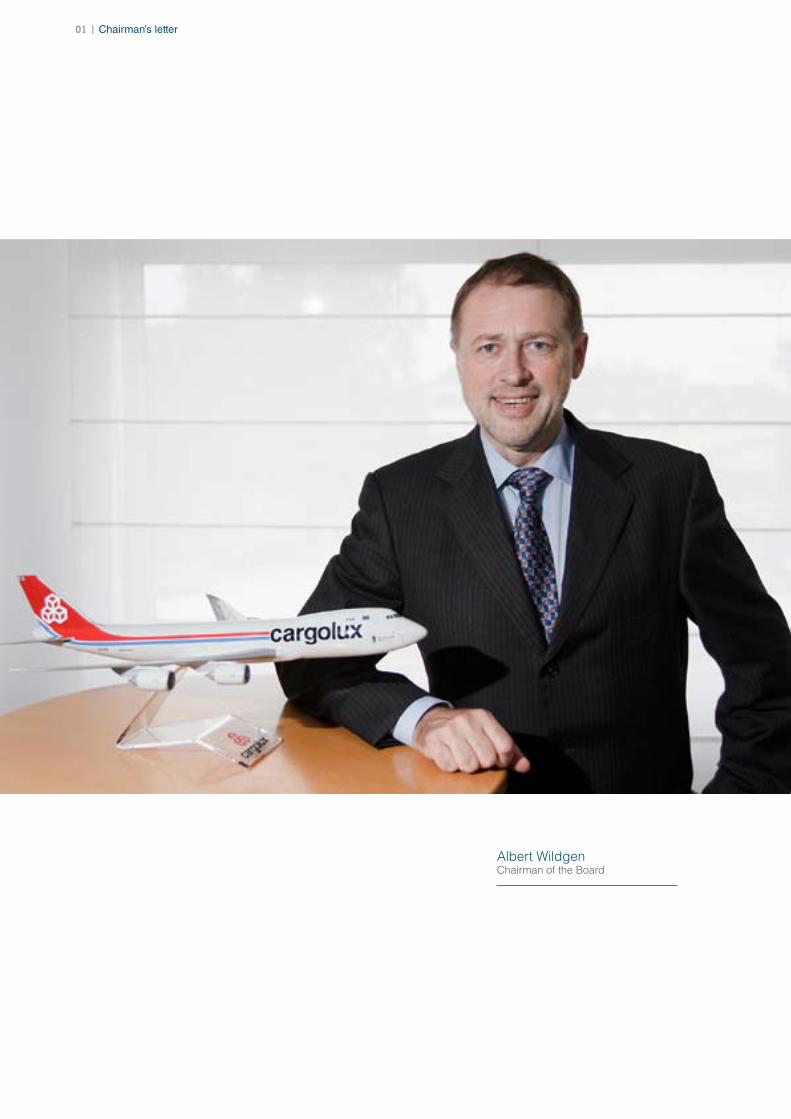
Albert Wildgen Chairman of the Board
ANNUAL REPORT 2011 6 // 7
Chairman’s letter
The previous Chairman’s letter covering the 2010 financial year commented on the remarkable recovery of the air cargo market following a disastrous year 2009.
Unfortunately, 2011 proved to be the opposite of the year before with demand for capacity turning out to be a reversal of 2010. On the other hand, a large amount of additional capacity was introduced into the market, especially through belly space on passenger flights, which greatly exceeded the additional demand generated by the traditional peak period in the industry in November and December.
Consequently for 2011 we recorded a loss of U$ 18.3 million against a profit of U$ 59.8 million in 2010. Management is concerned that the difficult conditions experienced in the last quarter of 2011 will continue into 2012. Hence they are monitoring the situation carefully and this is closely being reviewed by the Directors of the Company. The risk arising from the Eurozone financial crisis allied with the outlook of an economic downturn in the region could suppress any upward potential growth in the freight market. In addition, the oil price remains very high and the risk of a further massive price spike cannot be excluded if the geopolitical situation in the Middle East deteriorates further.
On a more positive note, the shareholding of the Company was restructured when Qatar Airways purchased a 35% stake in our airline, setting the stage for implementing a mutually beneficial commercial cooperation between the two partners. The partnership with one of the leading airlines in the world has opened up new possibilities for growth. Tapping into the extensive worldwide network of Qatar Airways and gaining access to both belly and complementary cargo capacity enables us to extend and improve our product offering to customers. We are highly confident that we will be able to develop this relationship for the benefit of both airlines.
Cargolux also finally took the Boeing 747-8 freighter into service in October 2011. As at year end, two Boeing 747-8 freighters were part of a fleet of 15 aircraft. The uncertainty over definite delivery dates being met by the manufacturer continues to be of concern to Cargolux as it places additional strain on resources during difficult times.
The compliance program initiated in 2011 is now well into its implementation and there is regular feedback to the Cargolux Board of Directors of the results of the program, including any issues raised and their resolution.
Last, but definitely not least, I would like to express my heartfelt thanks and appreciation to all the employees of Cargolux who demonstrated their commitment to the Company during these times of global economic uncertainty and volatility. In addition, my thanks and appreciation extends to all the customers, bankers and financial institutions that have stood by the Company all these years.
Luxembourg, March 12, 2012
801 | CEO’s letter
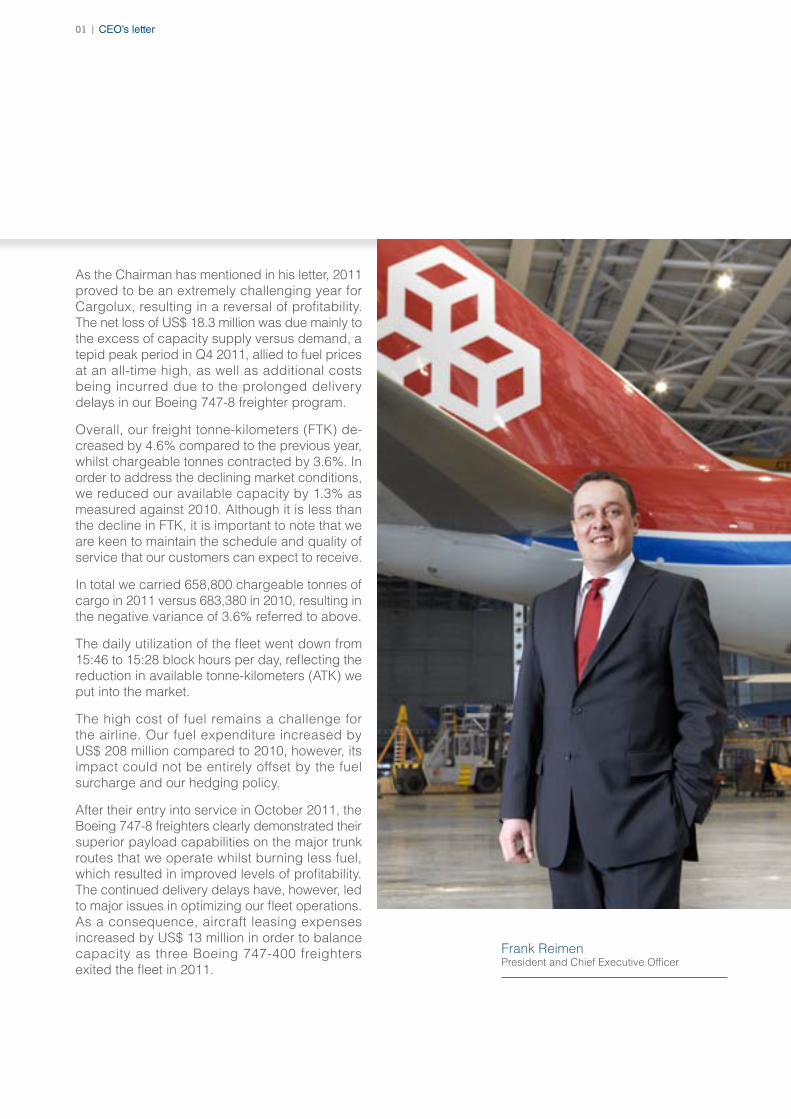
As the Chairman has mentioned in his letter, 2011 proved to be an extremely challenging year for Cargolux, resulting in a reversal of profitability. The net loss of US$ 18.3 million was due mainly to the excess of capacity supply versus demand, a tepid peak period in Q4 2011, allied to fuel prices at an all-time high, as well as additional costs being incurred due to the prolonged delivery delays in our Boeing 747-8 freighter program.
Overall, our freight tonne-kilometers (FTK) de-creased by 4.6% compared to the previous year, whilst chargeable tonnes contracted by 3.6%. In order to address the declining market conditions, we reduced our available capacity by 1.3% as measured against 2010. Although it is less than the decline in FTK, it is important to note that we are keen to maintain the schedule and quality of service that our customers can expect to receive.
In total we carried 658,800 chargeable tonnes of cargo in 2011 versus 683,380 in 2010, resulting in the negative variance of 3.6% referred to above.
The daily utilization of the fleet went down from 15:46 to 15:28 block hours per day, reflecting the reduction in available tonne-kilometers (ATK) we put into the market.
The high cost of fuel remains a challenge for the airline. Our fuel expenditure increased by US$ 208 million compared to 2010, however, its impact could not be entirely offset by the fuel surcharge and our hedging policy.
After their entry into service in October 2011, the Boeing 747-8 freighters clearly demonstrated their superior payload capabilities on the major trunk routes that we operate whilst burning less fuel, which resulted in improved levels of profitability. The continued delivery delays have, however, led to major issues in optimizing our fleet operations. As a consequence, aircraft leasing expenses increased by US$ 13 million in order to balance capacity as three Boeing 747-400 freighters exited the fleet in 2011.
Frank Reimen President and Chief Executive Officer
ANNUAL REPORT 2011 8 // 9
‘Compliance for Business’ (C4B), the Cargolux Compliance Program, continues to gain momentum throughout the Company and progress is monitored on a weekly basis by the Executive Committee. The revision of the Cargolux Ethics Code and the development of a broad array of complementary policies and guidelines offered us the opportunity to restate our firm commitment to corporate citizenship. It allowed us to emphasize that we must achieve business success sustainably and responsibly as we are aware that the impact of our work reaches well beyond the confines of our operations.
Our approach to corporate social responsibility, described fully in the CSR part of this annual report, is reflected in the many efforts deployed to lessen our impact on the environment and to engage with our internal and external stakeholders.
The introduction of our new shareholder, Qatar Airways, and the potential for synergies between the two companies present opportunities for the future.
As a consequence of the extreme volatility the market is experiencing, we are also conducting a review of our business model in terms of fleet plan, fleet usage optimization and cost structure, to ensure that Cargolux remains a profitable and sustainable business in the short, medium and long term. We expect 2012 to be another challenging year for the industry, exacerbated also by the increase in belly capacity from passenger aircraft operations. The impact of belly space on overall capacity should not be underestimated and unfortunately this leads to downward pressure on yields and load factors.
Accordingly, we have taken into account the tough market conditions in preparing the budget for the current year and have put in place contingency plans should the position deteriorate even further than our base assumptions.
On the positive side, we are prepared to react rapidly should the market rebound, as was the case in 2010.
The main objective for Cargolux during 2012 is to remain as flexible as possible and to react timeously and appropriately to any significant changes in the market and so reduce any negative impact on the Company or to take maximum advantage of any positive changes that do occur.
I would like to conclude by expressing my thanks and appreciation to all employees of Cargolux for the engagement, hard work and fighting spirit they exhibited during a very challenging 2011. This year is bound to be more challenging still, but I know that with their unabated support and commitment to the airline we will endure and even outperform.
I would also like to extend a special thank you to our shareholders, bankers, customers, authorities, and the Luxembourg government, and indeed to all our stakeholders, for their continued support of Cargolux.
Luxembourg, March 12, 2012
CEO’s letter
1001 | Consolidated figures – highlights
ANNUAL REPORT 2011 10 // 11
Consolidated figures – highlights
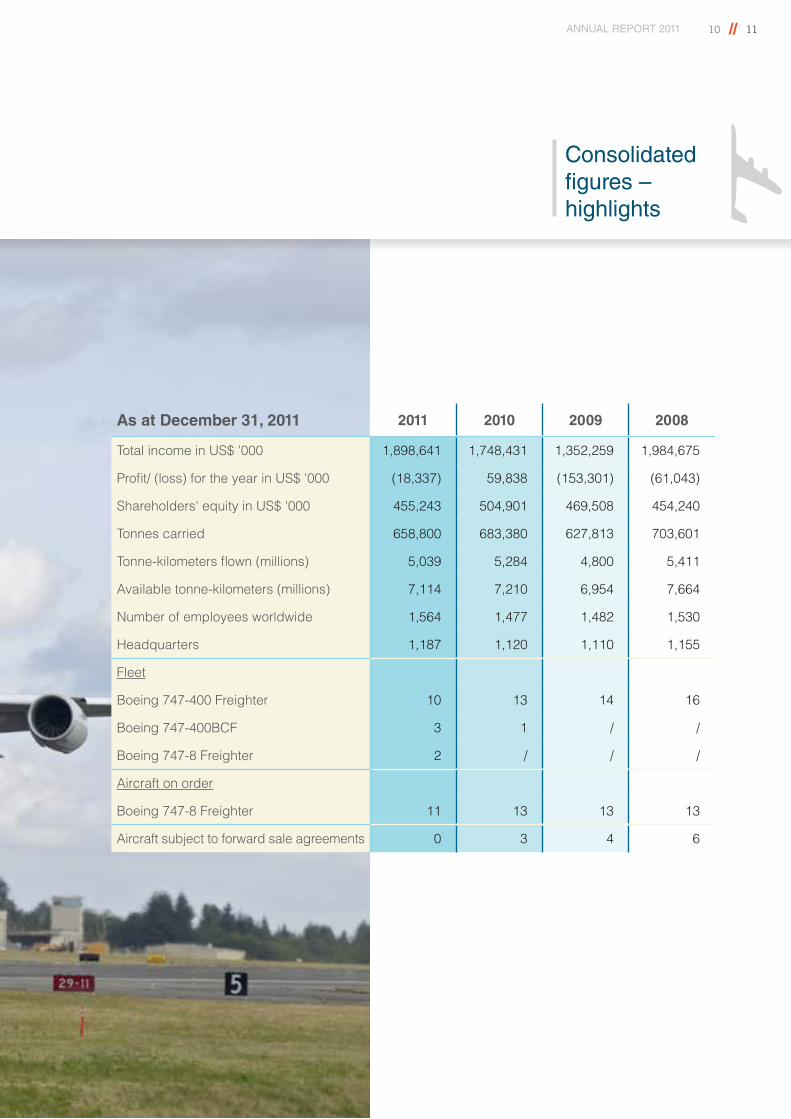
As at December 31, 2011 2011 2010 2009 2008
Total income in US$ '000 1,898,641 1,748,431 1,352,259 1,984,675
Profit/ (loss) for the year in US$ '000 (18,337) 59,838 (153,301) (61,043)
Shareholders' equity in US$ '000 455,243 504,901 469,508 454,240
Tonnes carried 658,800 683,380 627,813 703,601
Tonne-kilometers flown (millions) 5,039 5,284 4,800 5,411
Available tonne-kilometers (millions) 7,114 7,210 6,954 7,664
Number of employees worldwide 1,564 1,477 1,482 1,530
Headquarters 1,187 1,120 1,110 1,155
Fleet
Boeing 747-400 Freighter 10 13 14 16
Boeing 747-400BCF 3 1 / /
Boeing 747-8 Freighter 2 / / /
Aircraft on order
Boeing 747-8 Freighter 11 13 13 13
Aircraft subject to forward sale agreements 0 3 4 6
1201 | Corporate governance
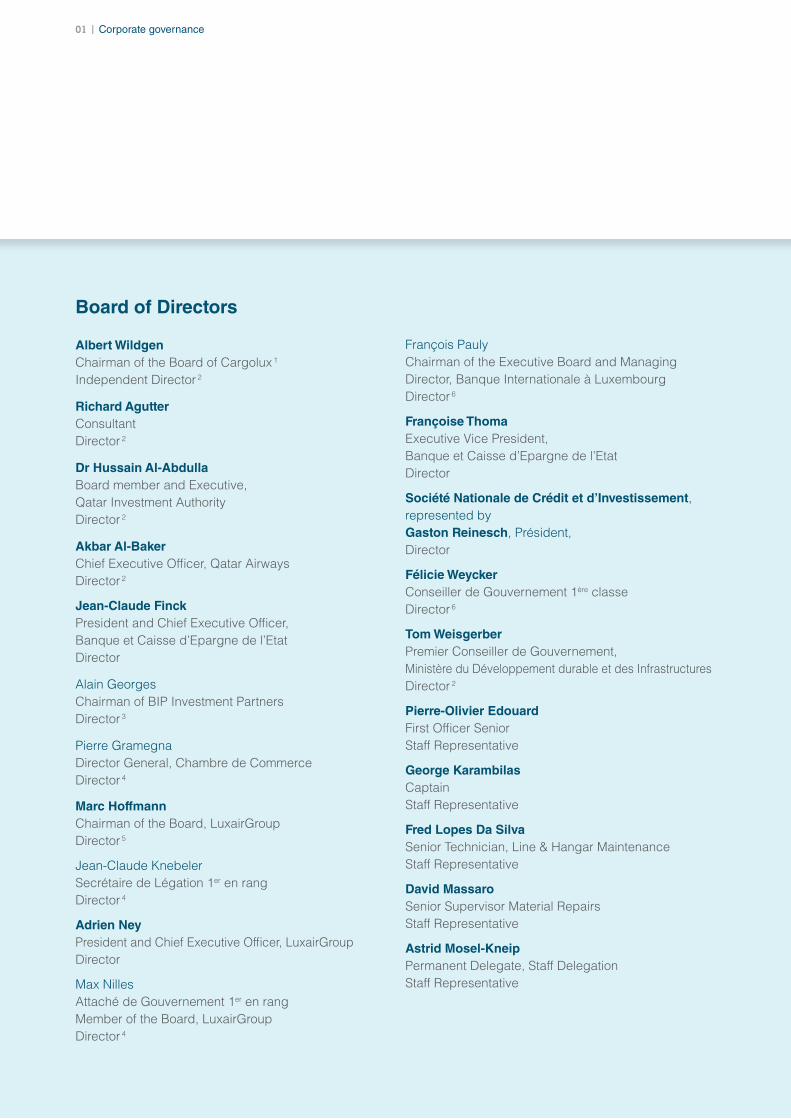
Board of Directors
Albert WildgenChairman of the Board of Cargolux 1
Independent Director 2
Richard AgutterConsultantDirector 2
Dr Hussain Al-AbdullaBoard member and Executive, Qatar Investment AuthorityDirector 2
Akbar Al-BakerChief Executive Officer, Qatar AirwaysDirector 2
Jean-Claude FinckPresident and Chief Executive Officer, Banque et Caisse d’Epargne de l’EtatDirector
Alain GeorgesChairman of BIP Investment PartnersDirector 3
Pierre GramegnaDirector General, Chambre de CommerceDirector 4
Marc HoffmannChairman of the Board, LuxairGroupDirector 5
Jean-Claude KnebelerSecrétaire de Légation 1er en rangDirector 4
Adrien NeyPresident and Chief Executive Officer, LuxairGroupDirector
Max NillesAttaché de Gouvernement 1er en rangMember of the Board, LuxairGroupDirector 4
François PaulyChairman of the Executive Board and Managing Director, Banque Internationale à LuxembourgDirector 6
Françoise Thoma Executive Vice President, Banque et Caisse d’Epargne de l’EtatDirector
Société Nationale de Crédit et d’Investissement, represented byGaston Reinesch, Président,Director
Félicie WeyckerConseiller de Gouvernement 1ère classeDirector 6
Tom WeisgerberPremier Conseiller de Gouvernement, Ministère du Développement durable et des InfrastructuresDirector 2
Pierre-Olivier EdouardFirst Officer SeniorStaff Representative
George KarambilasCaptainStaff Representative
Fred Lopes Da SilvaSenior Technician, Line & Hangar MaintenanceStaff Representative
David MassaroSenior Supervisor Material RepairsStaff Representative
Astrid Mosel-KneipPermanent Delegate, Staff DelegationStaff Representative
ANNUAL REPORT 2011 12 // 13
Strategy Committee 4
Marc Hoffmann, Chairman of the CommitteeJean-Claude FinckPierre GramegnaFrançois Pauly6
Gaston ReineschFélicie Weycker6
Shareholders’ Strategic Committee1
Albert Wildgen, Chairman of the CommitteeAkbar Al-Baker, MemberMarc Hoffmann, MemberRichard Agutter, Alternate to Akbar Al-BakerGiles Agutter, Alternate to Akbar Al-BakerJean Claude Finck, Alternate to Marc HoffmannAdrien Ney, Alternate to Marc Hoffmann
Compensation Committee
Marc Hoffmann, Chairman of the CommitteeAkbar Al-Baker1 Jean-Claude FinckAlain Georges3
Pierre Gramegna1
François Pauly6 Max Nilles4 Gaston Reinesch7
Félicie Weycker6
Audit Committee
Richard Agutter, Chairman of the Committee1
Marc Hoffmann, Chairman of the Committee5
Jean-Claude Finck5
Alain Georges3
Pierre Gramegna4
Adrien Ney1
Max Nilles4
François Pauly6
Gaston ReineschFrançoise Thoma1
Félicie Weycker6
Corporate governance as at December 31, 2011
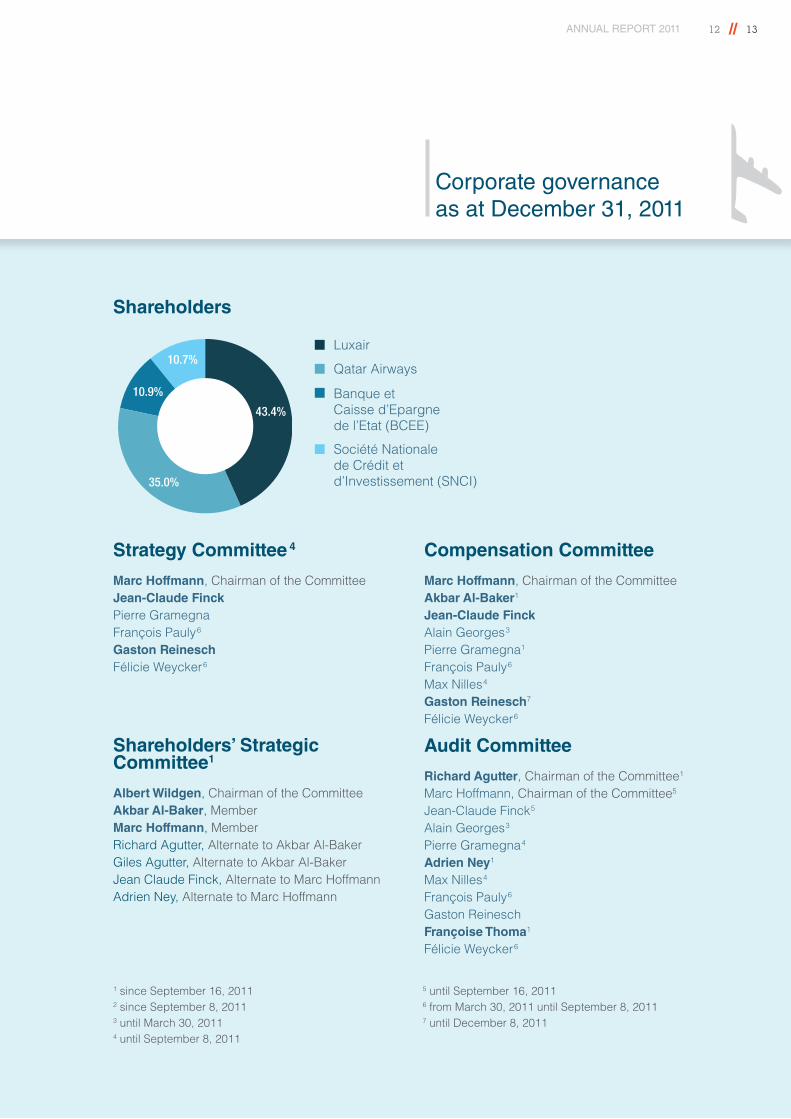
Shareholders
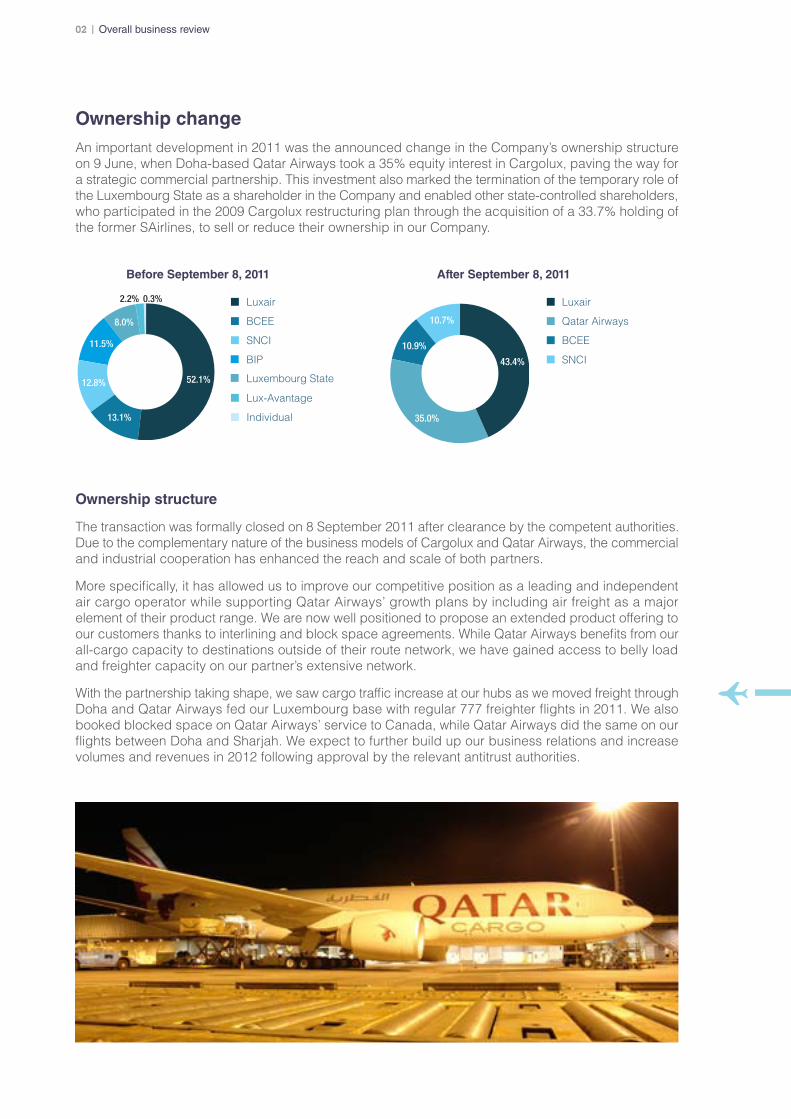
43.4%
10.7%
10.9%
35.0%
Luxair
Qatar Airways
Banque et Caisse d’Epargne de l’Etat (BCEE)
Société Nationale de Crédit et d’Investissement (SNCI)
1 since September 16, 20112 since September 8, 20113 until March 30, 20114 until September 8, 2011
5 until September 16, 20116 from March 30, 2011 until September 8, 20117 until December 8, 2011
1401 | Corporate governance
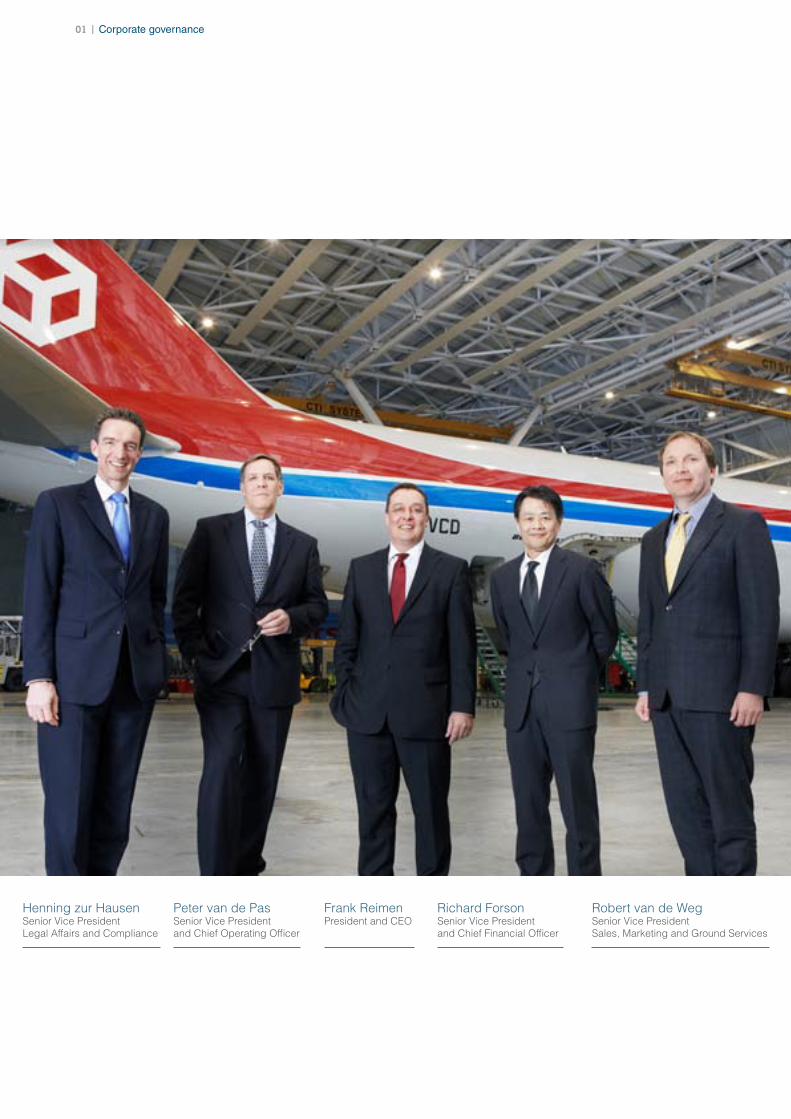
Frank Reimen President and CEO
Peter van de Pas Senior Vice President and Chief Operating Officer
Henning zur Hausen Senior Vice President Legal Affairs and Compliance
Robert van de Weg Senior Vice President Sales, Marketing and Ground Services
Richard Forson Senior Vice President and Chief Financial Officer
ANNUAL REPORT 2011 14 // 15
Corporate governance as at December 31, 2011
Executive Committee
Frank ReimenPresident and Chief Executive Officer
David Arendt1
Executive Vice President and Chief Financial Officer
Richard Forson2
Senior Vice President and Chief Financial Officer
Robert van de WegSenior Vice President Sales & Marketing
Peter van de PasSenior Vice President and Chief Operating Officer
Henning zur HausenSenior Vice President Legal Affairs and Compliance
1 until December 31, 20112 since February 6, 2012
Management’s report of activities02
1802 | Financial review and analysis as at 31 December 2011
GeneralFollowing the abyss of 2009 and the remarkable air cargo market recovery during 2010, the year 2011 was again a difficult and challenging year for the Company. As the recovery of 2010 was due to a combination of demand increases followed by price rises, the basis was set for a positive market environment during the first quarter of the year under review. As from the second quarter onwards, however, demand slowed down and the gap between capacity and demand increased resulting in a depressed second half where even the traditional high season could not trigger enough demand to offset overcapacity. Additionally, the Company suffered from record high fuel prices and saw total fuel cost rise to almost 50% of total operating expenses. The continued delays in the Boeing 747-8 program hampered expected improvements in operational efficiency and led to increased wet-leasing costs and reduced network flexibility. Consequently, the Company reported a net consolidated loss of US$ 18.3 million for the year under review.
Key performance indicators1
Capacity, as measured by ATK, decreased by 1.3%, reflecting the weakening demand for air freight during the year. Due to the
delayed deliveries of the Boeing 747-8 freighter, the Cargolux fleet is currently in a transition phase. In addition to the three Boeing 747-400 freighter aircraft sold to UPS and Silk Way in 2009 and 2010, three more left the fleet in 2011: LX-GCV and LX-LCV went to UPS in January/February and LX-NCV left the fleet to Silk Way in September. With the first two Boeing 747-8 freighters arriving only in October 2011, the capacity of the sold aircraft had to be bridged by a less efficient mix of dry-leased Boeing 747-400BCF (Boeing Converted Freighter) - LX-ZCV, LX-ACV and LX-DCV -, a wet-leased Boeing 747-400BDSF (Bedek Special Freighter), a Boeing 747-400BCF and a Boeing 747-200SF (Special Freighter), respectively.
While overall block hours remained relatively flat (-0.5% vs. 2010), the share of owned aircraft in the fleet, Boeing 747-400 and 747-8 freighters, decreased from 92.5% in 2010 to 75.3% in 2011. All wet-leased capacity was terminated by the end of 2011. The dry-leased Boeing 747-400BCF accounted for 14.5% of all block hours in 2011, up from 4.1% in 2010, whereas the share of wet-leased flights grew from 3.4% in 2010 to 10.2% in 2011. The average daily utilization of the Company’s fleet, excluding wet-leased aircraft, decreased to 15:28 block hours, down 1.9% from 2010 levels.
The Company’s production, as measured by FTK, decreased by 4.6% in 2011, reflecting the significantly reduced demand, particularly in the fourth quarter. Load factors dropped by 2.5 percentage points to 70.8%.
Average system yield (USD/kg), including the fuel surcharge (up 50.5%/kg due to the massive rise of fuel cost), increased by 11.6% versus 2010. Tonnages sold decreased by 3.6% to 658,800 tonnes across the Cargolux network. Asian exports, where the chargeable tonnage declined by 15.4%, and Africa with a 14.3% fall were particularly affected. On the other hand, export tonnage out of the Americas grew by 10.1% while Europe and Middle East stayed relatively flat (+0.8%).
1 Including Cargolux Italia
ANNUAL REPORT 2011 18 // 19
Financial review and analysis as at December 31, 2011
Markets and network2
2011 was marked by an increasing overcapacity in the international air freight markets: IATA noted a capacity increase of 5.2% vs. 2010 while demand, measured in FTK, decreased by 0.5%. The capacity growth was particularly driven by belly carriers, who significantly increased the number of wide-body passenger flights due to continuous strong passenger demand (+6.9%). The negative capacity gap had a detrimental effect on load factors, yields and profitability across the air freight industry in particular in exports markets in Asia and the Middle East.
In addition to the overcapacity on the international air freight markets, the Company had to confront other challenges including:
• The Boeing 747-8 freighter delay causing the use of an unfavorable, less efficient fleet mix of owned, dry- and wet-leased aircraft to bridge the capacity gap caused by the delay in the 747-8 program.
• Record-high fuel prices of around 1,010 US$/tonne average.
• A weakening global economy, in particular in the United States and the Euro Zone, negatively impacting consumer spending, thus demand for goods from Asia to Europe and the USA.
Network management was dynamic to account for the changes in traffic flows. The Company shifted capacity from Asia to North and South America and opened a new service, directly linking the USA with Africa. Flights ex Northern Asia to Europe were increasingly routed via Novosibirsk rather than Almaty, positively impacting the cost structure of these services.
Consolidation As in the prior year, the Company presents consolidated accounts in addition to parent company accounts. The consolidated accounts comprise Cargolux RE S.A., a captive reinsurance company, Cargolux Italia S.p.A., an Italian all cargo airline and an Italian investment company, Italia Aerologistics S.R.L.. In addition, the Company equity accounts its participations in Champ Cargosystems S.A. (49%), Freighter Leasing S.A. (33.3%) and a joint venture, Global Aviation Technical Solutions GB (BVI) Ltd (50%), established during the year 2011. During 2011, the Company sold its participation of 30% held in Luxfuel S.A..
Income statement3
Revenues increased by 8.4% from US$ 1,722.6 million to US$ 1,867.4 million. On a yearly average the Euro strengthened versus the US dollar (+4.9%) which had a positive impact on the revenues.
However, towards the end of the year, the exchange rate decreased below the level of the prior year, which had a negative impact on the fourth quarter.
Other Operating Income increased to US$ 31.2 million from US$ 25.9 million in 2010 mainly due to capital gains derived from the sale of two Boeing 747-400 freighters and the sale of an investment in an associate.
2 Including Cargolux Italia3 Consolidated
2002 | Financial review and analysis as at 31 December 2011
Aircraft Lease Expenses went up by US$ 13.2 million or 17.1%. The main reason for the increase were higher wet lease costs triggered by leased-in capacity to compensate for exits from the fleet and further delivery delays of the Boeing 747-8 freighter aircraft.
Aircraft Maintenance Expenses increased by 0.6% to US$ 109.6 million from US$ 108.9 million. Despite less block hours in 2011, costs remained at the same level than 2010 due to high utilization of dry-leased aircraft (engines reserves specifically). Other Aircraft Expenses mainly represent premiums paid to insure the Company’s fleet and increased by 5.6% to US$ 4.6 million.
Depreciation decreased by 4.6% to US$ 56.5 million, due to the sale of LX-MCV in October 2010.
Fuel Cost (including the result of fuel hedging) increased by 31.4% to US$ 869.6 million and represented 46.2% of total cost.
Personnel Costs and Benefits went up by 10.1% to US$ 241.5 million. In Euro terms the salary of all Luxembourg-based staff went up by 8.0% reflecting a headcount increase, a Collective Work Agreement (CWA) time unit increase and a mandatory salary indexation which became effective in October 2011.
Handling, Landing and Overflying costs increased by 2.6% to US$ 259.2 million in 2011.
Handling charges went up by 1.6%. The impact of the foreign exchange (+2.7%) was mitigated by less cycles flown (-1.0%) and a lower unit rate (-1.7%).
Landing charges increased by 5.2%, driven by a significant unit rate increase of 4.3% (mainly influenced by the introduction of the Boeing 747-8 freighter with a maximum take-off weight (MTOW) of +11.6% vs. the Boeing 747-400 freighter) and an unfavorable foreign exchange impact of +1.8%. This increase was partially mitigated by a lower number of cycles flown (-1.0%). Overflying costs increased by 3.0% mainly driven by a currency impact of +2.7% and mitigated by a reduction of block hours flown (-0.9%). The unit rate stayed stable.
Trucking, Truck Handling and Interlining costs increased by 3.8% to US$ 106.8 million in 2011.
Trucking and Truck Handling costs went up by 2.2%. The unfavorable currency impact (+4.2%) and the unit rate increase (0.7%) were mitigated by a lower tonnage carried (-3.7%). Interlining costs went up by 0.2%, driven by a unit rate increase of 4.0% and counterbalanced by a lower tonnage carried (-3.7%).
Other Operating Expenses, including inter alia GSA commissions, IT services, travel & entertainment, office rental and equipment, legal, audit and consulting fees, telecommunication expenses and net worth tax, decreased by 3.9% to US$ 144.5 million.
Taking all of the preceding into account, EBIT for the year was US$ 15.5 million compared to US$ 111.6 million in 2010. The EBIT margin was 0.8% and thus insufficient to cover the Company’s estimated cost of capital of 6%.
Financial Income increased by 22.9% to US$ 16.9 million. Financial Expenses decreased by 23.4% to US$ 41.4 million. The movement in Financial Expenses was mainly due to the sale of two Boeing 747-400 freighters, namely LX-MCV and LX-NCV. Net Finance Costs were US$ 24.5 million (2010: US$ 40.3 million).
The consolidated Loss before Tax was US$ 8.9 million (2010: Profit before Tax was US$ 76.0 million) and the consolidated net after tax loss was US$ 18.3 million (2010: Profit of US$ 59.8 million).
Tax adjustmentsCurrent Tax for the year amounted to US$ 0.5 million (2010: US$ 0.007 million). As in 2010, the Company accounted for an adjustment of deferred taxes. The main reason for the US$ 8.9 million (2010: US$ 16.2 million) adjustment in 2011 is the consequence of the use of tax losses as well as taxes being assessed on the basis of a tax balance sheet which requires significant accounting changes from IFRS.
After these adjustments, the consolidated net after tax loss for 2011 was US$ 18.3 million (2010: Profit of US$ 59.8 million).
ANNUAL REPORT 2011 20 // 21
Balance sheetTotal Assets went up 21.9% to US$ 1,906.8 million from US$ 1,563.9 million mainly due to the acquisition of two Boeing 747-8 freighter aircraft. Shareholders’ Equity decreased by 9.8% to US$ 455.2 million from US$ 504.9 million.
Interest bearing liabilities (including finance leases) increased by 92.1% to US$ 830.2 million from US$ 432.2 million mainly due to the financing of the two Boeing 747-8 freighter aircraft. Cash and cash equivalents and Other Investments increased by 5.9% from US$ 320.5 million to US$ 339.5 million. Net financial gearing amounted to 107.8% (2010: 22.1%) and net adjusted gearing (to take into account the present value of future operating lease payments) was 134.8% (2010: 57.4%).
Fleet developmentIn 2011, due to the continuously prolonged delivery delays of the Boeing 747-8 freighter, Cargolux had to deal with an unfavorable fleet mix throughout the entire year, operating Boeing 747-400 freighters, dry-leased Boeing 747-400BCF and expensive wet-leased capacity. Indeed, three Boeing 747-400 freighters exited the fleet before the first Boeing 747-8 freighter arrived. On October 12 and 13, 2011, the Company finally took delivery of its first two Boeing 747-8 freighters, LX-VCB and LX-VCD, the first 747-8F to enter operational service with any airline.
In 2012, the Company will require as much fleet flexibility as possible given current market uncertainty. Air cargo demand and Company performance will ultimately determine the capacity required.
Branch networkThe Company operates worldwide through a network of branches established in 31 countries (2010:31).
Outlook and recent developmentsFollowing the 2011 operating loss and the very challenging market environment expected for 2012, the Company’s 2012 budget foresees another operating loss despite the significant cost reduction and revenue enhancement program that the Company has initiated early 2012. These measures are reflected in a comprehensive action plan and are monitored and adapted on a regular basis.
In the 2012 budget, all committed credit facilities are expected to remain unused. Such committed credit lines amounted in the aggregate to US$ 54.1 million at year end 2011 (reduced to US$ 46 million in the first quarter of 2012). Throughout 2012, the Company expects its non-restricted cash to remain above the US$ 100 million level.
The management of Cargolux further refer to footnote 5 to the financial statements attached to this report, outlining the risk factors that might affect the Company as a growing concern. As highlighted in the budget approved by the Board of Directors, the Company will face challenges not only linked to low or negative air cargo growth but also to the introduction into its fleet of the Boeing 747-8 freighter.
The Company continuously monitors the environment for other risks and in respect of those under our control, has in place existing safeguards, including legal and operational compliance reviews, aircraft maintenance quality programs and IT security measures to protect against unauthorized entry into our systems. Our Aircraft and Third Party Liability insurance coverage is also in line with industry best practice and satisfies specific financing contractual obligations.
As regards instances of events out of our control, such as occurred when volcanic ash clouds disrupted flight operations, these tend to affect the industry as a whole and Cargolux would work together with the relevant authorities, including other airlines, to ensure the minimum disruption to normal operations.
2202 | Overall business review
ANNUAL REPORT 2011 22 // 23
Overall business review
While 2010 was a year of recovery for the industry, 2011 quickly developed into a very difficult time for our business. It started reasonably well, but the supply/demand balance soon deteriorated and market growth turned into decline around the middle of 2011, while global cargo capacity continued to grow. This put pressure on both load factor and yields. We registered the biggest impact in Asia, where overcapacity was mostly felt. Slumping consumer confidence in Europe and the United States caused a slowdown in demand for ex Asia and further amplified the adverse impact of excess capacity on Area 3.
While other markets were also affected, some markets, noticeably Brazil, even continued to flourish during the year. Export/import traffic between Europe and the United States was satisfactory and we also saw a healthy demand to the Middle East.
Exports from Europe were relatively strong, in fact, Germany had a record year in exports and traffic to Asia was stable. In short, the weak economy mostly affected our import business into Europe, mainly out of Asia, but also from flower markets like Kenya and Ecuador.
The above resulted in a decline in block hours of 7.5% to 77,294. The daily aircraft utilization reached 15:28 hours, a slight fall of 1.9%. This figure is for the Cargolux fleet only, including dry-leases but excluding wet-leases. Load factors also declined slightly to 70.8%. Freight tonne-kilometers (FTK) dropped 4.6% and reached 5.04 billion against 5.3 billion in 2010, while available tonne-kilometers (ATK) reached 7.1 billion, a reduction of 1.33% against 2010.
A big challenge was the delayed delivery of our Boeing 747-8 freighters. As a consequence, we had to use wet-leased capacity, which is not only expensive, but also reduces our operational flexibility.
In 2011, Cargolux Airlines and Cargolux Italia carried 658,800 tonnes of cargo, 3.6% less than in the previous year.
NetworkWith the unfolding supply/demand problem, we continuously shifted our network around. For example, we introduced a new tailor-made flight from Shanghai to Luxembourg with direct transfer connections to São Paulo, Brazil. We added a fifth frequency between Hong Kong and Budapest and introduced a new Komatsu – Chicago – New York service in October. We increased our capacity to the United States, growing our business in certain markets by around 50% and we added direct flights between the US and Africa. We reduced our capacity out of Asia mainly by operating fewer frequencies.
Because European inbound demand was weak, we leveraged our network out of Luxembourg and actively marketed these network destinations in the Asian and US markets.
Area by areaArea 1 – The Americas
Even though 2011 proved difficult for the industry as a whole and the Asian markets in particular, Cargolux managed a significant growth in its Area 1, the Americas. It was especially noticeable in North America, where we enjoyed a growth of 9,800 tonnes over 2010. This was attributable to the capacity we increased, mainly in New York, Houston, Atlanta and Los Angeles.
2402 | Overall business review
Cargolux is a major supplier of capacity in the North American market, providing over 2,500 tonnes per week from 12 destinations: Calgary, Seattle, Los Angeles, Chicago, Huntsville, Indianapolis, Houston, Miami, New York, Atlanta, Mexico City and Guadalajara.
We continued to operate four weekly transpacific flights out of North America and initiated direct services to Africa, connecting Houston and New York with Lagos and Accra. Additionally, we saw strong customer support on our direct services to Milan, Italy.
In Central America, we added a second flight to Guadalajara to satisfy the strong demand for additional mid-week capacity.
Area 1 once again significantly supported our network with a total of 36,380 tonnes that were moved beyond Luxembourg on scheduled Cargolux services. This represents an increase of 14% over the previous year. Despite the economic difficulties and the resulting market pressure in 2011, North America could slightly increase its yields over 2010.
In South America, we saw a major increase in our services, moving an additional 3,600 tonnes compared to 2010. This 35% increase marks a significant achievement in a very competitive market. Brazil, especially, was very successful and we could profit from its continuing export growth by adding additional capacity. In the final quarter of 2011, we started an additional direct service from Quito and Bogota to Maastricht. This service shortens the transit time for perishable products by 24 hours and positions Cargolux as an important service provider in this increasingly competitive market segment.
The total revenue in Area 1 exceeded US$ 334 million, an increase of 19.7% against 2010. It is the largest contribution that Area 1 has ever made to the Company’s performance.
Area 2 – Europe, Middle East & Central Asia
Faced with good European exports but declining imports, Area 2 focused on reaching a status quo in tonnage and striving to maximize revenues. We saw satisfying loads throughout the year and registered substantial growth in the major markets, in particular in Switzerland, Germany, France, the United Kingdom, Italy and the Netherlands.
With a total of 286,000 tonnes, Europe, Middle East and Central Asia achieved 44% of the production of Cargolux, a slight improvement over 2010. We were able to increase our tonnage to higher yield destinations, resulting in a healthy 30.5% rise in revenues to US$ 706.6 million.
In line with its capacity allocation, 34% of the Area 2 production was going to Asia, but generated only 25% of the total area revenue. With an increase of 14% over 2010, 35% of the Area 2 production went to the American continent, generating 43% of the income. It was mainly driven by the growing demand in Central and South America.
As in 2009, North and South America proved to be the biggest markets for exports from Area 2. The highest growth was achieved in Brazil.
In the Middle East, we faced fierce competition and a decline in sea-air traffic. This had a negative impact on our production in Dubai and loads were lower than in 2010.
As a result of the European debt crisis, we reduced our capacity from Europe into Asia during the year. Nevertheless, we grew our export tonnage to Asia by 2%. The decline in markets such as Bangkok, Hong Kong and Shanghai was partially compensated by rising demand in Japan, Vietnam and Korea.
One of the Company’s strengths is the transport of heavy and outsized cargo. The fact that we operated a mixed fleet of Boeing aircraft composed of 747-400F, 747-400BCF and 747-8F during 2011 proved to be a challenge, because some of these aircraft lacked the nose cargo door and could not accommodate outsized cargo such as long oil drilling equipment. Coupled with the weak conditions on the global markets, this made for some difficult situations.
In other commodities, we saw a continued growth in temperature-controlled shipments, in particular pharmaceuticals flown out of Europe.
ANNUAL REPORT 2011 24 // 25
Area 3 – Asia Pacific
If the beginning of 2011 can be described as spring time, winter came too early in the middle of the second quarter and lasted until the end of the year. Indeed, just like other industries, the air cargo business in the Asia-Pacific region experienced many problems that can be attributed to the decline of the economy, particularly in Europe. The Greater China market remained one of the key spotlights. The direct flights to Barcelona and Budapest secured sufficient loads out of Hong Kong, while the Hong Kong transpacific flights were re-routed to reduce capacity and to share some freighter space with stations such as Japan and Singapore, thus protecting our yields.
Competition in the Shanghai market was severe and we counteracted by routing flights through Bangkok. Later in the year, we operated directly to Luxembourg without a technical stop en route. In a successful campaign, Area 3 promoted services via Luxembourg to Viracopos, which has proven to be a popular cargo destination. Beijing and Xiamen both have steadily served our local and regional customers with niche services to South America, the Middle East and Africa. Taiwan remained stable and competitive, supported by long-term business partners.
We saw signs of overcapacity in the South East region because too much capacity was diverted there in the wake of reduced exports out of China. Our operations in Singapore, Kuala Lumpur and Bangkok were well supported by long-term customers that had blocked-space agreements in place. The flood in Thailand towards the end of the year only caused little interruption to our operation. Bangkok enjoyed increasing demand to Viracopos, geographically supporting the Area’s network.
Traffic in Vietnam, a market of promising potential, showed a shift from Ho Chi Minh City to Hanoi in the second half of the year. The Area shifted capacity accordingly, launching a second frequency out of Hanoi towards the end of the year.
Our operation in Komatsu was not affected by the devastating earthquake in Japan in March 2011 and we are grateful that our Japanese staff remained unharmed. Export volume from Japan quickly showed a healthy recovery. Similar to other markets, Korea was under severe price pressure; however, the steady South American, African and Middle East traffic sustained the operation. Being the General Sales Agent (GSA) for Cargolux Italia, Hong Kong and Japan have served the competitive Italian markets well. This supported the Japan operation in its growth.
Throughout the year, the Area produced a total of 173,748 tonnes of cargo, 15.4% less than in 2010. Revenue declined by 11.6% to US$ 673.4 million.
To sustain its activities during the economic downturn, we reacted strategically, avoided competition downward spiral and ensured positive flight results. Determined to cope with the inevitable economic cycles, the Area expects a return to strength in the near future. Paying close attention to customer needs and market developments as well as exploring new potential markets has proven to be a sound strategy.
2602 | Overall business review
Area 4 – Africa
In 2011, the African markets gave mixed signals. On one hand, we saw a steady continuity in imports and key commodities, such as oil and gas equipment, IT and pharmaceutical goods showed positive growth. A successful new direct service from the US gateway Houston via New York to Accra and Lagos in West Africa highlighted the rising demand for shipments to Africa.
On the other hand, export markets from Africa took a hit. While South Africa was still doing fairly well, Kenya’s and Egypt’s perishable exports suffered substantially. Flower exports to Europe declined noticeably. After the geopolitical trouble in Libya and Egypt, buyers turned to other countries such as Morocco for their perishable needs.
While growers in Egypt were caught between political unrest and a decline in demand for their goods, Kenya experienced another kind of market pressure. Following the downturn in Asia, a number of carriers, mainly from the Middle East, shifted their excess capacity to Africa, which created an overcapacity situation in Nairobi.
Despite Africa’s positive imports in 2011, the negative development on our northbound services made for a challenging situation that resulted in a 9.6% decline in revenue to US$ 76 million, even though yields grew. Tonnage declined by 14.3% and reached 48,933 tonnes.
Data suggest that some parts of the continent are experiencing fast growth and overall, Africa’s economic growth is expected to reach as much as 5.8% in 2012, despite the current global economic recession.
Cargolux has actively supported this growing economy since the early 1970s and has regularly expanded its network to serve nine countries and many more via interlining and trucking agreements today.
Out of Kinshasa, Cargolux offers on-demand connections to Cabinda, while Pointe Noire is served out of Brazzaville and Conakry via Abidjan.
Our flights to Libreville enable us to offer multimodal connections to Port Gentil, the center of Gabon’s petroleum and timber industries.
Out of Johannesburg, a large choice of connections is available, such as daily connections to Windhoek and to Walvis Bay in Namibia to Gaborone in Tanzania and finally, to Lusaka in Zambia. Luanda in Angola, Maputo in Mozambique, Lusaka in Zambia, Entebbe in Uganda, Dar es Salaam in Tanzania and Harare in Zimbabwe are also served in co-operation with South African Airways.
Lagos, finally, is the ideal destination in the Cargolux network to connect to Port Harcourt, a major Petroleum center in Nigeria and to Abuja, the capital city.
CharterThe charter business continued to be an important segment of our business in 2011. However, we saw a geographical shift of charter activities and, fuelled by overcapacity, a highly contested charter market.
During the first few months of the year, charter activities mainly concentrated on requests from Africa, which became the most important market throughout 2011, with over half of our charter flights operating there.
Towards the middle of the year, our activities became more balanced with flights to the US, Middle East and Australia, while the final months saw a strong demand for charters to South America.
For the first time in our history, we did not operate any charters from Asia during the Asian high season, a sure sign of the weakness of Asian markets in 2011. Even the improving business in October and November did not generate enough traffic to outgrow capacity.
Our competitiveness, resulting from the close cooperation with the sales staff in our Areas, as well as a flexible network and state-of-the-art equipment, allowed us to secure our share of this lucrative business and operate the same amount of ad-hoc charters as in 2010.
ANNUAL REPORT 2011 26 // 27
We were active in a number of charter projects such as Formula One charters, the MotoGP or a series of flights to Nigeria with telecom equipment, but commodities flown on charter flights ranged from oil drilling equipment, pharmaceuticals, relief goods, livestock and perishables to art and valuable cargo.
Cargolux Italia2011 was a pivotal and challenging year for Cargolux Italia. Because its business is very much geared towards Asia, it was disproportionally affected by the same dynamics as Cargolux Airlines, mainly suffering from market overcapacity and the already mentioned supply/demand imbalance.
Initially, the relatively good market demand experienced in 2010 continued into the first quarter 2011. Until summer, demand slowed down and the year developed into a depressed autumn, in stark contrast to the usual business cycles.
In a positive development, Italian exports continued to grow throughout the year, consolidating the market leadership of Cargolux Italia in Italy, the second biggest air freight market in Europe. In fact, in October 2011, Italy showed the highest export figure ever achieved by the group with 4,962 tonnes.
Cargolux Italia opened new services to Brazil in October 2011 and operated two weekly flights with wet-leased equipment, taking advantage of the strong demand for capacity from Italy to Brazil.
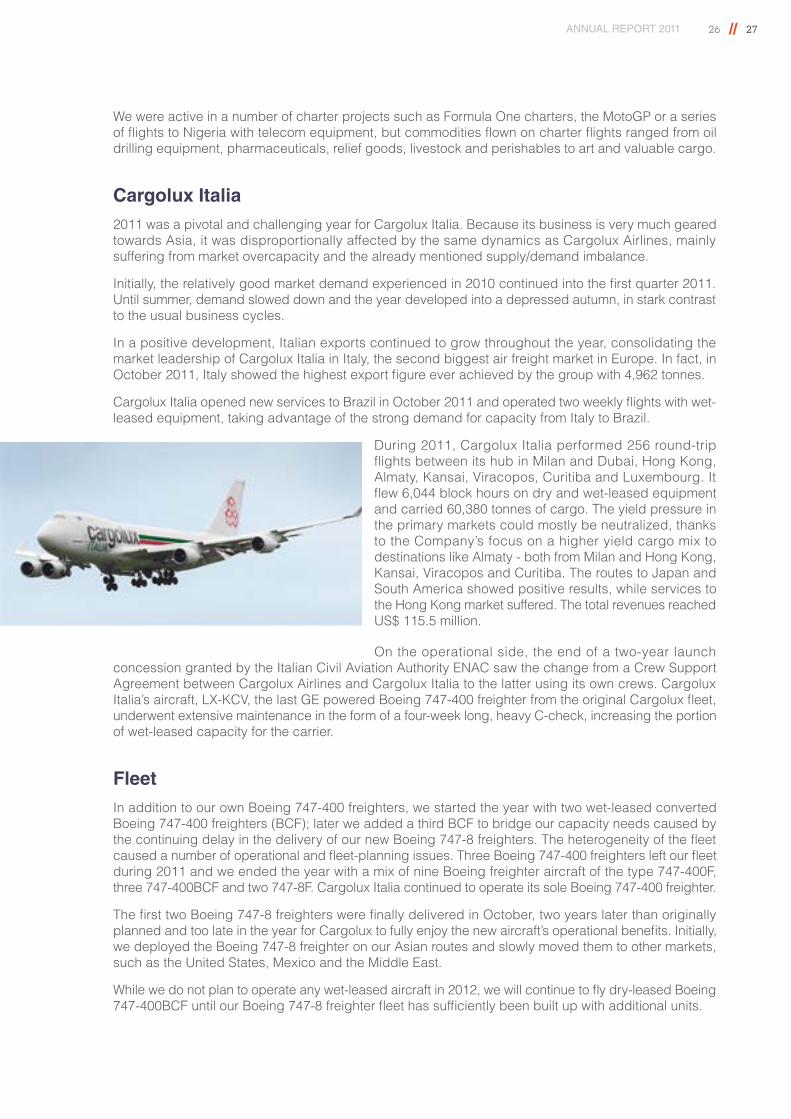
During 2011, Cargolux Italia performed 256 round-trip flights between its hub in Milan and Dubai, Hong Kong, Almaty, Kansai, Viracopos, Curitiba and Luxembourg. It flew 6,044 block hours on dry and wet-leased equipment and carried 60,380 tonnes of cargo. The yield pressure in the primary markets could mostly be neutralized, thanks to the Company’s focus on a higher yield cargo mix to destinations like Almaty - both from Milan and Hong Kong, Kansai, Viracopos and Curitiba. The routes to Japan and South America showed positive results, while services to the Hong Kong market suffered. The total revenues reached US$ 115.5 million.
On the operational side, the end of a two-year launch concession granted by the Italian Civil Aviation Authority ENAC saw the change from a Crew Support Agreement between Cargolux Airlines and Cargolux Italia to the latter using its own crews. Cargolux Italia’s aircraft, LX-KCV, the last GE powered Boeing 747-400 freighter from the original Cargolux fleet, underwent extensive maintenance in the form of a four-week long, heavy C-check, increasing the portion of wet-leased capacity for the carrier.
FleetIn addition to our own Boeing 747-400 freighters, we started the year with two wet-leased converted Boeing 747-400 freighters (BCF); later we added a third BCF to bridge our capacity needs caused by the continuing delay in the delivery of our new Boeing 747-8 freighters. The heterogeneity of the fleet caused a number of operational and fleet-planning issues. Three Boeing 747-400 freighters left our fleet during 2011 and we ended the year with a mix of nine Boeing freighter aircraft of the type 747-400F, three 747-400BCF and two 747-8F. Cargolux Italia continued to operate its sole Boeing 747-400 freighter.
The first two Boeing 747-8 freighters were finally delivered in October, two years later than originally planned and too late in the year for Cargolux to fully enjoy the new aircraft’s operational benefits. Initially, we deployed the Boeing 747-8 freighter on our Asian routes and slowly moved them to other markets, such as the United States, Mexico and the Middle East.
While we do not plan to operate any wet-leased aircraft in 2012, we will continue to fly dry-leased Boeing 747-400BCF until our Boeing 747-8 freighter fleet has sufficiently been built up with additional units.
2802 | Overall business review
Ownership changeAn important development in 2011 was the announced change in the Company’s ownership structure on 9 June, when Doha-based Qatar Airways took a 35% equity interest in Cargolux, paving the way for a strategic commercial partnership. This investment also marked the termination of the temporary role of the Luxembourg State as a shareholder in the Company and enabled other state-controlled shareholders, who participated in the 2009 Cargolux restructuring plan through the acquisition of a 33.7% holding of the former SAirlines, to sell or reduce their ownership in our Company.
Ownership structure
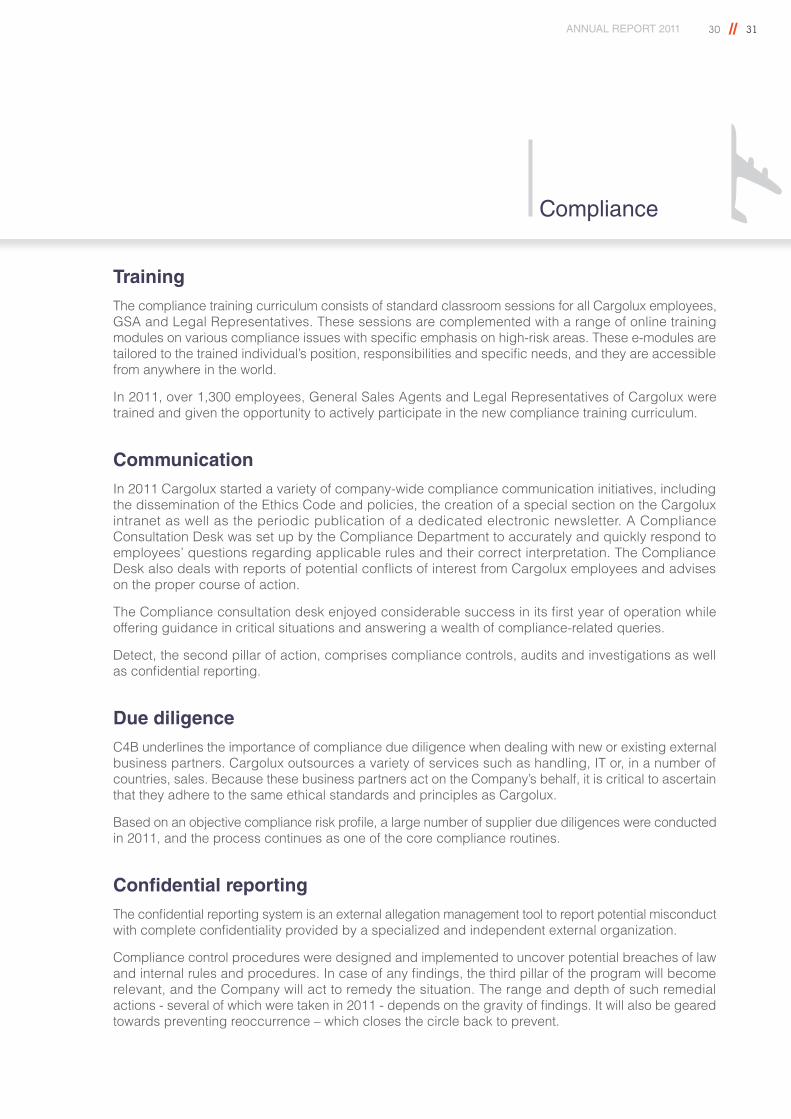
The transaction was formally closed on 8 September 2011 after clearance by the competent authorities. Due to the complementary nature of the business models of Cargolux and Qatar Airways, the commercial and industrial cooperation has enhanced the reach and scale of both partners.
More specifically, it has allowed us to improve our competitive position as a leading and independent air cargo operator while supporting Qatar Airways’ growth plans by including air freight as a major element of their product range. We are now well positioned to propose an extended product offering to our customers thanks to interlining and block space agreements. While Qatar Airways benefits from our all-cargo capacity to destinations outside of their route network, we have gained access to belly load and freighter capacity on our partner’s extensive network.
With the partnership taking shape, we saw cargo traffic increase at our hubs as we moved freight through Doha and Qatar Airways fed our Luxembourg base with regular 777 freighter flights in 2011. We also booked blocked space on Qatar Airways’ service to Canada, while Qatar Airways did the same on our flights between Doha and Sharjah. We expect to further build up our business relations and increase volumes and revenues in 2012 following approval by the relevant antitrust authorities.
43.4%
10.7%
10.9%
35.0%
Luxair
Qatar Airways
BCEE
SNCI
Before September 8, 2011 After September 8, 2011
2.2% 0.3%
52.1%
13.1%
12.8%
11.5%
8.0%
Luxair
BIP
BCEE
SNCI
Luxembourg State
Lux-Avantage
Individual
ANNUAL REPORT 2011 28 // 29
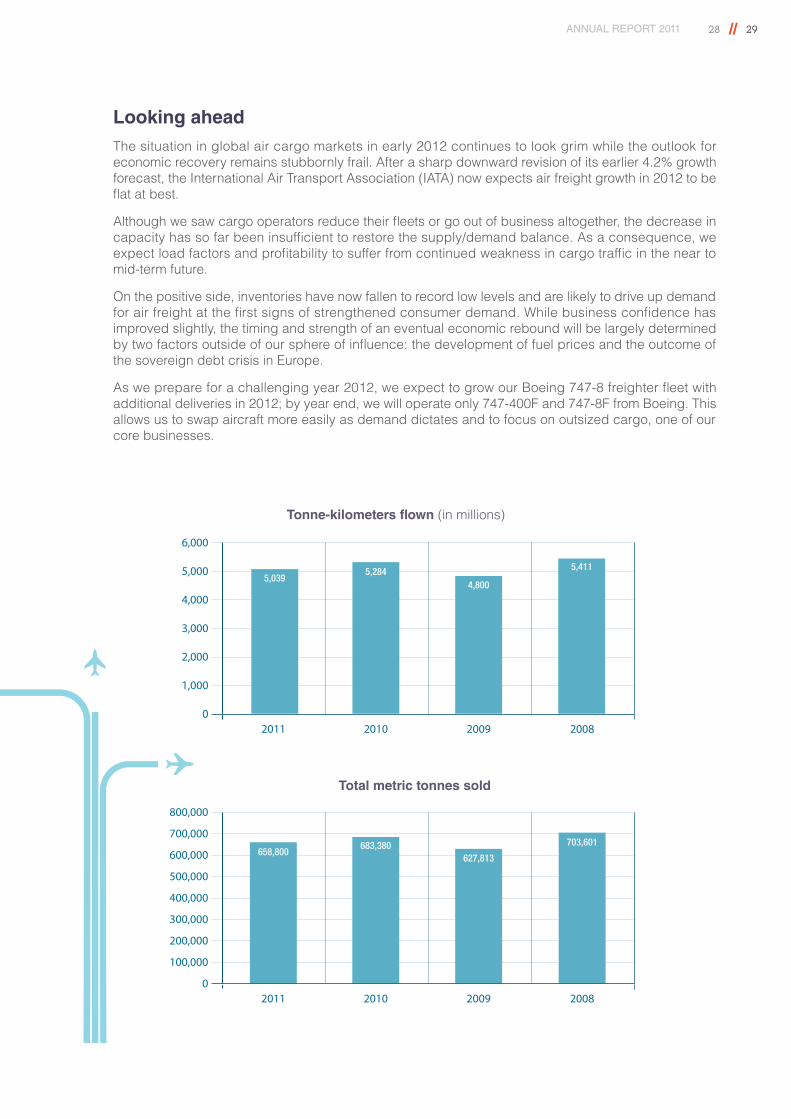
Tonne-kilometers flown (in millions)
Total metric tonnes sold
2011 2010 2009 20080
6,000
5,000
4,000
3,000
2,000
1,000
5,411
4,8005,284
5,039
2011 2010 2009 20080
800,000
700,000
600,000
500,000
400,000
300,000
200,000
100,000
703,601
627,813683,380
658,800
Looking aheadThe situation in global air cargo markets in early 2012 continues to look grim while the outlook for economic recovery remains stubbornly frail. After a sharp downward revision of its earlier 4.2% growth forecast, the International Air Transport Association (IATA) now expects air freight growth in 2012 to be flat at best.
Although we saw cargo operators reduce their fleets or go out of business altogether, the decrease in capacity has so far been insufficient to restore the supply/demand balance. As a consequence, we expect load factors and profitability to suffer from continued weakness in cargo traffic in the near to mid-term future.
On the positive side, inventories have now fallen to record low levels and are likely to drive up demand for air freight at the first signs of strengthened consumer demand. While business confidence has improved slightly, the timing and strength of an eventual economic rebound will be largely determined by two factors outside of our sphere of influence: the development of fuel prices and the outcome of the sovereign debt crisis in Europe.
As we prepare for a challenging year 2012, we expect to grow our Boeing 747-8 freighter fleet with additional deliveries in 2012; by year end, we will operate only 747-400F and 747-8F from Boeing. This allows us to swap aircraft more easily as demand dictates and to focus on outsized cargo, one of our core businesses.
3002 | Compliance
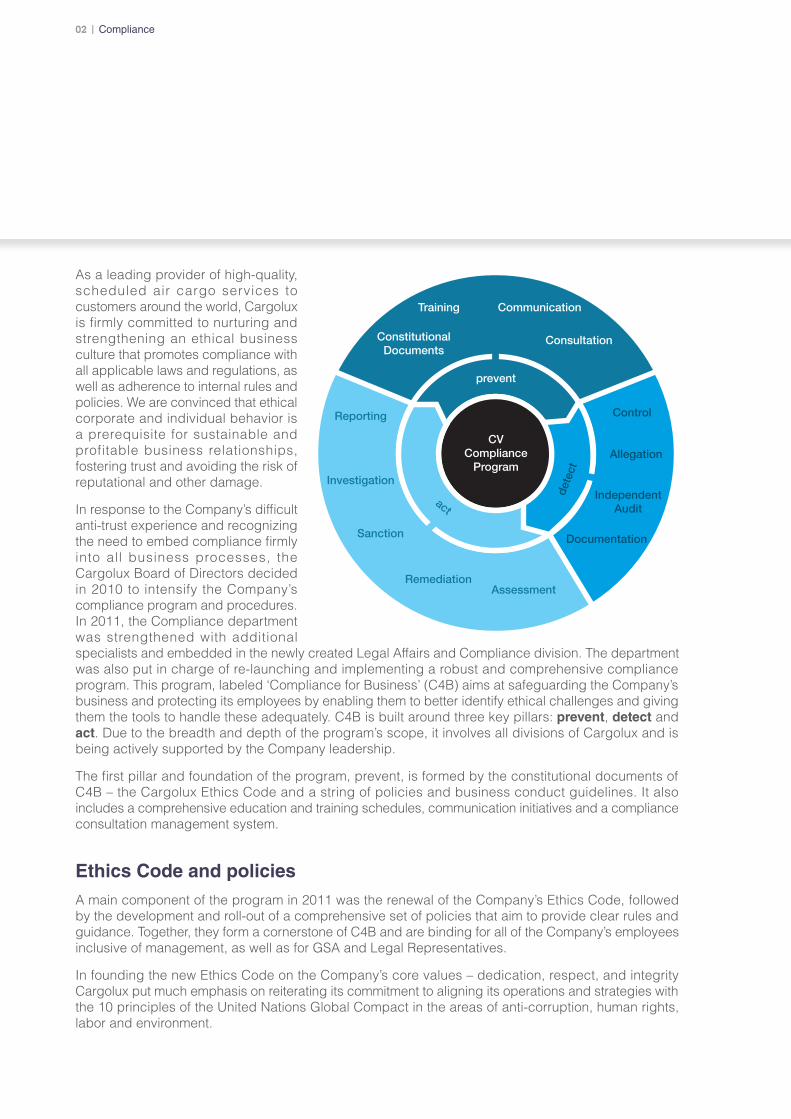
As a leading provider of high-quality, scheduled air cargo services to customers around the world, Cargolux is firmly committed to nurturing and strengthening an ethical business culture that promotes compliance with all applicable laws and regulations, as well as adherence to internal rules and policies. We are convinced that ethical corporate and individual behavior is a prerequisite for sustainable and profitable business relationships, fostering trust and avoiding the risk of reputational and other damage.
In response to the Company’s difficult anti-trust experience and recognizing the need to embed compliance firmly into all business processes, the Cargolux Board of Directors decided in 2010 to intensify the Company’s compliance program and procedures. In 2011, the Compliance department was strengthened with additional specialists and embedded in the newly created Legal Affairs and Compliance division. The department was also put in charge of re-launching and implementing a robust and comprehensive compliance program. This program, labeled ‘Compliance for Business’ (C4B) aims at safeguarding the Company’s business and protecting its employees by enabling them to better identify ethical challenges and giving them the tools to handle these adequately. C4B is built around three key pillars: prevent, detect and act. Due to the breadth and depth of the program’s scope, it involves all divisions of Cargolux and is being actively supported by the Company leadership.
The first pillar and foundation of the program, prevent, is formed by the constitutional documents of C4B – the Cargolux Ethics Code and a string of policies and business conduct guidelines. It also includes a comprehensive education and training schedules, communication initiatives and a compliance consultation management system.
Ethics Code and policiesA main component of the program in 2011 was the renewal of the Company’s Ethics Code, followed by the development and roll-out of a comprehensive set of policies that aim to provide clear rules and guidance. Together, they form a cornerstone of C4B and are binding for all of the Company’s employees inclusive of management, as well as for GSA and Legal Representatives.
In founding the new Ethics Code on the Company’s core values – dedication, respect, and integrity Cargolux put much emphasis on reiterating its commitment to aligning its operations and strategies with the 10 principles of the United Nations Global Compact in the areas of anti-corruption, human rights, labor and environment.
CVCompliance
Program
Training
prevent
ConstitutionalDocuments
Reporting
Investigation
Sanction
RemediationAssessment
Control
Allegation
IndependentAudit
Documentation
Communication
Consultation
dete
ct
act
ANNUAL REPORT 2011 30 // 31
Compliance
TrainingThe compliance training curriculum consists of standard classroom sessions for all Cargolux employees, GSA and Legal Representatives. These sessions are complemented with a range of online training modules on various compliance issues with specific emphasis on high-risk areas. These e-modules are tailored to the trained individual’s position, responsibilities and specific needs, and they are accessible from anywhere in the world.
In 2011, over 1,300 employees, General Sales Agents and Legal Representatives of Cargolux were trained and given the opportunity to actively participate in the new compliance training curriculum.
CommunicationIn 2011 Cargolux started a variety of company-wide compliance communication initiatives, including the dissemination of the Ethics Code and policies, the creation of a special section on the Cargolux intranet as well as the periodic publication of a dedicated electronic newsletter. A Compliance Consultation Desk was set up by the Compliance Department to accurately and quickly respond to employees’ questions regarding applicable rules and their correct interpretation. The Compliance Desk also deals with reports of potential conflicts of interest from Cargolux employees and advises on the proper course of action.
The Compliance consultation desk enjoyed considerable success in its first year of operation while offering guidance in critical situations and answering a wealth of compliance-related queries.
Detect, the second pillar of action, comprises compliance controls, audits and investigations as well as confidential reporting.
Due diligenceC4B underlines the importance of compliance due diligence when dealing with new or existing external business partners. Cargolux outsources a variety of services such as handling, IT or, in a number of countries, sales. Because these business partners act on the Company’s behalf, it is critical to ascertain that they adhere to the same ethical standards and principles as Cargolux.
Based on an objective compliance risk profile, a large number of supplier due diligences were conducted in 2011, and the process continues as one of the core compliance routines.
Confidential reportingThe confidential reporting system is an external allegation management tool to report potential misconduct with complete confidentiality provided by a specialized and independent external organization.
Compliance control procedures were designed and implemented to uncover potential breaches of law and internal rules and procedures. In case of any findings, the third pillar of the program will become relevant, and the Company will act to remedy the situation. The range and depth of such remedial actions - several of which were taken in 2011 - depends on the gravity of findings. It will also be geared towards preventing reoccurrence – which closes the circle back to prevent.
3202 | Maintenance and Engineering
Scheduling reliabilityThe Cargolux Maintenance & Engineering (M&E) organization supports the Boeing 747 freighters of Cargolux Airlines and Cargolux Italia, securing both airlines’ safe operation and on-time performance on its networks. In 2011, the airlines operated a mixed fleet of 747-400F, 747-400BCF and 747-8F. The services provided by the M&E division resulted in a technical schedule reliability of 98%. In addition to supporting the combined fleet of Cargolux and Cargolux Italia, the M&E division also supports its external customers with a broad range of technical services, ranging from fully integrated maintenance management to individual aircraft checks or aircraft component services.
Heavy maintenanceIn 2011, Cargolux M&E was able to increase its maintenance activities and grow the number of A and C-checks it carried out. All A and C-checks on the Cargolux and Cargolux Italia fleet were performed in-house. The heavier D-checks are normally outsourced; however, resulting from a maintenance program interval increase, no D-checks became due in 2011.
Throughout the year, Cargolux M&E increased its staff level to 395, up from 366 at the end of 2010. The division recorded a total of 563,000 man hours, a 25% increase compared to 2010. These man hours were split between line, hangar and back shops, in support of the Cargolux and customers’ fleets. Maintenance revenue more than doubled to US$ 20.1 million, a significant increase compared to the US$ 9.2 million achieved in 2010.
Working for the customerCargolux has a well-earned reputation as a provider of reliable, high-class maintenance services throughout the industry. Customers who sent their aircraft to our Luxembourg-based maintenance center in 2011 included Corsair, AirBridge Cargo, Air Atlanta, Atlas Air, KLM and Luxair. Silkway of Azerbaijan became a new customer in 2010 when they began to operate an ex-Cargolux 747-400F; in 2011, a second aircraft joined their fleet and our maintenance support increased accordingly. The M&E division provided both Part M as well as a variety of Part145 and Part147 services to its customers. In addition, the M&E division extended its services to include 777 maintenance support when it began line maintenance on Cargolux’s new shareholder Qatar Airways’ 777 cargo flights operating through Luxembourg.
ANNUAL REPORT 2011 32 // 33
Maintenance and Engineering
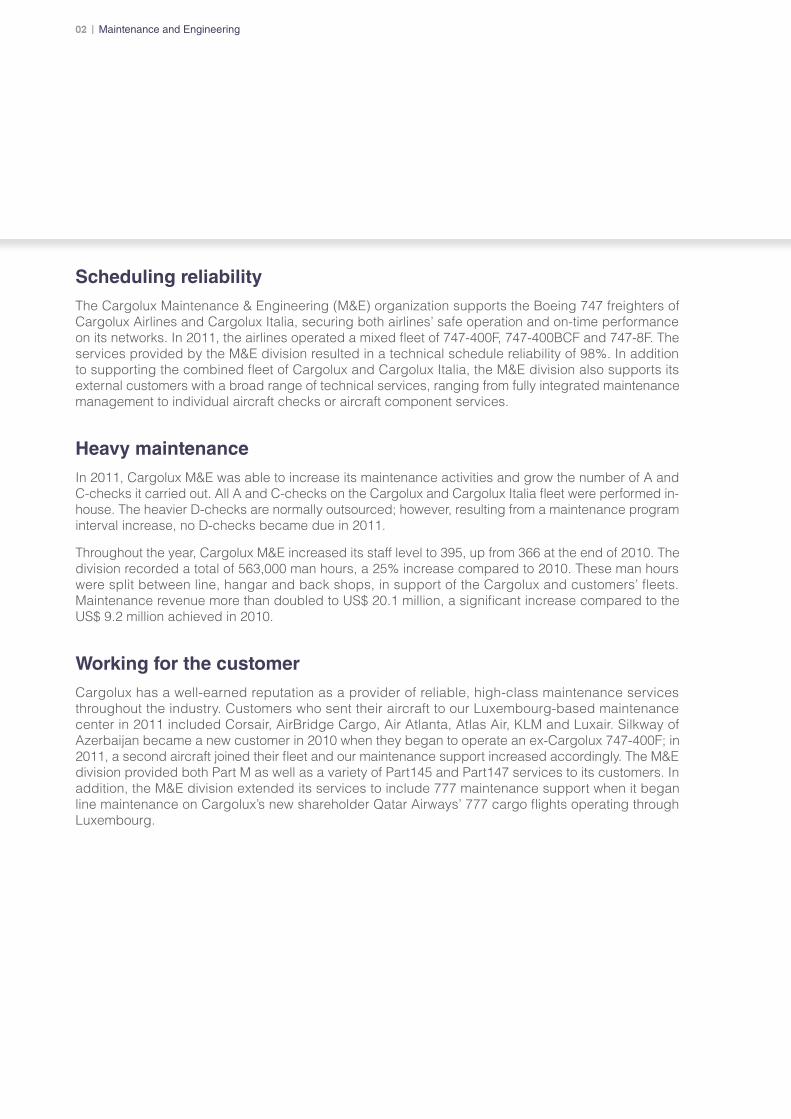
Boeing 747-8 freighterWhen the first Boeing 747-8 freighter finally arrived In October 2011, the Cargolux M&E division was fully prepared for the acceptance of the new derivative of the 747 family of aircraft. Extensive preparations and training of M&E staff, both in Luxembourg and at the Cargolux line stations throughout the world, resulted in a smooth entry into service.
747-8F Asset management joint-venture In 2011 Cargolux teamed up with Atlas Air to create a mutually beneficial material management partnership, the joint venture company Global Aviation Technical Solutions SECS (GATS). This jointly owned, Luxembourg-based company covers the full material management of major 747-8F rotable components; stocking parts in strategic global locations. GATS delivers a number of advantages to both airlines; these include lower spare part investments and operational cost synergies. GATS could further expand its role by offering these asset management services to other 747-8 operators when opportunities arise.
3402 | Flight operations
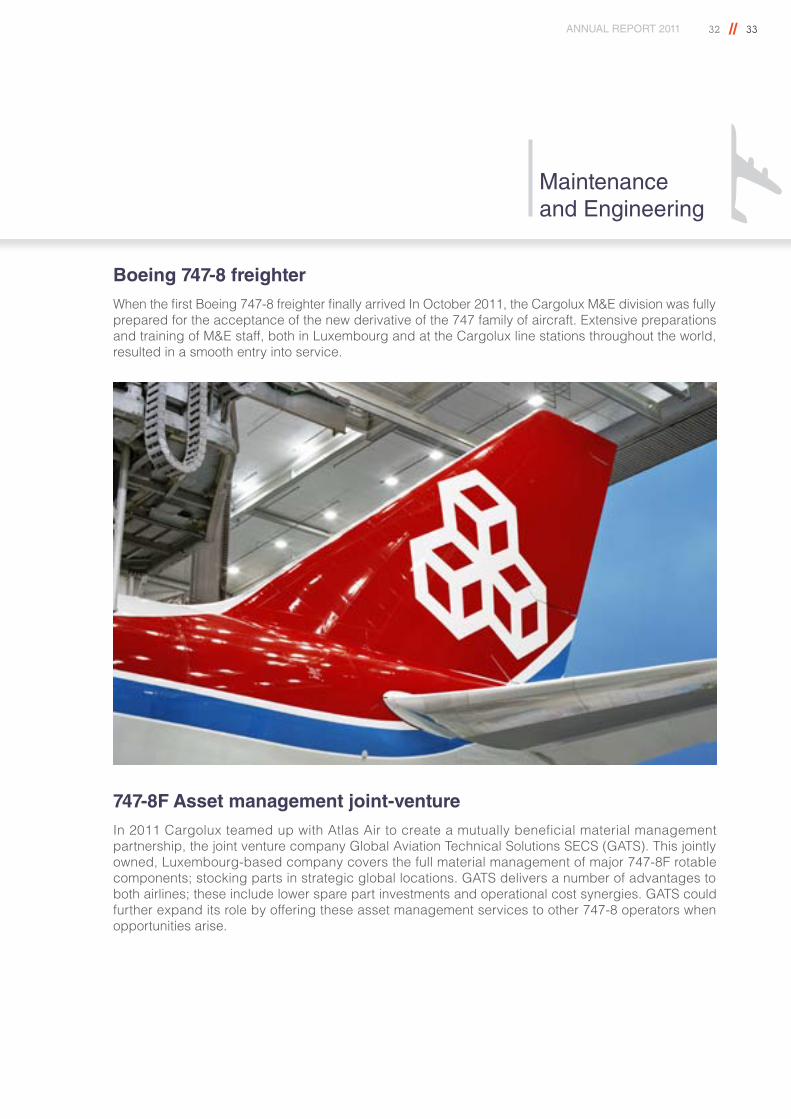
The Cargolux fleet at the beginning of 2011 consisted of twelve Boeing 747-400 freighters and one Boeing 747-400BCF, while another Boeing 747-400 freighter operated for Cargolux Italia. During the year, three more 747-400 freighters left the fleet and were replaced with two additional Boeing 747-400BCF, due to the repeated delays in the delivery of the new 747-8F which severely affected our resources. The first two 747-8F finally arrived in October and we ended the year with nine 747-400F, three 747-400BCF and two 747-8F, while Cargolux Italia continued to operate one 747-400F.
The Cargolux fleet flew 77,294 block hours and the daily aircraft utilization slightly declined by 1.9% to 15:28 hours compared to 15:46 hours in 2010. These figures include data for the fleets of Cargolux Airlines International S.A. and Cargolux Italia.
ANNUAL REPORT 2011 34 // 35
Flight Operations
Boeing 747-8 freighter trainingThe introduction of the 747-8F into the Cargolux fleet represented an important highlight for Cargolux Operations, which was actively involved in the aircraft’s performance discussions with Boeing. On the positive side, the introduction went very smoothly from an operational point of view and the Company could enjoy the benefits of the new-technology aircraft’s enhanced economics and performance.
On the other hand, the continued delivery delay throughout the year led to problems, especially with the crew training schedules. Cargolux not only trained its own pilots on the new aircraft but also conducted courses for customers, such as Global Supply Systems, the UK-based operator affiliated with Atlas Air.
In 2011, Cargolux hired 31 additional pilots and upgraded 12. In total, the Company employed 430 pilots at the end of the year versus 405 at the end of 2010.
Simulator trainingThe world’s first 747-8F simulator was delivered from Canada’s CAE in mid-2011 and installed at the Cargolux Training Center in June. However, due to the late availability of flight test data from Boeing, it could not be taken into operation. The missing data is essential for the simulator’s software and we now expect to start training in the simulator in May 2012.
The Company’s 747-400F simulator enjoyed an excellent utilization throughout the year. In contrast to other operators, Cargolux calculates its simulator utilization based on 24 hours/365 days a year, resulting in 8,760 available simulator hours in 2011. Out of those, Cargolux recorded a utilization of 6,516 hours, or 74%. The utilization was split between the Company’s own training needs (84.5%) and the training for customers (15.5%), which included Silkway Airlines and Käufer, a Germany-based training organization.
Operational challengesContrary to 2010, we saw no operational crisis; however, we experienced certain operational constraints in connection with the new Boeing 747-8 freighter. These mainly concerned the airports we could initially operate to because each destination and alternate airport in the Cargolux network needs to hold an approval for 747-8F operation, due to the aircraft’s bigger size. Getting the airports approved is a huge project and involves several hundred airports worldwide that have to obtain an authorization from the relevant authorities. Initially, we operated the new aircraft to Hong Kong and Singapore and slowly built up the network to cover Shanghai, Novosibirsk, Mexico and North America at the end of 2011.
A second constraint involved our pilot training. Each pilot converting to the 747-8F from the 747-400F is required to fly two sectors under supervision of an instructor. Since the first aircraft was repeatedly delayed, Cargolux could not use it as planned for the necessary flights. When it arrived in October, Cargolux had only four qualified instructors who started to train other instructors within the Company.
As mentioned, the delivery delays at Boeing necessitated the operation of a number of leased-in 747-400BCF resulting in a mixed fleet of standard 747-400F, BCF and, in the final weeks of 2011, 747-8F. The mix made fleet planning difficult because aircraft could not be swapped as easily as our operation required and the leased aircraft lacked the nose cargo door. For 2012 we don’t foresee any wet-leases as we build up our own Boeing 747-8 freighter fleet with additional deliveries.
37
Consolidated financial statements03
3803 | Consolidated financial statements
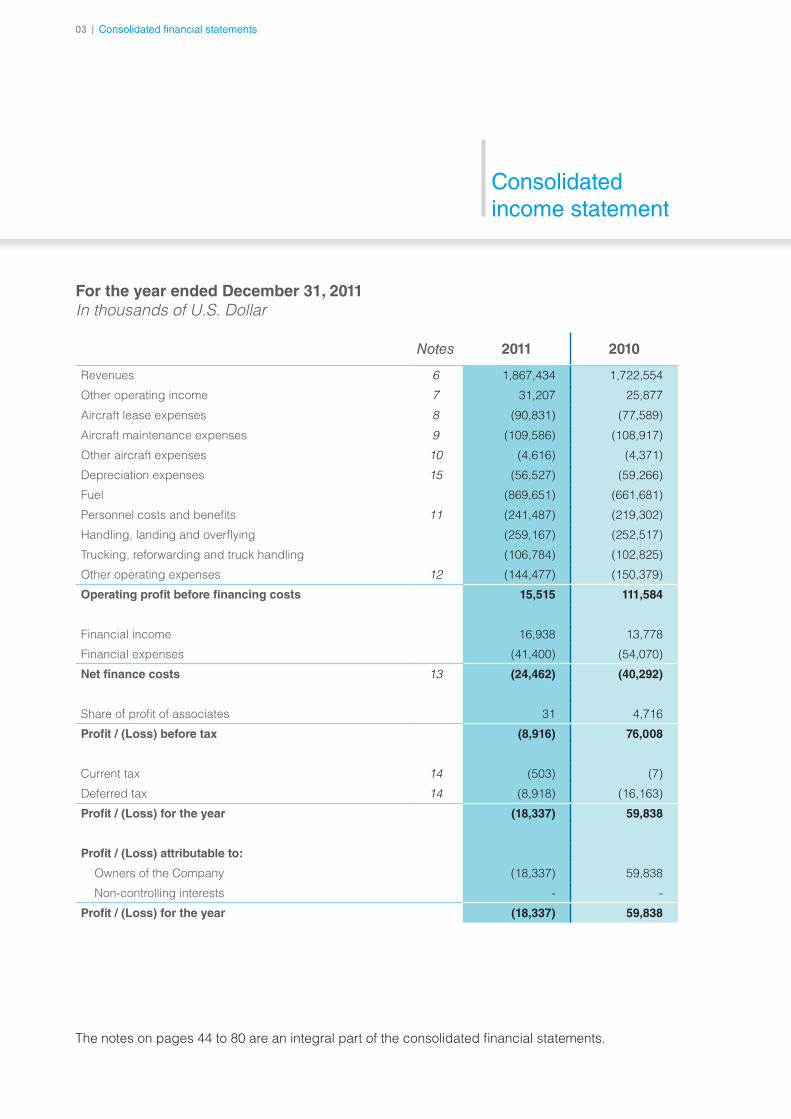
Consolidated income statement
For the year ended December 31, 2011 In thousands of U.S. Dollar
Notes 2011 2010
Revenues 6 1,867,434 1,722,554
Other operating income 7 31,207 25,877
Aircraft lease expenses 8 (90,831) (77,589)
Aircraft maintenance expenses 9 (109,586) (108,917)
Other aircraft expenses 10 (4,616) (4,371)
Depreciation expenses 15 (56,527) (59,266)
Fuel (869,651) (661,681)
Personnel costs and benefits 11 (241,487) (219,302)
Handling, landing and overflying (259,167) (252,517)
Trucking, reforwarding and truck handling (106,784) (102,825)
Other operating expenses 12 (144,477) (150,379)
Operating profit before financing costs 15,515 111,584
Financial income 16,938 13,778
Financial expenses (41,400) (54,070)
Net finance costs 13 (24,462) (40,292)
Share of profit of associates 31 4,716
Profit / (Loss) before tax (8,916) 76,008
Current tax 14 (503) (7)
Deferred tax 14 (8,918) (16,163)
Profit / (Loss) for the year (18,337) 59,838
Profit / (Loss) attributable to:
Owners of the Company (18,337) 59,838
Non-controlling interests - -
Profit / (Loss) for the year (18,337) 59,838
The notes on pages 44 to 80 are an integral part of the consolidated financial statements.
ANNUAL REPORT 2011 38 // 39
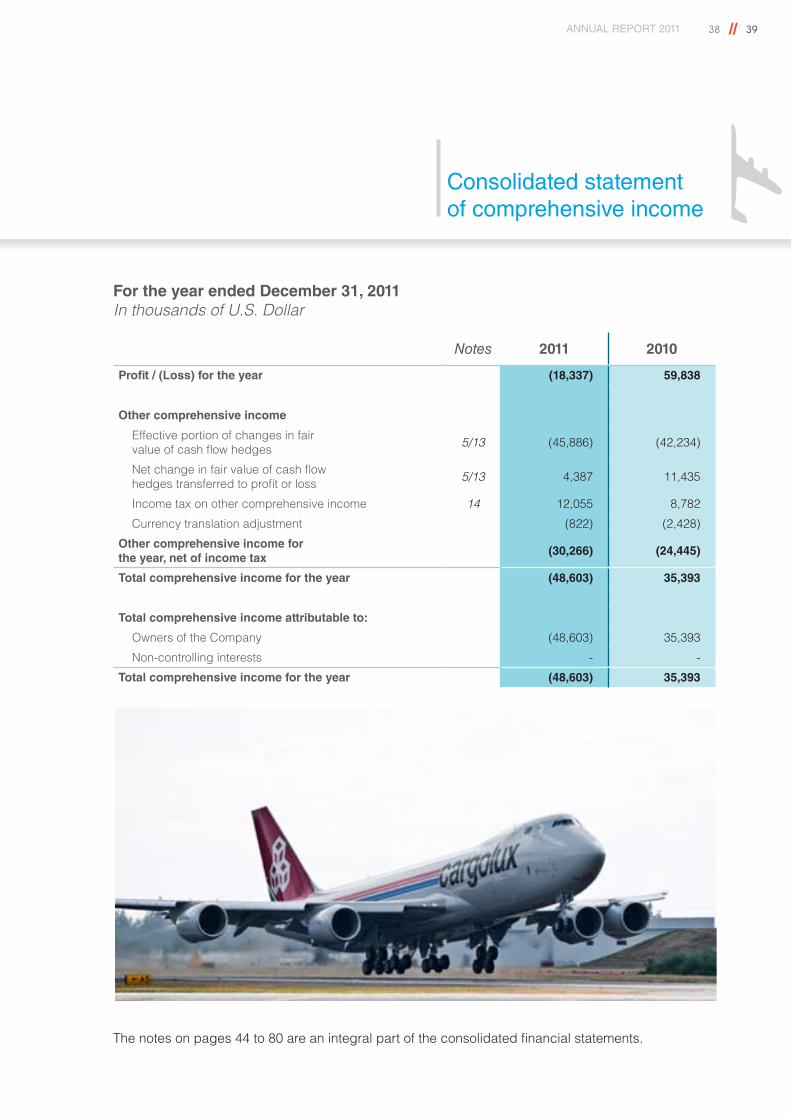
Consolidated statement of comprehensive income
For the year ended December 31, 2011 In thousands of U.S. Dollar
Notes 2011 2010
Profit / (Loss) for the year (18,337) 59,838
Other comprehensive income
Effective portion of changes in fair value of cash flow hedges 5/13 (45,886) (42,234)
Net change in fair value of cash flow hedges transferred to profit or loss 5/13 4,387 11,435
Income tax on other comprehensive income 14 12,055 8,782
Currency translation adjustment (822) (2,428)
Other comprehensive income for the year, net of income tax
(30,266) (24,445)
Total comprehensive income for the year (48,603) 35,393
Total comprehensive income attributable to:
Owners of the Company (48,603) 35,393
Non-controlling interests - -
Total comprehensive income for the year (48,603) 35,393
The notes on pages 44 to 80 are an integral part of the consolidated financial statements.
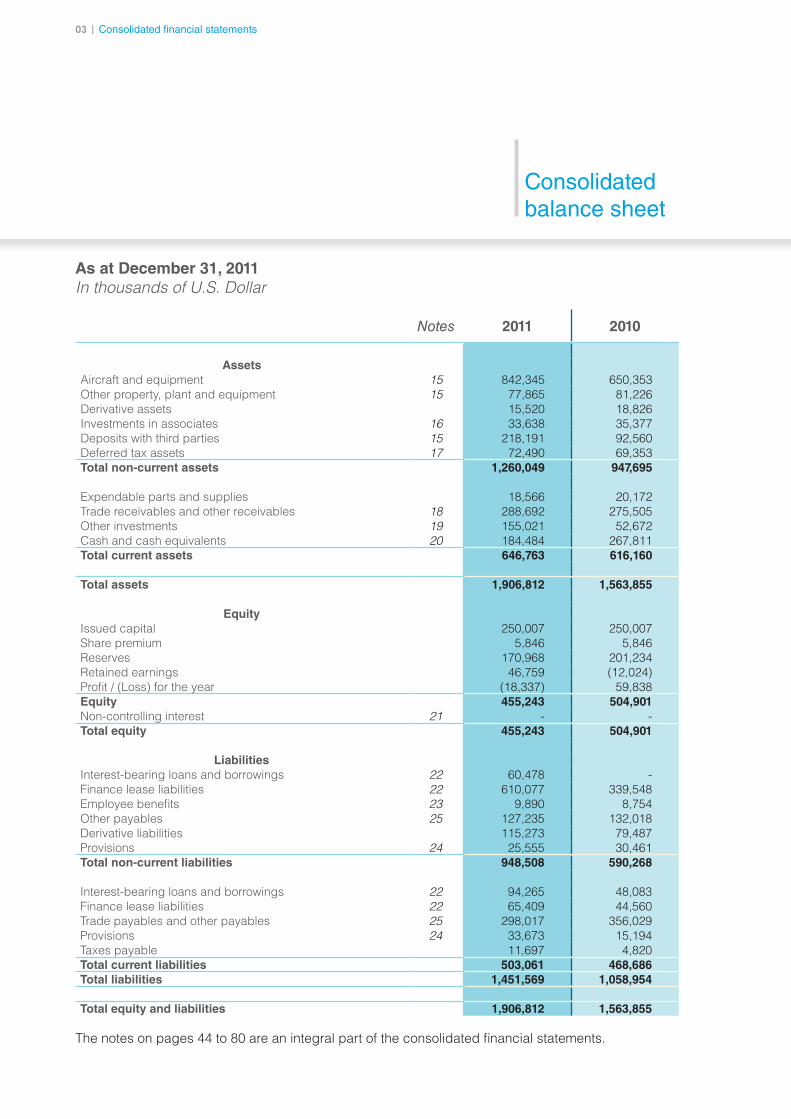
4003 | Consolidated financial statements
As at December 31, 2011 In thousands of U.S. Dollar
Notes 2011 2010
AssetsAircraft and equipment 15 842,345 650,353 Other property, plant and equipment 15 77,865 81,226 Derivative assets 15,520 18,826 Investments in associates 16 33,638 35,377 Deposits with third parties 15 218,191 92,560 Deferred tax assets 17 72,490 69,353 Total non-current assets 1,260,049 947,695
Expendable parts and supplies 18,566 20,172 Trade receivables and other receivables 18 288,692 275,505 Other investments 19 155,021 52,672 Cash and cash equivalents 20 184,484 267,811 Total current assets 646,763 616,160
Total assets 1,906,812 1,563,855
EquityIssued capital 250,007 250,007Share premium 5,846 5,846Reserves 170,968 201,234Retained earnings 46,759 (12,024) Profit / (Loss) for the year (18,337) 59,838 Equity 455,243 504,901Non-controlling interest 21 - -Total equity 455,243 504,901
LiabilitiesInterest-bearing loans and borrowings 22 60,478 -Finance lease liabilities 22 610,077 339,548 Employee benefits 23 9,890 8,754 Other payables 25 127,235 132,018 Derivative liabilities 115,273 79,487 Provisions 24 25,555 30,461 Total non-current liabilities 948,508 590,268
Interest-bearing loans and borrowings 22 94,265 48,083 Finance lease liabilities 22 65,409 44,560 Trade payables and other payables 25 298,017 356,029 Provisions 24 33,673 15,194 Taxes payable 11,697 4,820 Total current liabilities 503,061 468,686 Total liabilities 1,451,569 1,058,954
Total equity and liabilities 1,906,812 1,563,855
Consolidated balance sheet
The notes on pages 44 to 80 are an integral part of the consolidated financial statements.
ANNUAL REPORT 2011 40 // 41
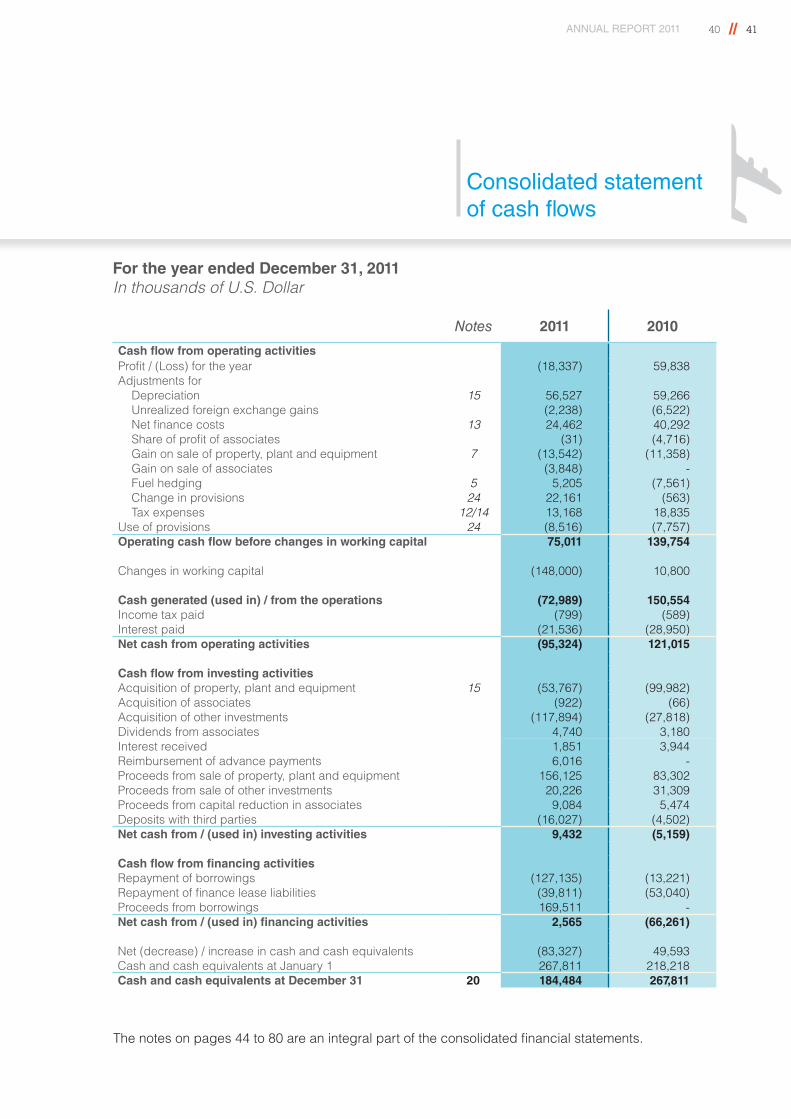
Consolidated statement of cash flows
For the year ended December 31, 2011 In thousands of U.S. Dollar
Notes 2011 2010
Cash flow from operating activitiesProfit / (Loss) for the year (18,337) 59,838 Adjustments for
Depreciation 15 56,527 59,266 Unrealized foreign exchange gains (2,238) (6,522) Net finance costs 13 24,462 40,292 Share of profit of associates (31) (4,716) Gain on sale of property, plant and equipment 7 (13,542) (11,358) Gain on sale of associates (3,848) -Fuel hedging 5 5,205 (7,561) Change in provisions 24 22,161 (563)Tax expenses 12/14 13,168 18,835
Use of provisions 24 (8,516) (7,757) Operating cash flow before changes in working capital 75,011 139,754
Changes in working capital (148,000) 10,800
Cash generated (used in) / from the operations (72,989) 150,554 Income tax paid (799) (589) Interest paid (21,536) (28,950) Net cash from operating activities (95,324) 121,015
Cash flow from investing activitiesAcquisition of property, plant and equipment 15 (53,767) (99,982) Acquisition of associates (922) (66) Acquisition of other investments (117,894) (27,818) Dividends from associates 4,740 3,180 Interest received 1,851 3,944 Reimbursement of advance payments 6,016 - Proceeds from sale of property, plant and equipment 156,125 83,302 Proceeds from sale of other investments 20,226 31,309 Proceeds from capital reduction in associates 9,084 5,474 Deposits with third parties (16,027) (4,502) Net cash from / (used in) investing activities 9,432 (5,159)
Cash flow from financing activitiesRepayment of borrowings (127,135) (13,221) Repayment of finance lease liabilities (39,811) (53,040) Proceeds from borrowings 169,511 -Net cash from / (used in) financing activities 2,565 (66,261)
Net (decrease) / increase in cash and cash equivalents (83,327) 49,593 Cash and cash equivalents at January 1 267,811 218,218 Cash and cash equivalents at December 31 20 184,484 267,811
The notes on pages 44 to 80 are an integral part of the consolidated financial statements.
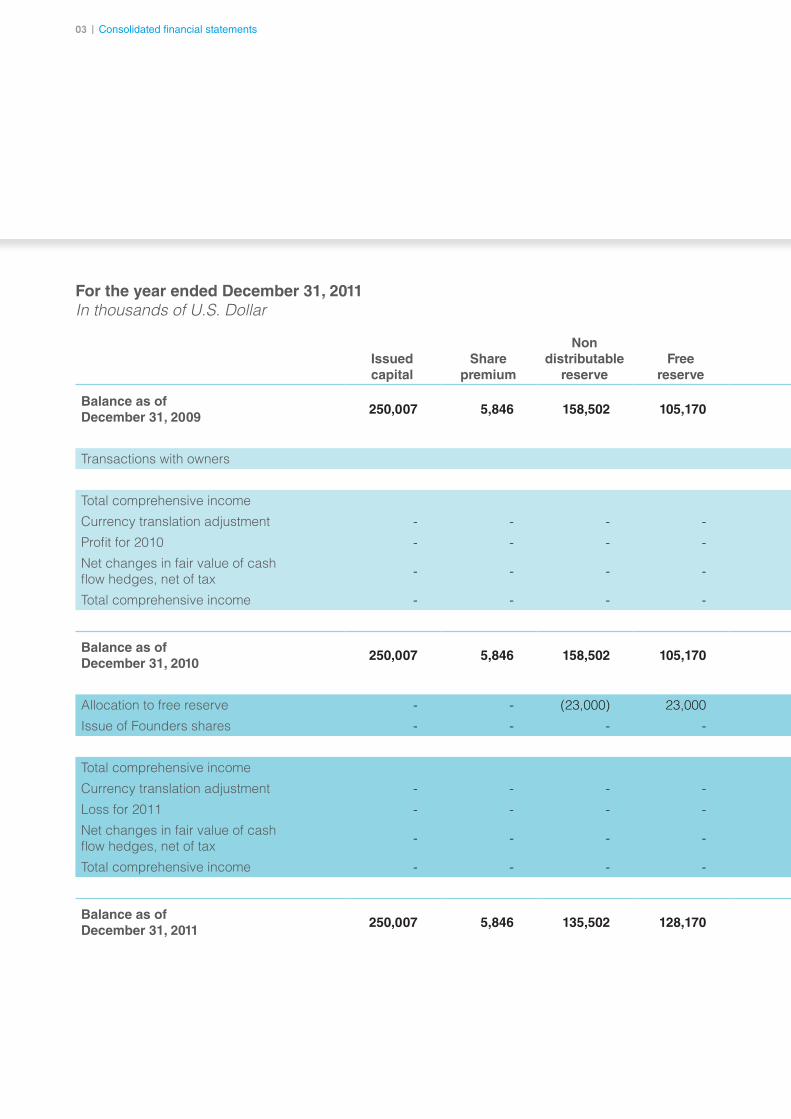
4203 | Consolidated financial statements
For the year ended December 31, 2011 In thousands of U.S. Dollar
Issued capital
Share premium
Non distributable
reserveFree
reserve
Currency translation
reserveHedging reserve
Total reserves
Retained earnings
Total equity
Non-controlling
interestTotal
equity
Balance as of December 31, 2009
250,007 5,846 158,502 105,170 2,267 (40,260) 225,679 (12,024) 469,508 - 469,508
Transactions with owners
Total comprehensive income
Currency translation adjustment - - - - (2,428) - (2,428) - (2,428) - (2,428)
Profit for 2010 - - - - - - - 59,838 59,838 - 59,838
Net changes in fair value of cash flow hedges, net of tax - - - - - (22,017) (22,017) - (22,017) - (22,017)
Total comprehensive income - - - - (2,428) (22,017) (24,445) 59,838 35,393 - 35,393
Balance as of December 31, 2010
250,007 5,846 158,502 105,170 (161) (62,277) 201,234 47,814 504,901 - 504,901
Allocation to free reserve - - (23,000) 23,000 - - - - - - -
Issue of Founders shares - - - - - - - (1,055) (1,055) - (1,055)
Total comprehensive income
Currency translation adjustment - - - - (822) - (822) - (822) - (822)
Loss for 2011 - - - - - - - (18,337) (18,337) - (18,337)
Net changes in fair value of cash flow hedges, net of tax - - - - - (29,444) (29,444) - (29,444) - (29,444)
Total comprehensive income - - - - (822) (29,444) (30,266) (18,337) (48,603) - (48,603)
Balance as of December 31, 2011
250,007 5,846 135,502 128,170 (983) (91,721) 170,968 28,422 455,243 - 455,243
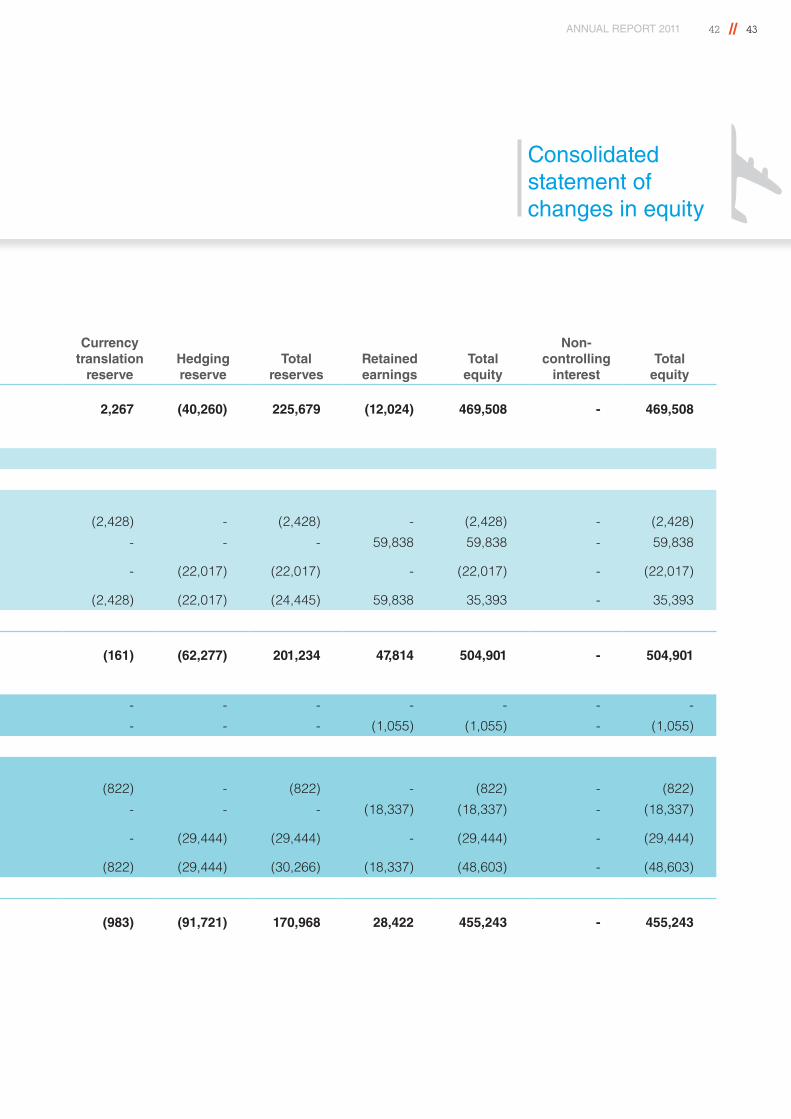
ANNUAL REPORT 2011 42 // 43
Consolidated statement of changes in equity
For the year ended December 31, 2011 In thousands of U.S. Dollar
Issued capital
Share premium
Non distributable
reserveFree
reserve
Currency translation
reserveHedging reserve
Total reserves
Retained earnings
Total equity
Non-controlling
interestTotal
equity
Balance as of December 31, 2009
250,007 5,846 158,502 105,170 2,267 (40,260) 225,679 (12,024) 469,508 - 469,508
Transactions with owners
Total comprehensive income
Currency translation adjustment - - - - (2,428) - (2,428) - (2,428) - (2,428)
Profit for 2010 - - - - - - - 59,838 59,838 - 59,838
Net changes in fair value of cash flow hedges, net of tax - - - - - (22,017) (22,017) - (22,017) - (22,017)
Total comprehensive income - - - - (2,428) (22,017) (24,445) 59,838 35,393 - 35,393
Balance as of December 31, 2010
250,007 5,846 158,502 105,170 (161) (62,277) 201,234 47,814 504,901 - 504,901
Allocation to free reserve - - (23,000) 23,000 - - - - - - -
Issue of Founders shares - - - - - - - (1,055) (1,055) - (1,055)
Total comprehensive income
Currency translation adjustment - - - - (822) - (822) - (822) - (822)
Loss for 2011 - - - - - - - (18,337) (18,337) - (18,337)
Net changes in fair value of cash flow hedges, net of tax - - - - - (29,444) (29,444) - (29,444) - (29,444)
Total comprehensive income - - - - (822) (29,444) (30,266) (18,337) (48,603) - (48,603)
Balance as of December 31, 2011
250,007 5,846 135,502 128,170 (983) (91,721) 170,968 28,422 455,243 - 455,243
4403 | Consolidated financial statements
1. Reporting entityThe parent company, Cargolux Airlines International S.A. (the ‘Company’ or ‘Cargolux’), was incorporated on March 4, 1970 and is registered as a ‘société anonyme’ under the laws of the Grand Duchy of Luxembourg. The Company is an all cargo airline. It also maintains its own aircraft and provides third party maintenance and flight operations assistance (including crew training) to third parties at its Luxembourg headquarters. As at the balance sheet date, operations outside of Luxembourg that relate to the Company’s business activities are conducted solely under branch offices, except for Italy, where Cargolux conducts its business through its subsidiary Cargolux Italia S.p.A., an all cargo airline based in Milan. As at the balance sheet date the Company maintained branches in 31 countries.
The consolidated financial statements of the Company for the year ended December 31, 2011, comprise the Company and its subsidiaries, Cargolux RE S.A., Cargolux Italia S.p.A. and Italia Aerologistics S.R.L. (together referred to as the “Group”) and the Group’s interest in joint ventures and associates.
2. Basis of preparation(a) Statement of compliance
The Group prepares its financial statements under International Financial Reporting Standards (“IFRS”) as adopted by the EU.
The Board of Directors approved the financial statements for the year ended December 31, 2011 on March 19, 2012 and authorized the publication of said financial statements on March 28, 2012, following confirmation by the shareholders thereof on that date.
(b) Basis of measurement
The financial statements have been prepared on the historical cost basis except for the following material items in the financial statements:
• derivative financial instruments are measured at fair value
• liabilities for cash-settled share-based payment arrangements are measured at fair value
• the defined benefit liability is recognized as the net total of: fair value of plan assets plus service cost, actuarial losses minus actuarial gains and the present value of the defined benefit obligation.
(c) Going concern
Despite a loss for the year, the Group believes it is in a position to meet its commitments when they fall due. The Group believes that the operating cash flows, the contracted disposal of assets, the credit facilities in place and the support from the shareholders will secure the liquidity needs of the Group for the foreseeable future and at least 12 months from the date of issuance of these financial statements (see Notes 5 (e), 21 and 22). Consequently, the financial statements have been prepared on the basis of the assumption of the Company’s ability to operate as a going concern.
(d) Functional and presentation currency
The consolidated financial statements are presented in United States Dollar (‘US dollar’ or ‘US$’) as the functional currency US dollars are rounded to the nearest thousand.
ANNUAL REPORT 2011 44 // 45
Notes to the consolidated financial statements
(e) Use of estimates and judgments
The preparation of financial statements in conformity with IFRS requires management to make judgments, estimates and assumptions that affect the reported amounts of assets and liabilities, income and expenses.
The estimates and related assumptions are based on historical experience and various other factors: these estimates and related assumptions are believed to be reasonable under the circumstances and on their basis judgments about carrying values of assets and liabilities that cannot readily be derived from other sources are made. Actual results may differ from these estimates.
The estimates and underlying assumptions are reviewed on an ongoing basis. Revisions to accounting estimates are given effect in the period during which the estimate was revised and in any future periods affected.
Judgments made by management in the application of IFRS that have significant effect on the financial statements are discussed in Note 31.
(f) Changes in accounting policies
The accounting policies set out below have been applied consistently to all periods presented in these financial statements.
However, certain comparative amounts in the statement of other comprehensive income and in the notes have been reclassified to conform with the current year’s presentation.
3. Significant accounting policies
(a) Basis of consolidation
(i) SubsidiariesCompanies in which the Group exercises exclusive control are fully consolidated. Control exists when the Group has the power directly or indirectly to govern the financial and operating policies of an entity so as to obtain benefits from the entity’s activities. In assessing control, potential voting rights that presently are exercisable (e.g. under option agreements) are taken into account. The consolidated financial statements of subsidiaries are included in the consolidated financial statements from the date that control commences until the date that control ceases.
(ii) Associates and joint venturesAssociates are those entities in which the Group has significant influence, but not control, over the financial and operating policies. Joint ventures are those entities over whose activities the Group has joint control, established by contractual agreement. The consolidated financial statements include the Group’s share of the total recognized gains and losses of associates on an equity accounted basis, from the date that significant influence commences until the date that significant influence ceases. Typically associates where the Group controls 20% or more of the equity but does not exercise control and joint ventures are equity accounted. When the Group’s share of losses exceeds its interest in an equity accounted investee, the carrying amount of that interest (including any long-term investments) is reduced to nil and the recognition of further losses is discontinued except to the extent that the Group has an obligation to make payments or has made payments on behalf of that investee.
4603 | Consolidated financial statements
(iii) Transactions eliminated on consolidation Intragroup balances and any unrealized gains and losses or income and expenses arising from intragroup transactions with fully consolidated entities are eliminated in preparing the consolidated financial statements.
Unrealized gains and losses arising from transactions with associates are eliminated to the extent of the Group’s interest in the associate.
(iv) Special purpose entitiesThe Group has established a number of special purpose entities (SPEs) for aircraft financing purposes. Generally the Group does not have any direct or indirect shareholding in these entities. An SPE is consolidated if, based on an evaluation of the substance of its relationship with the Group and the SPEs’ risks and rewards with respect of the asset in its balance sheet, the Group concludes that it controls the SPEs. SPEs controlled by the Group are always established under terms that impose strict limitations on the decision-making powers of the SPEs’ management and that result in the Group receiving all of the benefits related to the SPEs’ operations and net assets.
(b) Foreign currency
(i) Foreign currency transactionsTransactions in foreign currencies are translated into the functional currency of the Group at the foreign exchange rate prevailing at the date of the transaction. Monetary assets and liabilities denominated in foreign currencies are translated into functional currency at the foreign exchange rates applicable at the balance sheet date. The foreign currency gain or loss on monetary items is the difference between the value of the item expressed in the functional currency at the beginning of the period and the value of the item expressed in functional currency at the end of the period, using for translation purposes the exchange rate prevailing at the end of each relevant date. The year-end value reflects, if and as applicable, amortization, payments and interest accruals effected during the year. Non-monetary assets and liabilities that are stated at historical cost less amortization are translated into the functional currency using the exchange rate at the date of the transaction. Non-monetary assets and liabilities denominated in foreign currencies that are stated at fair value are translated into the functional currency at foreign exchange rates applicable at the date the fair value is determined. Foreign exchange differences arising on translation are recognized in the income statement.
(ii) Financial statements of foreign operationsThe assets and liabilities of entities controlled by the Group that have a functional currency other than the US dollar (‘foreign operations’) are translated into US dollar at foreign exchange rates applicable at the balance sheet date. The rule also applies to goodwill and fair value adjustments arising on consolidation of foreign operations. The revenues and expenses of foreign operations are translated into US dollar at rates applicable at the dates of the transactions. Foreign exchange differences arising on retranslation are recognized directly in a separate component of equity.
(c) Derivative financial instruments, including hedge accounting
The Group uses derivative financial instruments to hedge its exposure to the fluctuation of exchange rates, interest rates and fuel prices arising from operational and financing activities. In accordance with its hedging policy, the Group does not hold or issue derivative financial instruments for trading purposes. However, derivatives that do not qualify for hedge accounting are treated as trading instruments.
The gain or loss in the fair value of the derivative financial instrument is recognized in the income statement unless the derivative qualifies for hedge accounting, in which case the effective part of the derivative financial instrument is recognized in other comprehensive income and presented in the hedging reserve in equity. Any gain or loss with respect to the ineffective part of hedge accounted instruments (as are gains or losses on trading instruments) is recognized in the income statement.
Hedge accounting is discontinued when the hedging instrument expires or is sold, terminated, or exercised, or no longer qualifies for hedge accounting. At that time, any cumulative gain or loss on the hedging instrument recognized in equity is retained in equity until the forecasted transaction occurs. If a hedged transaction is no longer expected to occur, the net cumulative gain or loss recognized in equity is transferred to profit or loss for the period.
ANNUAL REPORT 2011 46 // 47
(d) Property, plant and equipment
(i) Aircraft and equipmentB747-400F and B747-8F aircraft (including installed engines) and rotable spare parts (including spare engines) are stated at cost, adjusted for any impairment, less accumulated depreciation.
Borrowing costs related to the acquisition of an aircraft are capitalized as part of the cost of this aircraft.
The initial cost of the aircraft includes the first ‘D-check’ as a separate component. The costs of subsequent “D-checks” are capitalized when the first ‘D-check’ (or second or third “D-check”, as the case may be) occurs and the capitalized ‘D-check’ is depreciated over the period to the next scheduled “D-check”. The period of depreciation of ‘D-checks’ is set forth in (v) below.
(ii) Other property, plant and equipmentOther items of property, plant and equipment are also stated at cost less accumulated depreciation (see (v) below) and impairment, if applicable (on which see Note 3 (j)).
Where parts of an item of property, plant and equipment have different useful lives, they are accounted for as separate items of property, plant and equipment (see (v) below).
(iii) Leased assets1) Finance leases:Leases under the terms of which the Group assumes substantially all the risks and rewards of ownership are classified as finance leases. The assets acquired by way of finance leases are recognized as non-current assets and are stated at an amount equal to the lower of their fair value and the present value of the minimum future lease payments at inception of the lease, less accumulated depreciation (see Note (v)) and impairment, if any (on which see Note 3 (j)). The related liability is included under Finance lease liabilities.
In the context of sale and leaseback transactions, the recognition of any gain on the sale is deferred and recognized instead as finance income over the lease term. No loss is recognized unless the asset is impaired.
2) Operating leases:Leases under the terms of which the Group does not assume the risks and rewards of ownership are classified as operating leases and are not carried on the Group’s balance sheet. The net present value of future lease payments under operating leases is disclosed in the notes to these financial statements (see Note 26 below).
In the context of sale and leaseback transactions, the related gains are accounted for as follows:
• they are immediately recognized as income when the transaction is realized at fair market value,
• they are deferred and amortized over the lease term when the transaction is realized under or over fair value.
(iv) Subsequent costsThe Group outsources the major aircraft overhaul checks, as well as the maintenance and repairs of engines to outside contractors, however performs the major overhaul ‘C-checks’ internally. The cost related to line maintenance, ‘A-checks’ and ‘C-checks’ performed in Luxembourg are expensed when incurred under various line items in the income statement.
4803 | Consolidated financial statements
(v) Depreciation Depreciation is charged to the income statement on a straight-line basis over the estimated useful lives of each component or part of aircraft and other property, plant and equipment. The estimated useful lives and residual values of relevant assets are as follows:
Useful life (average)
Residual value (average)
Components of aircraft:
Airframe 20 years 15% of initial cost
Engines (CF6, RB 211, GEnX) 13 years 8% of initial cost
1st and 2nd “D-check” 8 years nil
Subsequent ‘D-checks’ 6 years nil
Rotable spare parts 10 years nil
Equipment: 5 years nil
(e) Investments in subsidiaries, joint ventures and associates
Subsidiaries, joint ventures and associates are accounted for in accordance with the basis for consolidation (see Note 3 (a)).
(f) Investments
Treasury instruments are carried at fair value with variations in value flowing through the income statement. These assets are classified as current assets in Other investments. Related transaction costs are expensed when incurred.
Financial instruments are recognized / derecognized by the Group on the date it commits to purchase / sell the instruments.
(g) Trade and other receivables
Trade and other receivables are stated at their cost less impairment (on which see Note 3 (j)).
(h) Expendable parts and supplies
Expendable parts and supplies are stated at the lower of cost and net realizable value. Inventories are carried on a first-in-first-out basis. Net realizable value is the estimated market price in the ordinary course of business, less estimated sales costs. Expendable parts and supplies are charged to Aircraft maintenance expenses when used.
(i) Cash and cash equivalents
Cash and cash equivalents comprise cash balances, call and short term deposits and shares in money market funds. Bank overdrafts that are repayable on demand and form an integral part of the Group’s cash management are included as a component of Cash and cash equivalents in the Statement of Cash Flows.
(j) Impairment
(i) Non-financial assetsThe carrying amounts of the Group’s non-financial assets, other than expendable parts and supplies (on which see Note 3 (h) above) and deferred tax assets (on which see Note 3 (q)), are reviewed at each balance sheet date to determine whether there is any impairment. If any impairment exists, the asset’s recoverable amount is estimated and the carrying value adjusted accordingly.
Impairment is recognized whenever the carrying amount of an asset exceeds its recoverable amount. Impairment losses are recognized in the income statement.
ANNUAL REPORT 2011 48 // 49
Calculation of recoverable amount:
The recoverable amount of assets is the greater of their fair value (less costs to sell) and value in use. In assessing value in use, the estimated future cash flows to be derived from the use of the asset are discounted to their present value using a pre-tax discount rate that reflects current market assessments of the time value of money and the risks specific to the asset. Impairment is reversed if there has been a change in the estimates used to determine the recoverable amount. Impairment is reversed only to the extent that the asset’s carrying amount does not exceed the carrying amount that would have been determined, net of depreciation or amortization.
(ii) Financial assetsA financial asset is considered to be impaired if objective evidence indicates that one or more events have had a negative effect on the estimated future cash flows of that asset.
An impairment loss in respect of a financial asset carried at amortized cost is calculated as the difference between its carrying amount and the present value of the estimated future cash flows. An impairment loss in respect of an available-for-sale financial asset is calculated by reference to its fair value.
Significant financial assets are tested for impairment on an individual basis. The remaining financial assets are assessed collectively in groups that share similar credit risk characteristics.
All impairment losses are recognized in profit or loss.
An impairment loss is reversed if the reversal can be related objectively to an event occurring after the impairment loss was recognized. For financial assets carried at amortized cost and available-for-sale financial assets that are debt securities, the reversal is recognized in profit or loss. For available-for-sale financial assets that are equity securities, the reversal is recognized directly in equity.
(k) Interest-bearing liabilities and finance lease liabilities
Interest-bearing liabilities and finance lease liabilities are recognized initially at principal amount less related transaction costs. Subsequent to initial recognition, interest-bearing liabilities are stated at amortized amount using the effective interest rate method.
(l) Employee benefits
Retirement benefit costsThe Group maintains defined contribution and defined benefit pension schemes for its Luxembourg based employees.
Premiums paid to the insurance company in relation to defined contribution retirement benefit plan are charged as an expense as they fall due.
The defined benefit scheme in Luxembourg is accounted for as such under IAS 19, using the Projected Unit Credit Method, with actuarial valuations being carried out at each balance sheet date (see Note 23 below).
To the extent that any cumulative unrecognized actuarial gain or loss exceeds 10 per cent of the greater of the present value of the defined benefit obligation and the fair value of plan assets, that portion is amortized in the income statement over the expected average remaining working lives of the employees participating in the plan. Otherwise, the actuarial gain or loss is not recognized.
(m) Provisions
A provision is recognized in the balance sheet when the Group has a present legal or contractual obligation that can be estimated reliably as a result of a past event, and if it is probable that an outflow of economic benefits will be required to settle this obligation. If the effect is material, provisions are determined by discounting the expected future cash flows at a pre-tax rate that reflects current market assessments of the time value of money and, where appropriate, the risks specific to the liability. Accruals related to those provisions are recognized as finance cost over the period.
Heavy maintenance costs (“D-checks”) relating to aircraft under operating leases are recognized as provisions on the basis of the heavy maintenance supplier agreement.
5003 | Consolidated financial statements
The Group accrues for delivery costs related to aircraft under operating leases as soon as it becomes apparent that the asset does not meet the return condition criteria set forth in the lease agreement.
(n) Trade and other payables
Trade and other payables are stated at cost.
(o) Revenue - Services rendered
Cargo sales, net of discounts, are recognized as revenue when the transportation service is provided. Other revenue, primarily third party aircraft maintenance, is also recognized when the service is rendered.
(p) Expenses
(i) Operating lease paymentsRentals paid under operating leases are recognized in the income statement over the term of the lease. Lease incentives received are recognized in the income statement as an integral part of the total lease expense over the term of the lease.
(ii) Finance lease paymentsMinimum lease payments are apportioned between the finance charge and the reduction of the outstanding liability. The finance charge is allocated to each period during the lease term so as to produce a constant periodic rate of interest on the remaining balance of the liability. The interest expense component of finance lease payments is recognized in the income statement using the effective interest rate method.
(iii) Net finance costsNet finance costs comprise the net result of (i) interest payable on borrowings, and (ii) interest receivable on funds invested (Cash and cash equivalents and Other investments), and gains and losses (realized and unrealized) on Other investments and on interest rate hedging instruments that do not qualify for hedge accounting (see Note 3 (c)).
Interest income is recognized in the income statement as it accrues, using the effective interest method where appropriate. Dividend income is recognized in the income statement as Other operating income on the date the Group’s right to receive the payments is established.
(q) Income tax
Income tax on the profit or loss for the year comprises current and deferred tax. Income tax is recognized in the income statement except to the extent that it relates to items recognized directly in equity, in which case it is recognized in equity or in Other Comprehensive Income.
Current tax is the expected tax payable on the taxable income for the year, using tax rates applicable at the balance sheet date, subject to any adjustment to tax payable in respect of previous years. Taxes that are not assessed on the Group’s income (e.g. Net worth tax) are recognized in Other operating expenses.
Deferred tax is computed using the balance sheet method, providing for temporary differences between the carrying amounts of assets and liabilities for financial reporting purposes and the amounts used for taxation purposes. Deferred tax is not recognized for temporary differences related to Investments in subsidiaries to the extent that they will probably not be reversed in the foreseeable future. The amount of deferred tax provided is based on the expected manner of realization or settlement of the carrying amount of assets and liabilities, using tax rates enacted at the balance sheet date.
A deferred tax asset is recognized only to the extent that it is probable that future taxable profits will be available against which the deferred tax asset can be utilized. Deferred tax assets are reviewed at each balance sheet date and are reduced to the extent that it is no longer probable that the related tax benefit will be realized.
(r) New and amended standards adopted by the Group
There are no IFRSs or IFRIC interpretations that are effective for the first time for the financial year beginning on or after January 1, 2011 that would be expected to have a material impact on the reporting result of the Group. The Group applied as from January 1, 2011 IAS24 revised.
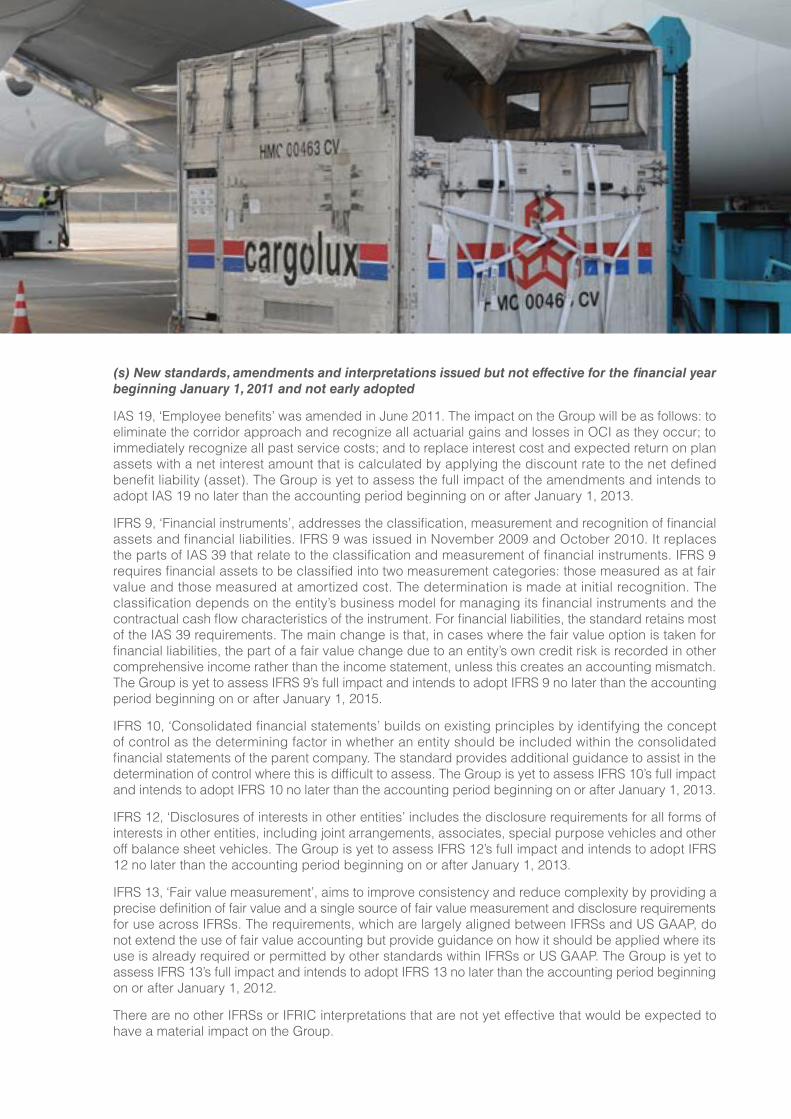
ANNUAL REPORT 2011 50 // 51
(s) New standards, amendments and interpretations issued but not effective for the financial year beginning January 1, 2011 and not early adopted
IAS 19, ‘Employee benefits’ was amended in June 2011. The impact on the Group will be as follows: to eliminate the corridor approach and recognize all actuarial gains and losses in OCI as they occur; to immediately recognize all past service costs; and to replace interest cost and expected return on plan assets with a net interest amount that is calculated by applying the discount rate to the net defined benefit liability (asset). The Group is yet to assess the full impact of the amendments and intends to adopt IAS 19 no later than the accounting period beginning on or after January 1, 2013.
IFRS 9, ‘Financial instruments’, addresses the classification, measurement and recognition of financial assets and financial liabilities. IFRS 9 was issued in November 2009 and October 2010. It replaces the parts of IAS 39 that relate to the classification and measurement of financial instruments. IFRS 9 requires financial assets to be classified into two measurement categories: those measured as at fair value and those measured at amortized cost. The determination is made at initial recognition. The classification depends on the entity’s business model for managing its financial instruments and the contractual cash flow characteristics of the instrument. For financial liabilities, the standard retains most of the IAS 39 requirements. The main change is that, in cases where the fair value option is taken for financial liabilities, the part of a fair value change due to an entity’s own credit risk is recorded in other comprehensive income rather than the income statement, unless this creates an accounting mismatch. The Group is yet to assess IFRS 9’s full impact and intends to adopt IFRS 9 no later than the accounting period beginning on or after January 1, 2015.
IFRS 10, ‘Consolidated financial statements’ builds on existing principles by identifying the concept of control as the determining factor in whether an entity should be included within the consolidated financial statements of the parent company. The standard provides additional guidance to assist in the determination of control where this is difficult to assess. The Group is yet to assess IFRS 10’s full impact and intends to adopt IFRS 10 no later than the accounting period beginning on or after January 1, 2013.
IFRS 12, ‘Disclosures of interests in other entities’ includes the disclosure requirements for all forms of interests in other entities, including joint arrangements, associates, special purpose vehicles and other off balance sheet vehicles. The Group is yet to assess IFRS 12’s full impact and intends to adopt IFRS 12 no later than the accounting period beginning on or after January 1, 2013.
IFRS 13, ‘Fair value measurement’, aims to improve consistency and reduce complexity by providing a precise definition of fair value and a single source of fair value measurement and disclosure requirements for use across IFRSs. The requirements, which are largely aligned between IFRSs and US GAAP, do not extend the use of fair value accounting but provide guidance on how it should be applied where its use is already required or permitted by other standards within IFRSs or US GAAP. The Group is yet to assess IFRS 13’s full impact and intends to adopt IFRS 13 no later than the accounting period beginning on or after January 1, 2012.
There are no other IFRSs or IFRIC interpretations that are not yet effective that would be expected to have a material impact on the Group.
5203 | Consolidated financial statements
4. Determination of fair valuesA number of the Group’s accounting policies and disclosures require the determination of fair value, for both financial and non-financial assets and liabilities. Fair values have been determined for measurement and/or disclosure purposes based on the following methods. Where applicable, further information about the assumptions made in determining fair values is disclosed in the notes specific to that asset or liability.
(i) Investments in equity securities The fair value of financial assets is determined by reference to their quoted bid price at the reporting date.
(ii) DerivativesFair values of hedging instruments, representing unrealized gains and losses, are determined on the balance sheet date based on third party pricings and valuations, including valuations provided by the Group’s counterparties to the hedging transactions. Where feasible any counterparty valuation is verified by the Group using independent sources. The values assume a normal functioning of financial markets. Market volatility will necessarily have an impact on said pricings and valuations as well as the Group’s eventual liability with respect of the hedging instruments booked at the balance sheet date.
(iii) Other financial assets/liabilitiesThe fair value of non-current receivables and payables is determined by discounting future cash flows using current market interest rates. Other financial assets and liabilities are carried at the fair value (on which see Note 3 (j) above).
5. Financial risks and risk managementRisk management framework
The Group has exposure to the following risks with respect of its financial assets and use of financial instruments:
• credit risk• liquidity risk• market risk
The objective of risk management is to manage and control risk exposures within acceptable parameters, while optimizing the benefit expected to be derived from the investing and risk management activities, respectively.
Credit riskCredit risk is the risk of financial loss to the Group if a counterparty to a financial instrument or issuer of a security owned by the Group fails to meet its contractual obligations because of insolvency, bankruptcy or similar event.
Liquidity risk Liquidity risk is the risk that the Group will encounter difficulty in meeting the obligations associated with its financial liabilities that are settled by delivering cash or another financial asset. The Group’s approach to managing liquidity is to ensure, as far as possible, that it will always have sufficient liquidity to meet its liabilities when due, under both normal and stressed conditions, without incurring unacceptable losses or risking damage to the Group’s assets or reputation.
Market risk Market risk is the risk that changes in asset prices resulting from fluctuation in foreign exchange rates, interest rates or fuel prices will affect the Group’s income or the value of its holdings of financial instruments.
General
This note presents information about the Group’s exposure to each of the above risks, the Group’s objectives, policies and processes for measuring and managing risk, as well as the Group’s objectives and policies for the management of excess cash. Where applicable, further quantitative disclosures are included throughout these financial statements.
ANNUAL REPORT 2011 52 // 53
The Board of Directors has overall responsibility for the establishment and oversight of the Group’s risk management framework. The Board has established the Risk Management Committee, which is responsible for executing and monitoring the Group’s risk management policies. The Risk Management Committee reports on a regular basis to the Board of Directors and its Audit Committee on the committee’s activities and on the evolution of the Group’s derivative portfolio.
The Group’s risk management policies are established to identify and analyze the risks faced by the Group, to set appropriate risk limits and controls, to determine appropriate instruments to protect the Group against risks and to monitor risks and financial limits. Risk management policies and procedures are reviewed as required to reflect changes in market conditions and the Group’s activities. The Group, through its training and management standards and procedures, aims to develop a disciplined and constructive control environment in which employees involved in the risk management activity understand their respective roles and obligations.
Risk management policiesThe Group buys derivatives in order to manage market risks. In connection with purchases of derivatives, the Group sometimes also sells derivatives. Such transactions are carried out within the risk management
framework and control mechanisms described below. Where possible the Group seeks to apply hedge accounting for those instruments in order to reduce volatility in profit or loss. The Group’s risk management policy prohibits short selling of options.
Investment policyThe primary goal of the Group’s investment policy is to maximize investment returns while always protecting the invested capital. To this effect, the Group invests excess cash, subject to limits established in its treasury policy, in investment funds, bank deposits, zero-coupons and structured products with a capital guarantee at maturity. The return on structured products depends on the performance of the underlying used, which may be equities, commodities, indices, currencies, securities or interest rates. Structured products are designated as Other investments and recorded at fair value in the balance sheet with any change in value flowing through the income statement. The Group does only purchase securities or structured investment products from a counterparty having a minimum, pre-determined credit rating and which makes a daily market in those securities or financial instruments.
5403 | Consolidated financial statements
(a) Credit risk
Cash, derivatives and other financial instrumentsGenerally, the Group limits its exposure to credit risk by only making deposits with, investing in securities issued by and buying protection from counterparties that have a long-term credit rating of at least BBB+ from Standard & Poor’s and Fitch and Baa1 from Moody’s. Any exception to this rule must be approved by the Risk Management Committee and is closely monitored and reported to the Executive Committee and the Board of Directors. Credit limits for each counterparty are in place and monitored on an ongoing basis. This enables the Group to cap the maximum amount of business that can be transacted with any given counterparty. Compliance with those credit limits is monitored and any exceeding of a limit is reported to Excom on a weekly basis.
The carrying amount of financial assets represents the maximum credit exposure.
Trade and other receivables The Group’s exposure to credit risk is influenced mainly by the individual characteristics of the customer and the demographics of the Group’s customer base, including the default risk of the industry and country in which customers operate. The Group distinguishes between countries considered as low risk and countries of higher risk depending on their geographical and political situation and monitors customers on either list separately.
The Credit Committee has established a credit policy under which each new customer not paying through CASS (Cargo Accounts Settlement Systems) is analyzed individually for creditworthiness before the Group’s standard payment and delivery terms and conditions are offered. The Group’s review includes external ratings, when available, and in some cases bank references. Purchase limits are established for each customer, which represents the maximum open amount allowed for trading without requiring approval from the Credit Committee; these limits are reviewed regularly. Customers that fail to meet the Group’s benchmark creditworthiness may transact with the Group only on a prepayment basis or if they can offer collateral e.g. bank guarantees or letters of a credit. The creditworthiness of customers paying through CASS is assessed and monitored by IATA which runs this clearing and settlement system on behalf of the cargo carriers.
ANNUAL REPORT 2011 54 // 55
Not more than 13% (2010: 13%) of the Group’s revenue is attributable to sales transactions with a single customer. The five largest customers of the Group represent 45% (2010: 45%) of the net cargo sales. More than 63% (2010: 65%) of the Group’s customers have been transacting with the Group for over four years, and losses have occurred infrequently. In monitoring customer credit risk, customers are grouped according to their credit characteristics, including whether they are an individual or legal entity, whether they are stand alone entities or part of a larger group, geographic location, aging profile, maturity and credit history. Customers that are graded as ‘high risk’ are closely scrutinized and monitored, and future sales are made on a prepayment or collateral basis with approval of the Credit Committee.
The Group’s credit risk exposure is mitigated by a credit risk insurance against delinquent customer payments purchased from a professional insurer that retransfers part of the risk to the Group’s captive reinsurance company.
The Group establishes an allowance for impairment that represents its estimate of incurred losses in respect of trade and other receivables (see Note 18).
The maximum exposure to credit risk for trade receivables at the reporting date by areas was:
In thousands of U.S. Dollar
2011 2010
Area 1 42,045 32,978
Area 2 92,295 77,902
Area 3 69,596 87,522
Area 4 3,144 2,414
207,080 200,816
Cargolux is a member of the IATA clearing systems CASS (Cargo Accounts Settlement Systems) and ICH (IATA Clearing House) commonly used by forwarders and airlines, respectively, to settle payments. In 2011, 74.0% of receivables were cleared through CASS and ICH (67.6% in 2010). As of December 31, 2011, 98.6% (97.0% in 2010) of the total outstanding trade debtors were within the contractual payment terms. The average DSO of trade receivables was 41.1 days in 2011 (40.9 days in 2010). In 2011 the Group suffered a credit loss of US$ 0.01 million (2010: US$ 0.20 million).
(b) Fuel risk
Fuel PriceThe Group’s earnings are significantly exposed to fluctuations in fuel prices. At USD/ton 1,010, 2011 marked the year with the highest average jet market price in history, exceeding the former 2008 record average and up by USD/ton 289 from 2010’s market price.
Fuel hedgesTo manage its fuel price risk the Group uses derivative instruments, mainly options. Most of the protection is provided through call options. To reduce the premiums paid for call options the Group sometimes combines the purchase of call options with the sale of put options, which creates a potential for the Group to pay out from such positions when the fuel price settles below the put strike price. The balance of selective downside exposure at low fuel prices and sustained protection against high fuel prices is reviewed in regular meetings of the Group’s Fuel Risk Management Committee. The Committee works within a Governance framework of Policy and Procedures and actively manages the fuel hedge portfolio.
During every month in 2011, the fuel hedges provided positive cash settlements. As cash collected from those positions in 2011 exceeded the premiums spent to establish those positions the overall effect was a reduction of the Group’s fuel bill as intended by the Group’s Governance on fuel.
As at December 31, 2011, a quantity of 103,311 metric tonnes was hedged for first half of 2012. For second half of 2012, the coverage amounted to 83,444 metric tonnes. Following the Group’s gradual approach to building the hedge portfolio, 2013 coverage stood at 21,854 metric tonnes only.
5603 | Consolidated financial statements
As at December 31, 2011, the fair value of fuel derivatives was as follows:
In thousands of U.S. Dollar
2011 2010
Derivative assets 19,270 21,427
Derivative liabilities (1,639) (11,357)
Balance at January 1 17,631 10,070
Non-qualifying hedges recognized in profit and loss – prior year (17,631) (10,070)
Non-qualifying hedges recognized in profit and loss – current year 12,426 17,631
Derivative assets 16,398 19,270
Derivative liabilities (3,972) (1,639)
Balance at December 31 12,426 17,631
No hedges have been considered for hedge accounting under IAS 39 in 2011 and 2010.
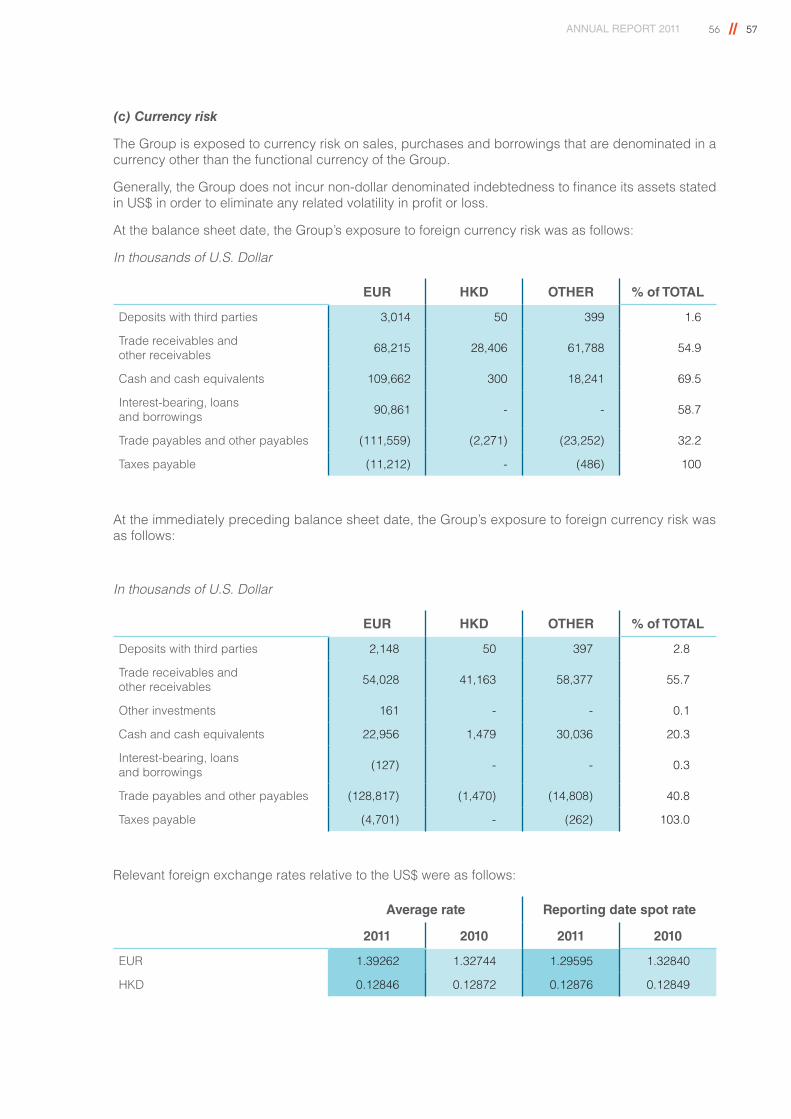
ANNUAL REPORT 2011 56 // 57
(c) Currency risk
The Group is exposed to currency risk on sales, purchases and borrowings that are denominated in a currency other than the functional currency of the Group.
Generally, the Group does not incur non-dollar denominated indebtedness to finance its assets stated in US$ in order to eliminate any related volatility in profit or loss.
At the balance sheet date, the Group’s exposure to foreign currency risk was as follows:
In thousands of U.S. Dollar
EUR HKD OTHER % of TOTAL
Deposits with third parties 3,014 50 399 1.6
Trade receivables and other receivables 68,215 28,406 61,788 54.9
Cash and cash equivalents 109,662 300 18,241 69.5
Interest-bearing, loans and borrowings 90,861 - - 58.7
Trade payables and other payables (111,559) (2,271) (23,252) 32.2
Taxes payable (11,212) - (486) 100
At the immediately preceding balance sheet date, the Group’s exposure to foreign currency risk was as follows:
In thousands of U.S. Dollar
EUR HKD OTHER % of TOTAL
Deposits with third parties 2,148 50 397 2.8
Trade receivables and other receivables 54,028 41,163 58,377 55.7
Other investments 161 - - 0.1
Cash and cash equivalents 22,956 1,479 30,036 20.3
Interest-bearing, loans and borrowings (127) - - 0.3
Trade payables and other payables (128,817) (1,470) (14,808) 40.8
Taxes payable (4,701) - (262) 103.0
Relevant foreign exchange rates relative to the US$ were as follows:
Average rate Reporting date spot rate
2011 2010 2011 2010
EUR 1.39262 1.32744 1.29595 1.32840
HKD 0.12846 0.12872 0.12876 0.12849
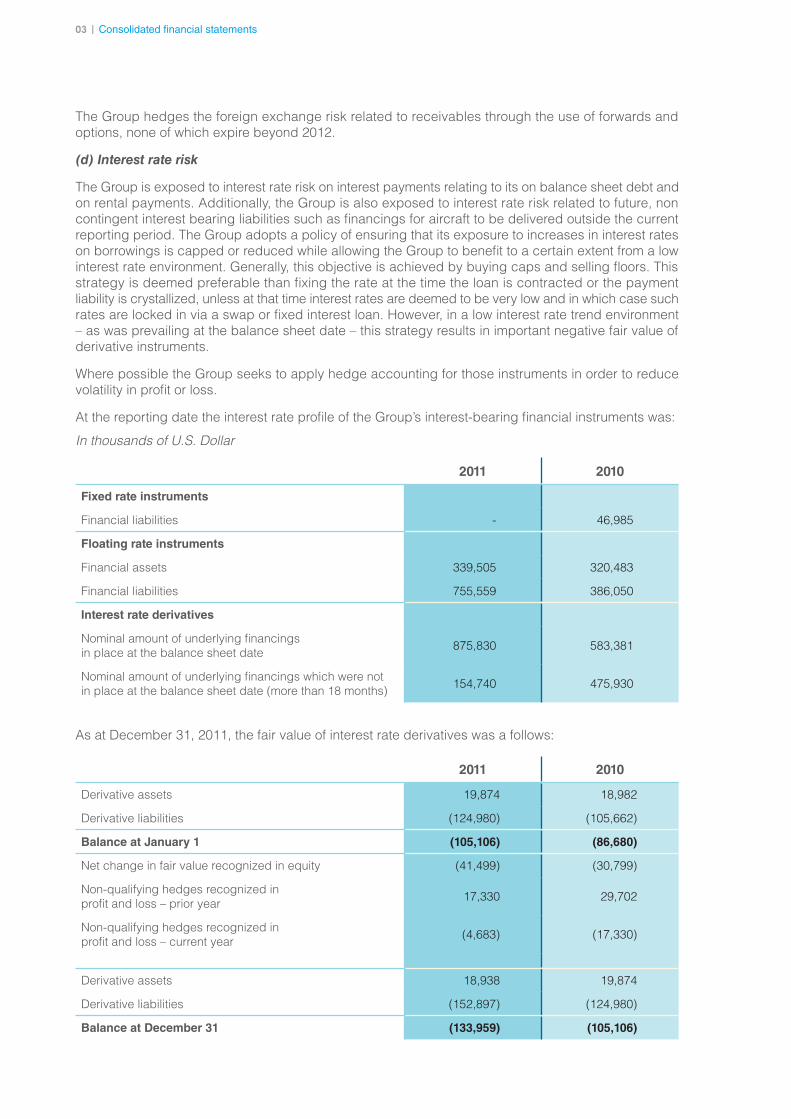
5803 | Consolidated financial statements
The Group hedges the foreign exchange risk related to receivables through the use of forwards and options, none of which expire beyond 2012.
(d) Interest rate risk
The Group is exposed to interest rate risk on interest payments relating to its on balance sheet debt and on rental payments. Additionally, the Group is also exposed to interest rate risk related to future, non contingent interest bearing liabilities such as financings for aircraft to be delivered outside the current reporting period. The Group adopts a policy of ensuring that its exposure to increases in interest rates on borrowings is capped or reduced while allowing the Group to benefit to a certain extent from a low interest rate environment. Generally, this objective is achieved by buying caps and selling floors. This strategy is deemed preferable than fixing the rate at the time the loan is contracted or the payment liability is crystallized, unless at that time interest rates are deemed to be very low and in which case such rates are locked in via a swap or fixed interest loan. However, in a low interest rate trend environment – as was prevailing at the balance sheet date – this strategy results in important negative fair value of derivative instruments.
Where possible the Group seeks to apply hedge accounting for those instruments in order to reduce volatility in profit or loss.
At the reporting date the interest rate profile of the Group’s interest-bearing financial instruments was:
In thousands of U.S. Dollar
2011 2010
Fixed rate instruments
Financial liabilities - 46,985
Floating rate instruments
Financial assets 339,505 320,483
Financial liabilities 755,559 386,050
Interest rate derivatives
Nominal amount of underlying financings in place at the balance sheet date 875,830 583,381
Nominal amount of underlying financings which were not in place at the balance sheet date (more than 18 months) 154,740 475,930
As at December 31, 2011, the fair value of interest rate derivatives was a follows:
2011 2010
Derivative assets 19,874 18,982
Derivative liabilities (124,980) (105,662)
Balance at January 1 (105,106) (86,680)
Net change in fair value recognized in equity (41,499) (30,799)
Non-qualifying hedges recognized in profit and loss – prior year 17,330 29,702
Non-qualifying hedges recognized in profit and loss – current year (4,683) (17,330)
Derivative assets 18,938 19,874
Derivative liabilities (152,897) (124,980)
Balance at December 31 (133,959) (105,106)
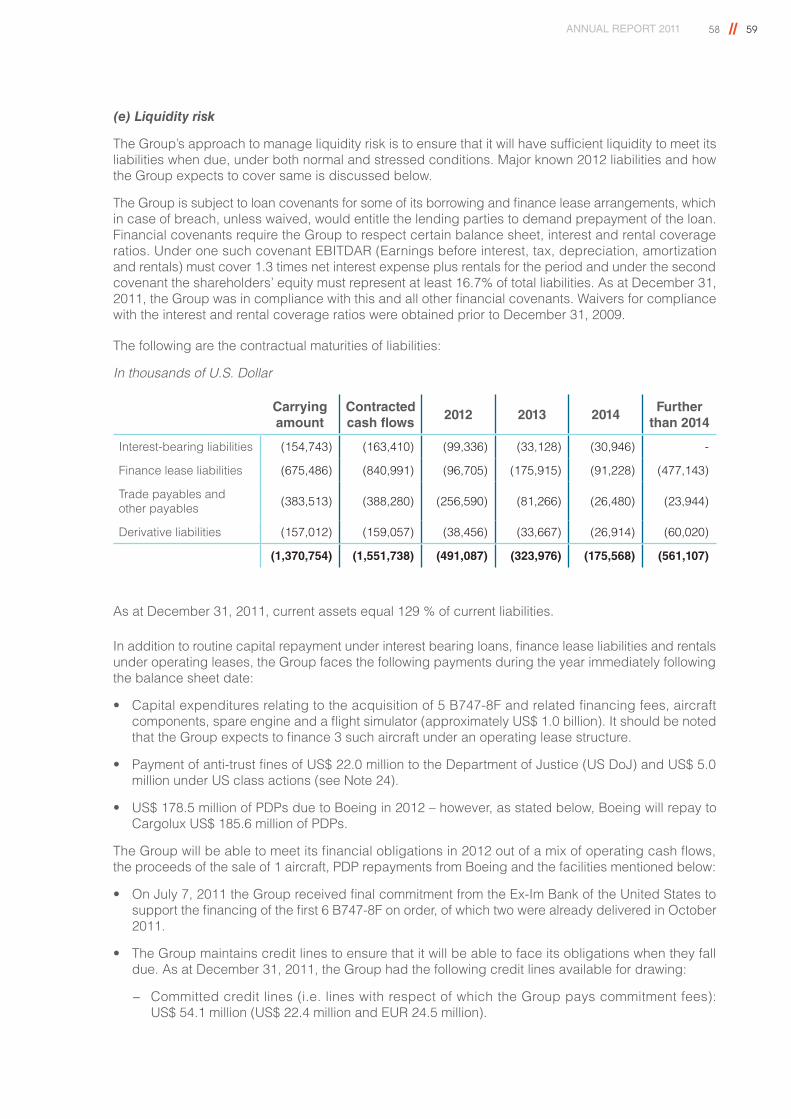
ANNUAL REPORT 2011 58 // 59
(e) Liquidity risk
The Group’s approach to manage liquidity risk is to ensure that it will have sufficient liquidity to meet its liabilities when due, under both normal and stressed conditions. Major known 2012 liabilities and how the Group expects to cover same is discussed below.
The Group is subject to loan covenants for some of its borrowing and finance lease arrangements, which in case of breach, unless waived, would entitle the lending parties to demand prepayment of the loan. Financial covenants require the Group to respect certain balance sheet, interest and rental coverage ratios. Under one such covenant EBITDAR (Earnings before interest, tax, depreciation, amortization and rentals) must cover 1.3 times net interest expense plus rentals for the period and under the second covenant the shareholders’ equity must represent at least 16.7% of total liabilities. As at December 31, 2011, the Group was in compliance with this and all other financial covenants. Waivers for compliance with the interest and rental coverage ratios were obtained prior to December 31, 2009.
The following are the contractual maturities of liabilities:
In thousands of U.S. Dollar
Carrying amount
Contracted cash flows
2012 2013 2014Further
than 2014
Interest-bearing liabilities (154,743) (163,410) (99,336) (33,128) (30,946) -
Finance lease liabilities (675,486) (840,991) (96,705) (175,915) (91,228) (477,143)
Trade payables and other payables (383,513) (388,280) (256,590) (81,266) (26,480) (23,944)
Derivative liabilities (157,012) (159,057) (38,456) (33,667) (26,914) (60,020)
(1,370,754) (1,551,738) (491,087) (323,976) (175,568) (561,107)
As at December 31, 2011, current assets equal 129 % of current liabilities.
In addition to routine capital repayment under interest bearing loans, finance lease liabilities and rentals under operating leases, the Group faces the following payments during the year immediately following the balance sheet date:
• Capital expenditures relating to the acquisition of 5 B747-8F and related financing fees, aircraft components, spare engine and a flight simulator (approximately US$ 1.0 billion). It should be noted that the Group expects to finance 3 such aircraft under an operating lease structure.
• Payment of anti-trust fines of US$ 22.0 million to the Department of Justice (US DoJ) and US$ 5.0 million under US class actions (see Note 24).
• US$ 178.5 million of PDPs due to Boeing in 2012 – however, as stated below, Boeing will repay to Cargolux US$ 185.6 million of PDPs.
The Group will be able to meet its financial obligations in 2012 out of a mix of operating cash flows, the proceeds of the sale of 1 aircraft, PDP repayments from Boeing and the facilities mentioned below:
• On July 7, 2011 the Group received final commitment from the Ex-Im Bank of the United States to support the financing of the first 6 B747-8F on order, of which two were already delivered in October 2011.
• The Group maintains credit lines to ensure that it will be able to face its obligations when they fall due. As at December 31, 2011, the Group had the following credit lines available for drawing:
− Committed credit lines (i.e. lines with respect of which the Group pays commitment fees): US$ 54.1 million (US$ 22.4 million and EUR 24.5 million).
6003 | Consolidated financial statements
• To finance part of the PDPs due to Boeing in 2012 and 2013, the Company has in place one revolving PDP credit facility of US$ 65.4 million expiring in 2013 and one committed PDP credit of US$ 26.0 million expiring in the second half of 2012.
• Utilized credit facility: EUR 70 million:
− On December 18, 2009, the Group signed with the Luxembourg government and six financial institutions a State guaranteed credit facility under the law of May 29, 2009 enabling the Government to issue its guarantee to undertakings which are temporarily affected by the crisis but are otherwise sound. The Group drew the full amount of the facility in December 2011 as if unused, the facility would have expired on December 31, 2011. The outstanding EUR 70 million at year-end 2011 are to be repaid in three equal year-end installments between 2012 and 2014 subject to any prepayment.
(f) Sensitivity analysis
In managing currency, interest rate and fuel price risks, the Group seeks to reduce the impact of short- to medium-term changes in values on the Group’s budgeted earnings and cash flows. Over the longer term, however, permanent changes in any or all of the above would have a material impact on earnings and cash flows.
At December 31, 2011, it is estimated that a general increase of one percentage point in interest rates would have increased the Group’s profit before tax before marked-to-market of derivative instruments by approximately US$ 1.8 million. Interest rate swaps and other hedging instruments that were in place at that time have been included in this calculation. A general decrease of one percentage point in interest rates would have led to negative interest rates at balance sheet date and therefore such an impact has not been simulated.
It is estimated that a general increase/decrease of one percentage point in the value of the US dollar against other foreign currencies throughout the year would have decreased/increased the Group’s profit before tax by approximately US$ 7.5 million. The forward exchange contracts and other hedging instruments that were in place at that time have been included in this calculation.
It is estimated that an increase/decrease of USD/t 50 in the price of jet fuel (basis barges Rotterdam) over a one-year period would have increased/decreased the Group’s fuel bill by around US$ 37 million. The impact on the Profit and Loss of a fuel price increase can to a large extent be mitigated by cash inflows from both fuel hedging and the fuel surcharge program.
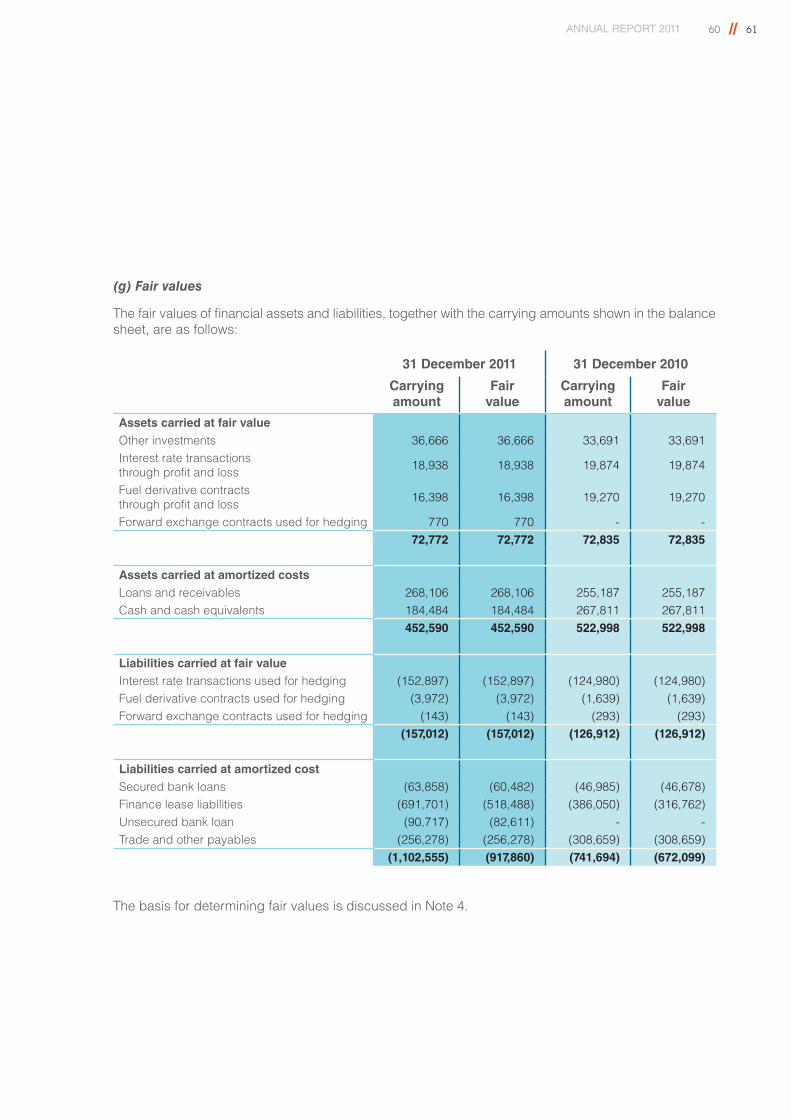
ANNUAL REPORT 2011 60 // 61
(g) Fair values
The fair values of financial assets and liabilities, together with the carrying amounts shown in the balance sheet, are as follows:
31 December 2011 31 December 2010
Carrying amount
Fair value
Carrying amount
Fair value
Assets carried at fair valueOther investments 36,666 36,666 33,691 33,691Interest rate transactions through profit and loss 18,938 18,938 19,874 19,874
Fuel derivative contracts through profit and loss 16,398 16,398 19,270 19,270
Forward exchange contracts used for hedging 770 770 - -72,772 72,772 72,835 72,835
Assets carried at amortized costsLoans and receivables 268,106 268,106 255,187 255,187Cash and cash equivalents 184,484 184,484 267,811 267,811
452,590 452,590 522,998 522,998
Liabilities carried at fair valueInterest rate transactions used for hedging (152,897) (152,897) (124,980) (124,980) Fuel derivative contracts used for hedging (3,972) (3,972) (1,639) (1,639)Forward exchange contracts used for hedging (143) (143) (293) (293)
(157,012) (157,012) (126,912) (126,912)
Liabilities carried at amortized costSecured bank loans (63,858) (60,482) (46,985) (46,678)Finance lease liabilities (691,701) (518,488) (386,050) (316,762)Unsecured bank loan (90,717) (82,611) - -Trade and other payables (256,278) (256,278) (308,659) (308,659)
(1,102,555) (917,860) (741,694) (672,099)
The basis for determining fair values is discussed in Note 4.
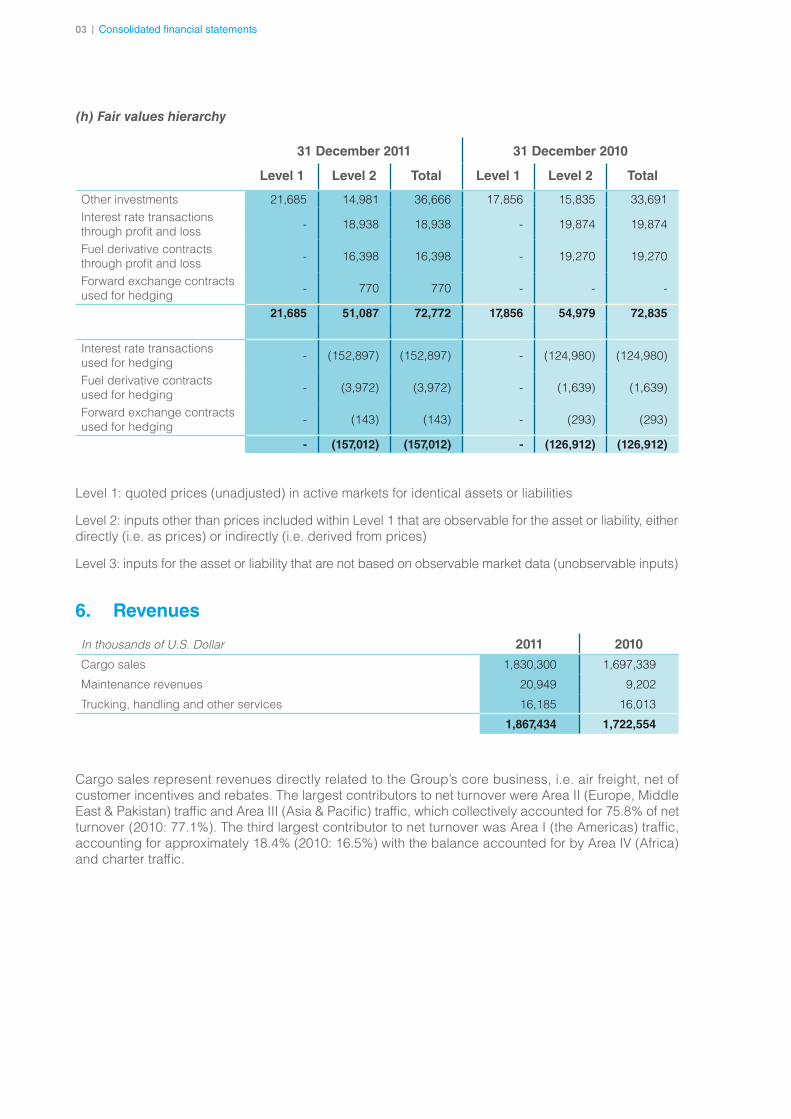
6203 | Consolidated financial statements
(h) Fair values hierarchy
31 December 2011 31 December 2010
Level 1 Level 2 Total Level 1 Level 2 Total
Other investments 21,685 14,981 36,666 17,856 15,835 33,691Interest rate transactions through profit and loss - 18,938 18,938 - 19,874 19,874
Fuel derivative contracts through profit and loss - 16,398 16,398 - 19,270 19,270
Forward exchange contracts used for hedging - 770 770 - - -
21,685 51,087 72,772 17,856 54,979 72,835
Interest rate transactions used for hedging - (152,897) (152,897) - (124,980) (124,980)
Fuel derivative contracts used for hedging - (3,972) (3,972) - (1,639) (1,639)
Forward exchange contracts used for hedging - (143) (143) - (293) (293)
- (157,012) (157,012) - (126,912) (126,912)
Level 1: quoted prices (unadjusted) in active markets for identical assets or liabilities
Level 2: inputs other than prices included within Level 1 that are observable for the asset or liability, either directly (i.e. as prices) or indirectly (i.e. derived from prices)
Level 3: inputs for the asset or liability that are not based on observable market data (unobservable inputs)
6. Revenues
In thousands of U.S. Dollar 2011 2010
Cargo sales 1,830,300 1,697,339
Maintenance revenues 20,949 9,202
Trucking, handling and other services 16,185 16,013
1,867,434 1,722,554
Cargo sales represent revenues directly related to the Group’s core business, i.e. air freight, net of customer incentives and rebates. The largest contributors to net turnover were Area II (Europe, Middle East & Pakistan) traffic and Area III (Asia & Pacific) traffic, which collectively accounted for 75.8% of net turnover (2010: 77.1%). The third largest contributor to net turnover was Area I (the Americas) traffic, accounting for approximately 18.4% (2010: 16.5%) with the balance accounted for by Area IV (Africa) and charter traffic.
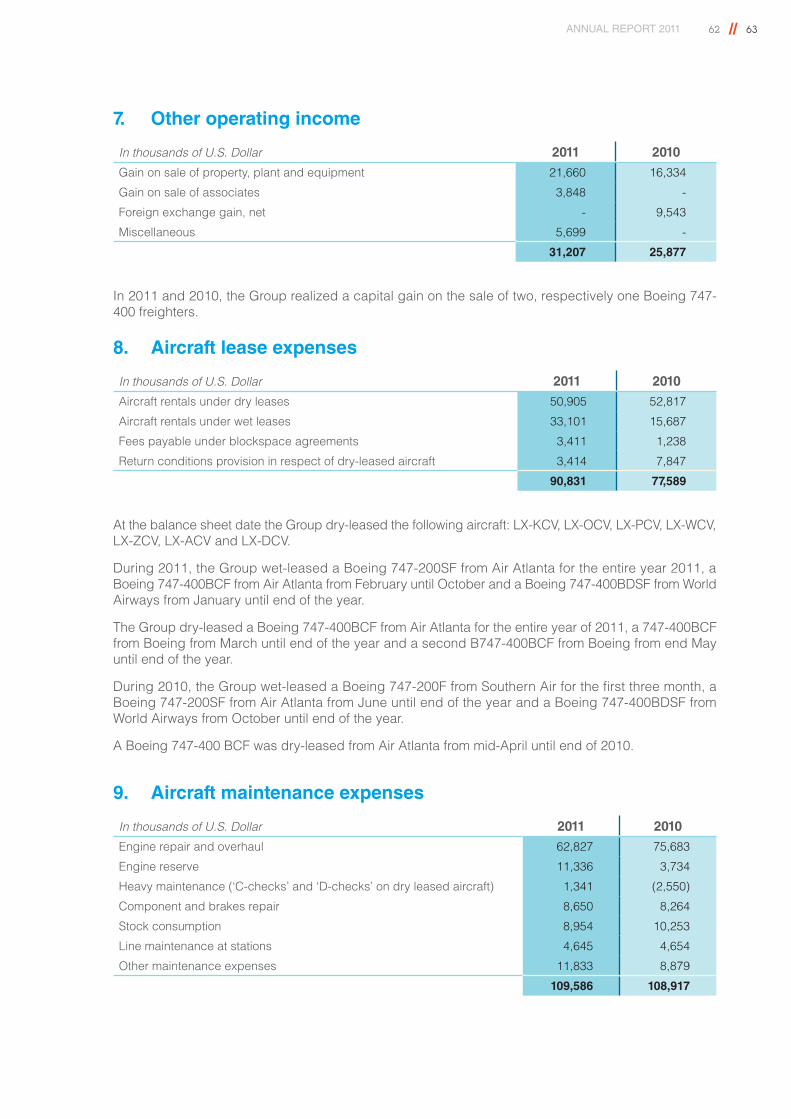
ANNUAL REPORT 2011 62 // 63
7. Other operating income
In thousands of U.S. Dollar 2011 2010
Gain on sale of property, plant and equipment 21,660 16,334
Gain on sale of associates 3,848 -
Foreign exchange gain, net - 9,543
Miscellaneous 5,699 -
31,207 25,877
In 2011 and 2010, the Group realized a capital gain on the sale of two, respectively one Boeing 747-400 freighters.
8. Aircraft lease expenses
In thousands of U.S. Dollar 2011 2010
Aircraft rentals under dry leases 50,905 52,817
Aircraft rentals under wet leases 33,101 15,687
Fees payable under blockspace agreements 3,411 1,238
Return conditions provision in respect of dry-leased aircraft 3,414 7,847
90,831 77,589
At the balance sheet date the Group dry-leased the following aircraft: LX-KCV, LX-OCV, LX-PCV, LX-WCV, LX-ZCV, LX-ACV and LX-DCV.
During 2011, the Group wet-leased a Boeing 747-200SF from Air Atlanta for the entire year 2011, a Boeing 747-400BCF from Air Atlanta from February until October and a Boeing 747-400BDSF from World Airways from January until end of the year.
The Group dry-leased a Boeing 747-400BCF from Air Atlanta for the entire year of 2011, a 747-400BCF from Boeing from March until end of the year and a second B747-400BCF from Boeing from end May until end of the year.
During 2010, the Group wet-leased a Boeing 747-200F from Southern Air for the first three month, a Boeing 747-200SF from Air Atlanta from June until end of the year and a Boeing 747-400BDSF from World Airways from October until end of the year.
A Boeing 747-400 BCF was dry-leased from Air Atlanta from mid-April until end of 2010.
9. Aircraft maintenance expenses
In thousands of U.S. Dollar 2011 2010
Engine repair and overhaul 62,827 75,683
Engine reserve 11,336 3,734
Heavy maintenance (‘C-checks’ and ‘D-checks’ on dry leased aircraft) 1,341 (2,550)
Component and brakes repair 8,650 8,264
Stock consumption 8,954 10,253
Line maintenance at stations 4,645 4,654
Other maintenance expenses 11,833 8,879
109,586 108,917
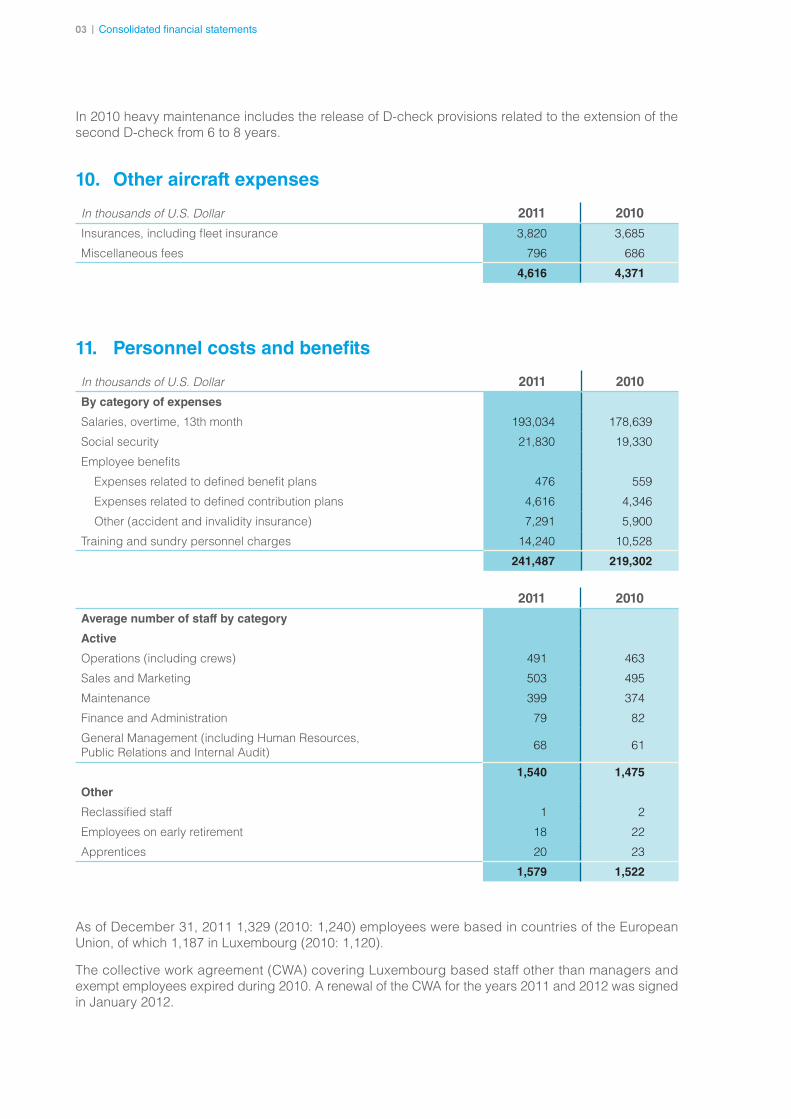
6403 | Consolidated financial statements
In 2010 heavy maintenance includes the release of D-check provisions related to the extension of the second D-check from 6 to 8 years.
10. Other aircraft expenses
In thousands of U.S. Dollar 2011 2010
Insurances, including fleet insurance 3,820 3,685
Miscellaneous fees 796 686
4,616 4,371
11. Personnel costs and benefits
In thousands of U.S. Dollar 2011 2010
By category of expenses
Salaries, overtime, 13th month 193,034 178,639
Social security 21,830 19,330
Employee benefits
Expenses related to defined benefit plans 476 559
Expenses related to defined contribution plans 4,616 4,346
Other (accident and invalidity insurance) 7,291 5,900
Training and sundry personnel charges 14,240 10,528
241,487 219,302
2011 2010
Average number of staff by category
Active
Operations (including crews) 491 463
Sales and Marketing 503 495
Maintenance 399 374
Finance and Administration 79 82
General Management (including Human Resources, Public Relations and Internal Audit) 68 61
1,540 1,475
Other
Reclassified staff 1 2
Employees on early retirement 18 22
Apprentices 20 23
1,579 1,522
As of December 31, 2011 1,329 (2010: 1,240) employees were based in countries of the European Union, of which 1,187 in Luxembourg (2010: 1,120).
The collective work agreement (CWA) covering Luxembourg based staff other than managers and exempt employees expired during 2010. A renewal of the CWA for the years 2011 and 2012 was signed in January 2012.
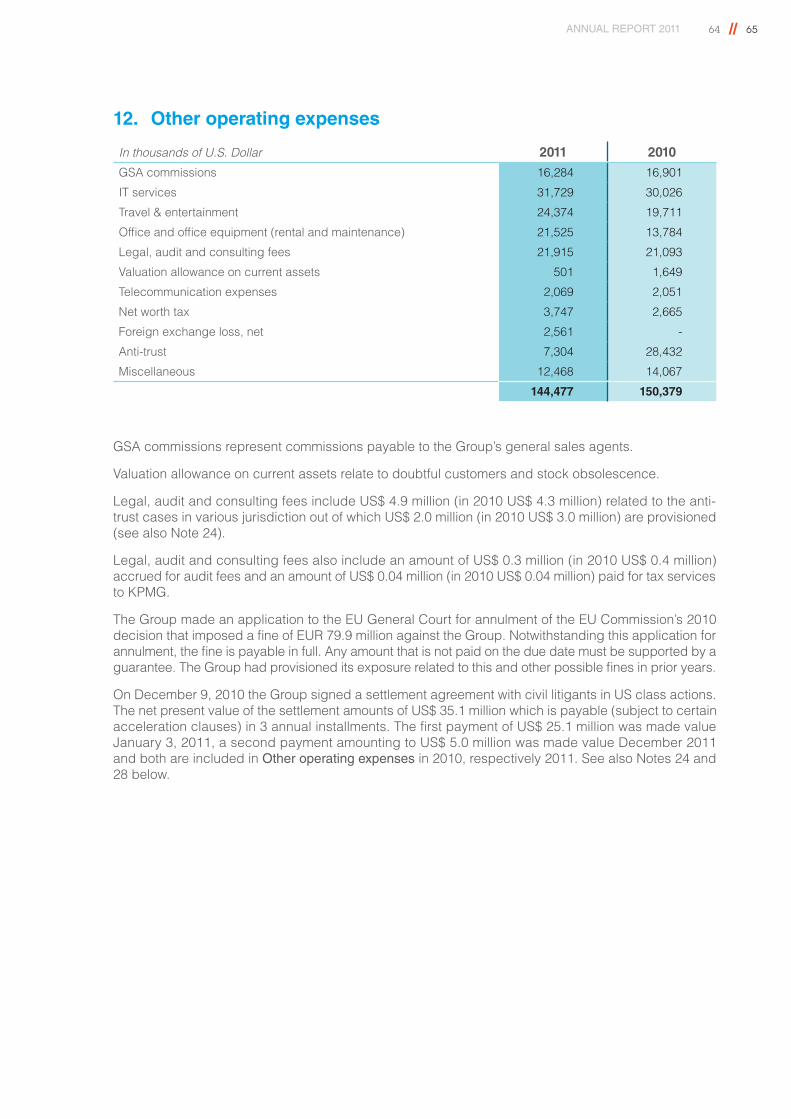
ANNUAL REPORT 2011 64 // 65
12. Other operating expenses
In thousands of U.S. Dollar 2011 2010
GSA commissions 16,284 16,901
IT services 31,729 30,026
Travel & entertainment 24,374 19,711
Office and office equipment (rental and maintenance) 21,525 13,784
Legal, audit and consulting fees 21,915 21,093
Valuation allowance on current assets 501 1,649
Telecommunication expenses 2,069 2,051
Net worth tax 3,747 2,665
Foreign exchange loss, net 2,561 -
Anti-trust 7,304 28,432
Miscellaneous 12,468 14,067
144,477 150,379
GSA commissions represent commissions payable to the Group’s general sales agents.
Valuation allowance on current assets relate to doubtful customers and stock obsolescence.
Legal, audit and consulting fees include US$ 4.9 million (in 2010 US$ 4.3 million) related to the anti-trust cases in various jurisdiction out of which US$ 2.0 million (in 2010 US$ 3.0 million) are provisioned (see also Note 24).
Legal, audit and consulting fees also include an amount of US$ 0.3 million (in 2010 US$ 0.4 million) accrued for audit fees and an amount of US$ 0.04 million (in 2010 US$ 0.04 million) paid for tax services to KPMG.
The Group made an application to the EU General Court for annulment of the EU Commission’s 2010 decision that imposed a fine of EUR 79.9 million against the Group. Notwithstanding this application for annulment, the fine is payable in full. Any amount that is not paid on the due date must be supported by a guarantee. The Group had provisioned its exposure related to this and other possible fines in prior years.
On December 9, 2010 the Group signed a settlement agreement with civil litigants in US class actions. The net present value of the settlement amounts of US$ 35.1 million which is payable (subject to certain acceleration clauses) in 3 annual installments. The first payment of US$ 25.1 million was made value January 3, 2011, a second payment amounting to US$ 5.0 million was made value December 2011 and both are included in Other operating expenses in 2010, respectively 2011. See also Notes 24 and 28 below.
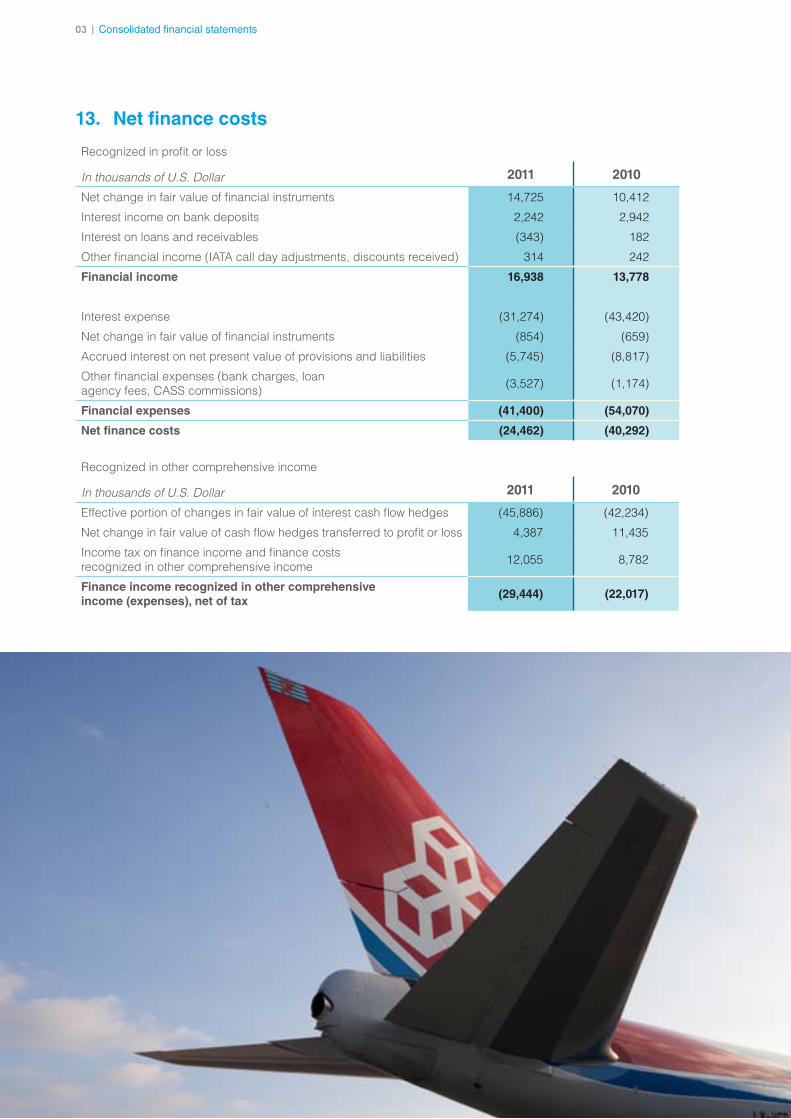
6603 | Consolidated financial statements
13. Net finance costs
Recognized in profit or loss
In thousands of U.S. Dollar 2011 2010
Net change in fair value of financial instruments 14,725 10,412
Interest income on bank deposits 2,242 2,942
Interest on loans and receivables (343) 182
Other financial income (IATA call day adjustments, discounts received) 314 242
Financial income 16,938 13,778
Interest expense (31,274) (43,420)
Net change in fair value of financial instruments (854) (659)
Accrued interest on net present value of provisions and liabilities (5,745) (8,817)
Other financial expenses (bank charges, loan agency fees, CASS commissions) (3,527) (1,174)
Financial expenses (41,400) (54,070)
Net finance costs (24,462) (40,292)
Recognized in other comprehensive income
In thousands of U.S. Dollar 2011 2010
Effective portion of changes in fair value of interest cash flow hedges (45,886) (42,234)
Net change in fair value of cash flow hedges transferred to profit or loss 4,387 11,435
Income tax on finance income and finance costs recognized in other comprehensive income 12,055 8,782
Finance income recognized in other comprehensive income (expenses), net of tax
(29,444) (22,017)
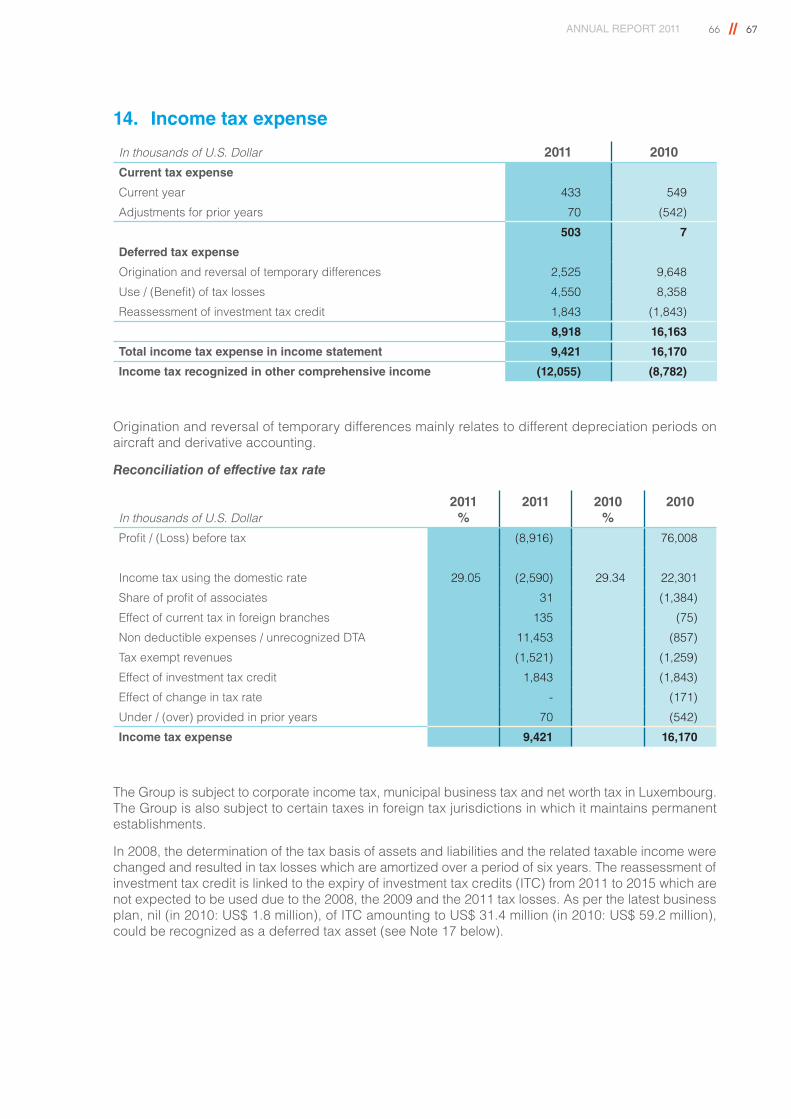
ANNUAL REPORT 2011 66 // 67
14. Income tax expense
In thousands of U.S. Dollar 2011 2010
Current tax expense
Current year 433 549
Adjustments for prior years 70 (542)
503 7
Deferred tax expense
Origination and reversal of temporary differences 2,525 9,648
Use / (Benefit) of tax losses 4,550 8,358
Reassessment of investment tax credit 1,843 (1,843)
8,918 16,163
Total income tax expense in income statement 9,421 16,170
Income tax recognized in other comprehensive income (12,055) (8,782)
Origination and reversal of temporary differences mainly relates to different depreciation periods on aircraft and derivative accounting.
Reconciliation of effective tax rate
In thousands of U.S. Dollar2011
%2011 2010
%2010
Profit / (Loss) before tax (8,916) 76,008
Income tax using the domestic rate 29.05 (2,590) 29.34 22,301
Share of profit of associates 31 (1,384)
Effect of current tax in foreign branches 135 (75)
Non deductible expenses / unrecognized DTA 11,453 (857)
Tax exempt revenues (1,521) (1,259)
Effect of investment tax credit 1,843 (1,843)
Effect of change in tax rate - (171)
Under / (over) provided in prior years 70 (542)
Income tax expense 9,421 16,170
The Group is subject to corporate income tax, municipal business tax and net worth tax in Luxembourg. The Group is also subject to certain taxes in foreign tax jurisdictions in which it maintains permanent establishments.
In 2008, the determination of the tax basis of assets and liabilities and the related taxable income were changed and resulted in tax losses which are amortized over a period of six years. The reassessment of investment tax credit is linked to the expiry of investment tax credits (ITC) from 2011 to 2015 which are not expected to be used due to the 2008, the 2009 and the 2011 tax losses. As per the latest business plan, nil (in 2010: US$ 1.8 million), of ITC amounting to US$ 31.4 million (in 2010: US$ 59.2 million), could be recognized as a deferred tax asset (see Note 17 below).
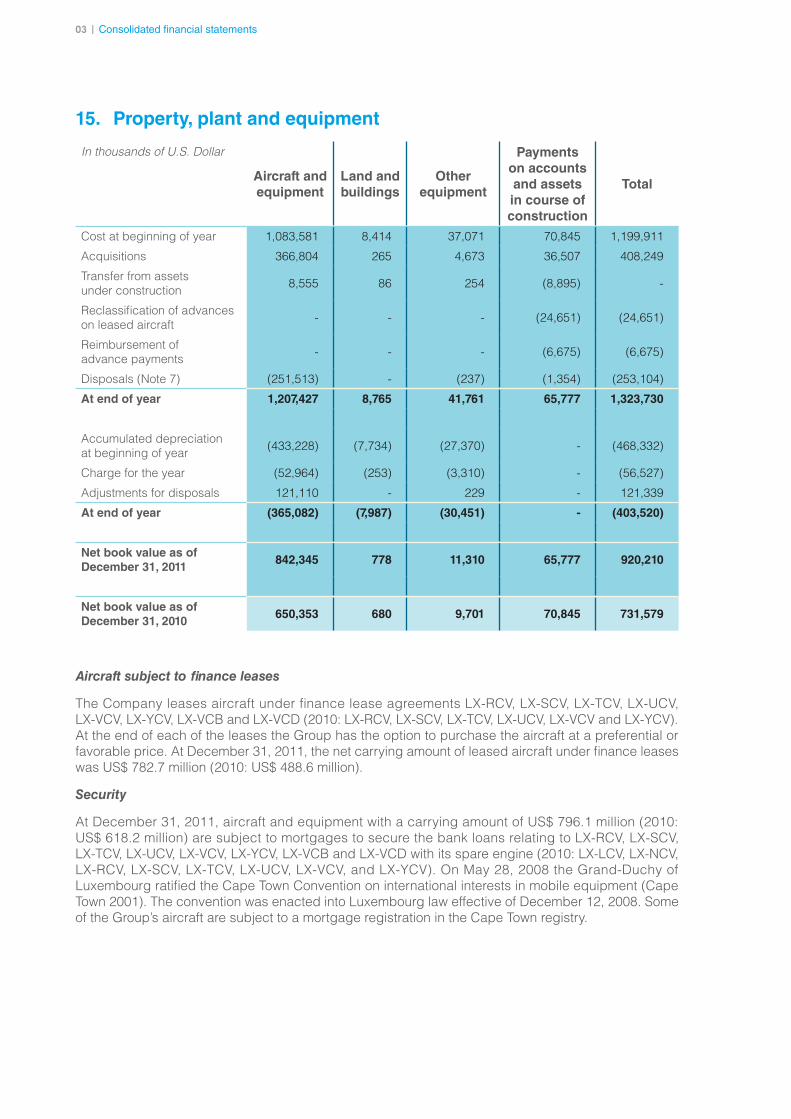
6803 | Consolidated financial statements
15. Property, plant and equipment
In thousands of U.S. Dollar
Aircraft and equipment
Land and buildings
Other equipment
Payments on accounts and assets in course of construction
Total
Cost at beginning of year 1,083,581 8,414 37,071 70,845 1,199,911
Acquisitions 366,804 265 4,673 36,507 408,249
Transfer from assets under construction 8,555 86 254 (8,895) -
Reclassification of advances on leased aircraft - - - (24,651) (24,651)
Reimbursement of advance payments - - - (6,675) (6,675)
Disposals (Note 7) (251,513) - (237) (1,354) (253,104)
At end of year 1,207,427 8,765 41,761 65,777 1,323,730
Accumulated depreciation at beginning of year (433,228) (7,734) (27,370) - (468,332)
Charge for the year (52,964) (253) (3,310) - (56,527)
Adjustments for disposals 121,110 - 229 - 121,339
At end of year (365,082) (7,987) (30,451) - (403,520)
Net book value as of December 31, 2011
842,345 778 11,310 65,777 920,210
Net book value as of December 31, 2010
650,353 680 9,701 70,845 731,579
Aircraft subject to finance leases
The Company leases aircraft under finance lease agreements LX-RCV, LX-SCV, LX-TCV, LX-UCV, LX-VCV, LX-YCV, LX-VCB and LX-VCD (2010: LX-RCV, LX-SCV, LX-TCV, LX-UCV, LX-VCV and LX-YCV). At the end of each of the leases the Group has the option to purchase the aircraft at a preferential or favorable price. At December 31, 2011, the net carrying amount of leased aircraft under finance leases was US$ 782.7 million (2010: US$ 488.6 million).
Security
At December 31, 2011, aircraft and equipment with a carrying amount of US$ 796.1 million (2010: US$ 618.2 million) are subject to mortgages to secure the bank loans relating to LX-RCV, LX-SCV, LX-TCV, LX-UCV, LX-VCV, LX-YCV, LX-VCB and LX-VCD with its spare engine (2010: LX-LCV, LX-NCV, LX-RCV, LX-SCV, LX-TCV, LX-UCV, LX-VCV, and LX-YCV). On May 28, 2008 the Grand-Duchy of Luxembourg ratified the Cape Town Convention on international interests in mobile equipment (Cape Town 2001). The convention was enacted into Luxembourg law effective of December 12, 2008. Some of the Group’s aircraft are subject to a mortgage registration in the Cape Town registry.
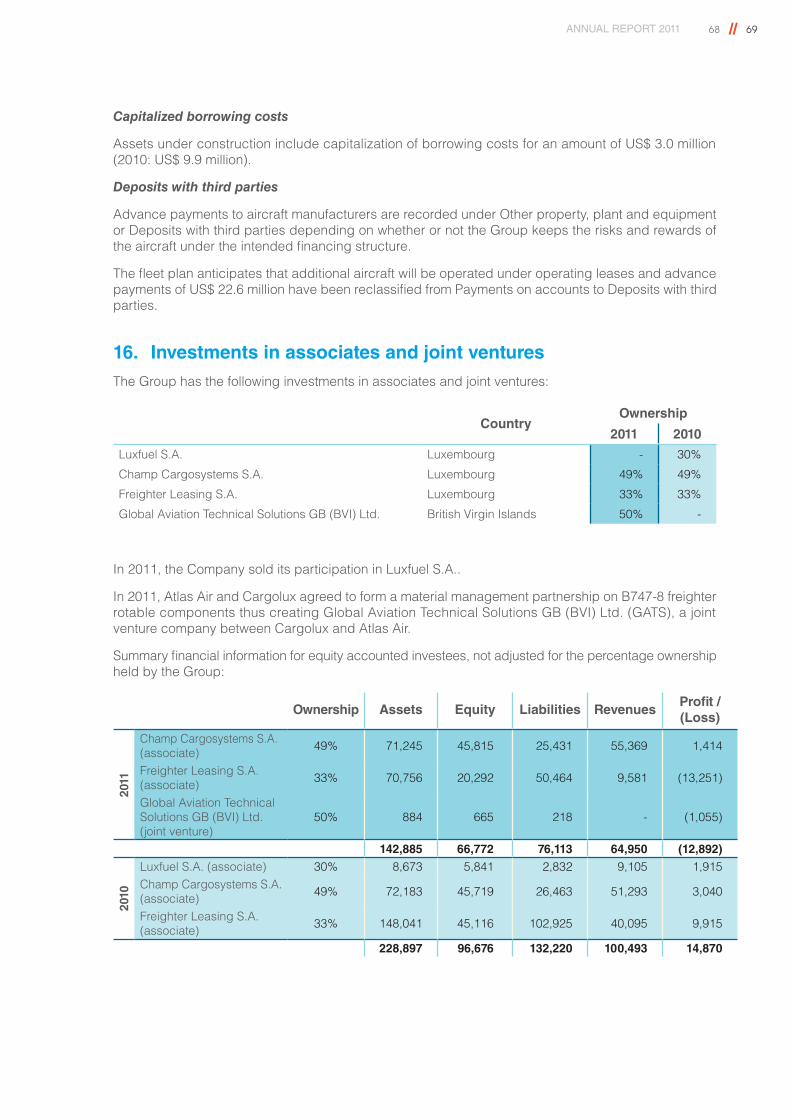
ANNUAL REPORT 2011 68 // 69
Capitalized borrowing costs
Assets under construction include capitalization of borrowing costs for an amount of US$ 3.0 million (2010: US$ 9.9 million).
Deposits with third parties
Advance payments to aircraft manufacturers are recorded under Other property, plant and equipment or Deposits with third parties depending on whether or not the Group keeps the risks and rewards of the aircraft under the intended financing structure.
The fleet plan anticipates that additional aircraft will be operated under operating leases and advance payments of US$ 22.6 million have been reclassified from Payments on accounts to Deposits with third parties.
16. Investments in associates and joint venturesThe Group has the following investments in associates and joint ventures:
CountryOwnership
2011 2010
Luxfuel S.A. Luxembourg - 30%
Champ Cargosystems S.A. Luxembourg 49% 49%
Freighter Leasing S.A. Luxembourg 33% 33%
Global Aviation Technical Solutions GB (BVI) Ltd. British Virgin Islands 50% -
In 2011, the Company sold its participation in Luxfuel S.A..
In 2011, Atlas Air and Cargolux agreed to form a material management partnership on B747-8 freighter rotable components thus creating Global Aviation Technical Solutions GB (BVI) Ltd. (GATS), a joint venture company between Cargolux and Atlas Air.
Summary financial information for equity accounted investees, not adjusted for the percentage ownership held by the Group:
Ownership Assets Equity Liabilities RevenuesProfit / (Loss)
2011
Champ Cargosystems S.A. (associate) 49% 71,245 45,815 25,431 55,369 1,414
Freighter Leasing S.A. (associate) 33% 70,756 20,292 50,464 9,581 (13,251)
Global Aviation Technical Solutions GB (BVI) Ltd. (joint venture)
50% 884 665 218 - (1,055)
142,885 66,772 76,113 64,950 (12,892)
2010
Luxfuel S.A. (associate) 30% 8,673 5,841 2,832 9,105 1,915Champ Cargosystems S.A. (associate) 49% 72,183 45,719 26,463 51,293 3,040
Freighter Leasing S.A. (associate) 33% 148,041 45,116 102,925 40,095 9,915
228,897 96,676 132,220 100,493 14,870
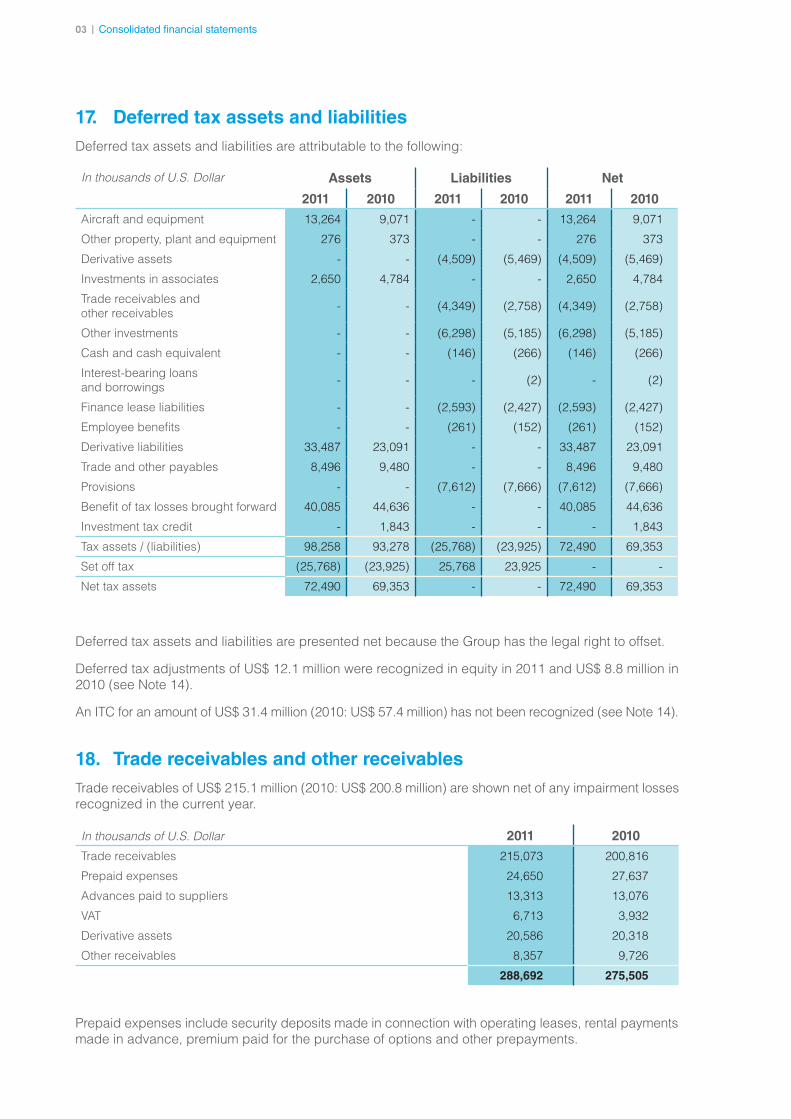
7003 | Consolidated financial statements
17. Deferred tax assets and liabilities Deferred tax assets and liabilities are attributable to the following:
In thousands of U.S. Dollar Assets Liabilities Net
2011 2010 2011 2010 2011 2010
Aircraft and equipment 13,264 9,071 - - 13,264 9,071
Other property, plant and equipment 276 373 - - 276 373
Derivative assets - - (4,509) (5,469) (4,509) (5,469)
Investments in associates 2,650 4,784 - - 2,650 4,784
Trade receivables and other receivables - - (4,349) (2,758) (4,349) (2,758)
Other investments - - (6,298) (5,185) (6,298) (5,185)
Cash and cash equivalent - - (146) (266) (146) (266)
Interest-bearing loans and borrowings - - - (2) - (2)
Finance lease liabilities - - (2,593) (2,427) (2,593) (2,427)
Employee benefits - - (261) (152) (261) (152)
Derivative liabilities 33,487 23,091 - - 33,487 23,091
Trade and other payables 8,496 9,480 - - 8,496 9,480
Provisions - - (7,612) (7,666) (7,612) (7,666)
Benefit of tax losses brought forward 40,085 44,636 - - 40,085 44,636
Investment tax credit - 1,843 - - - 1,843
Tax assets / (liabilities) 98,258 93,278 (25,768) (23,925) 72,490 69,353
Set off tax (25,768) (23,925) 25,768 23,925 - -
Net tax assets 72,490 69,353 - - 72,490 69,353
Deferred tax assets and liabilities are presented net because the Group has the legal right to offset.
Deferred tax adjustments of US$ 12.1 million were recognized in equity in 2011 and US$ 8.8 million in 2010 (see Note 14).
An ITC for an amount of US$ 31.4 million (2010: US$ 57.4 million) has not been recognized (see Note 14).
18. Trade receivables and other receivablesTrade receivables of US$ 215.1 million (2010: US$ 200.8 million) are shown net of any impairment losses recognized in the current year.
In thousands of U.S. Dollar 2011 2010
Trade receivables 215,073 200,816
Prepaid expenses 24,650 27,637
Advances paid to suppliers 13,313 13,076
VAT 6,713 3,932
Derivative assets 20,586 20,318
Other receivables 8,357 9,726
288,692 275,505
Prepaid expenses include security deposits made in connection with operating leases, rental payments made in advance, premium paid for the purchase of options and other prepayments.
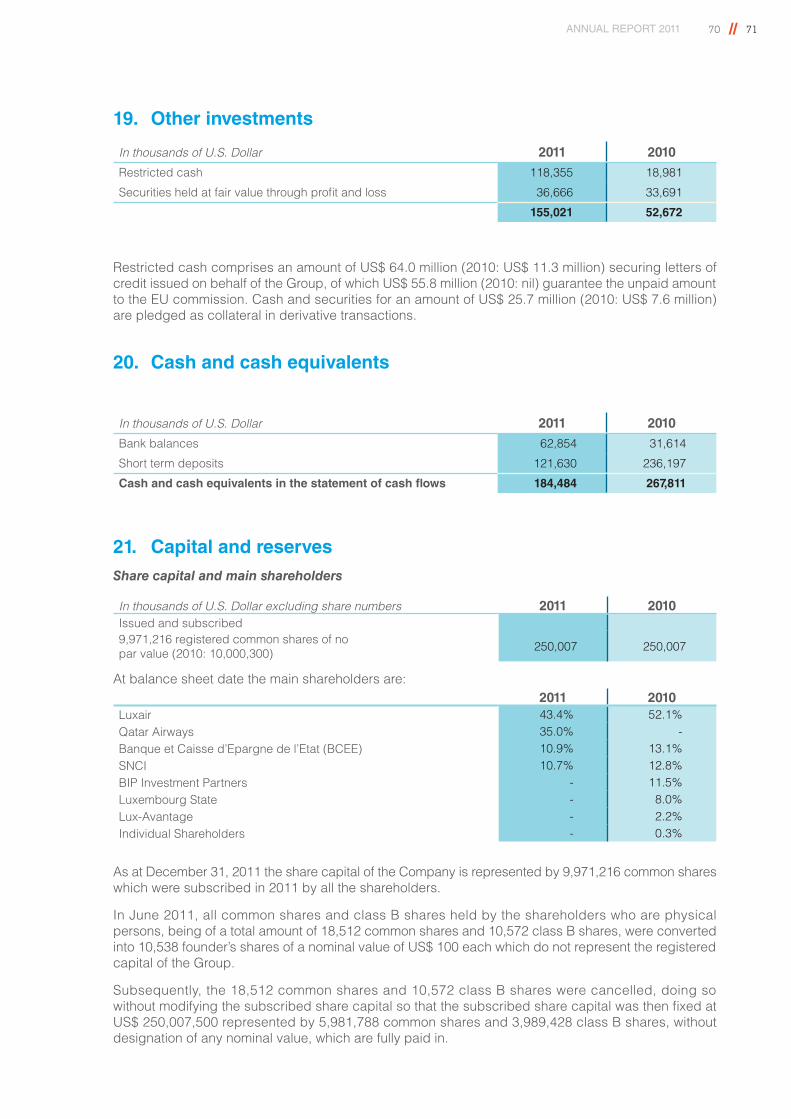
ANNUAL REPORT 2011 70 // 71
19. Other investments
In thousands of U.S. Dollar 2011 2010
Restricted cash 118,355 18,981
Securities held at fair value through profit and loss 36,666 33,691
155,021 52,672
Restricted cash comprises an amount of US$ 64.0 million (2010: US$ 11.3 million) securing letters of credit issued on behalf of the Group, of which US$ 55.8 million (2010: nil) guarantee the unpaid amount to the EU commission. Cash and securities for an amount of US$ 25.7 million (2010: US$ 7.6 million) are pledged as collateral in derivative transactions.
20. Cash and cash equivalents
In thousands of U.S. Dollar 2011 2010
Bank balances 62,854 31,614
Short term deposits 121,630 236,197
Cash and cash equivalents in the statement of cash flows 184,484 267,811
21. Capital and reservesShare capital and main shareholders
In thousands of U.S. Dollar excluding share numbers 2011 2010Issued and subscribed9,971,216 registered common shares of no par value (2010: 10,000,300) 250,007 250,007
At balance sheet date the main shareholders are:2011 2010
Luxair 43.4% 52.1%Qatar Airways 35.0% -Banque et Caisse d’Epargne de l’Etat (BCEE) 10.9% 13.1%SNCI 10.7% 12.8%BIP Investment Partners - 11.5%Luxembourg State - 8.0%Lux-Avantage - 2.2%Individual Shareholders - 0.3%
As at December 31, 2011 the share capital of the Company is represented by 9,971,216 common shares which were subscribed in 2011 by all the shareholders.
In June 2011, all common shares and class B shares held by the shareholders who are physical persons, being of a total amount of 18,512 common shares and 10,572 class B shares, were converted into 10,538 founder’s shares of a nominal value of US$ 100 each which do not represent the registered capital of the Group.
Subsequently, the 18,512 common shares and 10,572 class B shares were cancelled, doing so without modifying the subscribed share capital so that the subscribed share capital was then fixed at US$ 250,007,500 represented by 5,981,788 common shares and 3,989,428 class B shares, without designation of any nominal value, which are fully paid in.
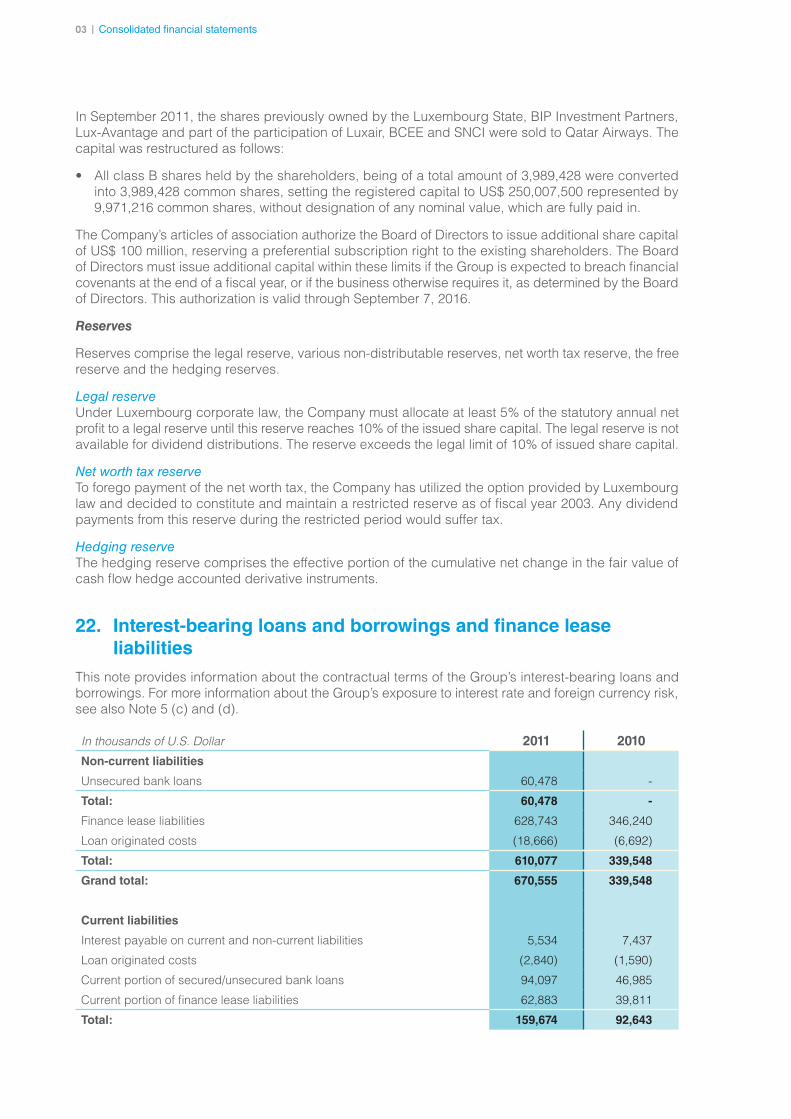
7203 | Consolidated financial statements
In September 2011, the shares previously owned by the Luxembourg State, BIP Investment Partners, Lux-Avantage and part of the participation of Luxair, BCEE and SNCI were sold to Qatar Airways. The capital was restructured as follows:
• All class B shares held by the shareholders, being of a total amount of 3,989,428 were converted into 3,989,428 common shares, setting the registered capital to US$ 250,007,500 represented by 9,971,216 common shares, without designation of any nominal value, which are fully paid in.
The Company’s articles of association authorize the Board of Directors to issue additional share capital of US$ 100 million, reserving a preferential subscription right to the existing shareholders. The Board of Directors must issue additional capital within these limits if the Group is expected to breach financial covenants at the end of a fiscal year, or if the business otherwise requires it, as determined by the Board of Directors. This authorization is valid through September 7, 2016.
Reserves
Reserves comprise the legal reserve, various non-distributable reserves, net worth tax reserve, the free reserve and the hedging reserves.
Legal reserveUnder Luxembourg corporate law, the Company must allocate at least 5% of the statutory annual net profit to a legal reserve until this reserve reaches 10% of the issued share capital. The legal reserve is not available for dividend distributions. The reserve exceeds the legal limit of 10% of issued share capital.
Net worth tax reserve To forego payment of the net worth tax, the Company has utilized the option provided by Luxembourg law and decided to constitute and maintain a restricted reserve as of fiscal year 2003. Any dividend payments from this reserve during the restricted period would suffer tax.
Hedging reserveThe hedging reserve comprises the effective portion of the cumulative net change in the fair value of cash flow hedge accounted derivative instruments.
22. Interest-bearing loans and borrowings and finance lease liabilities
This note provides information about the contractual terms of the Group’s interest-bearing loans and borrowings. For more information about the Group’s exposure to interest rate and foreign currency risk, see also Note 5 (c) and (d).
In thousands of U.S. Dollar 2011 2010
Non-current liabilities
Unsecured bank loans 60,478 -
Total: 60,478 -
Finance lease liabilities 628,743 346,240
Loan originated costs (18,666) (6,692)
Total: 610,077 339,548
Grand total: 670,555 339,548
Current liabilities
Interest payable on current and non-current liabilities 5,534 7,437
Loan originated costs (2,840) (1,590)
Current portion of secured/unsecured bank loans 94,097 46,985
Current portion of finance lease liabilities 62,883 39,811
Total: 159,674 92,643
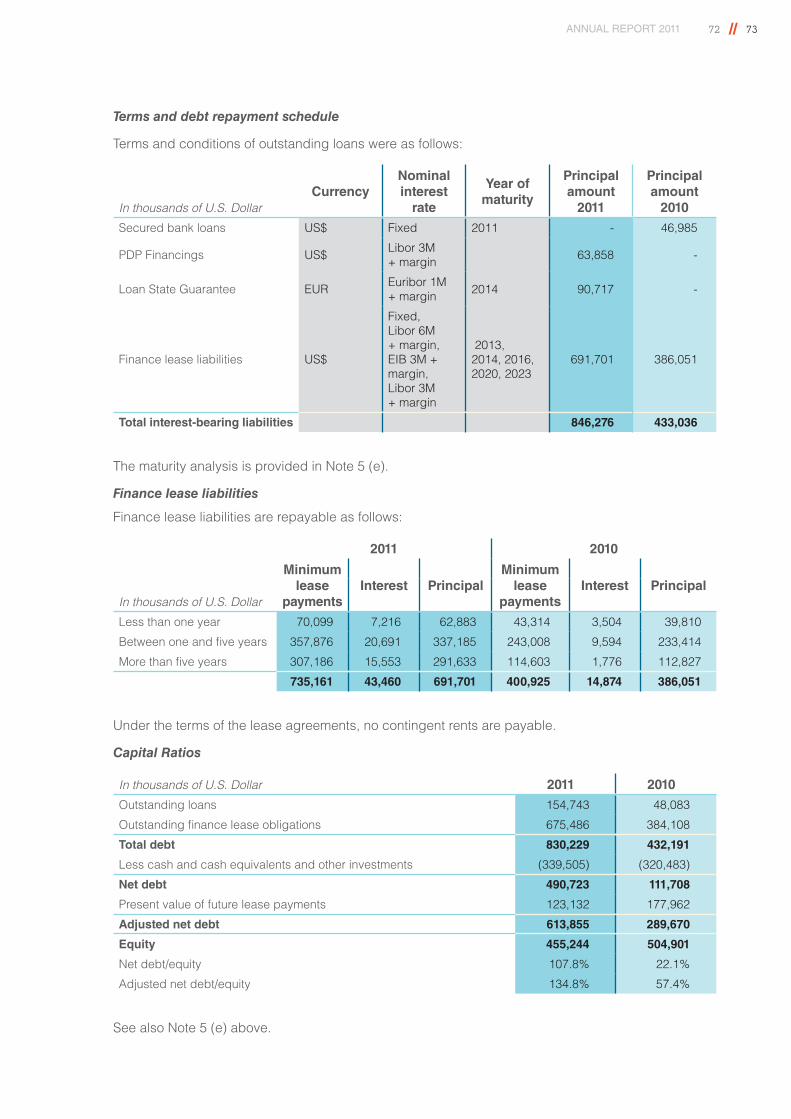
ANNUAL REPORT 2011 72 // 73
Terms and debt repayment schedule
Terms and conditions of outstanding loans were as follows:
In thousands of U.S. DollarCurrency
Nominal interest
rate
Year of maturity
Principal amount
2011
Principal amount
2010
Secured bank loans US$ Fixed 2011 - 46,985
PDP Financings US$ Libor 3M + margin 63,858 -
Loan State Guarantee EUR Euribor 1M + margin 2014 90,717 -
Finance lease liabilities US$
Fixed, Libor 6M + margin, EIB 3M + margin, Libor 3M + margin
2013, 2014, 2016, 2020, 2023
691,701 386,051
Total interest-bearing liabilities 846,276 433,036
The maturity analysis is provided in Note 5 (e).
Finance lease liabilities
Finance lease liabilities are repayable as follows:
2011 2010
Minimum lease
paymentsInterest Principal
Minimum lease
paymentsInterest Principal
In thousands of U.S. Dollar
Less than one year 70,099 7,216 62,883 43,314 3,504 39,810
Between one and five years 357,876 20,691 337,185 243,008 9,594 233,414
More than five years 307,186 15,553 291,633 114,603 1,776 112,827
735,161 43,460 691,701 400,925 14,874 386,051
Under the terms of the lease agreements, no contingent rents are payable.
Capital Ratios
In thousands of U.S. Dollar 2011 2010
Outstanding loans 154,743 48,083
Outstanding finance lease obligations 675,486 384,108
Total debt 830,229 432,191
Less cash and cash equivalents and other investments (339,505) (320,483)
Net debt 490,723 111,708
Present value of future lease payments 123,132 177,962
Adjusted net debt 613,855 289,670
Equity 455,244 504,901
Net debt/equity 107.8% 22.1%
Adjusted net debt/equity 134.8% 57.4%
See also Note 5 (e) above.
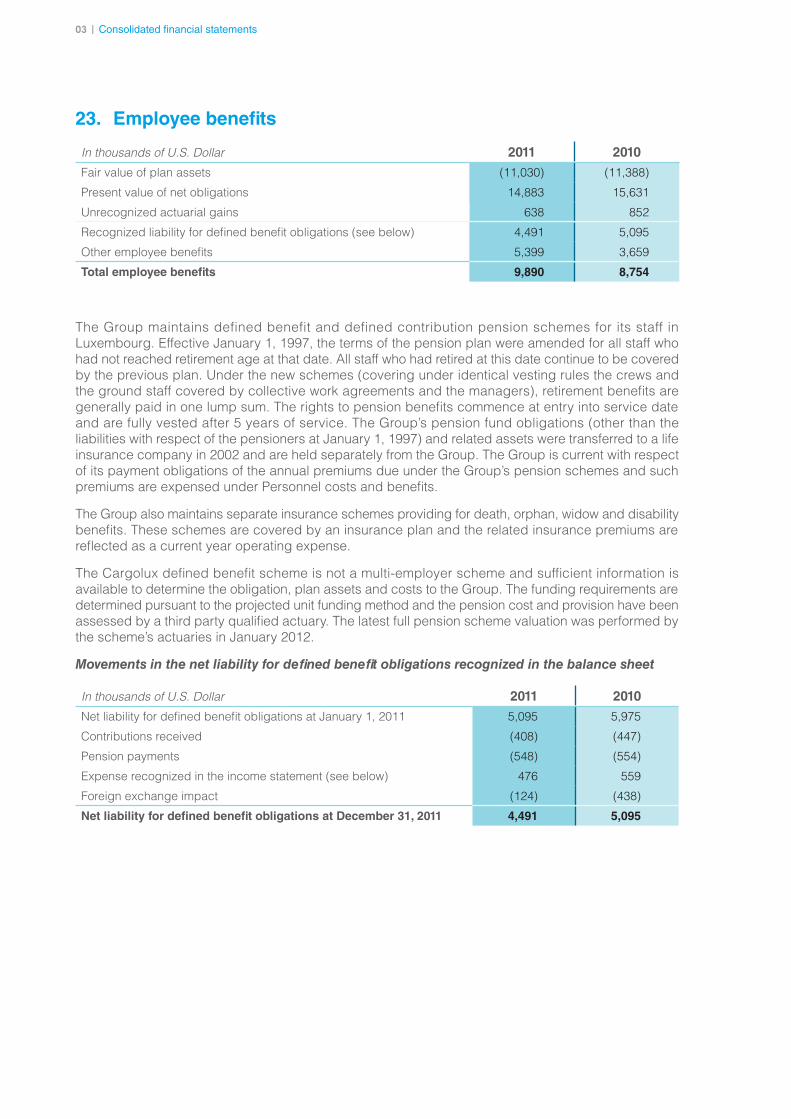
7403 | Consolidated financial statements
23. Employee benefits
In thousands of U.S. Dollar 2011 2010
Fair value of plan assets (11,030) (11,388)
Present value of net obligations 14,883 15,631
Unrecognized actuarial gains 638 852
Recognized liability for defined benefit obligations (see below) 4,491 5,095
Other employee benefits 5,399 3,659
Total employee benefits 9,890 8,754
The Group maintains defined benefit and defined contribution pension schemes for its staff in Luxembourg. Effective January 1, 1997, the terms of the pension plan were amended for all staff who had not reached retirement age at that date. All staff who had retired at this date continue to be covered by the previous plan. Under the new schemes (covering under identical vesting rules the crews and the ground staff covered by collective work agreements and the managers), retirement benefits are generally paid in one lump sum. The rights to pension benefits commence at entry into service date and are fully vested after 5 years of service. The Group’s pension fund obligations (other than the liabilities with respect of the pensioners at January 1, 1997) and related assets were transferred to a life insurance company in 2002 and are held separately from the Group. The Group is current with respect of its payment obligations of the annual premiums due under the Group’s pension schemes and such premiums are expensed under Personnel costs and benefits.
The Group also maintains separate insurance schemes providing for death, orphan, widow and disability benefits. These schemes are covered by an insurance plan and the related insurance premiums are reflected as a current year operating expense.
The Cargolux defined benefit scheme is not a multi-employer scheme and sufficient information is available to determine the obligation, plan assets and costs to the Group. The funding requirements are determined pursuant to the projected unit funding method and the pension cost and provision have been assessed by a third party qualified actuary. The latest full pension scheme valuation was performed by the scheme’s actuaries in January 2012.
Movements in the net liability for defined benefit obligations recognized in the balance sheet
In thousands of U.S. Dollar 2011 2010
Net liability for defined benefit obligations at January 1, 2011 5,095 5,975
Contributions received (408) (447)
Pension payments (548) (554)
Expense recognized in the income statement (see below) 476 559
Foreign exchange impact (124) (438)
Net liability for defined benefit obligations at December 31, 2011 4,491 5,095
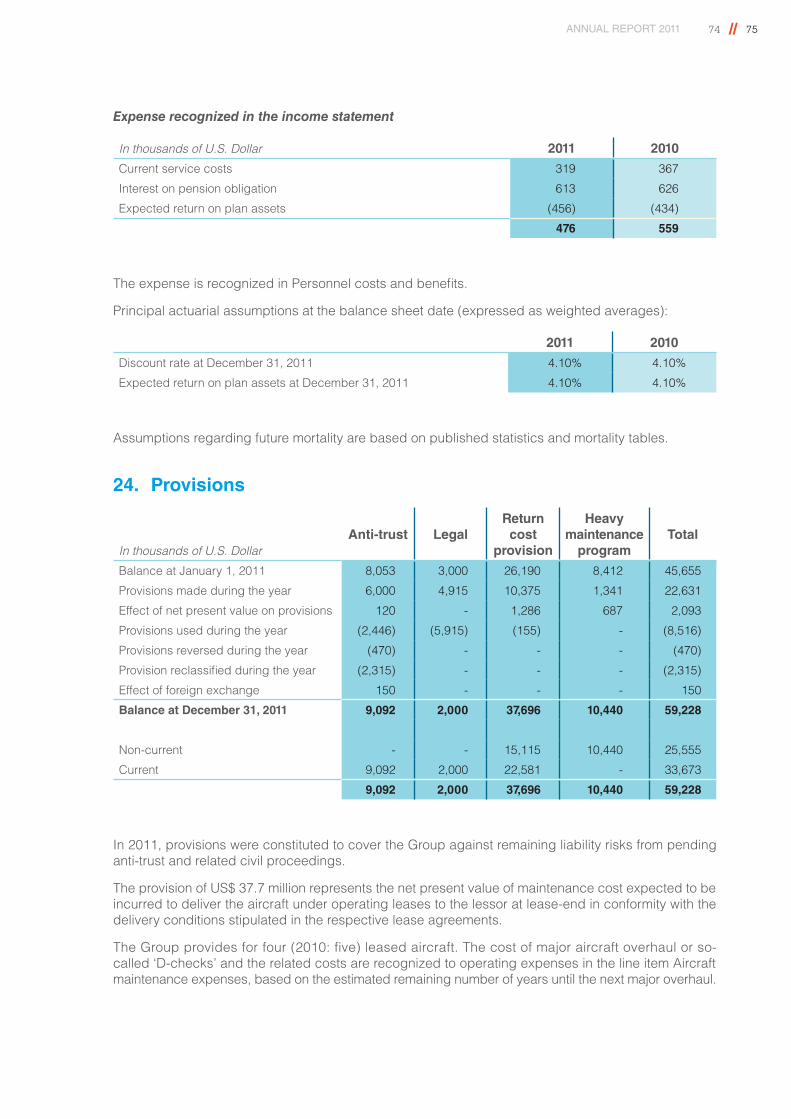
ANNUAL REPORT 2011 74 // 75
Expense recognized in the income statement
In thousands of U.S. Dollar 2011 2010
Current service costs 319 367
Interest on pension obligation 613 626
Expected return on plan assets (456) (434)
476 559
The expense is recognized in Personnel costs and benefits.
Principal actuarial assumptions at the balance sheet date (expressed as weighted averages):
2011 2010
Discount rate at December 31, 2011 4.10% 4.10%
Expected return on plan assets at December 31, 2011 4.10% 4.10%
Assumptions regarding future mortality are based on published statistics and mortality tables.
24. Provisions
In thousands of U.S. DollarAnti-trust Legal
Return cost
provision
Heavy maintenance
programTotal
Balance at January 1, 2011 8,053 3,000 26,190 8,412 45,655
Provisions made during the year 6,000 4,915 10,375 1,341 22,631
Effect of net present value on provisions 120 - 1,286 687 2,093
Provisions used during the year (2,446) (5,915) (155) - (8,516)
Provisions reversed during the year (470) - - - (470)
Provision reclassified during the year (2,315) - - - (2,315)
Effect of foreign exchange 150 - - - 150
Balance at December 31, 2011 9,092 2,000 37,696 10,440 59,228
Non-current - - 15,115 10,440 25,555
Current 9,092 2,000 22,581 - 33,673
9,092 2,000 37,696 10,440 59,228
In 2011, provisions were constituted to cover the Group against remaining liability risks from pending anti-trust and related civil proceedings.
The provision of US$ 37.7 million represents the net present value of maintenance cost expected to be incurred to deliver the aircraft under operating leases to the lessor at lease-end in conformity with the delivery conditions stipulated in the respective lease agreements.
The Group provides for four (2010: five) leased aircraft. The cost of major aircraft overhaul or so-called ‘D-checks’ and the related costs are recognized to operating expenses in the line item Aircraft maintenance expenses, based on the estimated remaining number of years until the next major overhaul.
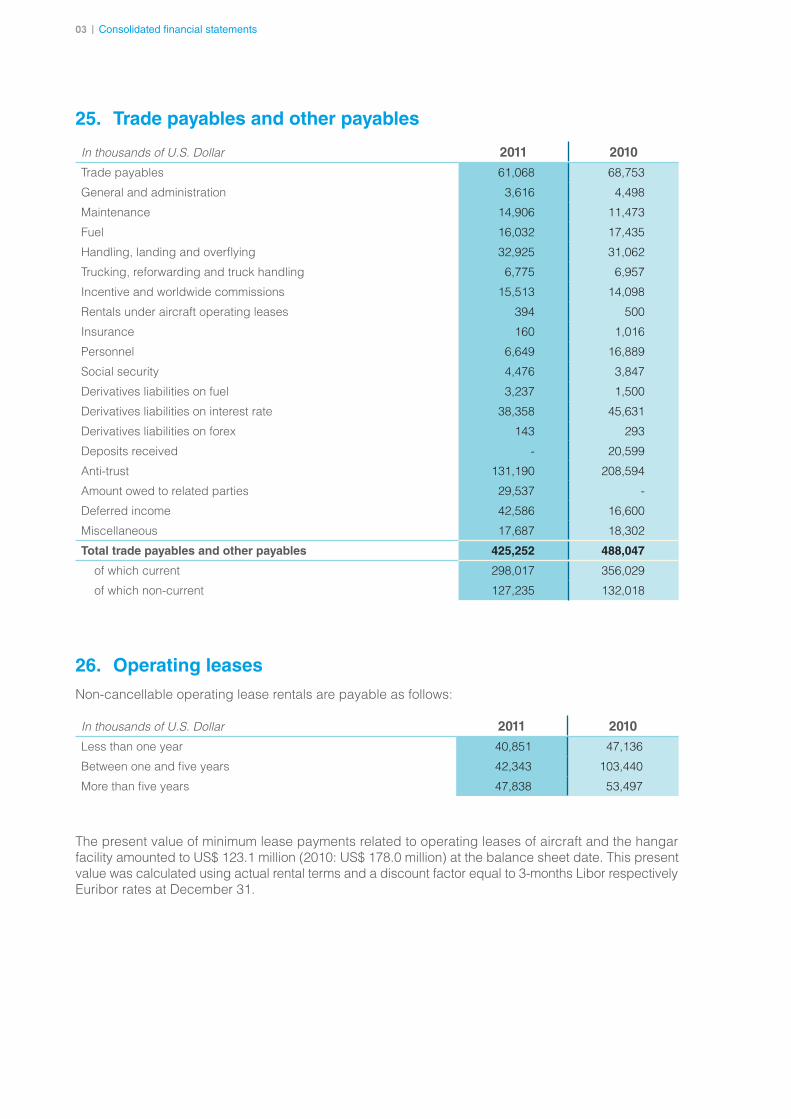
7603 | Consolidated financial statements
25. Trade payables and other payables
In thousands of U.S. Dollar 2011 2010
Trade payables 61,068 68,753
General and administration 3,616 4,498
Maintenance 14,906 11,473
Fuel 16,032 17,435
Handling, landing and overflying 32,925 31,062
Trucking, reforwarding and truck handling 6,775 6,957
Incentive and worldwide commissions 15,513 14,098
Rentals under aircraft operating leases 394 500
Insurance 160 1,016
Personnel 6,649 16,889
Social security 4,476 3,847
Derivatives liabilities on fuel 3,237 1,500
Derivatives liabilities on interest rate 38,358 45,631
Derivatives liabilities on forex 143 293
Deposits received - 20,599
Anti-trust 131,190 208,594
Amount owed to related parties 29,537 -
Deferred income 42,586 16,600
Miscellaneous 17,687 18,302
Total trade payables and other payables 425,252 488,047
of which current 298,017 356,029
of which non-current 127,235 132,018
26. Operating leasesNon-cancellable operating lease rentals are payable as follows:
In thousands of U.S. Dollar 2011 2010
Less than one year 40,851 47,136
Between one and five years 42,343 103,440
More than five years 47,838 53,497
The present value of minimum lease payments related to operating leases of aircraft and the hangar facility amounted to US$ 123.1 million (2010: US$ 178.0 million) at the balance sheet date. This present value was calculated using actual rental terms and a discount factor equal to 3-months Libor respectively Euribor rates at December 31.
ANNUAL REPORT 2011 76 // 77
27. Capital commitments In 2011 Boeing announced a further delay in its B747-8F program with the first two aircraft deliveries having occurred now only in October 2011. Between December 2009 and October 2011, the Group and Boeing signed delivery delay settlement agreements taking into account the new delivery dates. As at the balance sheet date, the Group had firm purchase orders for 11 B747-8F aircraft to be delivered from 2012 to 2014. Based on prices published by manufacturers the total amount of the above total investment in 13 B747-8F is close to US$ 4 billion.
At the balance sheet date, the Group held options to purchase two further B747-8F aircraft with delivery slots in 2014 and 2015.
The Group constantly reviews its investment program to align it to the extent possible with the market environment.
In connection with aircraft purchases, the Group routinely makes down payments to manufacturers. Such advance payments are recorded under Other property, plant and equipment or Deposits with third parties depending on whether or not the Group keeps the risks and rewards of the aircraft.
28. ContingenciesLegal proceedings
The Group is party to legal proceedings, both as defendant and claimant, from time to time in the normal course of its business. In addition, the Group was or is subject to investigations and proceedings from anti-trust authorities in the US, EU, Canada, New Zealand, South Africa, South Korea and Switzerland in connection with a worldwide investigation of air cargo carriers regarding alleged violations of anti-trust laws. The Group continues to fully cooperate with all relevant authorities. In 2011, the Group reached a settlement agreement with the New Zealand Commerce Commission and agreed to pay a fine of NZ$ 6 million. This settlement agreement was approved by the High Court of New Zealand on April 5. The Group also made an application to the EU General Court for annulment of the EU Commission’s 2010 decision that imposed a fine of EUR 79.9 million against the Group. In previous years, the Group had reached settlements with and/or accepted penalties imposed by the competition authorities in the US, Canada and South Korea.
In the wake of the anti-trust proceedings, civil lawsuits have been launched in the US, in Canada, in United Kingdom, in the Netherlands and in Australia against a number of air carriers, including against the Group. A settlement agreement concluded with US civil plaintiffs in 2010 against payment of US$ 35.1 million obtained final approval by the competent US Court in June 2011. As foreseen by US procedure, some members of the case of plaintiffs ‘opted out’ of the settlement and may individually pursue their alleged claims against the Group. In 2011, the Group also entered into a settlement agreement with civil plaintiffs in Canada against payment of CAD 1.8 million. This agreement obtained final approval by the Courts of British Columbia, Ontario and Quebec in October 2011. The civil lawsuit in United Kingdom has been stayed pending the decision on the application to annul the mentioned EU Commission, and the same is expected regarding the civil lawsuit in the Netherlands.
In prior periods the Group had constituted provisions to cover the Group’s exposure with respect of the anti-trust proceedings initiated by the anti-trust authorities mentioned above against the Group (see also Notes 12 and 24 above). Considering the risks stemming from the pending administrative and civil proceedings, the provisions have been increased to US$ 9.1 million.
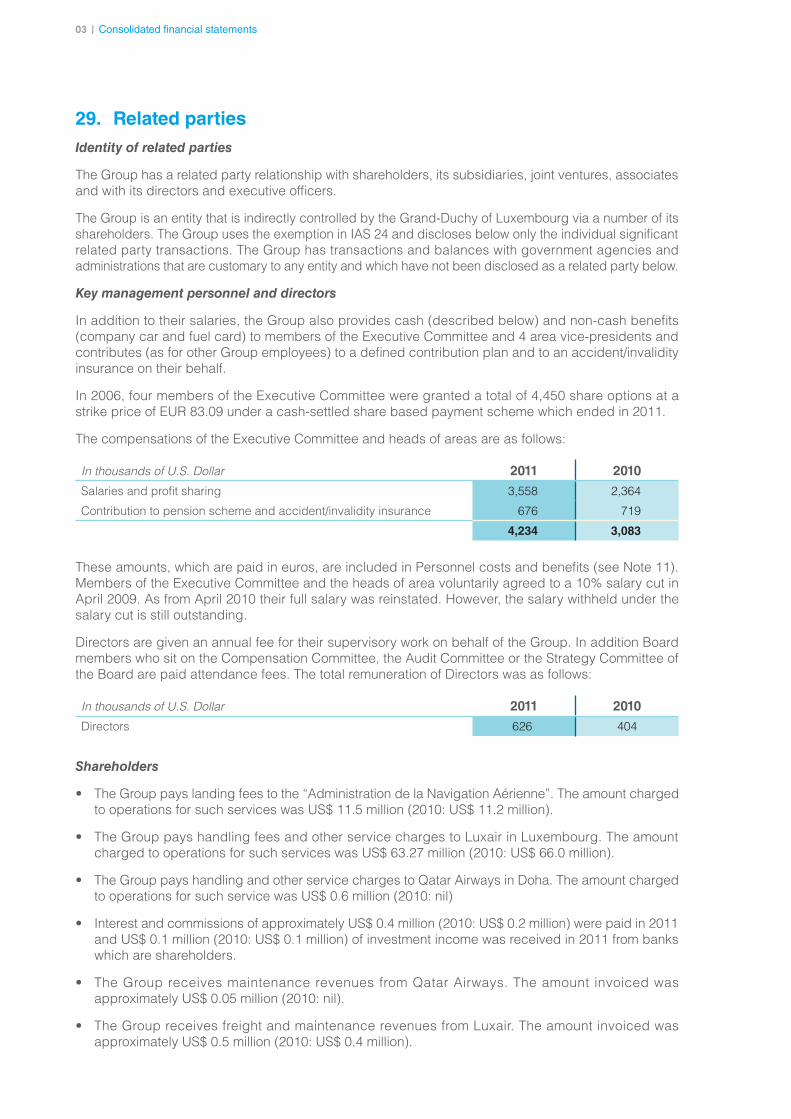
7803 | Consolidated financial statements
29. Related parties Identity of related parties
The Group has a related party relationship with shareholders, its subsidiaries, joint ventures, associates and with its directors and executive officers.
The Group is an entity that is indirectly controlled by the Grand-Duchy of Luxembourg via a number of its shareholders. The Group uses the exemption in IAS 24 and discloses below only the individual significant related party transactions. The Group has transactions and balances with government agencies and administrations that are customary to any entity and which have not been disclosed as a related party below.
Key management personnel and directors
In addition to their salaries, the Group also provides cash (described below) and non-cash benefits (company car and fuel card) to members of the Executive Committee and 4 area vice-presidents and contributes (as for other Group employees) to a defined contribution plan and to an accident/invalidity insurance on their behalf.
In 2006, four members of the Executive Committee were granted a total of 4,450 share options at a strike price of EUR 83.09 under a cash-settled share based payment scheme which ended in 2011.
The compensations of the Executive Committee and heads of areas are as follows:
In thousands of U.S. Dollar 2011 2010
Salaries and profit sharing 3,558 2,364
Contribution to pension scheme and accident/invalidity insurance 676 719
4,234 3,083
These amounts, which are paid in euros, are included in Personnel costs and benefits (see Note 11). Members of the Executive Committee and the heads of area voluntarily agreed to a 10% salary cut in April 2009. As from April 2010 their full salary was reinstated. However, the salary withheld under the salary cut is still outstanding.
Directors are given an annual fee for their supervisory work on behalf of the Group. In addition Board members who sit on the Compensation Committee, the Audit Committee or the Strategy Committee of the Board are paid attendance fees. The total remuneration of Directors was as follows:
In thousands of U.S. Dollar 2011 2010
Directors 626 404
Shareholders
• The Group pays landing fees to the “Administration de la Navigation Aérienne”. The amount charged to operations for such services was US$ 11.5 million (2010: US$ 11.2 million).
• The Group pays handling fees and other service charges to Luxair in Luxembourg. The amount charged to operations for such services was US$ 63.27 million (2010: US$ 66.0 million).
• The Group pays handling and other service charges to Qatar Airways in Doha. The amount charged to operations for such service was US$ 0.6 million (2010: nil)
• Interest and commissions of approximately US$ 0.4 million (2010: US$ 0.2 million) were paid in 2011 and US$ 0.1 million (2010: US$ 0.1 million) of investment income was received in 2011 from banks which are shareholders.
• The Group receives maintenance revenues from Qatar Airways. The amount invoiced was approximately US$ 0.05 million (2010: nil).
• The Group receives freight and maintenance revenues from Luxair. The amount invoiced was approximately US$ 0.5 million (2010: US$ 0.4 million).
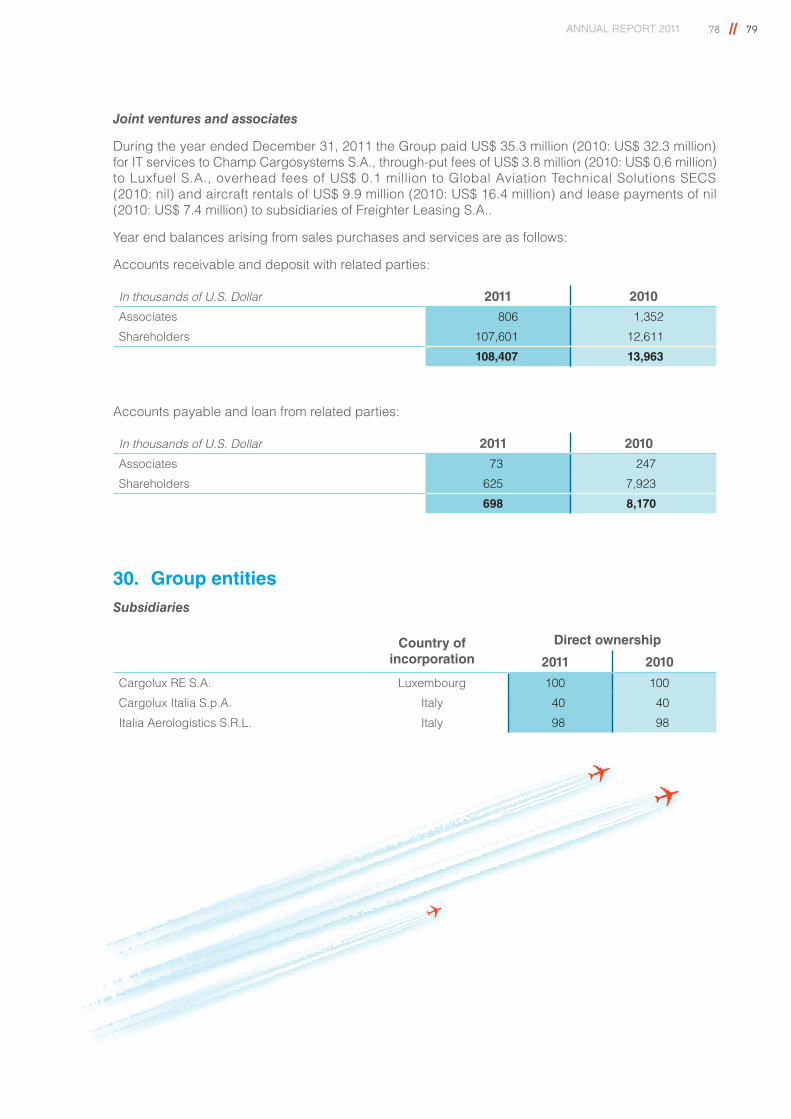
ANNUAL REPORT 2011 78 // 79
Joint ventures and associates
During the year ended December 31, 2011 the Group paid US$ 35.3 million (2010: US$ 32.3 million) for IT services to Champ Cargosystems S.A., through-put fees of US$ 3.8 million (2010: US$ 0.6 million) to Luxfuel S.A., overhead fees of US$ 0.1 million to Global Aviation Technical Solutions SECS (2010: nil) and aircraft rentals of US$ 9.9 million (2010: US$ 16.4 million) and lease payments of nil (2010: US$ 7.4 million) to subsidiaries of Freighter Leasing S.A..
Year end balances arising from sales purchases and services are as follows:
Accounts receivable and deposit with related parties:
In thousands of U.S. Dollar 2011 2010
Associates 806 1,352
Shareholders 107,601 12,611
108,407 13,963
Accounts payable and loan from related parties:
In thousands of U.S. Dollar 2011 2010
Associates 73 247
Shareholders 625 7,923
698 8,170
30. Group entitiesSubsidiaries
Country of incorporation
Direct ownership
2011 2010
Cargolux RE S.A. Luxembourg 100 100
Cargolux Italia S.p.A. Italy 40 40
Italia Aerologistics S.R.L. Italy 98 98
03 | Consolidated financial statements
31. Accounting estimates and judgments Certain critical accounting judgments in applying the Group’s accounting policies are described below.
Finance and operating leases
The Group entered into a lease arrangement in relation with the hangar it operates in Luxembourg. The lease contains 3 extension options for incremental 5 year lease periods. This option can be exercised for the first time on the 15th anniversary of the lease, i.e. on June 15, 2024.
In determining lease classification the Group evaluated whether substantially all the risks and rewards of ownership were transferred to the Group. Specifically, it was not considered as reasonably certain, at the inception of the lease, that the Group will operate the hangar beyond 15 years.
Based on this judgment, it is concluded that the lease is an operating lease.
Deferred tax asset
The deferred tax asset is based on the most recent business plan available at each balance sheet date.
Heavy maintenance check
The timing of ‘C’ and ‘D-check’ is determined in accordance with the Group’s maintenance program which is based on recommendations of the manufacturer and is approved by the civil aviation authorities (DAC). The amount provisioned is based on prices derived from contractual arrangements concluded with providers and are discounted to the balance sheet date. As of July 2009 the Group performs the major overhaul ‘C-checks’ in-house.
Provision
The recognition of a provision requires that the management is in the position to make a reliable estimate of the amount of the obligation resulting from past events. When no reliable estimate can be made, a contingent liability is disclosed.
Residual values of aircraft
Management estimate of residual values is reassessed yearly on the basis of the current and future estimated market values published by external appraisers and on the basis of observable transactions. Where appropriate this review may lead to revisions to the residual values from the current estimate.
32. Subsequent events No events that are of material importance to an assessment of the earnings, financial and asset position of the Group occurred after the balance sheet date.
80
81
REPORT OF THE REVISEUR D’ENTREPRISES AGREE
KPMG Luxembourg S.à.r.l. 9, allée Scheffer L-2520 Luxembourg
To the Shareholders of Cargolux Airlines International S.A. AéroportdeLuxembourg•L-2990Sandweiler
Report on the consolidated financial statements
We have audited the accompanying consolidated financial statements of Cargolux Airlines International S.A., which comprise the consolidated balance sheet as at December 31, 2011 and the consolidated statements of income, comprehensive income, changes in equity and cash flows for the year then ended, and a summary of significant accounting policies and other explanatory information as set out on pages 38 to 80.
Board of Directors’ responsibility for the consolidated financial statements The Board of Directors is responsible for the preparation and fair presentation of these consolidated financial statements in accordance with International Financial Reporting Standards as adopted by the European Union, and for such internal control as the Board of Directors determines is necessary to enable the preparation of consolidated financial statements that are free from material misstatement, whether due to fraud or error.
Responsibility of the Réviseur d’Entreprises agrééOur responsibility is to express an opinion on these consolidated financial statements based on our audit. We conducted our audit in accordance with International Standards on Auditing as adopted for Luxembourg by the Commission de Surveillance du Secteur Financier. Those standards require that we comply with ethical requirements and plan and perform the audit to obtain reasonable assurance about whether the consolidated financial statements are free from material misstatement.
An audit involves performing procedures to obtain audit evidence about the amounts and disclosures in the consolidated financial statements. The procedures selected depend on the judgement of the Réviseur d’Entreprises agréé, including the assessment of the risks of material misstatement of the consolidated financial statements, whether due to fraud or error. In making those risk assessments, the Réviseur d’Entreprises agréé considers internal control relevant to the entity’s preparation and fair presentation of the consolidated financial statements in order to design audit procedures that are appropriate in the circumstances, but not for the purpose of expressing an opinion on the effectiveness of the entity’s internal control. An audit also includes evaluating the appropriateness of accounting policies used and the reasonableness of accounting estimates made by the Board of Directors, as well as evaluating the overall presentation of the consolidated financial statements.
We believe that the audit evidence we have obtained is sufficient and appropriate to provide a basis for our audit opinion.
OpinionIn our opinion, the consolidated financial statements give a true and fair view of the consolidated financial position of Cargolux Airlines International S.A. as of December 31, 2011, and of its consolidated financial performance and its consolidated cash flows for the year then ended in accordance with International Financial Reporting Standards as adopted by the European Union.
Report on other legal and regulatory requirements
The directors’ report, which is the responsibility of the Board of Directors, is consistent with the consolidated financial statements.
Luxembourg, 19 March 2012 KPMG Luxembourg S.à r.l. Cabinet de révision agréé
Thierry Ravasio
//ANNUAL REPORT 2011 81 80
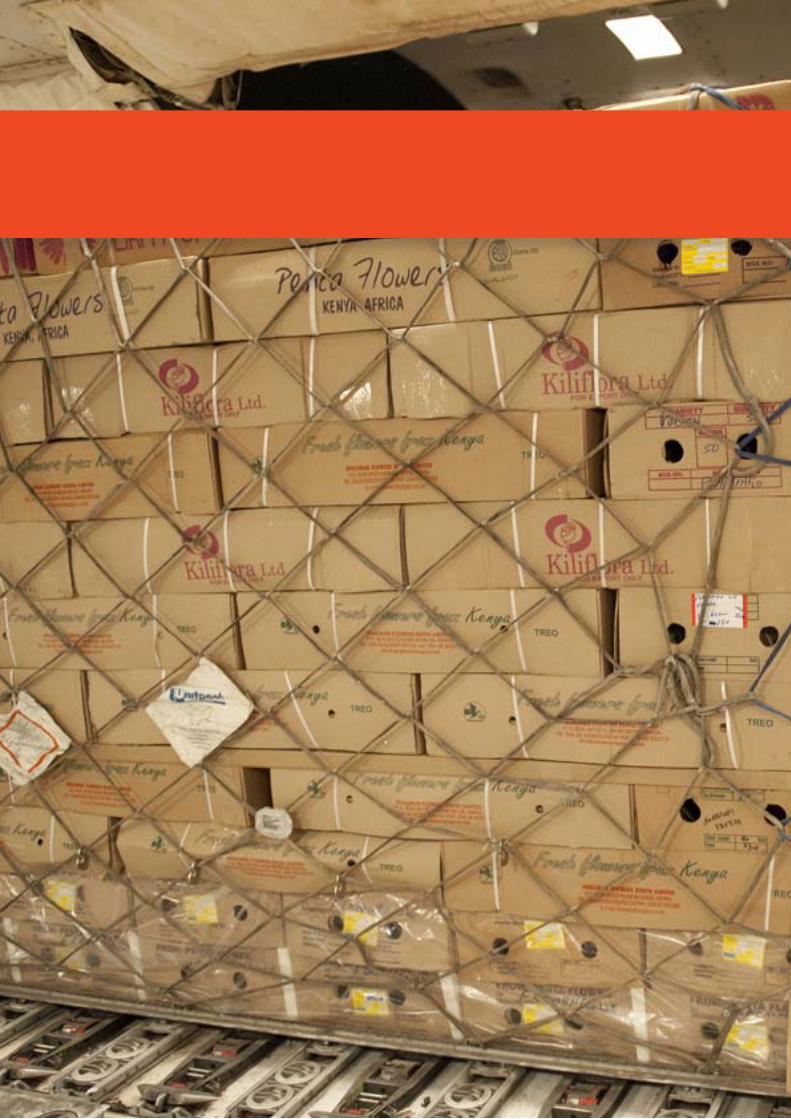
8203 | Consolidated financial statements
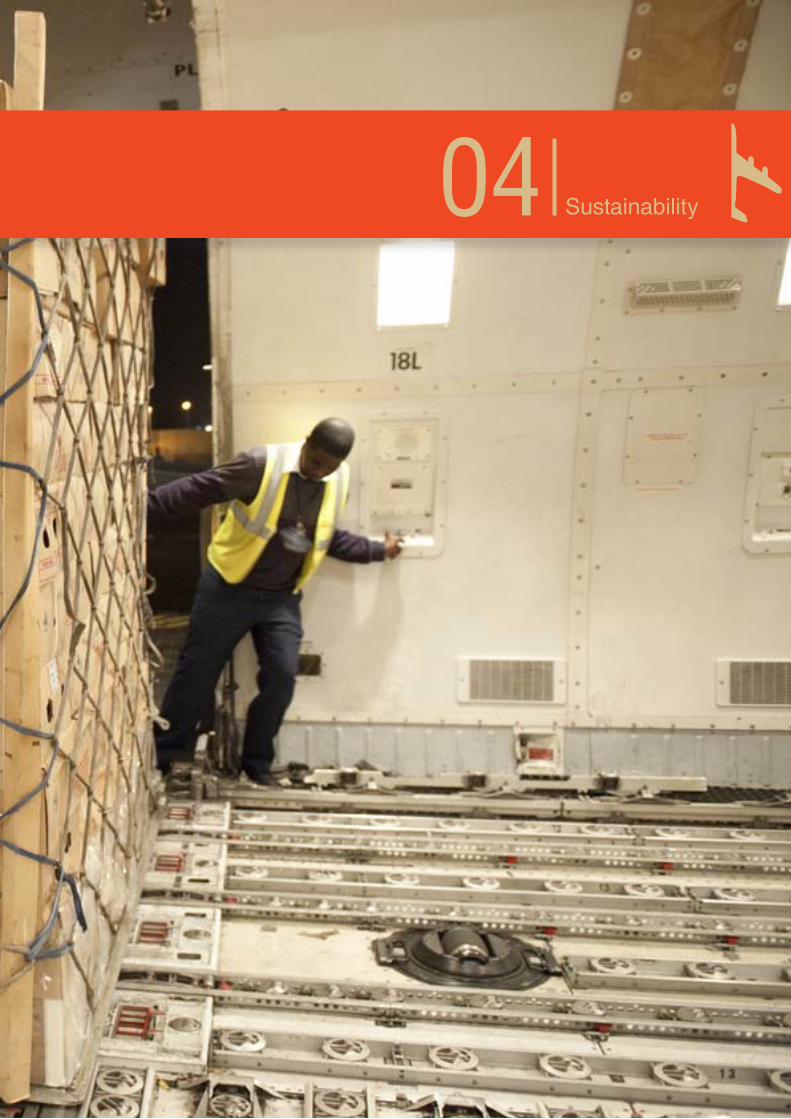
ANNUAL REPORT 2011 82 // 83
Sustainability04
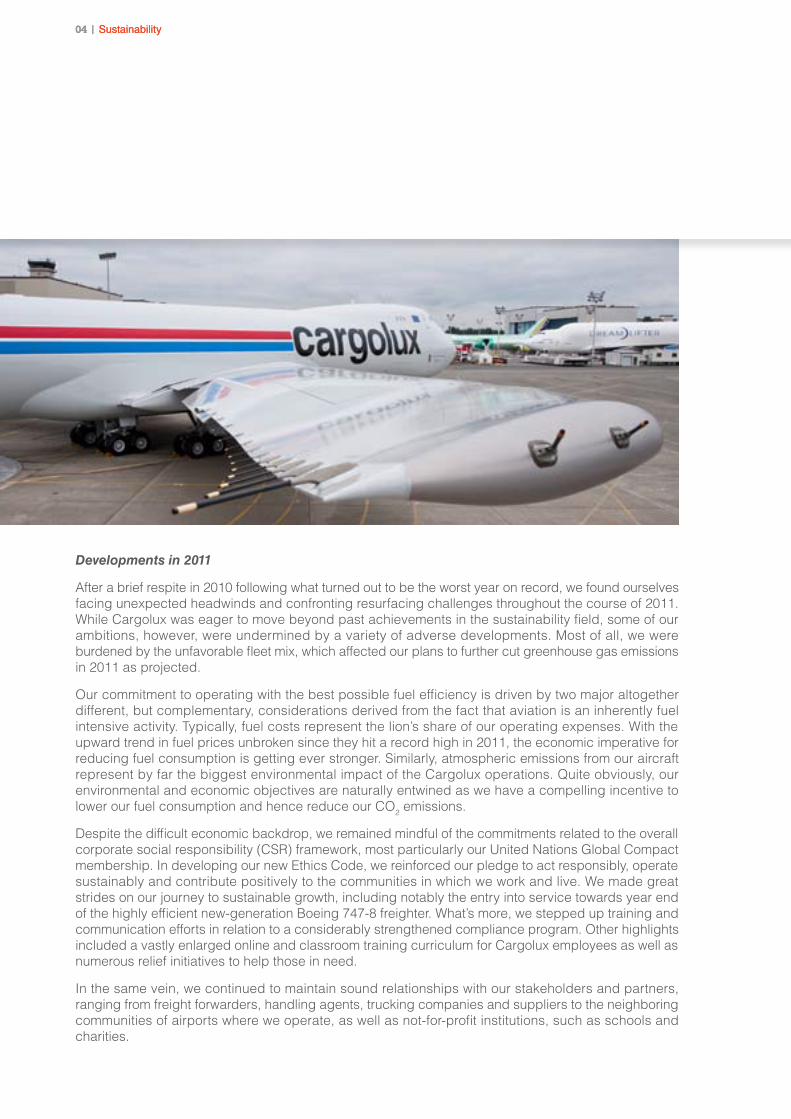
8404 | Sustainability
Developments in 2011
After a brief respite in 2010 following what turned out to be the worst year on record, we found ourselves facing unexpected headwinds and confronting resurfacing challenges throughout the course of 2011. While Cargolux was eager to move beyond past achievements in the sustainability field, some of our ambitions, however, were undermined by a variety of adverse developments. Most of all, we were burdened by the unfavorable fleet mix, which affected our plans to further cut greenhouse gas emissions in 2011 as projected.
Our commitment to operating with the best possible fuel efficiency is driven by two major altogether different, but complementary, considerations derived from the fact that aviation is an inherently fuel intensive activity. Typically, fuel costs represent the lion’s share of our operating expenses. With the upward trend in fuel prices unbroken since they hit a record high in 2011, the economic imperative for reducing fuel consumption is getting ever stronger. Similarly, atmospheric emissions from our aircraft represent by far the biggest environmental impact of the Cargolux operations. Quite obviously, our environmental and economic objectives are naturally entwined as we have a compelling incentive to lower our fuel consumption and hence reduce our CO2 emissions.
Despite the difficult economic backdrop, we remained mindful of the commitments related to the overall corporate social responsibility (CSR) framework, most particularly our United Nations Global Compact membership. In developing our new Ethics Code, we reinforced our pledge to act responsibly, operate sustainably and contribute positively to the communities in which we work and live. We made great strides on our journey to sustainable growth, including notably the entry into service towards year end of the highly efficient new-generation Boeing 747-8 freighter. What’s more, we stepped up training and communication efforts in relation to a considerably strengthened compliance program. Other highlights included a vastly enlarged online and classroom training curriculum for Cargolux employees as well as numerous relief initiatives to help those in need.
In the same vein, we continued to maintain sound relationships with our stakeholders and partners, ranging from freight forwarders, handling agents, trucking companies and suppliers to the neighboring communities of airports where we operate, as well as not-for-profit institutions, such as schools and charities.
04 | Sustainability
ANNUAL REPORT 2011 84 // 85
Environmentalresponsibility
Sustainability and corporate social responsibility (CSR) framework
Our sustainability and CSR activities are guided by the following comprehensive framework of charters, policies, guidelines and standards:
• Corporate Charter for Social Responsibility and sustainable development (member since 2005)
• UN Global Compact (member since 2007)
• Reviewed and extended Cargolux Ethics Code (effective 2011, replaces former code of 2007)
• Global Reporting Initiative (GRI) CSR reporting guidelines (cf. GRI indicators page 103)
• ISO 14001: internationally recognized environmental management standard
• Cargolux Environmental Management System
• Cargolux Environmental Policy
Environmental responsibilityThe activities of airlines undoubtedly affect the environment and play a part in global climate change. Despite a widely held belief, however, aviation produces only about 2% of total manmade CO2 emissions according to the United Nations Intergovernmental Panel on Climate Change (IPPC). All in all, and including other emissions such as e.g. nitrogen and sulfur oxides, it is estimated that aviation accounts for about 3% of total manmade climate impact.
As a full cargo carrier serving an extensive network of destinations the world over, our flight operations activity is by far the most demanding in terms of energy consumption with over 99% of total greenhouse gas emissions produced by Cargolux. We recognize that we have a significant responsibility to tackle the global climate change challenge, which is why the further curbing of carbon dioxide emissions and lessening of our noise footprint remains an overarching objective for Cargolux.
Even though the CO2 impact of our non-flight activities including road feeder services, business travel, commuting, and office heating may seem insignificant in relation to flight operations, our chief activity, we commit to the sustainable management of finite resources as a rule by monitoring and seeking to minimize the consumption of energy and use of water at our Luxembourg headquarters, which complements our extensive waste management program.
1. POLICY AND CONTRACTUAL FRAMEWORK
The Cargolux Environmental Management System (EMS) is aligned with the requirements of ISO 14001, an established international standard that specifies a process for controlling and improving the environmental performance of a company, and defines how we approach the environmental challenges that confront us.
EMS and ISO 14001
We were among the first airlines to demonstrate our commitment to sustainable development and continual improvement with the ISO 14001 certification of our Flight Operations Division and Type Rating Training Organization in 2009, which has successfully passed subsequent annual surveillance audits. Building on that, the Cargolux Maintenance Division continued preparations for ISO 14001 compliance, including the analysis of a large number of processes and training of more than 300 staff, with certification
8604 | Sustainability
set to take place by April 2012. Meanwhile, Ground Operations will begin preparations with the objective of attaining ISO 14001 certification in the course of 2013.
The Cargolux EMS, in conjunction with our Corporate Environmental Policy, provides an environmental performance framework that is fully compliant with the requirements of ISO 14001. Other than helping define long-term objectives and key performance indicators (KPI) designed to reduce our ecological footprint in a steady manner, it allows us to monitor the impact of our operations and processes on the environment. It also offers significant benefits in terms of energy savings, waste reduction, process efficiency improvements, and better use of limited resources.
Environmental targets and objectives are implemented, maintained and documented throughout the organization and include the reduction of fuel consumption and CO2 emissions, lower noise emissions, an improved waste management in offices and workshops, as well as an improvement of environmental awareness through regular training and communication. We have established a variety of programs to achieve the following long-term objectives:
• Reduce fuel consumption per FTK
• Reduce CO2 emissions per FTK
• Reduce noise emissions
• Improve chemical risk management
• Improve waste management
• Improve environmental awareness through training and communication
Apart from the team with direct responsibility for EMS, we have established an Environmental Management Board (EMB) composed of divisional representatives. The EMB coordinates all relevant efforts within Cargolux and meets regularly to review progress on current projects while defining future action plans. A comprehensive communication system that uses various channels makes sure that the same information is available throughout the network. It addresses internal as well as external communication.
Mandatory web-based modules were added to the corporate training curriculum to further embed environmental awareness and practices as part of our regular business operations.
To safeguard its continuing suitability and effectiveness, the EMS is subject to regular reviews by executive and senior management, who analyze the outcome of internal audits, evaluate compliance with legal requirements and assess attained results against environmental KPI.
2. ENERGY AND ATMOSPHERIC EMISSIONS
Cargolux was unable to re-conduct the fuel efficiency gains achieved in 2010; primarily owing to the unfavorable fleet mix caused by repeated delivery delays in the Boeing 747-8 freighter program. We had to bridge capacity gaps caused by fleet exits with costly wet-leased aircraft whose environmental efficiency lagged markedly behind the ecological performance of the considerably more advanced Boeing 747-400 freighter.
According to the Cargolux information management system, our aircraft burned on average 171 grams of fuel while emitting 540 grams of CO2 per tonne of cargo transported over a one-kilometer distance. As a consequence, our carbon dioxide emissions record deteriorated by 4.4% in comparison with 2010, largely due to the fleet mix, which was highly unusual by Cargolux standards. Another unhelpful development consisted in a modest decrease of the load factor, which fell from 73.3% in 2010 to 70.8% last year. With less cargo carried on average per flight, the ratio between total CO2 emissions of the aircraft and total payload is modified at the expense of the freight, hence the poorer performance in fuel efficiency expressed in fuel burn per tonne-kilometer.
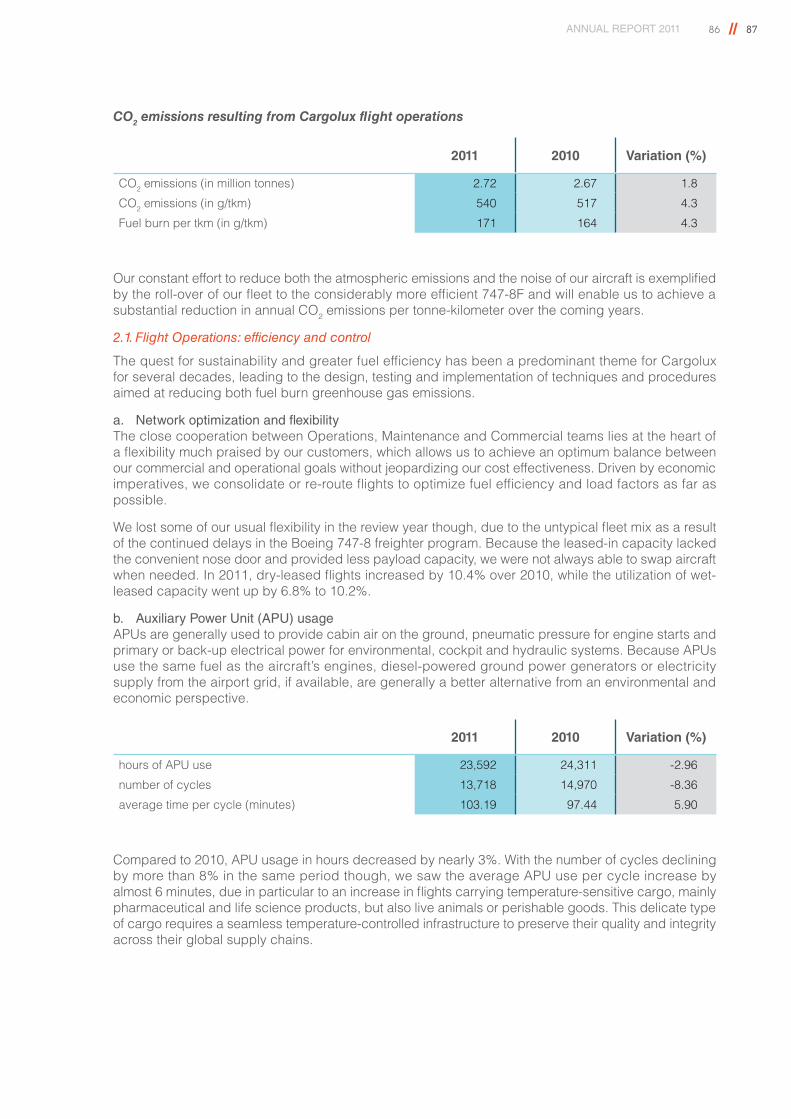
ANNUAL REPORT 2011 86 // 87
CO2 emissions resulting from Cargolux flight operations
2011 2010 Variation (%)
CO2 emissions (in million tonnes) 2.72 2.67 1.8
CO2 emissions (in g/tkm) 540 517 4.3
Fuel burn per tkm (in g/tkm) 171 164 4.3
Our constant effort to reduce both the atmospheric emissions and the noise of our aircraft is exemplified by the roll-over of our fleet to the considerably more efficient 747-8F and will enable us to achieve a substantial reduction in annual CO2 emissions per tonne-kilometer over the coming years.
2.1. Flight Operations: efficiency and control
The quest for sustainability and greater fuel efficiency has been a predominant theme for Cargolux for several decades, leading to the design, testing and implementation of techniques and procedures aimed at reducing both fuel burn greenhouse gas emissions.
a. Network optimization and flexibilityThe close cooperation between Operations, Maintenance and Commercial teams lies at the heart of a flexibility much praised by our customers, which allows us to achieve an optimum balance between our commercial and operational goals without jeopardizing our cost effectiveness. Driven by economic imperatives, we consolidate or re-route flights to optimize fuel efficiency and load factors as far as possible.
We lost some of our usual flexibility in the review year though, due to the untypical fleet mix as a result of the continued delays in the Boeing 747-8 freighter program. Because the leased-in capacity lacked the convenient nose door and provided less payload capacity, we were not always able to swap aircraft when needed. In 2011, dry-leased flights increased by 10.4% over 2010, while the utilization of wet-leased capacity went up by 6.8% to 10.2%.
b. Auxiliary Power Unit (APU) usageAPUs are generally used to provide cabin air on the ground, pneumatic pressure for engine starts and primary or back-up electrical power for environmental, cockpit and hydraulic systems. Because APUs use the same fuel as the aircraft’s engines, diesel-powered ground power generators or electricity supply from the airport grid, if available, are generally a better alternative from an environmental and economic perspective.
2011 2010 Variation (%)
hours of APU use 23,592 24,311 -2.96
number of cycles 13,718 14,970 -8.36
average time per cycle (minutes) 103.19 97.44 5.90
Compared to 2010, APU usage in hours decreased by nearly 3%. With the number of cycles declining by more than 8% in the same period though, we saw the average APU use per cycle increase by almost 6 minutes, due in particular to an increase in flights carrying temperature-sensitive cargo, mainly pharmaceutical and life science products, but also live animals or perishable goods. This delicate type of cargo requires a seamless temperature-controlled infrastructure to preserve their quality and integrity across their global supply chains.
8804 | Sustainability
c. Deep core engine washingEngine core/ compressor wash at regular intervals allows maximizing overall aircraft engine efficiency by removing surface contaminants from inner engine components. The implementation of the engine core wash program on the 747-400F fleet has shown a reduction in fuel burn, CO2 emissions on GE engines and an improvement of engine on-wing time on GE and RR engines.
With the entry into service of the Boeing 747-8 freighter, the world’s most efficient freighter equipped with GEnx-2B engines, Cargolux will be able to take advantage of the enhanced operational and environmental benefits offered by GE’s newly released ClearCoreTM engine wash system. ClearCoreTM is an on-wing engine wash and effluent collection system that allows operators to wash engines at the gate or in the hangar. The used water is captured and filtered for reuse. According to GE estimates, the system is able to reduce fuel efficiency loss by 0.25% to 2%.
The ClearCoreTM engine wash procedure on the Company’s Boeing 747-8 freighters is targeted for implementation in second quarter 2012.
d. Fleet renewalOur hopes for the eagerly awaited efficiency gains were dampened anew as the rollover debut from the 747-400F to the 747-8F, announced by Boeing for mid - 2011, was pushed back once more. After program delays prevented the Boeing 747-8 freighter from joining the Cargolux fleet before September 2011 and a short-lived disagreement between the Company and the manufacturer about the aircraft’s performance, we eventually received the first two of a total thirteen orders in October 2011, more than two years after the original delivery date.
This unfortunate development forced us to offset capacity gaps caused by fleet exits with leased aircraft whose operating and environmental performance lagged considerably behind both types of airliners now operated by Cargolux; partly upsetting our environmental efforts as well as adding to soaring operating costs largely driven by record fuel prices.
Clearly, this latest generation 747 aircraft offers the single most important improvement in fuel efficiency for our operations. The aircraft offers impressive double-digit gains in fuel burn and CO2 emissions compared with the 747-400F, despite falling slightly short on the manufacturer’s commitment on performance. Boeing is working on improving the performance of the Boeing 747-8 freighter to meet catalogue commitments in both fuel burn and CO2 emissions.
Three more Boeing 747-400 freighters have left our fleet during 2011 and were initially replaced with 747-400 BCF aircraft, due to the late arrival of the Boeing 747-8 freighter. Delivery of our third 747-8F, originally planned for 2011, was moved to early 2012 by Boeing and we expect to build up the Boeing 747-8 freighter fleet with additional deliveries in 2012.
e. Alternative fuelsCargolux is one of the founding members of the Sustainable Aviation Fuel Users Group (SAFUG), a cross-industry multi stakeholder initiative focused on accelerating the development, certification and commercial use of environmentally and socially sustainable aviation biofuel, which is one of the most effective solutions to reducing carbon emissions, with total life cycle greenhouse gas emissions significantly lower than those from fossil fuels.
To satisfy the requirements set by SAFUG, aviation biofuel must come from renewable resources, have a positive socio-economic impact and meet or exceed internationally recognized jet fuel specifications. Any solutions that would require changes to aircraft engine fuel systems, storage facilities or distribution methods would not be viable for an industry burdened with high structural and other costs. What’s more, aviation biofuel must neither compete with agricultural food production nor pose a threat to fragile eco-systems.
While many regulatory and organizational challenges remain to be overcome before the targeted economies of scale will allow sustainable biofuel to become available in sufficient quantities at an acceptable cost, remarkable progress has already been achieved by the industry who has successfully addressed the technical issues.
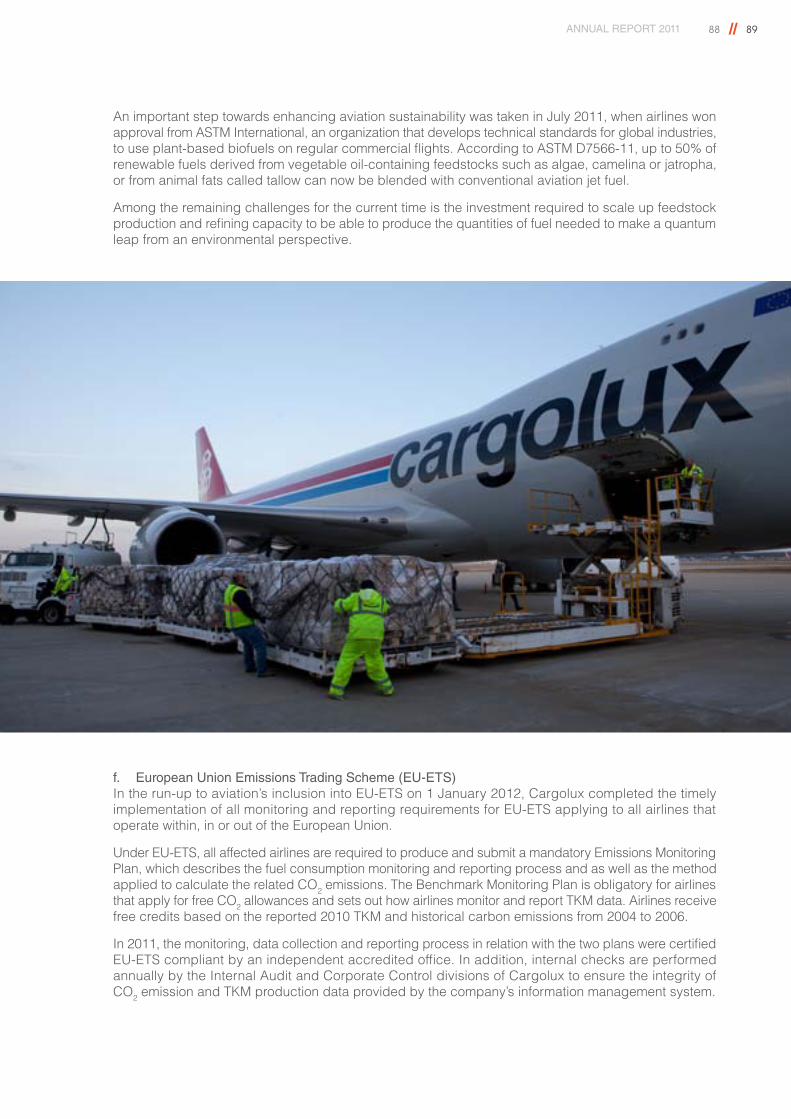
ANNUAL REPORT 2011 88 // 89
An important step towards enhancing aviation sustainability was taken in July 2011, when airlines won approval from ASTM International, an organization that develops technical standards for global industries, to use plant-based biofuels on regular commercial flights. According to ASTM D7566-11, up to 50% of renewable fuels derived from vegetable oil-containing feedstocks such as algae, camelina or jatropha, or from animal fats called tallow can now be blended with conventional aviation jet fuel.
Among the remaining challenges for the current time is the investment required to scale up feedstock production and refining capacity to be able to produce the quantities of fuel needed to make a quantum leap from an environmental perspective.
f. European Union Emissions Trading Scheme (EU-ETS)In the run-up to aviation’s inclusion into EU-ETS on 1 January 2012, Cargolux completed the timely implementation of all monitoring and reporting requirements for EU-ETS applying to all airlines that operate within, in or out of the European Union.
Under EU-ETS, all affected airlines are required to produce and submit a mandatory Emissions Monitoring Plan, which describes the fuel consumption monitoring and reporting process and as well as the method applied to calculate the related CO2 emissions. The Benchmark Monitoring Plan is obligatory for airlines that apply for free CO2 allowances and sets out how airlines monitor and report TKM data. Airlines receive free credits based on the reported 2010 TKM and historical carbon emissions from 2004 to 2006.
In 2011, the monitoring, data collection and reporting process in relation with the two plans were certified EU-ETS compliant by an independent accredited office. In addition, internal checks are performed annually by the Internal Audit and Corporate Control divisions of Cargolux to ensure the integrity of CO2 emission and TKM production data provided by the company’s information management system.
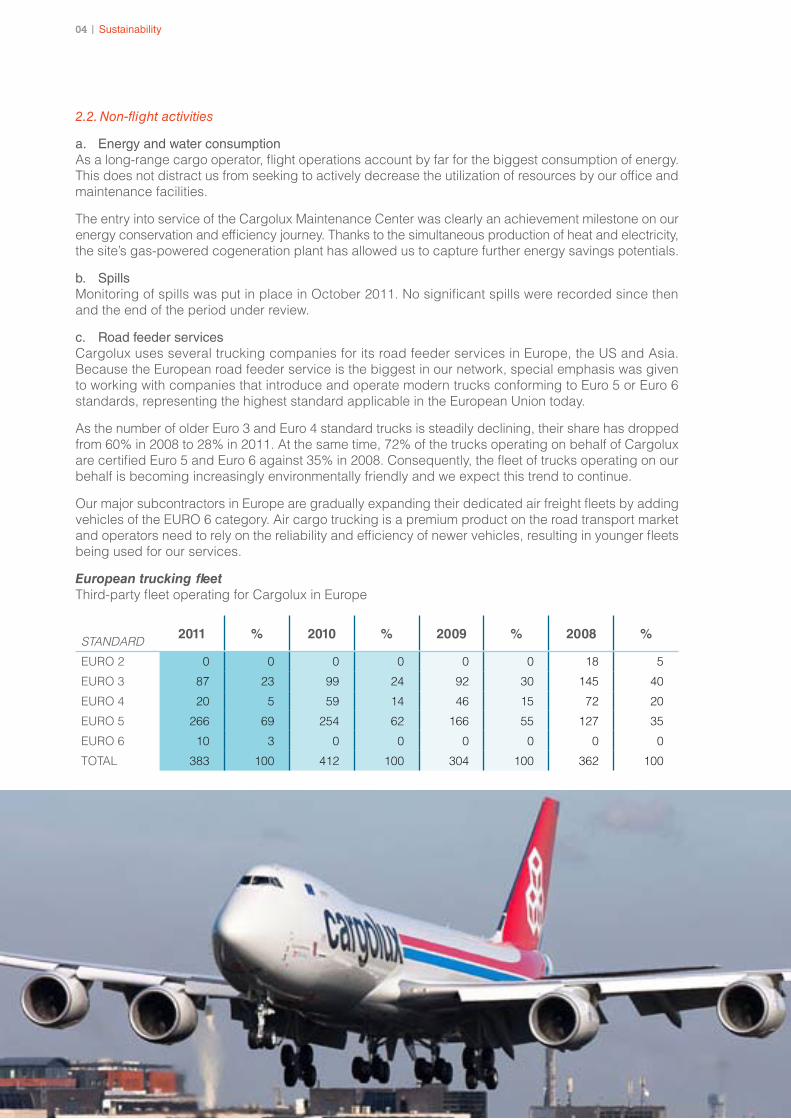
9004 | Sustainability
2.2. Non-flight activities
a. Energy and water consumptionAs a long-range cargo operator, flight operations account by far for the biggest consumption of energy. This does not distract us from seeking to actively decrease the utilization of resources by our office and maintenance facilities.
The entry into service of the Cargolux Maintenance Center was clearly an achievement milestone on our energy conservation and efficiency journey. Thanks to the simultaneous production of heat and electricity, the site’s gas-powered cogeneration plant has allowed us to capture further energy savings potentials.
b. SpillsMonitoring of spills was put in place in October 2011. No significant spills were recorded since then and the end of the period under review.
c. Road feeder servicesCargolux uses several trucking companies for its road feeder services in Europe, the US and Asia. Because the European road feeder service is the biggest in our network, special emphasis was given to working with companies that introduce and operate modern trucks conforming to Euro 5 or Euro 6 standards, representing the highest standard applicable in the European Union today.
As the number of older Euro 3 and Euro 4 standard trucks is steadily declining, their share has dropped from 60% in 2008 to 28% in 2011. At the same time, 72% of the trucks operating on behalf of Cargolux are certified Euro 5 and Euro 6 against 35% in 2008. Consequently, the fleet of trucks operating on our behalf is becoming increasingly environmentally friendly and we expect this trend to continue.
Our major subcontractors in Europe are gradually expanding their dedicated air freight fleets by adding vehicles of the EURO 6 category. Air cargo trucking is a premium product on the road transport market and operators need to rely on the reliability and efficiency of newer vehicles, resulting in younger fleets being used for our services.
European trucking fleetThird-party fleet operating for Cargolux in Europe
STANDARD 2011 % 2010 % 2009 % 2008 %
EURO 2 0 0 0 0 0 0 18 5
EURO 3 87 23 99 24 92 30 145 40
EURO 4 20 5 59 14 46 15 72 20
EURO 5 266 69 254 62 166 55 127 35
EURO 6 10 3 0 0 0 0 0 0
TOTAL 383 100 412 100 304 100 362 100
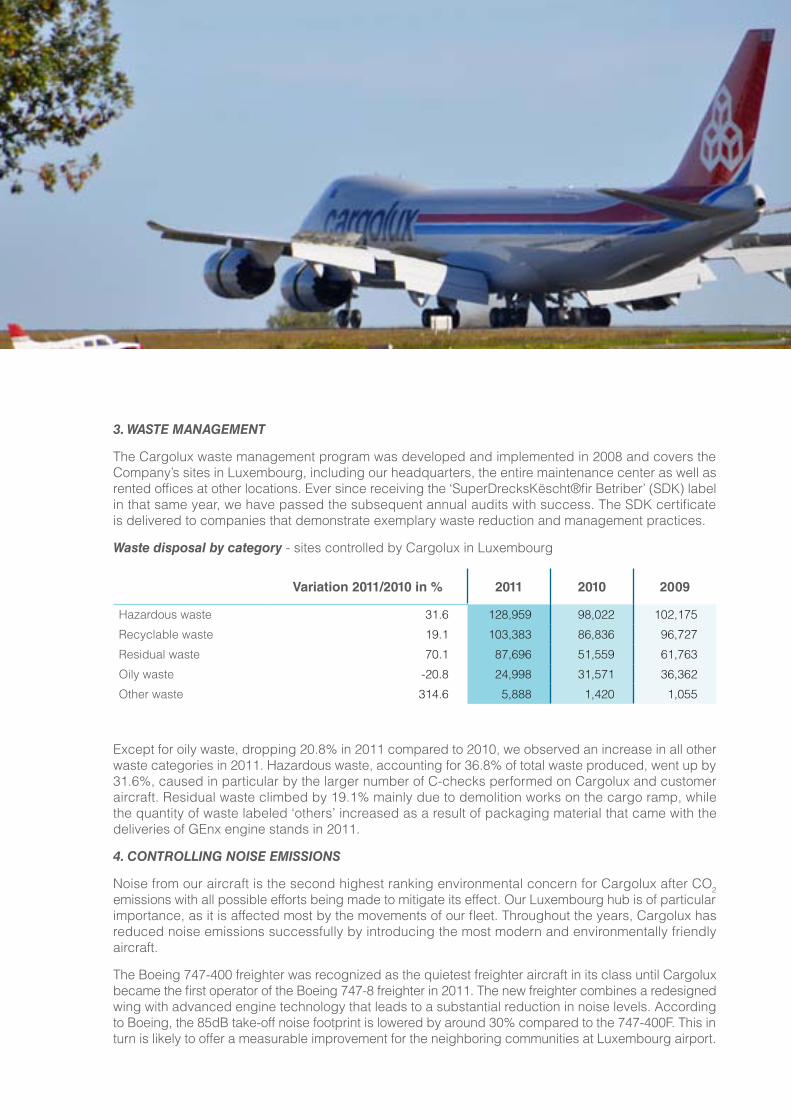
ANNUAL REPORT 2011 90 // 91
3. WASTE MANAGEMENT
The Cargolux waste management program was developed and implemented in 2008 and covers the Company’s sites in Luxembourg, including our headquarters, the entire maintenance center as well as rented offices at other locations. Ever since receiving the ‘SuperDrecksKëscht®fir Betriber’ (SDK) label in that same year, we have passed the subsequent annual audits with success. The SDK certificate is delivered to companies that demonstrate exemplary waste reduction and management practices.
Waste disposal by category - sites controlled by Cargolux in Luxembourg
Variation 2011/2010 in % 2011 2010 2009
Hazardous waste 31.6 128,959 98,022 102,175
Recyclable waste 19.1 103,383 86,836 96,727
Residual waste 70.1 87,696 51,559 61,763
Oily waste -20.8 24,998 31,571 36,362
Other waste 314.6 5,888 1,420 1,055
Except for oily waste, dropping 20.8% in 2011 compared to 2010, we observed an increase in all other waste categories in 2011. Hazardous waste, accounting for 36.8% of total waste produced, went up by 31.6%, caused in particular by the larger number of C-checks performed on Cargolux and customer aircraft. Residual waste climbed by 19.1% mainly due to demolition works on the cargo ramp, while the quantity of waste labeled ‘others’ increased as a result of packaging material that came with the deliveries of GEnx engine stands in 2011.
4. CONTROLLING NOISE EMISSIONS
Noise from our aircraft is the second highest ranking environmental concern for Cargolux after CO2 emissions with all possible efforts being made to mitigate its effect. Our Luxembourg hub is of particular importance, as it is affected most by the movements of our fleet. Throughout the years, Cargolux has reduced noise emissions successfully by introducing the most modern and environmentally friendly aircraft.
The Boeing 747-400 freighter was recognized as the quietest freighter aircraft in its class until Cargolux became the first operator of the Boeing 747-8 freighter in 2011. The new freighter combines a redesigned wing with advanced engine technology that leads to a substantial reduction in noise levels. According to Boeing, the 85dB take-off noise footprint is lowered by around 30% compared to the 747-400F. This in turn is likely to offer a measurable improvement for the neighboring communities at Luxembourg airport.
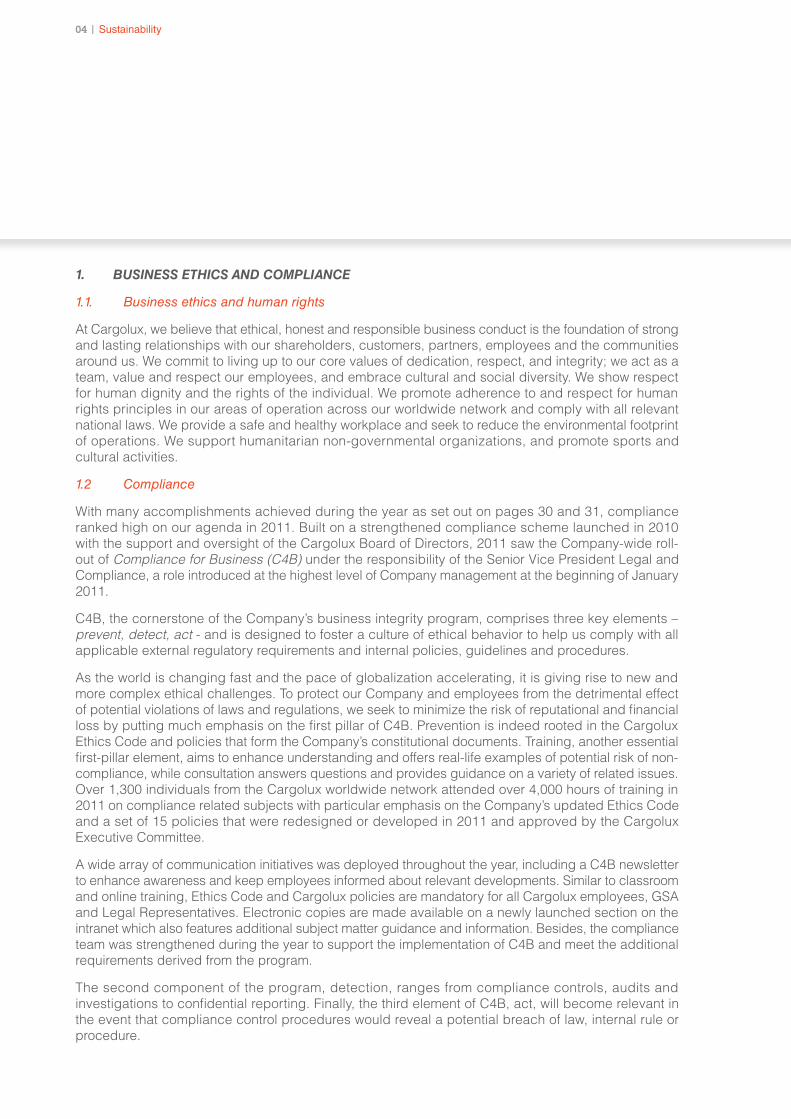
9204 | Sustainability
1. BUSINESS ETHICS AND COMPLIANCE
1.1. Business ethics and human rights
At Cargolux, we believe that ethical, honest and responsible business conduct is the foundation of strong and lasting relationships with our shareholders, customers, partners, employees and the communities around us. We commit to living up to our core values of dedication, respect, and integrity; we act as a team, value and respect our employees, and embrace cultural and social diversity. We show respect for human dignity and the rights of the individual. We promote adherence to and respect for human rights principles in our areas of operation across our worldwide network and comply with all relevant national laws. We provide a safe and healthy workplace and seek to reduce the environmental footprint of operations. We support humanitarian non-governmental organizations, and promote sports and cultural activities.
1.2 Compliance
With many accomplishments achieved during the year as set out on pages 30 and 31, compliance ranked high on our agenda in 2011. Built on a strengthened compliance scheme launched in 2010 with the support and oversight of the Cargolux Board of Directors, 2011 saw the Company-wide roll-out of Compliance for Business (C4B) under the responsibility of the Senior Vice President Legal and Compliance, a role introduced at the highest level of Company management at the beginning of January 2011.
C4B, the cornerstone of the Company’s business integrity program, comprises three key elements – prevent, detect, act - and is designed to foster a culture of ethical behavior to help us comply with all applicable external regulatory requirements and internal policies, guidelines and procedures.
As the world is changing fast and the pace of globalization accelerating, it is giving rise to new and more complex ethical challenges. To protect our Company and employees from the detrimental effect of potential violations of laws and regulations, we seek to minimize the risk of reputational and financial loss by putting much emphasis on the first pillar of C4B. Prevention is indeed rooted in the Cargolux Ethics Code and policies that form the Company’s constitutional documents. Training, another essential first-pillar element, aims to enhance understanding and offers real-life examples of potential risk of non-compliance, while consultation answers questions and provides guidance on a variety of related issues. Over 1,300 individuals from the Cargolux worldwide network attended over 4,000 hours of training in 2011 on compliance related subjects with particular emphasis on the Company’s updated Ethics Code and a set of 15 policies that were redesigned or developed in 2011 and approved by the Cargolux Executive Committee.
A wide array of communication initiatives was deployed throughout the year, including a C4B newsletter to enhance awareness and keep employees informed about relevant developments. Similar to classroom and online training, Ethics Code and Cargolux policies are mandatory for all Cargolux employees, GSA and Legal Representatives. Electronic copies are made available on a newly launched section on the intranet which also features additional subject matter guidance and information. Besides, the compliance team was strengthened during the year to support the implementation of C4B and meet the additional requirements derived from the program.
The second component of the program, detection, ranges from compliance controls, audits and investigations to confidential reporting. Finally, the third element of C4B, act, will become relevant in the event that compliance control procedures would reveal a potential breach of law, internal rule or procedure.
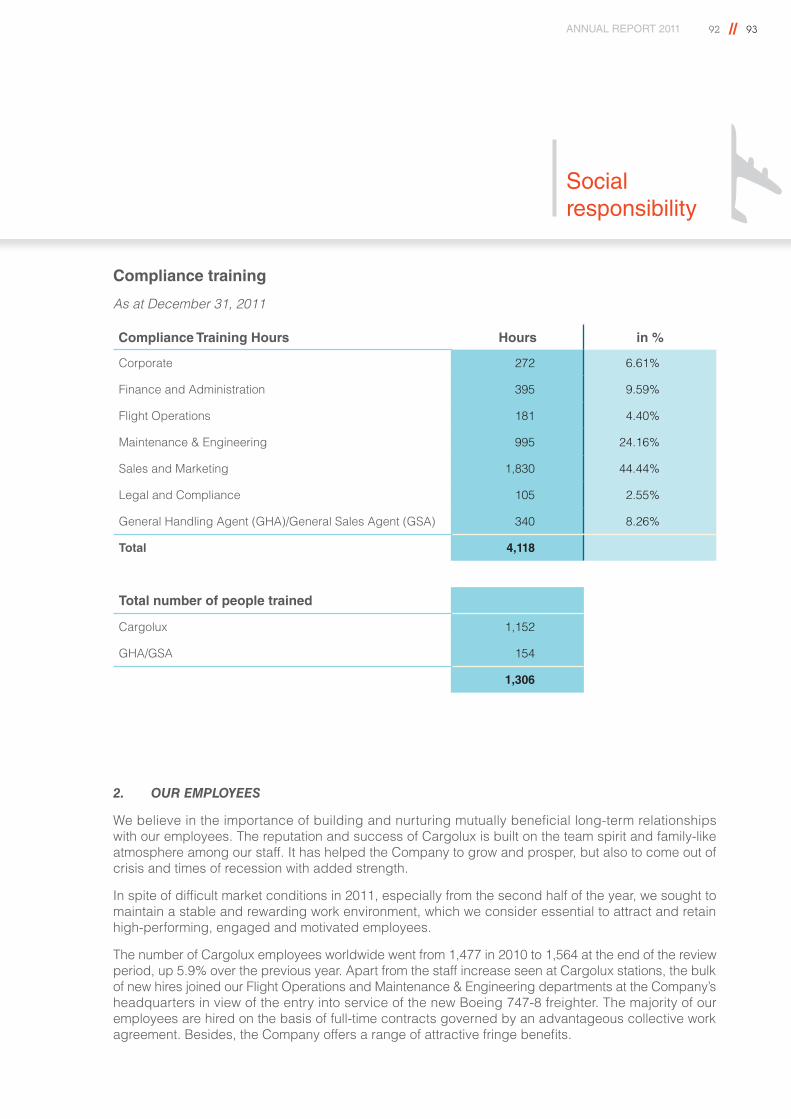
ANNUAL REPORT 2011 92 // 93
Socialresponsibility
Compliance training
As at December 31, 2011
Compliance Training Hours Hours in %
Corporate 272 6.61%
Finance and Administration 395 9.59%
Flight Operations 181 4.40%
Maintenance & Engineering 995 24.16%
Sales and Marketing 1,830 44.44%
Legal and Compliance 105 2.55%
General Handling Agent (GHA)/General Sales Agent (GSA) 340 8.26%
Total 4,118
Total number of people trained
Cargolux 1,152
GHA/GSA 154
1,306
2. OUR EMPLOYEES
We believe in the importance of building and nurturing mutually beneficial long-term relationships with our employees. The reputation and success of Cargolux is built on the team spirit and family-like atmosphere among our staff. It has helped the Company to grow and prosper, but also to come out of crisis and times of recession with added strength.
In spite of difficult market conditions in 2011, especially from the second half of the year, we sought to maintain a stable and rewarding work environment, which we consider essential to attract and retain high-performing, engaged and motivated employees.
The number of Cargolux employees worldwide went from 1,477 in 2010 to 1,564 at the end of the review period, up 5.9% over the previous year. Apart from the staff increase seen at Cargolux stations, the bulk of new hires joined our Flight Operations and Maintenance & Engineering departments at the Company’s headquarters in view of the entry into service of the new Boeing 747-8 freighter. The majority of our employees are hired on the basis of full-time contracts governed by an advantageous collective work agreement. Besides, the Company offers a range of attractive fringe benefits.
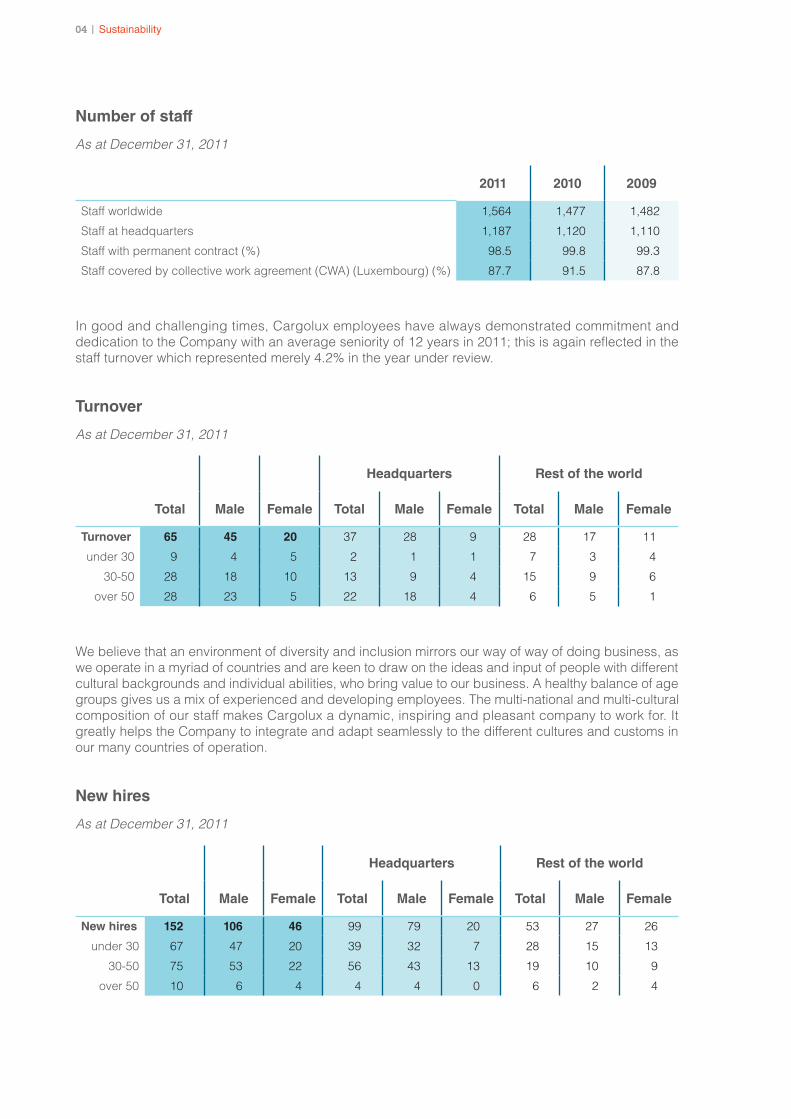
9404 | Sustainability
Number of staff
As at December 31, 2011
2011 2010 2009
Staff worldwide 1,564 1,477 1,482
Staff at headquarters 1,187 1,120 1,110
Staff with permanent contract (%) 98.5 99.8 99.3
Staff covered by collective work agreement (CWA) (Luxembourg) (%) 87.7 91.5 87.8
In good and challenging times, Cargolux employees have always demonstrated commitment and dedication to the Company with an average seniority of 12 years in 2011; this is again reflected in the staff turnover which represented merely 4.2% in the year under review.
Turnover
As at December 31, 2011
Headquarters Rest of the world
Total Male Female Total Male Female Total Male Female
Turnover 65 45 20 37 28 9 28 17 11
under 30 9 4 5 2 1 1 7 3 4
30-50 28 18 10 13 9 4 15 9 6
over 50 28 23 5 22 18 4 6 5 1
We believe that an environment of diversity and inclusion mirrors our way of way of doing business, as we operate in a myriad of countries and are keen to draw on the ideas and input of people with different cultural backgrounds and individual abilities, who bring value to our business. A healthy balance of age groups gives us a mix of experienced and developing employees. The multi-national and multi-cultural composition of our staff makes Cargolux a dynamic, inspiring and pleasant company to work for. It greatly helps the Company to integrate and adapt seamlessly to the different cultures and customs in our many countries of operation.
New hires
As at December 31, 2011
Headquarters Rest of the world
Total Male Female Total Male Female Total Male Female
New hires 152 106 46 99 79 20 53 27 26
under 30 67 47 20 39 32 7 28 15 13
30-50 75 53 22 56 43 13 19 10 9
over 50 10 6 4 4 4 0 6 2 4
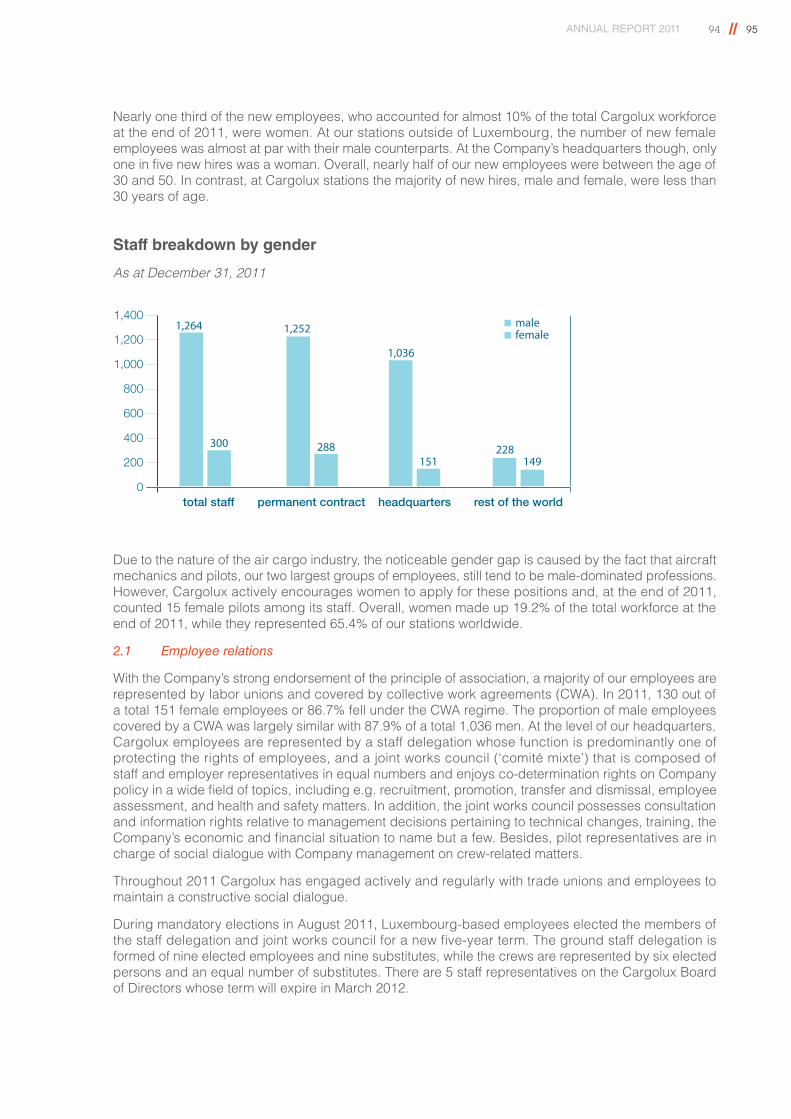
ANNUAL REPORT 2011 94 // 95
Nearly one third of the new employees, who accounted for almost 10% of the total Cargolux workforce at the end of 2011, were women. At our stations outside of Luxembourg, the number of new female employees was almost at par with their male counterparts. At the Company’s headquarters though, only one in five new hires was a woman. Overall, nearly half of our new employees were between the age of 30 and 50. In contrast, at Cargolux stations the majority of new hires, male and female, were less than 30 years of age.
Staff breakdown by gender
As at December 31, 2011
total staff permanent contract headquarters rest of the world0
1,400
1,200
1,000
800
600
400
200
1,264
300
1,252
288
1,036
malefemale
151228
149
Due to the nature of the air cargo industry, the noticeable gender gap is caused by the fact that aircraft mechanics and pilots, our two largest groups of employees, still tend to be male-dominated professions. However, Cargolux actively encourages women to apply for these positions and, at the end of 2011, counted 15 female pilots among its staff. Overall, women made up 19.2% of the total workforce at the end of 2011, while they represented 65.4% of our stations worldwide.
2.1 Employee relations
With the Company’s strong endorsement of the principle of association, a majority of our employees are represented by labor unions and covered by collective work agreements (CWA). In 2011, 130 out of a total 151 female employees or 86.7% fell under the CWA regime. The proportion of male employees covered by a CWA was largely similar with 87.9% of a total 1,036 men. At the level of our headquarters, Cargolux employees are represented by a staff delegation whose function is predominantly one of protecting the rights of employees, and a joint works council (‘comité mixte’) that is composed of staff and employer representatives in equal numbers and enjoys co-determination rights on Company policy in a wide field of topics, including e.g. recruitment, promotion, transfer and dismissal, employee assessment, and health and safety matters. In addition, the joint works council possesses consultation and information rights relative to management decisions pertaining to technical changes, training, the Company’s economic and financial situation to name but a few. Besides, pilot representatives are in charge of social dialogue with Company management on crew-related matters.
Throughout 2011 Cargolux has engaged actively and regularly with trade unions and employees to maintain a constructive social dialogue.
During mandatory elections in August 2011, Luxembourg-based employees elected the members of the staff delegation and joint works council for a new five-year term. The ground staff delegation is formed of nine elected employees and nine substitutes, while the crews are represented by six elected persons and an equal number of substitutes. There are 5 staff representatives on the Cargolux Board of Directors whose term will expire in March 2012.
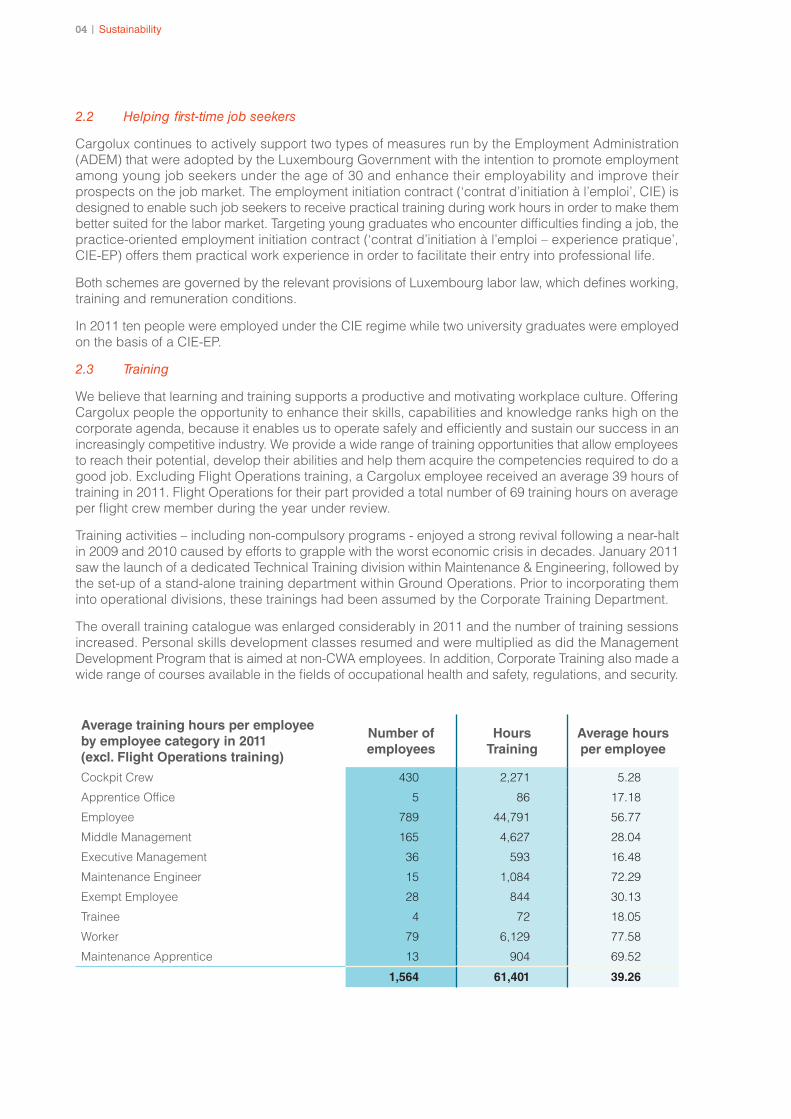
9604 | Sustainability
2.2 Helping first-time job seekers
Cargolux continues to actively support two types of measures run by the Employment Administration (ADEM) that were adopted by the Luxembourg Government with the intention to promote employment among young job seekers under the age of 30 and enhance their employability and improve their prospects on the job market. The employment initiation contract (‘contrat d’initiation à l’emploi’, CIE) is designed to enable such job seekers to receive practical training during work hours in order to make them better suited for the labor market. Targeting young graduates who encounter difficulties finding a job, the practice-oriented employment initiation contract (‘contrat d’initiation à l’emploi – experience pratique’, CIE-EP) offers them practical work experience in order to facilitate their entry into professional life.
Both schemes are governed by the relevant provisions of Luxembourg labor law, which defines working, training and remuneration conditions.
In 2011 ten people were employed under the CIE regime while two university graduates were employed on the basis of a CIE-EP.
2.3 Training
We believe that learning and training supports a productive and motivating workplace culture. Offering Cargolux people the opportunity to enhance their skills, capabilities and knowledge ranks high on the corporate agenda, because it enables us to operate safely and efficiently and sustain our success in an increasingly competitive industry. We provide a wide range of training opportunities that allow employees to reach their potential, develop their abilities and help them acquire the competencies required to do a good job. Excluding Flight Operations training, a Cargolux employee received an average 39 hours of training in 2011. Flight Operations for their part provided a total number of 69 training hours on average per flight crew member during the year under review.
Training activities – including non-compulsory programs - enjoyed a strong revival following a near-halt in 2009 and 2010 caused by efforts to grapple with the worst economic crisis in decades. January 2011 saw the launch of a dedicated Technical Training division within Maintenance & Engineering, followed by the set-up of a stand-alone training department within Ground Operations. Prior to incorporating them into operational divisions, these trainings had been assumed by the Corporate Training Department.
The overall training catalogue was enlarged considerably in 2011 and the number of training sessions increased. Personal skills development classes resumed and were multiplied as did the Management Development Program that is aimed at non-CWA employees. In addition, Corporate Training also made a wide range of courses available in the fields of occupational health and safety, regulations, and security.
Average training hours per employee by employee category in 2011 (excl. Flight Operations training)
Number of employees
Hours Training
Average hours per employee
Cockpit Crew 430 2,271 5.28
Apprentice Office 5 86 17.18
Employee 789 44,791 56.77
Middle Management 165 4,627 28.04
Executive Management 36 593 16.48
Maintenance Engineer 15 1,084 72.29
Exempt Employee 28 844 30.13
Trainee 4 72 18.05
Worker 79 6,129 77.58
Maintenance Apprentice 13 904 69.52
1,564 61,401 39.26
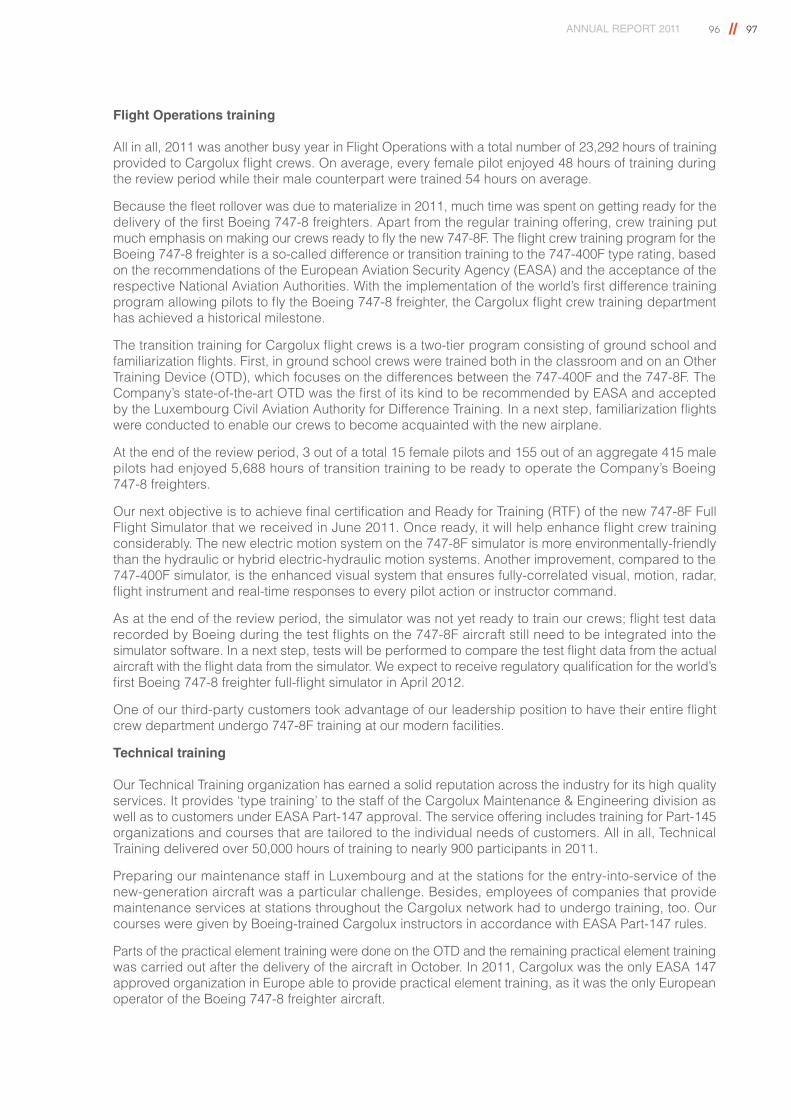
ANNUAL REPORT 2011 96 // 97
Flight Operations training
All in all, 2011 was another busy year in Flight Operations with a total number of 23,292 hours of training provided to Cargolux flight crews. On average, every female pilot enjoyed 48 hours of training during the review period while their male counterpart were trained 54 hours on average.
Because the fleet rollover was due to materialize in 2011, much time was spent on getting ready for the delivery of the first Boeing 747-8 freighters. Apart from the regular training offering, crew training put much emphasis on making our crews ready to fly the new 747-8F. The flight crew training program for the Boeing 747-8 freighter is a so-called difference or transition training to the 747-400F type rating, based on the recommendations of the European Aviation Security Agency (EASA) and the acceptance of the respective National Aviation Authorities. With the implementation of the world’s first difference training program allowing pilots to fly the Boeing 747-8 freighter, the Cargolux flight crew training department has achieved a historical milestone.
The transition training for Cargolux flight crews is a two-tier program consisting of ground school and familiarization flights. First, in ground school crews were trained both in the classroom and on an Other Training Device (OTD), which focuses on the differences between the 747-400F and the 747-8F. The Company’s state-of-the-art OTD was the first of its kind to be recommended by EASA and accepted by the Luxembourg Civil Aviation Authority for Difference Training. In a next step, familiarization flights were conducted to enable our crews to become acquainted with the new airplane.
At the end of the review period, 3 out of a total 15 female pilots and 155 out of an aggregate 415 male pilots had enjoyed 5,688 hours of transition training to be ready to operate the Company’s Boeing 747-8 freighters.
Our next objective is to achieve final certification and Ready for Training (RTF) of the new 747-8F Full Flight Simulator that we received in June 2011. Once ready, it will help enhance flight crew training considerably. The new electric motion system on the 747-8F simulator is more environmentally-friendly than the hydraulic or hybrid electric-hydraulic motion systems. Another improvement, compared to the 747-400F simulator, is the enhanced visual system that ensures fully-correlated visual, motion, radar, flight instrument and real-time responses to every pilot action or instructor command.
As at the end of the review period, the simulator was not yet ready to train our crews; flight test data recorded by Boeing during the test flights on the 747-8F aircraft still need to be integrated into the simulator software. In a next step, tests will be performed to compare the test flight data from the actual aircraft with the flight data from the simulator. We expect to receive regulatory qualification for the world’s first Boeing 747-8 freighter full-flight simulator in April 2012.
One of our third-party customers took advantage of our leadership position to have their entire flight crew department undergo 747-8F training at our modern facilities.
Technical training
Our Technical Training organization has earned a solid reputation across the industry for its high quality services. It provides ‘type training’ to the staff of the Cargolux Maintenance & Engineering division as well as to customers under EASA Part-147 approval. The service offering includes training for Part-145 organizations and courses that are tailored to the individual needs of customers. All in all, Technical Training delivered over 50,000 hours of training to nearly 900 participants in 2011.
Preparing our maintenance staff in Luxembourg and at the stations for the entry-into-service of the new-generation aircraft was a particular challenge. Besides, employees of companies that provide maintenance services at stations throughout the Cargolux network had to undergo training, too. Our courses were given by Boeing-trained Cargolux instructors in accordance with EASA Part-147 rules.
Parts of the practical element training were done on the OTD and the remaining practical element training was carried out after the delivery of the aircraft in October. In 2011, Cargolux was the only EASA 147 approved organization in Europe able to provide practical element training, as it was the only European operator of the Boeing 747-8 freighter aircraft.
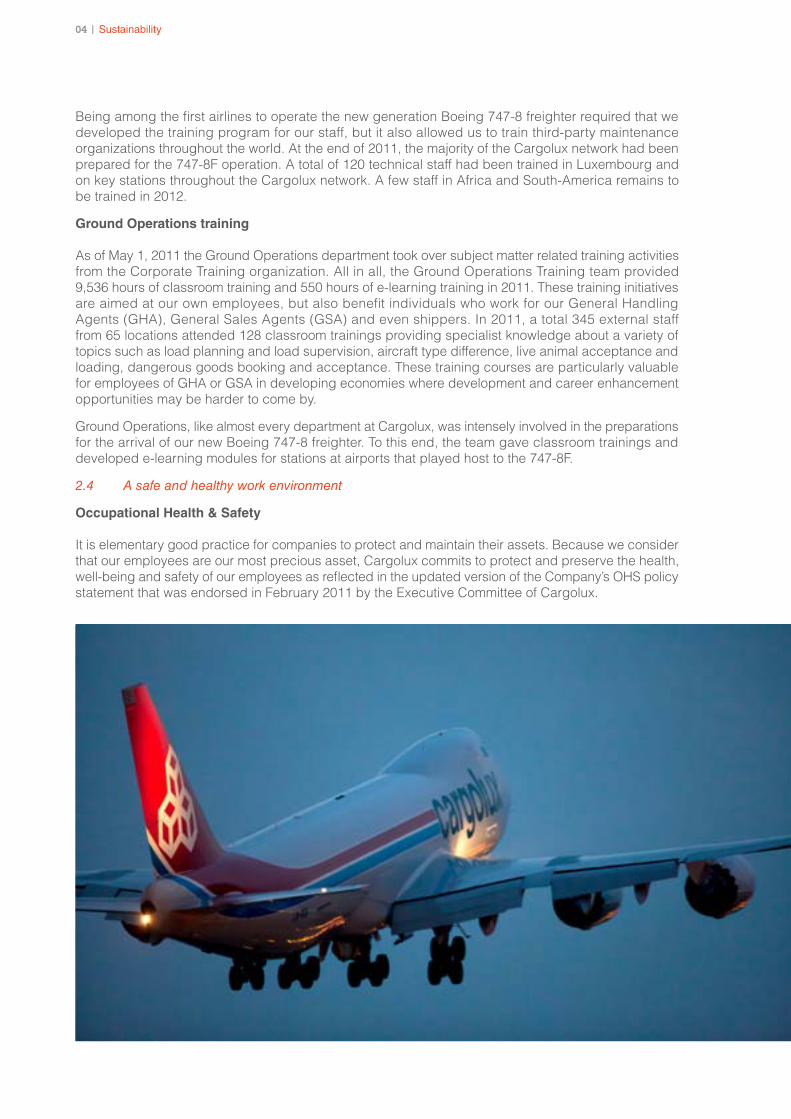
9804 | Sustainability
Being among the first airlines to operate the new generation Boeing 747-8 freighter required that we developed the training program for our staff, but it also allowed us to train third-party maintenance organizations throughout the world. At the end of 2011, the majority of the Cargolux network had been prepared for the 747-8F operation. A total of 120 technical staff had been trained in Luxembourg and on key stations throughout the Cargolux network. A few staff in Africa and South-America remains to be trained in 2012.
Ground Operations training
As of May 1, 2011 the Ground Operations department took over subject matter related training activities from the Corporate Training organization. All in all, the Ground Operations Training team provided 9,536 hours of classroom training and 550 hours of e-learning training in 2011. These training initiatives are aimed at our own employees, but also benefit individuals who work for our General Handling Agents (GHA), General Sales Agents (GSA) and even shippers. In 2011, a total 345 external staff from 65 locations attended 128 classroom trainings providing specialist knowledge about a variety of topics such as load planning and load supervision, aircraft type difference, live animal acceptance and loading, dangerous goods booking and acceptance. These training courses are particularly valuable for employees of GHA or GSA in developing economies where development and career enhancement opportunities may be harder to come by.
Ground Operations, like almost every department at Cargolux, was intensely involved in the preparations for the arrival of our new Boeing 747-8 freighter. To this end, the team gave classroom trainings and developed e-learning modules for stations at airports that played host to the 747-8F.
2.4 A safe and healthy work environment
Occupational Health & Safety
It is elementary good practice for companies to protect and maintain their assets. Because we consider that our employees are our most precious asset, Cargolux commits to protect and preserve the health, well-being and safety of our employees as reflected in the updated version of the Company’s OHS policy statement that was endorsed in February 2011 by the Executive Committee of Cargolux.
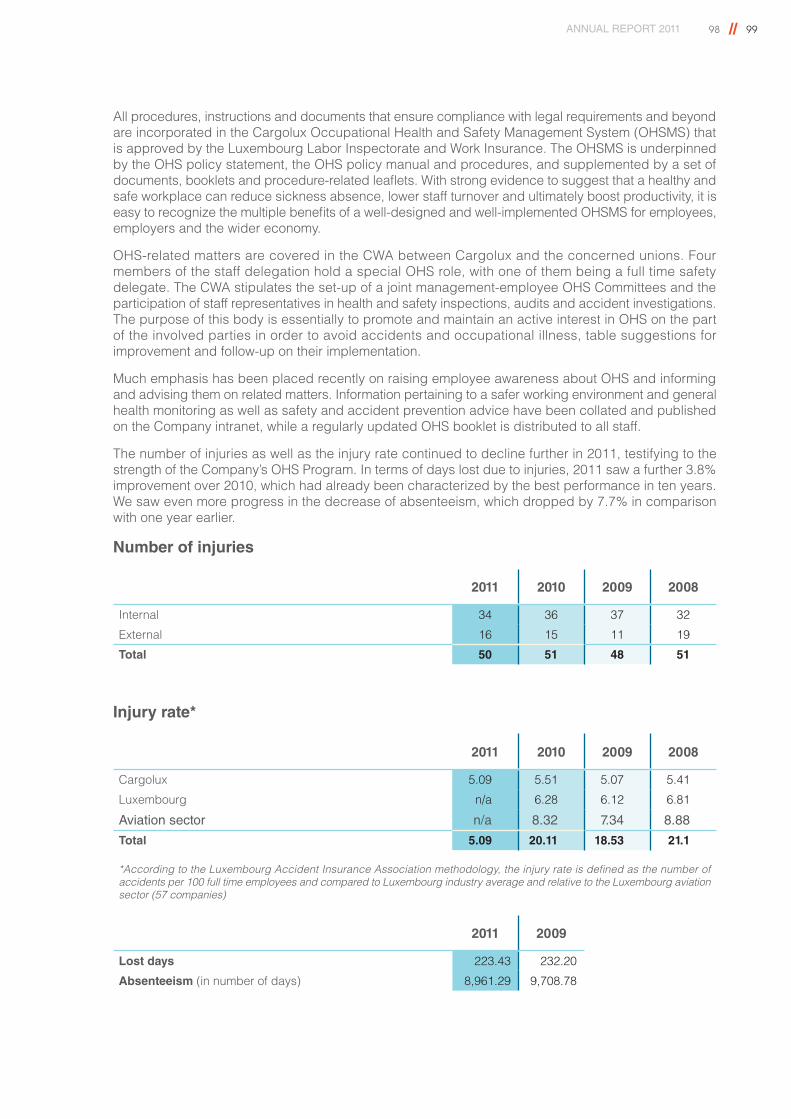
ANNUAL REPORT 2011 98 // 99
All procedures, instructions and documents that ensure compliance with legal requirements and beyond are incorporated in the Cargolux Occupational Health and Safety Management System (OHSMS) that is approved by the Luxembourg Labor Inspectorate and Work Insurance. The OHSMS is underpinned by the OHS policy statement, the OHS policy manual and procedures, and supplemented by a set of documents, booklets and procedure-related leaflets. With strong evidence to suggest that a healthy and safe workplace can reduce sickness absence, lower staff turnover and ultimately boost productivity, it is easy to recognize the multiple benefits of a well-designed and well-implemented OHSMS for employees, employers and the wider economy.
OHS-related matters are covered in the CWA between Cargolux and the concerned unions. Four members of the staff delegation hold a special OHS role, with one of them being a full time safety delegate. The CWA stipulates the set-up of a joint management-employee OHS Committees and the participation of staff representatives in health and safety inspections, audits and accident investigations. The purpose of this body is essentially to promote and maintain an active interest in OHS on the part of the involved parties in order to avoid accidents and occupational illness, table suggestions for improvement and follow-up on their implementation.
Much emphasis has been placed recently on raising employee awareness about OHS and informing and advising them on related matters. Information pertaining to a safer working environment and general health monitoring as well as safety and accident prevention advice have been collated and published on the Company intranet, while a regularly updated OHS booklet is distributed to all staff.
The number of injuries as well as the injury rate continued to decline further in 2011, testifying to the strength of the Company’s OHS Program. In terms of days lost due to injuries, 2011 saw a further 3.8% improvement over 2010, which had already been characterized by the best performance in ten years. We saw even more progress in the decrease of absenteeism, which dropped by 7.7% in comparison with one year earlier.
Number of injuries
2011 2010 2009 2008
Internal 34 36 37 32
External 16 15 11 19
Total 50 51 48 51
Injury rate*
2011 2010 2009 2008
Cargolux 5.09 5.51 5.07 5.41
Luxembourg n/a 6.28 6.12 6.81
Aviation sector n/a 8.32 7.34 8.88
Total 5.09 20.11 18.53 21.1
*According to the Luxembourg Accident Insurance Association methodology, the injury rate is defined as the number of accidents per 100 full time employees and compared to Luxembourg industry average and relative to the Luxembourg aviation sector (57 companies)
2011 2009
Lost days 223.43 232.20
Absenteeism (in number of days) 8,961.29 9,708.78
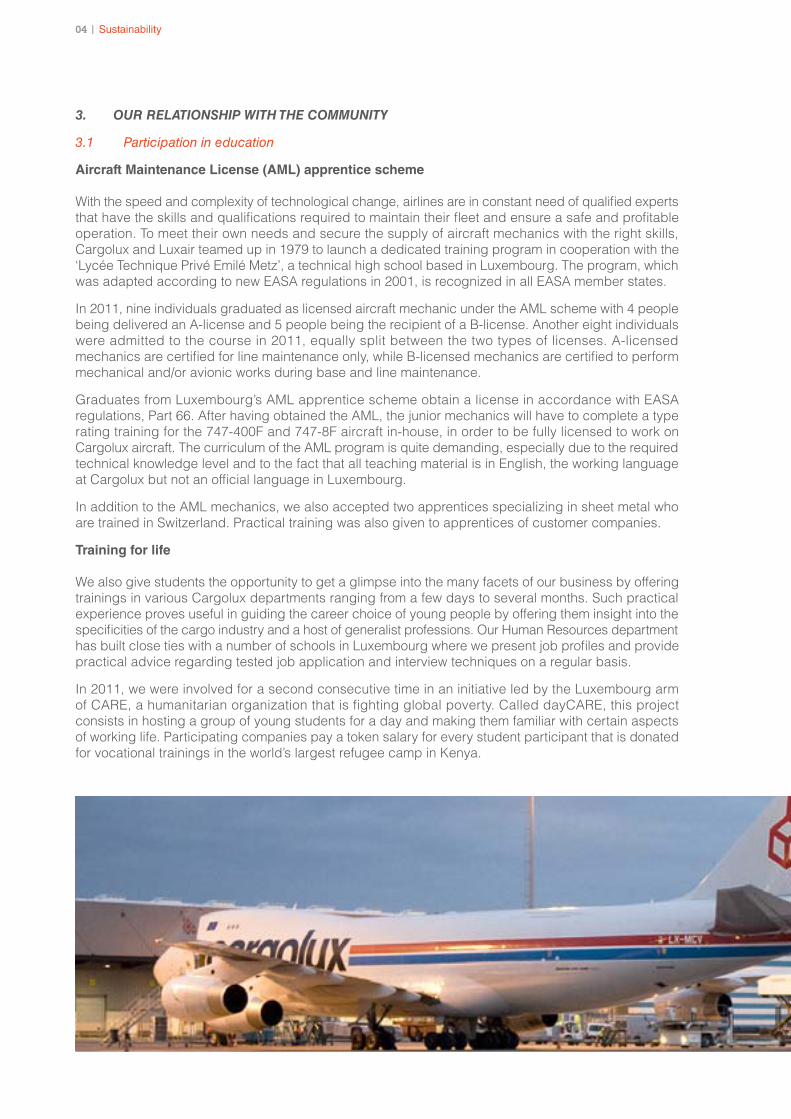
10004 | Sustainability
3. OUR RELATIONSHIP WITH THE COMMUNITY
3.1 Participation in education
Aircraft Maintenance License (AML) apprentice scheme
With the speed and complexity of technological change, airlines are in constant need of qualified experts that have the skills and qualifications required to maintain their fleet and ensure a safe and profitable operation. To meet their own needs and secure the supply of aircraft mechanics with the right skills, Cargolux and Luxair teamed up in 1979 to launch a dedicated training program in cooperation with the ‘Lycée Technique Privé Emilé Metz’, a technical high school based in Luxembourg. The program, which was adapted according to new EASA regulations in 2001, is recognized in all EASA member states.
In 2011, nine individuals graduated as licensed aircraft mechanic under the AML scheme with 4 people being delivered an A-license and 5 people being the recipient of a B-license. Another eight individuals were admitted to the course in 2011, equally split between the two types of licenses. A-licensed mechanics are certified for line maintenance only, while B-licensed mechanics are certified to perform mechanical and/or avionic works during base and line maintenance.
Graduates from Luxembourg’s AML apprentice scheme obtain a license in accordance with EASA regulations, Part 66. After having obtained the AML, the junior mechanics will have to complete a type rating training for the 747-400F and 747-8F aircraft in-house, in order to be fully licensed to work on Cargolux aircraft. The curriculum of the AML program is quite demanding, especially due to the required technical knowledge level and to the fact that all teaching material is in English, the working language at Cargolux but not an official language in Luxembourg.
In addition to the AML mechanics, we also accepted two apprentices specializing in sheet metal who are trained in Switzerland. Practical training was also given to apprentices of customer companies.
Training for life
We also give students the opportunity to get a glimpse into the many facets of our business by offering trainings in various Cargolux departments ranging from a few days to several months. Such practical experience proves useful in guiding the career choice of young people by offering them insight into the specificities of the cargo industry and a host of generalist professions. Our Human Resources department has built close ties with a number of schools in Luxembourg where we present job profiles and provide practical advice regarding tested job application and interview techniques on a regular basis.
In 2011, we were involved for a second consecutive time in an initiative led by the Luxembourg arm of CARE, a humanitarian organization that is fighting global poverty. Called dayCARE, this project consists in hosting a group of young students for a day and making them familiar with certain aspects of working life. Participating companies pay a token salary for every student participant that is donated for vocational trainings in the world’s largest refugee camp in Kenya.
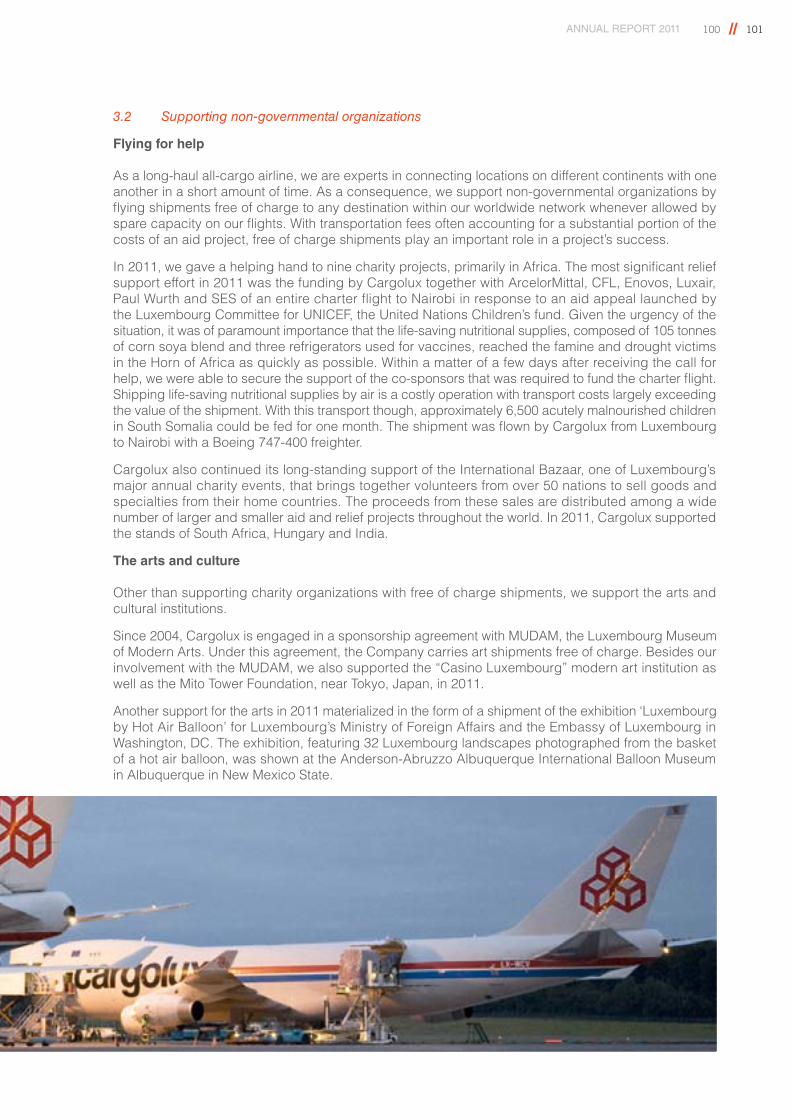
ANNUAL REPORT 2011 100 // 101
3.2 Supporting non-governmental organizations
Flying for help
As a long-haul all-cargo airline, we are experts in connecting locations on different continents with one another in a short amount of time. As a consequence, we support non-governmental organizations by flying shipments free of charge to any destination within our worldwide network whenever allowed by spare capacity on our flights. With transportation fees often accounting for a substantial portion of the costs of an aid project, free of charge shipments play an important role in a project’s success.
In 2011, we gave a helping hand to nine charity projects, primarily in Africa. The most significant relief support effort in 2011 was the funding by Cargolux together with ArcelorMittal, CFL, Enovos, Luxair, Paul Wurth and SES of an entire charter flight to Nairobi in response to an aid appeal launched by the Luxembourg Committee for UNICEF, the United Nations Children’s fund. Given the urgency of the situation, it was of paramount importance that the life-saving nutritional supplies, composed of 105 tonnes of corn soya blend and three refrigerators used for vaccines, reached the famine and drought victims in the Horn of Africa as quickly as possible. Within a matter of a few days after receiving the call for help, we were able to secure the support of the co-sponsors that was required to fund the charter flight. Shipping life-saving nutritional supplies by air is a costly operation with transport costs largely exceeding the value of the shipment. With this transport though, approximately 6,500 acutely malnourished children in South Somalia could be fed for one month. The shipment was flown by Cargolux from Luxembourg to Nairobi with a Boeing 747-400 freighter.
Cargolux also continued its long-standing support of the International Bazaar, one of Luxembourg’s major annual charity events, that brings together volunteers from over 50 nations to sell goods and specialties from their home countries. The proceeds from these sales are distributed among a wide number of larger and smaller aid and relief projects throughout the world. In 2011, Cargolux supported the stands of South Africa, Hungary and India.
The arts and culture
Other than supporting charity organizations with free of charge shipments, we support the arts and cultural institutions.
Since 2004, Cargolux is engaged in a sponsorship agreement with MUDAM, the Luxembourg Museum of Modern Arts. Under this agreement, the Company carries art shipments free of charge. Besides our involvement with the MUDAM, we also supported the “Casino Luxembourg” modern art institution as well as the Mito Tower Foundation, near Tokyo, Japan, in 2011.
Another support for the arts in 2011 materialized in the form of a shipment of the exhibition ‘Luxembourg by Hot Air Balloon’ for Luxembourg’s Ministry of Foreign Affairs and the Embassy of Luxembourg in Washington, DC. The exhibition, featuring 32 Luxembourg landscapes photographed from the basket of a hot air balloon, was shown at the Anderson-Abruzzo Albuquerque International Balloon Museum in Albuquerque in New Mexico State.
04 | Sustainability 102
1. Report structure, criteria and selection of issues
This is the fourth corporate social responsibility report of Cargolux. Following on the report published in the past three years, the preparation of this report was based on a continued analysis of the Company’s main impacts and responsibilities, both in connection with the environment and society, and relative to the concerns raised by the key groups of stakeholders in this field. Stakeholder groups were identified according to the nature and geographic location of our activities. We are engaged in an ongoing dialogue with our stakeholders via public meetings, direct representation or the media. Regular meetings are also held between the senior management of the Company and our employees, including open question and answer sessions.
Stakeholder groups include our shareholders, employees, customers, investors and suppliers. They extend to the communities potentially affected by our activities, primarily living around the airport of Luxembourg, our primary operational hub, an also include government and local authorities, national and industrial representations, non-governmental organizations and auditing bodies.
The 2011 report describes the Company’s actions and initiatives in a context of both continuity and change in an economic environment that was challenging for the airfreight industry. Nevertheless, we made every effort to uphold our commitment to taking our environmental and social responsibility seriously.
This report is based on the guidelines of the Global Reporting Initiative (GRI). We believe that our report meets application level C+ of the guidelines. We aim to continuously review and refine our sustainability process and to add further reporting indicators where necessary or relevant.
2. Reporting boundaries
This report pertains to Cargolux operations and geographical presence overall, except where otherwise specified in the report. Certain indicators cover our Luxembourg-based activities only. These include figures relating to waste disposal, the Company’s employees as well as date related to occupational health and safety. The report does not cover the activities of separate legal entities fully or partly owned by Cargolux. Our monitoring of fuel consumption and CO2 emissions includes the data collected by Cargolux Italia.
3. External assurance
Cargolux has asked Ernst & Young to provide limited assurance on the environmental and social information in this report as set out on pages 84 to 104. Information and data published were collected by Cargolux, however, and are presented entirely under the Company’s responsibility. Ernst & Young’s limited assurance report can be found on page 105.
4. Contact
We invite all interested parties to enter into dialogue with us about our sustainability policy, our activities and this report. Our policy and further information about our activities can be found on our website at http://www.cargolux.com/sustainability/. All comments and enquiries are welcome and can be forwarded to us through the contact form on the aforementioned webpage, or by writing to [email protected] .
ANNUAL REPORT 2011 // 103//
Reporting process and GRI
GRI indicators
1. Strategy & analysis
1.1. Statement from the most senior executive of the organization about the relevance of sustainability to the organization and its strategy
page 9
1.2 not required for C level
2. Organizational profile
2.1. Name of organization Cargolux Airlines International S.A.
2.2. Primary brands, products and/ or services Long-range transport of goods by air
2.3. Operational structure of the organization Main Company divisions: Flight Operations, Sales, Marketing & Ground Services, Finance & Administration, Legal Affairs and Compliance, IT, Maintenance & Engineering, Human Resources, Corporate Services
2.4. Location of organization's headquarter Luxembourg
2.5. Number of countries where the organization operates
31 countries (excluding agents)
2.6. Nature of ownership and legal form société anonyme
2.7. Markets served Cargolux provides air freight transport services to freight forwarders in most parts of the world through scheduled and charter flights. This includes the regular transportation of supply-chain goods, finished commodities, project cargo, perishables, temperature and shock-sensitive goods and live animals, among others.”
2.8. Scale of the reporting organization page 11
2.9. Significant changes during the reporting period regarding size, structure or ownership
pages 7, 9, 12, 13, 28, 32, 71, 73, 78
2.10. Awards received Customer Satisfaction Award 2010 A.N.A.M.A., Italy
International All Cargo Carrier of the Year in Africa The STAT Trade Times
Best Freighter Only Airline Air Cargo News
Air Cargo Award of Excellence Air Cargo World
Prix d’excellence Luxembourg FIABCI, Luxembourg
>>>
102
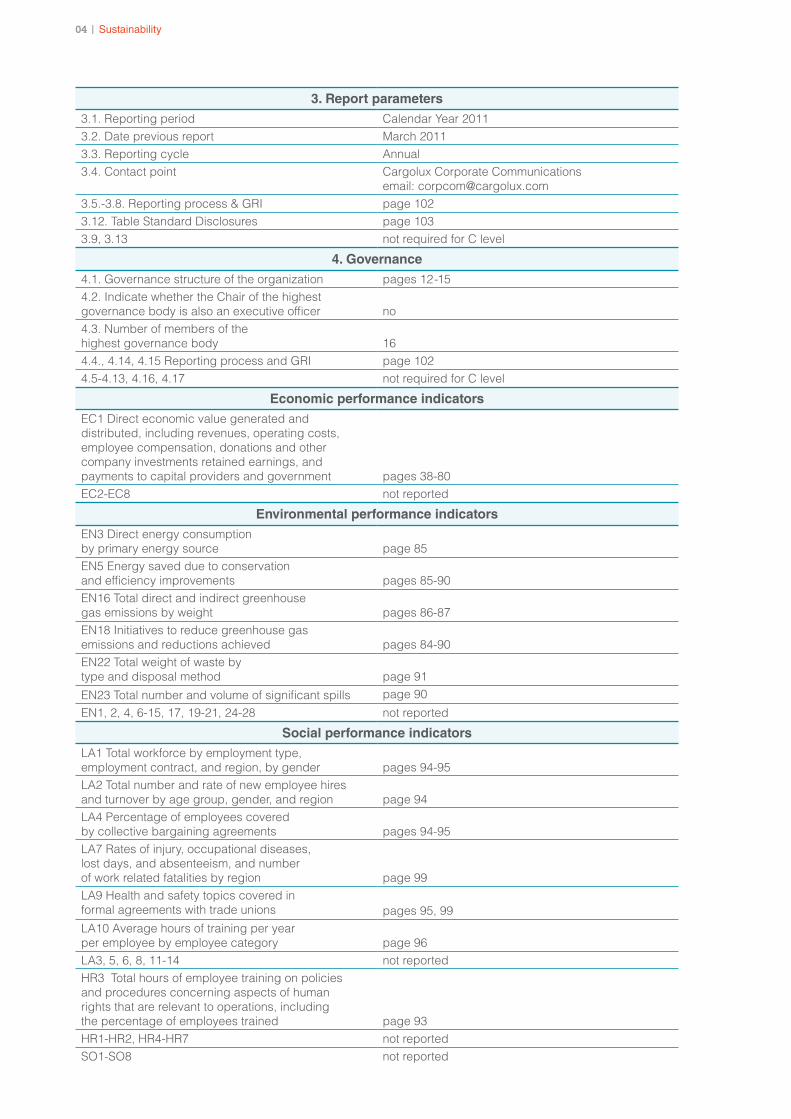
04 | Sustainability 104
3. Report parameters3.1. Reporting period Calendar Year 20113.2. Date previous report March 20113.3. Reporting cycle Annual3.4. Contact point Cargolux Corporate Communications
email: [email protected]. Reporting process & GRI page 1023.12. Table Standard Disclosures page 1033.9, 3.13 not required for C level
4. Governance4.1. Governance structure of the organization pages 12-154.2. Indicate whether the Chair of the highest governance body is also an executive officer
no
4.3. Number of members of the highest governance body
16
4.4., 4.14, 4.15 Reporting process and GRI page 1024.5-4.13, 4.16, 4.17 not required for C level
Economic performance indicatorsEC1 Direct economic value generated and distributed, including revenues, operating costs, employee compensation, donations and other company investments retained earnings, and payments to capital providers and government
pages 38-80
EC2-EC8 not reported
Environmental performance indicatorsEN3 Direct energy consumption by primary energy source
page 85
EN5 Energy saved due to conservation and efficiency improvements
pages 85-90
EN16 Total direct and indirect greenhouse gas emissions by weight
pages 86-87
EN18 Initiatives to reduce greenhouse gas emissions and reductions achieved
pages 84-90
EN22 Total weight of waste by type and disposal method
page 91
EN23 Total number and volume of significant spills page 90
EN1, 2, 4, 6-15, 17, 19-21, 24-28 not reported
Social performance indicatorsLA1 Total workforce by employment type, employment contract, and region, by gender
pages 94-95
LA2 Total number and rate of new employee hires and turnover by age group, gender, and region
page 94
LA4 Percentage of employees covered by collective bargaining agreements
pages 94-95
LA7 Rates of injury, occupational diseases, lost days, and absenteeism, and number of work related fatalities by region
page 99
LA9 Health and safety topics covered in formal agreements with trade unions
pages 95, 99
LA10 Average hours of training per year per employee by employee category page 96LA3, 5, 6, 8, 11-14 not reportedHR3 Total hours of employee training on policies and procedures concerning aspects of human rights that are relevant to operations, including the percentage of employees trained
page 93
HR1-HR2, HR4-HR7 not reportedSO1-SO8 not reported
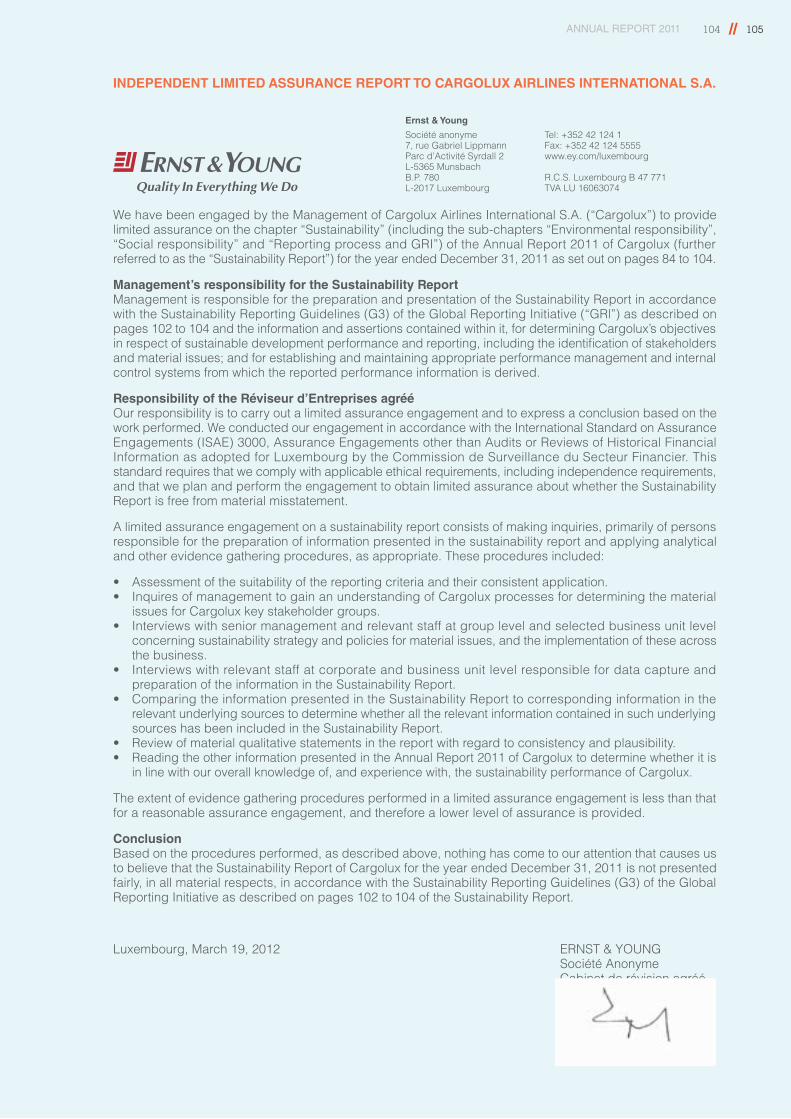
ANNUAL REPORT 2011 // 105
INDEPENDENT LIMITED ASSURANCE REPORT TO CARGOLUX AIRLINES INTERNATIONAL S.A.
We have been engaged by the Management of Cargolux Airlines International S.A. (“Cargolux”) to provide limited assurance on the chapter “Sustainability” (including the sub-chapters “Environmental responsibility”, “Social responsibility” and “Reporting process and GRI”) of the Annual Report 2011 of Cargolux (further referred to as the “Sustainability Report”) for the year ended December 31, 2011 as set out on pages 84 to 104.
Management’s responsibility for the Sustainability ReportManagement is responsible for the preparation and presentation of the Sustainability Report in accordance with the Sustainability Reporting Guidelines (G3) of the Global Reporting Initiative (“GRl”) as described on pages 102 to 104 and the information and assertions contained within it, for determining Cargolux’s objectives in respect of sustainable development performance and reporting, including the identification of stakeholders and material issues; and for establishing and maintaining appropriate performance management and internal control systems from which the reported performance information is derived.
Responsibility of the Réviseur d’Entreprises agrééOur responsibility is to carry out a limited assurance engagement and to express a conclusion based on the work performed. We conducted our engagement in accordance with the International Standard on Assurance Engagements (ISAE) 3000, Assurance Engagements other than Audits or Reviews of Historical Financial Information as adopted for Luxembourg by the Commission de Surveillance du Secteur Financier. This standard requires that we comply with applicable ethical requirements, including independence requirements, and that we plan and perform the engagement to obtain limited assurance about whether the Sustainability Report is free from material misstatement.
A limited assurance engagement on a sustainability report consists of making inquiries, primarily of persons responsible for the preparation of information presented in the sustainability report and applying analytical and other evidence gathering procedures, as appropriate. These procedures included:
• Assessmentofthesuitabilityofthereportingcriteriaandtheirconsistentapplication.• InquiresofmanagementtogainanunderstandingofCargoluxprocessesfordeterminingthematerial
issues for Cargolux key stakeholder groups.• Interviewswithseniormanagementandrelevantstaffatgrouplevelandselectedbusinessunitlevel
concerning sustainability strategy and policies for material issues, and the implementation of these across the business.
• Interviewswithrelevantstaffatcorporateandbusinessunitlevelresponsiblefordatacaptureandpreparation of the information in the Sustainability Report.
• ComparingtheinformationpresentedintheSustainabilityReporttocorrespondinginformationintherelevant underlying sources to determine whether all the relevant information contained in such underlying sources has been included in the Sustainability Report.
• Reviewofmaterialqualitativestatementsinthereportwithregardtoconsistencyandplausibility.• ReadingtheotherinformationpresentedintheAnnualReport2011ofCargoluxtodeterminewhetheritis
in line with our overall knowledge of, and experience with, the sustainability performance of Cargolux.
The extent of evidence gathering procedures performed in a limited assurance engagement is less than that for a reasonable assurance engagement, and therefore a lower level of assurance is provided.
ConclusionBased on the procedures performed, as described above, nothing has come to our attention that causes us to believe that the Sustainability Report of Cargolux for the year ended December 31, 2011 is not presented fairly, in all material respects, in accordance with the Sustainability Reporting Guidelines (G3) of the Global Reporting Initiative as described on pages 102 to 104 of the Sustainability Report.
Luxembourg, March 19, 2012 ERNST & YOUNG Société Anonyme Cabinet de révision agréé
Werner WEYNAND
Ernst & Young
Société anonyme7, rue Gabriel LippmannParc d’Activité Syrdall 2L-5365 Munsbach B.P. 780L-2017 Luxembourg
Tel: +352 42 124 1Fax: +352 42 124 5555www.ey.com/luxembourg
R.C.S. Luxembourg B 47 771TVA LU 16063074
104
Spanning the world05
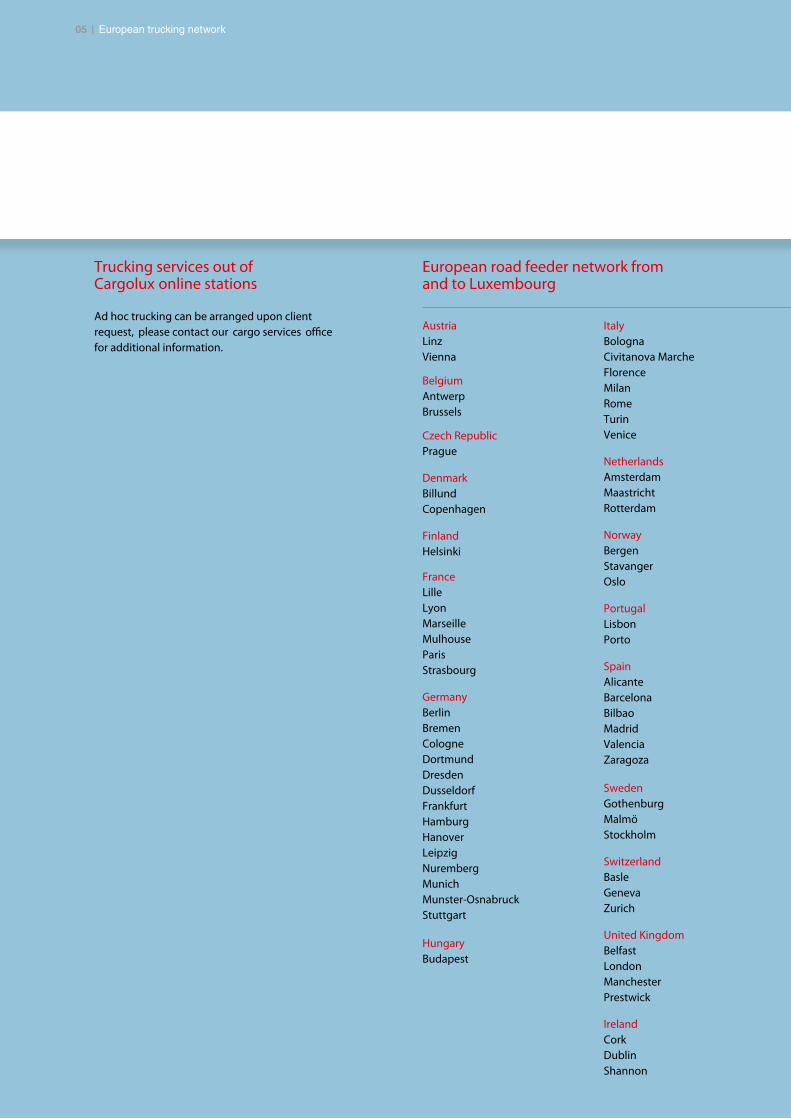
c o
10805 | European trucking network
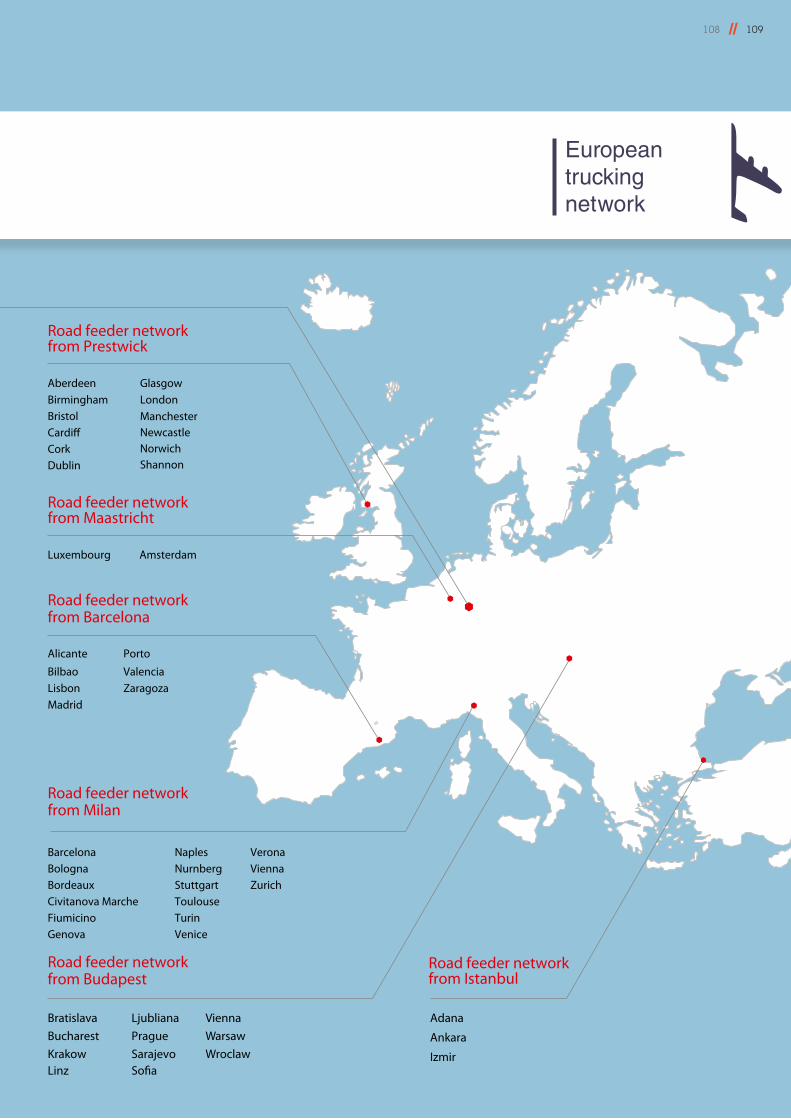
ANNUAL REPORT 2011
c o
109//
European trucking network
108
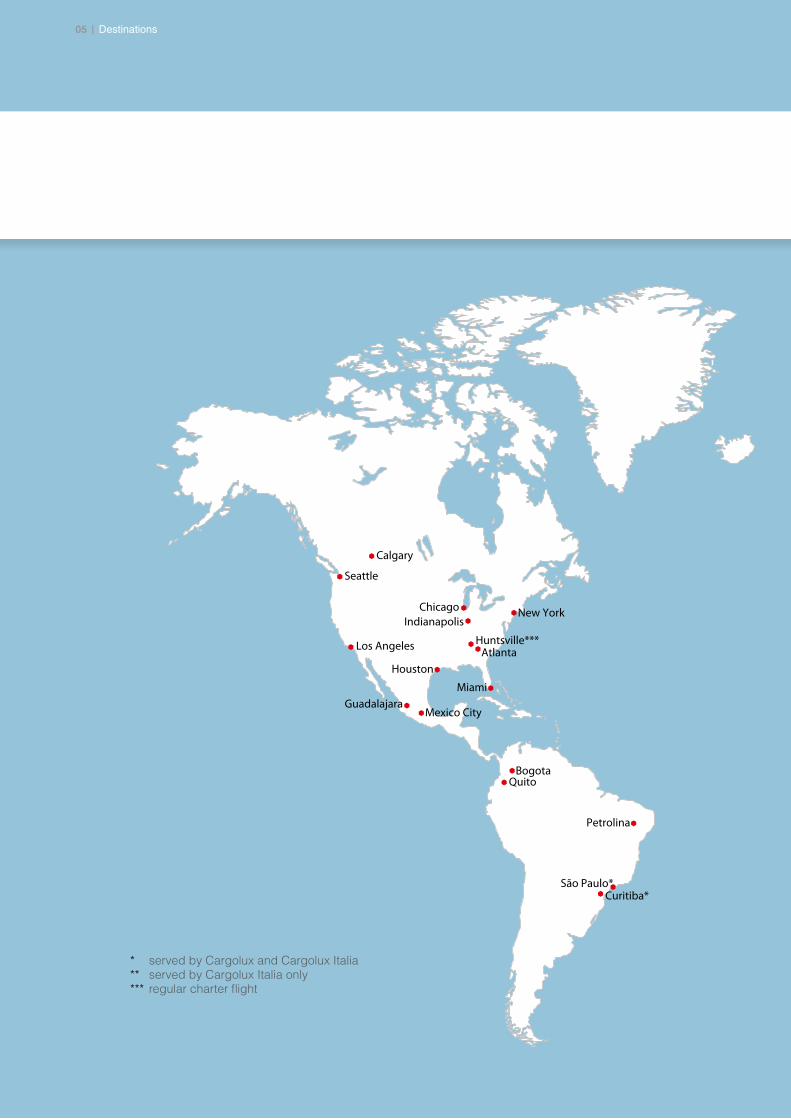
* served by Cargolux and Cargolux Italia** served by Cargolux Italia only*** regular charter flight
11005 | Destinations
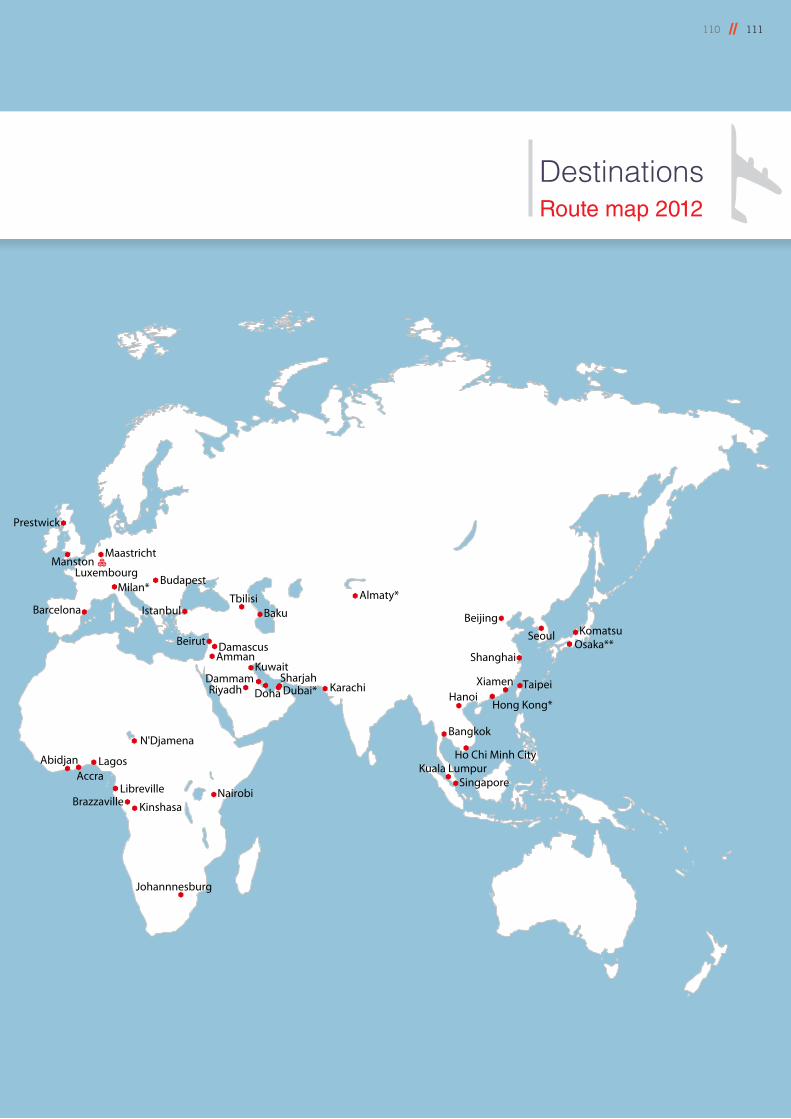
ANNUAL REPORT 2011 // 111
DestinationsRoute map 2012
110
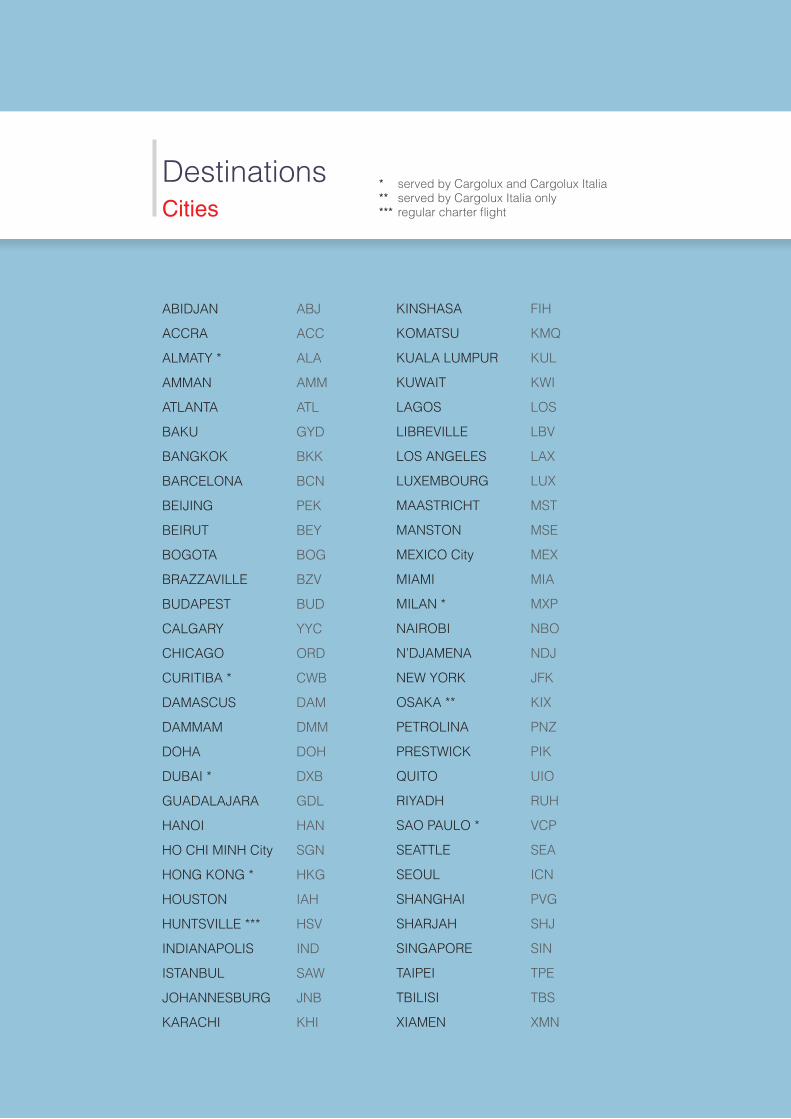
ABIDJAN ABJ
ACCRA ACC
ALMATY * ALA
AMMAN AMM
ATLANTA ATL
BAKU GYD
BANGKOK BKK
BARCELONA BCN
BEIJING PEK
BEIRUT BEY
BOGOTA BOG
BRAZZAVILLE BZV
BUDAPEST BUD
CALGARY YYC
CHICAGO ORD
CURITIBA * CWB
DAMASCUS DAM
DAMMAM DMM
DOHA DOH
DUBAI * DXB
GUADALAJARA GDL
HANOI HAN
HO CHI MINH City SGN
HONG KONG * HKG
HOUSTON IAH
HUNTSVILLE *** HSV
INDIANAPOLIS IND
ISTANBUL SAW
JOHANNESBURG JNB
KARACHI KHI
KINSHASA FIH
KOMATSU KMQ
KUALA LUMPUR KUL
KUWAIT KWI
LAGOS LOS
LIBREVILLE LBV
LOS ANGELES LAX
LUXEMBOURG LUX
MAASTRICHT MST
MANSTON MSE
MEXICO City MEX
MIAMI MIA
MILAN * MXP
NAIROBI NBO
N’DJAMENA NDJ
NEW YORK JFK
OSAKA ** KIX
PETROLINA PNZ
PRESTWICK PIK
QUITO UIO
RIYADH RUH
SAO PAULO * VCP
SEATTLE SEA
SEOUL ICN
SHANGHAI PVG
SHARJAH SHJ
SINGAPORE SIN
TAIPEI TPE
TBILISI TBS
XIAMEN XMN
DestinationsCities
* served by Cargolux and Cargolux Italia** served by Cargolux Italia only*** regular charter flight
Issued and edited byCorporate CommunicationsCargolux Airlines International S.A.Luxembourg AirportL-2990 LuxembourgGrand Duchy of LuxembourgTel.: +352 4211-1Fax: +352 4211 [email protected]
Designed and produced byImprimerie Centrale
Photo creditsChristian Aschman pages 2, 3, 33Boeing pages 4, 10, 11, 16, 17,
36, 37, 39, 84, 90Daniel Clarens page 6Cargolux pages 10, 11, 22, 25, 34, 100, 101Antoine Decker page 28John Fleck pages 56, 66, 89, 98Patrick Jeanne, Cargolux pages 18, 22, 25, 34, 51, 53,
54, 82, 83, 106, 107, 113Mike Joris pages 60, 91Jérôme Krier page 27Fränk Weber pages 8, 14