annual report 2012 - mediolanum€¦ · 246 responsibility statements pursuant to section 154-bis,...
TRANSCRIPT
MEDIOLANUM S.p.A.
ANNUALREPORT2012

3 Corporate Governance Officers
4 Group structure
5 Mediolanum Group’s Financial Highlights
Consolidated Annual Financial Statements at December 31, 20128 Directors’ Report
40 Consolidated Accounts
48 Notes to the Consolidated Annual Financial Statements
167 Schedules
188 Independent Auditors’ Report
Separate Annual Financial Statements at December 31, 2012192 Directors’ Report
200 Accounts
208 Notes to the Separate Annual Financial Statements
234 Schedules
244 Fees Paid to the Independent Auditors
246 Responsibility Statements pursuant to section 154-bis, paragraph 2, Legislative Decree 58/98
248 Report of the Board of Statutory Auditors
254 Independent Auditors’ Report
258 General Meeting of April 23, 2013
Table of Contents
The English version of the Annual Report is a translation of the Italian text provided for the convenienceof international readers.
ANNUALREPORT 2012
Registered office: Meucci Building Via F. Sforza – Basiglio – Milano Tre (Milan) Share capital € 73,441,716.90 fully paid up
Tax, VAT and Milan Register of Companies Registration No. 11667420159


3
Corporate Governance Officers
BOARD OF DIRECTORS
Carlo Secchi Chairman of the Board
Alfredo Messina Deputy Chairman of the Board
Massimo Antonio Doris Executive Deputy Chairman
Ennio Doris Chief Executive Officer
Luigi Berlusconi Director
Pasquale Cannatelli Director
Maurizio Carfagna Director
Edoardo Lombardi Director
Mario Molteni Director
Danilo Pellegrino Director
Angelo Renoldi Director
Paolo Sciumè Director
Maria Alessandra Zunino De Pignier Director
BOARD OF STATUTORY AUDITORS
Ezio Simonelli Chairman
Riccardo Perotta Standing Auditor
Francesco Vittadini Standing Auditor
Ferdinando Gatti Alternate Auditor
Antonio Marchesi Alternate Auditor
BOARD SECRETARY
Luca Maria Rovere
INDEPENDENT AUDITORS
Deloitte & Touche S.p.A.
OFFICER RESPONSIBLE FOR PREPARING ACCOUNTING AND FINANCIAL REPORTING DOCUMENTS
Luigi Del Fabbro
4
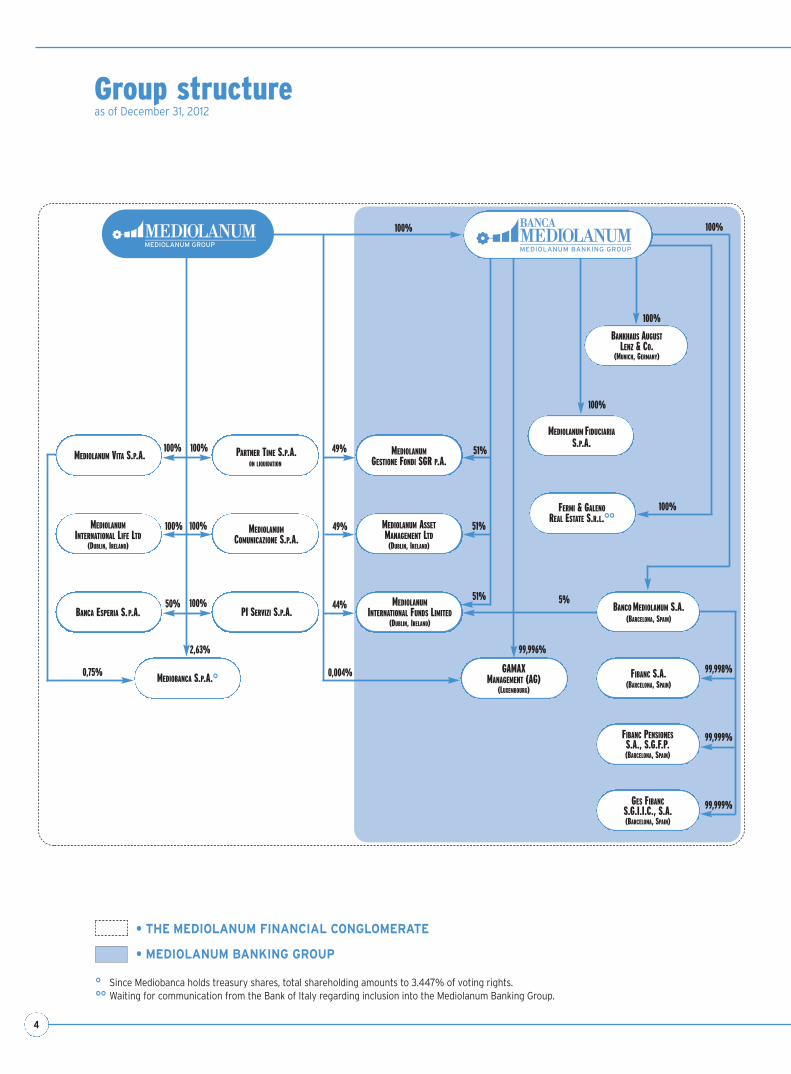
Group structureas of December 31, 2012
BANCA ESPERIA S.P.A.
MEDIOBANCA S.P.A.°GAMAX
MANAGEMENT (AG)(LUXEMBOURG)
49% 51%
MEDIOLANUMGESTIONE FONDI SGR P.A.
MEDIOLANUMINTERNATIONAL LIFE LTD
(DUBLIN, IRELAND)
PI SERVIZI S.P.A.
MEDIOLANUM ASSETMANAGEMENT LTD
(DUBLIN, IRELAND)
PARTNER TIME S.P.A.ON LIQUIDATION
MEDIOLANUMCOMUNICAZIONE S.P.A.
100%
100%
100%
99,998%
99,999%
49%
44%
0,004%
51%
51%
100%
50%
2,63%
0,75%
99,996%
100%
100% 100%
100%
FIBANC S.A. (BARCELONA, SPAIN)
BANKHAUS AUGUSTLENZ & CO.
(MUNICH, GERMANY)
5%MEDIOLANUMINTERNATIONAL FUNDS LIMITED
(DUBLIN, IRELAND)
FIBANC PENSIONESS.A., S.G.F.P.(BARCELONA, SPAIN)
99,999%GES FIBANCS.G.I.I.C., S.A.(BARCELONA, SPAIN)
MEDIOLANUM FIDUCIARIAS.P.A.
100%
MEDIOLANUM VITA S.P.A.
BANCO MEDIOLANUM S.A. (BARCELONA, SPAIN)
° Since Mediobanca holds treasury shares, total shareholding amounts to 3.447% of voting rights.°° Waiting for communication from the Bank of Italy regarding inclusion into the Mediolanum Banking Group.
• THE MEDIOLANUM FINANCIAL CONGLOMERATE
• MEDIOLANUM BANKING GROUP
FERMI & GALENOREAL ESTATE S.R.L.°°
100%

5
Mediolanum Group’s Financial Highlights
€/million Dec. 31, 2012 Dec. 31, 2011 Change %
Assets under management and administration (*) 51,576.9 46,206.8 12%
Net inflows of which Banca Mediolanumof which Banca Esperia
1,806.6)2,258.3)(620.5)
2,727.62,280.0
301.3
-34%-1%
ns
Profit before tax 500.6 84.2 494%
Income Tax (149.6) (17.0) 782%
Net profit of which nonrecurring items (after tax)
351.0-82.8
67.3-125.9
422%-34%
Net profit excluding nonrecurring items 433.8 193.2 125%
€ Dec. 31, 2012 Dec. 31, 2011 Change %
Earnings per share – on continuing operations 0.591 0.263 124%
Earnings per share – total 0.478 0.092 421%
Diluted earnings per share (°) 0.465 0.091 410%
(*) The figures relate to retail customers only.(°) Net earnings attributable to holders of ordinary shares divided by the weighted average number of ordinary shares
in issue.

ConsolidatedAnnualFinancialStatements
2012
8
CONSOLIDATED ANNUALFINANCIAL STATEMENTS
2012
Dear Shareholder,
For financial year 2012 the Mediolanum Group reported net profit of €351 million up €283.7 million (422%)
from €67.3 million in the prior year.
The bottom line benefitted from growth in recurring revenue items, especially net interest income up €83.8 mil-
lion (36%) and management fees up €54.4 million (13%), but also from the contribution of performance fees
up €79.4 million and net income on investments at fair value up €183.5 million. Nonrecurring items gave a
negative contribution of €82.8 million, made up of the €62.7 million impairment on the stake in Mediobanca
and the €20.1 million impairment of CGU Spain’s goodwill. In the prior year, the Group had recognised a neg-
ative contribution from nonrecurring items aggregating to €125.9 million, namely an impairment charge on
Greek sovereign debt holdings of €84.8 million (after tax) and impairment of the investment in Mediobanca
amounting to €41.1 million.
Excluding the non-recurring items above, net profit was €433.8 million versus €193.2 million in 2011.
Mediolanum Group’s total assets under management and administration aggregated to €51,576.9 million up 12%
over the 2011 year end balance of €46,206.8 million.
Net inflows for the year amounted to €1,806.6 million versus €2,727.6 million at the end of the prior year.
Banca Mediolanum posted net inflows of €2,258.3 million, essentially in line with the balance of €2,280.0
million recorded in the prior year. Specifically, net inflows into asset management products jumped from
€731.8 million in 2011 to €1,552.9 million at year end 2012, driven in particular by net inflows into mutual
funds amounting to €1,352.2 million (vs. €590.3 million at December 31, 2011) and benefitting also from the
contribution of third-party structured bonds that recorded net inflows of €200.7 million (vs. €141.5 million
at year end 2011).
Regarding assets under administration, the positive contribution of the €2,134 million net inflows into current
accounts and deposit accounts was offset in part by the €1,070.8 million net outflows relating to the policy
associated with the Freedom bank account (net outflows of €521.5 million at year end 2011). Total net inflows
into administered assets came in at €705.5 million down 54% over the prior year (€1,548.2 million).
According to information published in the financial newspaper Il Sole 24 Ore last February 2, with €2.3 billion net
inflows in the year 2012 Banca Mediolanum still ranked first among top Italian sales networks.
Data relating to net inflows into mutual funds released by Assogestioni show that in 2012 Banca Mediolanum
posted net inflows of €2.1 billion, more than the about €1.7 billion net inflows recorded by the whole domestic
industry.
Directors’ Report

9
DIRECTORS’REPORT
The Assogestioni ranking of top asset managers in terms of managed assets volumes shows that in 2012 the
Mediolanum Group was in sixth place versus fourth place in the prior two years, notably its market share grew from
4.90% in December 2011 to 4.93% at the end of the year under review.
The macroeconomic environment
In 2012, the actions taken to deal with the financial crisis in the Eurozone significantly improved investor senti-
ment.
In the early part of the year the conventional and non-standard measures deployed by the European Central Bank
(ECB) – in particular the two Long-Term Refinancing Operations (LTROs) of December 21, 2011 and February 29,
2012 whereby the ECB injected €489.2 billion and €529.5 billion, respectively, into the market – brought about
improved market liquidity, reduced yields on European peripheral government bonds and positive stock market per-
formance. The renewed turbulence on financial markets from March to June prompted EU leaders to take decisions
regarding the European Stability Mechanism (ESM) and the European Financial Stability Facility (EFSF) at the
European Council meeting of June 28-29, 2012.
Over the summer investor confidence improved after ECB President Mario Draghi provided further assurances and
the German Constitutional Court gave the green light to the ratification of the ESM. In the final months of 2012,
uncertainty about the timing and the procedures for the activation of the ECB government bond purchase pro-
gramme through Outright Monetary Transactions (OMT), emerging signs of political and social instability in periph-
eral countries of the Eurozone, concerns about global economic growth and the possible impact of the fiscal cliff
(the combination of spending cuts and tax increases following the expiration of Bush-era tax cuts) on US growth
brought about some market volatility.
The victory by the pro-Euro conservative party Nea Dimokratia at the Greek elections of last June 15 put an end
to the political and financial stalemate resulting from the previous elections of May 6.
In December 2012, the Euro-group finally reached an agreement on the restructuring of the Greek debt releasing
€43.7 billion to Greece. Socialist Hollande’s victory over incumbent Sarkozy in France’s presidential elections held
in May contributed to a shift in the Eurozone political balance.
Outside Europe, in November 2012, President Obama won the elections for a second mandate, while in Japan in
December 2012 the liberal-democrats returned to power with Abe as Prime Minister. In the final part of the year,
the difficulties in reaching a political agreement to avoid the fiscal cliff in the US and the ensuing concerns about
its impact on both US and global growth brought about market volatility.
Stats confirm growth has slowed down in the Eurozone, while the US has powered ahead. In the third quarter of
2012, GDP expanded at 3.1% (annualised rate) in the US and shrank by 0.1% (non annualised) in the Eurozone,
confirming again the lag between these two regions. Specifically, GDP grew in Germany (up 0.2%) and France (up
0.1%), while it shrank in Spain (down 0.3%) and Italy (down 0.2%). Eurozone’s sluggishness in 2012 has been
reflected in the Purchasing Managers’ Indices (PMI) indicating the lack of a sustainable recovery in the manufac-
turing and services sectors. Conversely, in the US the readings of Institute for Supply Management (ISM) indices
for both the manufacturing sector and services stayed above 50% (the threshold signalling that more companies
are expanding instead of shrinking).
Both in the US and in the Eurozone, unemployment continues to be a major concern as it weighs on consumer
confidence and demand for goods and services. In December 2012, the unemployment rate in the US was 7.8%

10
CONSOLIDATED ANNUALFINANCIAL STATEMENTS
2012
versus 8.5% in the prior year. In 2012, the readings of the Conference Board Consumer Confidence Index (CCI)
and the University of Michigan Consumer Sentiment Index (MCSI) remained far from the highs recorded in the
past.
In December 2012, in the Eurozone, the unemployment rate was 11.7% versus 10.7% at year end 2011.
Specifically, the joblessness rate was 11.3% in Italy versus 9.5% in the prior year, 6.9% in Germany versus 6.8%
in the prior year, and 26% in Spain versus 18.8% in the prior year.
In the current economic cycle inflation continues to be subdued.
In December, the CPI (annualised) was 2.2% versus 2.7% at year end 2011 in the Eurozone, and 1.7% versus
3.0% at year end 2011 in the US. Excluding food and energy, the CPI was 1.5% (1.6% in the prior year) and
1.9% (2.2% in the prior year), respectively. In the same month, the PPI (annualised) was 2.2% in the Eurozone
and 1.3% in the US. In the UK the inflation rate fell from 4.2% in the prior year to 2.7%.
Financial Markets
During the year, the yield spreads between Italian and German government bonds declined, specifically from 528
bps at December 31, 2011 to 318 bps at year end 2012, with a peak last July 24 of 536 bps on 10-year notes
and from 497 bps at December 31, 2011 to 200 bps at year end 2012, with a peak last July 24 of 512 bps on
2-year notes.
Yields on 2-year Italian treasuries fell from 5.12% at the start of the year to 1.99% at December 31, 2012;
while yields on 2-year Italian treasuries dropped from 7.11% at the start of the year to 4.50% on December
31, 2012. Like in 2011, benefitting from purchases made by investors looking for low-risk assets, yields on
German government bonds declined across all maturities (from 0.14% to a negative return of -0.015% on 2-
yr notes; and from 1.83% to 1.32% on 10-yr notes). Yields on US treasuries remained in line with the low
levels seen at year end 2011 (moving from 0.24% to 0.4% on 2-yr notes; from 1.88% to 1.76% on 10-yr
notes).
Emerging markets and corporate bonds continued to benefit from uncertainty and volatility in peripheral
Eurozone government bond markets with ensuing declines in yields and yield spreads.
In the fourth quarter of 2012 the protracted negotiations to reach a political agreement and avoid the fiscal
cliff in the US and concerns about the impact of the fiscal cliff on US and global economic growth led the US
stock market to underperform (S&P 500 down 1%) European bourses (STOXX Europe 600 up 4.2%).
In 2012, global equity markets were up 16.6% (MSCI World in US dollars). In the US, both the S&P500 and
Nasdaq Composite recorded good performance, up 13.4% and up 15.9%, respectively. In Europe, stock mar-
kets fared well, too, on average (STOXX Europe 600 up 14.4%). Specifically, the Italian (FTSE MIB up 7.8%)
and Spanish (IBEX 35 down 4.7%) markets underperformed the German (DAX up 29.1%), French (CAC40
up 15.2%) and Swiss (SMI up 14.9%) markets. Stock market indices were driven north by cyclical stocks and
financials. Emerging markets rose 18.5% (MSCI EM in USD).
The performance of the Euro against the US dollar mirrored the developments of the European financial cri-
sis. Specifically, the Euro experienced weakness in the early months of 2012, to strengthen later in the year fol-
lowing the reassuring statements made by ECB President Mario Draghi in July 2012, moving from 1.30 at the
beginning of the year to 1.32 at year end against the US dollar, with a low of 1.21 in July. The Euro had simi-
lar movements in its foreign exchange value also against the UK sterling, namely from 0.83 in January to 0.78
in July and 0.81 in December. The performance of the European single currency against the Japanese yen and
11
DIRECTORS’REPORT
the Swiss franc reflected the actions taken by the Central Banks of those countries. In the second part of the
year the Bank of Japan set inflation targets at a level that facilitated its currency devaluation via monetary
easing: the Euro strengthened from 99.66 in January to 114.46 in December against the Japanese yen. The
Swiss National Bank intervened in the currency market throughout 2012 to avoid appreciation of the Swiss
franc.
In 2012, Brent oil prices remained essentially flat moving from US$107.58 per barrel at the beginning of the
year to US$111.94 per barrel at year end, with high volatility that brought it to a high of US$126.65 on
February 24 and a low of US$88.74 on June 21.
In the year under review, the price of gold confirmed the historic highs seen in prior years moving from
US$1,563.70 per ounce at the beginning of the year to US$1,675.35 per ounce in December 2012.
The Insurance Market
Data released by ANIA, the Association of Italian Insurers, shows that in the year 2012 new business written
(that now includes also additional premium payments under single premium policies) under individual policies
declined 10% over the prior year to €47.7 billion. In 2012, EU companies conducting business in Italy (ANIA
data) posted premiums written of €7.0 billion, in line with the prior year.
Including also these companies, new business written since the beginning of the year aggregated to €54.7 bil-
lion, down 8.8% over the prior year (€60.0 billion in 2011). The decline was largely in class I traditional poli-
cies that were down 15.1% from €41.2 billion in 2011 to €35.0 billion in 2012. New premiums written under
unit-linked and index-linked policies (class III) increased by 13.3% to €11.4 billion at year end 2012 from
€10.1 billion at year end 2011.
The analysis by distribution channel shows that banks and post offices posted a 17.1% decline in new business
written and their market share fell to 64.8%; agents and subsidiary agencies recorded a 8.7% decrease over
the prior year in new life premiums written, and their market share was 16.4%. Conversely, new business writ-
ten through financial advisors was up 26.4% over the prior year, with a market share of 18.5%.
Based on new life business written under both individual and group policies it is possible to estimate direct pre-
miums written at year end 2012. In particular, considering that a portion of premiums written during the year
relates to policies issued in prior years, premiums written should aggregate to about €69.5 billion year, down
6.0% on 2011 when premiums written were €73.9 billion.
The Banking Market
Holdings in life insurance, pension funds and severance funds were up 1.6%, with a weight of 18.0% (17.7%
in the same period of the prior year).
In the first nine months of the year, holdings in mutual funds were up 9.6% and accounted for 7.6% (vs. 6.9%
for the same period of the prior year) of total financial assets of households. Conversely, holdings in equities
were down 10.9% with a weight of 17.6% (vs. 19.7% in the third quarter of 2011). Bond holdings (govern-
ment and corporate bonds) declined too, namely by 1.5%, yet holdings in government bonds were up 14.7%.
Bond holdings accounted for 19.1% (19.3% in the prior year) of total financial assets of households.
During 2012, in Italy banking funding slightly accelerated. Specifically, at year end 2012, Italian banks record-

12
CONSOLIDATED ANNUALFINANCIAL STATEMENTS
2012
ed inflows into euro-denominated current accounts, term deposits net of receivables sales, deposits repayable
upon notice, and repurchase agreements (deposits net of operations with central counterparties) and bonds (net
of those repurchased by banks) held by resident customers aggregating to €1,761.5 billion, up 1.6% (vs. 0.9%
at the end of December 2011) and an increase in the stock of funding of nearly €28 billion. The analysis of the
various components shows deposits of resident customers (net of operations with central counterparties and
term deposits connected with sales of receivables) were up 6.2% (down 0.4% in December 2011), the highest
level since 2008. Bond holdings were down 6.8% in the year (up 3.2% in December 2011).
At year end 2012, lending (to the private sector and public administrations net of repurchase agreements with
central counterparties) was down 1.1% year on year (up 2.4% at year end 2011) to €1,928 billion. Loans to pri-
vate sector Italian residents1 were slightly down too, down 1.8% (vs. up 2.9% at year end 2011) to €1,660.2 bil-
lion. Loans to households and non-financial companies amounted to about €1,475 billion, down 2.5% year on year
(up 3.6% at year end 2011; Euro zone average: down 1.7%).
Maturity analysis shows that short-term lending (due within one year) was down 1.7% (up 5.5% in the prior year)
and medium/long-term lending (due after more than one year) was down 2.8% (up 3% at year end 2011).
Credit facilities to households slowed down too, 1.4% decline versus 4.4.% growth at year end 2011 (when adjust-
ed for securitisation2, 0.5% decline in 2012 vs. 3.4% growth in 2011).
Consumer credit experienced high volatility and fell by about 7% in 2012 (2.7% growth in 2011). In the Eurozone
consumer credit shrank by 3.9%. In the past decade the share of Italy’s consumer credit in the Eurozone market
grew from 4.2% at year end 2000 to 9.9% in December 2012.
Italian banks’ share of the European home loans market grew, too, from 5.2% in December 2000 to 9.5% in
December 2012. During 2012 home lending shrank 0.6% compared to 4.4% growth (Eurozone average: 1.2%
growth).
In December 2012, gross non-performing loans aggregated to €125 billion, increasing by €17.8 billion over
year end 2011 (up about 16.6% year on year). The ratio of gross non-performing loans to total loans was 6.3%
at year end 2012 versus 5.4% at the end of the prior year. Net non-performing loans amounted to €64.3 bil-
lion, some €2.1 billion more than in the prior month and nearly €12.9 billion more than in the prior year (25%
increase year on year). The ratio of net non-performing loans to total loans was 3.33% (vs. 2.69% at year end
2011).
At December 2012, the securities portfolio of Italian banks grew to €874 billion.
Interest applied to bank deposits of households and non-financial companies slightly increased, namely from 1.08%
at year end 2011 to 1.25% at year end 2012. At the end of December 2012, average interest on euro-denominat-
ed bank deposits, bonds and repurchase agreements held by households and non-financial companies was 2.08% in
December 2012 versus 2% at the end of the prior year. In the year under review interest rates on repurchase agree-
ments increased too, from 2.77% in December 2011 to 3.03% in December 2012, while yields on bank bonds
remained essentially flat (3.37% vs. 3.36%).
In 2012, the weighted average rate applied to total loans extended to households and non-financial companies cal-
culated by the Italian Bankers’ Association slightly declined, consistently with conditions on the interbank market,
from 4.23% in December 2011 to 3.78% in December 2012. At year end 2012, also interest on active bank
1 Other Italian residents: non-financial companies, consumer households, family businesses, nonprofits, insurers, pension funds, other financial institutionsnet of repos with central counterparties.2 Growth rates calculated including loans not carried on the statement of financial position of banks because they were securitised and net of changes notconnected with transactions (e.g. exchange rate movements, value adjustments or reclassifications).

13
DIRECTORS’REPORT
accounts and revolving loans to households and non-financial companies fell from 5.56% in December 2011 to
5.48% in December 2012.
Interest rates applied to new transactions were down to particularly low levels: in December 2012 the rate
applied to euro-denominated loans extended to non-financial companies was 3.65% (4.18% in December
2011), interest on euro-denominated home loans to households (average for both fixed and floating-rate loans,
considering all the various types of loans) was 3.69% (4.03% in December 2011). In the last month of 2012
fixed-rate lending accounted for 22.8% (vs. 37.5% in December 2012). The average spread between lending
and funding interest rates applied to households and non-financial companies declined to 187 bps, down 30 bps
year on year. Before the beginning of the financial crisis the average spread between lending and funding inter-
est rates exceeded 300 bps.
Mediolanum Group’s performance
In 2012, new product launches regarded mostly the asset administration segment.
In January 2012, as a further distinguishing competitive trait, quarterly interest payments (in the form of quarter-
ly interest advances) were introduced for the InMediolanum deposit account.
Beginning from March 2012 said deposit accounts have been subject to the 0.1% stamp duty (0.15% in 2013)
introduced by Prime Minister Monti under the so-called ‘Save Italy’ Decree.
Since June 2012, to incentivise growth of customers acquired through the deposit account, Banca Mediolanum cus-
tomers who hold a deposit account have been offered stepping up interest rates on balances locked up in their
Freedom Più accounts. Freedom Più accounts are subject to the stamp duty within the limit set for current accounts
(i.e. max. €34.20).
At year end 2012 there were about 124,100 InMediolanum accounts, the deposit account launched in May 2011.
Of these, some 39,600 accounts (32%) were opened by new customers. New deposit accounts opened in the year
2012 were 65,800. Of these 24,200 accounts (37%) were opened by new customers. At year end 2012, balances
on InMediolanum deposit accounts aggregated to about €2,350 million.
On March 10, 2012 a new version of the Mediolanum Freedom bank account named ‘Mediolanum Freedom Più’
was introduced. This new product is no longer associated with the Mediolanum Plus policy of Mediolanum Vita
S.p.A. and pays interest on account balances above a minimum threshold up to a predetermined ceiling. The
Mediolanum Freedom Più account has largely the same features as Mediolanum Freedom. What is different is that
the interest paid on balances above the minimum threshold is no longer linked to the returns earned on the sepa-
rately managed Freedom Fund and interest is paid on a quarterly basis.
In September 2012 a new bank account called Freedom One was launched. At December 31, 2012 there were some
45,000 Freedom One accounts, accounting for about 44% of new accounts opened.
At year end 2012, balances on Freedom One accounts aggregated to €203 million.
14
CONSOLIDATED ANNUALFINANCIAL STATEMENTS
2012
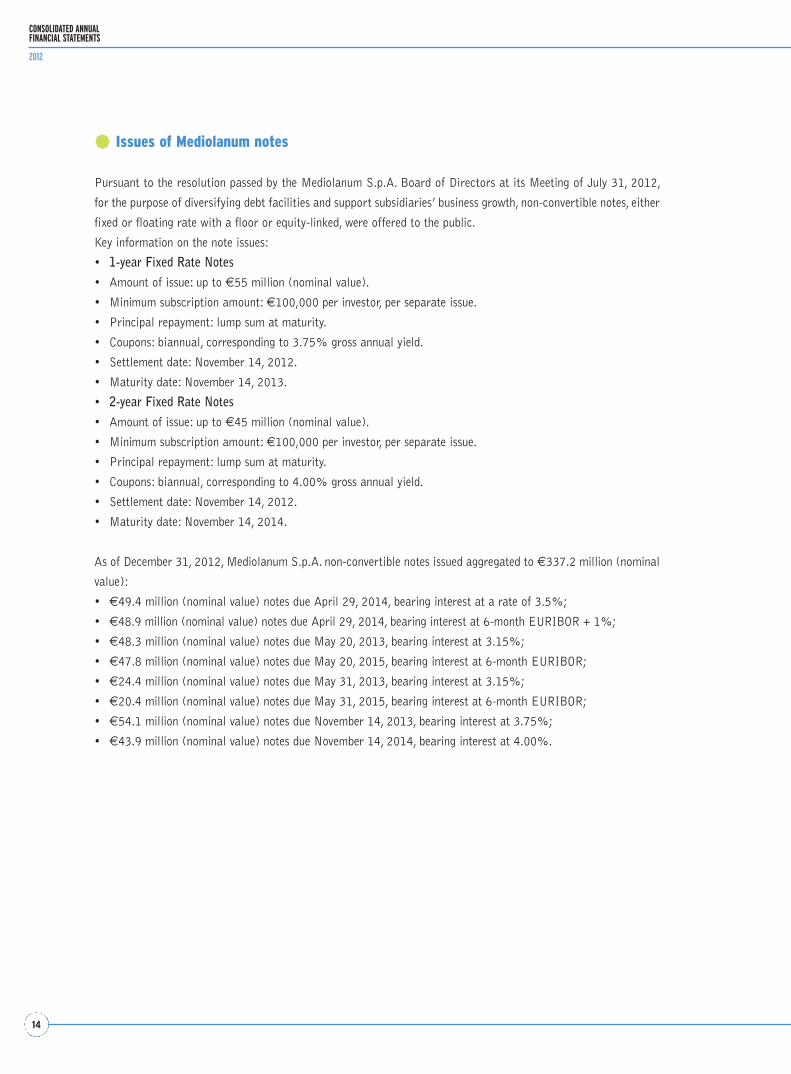
Issues of Mediolanum notes
Pursuant to the resolution passed by the Mediolanum S.p.A. Board of Directors at its Meeting of July 31, 2012,
for the purpose of diversifying debt facilities and support subsidiaries’ business growth, non-convertible notes, either
fixed or floating rate with a floor or equity-linked, were offered to the public.
Key information on the note issues:
• 1-year Fixed Rate Notes• Amount of issue: up to €55 million (nominal value).
• Minimum subscription amount: €100,000 per investor, per separate issue.
• Principal repayment: lump sum at maturity.
• Coupons: biannual, corresponding to 3.75% gross annual yield.
• Settlement date: November 14, 2012.
• Maturity date: November 14, 2013.
• 2-year Fixed Rate Notes• Amount of issue: up to €45 million (nominal value).
• Minimum subscription amount: €100,000 per investor, per separate issue.
• Principal repayment: lump sum at maturity.
• Coupons: biannual, corresponding to 4.00% gross annual yield.
• Settlement date: November 14, 2012.
• Maturity date: November 14, 2014.
As of December 31, 2012, Mediolanum S.p.A. non-convertible notes issued aggregated to €337.2 million (nominal
value):
• €49.4 million (nominal value) notes due April 29, 2014, bearing interest at a rate of 3.5%;
• €48.9 million (nominal value) notes due April 29, 2014, bearing interest at 6-month EURIBOR + 1%;
• €48.3 million (nominal value) notes due May 20, 2013, bearing interest at 3.15%;
• €47.8 million (nominal value) notes due May 20, 2015, bearing interest at 6-month EURIBOR;
• €24.4 million (nominal value) notes due May 31, 2013, bearing interest at 3.15%;
• €20.4 million (nominal value) notes due May 31, 2015, bearing interest at 6-month EURIBOR;
• €54.1 million (nominal value) notes due November 14, 2013, bearing interest at 3.75%;
• €43.9 million (nominal value) notes due November 14, 2014, bearing interest at 4.00%.

15
DIRECTORS’REPORT
Consolidated Inflows, Assets under Management and Assets under Administration
Net Inflows
€/million Dec. 31, 2012 Dec. 31, 2011 Change
ITALY
Life insurance products (991.2) (813.9) 22%
Asset Management products 2,343.3 1,404.2 67%
Total managed assets inflows 1,352.2 590.3 129%
Third-party structured bonds 200.7 141.5 42%
Total managed assets + third-party structured bonds 1,552.9 731.8 112%
‘Freedom’ Life Policies (1,070.8) (521.5) 105%
Administered assets 1,776.3 2,069.6 (14%)
Total administered assets including ‘Freedom’ policies 705.5 1,548.2 (54%)
BANCA MEDIOLANUM 2,258.3 2,280.0 (1%)
BANCA ESPERIA GROUP (*) (620.5) 301.3 ns
Total ITALY 1,637.8 2,581.3 (37%)
SPAIN 114.3 94.6 21%
GERMANY 54.5 51.7 5%
TOTAL FOREIGN MARKETS 168.8 146.3 15%
TOTAL NET INFLOWS 1,806.6 2,727.6 (34%)
(*) The figures relating to Banca Esperia are stated on a pro-rata basis according to the stake held by the Mediolanum Group in that entity, i.e. 50%.
Assets under Management and under Administration(*)
€/million Dec. 31, 2012 Dec. 31, 2011 Change
ITALY
Life Products 13,795.7 13,678.5 1%
‘Freedom’ Life Policies 3,433.0 4,503.8 (24%)
Asset Management products 23,384.4 19,725.3 19%
Banking products 11,336.5 8,925.6 27%
Consolidation adjustments (9,515.3) (8,966.0) 6%
BANCA MEDIOLANUM 42,434.3 37,867.2 12%
BANCA ESPERIA GROUP (**) 6,900.1 6,408.5 8%
Total ITALY 49,334.4 44,275.7 11%
SPAIN 1,799.6 1,581.2 14%
GERMANY 442.9 349.9 27%
TOTAL FOREIGN MARKETS 2,242.5 1,931.1 16%
TOTAL ASSETS UNDER MANAGEMENT & ADMINISTRATION 51,576.9 46,206.8 12%
(*) The figures relate to retail customers only. (**) The figures relating to Banca Esperia are stated on a pro-rata basis according to the stake held by the Mediolanum Group in that entity, i.e. 50%.
16
CONSOLIDATED ANNUALFINANCIAL STATEMENTS
2012
At December 31, 2012, total assets under management and administration amounted to €51,576.9 million up 12%
from €46,206.8 million at December 31, 2011.
The analysis of consolidated inflows, assets under management and under administration by operating segment is
set out below.
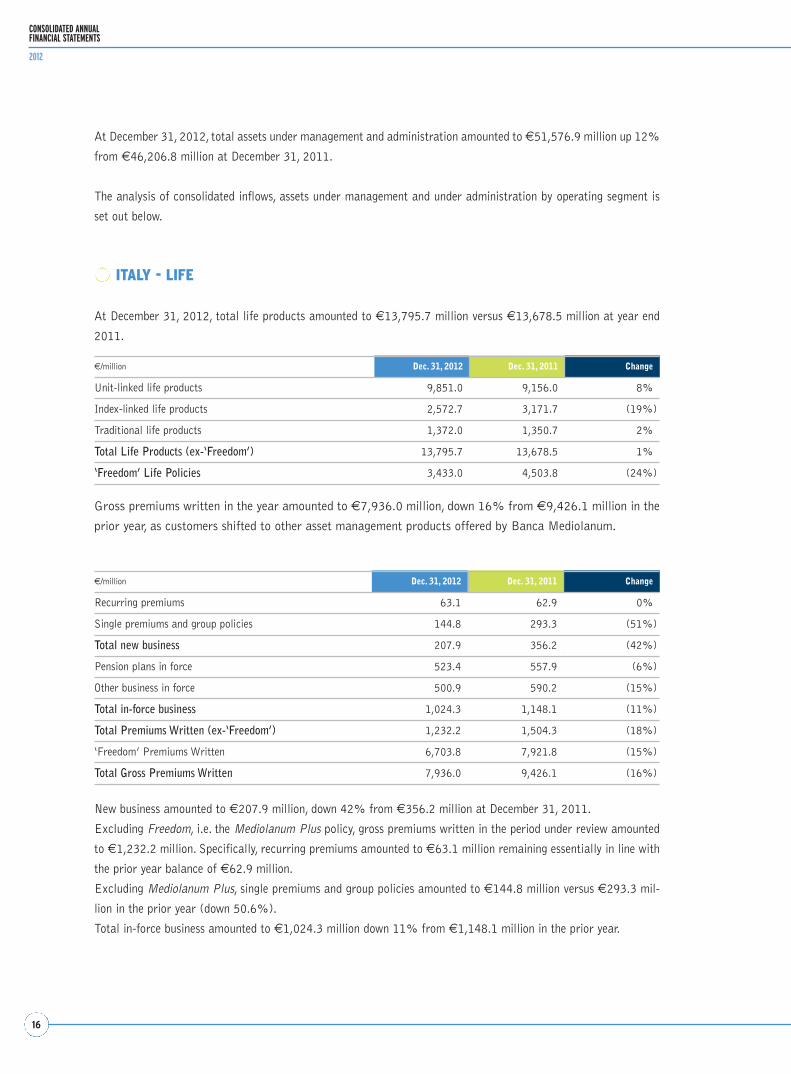
ITALY - LIFE
At December 31, 2012, total life products amounted to €13,795.7 million versus €13,678.5 million at year end
2011.
€/million Dec. 31, 2012 Dec. 31, 2011 Change
Unit-linked life products 9,851.0 9,156.0 8%
Index-linked life products 2,572.7 3,171.7 (19%)
Traditional life products 1,372.0 1,350.7 2%
Total Life Products (ex-‘Freedom’) 13,795.7 13,678.5 1%
‘Freedom’ Life Policies 3,433.0 4,503.8 (24%)
Gross premiums written in the year amounted to €7,936.0 million, down 16% from €9,426.1 million in the
prior year, as customers shifted to other asset management products offered by Banca Mediolanum.
€/million Dec. 31, 2012 Dec. 31, 2011 Change
Recurring premiums 63.1 62.9 0%
Single premiums and group policies 144.8 293.3 (51%)
Total new business 207.9 356.2 (42%)
Pension plans in force 523.4 557.9 (6%)
Other business in force 500.9 590.2 (15%)
Total in-force business 1,024.3 1,148.1 (11%)
Total Premiums Written (ex-‘Freedom’) 1,232.2 1,504.3 (18%)
‘Freedom’ Premiums Written 6,703.8 7,921.8 (15%)
Total Gross Premiums Written 7,936.0 9,426.1 (16%)
New business amounted to €207.9 million, down 42% from €356.2 million at December 31, 2011.
Excluding Freedom, i.e. the Mediolanum Plus policy, gross premiums written in the period under review amounted
to €1,232.2 million. Specifically, recurring premiums amounted to €63.1 million remaining essentially in line with
the prior year balance of €62.9 million.
Excluding Mediolanum Plus, single premiums and group policies amounted to €144.8 million versus €293.3 mil-
lion in the prior year (down 50.6%).
Total in-force business amounted to €1,024.3 million down 11% from €1,148.1 million in the prior year.

17
DIRECTORS’REPORT
Excluding Freedom, amounts paid were down 4% from €2,318.2 million in 2011 to €2,222.8 million at year end
2012.
€/million Dec. 31, 2012 Dec. 31, 2011 Change
Claims 64.8 69.4 (7%)
Coupons 64.5 84.1 (23%)
Maturities 1,095.8 1,248.1 (12%)
Surrenders 997.6 916.6 9%
Amounts paid (ex-‘Freedom’) 2,222.8 2,318.2 (4%)
Amounts paid under ‘Freedom’ contracts 7,898.0 8,554.1 (8%)
€/million Dec. 31, 2012 Dec. 31, 2011 Change
Class I 3.4 5.2 (35%)
Class III 61.4 64.2 (4%)
Total (ex-‘Freedom’) 64.8 69.4 (7%)
€/million Dec. 31, 2012 Dec. 31, 2011 Change
‘Best brands’ funds of funds 7,676.9 5,398.3 42%
‘Portfolio’ funds of funds 578.5 680.1 (15%)
‘Challenge’ funds 11,980.7 11,221.2 7%
Funds of hedge funds 193.8 269.0 (28%)
Other Italy-based mutual funds 2,839.6 2,084.5 36%
Real estate funds 436.6 444.4 (2%)
Other internationally-based mutual funds & managed accounts 321.2 306.2 5%
Duplication adjustments (642.9) (678.3) (5%)
Total asset management products 23,384.4 19,725.3 19%
of which (*):
Equity 56% 61% (5%)
Bond 36% 28% 8%
Money market 2% 4% (2%)
Other 6% 7% (1%)
ITALY - ASSET MANAGEMENT
The analysis of assets under management in the retail segment is set out below.
The analysis of inflows into asset management products, in the retail segment, on a management basis, is set out in
the table below.

18
CONSOLIDATED ANNUALFINANCIAL STATEMENTS
2012
Net inflows
€/million Dec. 31, 2012 Dec. 31, 2011 Change
‘Best brands’ funds of funds 1,885.7 1,703.7 11%
‘Challenge’ funds (8.1) (230.4) (97%)
Other Italy-based mutual funds 569.2 37.1 ns
Real estate funds 0.6 5.0 (88%)
Other funds and managed accounts (104.2) (111.2) (6%)
Total asset management products 2,343.3 1,404.2 67%
Net inflows for the year under review were up 67% to €2,343.3 million compared to the prior year’s balance of
€1,404.2 million.
Gross inflows
€/million Dec. 31, 2012 Dec. 31, 2011 Change
‘Best brands’ funds of funds 3,659.0 2,920.0 25%
‘Challenge’ funds 1,018.9 837.6 22%
Other Italy-based mutual funds 1,067.9 606.3 76%
Real estate funds 18.2 31.5 (42%)
Other funds and managed accounts 27.7 48.5 (43%)
Total asset management products 5,791.7 4,444.0 30%
In the period under review gross inflows were up 30% to €5,791.7 million compared to €4,444.0 million in the
prior year.
ITALY - BANKING
At December 31, 2012, the Group reported net inflows into administered assets of €1,776.3 million versus
€2,069.6 million in 2011.
The analysis of assets under administration, on a management basis, is set out in the table below.
€/million Dec. 31, 2012 Dec. 31, 2011 Change
Customer Deposits 7,623.1 5,489.2 39%
Banca Mediolanum Bonds 409.7 487.6 (16%)
Third-party Structured Bonds 1,216.1 805.9 51%
Third-party Structured Bonds 2,074.8 1,931.7 7%
Repurchase agreements 12.9 211.2 (94%)
Total Assets under Administration 11,336.5 8,925.6 27%
At December 31, 2012, there were 707,609 bank accounts (vs. 627,365 at year end 2011) and 801,641 account
holders.
At year end 2012, the total number of customers – either bank account holders or investors in financial/insurance
products sold by the Mediolanum Group – was 1,040,448 (vs. 1,066,423 in the prior year). Of these 879,200 were
primary account holders.

19
DIRECTORS’REPORT
SPAIN
€/million Dec. 31, 2012 Dec. 31, 2011 Change
Assets under Management & Administration 1,799.6 1,581.2 14%
Assets under Management 1,181.2 986.8 20%
Assets under Administration 618.4 594.4 4%
Gross Inflows AuM 285.2 285.7 0%
Net Inflows 114.3 94.6 21%
Assets under Management 88.2 98.3 (10%)
Assets under Administration 26.2 (3.7) ns
€/million Dec. 31, 2012 Dec. 31, 2011 Change
Assets under Management & Administration 442.9 349.9 27%
Assets under Management 356.4 291.5 22%
Assets under Administration 86.5 58.4 48%
Gross Inflows AuM 90.8 66.9 36%
Net Inflows 54.5 51.7 5%
Assets under Management 26.3 18.4 43%
Assets under Administration 28.2 33.3 (15%)
Assets under Management and under Administration were up 27% from €349.9 million at year end 2011 to
€442.9 million at the end of the period under review.
Net inflows amounted to €54.5 million versus €51.7 million at the end of the prior year. Specifically, net inflows
into asset management products were up 43% over the prior year to €26.3 million.
At December 31, 2012 the number of customers was up 23% to 4,533 from 3,677 at year end 2011.
The Sales Networks
Number Dec. 31, 2012 Dec. 31, 2011 Change
Licensed financial advisors 4,315 4,507 (4%)
Non-licensed advisors / agents - 1 (100%)
BANCA MEDIOLANUM 4,315 4,508 (4%)
SPAIN 590 549 7%
GERMANY 46 42 10%
Total 4,951 5,099 (3%)
At year end 2012 the Banca Mediolanum sales network consisted of 4,951 financial advisors (5,099 at year end
2011).
Assets under Management and under Administration amounted to €1,799.6 million, up 14% from €1,581.2 mil-
lion at year end 2011.
Net inflows for the period amounted to €114.3 million versus €94.6 million at the end of the prior year.
At December 31, 2012, Fibanc customers were 78,856 versus 75,837 at December 31, 2011.
GERMANY

20
CONSOLIDATED ANNUALFINANCIAL STATEMENTS
2012
Reclassified Consolidated Income Statement at December 31, 2012
€/’000 Dec. 31, 2012 Dec. 31, 2011
Net premiums written 8,051,307 9,543,417
Amounts paid and change in technical reserves (8,018,057) (9,505,033)
Net life insurance revenues (ex-commissions) 33,250 38,384
Entry fees 115,640 98,475
Management fees 472,238 417,796
Performance fees 171,937 92,496
Banking services fees 95,741 111,154
Other fees 38,462 33,283
Total commission income 894,018 753,204
Net interest income 314,604 230,749
Net income (loss) on investments at fair value 118,096 (65,688)
Net financial income 432,701 165,061
Equity contribution (55,220) (34,582)
Realised gains (losses) on other investments 27,809 7,300
Impairment of loans (9,091) (6,172)
Impairment of other investments (22,599) (125,462)
Net income (loss) on other investments (3,881) (124,334)
Other revenues 26,435 22,252
TOTAL REVENUES 1,327,303 819,985
Acquisition costs & Sales network commission expenses (364,040) (303,916)
Other commission expenses (41,201) (50,120)
General and Administrative expenses (381,118) (352,045)
Amortisation and depreciation (14,259) (17,091)
Net provisions for risks (26,102) (12,594)
TOTAL COSTS (826,720) (735,766)
PROFIT (LOSS) BEFORE TAX 500,584 84,219
Income tax (149,561) (16,952)
NET PROFIT (LOSS) FOR THE PERIOD 351,023 67,267
of which nonrecurring items (after tax) (82,804) (125,907)
NET PROFIT ex-nonrecurring items 433,827 193,174

21
DIRECTORS’REPORT
The reclassified consolidated income statement above highlights the effects of the nonrecurring items set out in the
table below.
€/million Dec. 31, 2012 Dec. 31, 2011
Impairment of the investment in Mediobanca (62.7) (41.1)
Impairment of CGU Spain’s goodwill (20.1) -
Impairment of Greek sovereign debt holdings (after tax) - (84.8)
Total non recurring items (82.8) (125.9)
The non-recurring items highlighted in the reclassified consolidated income statement above for financial year
2012 were the €62.7 million impairment of the stake held in Mediobanca and the €20.1 million impairment
of goodwill relating to CGU Spain. In the prior year the Group had reported a €41.1 million impairment on
the stake in Mediobanca and an €84.8 million impairment on Greek sovereign debt holdings, after tax.
To ensure meaningful comparisons between 2012 and 2011 financial data, prior year’s comparative information
was reclassified, where necessary.
For the year under review net premiums written amounted to €8,051.3 million versus €9,543.4 million in the prior
year (down 16%). The decline was principally driven by reduced inflows into the policy associated with the Freedom
bank account (down €1,218 million).
Amounts paid and change in technical reserves were down 16% over the prior year’s balance of €9,505.0 million
to €8,018.1 million, of which €7,898 million relating to the policies associated with the Freedom bank account
(€8,554 million at December 31, 2011).
Total commission income for the year 2012 amounted to €894.0 million versus €753.2 million in the prior year.
The €140.8 million increase was mainly driven by performance fees (up €79.4 million) and management fees (up
€54.4 million). Banking services fees declined by €15.4 million, especially due to the decrease in fees on placement
of third-party structured bonds.
Net financial income rose from €165.1 million at year end 2011 to €432.7 million at year end 2012. Notably,
there was 36% growth in net interest income largely related to Banca Mediolanum, driven by both asset growth and
bigger interest spreads. Net income on investments at fair value shot up to 118.1 million (up €183.8 million) com-
pared to a net loss of €65.7 million at the end of the prior year.
Equity contribution was negative at €55.2 million, largely driven by the €62.7 million impairment on the stake in
Mediobanca S.p.A., versus a negative balance of €34.6 million at December 31, 2011.
For the period under review net income on other investments recorded a negative balance of €3.9 million versus a
negative balance at year end 2011 of €124.3 million, which had included a €120.6 million impairment on Greek
sovereign debt holdings.
At December 31, 2012, total commission expenses amounted to €405.2 million versus €354 million in the

22
CONSOLIDATED ANNUALFINANCIAL STATEMENTS
2012
prior year. The increase largely reflects greater amounts provided for incentives (€12.7 million) in connection
with sales volume growth and amounts retroceded to the sales network following changes in the compensation
policy.
Excluding acquisition costs & sales network commission expenses, costs aggregated to €421.5 million versus
€381.7 million in the prior year (up €14.4 million). Specifically, general & administrative expenses were up about
€29 million in connection with greater charges relating to staff costs, advertising, advisory fees and IT expenses.
Provisions for risks were up €13.5 million in connection with amounts set aside for legal disputes and support to
customers affected by the earthquake and flooding (€2.3 million). Amortisation & depreciation declined by €2.8
million.
Income tax for the year amounted to €149.6 million versus €17.0 million at year end 2011 (tax rate 29.9%).
The analysis of income statement data by operating segment is set out below.
ITALY - LIFE
€/’000 Dec. 31, 2012 Dec. 31, 2011 Change Change %
Net premiums written 7,922,819 9,400,919 (1,478,100) (16%)
Amounts paid & change in technical reserves (7,908,540) (9,381,508) 1,472,968 (16%)
Net life insurance revenues (ex-commissions) 14,279 19,411 (5,132) (26%)
Total commission income 280,311 254,685 25,626 10%
Net interest income 18,353 34,851 (16,498) (47%)
Net income (loss) on investments at fair value 81,486 (33,002) 114,488 ns
Net financial income 99,839 1,849 97,990 ns
Net income (loss) on other investments 6,966 (35,822) 42,788 ns
Other revenues 11,053 11,392 (339) (3%)
TOTAL REVENUES 412,449 251,515 160,934 64%
Acquisition costs & Sales network commission expenses (94,217) (88,406) (5,811) 7%
Other commission expenses (5,522) (6,356) 834 (13%)
General and Administrative expenses (83,074) (92,082) 9,008 (10%)
Amortisation and depreciation (2,996) (4,505) 1,509 (33%)
Net provisions for risks (3,888) (4,042) 154 (4%)
TOTAL COSTS (189,697) (195,391) 5,694 (3%)
PROFIT BEFORE TAX 222,752 56,124 166,628 297%
In the ‘Italy – Life’ operating segment, profit before tax amounted to €222.8 million, up 297% over the prior year’s
balance of €56.1 million, benefitting from the contribution given by net income on investments at fair value (up
€114.5 million) and total commission income (up €25.6 million). Net income on other investments amounted to
€7.0 million versus a net loss in the prior year when this account had been impacted by impairment of Greek sov-
ereign debt holdings aggregating to €39.3 million. Net interest income was down €16.5 million.

23
DIRECTORS’REPORT
Net life insurance revenues before acquisition costs came in at €14.3 million versus €19.4 million in the prior year.
Total commission income amounted to €280.3 million, up €25.6 million from €254.7 million at year end 2011.
The increase was driven by growth in performance fees earned in the Life segment, up €12.3 million, and in man-
agement fees which were up €13.3 million.
Acquisition costs & sales network commission expenses were up €5.8 million owing to changes in the sales net-
work compensation policy.
Net financial income for the year under review amounted to €99.8 million up €97.9 million compared to €1.9 mil-
lion in the prior year. The notable improvement reflects fair value appreciation in the year, which boosted income on
investments at fair value by €114.5 million, offset in part by reduced net interest income owing to increased expense
for amounts retroceded to policyholders.
Net income on other investments amounted to €7 million versus a loss of €35.8 million at the end of the prior
year when this account had been impacted by a €39.9 million impairment of Greek sovereign debt holdings.
Other expenses amounted to €90 million versus €100.6 million in the prior year, down €10.6 million as customers
shifted to banking and asset management products from life products and this entailed reduced related costs in the
life segment.
ITALY – ASSET MANAGEMENT
€/’000 Dec. 31, 2012 Dec. 31, 2011 Change Change %
Entry fees 110,407 94,461 15,946 17%
Management fees 234,905 195,813 39,092 20%
Performance fees 106,909 41,636 65,273 157%
Other fees 25,234 24,366 868 4%
Total commission income 477,455 356,276 121,179 34%
Net interest income 697 1,240 (543) (44%)
Net income (loss) on investments at fair value 2 15 (13) (87%)
Net financial income 699 1,255 (556) (44%)
Net income (loss) on other investments (593) 317 (910) ns
Other revenues 431 360 71 20%
TOTAL REVENUES 477,992 358,208 119,784 33%
Acquisition costs & Sales network commission expenses (188,231) (146,582) (41,649) 28%
Other commission expenses (11,786) (9,323) (2,463) 26%
General and Administrative expenses (78,983) (69,107) (9,876) 14%
Amortisation and depreciation (2,228) (2,714) 486 (18%)
Net provisions for risks (7,618) (6,695) (923) 14%
TOTAL COSTS (288,846) (234,421) (54,425) 23%
PROFIT BEFORE TAX 189,146 123,787 65,359 53%

24
CONSOLIDATED ANNUALFINANCIAL STATEMENTS
2012
In the ‘Italy – Asset Management’ segment, profit before tax for the year under review amounted to €189.1 mil-
lion climbing 53% from 123.8 million at the end of the prior year.
Total commission income amounted to €477.5 million versus €356.3 million at the end of the prior year. The
€121.2 million increase was driven by performance fees (up €65.3 million) and management fees (up €39.1 mil-
lion) as a result of assets growth in the period.
Costs for the year came in at €288.8 million versus €234.4 million at the end of the prior year, up €54.4 million
principally due to the greater commissions paid out to the sales network as a result of the changes in the sales net-
work compensation policy.
ITALY – BANKING
€/’000 Dec. 31, 2012 Dec. 31, 2011 Change Change %
Banking services fees 81,820 85,506 (3,686) (4%)
Other fees 11,247 7,136 4,111 58%
Total commission income 93,067 92,642 425 0%
Net interest income 275,109 190,064 85,045 45%
Net income (loss) on investments at fair value 33,791 (32,307) 66,098 ns
Net financial income 308,900 157,757 151,143 96%
Net income (loss) on other investments (10,217) (81,323) 71,106 (87%)
Other revenues 13,699 8,858 4,841 55%
TOTAL REVENUES 405,449 177,934 227,515 128%
Acquisition costs & Sales network commission expenses (60,198) (48,973) (11,225) 23%
Other commission expenses (12,307) (12,224) (83) 1%
General and Administrative expenses (176,928) (151,911) (25,017) 16%
Amortisation and depreciation (6,815) (7,436) 621 (8%)
Net provisions for risks (2,097) (1,683) (414) 25%
TOTAL COSTS (258,345) (222,227) (36,118) 16%
PROFIT BEFORE TAX 147,104 (44,293) 191,397 ns
For the year under review in the ‘Italy – Banking’ segment the Group recorded profit before tax of €147.1 million
versus a loss of €44.3 million in the prior year. The year-on-year improvement was driven by strong growth in net
financial income (up €151.1 million).
At year end 2012, net financial income came in at €308.9 million versus €157.8 million at December 31, 2011,
up €151.1 million thanks to bigger interest spreads reflecting refinancing with the ECB, as well as increased net
income from trading (up €66.5 million) mainly driven by fair value gains (up €49 million) and trading gains (up
€17.5 million).
Net income on other investments improved from a negative balance of €81.3 million in the prior year to a nega-
tive balance €10.2 million at year end 2012 thanks to reduced impairment on securities holdings compared to the
prior financial year when this account had been impacted by impairment of Greek sovereign debt holdings (€82.8
million).
25
DIRECTORS’REPORT
Total commission income remained in line with the prior year’s balance.
Acquisition costs & sales network commission expenses amounted to €60.2 million versus €49.0 million at the
end of the prior year, increasing by €11.2 million as a result of greater amounts provided for sales network incen-
tives.
Other expenses amounted to €185.8 million versus €161 million in the prior year. The €24.8 million increase was
mostly in connection with increases in headcount and related costs and greater advisory fees in connection with IRS
tax claims.
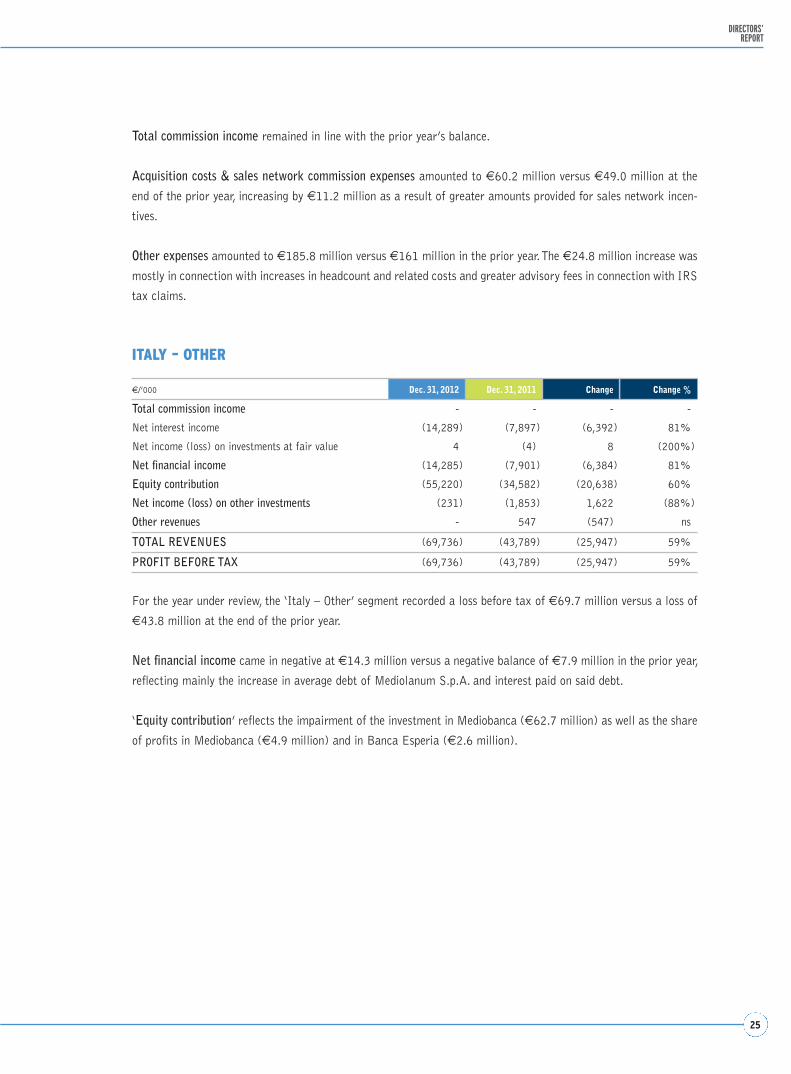
ITALY – OTHER
€/’000 Dec. 31, 2012 Dec. 31, 2011 Change Change %
Total commission income - - - -
Net interest income (14,289) (7,897) (6,392) 81%
Net income (loss) on investments at fair value 4 (4) 8 (200%)
Net financial income (14,285) (7,901) (6,384) 81%
Equity contribution (55,220) (34,582) (20,638) 60%
Net income (loss) on other investments (231) (1,853) 1,622 (88%)
Other revenues - 547 (547) ns
TOTAL REVENUES (69,736) (43,789) (25,947) 59%
PROFIT BEFORE TAX (69,736) (43,789) (25,947) 59%
For the year under review, the ‘Italy – Other’ segment recorded a loss before tax of €69.7 million versus a loss of
€43.8 million at the end of the prior year.
Net financial income came in negative at €14.3 million versus a negative balance of €7.9 million in the prior year,
reflecting mainly the increase in average debt of Mediolanum S.p.A. and interest paid on said debt.
‘Equity contribution’ reflects the impairment of the investment in Mediobanca (€62.7 million) as well as the share
of profits in Mediobanca (€4.9 million) and in Banca Esperia (€2.6 million).

26
CONSOLIDATED ANNUALFINANCIAL STATEMENTS
2012
SPAIN
€/’000 Dec. 31, 2012 Dec. 31, 2011 Change Change %
Net premiums written 99,718 119,045 (19,327) (16%)
Amounts paid and change in technical reserves (84,380) (103,339) 18,959 (18%)
Net life insurance revenues (ex-commissions) 15,338 15,706 (368) (2%)
Total commission income 26,296 23,292 3,004 13%
Net interest income 33,754 10,772 22,982 213%
Net income (loss) on investments at fair value 2,014 (82) 2,096 ns
Net financial income 35,768 10,690 25,078 235%
Net income (loss) on other investments 194 605 (411) (68%)
Other revenues 358 326 32 10%
TOTAL REVENUES 77,954 50,619 27,335 54%
Acquisition costs & Sales network commission expenses (17,601) (16,414) (1,187) 7%
Other commission expenses (2,763) (2,724) (39) 1%
General and administrative expenses (27,930) (25,943) (1,987) 8%
Amortisation and depreciation (1,498) (1,644) 146 (9%)
Net provisions for risks (12,499) (174) (12,325) ns
TOTAL COSTS (62,291) (46,899) (15,392) 33%
PROFIT (LOSS) BEFORE TAX 15,663 3,720 11,943 321%
In the ‘Spain’ segment net life insurance revenues before acquisition costs amounted to €15.3 million essentially
in line with the prior year’s balance of €15.7 million.
Total commission income increased from €23.3 million in the prior year to €26.3 million at the end of the year
under review.
Net financial income amounted to €35.8 million versus €10.7 million at the end of the prior year, up €25.1 mil-
lion, mostly driven by the €23.0 million increase in net interest income resulting from refinancing operations with
the ECB.
Other expenses increased from €46.9 million in the prior year to €62.3 million at year end 2012, mostly due to
greater provisions for risks connected with legal disputes.

27
DIRECTORS’REPORT
GERMANY
€/’000 Dec. 31, 2012 Dec. 31, 2011 Change Change %
Net premiums written 28,770 23,453 5,317 23%
Amounts paid and change in technical reserves (25,137) (20,186) (4,951) 25%
Net life insurance revenues (ex-commissions) 3,633 3,267 366 11%
Total commission income 17,501 27,490 (9,989) (36%)
Net interest income 980 1,719 (739) (43%)
Net income (loss) on investments at fair value 799 (308) 1,107 ns
Net financial income 1,779 1,411 368 26%
Net income (loss) on other investments - (6,258) 6,258 ns
Other revenues 982 937 45 5%
TOTAL REVENUES 23,895 26,847 (2,952) (11%)
Acquisition costs & Sales network commission expenses (3,803) (3,548) (255) 7%
Other commission expenses (8,823) (19,493) 10,670 (55%)
General and Administrative expenses (14,892) (14,344) (548) 4%
Amortisation and depreciation (722) (792) 70 (9%)
Net provisions for risks - - - -
TOTAL COSTS (28,240) (38,177) 9,937 (26%)
PROFIT (LOSS) BEFORE TAX (4,345) (11,330) 6,985 (62%)
In the ‘Germany’ segment, total commission income amounted to €17.5 million versus €27.5 million at the end of
the prior year. The €10.0 million (36%) decline was mainly due to reduced commissions on Bank Lenz ATM busi-
ness which also entailed a decrease in other commission expenses from €19.5 million in the prior year to €8.8 mil-
lion at December 31, 2012.
Key corporate events and performance of companies within the Group
After December 31, 2012 there was no material event which could have a significant impact on the financial posi-
tions, result of operations or cash flows of the Mediolanum Group.
The Parent Company
At December 31, 2012, the Parent Company Mediolanum S.p.A. reported net profit of €133.6 million versus
€159.6 million at December 31, 2011.
Dividends recognised in the 2012 income statement aggregated to €177.5 million versus €180.3 million in the
prior year.
Pursuant to the resolution passed at the Annual General Meeting held on April 19, 2012, in May 2012, the
Parent Company Mediolanum S.p.A. paid out the 2011 final dividend of €0.04 per share for a total amount
of €29.4 million.
As per the resolution of the Board of Directors of November 8, 2012, in November 2012, the Parent Company
paid out the 2012 interim dividend of €0.10 per share for a total amount of €73.4 million (€51.3 million in
the prior year).

28
CONSOLIDATED ANNUALFINANCIAL STATEMENTS
2012
Key information on the performance of the main companies that are part of the Mediolanum Group during the peri-
od under review is set out below.
Life Insurance Companies
MEDIOLANUM VITA S.P.A.For financial year 2012 this company reported net profit of €77.2 million versus a loss of €35.3 million in the
prior year. The bottom line benefitted from investment income improving by €115,941 thousand over the prior
year.
For financial year 2012 the company reported premiums written of €7,809 million down 15% from €9,144
million in the prior year largely owed to reduced premiums written under the ‘Mediolanum Plus’ policy.
At December 31, 2012, mathematical reserves and financial liabilities to policyholders amounted to €14,605.5
million (€15,440.0 million in 2011), of which €14,533.3 million relating to individual policies (€15,371.2
million in 2011) and €72.2 million to group policies (€68.8 million in 2011).
At year end 2012, annual gross return on Medinvest segregated funds was 5.02% (vs. 4.69% in 2011).
Annualised gross returns on the Mediolanum Freedom segregated funds were 3.48% in the quarter from Dec. 1
to Feb. 28; 2.79% in the quarter from March 1 to May 31; 2.75% in the quarter from June 1 to August 31;
and 2.38% in the quarter from September 1 to November 30.
MEDIOLANUM INTERNATIONAL LIFE LTD
For financial year 2012 this company reported premiums written of €248 million versus €405.6 million in the
prior year.
Premiums written in foreign markets (Spain and Germany) amounted to €128.5 million versus €142.5 million
at December 31, 2011.
At December 31, 2012, mathematical reserves and financial liabilities to policyholders amounted to €3,300
million versus €3,273 million in 2011.
For financial year 2012 the company reported net profit of €18 million versus €7.4 million in the prior year.
Mediolanum International Life Ltd policies are distributed in Italy by Banca Mediolanum, in Spain by Fibanc
and in Germany through Bankhaus August Lenz.
Asset Management Companies
MEDIOLANUM INTERNATIONAL FUNDS LTD
For financial year 2012 the company reported net profit of €261.4 million up €58.4 million over the prior year
(FY 2011: €203.0 million), largely due to the increase in performance fees earned in the period (up €46.6 mil-
lion).
At the end of the year under review, the company reported net inflows of €1,718.9 million versus €1,598.1
million at December 31, 2011.
At December 31, 2012, total assets under management amounted to €20,952 million up 16.6% compared to
€17,975 million in the prior year.
In October 2012, the company resolved to distribute a 2012 interim dividend for a total amount of €207 mil-
lion versus €114.0 million in the prior year.

29
DIRECTORS’REPORT
MEDIOLANUM GESTIONE FONDI SGR P.A. For financial year 2012, the company reported net profit of €35 million versus €12.5 million in the same peri-
od of the prior year. The bottom line benefitted in particular from the positive contribution of performance fees
earned in the year.
At December 31, 2012, assets managed directly by this company amounted to €3,377.4 million up 29.3%
from €2,612.2 million at December 31, 2011, benefitting from both growth in net inflows (€577.2 million)
and the positive performance of financial markets.
Assets managed on mandates from fellow subsidiaries amounted to €15,016.9 million versus 15,564.4 million
at December 31, 2011, down 3.5% largely owed to declines in Mediolanum Plus policy-associated assets.
GAMAX MANAGEMENT AGAt December 31, 2012, this Luxembourg-based company reported net profit of €4.1 million, in line with the
prior year’s balance of €4.2 million.
In the retail segment, the company recorded net outflows of €0.1 million versus net inflows of €1.1 million in
the prior year. At year end 2012, assets under management amounted to €228.4 million versus €204.8 million
at the end of the prior year.
At December 31, 2012 total assets under management (Retail + Institutional) amounted to €409 million ver-
sus €378 million in the prior year.
MEDIOLANUM ASSET MANAGEMENT LTD
For financial year 2012 this company reported net profit of €14.2 million up €0.7 million from €13.5 million
at December 31, 2011.
In October 2012, the company resolved to distribute a 2012 interim dividend for a total amount of €10 mil-
lion versus €6.0 million in the prior year.
Banking operations (including Group product distribution)
BANCA MEDIOLANUM S.P.A. or financial year 2012 the bank reported net profit of €189.3 million up €173.2 million compared to €16.1
million in the prior year. Profit before tax was €230.3 million up €232.9 million from a loss of €2.6 million
at the end of the prior year. The improvement was driven in particular by robust growth in net financial income
(up €142.8 million), reduced net impairment (down €80.3 million) and greater dividends from equity invest-
ments (up €46.5 million) offset, in part, by reduced net commission income (down €29.7 million).
Income tax for the year was a negative balance of €41.0 million versus a positive balance of €18.7 million in
the prior year.
Total net inflows (managed assets and administered assets) amounted to €2,258.3 million versus €2,280 mil-
lion in the prior year.
Net inflows into asset management products and sales of third-party structured bonds aggregated to €1,552.9
million versus €731.8 million in 2011.
Freedom bank accounts associated with the Mediolanum Plus policy recorded net outflows of €1,070.8 mil-
lion versus €521.5 million at December 31, 2011. Other AuA products recorded net inflows of €1,776.3 mil-
lion versus €2,069.6 million at the end of the prior year.
At year end 2012, the bank had €1,040,488 customers versus €1,066,423 at the end of the prior year.

30
CONSOLIDATED ANNUALFINANCIAL STATEMENTS
2012
At December 31, 2012, total statement of financial position assets amounted to €17,064.5 million, up
€2,726.7 million over the prior year.
Customer deposits grew from €7,163.4 million at year end 2011 to €8,897.6 million at December 31, 2012.
Loans to customers, excluding securities lending, amounted to €4,422.6 million versus €3,312.9 million at
December 31, 2011.
Net interest income amounted to €275.1 million, growing 45% from €190.1 million at year end 2010. The
€85 million increase over the prior year largely reflects bigger interest spreads benefitting in particular from
refinancing operations with the ECB.
Adding net income from trading, net income from hedging and net gains/losses on the sale of available-for-sale
financial assets, net financial income came in at €307.1 million versus €164.3 million in the prior year. The
€142.8 million increase was driven by improved income from trading (up €66.5 million) principally benefit-
ting from fair value gains (up €49 million) and gains from trading (up €17.5 million).
Net commission income declined by €29.7 million from €105.1 million at year end 2011 to €75.3 million at
the end of the year under review, largely reflecting greater amounts provided for incentives (€12.7 million) and
amounts retroceded to the sales network following changes in the compensation policy.
Specifically, for the year ended December 31, 2012, commission income amounted to €406.8 million versus
€379 million in the prior year (up 7%).
Commission expenses amounted to €331.4 million versus €273.8 million in the prior year (up 21%).
Dividends increased by €46.5 million from €124.5 million in the prior year to €171.0 million at the end of
the year under review, largely owing to the greater dividends distributed by the Irish subsidiaries (up €53 mil-
lion), offset, in part, by the reduced dividends received from the Italian subsidiary Mediolanum Gestione Fondi
(down €3.1 million) and the subsidiary Gamax Management (down €2 million).
Net impairment aggregated to €10.4 million versus €90.6 million in the prior year. The improvement reflects
the decline in impairment on securities holdings compared to 2011 when the bank had recorded €82.8 million
impairment of Greek sovereign debt holdings, marginally offset by the €1.9 million collective impairment of
loans resulting from the new classification of over 90 days past due positions effective from the current year
as per Bank of Italy’s requirements. Last year there had been a €0.8 million reversal of collective impairment
on loans.
Operating expenses amounted to €304.0 million versus €289.6 million at year end 2011.
Specifically, staff costs rose from €100.3 million in 2011 to €109.5 million at the end of the year under review,
reflecting the increase in average number of personnel from 1,529 to 1,627 people following the merger of
MCU, certain activities relating to events organisation and corporate television being brought back in-house as
well as greater incentives given to employees (up €2.7 million).
Other administrative expenses amounted to €164.0 million versus €156.7 million in the prior year. Although
bringing certain activities back in-house reduced expenses, expenses for IT systems increased (up €2.5 million).
Additionally, expenses for legal advice increased too (up €7.5 million) mainly in connection with pending tax
claims.
Other operating expenses increased from €12.7 million to €14.2 million owing to greater amounts set aside
for contractual obligations to the sales network.
BANCO MEDIOLANUM S.A.For financial year 2012 the Spanish Group reported net profit of €30.3 million versus €6.8 million in the prior
year, thanks to the positive contribution of treasury operations (up €42.2 million before tax), offset, in part, by
greater amounts set aside for legal disputes (up €12.5 million before tax).

31
DIRECTORS’REPORT
In the year under review, gross inflows into asset management products amounted to €285.2 million, remain-
ing essentially in line with the prior year’s balance, and net inflows were €88.2 million versus €98.3 million in
the prior year. Assets under administration recorded inflows of €26.2 million versus net outflows of €3.7 mil-
lion at the end of the prior year.
At year end 2012, total assets under management and under administration amounted to €1,799.6 million ver-
sus €1,581.2 million at December 31, 2011.
The sales network consisted of 590 people (vs. 549 at December 31, 2011), of whom 551 tied advisors (vs.
505 at year 2011).
BANKHAUS AUGUST LENZ & CO. AGFor financial year 2012 the company reported a net loss of €8.4 million versus €14.2 million in the prior year
when financial results had been impacted in particular by net financial income coming in negative at €6.3 mil-
lion.
Net inflows into asset management products amounted to €26.4 million versus €17.4 million in the prior year,
and net inflows of assets under administration were €28.2 million versus €33.3 million in the prior year.
At year end 2012, total assets under management and under administration amounted to €214.5 million ver-
sus €145.1 million at December 31, 2011.
The sales network consisted of 46 people (vs. 42 at year end 2011).
Joint ventures
For financial year 2012, the Banca Esperia Group reported consolidated net profit of €5.1 million versus €1.5
million in the prior year.
For the year under review this entity recorded net outflows of €1,241 million versus net inflows of €603 mil-
lion in the prior year.
At year end 2012, total assets under management and administration amounted to €13,800 million versus
€12,817 million at the end of the prior year.
At December 31, 2012, the group had 72 private bankers versus 80 at the end of the prior year.
Associates
For financial year ended June 30, 2012, the Mediobanca Group reported net profit of €80.9 million versus
€368.6 million in the prior financial year. In particular, net profit for the six-month period from January
through June 2012 amounted to €17.5 million versus €105.7 million for the same period of the prior year.
In its half-yearly accounts for the period June 1 through December 31, 2012, the Mediobanca Group reported
net profit of €123.8 million almost twice the €63.4 million profit recorded in the same period of the prior year.
This was largely owed to write-downs on the securities and investment portfolio declining from €231.1 million
to €89.5 million.
Total revenues were down 6.4% from €973.3 million to €911 million, specifically:
• net interest income was down 6.7% from €554.6 million to €517.7 million due to results in the corporate
and investment banking areas where net interest income fell from €204.5 million to €157.4 million;

32
CONSOLIDATED ANNUALFINANCIAL STATEMENTS
2012
• net trading income came in at €106.5 million confirming the sound results recorded in the prior year
(€112.5 million) benefitting from reduced sovereign debt yield spreads;
• fee and commission income were down 14.2% from €234.4 million to €201 million, largely owed to the
reduced contribution of consumer credit;
• the contribution of investments accounted for by the equity method rose from €71.8 million to €85.8 mil-
lion.
Operating costs were down 5.9% from €399.2 million to €375.6 million reflecting reduced staff costs (down
3.4%) and administrative expenses (down 8.4%).
Given the recessionary environment, write-downs of loans were up 9.7% from €212.3 million to €232.8 mil-
lion. Write-downs in the securities and investment portfolio included a €95 million impairment charge on the
stake held in Telco to reflect Telecom Italia’s present value of €1.20 per share, a €12.2 million reversal of
impairment on Greek sovereign debt holdings, €6.7 million other charges on unlisted AFS financial instru-
ments.
At December 31, 2012, consolidated shareholders’ equity after minority interests and net profit for the year
amounted to €6,922.3 million versus €6,418.7 million at June 30, 2012 and €6,049.9 million at December
31, 2011. The €503.6 million increase over June 30, 2012 (from €6,418.7 million to €6,922.3 million)
reflects the increase in valuation reserves (up €455.9 million).
Following impairment review, Mediolanum decided to write-down the value of its stake in Mediobanca which
entailed the recognition of a €62.7 million impairment charge. Details on impairment review are given in the
section ‘Impairment test’ herein.
The impact of investments accounted for by the equity method on the Mediolanum Group’s income statement
was a negative balance of €55.2 million, which includes the €62.7 million impairment charge on the stake in
Mediobanca, versus a negative balance of €41.1 million in the prior year.
Intercompany and related party transactions
There were no atypical or unusual transactions as related party transactions, including intercompany transac-
tions, that are part of the Group’s ordinary business, were made at arm’s length in consideration of the fea-
tures of goods and services provided.
In accordance with art. 2391 bis of the Italian Civil Code, art. 71 bis of Consob Regulation 11971/99
(Regulation for Issuers) and the recommendations set out in the Code of Conduct, adopted by the company by
Board of Directors resolutions, related party disclosures are set out in the relevant section of the Notes.
Social and environmental responsibility
For information on the Group’s policy on social and environmental responsibility, readers are referred to the
Social Report 2012.
33
DIRECTORS’REPORT
Impairment test
Goodwill recognised in the consolidated accounts for the year ended December 31, 2012 relates to the Cash
Generating Units (CGUs) Spain, Germany and Italy (Life) in relation to foreign investments of the Mediolanum
Banking Group.
At its meeting held last March 19, the Board of Directors of the Bank approved the procedures for impairment
review of goodwill allocated to the CGUs above in accordance with IAS 36.
For the purpose of impairment review at December 31, 2012, Banca Mediolanum requested the assistance of
a primary specialist firm. The valuations were based on cash-flow estimates derived from the 2013-2015 Plans
approved by the Board of Directors of Banca Mediolanum last February 15, which represent management’s
best estimate of the future economic and financial performance of the respective CGUs, applying industry stan-
dard methods best suited for the purposes of the exercise in the specific cases, in accordance with applicable
accounting standards.
In their February 28, 2013 report the independent valuers stated that based on their analysis of the recover-
able amount of goodwill carried on the consolidated statement of financial position of the Mediolanum Banking
Group and allocated to the CGUs above, the recoverable amount of goodwill allocated to CGU Germany and to
CGU Italy Asset Management did not show any evidence of impairment, while the recoverable amount allocat-
ed to CGU Spain based on conservative estimates was determined to be €102.8 million, which was lower than
the amount at which it was carried in the consolidated accounts (€122.9 million). Based on these results an
impairment charge of €20.1 million was recognised on goodwill allocated to CGU Spain.
As to the investments in Mediobanca and Banca Esperia, which are accounted for by the equity method, they
were tested for impairment as follows.
As to Mediobanca, also in the light of the stock performance during 2012, last October Mediolanum decid-
ed to review for impairment the value of its stake therein before the end of the financial year. The value of
Mediolanum’s stake in Mediobanca at September 30, 2012 was tested for impairment with the assistance of
an independent valuer, applying the Dividend Discount Model (DDM) in the Excess Capital variant. The
recoverable amount of the stake in Mediobanca was found to range between €9.3 and €9.8 per share, with
a median value of €9.5 per share. Based on said valuation, the Board of Directors of Mediolanum S.p.A.
resolved to proceed to write down the value of the stake in Mediobanca in the interim accounts at September
30, 2012 from €11.78 per share (aggregating to €342.6 million) to €9.5 per share (aggregating to €276.4
million).
At year end, impairment review was again undertaken to determine the recoverable amount of the investment
in Mediobanca at December 31, 2012. To that end, Mediolanum S.p.A requested again the assistance of an
independent valuer. This time the recoverable amount of the stake in Mediobanca was found to range between
€9.76 and €10.39 per share, with a median value of €10.05 per share. Based on said valuation, the stake in
Mediobanca was carried at €10.05 per share in the consolidated accounts at December 31, 2012. The impair-
ment recognised for financial year 2012 on the investment in Mediobanca aggregated to €62.7 million.
As to Banca Esperia, for the purpose of impairment review at December 31, 2012, Directors considered that
the company’s equity approximated its carrying amount and also used as reference the appraisal at June 30,
2012, requested by Banca Esperia to determine the exercise price of the Private Bankers Stock Options Plan
and issued by the independent specialist firm on December 10, 2012. The appraisal used the following assump-

34
CONSOLIDATED ANNUALFINANCIAL STATEMENTS
2012
tions: going concern, growth at a normal rate, materialisation of the assumptions and attainment of the goals
set out in the forecasts for 2012 and the Business Plan for 2013-2015.
Said valuation indicated a value per share of €2.05, which was about 1.4 times the carrying amount of the
investment at December 31, 2012 (€1.48 per share). The analysis revealed no impairment of the investment in
Banca Esperia.
Tax claims
Banca Mediolanum. As you may recall two separate Audit Reports had been issued in past years following the
field audit Italy’s Tax Police (Milan Office – 1st Revenue Protection Group) started on September 16, 2010 and
concluded on February 28, 2011. One Audit Report had been issued on October 29, 2010 claiming a total
adjustment of €48.3 million to IRES and IRAP taxable income for tax year 2005, the other on February 28,
2011 claiming a total adjustment of €121.4 million to IRES and IRAP taxable income for tax years from
2006 through 2009, all relating to fees rebated by the Irish subsidiary Mediolanum International Funds Ltd.
On April 29, 2011, the Bank had filed a brief prepared pursuant to section 12, paragraph 7, Act 212 of July
27, 2000 with the IRS Lombardy Office whereby the Bank had asserted the illegitimacy of the claims and its
law-abiding conduct, requesting in any case the application of the penalty waiver clause under Article 26 of
Italy’s Decree Law 78 of May 31, 2010.
On December 21, 2012 the Bank was notified three Notices of IRES Tax Due and Demands for Payment and
as many Notices of IRAP Tax Due and Demands for Payment for tax years 2005, 2006 and 2007, claiming
adjustments to taxable income aggregating to €333.5 million, resulting in €110.1 million IRES tax due plus
€85.7 million penalties, and €17.5 million IRAP tax due plus €13.6 million penalties.
The Bank believes the analysis developed by the IRS in the Notices is illegitimate besides being groundless as
to the adjustments to taxable income claimed and illegitimate as to the penalties given that the waiver under
Art. 26 of Decree Law 78/2010 was not applied although the tax administration itself recognised formal com-
pliance of documentation produced within the required deadline.
However, in the light of the complexity of the matter which involves also the subsidiary Mediolanum
International Funds Ltd, the Bank started the procedure under the EU Arbitration Convention (Convention
90/436/EEC) for adjudication of its case by the competent Irish and Italian tax authorities.
As to the outcome of the claims above for which the procedure under the international Arbitration Convention
was initiated, considering that transfer pricing applied by the Bank is within the arm’s length range as deter-
mined by independent economists, the directors believe based, inter alia, on the opinion of an independent advi-
sor, the risk is only possible and, in addition, since the pending issues relate to determinations, no sufficiently
reliable estimate can be made of the amount of the obligation that may ultimately result.
In the light of the foregoing no provision was made in the separate accounts for the year ended December
31, 2012.
Finally, we inform you that the claim aggregating to €64 million raised by the tax administration for alleged
failure to apply VAT to the indirect commissions (so-called overrides) paid to certain sales network members
for their supervision and coordination of other sales network members from tax year 2006 through September
16, 2010 (the start date of the Tax Police audit) had a positive conclusion for the Bank.

35
DIRECTORS’REPORT
The complete groundlessness of the claim was confirmed by the IRS Assessment Office that in its Note No.
2012/82261 of May 30, 2012 clearly affirmed the tax-exempt status for overrides paid to certain sales net-
work members for their supervision and coordination of other sales network members pursuant to paragraph 1
N. 9 of article 10 of the Decree of the President of the Italian Republic No. 633/197.
Mediolanum Vita S.p.A.. On December 23, 2010 the Company had received ‘Notices of Tax Due and Demands
for Payment’ claiming a total adjustment of €47.9 million to IRES and IRAP taxable income for tax year 2005
resulting in a €2,512 thousand IRAP tax due plus a penalty in the same amount, and €15,804 thousand IRES
tax due with no penalty, in relation to commissions rebated by Mediolanum International Funds Ltd to the
Company. After the Request for Compromise had fallen through, in May 2011, the Company had file a petition
in the Milan Provincial Tax Court contesting said Notices for groundlessness and asking for their annulment.
On July 28, 2012, owing to the complexity of the matter which involves also the subsidiary Mediolanum
International Funds Ltd, which is resident in Ireland, the Company started the procedure under the EU
Arbitration Convention (Convention 90/436/EEC) for adjudication of its case by the competent Irish and
Italian tax authorities.
On December 21, 2012 the Company was notified other Notices of Tax Due and Demands for Payment claim-
ing adjustments to IRES taxable income aggregating to €128,080 thousand, and to IRAP taxable income
aggregating to €127,454 thousand, for tax years 2006 and 2007, resulting in €42,266 thousand IRES tax
due plus €41,417 thousand penalties, and €6,691 thousand IRAP tax due plus €3,481 thousand penalties.
The Company believes the analysis developed by the IRS in the Notices is illegitimate besides being groundless
as to the adjustments to taxable income claimed and illegitimate as to the penalties given that the waiver under
Art. 26 of Decree Law 78/2010 was not applied although the tax administration itself recognised formal com-
pliance of documentation produced within the required deadline.
For the same reasons and considerations set out above in relation to the Notices regarding tax year 2005, the
Company started the procedure under the EU Arbitration Convention (Convention 90/436/EEC).
As to the outcome of the claims above, given that the pending issues relate to determinations for which the pro-
cedure under the international Arbitration Convention was initiated and considering that the transfer pricing
applied by the Company is within the arm’s length range as determined by independent economists, the direc-
tors believe based, inter alia, on the opinion of an independent advisor, the risk is only possible and, in addition,
as pending issues relate to determinations, no sufficiently reliable estimate can be made of the amount of the
obligation that may ultimately result.
In the light of the foregoing no provision was made in the separate accounts for the year ended December
31, 2012.
Disclosures pursuant to Document No. 4 of March 3, 2010 jointly issued by the Bank ofItaly, CONSOB and ISVAP
In Document No. 4 dated March 3, 2010 jointly issued by the Bank of Italy (Italy’s Central Bank), CONSOB
(stock market regulator) and ISVAP (insurance market regulator) Italian regulators called upon Senior
Management to adhere strictly to international accounting and financial reporting standards and applicable leg-
islation and provide complete, clear and timely information about the risks and uncertainties to which their com-
panies are exposed, the capital their companies have to cover those risks and their earnings generation ability.

36
CONSOLIDATED ANNUALFINANCIAL STATEMENTS
2012
In connection therewith Management is making the following disclosures.
As to the entity’s ability to continue as a going concern, the management of Mediolanum S.p.A. confirm they
reasonably expect the company will continue in operation in the foreseeable future and therefore the financial
statements for the year ended December 31, 2012 were prepared based on the going concern assumption.
Following their examination of the financial position, result of operations and cash-flows, they also confirm they
did not find any evidence of uncertainties in relation to the ability of the entity to continue in operation as a
going concern.
In relation to ‘Impairment of Assets’ (IAS 36), the impairment method used by the Mediolanum Group includ-
ed assessment of impairment by an independent valuer based on current multi-year business plans previously
approved by the Board of Directors of the companies within the Group. The impairment process was validated
by the Board of Directors of Mediolanum S.p.A.. For further details readers are referred to Part B of the Notes
to the consolidated financial statements.
With regard to information on the criteria used to measure equity instruments classified as ‘available for sale’
and the requirements set out in paragraph 61 of IAS 39, the Mediolanum Group assesses separately if there is
a ‘significant’ or ‘prolonged’ decline in the value of the assets. If it finds out that there has been a ‘significant’
or a ‘prolonged’ decline in value the Group recognises the impairment loss on the AFS equity instrument irre-
spective of any other considerations.
Specifically, for equity instruments the Group considers there is evidence of impairment when the decline in the
original fair value exceeds one third or is prolonged for over 36 months.
For details on disclosures to be made in the notes, readers are referred to Parts A, B and E of the Notes.
Information on “fair value hierarchy” (IFRS 7) for positions held at December 31, 2012, including prior year’s
comparative information, is given in Part A of the Notes.
Finally, there are no financial debt contract clauses (IFRS 7) or debt restructuring (IAS 39) involving the
Mediolanum Group.
Other information
At December 31, 2012, the solvency capital requirement of the Mediolanum S.p.A. financial conglomerate cal-
culated in accordance with regulatory requirements for financial conglomerates engaged mainly in insurance
was in line with the requirements set out in ISVAP Regulation No. 18 of March 12, 2008 regarding assess-
ment of capital adequacy under Title XV, Chapter IV of Legislative Decree 209 of September 7, 2005 – Private
Insurers Code – Regulations governing the capital adequacy of financial conglomerates pursuant to Legislative
Decree 142 of May 30, 2005, and the financial conglomerates coordination agreement signed by ISVAP, CON-
SOB and the Bank of Italy on March 30, 2006.
Notably, the Group held €1,252 million capital to cover the €896 million capital requirement with surplus cap-
ital of €356 million.
Disclosures required under section 123 bis of the Consolidated Finance Act are set out in the Corporate
Governance Report made available also on the company’s website (www.mediolanum.it) in accordance with art.
89 bis of the Regulation for Issuers.

37
DIRECTORS’REPORT
Post balance sheet date events
On September 11, 2012, the Board of Directors of Mediolanum S.p.A. resolved to proceed to acquire the entire
share capital of Mediolanum Assicurazioni S.p.A..
Being the sellers the majority shareholders of both Mediolanum S.p.A. (the ‘acquirer’) and Mediolanum
Assicurazioni S.p.A. (the ‘acquiree’), pursuant to article 4 of the Procedures under Consob Resolution No.
17221, the transaction qualified as a related-party transaction of lesser significance, and as such, pursuant to
paragraph 7.1 of said Procedures, it was subject to Mediolanum S.p.A. Audit Committee’s prior positive opin-
ion, which was given by unanimous vote.
The acquisition is a strong complementary fit for the Mediolanum Group.
Mediolanum Assicurazioni S.p.A. is an entity operating in the insurance and reinsurance markets with a retail
offering made up of a suite of non-life (excluding Motor TPL) standard-contract insurance products for the
protection of individuals, households, equity and assets.
At December 31, 2011, Mediolanum Assicurazioni S.p.A. reported net profit of €2.6 million, shareholder’s
equity of €32.6 million and premiums written of €25.3 million.
The €35.9 million consideration initially agreed by the parties was based on Mediolanum Assicurazioni S.p.A.’s
accounts and the value of its in-force business at March 31, 2012, and backed by PriceWaterhouseCoopers
Advisory S.p.A.’s valuation of the company’s entire capital.
Said consideration was subject to adjustments based on Mediolanum Assicurazioni S.p.A.’s accounts and net
present value of its in-force business as of the end of the month in which the insurance regulator would give the
green light to the transaction.
Mediolanum S.p.A. received the approval of the insurance regulator (IVASS, previously named ISVAP) on
March 19, 2013, hence the final consideration will be determined based on Mediolanum Assicurazioni S.p.A.’s
accounts and the value of its in-force business at March 31, 2013.
After December 31, 2012, there was no other event which could have a significant impact on the financial posi-
tion, result of operations and cash flows of the Group.
Main risks and uncertainties
Readers can find information about the risks and uncertainties to which the Mediolanum Group is exposed in
this Report and in the Notes.
Specifically, information about the risks related to the performance of the world’s economies and financial mar-
kets is set out in this Report, under ‘Macroeconomic Environment’, ‘Financial Markets’ and ‘Outlook’.
Information on financial risk and operational risk is detailed in Part F of the Notes.

38
CONSOLIDATED ANNUALFINANCIAL STATEMENTS
2012
Outlook
In October 2012 and again in January 2013 the International Monetary Fund (IMF) lowered its forecasts for
global economic growth noting that the recovery continues, but it has weakened.
2013 may unfold showing commonalities with the recently ended year: moderate growth, fiscal tightening, mon-
etary easing and no major concern about inflation.
In such an environment, the Mediolanum Group will continue to be focused on its all-around offering of ever
more sophisticated products and services to protect the savings and grow the assets of its customers. Income
from treasury operations will continue to be linked to the performance of markets.
In the light of the foregoing, considering the risks that are inherent in the business of the Group, barring any
exceptional events or circumstances that depend on variables essentially outside the control of Directors and
Senior Management – and not in the offing at present – the Group’s outlook for next year is positive.
Basiglio, March 21, 2013
For the Board of Directors
The Chairman
(Carlo Secchi)

ConsolidatedAccounts
2012

40
CONSOLIDATED ANNUALFINANCIAL STATEMENTS
2012
Statement of financial positionAssets€/’000 Dec. 31, 2012 Dec. 31, 2011
1. Intangible assets
1.1 Goodwill 129,886 149,864
1.2 Other intangible assets 23,096 17,002
Total intangible assets 152,982 166,866
2. Tangible assets
2.1 Property 80,520 60,061
2.2 Other tangible assets 9,062 9,899
Total tangible assets 89,582 69,960
3. Reinsurers’ share of technical reserves 76,198 89,273
4. Investments
4.1 Investment property 106,798 108,041
4.2 Investments in subsidiaries, associates and JVs 382,700 404,493
4.3 Held to maturity investments 1,359,408 1,005,949
4.4 Loans and receivables 6,404,352 6,245,884
4.5 Available for sale financial assets 12,319,069 9,062,406
4.6 Financial assets at fair value through profit and loss 14,191,110 15,639,522
Total investments 34,763,437 32,466,295
5. Receivables
5.1 Arising out of direct insurance business 5,641 5,512
5.2 Arising out of reinsurance business 4,183 -
5.3 Other receivables 1,549 229
Total receivables 11,373 5,741
6. Other assets
6.1 Non current assets of disposal groups, held for sale 1,094 747
6.2 Deferred acquisition costs -
6.3 Deferred tax assets 126,259 252,201
6.4 Current tax assets 338,686 278,313
6.5 Other assets 297,954 303,978
Total other assets 763,993 835,239
7. Cash and cash equivalents 191,264 338,386
TOTAL ASSETS 36,048,829 33,971,760

41
CONSOLIDATEDACCOUNTS
Shareholders’ equity and liabilities€/’000 Dec. 31, 2012 Dec. 31, 2011
1. Shareholders’ equity
1.1 Group shareholders’ equity
1.1.1 Share capital 73,434 73,382
1.1.2 Other equity instruments
1.1.3 Capital reserves 56,497 56,013
1.1.4 Retained earnings and other equity reserves 821,182 847,716
1.1.5 Treasury shares (-) (2,045) (2,045)
1.1.6 Exchange difference reserves
1.1.7 Gains or losses on available for sale financial assets 88,984 (283,184)
1.1.8 Other gains or losses recognised directly in equity 31,372 3,201
1.1.9 Net profit (loss) for the year attributable to the Group 351,023 67,267
Total capital and reserves attributable to the Group 1,420,447 762,350
1.2 Attributable to minority interests
1.2.1 Capital and reserves attributable to minority interests - -
1.2.2 Gains (losses) recognised directly in equity - -
1.2.3 Net profit (loss) for the year attributable to minority interests - -
Total capital and reserves attributable to minority interests - -
Total shareholders’ equity 1,420,447 762,350
2. Provisions 191,022 160,693
3. Technical reserves 17,823,829 18,632,275
4. Financial liabilities
4.1 Financial liabilities at fair value through profit and loss 443,045 489,624
4.2 Other financial liabilities 15,491,157 13,369,539
Total financial liabilities 15,934,202 13,859,163
5. Payables
5.1 Arising out of direct insurance business 5,580 5,229
5.2 Arising out of reinsurance business 68 2,387
5.3 Other payables 275,679 217,638
Total payables 281,327 225,254
6. Other liabilities
6.1 Liabilities of disposal groups held for sale 960 968
6.2 Deferred tax liabilities 97,210 41,018
6.3 Current tax liabilities 122,578 15,082
6.4 Other liabilities 177,254 274,957
Total other liabilities 398,002 332,025
TOTAL SHAREHOLDERS’ EQUITY AND LIABILITIES 36,048,829 33,971,760

42
CONSOLIDATED ANNUALFINANCIAL STATEMENTS
2012
Income statement€/’000 Dec. 31, 2012 Dec. 31, 2011
1. Revenues1.1 Net premiums written
1.1.1 Gross premiums written 8,054,608 9,547,764
1.1.2 Reinsurance premiums (3,301) (4,347)
Total premiums written 8,051,307 9,543,417
1.2 Commission income 893,558 752,520
1.3 Net income on financial instruments at fair value through profit and loss 1,378,314 (601,369)
1.4 Income on investments in subsidiaries, associates and JVs 7,483 6,544
1.5 Income on other financial instruments and investment property
1.5.1 Interest income 644,165 445,626
1.5.2 Other income 10,145 10,879
1.5.3 Realised gains 47,610 24,986
1.5.4 Unrealised gains 4,623 5,412
Total income on other financial instruments and investment property 706,543 486,903
1.6 Other revenues 26,435 20,977
Total revenues and income 11,063,640 10,208,992
2. Costs2.1 Net claims and benefits
2.1.1 Amounts paid and change in technical reserves (9,396,301) (9,041,752)
2.1.2 Reinsurers’ share 8,852 5,468
Net claims and benefits (9,387,449) (9,036,284)
2.2 Commission expense (314,868) (262,719)
2.3 Losses on investments in subsidiaries, associates and JVs (62,703) (41,126)
2.4 Loss on other financial instruments and investment property
2.4.1 Interest expense (225,051) (149,033)
2.4.2 Other expenses (696) (459)
2.4.3 Realised losses (25,646) (27,382)
2.4.4 Unrealised losses (17,729) (137,311)
Loss on other financial instruments and investment property (269,122) (314,185)
2.5 Operating expenses
2.5.1 Agents’ commissions and other acquisition costs (73,340) (73,726)
2.5.2 Investment management expenses (319) (513)
2.5.3 Other administrative expenses (360,211) (329,578)
Total operating expenses (433,870) (403,817)
2.6 Other costs (95,018) (66,322)
Total costs (10,563,030) (10,124,453)
Profit (loss) before tax for the period 500,610 84,539
3. Income tax (149,561) (16,952)
Profit (loss) for the period 351,049 67,587
4. Profit (loss) from discountinued operations (26) (320)
Group net profit (loss) for the period 351,023 67,267
of which pertaining to the Group 351,023 67,267
Earning per share (in euro) 0.478 0.092

43
CONSOLIDATEDACCOUNTS
Statement of other comprehensive income€/’000 Dec. 31, 2012 Dec. 31, 2011
CONSOLIDATED NET PROFIT (LOSS) 351,023 67,267
Changes in net exchange differences reserve - -
Profit (loss) on available for sale financial assets 372,168 (213,351)
Profit (loss) on cash flow hedges - -
Profit (loss) on hedges of investments in foreign operations - -
Changes in the equity of investees 28,171 (19,100)
Changes in intangible assets revaluation reserve - -
Changes in tangible assets revaluation reserve - -
Gains (losses) on non-current assets or disposal groups held for sale - -
Actuarial gains (losses) and adjustments on defined benefit plans - -
Other - -
TOTAL OTHER COMPONENTS OF STATEMENT OF OTHER COMPREHENSIVE INCOME 400,339 (232,451)
TOTAL CONSOLIDATED STATEMENT OF OTHER COMPREHENSIVE INCOME 751,362 (165,184)
attributable to the Group 751,362 (165,184)
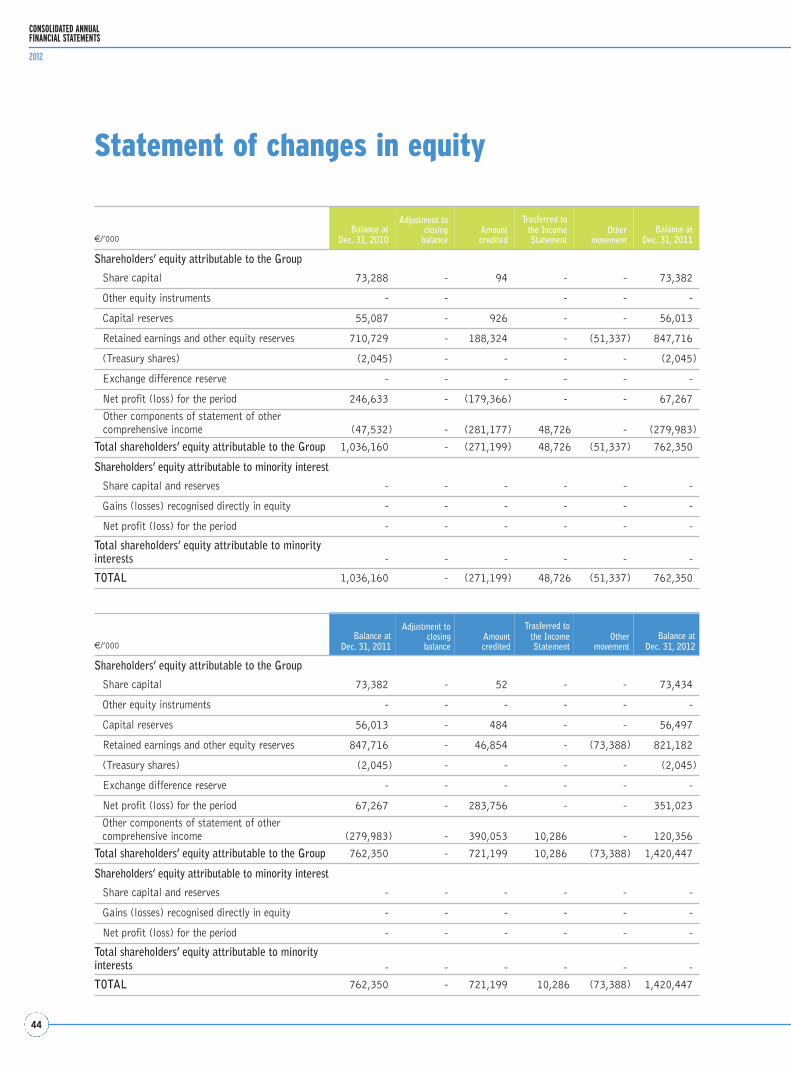
44
CONSOLIDATED ANNUALFINANCIAL STATEMENTS
2012
€/’000Balance at
Dec. 31, 2010
Adjustment toclosing
balanceAmountcredited
Trasferred tothe IncomeStatement
Othermovement
Balance atDec. 31, 2011
Shareholders’ equity attributable to the Group
Share capital 73,288 - 94 - - 73,382
Other equity instruments - - - - -
Capital reserves 55,087 - 926 - - 56,013
Retained earnings and other equity reserves 710,729 - 188,324 - (51,337) 847,716
(Treasury shares) (2,045) - - - - (2,045)
Exchange difference reserve - - - - - -
Net profit (loss) for the period 246,633 - (179,366) - - 67,267
Other components of statement of other comprehensive income (47,532) - (281,177) 48,726 - (279,983)
Total shareholders’ equity attributable to the Group 1,036,160 - (271,199) 48,726 (51,337) 762,350
Shareholders’ equity attributable to minority interest
Share capital and reserves - - - - - -
Gains (losses) recognised directly in equity - - - - - -
Net profit (loss) for the period - - - - - -
Total shareholders’ equity attributable to minorityinterests - - - - - -
TOTAL 1,036,160 - (271,199) 48,726 (51,337) 762,350
€/’000Balance at
Dec. 31, 2011
Adjustment toclosing
balanceAmountcredited
Trasferred tothe IncomeStatement
Othermovement
Balance atDec. 31, 2012
Shareholders’ equity attributable to the Group
Share capital 73,382 - 52 - - 73,434
Other equity instruments - - - - - -
Capital reserves 56,013 - 484 - - 56,497
Retained earnings and other equity reserves 847,716 - 46,854 - (73,388) 821,182
(Treasury shares) (2,045) - - - - (2,045)
Exchange difference reserve - - - - - -
Net profit (loss) for the period 67,267 - 283,756 - - 351,023
Other components of statement of other comprehensive income (279,983) - 390,053 10,286 - 120,356
Total shareholders’ equity attributable to the Group 762,350 - 721,199 10,286 (73,388) 1,420,447
Shareholders’ equity attributable to minority interest
Share capital and reserves - - - - - -
Gains (losses) recognised directly in equity - - - - - -
Net profit (loss) for the period - - - - - -
Total shareholders’ equity attributable to minorityinterests - - - - - -
TOTAL 762,350 - 721,199 10,286 (73,388) 1,420,447
Statement of changes in equity
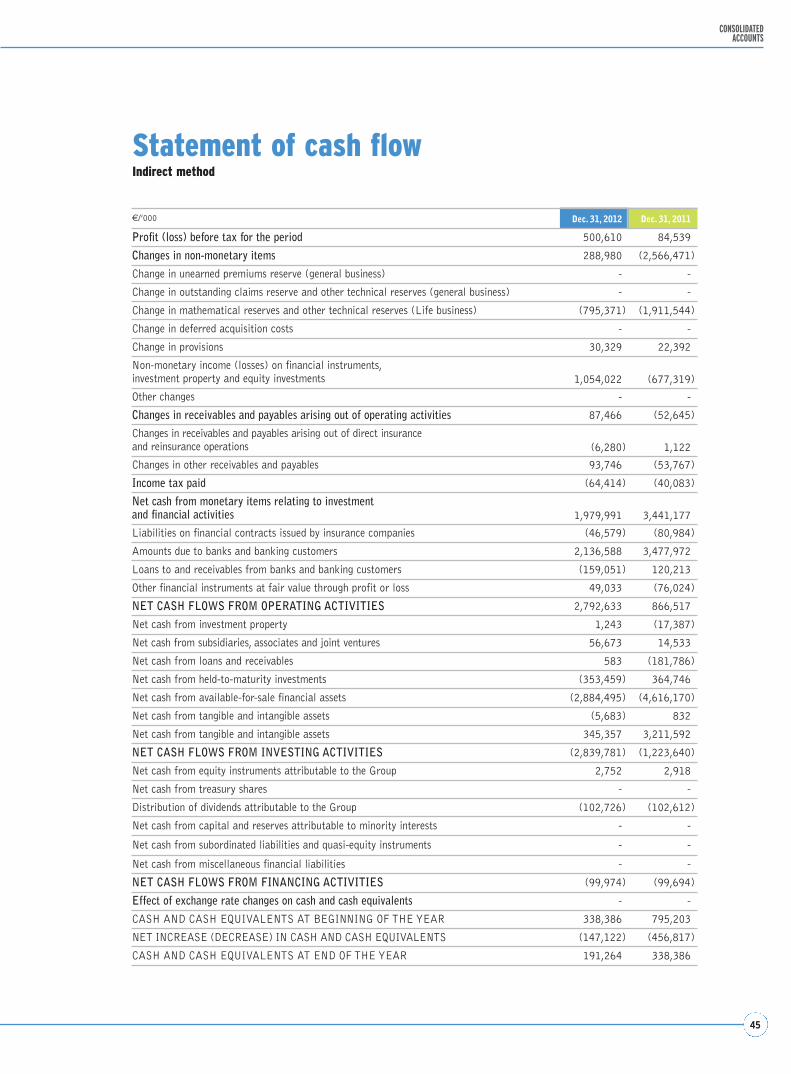
45
CONSOLIDATEDACCOUNTS
Statement of cash flow Indirect method
€/’000 Dec. 31, 2012 Dec. 31, 2011
Profit (loss) before tax for the period 500,610 84,539
Changes in non-monetary items 288,980 (2,566,471)
Change in unearned premiums reserve (general business) - -
Change in outstanding claims reserve and other technical reserves (general business) - -
Change in mathematical reserves and other technical reserves (Life business) (795,371) (1,911,544)
Change in deferred acquisition costs - -
Change in provisions 30,329 22,392
Non-monetary income (losses) on financial instruments, investment property and equity investments 1,054,022 (677,319)
Other changes - -
Changes in receivables and payables arising out of operating activities 87,466 (52,645)
Changes in receivables and payables arising out of direct insurance and reinsurance operations (6,280) 1,122
Changes in other receivables and payables 93,746 (53,767)
Income tax paid (64,414) (40,083)
Net cash from monetary items relating to investment and financial activities 1,979,991 3,441,177
Liabilities on financial contracts issued by insurance companies (46,579) (80,984)
Amounts due to banks and banking customers 2,136,588 3,477,972
Loans to and receivables from banks and banking customers (159,051) 120,213
Other financial instruments at fair value through profit or loss 49,033 (76,024)
NET CASH FLOWS FROM OPERATING ACTIVITIES 2,792,633 866,517
Net cash from investment property 1,243 (17,387)
Net cash from subsidiaries, associates and joint ventures 56,673 14,533
Net cash from loans and receivables 583 (181,786)
Net cash from held-to-maturity investments (353,459) 364,746
Net cash from available-for-sale financial assets (2,884,495) (4,616,170)
Net cash from tangible and intangible assets (5,683) 832
Net cash from tangible and intangible assets 345,357 3,211,592
NET CASH FLOWS FROM INVESTING ACTIVITIES (2,839,781) (1,223,640)
Net cash from equity instruments attributable to the Group 2,752 2,918
Net cash from treasury shares - -
Distribution of dividends attributable to the Group (102,726) (102,612)
Net cash from capital and reserves attributable to minority interests - -
Net cash from subordinated liabilities and quasi-equity instruments - -
Net cash from miscellaneous financial liabilities - -
NET CASH FLOWS FROM FINANCING ACTIVITIES (99,974) (99,694)
Effect of exchange rate changes on cash and cash equivalents - -
CASH AND CASH EQUIVALENTS AT BEGINNING OF THE YEAR 338,386 795,203
NET INCREASE (DECREASE) IN CASH AND CASH EQUIVALENTS (147,122) (456,817)
CASH AND CASH EQUIVALENTS AT END OF THE YEAR 191,264 338,386


Notes to theConsolidatedAnnualFinancialStatements
2012

48
CONSOLIDATED ANNUALFINANCIAL STATEMENTS
2012
These notes are structured as follows:
Part A - Accounting Basis and Scope of Consolidation
Part B - Accounting policies
Part C - Information on the consolidated statement of financial position
Part D - Information on the consolidated income statement
Part E - Segmental information
Part F - Information on risks and risk management
Part G - Business combinations
Part H - Related Party Transactions
Part I - Equity-settled share-based payment transactions
PART A - ACCOUNTING BASIS AND SCOPE OF CONSOLIDATION
Pursuant to Legislative Decree No. 38 of February 28, 2005, the consolidated financial statements for the year
ended December 31, 2012 of the Mediolanum Group were prepared in accordance with the International
Accounting and Financial Reporting Standards (IAS/IFRS) issued by the International Accounting Standards
Board (IASB) and the related interpretations of the International Financial Reporting Interpretations Committee
(IFRIC) as adopted by the European Commission under European Parliament and Council Regulation (EC) 1606
of July 19, 2002.
The Mediolanum Group is a financial conglomerate that operates primarily in the insurance business under
Legislative Decree 142 of May 30, 2005.
In accordance therewith, the Mediolanum Group’s financial statements for the year ended December 31, 2012 were
prepared following the “Instructions for the preparation of IFRS consolidated accounts” issued by ISVAP (Italy’s
supervisory authority for insurance companies) in accordance with Regulation No. 7 of July 13, 2007, as subse-
quently amended by ISVAP Regulation 2784 of March 8, 2010.
Accounting Basis
In the preparation of the consolidated financial statements the Group applied the International Accounting and
Financial Reporting standards IAS/IFRS (including SIC and IFRIC interpretations) in effect at December 31,
2012, as adopted by the European Commission, as well as the underlying assumptions set out in the IASB
Framework for the Preparation and Presentation of Financial Statements.
The consolidated financial statements consist of:
• Statement of financial position;
• Income Statement;
Notes to the Consolidated AnnualFinancial Statements

49
NOTES TO THE CONSOLIDATEDANNUAL FINANCIAL STATEMENTS
• Statement of Comprehensive Income;
• Statement of Changes in Equity;
• Statement of Cash Flows;
• Explanatory Notes.
In addition to the Directors’ Report.
The consolidated financial statements were prepared pursuant to section 154 ter of Legislative Decree 58/98 intro-
duced by Legislative Decree 195/07 which transposed into national legislation the so called “Transparency
Directive”. Said statute requires listed issuers whose home Member State is Italy to approve their annual financial
statements not later than 120 days after the end of the financial year and publish the annual report including:
• the separate financial statements;
• the consolidated financial statements, where applicable;
• the directors’ reports;
• the responsibility statement pursuant to section 154-bis, paragraph 2.
The complete independent auditors’ reports pursuant to sections 14 and 16 of Legislative Decree No. 39/2010 are
published together with the annual report.
In accordance with art. 5 of Legislative Decree No. 38/2005 the financial statements were prepared using the euro
as reporting currency.
The amounts set out in the Accounts, in the Notes and the Directors’ Report are presented in thousands of euros
unless stated otherwise.
The accounts and the notes also include comparative information for the year ended December 31, 2011. Where
necessary, for the sake of comparability of financial information, certain reclassifications were made with respect
to prior period’s comparative information.
The accounts and the notes were prepared also in accordance with ISVAP Regulation 7 of July 13, 2007, as amend-
ed by ISVAP Regulation 2784 of March 8, 2010 to incorporate certain changes introduced in international
accounting and financial reporting standards IAS/IFRS since the date of the previous ISVAP regulation. Certain
tables set out in the notes have been rationalised to bring financial reporting more in line with European harmonised
standards.
Scope of consolidation
The consolidated financial statements include the accounts of Mediolanum S.p.A. and those of its directly or indi-
rectly controlled subsidiaries.
The subsidiaries which are consolidated on a line-by-line basis in accordance with the international accounting stan-
dards are set out in the tables below.
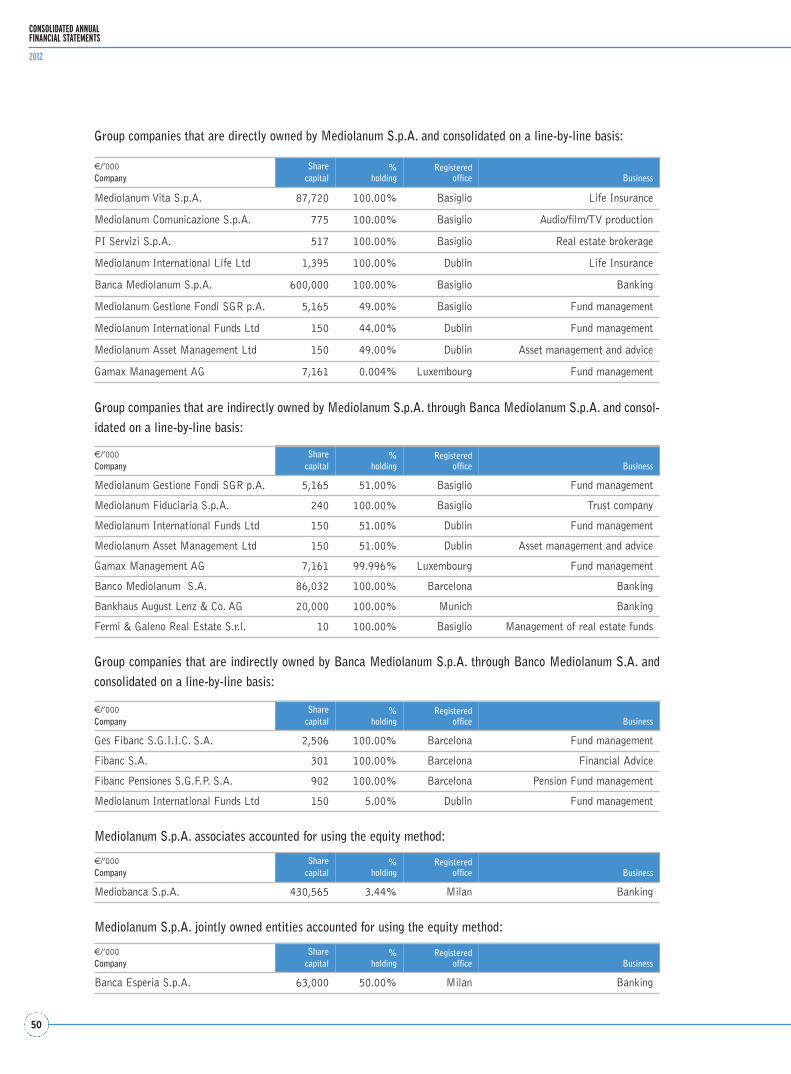
50
CONSOLIDATED ANNUALFINANCIAL STATEMENTS
2012
Group companies that are directly owned by Mediolanum S.p.A. and consolidated on a line-by-line basis:
€/’000Company
Share capital
%holding
Registeredoffice Business
Mediolanum Vita S.p.A. 87,720 100.00% Basiglio Life Insurance
Mediolanum Comunicazione S.p.A. 775 100.00% Basiglio Audio/film/TV production
PI Servizi S.p.A. 517 100.00% Basiglio Real estate brokerage
Mediolanum International Life Ltd 1,395 100.00% Dublin Life Insurance
Banca Mediolanum S.p.A. 600,000 100.00% Basiglio Banking
Mediolanum Gestione Fondi SGR p.A. 5,165 49.00% Basiglio Fund management
Mediolanum International Funds Ltd 150 44.00% Dublin Fund management
Mediolanum Asset Management Ltd 150 49.00% Dublin Asset management and advice
Gamax Management AG 7,161 0.004% Luxembourg Fund management
Group companies that are indirectly owned by Mediolanum S.p.A. through Banca Mediolanum S.p.A. and consol-idated on a line-by-line basis:
€/’000Company
Share capital
%holding
Registeredoffice Business
Mediolanum Gestione Fondi SGR p.A. 5,165 51.00% Basiglio Fund management
Mediolanum Fiduciaria S.p.A. 240 100.00% Basiglio Trust company
Mediolanum International Funds Ltd 150 51.00% Dublin Fund management
Mediolanum Asset Management Ltd 150 51.00% Dublin Asset management and advice
Gamax Management AG 7,161 99.996% Luxembourg Fund management
Banco Mediolanum S.A. 86,032 100.00% Barcelona Banking
Bankhaus August Lenz & Co. AG 20,000 100.00% Munich Banking
Fermi & Galeno Real Estate S.r.l. 10 100.00% Basiglio Management of real estate funds
€/’000Company
Share capital
%holding
Registeredoffice Business
Ges Fibanc S.G.I.I.C. S.A. 2,506 100.00% Barcelona Fund management
Fibanc S.A. 301 100.00% Barcelona Financial Advice
Fibanc Pensiones S.G.F.P. S.A. 902 100.00% Barcelona Pension Fund management
Mediolanum International Funds Ltd 150 5.00% Dublin Fund management
Group companies that are indirectly owned by Banca Mediolanum S.p.A. through Banco Mediolanum S.A. andconsolidated on a line-by-line basis:
Mediolanum S.p.A. associates accounted for using the equity method:
€/’000Company
Share capital
%holding
Registeredoffice Business
Mediobanca S.p.A. 430,565 3.44% Milan Banking
Mediolanum S.p.A. jointly owned entities accounted for using the equity method:
€/’000Company
Share capital
%holding
Registeredoffice Business
Banca Esperia S.p.A. 63,000 50.00% Milan Banking

51
NOTES TO THE CONSOLIDATEDANNUAL FINANCIAL STATEMENTS
Methods of consolidation
Subsidiaries are consolidated on a line-by-line basis, while associates and joint ventures are accounted for using the
equity method.
Consolidation on a line-by-line basis
Consolidation is the combination of the accounts of the parent company and those of its subsidiaries line by line by
adding together like items of the statement of financial position and the income statement. After minority interests in
the net assets and minority interests in the profit or loss of subsidiaries are separately identified, the carrying amount
of the parent’s investment in each subsidiary and the parent’s portion of equity of each subsidiary are eliminated.
Any resulting difference, if positive, after recognition of the assets or liabilities of the subsidiary, is recognised as
goodwill under “Intangible Assets” on first-time consolidation. Negative differences are recognised in the income
statement.
Intercompany assets, liabilities, income and expenses are eliminated in full.
Business combinations are accounted for by applying the purchase method. Goodwill acquired in a business combi-
nation is initially measured at cost, being the excess of the cost of the business combination over the Group’s (acquir-
er’s) interest in the net fair value of the identifiable assets, liabilities and contingent liabilities of the acquiree.
After initial recognition, goodwill is measured at cost less any accumulated impairment losses. For the purpose of
impairment testing, goodwill acquired in a business combination is allocated, from the acquisition date, to each of
the Group’s (acquirer’s) cash-generating units or groups of cash-generating units, that are expected to benefit from
the synergies of the combination, irrespective of whether other assets or liabilities of the acquiree are assigned to
those units or groups of units.
If goodwill has been allocated to a cash-generating unit (or group of cash-generating units) and the Group dispos-
es of an operation within that unit, the goodwill associated with the operation disposed of is included in the carry-
ing amount of the operation when determining the gain or loss on disposal and is measured on the basis of the rel-
ative values of the operation disposed of and the portion of the cash-generating unit retained.
The income and expenses of a subsidiary acquired during the reporting period are included in the consolidated finan-
cial statements from the date of acquisition. Accordingly, the income and expenses of a subsidiary disposed of in the
reporting period are included in the consolidated financial statements until the date on which the parent ceases to
control the subsidiary. Any difference between the consideration for the disposal of the subsidiary and its carrying
amount as of the date of disposal is recognised in the income statement.
The financial statements of the Parent Company and those of its subsidiaries used in the preparation of the consol-
idated financial statements are prepared as of the same reporting date.
When a company within the Group uses different accounting policies, in preparing the consolidated financial state-
ments adjustments are made to make them uniform with the accounting policies adopted by the Group.
Equity method
Under the equity method, an investment is initially recognised at cost and its carrying amount is increased or
decreased thereafter to reflect the value of the investor’s share of the investee’s equity and profit. The investor’s

52
CONSOLIDATED ANNUALFINANCIAL STATEMENTS
2012
share of the profit or loss of the investee is recognised under the relevant item in the consolidated income state-
ment, and the investor’s share of changes in the investee’s equity, other than transactions with the shareholders, is
recognised under the relevant item in the consolidated statement of statement of other comprehensive income. If
there is evidence that an investment may be impaired, its recoverable amount is calculated by estimating the pres-
ent value of future cash flows expected to be generated by the associate, including the proceeds on the ultimate dis-
posal of the investment. If the recoverable amount is lower than the carrying amount, the resulting difference is
recognised in the income statement. In applying the equity method to investments in associates the approved
IAS/IFRS annual financial statements of associates were used.
Post balance sheet date events
On March 19, 2013, Italy’s insurance regulator IVASS (previously named ISVAP) gave the green light to
Mediolanum S.p.A.’s acquisition of the entire share capital of Mediolanum Assicurazioni S.p.A. resolved by the
Board of Directors of Mediolanum S.p.A. on September 11, 2012. The consideration for the acquisition will there-
fore be based on Mediolanum Assicurazioni S.p.A.’s accounts and the value of its in-force business at March 31,
2013.
In the period between the end of financial year 2012 and the date on which these financial statements were
approved, there was no other event which could materially impact the business or result of operations of the
Mediolanum Group.
Significant non-recurring transactions or events
In the year under review, there were no non-recurring events or transactions, i.e. events or transactions which do
not occur frequently in the ordinary course of business, which could have a material impact on the financial posi-
tion, results of operations and cash flows of the Mediolanum Group (cf. Consob Communication DEM/6064293 of
July 28, 2006).

53
NOTES TO THE CONSOLIDATEDANNUAL FINANCIAL STATEMENTS
PART B – ACCOUNTING POLICIES
This section presents the accounting policies applied in the preparation of the consolidated financial statements for
the year ended December 31, 2012.
The accounting policies applied in the preparation of the consolidated financial statements, with respect to the clas-
sification, measurement, recognition and derecognition of the various items of assets and liabilities as well as the
various items of income and expense, are consistent with those applied in the preparation of the consolidated finan-
cial statements for the year ended December 31, 2011.
New standards, interpretations and amendments to standards that have been adoptedby the Group beginning from January 1, 2012
The Group has adopted amendments to IFRS 7 ‘Financial Instruments: Disclosures’ issued by the IASB on October
7, 2010 that became effective for financial years beginning on January 1, 2012. The IASB issued said amendments
to allow users of financial statements to improve their understanding of transfers of financial assets (derecogni-
tion), including understanding the possible effects of any risks that may remain with the entity that transferred the
assets. The amendments also require additional disclosures if a disproportionate amount of transfer transactions
are undertaken around the end of a reporting period. The adoption of said amendments did not have any material
impact on the Group’s financial statements.
New standards, interpretations and amendments to standards that are not yet effective and have not been adopted early by the Group
On June 16, 2011, the IASB issued an amendment to IAS 1 ‘Presentation of Financial Statements’. The amend-
ment requires companies to group items of Other Statement of other comprehensive income according to whether
they may be subsequently reclassified to profit or loss. Application of the revised standard is required for financial
years beginning on or after July 1, 2012. The adoption of this amendment in these financial statements would have
had no impact on the financial position, result of operations and cash flows of the Group, but it would have entailed
rearranging the presentation of items of other statement of other comprehensive income.
On June 16, 2011, the IASB also issued an amendment to IAS 19 ‘Employee Benefits’. The amendment eliminates
the option to defer the recognition of actuarial gains/losses under the ‘corridor’ approach, requiring immediate recog-
nition of changes in the plan’s net assets/liabilities, recognition in the income statement of service costs, interest cost
as well as of actuarial gains/losses resulting from the re-measurement of assets and liabilities in Other Statement of
other comprehensive income. Expected returns on plan assets are replaced by recognition in the income statement of
interest income calculated using the discount rate used to measure the obligation. The amended standard also intro-
duces additional information disclosures in the notes to the financial statement. The amended standard will become
effective for annual periods beginning on or after January 1, 2013 with retrospective application required. The intro-
duction of the amended standard will have an impact on the Group’s equity on its first-time adoption, due to the dif-
ferent requirement for recognition of actuarial gains/losses. At the date of these financial statements, the Group esti-
mates the impact of the adoption of the amended standard will be about €667 thousand reduced costs in the income
statement and the concurrent recognition of a negative equity reserve of €484 thousand after tax.

54
CONSOLIDATED ANNUALFINANCIAL STATEMENTS
2012
On December 20, 2010, the IASB issued an amendment to IAS 12 – ‘Income Taxes - Deferred Tax: Recovery of
Underlying Assets’ clarifying how deferred tax liabilities and assets on investment properties measured at fair value
are to be determined. The amendment was endorsed by the EU with the publication of ‘Commission Regulation (EU)
1255/2012 of December 11, 2012’ in the EU Official Journal L 360 of December 29, 2012. The amendment intro-
duced the presumption that the carrying amount of investment properties measured using the fair value model in
IAS 40 would be recovered through sale and the measurement of deferred tax liabilities or assets should reflect the
consequences of recovering the carrying amount through sale. The amendment made to IAS 12 superseded SIC
Interpretation 21 ‘Income Taxes – Recovery of Revalued Non-Depreciable Assets’ that was withdrawn. The amend-
ment to IAS 12 will become effective for financial years beginning on or after the date on which the EU Regulation
entered into force (which was the third day following its publication in the EU Official Journal). The adoption of the
amendment to IAS 12 in these financial statements would have had no impact on the financial position, result of
operations and cash flows of the Group nor on other disclosures.
On May 12, 2011, the IASB issued IFRS 10 ‘Consolidated Financial Statements’ superseding SIC 12
‘Consolidation – Special Purpose Entities’ and the requirements relating to consolidated financial statements of
IAS 27 ‘Consolidated and Separate Financial Statements’. The amended IAS 27 titled ‘Separate Financial
Statements’ sets out the requirements for accounting treatment of investments in subsidiaries, joint ventures, and
associates in separate (non-consolidated) financial statements. The new standard IFRS 10 was endorsed by the EU
with publication of ‘Commission Regulation (EU) 1254/2012 of December 11, 2012’ in the EU Official Journal L
360 of December 29, 2012. Built on existing principles, the new standard identifies control as the basis to deter-
mine which entities are to be consolidated by the parent company in its consolidated accounts. It also provides guid-
ance on how to assess control to determine whether or not the parent has control over an entity. The standard shall
be applied at the latest as from the commencement date of the entity’s financial year starting on or after January
1, 2014. Early adoption is permitted provided that IFRS 10 is adopted at the same time as IFRS 11, IFRS 12, IAS
27 and IAS 28. Only IFRS 12 can be adopted early without the others. The adoption of the new standard IFRS 10
in these financial statements would have had no impact on the financial position, result of operations and cash flows
of the Group.
On May 12, 2011, the IASB issued IFRS 11 ‘Joint Arrangements’ superseding IAS 31 ‘Interests in Joint Ventures’
and SIC 13 ‘Jointly Controlled Entities – Non-Monetary Contributions by Venturers’. The new standard was
endorsed by the EU with publication of ‘Commission Regulation (EU) 1254/2012 of December 11, 2012’ in the
EU Official Journal L 360 of December 29, 2012. The new standard establishes principles for financial reporting
of joint arrangements, for their classification based on the rights and obligations of the parties to the arrangements
instead of their legal form, and that jointly controlled entities that meet the definition of a joint venture must be
accounted for exclusively by using the equity method in the consolidated financial statements. Following the issue
of IFRS 11, IAS 28 ‘Investments in Associates’ was amended to include in its scope from the effective date of IFRS
11 also joint ventures (revised IAS 28 ‘Investments in Associates and Joint Ventures’). IFRS 11 shall be applied
at the latest as from the commencement date of the entity’s financial year starting on or after January 1, 2014.
Early adoption is permitted provided that IFRS 10, IFRS 11, IFRS 12, IAS 27 and IAS 28 are adopted at the
same time. Only IFRS 12 can be adopted early without the others. The adoption of the new standard in these finan-
cial statements would have had no impact on the financial position, result of operations and cash flows of the Group.
On May 12, 2011, the IASB issued IFRS 12 ‘Disclosure of Interests in Other Entities’. This new standard includes
all disclosure requirements for all interests in other entities, including subsidiaries, joint arrangements, associates,
structured entities and unconsolidated entities. The new standard was endorsed by the EU with publication of
‘Commission Regulation (EU) 1254/2012 of December 11, 2012’ in the EU Official Journal L 360 of December
55
NOTES TO THE CONSOLIDATEDANNUAL FINANCIAL STATEMENTS
29, 2012. IFRS 12 shall be applied at the latest as from the commencement date of the entity’s financial year start-
ing on or after January 1, 2014. Early adoption of IFRS 12 is permitted. The adoption of the new standard in these
financial statements would have had no impact on the financial position, result of operations and cash flows of the
Group. The Group is assessing the potential impact on disclosures relating to subsidiaries.
On May 12, 2011, the IASB issued IFRS 13 ‘Fair Value Measurement’ that clarifies how fair value is to be meas-
ured. IFRS 13 applies anytime another IFRS requires or permits fair value measurements or disclosures about
measurements based on fair value. The new standard was endorsed by the EU with publication of ‘Commission
Regulation (EU) 1255/2012 of December 11, 2012’ in the EU Official Journal L 360 of December 29, 2012. IFRS
13 shall be applied at the latest as from the commencement date of the entity’s financial year starting on or after
January 1, 2013. Early adoption of IFRS 13 is permitted. The Group is assessing the potential impact of the adop-
tion of the new standard.
On December 16, 2011, the IASB issued amendments to IAS 32 ‘Financial Instruments: Presentation-Offsetting
Financial Assets and Financial Liabilities’ to provide additional guidance on consistent application of IAS 32
regarding offset of financial assets and financial liabilities. The new standard was endorsed by the EU with publi-
cation of ‘Commission Regulation (EU) 1256/2012 of December 13, 2012’ in the EU Official Journal L 360 of
December 29, 2012. The revised standard shall be applied at the latest as from the commencement date of the enti-
ty’s financial year starting on or after January 1, 2014. Early adoption is permitted for amendments to IAS 32 pro-
vided that they are adopted together with amendments to IFRS 7. The adoption of the revised standard in these
financial statements would have had no impact on the financial position, result of operations and cash flows of the
Group, nor on other disclosures.
On December 16, 2011, the IASB issued amendments to IFRS 7 ‘Financial Instruments: Disclosures’ to require the
provision of information on the effects or potential effects of offsetting financial assets and liabilities on the state-
ment of financial position. The new standard was endorsed by the EU with publication of ‘Commission Regulation
(EU) 1256/2012 of December 13, 2012’ in the EU Official Journal L 360 of December 29, 2012. The revised stan-
dard shall be applied at the latest as from the commencement date of the entity’s financial year starting on or after
January 1, 2013. The adoption of the new standard in these financial statements would have had no impact on the
financial position, result of operations and cash flows of the Group, nor on other disclosures.
On May 17, 2012, the IASB issued a collection of amendments to IFRSs (“Annual Improvements to IFRSs – 2009-
2011 Cycle”) to be applied retrospectively to annual periods beginning on or after January 1, 2013. Amendments
relate, inter alia, to the following standards:
IAS 1 – Presentation of financial statement. The amendment clarifies requirements for presentation of compara-
tive information when an entity changes accounting policies or makes retrospective restatements or reclassifica-
tions, and when an entity provides an additional statement of financial position that is more than information
required under the standard.
IAS 16 – Property, Plant and Equipment. The amendment clarifies that spare parts, stand-by or servicing equip-
ment are to be capitalised only when they meet the definition of property, plant and equipment (PPE), otherwise
they are to be classified as Inventory.
IAS 32 – Financial Instruments. The amendment eliminates inconsistencies between IAS 32 and IAS 12 Income
Taxes, clarifying that income taxes relating to distributions to shareholders are to be recognised in the income state-
ment to the extent to which they relate to income generated from transactions originally recognised in the income
statement.

56
CONSOLIDATED ANNUALFINANCIAL STATEMENTS
2012
Financial assets at fair value through profit or loss
This category includes:
• investment contracts to the benefit of life policyholders who bear the risk thereof and in connection with pension
fund management;
• financial assets held for trading.
Financial assets at fair value through profit or loss consist of debt securities, equities and trading derivatives with
positive fair value.
Financial assets at fair value through profit or loss are initially recognised on the settlement date if they are debt
securities and equities, and on the trade date if they are derivatives.
On initial recognition financial assets at fair value through profit or loss are measured at cost, i.e. the fair value of
the instrument, without adding directly attributable transaction costs or income.
After initial recognition financial assets at fair value through profit or loss are measured at their fair value.
The fair value of a financial instrument quoted in an active market1 is determined using its market quotation. If the
market for a financial instrument is not active, fair value is determined using estimation and valuation techniques
which measure all instrument-related risks and use market data, e.g. the quoted price of instruments with similar
characteristics, discounted cash flow analysis, option pricing models, recent comparable transactions.
Financial assets are derecognised when the contractual rights to the cash flows from the financial asset expire or
the financial asset and substantially all the risks and rewards of ownership thereof are transferred.
Available-for-sale financial assets
Available-for-sale financial assets include non-derivative financial assets that are not classified as Loans and
Receivables, Financial Assets Held for Trading or Held-to-Maturity Investments.
In particular, shareholdings that are not held for trading and those that do not qualify as investments in subsidiaries,
associates or joint ventures are also classified under this category.
Available-for-sale financial assets are initially recognised on the settlement date if they are debt or equity instru-
ments and on the trade date if they are loans or receivables.
On initial recognition available-for-sale financial assets are measured at cost, i.e. the fair value of the instrument,
plus any directly attributable transaction costs or income. When reclassified out of the Held-to-Maturity
Investments category, available-for-sale financial assets are re-measured at their fair value on such reclassification.
After initial recognition available-for-sale financial assets continue to be measured at fair value, and are amortised
through profit or loss, while gains or losses arising from a change in their fair value are recognised in a specific
equity reserve until the financial asset is derecognised or impaired. At the time of their dismissal or impairment, the
cumulative gain or loss previously recognised in equity is recognised in the income statement.
Equity instruments whose fair value cannot be reliably measured as set out above are measured at cost.
1 A financial instrument is regarded as quoted in an active market if quoted prices are readily and regularly available from an exchange, dealer,broker, industry group, pricing service or regulatory agency and those prices represent actual and regularly occurring market transactions on anarm’s length basis.
57
NOTES TO THE CONSOLIDATEDANNUAL FINANCIAL STATEMENTS
At each interim and annual statement of financial position date the Group assesses whether there is objective evi-
dence of any impairment loss.
If the fair value of a previously impaired asset increases and the increase can be objectively related to an event
occurring after the impairment loss was recognised, the impairment loss is reversed and the reversal recognised in
the income statement if the asset is a loan or receivable or a debt instrument, and in equity if the asset is an equi-
ty instrument. The reversal shall not result in a carrying amount of the financial asset that exceeds what the amor-
tised cost would have been had the impairment loss not been recognised at the date the impairment is reversed.
Financial assets are derecognised when the contractual rights to the cash flows from the financial asset expire or
the financial asset and substantially all the risks and rewards of ownership thereof are transferred.
Held-to-maturity investments
Held-to-maturity investments consist of debt securities with fixed or determinable payments and fixed maturity
which the Group intends or has the ability to hold to maturity. If, as a result of a change in intention or ability, it is
no longer appropriate to classify an investment as held to maturity, it is reclassified as an available-for-sale finan-
cial asset.
Held-to-maturity investments are initially recognised on settlement date.
Held-to-maturity investments are initially measured at cost, including any directly attributable costs or income.
When reclassified out of the available-for-sale financial assets category, the fair value on such reclassification is the
value of the amortised cost at which held-to-maturity investments are carried.
After initial recognition held-to-maturity investments are measured at amortised cost using the effective interest
method.
Gains or losses of held-to-maturity investments are recognised in the income statement when the financial asset is
derecognised or impaired, and through the amortisation process.
At each interim and annual reporting date the Group assesses whether there is objective evidence of any impair-
ment loss.
If any such evidence exists, the amount of the impairment loss is measured as the difference between the carrying
amount of the asset and the present value of estimated future cash flows, discounted at the financial asset’s origi-
nal effective interest rate. The amount of the impairment loss is recognised in the income statement.
If the value of a previously impaired investment increases and the increase can be objectively related to an event
occurring after the impairment loss was recognised, the impairment loss is reversed and the reversal recognised in
the income statement.
Held-to-maturity investments are derecognised when the contractual rights to the cash flows from the financial
asset expire or the financial asset and substantially all the risks and rewards of ownership thereof are transferred.
Hedging
Hedging transactions are intended to offset changes in the fair value or cash flows of an item or group of items,
that are attributable to a particular risk, in the event that risk materialises.
Pursuant to IAS 39 the Company adopted fair value hedging to cover exposure to changes in the fair value of a
financial item, that is attributable to a particular risk. Specifically, the Company entered into fair value hedges of
the interest rate exposure of a portfolio of financial assets or financial liabilities.

58
CONSOLIDATED ANNUALFINANCIAL STATEMENTS
2012
Only instruments that involve a party external to the Group can be designated as hedging instruments. A hedge of
an overall net position in a portfolio of financial instruments does not qualify for hedge accounting.
Hedging derivatives are measured at fair value. As they are accounted for as fair value hedges, the changes in the
fair value of the hedged item are offset by the changes in the fair value of the hedging instrument. Hedge account-
ing recognises the offsetting effects on profit or loss of changes in the fair values of the hedging instrument and the
hedged item (in relation to changes generated by the underlying risk). Any resulting difference, which represents the
partial ineffectiveness of the hedge, is the net effect on profit or loss.
Fair value is determined on the basis of quoted prices in an active market, prices quoted by market participants or
internal valuation models commonly used in financial practice, which take into account all risk factors associated
with the instruments and based on market information.
Derivatives are recognised as hedging derivatives if there is formal documentation of the hedging relationship
between the hedging instrument and the hedged item and if, at the inception of the hedge and prospectively, the
hedge is expected to be effective during the period for which the hedge is designated.
A hedge is effective if it achieves offsetting changes in the fair value of the hedged risk.
The hedging relationship is considered effective if, at the inception of the hedge and in subsequent periods, the
changes in the fair value of the hedged item are offset by the changes in fair value of the hedging instrument and
if the actual results of the hedge are within a range of 80%-125%.
Hedge effectiveness is assessed at the date the entity prepares its annual or interim financial statements, using:
• prospective tests which support hedge accounting in terms of expected effectiveness;
• retrospective tests which show the degree of hedge effectiveness in the relevant past periods.
In other words, they measure how much actual results differed from perfect hedging.
If the tests do not confirm hedge effectiveness, hedge accounting is discontinued, the hedging derivative is reclassi-
fied into trading instruments while the hedged item is again recognised according to its usual classification in the
statement of financial position and the changes in the fair value of the hedged item up until the date hedge account-
ing was discontinued are amortised applying the effective interest rate.
Loans and receivables
This category includes loans to customers and to banks with fixed or determinable payments, that are not quoted
in an active market and that, upon initial recognition, were not classified as available-for-sale financial assets.
Loans and receivables also include trade receivables, repurchase agreements and securities purchased under a pub-
lic offering or private placement, with fixed or determinable payments, that are not quoted in an active market.
A loan or receivable is initially recognised at fair value on the trade date or, in the case of a debt instrument, on the
settlement date. The fair value of a loan or receivable is the loaned amount, or the transaction price, including any
directly attributable costs or income determinable on the trade date, even if settled at a later date, except for those
costs that are reimbursed by the borrower/debtor or are internal administrative costs.
Carryovers and repurchase agreements which entail the obligation for a future resale/repurchase are recognised as
funding or lending transactions. Specifically, the amount received for the sale of an asset under an agreement to
repurchase it at a future date is recognised in the statement of financial position as a debt, while the amount paid
for the purchase of an asset under an agreement to resell it at a future date is recognised as a loan.
After initial recognition, loans and receivables are measured at amortised cost. Amortised cost is the amount at which
59
NOTES TO THE CONSOLIDATEDANNUAL FINANCIAL STATEMENTS
the financial asset is measured on initial recognition minus principal repayments, plus or minus the cumulative amor-
tisation using the effective interest method of any difference between that initial amount and the maturity amount,
plus or minus any directly attributable costs/income and minus/plus any reduction/reversal for impairment.
The effective interest rate is the rate that exactly discounts estimated future cash flows (principal and interest) to
the net carrying amount of the asset, i.e. the carrying amount plus/minus any directly attributable costs/income,
through the expected life of the asset.
Amortised cost is not applied to short-terms loans and receivables for which the effect of discounting is immateri-
al. Those loans and receivables are measured at historical cost and the related costs/income are recognised in the
income statement over the expected life of the asset.
At each interim and annual reporting date the Group assesses whether there is objective evidence of any impair-
ment loss as a result of one or more events that occurred after initial recognition. If there is objective evidence of
impairment the loan or receivable is classified as follows:
• nonperforming – these are formally impaired loans i.e. exposures to borrowers that are unable to meet their pay-
ment obligations, even if their insolvency has not been established by a court of law, or in equivalent conditions;
• watch list – these are exposures to borrowers that are experiencing temporary difficulties in meeting their pay-
ment obligations but are expected to make good within a reasonable timeframe. Watch list loans also include
exposures – other than to nonperforming borrowers or to government entities – that satisfy both the following
conditions:
– have been past due and unpaid for over 270 days (over 150 or 180 days for consumer loans with original
maturity of less than 36 months, or of 36 months or more, respectively);
– the aggregate exposure as per the previous paragraph and in relation to other payments that are less than
270 days past due – to the same borrower accounts for at least 10% of total exposure to that borrower;
• restructured – exposures for which a grace period was accorded with concurrent renegotiation of the loan terms
and conditions at below market rates, that were in part converted into shares and/or for which a principal reduc-
tion was agreed;
• past due – exposures to borrowers other than those classified in the categories above, that at the reporting date
were over 90 days past due or overdrawn. Total exposure is considered if at the reporting date:
– the past due /overdrawn amount,
or:
– the mean value of daily past due/overdrawn amounts in the last quarter was 5% or more of total exposure.
Impaired loans are individually assessed and the amount of the impairment loss is measured as the difference
between the asset’s carrying amount (measured at amortised cost) at the time of assessment and the present value
of estimated future cash flows discounted at the financial asset’s original effective interest rate.
Future cash flows are estimated taking into account the expected time of recovery, the realisable value of any col-
laterals as well as any costs of recovery. Future cash flows of loans which are expected to be recovered in the short
term are not discounted.
The asset’s original effective interest rate remains unchanged over time also in the event of a restructuring as a
result of which the interest rate changes or the loan or receivable actually carries no interest.
The amount of the impairment loss is recognised in the income statement.
If the value of a previously impaired loan or receivable increases and the increase can be objectively related to an
event occurring after the impairment loss was recognised, the impairment loss is reversed and the reversal recog-
nised in the income statement.

60
CONSOLIDATED ANNUALFINANCIAL STATEMENTS
2012
The reversal shall not result in a carrying amount of the financial asset that exceeds what the amortised cost would
have been had the impairment loss not been recognised at the date the impairment is reversed.
If no objective evidence of impairment exists for individually assessed loans – i.e. generally, performing loans – those
loans are collectively assessed for impairment. For the purpose of a collective evaluation of impairment, loans and
receivables are grouped on the basis of similar credit risk characteristics and the related loss probability is estimat-
ed using historical loss rates based on observable data at the time of assessment that can reliably estimate the loss
probability of each loan group.
Any collectively assessed impairment loss is recognised in the income statement. At each interim and annual report-
ing date any additional impairment loss or reversal thereof is calculated in relation to the entire portfolio of per-
forming loans on that same date.
Equity investments
This account relates to investments in associates and joint ventures that are accounted for using the equity method.
An associate is an entity over which the parent company (the investor) has significant influence, i.e. it holds, direct-
ly or indirectly, 20 per cent or more of the voting power of the investee or, if it holds less than 20 per cent of the
voting power of the investee, it has the power to participate in the financial and operating policy decisions of the
investee under legal arrangements, e.g. a shareholders’ agreement.
An investment in an associate is accounted for using the equity method from the date on which the parent begins
to have significant influence over the associate. The parent discontinues the use of the equity method from the date
it ceases to have significant influence over the associate and from that date it accounts for the investment in accor-
dance with IAS 39, provided that the associate does not become a subsidiary or a joint venture.
A joint venture is an entity in which the parent company (the investor) holds, directly or indirectly, 50 per cent of
the voting power of the investee and a third party holds the other 50 percent. An investment in a joint venture is
accounted for using the equity method in the same way as investments in associates.
If there is evidence that an investment in an associate or joint venture may be impaired, its recoverable amount is
calculated by estimating the present value of future cash flows expected to be generated by the associate or joint
venture, including the proceeds on the ultimate disposal of the investment.
If the recoverable amount is lower than the carrying amount, the resultant difference is recognised in the income
statement.
If the value of a previously impaired investment increases and the increase can be objectively related to an event
occurring after the impairment loss was recognised, the impairment loss is reversed and the reversal recognised in
the income statement.
Investment property and other tangible assets
Tangible assets include land, Group-occupied property, investment property, furnishings, fixtures, fittings, plant and
equipment.
These are tangible items that are held for use in the production or supply of goods or services, for rental to others,
or for administrative purposes and that are expected to be used during more than one period.
This account also includes assets held under finance leases even when the lessor retains title thereof.

61
NOTES TO THE CONSOLIDATEDANNUAL FINANCIAL STATEMENTS
Tangible assets are initially recognised at cost, which comprises the purchase price of the asset and all costs direct-
ly attributable to the asset’s acquisition and operation.
The costs of major repairs which increase the future economic benefits associated with the asset are recognised in
the carrying amount of the asset, while the costs of day-to-day servicing are recognised in the income statement.
Tangible assets, including investment property, are carried at cost less any accumulated depreciation and impair-
ment losses.
Tangible assets are systematically depreciated on a straight-line basis over their useful lives except for land, be it
acquired separately or together with buildings, which has an indefinite useful life. Under the international account-
ing standards land and buildings are separable assets and are to be accounted for separately. When the value of land
is embedded in the value of the building, only for land on which a building stands, their respective value is deter-
mined by independent valuers.
At each interim and annual reporting date if there is an indication that an asset may be impaired the carrying
amount of the asset is compared to its recoverable amount. The recoverable amount of an asset is the higher of its
fair value less costs to sell and its value in use. Value in use is the present value of the future cash flows expected
to be derived from an asset. If the recoverable amount of an asset is less than its carrying amount, the carrying
amount is reduced to its recoverable amount. Any reduction is recognised as impairment loss in the income state-
ment.
If the value of a previously impaired asset increases, the impairment loss is reversed. The reversal shall not result
in a carrying amount of the asset that exceeds what the carrying amount less accumulated depreciation would have
been had the impairment loss not been recognised at the date the impairment is reversed.
A tangible asset is derecognised from the statement of financial position on disposal or when no future economic
benefits are expected from its use or disposal.
Intangible assets
Intangible assets include goodwill and software used over more than one year.
Goodwill is the excess of the cost of the acquisition over the acquirer’s interest in the fair value of the identifiable
assets and liabilities acquired. Other intangible assets are recognised if they are identifiable as such and arise from
contractual or other legal rights.
An intangible asset can be recognised as goodwill when the excess of the cost of the acquisition over the acquirer’s
interest in the fair value of the identifiable assets and liabilities acquired (including any accumulated impairment
losses) is representative of the future earnings capabilities of the investee.
Any negative goodwill (badwill) is directly recognised in the income statement.
Other intangible assets are carried at cost less any accumulated amortisation and impairment losses only if it is
probable that future economic benefits attributable to the asset will flow to the entity and the cost of the asset can
be measured reliably, otherwise it is recognised as an expense in the income statement in the year in which it was
incurred. Intangible assets are amortised on a straight-line basis over their useful lives. Intangible assets with indef-
inite useful lives are not amortised, but periodically tested for impairment by comparing their recoverable amount
with their carrying amount.
At each reporting date, if there is evidence of impairment, the recoverable amount of the asset is estimated. If the
recoverable amount of the asset is less than its carrying amount, the carrying amount of the asset is reduced to its
recoverable amount. That reduction is an impairment loss. The impairment loss is recognised in profit or loss.

62
CONSOLIDATED ANNUALFINANCIAL STATEMENTS
2012
An intangible asset is derecognised on disposal or when no future economic benefits are expected from its use or
disposal.
Other assets
Other assets include expenditure on the renovation of leasehold property.
Expenditure on the renovation of leasehold property is capitalised since during the lease term the lessee controls
the assets and obtains future economic benefits from them.
Expenditure on the renovation of leasehold property is amortised over a period which does not exceed the lease
term.
Financial liabilities at fair value through profit or loss
Financial liabilities at fair value through profit or loss include:
• deposit accounts relating to financial contracts (under which the investment risk is borne by the policyholder)
and to the management of pension funds;
• trading derivatives with negative fair value;
• short positions on securities trading.
Deposit accounts relating to financial contracts under which the investment risk is borne by the policyholder reflect
with the best possible approximation the value of holdings in investment funds or benchmark stock indices. These
liabilities are backed by assets carried at fair value.
The same applies to the liabilities relating to the Previgest Mediolanum non-occupational pension fund.
Financial liabilities are initially recognised at the time the policy is issued or amounts are received.
They are initially measured at the fair value of the assets under the contract (policy), i.e. generally the issue price
of the underlying assets.
After initial recognition, financial liabilities are measured at fair value.
A financial liability is derecognised when it expires or is extinguished.
Debt and securities issued/Other financial liabilities
Other financial liabilities include bonds issued. These financial liabilities are initially recognised when amounts are
received or bonds are issued.
They are initially measured at fair value, i.e. generally the amount received or the issue price, plus any additional
costs/ income directly attributable to the individual funding transaction or bond issue and not reimbursed by the
creditor. Internal administrative costs are not added.
The fair value of any financial liabilities issued below market value is subject to assessment and the difference over
market value is directly recognised in the income statement.
After initial recognition, financial liabilities are measured at amortised cost using the effective interest method

63
NOTES TO THE CONSOLIDATEDANNUAL FINANCIAL STATEMENTS
except for short-term liabilities for which the time value of money is immaterial that are measured on the basis of
the contractual cash flows and related costs are recognised in the income statement over the contractual term of
the liability.
A financial liability is derecognised when it expires or is extinguished. A financial liability is derecognised also when
it is bought back. The difference between the carrying amount of the liability and the amount paid to buy it back is
recognised in the income statement.
Life Technical Reserves
Life technical reserves represent the reserves for liabilities under insurance contracts and investment contracts with
Discretionary Participation Features (DPF).
Life technical reserves include mathematical reserves, calculated on each individual contract according to the pay-
ment commitments undertaken and on the basis of the actuarial assumptions adopted for the computation of relat-
ed premiums. Mathematical reserves include all revaluations applied in accordance with contract terms, as well as
provisions for demographic risk. Mathematical reserves are not lower than surrender value.
Life technical reserves also include amounts set aside for the portion of premiums and the portion of contract-relat-
ed expenses, e.g. handling costs and additional health premiums, that relate to future periods.
At each reporting date an assessment is made of the adequacy of insurance contract reserves (liability adequacy
test) using current estimates of future cash-flows under insurance contracts. If the assessment reveals that the car-
rying amount of reserves is inadequate in the light of the estimated future cash flows, the Group increases reserves
and recognises the difference in the income statement.
Technical reserves for contracts with DPF represent the reserves for liabilities arising on unrealised gains on assets
under segregated fund management contracts.
When net gains arise on assets under contracts with Discretionary Participation Features (DPF) the Group raises
a so-called shadow accounting reserve.
This reserve is recognised in equity when the unrealised gains or losses are recognised in equity, otherwise is recog-
nised in the income statement.
Assets/Liabilities associated with disposal groups held for sale
This account relates to non-current assets/liabilities and disposal groups held for sale. They are measured at the
lower of their carrying amount and fair value less cost to sell.
Related income and expenses (after taxes) are separately recognised in the income statement.
Provisions for risks and charges
Provisions for risks and charges relate to amounts set aside for present obligations resulting from a past event for
which it is probable that an outflow of resources embodying economic benefits will be required to settle the obliga-
tion, provided that a reliable estimate can be made of the obligation.
64
CONSOLIDATED ANNUALFINANCIAL STATEMENTS
2012
When the effect of the time value of money is material, the amount of the provision is discounted at current mar-
ket rates. Provisions for risk and charges are recognised in the income statement.
Employee completion-of-service entitlements
Completion-of-service entitlements are recognised at the present value of the benefit obligations calculated using
actuarial techniques in accordance with the rules governing ‘defined benefit plans’. Future disbursements are esti-
mated on the basis of past data (such as employee turnover and retirement) and demographic patterns, including
assumptions for pay hikes pursuant to section 2120 of the Italian Civil Code (application of a fixed rate of 1.5 per-
cent and a rate equal to 75 percent of ISTAT inflation rate). To determine the present value of benefit obligations
the Projected Unit Credit Method is used. As to the discount rate it was decided to apply the rate implied in IBOXX
EUR Corporate AA indices published by Markit Group Ltd as these indices correspond to the implied internal rate
of return of euro-denominated liquid corporate securities. The resulting values are recognised under staff costs as
the net total of current service costs, past service costs, accrued interest and actuarial gains or losses. Actuarial
gains or losses are fully recognised under staff costs.
Entitlements accrued from January 1, 2007 allocated to either INPS or private pension plans are defined contri-
bution payment obligations, since the company’s obligation is limited to the amount it agrees to contribute to the
fund. The defined contribution obligations for each period are the amounts to be contributed for that period.
Employee pension plan
For the defined contribution pension plan under which the company’s obligation is limited to the amount it agrees
to contribute to the fund, the amount of the contribution payable for the year is recognised in the income statement.
Assets and liabilities denominated in foreign currencies
Assets and liabilities denominated in foreign currencies are initially recognised in the functional currency, applying
to the foreign currency amount the exchange rate in effect at the date of the transaction.
At each interim or annual reporting date, assets and liabilities denominated in foreign currencies are measured as
follows:
• monetary items are translated using the closing rate;
• non-monetary items measured at historical cost are translated applying the exchange rate in effect at the date
of the transaction;
• non-monetary items measured at fair value are translated applying the exchange rate in effect at the reporting
date.
Exchange differences arising on the settlement of monetary items or on translating monetary items at rates differ-
ent from those at which they were translated on initial recognition during the period or in previous financial state-
ments are recognised in the income statement in the period in which they arise.

65
NOTES TO THE CONSOLIDATEDANNUAL FINANCIAL STATEMENTS
When a gain or loss on a non-monetary item is recognised directly in equity, the exchange difference component of
that gain or loss is also recognised in equity. Conversely, when a gain or loss on a non-monetary item is recognised
in the income statement, the exchange difference component of that gain or loss is also recognised in the income
statement.
Tax assets and liabilities
The Italian companies that are part of the Mediolanum Group adhere to the so-called ‘tax consolidation regime’
regulated by articles 117-129 of the Consolidated Income Tax Act introduced into Italy’s tax legislation by
Legislative Decree 344/2003. Under said regime each participating subsidiary may elect to calculate its own tax
base separately, taking into account, inter alia, any withholding taxes, tax deductions and tax credits. The resulting
taxable income or loss of all participating subsidiaries is aggregated and transferred to the parent company. The
parent company adds its taxable income or loss and calculates the consolidated tax expense or income as a single
tax reporting entity.
The Mediolanum Group companies that elected to apply the ‘tax consolidation regime’ calculated their tax base and
transferred the resulting taxable income to the Parent Company. Any tax losses of one or more subsidiaries are
transferred to the Parent Company if the Group generated taxable income in the year or is expected to generate
taxable income in the future.
The Group recognises current and deferred taxes applying the tax rates in effect in the countries where consolidat-
ed subsidiaries are incorporated.
Income taxes are recognised in the income statement except for items which are credited/charged directly to equity.
Provisions for income taxes are calculated on the basis of conservative estimates of the current and deferred tax
expense. Deferred taxes are computed in respect of the temporary differences, with no time limit, arising between
the tax bases of assets and liabilities and their carrying amounts in the financial statements.
Deferred tax assets are recorded to the extent that there is reasonable certainty they will be recovered, i.e. to the
extent that the company – or the Parent Company under Italy’s tax consolidation regime – is expected to continue
to generate sufficient taxable income against which temporary differences can be utilised.
Deferred tax assets and deferred tax liabilities are not netted, and are separately recognised in the statement of
financial position under “Tax assets” and “Tax liabilities” respectively.
Deferred taxes are accounted for using the liability method on temporary differences between the tax base of an
asset or liability and its carrying amount in the statement of financial position.
A deferred tax liability is recognised for all taxable temporary differences.
A deferred tax asset is recognised for all deductible temporary differences, and the carry-forward of unused tax
losses and unused tax credits, to the extent that it is probable that taxable profit will be available against which the
deductible temporary difference and the carry-forward of unused tax losses and unused tax credits can be utilised,
unless:
• the deferred tax asset arises from the initial recognition of an asset or liability in a transaction that is not a busi-
ness combination and, at the time of the transaction, affects neither accounting profit nor taxable profit (tax loss);
• a deferred tax asset is also recognised for all deductible temporary differences associated with investments in
subsidiaries, associates and joint ventures, only to the extent that it is probable that the temporary difference will
reverse in the foreseeable future and taxable profit will be available against which the temporary difference can
be utilised.

66
CONSOLIDATED ANNUALFINANCIAL STATEMENTS
2012
Deferred tax assets and deferred tax liabilities are systematically re-measured to reflect any changes either in tax
rules or tax rates as well as any possible changes in the company’s tax position.
The provision for tax claims relates to tax payments which may become due as a result of pending tax audits or
disputes with tax authorities.
Treasury shares
Treasury shares are deducted from equity. Their original cost, any gains or losses on their sale are recognised direct-
ly in equity.
Income Statement
Revenue is recognised when received or when it is probable that future economic benefits will flow to the entity and
the amount of those benefits can be measured reliably.
Specifically:
• commissions are measured on an accrual basis;
• interest income and interest expense are recognised on an accrual basis applying the effective interest method;
• dividends are recognised in the income statement when their distribution to shareholders is established;
• any default interests, in accordance with the terms of the relevant agreement, are recognised in the income state-
ment only when actually received.
Other information
Use of estimates
The application of International Accounting and Financial Reporting Standards (IAS/IFRS) in the preparation of
financial statements entails the use of complex valuations and estimates which have an impact on assets, liabilities,
revenues and costs recognised in the financial statements as well as on the identification and quantification of
potential assets and liabilities. These estimates primarily relate to:
• estimates and assumptions used to determine the fair value of financial instruments that are not quoted in an
active market (fair value hierarchy levels 2 and 3);
• identification of loss events as per IAS 39;
• assumptions used for the identification of any objective evidence of impairment of intangible assets and equity
investments recognised in the statement of financial position;
• determination of impairment losses on loans and other financial assets;
• determination of provisions for risks and charges;
• estimates and assumptions for the determination of the probability of utilisation of deferred tax assets;
• assumptions used to determine the costs of stock options plans for top management and sales network members;
• estimates to determine technical reserves;
• assumptions used to determine employee completion-of-service entitlements.

67
NOTES TO THE CONSOLIDATEDANNUAL FINANCIAL STATEMENTS
Senior management regularly check valuations and estimates made on the basis of past experience and other rea-
sonable factors. Due to the uncertainty typically related to these financial items, actual values may differ from esti-
mates due to the occurrence of unexpected events or changes in operating conditions.
For information about the methods used to determine the financial items above and main risk factors readers are
referred to the previous sections of these notes for information on accounting policies and to Part F for informa-
tion on financial risk.
Impairment
When upon assessment at the reporting date there is any indication that an asset may be impaired, the tangible or
intangible asset is tested for impairment in accordance with IAS 36.
An asset is impaired when its carrying amount exceeds its recoverable amount, which is the higher of its fair value
less cost to sell (the amount obtainable from the sale of the asset in an arm’s length transaction between knowl-
edgeable, willing parties) and its value in use (i.e. the present value of the future cash flows expected to be derived
from the permanent use of the assets and its disposal at the end of its useful life).
If an asset is impaired, the relevant impairment loss is recognised in profit or loss and the depreciation (amortisa-
tion) charge for the asset shall be adjusted accordingly in future periods.
If, in a subsequent period, there is any indication that the impairment loss recognised in prior periods no longer
exists, the previously recognised impairment loss is reversed.
If there is objective evidence that a financial asset is impaired, the Group applies the provisions of IAS 39, except
for financial assets carried at fair value through profit or loss.
Indications of possible impairment include events such as significant financial difficulties of the issuer, default or
delinquency in interest or principal payments, the possibility that the borrower will enter bankruptcy or other finan-
cial reorganisation and the disappearance of an active market for that financial asset.
A significant or prolonged decline in the market value of an investment in an equity instrument or holdings in UCITS
below its cost is also objective evidence of impairment.
Specifically, for equities, there is evidence of impairment where the decline in the original fair value exceeds one-
third or is prolonged for over 36 months.
If there is objective evidence of impairment, the amount of the impairment loss is measured:
• as the difference between the asset’s carrying amount and the present value of estimated future cash flows dis-
counted at the financial asset’s effective interest rate computed at initial recognition, for financial assets carried
at amortised cost;
• as the difference between cost (for equity instruments) or amortised cost (for debt instruments) and current
market value, for available-for-sale financial assets.
If, in a subsequent period, the reasons for the impairment loss no longer exist, the impairment loss is reversed and
the reversal recognised in the income statement if the asset is a debt instrument, and in equity if the asset is an
equity instrument.
Goodwill is tested for impairment annually (or any time there is evidence of impairment). To that end goodwill is
allocated to the cash-generating unit (CGU). If the recoverable amount of the unit is less than its carrying amount
an impairment loss is recognised. The recoverable amount of a cash-generating unit is the higher of the cash-gener-

68
CONSOLIDATED ANNUALFINANCIAL STATEMENTS
2012
ating unit’s fair value less cost to sell and its value in use. The impairment loss is recognised in the income state-
ment and cannot be reversed.
Share-based payments
Stock options are share-based payments.
Stock options granted, and the corresponding increase in equity, are measured by reference to the fair value of the
stock option at Grant Date, and accounted for during the Vesting Period.
The fair value of the stock option is determined using a valuation technique that takes into account the specific
terms and conditions of the stock option plan in place, in addition to information such as the exercise price and the
life of the option, the current price of underlying shares, the expected volatility of the share price, dividends expect-
ed on the shares and the risk-free interest rate for the life of the option. The pricing model separately measures the
stock option and the probability that the market conditions upon which vesting is conditioned be satisfied. The com-
bination of the two values is the fair value of the stock option.
The cumulative expense recognised at each annual reporting date up until the vesting date takes account of the vest-
ing period and is based on the best available estimate of options that are going to be exercised upon vesting. The
expense or the reversal recognised in the income statement for each year represents the change in the cumulative
expense over the amount recognised in the prior year. No expense is recognised for options that do not vest.

69
NOTES TO THE CONSOLIDATEDANNUAL FINANCIAL STATEMENTS
In the year under review there was no reclassification of assets. The information in the table above relates exclu-
sively to reclassifications made in 2008 of financial instruments which were, in part, sold in subsequent periods.
Fair value hierarchy
Fair value disclosures
Reclassifications of assets
€/’000
No reclassification impact on profit/loss
(before tax)
Impact of reclassifications for the year (before tax)
Type of financial instrument(1)
Reclassifiedfrom
(2)
Reclassifiedto
(3)
Book value atDec. 31, 2012
(4)
Fair value atDec. 31, 2012
(5)Valuation
(6)Other
(7)Valuation
(8)Other
(9)
A. Debt securities 169,445 168,595 8,098 4,894 7,133 5,335
HFT AFS 141,144 141,144 7,133 3,740 7,133 4,160
HFT Loans toCustomers 28,301 27,451 965 1,154 - 1,175
€/’000
L1 L2 L3 Total
2012 2011 2012 2011 2012 2011 2012 2011
Available for sale financial assets 11,759,893 8,387,380 463,724 564,908 95,452 110,118 12,319,069 9,062,406
Financial assets at fair valuethrough profit or loss
Financial assets held for trading 1,180,778 2,752,157 32,937 116,003 7,774 39,756 1,221,489 2,907,916
Financial assets at fair value 9,800,501 9,051,992 2,268,591 2,888,501 900,529 791,113 12,969,621 12,731,606
Total 22,741,172 20,191,529 2,765,252 3,569,412 1,003,755 940,987 26,510,179 24,701,928
Financial liabilities at fair valuethrough profit or loss
Financial liabilities held for trading 235,672 320,066 23,477 17,418 1,967 3,861 261,116 341,345
Financial liabilities at fair value 46,090 27,839 120,044 120,440 15,795 - 181,930 148,279
Total 281,762 347,905 143,521 137,858 17,762 3,861 443,045 489,624

70
CONSOLIDATED ANNUALFINANCIAL STATEMENTS
2012
A.3.2.3 Year’s movements in Level 3 financial liabilities
€/’000
FINANCIAL LIABILITIES
held for trading at fair value hedges
1. Opening balance 3,861 - -
2. Increases (1,964) - -
2.1 Issues - - -
2.2 Losses recognised
2.2.1 Through profit or loss (388) - -
- of which: losses (388) - -
2.2.2 In equity X X -
2.3 Transferred from other level - - -
2.4 Other increases (1,576) - -
3. Decreases 70 - -
3.1 Redemptions - - -
3.2 Buybacks - - -
3.3 Losses recognised
3.3.1 Through profit or loss 70 - -
- of which: gains 70 - -
3.3.2 In equity X X -
3.4 Transferred to other level - - -
3.5 Other decreases - - -
4. Closing balance 1,967 - -
A.3.2.2 Year’s movements in Level 3 financial assets
€/’000
FINANCIAL ASSETS
held for trading at fair value available for sale hedges
1. Opening balance 39,756 791,113 110,118 -
2. Increases 105,964 727,122 16,040 -
2.1 Purchases 104,096 594,669 12,633 -
2.2 Profits recognised
2.2.1 Through profit or loss 1,845 132,453 659 -
- of which: gains - 5,543 - -
2.2.2 In equity X X 685 -
2.3 Transferred from other level - - - -
2.4 Other increases 23 - 2,063 -
3. Decreases (137,946) (617,706) (30,706) -
3.1 Sales (123,007) (578,954) (20,777) -
3.2 Redemptions (75) - - -
3.3 Losses recognised
3.3.1 Through profit or loss (521) (27,255) (1,516) -
- of which: losses - (8,155) (685) -
3.3.2 In equity X X (6,631) -
3.4 Transferred to other level (5,039) - (622) -
3.5 Other decreases (9,304) (11,497) (1,160) -
4. Closing balance 7,774 900,529 95,452 -

71
NOTES TO THE CONSOLIDATEDANNUAL FINANCIAL STATEMENTS
PART C – INFORMATION ON THE CONSOLIDATED STATEMENT OF FINANCIAL POSITIONASSETS
INTANGIBLE ASSETS
€/’000 Dec. 31, 2012 Dec. 31, 2011
Goodwill 129,886 149,864
Other intangible assets 23,096 17,002
Total 152,982 166,866
This section provides disclosures on impairment testing conducted on cash generating units (CGUs) in operation at
December 31, 2012, in accordance with IAS 36 and the instructions set forth in the document jointly issued by the
Bank of Italy, CONSOB and ISVAP on March 3, 2010.
The purpose of impairment testing is to ascertain that the carrying amount of each cash generating unit (CGU) does
not exceed its recoverable amount, i.e. the benefit that can be derived from it, either through future use (value in
use) or by its disposal (fair value less cost to sell), whichever is the higher.
Goodwill recognised in the consolidated accounts of the Mediolanum Group is lower than value in use. In connec-
tion therewith, you are advised that the Mediolanum Group average stock market value in 2012 was 2x its equity
book value.
Impairment testing was conducted with the assistance of an independent valuation expert applying the methods and
assumptions set out below.
DEFINITION OF CGUs AND ALLOCATION OF GOODWILL
Like in prior years, CGUs have been identified on the basis of the geographic area of operations in accordance with
the Mediolanum Group business reporting system. Hence, impairment testing was conducted on the CGUs set out
in the table below.
Goodwill allocated to the CGU Spain included goodwill relating to Banco Mediolanum amounting to €123.0 mil-
lion. Following the recognition of impairment in 2011, no goodwill was allocated to Bankhaus August Lenz & Co
AG (BAL). In conformity with the Group’s business reporting system, Gamax’s goodwill amounting to €27 million
was allocated to two different CGUs (Italy Life and Germany), on a pro-rata basis of total assets adjusted for prof-
itability. Goodwill allocated to the CGU Germany was €4.3 million, and goodwill allocated to the CGU Italy Life
was €22.7 million.
€/m DescriptionAllocated goodwill
CGU - SPAIN Banco Mediolanum S.A. 123.0
CGU - GERMANY Gamax Management AG - German division 4.3
CGU - ITALY Life Gamax Management AG - Italian division 22.7

72
CONSOLIDATED ANNUALFINANCIAL STATEMENTS
2012
VALUATION METHOD
As done in prior years, the recoverable amount of the CGUs was determined by calculating their value in use. Under
IAS 36 value in use can be calculated applying the Discounted Cash Flow (DCF) method whereby the value in use
of a CGU, or an entity, is determined by computing the present value of future cash flows (from operations) it is
expected to generate over time.
For lenders, it is common practice to apply the Free Cash Flow to Equity (FCFE) model known in Anglo-Saxon
countries as ‘Dividend Discount Model’ (DDM), in the Excess Capital variant, that determines the value of the
entity on the basis of the future cash flows it expects to be capable of distributing to the shareholders, without
impacting the assets supporting its future growth, in compliance with regulatory capital requirements, and apply-
ing a discount rate which reflects the specific equity risk. Please note that although the name Dividend Discount
Model contains the term ‘dividend’, the cash flows it calculates are not the dividends the entity expects to dis-
tribute to its shareholders, but the cash flows potentially available to equity holders net of the assets needed for
business operation.
CGU SPAINThe recoverable amount of the CGU Spain was determined based on value in use calculated by applying the DDM
method to the information set out in the 2013-2015 Business Plan (the 2013-2015 Plan) approved by the Boards
of Directors of Banco Mediolanum and Banca Mediolanum S.p.A..
The 2013-2015 Plan was built on reasonable, consistent assumptions and represents the management best estimate
of the range of possible future developments for the CGU.
The 2013-2015 Plan confirmed the strategic lines set out in the previous plan (2012-2015 Plan), notably the devel-
opment of Banca Mediolanum’s business model in Spain.
The previous plan was updated to incorporate most recent expectations in relation to interest rate developments over
the plan period and inflows forecasts on the basis of volumes and sales network numbers at December 31, 2012.
Specifically, the 2013-2015 Plan is based on the following key assumptions:
• growth in assets under management and administration at an average annual rate of 13%;
• business margin growth at an average annual rate of 2.2%;
• increase in general expenses at an average annual rate of 2.5%;
To determine the value in use of the CGU two scenarios were considered:
• Base scenario: developed using the projections set out in the 2013-2015 Plan;
• Prudential scenario: developed using the projections set out in the Plan with the exclusion of corporate treasury
activities.
In both scenarios cash-flows were estimated assuming a minimum Tier 1 Capital ratio of 8.5%.
Under the Capital Asset Pricing Model the discount rate applied to calculate the present value of future cash flows
(ke) was estimated at 13.9%, based on the following parameters:
• risk-free rate of 5.8% calculated on the basis of average historical 12-month yields on 10-year Spanish treasuries;
• beta coefficient (risk measure of the stock compared to the market) of 1,14 calculated on the basis of the his-
torical 2-year beta of a panel of comparable entities operating in the Spanish banking market;
73
NOTES TO THE CONSOLIDATEDANNUAL FINANCIAL STATEMENTS
• market premium (i.e. the premium required by investors to buy equities in lieu of risk-free assets) of 5% in line
with common practice;
• specific risk premium conservatively estimated at 2.5% to take into account the underlying uncertainty in the
execution of the plan;
• the value of the CGU Spain at the end of the plan period was calculated based on cash flows available in 2015,
excluding the contribution of corporate treasury activities, and assuming 2% long-term growth in line with long-
term inflationary expectations.
Under the prudential scenario, the recoverable amount of CGU Spain was found to be €102.8 million which
was lower than its consolidated carrying amount (€122.9 million), essentially due to the results of the 2013-
2015 three-year plan. The Group, therefore, decided to write down the goodwill allocated to CGU Spain by
€20.1 million.
CGU GERMANY
The recoverable amount of the CGU Germany was determined based on value in use calculated by applying the DDM
method to the information set out in the 2013-2016 Business Plan approved by the directors of Gamax (for the
German division of Gamax) and the 2013-2015 Business Plan approved by the directors of BAL. Both Business
Plans were also approved by the Board of Directors of Banca Mediolanum S.p.A..
GAMAX - GERMAN DIVISION
The 2013-2016 Plan was built on reasonable, consistent assumptions and represents the management best estimate
of the range of possible future business developments of the German Division of Gamax.
The previous plan was updated to incorporate most recent expectations in relation to financial market performance
and interest rate developments over the plan period.
At December 31, 2012, the profitability of the German Division of Gamax was €1.5 million, essentially in line with
the prior year (€1.4 million).
Specifically, the 2013-2016 Plan of the German Division of Gamax was based on the following key assumptions:
• assets under administration growth at an average annual rate of 13.5%;
• growth in business margin at an average annual rate of 11.5%;
• increase in general expenses at an average annual rate of 10.9%.
Under the Capital Asset Pricing Model the discount rate applied to calculate the present value of future cash flows
(ke) was estimated at 8.1% based on the following parameters:
• risk-free rate of 1.5% calculated on the basis of average historical 6-month yields on 10-year German treasuries;
• beta coefficient (risk measure of the stock compared to the market) of 1,13 calculated on the basis of the his-
torical 2-year beta of a panel of comparable entities;
• market premium (i.e. the premium required by investors to buy equities in lieu of risk-free assets) of 5% in line
with common practice;
• specific risk premium conservatively estimated at 1.0% to take into account underlying uncertainty in the exe-
cution of the plan.
74
CONSOLIDATED ANNUALFINANCIAL STATEMENTS
2012
The value at the end of the plan period was calculated based on cash flows available in 2016, and assuming 2%
long-term growth in line with long-term inflationary expectations. Prudentially, the capital surplus that would poten-
tially be available was not considered.
BAL
BAL’s 2013-2015 Plan was built on reasonable, consistent assumptions and represents the management best esti-
mates of the possible future business developments of BAL.
BAL’s plan approved by the Bank in the previous year was confirmed.
At December 31, 2012, BAL recorded a loss of €6.5 million (€13.1 million in 2011).
Specifically, BAL’s 2013-2015 Plan was based on the following key assumptions:
• growth in business margin from €2.2 million in 2013 to €9.3 million in 2015;
• return to profit in financial year 2015, the last year of the plan.
Under the Capital Asset Pricing Model the discount rate applied to calculate the present value of future cash flows
(ke) was estimated at 10.6% based on the following parameters:
• risk-free rate of 1.5% calculated on the basis of average historical 6-month yields on 10-year German treasur-
ies;
• beta coefficient (risk measure of the stock compared to the market) of 1,13 calculated on the basis of the his-
torical 2-year beta of a panel of comparable entities;
• market premium (i.e. the premium required by investors to buy equities in lieu of risk-free assets) of 5% in line
with common practice;
• specific risk premium conservatively estimated at 3.5% to take into account the risk of missing plan targets in
the light of negative historical data.
The value at the end of the plan period was calculated based on cash flows available in 2015, and assuming 2%
long-term growth in line with long-term inflationary expectations.
CGU GERMANY
The DDM exercise conducted on CGU Germany (German Division of Gamax and BAL) did not reveal any impair-
ment losses.
Sensitivity to changes in some key assumptions was tested. The recoverable amount was found to be equal to the
carrying amount of the CGU for the following changes in key assumptions:
• 436 bps increase in discount rate;
• 585 bps decrease in long term growth;
• net profitability 36% lower than forecast in the plans.
CGU ITALY LIFE
The recoverable amount of this CGU is assumed higher than the goodwill allocated to the CGU amounting to €22.7
million. The recoverable amount of this CGU is assumed higher than its carrying amount. The comparison of
Mediolanum S.p.A. stock market capitalisation (€2.8 billion at December 31, 2012) to its equity (€1.4 billion at
December 31, 2012) reveals an implicit multiple of 2.0x, indicating no impairment of goodwill allocated to the
CGU Italy Life.

75
NOTES TO THE CONSOLIDATEDANNUAL FINANCIAL STATEMENTS
Analysis of intangible assets
Year’s movements in intangible assets
€/m Dec. 31, 2012 Dec. 31, 2011
CGU SPAIN 102.8 122.8
CGU GERMANY 4.3 4.3
CGU ITALY LIFE 22.7 22.7
OTHER CGUS 0.1 0.1
Total 129.9 149.9
Dec. 31, 2012 Dec. 31, 2011
€/’000Finite
lifeIndefinite
lifeFinite
lifeIndefinite
life
Goodwill- group - 129,886 - 149,864
Other intangible assetsMeasured at cost - - - -
Other intangible assets 23,096 - 17,002 -
Total 23,096 129,886 17,002 149,864
Goodwill
Other intangible assets: internally
generated
Other intangible assetsother
€/’000 Finite life Indefinite life Finite life Indefinite life Total
Opening balance 149,864 - - 17,002 - 166,866
Increases- Additions- Other changes
-164
--
--
14,449-
--
14,449164
Decrease- Disposals - - - (10) - (10)
- Value adjustments (20,142) - - (7,552) - (27,664)
- Amortisation - - - (7,552) - (7,552)
- Impairment (20,142) - - - - (20,142)
- - in the income statement (20,142) - - - - (20,142)
- Other changes - - - (823) - (823)
Closing balance 129,886 - - 23,096 - 152,982
At statement of financial position date goodwill was allocated to the following CGUs
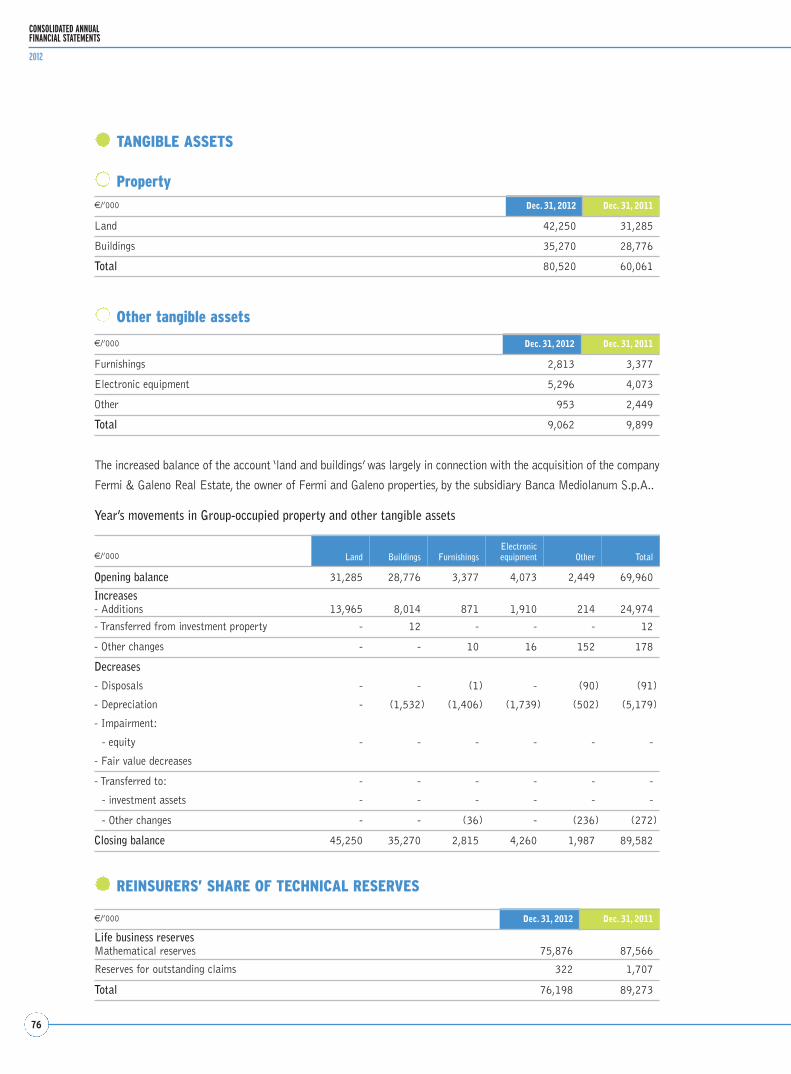
76
CONSOLIDATED ANNUALFINANCIAL STATEMENTS
2012
Other tangible assets
€/’000 Dec. 31, 2012 Dec. 31, 2011
Land 42,250 31,285
Buildings 35,270 28,776
Total 80,520 60,061
€/’000 Dec. 31, 2012 Dec. 31, 2011
Life business reservesMathematical reserves 75,876 87,566
Reserves for outstanding claims 322 1,707
Total 76,198 89,273
€/’000 Dec. 31, 2012 Dec. 31, 2011
Furnishings 2,813 3,377
Electronic equipment 5,296 4,073
Other 953 2,449
Total 9,062 9,899
REINSURERS’ SHARE OF TECHNICAL RESERVES
€/’000 Land Buildings FurnishingsElectronicequipment Other Total
Opening balance 31,285 28,776 3,377 4,073 2,449 69,960
Increases- Additions 13,965 8,014 871 1,910 214 24,974
- Transferred from investment property - 12 - - - 12
- Other changes - - 10 16 152 178
Decreases
- Disposals - - (1) - (90) (91)
- Depreciation - (1,532) (1,406) (1,739) (502) (5,179)
- Impairment:
- equity - - - - - -
- Fair value decreases
- Transferred to: - - - - - -
- investment assets - - - - - -
- Other changes - - (36) - (236) (272)
Closing balance 45,250 35,270 2,815 4,260 1,987 89,582
The increased balance of the account ‘land and buildings’ was largely in connection with the acquisition of the company
Fermi & Galeno Real Estate, the owner of Fermi and Galeno properties, by the subsidiary Banca Mediolanum S.p.A..
Year’s movements in Group-occupied property and other tangible assets
TANGIBLE ASSETS
Property

77
NOTES TO THE CONSOLIDATEDANNUAL FINANCIAL STATEMENTS
INVESTMENTS
Investment property
€/’000 Dec. 31, 2012 Dec. 31, 2011
Land 62,028 62,028
Buildings 44,770 46,013
Total 106,798 108,041
€/’000 Land Buildings
Opening balance 62,028 46,013
Increases- Capitalised improvements - 328
Decreases- Depreciation - Other
--
(1,558)(13)
Closing balance 62,028 44,770
At December 31, 2012, the market value of investment property, as determined by external valuers, amounted to
€123,710 thousand.
Year’s movements in investment property
Investments in associates and joint ventures
The year’s movements in this account relate to the investments in Mediobanca and Banca Esperia accounted for
under the equity method in accordance with the respective share of equity included in the consolidated accounts at
December 31, 2012.
Mediolanum S.p.A. decided to review for impairment the value of its stake in Mediobanca at September 30, 2012.
For that purpose it requested the assistance of a specialist valuation firm. To determine the recoverable amount of
the investment in Mediobanca the dividend discount model in the excess capital variant was used. Due to the lack
of a plan approved by the Board of Directors of Mediobanca, the financial projections used for impairment testing
were derived from recent research done by financial analysts.
The main input assumptions used to determine the recoverable amount of the investment in Mediobanca are set out
below:
• cost of equity at 10.85%, estimated using the Capital Asset Pricing Model (CAPM) assuming:
– a risk free rate of 5.61% (average 6-month gross yield on 10-yr Italian BTP at October 30, 2012);
– beta coefficient of 1.05 (average beta coefficient of the Mediobanca stock at October 30, 2012 based on 2-
year weekly data) which reflects the overall average stock volatility;
– market risk premium of 5% (according to Italian market valuation practice);
€/’000 Dec. 31, 2012 Dec. 31, 2011
Mediobanca S.p.A. 292,406 322,955
Banca Esperia S.p.A. 90,294 81,538
Total 382,700 404,493

78
CONSOLIDATED ANNUALFINANCIAL STATEMENTS
2012
• financial analysts estimates through June 2015;
• inertial projections through 2020 to determine sustainable medium-term average income configuration assum-
ing the gradual alignment of statement of financial position and income components with the long term growth
rate and convergence of cost of risk toward the pre-crisis average value in the years 2007 and 2008; long-term
growth rate for the calculation of Terminal Value at 2% in line with Italian market valuation practice;
• target Tier 1 ratio of 8% (8.5% beginning from 2019, the year in which Basel III will take full effect) and Total
Capital Ratio of 10.5%.
Sensitivity analysis was performed to see how results would vary for changes in key parameters (cost of equity and
long-term growth rate) and it was found that the recoverable amount of the investment in Mediobanca ranged from
€9.3 to €9.8 per share. Based on the analyses above the recoverable amount of the investment in Mediobanca was
determined at €9.5 per share.
Based on said valuation, it was decided to write down the carrying amount of the stake in Mediobanca from €11.78
per share (aggregating to €342.6 million) to €9.5 per share (aggregating to €276.4 million) in the interim
accounts at September 30, 2012.
Impairment review was again undertaken to determine the recoverable amount of the investment in Mediobanca at
December 31, 2012. To that end, Mediolanum S.p.A. requested again the assistance of an independent valuer. This
time the recoverable amount of the stake in Mediobanca was found to range between €9.76 and €10.39 per share,
with a median value of €10.05 per share.
The main input assumptions used to determine the recoverable amount of the investment at December 31, 2012
were as follows:
• financial analysts estimates for the 2013-2015 period;
• cost of equity at 9.96%, estimated using the Capital Asset Pricing Model (CAPM) assuming:
– a risk free rate of 4.75% (average 6-month gross yield on 10-yr Italian BTP at February, 2013);
– beta coefficient of 1.04 (average beta coefficient of the Mediobanca stock in February, 2013 based on 2-year
weekly data) which reflects the overall average stock volatility.
Sensitivity analysis was performed to see how results would vary for changes in cost of equity and long-term growth
rate, and it was found that the recoverable amount of the investment in Mediobanca ranged from €9.76 to €10.39
per share.
Based on the analyses above that were consistent with those applied for impairment review at September 30, 2012,
the recoverable amount of the investment in Mediobanca at year end 2012 was determined at €10.05 per share.
Compared to September 30, 2012, there was a decline in cost of equity largely as a result of the lower risk-free
rate.
In the light of the foregoing, the carrying amount of the equity accounted investment in Mediobanca was adjusted
from €9.93 per share to €10.05 per share in the consolidated accounts at December 31, 2012. The impairment
recognised for financial year 2012 on the investment in Mediobanca aggregated to €62.7 million.
Excluding the impairment above, the impact on the income statement of investments accounted for by the equity
method was a positive balance of €7.5 million versus a positive balance of €6.5million in the prior year.
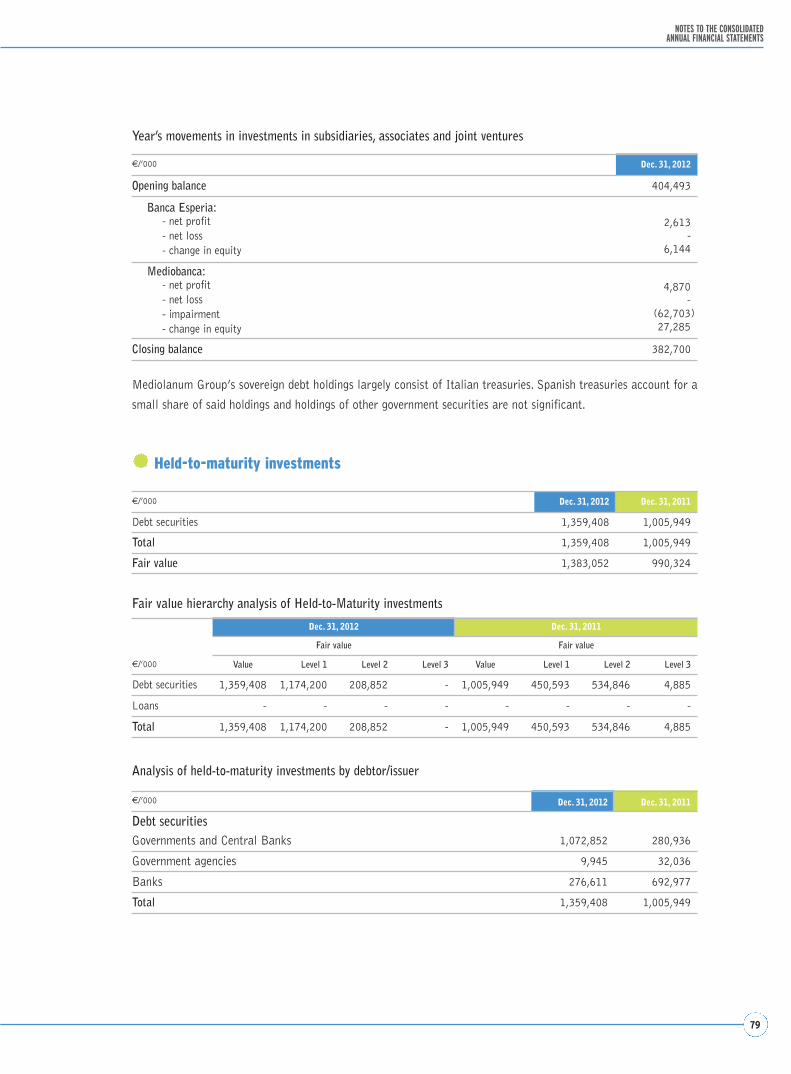
79
NOTES TO THE CONSOLIDATEDANNUAL FINANCIAL STATEMENTS
Fair value hierarchy analysis of Held-to-Maturity investments
Analysis of held-to-maturity investments by debtor/issuer
€/’000
Dec. 31, 2012 Dec. 31, 2011
Fair value Fair value
Value Level 1 Level 2 Level 3 Value Level 1 Level 2 Level 3
Debt securities 1,359,408 1,174,200 208,852 - 1,005,949 450,593 534,846 4,885
Loans - - - - - - - -
Total 1,359,408 1,174,200 208,852 - 1,005,949 450,593 534,846 4,885
€/’000 Dec. 31, 2012 Dec. 31, 2011
Debt securitiesGovernments and Central Banks 1,072,852 280,936
Government agencies 9,945 32,036
Banks 276,611 692,977
Total 1,359,408 1,005,949
Year’s movements in investments in subsidiaries, associates and joint ventures
Mediolanum Group’s sovereign debt holdings largely consist of Italian treasuries. Spanish treasuries account for a
small share of said holdings and holdings of other government securities are not significant.
Held-to-maturity investments
€/’000 Dec. 31, 2012
Opening balance 404,493
Banca Esperia:- net profit - net loss- change in equity
2,613-
6,144
Mediobanca:- net profit- net loss - impairment - change in equity
4,870)-)
(62,703)27,285)
Closing balance 382,700
€/’000 Dec. 31, 2012 Dec. 31, 2011
Debt securities 1,359,408 1,005,949
Total 1,359,408 1,005,949
Fair value 1,383,052 990,324

80
CONSOLIDATED ANNUALFINANCIAL STATEMENTS
2012
Time-to-maturity of held-to-maturity investments
€/’000 Dec. 31, 2012 Dec. 31, 2011
Time to maturity
1-5 years 1,070,412 809,412
5-10 years 172,682 91,473
Over 10 years 116,314 105,064
Total 1,359,408 1,005,949
€/’000 Dec. 31, 2012 Dec. 31, 2011
Time-to-maturity
Within 1 year 466,109 1,891,855
1-5 years 2,198,787 1,236,076
Over 10 years 3,739,456 3,117,953
Total 6,404,352 6,245,884
€/’000 Dec. 31, 2012 Dec. 31, 2011
Banks 1,191,226 1,866,543
Banking customers 5,204,849 4,370,481
Other 8,277 8,860
Total 6,404,352 6,245,884
Loans and receivables
Time-to-maturity of loans and receivables
€/’000 Dec. 31, 2012 Dec. 31, 2011
Deposits with Central Banks- Time deposits 5,500 50,001
- For reserve requirements 71,758 80,352
Loans to banks- Time deposits 208,215 163,080
- Repurchase agreements 211,774 313,058
- Other loans 42,594 17,145
- Debt securities 651,385 1,242,907
Total 1.191,226 1,866,543
Fair value 1,319,140 2,103,289
Loans and receivables: banks

81
NOTES TO THE CONSOLIDATEDANNUAL FINANCIAL STATEMENTS
Available-for-sale financial assets
€/’000 Dec. 31, 2012 Dec. 31, 2011
Debt securities 12,111,226 8,847,747
Equities 34,821 34,387
Holdings in UCITS 173,022 180,272
Total 12,319,069 9,062,406
Loans and receivables: banking customers
The €834.4 million increase in the balance of ‘Loans and receivables – banking customers’ at December 31, 2012
relates to mortgage loans, up €638.5 million, and other transactions (‘other’), up €222 million, consisting prima-
rily of deposits with Cassa Compensazione e Garanzia.
Loans and receivables – banking customers – analysis by borrower/issuer
€/’000 Dec. 31, 2012 Dec. 31, 2011
Bank accounts 418,564 380,697
Repurchase agreements 53,716 9,884
Mortgage loans 3,221,580 2,583,084
Credit cards, personal loans and salary-guaranteed loans 469,838 271,299
Finance leases 1 51
Factoring - -
Other 410,704 188,744
Debt securities 630,446 936,722
Total 5,204,849 4,370,481
Fair value 5,513,296 4,430,236
€/’000 Dec. 31, 2012 Dec. 31, 2011
Debt securitiesGovernments 350,980 501,420
Government agencies - 100,917
Other issuers
- non financial companies - -
- financial companies 279,466 334,385
- insurance companies - -
- others - -
Loans: Governments 12 -
Government agencies 48 25
Others
- non financial companies 215,302 95,569
- financial companies 308,365 143,425
- insurance companies 1,427 1,430
- others 4,049,249 3,193,310
Total 5,204,849 4,370,481
Available-for-sale financial assets increased by €3,256.7 million, primarily reflecting purchases of Italian govern-
ment securities.

82
CONSOLIDATED ANNUALFINANCIAL STATEMENTS
2012
€/’000
Dec. 31, 2012 Dec. 31, 2011
Level 1 Level 2 Level 3 Level 1 Level 2 Level 3
Debt securities 11,744,882 366,344 - 8.374,279 434,897 38,571
Equities 4,217 16,163 14,441 3,524 16,165 14,698
Holdings in UCITS 10,794 81,217 81,011 9,577 113,846 56,849
Loans - - - - - -
Total 11,759,893 463,724 95,452 8,387,380 564,908 110,118
Analysis of available-for-sale financial assets by debtor/issuer
€/’000 Dec. 31, 2012 Dec. 31, 2011
Debt securities
- Governments and Central Banks 10,470,849 7,017,197
- Government agencies - -
- Banks 1,453,812 1,800,980
- Other issuers 186,565 29,570
Equities
- Banks - -
- Other issuers 34,821 34,387
Holdings in UCITS 173,022 180,272
Total 12,319,069 9,062,406
€/’000 Dec. 31, 2012 Dec. 31, 2011
Time-to-maturity
1-5 years 11,357,059 7,748,641
5-10 years 666,390 905,478
over 10 years 246,705 140,253
Indefinite 48,915 268,034
Total 12,319,069 9,062,406
Fair value hierarchy analysis of available-for-sale financial assets
Time-to-maturity of available-for-sale financial assets

83
NOTES TO THE CONSOLIDATEDANNUAL FINANCIAL STATEMENTS
Fair value hierarchy analysis of financial assets at fair value through profit or loss
Financial assets at fair value through profit or loss
€/’000 Dec. 31, 2012 Dec. 31, 2011
Financial assets held for trading
Debt securities 1,214,764 2,883,613
Equities - 3
Holdings in UCITS 116 18,773
Loans - -
Trading derivatives 6,609 5,527
Total 1,221,489 2,907,916
Financial assets at fair value
Debt securities 3,402,540 3,796,258
Equities - -
Holdings in UCITS 9,565,715 8,935,348
Loans - -
Hedging derivatives 1,366 -
Total 12,969,621 12,731,606
Total financial assets at fair value through profit or loss 14,191,110 15,639,522
€/’000
Dec. 31, 2012 Dec. 31, 2011
Level 1 Level 2 Level 3 Level 1 Level 2 Level 3
Financial assets held for trading
Debt securities 1,180,524 28,567 5,673 2,752,145 113,164 18,304
Equities - - - 3 - -
Holdings in UCITS 116 - - - 9 18,764
Loans - - - - - -
Trading derivatives 138 4,370 2,101 9 2,830 2,688
Total 1,180,778 32,937 7,774 2,752,157 116,003 39,756
Financial assets at fair value
Debt securities 356,806 2,145,205 900,529 275,791 2,729,354 791,113
Equities - - - - - -
Holdings in UCITS 9,443,695 122,020 - 8,776,201 159,147 -
Loans - - - - - -
Trading derivatives - 1,366 - - - -
Total 9,800,501 2,268,591 900,529 9,051,992 2,888,501 791,113
Total financial assets at fair value throughprofit or loss 10,981,279 2,301,528 908,303 11,804,149 3,004,504 830,869
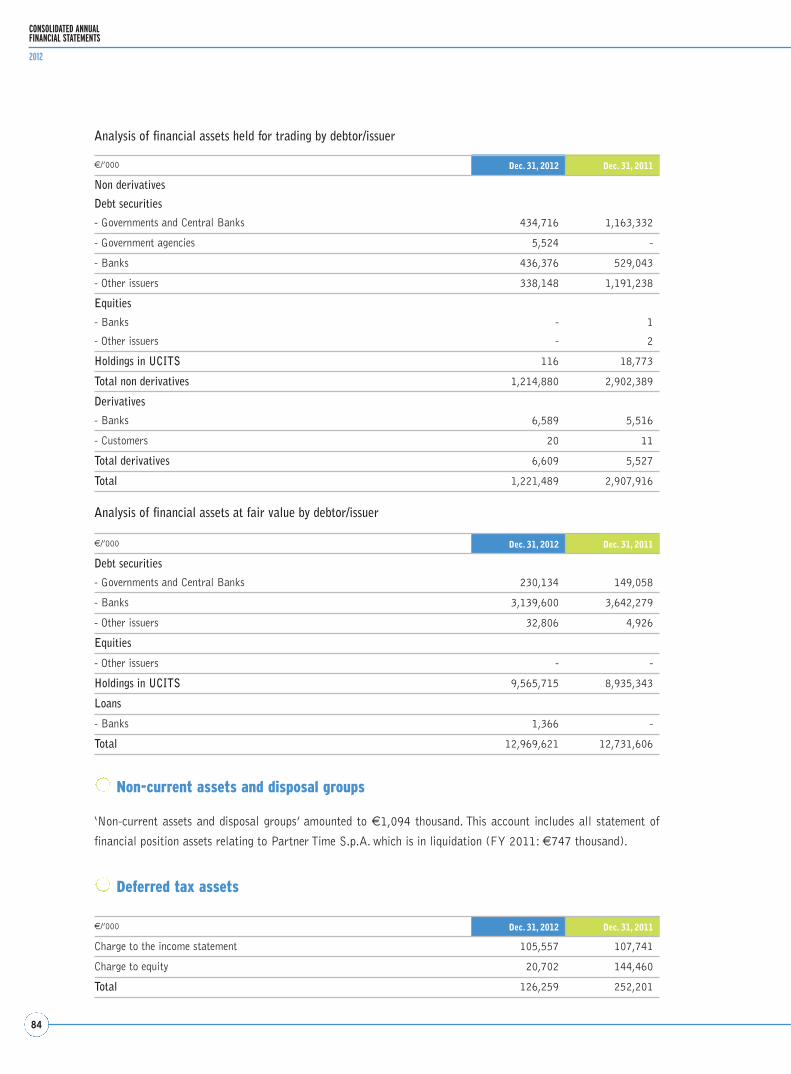
84
CONSOLIDATED ANNUALFINANCIAL STATEMENTS
2012
Analysis of financial assets held for trading by debtor/issuer
€/’000 Dec. 31, 2012 Dec. 31, 2011
Non derivatives
Debt securities
- Governments and Central Banks 434,716 1,163,332
- Government agencies 5,524 -
- Banks 436,376 529,043
- Other issuers 338,148 1,191,238
Equities
- Banks - 1
- Other issuers - 2
Holdings in UCITS 116 18,773
Total non derivatives 1,214,880 2,902,389
Derivatives
- Banks 6,589 5,516
- Customers 20 11
Total derivatives 6,609 5,527
Total 1,221,489 2,907,916
Analysis of financial assets at fair value by debtor/issuer
€/’000 Dec. 31, 2012 Dec. 31, 2011
Debt securities
- Governments and Central Banks 230,134 149,058
- Banks 3,139,600 3,642,279
- Other issuers 32,806 4,926
Equities
- Other issuers - -
Holdings in UCITS 9,565,715 8,935,343
Loans
- Banks 1,366 -
Total 12,969,621 12,731,606
€/’000 Dec. 31, 2012 Dec. 31, 2011
Charge to the income statement 105,557 107,741
Charge to equity 20,702 144,460
Total 126,259 252,201
Non-current assets and disposal groups
‘Non-current assets and disposal groups’ amounted to €1,094 thousand. This account includes all statement of
financial position assets relating to Partner Time S.p.A. which is in liquidation (FY 2011: €747 thousand).
Deferred tax assets

85
NOTES TO THE CONSOLIDATEDANNUAL FINANCIAL STATEMENTS
Year’s movements in deferred tax assets (charge to the income statement)
Year’s movements in deferred tax assets (charge to equity)
€/’000 Dec. 31, 2012 Dec. 31, 2011
Opening balance 107,741 98,971
Increases
Deferred tax assets arisen in the year
- relating to prior years 4,550 96
- changes in the accounting policies (3,221) 1,508
- reversals (20) -
- other 27,561 37,613
New taxes or increased tax rates - 1,452
Other increases 13,480 3,785
Decreases
Deferred tax assets cancelled in the year
- reversals (438) (12,448)
- changes in the accounting policies - 1
Other decreases (44,095) (23,237)
Closing balance 105,557 107,741
€/’000 Dec. 31, 2012 Dec. 31, 2011
Opening balance 144,460 40,014
Increases
Deferred tax assets arisen in the year
- relating to prior years - -
- changes in the accounting policies - -
- other 20,539 153,453
New taxes or increased tax rates - 466
Other increases - -
Decreases
Deferred tax assets cancelled in the year
- reversals (8,368) (24,974)
- irrecoverable amounts - -
- changes in accounting policies - -
- other (135,929) (24,499)
Reduced tax rates - -
Other decreases - -
Closing balance 20,702 144,460
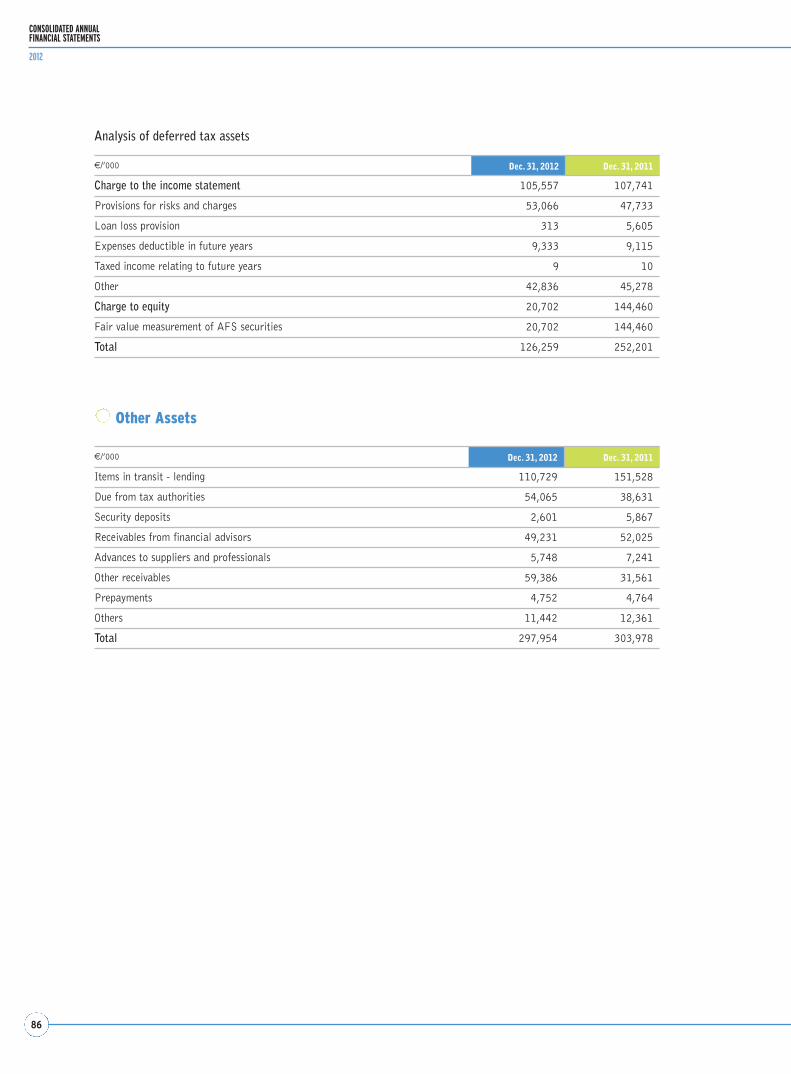
86
CONSOLIDATED ANNUALFINANCIAL STATEMENTS
2012
Analysis of deferred tax assets
€/’000 Dec. 31, 2012 Dec. 31, 2011
Charge to the income statement 105,557 107,741
Provisions for risks and charges 53,066 47,733
Loan loss provision 313 5,605
Expenses deductible in future years 9,333 9,115
Taxed income relating to future years 9 10
Other 42,836 45,278
Charge to equity 20,702 144,460
Fair value measurement of AFS securities 20,702 144,460
Total 126,259 252,201
€/’000 Dec. 31, 2012 Dec. 31, 2011
Items in transit - lending 110,729 151,528
Due from tax authorities 54,065 38,631
Security deposits 2,601 5,867
Receivables from financial advisors 49,231 52,025
Advances to suppliers and professionals 5,748 7,241
Other receivables 59,386 31,561
Prepayments 4,752 4,764
Others 11,442 12,361
Total 297,954 303,978
Other Assets

87
NOTES TO THE CONSOLIDATEDANNUAL FINANCIAL STATEMENTS
€/’000 Dec. 31, 2012 Dec. 31, 2011
Share capital 73,434 73,382
Capital reserves 56,497 56,013
Retained earnings and other equity reserves 821,182 847,716
(Treasury shares) (2,045) (2,045)
Gains (losses) on available-for-sale financial assets 88,984 (283,184)
Other gains (losses) recognised directly in equity 31,372 3,201
Group’s profit (loss) for the year 351,023 67,267
Group’s capital and reserves 1,420,447 762,350
€/’000
Dec. 31, 2012 Dec. 31, 2011
Gains Losses Gains Losses
Debt securities 152,099 (60,037) 3,634 (284,419)
Equities 735 (109) 199 (3)
Holdings in UCITS 2,135 (5,839) 87 (2,682)
Total 154,969 (65,985) 3,920 (287,104)
Shadow AccountingShadow accounting is used to mitigate the effects of stocks volatility on equity and earnings.
At December 31, 2012, the Group recorded charges amounting to €2 million (€1.3 million after tax) and latent
gains with a negative impact on equity of €5.8 million (€3.8 million after tax) in relation to the retrocession to
policyholders of their share of valuation gains at December 31, 2012.
SHAREHOLDERS’ EQUITY AND LIABILITIES
EQUITY
At December 31, 2012 the Group’s capital and reserves amounted to €1,420.4 million versus €762.4 million in
the prior year.
At year end 2012, the AFS Reserve was up €372.2 million to a positive balance of €89.0 million from a negative
balance of €283.2 million in 2011.
Share capital was fully paid up and amounted to €73,433,791.90, divided into 734,337,919 ordinary shares.
Treasury shares amounted to 385,000. There were no equity holders other than the Group. For information on move-
ments in the year, readers are referred to the Statement of changes in Equity herein.
Gain (Losses) on Available-for-Sale Financial Assets

88
CONSOLIDATED ANNUALFINANCIAL STATEMENTS
2012
Year’s movements in the revaluation reserve relating to available-for-sale financial assets
Net profit for the year attributable to the Group
Earnings per share on continuing operations
€/’000
Dec. 31, 2012 Dec. 31, 2011
Total Total
Profit for the year 433,827 193,174
Weighted average number of shares outstanding 734,079 733,350
Earnings per share (in euro) 0.591 0.263
Diluted earnings per share
€/’000Debt
securities EquitiesHoldings
in UCITS Total
Opening balance (280,785) 196 (2,595) (283,184)
Increases
Increase in fair value 368,252 684 2,623 371,559
Reclassification to the income statement from reserves:
- impairment - 3 1,076 1,079
- realised gains 10,360 - 3 10,363
Other increases - - - -
Decreases
Decrease in fair value (767) (257) (4,811) (5,835)
Impairment - - - -
Reclassification to the income statement from reserves: realised losses (1,156) - - (1,156)
Other decreases (3,842) - - (3,842)
Closing balance 92,062 626 (3,704) 88,984
Earnings per share
€/’000
Dec. 31, 2012 Dec. 31, 2011
Total Total
Profit for the year 351,023 67,267
Weighted average number of shares outstanding 734,079 733,350
Earnings per share (in euro) 0.478 0.092
€/’000
Dec. 31, 2012 Dec. 31, 2011
Total Total
Profit for the year 351,023 67,267
Weighted average number of shares outstanding 734,079 733,350
Adjustments for stock options with potential dilution effect 21,170 4,050
Weighted average number of shares outstanding for diluted earnings per share 755,248 737,400
Diluted earnings per share (in euro) 0.465 0.091

89
NOTES TO THE CONSOLIDATEDANNUAL FINANCIAL STATEMENTS
PROVISIONS
Analysis of other provisions
Year’s movements in provisions
Reconciliation of the parent company’s shareholders’ equity to consolidated shareholders’ equity
€/’000 Dec. 31, 2012 Dec. 31, 2011
Provision for taxes 40 46
Other provisions 190,982 160,647
Total 191,022 160,693
€/’000 Dec. 31, 2012 Dec. 31, 2011
Provision for other completion-of-service entitlements and similar obligations 1,540 1,402
Provision for sales network benefits 100,664 84,668
Provision for risks related to sales network’s illegal actions 37,682 40,627
Other provisions for risks and charges 51,096 33,950
Total 190,982 160,647
€/’000 Provision for taxes Other provisions
Opening balance 46 160,647
Increases
- Year’s provision - 65,719
- Other increases - 428
Decreases
- Funds utilised in the year - (19,408)
- Other decreases (6) (16,404)
Closing balance 40 190,982
€/’000 Capital & reserves Net Profit Shareholders’ Equity
Parent Company Accounts at Dec. 31, 2012 541,445 133,620 675,065
Successive changes in carrying amount and equityof companies consolidated on a line-by-line basis 95,849 593,345 689,194
Differences on investments accounted for by the equity method 66,067 (14,083) 51,984
Intercompany dividends 360,527 (360,527) -
Elimination of intercompany transactions effects (2,116) 217 (1,899)
Amortisation of greater value attributed to property on the date of acquisition of investments consolidated on a line-by-line basis 6,384 (166) 6,218
Other 1,268 (1,383) (115)
Consolidated Accounts at December 31, 2012 1,069,424 351,023 1,420,447

90
CONSOLIDATED ANNUALFINANCIAL STATEMENTS
2012
Financial liabilities at fair value
€/’000 Dec. 31, 2012 Dec. 31, 2011
Financial liabilities held for trading
Short positions on debt securities 235,672 320,066
Trading derivatives 25,443 21,087
Other financial liabilities - 192
Total financial liabilities held for trading 261,115 341,345
Liabilities arising on financial contracts issued by insurance companies:
- under which the investment risk is borne by the policyholder 89,042 80,383
Hedging derivatives 92,888 67,896
Total financial liabilities at fair value 181,930 148,279
Total financial liabilities at fair value through profit or loss 443,045 489,624
At year end 2012, financial liabilities at fair value through profit or loss amounted to €443.0 million down €46.6
million compared to €489.6 million at December 31, 2011. Short positions on debt securities held by Banca
Mediolanum were down €84.4 million, while hedging derivatives were up €25 million.
TECHNICAL RESERVES
€/’000 Dec. 31, 2012 Dec. 31, 2011
Mathematical reserves 4,648,989 5,755,113
Reserve for outstanding claims 183,262 134,529
Technical reserves for contracts under which the investment risk is borne by the policyholder and relating to pension fund management 12,978,601 12,735,460
Other reserves 12,977 7,173
Total life business reserves 17,823,829 18,632,275
FINANCIAL LIABILITIES
Financial liabilities at fair value through profit and loss

91
NOTES TO THE CONSOLIDATEDANNUAL FINANCIAL STATEMENTS
€/’000
Dec. 31, 2012 Dec. 31, 2011
Total L1 L2 L3 Total L1 L2 L3
Financial liabilities held for trading
Short positions on debt securities 235,672 235,672 - - 320,066 320,066 - -
Trading derivatives 25,444 - 23,477 1,967 21,087 - 17,226 3,861
Securities issued - - - - - - - -
Other financial liabilities - - - - 192 - 192 -
Total 261,116 235,672 23,477 1,967 341,345 320,066 17,418 3,861
Financial liabilities at fair value
Liabilities arising on financial contractsissued by insurance companies:
- under which the investment risk is borneby the policyholder 89,042 46,090 27,156 15,795 80,383 27,839 52,544 -
- in connection with pension fundmanagement - - - - - - - -
Hedging derivatives 92,888 - 92,888 - 67,896 - 67,896 -
Total 181,930 46,090 120,044 15,795 148,279 27,839 120,440 -
Total financial liabilities at fair value through profit or loss 443,045 281,762 143,521 17,762 489,624 347,905 137,858 3,861
The analysis of ‘financial liabilities: banks’ shows that amounts due to central banks, demand deposits and repur-
chase agreements decreased by €1,388.9 million, €175.7 million and €181.1 million respectively. They almost
entirely related to Banca Mediolanum like time deposits which instead increased by €62.4 million.
Amounts due to banking customers amounted to €10,983 million versus €6,942 million in the prior year. The
increase relates to Banca Mediolanum time deposits amounting to €2,550 million (vs. €1,097 million at December
31, 2011) and to repurchase agreements, also mostly relating to Banca Mediolanum, which amounted to €2,843
million (vs. €879 million at December 31, 2011).
Securities issued consisted of €93 million subordinated notes issued by Banca Mediolanum, €1 million bonds issued
by Banca Mediolanum and €338 million bonds issued by the parent company Mediolanum S.p.A..
Fair Value hierarchy of financial liabilities at fair value through profit and loss
€/’000 Dec. 31, 2012 Dec. 31, 2011
Banks 3,813,632 5,602,538
Banking customers 10,983,468 6,942,439
Securities issued 432,404 524,884
Deposits from reinsurers 75,875 87,565
Collaterals 185,778 197,143
Other - 14,970
Total 15,491,157 13,369,539
Other financial liabilities

92
CONSOLIDATED ANNUALFINANCIAL STATEMENTS
2012
€/’000 Dec. 31, 2012 Dec. 31, 2011
Central banks 3,105,719 4,494,571
Other banks
- Demand deposits 1,688 177,686
- Time deposits 403,252 340,930
- Loans 302,149 401,215
- Repurchase agreements 6 187,116
- Other liabilities 818 1,020
Total 3,183,632 5,602,538
Time to maturity
The item “Financial liabilities: Banks” largely related to financial liabilities maturing within one year.
Financial liabilities: Banking customers
At the end of the year under review, Mediolanum Vita and Mediolanum International Life had €185.8 million lia-
bilities on collaterals received (197.1 million at December 31, 2011) under derivative contracts whose risk is borne
by policyholders.
Financial liabilities: Banks
€/’000 Dec. 31, 2012 Dec. 31, 2011
Time to maturity
within 1 year 787,951 3,602,038
1-5 years 3,025,681 2,000,500
Total 3,813,632 5,602,538
€/’000 Dec. 31, 2012 Dec. 31, 2011
Bank accounts 8,081,543 5,992,339
Repurchase agreements 2,861,406 923,457
Other liabilities 40,519 26,643
Total 10,983,468 6,942,439
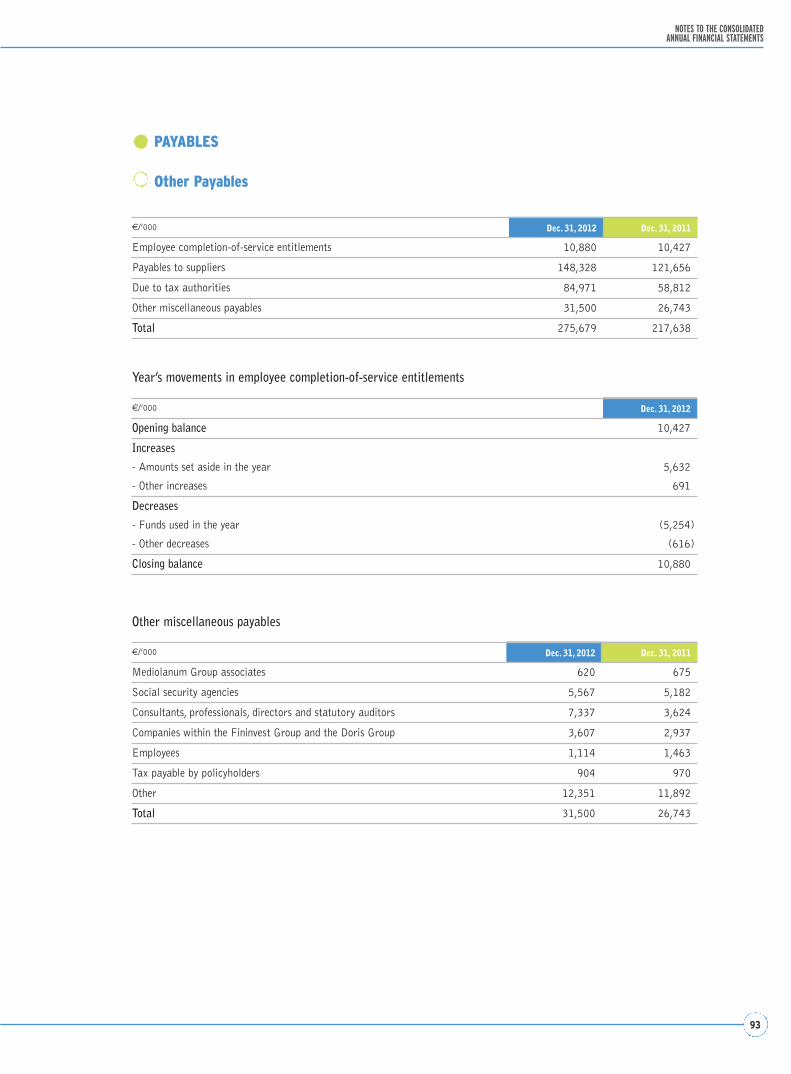
93
NOTES TO THE CONSOLIDATEDANNUAL FINANCIAL STATEMENTS
PAYABLES
Other Payables
Year’s movements in employee completion-of-service entitlements
Other miscellaneous payables
€/’000 Dec. 31, 2012 Dec. 31, 2011
Employee completion-of-service entitlements 10,880 10,427
Payables to suppliers 148,328 121,656
Due to tax authorities 84,971 58,812
Other miscellaneous payables 31,500 26,743
Total 275,679 217,638
€/’000 Dec. 31, 2012 Dec. 31, 2011
Mediolanum Group associates 620 675
Social security agencies 5,567 5,182
Consultants, professionals, directors and statutory auditors 7,337 3,624
Companies within the Fininvest Group and the Doris Group 3,607 2,937
Employees 1,114 1,463
Tax payable by policyholders 904 970
Other 12,351 11,892
Total 31,500 26,743
€/’000 Dec. 31, 2012
Opening balance 10,427
Increases
- Amounts set aside in the year 5,632
- Other increases 691
Decreases
- Funds used in the year (5,254)
- Other decreases (616)
Closing balance 10,880

94
CONSOLIDATED ANNUALFINANCIAL STATEMENTS
2012
Year’s movements in deferred tax liabilities (charge to the income statement)
Year’s movements in deferred tax liabilities (charge to equity)
€/’000 Dec. 31, 2012 Dec. 31, 2011
Charge to the income statement 33,911 39,025
Charge to equity 63,299 1,993
Total 97,210 41,018
€/’000 Dec. 31, 2012 Dec. 31, 2011
Opening balance (39,025) (45,127)
Increases
Deferred tax liabilities arisen in the year
- other (6,328) (3,617)
New taxes or increased tax rates - (2,194)
Decreases (3,870) -
Deferred tax liabilities cancelled in the year
- reversals - 1,945
- other 1,084 9,965
Other decreases 14,228 4
Closing balance (33,911) (39,025)
€/’000 Dec. 31, 2012 Dec. 31, 2011
Opening balance (1,993) (6,805)
Increases
Deferred tax liabilities arisen in the year
- other (117,036) (3,686)
New taxes or increased tax rates - (51)
Other increases (9) (2)
Decreases
Deferred tax liabilities cancelled in the year
- reversals 13,858 5,427
- other 41,875 3,085
Other decreases 6 39
Closing balance (63,299) (1,993)
OTHER LIABILITIES
Deferred tax liabilities

95
NOTES TO THE CONSOLIDATEDANNUAL FINANCIAL STATEMENTS
Analysis of deferred tax liabilities
Liabilities associated with disposal groups held for sale
The balance of this account amounting to €960 thousand includes all liabilities relating to the investment in
Partner Time S.p.A. that is under liquidation (FY 2011: €968 thousand).
Other liabilities
€/’000 Dec. 31, 2012 Dec. 31, 2011
Charge to the income statement 33,911 39,025
income taxable in future years 33,621 38,646
future expenses deductible in the year 211 215
deducted expenses relating to future years 79 164
Charge to equity 63,299 1,993
fair value measurement of AFS securities 63,299 1,993
Total 97,210 41,018
€/’000 Dec. 31, 2012 Dec. 31, 2011
Items in transit - lending 128,612 233,725
Provision for staff costs 6,151 6,744
Agents’ severance benefits 3,742 3,528
Security deposits 2,835 4,171
Accrued expenses 26,869 18,118
Other 9,045 8,671
Total 177,254 274,957
“Items in transit” included payments to other bank accounts ordered by customers and cleared through the
Interbank Payment System in the first days of 2012 (€20,191 thousand), payments by direct debit/standing orders
of customers (€22,458 thousand), transactions made by customers at post offices (Banco Posta) (€4,436 thou-
sand), payments to be made into Mediolanum Plus policies (€12,012 thousand) and other items being processed
that were cleared in the first days of 2013.
Accrued expenses mostly related to commissions on sales of Mediolanum Plus Certificates relating to future years.
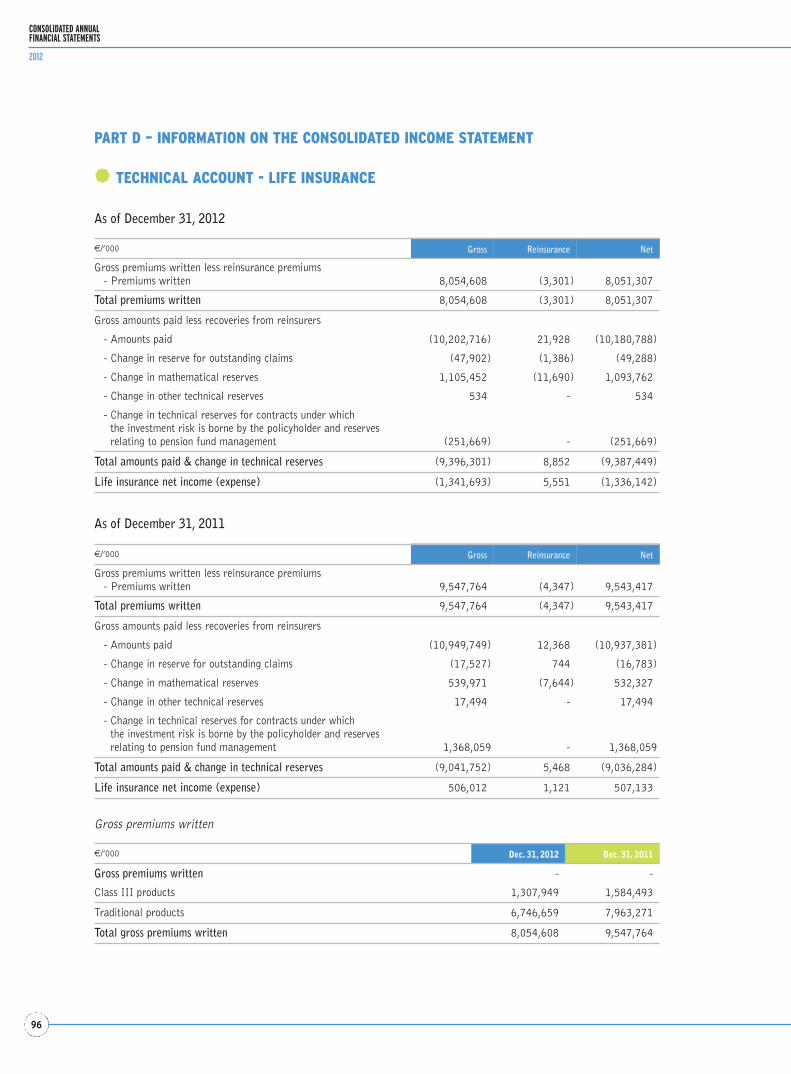
96
CONSOLIDATED ANNUALFINANCIAL STATEMENTS
2012
PART D – INFORMATION ON THE CONSOLIDATED INCOME STATEMENT
TECHNICAL ACCOUNT - LIFE INSURANCE
As of December 31, 2012
€/’000 Gross Reinsurance Net
Gross premiums written less reinsurance premiums- Premiums written 8,054,608 (3,301) 8,051,307
Total premiums written 8,054,608 (3,301) 8,051,307
Gross amounts paid less recoveries from reinsurers
- Amounts paid (10,202,716) 21,928 (10,180,788)
- Change in reserve for outstanding claims (47,902) (1,386) (49,288)
- Change in mathematical reserves 1,105,452 (11,690) 1,093,762
- Change in other technical reserves 534 - 534
- Change in technical reserves for contracts under which the investment risk is borne by the policyholder and reserves relating to pension fund management (251,669) - (251,669)
Total amounts paid & change in technical reserves (9,396,301) 8,852 (9,387,449)
Life insurance net income (expense) (1,341,693) 5,551 (1,336,142)
€/’000 Gross Reinsurance Net
Gross premiums written less reinsurance premiums- Premiums written 9,547,764 (4,347) 9,543,417
Total premiums written 9,547,764 (4,347) 9,543,417
Gross amounts paid less recoveries from reinsurers
- Amounts paid (10,949,749) 12,368 (10,937,381)
- Change in reserve for outstanding claims (17,527) 744 (16,783)
- Change in mathematical reserves 539,971 (7,644) 532,327
- Change in other technical reserves 17,494 - 17,494
- Change in technical reserves for contracts under which the investment risk is borne by the policyholder and reserves relating to pension fund management 1,368,059 - 1,368,059
Total amounts paid & change in technical reserves (9,041,752) 5,468 (9,036,284)
Life insurance net income (expense) 506,012 1,121 507,133
As of December 31, 2011
Gross premiums written
€/’000 Dec. 31, 2012 Dec. 31, 2011
Gross premiums written - -
Class III products 1,307,949 1,584,493
Traditional products 6,746,659 7,963,271
Total gross premiums written 8,054,608 9,547,764

97
NOTES TO THE CONSOLIDATEDANNUAL FINANCIAL STATEMENTS
Commission income for the period amounted to €893.6 million versus €752.5 million in 2011. The €141.1 mil-
lion increase was largely in connection with growth in performance fees (up €79 million) and in management fees
(up €54 million), offset in part by decreased banking services fees (down €16 million).
Commission expenses
Commission income
€/’000 Dec. 31, 2012 Dec. 31, 2011
Management, brokerage and consulting services: 279,937 206,045
- Financial instruments brokerage 1,697 2,216
- Asset management 3,890 3,221
- Securities in custody and under administration 834 908
- Sales of securities 17,243 1,858
- Off-premises sales of securities, products and services 256,273 197,842
Collection and payment services 19,451 29,982
Commissions on the acquisition of investment contracts 712 182
Other services 14,768 26,510
Total 314,868 262,719
€/’000 Dec. 31, 2012 Dec. 31, 2011
Guarantees issued 96 88
Management, brokerage and consulting services: 835,789 684,389
- Financial instruments brokerage 2,026 2,690
- Currency brokerage 2 1
- Asset management 708,658 571,357
- individual portfolio management 4,581 4,816
- collective portfolio management 704,077 566,541
- Securities in custody and under administration 4,181 4,698
- Custodian bank 616 567
- Sales of securities 23,770 28,007
- Order taking 5,473 5,902
- Services to third parties 91,063 71,167
- asset management 333 216
- collective portfolio management 333 216
- insurance products 69,377 61,884
- other products 21,353 9,067
Collection and payment services 19,032 29,654
Loadings on investment contracts 681 384
Other services 37,960 38,005
Total 893,558 752,520
Commission expenses for the period amounted to €314.9 million versus €262.7 million in the prior year. The €52.2
million increase was largely due to greater amounts provided for incentives and to changes in the sales network com-
pensation policy.

98
CONSOLIDATED ANNUALFINANCIAL STATEMENTS
2012
This account shows a positive balance of €1,378.3 million (vs. a negative balance of €601.4 million in FY 2011).
Financial assets/liabilities held for trading generated net income of €132,746 thousand (vs. a loss of €69,497
thousand in FY 2011), largely on debt securities, benefitting from the recovery of government bond prices.
Financial assets/liabilities at fair value generated net income of €1,114.0 million (vs. a loss of €709,095 thousand
in FY 2011), largely reflecting changes in the value of assets underlying index-linked and unit-linked policies under
which the investment risk is borne by the policyholder.
Analysis of net income from financial assets held for trading through profit or loss
€/’000Unrealised
gains (A)
Realised trading profits
(B)Unrealised losses (C)
Realised losses (D)
Net income
[(A+B)-(C+D)]
Financial assets held for tradingDebt securities 51,007 95,791 (407) (2,737) 143,654
Equities - 7 - (97) (90)
Holdings in UCITS 7 32 (2,368) - (2,329)
Loans - - - - -
Other - - - - -
Other financial assets and liabilities: exchange differences - - - - 26
DerivativesFinancial derivatives
- debt securities & interest rates 1,063 12,723 (6,937) (17,820) (10,971)
- equities & stock indices - 24 - - 24
- currencies and gold - - - - 1,105
- other - - - - -
Credit derivatives - - - - -
Total 52,077 108,577 (9,712) (20,654) 131,419
€/’000 Dec. 31, 2012 Dec. 31, 2011
Financial assetsInterest income and other investment income
- from financial assets held for trading 96,949 86,370
- from financial assets at fair value 44,899 106,306
Net income from financial assets held for trading 131,419 (67,715)
Net income from financial assets at fair value 1,103,055 (753,343)
Financial liabilitiesInterest expense and similar charges
- from financial liabilities held for trading (9,822) (15,038)
- from financial liabilities at fair value (446) (415)
Net income from financial liabilities held for trading 1,327 (1,782)
Net income from financial liabilities at fair value 10,933 44,248
Total 1,378,314 (601,369)
NET INCOME FROM FINANCIAL INSTRUMENTS AT FAIR VALUE THROUGH PROFIT OR LOSS

99
NOTES TO THE CONSOLIDATEDANNUAL FINANCIAL STATEMENTS
€/’000Urealised gains
(A)
Realised trading profits
(B)
Urealised losses
(C)
Realised losses
(D)Net income
[(A+B)-(C+D)]
Debt securities 402,437 44,990 (15,287) (10,470) 421,670
Equities - - - - -
Holdings in UCITS 693,415 85,314 (22,264) (70,801) 685,664
Loans 20,945 - - - 20,945
Helding derivatives - - (25,224) - (25,224)
Total 1,116,797 130,304 (62,775) (81,271) 1,103,055
€/’000Urealised gains
(A)
Realised trading profits
(B)
Urealised losses
(C)
Realised losses
(D)Net income
[(A+B)-(C+D)]
Debt securities 953 4,471 (2,834) (1,262) 1,328
Debt - - - - -
Other - - - (1) (1)
Total 953 4,471 (2,834) (1,263) 1,327
Analysis of net income from financial assets at fair value through profit or loss
Net income from financial liabilities at fair value through profit or loss
Net income from financial liabilities at fair value through profit or loss amounted to €10,933 thousand (vs.
€44,248 thousand at December 31, 2011), and related exclusively to profits/losses on investment contracts issued
by the Group insurance companies.
Analysis of net income from financial liabilities held for trading
INCOME ON INVESTMENTS IN SUBSIDIARIES, ASSOCIATES AND JOINT VENTURES
At year end 2012, income on investments in associates and joint ventures that are accounted for under the equity
method aggregated to €7,483 thousand, of which €2,613 thousand (FY 2011: €715 thousand) on the investment
in Banca Esperia S.p.A. and €4,870 thousand (FY 2011: €5,829 thousand) on the investment in Mediobanca
S.p.A..
LOSS ON INVESTMENTS IN SUBSIDIARIES, ASSOCIATES AND JOINT VENTURES
The €62,703 thousand loss reported in this line item at December 31, 2012 (FY 2011: €41,126 thousand) relates
to the impairment charge recognised on the stake in Mediobanca S.p.A., which is accounted for under the equity
method, following impairment review as a result of which the carrying amount of this investment was written down
to €10.05 per share.

100
CONSOLIDATED ANNUALFINANCIAL STATEMENTS
2012
€/’000 Dec. 31, 2012 Dec. 31, 2011
Interest income and other income 439,742 205,642Realised gains 47,225 23,360Unrealised gains - 158Realised losses (25,415) (27,307)Unrealised losses (2,423) (109,055)Total net income from AFS financial assets 459,129 92,798
Analysis of net income from available-for-sale financial assets
Analysis of net investment income
€/’000 Dec. 31, 2012 Dec. 31, 2011
Investment property 5,988 5,645
Available for sale financial assets 459,129 92,798
Held to Maturity Investments 40,419 36,556
Loans and Receivables 156,821 186,490
Other (224,936) (148,771)
Total 437,421 172,718
Analysis of net income from investment property
€/’000 Dec. 31, 2012 Dec. 31, 2011
Realised gains - 48
Realised losses - -
Other income 8,242 7,403
Other expenses (696) (459)
Unrealised losses (1,558) (1,347)
Total net income from investment property 5,988 5,645
Analysis of net income from held-to-maturity investments
€/’000 Dec. 31, 2012 Dec. 31, 2011
Interest income and other income 40,389 51,010
Realised gains 30 1,046
Unrealised losses - (15,500)
Total net income from HTM investments 40,419 36,556
Income (loss) on other financial instruments and investment property
€/’000 Dec. 31, 2012 Dec. 31, 2011
Interest income and other income 654,310 456,505
Realised gains 47,610 24,986
Unrealised gains 4,623 5,412
Total income 706,543 486,903
Interest expense and similar charges (225,747) (149,492)
Realised losses (25,646) (27,382)
Unrealised losses (17,729) (137,311)
Total charges (269,122) (314,185)
Total net investment income 437,421 172,718

101
NOTES TO THE CONSOLIDATEDANNUAL FINANCIAL STATEMENTS
Analysis of Loans and Receivables
€/’000 Dec. 31, 2012 Dec. 31, 2011
Interest income and other income 165,937 192,450Realised gains 237 266Unrealised gains 4,623 5,254Realised losses (228) (71)Unrealised losses (13,748) (11,409)Total net income from loans and receivables 156,821 186,490
Analysis of net income from financial liabilities
€/’000 Dec. 31, 2012 Dec. 31, 2011
Interest expense and other charges (225,051) (149,033)
Realised gains 118 266
Realised losses (3) (4)
Total (224,936) (148,771)
OTHER REVENUES
€/’000 Dec. 31, 2012 Dec. 31, 2011
Fixed duties on insurance products 10,135 11,064Recoveries of expenses on contracts and services rendered 1,229 1,490Other 15,071 8,423Total 26,435 20,977
€/’000 Dec. 31, 2012 Dec. 31, 2011
Agents’ Commissions and other acquisition costs 73,340 73,726Investment management expenses 319 513Other administrative expensesEmployees 153,034 143,942Advertising and promotions 28,616 25,418Advisory services and collaborations 32,330 22,612IT systems 54,401 54,234Miscellaneous communications services 21,240 20,894Other general expenses 70,590 62,478Total other administrative expenses 360,211 329,578Total 433,870 403,817
OPERATING EXPENSES
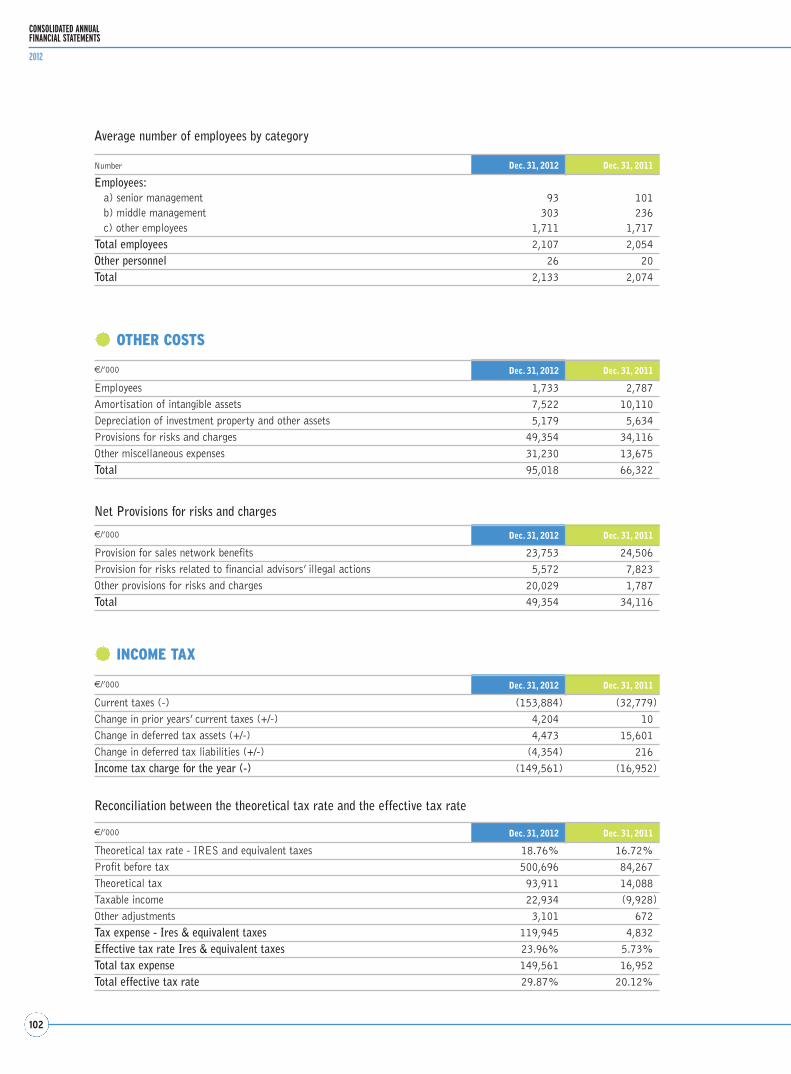
102
CONSOLIDATED ANNUALFINANCIAL STATEMENTS
2012
€/’000 Dec. 31, 2012 Dec. 31, 2011
Current taxes (-) (153,884) (32,779)Change in prior years’ current taxes (+/-) 4,204 10Change in deferred tax assets (+/-) 4,473 15,601Change in deferred tax liabilities (+/-) (4,354) 216Income tax charge for the year (-) (149,561) (16,952)
€/’000 Dec. 31, 2012 Dec. 31, 2011
Theoretical tax rate - IRES and equivalent taxes 18.76% 16.72%Profit before tax 500,696 84,267Theoretical tax 93,911 14,088Taxable income 22,934 (9,928)Other adjustments 3,101 672Tax expense - Ires & equivalent taxes 119,945 4,832Effective tax rate Ires & equivalent taxes 23.96% 5.73%Total tax expense 149,561 16,952Total effective tax rate 29.87% 20.12%
INCOME TAX
Reconciliation between the theoretical tax rate and the effective tax rate
€/’000 Dec. 31, 2012 Dec. 31, 2011
Employees 1,733 2,787Amortisation of intangible assets 7,522 10,110Depreciation of investment property and other assets 5,179 5,634Provisions for risks and charges 49,354 34,116Other miscellaneous expenses 31,230 13,675Total 95,018 66,322
€/’000 Dec. 31, 2012 Dec. 31, 2011
Provision for sales network benefits 23,753 24,506Provision for risks related to financial advisors’ illegal actions 5,572 7,823Other provisions for risks and charges 20,029 1,787Total 49,354 34,116
OTHER COSTS
Net Provisions for risks and charges
Number Dec. 31, 2012 Dec. 31, 2011
Employees:a) senior management 93 101b) middle management 303 236c) other employees 1,711 1,717
Total employees 2,107 2,054Other personnel 26 20Total 2,133 2,074
Average number of employees by category

103
NOTES TO THE CONSOLIDATEDANNUAL FINANCIAL STATEMENTS
PART E - SEGMENTAL INFORMATION
Segment reporting
This section presents consolidated financial data reported by operating segment. In compliance with IFRS 8, seg-
ment reporting reflects the management reporting approach of the Mediolanum Group, and is consistent with the
information disclosed to the market and to the various stakeholders.
Note on the method applied to segment reporting
Pursuant to IFRS 8, for the purpose of segment reporting of consolidated results the Mediolanum Group identified
the following operating segments:
• ITALY – LIFE
• ITALY – ASSET MANAGEMENT
• ITALY – BANKING
• ITALY – OTHER
• SPAIN
• GERMANY
For the purpose of segment reporting income and expense items were directly assigned to the specific operating seg-
ment by product. Indirect costs and other residual items were spread over the various segments applying allocation
policies.

104
CONSOLIDATED ANNUALFINANCIAL STATEMENTS
2012
Reconciliation of the income statement at December 31, 2012 to the reclassified income statement
Consolidatedincome
€/’000 statement statements
1.1 Net premiums written1.1.1 Gross premiums written 8,054,6081.1.2 Reinsurance premiums (3,301)Total premiums written 8,051,3071.2 Commission income 893,5581.3 Net income on financial instruments at fair value through profit or loss 1,378,3141.4 Income on investments in subsidiaries, associates and joint ventures 7,4831.5 Income on other financial instruments and investment property1.5.1 Interest income 644,1651.5.2 Other income 10,1451.5.3 Realised gains 47,6101.5.4 Unrealised gains 4,623Total income on other financial instruments and investment property 706,5431.6 Other revenues 26,435Total revenues 11,063,640
2. Costs2.1 Net claims and benefits2.1.1 Amounts paid and change in technical reserves (9,396,301) 2.1.2 Reinsurers’ share 8,852Net claims and benefits (9,387,449) 2.2 Commission expense (314,868)2.3 Loss on other investments in subsidiaries, associates and joint ventures (62,703)2.4 Loss on other financial instruments and investment property2.4.1 Interest expense (225,051)2.4.2 Other expenses (696)2.4.3 Realised losses (25,646)2.4.4 Unrealised losses (17,729)Loss on other financial instruments and investment property (269,122) 2.5 Operating expenses2.5.1 Agents’ commissions and other acquisition costs (73,340)2.5.2 Investment management costs (319)2.5.3 Other administrative expenses (360,211)Total operating expenses (433,870)2.6 Other costs (95,018)Total costs (10,563,030)Profit (loss) before tax for the period 500,610
3. Income tax (149,561)4. Profit (loss) from discontinued operations (26)
Net profit (loss) for the period 351,023
RECLASSIFICATIONSInterest income and expense on assets/liabilities pertaining to policyholders(including policies classified as investment contracts under IFRS4) -Other reclassifications -
TOTAL RECLASSIFICATIONS -

105
NOTES TO THE CONSOLIDATEDANNUAL FINANCIAL STATEMENTS
RECLASSIFIED INCOME STATEMENT - REVENUES (ORDINARY ACTIVITIES)
amounts paid netand change total income/loss net income
non-recurring ordinary net premiums in technical commission net interest on investments equity on other other items activities written reserves income income at fair value contribution investments revenue
8,054,608 - - - - - - -(3,301) - - - - - - -
8,051,307 - - - - - - -- - 893,558 - - - - -- - - 131,580 1,246,734) - - -- - - - - 7,483 - -
- - - 644,165 - - - -- - - 1,903 - - 8,242 -- - - - - - 47,610 -- - - - - - 4,623 -- - - 646,068 - - 60,475 -- - - - - - - 26,435
8,051,307 - 893,558 777,648 1,246,734) 7,483 60,475 26,435
- (9,394,899) - - - - - -- 8,852 - - - - - -- (9,386,047) - - - - - -- - - - - - - -- - - - - (62,703) - -
- - - (225,051) - - - -- - - - - - (696) -- - - - - - (25,646) -- - - - - - (16,171) -- - - (225,051) - - (42,513) -
- - - - - - - -- - - - - - - -- - - - - - - -- - - - - - - -- - - - - - (20,142) -- (9,386,047) - (225,051) - (62,703) (62,655) -
8,051,307 (9,386,047) 893,558 552,597 1,246,734) (55,220) (2,180) 26,435- - - - - - - -- - - - - - (26) -
8,051,307 (9,386,047) 893,558 552,597 1,246,734) (55,220) (2,206) 26,435
- 1,368,305) - (236,090) (1,128,638) - (3,578) -- (315) 460 (1,903) - - 1,903 -
8,051,307 (8,018,057) 894,018 314,604 118,096 (55,220) (3,881) 26,435

106
CONSOLIDATED ANNUALFINANCIAL STATEMENTS
2012
Reconciliation of the income statement at December 31, 2012 to the reclassified income statement
€/’000 commission expenses
1.1 Net premiums written1.1.1 Gross premiums written 1.1.2 Reinsurance premiums Total premiums written1.2 Commission income1.3 Net income on financial instruments at fair value through profit or loss1.4 Income on investments in subsidiaries, associates and joint ventures1.5 Income on other financial instruments and investment property1.5.1 Interest income 1.5.2 Other income 1.5.3 Realised gains 1.5.4 Unrealised gains Total income on other financial instruments and investment property1.6 Other revenuesTotal revenues
2. Costs2.1 Net claims and benefits2.1.1 Amounts paid and change in technical reserves2.1.2 Reinsurers’ shareNet claims and benefits2.2 Commission expense2.3 Loss on other investments in subsidiaries, associates and joint ventures2.4 Loss on other financial instruments and investment property2.4.1 Interest expense 2.4.2 Other expenses 2.4.3 Realised losses 2.4.4 Unrealised losses Loss on other financial instruments and investment property2.5 Operating expenses2.5.1 Agents’ commissions and other acquisition costs2.5.2 Investment management costs2.5.3 Other administrative expensesTotal operating expenses2.6 Other costsTotal costsProfit (loss) before tax for the period
3. Income tax4. Profit (loss) from discontinued operations
Net profit (loss) for the period
RECLASSIFICATIONSInterest income and expense on assets/liabilities pertaining to policyholders(including policies classified as investment contracts under IFRS4)Other reclassifications
TOTAL RECLASSIFICATIONS

107
NOTES TO THE CONSOLIDATEDANNUAL FINANCIAL STATEMENTS
RECLASSIFIED INCOME STATEMENT - COSTS AND TAXATION (ORDINARY ACTIVITIES)
other general provisions sales network commission and administrative amortisation for risks income
commission expenses expenses expenses and depreciation and charges tax for the period net profit
- - - - - - -- - - - - - -- - - - - - -- - - - - - -- - - - - - -- - - - - - -
- - - - - - -- - - - - - -- - - - - - -- - - - - - -- - - - - - -- - - - - - -- - - - - - -
- - (1,402) - - - -- - - - - - -- - (1,402) - - - -
(314,868) - - - - - -- - - - - - -
- - - - - - -- - - - - - -- - - - - - -- - - (1,558) - - -- - - (1,558) - - -
(67,583) - (5,757) - - - -- - (319) - - - -- - (360,211) - - - -
(67,583) - (366,287) - - - -- - (12,821) (12,701) (49,354) - -
(382,451) - (380,510) (14,259) (49,354) - -(382,451) - (380,510) (14,259) (49,354) - -
- - - - - (149,561) -- - - - - - -
(382,451) - (380,510) (14,259) (49,354) (149,561) 351,023
- - - - - - -18,411 (41,201) (608) - 23,252 - -
(364,040) (41,201) (381,118) (14,259) (26,102) (149,561) 351,023

108
CONSOLIDATED ANNUALFINANCIAL STATEMENTS
2012
FINANCIAL INFORMATION BY OPERATING SEGMENT AT DECEMBER 31, 2012
€/’000
ITALY
Life BankingAsset
Management OtherConsolidation
adjustments Total
Net premiums written 7,922,819 - - - - 7,922,819
Amounts paid & change in technical reserves (7,908,540) - - - - (7,908,540)
Net life insurance revenues (ex-commissions) 14,279 - - - - 14,279
Entry fees - - 110,407 - - 110,407
Management fees 219,029 - 234,905 - - 453,934
Performance fees 60,603 - 106,909 - - 167,512
Banking service fees - 81,820 - - (605) 81,215
Other fees 679 11,247 25,234 - - 37,160
Total commission income 280,311 93,067 477,455 - (605) 850,228
Net interest income 18,353 275,109 697 (14,289) - 279,870
Net income (loss) on investments at fair value 81,486 33,791 2 4 - 115,283
Net financial income 99,839 308,900 699 (14,285) - 395,154
Equity contribution - - - (55,220) - (55,220)
Realised gains (losses) on other investments 6,966 137 323 - - 7,426
Impairment of loans - (9,044) - - - (9,044)
Impairment of other investments - (1,310) (916) (231) - (2,457)
Net income (loss) on other investments 6,966 (10,217) (593) (231) - (4,075)
Other revenues 11,053 13,699 431 - - 25,183
TOTAL REVENUES 412,449 405,449 477,992 (69,736) (605) 1,225,549
Acquisition costs and sales network commission expenses (94,217) (60,198) (188,231) - - (342,646)
Other commission expenses (5,522) (12,307) (11,786) - - (29,615)
General and administrative expenses (83,074) (176,928) (78,983) - 605 (338,380)
Amortisation and depreciation (2,996) (6,815) (2,228) - - (12,039)
Net provisions for risks (3,888) (2,097) (7,618) - - (13,603)
TOTAL COSTS (189,697) (258,345) (288,846) - 605 (736,283)
PROFIT BEFORE TAX 222,752 147,104 189,146 (69,736) - 489,266
Income tax - - - - - (140,714)
NET PROFIT FOR THE PERIOD - - - - - 348,552
Goodwill 22,915 - - - - 22,915
Investment Property 106,810 - - - - 106,810
Equity investments - - - 382,700 - 382,700
HTM investments + LR 469,599 2,167,633 - - - 2,637,232
AFS instruments 3,102,679 8,123,450 39,746 20,011 - 11,285,886
Fin. assets/liabilities at FV through profit or loss 620,911 331,689 - - - 952,600
Financial assets - risk borne by policyholder 12,361,225 - - - - 12,361,225
Net treasury position (745,190) 2,455,483 (44,060) 275,498 - 1,941,730
- of which intercompany 751,130 620,855 39,762 26,610 - 1,438,357
Loans to customers - 4,329,669 - - - 4,329,669
Bank funding - 11,727,693 - - - 11,727,693
- of which intercompany - 1,018,251 - - - 1,018,251
Net technical reserves 17,144,915 - - - - 17,144,915

109
NOTES TO THE CONSOLIDATEDANNUAL FINANCIAL STATEMENTS
ABROAD
Consolidation adjustments TotalSpain Germany
99,718 28,770 - 8,051,307
(84,380) (25,137) - (8,018,057)
15,338 3,633 - 33,250
4,997 236 - 115,640
13,034 5,270 - 472,238
3,406 1,019 - 171,937
3,804 10,728 (6) 95,741
1,055 248 - 38,462
26,296 17,501 (6) 894,018
33,754 980 - 314,604
2,014 799 - 118,096
35,768 1,779 - 432,701
- - - (55,220)
20,383 - - 27,809
(47) - - (9,091)
(20,142) - - (22,599)
194 - - (3,881)
358 982 (88) 26,435
77,954 23,895 (94) 1,327,303
(17,601) (3,803) 10 (364,040)
(2,763) (8,823) - (41,201)
(27,930) (14,892) 84 (381,118)
(1,498) (722) - (14,259)
(12,499) - - (26,102)
(62,291) (28,240) 94 (826,720)
15,663 (4,345) - 500,584
(8,452) (395) - (149,561)
7,211 (4,741) - 351,023
102,831 4,140 - 129,886
- - - 106,810
- - - 382,700
- 4,007 - 2,641,239
1,005,181 28,002 - 12,319,069
14,966 (5,817) - 961,749
523,490 98,394 - 12,983,109
689,572 (104,569) - 2,526,733
(644,019) 23,109 - 817,447
159,006 6,894 - 4,495,569
340,827 96,047 - 12,164,567
2,044 236 - 1,020,531
505,093 97,623 - 17,747,631

110
CONSOLIDATED ANNUALFINANCIAL STATEMENTS
2012
FINANCIAL INFORMATION BY OPERATING SEGMENT AT DECEMBER 31, 2012
€/’000
ITALY
Life BankingAsset
Management OtherConsolidation
adjustments Total
Net premiums written 9,400,919 - - - - 9,400,919Amounts paid & change in technical reserves (9,381,508) - - - - (9,381,508)Net life insurance revenues (ex-commissions) 19,411 - - - - 19,411Entry fees - - 94,461 - - 94,461Management fees 205,734 - 195,813 - - 401,547Performance fees 48,325 - 41,636 - - 89,961Banking service fees - 85,506 - - (1,175) 84,331Other fees 626 7,136 24,366 - - 32,128Total commission income 254,685 92,642 356,276 - (1,175) 702,428Net interest income 34,851 190,064 1,240 (7,897) - 218,258Net income (loss) on investments at fair value (33,002) (32,307) 15 (4) - (65,298)Net financial income 1,849 157,757 1,255 (7,901) - 152,960Equity contribution - - - (34,582) - (34,582)Realised gains (losses) on other investments 3,521 9,302 317 83 - 13,223Impairment of loans - (6,210) - (74) - (6,284)Impairment of other investments (39,343) (84,415) - (1,862) - (125,620)Net income (loss) on other investments (35,822) (81,323) 317 (1,853) - (118,681)Other revenues 11,392 8,858 360 547 - 21,157TOTAL REVENUES 251,515 177,934 358,208 (43,789) (1,175) 742,693Acquisition costs and sales network commission expenses (88,406) (48,973) (146,582) - - (283,961)Other commission expenses (6,356) (12,224) (9,323) - - (27,903)General and administrative expenses (92,082) (151,911) (69,107) - 1,175 (311,925)Amortisation and depreciation (4,505) (7,436) (2,714) - - (14,655)Net provisions for risks (4,042) (1,683) (6,695) - - (12,420)TOTAL COSTS (195,391) (222,227) (234,421) - 1,175 (650,864)PROFIT BEFORE TAX 56,124 (44,293) 123,787 (43,789) - 91,829Income tax - - - - - (16,898)NET PROFIT FOR THE PERIOD - - - - - 74,931Goodwill 22,915 - - - - 22,915Investment Property 108,041 - - - - 108,041Equity investments - - - 404,494 - 404,494HTM investments + LR 490,380 2,686,210 - - - 3,176,590AFS instruments 2,609,978 5,722,469 42,845 19,390 - 8,394,682Fin. assets/liabilities at FV through profit or loss 2,191,890 359,831 - - - 2,551,721Financial assets - risk borne by policyholder 12,268,431 - - - - 12,268,431Net treasury position (247,712) 4,034,735 (54,088) 265,605 - 3,998,540- of which intercompany 452,315 382,609 43,412 135,588 - 1,013,924Loans to customers - 3,245,008 - - - 3,245,008Bank funding - 7,870,465 - - - 7,870,465- of which intercompany - 946,482 - - - 946,482Net technical reserves 18,054,896 - - - - 18,054,896

111
NOTES TO THE CONSOLIDATEDANNUAL FINANCIAL STATEMENTS
ABROAD
Consolidation adjustments TotalSpain Germany
119,045 23,453 - 9,543,417(103,339) (20,186) - (9,505,033)
15,706 3,267 - 38,3843,747 267 - 98,475
11,339 4,910 - 417,7961,949 586 - 92,4965,128 21,701 (6) 111,1541,129 26 - 33,283
23,292 27,490 (6) 753,20410,772 1,719 - 230,749
(82) (308) - (65,688)10,690 1,411 - 165,061
- - - (34,582)335 (6,258) - 7,300112 - - (6,172)158 - - (125,462)605 (6,258) - (124,334)326 937 (168) 22,252
50,619 26,847 (174) 819,985(16,414) (3,548) 7 (303,916)
(2,724) (19,493) - (50,120)(25,943) (14,344) 167 (352,045)
(1,644) (792) - (17,091)(174) - - (12,594)
(46,899) (38,177) 174 (735,766)3,720 (11,330) - 84,219
163 (217) - (16,952)3,883 (11,547) - 67,267
122,809 4,140 - 149,864- - - 108,041- - - 404,494- 8,989 - 3,185,579
642,063 25,660 - 9,062,40610,004 4,846 - 2,566,571
450,337 63,839 - 12,782,607383,678 (88,244) - 4,293,974
(391,929) 9,256 - 631,251137,333 8,712 - 3,391,053292,176 66,983 - 8,229,625
349 (184) - 946,647460,502 65,449 - 18,580,848

112
CONSOLIDATED ANNUALFINANCIAL STATEMENTS
2012
PART F – INFORMATION ON RISKS AND RISK MANAGEMENT
Risk Management and Internal Control
The Group’s internal control system consists of the set of rules, procedures and functions established to ensure the
effectiveness and efficiency of corporate processes, the protection of company’s assets and the proper management
of customer assets, the reliability and integrity of accounting and management information as well as compliance
with internal and external rules, statutes and regulations. The various companies within the Mediolanum Group oper-
ate a comprehensive, effective internal control system in accordance with applicable regulations and the business
they conduct.
The Board of Directors and management play a key role in the establishment of an adequate risk management
framework and the implementation of an effective internal control system. However, in addition to specific functions
and committees, responsibility for risk management and internal controls is taken at different levels throughout the
organisation.
Specifically, the internal control system is built around the following three main lines of defence:
• line controls. This first line of defence consists of controls made by the individuals who carry out a certain activ-
ity and by their supervisors, generally within the same organisational unit or function. These controls are carried
out by operational units or embedded in automated procedures, and they are part of back-office activities;
• risk controls or second level controls. These are specific controls performed by units other than operating units
that contribute to the definition of risk measurement methods, control of operating limits of officers to whom
authorities are delegated, and verify compliance of transactions with the risk/return targets set by corporate bod-
ies in their respective areas of responsibility. This second line of defence is tailored to the risk profile of the indi-
vidual business and includes controls over credit risk, market risk, capital risk, investment risk, operational risk,
compliance risk and reputational risk;
• internal Audit or third level controls. This third line of defence entails the periodic assessment of the complete-
ness, effectiveness and adequacy of the internal control system in relation to the nature of the business and the
level of risks undertaken. These controls are the responsibility of the Internal Audit function which is separate
and independent of operating units.
For the performance of their duties, control staff are granted access to all corporate structures as well as to any
information they may need to assess outsourced activities. The Board of Directors and the Board of Statutory
Auditors receive regular reports on internal control work so that they can promptly take suitable corrective meas-
ures if deficiencies are detected.
Compliance & Risk Control
The Compliance & Risk Control team is responsible for monitoring Mediolanum SpA exposure to financial risk and
credit risk, assessing the impact of operational, legal and reputational risks and ensuring that capital is adequate
to the business conducted. The Compliance & Risk Control team also continuously monitors the regulatory environ-
ment for changes in statutes or regulations in order to ensure compliance therewith and assess their impact on the
Group business.
The Group risk management framework was built considering the profile of individual entities and their business

113
NOTES TO THE CONSOLIDATEDANNUAL FINANCIAL STATEMENTS
and taking into account the level of risk concentration/diversification originating from being part of the Group. It
includes the policies for the risks managed directly by subsidiaries (underwriting, reserve, market, credit, liquidity,
operational, legal, strategic, reputational risks) as well as the policies for the risks faced by individual entities as a
result of being members of the Group, that are monitored and managed by the holding company Mediolanum S.p.A..
Risk management processes are calibrated to the degree of complexity of the individual businesses and the poten-
tial impact of risk on them with clear definition of roles and responsibilities, timing and manner of risk identifica-
tion as well as reporting lines.
The Group risk management framework has been developed taking into account the nature of the business as well
as statutory and regulatory requirements and is continually reviewed and upgraded to keep abreast of any changes
in the internal and external regulatory and business environment.
The Group risk management framework, together with related corroborative information, was examined and
approved by the Audit Committee, Senior Management and the Board of Directors of the Parent Company.
Underlying principles
The following general principles form the bedrock of the Group risk management framework:
• identification and full coverage of all categories of risks within all companies;
• segregation of duties between the Compliance & Risk Control function and Operating Units, in accordance with
the proportionality principle, which entails an implementation approach by subsidiaries commensurate with the
size of the entity;
• use of uniform, consistent models and methods for the collection of data and information as well as for the analy-
sis and measurement of risks by all organisational units and/or companies within a Group;
• timely and consistent analysis and measurement of risks; subsequent preparation of reports to support control
and decision-making processes;
• transparency and dissemination of models, methods and criteria applied in the analysis and measurement of risks
to promote a control culture within the organisation and understanding of the reasons underlying the choices
made;
• delegation of risk management authorities and responsibilities from the Board of Directors to the Operating
Units for their direct management of the risks to which corporate processes are exposed.
To ensure adherence to the principles above and have a comprehensive risk management framework, the
Mediolanum Group has adopted a set of risk policies.
The main purposes of risk policies are to:
• ensure that any material breaches/anomalies be promptly identified by the internal control system and adequate
corrective/mitigating actions be taken;
• ensure the consistent application of risk management principles and rules across the Group;
• promote a risk management culture at all levels of the organisation and encourage consistent, knowledgeable
operating choices and practices, in a structured way.
The Compliance & Risk Control function of Banca Mediolanum provides risk management and compliance servic-
es to Mediolanum S.p.A. under a specific service agreement. The Compliance & Risk Control function of Banca
Mediolanum is organised into three main units: Risk Control, Risk Assessment & Mitigation, Compliance.

114
CONSOLIDATED ANNUALFINANCIAL STATEMENTS
2012
Risk Control
The main duties of the Risk Control team are to:
• compute economic capital both for the individual entities and at Group level for the risks that fall within its
remit;
• monitor credit risk, concentration and residual risks of institutional counterparties; prepare business plan-com-
pliant credit and rating policy proposals for the relevant portfolios in collaboration with the Finance division, and
submit them to the Board of Directors at least annually; implement all procedures for monitoring the credit risk
limits set out in approved policies;
• perform institutional counterparties’ credit analysis in accordance with the credit policy, oversee to credit risk
monitoring and report any ‘anomalies’; define, where relevant, and through adequate tools, the level of potential
insolvency of the individual borrowers, as well as key statistics for the various forms of lending in order to ensure
the solvency of the Bank and of the Banking Group; measure credit risk and verify capital adequacy;
• manage the risk control process for market and solvency risks at Banking Group level for the proprietary port-
folio, in accordance with the requirement of the Basel Committee on banking supervision; in connection there-
with, calculate the VaR of the proprietary portfolio on a daily basis; monitor developments in operational risk
through risk identification, measurement and control in accordance with internal rules and the risk appetite of
the organisation; carry out stress tests and produce regular reports;
• coordinate with Network Inspectors and the Anti-Money Laundering team for controls of operational risk relat-
ing to the Sales Network activities;
• verify and validate the models for the calculation of the capital charge for operational risk and activities pre-
scribed by regulatory requirements in relation to the measurement methods adopted by individual entities and at
Group level;
• with the assistance of the relevant organisational functions, gather information needed for the quantification and
management of losses arising from operational risk;
• compile operational risk loss data for periodic reports required by supervisory authorities;
• monitor the asset liability management process adopted by the Finance division to identify any differences in
respect of the limits set forth in the approved policy;
• monitor operational and structural liquidity management, prepare daily reports and identify any issues in respect
of the limits set forth in the approved policy;
• conduct, at least annually, stress tests for significant risks as well as retrospective and prospective tests for hedge
accounting purposes;
• report on the risk position taken by the Bank and the Banking Group;
• assess the consistency of the risk appetite of the Bank and other monitored entities, both individually and at
Group level, verifying risk levels and proposing any corrective actions that may be necessary to meet set targets;
• gather real economy, monetary policy, credit and financial market information and data including for the prepa-
ration of the notes to the financial statements;
• organise and coordinate the other units within the Compliance & Risk Control function for the finalisation of cor-
porate reports;
• develop, process and produce mathematical and statistical models for risk analysis by gathering financial data,
all in accordance with best market practices;
• develop models for the calculation of economic capital and estimate of related variables;

115
NOTES TO THE CONSOLIDATEDANNUAL FINANCIAL STATEMENTS
• develop tactical solutions for the assessment of risk in relation to products not yet covered by market risk man-
agement procedures, in accordance with best market practices;
• develop methods for liquidity risk and interest rate risk management in collaboration with first-level risk man-
agement functions;
• develop pricing models for fair value measurement of financial instruments issued or placed by the Bank, in
accordance with best market practices;
• validate any pricing and risk calculation models developed by line functions;
• validate pricing used for the valuation of the Bank’s securities portfolio in accordance with the rules set forth in
the active market policy;
• develop methods for refining stress testing techniques for the risks falling within its remit.
Risk Assessment & Mitigation
The Risk Assessment & Mitigation team is responsible for identifying, monitoring and assessing compliance and
operational risk exposures of the various organisational units, collaborating with the other units within the
Compliance & Risk Control Function to arrive at a common assessment of the risks to which the various organisa-
tional areas and processes are exposed, their mitigation and subsequent optimisation of operational effectiveness
and efficiency. In addition, including through a system of remote indicators, this team makes sure checkpoints and
controls over operational and compliance risk are effectively implemented. The team monitors management of cus-
tomer complaints and supervisory requirements, checks their progress also in view of promptly identifying any areas
for improvement in the processes in place within the organisation.
The team also provides assistance to the Chief Financial Officer in relation to his guidance and coordination duties
regarding accounting and financial reporting procedures within the Group.
Compliance
The Compliance team is responsible for continuously monitoring the banking, financial, insurance and pension reg-
ulatory environment for any changes in statutes and regulations and early assessment of their impact on the Group
business. The Compliance team provides advice and assistance to the Chairman of the Board of Directors, the
Executive Deputy Chairman and the Chief Executive Officers in the assessment of compliance of procedures and
practices with applicable laws and regulations as well as in the timely introduction of amendments thereto in case
of regulatory changes.
Specifically, in relation to Mediolanum S.p.A., the compliance team:
• monitors the regulatory environment, assesses the impact of statutes and regulations on the business at Group
level, and proposes changes to operating processes and/or procedures, when needed;
• reviews compliance of processes with the law, the regulations issued by Supervisory Authorities and self-disci-
pline rules (e.g. codes of conducts) as well as with any other applicable rules. This is done working together with
Internal Audit, Corporate Affairs and Operations staff.

116
CONSOLIDATED ANNUALFINANCIAL STATEMENTS
2012
Internal Audit
The internal audit team constantly monitors the internal control system to verify its effectiveness and efficiency and
to identify any deficiencies in the system, in procedures or policies. The internal audit team also monitors the effec-
tiveness of the overall financial risk, credit risk and operational risk management system and promotes actions to
enhance it, when needed.
Internal auditors provide independent and objective audit services and advice to improve the effectiveness and effi-
ciency of the organisation and of the overall internal control system.
They monitor operation and assess functionality of the overall internal control system, including via field checks,
and report on possible improvements of risk management policies, risk measurement tools and governance process-
es to the Board of Directors and the Chief Executive Officer.
The internal audit team provides the services outlined above for those Group companies with which the Bank has
signed a specific internal audit service contract, and, at Group level, it coordinates its audit work with the internal
audit teams of subsidiaries and associates.
The team regularly reports on its activities to the Board of Directors, the Board of Statutory Auditors and the Audit
Committee. In the event of serious irregularities the team immediately reports them to the Board of Statutory
Auditors and the Board of Directors.
Audit Committee
The Audit Committee provides assistance to the Board of Directors in their at least annual assessment of the con-
formity, adequacy and effective operation of the internal control system by making sure that key risks, including
credit risk, are correctly identified and measured as well as properly managed and monitored.
The Audit Committee assists the Board of Directors in the performance of their duties of guidance with respect to
the Internal Control System of the Company and its subsidiaries as well as the regular assessment of its adequacy
and effective operation.
The Audit Committee assesses the audit programme prepared by the Internal Audit team from which it receives reg-
ular reports; it examines and assesses any issues raised by control teams, the Statutory Auditors and the independ-
ent auditors in their reports; it assesses issues raised and recommendations made following controls by Control
and/or Supervisory Authorities. The Audit Committee reports to the Board of Directors on its activities, at least
biannually, upon the approval of the half-yearly and annual reports and accounts; it fulfils the further internal con-
trol duties mandated to it by the Board of Directors, in particular in respect of its relationship with the independ-
ent auditing firm.
RISK DISCLOSURES PURSUANT TO IFRS 7
Under IFRS 7 – which became effective for annual periods beginning on or after January 2007 – entities are
required to provide disclosures in their financial statements that enable users to evaluate the nature and extent of
risks arising from financial instruments to which the entity is exposed.

117
NOTES TO THE CONSOLIDATEDANNUAL FINANCIAL STATEMENTS
The disclosures required under IFRS 7 are both qualitative and quantitative and relate to exposure to credit risk,
liquidity risk and market risk. Qualitative disclosures relate to the “objectives, policies, processes and methods
adopted by management for risk measurement and management”, while quantitative disclosures relate to quanti-
tative data about the entity’s exposures to credit risk, liquidity risk and market risk.
This section provides information that is representative of Mediolanum Group risk exposures pursuant to IFRS 7,
in accordance with their relevance for the Group’s operating segments, i.e. insurance, banking and asset manage-
ment.
Pursuant to IFRS7 disclosures are provided in relation to liquidity risk, credit risk and market risk.
This section, however, contains further information about risk management policies and techniques for purposes
beyond the scope of IFRS 7.
Financial Instruments’ classification method and principles
Pursuant to IFRS7, exposures are analysed in relation to three main types of risk:
1. Credit risk is the risk of loss arising from the deterioration in the creditworthiness up to default of either retail
customers or institutional counterparties of whom the bank is a creditor in its investment activities, as a result
of which debtors fail to meet all or part of their contractual obligations.
2. Market risk is the risk of potential losses, which may also be significant, from adverse movements in market
rates and prices to which the Mediolanum Group companies are exposed in their investment activities. These
include movements in interest rates, foreign exchange values, equity prices, volatility, bond spreads.
3. Liquidity risk is typically the risk that arises from the difficulty of liquidating assets. More specifically, it is the
risk that a financial instrument cannot be bought or sold without a material decrease/increase in its price (wide
bid-ask spread) due to the potential inability of the market to settle the transaction wholly or partly. Liquidity
risk is also the potential that an entity will be unable to obtain adequate funding. Pursuant to Basel II Second
Pillar Supervisory Review of the Internal Capital Adequacy Assessment Process (ICAAP), the regulator requires
banking organisations to put in place liquidity risk measurement and management policies and processes.
In March 2009, the IASB issued amendments to IFRS 7 to respond to market pricing predicaments following the
financial crisis and the need for improved transparency. A key change introduced by the IASB was a fair value meas-
urement hierarchy (‘fair value hierarchy’) that has the following 3 levels:
• Level 1 fair value measurements are those derived from quoted prices in active markets;
• Level 2 fair value measurements are those derived from inputs that are based on observable market data other
than quoted prices;
• Level 3 fair value measurements are those derived from valuation techniques that include inputs for the asset or
liability that are not based on observable market data.
118
CONSOLIDATED ANNUALFINANCIAL STATEMENTS
2012
The Mediolanum Group classified its assets and liabilities at fair value in accordance with the rules set out in said
amendments, providing disclosures both by line of business and by type of product.
For its insurance business, the Mediolanum Group also disclosed separately risk information relating to its own risk
and the risk of its clients (assets backing Class III reserves).
Information on risks is set out below.
Risk management at Conglomerate level
For financial conglomerates that engage in both insurance and banking, the traditional approach applied by regu-
lators and supervisors to ensure that enough capital is held against risks has been to consider the risk profile of
each business (insurance and banking) and set forth capital requirements against the specific risks to which each
business is exposed. The insurance business is subject to Solvency II requirements and the banking business to the
ICAAP process. At conglomerate level, compliance with these requirements is compounded by assessment, analysis
and monitoring of risk concentration. Risk concentration indicates an exposure with the potential to produce loss-
es that are large enough to threaten the solvency or financial position of the conglomerate entities. Management
and control of risk concentration is carried out by aggregating the exposures of all Conglomerate entities to the
same counterparty, be it public or private, regardless of the form of exposure.
Quarterly reports with particulars on the most significant exposures of the Conglomerate to the same counterpar-
ties are sent to the supervisory authorities.
Owing to their pervasive nature a common risk framework was adopted at Group level for strategic risk, operational
risk, compliance risk and reputational risk. Said framework is applied to the various entities within the Group under
a proportionate approach according to the characteristics of the specific business and related statutory and regu-
latory requirements.
Given the common framework information about strategic risk, operational risk, compliance risk and reputational
risk provided in the following pages relates to the entire Group while the information about financial risk and cred-
it risk is given separately for the insurance business and banking business.
119
NOTES TO THE CONSOLIDATEDANNUAL FINANCIAL STATEMENTS
Insurance - Financial Risk and Credit Risk
Introduction
The Group conducts insurance business through two entities: the Italian company Mediolanum Vita and the Irish
company Mediolanum International Life LTD.
The risk management models are tailored to the complexity of the business and the characteristics of the products
sold. In certain instances, e.g. class III products dealt with by both companies, control processes are geared to pro-
tect the policyholders who bear the investment risk thereof, through the validation of pricing models and control of
issuers’ solvency. The Irish company has limited free capital which is mainly invested in term deposits held with other
Mediolanum Group companies. Any payment obligation under residual index-linked policies following surrenders is
promptly settled with the counterparties, thus free capital residual exposure to counterparty risk is marginal. The
Group also monitors concentration risk and credit risk exposures using “credit VaR”. (For details on control meth-
ods and processes, readers are referred to the section commenting Index Linked contracts).
Overall portfolio risk is also monitored for the Italian insurance company as it offers a broader, more diversified
portfolio of products (prevalence of class III products, class I products, and residual portfolio of products in class
I i.e. capitalisation plans, and class VI i.e. pension funds). Risk management and control activities are carried out
by both the operating units of the insurance company and by second-level functions, e.g. Risk Control team.
Free Capital and Traditional Portfolio
The controls currently in place monitor the value of underlying assets ex-ante and ex-post. Frequency of controls is
established at the level of each entity.
In the traditional reserve portfolio the risk of asset-liability mismatch is periodically assessed by Mediolanum Vita
using an Asset Liability Management stochastic model.
Under the regulations in force, the insurance companies within the Group are authorised to use derivatives to hedge
current positions or movements in underlying assets or liabilities. Financial derivatives are primarily used to achieve
operating targets with greater efficiency, flexibility and rapidity, to optimise portfolio management (“effective man-
agement”) and to mitigate market risk arising on interest rate or foreign exchange rate movements.
Asset Liability Management
Mediolanum Vita S.p.A. uses an advanced system for improved asset-liability measurement and management, i.e. a
stochastic Dynamic Financial Analysis (DFA) system which models the reactions of the company in response to a
large number of different scenarios and strategic choices. It allows projections not only of possible future scenar-
ios but also of their probability. The software generates stochastic projections of the flows of assets and liabilities
in the company’s traditional portfolio. To that end, at each assessment date 1,000 Market-Consistent financial sce-
narios are generated. Each of these scenarios shows the possible developments of risk factors over a 20-year hori-
zon. The system allows ex-ante modelling for:
• current and future asset allocation;
• type of securities to be bought/sold;
• ranking of securities to be bought/sold;
• liabilities paid up and lapse rate assumptions;
• return targets;
• actions to be taken to meet return targets.

120
CONSOLIDATED ANNUALFINANCIAL STATEMENTS
2012
Through ad-hoc reports generated by the system, it is possible to monitor the long-term impact of management
investment choices on the company’s profitability and solvency.
Key Risks Mapping
Group insurance entities’ exposure to financial risks arises from investments made to attain the strategic goals pur-
sued by these entities both in terms of income generation and levels of technical reserves. In particular, key finan-
cial risks essentially consist of market risk – mainly interest rate risk and spread risk – and, to a limited extent,
credit risk counterparty risk. The latter is principally in connection with derivate contracts and is mitigated via col-
lateralisation under ISDA/CSA agreements as per the relevant policy. Risk analysis also includes liquidity risk, reg-
ulatory compliance risk and, last but not least, reputational risk.
Since the risk exposures of the Italian Life Insurance Company are more significant than those of the Irish
Company, risk management disclosures set out in the next sections focus on Mediolanum Vita.
Solvency II
The Mediolanum Group started the implementation of its Solvency II compliance project several years ago. All
group teams in their various roles are engaged in the Group-wide efforts for compliance with all requirements under
Solvency II three pillars. The first pillar relates to quantitative requirements for the risk-based calculation of sol-
vency capital, the second pillar to qualitative and quantitative requirements and involves Own Risk and Solvency
Assessment (ORSA), and the third pillar to reporting and disclosure to the various stakeholders.
The project underway includes the review of risk management processes and the implementation of a Group-wide
system for the calculation of the Solvency Capital Requirement (SCR). The Mediolanum Group is now completing
the infrastructure for the calculation of the first pillar capital requirement, the ORSA process as well as reviewing
its risk appetite and internal risk governance. The Solvency II project will deliver a more risk-based management
system for the insurance business rounding out the Mediolanum Group’s overall risk management system which is
built on strong foundations including Basel II compliance and the ICAAP process in the Banking Group.
Over the years the Mediolanum Group has participated in all quantitative impact studies (QIS) required by
European insurance authorities and as part of its ORSA project it has developed initial projections of prospective
capital levels applying Solvency II required methods.
Financial risk management policies – General and organisational aspects
The Mediolanum Group financial risk management framework is designed to ensure:
• consistency with the organisational model and respect of existing internal relations and constraints;
• engagement of multiple organisational structures in Risk Control processes;
• enhancement and optimisation of organisational checkpoints, interrelations and flows of information between
existing organisational structures.
With respect to the Italian Life Insurance Company, Mediolanum Vita, a multitude of players are engaged in
Financial Risk Control activities across the Group.
Mediolanum Gestione Fondi and Banca Mediolanum are engaged in activities conducted under outsourcing arrange-
ments. They provide assistance in monitoring, control, management and mitigation of financial and credit risks in

121
NOTES TO THE CONSOLIDATEDANNUAL FINANCIAL STATEMENTS
relation to managed assets, each within its sphere of competence and in accordance with the degree of exposure to
risk factors and the organisational complexity of the business.
The organisational architecture that supports the process is made up of the interrelations of all organisational struc-
tures of the Life Insurance Company that are engaged in it: the Board of Directors, the Chief Executive Officers,
the Asset and Product Management Committee, the Asset Management Office, the Asset Managers (Mediolanum
Gestione Fondi), the Compliance & Risk Control function, the Risk Control team and the Internal Audit function.
The internal control system consists of the set of rules, procedures and functions established to ensure the effective-
ness and efficiency of corporate processes, the protection of corporate assets as well as the proper management of
customer assets, the reliability and accurateness of financial and management information as well as the compli-
ance of transactions with the law, the regulations issued by Supervisory Authorities, self-discipline and internal
rules.
The Board of Directors and management play a key role in the establishment of an adequate risk management
framework and the implementation of an effective internal control system.
As already noted, the internal control system is designed to encompass the following three main lines of defence:
• line controls or first level controls;
• second level controls;
• internal audit.
Risk management and control is implemented across the Group involving both management and the corporate struc-
tures that are responsible for guidance, control and supervision with segregation of duties between business and con-
trol functions.
Line controls are controls made by the individuals who carry out a certain activity and by their supervisors, gener-
ally within the same organisational unit or function. These controls are mainly carried out by the following struc-
tures:
• Asset Management Office;
• the Mediolanum Gestioni Fondi structures that are authorised to operate on the market as part of their asset
management activities under specific mandates; Mediolanum Gestioni Fondi has first level control and manage-
ment structures for which risk management is a primary focus;
• Chief Actuary and Actuarial department;
• Valuation office.
Second level controls are carried out by the Compliance & Risk Control function of Banca Mediolanum under the
relevant outsourcing agreement. This function is separate and segregated from the structures of the insurance com-
pany and the asset management company and is responsible for contributing to the definition of risk measurement
methods and operating limits, and for verifying compliance of transactions with the risk/return targets set by cor-
porate bodies for each service.
Internal Audit is carried out by Banca Mediolanum’s Internal Audit team under the relevant outsourcing agreement
and includes the periodic assessment of the completeness, effectiveness and adequacy of the internal control system
to the nature and the level of risks undertaken. These third level controls are conducted by structures that are sep-
arate and segregated from business structures and from those responsible for second level controls. The Board of
Directors and the Board of Statutory Auditors receive regular reports on internal audit work so that they can
promptly take suitable corrective measures if deficiencies are detected.

122
CONSOLIDATED ANNUALFINANCIAL STATEMENTS
2012
Market risk
Market risk associated with the traditional portfolio of the Italian Life Insurance Company is managed in accor-
dance with regulatory requirements and market best practice, applying Value at Risk measurement and manage-
ment processes. In light of the composition of the traditional portfolio, the main risk factors are interest rate risk
and spread risk.
The chart below shows Value at Risk (VaR) in FY 2012.
0
10,000.00
20,000.00
30,000.00
40,000.00
50,000.00
60,000.00
70,000.00
Risk limit
VaR at 99%
(€/000)
Jan
16, 2
012
Dec
16,
201
2
Nov
16,
201
2
Oct
16,
201
2
Sep
t 16
, 201
2
Aug
16,
201
2
July
16,
201
2
June
16,
201
2
May
16,
201
2
Apr
16,
201
2
Mar
16,
201
2
Feb
16,
201
2

123
NOTES TO THE CONSOLIDATEDANNUAL FINANCIAL STATEMENTS
The table below sets out an analysis of the Italian Life Insurance Company portfolio by rate.
FloatingStep CPN
Fixed
Variable
Step CPN2.1%
Floating25.9%
Fixed55.9%
Variable2.3%
Zero Coupon13.8%
Zero Coupon
Analysis of the Mediolanum Vita portfolio by type of assets (2012)
Credit riskThe risk that over the life of a financial instrument linked to an insurance product there may be an event which
changes the repayment ability (creditworthiness) of the counterparty (issuer) and consequently the value of the
credit position. Credit risk can be broken down into two components: insolvency risk and migration risk. Insolvency
risk is the risk of not being able to fully collect a certain number of future payments as a result of the insolvency
of the debtor; migration risk relates to the risk of a decline in the value of the instrument as a result of the deteri-
oration of the credit standing/rating of the debtor. The reduced credit rating of underlying assets was exclusively due
to domestic sovereign debt exposure and Italy’s credit rating downgrade in 2012. Given the predominance of domes-
tic treasuries, however, the risk of default for the securities portfolio of the Italian life insurance company is rela-
tively low.
Mediolanum Vita Securities Portfolio – RATING COMPOSITION (S&P equivalent)(YE 2012 vs. YE 2011)
Rating (S&P Equivalent)
2012 2011
Change (%)€/000 % €/000 %
Total Portfolio 4,083,176 100% 5,116,498 100% (20%)
AAA - 0.0% - 0.0% n/a
AA+ to AA- 23,569 0.6% 67,064 1.3% (65%)
A+ to A- 140,667 3.5% 3,070,847 60.0% (95%)
BBB+ to BBB- 3,285,948 80.5% 1,694,481 33.1% 94%
BB+ or lower 632,991 15.5% 278,845 5.4% 127%
Unrated - 0.0% 5,260 0.1% (100%)
NOTE: the value of the securities portfolio does not include residual Index Linked Policies, Funds, Shares and Rights.

124
CONSOLIDATED ANNUALFINANCIAL STATEMENTS
2012
Mediolanum Vita Securities Portfolio – POSITION(YE 2012 vs. YE 2011)
700,000
600,000
Mediolanum Vita Portfolio Analysis (free capital and traditional reserves at Dec. 31, 2012)800,000
500,000
400,000
300,000
200,000
0
MATURITY1d
100,000
AFSHFTL&RHTM
3m 6m 1yr 2yr 3yr 5yr 10yr
Nom
inal
val
ue (
€/00
0)
Mediolanum Vita Portfolio Analysis
IAS Category €/OOO 2012 2011 Change (%)
HFTNominal value 574,366 2,187,690 (74%)
Market value 553,764 2,099,921 (74%)
AFSNominal value 3,067,540 2,866,935 7%
Market value 3,057,314 2,575,370 19%
HTMNominal value 353,856 323,856 9%
Market value 337,809 269,782 25%
L&RNominal value 131,343 179,417 (27%)
Market value 134,289 171,425 (22%)
NOTE: the value of the securities portfolio does not include residual Index Linked Policies, Funds, Shares and Rights.
The analysis of the Mediolanum Vita portfolio by IAS/IFRS category is set out below:
Liquidity risk
Liquidity risk is essentially in relation to Mediolanum Vita S.p.A.’s free capital and traditional portfolio since for
Class III reserves there are buyback arrangements in place ensuring that the assets backing said reserves can be
promptly realised. Liquidity risk is managed applying a Group-wide consistent method of analysis based on matu-
rity and rating. Maturity analysis provides information for the management of liquidity risk and interest rate risk
showing any mismatch by type of instrument and maturity (month or quarter):
• for fixed-rate instruments it shows all cash flows (principal and interest) at maturity;
• for floating-rate instruments coupons are posted at maturity, while principal is posted at the first re-pricing date
after the analysis.

125
NOTES TO THE CONSOLIDATEDANNUAL FINANCIAL STATEMENTS
Investments to the benefit of policyholders who bear the investment risk and in connection with pension fund management
These investments consists of holdings in Proprietary Insurance Funds (under Unit-Linked policies), financial
instruments – notes and derivative instruments – (under Index-Linked policies) and individual pension plans that are
an insurance product linked to holdings in Irish UCITS. For these products the amounts payable by Life Insurers
are linked to changes in the value of units of one or more proprietary funds, which in turn depends on changes in
the price of the underlying financial assets or in the price of the financial instruments.
The competent functions manage risk by ensuring that regulatory limits (e.g. exposure limits, asset quality and
volatility) are not exceeded.
For class III products – Unit and Index-Linked policies – the use of derivatives is allowed to protect related tech-
nical reserves. Derivatives and the related assets approximate at best possible the value of technical reserves.
The company is exposed to counterparty risk on existing derivative positions. For listed instruments with daily re-
margining risk is residual.
For Over-The-Counter contracts, exposure to credit risk is represented by the fair value on the measurement date.
Credit risk is regularly monitored by reviewing counterparty exposure limits and credit standing. In addition, cred-
it risk is mitigated by collateralisation under CSAs (where applicable).
The Mediolanum Vita pension product does not offer guarantees of a financial nature, therefore up until the time
conversion into annuities occurs, the amount of accrued capital is always entirely correlated to the value of the hold-
ings in the UCITS into which the contributions paid are invested.
Credit Risk
The teams of each insurance entity within the Group monitor exposure to credit risk also for Index Linked contracts,
as this type of insurance investment entails customer exposure to two or three counterparties (the bond issuer, the
option counterparty and in some cases the swap counterparty). For the Index Linked portfolio credit risk analysis
includes measurements of both nominal value and market value of exposures. For each counterparty the probabili-
ty of default (PD) is assessed on the basis of the 1-year CDS spread quote at the end of the month and Loss Given
Default (LGD, set at 60% according to best market practice). PD times LGD and exposure gives the expected loss
for each counterparty. The 1-year expected losses due to default in the Index Linked portfolio is computed by aggre-
gating all expected losses.
Index Linked Portfolio - Credit VaR
In addition to expected losses (EL) also unexpected losses (UL) are computed for credit risk. Unexpected losses
are unusual losses that occur rarely and have a high severity. Unexpected losses are computed using Credit VaR in
Credit Metrics©. Unexpected losses are the difference between the 99th percentile in loss distribution, i.e. Credit
VaR, and expected losses as defined above. The distribution of losses due to default is calculated via 100,000 Monte
Carlo simulations, which take account not only of the probability of default of individual issuers (“specific risk”),
but also the default correlation between the counterparties (“systemic risk”).

126
CONSOLIDATED ANNUALFINANCIAL STATEMENTS
2012
Group Index Linked Portfolio Credit VaR (YE 2012 vs. YE 2011)
Reinsuredtechnical reserves(€/000)
Expectedloss
(€/000)Moody’s
ratingS&P’srating PD LGD
TOTAL 75,876 921
Swiss Re Europe SA 31,535 446 A1 AA- 2,36% 60%
Munchener Ruck Italia S.p.A. 16,785 95 Aa3 AA- 0,95% 60%
SCOR Global Life SE 11,779 166 A1 A+ 2,36% 60%
SCOR Global Life SE (EX REVIOS) 7,229 102 A1 A+ 2,36% 60%
Swiss Re Frankona Rueckversicherung - AG 6,547 93 A1 AA- 2,36% 60%
Hannover Rueckversicherung - AG 2,000 19 WR AA- 1,60% 60%
€/’OOO 2012 2011 Change (%)
Expected loss 28,617 96,709 (70%)
Unexpected loss 380,645 791,792 (52%)
Credit VaR (99%) 409,262 888,501 (54%)
Reinsurance credit risk
Mediolanum Vita has reinsured part of its portfolio. Exposures arising from reinsurance are exposures to counter-
party risk. In line with the methods applied to other portfolios, credit risk exposures associated with reinsurance are
estimated based on expected losses where the probability of default (risk neutral) is derived from CDS spreads
(where the CDS of the individual counterparty is not available, a sector index is used). Credit risk associated with
reinsurance contracts in force is partly mitigated through deposits received from counterparties.
Mediolanum Vita Portfolio Reinsurance Credit Risk Data as of Dec. 31, 2012

127
NOTES TO THE CONSOLIDATEDANNUAL FINANCIAL STATEMENTS
Fair Value Hierarchy Disclosures
Fair value hierarchy information relating to Mediolanum Vita’s Free Capital, Traditional Reserves and Class III
Portfolios is set out in the table below.
Data as of Dec. 31, 2012 – Mediolanum Vita
€/’000
L1 L1 L2 L2 L3 L3 TOTAL TOTAL
2012 2011 2012 2011 2012 2011 2012 2011
Free Capital
Assets
Debt securities 3,746,761 4,645,949 232,365 366,352 16 27,365 3,979,142 5,039,666
Equities - - - - 1,223 1,480 1,223 1,480
Holdings in UCITS - - 5,067 9 27,104 29,253 32,171 29,262
Loans - - - - - - - -
Financial derivatives 138 - 1,188 576 1,945 1,463 3,271 2,039
Credit derivatives - - - - - - - -
TOTAL ASSETS 3,746,899 4,645,949 238,620 366,938 30,288 59,560 4,015,807 5,072,447
Liabilities
Financial derivatives - - (2,154) (4,278) (1,967) (3,861) (4,121) (8,139)
TOTAL LIABILITIES - - (2,154) (4,278) (1,967) (3,861) (4,121) (8,139)
TOTAL A+L 3,746,899 4,645,949 236,465 362,660 28,321 55,699 4,011,686 5,064,307
Class III
Assets
Debt securities 115,742 116,575 680,356 1,095,143 6,751 55,423 802,849 1,267,141
Equities - - - - - - - -
Holdings in UCITS 8,952,574 8,309,871 368 2,875 - - 8,952,942 8,312,746
Loans - - - - - - - -
Financial derivatives - - 29,497 24,312 31,373 (3,191) 60,870 21,121
Credit derivatives - - - - - - - -
TOTAL ASSETS 9,068,316 8,426,446 710,221 1,122,329 38,124 52,232 9,816,661 9,601,008
LiabilitiesLiabilities under financialcontracts issued by insurancecompanies - - - - - - - -
Deposits received from reinsurers - - - - - - - -
Financial liabilities of reinsurance contracts - - - - - - - -
Amounts due to banks - - - - - - - -
Amounts due to customers - - - - - - - -
Debt securities - - - - - - - -
TOTAL LIABILITIES - - - - - - - -
TOTAL A+L 9,068,316 8,426,446 710,221 1,122,329 38,124 52,232 9,816,661 9,601,008

128
CONSOLIDATED ANNUALFINANCIAL STATEMENTS
2012
As you can see from the data above, 99% of Level 3 assets are assets backing Class III reserves and as such any
movement in their fair value is directly reflected in the same amount in mathematical reserves without any impact
on the Company’s profitability. These assets mostly consist of options on stock market indices whose value is linked
to parameters such as volatility and correlation that are not directly observable in the market.
Fair value hierarchy information relating to Mediolanum International Life Ltd’s Free Capital and Class III
Portfolios is set out in the table below.
As of Dec. 31, 2012 – Mediolanum International Life Ltd
€/’000
L1 L1 L2 L2 L3 L3 TOTAL TOTAL
2012 2011 2012 2011 2012 2011 2012 2011
Free Capital
Assets
Debt securities 46,046 46,813 2,904 4,726 5,299 7,305 54,250 58,844
Equities - - - - - - - -
Holdings in UCITS 116 - - - - - 116 -
Loans - - - - - - - -
Financial derivatives - - 541 619 156 1,225 697 1,845
Credit derivatives - - - - - - - -
TOTAL 46,163 46,813 3,445 5,346 5,456 8,530 55,064 60,689
Class III
Assets
Debt securities 241,064 159,216 1,324,728 1,486,593 - - 1,565,793 1,645,810
Equities - - - - - - - -
Holdings in UCITS 594,994 559,863 121,652 156,272 - - 716,646 716,135
Loans - - - - - - - -
Financial derivatives - - 110,646 123,311 862,405 738,880 973,051 862,191
Credit derivatives - - - - - - - -
TOTAL ASSETS 836,058 719,080 1,557,027 1,766,176 862,405 738,880 3,255,490 3,224,136
LiabilitiesLiabilities under financial contracts issued by insurancecompanies (46,090) (27,839) (27,156) (52,544) (15,795) - (89,042) (80,383)
Deposits received from reinsurers - - - - - - - -
Financial liabilities of reinsurance contracts - - - - - - - -
Amounts due to banks - - - - - - - -
Amounts due to customers - - - - - - - -
Debt securities - - - - - - - -
TOTAL LIABILITIES (46,090) (27,839) (27,156) (52,544) (15,795) - (89,042) (80,383)
TOTAL A+L 789,968 691,240 1,529,871 1,713,632 846,609 738,880 3,166,448 3,143,752
NOTE: debt securities have been reclassified separating bonds from derivatives.

129
NOTES TO THE CONSOLIDATEDANNUAL FINANCIAL STATEMENTS
As you can see from the data above, 99% of Level 3 assets are assets backing Class III reserves and as such any
movement in their fair value is directly reflected in the same amount in mathematical reserves without any impact
on the Company’s profitability. These assets mostly consist of certificates, i.e. hybrid instruments with a significant
fixed-rate component and a derivative component that requires a valuation model with input data that are not
observable market data.
Banking - Financial Risk and Credit Risk
The Internal Capital Adequacy Assessment Process (ICAAP)
Under Basel II Pillar 2 (Title III of Bank of Italy’s Circular 263/2006) banks are required to have a process
(Internal Capital Adequacy Assessment Process, ICAAP) to estimate their own internal capital requirements to
cover all risks, including those not captured by the total capital requirement (pillar 1) as part of the assessment of
the bank’s current and future exposure, taking account of the bank’s strategies and possible developments in the
environment in which it operates. Supervisory regulations detail the steps, the frequency and the main risks to be
considered and, for certain risks, set out indications on methods that should be used in the assessment. In accor-
dance with the principle of proportionality – under which the level of detail and sophistication of the analysis
required in a bank’s ICAAP depends on the size, nature and complexity of the bank’s activities – the supervisory
authorities have classified banks into three categories. Responsibility for the ICAAP rests with corporate gover-
nance bodies.
The Supervisory Review Process (SRP)
The Supervisory Review Process (SRP) entails two integrated steps. The first is the banks’ process for assessing
their current and future capital adequacy in relation to their risk profile and business strategies (ICAAP). The sec-
ond is the Supervisory Review and Evaluation Process (SREP) conducted by the national banking supervisory
authorities that review and evaluate banks’ internal capital adequacy and, if needed, take appropriate action.
The SREP hinges on the collaboration and exchange of information between the Banking Supervisor and banks.
The Banking Supervisor (Bank of Italy) can thus gain a deeper understanding of the banks’ ICAAP including under-
lying assumptions, and banks can detail the assumptions underlying their assessment.
Banks define strategies and put in place procedures and tools to maintain adequate capital level – in terms of value
and composition – to cover all the risks to which they are or may be exposed, including those risks for which a cap-
ital charge is not required.
The ICAAP hinges on the bank’s sound risk management framework, effective internal control system, robust cor-
porate governance and well-defined lines of responsibilities.
Board and senior management are responsible for the ICAAP. They are responsible for designing and organising it
in accordance with respective competences and prerogatives. They are responsible for the implementation and for
regular reviews of the ICAAP to ensure it is commensurate with the operational and strategic environment in which
the bank operates.
The ICAAP must be documented, shared and known across the organisation and subject to internal audit.

130
CONSOLIDATED ANNUALFINANCIAL STATEMENTS
2012
The Supervisory Review Process reflects the principle of proportionality, i.e.:
• the bank’s corporate governance, risk management framework, internal control system and capital assessment
process are commensurate with the nature, size and complexity of its activities;
• the frequency , the level of detail and sophistication of the SREP depend on the systemic relevance, the nature,
size and complexity of the bank’s business.
Classification of intermediaries in relation to the ICAAP
The principle of proportionality applies to:
• the methods used to measure/assess risks and related internal capital adequacy;
• the type and characteristics of stress tests;
• the treatment of correlations between risks and overall internal capital requirements;
• organisation of the risk management system;
• level of detail and sophistication of ICAAP reports to the Bank of Italy.
To facilitate the implementation of the proportionality principle, banks are classified into three categories accord-
ing to their size and the complexity of their activities. The Mediolanum Banking Group falls within category 2, i.e.
banking groups or banks applying the standardised approach, with consolidated or separate assets in excess of €3.5
billion.
Banks apply a consistent approach to deriving capital requirements from the bank’s risk measurement under the
first pillar and overall internal capital requirements.
Banca Mediolanum’s ICAAP
In accordance with supervisory requirements and in line with best practices, Banca Mediolanum’s ICAAP entails
the following steps:
1) identification of risks for assessment;
2) measurement/assessment of individual risks and related internal capital level;
3) measurement of the overall internal capital level;
4) determination of overall capital level and reconciliation to regulatory capital.
Key Risks Mapping
In accordance with Bank of Italy’s Circular 263/06, the process for the identification of the key risks for the
Mediolanum Group starts from the analysis of the Bank’s and Group’s statutory lines of business and activities con-
ducted in each of these lines.
Risk mapping therefore starts from the macro lines that make up the Banking Group’s business.
In the Mediolanum Banking Group the following main business segments can be identified:
• Lending (Retail and Commercial Banking);
• Treasury activities (Trading and Sales);
• Asset Management;
• Retail Brokerage.
The starting point is risk measurement followed by the definition of relevant risk thresholds for risks for which there

131
NOTES TO THE CONSOLIDATEDANNUAL FINANCIAL STATEMENTS
is a capital charge requirement as well as for other risks for which there is no capital charge requirement but must
be analysed and monitored.
First pillar risks
Credit Risk (including counterparty risk)
Credit risk is the risk of loss arising from the deterioration in the creditworthiness up to default of retail, corporate
and institutional counterparties of whom the bank is a creditor in its investment or lending business, as a result of
which debtors fail to meet all or part of their contractual obligations.
Market Risk
For banks using the standardised approach the capital requirement for market risk is the sum of capital require-
ments for position risk, settlement risk, concentration risk and commodity risk.
Operational Risk
Banca Mediolanum defines operational risk as “the risk of economic loss or damage to assets, and sometimes legal
and administrative consequences, resulting from any misconduct or inappropriate behaviour of its personnel, inad-
equate or failed systems or internal processes, or external events.”
Second pillar risks
Concentration Risk
Concentration risk is the risk arising from exposure to individual counterparties, groups of related counterparties
or counterparties in the same industry, business segment or geographical area.
Interest Rate Risk
Interest rate risk arising on activities other than trading: the risk of potential movements in interest rates.
Liquidity Risk
Liquidity risk is typically the risk that arises from the difficulty of liquidating assets. More specifically, it is the risk
that a financial instrument cannot be bought or sold without a material decrease/increase in its price (wide bid-ask
spread) due to the potential inability of the market to settle the transaction wholly or partly. Liquidity risk is also
the potential that an entity will be unable to obtain adequate funding.
Residual Risk
The risk that the credit risk mitigation techniques adopted by the Bank turn out to be less effective than anticipated.

132
CONSOLIDATED ANNUALFINANCIAL STATEMENTS
2012
Strategic Risk
Strategic risk is the current or prospective risk of impact on earnings or capital arising from changes in the indus-
try, adverse business decisions, improper implementation of decisions, lack of responsiveness to industry changes.
Reputational Risk
Reputational risk is the current or prospective risk of impact on earnings or capital arising from the negative per-
ception of the bank’s image by customers, counterparties, shareholders, investors or supervisory authorities.
Credit Risk
General
Lending, be it the provision of home loans or consumer credit, or in other forms to meet other financing needs, is
part of the business of the Mediolanum Banking Group. Consistently with the Group mission, lending complements
the Group primary business i.e. the distribution of banking, asset management, insurance and retirement savings
products. The Group applies prudent credit policies, which are geared to develop and strengthen the relationship
with customers who invest in products managed by the companies within the Group.
Banca Mediolanum Lending Division is responsible for ensuring adequate implementation of the Bank’s credit pol-
icy in compliance with laws and regulations in force. This division is organised into the Short-term lending unit, the
Medium/Long-term lending unit, the Watchlist unit, the Credit Operations unit and the Credit Policy and Monitoring
unit.
The Short-term lending team is responsible for all processes relating to approval and granting of overdrafts, loans,
endorsements as well as for management of guarantees.
The team exercises credit approvals under delegated authorities. For credit that is outside the scope of the author-
ities delegated to it, the team prepares all information and documentation relating to the loan application includ-
ing a non-binding opinion and submits it to superior bodies.
The Medium/Long-term lending team is responsible for approval and granting of mortgage loans in accordance with
Credit Management Guidelines and Rules. This team prepares and submits reports to the Head of the Division and
the Service Engineering & Analysis unit and collaborates with the Credit Policy and Monitoring unit in the prepa-
ration of Mortgage Lending Policy and Rules.
The Watchlist team deals with customers in difficulty ensuring that suitable solutions are found and implemented
in a timely manner in accordance with policies and rules. The watchlist team is informed of any amounts in arrear
collected by foreign lenders that are part of the Group.
The Credit Operations team manages the relationships with customers and the Sales Network providing all-round
assistance across the credit application process for all types of lending. The team has also approval authority for
low-risk, limited-amount credit applications.
The Credit Policy and Monitoring team sees to the preparation of credit management policies and strategies pro-
posals, defining the methodological principles and the technical rules for credit risk management and developing
models for estimating and measuring credit risk in close coordination with the Compliance & Risk Control function.
The team also prepares periodic reports on credit monitoring results highlighting key developments and trends.
133
NOTES TO THE CONSOLIDATEDANNUAL FINANCIAL STATEMENTS
Credit risk management – Organisational Aspects
The risk management framework includes policies that set out general principles and instructions on lending as well
as on monitoring the quality of the loan portfolio. The Parent Company of the Banking Group is responsible for
assessing overall exposure to credit risk and defining credit risk measurement policies for the whole Group.
Credit risk exposure is also assessed at the level of individual companies in their respective areas of responsibility,
by measuring and monitoring the risk associated with the various categories of financial instruments. Capital ade-
quacy and, in particular, compliance with solvency ratios and exposure limits for credit risk as set by local supervi-
sory authorities are periodically monitored by the competent offices of the respective companies.
Credit risk measurement, management and control
Credit quality is monitored by regularly assessing, in each stage of the lending process, whether there is evidence of
risk in accordance with entity-specific operating procedures.
In the lending process it is fundamental to have a comprehensive understanding of the financial condition of the
borrower and the type of financing which best meets his needs, the loan purpose, the borrower creditworthiness and
earnings capacity. To that end, each entity within the Group, as part of its loan application analysis, gathers all infor-
mation needed to assess the consistency of the borrower’s income and exposure (including existing commitments)
with the type and purpose of the loan or other financing. In that examination, the entity uses performance and finan-
cial analysis tools as well as intelligence obtained from private and public Credit Bureaus. Special attention is paid
to the assessment of any security taken.
All loans are subject to regular review by the competent units within each Group entity. Outstanding loans are con-
tinuously monitored focusing especially on riskier positions. Regular reports on credit protection actions taken are
submitted to the Board of Directors of the respective companies.
Credit risk mitigation techniques
Loans extended by the Banking Group entities are secured by collaterals received from borrowers. Collaterals pri-
marily consists of mortgages over property and pledges over financial instruments, plus conditional sales, and other
forms of security, e.g. surety bonds and endorsements. Although secondary to the assessment of the borrower’s cred-
itworthiness, in the assessment of credit risk great emphasis is placed on the appraised value of the collateral
received from the obligor and the prudential adjustments applied are properly differentiated according to the type
of collateral whose value is subject to regular review against its market value.
The Banking Group does not offset credit risk exposures against positive balances of on or off-balance sheet items.
Credit risk mitigation (CRM) techniques consist of loan-related contracts or other instruments and techniques that
reduce credit risk whose risk mitigating effect is recognised in the calculation of regulatory capital, as well as, for
risk management purposes, in the internal policies of the Mediolanum Banking Group. Credit risk is inherent in the
Business Operations Management division’s lending business and in Financial Management division’s liquidity man-
agement.
Eligible CRM techniques fall into two broad categories:
1. real guarantees;
2. personal guarantees.

134
CONSOLIDATED ANNUALFINANCIAL STATEMENTS
2012
Real guarantees are:
1. financial collateral, i.e. cash, certain financial instruments, gold – pledged or transferred-, repurchase/reverse
repurchase and securities lending/borrowing transactions;
2. master netting agreements;
3. on balance sheet netting;
4. mortgages and real estate leases.
Personal guarantees include personal guarantees and credit derivatives.
Currently, within the Mediolanum Banking Group, the use of credit derivatives is allowed only for trading purposes
and not for banking book credit risk mitigation.
Eligible CRM techniques are mortgages and pledges or other equivalent security interests in assets with a reason-
able degree of liquidity and a reasonably stable market value.
Conversely, although taken into account when deciding whether or not to extend a loan, ‘irrevocable orders to sell
other Group financial products’ are not eligible for CRM purposes.
As to pledges, the financial asset that is directly or indirectly pledged as security must be one of the following:
• bank account balances held with our bank;
• treasuries or securities guaranteed by governments, and securities that are accepted as guarantee by central
banks;
• holdings in mutual funds and open-end investment companies;
• liens on insurance policies issued by the Mediolanum Banking Group;
• assets in discretionary accounts managed by our Bank;
• bonds and certificates of deposit issued by our Bank or other Banks;
• repo transactions relating to listed bonds, treasuries or accepted as guarantee by central banks, with retail cus-
tomers;
• listed bonds;
• listed equities.
When the borrower’s equity does not cover entirely the loaned amount, the loan is recognised at full risk.
Credit risk on mortgage loans is mitigated by the property given as collateral. Properties given as loan collateral
must be located in Italy and be residential properties.
Semi-residential properties are accepted provided that they satisfy the following requirements:
• the non-residential portion does not exceed 40% of the estimated property value;
• the property is located in a residential area;
• the borrower is self-employed and intends to use the property as his/her primary residence.
In all these instances Loan-to-Value shall not exceed 70%.
The bank applies a disciplined approach to lending and adequate checks e.g. it checks the accurateness and com-
pleteness of the property appraisal as this is crucial to get a true view of risk. The bank requires than any request
for mortgage loan approval be accompanied by a valid property appraisal setting out a true estimate of the value
of the property for which the loan is sought and certifying to the highest possible degree that a valid building per-
mit and any other authorisations for the property have been obtained. If not so, the loan will not be extended or the
loan amount reduced to be commensurate with the true property value (which depends on its location, on how eas-
ily it can be resold, etc.).

135
NOTES TO THE CONSOLIDATEDANNUAL FINANCIAL STATEMENTS
The appraisal is made by independent professionally qualified valuers who have entered into an agreement with
Banca Mediolanum.
The relevant technical unit within the Lending Division is responsible for ensuring that internal procedures for the
preparation of property appraisals are thoroughly and properly applied.
Assessment of the quality of the loan portfolio
The Mediolanum Banking Group assesses the quality of the loan portfolio applying the following two-step approach
in view of identifying any possible impairment:
• Identification of assets to be individually or collectively tested for impairment;
• Measurement and recognition of the impairment loss in accordance with the specific impairment rules.
The first step is preliminary to the impairment test that assesses and measures the impairment loss, if any.
Banca Mediolanum tests for impairment loans and endorsements with fixed or determinable payments extended to
retail/corporate and institutional clients. Loans and endorsements to retail/corporate clients typically consist of
arranged overdraft facilities, loans and credit lines repayable in instalments, while those extended to institutional
clients (banks and other financial institutions) are made up of deposits, repurchase agreements (amount paid for
the purchase of the asset under an agreement to resell it at a future date) and hot money facilities.
To identify loans and endorsements to be individually/collectively tested for impairment it is necessary to analyse
the significance of the exposure and check whether there is objective evidence of any losses.
Banca Mediolanum individually tests for impairment all exposures classified as nonperforming, watch list and over
90 days past due loans (pursuant to Bank of Italy’s instructions) irrespective of their significance. In fact, these are
exposures for which there is objective evidence of impairment as per §64 of IAS 39. Other exposures, i.e. perform-
ing loans, are collectively tested for impairment. Only for monitoring purposes a €1,000,000 threshold is set for
the determination of the significance of the individual exposure. Any exposure in excess of said threshold is exam-
ined separately and individually.
For exposures that are individually assessed for impairment the recoverable amount of the individual exposure is
determined on the basis of:
• estimated recoverable cash flows;
• timing of recoveries;
• the interest rate used to discount future cash flows.
Banca Mediolanum treats nonperforming, watch list, restructured and over 90 days past due exposures in accor-
dance with the different level of risk of the respective category, taking account of the type and value of any securi-
ty taken and other key indicators of potential risk based on management expertise and conservative estimates.
Exposures that are not individually assessed are grouped on the basis of similar risk characteristics and collective-
ly assessed for impairment.
The collective impairment loss is obtained by adding up the losses of each group. The collective impairment amount
is compared with the previous carrying amount of loans to determine the amount of provisions to set aside or use.
The process for the identification of the groups of loans to be collectively assessed under IAS is in line with the cred-
it risk approach under Bank of Italy’s Circular 263 of December 27, 2006. Specifically, the risk parameters under
said regulation, i.e. probability of default (PD) by rating class and Loss Given Default (LGD) are significant param-
eters for the classification of loans into groups with similar credit risk characteristics and for the calculation of pro-
visions.
136
CONSOLIDATED ANNUALFINANCIAL STATEMENTS
2012
At present, the grouping of loans for the purpose of collective assessment is by rating and client segment
(Retail/Corporate).
The calculation of the impairment loss is made applying a Basel-oriented approach, i.e. impairment is approximated
to the concept of Expected Loss (EL) as set out in the relevant regulations. Expected Loss is the average loss the
Bank expects to incur on an exposure as a result of the deterioration of credit quality or default of the borrower.
Banca Mediolanum’s loan loss provision for collectively assessed exposures is therefore determined by calculating
the Expected Loss (EL) on all exposures in a given rating class, applying the following formula:
where:
• Balance exposure : is the book value for short-term financing and amortised cost for loans repayable in instalments;
• PDclass:is the probability of default over 1 year for performing loans in a given rating class;
• LGD: is the failed recoveries rate to be applied to performing loans;
The loan loss provision for collectively assessed exposures is thus obtained by adding up expected losses on each
exposure:
Impaired financial assets
Each Group entity, within its sphere of independence, has its own effective tools for prompt detection of any prob-
lem loans.
The rules set forth by the Basel Committee introduced significant changes in the general definitions of problem loans
and the discretionary guidance of national supervisory authorities. The most significant change relates to the defi-
nition of default.
A default is considered to have occurred with regard to a particular obligor when either or both of the two follow-
ing events have taken place:
• the bank considers that the obligor is unlikely to pay its credit obligations in full, without recourse by the bank
to actions such as realising security (if held);
• the obligor is past due more than 90 days on any material credit obligation to the bank.
In accordance with the discretionary guidance of national supervisory authorities, each entity within the Group clas-
sifies troubled positions according to their level of risk.
Each entity has dedicated problem loan management units that apply operating procedures and take action accord-
ing to the severity of the problem.
EL classexposure = Balance exposure × PD class × LGD
Total provision = ΣELexposure, class

137
NOTES TO THE CONSOLIDATEDANNUAL FINANCIAL STATEMENTS
A.1.1 Analysis of credit exposures by category and credit quality (book value)
€/’000 Non performing Watch list Restructured Past Due Other Assets Total
1. Financial assets held for trading - - - - 587,308 587,308
2. Available-for sale financial assets - - - - 9,041,941 9,041,941
3. Held-to-maturity investments - - - - 1,025,038 1,025,038
4. Loans to banks - - - - 1,082,992 1,082,992
5. Loans to customers 9,033 21,473 7,842 5,876 5,088,817 5,133,041
6. Financial assets at fair value - - - - - -
7. Financial assets being disposed of - - - - - -
8. Hedging derivatives - - - - 1,366 1,366
Total at Dec. 31, 2012 9,033 21,473 7,842 5,876 16,827,462 16,871,686
Total at Dec. 31, 2011 8,424 53,240 226 6,344 13,880,878 13,949,112
To determine ‘default’ Banca Mediolanum refers to the definition of ‘impaired loans’ used for the purpose of finan-
cial reporting. Impaired loans include:
• nonperforming loans;
• watch list loans;
• restructured loans;
• over 90 days past due loans.
Nonperforming loans consist of on and off-balance sheet exposures (e.g. loans, securities, derivatives) to borrowers that
are unable to meet their payment obligations – even if their insolvency has not been established by a court of law – or
in equivalent conditions, regardless of any losses estimated by the lender and irrespective of any security taken.
Watch list loans consist of on and off-balance sheet exposures (e.g. loans, securities, derivatives) to borrowers that
are experiencing objective temporary difficulties in meeting their payment obligations, but are expected to make
good within a reasonable timeframe. These exposures are recognised irrespective of any security taken.
Restructured loans consist of on and off-balance sheet exposures (e.g. loans, securities, derivatives) for which a
bank (or a syndicate of banks) agrees to change the original loan terms and conditions (e.g. rescheduling payments,
reducing debt and/or interest) due to the deterioration of the financial condition of the borrower, with ensuing loss-
es. This category does not include exposures to companies that are going out of business (e.g. voluntary wind-up or
similar conditions) as well as country-risk exposures.
An additional impaired loan category was introduced by the Bank of Italy (Circular 262 of December 22, 2005
‘The Financial Statements of Banks: Instructions for the preparation of financial statements’), i.e. over 90 days past
due loans. These consist of on and off-balance sheet exposures (e.g. loans, securities, derivatives) to borrowers other
than those classified in the categories above (nonperforming, watch list, restructured) that at the reporting date
were over 90 days past due or overdrawn.
For recognition in this category, both following conditions are to be satisfied:
• the borrower is past due more than 90 days in a row (to determine actual past due borrowers, overdrawn/unpaid
amounts can be offset against balances in credit under other loans/credit facilities extended to the same borrower);
• the mean value of daily past due/overdrawn amounts in the last quarter is 5% or more of total exposure.

138
CONSOLIDATED ANNUALFINANCIAL STATEMENTS
2012
When the borrower is a government entity that exceeded the limits above yet the overdrawn/past due amount does
not exceed €10,000, the relevant exposure is not classified as past due.
Counterparty risk
Counterparty risk is part of credit risk. Counterparty risk is the risk that a party to a derivative contract may fail
to perform on its contractual obligations and, when marked to market, the value of the derivative contract turns out
to be positive for Banca Mediolanum. Exposure to counterparty risk is measured applying the present value method
to OTC derivative contracts. The replacement cost of each contract is its fair value, if positive. Fair value is positive
if the bank is a net creditor of the counterparty. To protect against counterparty risk arising from said derivatives
contracts the Group entered into ISDA Master Agreements. In addition, Banca Mediolanum put in place ad-hoc
procedures and tools for the management of collaterals in relation to derivative transactions and used Credit
Support Annexes (CSA) as key instruments to mitigate related counterparty risk.
Concentration Risk
Concentration risk, as defined in regulations, is the exposure to individual counterparties, groups of individual or
related counterparties or counterparties in the same industry, business sector or geographical location.
Concentration risk thus falls within the wider category of credit risk.
As required by the Banking Supervisor (Bank of Italy) the banking group’s exposure to concentration risk in mon-
itored only for the ‘Business & Others’ Portfolio. The Group exposure in that portfolio is of limited size and rele-
vance. In addition, the Banking Group put in place a system for monitoring concentration risk on a weekly basis in
accordance with rules governing management of large exposures.
In accordance with regulations in force (Bank of Italy’s Circular 263/06, Title IV Chapter 1), for large exposures
the Mediolanum Banking Group has set the maximum limit for each exposure at 25% of consolidated regulatory
capital. Said limit is the only large exposures regulatory limit applicable to the Mediolanum Banking Group based
on volumes and characteristics.
Banca Mediolanum has defined operating licences and limits in accordance with the Institutional Counterparty
Credit Risk Policy. These operating licences and limits represent Banca Mediolanum’s risk tolerance based on the
Bank’s risk appetite. Operating licences and limits are closely monitored on an ongoing basis to ensure they are not
exceeded and are regularly reviewed, generally on an annual basis. Derogation from said limits is subject to dele-
gated authorities of the Chief Executive Officer and the Head of Finance.
Credit Risk Stress Testing
Credit risk exposures are essentially gauged using three key parameters: Exposure at Default (EAD), Probability of
Default (PD) and Loss Given Default (LGD).
As to exposure classes for which the credit risk capital charge is calculated, based on the qualitative and quantita-
tive considerations set out below, it was decided to focus attention exclusively on:
• exposures to regulated financial institutions;
• unsecured retail exposures;
• exposures secured by property.

139
NOTES TO THE CONSOLIDATEDANNUAL FINANCIAL STATEMENTS
The portfolios above (i.e. the portfolios to which stress testing can be applied) include assets in which the Bank
intends to continue to invest in the near future while keeping its exposure to other asset classes contained.
Stress testing is applied also to past due positions. So, for each asset class, and for each portfolio, all exposures,
both performing and impaired, at a given baseline date are considered and stressed to see how they would perform
under various crisis scenarios.
Although unsecured retail exposures and exposures to regulated financial institutions are small as a whole, it is con-
sidered important to stress test them to see the impact adverse macroeconomic conditions and extreme events would
have on ordinary banking operations and hence potential developments, under those circumstances, of the risk inher-
ent in those types of assets.
Market Risk
Interest Rate Risk and Pricing Risk – Trading Book
GeneralThe Banking Group’s trading book, as defined by supervisory authorities, consists of financial instruments subject
to capital requirements for market risk. According to this classification, at present only Banca Mediolanum has a
true trading book.
Specifically, the trading book consists of positions held by those Group functions authorised to take market risk
exposures within the limits and the authorities delegated to them by their respective Boards of Directors, in accor-
dance with the Banking Group’s Parent Company guidelines.
The trading book primarily consists of positions in bonds, equities, derivatives and money market instruments.
The reduced credit rating of underlying assets was exclusively due to domestic sovereign debt exposure and Italy’s
credit rating downgrade in 2012. Given the predominance of domestic treasuries, however, the risk of default for
the Mediolanum Banking Group’s securities portfolio is relatively low.
Rating analysis for the entire Mediolanum Banking Group’s securities portfolio, including both the trading book and
the banking book, is set out below.
Banking Group’s Securities Portfolio – RATING COMPOSITION (S&P equivalent)(YE 2012 vs. YE 2011)
Rating(S&P Equivalent)
2012 2011
Change (%)€/000 % €/000 %
Total Portfolio 11,424,991 100% 9,203,386 100% 24%
AAA (99,506) (0.9%) (40,447) (0.4%) (55%)
AA+ to AA- 234,416 2.1% 662,318 7.2% (65%)
A+ to A- 2,993,127 26.2% 6,719,071 73.0% (55%)
BBB+ to BBB- 8,285,635 72.5% 1,524,757 16.6% 443%
BB+ or lower - 0.0% 25,982 0.3% (100%)
Unrated 11,320 0.1% 311,705 3.4% (96%)
NOTE: the value of the securities portfolio does not include residual Index Linked Policies Funds, Shares and Rights.

140
CONSOLIDATED ANNUALFINANCIAL STATEMENTS
2012
Unrated0.1%
AAAAA+ to AA-A+ to A-BBB+ to BBB-BB+ or lowerUnrated
BB+ or lower0.0%
BBB+ to BBB-72.5%
A+ to A-26.2%
AA+ to AA-2.1%
AAA-0.9%
-5.0%
5.0%
15.0%
25.0%
35.0%
45.0%
55.0%
65.0%
75.0%
Banking Group’s Portfolio – RATING COMPOSITION
€/’000 2012 2011 Change (%)
Nominal value 349,744 403,289 (13%)
Market value 333,081 340,911 (2%)
Duration 0.92 0.91 1%
VaR 99% - 1 day 260 412 (37%)
Interest Rate Risk and Pricing Risk - Measurement and Management
The Parent Company’s Compliance & Risk Control function is responsible for ensuring that the various entities use
consistent methods in assessing financial risk exposure. It also contributes to the definition of lending and operat-
ing limits. However, each entity within the Group is directly responsible for the control of the risks assumed. Risks
are to be in accordance with the policies approved by the respective Board of Directors and consistent with the com-
plexity of managed assets.
Exposure to interest rate risk is measured by applying portfolio analyses (e.g. exposure limits, characteristics of the
instruments and of the issuers) as well as by estimating the risk of maximum loss on the portfolio (Value at risk).
VaR TablesHFT Portfolio - MARKET RISK(YE 2012 vs. YE 2011)
Interest rate and pricing risks – Banking book
The Group’s Banking Book is made up of those financial instruments that are not part of the trading book, in par-
ticular inter-bank loans, available-for-sale financial assets and held-to-maturity investments.
Banking book interest rate risk exposures are measured and managed by the Banking Group’s Parent Company
using an ALM model. Risk management activities include, inter alia, controls for credit risk inherent in transactions
with institutional counterparties according to the operating procedures and limits approved by the Board of

141
NOTES TO THE CONSOLIDATEDANNUAL FINANCIAL STATEMENTS
Directors of each entity within the Group in compliance with the guidelines issued by the Banking Group’s Parent
Company.
Interest rate risk is the risk of potential impact of unexpected interest rate changes on the Bank’s current earnings
and equity. This risk is typical of banking book positions.
The Banking Book consists of on and off-balance sheet items that are not held for trading.
The goals pursued by the interest rate risk management system are to:
• ensure the stability of net interest income, minimising any adverse impact of changes in interest rates (earnings
perspective), largely with near-term focus. The stability of net interest income is mainly influenced by re-pricing
risk, yield curve risk, basis risk, re-fixing risk and optionality risk;
• protect the economic value, i.e. the present value of expected cash flows from assets and liabilities. The econom-
ic value perspective is focused on the potential medium/long-term effects of changes in interest rates and is main-
ly associated with re-pricing risk;
• ensure that interest rate risk that has been taken or can be taken be properly identified, measured, monitored
and managed in accordance with uniform methods and procedures shared across the Group;
• make sure that risk measurement models are commensurate with actual earnings generated by the various risk
owners;
• ensure that the quality of risk measurement and management systems is aligned with market standards and best
practices;
• define risk limits and licences for the various levels of responsibility;
• ensure the generation of accurate data and reports by the various officers responsible for risk management and
control at the different levels within the organisation;
• ensure compliance with requirements established by domestic and international supervisory authorities.
The definition of limits and licences reflects the risk appetite of the organisation and permits to control that prac-
tices at the various levels within the organisation are aligned with the strategic guidelines and policies adopted by
the Board of Directors.
The application of the principles above led to the definition of the following indicators:
• net interest income sensitivity to parallel shifts in the yield curve;
• economic value sensitivity to parallel shifts in the yield curve.
Management of the interest rate risk in the banking book is part of Asset Liability Management (ALM). The
Mediolanum Banking Group has in place an ALM system that measures performance of annual Net Interest Income
and the Bank’s Economic Value in relation to regulatory capital. The ALM system is also used by management to
assess the impact of funding and lending policies on the entity’s financial condition and earnings.
Asset Liability Management
ALM PRO is the system used for managing Banking Book’s Assets and Liabilities against the risk of adverse move-
ments in interest rates. As such, ALM PRO assists management in assessing Banca Mediolanum’s funding and lend-
ing policies and their possible impact on the bank’s financial condition and earnings. Banca Mediolanum regularly
updates the dedicated ALM PRO policy including limits and procedures for monitoring annual Net Interest Income
and the Economic Value of the Bank.

142
CONSOLIDATED ANNUALFINANCIAL STATEMENTS
2012
Movements in annual net interest income Data as of Dec. 31, 2012
€/’000 Balance +100bps -100bps
Total assets 14,920,080 89,077 (79,356)
Total liabilities (15,207,465) (92,677) 47,239
Off-balance sheet positions (hedging derivatives) - 3,707 (585)
YEAR’S MOVEMENT - 106 (32,703)
Hedge Accounting
The introduction of IAS 39 brought about profound changes in the way derivatives and related hedged statement
of financial position assets/liabilities are accounted for.
Under IAS 39 all derivatives, either trading or hedging derivatives, are to be recognised in the statement of finan-
cial position at their fair value and any change, either increase or decrease, in their fair value is to be recognised
through profit or loss.
When the hedged item is measured at historical (amortised) cost the asymmetry resulting from the different meas-
urement method may lead to income statement information volatility. IAS 39 addresses this issue allowing entities
to apply consistent measurement methods to the hedging instrument and to the hedge item (Hedge Accounting).
To qualify for Hedge Accounting under IAS 39 the hedging relationship must satisfy certain conditions relating to
hedge effectiveness and related documentation.
The use of hedge accounting engages various structures of Banca Mediolanum.
The Treasury Committee provides guidance on hedging policies. Banca Mediolanum Treasury function handles all
aspects relating to the identification and operation of IAS compliant hedges. The Compliance & Risk Control func-
tion works across the process ensuring the alignment of systems and proper management of hedges. The Accounting
and Financial Reporting function records and monitors hedges on an ongoing basis and prepares Hedge Accounting
documentation.
As shown in the table below, back-testing of hedge effectiveness proved the hedge ratio met the requirement |0.8|
≤ HR ≤ |1.25|.
Hedge Ratio(YE 2012 vs. YE 2011)
2012 2011 Change (%)
Hedge ratio 111% 109% 3%
Liquidity risk
The Mediolanum Banking Group’s liquidity management model is structured in a manner that ensures adequate lev-
els of liquidity in the short term as well as in the medium and long term. Given the types of assets held, their dura-
tion as well as the type of funding, the Banking Group has no short-term liquidity concerns. From a structural view-
point, Banca Mediolanum can rely on stable ‘core funding’ and is only marginally exposed to volatility. This is evi-
denced also by Bank’s econometric projections of ‘on demand positions’. In addition to its sound core funding rep-
resented by bank deposits, Banca Mediolanum has been focusing on bond issues for medium-term funding.

143
NOTES TO THE CONSOLIDATEDANNUAL FINANCIAL STATEMENTS
The liquidity risk management framework is approved by the Board of Directors of the Banking Group’s Parent
Company and implemented across the Group (where applicable). Liquidity risk is monitored by the Risk Control unit
applying dedicated policies and procedures, including operating and structural limits, a maturity ladder as well as a
contingency funding plan under the broader Asset Liability Management model of the Banking Group.
In compliance with Basel II Second Pillar requirements, and in view of the implementation of Basel III, all inter-
nal procedures for liquidity risk management have been reviewed. Under the liquidity risk management policy Banca
Mediolanum implemented a control procedure which entails the generation of daily reports for monitoring opera-
tional liquidity limits in treasury management and quarterly reports for monitoring the bank’s structural liquidity
in the aggregate. The method used to manage operational liquidity is derived from the Maturity Mismatch Approach
and is based on the monitoring of cumulative gaps generated by Net Flows and Counterbalancing Capacity as
assessed using an operational Maturity Ladder. Structural liquidity is monitored by determining the long term ratio
(Net Stable, Funding, Ratio) in accordance with the rules defined by the European Banking Authority (EBA) in
relation to the new Basel III liquidity risk requirements. In 2012, Banca Mediolanum continued its quarterly mon-
itoring as promoted by the EBA for compliance with Basel III liquidity risk management and capital requirements.
Liquidity Risk Stress Testing
In addition to monitoring liquidity on a daily basis, the Mediolanum Banking Group also conducts stress scenario
simulations.
Stress scenarios are run for both systemic events (Market Stress Scenarios) and bank specific events (Bank Specific
Stress Scenarios) in relation to the macroeconomic environment, commercial policies and customer behaviour.
Generally, the systemic events tested in stress scenario simulations may include:
• a financial market shock that brings about a significant change in interest rates and exchange rates;
• a crisis in a geographical area or market (e.g. emerging markets or Eurozone Mediterranean markets), identi-
fied by a fall in major stock market indices or a possible sovereign debt downgrade;
• a systemic shock like the one after 9/11 which significantly restricts access to money markets;
• scarce liquidity in the interbank market.
Bank specific events may include:
• significant withdrawals of deposits by customers;
• reputational damage with subsequent difficulty to renew financing sources in the money market;
• default of a major market counterparty or source of funding;
• deterioration in loan quality;
• steep increase in draw-downs on committed credit lines;
• significant decline in the ability to roll over short-term funding;
• bigger haircuts on assets included in Counter Balancing Capacity (CBC).
Simulations are run under the different stress scenarios to evaluate the effects on the expected behaviour of inflows
and outflows over a given time horizon, both in terms of estimated cash-flows and timing. The Maturity Ladder is
redefined for each scenario simulation.
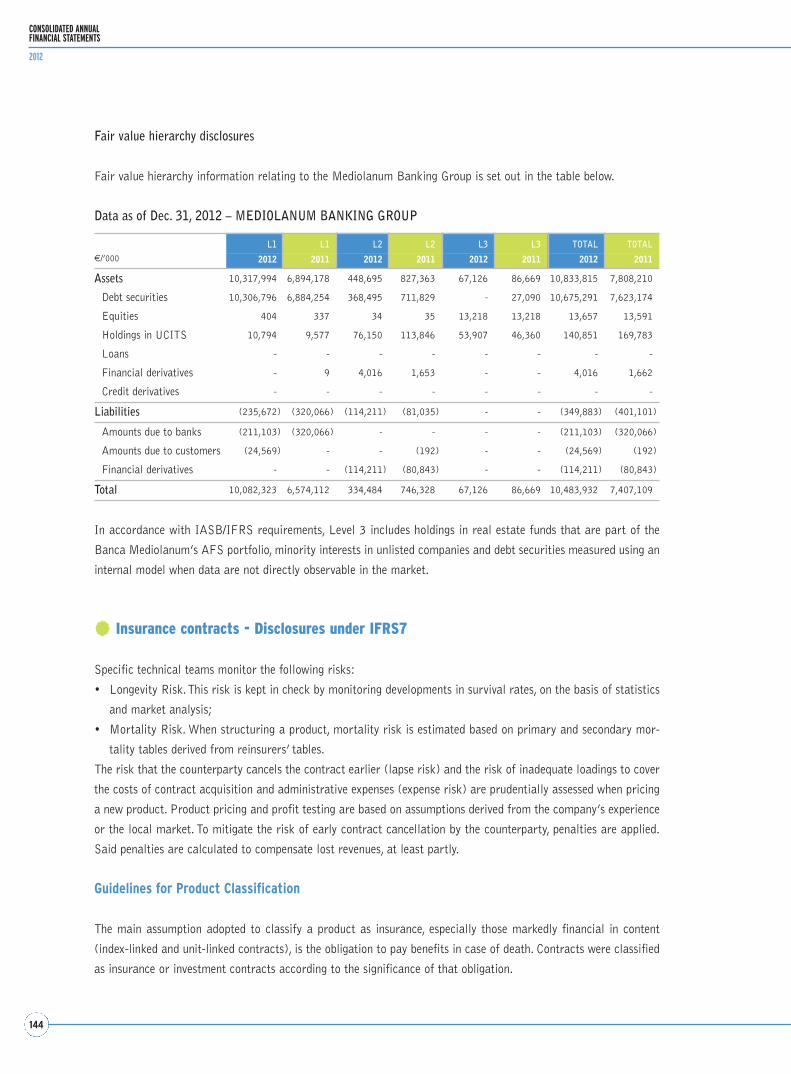
144
CONSOLIDATED ANNUALFINANCIAL STATEMENTS
2012
Fair value hierarchy disclosures
Fair value hierarchy information relating to the Mediolanum Banking Group is set out in the table below.
Data as of Dec. 31, 2012 – MEDIOLANUM BANKING GROUP
In accordance with IASB/IFRS requirements, Level 3 includes holdings in real estate funds that are part of the
Banca Mediolanum’s AFS portfolio, minority interests in unlisted companies and debt securities measured using an
internal model when data are not directly observable in the market.
Insurance contracts - Disclosures under IFRS7
Specific technical teams monitor the following risks:
• Longevity Risk. This risk is kept in check by monitoring developments in survival rates, on the basis of statistics
and market analysis;
• Mortality Risk. When structuring a product, mortality risk is estimated based on primary and secondary mor-
tality tables derived from reinsurers’ tables.
The risk that the counterparty cancels the contract earlier (lapse risk) and the risk of inadequate loadings to cover
the costs of contract acquisition and administrative expenses (expense risk) are prudentially assessed when pricing
a new product. Product pricing and profit testing are based on assumptions derived from the company’s experience
or the local market. To mitigate the risk of early contract cancellation by the counterparty, penalties are applied.
Said penalties are calculated to compensate lost revenues, at least partly.
Guidelines for Product Classification
The main assumption adopted to classify a product as insurance, especially those markedly financial in content
(index-linked and unit-linked contracts), is the obligation to pay benefits in case of death. Contracts were classified
as insurance or investment contracts according to the significance of that obligation.
€/’000
L1 L1 L2 L2 L3 L3 TOTAL TOTAL
2012 2011 2012 2011 2012 2011 2012 2011
Assets 10,317,994 6,894,178 448,695 827,363 67,126 86,669 10,833,815 7,808,210
Debt securities 10,306,796 6,884,254 368,495 711,829 - 27,090 10,675,291 7,623,174
Equities 404 337 34 35 13,218 13,218 13,657 13,591
Holdings in UCITS 10,794 9,577 76,150 113,846 53,907 46,360 140,851 169,783
Loans - - - - - - - -
Financial derivatives - 9 4,016 1,653 - - 4,016 1,662
Credit derivatives - - - - - - - -
Liabilities (235,672) (320,066) (114,211) (81,035) - - (349,883) (401,101)
Amounts due to banks (211,103) (320,066) - - - - (211,103) (320,066)
Amounts due to customers (24,569) - - (192) - - (24,569) (192)
Financial derivatives - - (114,211) (80,843) - - (114,211) (80,843)
Total 10,082,323 6,574,112 334,484 746,328 67,126 86,669 10,483,932 7,407,109

145
NOTES TO THE CONSOLIDATEDANNUAL FINANCIAL STATEMENTS
For the purpose of said classification the most important assumption is the “significance threshold”, i.e. the differ-
ence between the benefit payable in case of death and the contract mathematical reserve (i.e. the value of the under-
lying financial asset for class III products).
For traditional products another key element was considered, i.e. the payment of life annuity and the presence of
features which can be classified as “Discretionary Participation Features”.
Measurement assumptions
In accordance with the principle of prudence, the mortality tables and technical rates used to calculate and meas-
ure technical reserves (for class I contracts) were the same used to price premiums (Legislative Decree 174, art.
25 paragraph 11).
Mortality table technical rates
Type of product Technical rates applied in the calculation of premiums Technical rates applied in the calculation of reserves
Pure Endowment S.I.M. 1971: 3% 4% S.I.M. 1971: 3% 4%
Whole life S.I.M. 1981: 3% 4% S.I.M. 1981: 3% 4%
Mixed S.I.M. 1961 / 1981: 2% 3% 4% S.I.M. 1961 / 1981: 2% 3% 4%
Annuities S.I.M. 1931 / 1951 / 1971 S.I.M. 1931 / 1951 / 1971
S.I.M. p.s. 1971: 2% 3% 4% S.I.M. p.s. 1971
RG48: 0% IPS55 0% 2% RG48: 2% 3% 4%
IPS55U 0% IPS55: 2% 3% 4% 0% / IPS55U 0%
Term S.I.M. 1961 / 1981 / 1992 / 2002: 4% S.I.M. 1961 / 1981 / 1992 / 2002: 4%
S.I.U. 2002: 4% S.I.U. 2002: 4%
Group S.I.M. 1971 S.I.M. 1971
S.I.M. 1971 p.s. S.I.M. 1971 p.s.
RG48: 3% 4% RG48: 3% 4% IPS55 2%
Index Linked SIM02
Unit Linked SIM92
Significant clauses
Certain class I contracts, specifically deferred life annuity contracts, guarantee the payment of minimum income
benefits, calculated on the basis of the survival assumptions adopted by the Company when the contract is made.
In relation to those contracts the Company constantly monitors survival trends and raises a specific reserve to cover
the risk that technical reserves may be inadequate to cover the payment of those benefits.
Insurance Risk
Since for Class III contracts the investment risk is borne by the policyholder, insurance risk is represented only by the
risk of death of the policyholder. That risk is covered via treaty reinsurance arrangements (excess per risk treaties)
which limit the Company’s overall exposure per head insured. No such reinsurance protection is purchased for class
III products since the Company judges it can cover the risk of death of the policyholder using its own equity.
146
CONSOLIDATED ANNUALFINANCIAL STATEMENTS
2012
Liability adequacy testing (lat)
The company assessed the adequacy of technical reserves for Medinvest segregated funds, using a current estimate
of future cash-flows from insurance contracts, net of deferred acquisition costs and intangible assets. Contracts were
grouped on the basis of similar technical rate and future cash-flows were discounted at four percent. That exercise
showed that the carrying amount of technical reserves is adequate.
No express quantitative testing was performed for class III contracts since liabilities coincide with underlying assets and
other technical reserves are broadly covered by annual management fees and loadings (for coverage in case of death of
the policyholder) or are calculated using a prudent estimate of actual operating costs (reserve for future expenses).
The Group insurance companies are engaged in the implementation of the Solvency II framework.
In 2012, Mediolanum Vita continued in-depth analysis, knowledge building and implementation of specific actions
in relation to the measurement of future solvency capital requirements.
Disclosures pursuant to IFRS4
Life insurance
Insurance liabilities
The Group’s insurance companies consider the impact on future profitability of all sources of income and expense, espe-
cially those related to possible early termination of existing contracts. When pricing certain products penalties are
included for early termination of contracts. These penalties are calculated to compensate, at least partly, lost revenues.
Additionally, under the vast majority of contracts in force, financial guarantees are not paid in the event of early
termination of the contract, which is thus discouraged, and potential costs for the Company are reduced.
The assumptions used for both product pricing and risk assessment are regularly reviewed and updated based on
actual experience of early termination of contracts.
An analysis of life insurance reserves by contract maturity is set out in the table below.
€/’000 Insurance Investment Total
within one year 962,110 16,000 978,109
1 to 2 years 583,506 6,044 589,551
2 to 3 years 706,093 2,443 708,536
3 to 4 years 638,843 2,537 641,380
over 5 years 12,135,744 - 12,135,744
whole life 2,531,560 62,676 2,594,237
17,557,856 89,700 17,647,556

147
NOTES TO THE CONSOLIDATEDANNUAL FINANCIAL STATEMENTS
The total includes mathematical reserves and technical reserves for contracts under which the risk is borne by the
policyholder amounting to €861,733,257 and €12,978,600,411, respectively, the reserve for other technical items
amounting to €301,426,600, and investment contracts financial liabilities amounting to €89,041,635.
1. Life Insurance Business – Insurance Risk
The Life Insurance Books of Group’s companies largely consist of contracts with a predominantly savings compo-
nent and a marginal ‘pure risk’ component (death plus other coverage e.g. disability, injury…). There are also some
annuity books that are exposed to longevity risk.
The risks associated with products with a predominantly savings component, and with guarantees of minimum
return, are considered when pricing the products setting guarantees in a prudent way, in line with the specific fea-
tures of each financial market and considering regulatory constraints, if any.
As to the demographic risk associated with death benefit policies, prudent technical rates based on population mor-
tality tables plus adequate loadings are applied when pricing products.
To further mitigate mortality risk the Company reinsures principal in excess of €100,000.
As to longevity risk, the Company regularly reviews the adequacy of technical rates for the annuities it pays out.
For contracts featuring an initial accumulation plan with option to convert capital into annuities in the future gen-
erally no guarantee is given of conversion rates for future annuities.
The propensity of policyholders to opt for annuities is also monitored so that adjustments can be promptly made to
demographic assumptions and rates.
Regarding the impact of this variable on earnings, the company calculated that a 1% change in said variable would
bring about a similar movement of €1.5 million in the group’s net profit for 2012.
Lapse risk and expense risk are prudentially assessed and incorporated into the pricing of new products. Product
pricing and profit testing are based on assumptions derived from the company’s actual experience.
To mitigate risks associated with surrenders in general, penalties are applied. These penalties are calculated to com-
pensate lost revenues. Portfolio reviews on annual planning include analyses that check consistency of assumptions
made with actual experiences.
An analysis of life insurance gross premiums by product class and geographic area is set out in the table below.
€/’000Unit Linked
policiesIndex Linked
policiesTradizional
policiesGroup
policies Pension funds Total
Spain 35,681 64,037 - - - 99,718
Germany 12,602 16,187 - - - 28,789
Italy 1,179,442 - 6,743,281 5,750 - 7,928,473
1,227,725 80,224 6,743,281 5,750 - 8,056,980
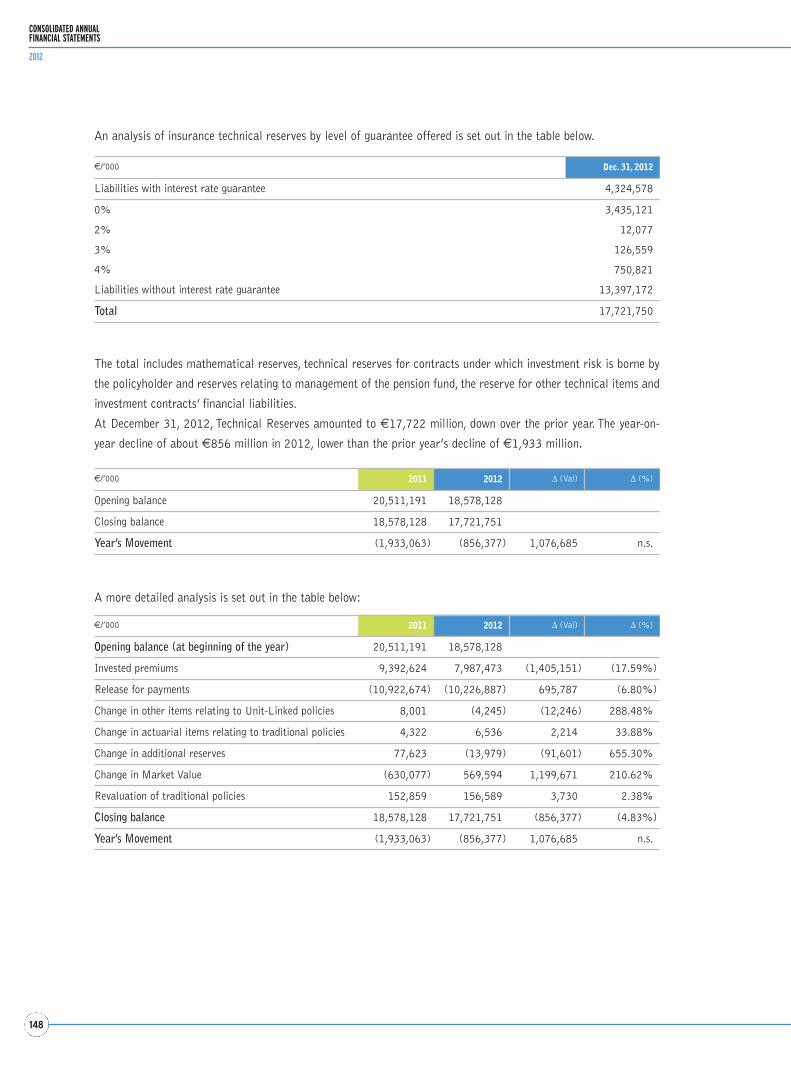
148
CONSOLIDATED ANNUALFINANCIAL STATEMENTS
2012
An analysis of insurance technical reserves by level of guarantee offered is set out in the table below.
The total includes mathematical reserves, technical reserves for contracts under which investment risk is borne by
the policyholder and reserves relating to management of the pension fund, the reserve for other technical items and
investment contracts’ financial liabilities.
At December 31, 2012, Technical Reserves amounted to €17,722 million, down over the prior year. The year-on-
year decline of about €856 million in 2012, lower than the prior year’s decline of €1,933 million.
€/’000 Dec. 31, 2012
Liabilities with interest rate guarantee 4,324,578
0% 3,435,121
2% 12,077
3% 126,559
4% 750,821
Liabilities without interest rate guarantee 13,397,172
Total 17,721,750
A more detailed analysis is set out in the table below:
€/’000 2011 2012 Δ (Val) Δ (%)
Opening balance 20,511,191 18,578,128
Closing balance 18,578,128 17,721,751
Year’s Movement (1,933,063) (856,377) 1,076,685 n.s.
€/’000 2011 2012 Δ (Val) Δ (%)
Opening balance (at beginning of the year) 20,511,191 18,578,128
Invested premiums 9,392,624 7,987,473 (1,405,151) (17.59%)
Release for payments (10,922,674) (10,226,887) 695,787 (6.80%)
Change in other items relating to Unit-Linked policies 8,001 (4,245) (12,246) 288.48%
Change in actuarial items relating to traditional policies 4,322 6,536 2,214 33.88%
Change in additional reserves 77,623 (13,979) (91,601) 655.30%
Change in Market Value (630,077) 569,594 1,199,671 210.62%
Revaluation of traditional policies 152,859 156,589 3,730 2.38%
Closing balance 18,578,128 17,721,751 (856,377) (4.83%)
Year’s Movement (1,933,063) (856,377) 1,076,685 n.s.
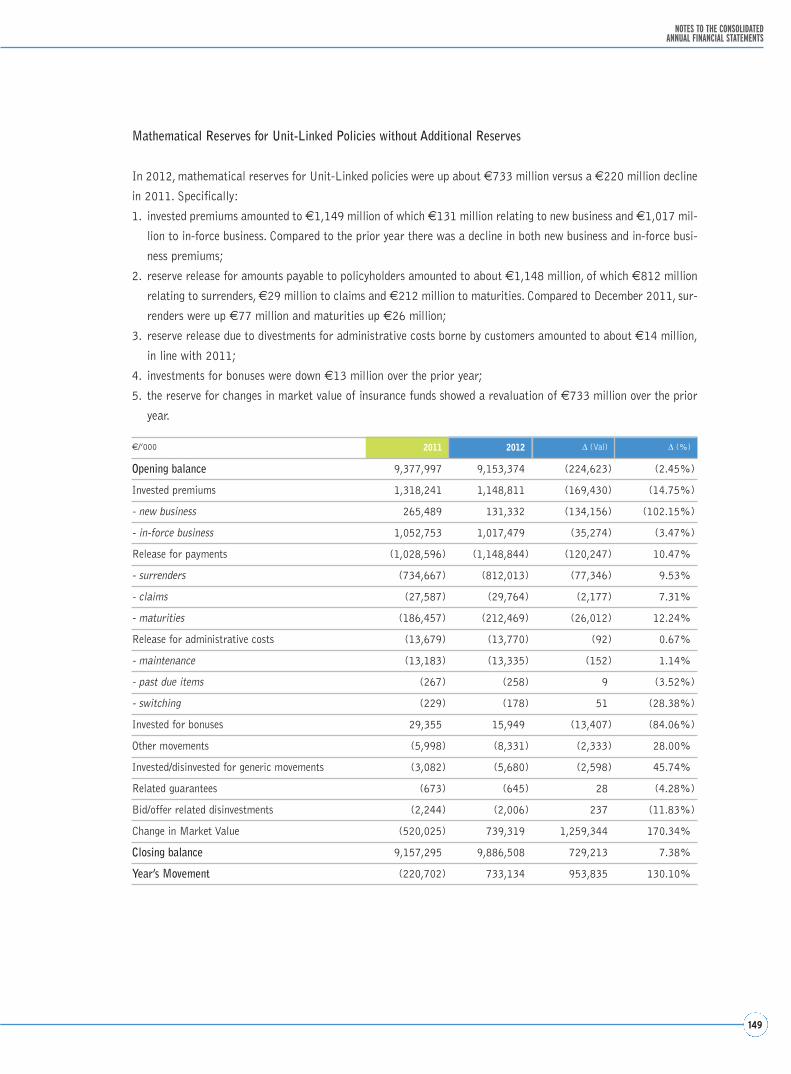
149
NOTES TO THE CONSOLIDATEDANNUAL FINANCIAL STATEMENTS
Mathematical Reserves for Unit-Linked Policies without Additional Reserves
In 2012, mathematical reserves for Unit-Linked policies were up about €733 million versus a €220 million decline
in 2011. Specifically:
1. invested premiums amounted to €1,149 million of which €131 million relating to new business and €1,017 mil-
lion to in-force business. Compared to the prior year there was a decline in both new business and in-force busi-
ness premiums;
2. reserve release for amounts payable to policyholders amounted to about €1,148 million, of which €812 million
relating to surrenders, €29 million to claims and €212 million to maturities. Compared to December 2011, sur-
renders were up €77 million and maturities up €26 million;
3. reserve release due to divestments for administrative costs borne by customers amounted to about €14 million,
in line with 2011;
4. investments for bonuses were down €13 million over the prior year;
5. the reserve for changes in market value of insurance funds showed a revaluation of €733 million over the prior
year.
€/’000 2011 2012 Δ (Val) Δ (%)
Opening balance 9,377,997 9,153,374 (224,623) (2.45%)
Invested premiums 1,318,241 1,148,811 (169,430) (14.75%)
- new business 265,489 131,332 (134,156) (102.15%)
- in-force business 1,052,753 1,017,479 (35,274) (3.47%)
Release for payments (1,028,596) (1,148,844) (120,247) 10.47%
- surrenders (734,667) (812,013) (77,346) 9.53%
- claims (27,587) (29,764) (2,177) 7.31%
- maturities (186,457) (212,469) (26,012) 12.24%
Release for administrative costs (13,679) (13,770) (92) 0.67%
- maintenance (13,183) (13,335) (152) 1.14%
- past due items (267) (258) 9 (3.52%)
- switching (229) (178) 51 (28.38%)
Invested for bonuses 29,355 15,949 (13,407) (84.06%)
Other movements (5,998) (8,331) (2,333) 28.00%
Invested/disinvested for generic movements (3,082) (5,680) (2,598) 45.74%
Related guarantees (673) (645) 28 (4.28%)
Bid/offer related disinvestments (2,244) (2,006) 237 (11.83%)
Change in Market Value (520,025) 739,319 1,259,344 170.34%
Closing balance 9,157,295 9,886,508 729,213 7.38%
Year’s Movement (220,702) 733,134 953,835 130.10%
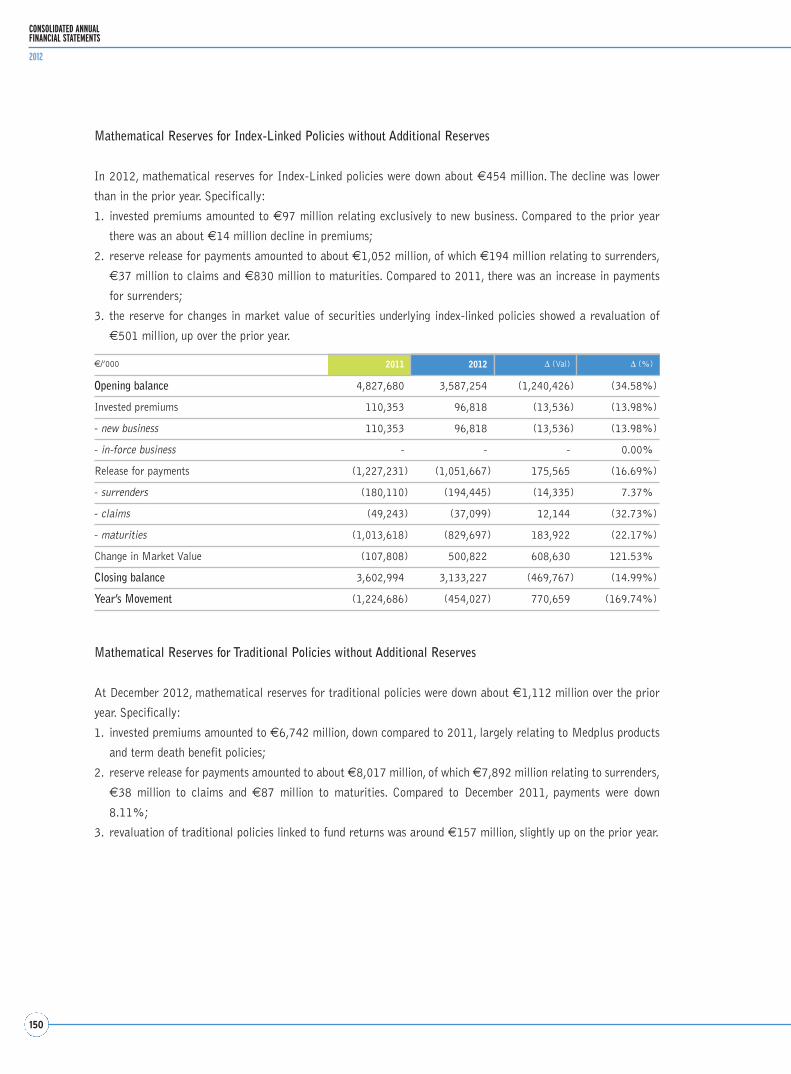
150
CONSOLIDATED ANNUALFINANCIAL STATEMENTS
2012
Mathematical Reserves for Index-Linked Policies without Additional Reserves
In 2012, mathematical reserves for Index-Linked policies were down about €454 million. The decline was lower
than in the prior year. Specifically:
1. invested premiums amounted to €97 million relating exclusively to new business. Compared to the prior year
there was an about €14 million decline in premiums;
2. reserve release for payments amounted to about €1,052 million, of which €194 million relating to surrenders,
€37 million to claims and €830 million to maturities. Compared to 2011, there was an increase in payments
for surrenders;
3. the reserve for changes in market value of securities underlying index-linked policies showed a revaluation of
€501 million, up over the prior year.
€/’000 2011 2012 Δ (Val) Δ (%)
Opening balance 4,827,680 3,587,254 (1,240,426) (34.58%)
Invested premiums 110,353 96,818 (13,536) (13.98%)
- new business 110,353 96,818 (13,536) (13.98%)
- in-force business - - - 0.00%
Release for payments (1,227,231) (1,051,667) 175,565 (16.69%)
- surrenders (180,110) (194,445) (14,335) 7.37%
- claims (49,243) (37,099) 12,144 (32.73%)
- maturities (1,013,618) (829,697) 183,922 (22.17%)
Change in Market Value (107,808) 500,822 608,630 121.53%
Closing balance 3,602,994 3,133,227 (469,767) (14.99%)
Year’s Movement (1,224,686) (454,027) 770,659 (169.74%)
Mathematical Reserves for Traditional Policies without Additional Reserves
At December 2012, mathematical reserves for traditional policies were down about €1,112 million over the prior
year. Specifically:
1. invested premiums amounted to €6,742 million, down compared to 2011, largely relating to Medplus products
and term death benefit policies;
2. reserve release for payments amounted to about €8,017 million, of which €7,892 million relating to surrenders,
€38 million to claims and €87 million to maturities. Compared to December 2011, payments were down
8.11%;
3. revaluation of traditional policies linked to fund returns was around €157 million, slightly up on the prior year.

151
NOTES TO THE CONSOLIDATEDANNUAL FINANCIAL STATEMENTS
Other Additional Reserves (Bonus Reserve, Expense Reserve, Reserve for Demographics Adjustments, etc)
In 2012, additional reserves were down about €14 million, with a marked movement over the prior year.
Specifically:
1. at December 2012, the Bonus Reserve showed a €18 million increase versus a €7 million increase in the prior
year;
2. amounts set aside for future expenses declined markedly over 2011;
3. the movement in the reserve for buyers propensity to opt for annuities was €1 million, down over 2011;
4. the reserve for the risk of declining rates was down about €2 million essentially due to good levels of return fore-
seeable for the next five-year period in relation to segregated funds.
€/’000 2011 2012 Δ (Val) Δ (%)
Opening balance 5,982,047 5,436,410 (545,637) (10.04%)
Invested premiums 7,964,029 6,741,844 (1,222,185) (18.13%)
- new business 1,295,059 723,943 (571,116) (78.89%)
- in-force business 6,668,970 6,017,901 (651,068) (10.82%)
Release for payments (8,666,847) (8,016,803) 650,044 (8.11%)
- surrenders (8,561,863) (7,891,656) 670,207 (8.49%)
- claims (32,426) (37,622) (5,196) 13.81%
- maturities (72,557) (87,524) (14,967) 17.10%
Other Changes 4,322 6,536 2,214 33.88%
Revaluation 152,859 156,589 3,730 2.38%
Closing balance 5,436,410 4,324,577 (1,111,833) (25.71%)
Year’s Movement (545,637) (1,111,833) (566,196) 50.92%
€/’000 2011 2012 Δ (Val) Δ (%)
Opening balance 323,305 399,984 76,679 19.17%
Amounts set aside for bonus reserve 6,984 17,573 10,589 60.26%
- loyalty bonus (11,742) (66) 11,676 n.s.
- maturity bonus 18,513 16,358 (2,155) (13.17%)
- other bonuses 51 174 123 70.86%
Amounts set aside for pension products 258 251 (7) (2.66%)
Amounts set aside for future expenses including Death Benefits 67,625 (30,870) (98,495) 319.07%
- Di Più 68,482 (30,569) (99,051) 324.03%
- traditional policies (30) 40 71 175.39%
Amounts set aside for propensity to opt for annuities 6,531 1,045 (5,486) (524.99%)
Amounts set aside for declining rates (3,749) (1,926) 1,823 (94.61%)
Amounts set aside for other reasons (27) (52) (25) 48.77%
- guarantees (42) 42 85 200.53%
- additional premiums 16 (94) (110) 116.71%
Closing balance 400,928 386,006 (14,922) (3.87%)
Year’s Movement 77,623 (13,979) (91,601) 655.30%

152
CONSOLIDATED ANNUALFINANCIAL STATEMENTS
2012
MCEV Value of new business
€/m % €/m %
Base value 1,864.28 - 9.70 -
INTEREST RATES AND ASSETS
1% reduction in risk-free reference rates (78.8) (4.2%) (0.3) (2.7%)
1% increase in risk-free reference rates 53.6 2.9% (0.1) (1.0%)
10% decrease in equity/property values (87.0) (4.7%) (0.5) (5.6%)
25% increase in equity/property implied volatilities (0.7) (0.0%) 0.0 0.0%
25% increase in swaption implied volatilities (0.5) (0.0%) 0.0 0.0%
EXPENSES AND PERSISTENCY
10% decrease in maintenance expenses 20.2 1.1% 1.0 10.1%
10% decrease in acquisition expenses 0.0 0.0% 3.2 33.2%
10% decrease in lapse rates 43.5 2.3% 2.2 22.2%
INSURANCE RISKS
5% decrease in mortality rates for life assurance business 3.2 0.2% 0.4 3.7%
5% decrease in mortality rates for annuity business (1.5) (0.1%) 0.0 0.0%
Embedded value sensitivity analysis was applied to both in-force business and new business generated in the year to
December 31, 2012 (calculated from the date the insurance product was sold). To that end the following stresses
were applied:
01. 100 bps decline in risk-free rates;
02. 100 bps increase in risk-free rates;
03. 10% decrease in equity/property values;
04. 25% increase in equity/property implied volatilities;
05. 25% increase in swaption implied volatilities;
06. 10% decrease in maintenance expenses;
07. 10% decrease in acquisition expenses;
08. 10% decrease in lapse rates;
09. 5% decrease in mortality rates for life insurance business;
10. 5% decrease in mortality rates for annuity business.
The quantitative impact is set out in the table below:

153
NOTES TO THE CONSOLIDATEDANNUAL FINANCIAL STATEMENTS
Conglomerate – Strategic risk, operational risk, compliance risk, reputational risk
Strategic Risk
Strategic risk is the current or prospective risk of impact on earnings or capital arising from changes in the indus-
try, adverse business decisions, improper implementation of decisions, lack of responsiveness to industry changes.
All Group companies are potentially exposed to strategic risk, each at different levels according to the volume of
business they manage and their operations.
Strategic risk may arise from:
• business decisions relating to the entry into new (local or international) markets or new product lines or changes
in the distribution model or channels;
• external events, changes in the competitive environment or unexpected market scenarios due to macroeconomic
events, or changes in the regulatory environment.
Strategic risk identification processes are part of usual management planning and control, entail analyses of mar-
ket scenario and changes in the competitive environment resulting from macroeconomic events or regulatory devel-
opments. These analyses are typically conducted upon budgeting and planning as well as upon the occurrence of
external events that may have a significant impact on the group’s business.
The Risk Assessment & Mitigation team takes care of said analyses as part of the KRI process.
Operational Risk
The Mediolanum Group defines operational risk as “the risk of economic loss or damage to assets, and sometimes
legal and administrative consequences, resulting from any misconduct or inappropriate behaviour of its personnel,
inadequate or failed systems or internal processes, or external events”.
The Mediolanum Group has adopted a common risk management framework under which identification, monitor-
ing and mitigation of operational risk is taken care of by Banca Mediolanum’s Compliance & Risk Control function
as per specific service contracts, in accordance with regulatory requirements and risk management policies.
The activities performed under the common integrated operational risk management framework are summarised in
the diagram below:
IDENTIFICATIONRISK ASSESSMENT
LOSS DATACOLLECTION
KRI
GENERICASSESSMENT
MEASUREMENTECONOMICCAPITAL
REGULATORYCAPITAL
MONITORING,CONTROL& REPORTING
MANAGEMENTANALYSIS
MITIGATION
TRANSFER
RETENTION
APPROVALOF THE MODELAND DEFINITIONOF STRATEGICPOLICIES

154
CONSOLIDATED ANNUALFINANCIAL STATEMENTS
2012
Each main component in said framework represents a macro-process which is divided into one or more sub-process-
es. In turn, these sub-processes consist of a series of steps and actions that are documented in internal procedures.
During 2012, 177 organisational units were examined within the Conglomerate. The exercise covered nearly all
activities and was the occasion for upgrading the 3,585 operational risk checkpoints. About 84% of checkpoints
and related controls were found to be effective, and targeted risk mitigation actions were taken for those that were
judged to be unsatisfactory or needing improvement.
The new Group entity Mediolanum Fiduciaria S.p.A. underwent thorough assessment to identify operational, com-
pliance and reputational risks inherent in its business, prior to starting operation. Recommendations were made to
the relevant teams regarding controls, procedures and checkpoints to be put in place.
The tests and analyses performed within the Mediolanum Group show the adequacy of the Group regulatory capi-
tal vis-à-vis operational risk, not only under the standardised approach but also confirmed by findings of internal
statistical analyses of processes and adverse events probability.
Compliance Risk
It is the risk of legal penalties or fines, financial losses or reputational damage resulting from failed compliance
with statutes, regulations, codes of conduct, self discipline or internal rules.
As mandated to it under the relevant service contracts Banca Mediolanum’s Compliance & Risk Control team mon-
itors the evolution of the banking, financial, insurance and pension regulatory environment to assess the impact of
changes in statutes and regulations on the Group business.
Specifically, under the common framework, in relation to compliance risk, the team takes care of:
• annual planning of compliance risk management activities, under a risk-based approach (compliance plan);
• monitoring the evolution of the regulatory environment and promptly informing the relevant organisational units
of any changes therein, especially those introduced by supervisory authorities.
• providing guidance and advice on the implementation of law or regulatory requirements, preparing adequate
training plans, providing assistance to senior management and corporate governance bodies on any matter involv-
ing regulatory risk and compliance;
• mapping applicable regulatory requirements, penalties applied in the event of failed compliance, as well as
affected processes and organisational units of Group entities;
• based on said mapping, assessing each single risky event whose occurrence might cause either directly or indi-
rectly penalties, financial losses or reputational damage, to determine the level of inherent risk (or risk impact);
• reviewing ex-ante the compliance risk control architecture (e.g. policies, rules, procedures, flows of information,
overall configuration, training) to make sure it is appropriate and effective to ensure regulatory compliance;
• verifying ex-post the effectiveness of the compliance risk control architecture in place (structure of processes,
operating and business procedures) to prevent operational and compliance risks, via ongoing controls and mon-
itoring multiple factors (e.g. tests, indicators, losses, penalties);
• defining, together with units that may be affected, corrective measures needed to mitigate any residual risk iden-
tified following the ex-ante review and ex-post verification of the effectiveness of the control architecture;
• preparing reports and ensuring adequate flows of information to the various internal structures, senior manage-
ment, corporate governance bodies and supervisory authorities on activities performed and the compliance risk
profile.

155
NOTES TO THE CONSOLIDATEDANNUAL FINANCIAL STATEMENTS
Reputational risk
Reputational risk is the current or prospective risk of impact on earnings or capital arising from the negative per-
ception of the Conglomerate’s image by customers, counterparties, shareholders of the Company, investors or super-
visory authorities.
Mediolanum S.p.A. recognises the reputation of the company and of the Conglomerate is the bedrock on which the
trust-based relationship with customers and market credibility are built.
Within the Mediolanum Group, reputation is managed and protected through:
• the values that are embedded in our organisation;
• the promotion of a corporate culture built on integrity, fairness and compliance at all levels of the organisation;
• the adoption of a reputational risk governance and control model.
Reputational damage can result from a multitude of causes, e.g. occurrence of operational risk events, breach of
internal or external rules, quality of internal and external communications including via social networks, blogs or
other digital media, or other circumstances that could undermine the reputation of the Conglomerate.
The Mediolanum Group has in place internal processes geared to ensuring proper management of relationships with
all stakeholders and continuously monitoring their satisfaction. Information on these aspects is set out also in the
Group’s Social Report. The processes in place are reviewed annually and actions and projects for improvement are
undertaken to ensure sustainable growth.

156
CONSOLIDATED ANNUALFINANCIAL STATEMENTS
2012
PART G - BUSINESS COMBINATIONS
1. Transactions concluded during the year
In the year under review there was no transaction requiring disclosure under IFRS 3.
2. Post-balance sheet date transactions
No transaction was concluded after the end of the financial year under review.

157
NOTES TO THE CONSOLIDATEDANNUAL FINANCIAL STATEMENTS
€/’000 Associates Other related
parties
Loans and Receivables 29,753 55,515
Available for Sale Financial Assets 63,833 -
Financial Assets at fair value through profit or loss 292,612 176,664
Other receivables 40 804
Other financial liabilities (737) (49,291)
Other payables - (3,789)
PART H - RELATED PARTY TRANSACTIONS
Transactions with related parties are part of the ordinary business of companies within the Group. These transac-
tions are made at arm’s length and in the interests of the individual entities.
In accordance with IAS 24, the following parties are Mediolanum S.p.A. Group related parties:
• the parent company Mediolanum S.p.A.;
• subsidiaries under its direct or indirect control;
• associates and joint-ventures (Banca Esperia Group, Mediobanca Group);
• parents and subsidiaries.
The following parties also fall within the definition of related parties:
• the members of the Boards of Directors of Group companies;
• Mediolanum S.p.A. key management officers.
As part of its ordinary business, the Group has commercial and financial relationships with companies that are relat-
ed parties. As part of its distribution and solicitation of investment business, the Group made contracts for the sale
of asset management, insurance and banking products and services through the sales networks of Group companies.
As part of its banking business, the Group made bank account, custodian, administration and brokerage service con-
tracts. As part of its asset management business, the Group made asset management contracts. In addition the
Group made contracts for the organisation of events, television communication, IT and administrative services,
rental, personnel secondment and other minor activities with Mediolanum Group companies.
1. Information on related party transactions
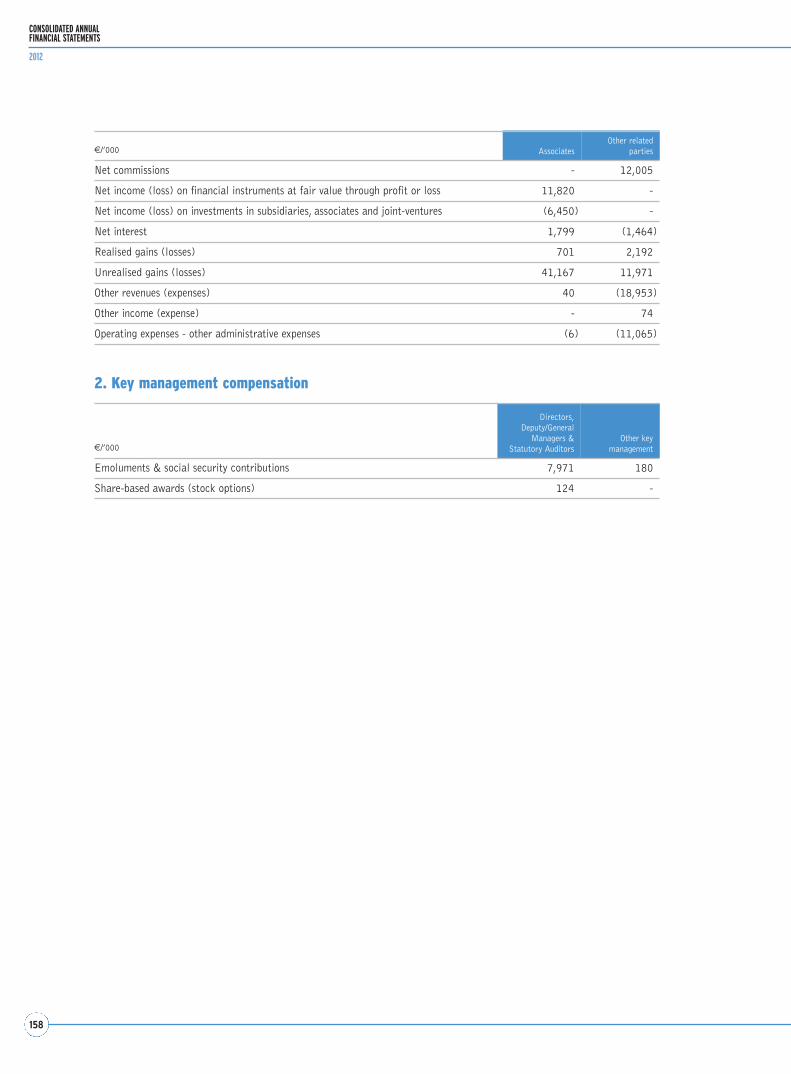
158
CONSOLIDATED ANNUALFINANCIAL STATEMENTS
2012
2. Key management compensation
€/’000 Associates Other related
parties
Net commissions - 12,005
Net income (loss) on financial instruments at fair value through profit or loss 11,820 -
Net income (loss) on investments in subsidiaries, associates and joint-ventures (6,450) -
Net interest 1,799 (1,464)
Realised gains (losses) 701 2,192
Unrealised gains (losses) 41,167 11,971
Other revenues (expenses) 40 (18,953)
Other income (expense) - 74
Operating expenses - other administrative expenses (6) (11,065)
€/’000
Directors,Deputy/General
Managers & Statutory Auditors
Other key management
Emoluments & social security contributions 7,971 180
Share-based awards (stock options) 124 -
159
NOTES TO THE CONSOLIDATEDANNUAL FINANCIAL STATEMENTS
PART I - EQUITY-SETTLED SHARE-BASED PAYMENT TRANSACTIONS
1. Description of equity-settled share-based payment transactions
At the Extraordinary General Meeting held on April 26, 2005, the shareholders of Mediolanum S.p.A. resolved to
increase share capital for a consideration, in one or more occasions over five years, by issuing up to 9,500,000
Mediolanum S.p.A. shares to be allotted to the employees, directors and contract workers of the company and its
subsidiaries under a stock option plan, which could be implemented on multiple occasions and in different years.
The stock options granted to employees would be exercisable upon the expiration of a two-year vesting period at a
share price equal to the fair market value – as defined by tax rules – of the Mediolanum stock on the date of the
Board of Directors’ resolutions relating to the respective capital increases.
The exercise of the Options granted to employees was subject to the satisfaction of the Vesting Conditions estab-
lished annually by the company that employs them.
The exercise of the Options – subject to the satisfaction of the Vesting Conditions – and the subsequent subscription
for Shares by Employees were allowed only upon the expiration of two years from the Grant Date (vesting period).
The exercise of the Options and the subsequent subscription for Shares were to be made in full on a single occasion
in the first five business days of each of the sixty calendar months subsequent to the Vesting Date.
The stock options granted to directors and contract workers would be exercisable upon the expiration of a vesting
period of two years for Directors and of three years for Contract Workers, at a share price equal to weighted aver-
age of (i) the company’s equity value per share as reported in the last financial statements approved prior to the
allotment of the Options and (ii) and the average stock market price of Mediolanum S.p.A. shares in the six months
preceding the Grant Date, applying a weight equal to ninety percent of the equity value and a weight equal to ten per-
cent of the average stock market price in the last six-month period, respectively. The exercise of the Options granted
to Directors and Contract Workers was subject to the satisfaction of at least one of the following conditions:
(i) that on the Vesting Date the closing price of Mediolanum S.p.A. ordinary shares be not lower than the closing
price of Mediolanum S.p.A. ordinary shares on the Grant date; or (ii) that the change in the closing price of
Mediolanum S.p.A. ordinary shares in the period between the Grant Date and the Vesting Date (the «Relevant
Period») be not lower than the arithmetic mean of the changes recorded in the Relevant Period in the S&P/Mib,
Comit Assicurativi and Comit Bancari indices (the “Indices”), properly adjusted applying the criteria commonly
adopted in financial market practice to take into account the correlation coefficient (known as the beta coefficient)
between the Mediolanum S.p.A. ordinary shares and said Indices in the Relevant Period; the adjusted mean change
in the Indices would be calculated by an independent third party appointed for that purpose by the Board of
Directors of the Company; or (iii) that the Embedded Value of the Mediolanum Group, as calculated by an inde-
pendent third-party appointed for that purpose by the Board of Directors of the Company and reported in the last
financial statements approved prior to the Vesting Date, be at least equal to the Embedded Value of the Mediolanum
Group as calculated based on the last financial statements approved prior to the Grant Date.
The exercise of the Options – subject to the satisfaction of Vesting Conditions – and the subsequent subscription for
Shares by Directors and Contract Workers were allowed only upon the expiration of two years for Directors and of
three years for Contract Workers from the Grant Date (Vesting Period). The exercise of the Options and the subse-
quent subscription for Shares were to be made in full on a single occasion in the first five business days of each of
the sixty calendar months subsequent to the Vesting Date.
160
CONSOLIDATED ANNUALFINANCIAL STATEMENTS
2012
At the Extraordinary General Meeting of Mediolanum S.p.A held on April 23, 2009, the shareholders resolved to
extend assessment of the satisfaction of vesting conditions over the entire exercise period i.e. the period spanning
from the Vesting Date to 60 months thereafter. The shareholders also resolved to revoke the authority to increase
share capital for a consideration through the issue of shares to be allotted to the employees and directors of the
Company and its subsidiaries, conferred upon the Board of Directors by the shareholders at the General Meetings
of April 26, 2005 and April 19, 2007, and partly executed, and to amend article 6 of the Bylaws accordingly.
As to the Director Stock Option Plan, at its Meeting of May 13, 2009, the Board of Directors of Mediolanum S.p.A.
approved the reduction of the vesting period from 36 to 24 months and the extension of the exercise period from
12 to 60 months.
At the same meeting, the Board of Directors of Mediolanum S.p.A. also resolved to increase share capital for a
consideration by €60,613.50 by issuing shares to be subscribed by the contract workers of the Company and its
subsidiaries in the first five business days of each of the 60 calendar months subsequent to the expiration of three
years from May 13, 2009 and to amend article 6 of the Bylaws accordingly.
At its May 13, 2009 meeting, the Board of Directors of Mediolanum S.p.A. resolved to effect the share capital
increases under article 2443 of the Italian Civil Code to serve the Contract Worker Stock Option Plan and allot
606,135 rights to the contract workers of the Company and its subsidiaries. The rights are exercisable from the 1st
trading day of May 2012 and not later that the 5th trading day of May, 2017 at a price of €1.022.
On March 9, 2010, after consulting with the Compensation Committee, the Board of Directors of Mediolanum S.p.A.
approved the guidelines for the Stock Options Plan reserved to the directors and executives of the Company and its
subsidiaries (‘Top Management Plan 2010’) as well as the guidelines for the Stock Options Plan for contract work-
ers – i.e. the members of the sales network – of the Company and its subsidiary (‘Sales Network Plan 2010’), col-
lectively the ‘Plans’. The Plans were submitted to the Extraordinary General Meeting of April 27, 2010 for approval.
Pursuant to section 84-bis, paragraph 3 of the Regulation for Issuers, readers are informed that:
• The Top Management Plan 2010 is the stock options plan reserved to the directors and other key management
of the Company and/or its subsidiaries. The Sales Network Plan 2010 is the stock options plan reserved to the
financial advisors working for the Company and its subsidiaries, as may be selected from time to time for their
individual role and contribution to business growth.
• The Plans entail annual awards of rights to subscribe to newly issued ordinary shares of the Company (the ‘Stock
Options’). The implementation of the Plans entails two new rights issues reserved to each of the two categories
of Beneficiaries, pursuant to art. 2441, paragraph five, of the Italian Civil Code, as resolved by the Board of
Directors under the authority delegated to it by the General Meeting, pursuant to art. 2443 of the Italian Civil
Code. The Stock Options under the Top Management Plan 2010 shall vest over a period of three to five years of
the Grant Date and be exercisable for a period of three years after the date of vesting. The Stock Options under
the Sales Network Plan 2010 shall vest over a period of five to ten years of the Grant Date and be exercisable
for a period of three years after the date of vesting.
The exercise of the Stock Options under the Plans is conditional upon the achievement of specific corporate
and/or individual performance targets. The details of the Plans shall be laid down by the Board of Directors after
consultation with the competent bodies of the Company and its subsidiaries.
• The Plans are designed to provide incentives to the Beneficiaries and at the same time promote value creation
and growth for the Company and, accordingly, its shareholders. The Top Management Plan 2010 is believed to
be an adequate scheme to link key management incentives to both medium-term performance of the

161
NOTES TO THE CONSOLIDATEDANNUAL FINANCIAL STATEMENTS
Company/Group and individual performance, align goals and maximise the creation of value for the sharehold-
ers. The Sales Network Plan 2010 is an adequate scheme to link sales network incentives to both medium-term
performance of the Company/Group and individual performance, align goals and maximise the creation of value
for the shareholders. Considering the length of the vesting period, the Sales Network Plan 2010 is also a pow-
erful way to enhance the sales network loyalty.
On July 8, 2010, after consulting with the Compensation Committee, by virtue of the authorities delegated to it by
the Ordinary and Extraordinary General Meetings of April 27, 2010, the Board of Directors of Mediolanum S.p.A.
resolved to:
• approve the Rules for the Stock Options Plan reserved to the Directors and Executives of the company and the
Group (‘Top Management Plan 2010’) and the Rules for the Stock Options Plan for the Sales Network of the
company and the Group (‘Sales Network Plan 2010’);
• increase the Company’s share capital by a maximum amount of €160,000.00, for a consideration, by issuing up
to 1,600,000 shares for the allotment of stock options under the Top Management Plan 2010;
• increase the Company’s share capital by a maximum amount of €131,744.20, for a consideration, by issuing up
to 1,317,442 shares for the allotment of stock options under the Sales Network Plan 2010;
• grant the beneficiaries – 19 under the Top Management Plan and 193 under the Sales Network Plan – part of
the stock options under the Plans.
On May 12, 2011, after consulting with the Compensation Committee, by virtue of the authorities delegated to it
by the Ordinary and Extraordinary General Meetings of April 27, 2010, the Board of Directors of Mediolanum
S.p.A. resolved, inter alia:
• to approve the amendments to the Rules for the Stock Options Plan reserved to the Directors and Executives of
the company and the Group (‘Top Management Plan 2010’) and the Rules for the Stock Options Plan for the
Sales Network of the company and the Group (‘Sales Network Plan 2010’);
• in partial execution of the authorities delegated to the Board of Directors by the shareholders at the Extraordinary
General Meeting of April 27, 2010 – to increase the Company’s share capital by a maximum amount of
€188,200.00 (one hundred and eighty-eight thousand two hundred point zero), for a consideration, by issuing up
to 1,882,000 (one million eight hundred and eighty two thousand) dividend-bearing ordinary shares, par value of
€0.1 each, with the exclusion of shareholders’ pre-emptive rights pursuant to article 2441, paragraph five, of the
Italian Civil Code, as they are reserved to the Directors and executives of the company and its subsidiaries pur-
suant to article 2359 paragraph 1, N. 1, of the Italian Civil Code for subscription at a price of €1.076 (one point
zero seventy six) per share. The shares are to be subscribed, in a single occasion in the first five business days of
each of the thirty six calendar months subsequent to the expiration of the three year term starting from today’s
date, except for any different exceptional circumstances set forth in the Plan rules. The final deadline for share
subscription is therefore set at the fifth business day in the thirty-sixth calendar months subsequent to the expira-
tion of the three year term from today’s date. In the event that the capital increase is not fully subscribed by said
deadline, share capital will be increased by the amount of the subscriptions received as of that date;
• in partial execution of the authorities delegated to the Board of Directors by the shareholders at the Extraordinary
General Meeting of April 27, 2010 – to increase the Company’s share capital by a maximum amount of
€67,427.50 (sixty seven thousand four hundred and twenty seven point fifty), for a consideration, by issuing up
to 674,275 (six hundred seventy four thousand two hundred and seventy five) dividend-bearing ordinary shares,
par value of €0.1 each, with the exclusion of shareholders’ pre-emptive rights pursuant to article 2441, paragraph

162
CONSOLIDATED ANNUALFINANCIAL STATEMENTS
2012
five, of the Italian Civil Code, as they are reserved to the sales network of the company and its subsidiaries pur-
suant to article 2359 paragraph 1, N. 1, of the Italian Civil Code for subscription at a price of €1.076 (one point
zero seventy six) per share. The shares are to be subscribed, in a single occasion in the first five business days of
each of the thirty six calendar months subsequent to the expiration of the nine year term starting from today’s
date, except for any different exceptional circumstances set forth in the Plan rules. The final deadline for share
subscription is therefore set at the fifth business day in the thirty-sixth calendar months subsequent to the expira-
tion of the nine year term from today’s date. In the event that the capital increase is not fully subscribed by said
deadline, share capital will be increased by the amount of the subscriptions received as of that date; and
• to grant the beneficiaries – 17 under the Top Management Plan and 161 under the Sales Network Plan – part
of the stock options under the Plans.
On May 10, 2012, by virtue of the authorities delegated to it by the Extraordinary General Meeting of April 27,
2010, as amended by resolution passed by the shareholders at the Ordinary and Extraordinary General Meeting of
April 19, 2012, the Board of Directors of Mediolanum S.p.A. resolved:
• to increase the Company’s share capital by a maximum amount of €186,405.00, for a consideration, by issuing
up to 1,864,050 dividend-bearing ordinary shares, par value of €0.1 each, with the exclusion of shareholders’
pre-emptive rights pursuant to article 2441, paragraph five, of the Italian Civil Code, as they are reserved to the
Directors and executives of the company and its subsidiaries pursuant to article 2359 paragraph 1, N. 1, of the
Italian Civil Code, setting as final deadline for share subscription the fifth business day in the thirty-sixth calen-
dar months subsequent to the expiration of the three year term from the date of the capital increase resolution;
• to increase the Company’s share capital by a maximum amount of €70,840.00, for a consideration, by issuing
up to 708,400 dividend-bearing ordinary shares, par value of €0.1 each, with the exclusion of shareholders’ pre-
emptive rights pursuant to article 2441, paragraph five, of the Italian Civil Code, as they are reserved to the sales
network of the company and its subsidiaries pursuant to article 2359 paragraph 1, N. 1, of the Italian Civil Code,
setting as final deadline for share subscription the fifth business day in the thirty-sixth calendar months subse-
quent to the expiration of the nine year term from the date of the capital increase resolution.
In accordance with art. 79 of Consob Regulation 11971 of May 14, 1999 the interests of Directors and Statutory
Auditors in ordinary shares of the company and its subsidiaries are set out in Schedule 3 below prepared pursuant
to Annex 3C of said regulation.
2. Fair value measurement of stock options
For measurement of stock options the Group applies the Black-Scholes model for European call options which is a
standard, easily replicable model.
The options under the Group stock options plan, however, differ from European-style call options in certain features
such as the vesting period, the exercise conditions and the exercise period. The method applied by the Group was to
price the options like plain vanilla options, analyse each specific plan feature and measure the relevant impact on
the final value of the option.
The results of the analysis of the stock option exercise period were such that the stock options could be treated like
European-style call options expiring on the first day of exercise. A European-style call option is priced using the
Black-Scholes model and the value thus obtained is then reduced, if necessary, by a certain percentage based on the
analysis of the exercise conditions.

163
NOTES TO THE CONSOLIDATEDANNUAL FINANCIAL STATEMENTS
3. Changes occurred in the year
In financial year 2012, 518,550 new Mediolanum dividend-bearing ordinary shares were issued following the exer-
cise of stock options by Directors and Sales Network people of companies within the Mediolanum Group. This
entailed a €51,855.0 increase in Mediolanum ordinary share capital and a €483,795.23 increase in the share pre-
mium account.
The year’s movements in option holdings are set out in the table below.
€/’000Number of options and exercise price
December 31, 2012 December 31, 2011
Number of options
Average exercise price
Average expiration
Number of options
Average exercise price
Average expiration
A. Opening balance 8,851,973 2.32954 May-17 7,261,693 3.00482 Sept-16
B. Increases 2,572,450 - - 2,556,275 - -
B.1. New issues 2,572,450 1.10400 Jan-17 2,556,275 1.07600 Nov-18
B.2 Other - - X - - X
C. Decreases 1,904,146 - - (965,995) - -
C.1. Cancelled 843,596 1.66621 X (43,600) 4.41723 X
C.2. Exercised (*) 518,550 1.03297 X (922,395) 1.08145 X
C.3 Lapsed 542,000 5.23100 X - - X
C.4 Other - - X - - X
D. Closing balance 9,520,277 1.9478 Sept-17 8,851,973 2.32954 May-17
E. Options exercisable at yearend 2,183,706 4.8205 X 2,775,521 5.02993 X
(*) Average market price on exercise date was €2,94.
4. Other information
The year’s cost of stock options, which corresponds to the year’s share of the fair value of financial instruments
over the vesting period, amounted to €2,216 thousand and entailed a corresponding increase in the Company’s
equity reserves.
Basiglio, March 21, 2013
For the Board of Directors
The Chairman
(Carlo Secchi)


Schedules


167
SCHEDULES
SCHEDULES
This section presents financial information in accordance with the “Instructions for the preparation of IFRS con-
solidated accounts” issued by ISVAP under Regulation No. 7 of July 13, 2007, as subsequently amended by ISVAP
Regulation 2784 of March 8, 2010.
In accordance with the regulations mentioned above, for segment reporting purposes, statement of financial posi-
tion and income statement balances were allocated as follows: ‘Life Business’ includes only the balances of the Life
Insurance companies within the Group while ‘Financial Business’ includes the balances of the parent company
Mediolanum S.p.A., the Mediolanum Banking Group and other Group companies. ‘Intersegment’ shows intercom-
pany balances that were offset against each other.
This presentation of segmental information differs from that used in past years. The new format was adopted to
present information in a manner that is more in line with the Mediolanum Group management reporting approach,
as noted in Part E – Segmental information.

STATEMENT OF FINANCIAL POSITION AS AT DECEMBER 31, 2012
Segment Reporting by Business sector
€/’000
LIFE INSURANCE
2012 2011
1. Intangible assets 92,928 100,861
2. Tangible assets 16,825 17,249
3. Reinsurers’ share of technical reserves 76,198 89,273
4. Investments 17,595,012 18,367,485
4.1 Investment property 106,798 108,041
4.2 Investments in subsidiaries, associates and joint ventures - -
4.3 Held-to-maturity investments 334,370 308,087
4.4 Loans and receivables 344,833 301,164
4.5 Available-for-sale financial assets 3,102,679 2,609,978
4.6 Financial assets at fair value through profit or loss 13,706,332 15,040,215
5. Receivables 11,315 5,850
6. Other assets 541,824 618,189
6.1 Deferred acquisition costs - -
6.2 Other 541,824 618,189
7. Cash and cash equivalents 787,780 576,310
Total assets 19,121,882 19,775,217
1. Shareholders’ equity - -
2. Provisions 1,146 781
3. Technical reserves 17,823,829 18,632,275
4. Financial liabilities 477,679 511,467
4.1 Financial liabilities at fair value through profit or loss 93,163 88,522
4.2 Other financial liabilities 384,516 422,945
5. Payables 143,009 126,627
6. Other liabilities 79,615 71,841
Total liabilities and shareholders’ equity - -
168
CONSOLIDATED ANNUALFINANCIAL STATEMENTS
2012

BANKING INTERSEGMENT TOTAL
2012 2011 2012 2011 2012 2011
60,054 66,005 - - 152,982 166,866
72,757 52,711 - - 89,582 69,960
- - - - 76,198 89,273
18,108,346 14,937,615 (939,921) (838,805) 34,763,437 32,466,295
- - - - 106,798 108,041
382,700 404,493 - - 382,700 404,493
1,025,038 697,862 - - 1,359,408 1,005,949
6,895,535 6,689,931 (836,016) (745,211) 6,404,352 6,245,884
9,216,390 6,452,428 - - 12,319,069 9,062,406
588,683 692,901 (103,905) (93,594) 14,191,110 15,639,522
215 134 (157) (243) 11,373 5,741
511,303 485,038 (289,134) (267,988) 763,993 835,239
- - - - -
511,303 485,038 (289,134) (267,988) 763,993 835,239
250,031 365,171 (846,547) (603,095) 191,264 338,386
19,002,706 15,906,674 (2,075,759) (1,710,131) 36,048,829 33,971,760
- - - - 1,420,447 762,350
189,876 159,912 - - 191,022 160,693
- - - - 17,823,829 18,632,275
17,312,687 14,861,550 (1,856,164) (1,513,854) 15,934,202 13,859,163
349,882 401,158 - (56) 443,045 489,624
16,962,805 14,460,392 (1,856,164) (1,513,798) 15,491,157 13,369,539
200,917 156,936 (62,599) (58,309) 281,327 225,254
475,383 398,152 (156,996) (137,968) 398,002 332,025
- - - - 36,048,829 33,971,760
169
SCHEDULES
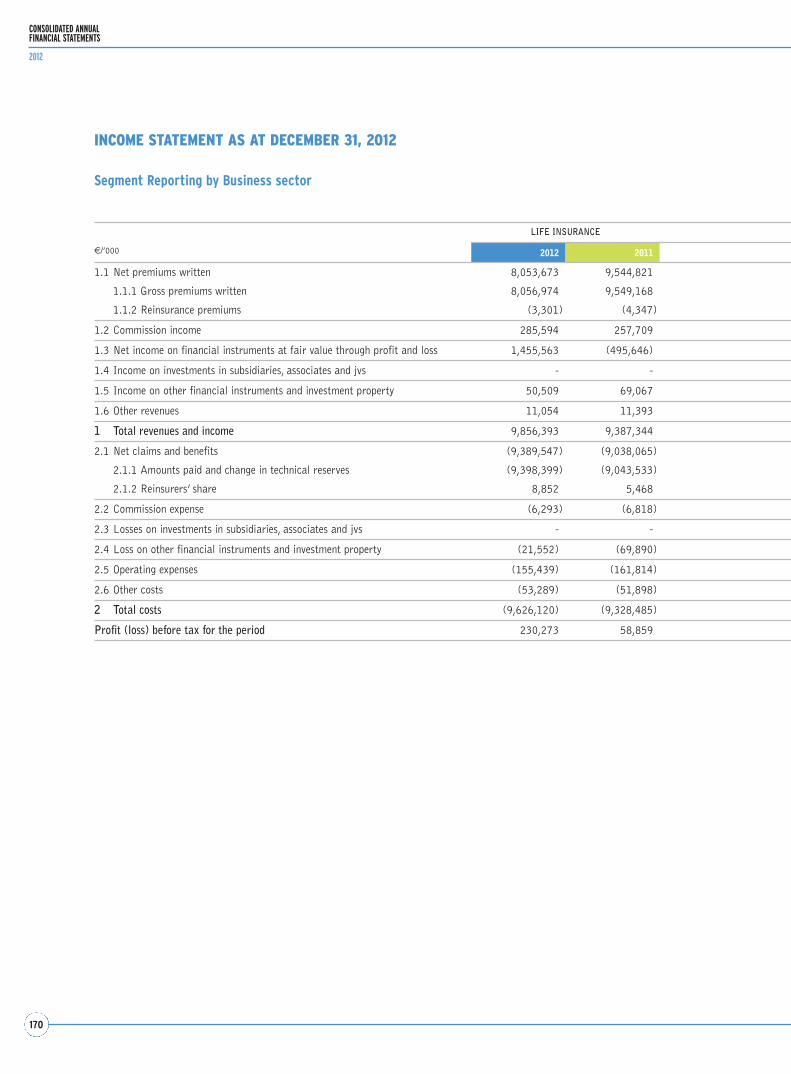
170
CONSOLIDATED ANNUALFINANCIAL STATEMENTS
2012
INCOME STATEMENT AS AT DECEMBER 31, 2012
Segment Reporting by Business sector
€/’000
LIFE INSURANCE
2012 2011
1.1 Net premiums written 8,053,673 9,544,821
1.1.1 Gross premiums written 8,056,974 9,549,168
1.1.2 Reinsurance premiums (3,301) (4,347)
1.2 Commission income 285,594 257,709
1.3 Net income on financial instruments at fair value through profit and loss 1,455,563 (495,646)
1.4 Income on investments in subsidiaries, associates and jvs - -
1.5 Income on other financial instruments and investment property 50,509 69,067
1.6 Other revenues 11,054 11,393
1 Total revenues and income 9,856,393 9,387,344
2.1 Net claims and benefits (9,389,547) (9,038,065)
2.1.1 Amounts paid and change in technical reserves (9,398,399) (9,043,533)
2.1.2 Reinsurers’ share 8,852 5,468
2.2 Commission expense (6,293) (6,818)
2.3 Losses on investments in subsidiaries, associates and jvs - -
2.4 Loss on other financial instruments and investment property (21,552) (69,890)
2.5 Operating expenses (155,439) (161,814)
2.6 Other costs (53,289) (51,898)
2 Total costs (9,626,120) (9,328,485)
Profit (loss) before tax for the period 230,273 58,859
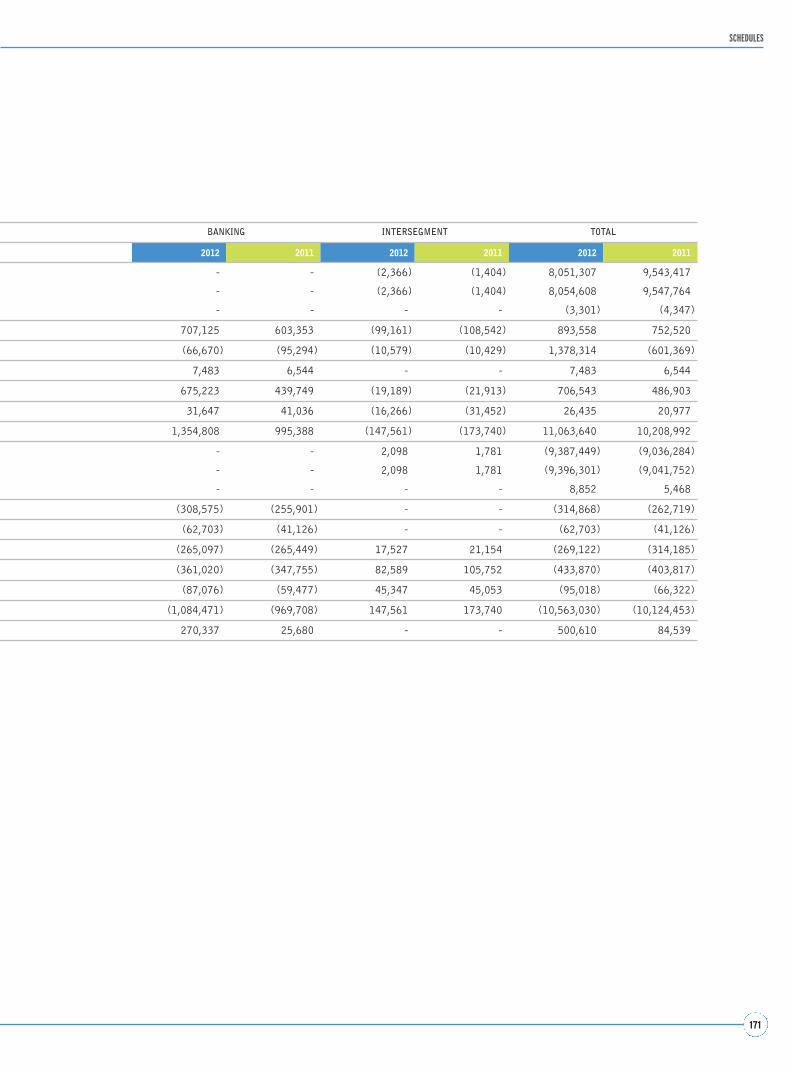
171
SCHEDULES
BANKING INTERSEGMENT TOTAL
2012 2011 2012 2011 2012 2011
- - (2,366) (1,404) 8,051,307 9,543,417
- - (2,366) (1,404) 8,054,608 9,547,764
- - - - (3,301) (4,347)
707,125 603,353 (99,161) (108,542) 893,558 752,520
(66,670) (95,294) (10,579) (10,429) 1,378,314 (601,369)
7,483 6,544 - - 7,483 6,544
675,223 439,749 (19,189) (21,913) 706,543 486,903
31,647 41,036 (16,266) (31,452) 26,435 20,977
1,354,808 995,388 (147,561) (173,740) 11,063,640 10,208,992
- - 2,098 1,781 (9,387,449) (9,036,284)
- - 2,098 1,781 (9,396,301) (9,041,752)
- - - - 8,852 5,468
(308,575) (255,901) - - (314,868) (262,719)
(62,703) (41,126) - - (62,703) (41,126)
(265,097) (265,449) 17,527 21,154 (269,122) (314,185)
(361,020) (347,755) 82,589 105,752 (433,870) (403,817)
(87,076) (59,477) 45,347 45,053 (95,018) (66,322)
(1,084,471) (969,708) 147,561 173,740 (10,563,030) (10,124,453)
270,337 25,680 - - 500,610 84,539
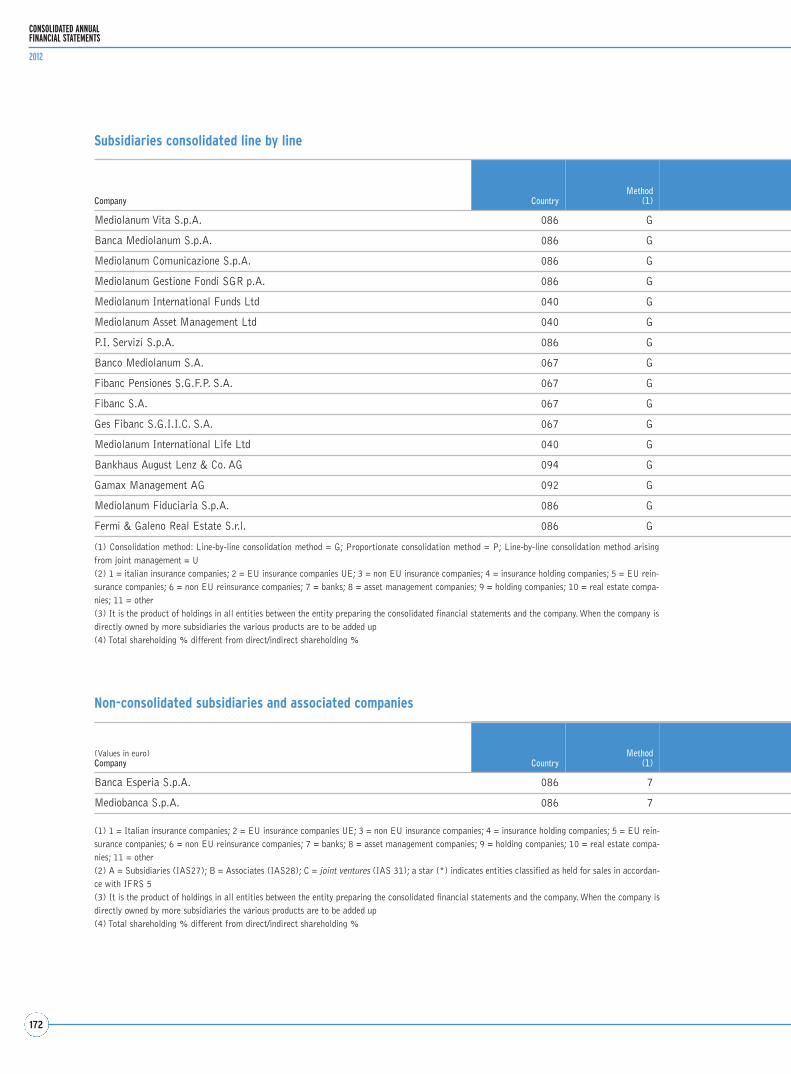
172
CONSOLIDATED ANNUALFINANCIAL STATEMENTS
2012
Subsidiaries consolidated line by line
Non-consolidated subsidiaries and associated companies
(1) Consolidation method: Line-by-line consolidation method = G; Proportionate consolidation method = P; Line-by-line consolidation method arisingfrom joint management = U(2) 1 = italian insurance companies; 2 = EU insurance companies UE; 3 = non EU insurance companies; 4 = insurance holding companies; 5 = EU rein-surance companies; 6 = non EU reinsurance companies; 7 = banks; 8 = asset management companies; 9 = holding companies; 10 = real estate compa-nies; 11 = other(3) It is the product of holdings in all entities between the entity preparing the consolidated financial statements and the company. When the company isdirectly owned by more subsidiaries the various products are to be added up(4) Total shareholding % different from direct/indirect shareholding %
(1) 1 = Italian insurance companies; 2 = EU insurance companies UE; 3 = non EU insurance companies; 4 = insurance holding companies; 5 = EU rein-surance companies; 6 = non EU reinsurance companies; 7 = banks; 8 = asset management companies; 9 = holding companies; 10 = real estate compa-nies; 11 = other(2) A = Subsidiaries (IAS27); B = Associates (IAS28); C = joint ventures (IAS 31); a star (*) indicates entities classified as held for sales in accordan-ce with IFRS 5(3) It is the product of holdings in all entities between the entity preparing the consolidated financial statements and the company. When the company isdirectly owned by more subsidiaries the various products are to be added up(4) Total shareholding % different from direct/indirect shareholding %
Company CountryMethod
(1)
Mediolanum Vita S.p.A. 086 G
Banca Mediolanum S.p.A. 086 G
Mediolanum Comunicazione S.p.A. 086 G
Mediolanum Gestione Fondi SGR p.A. 086 G
Mediolanum International Funds Ltd 040 G
Mediolanum Asset Management Ltd 040 G
P.I. Servizi S.p.A. 086 G
Banco Mediolanum S.A. 067 G
Fibanc Pensiones S.G.F.P. S.A. 067 G
Fibanc S.A. 067 G
Ges Fibanc S.G.I.I.C. S.A. 067 G
Mediolanum International Life Ltd 040 G
Bankhaus August Lenz & Co. AG 094 G
Gamax Management AG 092 G
Mediolanum Fiduciaria S.p.A. 086 G
Fermi & Galeno Real Estate S.r.l. 086 G
(Values in euro)Company Country
Method(1)
Banca Esperia S.p.A. 086 7
Mediobanca S.p.A. 086 7

173
SCHEDULES
Activity(2)
Direct Shareholding %
Indirect Shareholding %
(3)Total
(4) Group Equity Ratio
1 100.00 100.00 100.00
7 100.00 100.00 100.00
11 100.00 100.00 100.00
8 49.00 100.00 100.00
8 44.00 100.00 100.00
11 49.00 100.00 100.00
11 100.00 100.00 100.00
7 0.00 100.00 100.00
8 0.00 100.00 100.00
11 0.00 100.00 100.00
8 0.00 100.00 100.00
2 100.00 100.00 100.00
7 0.00 100.00 100.00
8 0.00 100.00 100.00
11 0.00 100.00 100.00
10 0.00 100.00 100.00
Activity(2)
Direct Shareholding %
Indirect Shareholding %
(3)Total
(4) Book Value
B 50.00 50.00 50.00 90,294,000
B 2.63 3.38 3.45 292,406,000
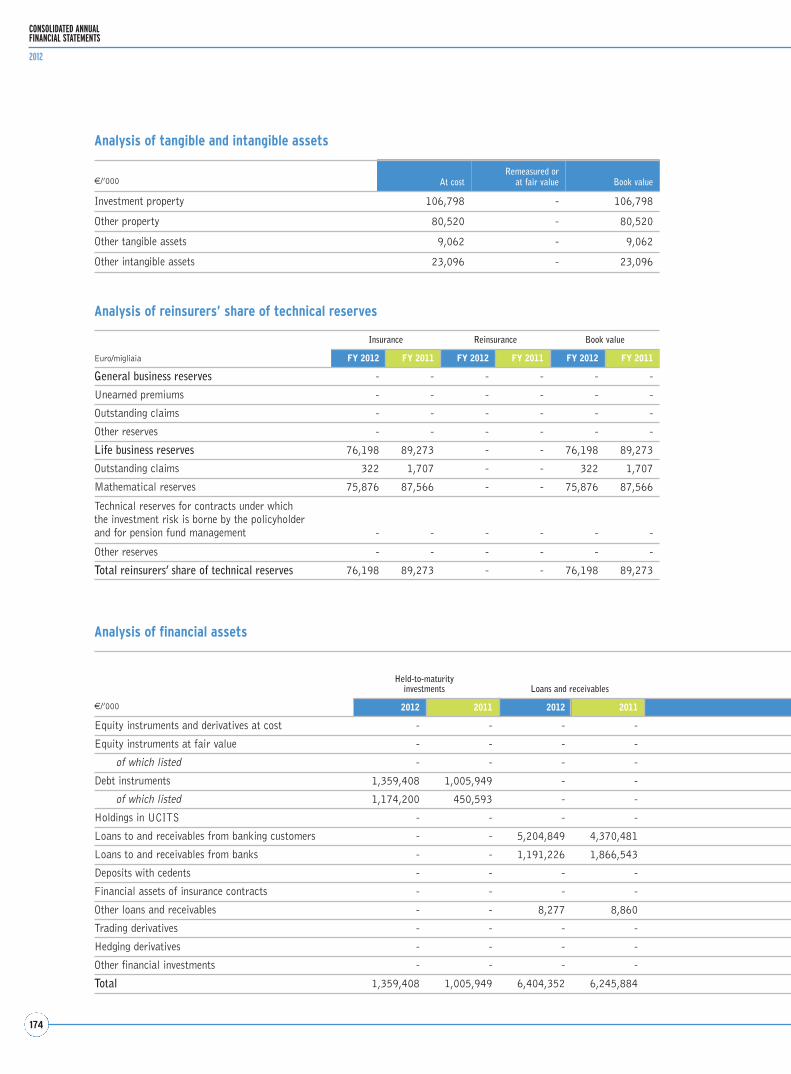
174
CONSOLIDATED ANNUALFINANCIAL STATEMENTS
2012
Analysis of tangible and intangible assets
Analysis of reinsurers’ share of technical reserves
€/’000 At costRemeasured or
at fair value Book value
Investment property 106,798 - 106,798
Other property 80,520 - 80,520
Other tangible assets 9,062 - 9,062
Other intangible assets 23,096 - 23,096
Euro/migliaia
Insurance Reinsurance Book value
FY 2012 FY 2011 FY 2012 FY 2011 FY 2012 FY 2011
General business reserves - - - - - -
Unearned premiums - - - - - -
Outstanding claims - - - - - -
Other reserves - - - - - -
Life business reserves 76,198 89,273 - - 76,198 89,273
Outstanding claims 322 1,707 - - 322 1,707
Mathematical reserves 75,876 87,566 - - 75,876 87,566
Technical reserves for contracts under which the investment risk is borne by the policyholder and for pension fund management - - - - - -
Other reserves - - - - - -
Total reinsurers’ share of technical reserves 76,198 89,273 - - 76,198 89,273
Analysis of financial assets
€/’000
Held-to-maturityinvestments Loans and receivables
2012 2011 2012 2011
Equity instruments and derivatives at cost - - - -
Equity instruments at fair value - - - -
of which listed - - - -
Debt instruments 1,359,408 1,005,949 - -
of which listed 1,174,200 450,593 - -
Holdings in UCITS - - - -
Loans to and receivables from banking customers - - 5,204,849 4,370,481
Loans to and receivables from banks - - 1,191,226 1,866,543
Deposits with cedents - - - -
Financial assets of insurance contracts - - - -
Other loans and receivables - - 8,277 8,860
Trading derivatives - - - -
Hedging derivatives - - - -
Other financial investments - - - -
Total 1,359,408 1,005,949 6,404,352 6,245,884

175
SCHEDULES
Available-for-salefinancial assets
Financial assets at fair value through profit or loss
Book valueFinancial assets held for trading
Financial assets at fair value through profit or loss
2012 2011 2012 2011 2012 2011 2012 2011
- - - - - - - -
34,821 34,387 - 3 - - 34,821 34,390
4,217 3,524 - 3 - - 4,217 3,527
12,111,226 8,847,747 1,214,764 2,883,613 3,402,540 3,796,258 18,087,938 16,533,567
11,744,882 8,374,279 1,180,524 2,752,145 356,806 275,791 14,456,412 11,852,808
173,022 180,272 116 18,773 9,565,715 8,935,348 9,738,853 9,134,393
- - - - - - 5,204,849 4,370,481
- - - - - - 1,191,226 1,866,543
- - - - - - - -
- - - - - - - -
- - - - - - 8,277 8,860
- - 6,609 5,527 - - 6,609 5,527
- - 1,366 - 1,366 -
- - - - - - - -
12,319,069 9,062,406 1,221,489 2,907,916 12,969,621 12,731,606 34,273,939 31,953,761
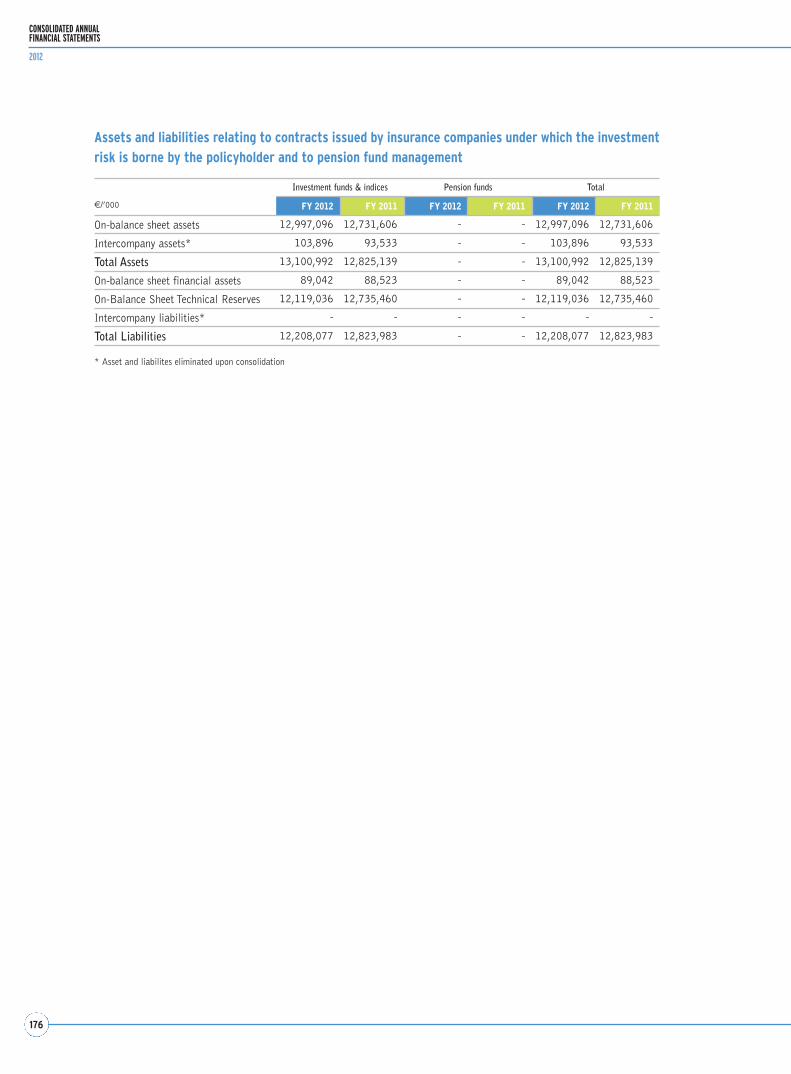
176
CONSOLIDATED ANNUALFINANCIAL STATEMENTS
2012
Assets and liabilities relating to contracts issued by insurance companies under which the investmentrisk is borne by the policyholder and to pension fund management
€/’000
Investment funds & indices Pension funds Total
FY 2012 FY 2011 FY 2012 FY 2011 FY 2012 FY 2011
On-balance sheet assets 12,997,096 12,731,606 - - 12,997,096 12,731,606
Intercompany assets* 103,896 93,533 - - 103,896 93,533
Total Assets 13,100,992 12,825,139 - - 13,100,992 12,825,139
On-balance sheet financial assets 89,042 88,523 - - 89,042 88,523
On-Balance Sheet Technical Reserves 12,119,036 12,735,460 - - 12,119,036 12,735,460
Intercompany liabilities* - - - - - -
Total Liabilities 12,208,077 12,823,983 - - 12,208,077 12,823,983
* Asset and liabilites eliminated upon consolidation

177
SCHEDULES
€/’000
Insurance Reinsurance Book value
FY 2012 FY 2011 FY 2012 FY 2011 FY 2012 FY 2011
General business reserves - - - - - -
Unearned premiums - - - - - -
Outstanding claims - - - - - -
Other reserves - - - - - -
of which amounts set aside following liability adequacy testing - - - - - -
Life business reserves 17,823,829 18,632,275 - - 17,823,829 18,632,275
Outstanding claims 183,262 134,529 - - 183,262 134,529
Mathematical reserves 4,648,989 5,755,113 - - 4,648,989 5,755,113
Technical reserves for contracts underwhich the investment risk is borne bythe policyholder and for pension fund management 12,978,601 12,735,460 - - 12,978,601 12,735,460
Other reserves 12,977 7,173 - - 12,977 7,173
of which amounts set aside following liability adequacy testing - - - - - -
of which deferred liabilities to policyholders - - - - - -
Total Technical Reserves 17,823,829 18,632,275 - - 17,823,829 18,632,275
Analysis of technical reserves

178
CONSOLIDATED ANNUALFINANCIAL STATEMENTS
2012
Analysis of financial liabilities
Analysis of technical account items
€/’000
Financial liabilities at fair value through profit or loss
Financial liabilitiesheld for trading
Financial liabilitiesat fair value through profit or loss
FY 2012 FY 2011 FY 2012 FY 2011
Quasi-equity instruments - - - -
Subordinated liabilities - - - -
Liabilities under financial contracts issued by insurance companies of which - - 89,042 80,383
contracts under which the investment risk is borne by the policyholder - - 89,042 80,383
pension fund management - - - -
other contracts - - - -
Deposits received from reinsureres - - - -
Financial liabilities of insurance contracts - - - -
Debt securities issued - - - -
Amounts due to banking customers - - - -
Amounts due to banks - - - -
Other financing received - - - -
Trading derivatives 25,444 21,087 - -
Hedging derivatives - - 92,888 67,896
Other financial liabilities 235,672 320,258 - -
Total 261,116 341,345 181,930 148,279
€/’000
FY 2012
Gross Reinsurers’ share Net
General Business
PREMIUMS WRITTEN - - -
a Premiums written - - -
b Change in unearned premiums reserve - - -
CLAIMS INCURRED - - -
a Claims paid - - -
b Change in outstanding claims reserve - - -
c Change in recoveries - - -
d Change in other technical reserves - - -
Life Business
PREMIUMS WRITTEN 8,056,974 3,301 8,053,673
AMOUNTS PAID AND CHANGE IN TECHNICAL RESERVES 9,398,399 8,852 9,389,547
a Amounts paid 10,204,814 21,928 10,182,886
b Change in outstanding claims reserve 47,902 (1,386) 49,288
c Change in mathematical reserves (1,105,452) (11,690) (1,093,762)
d Change in technical reserves for contracts under which the investment risk is borne by the policy holder and for pension fund management 251,669 - 251,669
e Change in other technical reserves (534) - (534)

179
SCHEDULES
Other financial liabilities Book value
FY 2012 FY 2011 FY 2012 FY 2011
- - - -
- - - -
- - 89,042 80,383
- - 89,042 80,383
- - - -
- - - -
75,875 87,565 75,875 87,565
- - - -
432,404 524,884 432,404 524,884
10,983,468 6,942,439 10,983,468 6,942,439
3,813,632 5,602,538 3,813,632 5,602,538
- - - -
- - 25,444 21,087
- - 92,888 67,896
185,778 212,113 421,450 532,371
15,491,157 13,369,539 15,934,203 13,859,163
FY 2011
Gross Reinsurers’ share Net
- - -
- - -
- - -
- - -
- - -
- - -
- - -
- - -
9,549,168 4,347 9,544,821
9,043,533 5,468 9,038,065
10,951,530 12,368 10,939,162
17,527 744 16,783
(539,971) (7,644) (532,327)
(1,368,059) - (1,368,059)
(17,494) - (17,494)
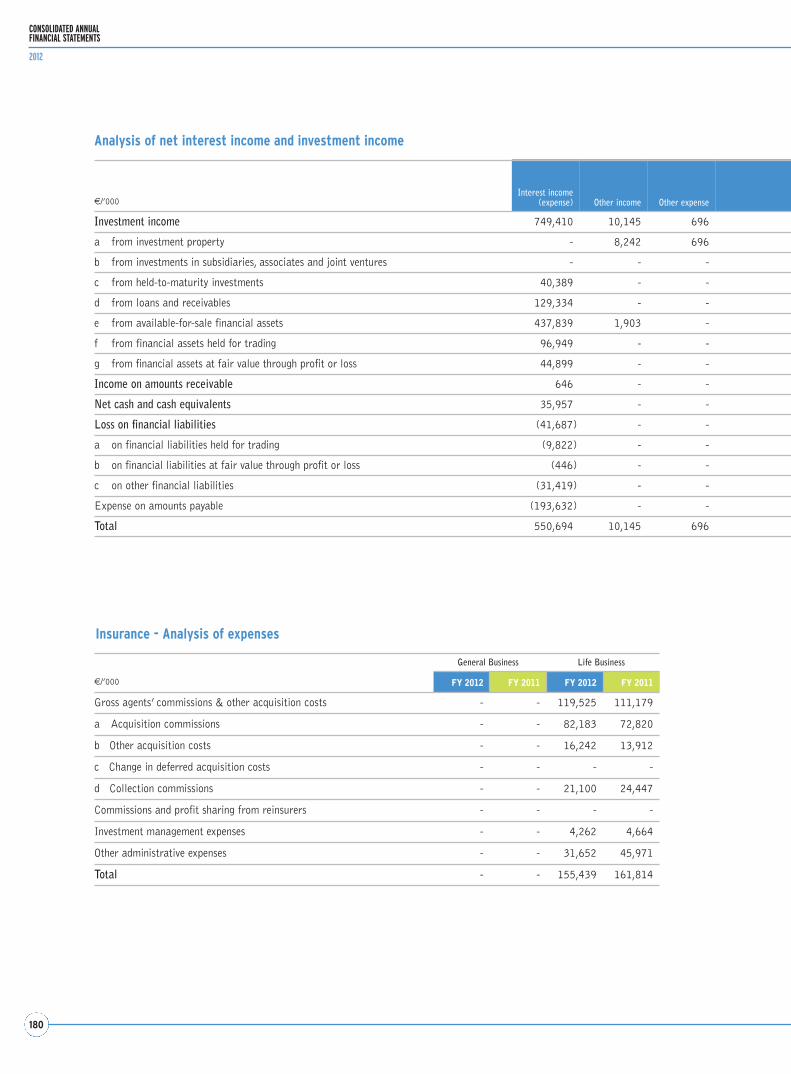
180
CONSOLIDATED ANNUALFINANCIAL STATEMENTS
2012
Analysis of net interest income and investment income
€/’000Interest income
(expense) Other income Other expense
Investment income 749,410 10,145 696
a from investment property - 8,242 696
b from investments in subsidiaries, associates and joint ventures - - -
c from held-to-maturity investments 40,389 - -
d from loans and receivables 129,334 - -
e from available-for-sale financial assets 437,839 1,903 -
f from financial assets held for trading 96,949 - -
g from financial assets at fair value through profit or loss 44,899 - -
Income on amounts receivable 646 - -
Net cash and cash equivalents 35,957 - -
Loss on financial liabilities (41,687) - -
a on financial liabilities held for trading (9,822) - -
b on financial liabilities at fair value through profit or loss (446) - -
c on other financial liabilities (31,419) - -
Expense on amounts payable (193,632) - -
Total 550,694 10,145 696
Insurance - Analysis of expenses
€/’000
General Business Life Business
FY 2012 FY 2011 FY 2012 FY 2011
Gross agents’ commissions & other acquisition costs - - 119,525 111,179
a Acquisition commissions - - 82,183 72,820
b Other acquisition costs - - 16,242 13,912
c Change in deferred acquisition costs - - - -
d Collection commissions - - 21,100 24,447
Commissions and profit sharing from reinsurers - - - -
Investment management expenses - - 4,262 4,664
Other administrative expenses - - 31,652 45,971
Total - - 155,439 161,814

181
SCHEDULES
Realisedgains
Realisedlosses Total
Unrealised gains Unrealised losses
Total
Net income (loss)
for FY 2012
Net income (loss)
for FY 2011Gains on
measurementReversal ofimpairment
Losses onmeasurement
Impairmentlosses
294,987 127,568 926,278 1,168,874 4,623 72,487 80,398 1,020,612 1,946,890 (403,753)
- - 7,546 - - - 1,558 (1,558) 5,988 5,645
7,483 - 7,483 - - - 62,703 (62,703) (55,220) (34,582)
30 - 40,419 - - - - - 40,419 36,556
237 228 129,343 - 4,623 - 13,714 (9,091) 120,252 124,474
47,225 25,415 461,552 - - - 2,423 (2,423) 459,129 92,798
109,708 20,654 186,003 52,077 - 9,712 - 42,365 228,368 18,393
130,304 81,271 93,932 1,116,797 - 62,775 - 1,054,022 1,147,954 (647,037)
- - 646 - - - 34 (34) 612 660
- - 35,957 - - - - - 35,957 61,356
4,589 1,266 (38,364) 11,886 - 2,834 - 9,052 (29,312) 591
4,471 1,263 (6,614) 953 - 2,834 - (1,881) (8,495) (16,558)
- - (446) 10,933 - - - 10,933 10,487 44,095
118 3 (31,304) - - - - - (31,304) (26,946)
- - (193,632) - - - - - (193,632) (122,087)
299,576 128,834 730,885 1,180,760 4,623 75,321 80,432 1,029,630 1,760,515 (463,233)

182
CONSOLIDATED ANNUALFINANCIAL STATEMENTS
2012
Analysis of other components of statement of other comprehensive income
Analysis of reclassified financial assets and effects on profit (loss) and statement of other comprehensive income
€/’000
Recognition
Adjustments owed to reclassification to the
income statement
FY 2012 FY 2011 FY 2012 FY 2011
Net exchange differences reserve - - - -
Profit (loss) on available for sale financial assets 361,882 (262,077) 10,286 48,726
Profit (loss) on cash flow hedges - - - -
Profit (loss) on hedges of investments in foreign operations - - - -
Changes in the equity of investees 28,171 (19,100) - -
Changes in intangible assets revaluation reserve - - - -
Changes in tangible assets revaluation reserve - - - -
Gains (losses) on non-current assets or disposal groups held for sale - - - -
Actuarial gains (losses) and adjustments on defined benefit plans - - - -
Other - - - -
Total other componentsof statement of other comprehensive income 390,053 (281,177) 10,286 48,726
€/’000
Category of reclassified financial assetsType of assets
Amount of assets reclassified
in FY 2012on re-classification
date
Book value of reclassified assets at Dec. 31, 2012
Fair value ofreclassified assets at Dec. 31, 2011
Assets reclassified in the year n
Assets reclassified
up until the year n
Assets reclassified
in the year n
Assets reclassified
up until the year n
from to
HFT AFS Debt securities - - 141,144 - 141,144
HFT Loans & Receivables Debt securities - - 28,301 - 27,451
Total - - 169,445 - 168,595

183
SCHEDULES
Other changes Total changes Taxation Balance
FY 2012 FY 2011 FY 2012 FY 2011 FY 2012 FY 2011 FY 2012 FY 2011
- - - - - - - -
- - 372,168 (213,351) 185,054 109,260 88,984 (283,184)
- - - - - - - -
- - - - - - - -
- - 28,171 (19,100) - - 31,372 3,201
- - - - - - - -
- - - - - - - -
- - - - - - - -
- - - - - - - -
- - - - - - - -
- - 400,339 (232,451) 185,054 109,260 120,356 (279,983)
Assets reclassified in FY 2012
Assets reclassified up until FY 2012
Assets reclassified in FY 2012
Assets reclassifiedup until FY 2012
Profit or loss recognised in the income
statement
Profit or loss
recognised under other
statement of other comprehensive income
components
Profit or loss recognised in the income
statement
Profit or loss recognised under other
statement of other comprehensive income
components
Profit or loss that wouldhave been recognised inthe income statement
if no re-classification hadbeen made
Profit or loss that would have been
recognised under other statement of other
comprehensive incomecomponents if no re-classification had been made
Profit or loss that wouldhave been recognised inthe income statement
if no re-classification hadbeen made
Profit or loss that would have been
recognised under other statement of other
comprehensive incomecomponents if no
re-classification had been made
- - - 4,160 - - - 10,873
- - - 1,175 - - - 2,119
- - - 5,335 - - - 12,992

184
CONSOLIDATED ANNUALFINANCIAL STATEMENTS
2012
Fair value hierarchy of financial assets and financial liabilities
Analysis of movements in level 3 financial assets and liabilities
€/’000
Available for sale financial assets
Financial assets at fair value through profit or lossFinancial assets held for trading
Financial assets at fair value
Total
Financial liabilities at fair value through profit or lossFinancial liabilities held for trading
Financial liabilities at fair value
Total
€/’000
Financial Assets Financial liabilities at fair value
through profit or loss
Available for salefinancial assets
Financial assets at fair valuethrough profit or loss
Held for trading At fair value Held for trading At fair value
Opening balance 110,118 39,756 791,113 3,861 -
Purchases/Issues 12,633 104,096 594,669 - -
Sales/Buybacks (20,777) (123,007) (578,954) - -
Redemptions - (75) - - -
Gains or losses recognised in the incomestatement (857) 1,324 105,198 (318) -
Gains or losses recognised in other components of statement of other comprehensive income (5,946) - - - -
Transferred to level 3 - - - - -
Transferred to other level (622) (5,039) - - -
Other changes 903 (9,281) (11,497) (1,576) -
Closing balance 95,452 7,774 900,529 1,967 -

185
SCHEDULES
Level 1 Level 2 Level 3 Total
FY 2012 FY 2011 FY 2012 FY 2011 FY 2012 FY 2011 FY 2012 FY 2011
11,759,893 8,387,380 463,724 564,908 95,452 110,118 12,319,069 9,062,406
1,180,778 2,752,157 32,937 116,003 7,774 39,756 1,221,489 2,907,916
9,800,501 9,051,992 2,268,591 2,888,501 900,529 791,113 12,969,621 12,731,606
22,741,172 20,191,529 2,765,252 3,569,412 1,003,755 940,987 26,510,179 24,701,928
235,672 320,066 23,477 17,418 1,967 3,861 261,116 341,345
46,090 27,839 120,044 120,440 15,795 - 181,930 148,279
281,762 347,905 143,521 137,858 17,762 3,861 443,045 489,624


IndependentAuditors’Report

188

189


SeparateAnnualFinancialStatements
2012
192
SEPARATE ANNUALFINANCIAL STATEMENTS
2012
Dear Shareholder,
The separate financial statements for the year ended December 31, 2012 that we present for your approval show
net profit of €133.6 million versus €159.6 million in the prior year.
The bottom line was impacted by the €19.8 million one-off impairment on the stake held in Mediobanca. Given
Mediobanca stock performance during 2012, last October Mediolanum decided to review for impairment the value
of its stake therein before the end of the financial year. Availing itself of the assistance of an independent valuer,
Mediolanum tested for impairment the value of its stake in Mediobanca at September 30, 2012 applying the
Dividend Discount Model (DDM) in the Excess Capital variant. The recoverable amount of the stake in Mediobanca
was found to range between €9.3 and €9.8 per share, with a median value of €9.5 per share. Based on said valu-
ation, the Board of Directors of Mediolanum S.p.A. resolved to proceed to write down the value of the stake in
Mediobanca in the interim accounts at September 30, 2012 to €9.5 per share.
At year end, impairment review was again undertaken to determine the recoverable amount of the investment in
Mediobanca at December 31, 2012. To that end, Mediolanum S.p.A. requested again the assistance of an independ-
ent valuer. This time the recoverable amount of the stake in Mediobanca was found to range between €9.76 and
€10.39 per share, with a median value of €10.05 per share. Based on said valuation, the Board of Directors of
Mediolanum S.p.A. resolved to carry the value of the stake in Mediobanca at €10.05 per share in the accounts at
December 31, 2012.
BUSINESS REVIEW
In the year under review, to enable the subsidiary Banca Mediolanum S.p.A. to take all opportunities for profitable
business growth, also in view of the upcoming Basel III requirements, it was decided to strengthen its capital base.
To that end, pursuant to the relevant resolution made by the Board of Directors on July 26, 2012 and notified to the
Bank of Italy by letter dated July 31, 2012, Mediolanum S.p.A. injected €25,000,000 into the subsidiary on March
14, 2012 and September 28, 2012. Additionally, on November 6, 2012, the Extraordinary General Meeting of Banca
Mediolanum S.p.A. approved the proposal for a capital increase in one or more occasions from €500,000,000 to
€700,000,000, setting December 31, 2014 as the final date for subscription thereto, as well as the subsequent
amendment to art. 6 of the Bylaws, as per Bank of Italy’s procedures under articles 56 and 61 of Legislative Decree
385/93 (Consolidated Banking Act). On December 5, 2012 Mediolanum S.p.A. proceeded to make an initial injec-
tion of €100,000,000 as a result of which Banca Mediolanum’s share capital increased to €600,000,000.
In 2012, dividends from subsidiaries and associates aggregated to €177.5 million versus €180.3 million in the prior
year. The balance includes interim dividends of €108 million (€53.1 million in the prior year).
At year end 2012, the company recorded losses on investments in subsidiaries aggregating to €26 thousand (FY
2011: losses of €339 thousand) and impairment of investments in associates (Mediobanca) of €19.8 million, as
already been commented above.
Directors’ Report
193
DIRECTORS’REPORT
In the year under review, the company recorded impairment of loans aggregating to €185.3 thousand. In the prior
year, the company had recorded €775.8 thousand impairment on available for sale financial assets.
Amounts due to banks were down €99.1 million to €302.1 million from €401.2 million at year end 2011.
Following issues made during the year, Mediolanum notes issued increased by €98.6 million to €337.7 million at
year end 2012 from €239.1 million at year end 2011.
Interest expense amounted to €21.4 million versus €14.7 million in the prior year. The year-on-year increase was
mostly due to higher interest rates resulting from bigger interest rate spreads in the market. Interest income stood
at €6.6 million, in line with the prior year, and was largely earned (€5.4 million) on the €120 million subordinat-
ed loan extended to the subsidiary Mediolanum Vita S.p.A..
At December 31, 2012, staff costs and other administrative expenses aggregated to €10.3 million versus €10.0
million at the end of the prior year.
For financial year 2012 the company reported other net income of €0.7 million up from 0.5 million in the prior
year.
Income tax for the year was a positive balance of €0.5 million versus a negative balance of €2.0 million in the
prior year.
For information on the performance of the companies that are part of the Mediolanum Group, readers are referred
to the Directors’ Report in the consolidated financial statements.
Acquisition of entire shareholding
On September 11, 2012, the Board of Directors of Mediolanum S.p.A. resolved to proceed to acquire the entire
share capital of Mediolanum Assicurazioni S.p.A..
Being the sellers the majority shareholders of both Mediolanum S.p.A. (the ‘acquirer’) and Mediolanum
Assicurazioni S.p.A. (the ‘acquiree’), pursuant to article 4 of the Procedures under Consob Resolution No. 17221,
the transaction qualified as a related-party transaction of lesser significance, and as such, pursuant to paragraph
7.1 of said Procedures, it was subject to Mediolanum S.p.A. Audit Committee’s prior positive opinion, which was
given by unanimous vote.
The acquisition is a strong complementary fit for the Mediolanum Group.
Mediolanum Assicurazioni S.p.A. is an entity operating in the insurance and reinsurance markets with a retail offer-
ing made up of a suite of non-life (excluding Motor TPL) standard-contract insurance products for the protection
of individuals, households, equity and assets.
At December 31, 2011, Mediolanum Assicurazioni S.p.A. reported net profit of €2.6 million, shareholder’s equity
of €32.6 million and premiums written of €25.3 million.
The €35.9 million consideration initially agreed by the parties was based on Mediolanum Assicurazioni S.p.A.’s
accounts and the value of its in-force business at March 31, 2012, and backed by PriceWaterhouseCoopers Advisory
S.p.A.’s valuation of the company’s entire capital.
Mediolanum S.p.A. received the approval of the insurance regulator (IVASS, previously named ISVAP) on March
19, 2013, hence the final consideration will be determined based on Mediolanum Assicurazioni S.p.A.’s accounts
and the value of its in-force business at March 31, 2013.
194
SEPARATE ANNUALFINANCIAL STATEMENTS
2012
Impairment test
Investments in subsidiaries that are part of the Mediolanum Group are carried at historical values which are sig-
nificantly lower than their value in use. In connection therewith, you are advised that the Mediolanum Group aver-
age stock market value in 2012 was 2x its equity book value.
As to the investment in Mediobanca, to determine its recoverable amount for impairment review purposes,
Mediolanum S.p.A. requested the assistance of a specialist valuation firm. Recoverable amount was determined
using the dividend discount model in the excess capital variant. Due to the lack of future plans approved by the
Board of Directors of Mediobanca, the financial projections used for impairment testing were derived from recent
research done by financial analysts. For details you are referred to the consolidated financial statements.
The recoverable amount of the stake in Mediobanca calculated applying the dividend discount model in the excess
capital variant was found to range between €9.3 and €9.8 per share, with a median value of €9.5 per share. Based
on said valuation, the Board of Directors of Mediolanum S.p.A. resolved to proceed to write down the value of the
stake in Mediobanca in the interim accounts at September 30, 2012 to €9.5 per share.
At year end, impairment review was again undertaken to determine the recoverable amount of the investment in
Mediobanca at December 31, 2012. To that end, Mediolanum S.p.A. requested again the assistance of an independ-
ent valuer. This time the recoverable amount of the stake in Mediobanca was found to range between €9.76 and
€10.39 per share, with a median value of €10.05 per share. Based on said valuation, the stake in Mediobanca was
carried at €10.05 per share in the consolidated accounts at December 31, 2012. The impairment recognised for
financial year 2012 on the investment in Mediobanca aggregated to €19.8 million.
As to Banca Esperia, for the purpose of impairment review at December 31, 2012, Directors considered that the
company’s equity approximated its carrying amount and also used as reference the appraisal at June 30, 2012,
requested by Banca Esperia to determine the exercise price of the Private Bankers Stock Options Plan and issued
by the independent specialist firm on December 10, 2012. The appraisal used the following assumptions: going con-
cern, growth at a normal rate, materialisation of the assumptions and attainment of the goals set out in the fore-
casts for 2012 and the Business Plan for 2013-2015.
Said valuation indicated a value per share of €2.05, which was more than twice the carrying amount of the invest-
ment at December 31, 2012 (€0.9 per share). It was therefore concluded there was no impairment of the invest-
ment in Banca Esperia.
Issues of Mediolanum notes
Pursuant to the resolution passed by the Mediolanum S.p.A. Board of Directors at its Meeting of July 31, 2012,
for the purpose of diversifying debt facilities and support subsidiaries’ business growth, non-convertible notes, either
fixed or floating rate with a floor or equity-linked, were offered to the public.
Key information on the note issues:
• 1-year Fixed Rate Notes • Amount of issue: up to €55 million (nominal value).
• Minimum subscription amount: €100,000 per investor, per separate issue.
• Principal repayment: lump sum at maturity.

195
DIRECTORS’REPORT
• Coupons: biannual, corresponding to 3.75% gross annual yield.
• Settlement date: November 14, 2012.
• Maturity date: November 14, 2013.
• 2-year Fixed Rate Notes• Amount of issue: up to €45 million (nominal value).
• Minimum subscription amount: €100,000 per investor, per separate issue.
• Principal repayment: lump sum at maturity.
• Coupons: biannual, corresponding to 4.00% gross annual yield.
• Settlement date: November 14, 2012.
• Maturity date: November 14, 2014.
As of December 31, 2012, Mediolanum S.p.A. non-convertible notes issued aggregated to €337.2 million (nomi-
nal value):
• €49.4 million (nominal value) notes due April 29, 2014, bearing interest at a rate of 3.5%;
• €48.9 million (nominal value) notes due April 29, 2014, bearing interest at 6-month EURIBOR + 1%;
• €48.3 million (nominal value) notes due May 20, 2013, bearing interest at 3.15%;
• €47.8 million (nominal value) notes due May 20, 2015, bearing interest at 6-month EURIBOR;
• €24.4 million (nominal value) notes due May 31, 2013, bearing interest at 3.15%;
• €20.4 million (nominal value) notes due May 31, 2015, bearing interest at 6-month EURIBOR;
• €54.1 million (nominal value) notes due November 14, 2013, bearing interest at 3.75%;
• €43.9 million (nominal value) notes due November 14, 2014, bearing interest at 4.00%.
Disclosures pursuant to Document No. 4 of March 3, 2010 jointly issued by the Bank of Italy, CONSOB and ISVAP
For information on disclosures pursuant to the document jointly issued by the Bank of Italy, CONSOB and ISVAP
on March 3, 2010, readers are referred to the Directors’ Report and the Notes to the consolidated financial state-
ments.
Main risks and uncertainties
For information about the risks and uncertainties to which the Mediolanum Group is exposed readers are referred
to the Directors’ Report and the Notes to the consolidated financial statements.
Other information
Pursuant to the resolution passed at the Annual General Meeting held on April 21, 2011, Mediolanum S.p.A. sep-
arate accounts are audited by Deloitte & Touche S.p.A..

SEPARATE ANNUALFINANCIAL STATEMENTS
2012
196
Treasury Shares
The company holds 385,000 treasury shares aggregating to €2.0 million (0.052% of share capital). During the
year there were no movements in treasury shares.
Post balance sheet date events
In the period between December 31, 2012 and the date on which these financial statements were approved there
was no material event other than those commented in the same section of the Directors Report, which could have
a significant impact on the financial positions, results of operations or cash flows of the company.
Outlook
Excluding post balance sheet date events, considering the risks that are inherent in the business, barring any excep-
tional events or circumstances that depend on variables essentially outside the control of Directors and Senior
Management – and not in the offing at present – the outlook for the year 2013 is positive.
Information on Stock Option Plans
On May 10, 2012, by virtue of the authorities delegated to it by the Extraordinary General Meeting of April 27,
2010, as amended by resolution passed by the shareholders at the Ordinary and Extraordinary General Meeting of
April 19, 2012, the Board of Directors of Mediolanum S.p.A. resolved:
• to increase the Company’s share capital by a maximum amount of €186,405.00, for a consideration, by issuing
up to 1,864,050 dividend-bearing ordinary shares, par value of €0.1 each, with the exclusion of shareholders’
pre-emptive rights pursuant to article 2441, paragraph five, of the Italian Civil Code, as they are reserved to the
Directors and executives of the company and its subsidiaries pursuant to article 2359 paragraph 1, N. 1, of the
Italian Civil Code, setting as final deadline for share subscription the fifth business day in the thirty-sixth calen-
dar months subsequent to the expiration of the three year term from the date of the capital increase resolution;
• to increase the Company’s share capital by a maximum amount of €70,840.00, for a consideration, by issuing
up to 708,400 dividend-bearing ordinary shares, par value of €0.1 each, with the exclusion of shareholders’ pre-
emptive rights pursuant to article 2441, paragraph five, of the Italian Civil Code, as they are reserved to the sales
network of the company and its subsidiaries pursuant to article 2359 paragraph 1, N. 1, of the Italian Civil Code,
setting as final deadline for share subscription the fifth business day in the thirty-sixth calendar months subse-
quent to the expiration of the nine year term from the date of the capital increase resolution.
197
DIRECTORS’REPORT
Dear Shareholder,
We assure you that the financial statements for the year ended December 31, 2012 presented to you for examina-
tion and approval were prepared in compliance with the law in force.
In requesting your approval of the financial statements including this report, we propose the following appropria-
tion of the year’s net profit of €133,619,860.24:
• distribution of a full-year dividend of €0.18 per share (par value of €0.10) to the shareholders, including the
interim dividend of €0.10 paid in November 2012. The final dividend of €0.08 per share will be due for pay-
ment from May 23, 2013 (ex-dividend date May 20, 2013). Said dividend will not be payable for treasury shares
held after the close of business on May 17, 2013;
• the remainder to the Extraordinary Reserve as the legal reserve has already reached the statutory limit.
Basiglio, March 21, 2013
For the Board of Directors
The Chairman
(Secchi Carlo)


Accounts
2012

200
SEPARATE ANNUALFINANCIAL STATEMENTS
2012
Statement of financial positionAssets€ Dec. 31, 2012 Dec. 31, 2011
Non current assets
Intangible assets 2,117 2,686
Tangible assets 33,357 58,301
Investments in subsidiaries and associates 1,124,448,592 994,291,547
Loans to subsidiaries 120,073,973 120,073,973
Available-for-sale financial assets 19,972,124 19,349,466
Total Non current assets 1,264,530,162 1,133,775,973
Current assetsReceivables from
Subsidiaries 761,244 709,593
Related parties 60,570 20,570
Others 15,113,404 1,415,486
Cash and cash equivalentsBank deposits 26,070,273 135,371,624
Cash 10,440 9,666
Tax AssetsCurrent 165,933,754 118,350,809
Deferred 6,749,361 3,516,330
Other assets 1,965 610,738
Total Current assets 214,701,012 260,004,816
TOTAL ASSETS 1,479,231,174 1,393,780,789

201
ACCOUNTS
Shareholders’ equity and liabilities€ Dec. 31, 2012 Dec. 31, 2011
Shareholders’ equity and liabilities
Capital and reservesShare capital 73,433,792 73,381,937
Treasury shares (2,045,116) (2,045,116)
Share premium account 56,496,878 56,013,083
Lehman Brothers operation equity reserve 84,692,746 84,692,746
Retained earnings 328,252,650 271,262,249
Valuation reserve for AFS financial instruments 614,096 -
Net profit (loss) for the period 133,619,860 159,592,247
Total Capital and reserves 675,064,906 642,897,146
Non current liabilitiesCompletion-of-service entitlements 521,545 501,167
Notes issued 210,542,479 239,076,737
Total Non current liabilities 211,064,024 239,577,904
Current liabilitiesPayables
Due to banks 302,149,384 401,215,060
Notes issued 127,141,091 -
Due to subsidiaries 528,589 402,744
Due to other related parties 93,163 146,432
Other payables 2,108,149 1,293,740
Tax liabilitiesCurrent 160,451,931 107,709,479
Deferred 14,766 6,205
Other liabilities 615,171 532,079
Total Current liability 593,102,244 511,305,739
TOTAL LIABILITIES 804,166,268 750,883,643
TOTAL SHAREHOLDERS’ EQUITY AND LIABILITIES 1,479,231,174 1,393,780,789

202
SEPARATE ANNUALFINANCIAL STATEMENTS
2012
€ Dec. 31, 2012 Dec. 31, 2011
Dividends and similar income from subsidiaries 176,270,997 176,310,295
from associates 1,132,236 3,849,601
from available for sale financial assets 55,359 124,559
Interest income and similar income 6,614,433 6,635,593
Interest expense and similar charges (21,416,951) (14,663,310)
Net income from trading 64 -
Impairment/reversal of impairment of: investments in associates (19,816,936) -
available for sale financial assets - (775,834)
loans and other financial instruments (185,268) -
NET INCOME FROM FINANCIAL OPERATIONS 142,653,934 171,480,904
Staff costs (4,580,394) (3,918,829)
Other administrative expenses (5,671,220) (6,070,224)
Amortisation and depreciation intangible assets (570) (1,156)
tangible assets (24,944) (28,094)
Other income (expenses) 700,334 517,397
OPERATING EXPENSES (9,576,793) (9,500,906)
Profit (loss) on investments in subsidiaries, associates and joint-ventures (26,019) (339,146)
PROFIT (LOSS) BEFORE TAX ON CONTINUING OPERATIONS 133,051,122 161,640,852
Income tax 568,738 (2,048,605)
PROFIT (LOSS) AFTER TAX ON CONTINUING OPERATIONS 133,619,860 159,592,247
NET PROFIT (LOSS) FOR THE PERIOD 133,619,860 159,592,247
EARNINGS PER SHARE 0.182 0.217
Income Statement
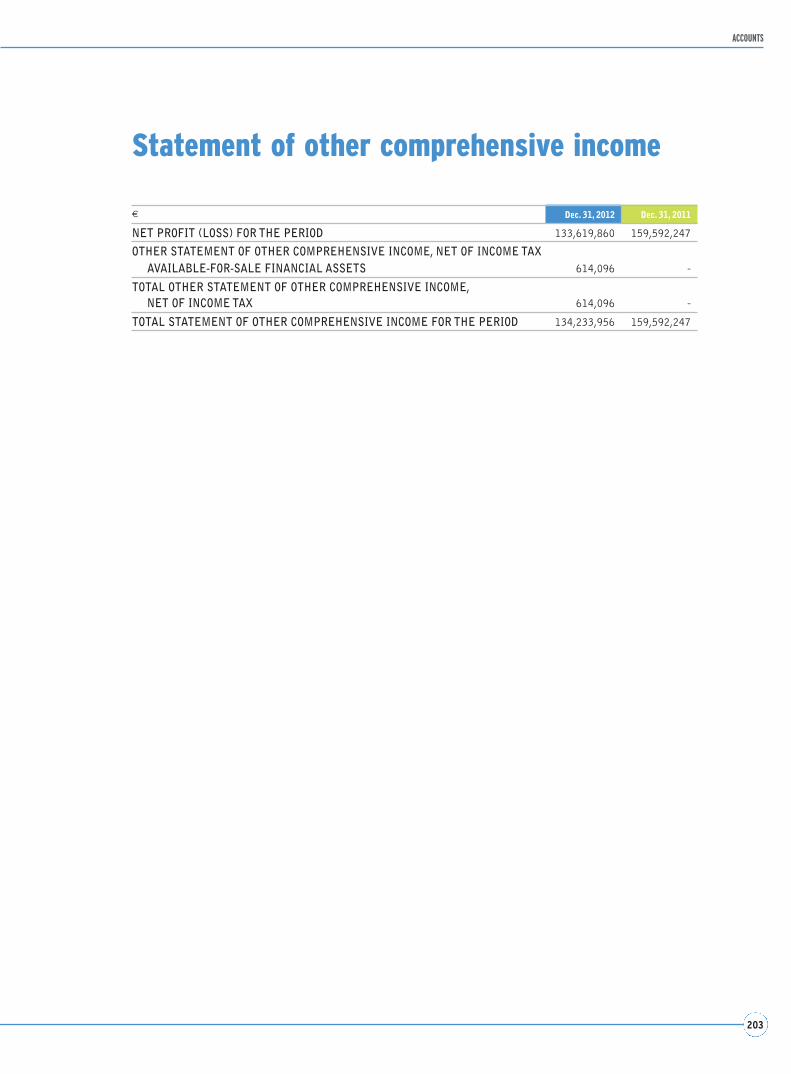
203
ACCOUNTS
€ Dec. 31, 2012 Dec. 31, 2011
NET PROFIT (LOSS) FOR THE PERIOD 133,619,860 159,592,247
OTHER STATEMENT OF OTHER COMPREHENSIVE INCOME, NET OF INCOME TAXAVAILABLE-FOR-SALE FINANCIAL ASSETS 614,096 -
TOTAL OTHER STATEMENT OF OTHER COMPREHENSIVE INCOME, NET OF INCOME TAX 614,096 -
TOTAL STATEMENT OF OTHER COMPREHENSIVE INCOME FOR THE PERIOD 134,233,956 159,592,247
Statement of other comprehensive income

204
SEPARATE ANNUALFINANCIAL STATEMENTS
2012
Statement of changes in equity
€
Balance atJan. 1, 2012
Appropriation ofprior year’s profit
ReservesDividends and other
Share capital 73,381,937 - -
Share premium account 56,013,083 - -
Reserves:
a) retained earnings 271,262,249 130,254,872 -
b) other 84,692,746 - -
Valuation reserves:
a) AFS fin. instruments - - -
Treasury shares (2,045,116) - -
Net profit (loss) 159,592,247 (130,254,872) (29,337,375)
Shareholders’ equity 642,897,146 - (29,337,375)
€
Balance atJan. 1, 2011
Appropriation ofprior year’s profit
ReservesDividends and other
Share capital 73,287,996 - -
Share premium account 55,086,936 - -
Reserves:
a) retained earnings 257,874,516 64,657,786 -
b) other 84,692,746 - -
Valuation reserves
a) AFS fin. instruments 80,279 - -
Treasury shares (2,045,116) - -
Net profit (loss) 115,932,434 (64,657,786) (51,274,648)
Shareholders’ equity 584,909,791 - (51,274,648)
as of December 31, 2012
as of December 31, 2011

205
ACCOUNTS
Movements in the year
Shareholders’equity at
Dec. 31, 2012Change
in reserves
Shareholders’ Equity
Net profit for the year
Dec. 31, 2012Shareissues
Purchase oftreasury shares
Extraordinarydividends
distribution
Changein equity
instrumentsStock
options
- 51,855 - - - - - 73,433,792
- 483,795 - - - - - 56,496,878
- - - (73,388,286) - 123,815 - 328,252,650
- - - - - - - 84,692,746
- - - - - - 614,096 614,096
- - - - - - - (2,045,116)
- - - - - - 133,619,860 133,619,860
- 535,650 - (73,388,286) - 123,815 134,233,956 675,064,906
Movements in the year
Shareholders’equity at
Dec. 31, 2011Change
in reserves
Shareholders’ Equity
Net profit for the year
Dec. 31, 2011Shareissues
Purchase oftreasury shares
Extraordinarydividends
distribution
Changein equity
instrumentsStock
options
- 93,941 - - - - - 73,381,937
- 926,147 - - - - - 56,013,083
- - - (51,337,341) - 67,288 - 271,262,249
- - - - - - - 84,692,746
- - - - - - (80,279) -
- - - - - - - (2,045,116)
- - - - - - 159,592,247 159,592,247
- 1,020,088 - (51,337,341) - 67,288 159,511,968 642,897,146

206
SEPARATE ANNUALFINANCIAL STATEMENTS
2012
€/’000 Dec. 31, 2012 Dec. 31, 2011
Profit (loss) before tax for the period 133,051 161,641
Changes in non-monetary itemsCompletion-of-service entitlements 189 176
Amortisation and depreciation 26 29
Stock Options 124 67
Other 19,843 3,615
Changes in receivables and payables relating to operating activitiesChanges in other receivables and payables (9,885) (4,046)
Paid taxes - -
Net cash from monetary items relating to investment and financialactivities - -
NET CASH FROM OPERATING ACTIVITIES 143,348 161,482
Net cash from subsidiaries, associates and joint venture (150,000) (25,250)
Net cash from available-for-sale financial assets - -
Net cash from tangible and intangible assets - -
Other cash flows from investment activities - -
NET CASH FROM INVESTING ACTIVITIES (150,000) (25,250)
Net cash from equity instruments 536 1,020
Net cash from treasury shares - -
Distribution of dividends (102,727) (102,612)
Net cash from subordinated liabilities - -
Net cash from other financial liabilities (459) 84,821
NET CASH FROM FINANCING ACTIVITIES (102,650) (16,771)
Effect of exchange rate changes on cash and cash equivalents - -
Cash and cash equivalents at beginning of the period 135,382 15,921
Net increase (decrease) in cash and cash equivalents (109,302) 119,461
Cash and cash equivalents at end of the period 26,080 135,382
Statement of cash flowIndirect method

Notes to theSeparateAnnualFinancialStatements
2012

208
SEPARATE ANNUALFINANCIAL STATEMENTS
2012
These notes are structured as follows:
Part A – Accounting Basis
Part B – Accounting policies
Part C – Information on the statement of financial position
Part D – Information on the income statement
Part E – Segmental information
Part F – Information on risks and risk management
Part G – Business combinations
Part H – Related Party Transactions
Part I – Equity-settled share-based payment transactions
PART A – ACCOUNTING BASIS
Pursuant to Legislative Decree No. 38 of February 28, 2005, the Mediolanum S.p.A. separate financial statements
for the year ended December 31, 2012 were prepared in accordance with the International Accounting and Financial
Reporting Standards (IAS/IFRS) issued by the International Accounting Standards Board (IASB) and the related
interpretations of the International Financial Reporting Interpretations Committee (IFRIC) as adopted by the
European Commission pursuant to the European Parliament and Council Regulation (EC) 1606 of July 19, 2002.
The separate financial statements consist of the statement of financial position, the Income Statement, the
Statement of statement of other comprehensive income, the Statement of Changes in Equity, the Statement of Cash
Flows (Accounts) and these Explanatory Notes, which set out the information required under art. 2427 and other
articles of the Italian Civil Code on financial reporting as well as other applicable statutes.
The separate financial statements also include the Directors’ Report.
In accordance with art. 5 of Legislative Decree 38/2005 the separate financial statements were prepared using the
euro as reporting currency.
The amounts set out in the Accounts are presented in units of euro, while the amounts set out in the Notes and the
Directors’ Report are presented in thousands of euro except where otherwise stated.
The accounts and the notes also include comparative information for the year ended December 31, 2011.
The financial statements were prepared in compliance with the general requirements of IAS 1 and the specific
accounting standards adopted by the European Commission, as presented in Part B (Accounting Policies) herein,
as well as in compliance with the underlying assumptions set out in the IASB Framework for the Preparation and
Presentation of Financial Statements.
In applying IAS/IFRS, no departure was made from requirements therein.
Notes to the separate annual financial statements

209
NOTES TO THE SEPARATE ANNUALFINANCIAL STATEMENTS
PART B – ACCOUNTING POLICIES
This section presents the accounting policies applied in the preparation of the separate financial statements for the
year ended December 31, 2012.
The accounting policies applied in the preparation of the separate financial statements, with respect to the classifi-
cation, measurement, recognition and derecognition of the various items of assets and liabilities as well as the items
of income and expense, are consistent with those applied in the preparation of the separate financial statements for
the year ended December 31, 2011.
For information on new standards, interpretations and amendments to standards readers are referred to Part B
Accounting Policies in the Notes to the consolidated financial statements.
Equity investments
This account relates to investments in subsidiaries, associates and joint ventures carried at cost.
On initial recognition these investments are measured at cost, i.e. the fair value of the investment, plus any direct-
ly attributable transaction costs or income.
After initial recognition equity investments continue to be carried at cost.
If there is evidence that an investment may be impaired, its recoverable amount is calculated by estimating the pres-
ent value of future cash flows expected to be generated by the investment, including the proceeds on the ultimate
disposal of the investment.
If the recoverable amount is lower than the carrying amount, the resultant difference is recognised in the income
statement.
If the value of a previously impaired investment increases and the increase can be objectively related to an event
occurring after the impairment loss was recognised, the impairment loss is reversed and the reversal recognised in
the income statement.
Available for sale financial assets
Available-for-sale financial assets include non-derivative financial assets that are not classified as Loans and
Receivables, Financial Assets Held for Trading or Held-to-Maturity Investments.
In particular, shareholdings that are not held for trading and do not qualify as investments in subsidiaries, associ-
ates or joint ventures are also classified under this category.
Available-for-sale financial assets are initially recognised on the settlement date if they are debt or equity instru-
ments and on the date they are extended if they are loans or receivables.
On initial recognition available-for-sale financial assets are measured at cost, i.e. the fair value of the instrument,
plus any directly attributable transaction costs or income. When reclassified out of the Held-to-Maturity
Investments category, available-for-sale financial assets are re-measured at their fair value on such reclassification.
After initial recognition available-for-sale financial assets continue to be measured at fair value, and are amortised
through profit or loss, while gains or losses arising from a change in their fair value are recognised in a specific
equity reserve until the financial asset is derecognised or impaired. At the time of their dismissal or impairment, the
cumulative gain or loss previously recognised in equity is recognised in the income statement.
210
SEPARATE ANNUALFINANCIAL STATEMENTS
2012
Equity instruments whose fair value cannot be reliably measured as set out above are measured at cost.
At each interim and annual statement of financial position date the Company assesses whether there is objective
evidence of any impairment loss.
If the fair value of a previously impaired asset increases and the increase can be objectively related to an event
occurring after the impairment loss was recognised, the impairment loss is reversed and the reversal recognised in
the income statement if the asset is a loan or receivable or a debt instrument, and in equity if the asset is an equi-
ty instrument. The reversal shall not result in a carrying amount of the financial asset that exceeds what the amor-
tised cost would have been had the impairment loss not been recognised at the date the impairment is reversed.
Available-for-sale financial assets are derecognised when the contractual rights to the cash flows from the financial
asset expire or the financial asset and substantially all the risks and rewards of ownership thereof are transferred.
Loans and receivables
This account includes trade receivables.
A receivable is initially recognised on the billing date or due date.
At each interim and annual reporting date the Company assesses whether there is objective evidence of any impair-
ment loss as a result of one or more events that occurred after initial recognition.
An impaired account is individually assessed and the amount of the impairment loss is measured as the difference
between the asset’s carrying amount at the time of assessment and the present value of estimated future cash flows.
Future cash flows are estimated taking into account the expected time of recovery, the realisable value of any col-
laterals as well as any costs of recovery. Future cash flows of receivables which are expected to be recovered in the
short term are not discounted.
The amount of the impairment loss is recognised in the income statement.
If the value of a previously impaired loan or receivable increases and the increase can be objectively related to an
event occurring after the impairment loss was recognised, the impairment loss is reversed and the reversal recog-
nised in the income statement.
The reversal shall not result in a carrying amount of the financial asset that exceeds what the cost would have been
had the impairment loss not been recognised at the date the impairment is reversed.
Tangible assets
Tangible assets include furnishings, fixtures, fittings, plant and equipment.
These are tangible items that are held for use in the production or supply of goods or services, or for administrative
purposes and that are expected to be used during more than one period.
Tangible assets are initially recognised at cost, which comprises the purchase price of the asset and all costs direct-
ly attributable to the asset’s acquisition and operation.
The costs of major repairs which increase the future economic benefits associated with the asset are recognised in
the carrying amount of the asset, while the costs of day-to-day servicing are recognised in the income statement.
Tangible assets are carried at cost less any accumulated depreciation and impairment losses.
Tangible assets are systematically depreciated on a straight-line basis over their useful lives.
At each interim and annual reporting date if there is an indication that an asset may be impaired the carrying
amount of the asset is compared to its recoverable amount. The recoverable amount of an asset is the higher of its
211
NOTES TO THE SEPARATE ANNUALFINANCIAL STATEMENTS
fair value less costs to sell and its value in use. Value in use is the present value of the future cash flows expected
to be derived from an asset. If the recoverable amount of an asset is less than its carrying amount, the carrying
amount is reduced to its recoverable amount. Any reduction is recognised as impairment loss in the income state-
ment.
If the value of a previously impaired asset increases, the impairment loss is reversed. The reversal shall not result
in a carrying amount of the asset that exceeds what the carrying amount less accumulated depreciation would have
been had the impairment loss not been recognised at the date the impairment is reversed.
A tangible asset is derecognised from the statement of financial position on disposal or when no future economic
benefits are expected from its use or disposal.
Intangible assets
Intangible assets include the costs of software used over more than one year.
Other intangible assets are recognised if they are identifiable as such and arise from contractual or other legal
rights.
Other intangible assets are carried at cost less any accumulated amortisation and impairment losses only if it is
probable that future economic benefits attributable to the asset will flow to the entity and the cost of the asset can
be measured reliably, otherwise the cost is recognised as an expense in the income statement in the year in which it
was incurred.
Intangible assets are amortised on a straight-line basis over their useful lives. Intangible assets with indefinite use-
ful lives are not amortised, but periodically tested for impairment by comparing their recoverable amount with their
carrying amount. Expenditure on the renovation of leasehold property is amortised over a period which does not
exceed the lease term.
At each reporting date, if there is evidence of impairment, the recoverable amount of the asset is estimated. If the
recoverable amount of the asset is less than its carrying amount, the carrying amount of the asset is reduced to its
recoverable amount. That reduction is an impairment loss. The impairment loss is recognised in profit or loss.
An intangible asset is derecognised on disposal or when no future economic benefits are expected from it.
Financial liabilities
Other financial liabilities include the various forms of funding from banks and companies within the Group. These
financial liabilities are initially recognised when amounts are received.
They are initially measured at fair value, i.e. generally the amount received, plus any additional costs/income direct-
ly attributable to the individual funding transaction. Internal administrative costs are not added.
The fair value of any financial liabilities issued below market value is subject to assessment and the difference over
market value is directly recognised in the income statement.
After initial recognition, financial liabilities are measured at amortised cost using the effective interest method
except for short-term liabilities for which the time value of money is immaterial that are measured on the basis of
the contractual cash flows and related costs are recognised in the income statement over the contractual term of
the liability.
A financial liability is derecognised when it expires or is extinguished.

212
SEPARATE ANNUALFINANCIAL STATEMENTS
2012
Provisions for risks and charges
Provisions for risks and charges relate to amounts set aside for present obligations resulting from a past event for
which it is probable that an outflow of resources embodying economic benefits will be required to settle the obliga-
tion, provided that a reliable estimate can be made of the obligation.
When the effect of the time value of money is material, the amount of the provision is discounted at current mar-
ket rates. Provisions for risks and charges are recognised in the income statement.
Employee completion-of-service entitlements
Completion-of-service entitlements are recognised at the present value of the benefit obligations calculated using
actuarial techniques in accordance with the rules governing ‘defined benefit plans’. Future disbursements are esti-
mated on the basis of past data (such as employee turnover and retirement) and demographic patterns, including
assumptions for pay hikes pursuant to section 2120 of the Italian Civil Code (application of a fixed rate of 1.5 per-
cent and a rate equal to 75 percent of ISTAT inflation rate). To determine the present value of benefit obligations
the Projected Unit Credit Method is used. As to the discount rate it was decided to apply the rate implied in IBOXX
EUR Corporate AA indices published by Markit Group Ltd as these indices correspond to the implied internal rate
of return of euro-denominated liquid corporate securities. The resulting values are recognised under staff costs as
the net total of current service costs, past service costs, accrued interest and actuarial gains or losses. Actuarial
gains or losses are fully recognised under staff costs.
Entitlements accrued from January 1, 2007 allocated to either INPS or private pension plans are defined contri-
bution payment obligations, since the company’s obligation is limited to the amount it agrees to contribute to the
fund. The defined contribution obligations for each period are the amounts to be contributed for that period.
Employee pension plan
For the defined contribution pension plan under which the company’s obligation is limited to the amount it agrees
to contribute to the fund, the amount of the contribution payable for the year is recognised in the income statement.
Notes issued
Notes (bonds) are initially recognised when amounts are received or notes are issued.
They are initially measured at fair value, i.e. generally the amount received or the issue price, plus any additional
costs/income directly attributable to the individual funding transaction or bond issue and not reimbursed by the
creditor. Internal administrative costs are not added.
The fair value of notes issued below market value is subject to assessment and the difference over market value is
directly recognised in the income statement.
After initial recognition, notes are measured at amortised cost using the effective interest method except for short-
term liabilities for which the time value of money is immaterial that are measured on the basis of the contractual
cash flows and related costs are recognised in the income statement over the contractual term of the liability.

213
NOTES TO THE SEPARATE ANNUALFINANCIAL STATEMENTS
Notes are derecognised from the statement of financial position when they expire or are extinguished. Notes are
derecognised also when they are bought back. The difference between the carrying amount of the liability and the
amount paid to buy it back is recognised in the income statement.
Current and deferred taxation
Income taxes are recognised in the income statement except for items which are credited/charged directly to equity.
Provisions for income taxes are calculated on the basis of conservative estimates of the current and deferred tax
expense. Deferred taxes are computed in respect of the temporary differences, with no time limit, arising between
the tax bases of assets and liabilities and their carrying amounts in the financial statements.
Deferred tax assets are recorded to the extent that there is reasonable certainty they will be recovered, i.e. to the
extent that the company which adhered to Italy’s tax consolidation regime is expected to continue to generate suf-
ficient taxable income against which temporary differences can be utilised.
Deferred tax assets and deferred tax liabilities are not netted, and are separately recognised in the statement of
financial position under “Tax assets” and “Tax liabilities” respectively.
Deferred taxes are accounted for using the so-called ‘liability method’ on temporary differences between the tax
base of an asset or liability and its carrying amount at the statement of financial position date. A deferred tax lia-
bility is recognised for all taxable temporary differences.
A deferred tax asset is recognised for all deductible temporary differences, and the carry-forward of unused tax
losses and unused tax credits, to the extent that it is probable that taxable profit will be available against which the
deductible temporary difference and the carry-forward of unused tax losses and unused tax credits can be utilised.
Deferred tax assets and deferred tax liabilities are systematically re-measured to reflect any changes either in tax
rules or tax rates as well as any possible changes in the company’s tax position.
The provision for tax claims relates to tax payments which may become due as a result of pending tax audits or dis-
putes with tax authorities.
Income Statement
Revenue is recognised when received or when it is probable that future economic benefits will flow to the entity and
the amount of those benefits can be measured reliably.
Specifically, dividends are recognised in the income statement when their distribution to shareholders is established.
Other information
Use of estimates
The application of International Accounting and Financial Reporting Standards (IAS/IFRS) in the preparation of
financial statements entails the use of complex valuations and estimates which have an impact on assets, liabilities,
revenues and costs recognised in the financial statements as well as on the identification of potential assets and lia-
bilities. These estimates primarily relate to:
• estimates and assumptions used to determine the fair value of financial instruments that are not quoted in an
active market (fair value hierarchy levels 2 and 3);
214
SEPARATE ANNUALFINANCIAL STATEMENTS
2012
• identification of loss events as per IAS 39;
• assumptions used for the identification of any objective evidence of impairment of intangible assets and equity
investments recognised in the statement of financial position;
• determination of impairment losses on loans and other financial assets;
• determination of provisions for risks and charges;
• estimates and assumptions for the determination of the probability of utilisation of deferred tax assets;
• assumptions used to determine the costs of stock options plans for top management and sales network members;
• estimates to determine technical reserves;
• assumptions used to determine employee completion-of-service entitlements.
Senior management regularly check valuations and estimates made on the basis of past experience and other rea-
sonable factors. Due to the uncertainty typically related to these financial items, actual values may differ from esti-
mates due to the occurrence of unexpected events or changes in operating conditions.
For information about the methods used to determine the financial items above and main risk factors readers are
referred to the previous sections of these notes for information on accounting policies and to Part F for informa-
tion on financial risk.
Impairment
When upon assessment at the reporting date there is any indication that an asset may be impaired, the tangible or
intangible asset is tested for impairment in accordance with IAS 36.
An asset is impaired when its carrying amount exceeds its recoverable amount, which is the higher of its fair value
less cost to sell (the amount obtainable from the sale of the asset in an arm’s length transaction between knowl-
edgeable, willing parties) and its value in use (i.e. the present value of the future cash flows expected to be derived
from the permanent use of the assets and its disposal at the end of its useful life).
If an asset is impaired, the relevant impairment loss is recognised in profit or loss and the depreciation (amortisa-
tion) charge for the asset shall be adjusted accordingly in future periods.
If, in a subsequent period, there is any indication that the impairment loss recognised in prior periods no longer
exists, the previously recognised impairment loss is reversed.
If there is objective evidence that a financial asset is impaired, the Group applies the provisions of IAS 39, except
for financial assets carried at fair value through profit or loss.
Indications of possible impairment include events such as significant financial difficulties of the issuer, default or
delinquency in interest or principal payments, the possibility that the borrower will enter bankruptcy or other finan-
cial reorganisation and the disappearance of an active market for that financial asset.
A significant or prolonged decline in the fair value of an investment in an equity instrument below its cost is also
objective evidence of impairment.
Specifically, for equities, there is evidence of impairment where the decline in the original fair value exceeds one-
third or is prolonged for over 36 months.
If there is objective evidence of impairment, the amount of the impairment loss is measured:
• as the difference between the asset’s carrying amount and the present value of estimated future cash flows dis-
counted at the financial asset’s effective interest rate computed at initial recognition, for financial assets carried
at amortised cost;
• as the difference between amortised cost and current market value, for available-for-sale financial assets.

215
NOTES TO THE SEPARATE ANNUALFINANCIAL STATEMENTS
If, in a subsequent period, the reasons for the impairment loss no longer exist, the impairment loss is reversed and
the reversal recognised in the income statement if the asset is a debt instrument, and in equity if the asset is an
equity instrument.
Share-based payments
Stock options are share-based payments.
Stock options granted, and the corresponding increase in equity, are measured by reference to the fair value of the
stock option at Grant Date, and accounted for during the Vesting Period.
The fair value of the stock option is determined using a valuation technique that takes into account the specific
terms and conditions of the stock option plan in place, in addition to information such as the exercise price and the
life of the option, the current price of underlying shares, the expected volatility of the share price, dividends expect-
ed on the shares and the risk-free interest rate for the life of the option. The pricing model separately measures the
stock option and the probability that the market conditions upon which vesting is conditioned be satisfied. The com-
bination of the two values is the fair value of the stock option.
The cumulative expense recognised at each annual reporting date up until the vesting date takes account of the vest-
ing period and is based on the best available estimate of options that are going to be exercised on the vesting date.
The expense or the reversal recognised in the income statement for each year represents the change in the cumula-
tive expense over the amount recognised in the prior year. No expense is recognised for options that do not vest.

216
SEPARATE ANNUALFINANCIAL STATEMENTS
2012
€/’000
Dec. 31, 2012 Dec. 31, 2011
Assets measured at cost
Assets measured at fair value
Assets measured at cost
Assets measured at fair value
Other intangible assets 2 - 3 -
Other intangible assets 2 - 3 -
Total 2 - 3 -
€/’000
Dec. 31, 2012 Dec. 31, 2011
Assets measured at cost
Assets measured at fair value
Assets measured at cost
Assets measured at fair value
Owned 33 - 58 -
- furnishings 32 - 55 -
- other 1 - 3 -
Total (at cost and re-measured) 33 - 58 -
€/’000 Total at Dec. 31, 2012
Opening balance 3
Increases -
Decreases 1
- Value adjustments 1 -
- Amortisation 1 -
Closing balance 2
TANGIBLE ASSETS
Year’s movements in tangible assets
PART C – INFORMATION ON THE STATEMENT OF FINANCIAL POSITION
ASSETS
INTANGIBLE ASSETS

217
NOTES TO THE SEPARATE ANNUALFINANCIAL STATEMENTS
Year’s movements in tangible assets
€/’000 FurnishingsElectronic equipment Other Total
Opening balance 55 - 3 58
Increases - - - -
Additions - - - -
Reversal of impairment - - - -
Increases in fair value: - - - -a) in equity - - - -
b) through profit or loss - - - -
Other changes - - - -
Decreases 23 - 2 25
Sales - - - -
Depreciation 23 - 2 25
Impairment - - - -
a) in equity - - - -
b) through profit or loss - - - -
Decreases in fair value: - - - -a) in equity - - - -
b) through profit or loss - - - -
Other changes - - - -
Closing balance 32 - 1 33

218
SEPARATE ANNUALFINANCIAL STATEMENTS
2012
€/’000 Dec. 31, 2012 Dec. 31, 2011
Subsidiaries: Banca Mediolanum S.p.A. 600,239 450,239
Mediolanum Vita S.p.A. 166,681 166,681
Mediolanum International Life Ltd 60,131 60,131
PI Servizi S.p.A. 7,760 7,760
Mediolanum Gestione Fondi SGR p.A. 2,507 2,507
Mediolanum Asset Management Ltd 1,911 1,911
Mediolanum Comunicazione S.p.A. 1,687 1,687
Mediolanum International Funds Ltd 1,194 1,194
Partner Time S.p.A. (in liquidation) 447 473
Gamax Management AG 1 1
Total subsidiaries 842,558 692,584
Associates and joint ventures:Mediobanca S.p.A. 227,578 247,396
Banca Esperia S.p.A. 54,312 54,312
Total associates and joint ventures 281,890 301,708
Total 1,124,448 994,292
In the year under review, to enable the subsidiary Banca Mediolanum S.p.A. to take all opportunities for profitable
business growth, also in view of the upcoming Basel III requirements, it was decided to strengthen its capital base.
To that end, pursuant to the relevant resolution made by the Board of Directors on July 26, 2012 and notified to
the Bank of Italy by letter dated July 31, 2012, Mediolanum S.p.A. injected €25,000,000 into the subsidiary on
March 14, 2012 and September 28, 2012. Additionally, on November 6, 2012, the Extraordinary General Meeting
of Banca Mediolanum S.p.A. approved the proposal for a capital increase in one or more occasions from
€500,000,000 to €700,000,000, setting December 31, 2014 as the final date for subscription thereto, as well as
the subsequent amendment to art. 6 of the Bylaws, as per Bank of Italy’s procedures under articles 56 and 61 of
Legislative Decree 385/93 (Consolidated Banking Act). On December 5, 2012 Mediolanum S.p.A. proceeded to
make an initial injection of €100,000,000 as a result of which Banca Mediolanum’s share capital increased to
€600,000,000.
Investments in subsidiaries that are part of the Mediolanum Group are carried at historical values which are sig-
nificantly lower than their value in use. In connection therewith, you are advised that the Mediolanum Group aver-
age stock market value in 2012 was 2x its equity book value.
As to the investment in Mediobanca, to determine its recoverable amount for impairment review purposes,
Mediolanum S.p.A. requested the assistance of a specialist valuation firm. Recoverable amount was determined
using the dividend discount model in the excess capital variant. Due to the lack of future plans approved by the
Board of Directors of Mediobanca, the financial projections used for impairment testing were derived from recent
research done by financial analysts.
Given Mediobanca stock performance during 2012, last October Mediolanum decided to review for impairment the
value of its stake therein before the end of the financial year. Availing itself of the assistance of an independent val-
uer, Mediolanum tested for impairment the value of its stake in Mediobanca at September 30, 2012. The recover-
able amount of the stake in Mediobanca calculated applying the dividend discount model in the excess capital vari-
INVESTMENTS IN SUBSIDIARIES, ASSOCIATES AND JOINT VENTURES

NOTES TO THE SEPARATE ANNUALFINANCIAL STATEMENTS
€/’000
Dec. 31, 2012 Dec. 31, 2011
Book Valueof which:
equity reserve Book Valueof which:
equity reserve
Fair value – Level 1 3,813 614 3,190 -
Assicurazioni Generali S.p.A. 3,813 614 3,190 -
Fair value – Level 2 - - - -
Fair value – Level 3 16,159 - 16,159 -
Sia SSB S.p.A. 6,204 - 6,204 -
Istituto Europeo di Oncologia 4,703 - 4,703 -
Cedacri S.p.A. 4,940 - 4,940 -
Nomisma S.p.A. 312 - 312 -
TOTAL 19,972 614 19,349 -
219
ant was found to range between €9.3 and €9.8 per share, with a median value of €9.5 per share. Based on said
valuation, the Board of Directors of Mediolanum S.p.A. resolved to proceed to write down the value of the stake in
Mediobanca in the interim accounts at September 30, 2012 to €9.5 per share.
At year end, impairment review was again undertaken to determine the recoverable amount of the investment in
Mediobanca at December 31, 2012. To that end, Mediolanum S.p.A. requested again the assistance of an independ-
ent valuer. This time the recoverable amount of the stake in Mediobanca was found to range between €9.76 and
€10.39 per share, with a median value of €10.05 per share. Based on said valuation, the stake in Mediobanca was
carried at €10.05 per share in the consolidated accounts at December 31, 2012. The impairment recognised for
financial year 2012 on the investment in Mediobanca aggregated to €19.8 million.
As to Banca Esperia, for the purpose of impairment review at December 31, 2012, Directors considered that the
company’s equity approximated its carrying amount and also used as reference the appraisal at June 30, 2012,
requested by Banca Esperia to determine the exercise price of the Private Bankers Stock Options Plan and issued
by the independent specialist firm on December 10, 2012. The appraisal used the following assumptions: going con-
cern, growth at a normal rate, materialisation of the assumptions and attainment of the goals set out in the fore-
casts for 2012 and the Business Plan for 2013-2015.
Said valuation indicated a value per share of €2.05, which was more than twice the carrying amount of the invest-
ment at December 31, 2012 (€0.9 per share). It was therefore concluded there was no impairment of the invest-
ment in Banca Esperia.
“Loans to subsidiaries” related to the indefinite-maturity subordinated loan up to €120,000,000.00 (one hundred
and twenty million euro) extended to the subsidiary Mediolanum Vita S.p.A. and fully drawn down. The interest rate
applied was 4.50% p.a. The account also includes interest accrued on the loan at year end.
AVAILABLE-FOR-SALE FINANCIAL ASSETS
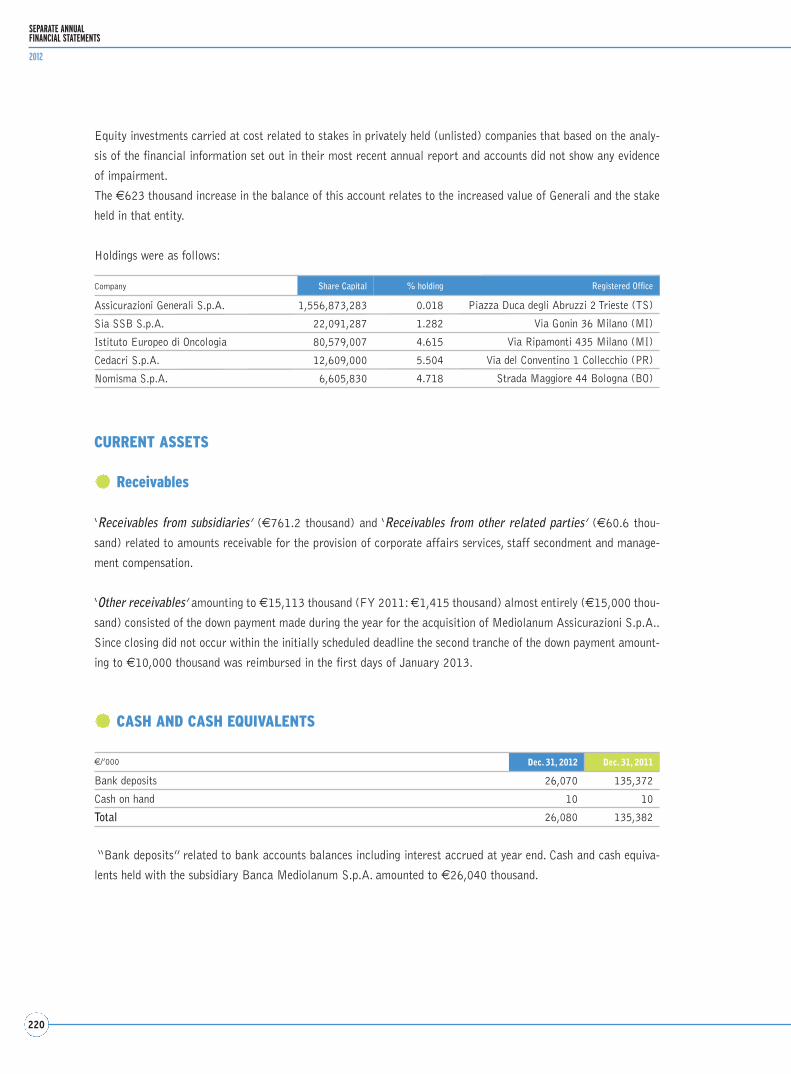
220
SEPARATE ANNUALFINANCIAL STATEMENTS
2012
Equity investments carried at cost related to stakes in privately held (unlisted) companies that based on the analy-
sis of the financial information set out in their most recent annual report and accounts did not show any evidence
of impairment.
The €623 thousand increase in the balance of this account relates to the increased value of Generali and the stake
held in that entity.
Holdings were as follows:
€/’000 Dec. 31, 2012 Dec. 31, 2011
Bank deposits 26,070 135,372
Cash on hand 10 10
Total 26,080 135,382
Company Share Capital % holding Registered Office
Assicurazioni Generali S.p.A. 1,556,873,283 0.018 Piazza Duca degli Abruzzi 2 Trieste (TS)
Sia SSB S.p.A. 22,091,287 1.282 Via Gonin 36 Milano (MI)
Istituto Europeo di Oncologia 80,579,007 4.615 Via Ripamonti 435 Milano (MI)
Cedacri S.p.A. 12,609,000 5.504 Via del Conventino 1 Collecchio (PR)
Nomisma S.p.A. 6,605,830 4.718 Strada Maggiore 44 Bologna (BO)
CURRENT ASSETS
Receivables
‘Receivables from subsidiaries’ (€761.2 thousand) and ‘Receivables from other related parties’ (€60.6 thou-
sand) related to amounts receivable for the provision of corporate affairs services, staff secondment and manage-
ment compensation.
‘Other receivables’ amounting to €15,113 thousand (FY 2011: €1,415 thousand) almost entirely (€15,000 thou-
sand) consisted of the down payment made during the year for the acquisition of Mediolanum Assicurazioni S.p.A..
Since closing did not occur within the initially scheduled deadline the second tranche of the down payment amount-
ing to €10,000 thousand was reimbursed in the first days of January 2013.
CASH AND CASH EQUIVALENTS
“Bank deposits” related to bank accounts balances including interest accrued at year end. Cash and cash equiva-
lents held with the subsidiary Banca Mediolanum S.p.A. amounted to €26,040 thousand.

221
NOTES TO THE SEPARATE ANNUALFINANCIAL STATEMENTS
TAX ASSETS
Analysis of Current Tax Assets
€/’000 Dec. 31, 2012 Dec. 31, 2011
Tax consolidation regimeMediolanum Vita S.p.A. 30,449 16,521Mediolanum Gestione Fondi SGR p.A. 14,442 15,833Mediolanum Comunicazione S.p.A. - 242Banca Mediolanum S.p.A. 30,023 -Total Tax consolidation regime 74,914 32,596IRS(IRES & IRAP) advances 4,277 2,995Prior years’ tax credit (IRES) 68,368 68,808Current year’s tax credit (IRES) 9,387 10,127VAT 9 -Tax credit reimbursements due (IRES) 8,978 3,825Total IRS 91,020 85,755Total current tax assets 165,934 118,351
LIABILITIES AND SHAREHOLDERS’ EQUITY
CAPITAL AND RESERVES
Share Capital
Share capital is fully paid up and amounts to €73,433,791.90 divided into 734,337,919 ordinary shares.
In 2012, to service the Stock Options Plans, capital was increased by €51,855 which corresponds to 518,550
shares.
Share premium account
The balance on the share premium account increased from €56,013 thousand at December 31, 2011 to €56,497
thousand at the end of the year under review. The increase relates to the subscriptions for the shares issued under
the Stock Option Plans.
Retained earnings
Analysis of retained earnings
€/’000 Dec. 31, 2012 Dec. 31, 2011
Legal reserve 17,363 17,363Extraordinary reserve 501,619 422,690FTA reserve (123,109) (123,109)Interim dividend (73,427) (51,364)Other 5,807 5,682Total 328,253 271,262
The legal reserve remained unchanged since it had already reached the statutory limit. The interim dividend amount
is before dividend on treasury shares.

222
SEPARATE ANNUALFINANCIAL STATEMENTS
2012
€/’000
Balance at December 31, 2011 501
Amount accrued and posted to the income statement 189
Benefits/advances paid during the year (18)
Amounts contributed to pension funds (140)
Amounts contributed to INPS (8)
Other (2)
Balance at December 31, 2012 522
NOTES ISSUED
Pursuant to the resolution passed by the Mediolanum S.p.A. Board of Directors at its Meeting of July 31, 2012,
for the purpose of diversifying debt facilities and support subsidiaries’ business growth, non-convertible notes, either
fixed or floating rate with a floor or equity-linked, were offered to the public.
Key information on the note issues:
• 1-year Fixed Rate Notes • Amount of issue: up to €55 million (nominal value).
• Minimum subscription amount: €100,000 per investor, per separate issue.
• Principal repayment: lump sum at maturity.
• Coupons: biannual, corresponding to 3.75% gross annual yield.
• Settlement date: November 14, 2012.
• Maturity date: November 14, 2013.
• 2-year Fixed Rate Notes• Amount of issue: up to €45 million (nominal value).
• Minimum subscription amount: €100,000 per investor, per separate issue.
• Principal repayment: lump sum at maturity.
• Coupons: biannual, corresponding to 4.00% gross annual yield.
• Settlement date: November 14, 2012.
• Maturity date: November 14, 2014.
AFS Revaluation Reserve
The AFS revaluation reserve amounted to €614 thousand and relates to the fair value measurement of the hold-
ings in Generali.
NON CURRENT LIABILITIES
EMPLOYEE COMPLETION-OF-SERVICE ENTITLEMENTS
An analysis of the year’s movements in this account is set out in the table below.

223
NOTES TO THE SEPARATE ANNUALFINANCIAL STATEMENTS
As of December 31, 2012, Mediolanum S.p.A. non-convertible notes issued aggregated to €337.2 million (nomi-
nal value):
• €49.4 million (nominal value) notes due April 29, 2014, bearing interest at a rate of 3.5%;
• €48.9 million (nominal value) notes due April 29, 2014, bearing interest at 6-month EURIBOR + 1%;
• €48.3 million (nominal value) notes due May 20, 2013, bearing interest at 3.15%;
• €47.8 million (nominal value) notes due May 20, 2015, bearing interest at 6-month EURIBOR;
• €24.4 million (nominal value) notes due May 31, 2013, bearing interest at 3.15%;
• €20.4 million (nominal value) notes due May 31, 2015, bearing interest at 6-month EURIBOR;
• €54.1 million (nominal value) notes due November 14, 2013, bearing interest at 3.75%;
• €43.9 million (nominal value) notes due November 14, 2014, bearing interest at 4.00%.
CURRENT LIABILITIES
PAYABLES
Amounts Due to banks aggregated to €302,149 thousand and relate to amounts due under credit facilities received
(€300,000 thousand) plus the related interest expense accrued at year end.
Amounts Due to subsidiaries (€529 thousand) and Amounts Due to other related parties (€93 thousand) relate
to outsourcing and other services.
Other payables amounting to €2,108 thousand mostly relate to employee buyouts (€756 thousand), amounts due
to suppliers (€296 thousand), withholding tax (€278 thousand) and pension contributions (€148 thousand) paid
in the first months of 2013.

224
SEPARATE ANNUALFINANCIAL STATEMENTS
2012
TAX LIABILITIES
Analysis of Current Tax Liabilities
€/’000 Dec. 31, 2012 Dec. 31, 2011
IRSIres 74,911 -Irap 3,903 4,277
Total IRS 78,814 4,277
Tax consolidation regime Banca Mediolanum S.p.A. 46,332 79,732
Mediolanum Vita S.p.A. 33,769 21,996
Mediolanum Comunicazione S.p.A. 260 627
Mediolanum Gestione Fondi SGR p.A. 942 458
Partner Time S.p.A. (in liquidation) 91 443
Mediolanum Fiduciaria S.p.A. 158 24
PI Servizi S.p.A. 86 152
Total Tax consolidation regime 81,638 103,432
Total current tax liabilities 160,452 107,709
Current tax liabilities under the tax consolidation regime relate to tax credits of Group companies that adhere to
Italy’s tax consolidation regime.
OTHER LIABILITIES
Other liabilities amounted to €615 thousand versus €532 thousand at December 31, 2011. They largely consist-
ed of allowances for vacation accruals and additional months for the year under review.

225
NOTES TO THE SEPARATE ANNUALFINANCIAL STATEMENTS
€/’000 Dec. 31, 2012 Dec. 31, 2011
Mediolanum International Life Ltd 17,000 86,240
Banca Mediolanum S.p.A. 15,005 60,003
Mediolanum International Funds Ltd 129,800 15,000
Mediolanum Gestione Fondi SGR p.A. 6,136 9,187
Mediolanum Asset Management Ltd 8,330 5,880
Total 176,271 176,310
€/’000 Dec. 31, 2012 Dec. 31, 2011
Bank accounts 309 917
Receivables from IRS 205 -
Hot money transactions 686 304
Other 5,415 5,415
Total 6,614 6,636
PART D - INFORMATION ON THE INCOME STATEMENT
DIVIDEND AND SIMILAR INCOME
Dividends from subsidiaries amounted to €176,271 thousand versus €176,310 thousand at December 31, 2011
as set out in the table below.
Dividends from associates amounted to €1,132 thousand entirely relating to the dividend received from
Mediobanca S.p.A.
Dividends from available-for-sale financial assets amounted to €55 thousand (€125 thousand at December 31,
2011) and consisted of dividends received from Assicurazioni Generali S.p.A.
INTEREST INCOME AND SIMILAR INCOME
An analysis of interest income and similar income is set out below.
Interest income on bank accounts primarily related to accounts held with the subsidiary Banca Mediolanum S.p.A..
‘Other’ interest income related to interest accrued on the subordinated loan extended to the subsidiary Mediolanum
Vita S.p.A..
INTEREST EXPENSE AND SIMILAR CHARGES
Interest expense and similar charges amounted to €21,417 thousand (€14,663 thousand at the end of the prior
year) and primarily related to interest expense on financing facilities in place amounting to €12,499 thousand and
on notes issued in the year amounting to €8,902 thousand.

226
SEPARATE ANNUALFINANCIAL STATEMENTS
2012
STAFF COSTS
An analysis of this account is set out in the table below.
€/’000 Dec. 31, 2012 Dec. 31, 2011
Wages and salaries 3,170 2,548
Social security contributions 812 834
Completion-of-service entitlements 189 166
Remuneration of Directors 1,488 1,526
Directors’ benefits 147 124
Key personnel (1,548) (1,627)
Pension fund 21 23
Other 302 325
Total 4,580 3,919
The increase in wages and salaries largely relates to employee buyouts.
Average number of employees
An analysis of the average number of employees by category is set out in the table below.
Category Dec. 31, 2012
Senior management 2
Middle management 5
Other personnel 13
Total 20
€/’000 Dec. 31, 2012 Dec. 31, 2011
Intercompany services 1,404 1,517
Professional services 1,322 1,410
Vehicle rentals 722 1,206
Emoluments of corporate officers 219 236
Property rentals and other related expenses 173 200
Donations 51 51
Utilities 15 23
Miscellaneous services 291 397
Other 1,474 1,031
Total 5,671 6,071
OTHER ADMINISTRATIVE EXPENSES
Professional services include fees for legal counselling, technical and administrative expertise, audit of financial
statements and other professional services.

227
NOTES TO THE SEPARATE ANNUALFINANCIAL STATEMENTS
€/’000 Dec. 31, 2012 Dec. 31, 2011
Central functions:
- subsidiaries 432 436
- companies that are part of the Fininvest Group and of the Doris Group 68 68
Other income 200 225
Total other income 700 729
Other expenses - (212)
Total other expenses - (212)
Total other income (expenses) 700 517
Total other net income increased from €517 thousand in the prior year to €700 thousand at year end 2012.
INCOME TAX
Income tax relates to the IRES (corporate income tax) and IRAP (regional business tax) tax expense for the year
calculated in accordance with tax rules and rates.
€/’000 Dec. 31, 2012 Dec. 31, 2011
Current tax expense (IRES) (4,222) (2,222)
Change in deferred tax assets (IRES) (300) -
Change in prior year’s deferred tax assets (IRES) 50 2
Total tax expense for the year (IRES) (4,472) (2,220)
Current tax expense (IRAP) 3,903 4,268
Change in deferred tax assets (IRAP) - 1
Total tax expense for the year (IRAP) 3,903 4,269
Change in deferred tax liabilities - -
Total (569) 2,049
OTHER INCOME (EXPENSES)

228
SEPARATE ANNUALFINANCIAL STATEMENTS
2012
The reconciliation between the theoretical tax expense and the effective tax expense is set out in the table below.
€/’000 Rate Taxable amount Tax expense
Calculation of taxable income (IRES) Profit before tax - 133,051 -
Theoretical tax 27.50% - 36,589
Temporary differences deductible in following years - 88 -
Prior years’ temporary differences - (182) -
Permanent differences - (148,311) -
Total taxable income - (15,354) -
Taxable income (27.50%) - (15,354) -
Current tax expense for the year - - (4,222)
Prior years’ taxes - - -
Current tax expense recognised in the income statement - - (4,222)
Average rate on profit before tax 3.17% - -
Calculation of taxable income (IRAP) Value of production less production costs - 69,667 -
Costs which are not significant for the purpose of IRAP calculation - (568) -
Total - 69,099 -
Theoretical tax 5.57% - 3,849
Prior years’ temporary differences - (11) -
Permanent differences - 968 -
Taxable income (rate of 5.57%) - 70,056 -
Current tax expense for the year - - 3,903
Prior years’ taxes - - -
Current tax expense recognised in the income statement - - 3,903
PART E - SEGMENTAL INFORMATION
No disclosure is provided in this section as segmental information is not significant at level of separate financial
statements. Readers are referred to the consolidated financial statements.
PART F - INFORMATION ON RISKS AND RISK MANAGEMENT
For information on risks and risk management readers are referred to the same section of the consolidated finan-
cial statements. No additional information is provided herein in consideration of the immateriality of risk inherent
in the company’s positions at year end.
PART G - BUSINESS COMBINATIONS
Transactions concluded during the year
In 2012 there were no transactions requiring disclosure under IFRS 3.
Post-balance sheet date transactions
No transaction was concluded after the end of the financial year under review.

229
NOTES TO THE SEPARATE ANNUALFINANCIAL STATEMENTS
PART H - RELATED PARTY TRANSACTIONS
1. Key management compensation
€/’000
Directors, StatutoryAuditors, Deputy/
General ManagersOther key
management
Emoluments & social security contributions 1,772 180
Other pension benefits and insurance - -
Non-cash benefits - -
Other post-employment benefits - -
Share-based awards (stock options) 124 -
€/’000Tax
assets Receivables Cash
Other financial
assetsOther
payablesTax
liabilities
(a) Parent company - - - - - -
(b) Entities exercising significant influence over thecompany - 15,000 - - 50 -
(c) Subsidiaries 74,914 761 26,040 120,074 535 81,638
(d) Associates - - - - - -
(e) Joint ventures - 40 - - - -
(f) Key management - - - - - -
(g) Other related parties - 21 - - 43 -
The Board of Directors consists of 13 members and the Board of Statutory Auditors of 3 members.
2. Information on related party transactions
Related party transactions primarily refer to transactions with companies that are part of the Mediolanum Group
and, in particular, with the subsidiary Banca Mediolanum S.p.A. in relation to bank accounts held with Banca
Mediolanum and services provided by central functions e.g. internal audit, IT systems management, organisation
and HR, general affairs, legal affairs, taxation, central procurement and management of suppliers, risk management
and compliance services.
In addition, personnel was seconded to companies within the Mediolanum Group.
All transactions are made on an arm’s length basis at market conditions, personnel secondment and services pro-
vided by central functions are charged on the basis of actual costs incurred.
For companies that are within the scope of the tax consolidation regime, related party transactions include also
amounts receivable and payable as a result of the application of said tax regime.
Analysis of related party balances at December 31, 2012 by related party category:
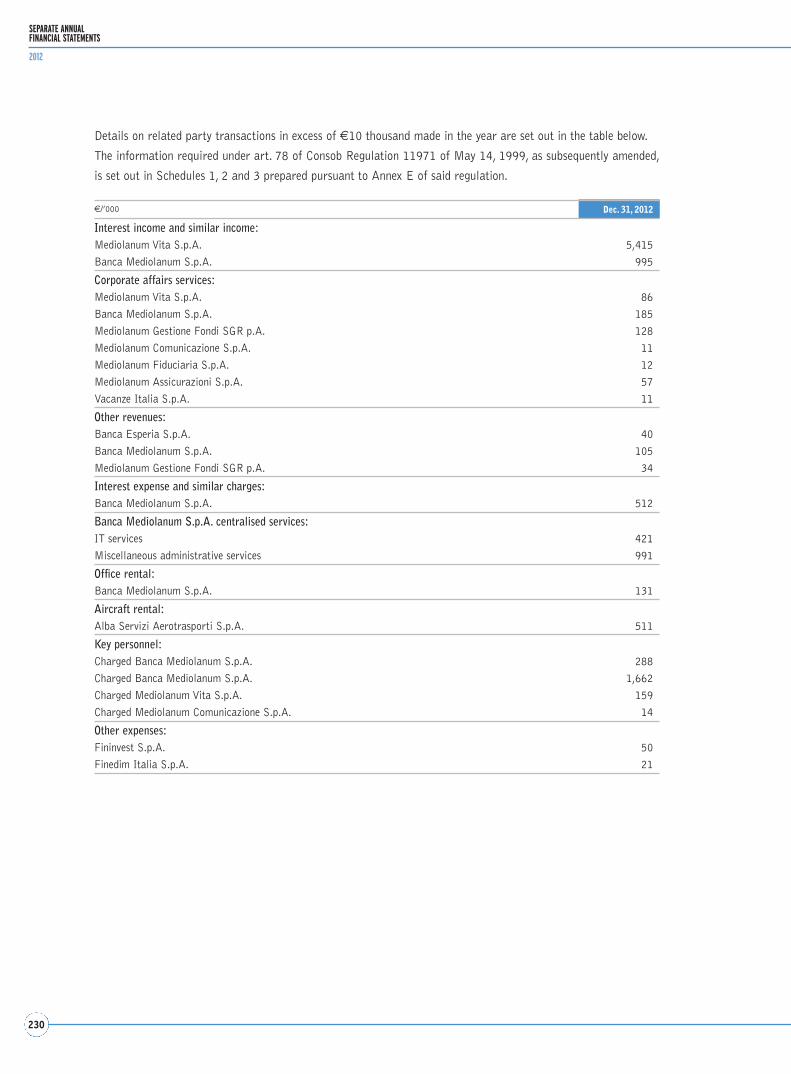
230
SEPARATE ANNUALFINANCIAL STATEMENTS
2012
Details on related party transactions in excess of €10 thousand made in the year are set out in the table below.
The information required under art. 78 of Consob Regulation 11971 of May 14, 1999, as subsequently amended,
is set out in Schedules 1, 2 and 3 prepared pursuant to Annex E of said regulation.
€/’000 Dec. 31, 2012
Interest income and similar income: Mediolanum Vita S.p.A. 5,415
Banca Mediolanum S.p.A. 995
Corporate affairs services: Mediolanum Vita S.p.A. 86
Banca Mediolanum S.p.A. 185
Mediolanum Gestione Fondi SGR p.A. 128
Mediolanum Comunicazione S.p.A. 11
Mediolanum Fiduciaria S.p.A. 12
Mediolanum Assicurazioni S.p.A. 57
Vacanze Italia S.p.A. 11
Other revenues:Banca Esperia S.p.A. 40
Banca Mediolanum S.p.A. 105
Mediolanum Gestione Fondi SGR p.A. 34
Interest expense and similar charges:Banca Mediolanum S.p.A. 512
Banca Mediolanum S.p.A. centralised services: IT services 421
Miscellaneous administrative services 991
Office rental: Banca Mediolanum S.p.A. 131
Aircraft rental: Alba Servizi Aerotrasporti S.p.A. 511
Key personnel: Charged Banca Mediolanum S.p.A. 288
Charged Banca Mediolanum S.p.A. 1,662
Charged Mediolanum Vita S.p.A. 159
Charged Mediolanum Comunicazione S.p.A. 14
Other expenses: Fininvest S.p.A. 50
Finedim Italia S.p.A. 21

231
NOTES TO THE SEPARATE ANNUALFINANCIAL STATEMENTS
PART I - EQUITY-SETTLED SHARE-BASED PAYMENT TRANSACTIONS
1. Description of equity-settled share-based payment transactions
In 2012, 518,550 new Mediolanum dividend-bearing ordinary shares were issued following the exercise of stock
options by Directors and Sales Network members of companies within the Mediolanum Group. This entailed a
€51,855.0 increase in Mediolanum ordinary share capital and a €483,795.23 increase in the share premium account.
On May 10, 2012, by virtue of the authorities delegated to it by the Extraordinary General Meeting of April 27,
2010, as amended by resolution passed by the shareholders at the Ordinary and Extraordinary General Meeting of
April 19, 2012, the Board of Directors of Mediolanum S.p.A. resolved:
• to increase the Company’s share capital by a maximum amount of €186,405.00, for a consideration, by issuing
up to 1,864,050 dividend-bearing ordinary shares, par value of €0.1 each, with the exclusion of shareholders’
pre-emptive rights pursuant to article 2441, paragraph five, of the Italian Civil Code, as they are reserved to the
Directors and executives of the company and its subsidiaries pursuant to article 2359 paragraph 1, N. 1, of the
Italian Civil Code, setting as final deadline for share subscription the fifth business day in the thirty-sixth calen-
dar months subsequent to the expiration of the three year term from the date of the capital increase resolution;
• to increase the Company’s share capital by a maximum amount of €70,840.00, for a consideration, by issuing
up to 708,400 dividend-bearing ordinary shares, par value of €0.1 each, with the exclusion of shareholders’ pre-
emptive rights pursuant to article 2441, paragraph five, of the Italian Civil Code, as they are reserved to the sales
network of the company and its subsidiaries pursuant to article 2359 paragraph 1, N. 1, of the Italian Civil Code,
setting as final deadline for share subscription the fifth business day in the thirty-sixth calendar months subse-
quent to the expiration of the nine year term from the date of the capital increase resolution.
For information on the fair value of stock options and the year’s movements readers are referred to the relevant
section of the notes to the consolidated financial statements.
2. Other information
The year’s cost of stock options, which corresponds to the year’s share of the fair value of financial instruments
over the vesting period, amounted to €124 thousand and entailed a corresponding increase in the Company’s equi-
ty reserves (December 31, 2011: €67 thousand).
SCHEDULES
Additional information is provided in the Schedules set out in the following pages that form an integral part of these
notes.
Basiglio, March 21, 2013
For the Board of Directors
The Chairman
(Secchi Carlo)


Schedules

234
SEPARATE ANNUALFINANCIAL STATEMENTS
2012
SCHEDULE 1
Analysis of equity reserves
Type/description
Utilisationin the priorthree years
Amount
Possibleutilisation(A, B, C)
Usableamount
losscoverage other
Share capital: 73,433,792 - - - -Capital reserves:- share premium account 56,496,878 A B C 56,496,878 - -
- Lehman Brothers operation equity reserve 84,692,746 A B C 84,692,746 - -
Retained earnings:- legal reserve 17,362,794 B 17,362,794 - -
- other reserves 308,844,740 A B C 308,844,740 - -
Valutation reserves:- available-for-sale financial assets 614,096 (1) - -
Total 541,445,046 467,397,158 - -
of which non-distributable - - 17,362,794 - -
of which distributable - - 450,034,364 - -
Legend:
A: capital increase
B: loss coverage
C: distribution to shareholders
(1) Reserve not available under art. 6 of Legislative Decree 38/2005.

235
SCHEDULES
SCHEDULE 2
Analysis of deferred taxation
FY 2012 FY 2011
Amount of temporary differences
Tax rateapplied
Amount oftemporary differences
Tax rateapplied
Deferred tax assets:Impairment losses on tangible assets - - - -
Impairment losses on intangible assets - - - -
Provisions for risks and charges - - - -Business expenses - - - -
Remuneration of Directors 87,587 27.50% 181,503 27.50%
TARSU 9,849 27.50% 9,849 27.50%
Adjustment to completion-of-service entitlementsunder IAS - - - -
Total 97,436 - 191,352 -
Deferred tax liabilities:Accelerated depreciation and amortisation - - - -
Excess depreciation and amortisation - - - -
Impairment of loans - - - -
Available-for-sale financial assets 31,133 27.50% - 32.32%
Adjustment to completion-of-serviceentitlements under IAS 22,563 27.50% 22,563 27.50%
Total 53,696 - 22,563 -
Net deferred tax liabilities (assets) 12,029 - 46,416 -
Deferred tax assets on tax lossesfor the year 4,222,254 - 3,463,708 -Deferred tax assets on tax losses for the prior year 2,500,313 - - -
Temporary differences excluded from the calculation of deferred tax liabilities (assets) - - - -
Tax losses carried forward - - - -........
Net amount - - - -
Deferred tax assets on tax losses for the year relate to both Mediolanum S.p.A.’s tax losses as well as the tax losses transferred to the parent companyby Group companies under the tax consolidation regime.

236
SEPARATE ANNUALFINANCIAL STATEMENTS
2012
SCHEDULE 3
Analysis of directly and indirectly controlled subsidiaries and associates
€/’000Name
Sharecapital
Equity
Total Share
Subsidiary
Banca Mediolanum S.p.A.Via F. Sforza P.zzo Meucci Basiglio (MI)
600,000 969,451 969,451
Mediolanum Vita S.p.A.Via F. Sforza P.zzo Meucci Basiglio (MI)
87,720 370,808 370,808
Mediolanum Gestione Fondi SGR p.A.Via F. Sforza P.zzo Meucci Basiglio (MI)
5,165 51,289 25,132
Mediolanum Comunicazione S.p.A.Via F. Sforza P.zzo Meucci Basiglio (MI)
775 1,200 1,200
Partner Time S.p.A. (on liquidation)Via F. Sforza P.zzo Meucci Basiglio (MI)
520 447 447
PI Servizi S.p.A.Via F. Sforza P.zzo Meucci Basiglio (MI)
517 7,873 7,873
Gamax Management AG69, route d’Esch 1470 Luxembourg
7,161 12,416 -
Mediolanum International Life LtdIona Building, Block B, 4th Floor, Shelbourne Road Dublin 4 Ireland
1,395 70,732 70,732
Mediolanum Asset Management LtdIona Building, Block B, 4th Floor, Shelbourne Road Dublin 4 Ireland
150 10,291 5,043
Mediolanum International Funds Ltd Iona Building, Block B, 4th Floor, Shelbourne RoadDublin 4 Ireland
150 60,722 26,718
(1) The amount includes the share of profit of subsidiaries indirectly controlled by the Group.

237
SCHEDULES
Net profit
% holdingCarrying amountTotal Share
189,264 189,264(1) 100 600,239
72,324 72,324 1 100 166,681
34,982 17,141 1 49 2,507
76 761 (1 100 1,687
(26) (26)(1 100 447
94 94 1 100 7,760
4,111 - 1 0.004 1
17,951 17,951 1 100 60,131
14,183 6,950 1 49 1,911
261,416 115,023 1 44 1,193

238
SEPARATE ANNUALFINANCIAL STATEMENTS
2012
Analysis of directly and indirectly controlled subsidiaries and associates (continued)
€/’000Name
Share capital
Equity
Total Share
SubsidiaryGamax Management AG69, route d’Esch 1470 Luxembourg
7,161 12,305 12,305
Bankhaus August Lenz & Co. AGHolbeinstrasse 11 81679 Münich
20,000 38,471 38,471
Banco Mediolanum S.A.Avenida Diagonal 668/670 Barcelona
86,032 187,907 187,907
Mediolanum Fiduciaria S.p.A.Via F. Sforza P.zzo Meucci Basiglio (MI)
240 1,273 1,273
Fermi & Galeno Real Estate S.r.l.Via F. Sforza P.zzo Galeno Basiglio (MI)
10 21,700 21,700
Fibanc Pensiones S.G.F.P., S.A.Avenida Diagonal 668/670 Barcelona
902 1,900 1,900
Fibanc S.A.Avenida Diagonal 668/670 Barcelona
301 417 417
Ges Fibanc S.G.I.I.C., S.A.Calle Enteza 325/335 Barcelona
2,506 3,846 3,846
Mediolanum Gestione Fondi SGR p.A.Via F. Sforza P.zzo Meucci Basiglio (MI)
5,165 51,289 26,157
Mediolanum Asset Management LtdIona Building, Block B, 4th Floor, Shelbourne RoadDublin 4 Ireland
150 10,291 5,248
Mediolanum International Funds Ltd Iona Building, Block B, 4th Floor, Shelbourne RoadDublin 4 Ireland
150 60,722 34,004
SubsidiancesMediobanca S.p.A. Piazzetta E. Cuccia, 1 Milan
430,565 4,421,588 116,597
Banca Esperia S.p.A. Via Del Lauro, 7 Milan
63,000 152,637 76,319

239
SCHEDULES
Net profit
% holdingCarrying amountTotal Share
4,194 4,194 99.996 -
(8,419) (8,419) 100 -
29,992 29,992 100 -
(402) (402) 100 -
(5,560) (5,560) 100 -
164 164 100 -
2 2 100 -
98 98 100 -
34,982 17,841 51 -
14,183 7,233 51 -
261,416 146,393 56 -
(200,151) (5,278) 2.637 227,579
1,103 552 50 54,311

240
SEPARATE ANNUALFINANCIAL STATEMENTS
2012
SCHEDULE 4MEDIOLANUM S.P.A.Analysis of significant investments under art. 125 of Consob Regulation No. 11971/1999As of December 31, 2012
Company name CountryTotal
holding %
Banca Esperia S.p.A. Italy 50.000
Banca Mediolanum S.p.A. Italy 100.000
Banco Mediolanum S.A. Spain 100.000
Bankhaus August Lenz & Co. AG Germany 100.000
Fibanc Pensiones, S.A., S.G.F.P. Spain 99.999
Fibanc, S.A. Spain 99.998
Gamax Management AG Luxembourg 100.000
Ges. Fibanc, S.G.I.I.C., S.A. Spain 99.999
Mediolanum Asset Management Ltd Ireland 100.000
Mediolanum Comunicazione S.p.A. Italy 100.000
Mediolanum Fiduciaria S.p.A. Italy 100.000
Fermi & Galeno Real Estate S.r.l. Italy 100.000
Mediolanum Gestione Fondi SGR p.A. Italy 100.000
Mediolanum International Funds Ltd Ireland 100.000
Mediolanum International Life Ltd Ireland 100.000
Mediolanum Vita S.p.A. Italy 100.000
Partner Time S.p.A. on liquidation Italy 100.000
PI Servizi S.p.A. Italy 100.000

241
SCHEDULES
Type of holding Shareholder % holding
direct ownership Mediolanum S.p.A. 50.000
direct ownership Mediolanum S.p.A. 100.000
indirect ownership Banca Mediolanum S.p.A. 100.000
indirect ownership Banca Mediolanum S.p.A. 100.000
indirect ownership Banco Mediolanum S.A. 99.999
indirect ownership Banco Mediolanum S.A. 99.998
indirect ownership Banca Mediolanum S.p.A. 99.996
direct ownership Mediolanum S.p.A. 0.004
indirect ownership Banco Mediolanum S.A. 99.999
indirect ownership Banca Mediolanum S.p.A. 51.000
direct ownership Mediolanum S.p.A. 49.000
direct ownership Mediolanum S.p.A. 100.000
indirect ownership Banca Mediolanum S.p.A. 100.000
indirect ownership Banca Mediolanum S.p.A. 100.000
indirect ownership Banca Mediolanum S.p.A. 51.000
direct ownership Mediolanum S.p.A. 49.000
indirect ownership Banca Mediolanum S.p.A. 51.000
direct ownership Mediolanum S.p.A. 44.000
indirect ownership Banca Mediolanum S.p.A. 5.000
direct ownership Mediolanum S.p.A. 100.000
direct ownership Mediolanum S.p.A. 100.000
direct ownership Mediolanum S.p.A. 100.000
direct ownership Mediolanum S.p.A. 100.000


Fees Paid to theIndependentAuditors

Fees paid to the independent auditors
The fees paid to the independent auditors Deloitte & Touche S.p.A. and entities that are part of their network are
set out in the table below.
Mediolanum GROUP(in euro, excluding VAT and expenses)
Service Company Fee (€/’000)
AuditDeloitte & Touche S.p.A. and other entities that are part of their network 863,105
CertificationDeloitte & Touche S.p.A. and other entities that are part of their network 723,808
Tax adviceDeloitte & Touche S.p.A. and other entities that are part of their network 166,550
OtherDeloitte & Touche S.p.A. and other entities that are part of their Italian network 918,340
OtherOther entities that are part of the Deloitte & Touche international network 324,600
Total 2,996,403
Service Company Fee (€/’000)
Audit Deloitte & Touche S.p.A. 185,760
CertificationDeloitte & Touche S.p.A. and other entities that are part of their network -
Tax adviceDeloitte & Touche S.p.A. and other entities that are part of their network -
OtherDeloitte & Touche S.p.A. and other entities that are part of the Deloitte Italian network 172,540
Total 358,300
Please note that the €723,808 fee was charged to mutual funds, segregated funds, unit-linked policies and to the
pension fund as set out in the relevant statements and is not a cost that remains charged to the company that gave
the audit mandate.
Fees paid to the independent auditors
The fees paid to the independent auditors Deloitte & Touche S.p.A. and entities that are part of their network are
set out in the table below.
Mediolanum S.p.A.(in euro, excluding VAT and expenses)
244
SEPARATE ANNUALFINANCIAL STATEMENTS
2012

ResponsibilityStatements

246
SEPARATE ANNUALFINANCIAL STATEMENTS
2012
RESPONSIBILITY STATEMENTS
PURSUANT TO SECTION 154-BIS, PARAGRAPH 2, LEGISLATIVE DECREE 58/98
1. We, the undersigned Ennio Doris, Chief Executive Officer, and Luigi Del Fabbro, Chief Financial Officer respon-
sible for Mediolanum S.p.A. accounting and financial reporting, also pursuant to section 154 bis, paragraphs 3
and 4, of Legislative Decree 58 of February 24, 1998, hereby confirm to the best of our knowledge:
• the adequacy in relation to the characteristics of the business and
• the effective application
of accounting and financial reporting procedures in the preparation of the annual report and accounts for finan-
cial year 2012.
2. The adequacy and the effective application of accounting and financial reporting procedures in the preparation
of the 2012 annual report and accounts were assessed applying a process defined by Mediolanum S.p.A. in
accordance with the Internal Control – Integrated Framework issued by the Committee of Sponsoring
Organizations of the Treadway Commission, which is an internationally accepted framework.
3. We also confirm that:
3.1 the annual report and accounts for the year ended December 31, 2012:
a) have been prepared in accordance with the International Accounting and Financial Reporting
Standards adopted by the European Commission pursuant to the European Parliament and Council
Regulation (EC) 1606 of July 19, 2002 as well as the regulations implementing section 9 of Legislative
Decree 38/2005;
b) reflect the accounting entries and records;
c) give a true and fair view of the financial position, result of operations and cash flows of the issuer and
of all entities included in the consolidated financial statements;
3.2 the directors’ report includes reliable information on the performance, result of operations and the busi-
ness of the issuer and of all entities included in the consolidated financial statements as well as descrip-
tion of principal risks and uncertainties to which they are exposed.
Basiglio, March 21, 2013
Chief Executive Officer Chief Financial Officer
(Ennio Doris) (Luigi Del Fabbro)

Report of the Board of StatutoryAuditors

248
SEPARATE ANNUALFINANCIAL STATEMENTS
2012
Dear Shareholder,
pursuant to article 153 of Legislative Decree No. 58 of February 24, 1998 and to article 2429 of the Italian Civil
Code, we report on our supervisory activities. We have performed our statutory supervisory duties in accordance
with the Italian Civil Code, article 148 et seq. of the aforesaid Legislative Decree, with the instructions contained
in CONSOB Communication No. DEM/1025564 of April 6, 2001, and also taking into account the principles of
conduct recommended by the National Council of Accountants.
* * *
We confirm that Mediolanum S.p.A. financial statements for the year ended December 31, 2012, which reported
net profit of €133,619,860, were prepared in accordance with the international accounting and financial report-
ing standards (IAS/IFRS) and were delivered to us with our prior waiver of statutory terms.
In addition to the specific statutory disclosures required in financial reporting, the notes to the financial statements
set out information deemed appropriate to give a true and fair view of the Company’s financial position, results of
operations and cash flows.
The Directors’ Report sets out appropriate comprehensive information on operations.
You are reminded that Mediolanum S.p.A., being the parent company of the Mediolanum Group, a financial con-
glomerate operating mainly in the insurance sector, is required to submit the Consolidated Financial Statements,
which include the accounts of your Company and those of its directly or indirectly controlled subsidiaries.
Based on our examinations, we confirm the Consolidated Financial Statements of the Mediolanum Group were pre-
pared in accordance with the law and give a fair view of the financial position, results of operations and cash flows
of the Group for the financial year ended December 31, 2012. We also confirm the Directors’ Report gives a fair
view of the company’s affairs and information therein is consistent with the information set out in the consolidat-
ed financial statements for the year ended December 31, 2012.
For the seventh year in a row, alongside the Annual Report and Accounts your company prepared the Social Report,
which demonstrates the connection between competitive business strategies, the values of the Group and the rela-
tionship with the stakeholders.
* * *
With regards to the manner in which we performed our statutory duties, we advise you that:
• we attended all the meetings of the Board of Directors, of the Audit & Risk Committee and of the Nomination
& Compensation Committee;
Report of the Board of Statutory Auditorsto the General Meeting convened to approve Mediolanum S.p.A. Financial Statements for the year ended December 31, 2012pursuant to article 153 of Legislative Decreeno. 58/1998 and to article 2429 paragraph 3 of the Italian Civil Code

249
REPORT OF THE BOARD OFSTATUTORY AUDITORS
• we held a number of meetings with the head of Internal Audit to exchange information on activity performed and
on audit programmes;
• we performed periodic checks to verify compliance with the law and the company’s Bylaws, adherence to princi-
ples of proper management and the adequacy of the company’s organisational structure and internal control sys-
tem;
• we had regular exchanges of information with the independent auditing firm;
• we constantly monitored the events relating to the Company and the Group.
In conclusion of our activity, in accordance with CONSOB recommendations and instructions, we wish to highlight
the following:
1. Most significant transactions with regard to the company’s financial position, results of operations and cashflows.During the year, we received regular information from Directors on the activities carried out by the Company and
its subsidiaries including transactions which could have a significant impact on financial position, result of opera-
tions and cash flows.
In their Report, the Directors have comprehensively illustrated said transactions, which included:
• the injections made into the subsidiary Banca Mediolanum S.p.A. on March 14, 2012 and September 28, 2012,
each amounting to €25 million, to strengthen the capital of the subsidiary. Additionally, on November 6, 2012,
the General Meeting of Banca Mediolanum S.p.A. approved the proposal for a capital increase in one or more
occasions from €500 million to €700 million and on December 5, 2012, Mediolanum S.p.A. proceeded to make
an initial injection of €100 million;
• the issue and public offering of non-convertible notes aggregating to €337.2 million (nominal value), pursuant
to the resolution passed by the Mediolanum S.p.A. Board of Directors on July 31, 201, mainly for the purpose
of diversifying debt facilities and support subsidiaries’ business growth;
• the issue of 518,550 new Mediolanum dividend-bearing ordinary shares following the exercise of stock options.
This entailed a €51,855.00 increase in Mediolanum ordinary share capital and a €483,795.23 increase in the
share premium account;
• on September 11, 2012, the Board of Directors of Mediolanum S.p.A. resolved to proceed to acquire the entire
share capital of Mediolanum Assicurazioni S.p.A. for €35.9 million, a consideration determined on the basis of
Mediolanum Assicurazioni S.p.A.’s accounts and the value of its in-force business at March 31, 2012, as backed
by PriceWaterhouseCoopers Advisory S.p.A.’s valuation of the company’s entire capital. Said consideration is
subject to adjustments based on Mediolanum Assicurazioni S.p.A.’s accounts and net present value of its in-force
business as of the end of the month in which the insurance regulator will give the green light to the transaction
which is expected by the end of March 2013.
We ascertained that the transactions that were resolved and implemented were in accordance with the law and the
company’s Bylaws, and in line with proper management principles. We satisfied ourselves that said transactions
were not manifestly imprudent or risky, did not represent a potential conflict of interest, were not in contrast with
the resolutions passed at General Meetings and did not put the company’s equity at risk. For more detailed infor-
mation on the characteristics of the transactions and their recognition in the accounts you are referred to the
Directors’ Report.
As set out in the Directors’ Report, after December 31, 2012 there were no other events which could have a signif-
icant impact on the financial position, results of operations and cash flows of the Company.
2012 financial results were impacted by the €19.8 million one-off impairment on the stake held in Mediobanca. In
light of Mediobanca stock performance during 2012, last October Mediolanum decided to review for impairment

250
SEPARATE ANNUALFINANCIAL STATEMENTS
2012
the value of its stake therein before the end of the financial year. At year end, impairment review was again under-
taken to determine the recoverable amount of the investment in Mediobanca at December 31, 2012. On both occa-
sions, for impairment review purposes Mediolanum S.p.A. requested the assistance of an independent valuer. The
recoverable amount of the stake in Mediobanca at year end 2012 was found to range between €9.76 and €10.39
per share. Based on said valuation, the Board of Directors of Mediolanum S.p.A. resolved to carry the value of the
stake in Mediobanca at the median value of €10.05 per share in the accounts at December 31, 2012.
2. Atypical and/or unusual intercompany or related party transactions.During the year, we did not detect or receive any indication from the Board of Directors, the Independent auditors
or the head of Internal Audit of the existence of any atypical and/or unusual third-party, intercompany or related
party transactions.
Related party transactions, which mainly relate to the exchange of services with Group companies, as illustrated by
the Directors in the Notes to the Financial Statements, were carried out at arm’s length. Staff secondment and cen-
trally managed services were charged on the basis of actually incurred costs.
We satisfied ourselves that the abovementioned transactions, which are of an ordinary nature, were fair and in the
best interests of the company, and were in connection and expedient to the achievement of the company’s purpose.
3. Appropriateness of the information disclosed in the Directors’ Report on atypical and/or unusual, intercompa-ny or related party transactions.See section 2. above.
4. Disclosures contained in the Independent Auditors’ Report.The independent auditors Deloitte & Touche S.p.A. issued their report on the Annual Financial Statements without
observations, certifying that they are in accordance with applicable rules governing financial statement preparation.
5. Notices or complaints under article 2408 of the Italian Civil Code.On April 18, 2012 the shareholder Carlo Fabris lodged a complaint under article 2408 of the Italian Civil Code
with the Board of Statutory Auditors. In his complaint said shareholder claimed the illegitimacy of the resolution
passed by the Board of Directors at its meeting of November 10, 2010 whereby the Board had repealed the last
paragraph of article 9 of the Company’s Bylaws that required publication of the Notice of the Annual General
Meeting in Italy’s Official Journal. The shareholder claimed that said amendment had not been mandated by law
and as such it should have been voted by shareholders at the Annual General Meeting and not resolved by the Board
of Directors. Our response on the matter given at the Annual General Meeting held on April 19, 2012, as recorded
in the AGM Minutes, mirrors our response to shareholder Fabris dated October 5, 2012. We confirm again herein
that, we believe the amendment to article 9 of the Bylaws of Mediolanum S.p.A. approved by the Board of Directors
at its meeting of November 10, 2010 satisfied all requirements of the law and the Bylaws.
6. Conferral of further appointments to the independent auditors or other parties linked to them and related costs.We have reviewed evidence of the fees paid by the Company to the independent auditors Deloitte & Touche S.p.A.,
and entities that are part of their international network as detailed below.
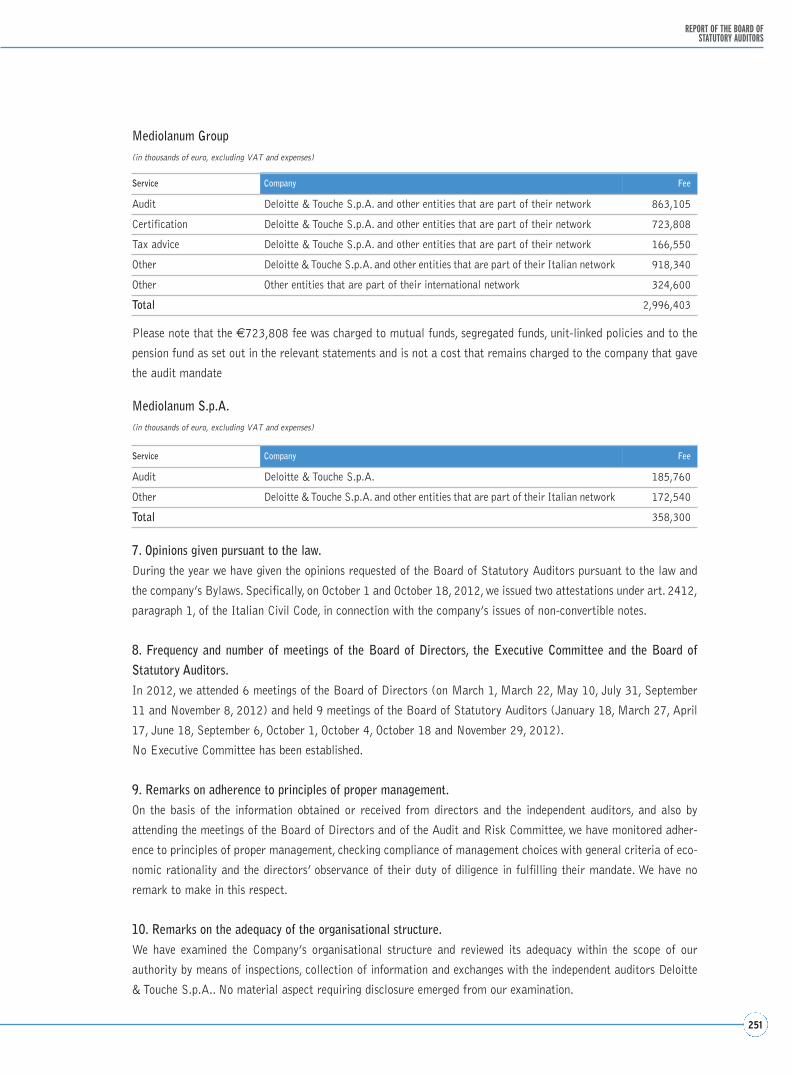
251
REPORT OF THE BOARD OFSTATUTORY AUDITORS
Mediolanum Group (in thousands of euro, excluding VAT and expenses)
Service Company Fee
Audit Deloitte & Touche S.p.A. and other entities that are part of their network 863,105
Certification Deloitte & Touche S.p.A. and other entities that are part of their network 723,808
Tax advice Deloitte & Touche S.p.A. and other entities that are part of their network 166,550
Other Deloitte & Touche S.p.A. and other entities that are part of their Italian network 918,340
Other Other entities that are part of their international network 324,600
Total 2,996,403
Service Company Fee
Audit Del oitte & Touche S.p.A. 185,760
Other Deloitte & Touche S.p.A. and other entities that are part of their Italian network 172,540
Total 358,300
Please note that the €723,808 fee was charged to mutual funds, segregated funds, unit-linked policies and to the
pension fund as set out in the relevant statements and is not a cost that remains charged to the company that gave
the audit mandate
Mediolanum S.p.A. (in thousands of euro, excluding VAT and expenses)
7. Opinions given pursuant to the law.During the year we have given the opinions requested of the Board of Statutory Auditors pursuant to the law and
the company’s Bylaws. Specifically, on October 1 and October 18, 2012, we issued two attestations under art. 2412,
paragraph 1, of the Italian Civil Code, in connection with the company’s issues of non-convertible notes.
8. Frequency and number of meetings of the Board of Directors, the Executive Committee and the Board ofStatutory Auditors.In 2012, we attended 6 meetings of the Board of Directors (on March 1, March 22, May 10, July 31, September
11 and November 8, 2012) and held 9 meetings of the Board of Statutory Auditors (January 18, March 27, April
17, June 18, September 6, October 1, October 4, October 18 and November 29, 2012).
No Executive Committee has been established.
9. Remarks on adherence to principles of proper management.On the basis of the information obtained or received from directors and the independent auditors, and also by
attending the meetings of the Board of Directors and of the Audit and Risk Committee, we have monitored adher-
ence to principles of proper management, checking compliance of management choices with general criteria of eco-
nomic rationality and the directors’ observance of their duty of diligence in fulfilling their mandate. We have no
remark to make in this respect.
10. Remarks on the adequacy of the organisational structure.We have examined the Company’s organisational structure and reviewed its adequacy within the scope of our
authority by means of inspections, collection of information and exchanges with the independent auditors Deloitte
& Touche S.p.A.. No material aspect requiring disclosure emerged from our examination.

252
SEPARATE ANNUALFINANCIAL STATEMENTS
2012
11. Adequacy of the internal control system.The internal control system, i.e. the system designed to verify compliance with the internal operational and admin-
istrative procedures adopted to ensure proper management, prevent possible financial and operational risks as well
as any frauds against the company, is in substance adequate to the size of the Company.
In particular, we regularly collected information on the activities performed, during the meetings of the Audit and
Risk Committee and in meetings with the head of Internal Audit.
We advise you that the organisational, management and control Model under Legislative Decree 231/2001 was
updated in March 2012 adding environmental compliance to the purview of the model. Further updating is sched-
uled in 2013 to incorporate other amendments to legislation made in 2012.
12. Accounting system adequacy and reliability. On the basis of our reviews and verifications, we satisfied ourselves that the accounting system is adequate, it is reli-
able and suitable to represent fairly the company’s affairs.
13. Adequacy of the instructions given to subsidiaries.We satisfied ourselves that the instructions given by the Company to its subsidiaries, pursuant to article 114, para-
graph 2, of Legislative Decree 58/1998, enable subsidiaries to provide timely information to the Parent Company
for its compliance with statutory disclosure requirements.
14. Remarks on meetings with the independent auditors.From the exchanges we had with the representatives of the independent auditing firm Deloitte & Touche S.p.A., pur-
suant to article 150 of Legislative Decree 58/1998, no issue emerged that needs to be brought to your attention.
15. Compliance with the Code of Conduct for listed companies.As early as 2000 the company adhered to the Code of Conduct for listed companies issued by Borsa Italiana and
since then it has been regularly reviewing and fine-tuning corporate governance rules to align them with any regu-
latory changes as set out in the Annual Report on Corporate Governance.
In compliance with the provisions of paragraph 5 of article 3 of the Code of Conduct, we verified the correct applica-
tion of the criteria and control procedures adopted by the Board of Directors to assess the independence of its mem-
bers, as well as compliance of Board members with the independence requirements set forth in the Code of Conduct.
16. Final remarks on our supervisory work.In the performance of our statutory supervisory duties, as described above, we did not find any omissions, inconsis-
tencies or irregularities requiring reporting.
17. Proposals of the Board of Statutory Auditors to the General Meeting.In consideration of the foregoing, within the scope of our authority, we express our favourable opinion on the
approval of the financial statements for the year ended December 31, 2012 and agree with the resolutions proposed
by the Board of Directors.
Milan, March 26, 2013 THE BOARD OF STATUTORY AUDITORS
Ezio Simonelli
Riccardo Perotta
Francesco Vittadini
Independent Auditors’ Report
254

255


GeneralMeeting ofApril 23, 2013
258
SEPARATE ANNUALFINANCIAL STATEMENTS
2012
RESOLUTIONS ABSTRACT
At the 2013 Annual General Meeting shareholders representing 69.016% of share capital by majority of votes
resolved:
Ordinary Meeting:
• to approve the financial statements for the year ended December 31, 2012, which reported net profit of
€133,619,860.24 including the Directors’ Report;
• to appropriate net profit for the year amounting to €133,619,860.24 as follows:
– distribution of a full-year dividend of €0.18 per share (par value of €0.10) to the shareholders, including the
2012 interim dividend of €0.10 paid in November 2012 and the final dividend of €0.08 (before withholding
tax) per share;
– the remainder to the extraordinary reserve as the legal reserve has already reached the statutory limit;
– the final dividend will be due for payment from May 23, 2013 (coupon No. 26) through intermediaries, record
date May 22, 2013;
• to authorise the Board of Directors to purchase and sell up to 8,000,000 treasury shares with par value of
€0.10 each, which correspond to about 1.09% of share capital, within the limit amount of €40 million, for a
period of one year and in any case for a period of no more than eighteen months;
• to confirm Board Director Prof. Carlo Secchi;
• to confirm Board Director Francesco Barbaro
up until the expiration of the entire Board of Directors, i.e. up until the date of the General Meeting convened
to approve the financial statements for the year ending December 31, 2013;
• to confirm Prof. Carlo Secchi as Chairman of the Board of Directors;
• to approve the Board of Directors Report on Compensation Policies.
Extraordinary Meeting:
• to approve the amendments to the Bylaws as proposed by the Board of Directors in their Report, namely the
amendments to articles 9, 10, 11, 12, 17, 23 and 27 of the Bylaws relating to:
a. gender quotas;
b. exercise of certain rights of shareholders in listed companies;
c. authorities delegated to the Board of Directors regarding issues of non-convertible bonds.
Annual General Meeting of April 23, 2013
