annual report 2012 - national bank of abu dhabi of directors and senior management 14 nbad at a...
TRANSCRIPT

Annual Report 2012


3
The Late His Highness Sheikh Zayed Bin Sultan Al Nahyan
First President of the United Arab Emirates


5
His Highness Sheikh Khalifa Bin Zayed Al Nahyan
President of the United Arab Emirates and Ruler of Abu Dhabi


7
His Highness Lt. General Sheikh Mohamed Bin Zayed Al Nahyan
Crown Prince of Abu Dhabi and Deputy Supreme Commander of the UAE Armed Forces

Contents

9
Vision, Mission, Values, Customer Pledge and CSR Policy 10
Board of Directors and Senior Management 14
NBAD at a Glance 18
Chairman’s Report to Shareholders 22
Group Chief Executive Review 26
Consolidated Financial Statement
•IndependentAuditors’Report 40
•ConsolidatedStatementofFinancialPosition 41
•ConsolidatedIncomeStatement 42
•ConsolidatedStatementofComprehensiveIncome 43
•ConsolidatedStatementofChangesinEquity 44
•ConsolidatedStatementofCashFlows 45
•NotestotheConsolidatedFinancialStatements 46
RiskManagement&BaselIIPillarIIIDesclosures 100
Corporate Governance Report 126
Shareholders’Information 142
Group Network 146

Vision, Mission, Values, Customer Pledge and Corporate Sustainability Policy

11

Our Vision
To be recognised as the World’s Best Arab Bank
Our Mission
To provide our customers with exceptional service by creating products and delivering services of enduring value to help our customers grow
Our Values
•Valueourstakeholders•Accessibletoourcustomers24x7•Loyaltoourheritageandglobalinouroutlook•Understandourcustomers’needs•Recognisethatpeopleareoursinglebiggestassetandempowerthem•Teamwork•Dealwithothersaswewouldlikethemtodealwithus

13
Our Customer Pledge
•Wewillrecogniseyou•Wewilllistentoyou•Wewillunderstandyourneeds•Wewilldedicateallourenergiestoservingyou•Wewillgrowwithyou
Our Corporate Sustainability Policy
Investinginourfuture.Wearecommittedtodoingbusinessinaresponsibleway; by dealing with our customers, investors and other stakeholders honestly and fairly, by valuing our employees, by being accessible and responsive to the communities where we do business and through careful environmental stewardship.

Board of Directors & Senior Management

15

Board of Directors
ChairmanH. E. Nasser Ahmed Alsowaidi
Deputy ChairmanH. E. Dr. Jauan Salem Al Dhaheri
MemberSheikh Mohammed Bin Saif Bin Mohammed Al Nahyan
Member H.E. Sultan Bin Rashed Al Dhaheri
MemberMr. David Beau
MemberMr. Matar Hamdan Al Ameri
MemberSheikh Ahmed Mohammed Sultan Al Dhaheri
MemberMr. Hashim Fawwaz Al Kudsi
MemberH.E. Mohammed Omar Abdulla
MemberMr. Khalifa Sultan Al Suwaidi
Member & Group Chief ExecutiveMr. Michael H. Tomalin
Risk Management Committee (RMC)
ChairmanH.E. Nasser Ahmed Alsowaidi
MembersSheikh Ahmed Mohammed Sultan Al DhaheriH.E. Dr. Jauan Salem Al Dhaheri H.E. Sultan Bin Rashed Al DhaheriMr. Hashim Fawwaz Al Kudsi
Remuneration Committee (RC)
ChairmanH.E. Mohamed Omar Abdulla
MembersSheikh Mohammed Bin Saif Bin Mohammed Al NahyanSheikh Ahmed Mohammed Sultan Al Dhaheri Mr. Khalifa Sultan Al Suwaidi Mr. David Beau
Audit Committee (AC)
ChairmanSheikh Mohammed Bin Saif Bin Mohammed Al Nahyan
MembersMr. Khalifa Sultan Al Suwaidi Mr. Matar Hamdan Al AmeriMr. David Beau
Corporate Governance and Nominations Committee (CGNC)
ChairmanH. E. Nasser Ahmed Alsowaidi
MembersH.E. Mohamed Omar AbdullaMr. Khalifa Sultan Al Suwaidi Mr. Matar Hamdan Al Ameri

17
Senior Management
Group Chief Executive Mr. Michael H. Tomalin
Deputy Group Chief Executive Mr. Abdulla Mohammed Saleh AbdulRaheem
Senior General Manager Domestic Banking & Islamic Banking Mr. Abdulla Khalaf Ahmed Al Otaiba
Senior General Manager & Group Chief Risk Officer Mr. Abhijit Choudhury
Senior General Manager Global Wholesale & Investment Banking Mr. Akram-Mark Yassin
Senior General Manager & Group Chief Operating Officer Mr. Khalaf Sultan Rashed Al Dhaheri
Senior General Manager Global Financial Markets Mr. Mahmood Al Aradi
Senior General Manager International Banking Mr. Qamber Ali Al Mulla
Senior General Manager Global Wealth Mr. Rudiger Von Wedel
Senior General Manager Corporate Banking & Real Estate - UAE Mr. Saif Ali Mohammed Munakhas Al Shehhi
Regional Manager Northern Emirates Mr. Abdullah Abdulla Ghobash
General Manager & Group Chief Compliance Officer Mr. John Garrett
General Manager & Group Chief Audit Officer Mr. Malcolm Walker
Group General Counsel and Board Secretary Mr. Samer Salah Abdelhaq

NBAD at a Glance

19

Key Facts•Incorporated in 1968 to serve as Banker to the
Emirate of Abu Dhabi
•Owned (70%)byGovernmentofAbuDhabi,viatheAbuDhabiInvestmentCouncil(ADIC)
•ListedonAbuDhabiSecuritiesExchange (ADX)since its inception in November 2000 with a market capitalisation of around USD 11 billion
• Among the highest rated banks in the Middle East (rated‘Aa3’byMoody’s,‘AA-’byFitch&‘A+’byS&P)
•One of the largest domestic networks with 121branches & cash offices, 571 ATMs/CDMs & 13 Business Banking centers across the UAE
* All figures as of 31 December 2012
• Well diversified Financial Group – across businesses and geography
• Consistent profitability and value creation to shareholders
• Well positioned for growth from global economic recovery
•‘SafestBankintheMiddleEast’-highestratedbank in the Middle East (Global Finance)
• Putting the client at the heart of the business
• Clear and focused strategy for growth
•Investinginthebusiness-developingandgrowing our fee income generating business
•Peoplefocused-attracting,selectingandretaining top tier staff across all
NBAD at a Glance*
Washington, D.C.
London
Paris Geneva
Egypt
Sudan
Kuwait Bahrain
Oman
Libya
Hong Kong
Jordan
UAE
Channel Islands
Malaysia
Shanghai
Financial Snapshot
2012 AED USD (Bn) (Bn)
Revenue 8.7 2.4
NetProfit 4.3 1.2
Assets 300.6 81.8
Equity 31.1 8.5
Return on ShareholdersFunds 16.5%
CapitalAdequacyratio 21.0%
Tier-ICapitalratio 17.2%
Worldwide presence of NBAD
3,019 3,020 3,683 3,708
4,332
5,301 6,399 7,179 7,881
8,671
164.7 196.8 211.4 255.7
300.6
14.4 20.4
24.1 26.4 31.1 Medium-term
Target 20%
23.6%
18.8% 18.8% 16.3% 16.5%
Revenues (AED million) Net profits (AED million) Assets (AED billion)
2008 2009 2010 2011 2012 2008 2009 2010 2011 2012 2008 2009 2010 2011 2012
Equity (AED billion)Return on average Shareholders’ funds (%) Capital adequacy (%)
2008 2009 2010 2011 2012
15.4% 17.4%
22.6% 20.6% 21.0%
12.6% 14.9% 16.2% 15.6%
17.2%
6%
10%
2008 2009 2010 2011 2012
Total CAR Tier I%
8%
12% UAE CB CAR requirement
Minimum Tier-I requirement
2008 2009 2010 2011 2012

21
A Diversified Business Model
DomesticBanking
UAE Corporate Banking & Real
Estate
Islamic Banking
Global Financial Markets
InternationalBanking
Global Wholesale & Investment
BankingGlobal Wealth
• Consumer & Elite Banking
• Business Banking Group
• UAE Government & Government Related Entities (GREs)
• UAE Corporate Banking
• UAE Real Estate Finance
• Abu Dhabi National Properties
• Abu Dhabi NationalIslamicFinance(ADNIF)
• NBADIslamicDivision
• Corporate coverage
• Trading & Investments
•Cash&Rates
•InstitutionalSales & Primary Markets
• Arab World
- Egypt- Oman- Sudan- Jordan- Bahrain- Kuwait- Libya
• International
- UK- France- USA- Hong Kong- China- Malaysia
• Global Corporates
• Multinationals & Globally operating GREs
• Wholesale Banking Group
-GlobalProject& Structured Finance
-Syndications& Specialised Portfolio
-FinancialInstitutionsGroup
-GlobalTransaction Banking(TradeFinance & Cash Management Services)
•InvestmentBanking Group
-DCM
-Advisory/M&A/ECM/ Private Equity
• Abu Dhabi NationalLeasing–Leasing
• Private Banking
-Investments& Financial Planning for UHNWIs
-On-shore&Off-shore platforms
• Asset Management Group
-Local&GlobalFunds
-DiscretionaryPortfolio Management
• NBAD Securities (Brokerage)
-Retail&HNWIs
-InstitutionalDesk
• Custody services
-Non-discretionary Portfolio Management
-Fundsadministration
• NBADTrustCo.(Jersey)Ltd
-CorporatePension & Savings solutions
-Privatetrusts,charitable foundations
• InvestmentGroup(Investmentproducts&views)
Head Office Support functions
GroupTreasury,Audit,Compliance,Finance,HumanResources,InformationTechnology,Legal,Operations, RiskManagement,InvestorRelations,CorporateCommunications,StrategicPlanning,SecuritiesServices,
Corporate Governance، Economic Research
National Bank of Abu Dhabi

Chairman’s Report to the Shareholders
for the Financial Year ended 31 December 2012

23

On behalf of the Board of Directors of National Bank of Abu Dhabi, I would like to commend and thank our senior management and staff for their efforts in enabling the group to produce good results in a challenging year characterised by difficult economic conditions.
Economic conditions in 2012
Global economic activity grew by 3.3% in 2012, down
slightly from 3.8% in 2011. The uncertainty surrounding
financial systems in many developed economies continues
to dampen the pace of global activity. Moreover, prospects
for the Euro Area remain a risk, although forceful
intervention by the European Central Bank has been an
important factor in easing concerns and providing time for
the Euro Area to implement greater financial and fiscal
integration. Monetary policy by major Central Banks has
been and is expected to remain, by necessity, extremely
accommodative to provide a cushion for fiscal adjustment.
United Arab Emirates continued to grow while other
economies faced challenges. Transport, trade, tourism,
and manufacturing activity picked up. Residential property
prices rose in a number of areas in Dubai. Nevertheless,
real estate sector overhang and corporate debt resolution
remained challenges. Throughout the year, the UAE
continued to be viewed as a safe haven in a period of
regional turmoil, further cementing its role as a regional
hub.
Average oil price in 2012 reached a record US$ 109.1 per
barrel (Dubai, spot), up from US$ 105.7 per barrel in 2011,
allowing oil exporting countries to spearhead growth in
the Middle East and North Africa. United Arab Emirates
raised oil production to the highest level since 2008 and
generated significant current account and fiscal surpluses.
Oil importers in the region grappled with sub-par growth
against the background of political transition and high
energy prices.
Banking sector loan growth – a proxy for the pace of non-
oil activity - was subdued at 3.4% during the year through
November 2012. The loan-to-deposit ratio for the banking
system as a whole declined from 100% to 94% through
November 2012, driven by deposit growth of 10.6% and
signifying healthy liquidity levels across the sector. Banks
in the system also continued to maintain capitalisation
levels well above regulatory requirements.
Financial Performance of the Group
National Bank of Abu Dhabi performed well in 2012 despite
challenging economic conditions. This strong performance

25
in uncertain times reflects the strength of the bank’s global
diversified business model as well as the quality of the
bank’sstaff,oursinglemostvaluableasset.
Netprofitsgrew17%toAED4.3billionforthefullyear
2012, and the growth came essentially from international
businessandoperationswhereas localearningsfellback.
The bank continued to grow its balance sheet and build
upon its strong capital and liquidity positions. In 2012,
the bank was once again named as one of the “World’s 50
Safest Banks” and “the Safest Bank in the Middle East” by
GlobalFinance.
We continued to grow both our domestic and international
operations. Our domestic network expanded to reach
121offices complementedbyover570ATMs. These are
further suppported with the set up of 13 Business Banking
centresdedicatedtoservetheneedsofourSMEcustomers.
Internationally, we opened new offices in China and
Malaysia in 2012 and have set a target of expanding
internationallyfrom14countriesto41countriesby2022.
The Bank is well positioned to continue our growth
trajectory in 2013. We will continue to expand our
local presence while also moving forward with plans to
openmore offices internationally.We anticipate opening
branches inLebanon,SouthSudanandBrazil in2013as
we continue to execute against our international expansion
strategy. At the end of 2012, approximately 42% of our
businesswasderivedfromclientsbasedoutsideUAE.
Finally, on behalf of the shareholders, the members of the
Board of Directors and the management and staff of the
Bank,Iwishtoextendourmostsincereappreciationand
gratitude to His Highness Sheikh Khalifa Bin Zayed Al
Nahyan, President of the UAE and Ruler of Abu Dhabi;
His Highness Sheikh Mohammed Bin Rashed Al Maktoum,
Vice President and Prime Minister of the UAE and Ruler
of Dubai; Their Highnesses members of Supreme Council,
rulers of Emirates; His Highness Sheikh Mohamed Bin
Zayed Al Nahyan, Abu Dhabi Crown Prince and Deputy
Supreme Commander of the UAE Armed Forces and to His
Highness SheikhMansourBinZayedAlNahyan,Deputy
Prime Minister and Minister of Presidential Affairs, for
theircontinuedsupportandinterestintheBank’sactivities.
Nasser Ahmed Khalifa AlsowaidiChairman

Group Chief Executive Review
for the Financial Year ended 31 December 2012

27

In a year marked by ongoing global challenges, National Bank of Abu Dhabi delivered another year of solid results. We continued to make progress towards
our goal to be recognised as the World’s Best Arab Bank, the Super Regional bank from MENA.
In 2012, the bank delivered record top line revenues of AED 8.7 billion and net profits of AED 4.3 billion, representing growth of 10% and 17%, respectively. Return on average shareholders’ funds was 16.5%, assets grew 18% to over AED 300 billion, and our capital adequacy ratios continued to be well in excess of the minimum thresholds required by our regulators.
Our growth in 2012 came from both domestic and international operations, and our international division continued to make increasingly significant contributions to both top and bottom line results. During the year, we continued to expand our presence by setting up offices in China and Malaysia while continuing expansion in the UAE, Egypt and Sudan.
In 2012, we also introduced a key pillar of our long-term strategy, which is our future Target Operating Model (TOM). TOM defines how we will drive sustainable profitable growth by becoming more customer-driven, profit-focused and efficient. This is a bank-wide initiative which will redefine the way we do business and ensure that we are well positioned to drive profit and growth.
We were also once again named as one of the “World’s 50 Safest Banks” and the “Safest Bank in the Middle East” by Global Finance magazine. This is an important accolade during a time when being a safe bank is an important building block of doing good business with others. All of these results and achievements in 2012 are a testament to the talent of our management team and our employees. It is also a result of our prudent growth strategy, which is aligned with the growth of Abu Dhabi and the 2030 Vision.
NBAD delivered record top line revenues of AED 8.7 billion and net profits of AED 4.3 billion in 2012
Some highlights for the bank in 2012 included the following:
• Renewed our sponsorship commitment as FoundingPartner of Yas Marina Circuit and kept our coveted status as the Official Bank of Formula 1 Abu Dhabi Grand Prix.
• HighlightedinvestmentopportunitiesinAbuDhabitoglobal investors as Lead Sponsor of the 4th Annual Abu Dhabi Investment Forum in London.
• Took the lead as a Gold Sponsor of the first ever Abu Dhabi Corporate Games, where more than

29
2500 teams and individuals represented private and government companies from Abu Dhabi and outside theUAE.
• Organised the 4th annual Global Financial MarketsForum, with record attendance of over 700 delegates including formerUSFed chairman,Mr.PaulVolckerand former president of Deutsche Bundesbank, the GermanCentralBank,AlexWeber.
• Held first Sustainability Week to highlight, promoteand educate staff about living and working sustainably; Current ranking of #3 out of 150 companies in the S&P/Hawkamah Environmental, Social & Governance PanArabIndex.
In2012,thebankwonanumberofawards,includingthefollowing:
• Rankedforthefourthconsecutiveyearasoneofthe“World’s 50 Safest Banks” and the “Safest Bank in the MiddleEast”byGlobalFinancemagazine.
• Group Chief Executive named “Banker of the Year”by Arab Bankers Association (ABA) and awardedhonorarydoctoratebyIFSinLondon.
• “ComplianceOfficeroftheYear”atACCAchievementsAwards.
• “Best Private Bank in UAE” at 4th Annual GlobalPrivateBankingAwards.
• “UAE Asset Manager of the Year” in MENA FundManager Performance Awards by MENA Fund Manager magazine.
• “Best Asset Management House in Middle East” byInternationalTakafulAwards.
• Named“FixedIncomeManageroftheYear”byGlobalInvestormagazine.
We have plans to open offices in Lebanon, South Sudan, Brazil, Turkey, India, Iraq and South Korea.
As we enter 2013, we are well positioned for success and continuedexpansionbothlocallyandinternationally.Ourexecution against our international strategy will continue duringthe2013-2014timeframeaswehaveplanstoopenoffices in Lebanon, South Sudan, Brazil, Turkey, India,Iraq andSouthKorea.We alsowill continue to increaseour presence in our existing network including the UAE, Egypt,Oman,Jordan,SudanandBahrain.
IthanktheGroupChairmanandtheBoardfortheirsupportand guidance, my executive team for their delivery and our management team and employees for their continuing efforts, I amproudofour2012performance, and I lookforwardtomoresuccessin2013.
Michael H. TomalinGroup Chief Executive

Financial and Business overview
ThebankearnedAED4,332millionin2012,up16.8%fromAED 3,708million in 2011. This represents diluted EPS ofAED1.04for2012versusAED0.88for2011.Thegrowthwasdueprimarilytohigherinvestmentandinterestincome.Theannualised return on shareholders’ funds for the year was 16.5%,which represents a slight improvement over 16.3%for2011.
NBAD earned AED 4,332 million in 2012, up 16.8% from AED 3,708 million in 2011
Operating income Total operating income increased by 10% to AED 8,671millionfromAED7,881millionin2011.NetinterestincomeandnetincomefromIslamicfinancinggrewatasteadypacethroughout2012,up5.1%toreachAED6,096million.Netfeesandcommissionsgrewby10.9%toAED1,546millionin2012comparedtoAED1,394millionin2011.Overall,non-interestincomegrewstronglyby23.9%in2012toAED2,575million driven largely by an increase of AED 444 million in investmentincomeover2011.
Ournet interestmargindeclinedto2.14%forthefullyear2012,lowerthan2.43%for2011duetoanincreaseinshort-datedsecuredlendingandamoreliquidbalancesheet.Thepercentage lent (loans and advances to total assets) at theendof2012was55%comparedwith62%atyear-end2011.
ExpensesOperatingexpensesfortheyearended2012wereAED2,870million,up11.9%comparedwiththecorrespondingperiod,reflecting continued investment in our business. The costto incomeratiowas33.1%in2012,slightlymorethanthe32.5%recordedforthefullyear2011butbelowtheGroup’smedium-termcapof35%.
The Bank further extended its network, which is already among the largest in the UAE, to 121 branches and cash offices,571ATMsand13businessbankingcentres.TheBankalso continued to invest in other distribution channels such as e-banking and 24x7 call centres, enhancing customerservice capabilities. Our footprint now covers 18 countriesand4continentsasofMarch2013.Ourinvestmentsinourfranchise, network and systems, products and people are in line with our vision to be recognised as the World’s Best Arab Bank.
Operating Profits by Business SegmentsOperatingprofitsgrew9.1% toAED5,801million in2012compared to AED 5,317million in 2011. Operating profitsfor our International businesses grew by 26% to AED935 million, while investment gains drove Head Office’scontributionhigherbyAED130million.FinancialMarketsGroup and Global Wealth businesses also performed well.Operatingprofitsfromourdomesticbusinesseswerealmostflat,reflectingtougherlocalconditions.
Provisions & Impairment chargesNet impairment charges were AED 1,337 million in 2012, 10.8% lower than 2011. The increase in gross specificprovisions of AED 418 million was neutralised by the increaseofAED408millionofrecoveriesandwrite-backs.The collective provision charge for 2012 was lower by AED 136millioncomparedto2011.TheBankcontinuestobefullycompliant with the Central Bank of UAE’s requirement of1.5%ofcreditriskweightedassetsforcollectiveprovisions,wellaheadoftheeffectivedateof2014.
FY 2011
FY 2012 1st Quarter
1st Half Nine
Months Full Year
927 1,952 2,984 3,708
1,041 2,087 3,212 4,332
7,881 8,671
+293 +152 +444 -116 +17
2011 Net Interest Income & net Income from
Islamic financing
Fees & Commissions,
net
Net investments
income
Net foreign exchange
gains
Other operating income
2012
Corporate & Investment
banking 44%
Domestic banking
18%
International banking
16% Financial Markets
16%
Global Wealth
2%
Islamic banking
3% Head Office
1%
Net profit (AED mn)
Movement in Operating income (AED mn)

31
Non-performing loans increased to AED 5,781 million,representing 3.4% of the loan book and in line with ourindicationsatthebeginningoftheyearthatnon-performingloans should plateau at between 3.5% and 3.75%. Totalprovisionsrepresented95.4%ofnon-performingloans.
NBAD continues to be fully compliant with the Central Bank of UAE’s requirement of 1.5% of credit risk weighted assets for collective provisions, well ahead of the effective date of 2014.
Balance SheetTotalAssetswereAED300.6billionasof31December2012,up17.6%versus31December2011.LoansandadvancestocustomerswereAED164.6billionasof31December2012.Loangrowthof3.2%yearonyearfortheGroupwasslowerthananticipated.CustomerdepositswereAED190.3billion,up 25.4% as of 31 December 2012. Throughout the year,there were significant inflows and outflows of government deposits,someofwhichwereofashort-termnature.Thesedepositswereplacedacrossvariousclassesof liquidassetsonsimilartenors.
Capital resourcesofAED36.8billionwerehigherby7.0%over 31 December 2011, consisting of shareholders’ funds ofAED27.1billion(includingaAED1.6billionincreaseinfair value reserve on investments due to favorable market movements), GoAD Tier-I capital notes of AED 4.0 billionandsubordinatednotesofAED5.7billion.
Basel-II ratios remain strongandwellabove theminimum12%and8%(Tier-I)requiredbytheUAECentralBank,withacapitaladequacyratioof21.0%andaTier-Iratioof17.2%asof31December2012.
Capital Markets ActivityThe Bank repaid AED 2.6 billion of the original AED 5.6billionMinistryofFinance(MoF)subordinatednotesduringtheyear.TheremainingoutstandingbalancenowstandsatAED3.0 billion. TheBank also issued anotice to exerciseits call option on its London Stock Exchange-listed AED2.0billionsubordinatedconvertiblenotesduein2018.TheoutstandingprincipalamountwasAED808.5millionasof15thFebruary,2013.TheBanksuccessfullyissuedaMYR500million (Malaysian Ringgit) Sukuk (equivalent USD 163.4million)withacouponof4.75%foratermof15years.Thiswasthefirsteverissuanceofasubordinateddebtbyanon-MalaysianfinancialinstitutioninMalaysia.
Under its USD 5 billion EMTN programme, the Bank tapped thecapitalmarketswith2majorpublicissuancesofUSD750million each inMarchandAugust. The issuance inMarchwas a 5-year bondwhichwas oversubscribed 4 times andtheorderbookswereclosedwithinaday.Thesecondmajorissuancein2012inAugustwasa7-yearbond,thelongestseniordollarbenchmarkeverprintedbyabankintheregion.InMay,theBankissuedaUSD25million30-yearbond,theregion’slongesttenorbondissuedbyafinancialinstitution.
Credit RatingsNBAD’s long term ratings continue to remain amongst the strongest combined ratings of any financial institution in the MENA region with ratings from Moody’s Aa3, Standard & Poor’s(S&P)A+,FitchAA-,RAM(Malaysia)AAAandR&I’s(Japan)ratingofA+.Allratingswerereaffirmedin2012withastableoutlook.
DividendThe Board of Directors approved a cash dividend of 35%(or35filspershare)andastockdividendof10%(1bonusshareforevery10sharesheld)forthefinancialyearended31December 2012 at the Annual General Meeting on 12 March 2013.
0
50
100
150
200
250
300
350
Assets Loans Deposits TBs*/Subdebt Equity 2011 255.7 159.5 151.8 23.1 26.4
2012 300.6 164.6 190.3 24.7 31.1
AED bn
+18% +3% +25% +7% +18%
*Term Borrowings
1,550
2,658 3,664
4,801 5,518
848 1,604
1,892 2,321 2,428 1,072
1,687
3,249
4,839
5,781
2008 2009 2010 2011 2012
Total Provisions Collective Provisions NPLs (AED mn)

Domestic Banking Division (DBD)
The division contributed 18% or AED 1,066 million tothe Group’s operating profit in 2012. The Retail, BusinessBankingandIslamicdivisionofthegroupcontinuedtofocuson the customer experience. Customer acquisition numbersare growing in parallel with our expanding distribution and enhanced value proposition, which is ‘to provide ourcustomers with exceptional service by creating and delivering services of enduring value to help our customers grow’.Ourapproach is built on providing convenience and accessibility to our customers and ensuring that both physical and online presences are being optimised to meet the diverse demands of ourcustomers.
Customer CentricityOurcustomersurveyresultshavebeenaboveindustryaverages,and we continue to enhance our offerings by utilising the feedback we receive to provide best in class service. As anexample,wehaverolledouttheconceptofserviceambassadors.
Largest Distribution and Online PlatformsWe have a total of 121 branches and cash offices in the UAE, offering one of the largest networks in the UAE, and we are enhancing our branches by introducing a new image and ‘lookandfeel’toenrichthecustomerexperience.IntermsofATMs &CDMs, we have one of the largest networks in the UAE with 571 and have introduced new designs for NBAD ATMs, including‘Drive-thru’ATMs.Intermsofalternativeplatforms,weredevelopedouronlinebankingplatform(‘NbadOnline’)aswell as a new mobile banking platform, both of which have generatedsignificantadoptionratesandincreasedusers.
Enhanced ProcessesBy automating and streamlining our credit origination processes, we have enhanced the turnaround time and reliability of our products, enabling our sales force to focus more on customer-specificneeds. Our ‘drive for excellence’has now been implemented across 86 branches, and the model has improved the level of sales and service culture within the bankandhassucceededindrivingnewcustomeracquisitionacrossthecountry.
Our customer survey results have been above industry averages, and we continue to enhance our offerings by utilising the feedback
New Products and Strategic PartnershipsWe have also added new products to our portfolio and have seen goodresultsfromourBancassuranceandInvestmentproducts.NewpartnershipswithcompanieslikeDubaiIslamicInsuranceandRe-InsuranceCompanyAMANhavebeensuccessfulandwewillcontinuetopursuethese.
Ourcreditcardbusinesscontinuestogrowsuccessfullyandthebusiness has generated strong sales through product launches, sales campaigns, event sponsorship in GEMS Education and movieticketoffersthroughReelandCineRoyalcinemas.
The Elite Banking segment continues to focus on the high net worth customer segment, providing them with more personalisedproductsandservices,includingeventVIPloungeaccess and complimentary access to Abu Dhabi’s finest golf clubs.
Economic vision 2020 and EmiratisationDBD, and in particular the retail banking division, makes the largest contribution to our Group’s Emiratisation efforts, providingchallengingopportunities, specialassignments, jobrotationsandclearpathsforcareerprogressiontoEmiratis.In2012, we successfully opened the Al Ain Contact Centre, a fully functional call centre handling almost 3 million calls per year, whichisstaffedfullywithfemaleEmiratis.
H.H. Sheikh Mansour Bin Zayed Al Nahyan, the Deputy Prime Minister and Minister of Presidential Affairs of the UAE, presents Emiratisation award to Ehab Hassan, Group Chief Human Resources Officer, praising NBAD’s Initiatives.
NBAD introduces new ATM design.
NBAD introduces new “look and feel” for branch offices.

33
Business Banking, which has an ongoing strategy to expand exclusive services to small and medium sized enterprises(SME),continuedtostrengthenitsdistributionchannelsintheUAEwith2newbusinesscentresintheUAE.
International Banking (IBD) IBD,consistingofouroperationsacross theArabWorldandinternationally, increaseditsoperatingprofitby26%toAED935million in2012. IBDaccountedfor16%of theGroup’soperatingprofits.
International StrategyThe bank’s international strategy is comprised of two distinct approaches. InMENA,wewillbuild“in-country”capabilityserving in particular the upper end of the retail and corporate markets. In the rest of the world, we are establishing aninterlinked chain of offices intermediating trade and capital flowsbetweenourMENAheartlandandtherestoftheworld.InLondon,Paris,Washington,DCandHongKong,forinstance,our clients include international companies and investors doing business in the UAE and wider MENA as well as MENA companiesandinvestorslookingtogobeyondtheregion.InBrazil,wewillbefinancingthegrowingtradeflowsbetweenthatcountryandMENA,workingalongsideBrazilianbanks.
NBAD expanded the size of its international business to 57 units across 14 countries
Business & Expansion UpdatesDuringtheyear,theBankexpandedthesizeofitsinternationalbusiness to 57 units across 14 countries by opening 4 units in Egyptandits4thunitinSudan.ThebusinessfurtherexpandedintheFarEastregionwiththeopeningofourShanghaiRep.OfficeChinaandNBADMalaysiaBerhadinKualaLumpur.
In Egypt, our business was stable despite tough marketconditions. Business in the Arab world has been subdued,howeverourbusinessinJordancontinuestogrow.OurLondonoffice had a splendid year building on its trade finance and corporate businesses. Hong Kong enjoyed continued stronggrowth reflecting the growing links between China and the
MiddleEast.
Additionally, work has progressed on opening new units in Juba(SouthSudan),Lebanon,Iraq,India,Brazil,SouthKoreaand Turkey. With regards to our expansion activity in ourexisting network within the coming year, we hope to be able to open3moreunitsinEgypt,2unitsinOman&Jordanand1uniteachinSudanandBahrain. Financial Markets Division (FMD)
FMD had an excellent year in 2012 and continued to enhance its product offering and expand market share both regionally and globally. The division’s contribution reached AED 910million,agrowthof8%andamountingto16%oftheGroup’soperatingprofits.
The division’s contribution reached AED 910 million, a growth of 8% and amounting to 16% of the Group’s operating profits.
Under the Trading & Investment Group,theFXteam(foreignexchange)focusedonincreasingtradingflow,enhancingtheprice delivery channels by focusing on electronic trading for our client and institutions distribution. TheStructured Product Trading & Investment team expanded its product offering and capabilities to include pricing on exotic options; commodity linked notes and increased their volumes more than 6 fold in thisregard.TheMENA Fixed Income team had an excellent year producing solid returns and increasing volumes mainly driven by secondary market trading as well as capitalising on 20newDCM(debtcapitalmarkets)mandatesthatNBADleadmanagedin2012.Thiswassupportedbyexcellentresearchandmarket feedback produced by our Market Strategyteam.ThePortfolio ManagementteamoutperformedtheHFRXindex,producing 6.3% onNBAD’s own invested capital. They alsocompleted the set up and obtained the necessary approval to allowustostartmarketingthisproducttoourclientbase.Ournewest product offering is Prime Brokerage, which currently offers electronic foreign exchange prime brokerage services,
Michael H. Tomalin, the Group Chief Executive of NBAD (middle) and Qamber Ali Al Mulla, the Senior General Manager of the International Banking Division (3rd from left) with NBAD executives and VIP guests at the official launch of NBAD Representative Office in Shanghai.
Paul Volcker, former Chairman of the Federal Reserve, addresses audience at 4th Global Financial Markets Forum, hosted by the Financial Markets Division.

capitalising on NBAD’s superior credit rating and market liquidity.Goingforward,wewillbroadenourprimebrokerageservicestoincludeotherassetclasses.
The Corporate Coverage Group expanded its reach both regionally and globally while continuing to build market share locally. Local flows of structure products and plain vanillabusiness continued to grow. This business has generatedexcellent momentum and currently covers a diversified customer base, thanks to the efforts of the Abu Dhabi and NorthernEmiratesteams.Goingforward,weplantocontinuetogrowthisbusiness. The Institutional Coverage & Primary Market Group had an excellent year syndicating more than 20 new bond mandates, andexpandeditsIslamicandsovereignfundandcentralbankcoverage to include most of the Arab world Central Banks and InvestmentAuthoritiesandplanstofurtherexpandintheUKandAsia. The Cash & Rates group produced superior results and solidified their positioning as the true market leader for GCC currencies.OurREPOofferingshaveexpandedandgrowntoanexcessofUSD7billion,enablingustomanageourliquiditymore efficiently while minimising the credit risk of plain vanilla lending.TheGrouphasalsoinvestedheavilyinexpandingitspricingcapabilitiesintheG7currencies.
Corporate and Investment Banking (CIBD)
ThecombinedbusinesseswithinCIBDcontributedAED2.5bnor44%oftheGroup’sOperatingProfitfor2012.
Corporate Banking Group (CBG)CBG-UAE continued its strong performance in 2012,contributingAED1.5bntotheGroup’soperatingprofitsdespitethegeneraleconomicslowdownintheUAEandabroad.CBGcomprises the coverage teams for GREs and corporate clients in the UAE and continues to play a centric role connecting all businessesandproductpartnerstothebank’sclients.
OurMultinational Global Coverage team expanded during 2012withtheadditionofseasonedinternationalbankers.Wehave embarked on the path of establishing industrial sector specializationandhavededicatedteamsforbothJapaneseandKoreanclients. Thecoverage teamsare focusedonworkingwithleadingglobalcorporationsactiveinMENA.Ourcoverageteams work closely with the product teams throughout the bank to deliver top quality financial services and productsto our corporate client base resulting in a significant number
of transactions in Debt Capital Markets, Global Project &Structured Finance, Trade Finance, and others across the region.
Wholesale Banking GroupTheWholesaleBankingGroup(WBG)consistsofGlobalProjects& Structured Finance, Syndications & Specialised Portfolio, the FinancialInstitutionsGroup,andGlobalTransactionBankingwhichcoversbothCashManagementandTradeFinance.WBGcontributedAED0.9bntotheCIBDoperatingprofitin2012.
Global Projects & Structured Finance (GPSF)GPSF originate, structure, lead arrange and underwrite large andcomplexproject&structuredfinancetransactionsacrossseveral industries and geographies. GPSF has established astrong track record for delivering complex financing solutions for top clients within the region whilst also collaborating with otherlocal,regionalandinternationalbanks.
The combined businesses within CIBD contributed AED 2.5bn or 44% of the Group’s Operating Profit for 2012
The team won several important mandates during the year in diverse sectors such as aviation, nuclear energy, rail transport, petrochemicals,aluminum,andacquisitionfinancing. During 2012, GPSF won the highly commended Deal of the Year2012awardforShamsPowerCo.,intheInfrastructureandProjectFinancecategoryfortheMiddleEastbyTheBankerFTBusinessmagazine.TheteamwontheEmergingEMEALoanoftheYear2012AwardforJAFZAandIFNAwardforthebestCorporateFinanceDealoftheYear2011forEmaarMalls.
Financial Institutions Group (FIG)FIG isdedicated to its 550 financial institutional client base from around the world including banks, insurance companies, sovereign wealth funds, asset management houses and brokeragefirms.FIGaimstobethefirstportofcallforforeignfinancialinstitutionswantingtogrowtheirbusinessinMENA.
Thedivisionwasre-organisedin2012intotwoseparateunits– Portfolio Management and Coverage. Clients were furtherdivided into 3 geographies – MENA, Europe & Americas, and Asia. A separate vertical for Non-Banking FinancialInstitutionsCoveragewassetuptolookafterNBFI’sglobally.
FIG was instrumental in winning 10 DCM mandates andwas ranked No. 3 in the FI League Tables in the GCC. Theteam successfully arranged and closed a number of deals as MandatedLeadArrangeracrosstheGCC,Turkey,India,Brazil,Chileandothercountries.FIGwasat the forefront incross-selling Trade Finance, Treasury, Custody and other products andservicesofthebanktoitsclients.
Syndications & Specialised Portfolio (SSP)SSP has garnered extensive expertise across a wide variety of transactions at the highest levels in key roles such as Bookrunner, Mandated Lead Arranger and Underwriter while managingsyndicates of local, regional, and international corporates and banks.In2012,NBADranked5thasaBookrunnerand6thasaMandatedLeadArrangerintheDealogicsyndicationsleaguetables forGCC,EgyptandTurkey. Inaddition tomanagingprimary distribution, SSP handles all secondary loan sales/purchasesandmaintainsasecurities’investmentportfolio.
Officials from NBAD (from right, Vasgen Edwards, Head of International Corporates and Mark Yassin, Senior General Manager – Global Banking) and Boeing at the signing ceremony for aircraft financing in Abu Dhabi.

35
Global Transaction Banking (GTB)Global Cash Management and Global Trade Finance businesses merged in 2012 to form Global Transaction Banking (GTB).The new GTB business with Regional Heads in Europe, USA, Egypt, andAsiaPacific regionshas invested in state-of-the-art platforms to facilitate end-to-end seamless processing oftransactions.
Amongotherproducts,GTBoffers lettersofcredit (import&export),lettersofguarantee(inward&outward),documentarycredits&collections,standbyLCs,billsforcollection(inward&outward),bridgefinancing(trustreceipts,billsdiscountingetc.)andstructuredtradefinanceproducts.
The Bank now offers its corporate clients new electronic banking services under the NBAD iBankingTMflagship brand comprisingd advanced features such as electronic payment solutions,liquidityandcollectionsmanagement,aswellasallrelatedtradefinanceproductsandservices.
OurInvestment Banking Group (IBG)enjoyedaverybusyandproductiveyearin2012.OntheAdvisoryfront,IBGwasmandated together with Goldman Sachs to advise on the merger of Sorouh Real Estate and Aldar Properties, two leading listed UAE real estate development companies. This was amajorsuccessfulmilestoneforNBADintermsofparticipatingina large-capM&Atransactionalongsideglobal investmentbankingfirms.
NBAD further cemented its position in investment banking by winningprivatemandatesadvisingcorporateandgovernment-related clients on a host of project and corporate finance-related (private debt andM&A) transactions across differenteconomicsectors.
Andontheprivateequityfront,NBADjoinedforceswiththeKhalifa Fund for Enterprise Development in launching aninvestment vehicle supporting SMEs in furtherance of budding Emiratientrepreneurs.
The Debt Capital Markets originating team ranked amongst the top 3 banks in theGCCBookrunner league tables. Theyalsoranked1stamongtheMENAregionalBookrunners.TheDCM team executed a record 20 transactions during 2012 in theMENAregionincludingTurkey.
Our leasing arm, Abu Dhabi National Leasing (ADNL) continued to record impressive growth in 2012 despite the prevailing soft market conditions. Major financing dealswereexecutedintheAviation,InfrastructureandSustainableenergysectors.TheprizednamessupportedbyADNLincludeAbu Dhabi Ports Company, Etihad Airways, National Petroleum ConstructionCompanyandEmiratesAirlines.
Our real estate subsidiary, Abu Dhabi National Property (ADNP), continued to focus on its core businesses of valuations, leasing and property management. In order toimprove operational efficiencies and better positioning in the marketplace, ADNP benefited from a comprehensive review of its operating model and market competitiveness conducted withaviewof realigning theCompany’sstrategicobjectiveswith those of theGroup.Going forward,ADNPwill bewellplaced to benefit from any anticipated recovery in the UAE realestatemarkets.
New Structure for CIBD: Global Wholesale & Investment Bank / CBRE – UAE
CIBDhas been our largest business by revenue and balancesheet.Increasinglyitistwobusinesses–alargelocalcorporateand real estate business and a global wholesale and investment banking business. In order to reflect this, with effect fromJanuary 2013 two new businesses have been created. First,Global Wholesale & Investment Bank, which will include Wholesale Banking (FIG, Trade, Cash, Syndicated Lendingand Project Finance), Investment Banking, Global CorporateBanking forMNCs and globally operatingGREs andADNL;and second, UAE Corporate Banking & Real Estate (CBRE – UAE), will include the UAE Govt & GREs, UAE Corporate Banking,UAERealEstateandADNP.
Global Wealth (GW)
Global Wealth comprising of our private banking, asset management, brokerage and custody activities faced a challenging year given the continued unrest in some of our core markets and the global economic uncertainty. Despitethese challenges, the business performed strongly, more than doubling its contribution to operating profits from AED 65 million(1.2%)in2011toAED138millionin2012(2.4%)andgrowingAssetsunderAdministrationfourfold.
The strongest contributors to the division’s performance in 2012 were our Private Banking activities in the UAE and Switzerland. Assets under Management in Private Bankingagaingrewby50%.Thiscontinuedgrowthisareflectionofthe efforts we have over the past years put into enhancing the breadth and depth of services and investment solutions we providetoourPrivateBankingclients.Thequalitativeresultofthese efforts was rewarded by being awarded the best Private Banking provider in the UAE by the Financial Times’ Private Wealth Management Magazine and by The Banker. We areconfident that we will continue the rapid rate of growth as we expandintoadditionalmarkets.
The strongest contributors to the division’s performance in 2012 were our Private Banking activities in the UAE and Switzerland
Ashraf Mazahreh, the Head of Private Banking at NBAD (left) receives “Best Private Bank in UAE for 2012” award from Yuri Bender, Editor of Professional Wealth Management Magazine.

In 2012 we rebranded our brokerage subsidiary from AbuDhabi Financial Services to NBAD Securities. At the sametime, we significantly upgraded our order management and online trading systems. These changes contributed to ourfurtherexpansionofmarketshare.Webelievethebusinessiswell positioned to take advantage of the expected return of confidenceintheUAEequitymarkets.
In 2012, ourAsset Management Group (AMG)more thandoubled its Assets under Management and won numerous awardsacrossmanyinvestmentstrategies.
OurCustody activities which are now fully operational showed very strong growth and continue to focus on expanding geographicalreachandproductdepth.
Islamic Banking
IslamicBanking,comprisingofourwholly-ownedsubsidiaryAbu Dhabi National Islamic Finance (ADNIF) andNBAD Islamic Division,contributed2.8%totheGroup’soperatingprofitsorAED162million,1.7%higherthan2011.
The retail segment enjoyed growth in customer finances of60%in2012whilstcorporate&commercialsegmentcustomerfinancesdeclinedby8%,resultinginanoveralldecreaseof6%in2012toAED6.6billioninloanbalances.
Support Divisions Information Technology (IT)OurITdepartmentcontinuestodeliveracompetitiveadvantagetotheBank.Theteamsuccessfullydelivered45projectsduring2012 covering different lines of businesses including the internationalexpansionofNBAD.
ITDwontheawardforBestPaymentInfrastructureProjectforMid-Tier Banks during the sixth Asian Banker Award 2012heldinBangkok.
Risk Management (RMD)As the Bank grows into a diversified international financial services company active in banking, investment, leasing, and wealth management services, we continue to strengthen our risk management framework through an integrated and disciplined approach.Throughourriskmanagementframeworkwemanageenterprise-wide risks,with theobjectiveofmaximising risk-adjustedreturnswhileremainingwithinourriskappetite.Ourcore risk management processes provide for both centralised governance, as well as decentralised management through embeddedriskfunctionsinourkeylinesofbusiness.
Compliance 2012wasthemedtheYearofComplianceCultureandwehada programme to raise the awareness of compliance across the Group moving to an understanding that ‘compliance iseveryone’s responsibility’.Robustandeffectivecompliance isacorevalueatNBAD.
In December John Garrett, GeneralManager & Group ChiefComplianceOfficerwasnamedtheComplianceOfficeroftheYear2012attheACCAchievementsAwards.
Human Resources – Our People (HRG)People are the most critical asset of any organisation and our HRG is committed to serve the businesses in hiring, developing, retainingandrewardingtoptalent.TheBankhascontinuedtoinvest in the learning, education and development of its people and fosters a “Learning Culture” at the Bank. During 2012,employees averaged approximately 8.42 days training and83%ofstaffbasedintheUAEattendedatrainingprogramme.Asofendof2012, thebank’sEmiratisationratiowas37.4%andthebankemployed5,920employeesacrosstheworld.
As of end of 2012, the bank’s Emiratisation ratio was 37.4%
Ehab Hassan, Group Chief Human Resources Officer (far left, back), Michael H. Tomalin, the Group Chief Executive of NBAD (middle back) with 19 UAE Nationals to commemorate graduation from NBAD AFAQ Programme
Alan Durrant, the Group Chief Investment Officer and General Manager of NBAD’s Asset Management Group (middle) receives “UAE Asset Manager of the Year” for 2012 award from MENA Fund Manager Magazine.

37

Consolidated Financial Statements
for the Financial Year ended 31 December 2012

39

Independent Auditors’ Report
Report on the Consolidated Financial StatementsWehaveauditedtheaccompanyingconsolidatedfinancialstatementsofNationalBankofAbuDhabiPJSC(“theBank”)andits subsidiaries (the “Group”),whichcomprise theconsolidated statementoffinancialpositionasat31December2012, theconsolidatedincomestatement,theconsolidatedstatementofcomprehensiveincome,changesinequityandcashflowsfortheyearthenended,andnotes,comprisingasummaryofsignificantaccountingpoliciesandotherexplanatoryinformation.
Management’s Responsibility for the Consolidated Financial StatementsManagement is responsible for the preparation and fair presentation of these consolidated financial statements in accordance withInternationalFinancialReportingStandards,andforsuchinternalcontrolasmanagementdeterminesisnecessarytoenablethepreparationofconsolidatedfinancialstatementsthatarefreefrommaterialmisstatement,whetherduetofraudorerror.
Auditors’ ResponsibilityOurresponsibilityistoexpressanopinionontheseconsolidatedfinancialstatementsbasedonouraudit.WeconductedourauditinaccordancewithInternationalStandardsonAuditing.Thosestandardsrequirethatwecomplywithethicalrequirementsandplan and perform the audit to obtain reasonable assurance about whether the consolidated financial statements are free from materialmisstatement.
An audit involves performing procedures to obtain audit evidence about the amounts and disclosures in the consolidated financial statements.Theproceduresselecteddependonourjudgment,includingtheassessmentoftherisksofmaterialmisstatementoftheconsolidatedfinancialstatements,whetherduetofraudorerror.Inmakingthoseriskassessments,weconsiderinternalcontrol relevant to the Group’s preparation and fair presentation of the consolidated financial statements in order to design audit procedures that are appropriate in the circumstances, but not for the purpose of expressing an opinion on the effectiveness of theGroup’s internal control.An audit also includes evaluating the appropriateness of accounting policies used and thereasonableness of accounting estimates made by management, as well as evaluating the overall presentation of the consolidated financialstatements.
Webelievethattheauditevidencewehaveobtainedissufficientandappropriatetoprovideabasisforourauditopinion.
OpinionInouropinion, the consolidated financial statements present fairly, in all material respects, the consolidated financial position of the Group as at 31 December 2012, and its consolidated financial performance and its consolidated cash flows for the year then endedinaccordancewithInternationalFinancialReportingStandards.
Report on Other Legal and Regulatory RequirementsAsrequiredbytheUAEFederalLawNo.8of1984(asamended),wefurtherconfirmthatwehaveobtainedallinformationandexplanationsnecessaryforouraudit;thefinancialstatementscomply,inallmaterialrespects,withtheapplicablerequirementsoftheUAEFederalLawNo.8of1984(asamended),UnionLawNo.10of1980andtheArticlesofAssociationoftheBank;that proper financial records have been kept by the Group; and the contents of the Chairman’s report which relate to these consolidatedfinancialstatementsareinagreementwiththeGroup’sfinancialrecords.WearenotawareofanyviolationoftheabovementionedLawsandtheArticlesofAssociationhavingoccurredduringtheyearended31December2012,whichmayhavehadamaterialadverseeffectonthebusinessoftheBankoritsfinancialposition.
KPMGMuntherDajaniRegistrationNo.268 29January2013

41
Consolidated statement of financial positionAs at 31 December 2012
2012 2011 Note AED’000 AED’000
AssetsCash and balances with central banks 7 54,943,221 24,468,641Investmentsatfairvaluethroughprofitorloss 8 3,274,313 1,610,745Due from banks and financial institutions 9 14,615,968 15,166,763Reverse repurchase agreements 10 18,509,608 16,425,020Loansandadvances 11 164,599,378 159,522,178Non-tradinginvestments 12 32,286,857 26,569,340Derivative financial instruments 39 5,583,080 5,605,647Otherassets 13 4,300,195 4,083,411InvestmentProperties 14 140,061 -Propertyandequipment 15 2,346,488 2,215,760 -------------- --------------Total assets 300,599,169 255,667,505 ========== ==========LiabilitiesDue to banks and financial institutions 16 35,477,275 39,795,601Repurchase agreements 17 2,017,041 3,513,726Euro commercial paper 18 2,831,198 -Customers’ deposits 19 190,303,573 151,816,887Term borrowings 20 19,073,630 15,148,516Derivative financial instruments 39 6,652,508 4,784,473Otherliabilities 21 7,448,492 6,228,763 -------------- -------------- 263,803,717 221,287,966Subordinated notes 22 5,662,361 7,990,054 -------------- --------------Total liabilities 269,466,078 229,278,020 -------------- --------------EquityShare capital 23 3,874,558 2,870,043Statutory and special reserves 23 4,065,532 3,563,274Otherreserves 23 14,067,140 11,466,410Government of Abu Dhabi tier 1 capital notes 24 4,000,000 4,000,000Share option scheme 25 95,312 76,497Subordinatedconvertiblenotes-equitycomponent 22 21,420 27,639Retained earnings 5,009,129 4,385,622 -------------- --------------Total equity 31,133,091 26,389,485 -------------- --------------Total liabilities and equity 300,599,169 255,667,505 ========== ==========
________________________ ______________________Nasser Ahmed Khalifa AlSowaidi Michael TomalinChairman Group Chief Executive
Thenotes1to45areanintegralpartoftheseconsolidatedfinancialstatements.Theindependentauditors’reportissetoutonpage40.

Consolidated income statementFor the year ended 31 December 2012
2012 2011 Note AED’000 AED’000
Interestincome 26 7,979,592 7,651,786Interestexpense 27 (2,156,628) (2,156,538) -------------- --------------Net interest income 5,822,964 5,495,248 -------------- --------------IncomefromIslamicfinancingcontracts 28 316,085 362,811Depositors’ share of profits 29 (42,957) (55,165) -------------- --------------Net income from Islamic financing contracts 273,128 307,646 -------------- --------------
Net interest and Islamic financing income 6,096,092 5,802,894
Fee and commission income 1,905,488 1,635,945Fee and commission expense (359,092) (245,126) -------------- --------------Net fee and commission income 30 1,546,396 1,390,819 -------------- --------------
Net gain on investments 31 537,234 93,540Net foreign exchange gain 32 403,000 522,231Otheroperatingincome 33 88,063 71,378 -------------- -------------- 1,028,297 687,149 -------------- --------------
Operating income 8,670,785 7,880,862
General, administration and other operating expenses 34 (2,870,053) (2,563,724) -------------- --------------Profit before net impairment charge and taxation 5,800,732 5,317,138
Net impairment charge 35 (1,336,543) (1,498,555) -------------- --------------Profit before taxation 4,464,189 3,818,583
Overseasincometaxexpense 36 (131,961) (111,036) -------------- --------------Net profit for the year 4,332,228 3,707,547 ========== ==========
Basic earnings per share (AED) 42 1.06 0.90 ========== ==========Diluted earnings per share (AED) 42 1.04 0.88 ========== ==========
Thenotes1to45areanintegralpartoftheseconsolidatedfinancialstatements.Theindependentauditors’reportissetoutonpage40.
43
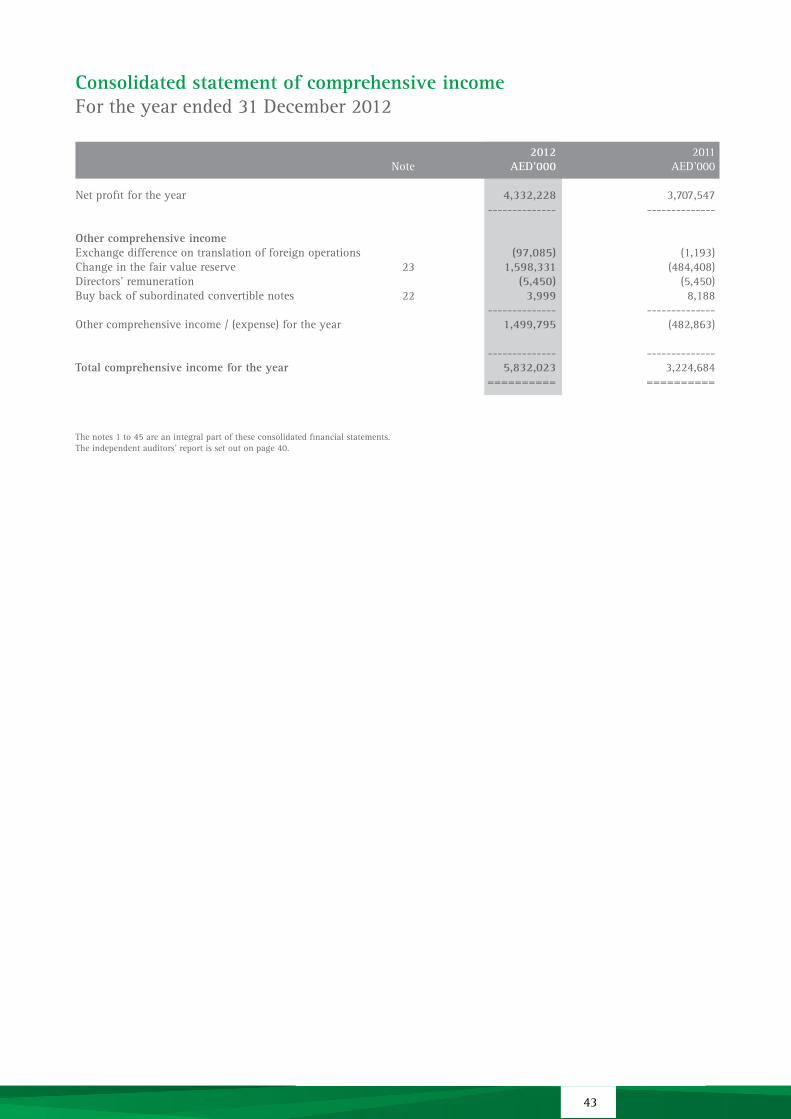
Consolidated statement of comprehensive incomeFor the year ended 31 December 2012
2012 2011 Note AED’000 AED’000
Net profit for the year 4,332,228 3,707,547 -------------- --------------
Other comprehensive incomeExchange difference on translation of foreign operations (97,085) (1,193)Change in the fair value reserve 23 1,598,331 (484,408)Directors’ remuneration (5,450) (5,450)Buy back of subordinated convertible notes 22 3,999 8,188 -------------- --------------Othercomprehensiveincome/(expense)fortheyear 1,499,795 (482,863)
-------------- --------------Total comprehensive income for the year 5,832,023 3,224,684 ========== ==========
Thenotes1to45areanintegralpartoftheseconsolidatedfinancialstatements.Theindependentauditors’reportissetoutonpage40.

Cons
olid
ated
sta
tem
ent
of c
hang
es in
equi
tyFo
r th
e ye
ar e
nded
31
Dec
embe
r 20
12
G
over
nmen
t
Subo
rdin
ated
of
Abu
Dha
bi
Fore
ign
conv
erti
ble
Ti
er 1
Sh
are
cu
rren
cy
note
s -
Sh
are
Stat
utor
y Sp
ecia
l G
ener
al
capi
tal
opti
on
Fair
val
ue
tran
slat
ion
equi
ty
Reta
ined
ca
pita
l re
serv
e re
serv
e re
serv
e no
tes
sche
me
rese
rve
rese
rve
com
pone
nt
earn
ings
To
tal
A
ED’0
00
AED
’000
A
ED’0
00
AED
’000
A
ED’0
00
AED
’000
A
ED’0
00
AED
’000
A
ED’0
00
AED
’000
A
ED’0
00
Bal
ance
at
1 Ja
nuar
y 20
11
2,39
1,70
3 1,
195,
852
2,12
8,25
3 10
,507
,798
4,
000,
000
52,7
39
(414
,606
) (3
,453
) 74
,925
4,
180,
205
24
,113
,416
Totalcomprehensiveincomefortheyear
-
-
-
8,188
-
-
(484,408)
(1,193)
-
3,702,097
3,224,684
Buybackofsubordinatedconvertiblenotes(note22)
-
-
-
-
-
-
-
-
(14,862)
-
(14,862)
Optionsgrantedtostaff(note25)
-
-
-
-
-
23,758
-
-
-
-
23,758
Dividendspaidfor2010(note23)
-
-
-
-
-
-
-
-
-
(717,511)
(717,511)
Bonussharesissued(note23)
478,340
-
-
(478,340)
-
-
-
-
-
-
-
PaymentonTier1capitalnotes(note24)
-
-
-
-
-
-
-
-
-
(240,000)
(240,000)
Transfertostatutoryreserve(note23)
-
239,169
-
-
-
-
-
-
-
(239,169)
-
Transfertogeneralreserve(note22,23)
-
-
-
2,332,424
-
-
-
-
(32,424)
(2,300,000)
-
-----------------------------------------------------------------------------
-----------
-----------
-----------
-----------
Bal
ance
at
31 D
ecem
ber
2011
2,
870,
043
1,43
5,02
1 2,
128,
253
12,3
70,0
70
4,00
0,00
0 76
,497
(8
99,0
14)
(4,6
46)
27,6
39
4,38
5,62
2 26
,389
,485
==
====
====
==
====
====
==
====
====
==
====
====
==
====
====
==
====
====
==
====
====
= =
====
====
==
====
====
==
====
====
===
====
====
=
Totalcomprehensiveincomefortheyear
-
-
-
3,999
-
-
1,598,331
(97,085)
-
4,326,778
5,832,023
Buybackofsubordinatedconvertiblenotes(note22)
-
-
-
-
-
-
-
-
(6,219)
-
(6,219)
Optionsgrantedtostaff(note25)
-
-
-
-
-
18,815
-
-
-
-
18,815
Dividendspaidfor2011(note23)
-
-
-
-
-
-
-
-
-
(861,013)
(861,013)
Bonussharesissued(note23)
1,004,515
-
-(1,004,515)
-
-
-
-
-
-
-
PaymentonTier1capitalnotes(note24)
-
-
-
-
-
-
-
-
-
(240,000)
(240,000)
Transfertostatutoryreserve(note23)
-
502,258
-
-
-
-
-
-
-
(502,258)
-
Transfertogeneralreserve(note22,23)
-
-
-
2,100,000
-
-
-
-
-
(2,100,000)
-
-----------------------------------------------------------------------------
-----------
-----------
-----------
-----------
Bal
ance
at
31 D
ecem
ber
2012
3,
874,
558
1,93
7,27
9 2,
128,
253
13,4
69,5
54
4,00
0,00
0 95
,312
69
9,31
7 (1
01,7
31)
21,4
20
5,00
9,12
9 31
,133
,091
==
====
====
==
====
====
==
====
====
==
====
====
==
====
====
==
====
====
==
====
====
= =
====
====
==
====
====
==
====
====
===
====
====
=
Thenotes1to45areanintegralpartoftheseconsolidatedfinancialstatements.
Theindependentauditors’reportissetoutonpage40.

45
Consolidated statement of cash flowsFor the year ended 31 December 2012
2012 2011 Note AED’000 AED’000
Cash flows from operating activitiesProfit before taxation 4,464,189 3,818,583Adjustmentsfor:Depreciation 34 181,316 157,277Accreted interest (11,622) 51,022Profit on buyback of subordinated notes 22 (6,534) (33,090)Write-offsandimpairmentcharges 35 2,143,636 1,897,920Foreigncurrencytranslationadjustment (98,961) (34,209)Share option scheme 18,815 23,758Write back of provisions for loans and advances 35 (579,717) (268,939) -------------- -------------- 6,111,122 5,612,322Change in investments at fair value through profit or loss (1,749,988) (317,919)Change in due from central banks, banks and financial institutions (4,281,980) 2,572,179Change in reverse repurchase agreements (2,084,588) (5,526,563)Change in loans and advances (6,547,359) (24,144,997)Change in other assets (354,552) (703,717)Change in due to banks and financial institutions (4,318,326) 8,244,255Change in repurchase agreements (1,496,684) 970,830Change in customers’ deposits 38,486,686 28,686,298Change in derivative financial instruments 1,890,602 (486,613)Change in other liabilities 1,165,262 1,250,091 -------------- -------------- 26,820,195 16,156,166Overseasincometaxpaid,netofrecoveries (99,028) (101,232) -------------- --------------Net cash from operating activities 26,721,167 16,054,934 -------------- --------------Cash flows from investing activitiesPurchaseofnon-tradinginvestments (18,761,389) (11,881,095)Proceedsfromsale/maturityofnon-tradinginvestments 14,659,428 6,207,254Purchase of investment properties (76,944) -Purchaseofpremisesandequipment,netofdisposals (312,043) (321,858) -------------- --------------Net cash used in investing activities (4,490,948) (5,995,699) -------------- --------------Cash flows from financing activitiesNet movement of Euro commercial paper 18 2,831,198 (35,053)Issueoftermborrowings 7,454,119 537,662Repayment of term borrowings (3,531,474) -Buy back of subordinated notes (2,839,397) (591,335)Issueofsubordinatednotes 598,154 -Dividends paid 23 (861,013) (717,511)PaymentonTierIcapitalnotes 24 (240,000) (240,000) -------------- --------------Net cash from / (used in) financing activities 3,411,587 (1,046,237) -------------- --------------
Net increase in cash and cash equivalents 25,641,806 9,012,998Cashandcashequivalentsat1January 29,989,577 20,976,579 -------------- --------------Cash and cash equivalents at 31 December 37 55,631,383 29,989,577 ========== ==========
Thenotes1to45areanintegralpartoftheseconsolidatedfinancialstatements.The independent auditors’ report is set out on page 40.
1 Legal status and principal activities National Bank of Abu Dhabi PJSC (the “Bank”) wasestablished in Abu Dhabi in 1968 with limited liability and is registered as a Public Joint Stock Company inaccordancewiththeUnitedArabEmiratesFederalLawNo. 8 of 1984 (as amended) relating to CommercialCompanies.
Itsregisteredofficeaddress isP.O.Box4,AbuDhabi,United Arab Emirates. The consolidated financialstatements as at and for the year ended 31 December 2012 comprise the Bank and its subsidiaries (togetherreferred to as the “Group”). The Group is primarilyengaged in corporate, retail, private and investment banking activities, management services, Islamicbanking activities; and carries out its operations through its local and overseas branches, subsidiaries and representative offices located in United Arab Emirates, Bahrain, Egypt, France, Oman, Kuwait, Sudan, Libya,theUnitedKingdom,Switzerland,HongKong,Jordan,Malaysia,ChinaandtheUnitedStatesofAmerica.
The Group’s Islamic banking activities are conductedinaccordancewithIslamicSharia’alawsissuedbytheSharia’aSupervisoryBoard.
The Bank is listed on the Abu Dhabi Securities Exchange (Ticker:NBAD).
The parent company of the Bank is the Abu Dhabi InvestmentCouncil,anentityownedbytheGovernmentoftheEmirateofAbuDhabi.
These consolidated financial statements were authorised forissuebytheBoardofDirectorson29January2013.
2 Basis of preparation
(a) Statement of compliance
These consolidated financial statements have been preparedinaccordancewiththeInternationalFinancialReporting Standards (IFRSs) and the requirements ofapplicablelawsintheUAE.
(b) Basis of measurement
These consolidated financial statements are prepared under the historical cost basis except for the following:
• derivativefinancialinstrumentsaremeasuredatfair value;
• investmentsatfairvaluethroughprofitorlossaremeasured at fair value;
• non-trading investments classified as available-for-salearemeasuredatfairvalue;
• recognised assets and liabilities designated ashedgeditemsinqualifyinghedgerelationshipsareadjusted forchanges in fairvalueattributable tothe risk being hedged
• non-financial assets acquired in settlement ofloans and advances are measured at the lower of their fair value less costs to sell and the carrying amountoftheloanandadvances.
(c) Functional and presentation currency
These consolidated financial statements are presented in United Arab Emirates Dirhams (“AED”), which isthe Bank’s functional currency. Items included in thefinancial statements of each of the Bank’s overseas subsidiaries and branches are measured using the currency of the primary economic environment in which theyoperate.Exceptasindicated,informationpresentedinAEDhasbeenroundedtothenearestthousand.
(d) Use of estimates and judgements
The preparation of consolidated financial statements requiresmanagementtomakejudgements,estimatesandassumptions that affect the application of accounting policies and reported amounts of assets and liabilities, income and expense. Actual results may differ fromtheseestimates.
Estimates and underlying assumptions are reviewed on anongoingbasis.Revisionstoaccountingestimatesarerecognised in the period in which the estimate is revised andinanyfutureperiodsaffected.
Information about significant areas of estimationuncertainty and critical judgements in applyingaccounting policies that have the most significant effect on the amount recognised in these consolidated financialstatementsaredescribedinnote5.
3 Significant accounting policies
The accounting policies set out below have been applied consistently to all periods presented in these consolidated financial statements and have been applied consistentlybyGroupentities.
(a) Basis of consolidation
(i) Subsidiaries Subsidiaries are entities controlled by the Group.Control exists when the Group has the power to govern the financial and operating policies of an entity so as to obtain benefits from its activities. The financialstatements of subsidiaries are included in these consolidated financial statements from the date that controlcommencesuntilthedatethatcontrolceases.
These consolidated financial statements of the Group comprise the Bank and its subsidiaries as listed below:
Country of incorporation Abu Dhabi International Bank Inc. Curacao, Netherlands Antilles
Abu Dhabi Financial Services LLC Abu Dhabi, United Arab Emirates
Abu Dhabi National Leasing LLC Abu Dhabi, United Arab Emirates
Abu Dhabi National Properties PrJC Abu Dhabi, United Arab Emirates
Notes to the consolidated financial statements

47
NBAD Trust Company (Jersey) Limited Jersey, Channel Islands
NBAD Private Bank (Suisse) SA Geneva, Switzerland
Abu Dhabi National Islamic Finance Company Abu Dhabi, United Arab Emirates
Ample China Holding Limited Hong Kong, China
Abu Dhabi Brokerage Egypt Egypt
National Bank of Abu Dhabi Malaysia Berhad Kuala Lumpur, Malaysia
NBAD Investment Management (DIFC) Limited Dubai, United Arab Emirates
(ii) Special purpose entities Special purpose entities (SPEs) are entities that are
created to accomplish a narrow and well defined objective. An SPE is consolidated if, based on theevaluation of the substance of its relationship with the Group and SPE’s risks and rewards, the Group concludes that it controls the SPE. An assessment of controlover the SPE is carried out at the inception and is not reassessed unless there is a change in the structure or terms of the SPE or change market conditions where the Group determines such reassessment necessary based onthefactsandcircumstances. Informationabout theGroup’sspecialpurposeentitiesissetoutinnote44.
(iii) Fund management The Group manages and administers assets held in trust or in fiduciary capacity on behalf of investors. Thefinancial statements of these funds are not included in these consolidated financial statements except when the Group controls the entity. Information about theGroup’s fund management and fiduciary activity is set outinnote43.
(iv) Transactions eliminated on consolidation The carrying amount of the Bank’s investment in each subsidiaryandtheequityofeachsubsidiaryiseliminatedon consolidation.All significant intra-groupbalances,andunrealisedincomeandexpensesarisingfromintra-grouptransactionsareeliminatedonconsolidation.
(b) Financial assets and liabilities
(i) Recognition The Group initially recognises loans and advances,
customers’ deposits, term borrowing and subordinated notes on the date that they are originated. All otherfinancial assets and liabilities are initially recognised on the consolidated statement of financial position when, the Group becomes a party to the contractual provisions oftheinstrument.
All regular way purchases and sales of financial assets arerecognisedonthesettlementdate, i.e. thedatetheassetisdeliveredtoorreceivedfromthecounterparty.Regular way purchases or sales of financial assets are
those that require delivery of assets within the timeframe generally established by regulation or convention inthemarketplace.
(ii) Derecognition The Group derecognises a financial asset when the
contractual rights to the cash flows from the financial asset expire, or when it transfers the rights to receive the contractual cash flows on the financial asset in a transaction in which substantially all the risks and rewards of ownership of the financial asset are transferred.
The Group derecognises a financial liability when its contractual obligations are discharged or cancelled or expire.
The Group enters into transactions whereby it transfers assets recognised on its consolidated statement of financial position, but retains either all or substantially all of the risks and rewards of the transferred assets or aportionofthem.Insuchtransactions,thetransferredassets are not derecognised from the consolidated statementoffinancialposition.Transfersofassetswithretention of all or substantially all risks and rewards includerepurchasetransactions.
The Group also derecognises certain assets when it writes off balances pertaining to the assets deemed to beuncollectible.
(iii) Designation at fair value through profit or loss The Group has designated financial assets and liabilities
at fair value through profit or loss when either:
•the assets or liabilities are managed, evaluated andreported internally on a fair value basis; or
•thedesignationeliminatesorsignificantlyreducesanaccountingmismatchwhichwouldotherwisearise.
(iv) Held for trading Tradingassetsarethoseassetsthatthegroupacquires
for the purpose of selling in the near term, or holds as partofaportfolio that ismanagedtogetherforshort-term profit taking. Trading assets are not reclassifiedsubsequenttotheirinitialrecognition.
(v) Designation as available-for-sale and held-to-maturity TheGrouphasnon-derivativefinancialassetsdesignatedas available-for-sale when these are not classified asloansandreceivables,held-to-maturityinvestmentsorfinancialassetsatfairvaluethroughprofitorloss.
Held-to-maturityinvestmentsarenon-derivativeassetswith fixed or determinable payments and fixed maturity that the Group has the positive intent and ability to hold to maturity, and which are not designated as at fair valuethroughprofitorloss,available-for-saleorthosemeetthedefinitionofloansandadvances.
(vi) Offsetting Financial assets and liabilities are set off and the net
amount presented in the consolidated statement of financial position when, and only when, the Group has a legal right to set off the amounts and intend either to settle on a net basis, or to realise the asset and settle the liabilitysimultaneously.
(vii) Amortised cost measurement The amortised cost of a financial asset or liability is
the amount at which the financial asset or liability is measured at initial recognition, minus principal repayments, plus or minus the cumulative amortisation using the effective interest method of any difference between the initial amount recognised and the maturity amount,minusanyreductionforimpairment.
(viii) Fair value measurement The determination of fair values of financial assets and liabilities is based on quoted market prices or dealerquotations for financial instruments traded in activemarkets.Amarketisregardedasactiveifquotedpricesare readily and regularly available and represent actual and regularly occurring market transactions on an arm’s length basis. Quoted bid prices are used for financialassets and quoted ask prices are used for financialliabilities.
For financial instruments not traded on an active market, fair value is determined based on recent transactions, brokers’ quotes or a widely recognisedvaluationtechnique.
Valuationtechniquesincludeusingrecentarm’slengthtransactionsbetweenknowledgeable,willingparties(ifavailable), reference to the current fair value of otherinstruments that are substantially the same, discounted cash flow analyses and option pricing models. Thechosen valuation technique makes maximum use ofmarket inputs, relies as little as possible on estimates specific to the Group, incorporates all factors that market participants would consider in setting a price, and is consistent with accepted economic methodologies for pricingfinancial instruments. Inputs to valuationtechniques reasonably represent market expectationsandmeasuresoftherisk-returnfactorsinherentinthefinancialinstrument.
The best evidence of the fair value of a financial instrument at initial recognition is the transaction price, i.e., the fair value of the consideration givenor received, unless the fair value of that instrument is evidenced by comparison with other observable current market transactions in the same instrument (i.e.,withoutmodificationorrepackaging)orbasedonavaluationtechniquewhosevariablesincludeonlydatafromobservablemarkets.
(ix) Identification and measurement of impairment An assessment is made at each reporting date and
periodically during the year to determine whether thereisanyobjectiveevidencethatfinancialassetsnotcarriedatfairvaluethroughprofitorloss,areimpaired.Financial assets are impairedwhenobjective evidenceindicates that a loss event has occurred after the initial recognition of the asset and that the loss event has an impact on the future cash flows of the asset that can be estimatedreliably.
Objective evidence that financial assets are impairedcan include significant financial difficulty of the borrower or issuer, default or delinquency by a
borrower, restructuring of a loan or advance by the Group on terms that the Group would not otherwise consider, indications that a borrower or issuer will enter bankruptcy, the disappearance of an active market for a security, or other observable data relating to a group of assets such as adverse changes in the payment status of borrowers or issuers in the group, or economic conditions that correlate with defaults in the group.Inaddition, foran investment inanequitysecurity,asignificant or prolonged decline in its fair value below itscostisobjectiveevidenceofimpairment.
The Group considers evidence of impairment at both specific and collective level. All individuallysignificantassetsareassessed for specific impairment.All individually significant assets found not to be specifically impaired are then collectively assessed for any impairment that has been incurred but not yet identified. Assets thatarenot individuallysignificantare collectively assessed for impairment by grouping togetherfinancialassetswithsimilarriskcharacteristics.
In assessing collective impairment the Group usesstatistical modelling of historical trends of the probability of default, timing of recoveries and the amount of loss incurred, adjusted for management’s judgement as towhether current economic and credit conditions are such that the actual losses are likely to be greater or less thansuggestedbyhistoricalmodelling. Default rates,loss rates and the expected timing of future recoveries are regularly benchmarked against actual outcomes to ensurethattheyremainappropriate.
Impairment losses on financial assets carried atamortised cost are measured as the difference between the carrying amount of the financial asset and the present value of estimated cash flows discounted at the original effective interest rate. Impairment losses arerecognised in the consolidated income statement and reflected in an allowance account against such financial assets.Whenasubsequenteventcausestheamountofimpairment loss to decrease, the decrease in impairment loss is reversed through the consolidated income statement.
Impairment losses on available-for-sale investment
securities are recognised by transferring the difference between the amortised acquisition cost and currentfair value out of other comprehensive income to the consolidated income statement. When a subsequenteventcausestheamountofimpairmentlossonavailable-for-saledebt security todecrease, the impairment lossisreversedthroughtheconsolidatedincomestatement.However, any subsequent recovery in the fair valueof an impaired available-for-sale equity investment isrecognised in the other comprehensiveincome.
Impairment losses on an unquoted equity instrumentthat is carried at cost because its fair value cannot be reliably measured, is measured as the difference between the carrying amount of the financial asset and the present value of estimated future cash flows discounted at the current market rate of return for a similar financial asset. Such impairment losses shallnotbereversed.
Notes to the consolidated financial statements

49
(c) Cash and cash equivalents
For the purpose of consolidated statement of cash flows, cash and cash equivalents comprise cash, balanceswith central banks and due from banks and financial institutions with original maturities of less than three months, which are subject to insignificant risk ofchanges in fair value, and are used by the Group in the managementofitsshort-termcommitments.
Cashandcashequivalentsarecarriedatamortisedcostintheconsolidatedstatementoffinancialposition.
(d) Investments at fair value through profit or loss
These are financial assets classified as held for trading or designated as such upon initial recognition. Theseare initially recognised and subsequentlymeasured atfair value with transaction costs taken directly to the consolidatedincomestatement.Allrelatedrealisedandunrealised gains or losses are included in net investment income.
(e) Due from banks and financial institutions
These are stated at amortised cost, less any allowance forimpairment.
(f) Loans and advances
Loansandadvancesarenon-derivativefinancialassetswithfixedordeterminablepaymentsthatarenotquotedin an active market and that the Group does not intend tosellimmediatelyorinthenearterm.
These are initially measured at fair value (beingthe transaction price at inception) plus incrementaldirect transaction costs and subsequently measuredat amortised cost using the effective interest method, adjustedforeffectivefairvaluehedges,netof interestsuspendedandprovisionsforimpairment.
When the Group is the lessor in a lease agreement that transfers substantially all of the risks and rewards incidental to ownership of the asset to the lessee, the arrangement is classified as a finance lease and a receivable equal to the net investment in the lease isrecognised and presented within loans and advances.In determining of whether an arrangement is a leaseis based on the substance of the arrangement and requiresanassessmentofwhetherthefulfilmentofthearrangement is dependent on the use of a specific asset or assets and the arrangement conveys a right to use the assets.
(g) Islamic financing and investing contracts
(i) Definitions
Ijara IjaraconsistsofIjaramuntahiabitamleek.
Ijara muntahia bitamleek is an agreement wherebythe Group (the lessor) conveys to the customer (thelessee), in return for a specific rent, the right to usea specific asset for a specific period of time, against
payment of fixedperiodicalandvariablerental.Underthis agreement, the Group purchases or constructs the assetandrentsittothecustomer.Thecontractspecifiesthe leasing party and the amount and timing of rental payments and responsibilities of both parties during the termofthelease.ThecustomerprovidestheGroupwithan undertaking to settle the rental amount as per the agreedschedule.
The Group retains the ownership of the assets throughout theentireleaseterm.Attheendoftheleaseterm,theGroup sells the leased asset to the customer at a nominal valuebasedonasaleundertakingbytheGroup.
Murabaha An agreement whereby the Group sells to a customer
a commodity, which the Group has purchased and acquired,basedonpromisereceivedfromthecustomerto buy the item purchased according to specific terms andconditions.Thesellingpricecomprisesthecostofthecommodityandanagreedprofitmargin.
Mudaraba A contract between the Group and a customer, whereby one party provides the funds (Rab Al Mal) and theotherparty(theMudarib)investsthefundsinaprojector a particular activity and any generated profits are distributed between the parties according to the profit shares thatwerepre-agreedupon in the contract. TheMudarib is responsible for all losses caused by his misconduct, negligence or violation of the terms and conditions of the Mudaraba; otherwise, losses are borne byRabAlMal.
Wakala An agreement whereby the Group provides a certain sum ofmoney to an agent (Wakkil)who invests it inSharia’s compliant transactions according to specific conditions in return for a certain fee (a lump sum ofmoneyorapercentageoftheamountinvested).
(ii) Revenue recognition
Ijara Income from Ijara is recognised on a declining-value
basis, until such time a reasonable doubt exists with regardtoitscollectability.
Murabaha Income fromMurabaha is recognised on a declining-
value basis, until such time a reasonable doubt exists withregardtoitscollectability.
Mudaraba IncomeorlossesonMudarabafinancingarerecognisedon an accrual basis if they can be reliably estimated.Otherwise, income is recognised on distribution bythe Mudarib, whereas the losses are charged to the consolidated income statement on their declaration by theMudarib.
Wakala Estimated income from Wakala is recognised on an accrualbasisovertheperiod,adjustedbyactualincomewhenreceived.Lossesareaccountedforonthedateofdeclarationbytheagent.

(h) Non-trading investments
Includedinnon-tradinginvestmentsareavailable-for-sale assets which are initially recognised at fair value plus incremental transaction costs directly attributable totheacquisition.
After initial recognition, these investments are remeasured at fair value. For investments which arenot part of an effective hedge relationship, unrealised gains or losses are recognised in other comprehensive income until the investment is derecognised or until the investment is determined to be impaired, at which time the cumulative gain or loss previously recognised in other comprehensive income, is included in the consolidated income statement for the year. Forinvestments which are part of an effective fair value hedge relationship, any unrealised gain or loss arising from a change in fair value is recognised directly in the consolidated income statement to the extent of the changesinfairvaluebeinghedged.
For the purpose of recognising foreign exchange gains and losses, an available-for-sale financial asset istreated as if it were carried at amortised cost in the foreigncurrency.Accordingly,forsuchafinancialasset,exchange differences are recognised in the consolidated incomestatement.
For unquoted equity investments where fair valuecannot be reliably measured, these are carried at cost less provision for impairment in value. Upon de-recognition, the gain or loss on sale is recognised in the consolidatedincomestatementfortheyear.
Included in non-trading investments are held-to-maturity assets which are non derivative assets with fixed or determinable payments and fixed maturity and that the Group has the positive intent and ability to hold them tillmaturity. These are carried at amortised costlessimpairment.
(i) Reverse repurchase agreements
Assets purchased with a simultaneous commitment to resell at a specified future date (reverse repos) arenot recognised. The amount paid to the counterpartyunder these agreements is shown as reverse repurchase agreements in the consolidated statement of financial position. The difference between purchase and resaleprice is treated as interest income and accrued over the life of the reverse repurchase agreement and charged to the consolidated income statement using the effective interestmethod.
(j) Property and equipment
(i) Recognition and measurement All items of property and equipment aremeasured at
cost less accumulated depreciation and impairment losses,ifany.Capitalprojectsinprogressareinitiallyrecorded at cost, and upon completion are transferred to
theappropriatecategoryofpropertyandequipmentandthereafterdepreciated.
Cost includes expenditures that are directly attributable totheacquisitionoftheasset.Purchasedsoftwarethatisintegraltothefunctionalityoftherelatedequipmentiscapitalisedaspartofthatequipment.
Gains and losses on disposal of an item of property and equipment are determined by comparing the proceedsfrom disposal with the carrying amount of property and equipment and are recognised net within otheroperatingincomeintheconsolidatedincomestatement.
Subsequent expenditures are only capitalised when itis probable that the future economic benefits of such expenditureswillflowtotheGroup.On-goingexpensesare charged to consolidated income statement as incurred.
(ii) Depreciation Depreciation is recognised in the consolidated income statement on a straight-line basis over the estimateduseful lives of all property and equipment. Freeholdlandandcapitalworkinprogressarenotdepreciated.
The estimated useful lives of assets for the current and comparative period are as follows:
Buildings 20 to 50 years
Officefurnitureandequipment 1to5years
Alterations to premises 4 years
Safes 10 to 20 years
Computersystemsandequipment 3to7years
Vehicles 3 years
Depreciation methods, useful lives and residual values arereassessedateveryreportingdate.
(iii) Impairment The carrying amounts are reviewed at each reporting dateforindicationofimpairment.Ifanysuchindicationexiststhentheasset’srecoverableamountisestimated.The recoverable amount of an asset or cash generating unit is the greater of its value in use and its fair value lesscoststosell.Inassessingvalueinuse,theestimatedfuture cash flows are discounted to their present value using a discount rate that reflects current market assessments of the time value of money and the risks specifictotheasset.Animpairmentlossisrecognisedin the consolidated income statement to the extent that carryingvaluesdonotexceedtherecoverableamounts.
(k) Investment properties
(i) Recognition and measurement Investmentpropertiesarepropertiesheldeithertoearn
rental income or for capital appreciation or for both, but not for sale in the ordinary course of business, use in the production or supply of goods or services or for administrative purposes. Investment properties
Notes to the consolidated financial statements

51
aremeasuredatcostasperCostmodelunder IAS40-Investment properties. Cost includes expenditures thataredirectlyattributabletotheacquisitionoftheasset.
When the use of a property changes such that it is reclassified as property and equipment, its fair valueat the date of reclassification becomes its cost for subsequentaccounting.
Investment properties are derecognised when eitherthey have been disposed of or when the investment property is permanently withdrawn from use and no futureeconomicbenefitisexpectedfromitsdisposal.
Any income or expenses on the investment properties are recognised in the consolidated income statement in other operating income or other operating expense respectively.
(ii) Depreciation Depreciation is recognised in the consolidated income statement on a straight-line basis over the estimatedusefullivesofallinvestmentproperties.
The estimated useful lives of investment properties for the current period are as follows:
Buildings and villas 20 to 50 years Depreciation methods, useful lives and residual values arereassessedateveryreportingdate.
(iii) Impairment The carrying amounts are reviewed at each reporting dateforindicationofimpairment.Ifanysuchindicationexiststhentheasset’srecoverableamountisestimated.The recoverable amount of an asset or cash generating unit is the greater of its value in use and its fair value lesscoststosell.Inassessingvalueinuse,theestimatedfuture cash flows are discounted to their present value using a discount rate that reflects current market assessments of the time value of money and the risks specifictotheasset.Animpairmentlossisrecognisedin the consolidated income statement to the extent that carryingvaluesdonotexceedtherecoverableamounts.
(l) Collateral pending sale
Non-financialassetsacquiredinsettlementofloansandadvances are recorded as assets held for sale and reported in“Otherassets”.Theassetacquiredisrecordedatthelower of its fair value less costs to sell and the carrying amount of the loan (net of impairment allowance) atthe date of exchange. No depreciation is provided inrespectofassetsheldforsale. Anysubsequentwrite-down of the acquired asset to fair value less costs tosell is recorded as an impairment loss and included in the consolidated income statement. Any subsequentincrease in the fair value less costs to sell, to the extent this does not exceed the cumulative impairment loss, is recognised in the consolidated income statement.The Group’s collateral disposal policy is in line with therespectiveregulatoryrequirementoftheregionsinwhichtheGroupoperates.
(m) Due to banks and financial institutions, customers’ deposits, Euro commercial paper and term borrowings
Due to banks and financial institutions, customer deposits, Euro commercial paper and term borrowings are initially recognised at their fair value minus the transaction costs and subsequently measured at theiramortisedcostusingtheeffectiveinterestmethod.
(n) Repurchase agreements
Assets sold with a simultaneous commitment to repurchase at a specified future date (repos) are notderecognised. The liability to the counterparty foramounts received under these agreements is shown as repurchase agreements in the consolidated statement offinancialposition.Thedifferencebetweensaleandrepurchase price is treated as interest expense and accrued over the life of the repurchase agreement and charged to the consolidated income statement using the effectiveinterestmethod.
(o) Subordinated notes
Subordinated notes include subordinated convertible notes that can be converted into share capital at the option of the holder, where the number of shares issued do not vary with changes in their fair value, are accounted for as compoundfinancial instruments.Theequitycomponentof the subordinatedconvertiblenotes is calculated as the excess of issue proceeds over the present value of the future interest and principal payments, discounted at the market rate of interest applicable to similar liabilities that do not have a conversionoption.
Subsequenttoinitialrecognition,allsubordinatednotesare measured at their amortised cost using the effective interestmethod.
(p) Share option scheme
Onthegrantdatefairvalueofoptionsgrantedtostaffisrecognised as staff cost, with a corresponding increase in equity, over the period in which the staff becomeunconditionally entitled to the options. The amountrecognised as an expense is adjusted to reflect thenumber of share options for which the related service conditions are expected to be met, such that the amount ultimately recognised as an expense is based on the number of share options that do meet the related service andnon-marketperformanceconditionsatthevestingdate.
(q) Interest
Interest income and expense are recognised in theconsolidated income statement using the effective interestmethod. The effective interest rate is the ratethat exactly discounts the estimated future cash flows through the expected life of the financial asset or liability to the carrying amount of the financial asset or liability.

The calculation of the effective interest rate includes all fees paid or received that are an integral part of the effective interest rate. Transaction costs includeincremental costs that are directly attributable to the acquisitionorissueofafinancialassetorliability.
Interest income and expense presented in theconsolidated income statement include:
• interestonfinancialassetsand liabilitiesatamortisedcostonaneffectiveinterestbasis.
• interest on available-for-sale investment securities onaneffectiveinterestbasis.
• interest on held for trading securities and derivativefinancialinstrumentsonaneffectiveinterestbasis.
r) Fee and commission
The Group earns fee and commission income from a diverserangeofservicesprovidedtoitscustomers.Thebasis of accounting treatment of fees and commission depends on the purposes for which the fees are collected and accordingly the revenue is recognised in consolidated income statement. Fee and commissionincome is accounted for as follows:
• income earned from the provision of services isrecognised as revenue as the services are provided;
• incomeearnedontheexecutionofasignificantact isrecognised as revenue when the act is completed;
• income which forms an integral part of the effectiveinterest rate of a financial instrument is recognised as anadjustmenttotheeffectiveinterestrateandrecordedin“Interestincome”.
Fee and commission expense relates mainly to transaction and service fees which are expensed as the servicesarereceived.
(s) Net gain on investments
Net gain on investments comprise realised and unrealised gains and losses on investments at fair value throughprofitorloss,realisedgainsandlossesonnon-trading investments and dividend income. Dividendincome is recognised when the right to receive payment isestablished.
(t) Foreign currency
(i) Foreign currency transactions Transactions in foreign currencies are translated into the
respective functional currencies of the Group entities at spotexchangeratesatthedatesofthetransactions.
Monetary assets and liabilities denominated in foreign currencies at the reporting date are retranslated to the functional currency at the spot exchange rates at the reportingdate.Non-monetaryassetsandliabilitiesthatare measured in terms of historical cost in a foreign currency are translated using the exchange rate at the dateofthetransaction.Theforeigncurrencygainorlosson monetary items is the difference between amortised cost in the functional currency at the beginning of the period, adjusted for effective interest and payments
during the period, and the amortised cost in foreign currency translated at the exchange rate at the end of the period. Foreign currency differences arising onretranslation are recognised in consolidated income statement.
(ii) Foreign operations The activities of subsidiaries and branches based
outside the UAE are not deemed an integral part of the head office operations, as they are financially and operationallyindependentoftheheadoffice.Theassetsand liabilities of the subsidiaries and overseas branches are translated into UAE Dirhams at rates of exchange at the reporting date. Income and expense items aretranslated at average rates, as appropriate, at the dates of transactions. Exchange differences (including thoseontransactionswhichhedgesuchinvestments)arisingfrom retranslating the opening net assets, are taken directly to foreign currency translation adjustmentaccountinothercomprehensiveincome.
(u) Overseas income tax expense
Income tax expense is provided for in accordancewith fiscal regulations of the respective countries in which the Group operates and is recognised in the consolidatedincomestatement.Incometaxexpenseisthe expected tax payable on the taxable income for the year, using tax rates enacted or substantively enacted at thereportingdateandanyadjustmenttotaxpayableinrespectofpreviousyears.
Deferred tax is provided using the liability method on all temporary differences between the carrying amounts of assets and liabilities for financial reporting purposes andtheamountsusedfortaxationpurposes.Deferredtax is not recognised for the following temporary differences: the initial recognition of goodwill, the initial recognition of assets or liabilities in a transaction that is not a business combination and that affects neither accounting nor taxable profit or loss, and differences relating to investments in subsidiaries to the extent that they probably will not reverse in the foreseeable future. Deferred tax ismeasuredat the tax rates thatare expected to apply to the period when the asset is realised or the liability is settled, based on laws that havebeenenactedatthereportingdate.
A deferred tax asset is recognised only to the extent that it is probable that future taxable profits will be availableagainstwhich theassetcanbeutilised. Thecarrying amount of deferred tax assets is reviewed at each reporting date and reduced to the extent that it is no longer probable that sufficient taxable profit will be available to allow all or part of the deferred tax asset to beutilised.
(v) Zakat
ZakatrepresentsbusinesszakatpayablebytheGrouptocomply with the principles of Sharia’a and approved by the Sharia’aSupervisoryBoard.TheGroup’sappointedZakatCommitteeismandatedtorecommendzakatdistribution.
Notes to the consolidated financial statements

53
(w) Derivative financial instruments and hedging
Derivatives are initially recognised, and subsequentlymeasured at fair value with transaction costs taken directlytotheconsolidatedincomestatement.Thefairvalueofaderivativeistheequivalentoftheunrealisedgain or loss from marking to market the derivative or using valuation techniques, mainly discounted cashflowmodels.
The method of recognising the resulting fair value gains or losses depends on whether the derivative is held for trading, or is designated as a hedging instrument and, ifso,thenatureoftheriskbeinghedged.Allgainsandlosses from changes in fair value of derivatives held for trading are recognised in the consolidated income statement.Whenderivativesaredesignatedashedges,theGroupclassifiesthemaseither:(i)fairvaluehedgeswhich hedge the exposure to changes in the fair value ofarecognisedassetor liability; (ii)cashflowhedgeswhich hedge exposure to variability in cash flows that is either attributable to a particular risk associated with a recognised asset or liability or a highly probable forecast transaction; (iii) hedge of net investmentwhich are accounted similarly to a cash flow hedge.Hedge accounting is applied to derivatives designated as hedging instruments in a fair value or cash flow, providedthecriteriaaremet.
Embedded derivatives Derivatives may be embedded in another contractual arrangement(ahostcontract).TheGroupaccountsforanembedded derivative separately from the host contract when the host contract is not itself carried at fair value through profit or loss, the terms of the embedded derivative would meet the definition of a derivative if they were contained in a separate contract, and the economic characteristic and risks of the embedded derivative are not closely related to the economic characteristicsandriskofthehostcontract.Separatedembedded derivatives are accounted for depending on their classification, and are presented separately from host contract in the consolidated statement of financial position.
Hedge accounting ItistheGroup’spolicytodocument,attheinceptionof
a hedge, the relationship between hedging instruments andhedgeditems,aswellasriskmanagementobjectiveandstrategy.Thepolicyalsorequiresdocumentationoftheassessment,atinceptionandonanon-goingbasis,oftheeffectivenessofthehedge.
The Group makes an assessment, both at the inception of thehedgerelationshipaswellasonanon-goingbasis,astowhetherthehedginginstrument(s)is(are)expectedto be highly effective in offsetting the changes in the fairvalueorcashflowsoftherespectivehedgeditem(s)during the period for which the hedge is designated, and whether the actual results of each hedge are within a rangeof80-125percent.TheGroupmakesanassessmentfor a cash flow hedge of a forecast transaction, as to whether the forecast transaction is highly probable to occur and presents an exposure to variations in cash
flowsthatcouldultimatelyaffectprofitorloss.
Fair value hedge Inrelationtofairvaluehedges,anygainor lossfromre-measuring the hedging instrument to fair value, aswell as related changes in fair value of the item being hedged, are recognised immediately in the consolidated income statement together with the changes in the fair value of the hedged item that are attributable to the hedged risk. Hedge accounting is discontinued whenthe hedging instrument expires or is sold, terminated or exercised,ornolongerqualifiesforhedgeaccounting.Any adjustment up to that period to the hedged itemfor which effective interest rate method was used is amortised to the consolidated income statement as a part of the recalculated effective interest rate of the then hedgeditemoveritsremaininglife.
Cash flow hedge In relation to effective cash flow hedges, the gain or
loss on the hedging instrument is recognised initially in other comprehensive income and transferred to the consolidated income statement in the period in which the hedged transaction impacts the consolidated income statement. Gains or losses, if any, relating to theineffective portion, are recognised immediately in the consolidatedincomestatement.Ifthehedgedtransactionis no longer expected to occur, the net cumulative gain or loss recognised in other comprehensive income is transferredtotheconsolidatedincomestatement.
Net investments hedges When a derivative instrument or a non-derivative
financial liability is designated as the hedging instrument in a hedge of a net investment in a foreign operation, the effective portion of the changes in the fair value of the hedging instrument is recognised in othercomprehensiveincomeinthetranslationreserve.Any ineffective portion of the changes in the fair value of the derivative is recognised immediately in the consolidatedincomestatement.Theamountrecognisedunder other comprehensive income is reclassified to incomestatementondisposaloftheforeignoperation.
Other derivatives All gains and losses from changes in the fair values of derivativesthatdonotqualifyforhedgeaccountingorare not designated as such are recognised immediately in the consolidated income statement as a component of netgainoninvestmentsornetforeignexchangegain.
(x) Provisions
A provision is recognised if, as a result of a past event, the Group has a present legal or constructive obligation that can be estimated reliably, and it is probable that an outflowofeconomicbenefitswillberequiredtosettletheobligation.Wheretheeffectoftimevalueofmoneyis material, provisions are determined by discounting the expected future cashflows, at apre-tax rate, thatreflects current market assessments of the time value of money and, where appropriate, the risks specific to the liability.

(y) Staff terminal benefits
UAE operations: UAE nationals employed by the Group are registered in the scheme managed by Abu Dhabi Retirement Pensions & Benefits Fund in accordance withLawnumber (2)of2000. Staff terminalbenefitsfor expatriate employees are accounted for on the basis of their accumulated services at the reporting date and in accordance with the Group’s internal regulations, whichcomplywiththeUAEfederallabourlaw.
Foreign operations: the Group provides for staff terminal benefits for its employees based overseas in accordance withtheapplicableregulationsinthosejurisdictions.
(z) Directors’ remuneration
In accordance with the Ministry of Economy andCommerceinterpretationofArticle119ofFederalLawNo.8of1984(asamended),Directors’remunerationhasbeen treated as an component of other comprehensive income.
(aa) Fiduciary activities
Assets held in trust or in a fiduciary capacity are not treated as assets of the Group and, accordingly, are not includedintheseconsolidatedfinancialstatements.
(ab) Financial guarantees
Financial guarantees are contracts that require theGroup to make specified payments to reimburse the holder for a loss it incurs because a specified party fails to meet its obligation when due in accordance with the contractualterms.
Certain financial guarantee contracts in the nature of credit default guarantees are not held for proprietary trading purposes and are treated as insurance contracts andaccountedunderIFRS4.
For other financial guarantee contracts, these are initially recognised at their fair value (which is thepremiumreceivedonissuance).Thereceivedpremiumis amortised over the life of the financial guarantee.The guarantee liability is subsequently carried at thehigher of this amortised amount and the present value of any expected payment (when a payment under theguaranteehasbecomeprobable).Thepremiumreceivedon these financial guarantees is included within other liabilities.
(ac) Earnings per share
The Group presents basic and diluted earnings per share (EPS)dataforitsordinaryshares.BasicEPSiscalculatedby dividing the profit or loss attributable to ordinary shareholders of the Bank by the weighted average numberofordinarysharesoutstandingduringtheyear.DilutedEPSisdeterminedbyadjustingtheprofitorlossattributable to ordinary shareholders and the weighted
average number of ordinary shares outstanding for the effects of all dilutive potential ordinary shares, which comprise subordinated convertible notes and share optionsgrantedtostaff.
(ad) Segment reporting
An operating segment is a component of the Group that engages in business activities from which it may earn revenues and incur expenses, including revenues and expenses that relate to transactions with any of theGroup’sothercomponents.Alloperatingsegments’operating results are reviewed regularly by the Group’s Chief Executive, being the chief operating decision maker, to make decisions about resources to be allocated to the segment and assess its performance, and for whichdiscretefinancialinformationisavailable.
Segment results that are reported to the Group Chief Executive include items directly attributable to a segment as well as those that can be allocated on a reasonablebasis.
(ae) Lease payments
Payments made under operating leases are recognised in the consolidated income statement on a straight-line basis over the termof the lease. Lease incentivesreceived are recognised as an integral part of the total leaseexpense,overthetermofthelease.
(af) New standards and interpretations not yet adopted
A number of new standards, amendments to standards and interpretations are not yet effective for the year ended 31 December 2012, and have not been applied in preparing these consolidated financial statements:
IFRS-7(Amendments to IFRS 7) - Disclosures - Offsetting financial assets and financial liabilities: amendment introduces disclosure requirement for financial assetsand liabilities that are offset in statement of financial positionoraresubjecttomasternettingarrangementorsimilararrangements.Effective1January2013;
IAS-32(Amendments to IAS32 Offsetting financial assets and financial liabilities): clarifies the offsetting criteria by explaining when an entity has a legal and enforceable righttosetoffandwhengrosssettlementisequivalenttonetsettlementEffectiveonorafter1January2014;
IFRS-10Consolidated Financial Statements: Replaces the part of IAS 27 Consolidated and separate financialstatements and SIC 12 Consolidation - Specialpurpose entities. IFRS10establishesprinciples for thepresentation and preparation of consolidated financial statements when an entity controls one or more other entities.Effective1January2013;
IFRS-11 Joint Arrangements: Standard on JointArrangements provides for a more realistic reflection
Notes to the consolidated financial statements

55
of joint arrangements by focusing on the rights andobligations of the arrangement, rather than its legal form (as iscurrently thecase).Thestandardaddressesinconsistencies in the reporting of joint arrangementsbyrequiringasinglemethodtoaccountforinterestsinjointlycontrolledentitiesEffective1January2013
IFRS -12 Disclosure of Interests in Other Entities: Standard on disclosure requirements for all forms ofinterests in other entities, including subsidiaries, jointarrangements, associates and unconsolidated structured entitiesEffective1January2013
IFRS -13 Fair Value Measurement: Seeks to increase consistency and comparability in fair value measurements and related disclosures across IFRSsEffective1January2013;
IFRS-9Financial Instruments: In November 2009 theIASB’s issued IFRS 9 as a comprehensive projectto replace IAS 39, deals with classification andmeasurementoffinancial assets. The requirementsofthis standard represent a significant change from the existingrequirementsinIAS39inrespectoffinancialassets.Thestandardcontainstwoprimarymeasurementcategories for financial assets: amortised cost and fair value. The standard eliminates the existing IAS 39categories of held to maturity, available-for-sale andloansandreceivable.
Gains and losses on remeasurement of financial assets measured at fair value will be recognized in profitor loss, except that for an investment in an equityinstrumentwhichisnotheld-for-trading,IFRS9(2010)added guidance to IFRS 9 (2009) on the classificationand measurement of financial liabilities, and this guidanceisconsistentwiththeguidanceinIAS39withfewexceptions.
IFRS 9 (2010) also added the requirements of IAS 39 forderecognitionoffinancialassetsandliabilitiestoIFRS9withoutchange.
TheIASBhasdeferredthemandatoryeffectivedateofthe existing chapters of IFRS 9 Financial Instruments(2009) and IFRS9 (2010) to annualperiodsbeginningonorafterJanuary1,2015.Theearlyadoptionofeitherstandard continues to be permitted. Given the natureof the Groups operations, this standard is expected to have a pervasive impact on the Group’s consolidated financialstatement.
4 Financial risk management
(a) Introduction and overview
The Group has exposure to the following risks from financial instruments:
• creditrisk • liquidityrisk
• marketrisk • operationalrisk
This note presents information about the Group’s exposure to each of the above risks, the Group’s objectives, policies and processes for measuring andmanagingrisk,andtheGroup’smanagementofcapital.
Risk management framework
The Board of Directors (the “Board”) has overallresponsibility for the establishment and oversight of the Group’s risk management framework and they are assisted by two board committees (Risk ManagementCommitteeandAuditCommittee),andsixmanagementcommittees (Group Assets and Liabilities Committee(“ALCO”), Group Credit Committee, InvestmentCommittee Bank Equity, Reputation Risk Committee,Business Continuity Management Committee and OperationalRiskManagementCommittee(“ORMC”)).
(b) Credit risk
Credit risk is the risk that a customer or counterparty to a financial asset fails to meet its contractual obligations and cause the Group to incur a financial loss. It arises principally from theGroup’s loans andadvances, due from banks and financial institutions, reverse repurchase agreements and non-trading debtinvestments, derivative financial instruments and certainotherassets.
For risk management purposes, credit risk arising on trading investments is managed independently, and reportedasacomponentofmarketriskexposure.
Management of credit risk
The Group uses an internal risk rating system to assess thecreditqualityofborrowersandcounterparties.Eachexposure in the Sovereign, Banks and Corporate asset classesisassignedarating.Theriskratingsystemhas11 grades, further segregated into 24 notches. Grades1-7areperforming,Grade8isWatch-listandGrades9-11arenon–performingeachwitharatingdescription.
In addition, the Group manages the credit exposureby obtaining collateral where appropriate and limiting thedurationof exposure. In certain cases, theGroupmay also close out transactions or assign them to other counterparties to mitigate credit risk. Credit risk inrespect of derivative financial instruments is limited to thosewithpositivefairvalues.
Credit risk arising from other financial instruments are managed by assigning limits, diversification of investment activities, limiting concentration of exposure to industry sectors, geographical locations and counterparties.

Notes to the consolidated financial statements
Impairment:
The Group measures its exposure to credit risk by reference to the gross carrying amount of financial assets less amounts offset, interest suspended and impairment losses, if any. The carrying amount offinancial assets represents themaximum creditexposure.
DuefromBanks Loansandadvances Non-tradinginvestments and financial institutions 2012 2011 2012 2011 2012 2011 AED’000 AED’000 AED’000 AED’000 AED’000 AED’000
Individually impairedSubstandard - - 2,734,930 2,292,175 - -Doubtful 718 979 1,860,988 1,823,454 20,055 20,055Loss - - 1,891,896 1,225,818 - - -------------- -------------- -------------- -------------- -------------- --------------Gross amount 718 979 6,487,814 5,341,447 20,055 20,055 -------------- -------------- -------------- -------------- -------------- --------------
Interestsuspended - - (707,053) (502,139) - - -------------- -------------- -------------- -------------- -------------- --------------Specific allowancefor impairment (718) (979) (3,089,649) (2,480,109) (16,712) (16,712) -------------- -------------- -------------- -------------- -------------- --------------Carrying amount - - 2,691,112 2,359,199 3,343 3,343 -------------- -------------- -------------- -------------- -------------- --------------Past due but not impaired
Past due comprises:Lessthan30days - - 413,555 430,912 - - 31 – 60 days - - 85,501 74,894 - - 61 – 90 days - - 133,548 77,998 - - More than 90 days - - 1,968,538 1,774,272 - - -------------- -------------- -------------- -------------- -------------- --------------Carrying amount - - 2,601,142 2,358,076 - - -------------- -------------- -------------- -------------- -------------- --------------
Neither past due norImpaired 14,615,968 15,166,763 161,735,198 157,125,500 32,283,514 26,565,997 -------------- -------------- -------------- -------------- -------------- --------------
Collective allowancefor impairment - - (2,428,074) (2,320,597) - - -------------- -------------- -------------- -------------- -------------- --------------
-------------- -------------- -------------- -------------- -------------- --------------Carrying amount 14,615,968 15,166,763 164,599,378 159,522,178 32,286,857 26,569,340 ========== ========== ========== ========== ========== ==========
NontradinginvestmentincludesinvestmentinequityinstrumentsamountingtoAED121million(2011: AED 97 million) which doesnotcarrycreditrisk.
The category of neither past due nor impaired includes renegotiated loans amounting to AED 2,405,817 thousand (2011: AED 3,108,468 thousand). Impaired loans and advances and non-trading investmentsImpairedloansandadvancesandnon-tradinginvestmentsarefinancialassetsforwhichtheGroupdeterminesthatitisprobablethatitwillbeunabletocollectallprincipalandinterestdueaccordingtothecontractualtermsoftheloanagreements.TheGroup financial assets that are neither past due nor impaired fall within the grade 1 – 7 in accordance with the Group’s internal creditriskgradingsystem.

57
Past due but not impairedPast due but not impaired are accounts where either contractual principal or interest are past due and when the accounts show somepotentialweaknessintheborrower’sfinancialpositionandcreditworthiness,andrequiresmorethannormalattention.Such potential weakness is specificallymonitored to ensure that the quality of the asset does not deteriorate in the nearfutureaffectingnegativelytheGroup’screditposition.OnthisclassofassettheGroupbelievesthatspecificimpairmentisnotappropriateatthecurrentcondition,butinterestissuspendedincertaincases.
Loans with renegotiated termsLoanswith renegotiated terms are loans that havebeen restructureddue to either deterioration in the borrower’sfinancialposition and where the Group has made concessions that it would not otherwise consider or the loans are performing but the termshavebeenamended.Oncealoanisrestructured,itremainsinthiscategoryforaminimumperiodoftwelvemonths,inordertoestablishsatisfactorytrackrecordofperformanceundertherestructuringagreement.TheBankdeterminesthetwelve-month period to commence from either the date of signing of the agreement for restructuring or the date on which the revised termswerefirstadheredtobytheborrower,whichevercomesearlier.Inthelasttwelvemonths,theGrouphasrenegotiatedthefollowing exposures:
2012 2011 AED’000 AED’000
Renegotiated loans 2,478,270 3,159,123 ========== ==========
Movement of renegotiated loans during the year
2012 2011 AED’000 AED’000
Balance at the beginning of the year 3,159,123 2,734,460 Upgraded to neither past due nor impaired during the year (1,748,416) (1,620,838Downgraded to individually impaired or past due but not impaired during the year (679,896) (508,191)Additions during the year 1,747,459 2,553,692 -------------- --------------Balance at the end of the year 2,478,270 3,159,123 ========== ==========
Allowances for impairmentThe Group establishes an allowance for impairment losses on assets carried at amortised cost that represents its estimate of incurred losses in its loanportfolio. Themain componentsof this allowanceare a specific loss component that relatesto individually significant exposures, and a collective loss allowance for losses that have been incurred but not identified, established for groups of homogeneous assets with similar risk characteristics that are indicative of the debtor’s ability to pay amounts due according to the contractual terms on the basis of a credit risk evaluation or grading process that considers asset type,industry,geographicallocation,collateraltype,pastduestatusandotherrelevantfactors.Futurecashflowsinagroupoffinancial assets that are collectively evaluated for impairment are estimated on the basis of historical loss experience for assets withcreditriskcharacteristicssimilartothoseinthegroup.
Individuallyassessedloansarerequiredtobeclassifiedasimpairedassoonasthereisobjectiveevidencethatanimpairmentlosshasbeenincurred.Objectiveevidenceofimpairmentincludesobservabledatasuchaswhencontractualpaymentofprincipalorinterest is overdue or there is known difficulties in the cash flows of counterparties, credit rating downgrades or original terms ofthecontractualrepaymentareunabletobemet.
Write-off policyTheGroupwritesoffaloanorinvestmentbalance(andanyrelatedallowancesforimpairmentlosses)whentheRiskManagementCommitteedeterminesthattheloansorinvestmentsareuncollectible.Thisisdeterminedafterallpossibleeffortsofcollectingtheamountshavebeenexhausted.
CollateralThe Group holds collateral against loans and advances and reverse repurchase agreement in the form of mortgage interests overproperty, other securities, cashdeposits andguarantees. TheGroupaccepts sovereignguarantees andguarantees fromwellreputedlocalor internationalbanks,wellestablishedlocalormultinational largecorporateandhighnet-worthprivateindividuals.Collateralgenerallyisnotheldagainstduefrombanksandfinancialinstitutions,andnosuchcollateralwasheldat31December2012or2011.

Notes to the consolidated financial statements
Anestimateofthecollateralcoverageagainstnonperformingloansandadvances(includingIslamicfinancing)isshownbelow:
2012 2011 AED’000 AED’000
Collateral value cover0–50% 4,611,357 2,961,17350–100% 1,103,605 1,358,079Above100% 772,852 1,022,195 ------------ ------------Total Gross non performing Loans 6,487,814 5,341,447 ========= =========
During the year 2012 and 2011, the Group repossessed a negligible amount of collateral that was held as security against loans andadvances.
Concentrations of risk
TheGroupmonitors concentrations of credit risk by industry sector, counterparty and geographic location.An analysis ofconcentrations of credit risk at the reporting date is shown below:
Loans and advances Others 2012 2011 2012 2011 AED’000 AED’000 AED’000 AED’000
Concentration by industry sector:Agriculture 88,740 50,082 - -Energy 25,225,352 30,557,399 5,132,425 3,105,361Manufacturing 8,951,376 9,152,371 6,046 -Construction 3,714,174 5,237,302 1,404 1,201Real estate 28,501,344 27,228,389 790,982 824,632Trading 3,503,000 4,018,428 306 59,457Transport 6,553,757 6,215,941 466,003 153,727Banks 20,177,846 16,052,536 26,949,819 21,456,968Otherfinancialinstitutions 8,133,530 7,338,342 9,435,418 11,571,008Services 17,936,238 14,356,321 871,943 628,408Government 21,153,974 17,293,055 10,432,450 6,810,035Personal loans for consumption 14,757,422 13,464,521 - -Personal loans others 12,046,362 13,379,553 - 11,020Others 81,039 480,783 694 - ------------ ------------ ------------ ------------ 170,824,154 164,825,023 54,087,490 44,621,817Less:allowanceforimpairment (5,517,723) (4,800,706) (16,712) (16,712)Less:interestsuspended (707,053) (502,139) - - ------------ ------------ ------------ ------------Carrying amount 164,599,378 159,522,178 54,070,778 44,605,105 ========= ========= ========= =========
Otherscomprisesofinvestmentsatfairvaluethroughprofitorloss,reverserepurchaseagreementsandnontradinginvestments.
Investments at fair value Non-trading investments through profit or loss 2012 2011 2012 2011 AED’000 AED’000 AED’000 AED’000
Concentration by counter party:Government 221,633 248,497 10,210,817 6,561,538Supranational - - - 9,586Public sector 674,651 298,074 7,664,196 5,214,065Banks and financial institutions 2,219,403 978,054 13,723,730 13,884,779Corporate sector 158,626 86,120 704,826 916,084 ------------ ------------ ------------ ------------ 3,274,313 1,610,745 32,303,569 26,586,052Less:Allowanceforimpairment - - (16,712) (16,712) ------------ ------------ ------------ ------------Total carrying amount 3,274,313 1,610,745 32,286,857 26,569,340 ========= ========= ========= =========
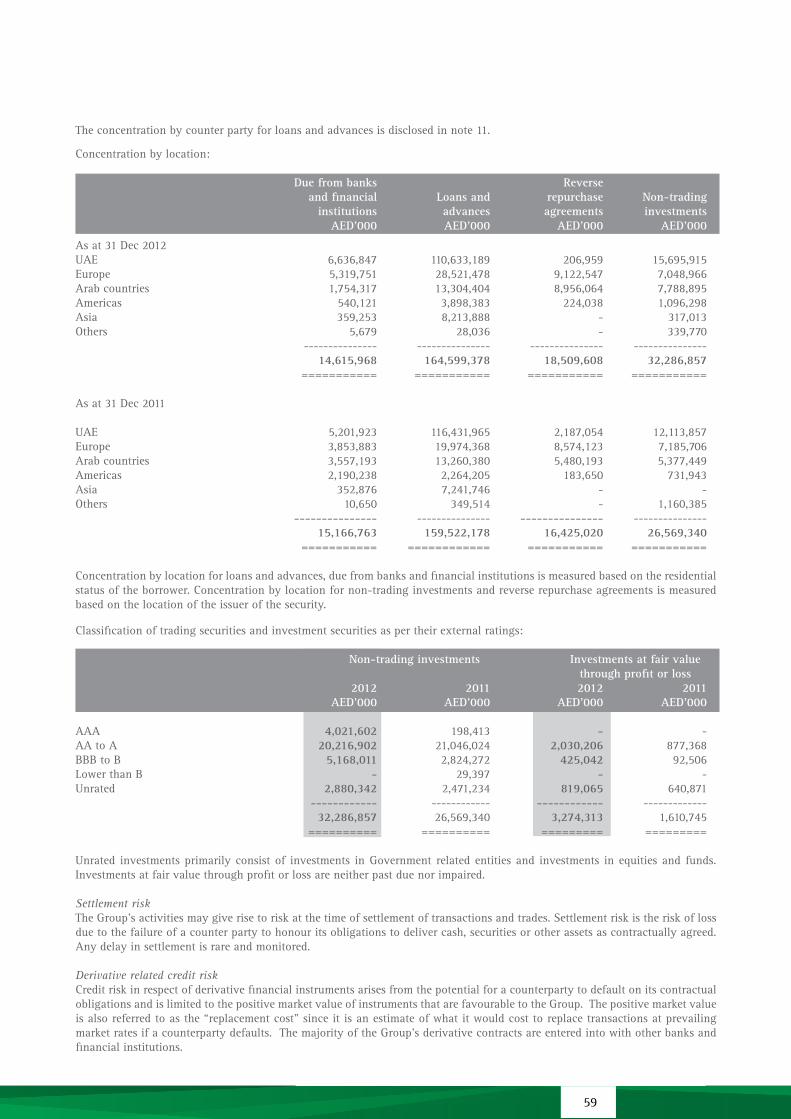
59
Theconcentrationbycounterpartyforloansandadvancesisdisclosedinnote11.
Concentration by location:
Due from banks Reverse and financial Loans and repurchase Non-trading institutions advances agreements investments AED’000 AED’000 AED’000 AED’000
As at 31 Dec 2012UAE 6,636,847 110,633,189 206,959 15,695,915Europe 5,319,751 28,521,478 9,122,547 7,048,966Arab countries 1,754,317 13,304,404 8,956,064 7,788,895Americas 540,121 3,898,383 224,038 1,096,298Asia 359,253 8,213,888 - 317,013Others 5,679 28,036 - 339,770 --------------- --------------- --------------- --------------- 14,615,968 164,599,378 18,509,608 32,286,857 =========== =========== =========== ===========
As at 31 Dec 2011
UAE 5,201,923 116,431,965 2,187,054 12,113,857Europe 3,853,883 19,974,368 8,574,123 7,185,706Arab countries 3,557,193 13,260,380 5,480,193 5,377,449Americas 2,190,238 2,264,205 183,650 731,943Asia 352,876 7,241,746 - -Others 10,650 349,514 - 1,160,385 --------------- --------------- --------------- --------------- 15,166,763 159,522,178 16,425,020 26,569,340 =========== ============ =========== ===========
Concentration by location for loans and advances, due from banks and financial institutions is measured based on the residential statusoftheborrower.Concentrationbylocationfornon-tradinginvestmentsandreverserepurchaseagreementsismeasuredbasedonthelocationoftheissuerofthesecurity.
Classification of trading securities and investment securities as per their external ratings:
Non-trading investments Investments at fair value through profit or loss 2012 2011 2012 2011 AED’000 AED’000 AED’000 AED’000
AAA 4,021,602 198,413 - -AA to A 20,216,902 21,046,024 2,030,206 877,368BBB to B 5,168,011 2,824,272 425,042 92,506LowerthanB - 29,397 - -Unrated 2,880,342 2,471,234 819,065 640,871 ------------ ------------ ------------ ------------- 32,286,857 26,569,340 3,274,313 1,610,745 ========== ========== ========= =========
Unrated investmentsprimarilyconsistof investments inGovernmentrelatedentitiesand investments inequitiesandfunds.Investmentsatfairvaluethroughprofitorlossareneitherpastduenorimpaired. Settlement riskTheGroup’sactivitiesmaygiverisetoriskatthetimeofsettlementoftransactionsandtrades.Settlementriskistheriskoflossduetothefailureofacounterpartytohonouritsobligationstodelivercash,securitiesorotherassetsascontractuallyagreed.Anydelayinsettlementisrareandmonitored.
Derivative related credit riskCredit risk in respect of derivative financial instruments arises from the potential for a counterparty to default on its contractual obligationsandislimitedtothepositivemarketvalueofinstrumentsthatarefavourabletotheGroup.Thepositivemarketvalueis also referred to as the “replacement cost” since it is an estimate of what it would cost to replace transactions at prevailing marketratesifacounterpartydefaults.ThemajorityoftheGroup’sderivativecontractsareenteredintowithotherbanksandfinancialinstitutions.

Notes to the consolidated financial statements
(c) Liquidity risk
LiquidityorfundingriskistheriskthattheGroupwillencounterdifficultyinmeetingobligationsassociatedwithfinancialliabilities. Liquidityriskcanbecausedbymarketdisruptionsorcreditdowngradeswhichmaycausecertainsourcesoffundingtodryupimmediately.
Management of liquidity risk TheGroup’sapproachtomanagingliquidityriskistoensurethat,managementhasdiversifiedfundingsourcesandcloselymonitorsliquiditytoensureadequatefunding.TheGroupmaintainsaportfolioofshort-termliquidassets,largelymadeupofshort-termliquidtradinginvestments,reverserepurchaseagreementsandinter-bankplacements.AllliquiditypoliciesandproceduresaresubjecttoreviewandapprovalbyALCO.
ThekeymeasureusedbytheGroupformeasuringliquidityriskistheratioofnetassets,i.e.,totalassetsbymaturityagainsttotalliabilitiesbymaturity.
Exposure to liquidity risk Details of the Group’s assets and liabilities is summarised in the table below by the maturity profile of the Group’s assets and
liabilities based on the contractual repayment arrangements and does not take account of the effective maturities as indicated bytheGroup’sdepositretentionhistory.Thecontractualmaturitiesofassetsandliabilitieshavebeendeterminedonthebasisoftheremainingperiodatthereportingdatetothecontractualmaturitydate.Thematurityprofileismonitoredbymanagementtoensureadequateliquidityismaintained.
The maturity profile of the assets and liabilities at 31 December 2012 was as follows:
Up to 3 months 1 to 3 3 to 5 over 5 Unspecified Total 3 months to 1 year years years years maturity AED’000 AED’000 AED’000 AED’000 AED’000 AED’000 AED’000
AssetsCash and balances with central banks 54,943,221 49,900,318 5,026,118 238 - 16,547 -Investmentsatfairvalue through profit or loss 3,274,313 6,611 983,891 548,440 525,502 1,209,869 -Due from banks and financial institutions 14,615,968 9,770,840 4,845,128 - - - -Reverse repurchase agreements 18,509,608 11,673,739 5,285,511 1,550,358 - - - Loansandadvances 164,599,378 30,948,613 29,832,358 31,055,494 17,879,307 54,883,606 - Non-tradinginvestments 32,286,857 1,361,781 3,743,716 3,995,095 3,757,355 19,428,910 - Derivative financial instruments 5,583,080 4,960,488 62,584 143,427 120,441 296,140 - Otherassets 4,300,195 3,225,146 1,075,049 - - - -Investmentproperties 140,061 - - - - - 140,061 Propertyandequipment 2,346,488 - - - - - 2,346,488 ------------ ------------ ------------ ------------ ------------ ------------ ------------ 300,599,169 111,847,536 50,854,355 37,293,052 22,282,605 75,835,072 2,486,549 ========= ========= ========= ========= ========= ========= =========Liabilities and equityDue to banks and financial institutions 35,477,275 34,686,371 790,904 - - - Repurchase agreements 2,017,041 2,017,041 - - - - -Euro commercial paper 2,831,198 1,603,366 1,227,832 - - - -Customers’ deposits 190,303,573 170,076,965 16,067,704 3,438,175 551,977 168,752 -Term borrowings 19,073,630 367,301 2,476,569 8,131,202 3,258,217 4,840,341 -Derivative financial instruments 6,652,508 5,183,380 143,290 366,909 277,243 681,686 - Otherliabilities 7,448,492 5,586,369 1,862,123 - - - -Subordinatednotes 5,662,361 - - - 4,306,445 1,355,916 -Equity 31,133,091 - - - - - 31,133,091 ------------ ------------ ------------ ------------ ------------ ------------ ------------ 300,599,169 219,520,793 22,568,422 11,936,286 8,393,882 7,046,695 31,133,091 ========= ========= ========= ========= ========= ========= =========Undrawn commitments to extend credit 25,805,030 1,556,430 1,646,946 5,867,311 2,492,106 14,242,237 -Financial guarantees 10,902,938 3,261,170 1,473,615 1,315,339 4,852,814 - - ========= ========= ========= ========= ========= ========= =========
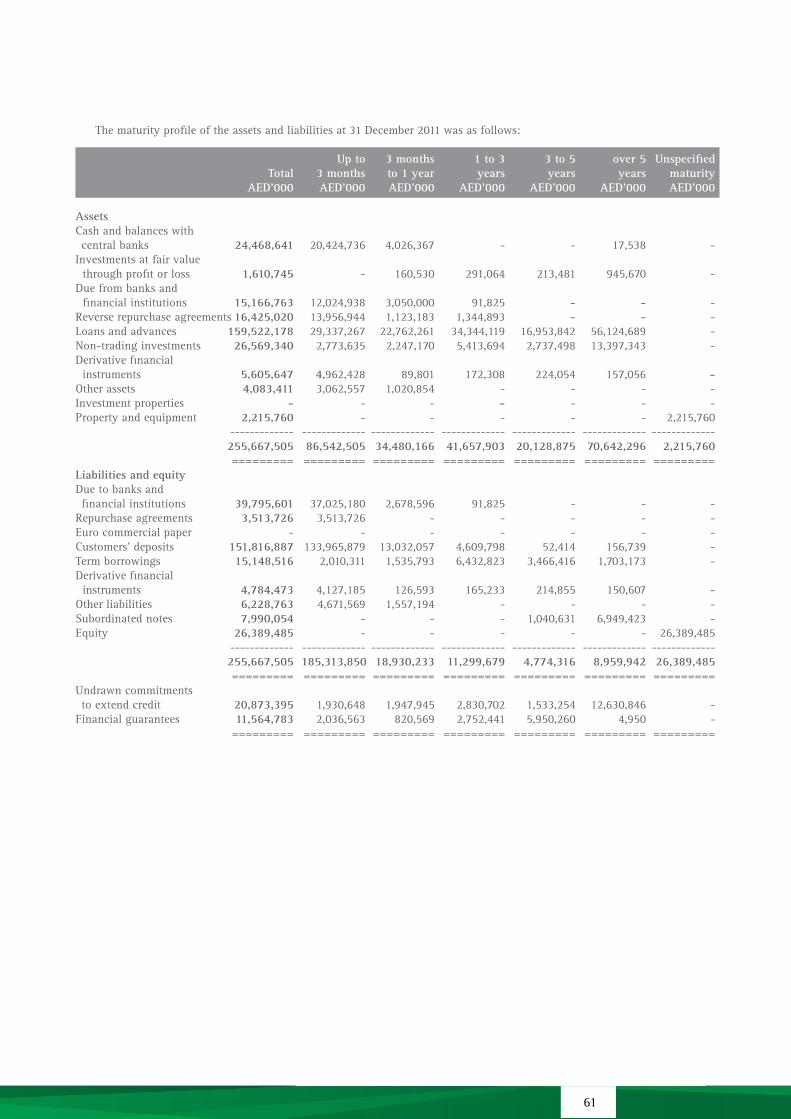
61
The maturity profile of the assets and liabilities at 31 December 2011 was as follows:
Up to 3 months 1 to 3 3 to 5 over 5 Unspecified Total 3 months to 1 year years years years maturity AED’000 AED’000 AED’000 AED’000 AED’000 AED’000 AED’000
AssetsCash and balances with central banks 24,468,641 20,424,736 4,026,367 - - 17,538 -Investmentsatfairvalue through profit or loss 1,610,745 - 160,530 291,064 213,481 945,670 -Due from banks and financial institutions 15,166,763 12,024,938 3,050,000 91,825 - - -Reverse repurchase agreements 16,425,020 13,956,944 1,123,183 1,344,893 - - -Loansandadvances 159,522,178 29,337,267 22,762,261 34,344,119 16,953,842 56,124,689 -Non-tradinginvestments 26,569,340 2,773,635 2,247,170 5,413,694 2,737,498 13,397,343 -Derivative financial instruments 5,605,647 4,962,428 89,801 172,308 224,054 157,056 - Otherassets 4,083,411 3,062,557 1,020,854 - - - -Investmentproperties - - - - - - - Propertyandequipment 2,215,760 - - - - - 2,215,760 ------------- ------------- ------------- ------------- ------------- ------------- ------------- 255,667,505 86,542,505 34,480,166 41,657,903 20,128,875 70,642,296 2,215,760 ========= ========= ========= ========= ========= ========= =========Liabilities and equityDue to banks and financial institutions 39,795,601 37,025,180 2,678,596 91,825 - - -Repurchase agreements 3,513,726 3,513,726 - - - - -Eurocommercialpaper - - - - - - -Customers’ deposits 151,816,887 133,965,879 13,032,057 4,609,798 52,414 156,739 -Term borrowings 15,148,516 2,010,311 1,535,793 6,432,823 3,466,416 1,703,173 -Derivative financial instruments 4,784,473 4,127,185 126,593 165,233 214,855 150,607 - Otherliabilities 6,228,763 4,671,569 1,557,194 - - - -Subordinated notes 7,990,054 - - - 1,040,631 6,949,423 -Equity 26,389,485 - - - - -26,389,485 ------------- ------------- ------------- ------------- ------------- ------------- ------------- 255,667,505 185,313,850 18,930,233 11,299,679 4,774,316 8,959,942 26,389,485 ========= ========= ========= ========= ========= ========= =========Undrawn commitments to extend credit 20,873,395 1,930,648 1,947,945 2,830,702 1,533,254 12,630,846 -Financial guarantees 11,564,783 2,036,563 820,569 2,752,441 5,950,260 4,950 - ========= ========= ========= ========= ========= ========= =========

Notes to the consolidated financial statements
ThetablebelowsummarizesthematurityprofileoftheGroup’sfinancialliabilitiesat31December2012basedoncontractualundiscountedrepaymentobligations.
Gross nominal Up to 3 months 1 to 3 3 to 5 over 5 Total cash flow 3 months to 1 year years years years AED’000 AED’000 AED’000 AED’000 AED’000 AED’000 AED’000
LiabilitiesAs at 31 December 2012Due to banks and financial institutions 35,477,275 35,517,958 34,709,532 808,426 - - -Repurchase agreements 2,017,041 2,022,714 2,022,714 - - - - Euro commercial paper 2,831,198 2,835,077 1,603,950 1,231,127 - - -Customers’ deposits 190,303,573 191,166,544 170,658,655 15,931,235 3,776,453 580,286 219,915 Term borrowings 19,073,630 21,711,720 606,537 2,851,374 8,832,628 3,660,162 5,761,019 Subordinated notes 5,662,361 6,752,862 6,198 177,834 473,823 4,388,884 1,706,123 ------------- ------------- ------------- ------------- ------------- ------------- ------------- 255,365,078 260,006,875 209,607,586 20,999,996 13,082,904 8,629,332 7,687,057 ========= ========= ========= ========= ========= ========= ========= Undrawn commitments to extend credit 25,805,030 25,805,030 23,351,434 1,353,628 863,328 - 236,640Financial guarantees 10,902,938 10,902,938 10,902,938 - - - - ========= ========= ========= ========= ========= ========= =========
As at 31 December 2011Due to banks and financial institutions 39,795,601 39,852,447 37,193,408 2,659,039 - - -Repurchase agreements 3,513,726 3,516,953 3,516,953 - - - -Euro commercial paper - - - - - - -Customers’ deposits 151,816,887 152,688,176 134,590,953 12,856,052 4,804,196 262,070 174,905 Term borrowings 15,148,516 16,740,435 2,271,566 1,797,711 7,052,611 3,542,165 2,076,382Subordinated notes 7,990,054 9,583,595 8,002 222,665 725,455 1,813,857 6,813,616 ------------- ------------- ------------- ------------- ------------- ------------- ------------- 218,264,784 222,381,606 177,580,882 17,535,467 12,582,262 5,618,092 9,064,903 ========= ========= ========= ========= ========= ========= =========Undrawn commitments to extend credit 20,873,395 20,873,395 13,378,405 5,400,469 1,838,851 - 255,670Financial guarantees 11,564,783 11,564,783 11,564,783 - - - - ========= ========= ========= ========= ========= ========= =========
(d) Market risk
Market risk is the risk that the Group’s income and / or value of a financial instrument will fluctuate because of changes in marketpricessuchasinterestrates,foreignexchangeratesandmarketpricesofequityandcommodityprice. Management of market risk The Risk Management Committee has set risk limits based on sensitivity analysis and notional limits which are closely monitored by the Risk Management Division and reported regularly to Senior Management and discussed monthly by the AssetsandLiabilitiesCommittee.
TheGroup separates its exposure tomarket riskbetween tradingandnon-tradingportfolios. Tradingportfolios includepositions arising from market making and proprietary position taking, together with financial assets and liabilities that are managedonafairvaluebasis.
Interest rate riskInterestrateriskarisesfrominterestbearingfinancialinstrumentsandreflectsthepossibilitythatchangesininterestrateswilladverselyaffectthevalueofthefinancialinstrumentsandtherelatedincome.TheGroupmanagesthisriskprincipallythroughmonitoringinterestrategapsandbymatchingthere-pricingprofileofassetsandliabilities.
OverallinterestrateriskpositionsaremanagedbyusingderivativeinstrumentstomanageoverallpositionarisingfromtheGroup’sinterestbearingfinancialinstruments.Theuseofderivativestomanageinterestrateriskisdescribedinnote39.

63
ThesubstantialportionoftheGroup’sassetsandliabilitiesarere-pricedwithinoneyear.Accordinglythereisalimitedexposuretointerestraterisk.
The effective interest rate of a monetary financial instrument is the rate that, when used in a present value calculation, results inthecarryingamountoftheinstrument.Therateisanoriginaleffectiveinterestrateforafixedrateinstrumentcarriedatamortisedcostandacurrentmarketrateforafloatinginstrumentoraninstrumentcarriedatfairvalue.
TheGroup’sinterestrategapandsensitivitypositionbasedoncontractualre-pricingarrangementsat31December2012was as follows:
Up to 3 months 1 to 3 3 to 5 over 5 Non interest Total 3 months to 1 year years years years bearing AED’000 AED’000 AED’000 AED’000 AED’000 AED’000 AED’000
AssetsCash and balances with central banks 54,943,221 3,218,960 5,026,118 238 - - 46,697,905Investmentsatfairvalue through profit or loss 3,274,313 1,022,404 106,806 528,388 419,923 509,486 687,306 Due from banks and financial institutions 14,615,968 12,973,804 1,536,303 - - - 105,861 Reverse repurchase agreements 18,509,608 11,673,738 5,285,512 1,550,358 - - - Loansandadvances 164,599,378 144,322,711 16,924,490 877,170 1,450,541 960,628 63,838 Non-tradinginvestments 32,286,857 4,845,013 3,196,622 3,865,920 2,724,550 17,528,362 126,390 Derivative financial instruments 5,583,080 - - - - - 5,583,080 Otherassets 4,300,195 - - - - - 4,300,195Investmentproperties 140,061 - - - - - 140,061 Propertyandequipment 2,346,488 - - - - - 2,346,488 -------------- ------------- ------------- ------------- ------------- ------------- ------------- 300,599,169 178,056,630 32,075,851 6,822,074 4,595,014 18,998,476 60,051,124 ========== ========= ========= ========= ========= ========= =========Liabilities and equityDue to banks and financial institutions 35,477,275 31,027,105 790,903 - - - 3,659,267Repurchase agreements 2,017,041 2,017,041 - - - - - Euro commercial paper 2,831,198 1,603,366 1,227,832 - - - -Customers’ deposits 190,303,573 139,396,190 15,025,329 3,385,135 551,978 168,752 31,776,189 Term borrowings 19,073,630 3,856,651 89,119 7,029,302 3,258,217 4,840,341 -Derivative financial instruments 6,652,508 - - - - - 6,652,508Otherliabilities 7,448,492 - - - - - 7,448,492 Subordinated notes 5,662,361 1,840,641 - - - 3,821,720 -Equity 31,133,091 - - - - -31,133,091 ------------- ------------- ------------- ------------- ------------- ------------- ------------- 300,599,169 179,740,994 17,133,183 10,414,437 3,810,195 8,830,813 80,669,547 ========= ========= ========= ========= ========= ========= =========Onstatementoffinancialpositiongap (1,684,364) 14,942,668 (3,592,363) 784,819 10,167,663(20,618,423)Offstatementoffinancialpositiongap (16,493,724) 9,334,235 8,192,422 3,903,596 (4,936,529) - ------------- ------------- ------------- ------------- ------------- -------------Total interest rate sensitivity gap (18,178,088) 24,276,903 4,600,059 4,688,415 5,231,134 (20,618,423) ------------- ------------- ------------- ------------- ------------- -------------Cumulative interest rate sensitivity (18,178,088) 6,098,815 10,698,874 15,387,289 20,618,423 - ========= ========= ========= ========= ========= =========

Notes to the consolidated financial statements
TheGroup’sinterestrategapandsensitivitypositionbasedoncontractualre-pricingarrangementsat31December2011was as follows:
Up to 3 months 1 to 3 3 to 5 over 5 Non interest Total 3 months to 1 year years years years bearing AED’000 AED’000 AED’000 AED’000 AED’000 AED’000 AED’000
AssetsCash and balances with central banks 24,468,641 18,928,096 4,026,367 - - 4,770 1,509,408Investmentsatfairvalue through profit or loss 1,610,745 39,276 250,296 290,552 115,779 316,056 598,786 Due from banks and financial institutions 15,166,763 14,371,954 150,000 91,825 - - 552,984Reverse repurchase agreements 16,425,020 13,956,943 1,123,184 1,344,893 - - -Loansandadvances 159,522,178 134,372,583 21,817,149 1,981,243 183,904 755,428 411,871 Non-tradinginvestments 26,569,340 8,164,665 2,925,075 3,946,774 2,097,248 9,328,190 107,388Derivative financial instruments 5,605,647 - - - - - 5,605,647Otherassets 4,083,411 - - - - - 4,083,411Investmentproperties - - - - - - -Propertyandequipment 2,215,760 - - - - - 2,215,760 -------------- ------------- ------------- ------------- ------------- ------------- ------------- 255,667,505 189,833,517 30,292,071 7,655,287 2,396,931 10,404,444 15,085,255 ========== ========= ========= ========= ========= ========= =========Liabilities and equityDue to banks and financial institutions 39,795,601 34,075,491 2,678,596 - - - 3,041,514 Repurchase agreements 3,513,726 3,513,726 - - - - -Eurocommercialpaper - - - - - - -Customers’ deposits 151,816,887 92,076,934 11,089,841 3,457,066 52,414 153,838 44,986,794 Term borrowings 15,148,516 6,300,854 - 3,678,073 3,466,416 1,703,173 -Derivative financial instruments 4,784,473 - - - - - 4,784,473 Otherliabilities 6,228,763 - - - - - 6,228,763 Subordinated notes 7,990,054 2,077,407 - - - 5,912,647 -Equity 26,389,485 - - - - - 26,389,485 ------------- ------------- ------------- ------------- ------------- ------------- ------------- 255,667,505 138,044,412 13,768,437 7,135,139 3,518,830 7,769,658 85,431,029 ========= ========= ========= ========= ========= ========= =========Onstatementoffinancialpositiongap 51,789,105 16,523,634 520,148 (1,121,899) 2,634,786 (70,345,774)Offstatementoffinancialpositiongap (7,535,883) 2,783,095 (687,595) 7,993,211 (2,552,828) - ------------- ------------- ------------- ------------- ------------- -------------Total interest rate sensitivity gap 44,253,222 19,306,729 (167,447) 6,871,312 81,958 (70,345,774) ------------- ------------- ------------- ------------- ------------- -------------Cumulative interest rate sensitivity 44,253,222 63,559,951 63,392,504 70,263,816 70,345,774 - ========= ========= ========= ========= ========= =========
Interestrateriskisalsoassessedbymeasuringtheimpactofreasonablepossiblechangeininterestratemovements.TheGroupassumes a fluctuation in interest rates of 50 basis points (2011: 50 basis points) and estimates the following impact on the net profitfortheyearandequityatthatdate:
Net profit Net profit for the year Equity for the year Equity AED’000 AED’000 AED’000 AED’000 2012 2012 2011 2011
Fluctuation in yield 34,010 150,340 229,808 398,733 ======== ======== ========= ========
Theinterestratesensitivitiessetoutaboveareillustrativeonlyandemploysimplifiedscenarios.TheyarebasedonAED210,132million (2011: AED 220,126 million) interest bearing assets and AED 196,874 million (2011: AED 151,813 million) interest bearing liabilities.Thesensitivitydoesnot incorporateactionsthatcouldbetakenbymanagementtomitigate theeffectofinterestratemovements.

65
Currency riskCurrency risk is the risk that the value of a financial instrument will fluctuate due to changes in foreign exchange rates and arisesfromfinancialinstrumentsdenominatedinaforeigncurrency.TheGroup’sfunctionalcurrencyistheUAEDirham.TheBoardofDirectorshassetlimitsonpositionsbycurrency.Positionsarecloselymonitoredandhedgingstrategiesareusedtoensurepositionsaremaintainedwithinestablishedlimits.At31December,theGrouphadthefollowingsignificantnetexposuresdenominated in foreign currencies:
Net spot Forward Total Total position position 2012 2011 (short)/long (short)/long (short)/long (short)/long AED’000 AED’000 AED’000 AED’000
CurrencyUSDollar (27,704,360) 25,937,421 (1,766,939) 1,744,244UKSterlingPound 6,291,085 (6,290,372) 713 37,546Euro 34,271,757 (34,366,521) (94,764) (44,156)KuwaitiDinar 228,919 (216,261) 12,658 39,562OmaniRiyal 460,452 (513,510) (53,058) (267,789)SaudiRiyal (2,133,116) 2,592,425 459,309 (508,255)JapaneseYen 387,294 (377,476) 9,818 6,311SwissFranc 334,271 (386,629) (52,358) (60,534) ========== ========== ========== ==========
TheexchangerateofAEDagainstUSDollar ispeggedand theGroup’sexposure tocurrencyrisk is limited to thatextent.Exposuretootherforeigncurrenciesisinsignificant.
Equity price riskEquitypriceriskarisesfromthechangeinfairvaluesofequityinvestments.TheGroupmanagesthisriskthroughdiversificationofinvestmentsintermsofgeographicaldistributionandindustryconcentration.
(e) Operational risks
Operational risk is the risk of direct or indirect loss arising from awide variety of causes associatedwith theGroup’sprocesses,personnel,technologyandinfrastructure,andfromexternalfactorsotherthancredit,marketandliquidityriskssuch as those arising from legal and regulatory requirements and generally accepted standards of corporate behaviour.OperationalrisksarisefromalloftheGroup’soperations.
TheBoardhasoversightresponsibilitiesforoperationalriskmanagementintheGroup.TheseresponsibilitiesareexercisedthroughORMCwithanestablishedframeworkofpoliciesandprocedurestoidentify,assess,monitor,control,manageandreportrisks.TheORMCemploysclearinternalpoliciesandprocedurestoreducethelikelihoodofanyoperationallosses.Whereappropriate, risk ismitigatedbywayof insurance.The frameworkalsoprovides the interrelationwithother riskcategories.
CompliancewithpoliciesandproceduresissupportedbyperiodicreviewsundertakenbytheComplianceDivision.Theresultsof these reviews are discussed with the management of the business unit to which they relate, with summaries submitted to theAuditCommitteeandseniormanagementoftheGroup.
(f) Capital management
TheGroup’sleadregulator,theCentralBankoftheUAE,setsandmonitorsregulatorycapitalrequirements.Theoverseasbranchesandsubsidiariesaredirectlysupervisedbytheirlocalregulators.
TheGroup’sobjectiveswhenmanagingcapitalare: • safeguardtheGroup’sabilitytocontinueasagoingconcernandincreasethereturnsfortheshareholders;and • complywithregulatorycapitalrequirementssetbytheCentralBankoftheUAEandtherespectiveregulatorswherethe
overseasunitsoperate.
During 2012, the Group’s strategy, which was unchanged from 2011, was to:
• maintainacapforpaymentofcashdividendratioof40%toincreasecapitalthroughretention; • maintain capital adequacy ratios above theminimum specified by the Central Bank of the UAE and Basel accord
guidelines; • maintainthehighestcreditratingintheMiddleEast;and • efficientlyallocatecapitaltovariousbusinesses.

Notes to the consolidated financial statements
TheGrouphassetupacommittee,namely,theBankEquityCommittee,tomanagetheinvestmentofcapitalfundsinsovereignbonds and short term money market placements with either the Central Bank of the UAE or above investment grade financial institutions.
In implementingcurrentcapitalrequirements, theGroupcalculates itscapitalratios inaccordancewithBasel IandBasel IIguidelinesestablishedbytheCentralBankoftheUAE.
TheGroup’sregulatoryriskassetsratio,setbytheCentralBankoftheUAEataminimumlevelof12%(2011: 12%), of which TierIistobe8%(2011: 8%) is analysed into two tiers as follows:
2012 2011 AED’000 AED’000
Tier 1 capitalIssuedordinarysharecapital 3,874,558 2,870,043Retained earnings 5,009,129 4,385,622Statutory and special reserve 4,065,532 3,563,274General reserve and share option scheme 13,564,866 12,446,567Foreign currency translation reserve (101,731) (4,646)Subordinatedconvertiblenotes-equitycomponent 21,420 27,639Government of Abu Dhabi tier 1 capital notes 4,000,000 4,000,000 -------------- --------------Total 30,433,774 27,288,499 -------------- --------------Tier 2 capitalFair value reserve 314,693 (899,014)Qualifyingsubordinatedliabilities 4,594,507 7,781,927 -------------- --------------Total 4,909,200 6,882,913 -------------- --------------
Deductions from Tier 1 and Tier 2 (44,764) (30,962) -------------- --------------Total (44,764) (30,962) -------------- --------------
Total regulatory capital base 35,298,210 34,140,450 ========== ==========
Risk weighted assets:Onstatementoffinancialposition 140,748,498 123,866,344Offstatementoffinancialposition 36,682,119 32,516,110 -------------- --------------Risk weighted assets 177,430,617 156,382,454 ========== ==========Total regulatory capital as a percentage of total risk weighted assets 19.89% 21.83% ========== ==========Total Tier 1 capital as a percentage of total risk weighted assets 17.15% 17.45% ========== ==========

67
TheGroup’sregulatorycapitaladequacyratio,setbytheCentralBankoftheUAEataminimumlevelof12%(2011: 12%), of whichTierIistobe8%(2011: 8%) is analysed into two tiers as follows:
Basel II BaselII 2012 2011 AED’000 AED’000
Tier 1 capital Ordinarysharecapital 3,874,558 2,870,043Retained earnings 5,009,129 4,385,622Statutory and special reserve 4,065,532 3,563,274General reserve and share option scheme 13,564,866 12,446,567Foreign currency translation reserve (101,731) (4,646)Subordinatedconvertiblenotes-equitycomponent 21,420 27,639Government of Abu Dhabi tier 1 capital notes 4,000,000 4,000,000 -------------- --------------Total 30,433,774 27,288,499 -------------- --------------
Tier 2 capitalFair value reserve 314,693 (899,014)Qualifyingsubordinatedliabilities 4,594,507 7,781,927Allowance for collective impairment 1,967,931 1,947,580 -------------- --------------Total 6,877,131 8,830,493 -------------- --------------
Deductions from capital (44,764) (30,962) -------------- --------------Total regulatory capital base 37,266,141 36,088,030 ========== ==========
Risk weighted assets:Credit risk 159,616,341 155,787,562Market risk 7,563,514 5,582,395Operationalrisk 9,887,826 13,411,531 -------------- --------------Risk weighted assets 177,067,681 174,781,488 ========== ==========
Capital adequacy ratio 21.05% 20.65% ========== ==========
The Bank and its overseas branches and subsidiaries have complied with all externally imposed capital requirements for all periods presented.

Notes to the consolidated financial statements
5 Use of estimates and judgements
IntheprocessofapplyingtheGroup’saccountingpolicies,managementhasmadethefollowingestimatesandjudgements,whichhavethemostsignificanteffectontheamountsrecognisedintheconsolidatedfinancialstatements.
Keysourcesofestimationuncertainty
(i) Impairment charge on loans and advances and investments Impairmentlossesareevaluatedasdescribedinaccountingpolicy3(b)(ix).
The Group evaluates impairment on loans and advances and investments on an ongoing basis and a comprehensive review onaquarterlybasistoassesswhetheranimpairmentchargeshouldberecognisedintheconsolidatedincomestatement.Inparticular, considerable judgementbymanagement is required in the estimationof theamountand timingof futurecashflowswhendeterminingthelevelofimpairmentchargerequired.Inestimatingthesecashflows,managementmakesjudgements about counterparty’s financial situation and othermeans of settlement and the net realisable value of anyunderlyingcollateral.Suchestimatesarebasedonassumptionsaboutseveralfactorsinvolvingvaryingdegreesofjudgementanduncertainty,andactualresultsmaydifferresultinginfuturechangestosuchimpairmentcharges.
(ii) Collective impairment charge In addition to specific impairment charge against individually impaired assets, the Group also maintains a collective
impairment allowance against portfolios of loans and advances with similar economic characteristics which have not been specifically identifiedas impaired. Inassessing theneed for collective impairment charge,management considersconcentrations,creditquality,portfoliosizeandeconomicfactors.Inordertoestimatetherequiredallowance,assumptionsaremadetodefinethewayinherentlossesaremodelledandtodeterminetherequiredinputparameters,basedonhistoricalandcurrenteconomicconditions.
(iii) Impairment charge on property and equipment and investment properties Impairmentlossesareevaluatedasdescribedinaccountingpolicy3(j)(iii)and3(k)(iii).
In determining the net realisable value, the Group uses the selling prices determined by external independent valuer’scompanies,havingappropriaterecognisedprofessionalqualificationsandrecentexperienceinthelocationandcategoryofpropertybeingvalued.Thesellingpricesarebasedonmarketvalues,beingtheestimatedamountforwhichapropertycouldbeexchangedonthedateofthevaluationbetweenawillingbuyerandawillingsellerinanarm’slengthtransaction.
(iv) Contingent liability arising from litigations Duetothenatureof itsoperations, theGroupmaybeinvolvedinlitigationsarisingintheordinarycourseofbusiness.
Provision for contingent liabilities arising from litigations is based on the probability of outflow of economic resources and reliabilityofestimatingsuchoutflow.Suchmattersaresubjecttomanyuncertaintiesandtheoutcomeofindividualmattersisnotpredictablewithassurance.
(v) Share option scheme ThefairvalueoftheshareoptionschemeisdeterminedusingtheBlack-Scholesmodel.Themodelinputscompriseshareprice,exerciseprice,sharepricevolatility,contractuallifeoftheoption,dividendyieldandrisk-freeinterestrate.
CriticalaccountingjudgementsinapplyingtheGroup’saccountingpoliciesinclude:
(a) Financial asset and liability classification The Group’s accounting policies provide scope for financial assets and liabilities to be designated on inception into different
accounting categories in certain circumstances:
Inclassifyingfinancialassetsas“fairvaluethroughprofitorloss”,“held-to-maturity”or“available-for-sale”,theGrouphasdetermineditmeetsthedescriptionassetoutinaccountingpolicy3(b)(iii,ivandv)respectively.
(b) Qualifying hedge relationships Indesignatingfinancialinstrumentsasqualifyinghedgerelationships,theGrouphasdeterminedthatitexpectsthehedgetobehighlyeffectiveoverthelifeofthehedgingrelationship.
(c) Valuation of financial instruments TheGroup’saccountingpolicyonfairvaluemeasurementsisdiscussedinaccountingpolicy3(b)(viii)andnote6.

69
6 Financial assets and liabilities
Fair value of financial instruments
All financial assets and liabilities are measured at amortised cost except for derivatives, investment at fair value through profitorloss,available-for-saleinvestmentsandnon-tradinginvestmentswhicharemeasuredatfairvaluebyreferenceto published price quotations in an activemarket or fromprices quoted by counterparties or throughuse of valuationtechniquessuchasdiscountedcashflowmethod.
Fair value is the amount for which an asset could be exchanged, or a liability settled, between knowledgeable willing partiesinanarm’slengthtransaction.Consequently,differencescanarisebetweenbookvaluesandthefairvalueestimates.Underlying the definition of fair value is the presumption that the Group is a going concern without any intention or requirementtomateriallycurtailthescaleofitsoperationortoundertakeatransactiononadverseterms.
The Group measures fair values using the following fair value hierarchy that reflects the significance of the inputs used in making the measurements:
• Level1:Quotedmarketprice(unadjusted)inactivemarketforanidenticalinstrument.
• Level2:Valuationtechniquesbasedonobservableinputs,eitherdirectly(i.e.,asprices)orindirectly(i.e.,derivedfromprices).Thiscategoryincludesinstrumentsvaluedusing:quotedmarketpricesinactivemarketsforsimilarinstruments;orothervaluationtechniqueswhereallsignificantinputsaredirectlyorindirectlyobservablefrommarketdata.
• Level3:Valuationtechniquesusingunobservableinputs.Thiscategoryincludesallinstrumentswherethevaluationtechnique
includes input not based on observable data and the unobservable input have a significant impact on the instrument’s valuation.
Valuationtechniquesincludenetpresentvalueanddiscountedcashflowmodels,comparisontosimilarinstrumentsforwhichmarketobservablepricesexist,Black-Scholesandothervaluationmodels.Assumptionsandinputsusedinvaluationtechniquesincluderisk-freeandbenchmarkinterestrates,creditspreadsandotherinputsusedinestimatingdiscountrates,bondandequityprices,foreigncurrencyexchangerates,equityandequityindexpricesandcorrelations.Theobjectiveofvaluationtechniquesis to arrive at a fair value determination that reflects the price of the financial instrument at the reporting date that would have beendeterminedbymarketparticipantsactingatarm’slength.
The fair values of due from banks and financial institutions, reverse repurchase agreement , due to banks and financial institutions, repurchase agreements and customers’ deposits which are predominantly short term in tenure and issued at market rates, are consideredtoreasonablyapproximatetheirbookvalue.
The Group estimates that the fair value of its loans and advances portfolio is not materially different from its book value sincemajorityofloansandadvancescarryfloatingmarketratesofinterestandarefrequentlyre-priced.Forloansconsideredimpaired, expected cash flows, including anticipated realisation of collateral, were discounted using an appropriate rate and consideringthetimeofcollection,thenetresultofwhichisnotmateriallydifferentfromthecarryingvalue.

Notes to the consolidated financial statements
The table below sets out the Group’s classification of each class of financial assets and liabilities and their carrying amounts as at 31 December 2012:
Designated at fair value Held Available Loans Other through for for Held to and amortised Carrying profit or loss trading sale maturity advances cost amount AED’000 AED’000 AED’000 AED’000 AED’000 AED’000 AED’000
Cashandbalanceswithcentralbanks - - - - -54,943,221 54,943,221 Investmentsatfairvalue throughprofitorloss 20,051 3,254,262 - - - - 3,274,313Due from banks andfinancialinstitutions - - - - -14,615,968 14,615,968Reverserepurchaseagreements - - - - -18,509,608 18,509,608Loansandadvances - - - -164,599,378 -164,599,378Non-tradinginvestments - -28,159,555 4,127,302 - -32,286,857Derivativefinancialinstruments 730,511 4,852,569 - - - - 5,583,080Otherassets - - - - - 4,156,287 4,156,287 ------------- ------------- ------------- ------------- -------------------------- ------------- 750,562 8,106,831 28,159,555 4,127,302 164,599,378 92,225,084 297,968,712 ========= ========= ========= ========= ========= ========= =========Duetobanksandfinancialinstitutions - - - - -35,477,275 35,477,275Repurchaseagreements - - - - - 2,017,041 2,017,041Eurocommercialpaper - - - - - 2,831,198 2,831,198Customers’deposits - - - - -190,303,573190,303,573Termborrowings - - - - -19,073,630 19,073,630Derivativefinancialinstruments 1,716,728 4,935,780 - - - - 6,652,508Otherliabilities - - - - - 6,640,834 6,640,834Subordinatednotes - - - - - 5,662,361 5,662,361 ------------- ------------- ------------- ------------- -------------------------- ------------- 1,716,728 4,935,780 - - - 262,005,912 268,658,420 ========= ========= ========= ========= ========= ========= =========
The table below sets out the Group’s classification of each class of financial assets and liabilities and their carrying amounts as at 31 December 2011:
Designated at fair value Held Available Loans Other through for for Held to and amortised Carrying profit or loss trading sale maturity advances cost amount AED’000 AED’000 AED’000 AED’000 AED’000 AED’000 AED’000
Cashandbalanceswithcentralbanks - - - - -24,468,641 24,468,641Investmentsatfairvaluethroughprofitorloss - 1,610,745 - - - - 1,610,745Duefrombanksandfinancialinstitutions - - - - -15,166,763 15,166,763Reverserepurchaseagreements - - - - -16,425,020 16,425,020Loansandadvances - - - -159,522,178 -159,522,178Non-tradinginvestments - -21,357,205 5,212,135 - -26,569,340Derivativefinancialinstruments 797,258 4,808,389 - - - - 5,605,647Otherassets - - - - - 3,938,409 3,938,409 ------------- ------------- ------------- ------------- -------------------------- ------------- 797,258 6,419,134 21,357,205 5,212,135 159,522,178 59,998,833 253,306,743 ========= ========= ========= ========= ========= ========= =========Duetobanksandfinancialinstitutions - - - - -39,795,601 39,795,601Repurchaseagreements - - - - - 3,513,726 3,513,726Eurocommercialpaper - - - - - - - Customers’deposits - - - - - 151,816,887 151,816,887Termborrowings - - - - -15,148,516 15,148,516Derivativefinancialinstruments 825,668 3,958,805 - - - - 4,784,473Otherliabilities - - - - - 5,545,544 5,545,544Subordinatednotes - - - - - 7,990,054 7,990,054 ------------- ------------- ------------- ------------- -------------------------- ------------- 825,668 3,958,805 - - - 223,810,328 228,594,801 ========= ========= ========= ========= ========= ========= =========

71
Fair value hierarchy
The table below analyses financial instruments measured at fair value at the end of the reporting period, by the level in the fair value hierarchy into which the fair value measurement is categorised:
Level 1 Level 2 Level 3 Total AED’000 AED’000 AED’000 AED’000
As at 31 December 2012Financialassetsheldfortrading 3,121,220 133,042 - 3,254,262Designated at fair value throughprofitandloss - 20,051 - 20,051Available-for-salefinancialassets 24,806,638 3,332,890 20,027 28,159,555Derivativefinancialinstruments(Assets) 1,540 5,581,540 - 5,583,080Derivativefinancialinstruments(Liabilities) 812 6,651,696 - 6,652,508 --------------- --------------- --------------- --------------- 27,930,210 15,719,219 20,027 43,669,456 =========== ========== ======== ===========
As at 31 December 2011Financialassetsheldfortrading 1,610,745 - - 1,610,745Designated at fair value throughprofitandloss - - - -Available-for-salefinancialassets 16,856,573 4,476,246 24,386 21,357,205Derivativefinancialinstruments(Assets) 501 5,605,146 - 5,605,647Derivativefinancialinstruments(Liabilities) 271 4,784,202 - 4,784,473 --------------- --------------- --------------- --------------- 18,468,090 14,865,594 24,386 33,358,070 =========== ========== ======== ===========
Certainavailable-for-saleinvestmentsecuritieshavebeendisclosedunderLevel3ofthefairvaluehierarchyasmanagementhasrecordedtheseatcostintheabsenceofobservablemarketdata.Managementhasdeemedcosttobeacloseapproximationoftheirfairvalue.
ThefollowingtableshowsareconciliationfromthebeginningbalancestotheendingbalancesforfairvaluemeasurementsinLevel3: 2012 2011 AED’000 AED’000
Available-for-sale financial assetsBalanceasat1January 24,386 419,238Purchases 943 -Settlementsandotheradjustments (5,302) (394,852) -------------- ---------------Balance as at 31 December 20,027 24,386 -------------- ---------------
7 Cash and balances with central banks
2012 2011 AED’000 AED’000
Cash on hand 1,238,260 1,132,344Balances with the Central Bank of the UAE cash reserve deposits 7,816,271 6,524,220 certificates of deposits 7,000,000 6,000,000 other deposits and balances - 914,352 Balances with other central banks cash reserve deposits 943,678 1,388,580 other deposits and balances 37,945,012 8,509,145 -------------- -------------- 54,943,221 24,468,641 ========== ==========CashreservedepositsarenotavailableforthedaytodayoperationsoftheGroup.

Notes to the consolidated financial statements
8 Investments at fair value through profit or loss
2012 2011 AED’000 AED’000
Managed portfolios 611,413 570,474Debtandequityinstruments 2,662,900 1,040,271 -------------- --------------- 3,274,313 1,610,745 ========== ==========
Debt and equity instruments include investments designated at fair value throughprofit or loss amounting toAED20,051thousand(2011:AEDNil).
9 Due from banks and financial institutions
2012 2011 AED’000 AED’000
Current, call and notice deposits 1,663,975 3,121,542Margin deposits 2,582,780 284,228Fixed deposits 8,971,357 10,370,993Wakala placements 1,397,856 1,390,000 -------------- --------------- 14,615,968 15,166,763 ========== ==========
10 Reverse repurchase agreements
The Group enters into reverse repurchase agreements in the normal course of business in which the third party transfers finan-cialassetstotheGroupforshorttermfinancing.
ThecarryingamountoffinancialassetsatthereportingdateamountedtoAED18,510million(2011:AED16,425million).
Noallowancesforimpairmenthavebeenrecognisedagainstreverserepurchaseagreementsduringtheyear(2011:nil).
11 Loans and advances
2012 2011 AED’000 AED’000
Gross loans and advances 170,824,154 164,825,023Less:allowanceforimpairment (5,517,723) (4,800,706)Less:interestsuspended (707,053) (502,139) -------------- ---------------Net loans and advances 164,599,378 159,522,178 ========== ===========
An analysis of gross loans and advances by counterparty at the reporting date is shown below:
2012 2011 AED’000 AED’000
Government sector 21,153,974 17,293,055Public sector 40,649,950 45,346,578Banking sector 20,177,846 16,052,536Corporate / private sector 62,038,598 59,288,780Personal / retail sector 26,803,786 26,844,074 -------------- ---------------Gross loans and advances 170,824,154 164,825,023 ========== ===========

73
The movement in the allowance for impairment during the year is shown below:
2012 2011 AED’000 AED’000
At1January 4,800,706 3,664,081Charge for the year Collective provision 291,874 428,376 Specific provision 1,709,070 1,291,038Recoveries (218,723) (128,195)Write-backsduringtheyear (579,717) (268,939)Amounts written off (485,487) (185,655) -------------- ---------------At 31 December 5,517,723 4,800,706 ========== ===========
Islamic financingIncludedintheaboveloansandadvancesarethefollowingIslamicfinancingcontracts:
2012 2011 AED’000 AED’000
Ijara 6,207,987 6,804,114Murabaha 583,102 611,588Mudaraba 3,805 2,940Others 3,576 2,533 -------------- ---------------Total Islamic financing contracts 6,798,470 7,421,175Less:allowanceforimpairment (35,542) (63,648)Less:suspendedprofit (819) (2,263) -------------- --------------- 6,762,109 7,355,264 ========== ===========
The movement in the allowance for impairment during the year is shown below:
2012 2011 AED’000 AED’000
Balanceasat1January 63,648 62,928Charge for the year Collective provision - 833 Specific provision 10,322 -Write-backsduringtheyear (4,790) (113)Amountswrittenoffandotheradjustments (33,638) - -------------- ---------------Balance as at 31 December 35,542 63,648 ========== ===========
ThegrossIjaraandtherelatedpresentvalueofminimumIjarapaymentsareasfollows:
2012 2011 AED’000 AED’000
Gross IjaraLessthanoneyear 2,048,093 1,493,258Between one and five years 3,965,907 3,796,320More than five years 2,615,230 2,968,025 -------------- --------------- 8,629,230 8,257,603Less:deferredincome (2,421,243) (1,453,489) -------------- ---------------Net Ijara 6,207,987 6,804,114 ========== ===========
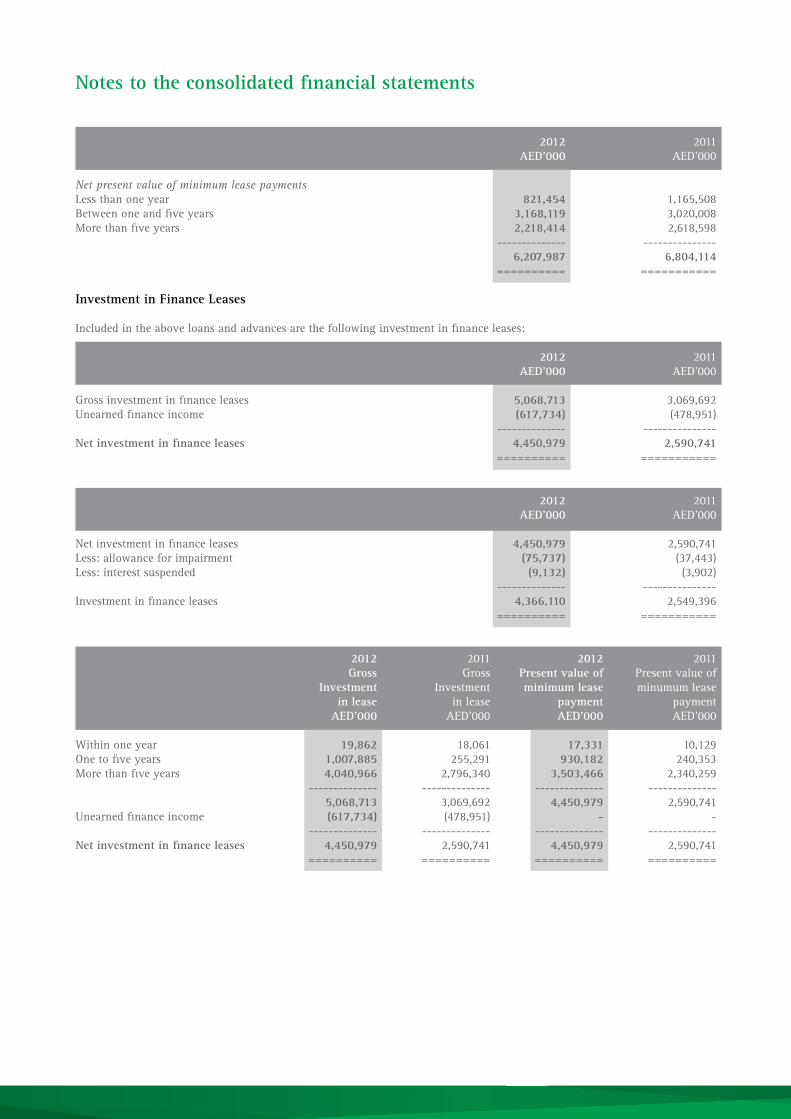
Notes to the consolidated financial statements
2012 2011 AED’000 AED’000
Net present value of minimum lease paymentsLessthanoneyear 821,454 1,165,508Between one and five years 3,168,119 3,020,008More than five years 2,218,414 2,618,598 -------------- --------------- 6,207,987 6,804,114 ========== ===========
Investment in Finance Leases
Includedintheaboveloansandadvancesarethefollowinginvestmentinfinanceleases:
2012 2011 AED’000 AED’000
Gross investment in finance leases 5,068,713 3,069,692Unearned finance income (617,734) (478,951) -------------- ---------------Net investment in finance leases 4,450,979 2,590,741 ========== ===========
2012 2011 AED’000 AED’000
Net investment in finance leases 4,450,979 2,590,741Less:allowanceforimpairment (75,737) (37,443)Less:interestsuspended (9,132) (3,902) -------------- ---------------Investmentinfinanceleases 4,366,110 2,549,396 ========== ===========
2012 2011 2012 2011 Gross Gross Present value of Present value of Investment Investment minimum lease minumum lease in lease in lease payment payment AED’000 AED’000 AED’000 AED’000
Within one year 19,862 18,061 17,331 10,129Onetofiveyears 1,007,885 255,291 930,182 240,353More than five years 4,040,966 2,796,340 3,503,466 2,340,259 -------------- -------------- -------------- -------------- 5,068,713 3,069,692 4,450,979 2,590,741 Unearned finance income (617,734) (478,951) - - -------------- -------------- -------------- --------------Net investment in finance leases 4,450,979 2,590,741 4,450,979 2,590,741 ========== ========== ========== ==========

75
12 Non-trading investments
Available-for-sale investments
2012 2011 AED’000 AED’000
Unquotedinvestments 32,368 41,098Less:allowanceforimpairment (16,712) (16,712) -------------- --------------- 15,656 24,386Quotedinvestments 28,143,899 21,332,819 -------------- ---------------Totalavailable-for-saleinvestments 28,159,555 21,357,205 -------------- ---------------
Unquoted investments includeunquotedequitysecuritiesamounting toAED14,908 thousand (2011:AED24,095 thousand)which are carried at cost as their fair value cannot be reliably estimated. TheGroup does not intend to dispose of theseinvestmentsinnearterm.
Debtinstrumentsunderrepurchaseagreementsincludedinquotedavailable-for-saleinvestmentsat31December2012amountedtoAED1,245million(2011:AED2,067million).
Held-to-maturity investments
2012 2011 AED’000 AED’000
Debt securities 4,127,302 5,212,135 -------------- ---------------
-------------- ---------------Totalnon-tradinginvestments 32,286,857 26,569,340 ========== ===========
Duringtheyear,theGroupreclassifieddebtsecuritiesamountingtoAEDnil(2011:AED266,692thousand)fromavailable-for-sale investments to held to maturity as a result of such reclassification there is no impact in the consolidated income statement orfairvaluereserve.
The movement in allowance for impairment against finance lease receivables during the year is shown below:
2012 2011 AED’000 AED’000
At1January 37,443 17,612Charge for the year Specific provision 39,180 10,827 Collective provision (886) 9,004 -------------- ---------------At 31 December 75,737 37,443 ========== ===========

Notes to the consolidated financial statements
13 Other assets
2012 2011 AED’000 AED’000
Interestreceivable 1,946,603 1,846,396Acceptances 1,463,434 1,369,955Sundry debtors and other receivables 868,983 837,823Deferred tax asset 21,175 29,237 -------------- --------------- 4,300,195 4,083,411 ========== ===========
TheGroupdoesnotperceiveanysignificantcreditriskoninterestreceivableandacceptances.
14 Investment properties
CostAt1January2011 - --------------At 31 December 2011 - --------------Acquisitionsandtransfers 143,987 --------------At 31 December 2012 143,987 ==========Accumulated depreciation
At1January2011 - --------------At 31 December 2011 - --------------Charge for the year 3,926 --------------At 31 December 2012 3,926 ==========
Carrying amountsAt 31 December 2011 - ==========At 31 December 2012 140,061 ==========
The Group estimates that the carrying value of the investment properties is not significantly different from its fair value as at thereportingdate.
Land and building AED’000

77
15 Property and equipment
Furniture, Land, Computer equipment, Capital building and systems and safes and work - in alterations equipment vehicles progress Total AED’000 AED’000 AED’000 AED’000 AED’000
CostAt1January2011 2,170,169 352,559 255,686 239,213 3,017,627Acquisitions 49,032 39,117 33,318 204,184 325,651Transfer 49,110 101,374 4,929 (155,413) -Disposals/writeoff (7,220) (3,966) (11,961) - (23,147) ------------- ------------ ------------ ------------ ------------At 31 December 2011 2,261,091 489,084 281,972 287,984 3,320,131 ------------- ------------ ------------ ------------ ------------
Acquisitions 50,052 46,593 40,553 182,153 319,351Transfer 14,232 98,774 2,099 (115,105) -Disposals/writeoff (19,324) (16,462) (19,507) - (55,293) ------------- ------------ ------------ ------------ ------------At 31 December 2012 2,306,051 617,989 305,117 355,032 3,584,189 ========== ======== ======== ======== ==========
Accumulated depreciation and impairment losses
At1January2011 445,220 206,644 155,211 - 807,075Chargefortheyear 48,847 70,067 38,363 - 157,277Disposals (6,181) (2,198) (10,975) - (19,354)Impairmentloss 159,373 - - - 159,373 ------------- ------------ ------------ ------------ ------------At 31 December 2011 647,259 274,513 182,599 - 1,104,371 ------------- ------------ ------------ ------------ ------------
Chargefortheyear 50,538 87,763 39,089 - 177,390Disposals (9,795) (15,204) (19,061) - (44,060) ------------- ------------ ------------ ------------ ------------At 31 December 2012 688,002 347,072 202,627 - 1,237,701 ========== ======== ======== ======== ==========
Carrying amountsAt 31 December 2011 1,613,832 214,571 99,373 287,984 2,215,760 ========== ======== ======== ======== ==========At 31 December 2012 1,618,049 270,917 102,490 355,032 2,346,488 ========== ======== ======== ======== ==========
Capitalworkinprogressmainlycomprisesofpropertiesunderconstruction.

Notes to the consolidated financial statements
16 Due to banks and financial institutions
2012 2011 AED’000 AED’000
Banks and financial institutionsCurrent, call and notice deposits 1,888,783 1,705,058Margin 121,821 155,754Fixed deposits 20,196,240 25,053,561Wakala deposit 4,650,000 5,808,400 -------------- -------------- 26,856,844 32,722,773 -------------- --------------Central banks Current and call deposits 2,324,938 1,351,001Fixed and certificate of deposits 6,295,493 5,721,827 -------------- -------------- 8,620,431 7,072,828 -------------- -------------- 35,477,275 39,795,601 ========== ==========
Duetobanksandfinancialinstitutionsaredenominatedinvariouscurrenciesandcarryarateofinterestintherangeof0%to3.75%(2011:0%to4.50%).
17 Repurchase agreements
The Group enters into repurchase agreements in the normal course of business by which it transfers recognised financial assets directlytothirdparties.
ThecarryingamountoffinancialassetscollateralisedatthereportingdateamountedtoAED1,245million(2011:AED2,067million)andtheirassociatedfinancialliabilitiesamountedtoAED2,017million(2011:AED3,514million).
18 Euro commercial paper
TheBankestablishedaUSD2,000,000thousandEurocommercialPaperProgramme(the“ECPProgramme”)fortheissuanceofEurocommercialpaperunderanagreementdated13September2006withCitibank,N.A.
ThenotesoutstandingasatthereportingdateamountedtoAED2,831,198thousand(2011:AEDnil).Theyaredenominatedinvariouscurrencies,bearinterestintherangebetween0.005%to1.87%andhavematurityperiodsoflessthan12months.
The Group has not had any defaults of principal, interests, or other breaches with respect to its Euro commercial Paper during 2012.
19 Customers’ deposits
2012 2011 AED’000 AED’000
By account:Current accounts 37,798,161 32,150,382Savings accounts 8,818,334 6,814,788Notice and time deposits 132,933,772 105,288,051Certificates of deposit 10,753,306 7,563,666 -------------- -------------- 190,303,573 151,816,887 ========== ==========

79
2012 2011 AED’000 AED’000
By counterparty: Government sector 77,558,577 46,594,553Public sector 21,544,696 26,077,291Corporate / private sector 50,916,022 45,909,760Retail sector 40,284,278 33,235,283 -------------- -------------- 190,303,573 151,816,887 ========== ==========
2012 2011 AED’000 AED’000
By location:UAE 134,760,589 101,848,077Europe 19,978,034 19,803,853Arab countries 23,591,133 20,074,335Americas 5,025,976 4,651,812Asia 6,621,787 4,724,381Others 326,054 714,429 -------------- -------------- 190,303,573 151,816,887 ========== ==========
Islamic customers’ deposits
Includedintheabovecustomers’depositsarethefollowingIslamiccustomerdeposits:
2012 2011 AED’000 AED’000
Wakala deposits 3,020,855 2,769,106Mudaraba deposit 180,655 146,285 -------------- -------------- 3,201,510 2,915,391 ========== ==========
20 Term borrowings
2012 2011 AED’000 AED’000
Club loan and other facilities 3,856,650 3,489,350Othertermnotes 15,216,980 11,659,166 -------------- -------------- 19,073,630 15,148,516 ========== ==========

Notes to the consolidated financial statements
The following term notes are outstanding at 31 December:
Yearof 2012 2011Currency Interest maturity AED’000 AED’000 GBP 5.88percent(fixed) Feb2012 - 2,010,313EUR 3MEURIBOR+step-upspread Jun2012 - 166,569EUR 3MEURIBOR+step-upspread Jul2012 - 556,815USD 3MUSDLIBOR+120bps Oct2012 - 77,808HKD 1.65percent(fixed) Oct2013 89,119 89,088USD 4.50percent(fixed) Sep2014 3,238,546 3,270,204HKD 3.80percent(fixed) Sep2014 195,697 197,718HKD 3.90percent(fixed) Oct2014 119,967 121,063USD 4.25percent(fixed) Mar2015 2,879,242 2,892,966MYR 4.75percent(fixed) Jun2015 595,851 573,449USD 3.25percent(fixed) Mar2017 2,828,117 -HKD 3.40percent(fixed) Sep2017 156,286 152,752USD 3.71percent(fixed) Sep2017 116,365 113,829HKD 4.32percent(fixed) Sep2017 157,450 155,508USD 3.00percent(fixed) Aug2019 2,750,561 -HKD 4.45percent(fixed) Sep2019 169,434 165,833MYR 4.90percent(fixed) Dec2020 569,676 549,922HKD 3.95percent(fixed) Apr2022 163,381 -JPY 2.60percent(fixed) Jul2026 431,052 491,869HKD 3.94percent(fixed) Jul2027 194,400 -USD 4.37percent(fixed) Aug2032 281,668 -USD 4.10percent(fixed) Sep2032 109,598 -USD 4.80percent(fixed) Sep2036 77,456 73,460USD 5.01percent(fixed) May2042 93,114 - -------------- -------------- 15,216,980 11,659,166 ========== ==========
The Group has not had any defaults of principal, interests, or other breaches with respect to its term borrowings during 2012 and2011.
21 Other liabilities
2012 2011 AED’000 AED’000
Interestpayable 1,513,640 1,368,526Acceptances 1,382,739 1,331,543Provision for staff terminal benefits 445,738 421,146Accounts payable, sundry creditors and other liabilities 4,009,821 3,043,928Overseasincometax 96,554 63,620 -------------- -------------- 7,448,492 6,228,763 ========== ==========
The movement in the provision for staff terminal benefits was as follows:
2012 2011 AED’000 AED’000
Balanceat1January 421,146 388,320Provided during the year 77,401 77,659Paid during the year (52,809) (44,833) -------------- --------------Balance at 31 December 445,738 421,146 ========== ==========

81
The Group has provided for overseas income tax in accordance with management’s estimate of the total amount payable based ontaxratesenactedorsubstantiallyenactedasatthereportingdate.WhereappropriatetheGrouphasmadepaymentsoftaxonaccountinrespectoftheseestimatedliabilities.
Theoverseasincometaxchargefortheyeariscalculatedbasedupontheadjustednetprofitfortheyear.Themovementintheprovision was as follows:
2012 2011 AED’000 AED’000
At1January 63,620 53,817Charge for the year 123,023 111,624Overseasincometaxpaid,netofrecoveries (90,089) (101,821) -------------- --------------At 31 December 96,554 63,620 ========== ==========
22 Subordinated notes
2012 2011 AED’000 AED’000
Subordinated note – Ministry of Finance Tier 2 notes 3,273,621 5,912,647Othersubordinatednotes 2,388,740 2,077,407 -------------- -------------- 5,662,361 7,990,054 ========== ==========
Ministry of Finance Tier 2 notes
ThenotesmaturinginDecember2016carryafixedstepupcouponandarepaidquarterlyinarrears.TheBankhashedgedtheinterestrateexposureonthesenotes.
2012 2011 AED’000 AED’000
Liability component15 March 2006 issue 1,032,824 1,040,63228 February 2008 issue 807,817 1,036,77510 December 2012 issue 548,099 - -------------- -------------- 2,388,740 2,077,407 ========== ==========
Equity component15 March 2006 issue 72,926 72,92628 February 2008 issue 52,984 52,984Less:conversionof15March2006issue (40,502) (40,502)Less:buybackof28February2008issue (31,564) (25,345)Transfer to general reserve (32,424) (32,424) -------------- -------------- 21,420 27,639 ========== ==========
15 March 2006 issue:
TheBankissuedAED2.5billionsubordinatedconvertiblenotesdueon15March2016inaccordancewiththeapprovaloftheExtraordinaryGeneralMeetingheldon22November2005.Thenotesbearaninterestrateequalto3monthEBORplus0.25%paidquarterly.
Duringthepreviousyear,theconversionoptionfor15March2006issueexpired,accordingly,theequitycomponentofAED32,424thousandrelatedtothisissuewastransferredtogeneralreserve.

Notes to the consolidated financial statements
Furtherduringtheyear,theBankpurchasedbackAED10,000thousand(2011:AED62,000thousand)ofthisissuefromthemarket forAED9,000 thousand (2011:AED54,405 thousand).As a result, the total outstanding liability componentsweredecreasedbyAED9,708thousand(2011:AED60,191thousand).Further,againontheextinguishmentintheamountofAED933thousand(2011:AED7,022thousand)wasrecognisedintheconsolidatedincomestatement.
The above mentioned notes are presented in the consolidated statement of financial position as follows:
2012 2011 AED’000 AED’000
Proceeds from issue of convertible notes 2,500,000 2,500,000Less:amountclassifiedasequity (72,926) (72,926) -------------- --------------Carrying amount of liability component on initial recognition 2,427,074 2,427,074Add: cumulative accreted interest 23,623 21,722Less:convertedliabilitycomponent (1,347,973) (1,347,973)Carrying amount of liability bought back (69,900) (60,191) -------------- --------------Carrying amount of liability component 1,032,824 1,040,632 ========== ==========
Theeffectiveinterestrateasat31December2012was3monthEBORplus0.301%(2011:3monthEBORplus0.301%).
28 February 2008 issue:
Further, on 28 February 2008, the Bank issued AED 2 billion subordinated convertible notes due on 28 February 2018 in accordancewiththeapprovaloftheExtraordinaryGeneralMeetingheldon5September2007.Thenotesbearaninterestrateequalto3monthEBORless0.25%paidquarterly.
These convertible notes are presented in the consolidated statement of financial position as follows:
2012 2011 AED’000 AED’000
Proceeds from issue of convertible notes 2,000,000 2,000,000Less:amountclassifiedasequity (52,984) (52,984) -------------- --------------Carrying amount of liability component on initial recognition 1,947,016 1,947,016Add: cumulative accreted interest 20,697 21,124Carrying amount of liability bought back (1,159,896) (931,365) -------------- --------------Carrying amount of liability component 807,817 1,036,775 ========== ==========
Interest on these notes is calculated on an effective yield basis by applying the effective interest rate for equivalent non-convertiblenotestotheliabilitycomponentoftheconvertiblenotes.Theeffectiveinterestrateasat31December2012was3monthEBORplus0.116%(2011:3monthEBORplus0.116%)
At the option of the holder, the notes may be converted into ordinary shares of the Bank at any time during the period beginning from 28 May 2008 and ending on the date falling 10 trading days prior to the first call date being 28 February 2013 at the conversionpriceofAED12.81perordinaryshare(subsequenttotheissueofbonusshares).TheBankhastheoptiontoredeemthesenotesonthefirstcalldatebeing28February2013.
ThesubordinatedconvertiblenotesformpartofTierIIcapitaloftheBank.
Duringtheyear,theBankpurchasedbackAED234,750thousand(2011:AED561,000thousand)ofthisissuefromthemarketforAED230,397thousand(2011:AED536,930thousand).Asaresult,thetotaloutstandingliabilityandequitycomponentsweredecreasedbyAED228,531thousand(2011:AED546,139thousand)andAED6,219thousand,(2011:AED14,862thousand)respectively.Further,againontheextinguishmentintheamountofAED5,601thousand(2011:AED26,068thousand)wasrecognisedintheconsolidatedincomestatement.

83
10 December 2012 issue:
Further,on10December2012,theBankissuedMYR500millionsubordinatednotesdueon9December2027.Thenotesbearaninterestrateequalto4.75%andwillbepaidonasemi-annualbasis.Thebankhashedgedtheinterestrateexposureonthesenotes.Theeffectiveinterestrateasat31December2012was4.79%.
Fair value
The carrying amount of the liability component of the subordinated notes reflects its current fair value based on discounted cash flows.
The Group has not had any defaults of principal, interests, or other breaches with respect to its subordinated notes during 2012 and2011.
23 Capital and reserves
Share capitalTheauthorisedsharecapitaloftheBankcomprise3,875millionordinarysharesofAED1each(2011:2,870millionsharesofAED1each).Theissuedandfullypaidsharecapitalat31December2012iscomprisedof3,875millionofAED1each(2011:2,870millionordinarysharesofAED1each).
Statutory reserveTheUAECommercialCompaniesLawNo.(8)of1984(asamended)andArticle56oftheBank’sArticlesofAssociationrequirethataminimumof10%oftheannualnetprofittobetransferredtoastatutoryreserveuntilitequals50%ofthepaid-upsharecapital.Thestatutoryreserveisnotavailablefordistributiontotheshareholders.
Special reserveTransferstothespecialreservearemadeinaccordancewithUnionLawNo.(10)of1980andArticle56oftheBank’sArticlesofAssociationunderwhichnotlessthan10%oftheannualnetprofitistobetransferredtothisreserveuntilitequals50%ofthepaid-upsharecapital.Thespecialreserveisnotavailablefordistributiontotheshareholders.
DividendsThe following cash dividend was paid by the Group during the year ended 31 December:
2012 2011 AED’000 AED’000
CashdividendAED0.3perordinaryshare(2011:0.3) 861,013 717,51135%bonusshares(2011:20%bonusshares)issued 1,004,515 478,340 ========== ==========
Proposed dividends:On29January2013,acashdividendofAED0.35perordinaryshareandbonussharesof10%(2011:proposedcashdividendofAED0.3perordinaryshareand30%bonusshares)wasproposedbytheBoardofDirectorsinrespectof2012whichissubjecttotheapprovaloftheshareholdersattheAnnualGeneralMeeting.
Other reservesOtherreservesincludethefollowing:
(i) General reserve The general reserve is available for distribution to the shareholders at the recommendation of the Board of Directors to the shareholders.On13March2012theshareholdersapprovedthetransferofAED2.1billion(2011:AED2.3billion)togeneralreserve.
(ii) Fair value reserve Thefairvaluereserveincludesthecumulativenetchangeinthefairvalueofnon-tradinginvestments,untiltheinvestment
is derecognised or impaired, and cash flow hedge reserve
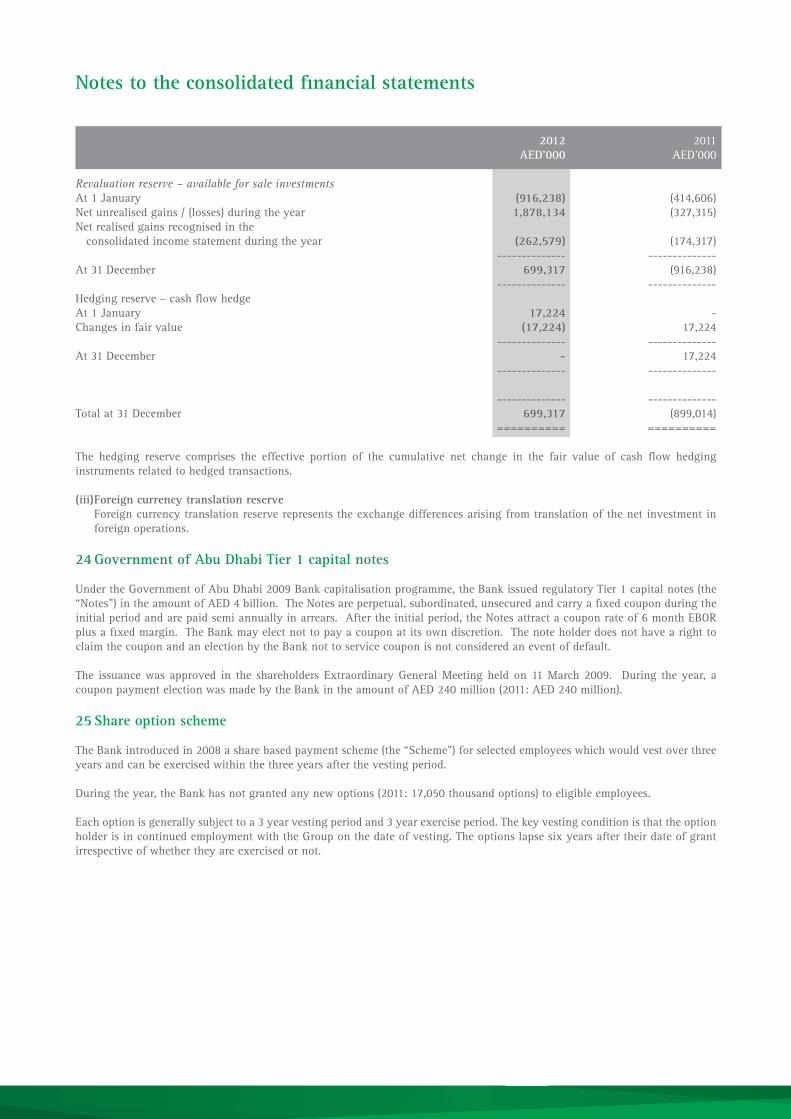
Notes to the consolidated financial statements
2012 2011 AED’000 AED’000
Revaluation reserve – available for sale investmentsAt1January (916,238) (414,606)Netunrealisedgains/(losses)duringtheyear 1,878,134 (327,315)Net realised gains recognised in the consolidated income statement during the year (262,579) (174,317) -------------- --------------At 31 December 699,317 (916,238) -------------- --------------Hedging reserve – cash flow hedgeAt1January 17,224 -Changes in fair value (17,224) 17,224 -------------- --------------At 31 December - 17,224 -------------- --------------
-------------- --------------Total at 31 December 699,317 (899,014) ========== ==========
The hedging reserve comprises the effective portion of the cumulative net change in the fair value of cash flow hedging instrumentsrelatedtohedgedtransactions.
(iii) Foreign currency translation reserve Foreign currency translation reserve represents the exchange differences arising from translation of the net investment in foreignoperations.
24 Government of Abu Dhabi Tier 1 capital notes
UndertheGovernmentofAbuDhabi2009Bankcapitalisationprogramme,theBankissuedregulatoryTier1capitalnotes(the“Notes”)intheamountofAED4billion.TheNotesareperpetual,subordinated,unsecuredandcarryafixedcouponduringtheinitialperiodandarepaidsemiannuallyinarrears.Aftertheinitialperiod,theNotesattractacouponrateof6monthEBORplusafixedmargin.TheBankmayelectnottopayacouponatitsowndiscretion.ThenoteholderdoesnothavearighttoclaimthecouponandanelectionbytheBanknottoservicecouponisnotconsideredaneventofdefault.
The issuancewasapproved in the shareholdersExtraordinaryGeneralMeetingheldon11March2009. During theyear,acouponpaymentelectionwasmadebytheBankintheamountofAED240million(2011:AED240million).
25 Share option scheme
TheBankintroducedin2008asharebasedpaymentscheme(the“Scheme”)forselectedemployeeswhichwouldvestoverthreeyearsandcanbeexercisedwithinthethreeyearsafterthevestingperiod.
Duringtheyear,theBankhasnotgrantedanynewoptions(2011:17,050thousandoptions)toeligibleemployees.
Eachoptionisgenerallysubjecttoa3yearvestingperiodand3yearexerciseperiod.ThekeyvestingconditionisthattheoptionholderisincontinuedemploymentwiththeGrouponthedateofvesting.Theoptionslapsesixyearsaftertheirdateofgrantirrespectiveofwhethertheyareexercisedornot.

85
The numbers of share options are as follows: 2012 2011 Number Number of options of options in thousands in thousands Outstandingat1January 39,524 23,730Forfeited during the year (641) (1,256)Exercised during the year - -Granted during the year - 17,050 -------------- --------------Outstandingat31December 38,883 39,524 ========== ==========
Asaresultoftheissueofbonusshares,theexercisepricepersharewasrevisedfromAED12.95toAED9.60(2011:AED15.55toAED12.95).Alltheoptionsoutstandingasat31December2012haveanexercisepricepershareofAED9.60(2011:AED12.95).
26 Interest income
2012 2011 AED’000 AED’000
Interest fromCentral banks 93,612 71,574Banks and financial institutions 454,356 607,188Reverse repurchase agreements 128,004 94,341Investmentsatfairvaluethroughprofitorloss 34,714 8,326Non-tradinginvestments 1,171,509 972,069Loansandadvances 6,097,397 5,898,288 -------------- -------------- 7,979,592 7,651,786 ========== ==========
27 Interest expense
2012 2011 AED’000 AED’000
Interest toBanks and financial institutions 169,268 271,272Repurchase agreements 15,263 19,628Euro commercial paper 11,118 138Customers’ deposits 893,809 912,743Certificates of deposit 211,090 115,935Term borrowings 571,941 511,339Subordinated notes 284,139 325,483 -------------- -------------- 2,156,628 2,156,538 ========== ==========

Notes to the consolidated financial statements
28 Income from Islamic financing contracts
2012 2011 AED’000 AED’000
Ijara 284,258 300,418Murabaha 31,827 61,905Mudaraba - 488 -------------- -------------- 316,085 362,811 ========== ==========
29 Depositors’ share of profits
2012 2011 AED’000 AED’000
Wakala Deposit 41,486 52,164Mudaraba Deposit 1,471 3,001 -------------- -------------- 42,957 55,165 ========== ==========
30 Net fee and commission income
2012 2011 AED’000 AED’000
Fee and commission income Lettersofcredit 201,478 174,261Lettersofguarantee 236,838 237,240Brokerage income, net 23,512 16,170InitialPublicOfferings(IPO) 45 2,436Asset management and investment services 127,470 111,337Risk participation fees 101,496 105,988Retail and corporate lending fees 966,836 752,721Lowcreditbalancefees 27,503 19,908Commission on transfers 33,633 32,456Others 186,677 183,428 -------------- --------------Total fee and commission income 1,905,488 1,635,945 -------------- --------------
Fee and commission expenseBrokerage commission 16,109 15,314Handling charges 4,665 4,508Credit card charges 293,456 174,099Othercommission 44,862 51,205 -------------- --------------Total fee and commission expense 359,092 245,126 -------------- --------------Net fee and commission income 1,546,396 1,390,819 ========== ==========
Asset management and investment service fees include fees earned by the Group on trust and fiduciary activities where the Groupholdsorinvestsassetsonbehalfofitscustomers.

87
31 Net gain on investments
2012 2011 AED’000 AED’000
Netrealisedandunrealisedgains/(loss)oninvestments at fair value through profit or loss and derivatives 271,412 (83,066)Netgainfromsaleofnon-tradinginvestments 262,579 174,317Dividend income 3,243 2,289 -------------- -------------- 537,234 93,540 ========== ==========
Interestincomeondebtinstrumentsclassifiedasinvestmentsatfairvaluethroughprofitorlossaswellasdebtinstrumentsclassifiedasnon-tradinginvestmentsispresentedwithininterestincome.
32 Net foreign exchange gain
2012 2011 AED’000 AED’000
Trading and retranslation gain on foreign exchange and related derivatives 142,876 98,698Dealings with customers 260,124 423,533 -------------- -------------- 403,000 522,231 ========== ==========
33 Other operating income
2012 2011 AED’000 AED’000
Gain on buy back of issued subordinated notes 6,534 33,090Others 81,529 38,288 -------------- -------------- 88,063 71,378 ========== ==========
34 General, administration and other operating expenses
2012 2011 AED’000 AED’000
Staff costs 1,927,242 1,716,380Othergeneralandadministrationexpenses 724,618 639,799Depreciation 181,316 157,277Donations and charity 36,877 50,268 -------------- -------------- 2,870,053 2,563,724 ========== ==========

Notes to the consolidated financial statements
35 Net impairment charge
2012 2011 AED’000 AED’000
Collective provision for loans and advances 291,874 428,376Specific provision for loans and advances 1,709,070 1,291,038Write back of provisions for loans and advances (579,717) (268,939)Recovery of loan loss provisions (218,723) (128,195)Write-offofimpairedfinancialassets 142,692 19,133Recovery of loans previously written off (8,392) (2,231)Otherrecoveries (261) -Impairmentofnonfinancialassets - 159,373 -------------- -------------- 1,336,543 1,498,555 ========== ==========
36 Overseas income tax expense
Inadditiontoadjustmentsrelatingtodeferredtaxation,thechargefortheyeariscalculatedbasedupontheadjustednetprofitfortheyearatratesoftaxapplicableinrespectiveoverseaslocations.
The charge to the consolidated income statement for the year was as follows:
2012 2011 AED’000 AED’000
Charge for the year 123,023 111,624Adjustmentsrelatingtodeferredtaxation 8,938 (588) -------------- -------------- 131,961 111,036 ========== ==========
37 Cash and cash equivalents
Cashandcashequivalentsincludedintheconsolidatedstatementofcashflowscomprisethefollowingamountsmaturingwithinthreemonthsofthedateoftheacquisition/placement:
2012 2011 AED’000 AED’000
Cash and balances with central banks 48,282,689 20,332,004Due from banks and financial institutions 7,348,694 9,657,573 -------------- --------------Cashandcashequivalents 55,631,383 29,989,577 ========== ==========

89
38 Commitments and contingencies
2012 2011 AED’000 AED’000
Lettersofcredit 35,048,515 31,475,502Lettersofguarantee 46,772,002 45,930,175Undrawn commitments to extend credit 25,805,030 20,873,395Financial guarantees 10,902,938 11,564,783 -------------- -------------- 118,528,485 109,843,855 -------------- --------------
Creditriskcharacteristicsoftheseunfundedfacilitiescloselyresemblethefundedfacilitiesasdescribedinnote4.
Capital and operating lease commitments at the reporting date is shown below:
2012 2011 AED’000 AED’000
Commitments for future capital expenditure 179,639 89,573Commitments for future operating lease payments for premises 134,255 164,785 -------------- -------------- 313,894 254,358 -------------- --------------
-------------- --------------Total commitments and contingencies 118,842,379 110,098,213 ========== ==========
LettersofcreditandguaranteecommittheGrouptomakepaymentsonbehalfofcustomerscontingentupontheproductionofdocumentsorthefailureofthecustomertoperformunderthetermsofthecontract.
Commitmentstoextendcreditrepresentcontractualcommitmentstoextendloansandrevolvingcredits.Commitmentsgenerallyhavefixedexpirationdatesorotherterminationclausesandmayrequireapaymentofafee.Sincecommitmentsmayexpirewithoutbeingdrawnupon,thetotalcontractedamountsdonotnecessarilyrepresentfuturecashrequirements.
Commitments for operating lease payments are payable as follows:
2012 2011 AED’000 AED’000
Lessthanoneyear 44,389 51,246Between one and five years 87,415 90,811More than five years 2,451 22,728 -------------- --------------Total commitments 134,255 110,384,087 ========== ==========
Financial guarantee contracts includes credit default agreements entered with banks and financial institutions amounting to AED 8,650million(2011:AED8,845million)whichareprimarilydenominatedinUSDollars.

Notes to the consolidated financial statements
2012 2011 AED’000 AED’000
Concentration by location:UAE 550,950 367,300Europe 2,148,705 2,093,610Arab countries - 139,574Americas 73,460 293,840Asia 4,407,600 4,536,155Others 1,469,200 1,414,105 -------------- -------------- 8,649,915 8,844,584 ========== ==========
39 Derivative financial instruments
IntheordinarycourseofbusinesstheGroupentersintovarioustypesoftransactionsthatinvolvederivativefinancialinstruments.Derivativefinancial instruments includeforwards, futures, swapsandoptions.These transactionsareprimarilyenteredwithBanksandfinancialinstitutions.
Forwards and futures contracts are commitments to either purchase or sell foreign currencies, commodities or financial instrumentsataspecifiedfuturedateforaspecifiedprice.
Swaps are the agreements between the Group and other parties to exchange future cash flows based upon agreed notional amounts.SwapsmostcommonlyusedbytheGroupareinterestrateswapsandcrosscurrencyswaps.
Optionsarecontractualagreementsthatconveytheright,butnottheobligation,toeitherbuyorsellaspecificamountofacommodityorfinancialinstrumentatafixedpriceeitheratfixedfuturedateoratanytimewithinaspecifiedperiod.
Derivativesaremeasuredatfairvaluebyreferencetopublishedpricequotationsinanactivemarketorcounterpartypricesorvaluationtechniquessuchasdiscountedcashflows.
Thetablebelowshowsthepositiveandnegativefairvaluesofderivativefinancialinstruments,whichareequivalenttotheirfairvalues,togetherwiththenotionalamountsanalysedbythetermtomaturity.Thenotionalamountistheamountofaderivative’sunderlying,referencerateorindexandisthebasisuponwhichchangesinthevalueofderivativesaremeasured.Thenotionalamountsindicatethevolumeoftransactionsoutstandingatyearendandareneitherindicativeofthemarketrisknorcreditrisk.

91
31 D
ecem
ber
2012
----
----
----
----
- N
otio
nal a
mou
nts
by t
erm
to
mat
urit
y --
----
----
----
----
-
Po
siti
ve
Neg
ativ
e
Less
tha
n Fr
om t
hree
Fr
om o
ne
From
thr
ee
mar
ket
mar
ket
Not
iona
l th
ree
mon
ths
to
year
to
year
s to
O
ver
va
lue
valu
e am
ount
m
onth
s on
e ye
ar
thre
e ye
ars
five
yea
rs
five
yea
rs
AED
’000
A
ED’0
00
AED
’000
A
ED’0
00
AED
’000
A
ED’0
00
AED
’000
A
ED’0
00
Hel
d fo
r tr
adin
g:Interestratederivatives
Sw
aps
4,1
21,0
31
3,6
00,6
87
256
,205
,751
2
9,66
8,31
5
62,
342,
809
6
3,53
3,79
8
60,
304,
214
40,
356,
615
For
war
ds &
Fut
ures
6
,048
4
,78875,261,193
36,73041,747,594 33,476,869
-
-
Options&Swaptions
167
,202
1
63,7
16
15,
165,
430
1
,292
,896
7
,025
,118
7
00,7
92
3,8
81,9
70
2,2
64,6
54
Fo
reig
n ex
chan
ge d
eriv
ativ
es
F
orw
ards
4
30,4
60
1,0
39,9
55 139,468,852101,716,82036,101,795
1,631,872
18,365
-
Options
128
,406
1
25,8
11
9,844,360
1,650,741
7,891,760
301,859
-
-
Otherderivativescontracts
114
8
22
3,272,135
1,749,377
1,357,473
18,365
146,920
-
----------------------------------------------------------------------------------------------------------------
4,
853,
261
4
,935
,779
4
99,2
17,7
21
136
,114
,879
1
56,4
66,5
49
99,
663,
555
6
4,35
1,46
9
42,
621,
269
----------------------------------------------------------------------------------------------------------------
Hel
d as
fai
r va
lue
hedg
es:
Interestratederivatives
Sw
aps
72
9,81
9
1,7
16,7
29
41,
501,
373
6
,080
,997
3
,519
,164
8
,350
,212
6
,809
,008
1
6,74
1,99
2
----------------------------------------------------------------------------------------------------------------
72
9,81
9
1,7
16,7
29
41,
501,
373
6
,080
,997
3
,519
,164
8
,350
,212
6
,809
,008
1
6,74
1,99
2
----------------------------------------------------------------------------------------------------------------
Hel
d as
cas
h flow
hed
ges
-
-
-
-
-
-
-
-
----------------------------------------------------------------------------------------------------------------
-
-
-
-
-
-
-
-
----------------------------------------------------------------------------------------------------------------
Tota
l 5,
583,
080
6,6
52,5
08
540
,719
,094
1
42,1
95,8
76
159
,985
,713
1
08,0
13,7
67
71,
160,
477
59,
363,
261
==
====
====
==
====
====
==
====
====
==
====
====
==
====
====
==
====
====
==
====
====
==
====
====

31 D
ecem
ber
2011
----
----
----
----
- N
otio
nal a
mou
nts
by t
erm
to
mat
urit
y --
----
----
----
----
-
Po
siti
ve
Neg
ativ
e
Less
tha
n Fr
om t
hree
Fr
om o
ne
From
thr
ee
mar
ket
mar
ket
Not
iona
l th
ree
mon
ths
to
year
to
year
s to
O
ver
va
lue
valu
e am
ount
m
onth
s on
e ye
ar
thre
e ye
ars
five
yea
rs
five
yea
rs
AED
’000
A
ED’0
00
AED
’000
A
ED’0
00
AED
’000
A
ED’0
00
AED
’000
A
ED’0
00
Hel
d fo
r tr
adin
g:Interestratederivatives
Sw
aps
3,1
32,1
07
2,8
11,1
38
207,
263,
109
2
1,67
7,48
5
39,
295,
128
6
0,32
2,52
7
47,
472,
586
3
8,49
5,38
3 Forwards&Futures
-
3,85
63,988,970
126,719
3,862,251
-
-
-
Options&Swaptions
324
,261
3
24,2
61
3,647,765
-
145,756
695,572
291,825
2,514,612
Fo
reig
n ex
chan
ge d
eriv
ativ
es
S
wap
s 8
28,9
85
323
,576149,933,619101,180,092
44,591,113
4,162,414
-
-
For
war
ds
494
,977
4
71,9
44
6,677,304
3,871,052
1,844,931
961,321
-
-
Options
27,
558
2
3,75
7 9,
199,
092
148
,692
2
,098
,058
4
,171
,848
5
05,3
83
2,27
5,11
1
Otherderivativescontracts
501
2
71
1,35
8,83
3 1
16,4
18
1,0
00,3
13
242
,102
-
-
----------------------------------------------------------------------------------------------------------------
4,
808,
389
3
,958
,803
3
82,0
68,6
92
127
,120
,458
9
2,83
7,55
0
70,
555,
784
4
8,26
9,79
4
43,
285,
106
----------------------------------------------------------------------------------------------------------------
Hel
d as
fai
r va
lue
hedg
es:
Interestratederivatives
Sw
aps
774
,333
8
15,3
70
30,
814,
467
5
,145
,113
3
,659
,939
6
,713
,904
9
,207
,801
6
,087
,710
Forwards
-
4,5
99
367,300
-
-
367,300
-
-
Otherderivativescontracts
-
-
15,256
15,256
-
-
-
-
----------------------------------------------------------------------------------------------------------------
77
4,33
3
819
,969
3
1,19
7,02
3
5,1
60,3
69
3,6
59,9
39
7,0
81,2
04
9,2
07,8
01
6,0
87,7
10
----------------------------------------------------------------------------------------------------------------
Hel
d as
cas
h flow
hed
ges:
Interestratederivatives
Sw
aps
20,6
98
-
366,693
-
-
-
-
366,693
Fo
reig
n ex
chan
ge d
eriv
ativ
es
F
orw
ards
2,
227
5,70
15,538,492
2,636,087
2,902,405
-
-
-
----------------------------------------------------------------------------------------------------------------
22
,925
5
,701
5
,905
,185
2
,636
,087
2
,902
,405
-
-
3
66,6
93
----------------------------------------------------------------------------------------------------------------
Tota
l 5,
605,
647
4
,784
,473
4
19,1
70,9
00
134
,916
,914
9
9,39
9,89
4
77,
636,
988
5
7,47
7,59
5
49,
739,
509
==
====
====
==
====
====
==
====
====
==
====
====
==
====
====
==
====
====
==
====
====
==
====
====
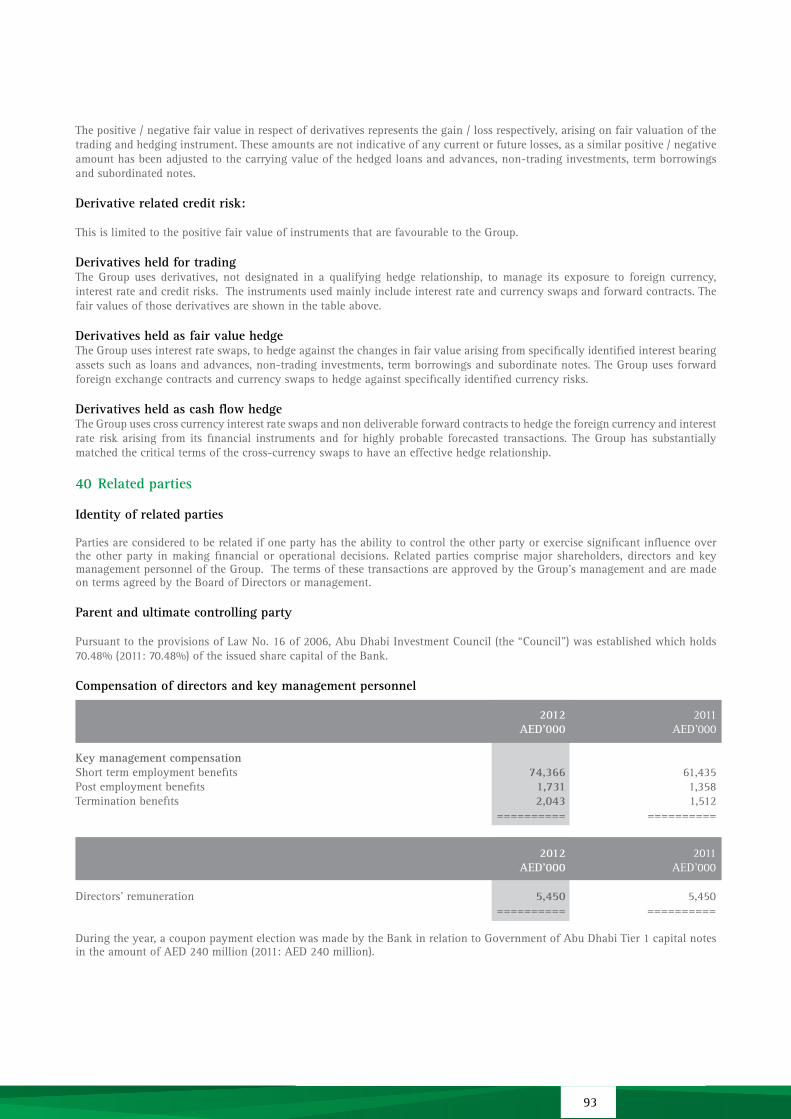
93
The positive / negative fair value in respect of derivatives represents the gain / loss respectively, arising on fair valuation of the tradingandhedginginstrument.Theseamountsarenotindicativeofanycurrentorfuturelosses,asasimilarpositive/negativeamounthasbeenadjustedtothecarryingvalueofthehedgedloansandadvances,non-tradinginvestments,termborrowingsandsubordinatednotes.
Derivative related credit risk:
ThisislimitedtothepositivefairvalueofinstrumentsthatarefavourabletotheGroup.
Derivatives held for tradingTheGroupusesderivatives,notdesignated in aqualifyinghedge relationship, tomanage its exposure to foreign currency,interestrateandcreditrisks.Theinstrumentsusedmainlyincludeinterestrateandcurrencyswapsandforwardcontracts.Thefairvaluesofthosederivativesareshowninthetableabove.
Derivatives held as fair value hedgeThe Group uses interest rate swaps, to hedge against the changes in fair value arising from specifically identified interest bearing assetssuchasloansandadvances,non-tradinginvestments,termborrowingsandsubordinatenotes.TheGroupusesforwardforeignexchangecontractsandcurrencyswapstohedgeagainstspecificallyidentifiedcurrencyrisks.
Derivatives held as cash flow hedgeThe Group uses cross currency interest rate swaps and non deliverable forward contracts to hedge the foreign currency and interest rate riskarising fromitsfinancial instrumentsandforhighlyprobable forecasted transactions.TheGrouphassubstantiallymatchedthecriticaltermsofthecross-currencyswapstohaveaneffectivehedgerelationship.
40 Related parties
Identity of related parties
Parties are considered to be related if one party has the ability to control the other party or exercise significant influence over theotherparty inmakingfinancialoroperationaldecisions.Relatedpartiescomprisemajorshareholders,directorsandkeymanagementpersonneloftheGroup.ThetermsofthesetransactionsareapprovedbytheGroup’smanagementandaremadeontermsagreedbytheBoardofDirectorsormanagement.
Parent and ultimate controlling party
PursuanttotheprovisionsofLawNo.16of2006,AbuDhabiInvestmentCouncil(the“Council”)wasestablishedwhichholds70.48%(2011:70.48%)oftheissuedsharecapitaloftheBank.
Compensation of directors and key management personnel
2012 2011 AED’000 AED’000
Key management compensationShort term employment benefits 74,366 61,435Post employment benefits 1,731 1,358Termination benefits 2,043 1,512 ========== ==========
2012 2011 AED’000 AED’000
Directors’ remuneration 5,450 5,450 ========== ==========
During the year, a coupon payment election was made by the Bank in relation to Government of Abu Dhabi Tier 1 capital notes intheamountofAED240million(2011:AED240million).

Notes to the consolidated financial statements
Terms and conditions
Loansanddepositsaregrantedandacceptedinvariouscurrencydenominationsandforvarioustimeperiods. Interestratesearnedonsuchloansandadvancesextendedtorelatedpartiesduringtheyearhaverangedfrom0.05%to8.25%perannum(2011:0.05%to7%perannum)andinterestratesincurredoncustomers’depositsplacedbyrelatedpartiesduringtheyearhaverangedfromnilto4.5%perannum(2011:nilto4.5%perannum).
Feesandcommissionsearnedontransactionswithrelatedpartiesduringtheyearhaverangedfrom0.20%to1.00%(2011:0.50%to1.00%).
Collateralsagainstlendingtorelatedpartiesrangefrombeingniltofullysecured.
Balances
Balances with related parties at the reporting date are shown below:
Directors and key Major 2012 2011 management shareholder Others Total Total AED’000 AED’000 AED’000 AED’000 AED’000
Financial assets 1,158,356 734,810 56,501,517 58,394,683 50,307,720 ========== ========== ========== ========== ===========Financial liabilities 866,377 1,343,137 80,370,657 82,580,171 47,986,923 ========== ========== ========== ========== ===========Contingent liabilities 578,226 193,203 39,008,674 39,780,103 27,504,245 ========== ========== ========== ========== ===========
OtherscompriseGovernmentofAbuDhabientities.
Transactions
Transactions carried out during the year with related parties are shown below:
Directors and key Major 2012 2011 management shareholder Others Total Total AED’000 AED’000 AED’000 AED’000 AED’000
Fee and commission income 6,263 1,512 49,444 57,219 23,787Interestincome 31,595 20,061 1,396,981 1,448,637 1,056,887Interestexpense 1,176 22,331 306,044 329,551 208,890 ========== ========== ========== ========== =========
No allowances for impairment have been recognised against loans and advances extended to related parties or contingent liabilitiesissuedinfavourofrelatedpartiesduringtheyear(2011:AEDnil).

95
41 Segmental information
TheGroupisstructuredintothefollowingsevenmajorbusinesssegments,whichformthebasisonwhichtheprimarysegmentinformation is reported:
• Domestic Banking TheDomesticBankingDivision(‘‘DBD’’)isresponsibleforthreemajorcustomersegmentstogetherwiththeassociated
operationsandadministration.TheDBDisstructuredonthebasisoftheIssuer’scustomersegmentsandthedifferingneedsoftheIssuer’sbroadcustomerbase.TheDBDcomprisesofthreesegments:ConsumerBanking,BusinessBankinggroupandEliteBanking.
• International Banking TheInternationalBankingDivision(‘‘IBD’’)managestheoverseasbankingnetworkandcreditderivativebook.Itprimarily
comprisesofbothArabworldbanking(whichincludestheIssuer’snetworksinBahrain,Egypt,Oman,Kuwait,Jordan,SudanandLibya)andinternationalbanking(whichincludestheIssuer’soperationsinFrance,Malaysia,HongKong,China,theUnitedKingdomandtheUnitedStatesofAmerica);
• Global Financial Markets TheGlobalFinancialMarketsDivision(‘‘GFMD’’)istheGroup’skeyaccesspointtothemarketsglobally,italsoensures
the liquidity for the entireGroup.GFMDcurrently operates throughLiquiditymanagement and Interest rate group,Tradingand investmentgroupand InstitutionalCoverageandprimarymarket,Corporate coverageandE-commercegroup.
• Corporate and Investment Banking CorporateandInvestmentBankingDivision(‘‘CIBD’’)providescorporateandinvestmentclientswithstrategicadvice
andbespokeinnovativesolutions.TheCIBDcomprisessixbusinessunits:CorporateBankingGroup,InvestmentBankingGroup,WholesaleBankingGroup,AbuDhabiNationalLeasingLLC,AbuDhabiNationalPropertiesandSpecialassetadvisory.
• Global Wealth GlobalWealthcomprisesPrivateBanking,AssetManagementGroup(whichincludeslocalandglobalfundsaswellas
discretionaryportfoliomanagement),CustodyandBusinessdevelopmentandtheBank’swholly-ownedstockbrokerAbuDhabiFinancialServicesandAbuDhabiBrokerageCompanyEgypt.
• Islamic Business IslamicBankingcomprisesAbuDhabiNationalIslamicFinanceandtheIssuer’sIslamicDivision.
• Head Office The Group provides centralised human resources, information technology, finance, investor relations, risk management,
corporate communications, property, legal, internal audit, compliance, collective provisions, operations and administrative supporttoallofitsbusinessesunits.TheHeadOffice,whichisrunlikeabusiness,managestheGroups’freecapital(Grouptreasury).
Theaccountingpoliciesofthereportablesegmentsarethesameasdescribedinnotes2and3.Transactionsbetweensegments, and between branches within a segment, are conducted at estimated market rates or rates agreed by management.Interestischargedorcreditedtobranchesandbusinesssegmentseitheratcontractedorpoolrates,bothofwhichapproximatethereplacementcostoffunds.
Information regarding the results of each reportable segment is included below. Performance ismeasured based onsegment profit before taxation, as included in the internal management reports that are reviewed by the Group’s Chief Executive.Segmentprofitisusedtomeasureperformanceasmanagementbelievesthatsuchinformationisthemostrelevantinevaluatingtheresultsofcertainsegmentsrelativetootherentitiesthatoperatewithintheseindustries.

Corp
orat
e &
D
omes
tic
Int’l
Fi
nanc
ial
Inve
stm
ent
Glo
bal
Isla
mic
H
ead
Ban
king
Ban
king
M
arke
ts
Ban
king
W
ealth
Bus
ines
s of
fice
To
tal
A
ED’0
00
AED
’000
A
ED’0
00
AED
’000
A
ED’0
00
AED
’000
A
ED’0
00
AED
’000
As
at a
nd for
the
yea
r en
ded
31 D
ecem
ber
2012
:
Operatingincome
1,957,915
1,357,275
1,047,857
2,797,679
341,876
269,753
898,430
8,67
0,78
5
====
====
===
====
====
==
====
====
==
====
====
==
====
====
==
====
====
==
====
====
==Netimpairmentcharge
272,389
221,186
(261)
520,441
4,042
5,525
313,221
1,33
6,54
3
====
====
===
====
====
==
====
====
==
====
====
==
====
====
==
====
====
==
====
====
==Profit/(loss)beforetaxation
793,131
714,042
910,058
2,027,914
133,965
156,534
(271,455)
4,46
4,18
9
====
====
===
====
====
==
====
====
==
====
====
==
====
====
==
====
====
==
====
====
==Overseastaxation
-122,475
-
-
10,086
-
(600)
131,
961
==
====
====
= ==
====
====
==
====
====
==
====
====
==
====
====
==
====
====
==
====
====
Netprofit/(loss)fortheyear
793,131
591,567
910,058
2,027,914
123,878
156,534
(270,854)
4,33
2,22
8
====
====
===
====
====
==
====
====
==
====
====
==
====
====
==
====
====
==
====
====
==
Segm
ent
tota
l ass
ets
41,8
84,8
46
93,1
19,4
95
114,
288,
050
99,6
60,4
17
8,44
1,65
3 9,
154,
649
52,1
72,7
13
418,
721,
823
==
====
====
= ==
====
====
==
====
====
==
====
====
==
====
====
==
====
====
==
====
====
Intersegmentbalances
(1
18,1
22,6
54)
--------------
Tota
l ass
ets
30
0,59
9,16
9
===
====
====
Segm
ent
tota
l lia
bilit
ies
41,0
46,2
12
89,8
96,2
31
113,
009,
996
97,2
51,0
25
7,91
6,26
4 8,
388,
279
30,0
80,7
25
387,
588,
732
==
====
====
= ==
====
====
==
====
====
==
====
====
==
====
====
==
====
====
==
====
====
Inter segmentbalances
(1
18,1
22,6
54)
Tota
l lia
bilit
ies
26
9,46
6,07
8
===
====
====
Not
e: E
xcep
t fo
r su
bsid
iari
es t
he c
olle
ctiv
e pr
ovis
ions
of
the
Gro
up’s
Uni
ted
Ara
b Em
irat
es o
pera
tions
are
rec
ogni
sed
cent
rally
in t
he H
ead
offi
ce a
ccou
nts
and
are
not
allo
cate
d to
the
bus
ines
s units.

97
Corp
orat
e &
D
omes
tic
Int’l
Fi
nanc
ial
Inve
stm
ent
Glo
bal
Isla
mic
H
ead
Ban
king
Ban
king
M
arke
ts
Ban
king
W
ealth
Bus
ines
s of
fice
To
tal
A
ED’0
00
AED
’000
A
ED’0
00
AED
’000
A
ED’0
00
AED
’000
A
ED’0
00
AED
’000
As
at a
nd for
the
yea
r en
ded
31 D
ecem
ber
2011
:
Operatingincome
1,855,907
1,139,436
985,611
2,746,823
242,760
240,335
669,990
7,88
0,86
2
====
====
===
====
====
==
====
====
==
====
====
==
====
====
==
====
====
==
====
====
==
Netimpairmentcharge
208,757
115,219
-
589,906
5,509
362
578,802
1,49
8,55
5
====
====
===
====
====
==
====
====
==
====
====
==
====
====
==
====
====
==
====
====
==Profit/(loss)beforetaxation
862,046
626,150
845,133
1,933,174
59,900
158,955
(666,775)
3,81
8,58
3
====
====
===
====
====
==
====
====
==
====
====
==
====
====
==
====
====
==
====
====
==
Overseastaxation
-
108,065
-
-
2,971
-
-
1 11,
036
==
====
====
= ==
====
====
==
====
====
==
====
====
==
====
====
==
====
====
==
====
====
Netprofit/(loss)fortheyear
862,046
518,085
845,133
1,933,174
56,929
158,955
(666,775)
3,70
7,54
7
====
====
===
====
====
==
====
====
==
====
====
==
====
====
==
====
====
==
====
====
==
Segm
ent
tota
l ass
ets
38,1
61,0
60
53,8
82,9
88
81,0
32,9
58
101,
818,
967
7,72
1,18
9 9,
933,
120
51,3
34,1
72
343,
884,
454
==
====
====
= ==
====
====
==
====
====
==
====
====
==
====
====
==
====
====
==
====
====
Intersegmentbalances
(8
8,21
6,94
9)
----------------
Tota
l ass
ets
25
5,66
7,50
5
===
====
====
Segm
ent
tota
l lia
bilit
y 37
,278
,142
51
,140
,937
81
,000
,396
99
,637
,619
7,
258,
254
9,35
5,96
4 31
,823
,657
31
7,49
4,96
9
====
====
===
====
====
==
====
====
==
====
====
==
====
====
==
====
====
==
====
====
==
Intersegmentbalances
(8
8,2 1
6,94
9)
----------------
Tota
l lia
bilit
y
229,
278,
020
=
====
====
==N
ote:
Exc
ept
for
subs
idia
ries
the
col
lect
ive
prov
isio
ns o
f th
e G
roup
’s U
nite
d A
rab
Emir
ates
ope
ratio
ns a
re r
ecog
nise
d ce
ntra
lly in
the
Hea
d of
fice
acc
ount
s an
d ar
e no
t al
loca
ted
to t
he b
usin
ess
units.

42 Earnings per share
Earnings per share is calculated by dividing the net profit for the year after deduction of Tier 1 capital notes payment by the weighted average number of ordinary shares in issue during the year as set out below:
2012 2011
Basic earnings per share:Netprofitfortheyear(AED’000) 4,332,228 3,707,547Less:PaymentonTier1capitalnotes(AED’000) (240,000) (240,000) -------------- --------------Net profit after payment of Tier1capitalnotes(AED’000) 4,092,228 3,467,547 ========== ==========Weighted average number of ordinary shares:Ordinarysharesasat1Januaryoftheyear(‘000s) 2,870,043 2,391,703Effect of bonus shares issuedduring2012(‘000s) 1,004,515 1,004,515Effect of bonus shares issued during2011(‘000s) - 478,340 -------------- --------------Weighted average number ofordinaryshares(‘000s) 3,874,558 3,874,558 ========== ==========Basic earnings per share (AED) 1.06 0.90 ========== ==========Diluted earnings per share:Net profit after payment of Tier1capitalnotes(AED’000) 4,092,228 3,467,547Add:Interestonsubordinatedconvertiblenotes(AED’000) 15,860 31,485Netprofitfortheyear -------------- -------------- for calculating diluted earningspershare(AED’000) 4,108,088 3,499,032 ========== ==========Weighted average number of ordinaryshares(‘000s) 3,874,558 3,874,558Effect of dilutive potential ordinary sharesissued(‘000s) 70,114 90,949Weightedaveragenumberofordinary -------------- -------------- shares in issue for diluted earnings pershare(‘000s) 3,944,672 3,965,507 ========== ==========Diluted earnings per share (AED) 1.04 0.88 ========== ==========
Notes to the consolidated financial statements

99
43 Fiduciary activities
The Group held assets under management in trust or in a fiduciary capacity for its customers at 31 December 2012 amounting toAED5,427million(2011:AED2,553million).Furthermore,theGroupprovidescustodianservicesforsomeofitscustomers.
The underlying assets held in a custodial or fiduciary capacity are excluded from these consolidated financial statements of the Group.
44 Special Purpose Entities
TheGrouphascreatedSpecialPurposeEntities(SPEs)withdefinedobjectivestocarryonfundmanagementandinvestmentactivitiesonbehalfofcustomers.TheequityandinvestmentsmanagedbytheSPEsarenotcontrolledbytheGroupandtheGroupdoesnotobtainbenefitsfromtheSPEs’operations,apartfromcommissionsandfeeincome.Inaddition,theGroupdoesnotprovideanyguaranteesorassumeanyliabilitiesoftheseentities.Consequently,theSPEs’assets,liabilitiesandresultsofoperationsarenotincludedintheseconsolidatedfinancialstatementsoftheGroup.TheSPEsareasfollows:
Country of HoldingLegal name Activities incorporation 2012
NBADNomineesLimited Sharesregistration England 100%
NBADFundManagers(Guernsey)Limited Equity/AssetManagement BailiwickofGuernsey 100%
NBADGlobalGrowthFundPCCLimited Equity/AssetManagement BailiwickofGuernsey 100%
OnesharePLC InvestmentCompany RepublicofIreland 100%
NBADPrivateEquity1 FundManagement CaymanIsland 57.14%
NBADDeucalionInvestmentManagerLimited FundManagement CaymanIsland 50%
NBAD(Cayman)Limited1 FundManagement CaymanIsland 100%
NBADGlobalMulti-StrategyFund1 FundManagement CaymanIsland 100%
1 New SPEs added during the year
45 Comparative figures
Certain comparative figures have been reclassified where appropriate to conform to the presentation and accounting policies adoptedintheseconsolidatedfinancialstatements.

Risk Management & Basel II-Pillar III Disclosures

101

Risk Management & Basel II Pillar III Disclosures
National Bank of Abu Dhabi (NBAD) and its subsidiaries,collectively known as the “Group”, assesses its capital adequacy based on the Capital Adequacy Standards of theCentralBankofUAE (CBUAE)published inNovember2009for Standardized Approach. The document is adopted fromBIS Revised Framework – ‘International Convergence ofCapitalMeasurementandCapitalStandards’.The frameworkisstructuredaroundthreePillars:PillarI-MinimumCapitalRequirements;PillarII–theSupervisoryReviewProcessandthe Internal Capital Adequacy Assessment Process (ICAAP);andPillarIII-MarketDiscipline. Pillar I deals with the computation of Regulatory Capital ratio.ItinvolvescriteriabasedassessmentofriskforvariousassetclassesandcalculationofRiskWeightedAssets(RWAs)forcredit,marketandoperationalrisktoderivetherequiredregulatorycapital.AllUAEbanksaresubjecttoaminimumcapitaladequacyratioof12%,which is significantlyhigherthantheglobalrequiredminimumof8%.CapitaladequacyfortheGroupasat31stDecember2012was21.05%-substantiallyhigherthantheregulatoryminimum.
The Group calculates RWA as per CBUAE guidelines for credit, market and operational risks as presented below:
Credit risk The Group uses the Standardised approach to calculate RWA for credit risk. It uses risk weights to convert exposuresintoRWAasperCBUAEguidelinesforBaselIIwhichcanrangebetween0%forcertainsovereignexposuresto150%for high risk exposures. The risk assessment is driven byratingspublishedbyExternalCreditAssessmentInstitutionsapprovedbyCBUAE.
Market risk
The Group uses the Standardised Approach of measurement asperCBUAEguidelinestocalculateRWAforspecificrisk.IncalculatingRWAformarketrisk,theGroupdistinguishesbetween general and specific risk and between holdings in thetradingbookandholdingsoutsidethetradingbook.
Operational risk
TheGroupusestheBasicIndicatorApproachasperCBUAEguidelinesforBasel2tocalculateRWAforoperationalrisk.Thecalculationisbasedonasingleindicator:income.RWAarecalculatedas15%percentageoftheaverageincomeinthepastthreeyears.
Future steps: The Group plans to migrate to the advanced approaches of Basel II accord and isworking internally onstrengtheningitspolicies,processesandtools.TheGrouphasvoluntarily applied to CBUAEwith a request to initiate theaccreditation process which would allow the Group to progress towards the Foundation – Internal Rating Based (F-IRB)approach; this would allow the Group to use its internal credit risk rating models to calculate and report credit risk regulatory capital.
Pillar II deals with (a) Supervisory Review of Bank’s riskmanagement framework and taking a view on whether additional capital needs to be held for risks not covered under PillarIand(b)InternalCapitalAdequacyAssessmentProcess(ICAAP), which is the Bank’s own framework to assess itssolvency (Capital and Liquidity) requirements over the nextbusinesscycle.
TheGroupwillbesubmittingitsICAAPdocumentfor2012toCBUAEinMarch2013.TheICAAPdocument:
• DefinesriskappetiteofthebankintermsofKPIs(financialandoperational)
• Introspectsintobusinessstrategiesundervariousadversescenarios (e.g.SevereRecession,LiquidityCrisis,etc.) toestimateadditionalsolvencyrequirements(StressTest)tooperatewithintheGroup’sriskappetite.
• Quantifiesadditionalcapitalrequirementsforquantifiable(e.g.Concentrationrisk,InterestRateRiskintheBankingBook) andqualitative risks (e.g.ReputationalRisk)overandabovethePillarIrequirements.
As per current internal estimates, the Group’s current level of capital adequacy is deemedmore than sufficient to dealwith all these additional risks and under appropriate stressed scenarios.
Pillar III relates tomarketdisciplineandrequires theBanktodisclosedetailedqualitative andquantitative informationof its risk management and capital adequacy policies andprocesses.
Pillar III Qualitative & Quantitative Disclosures
DisclosuresunderPillarIIIfollowtheguidelinesandformatsof theCapitalAdequacyStandards (StandardizedApproach)of CBUAE. All subsidiaries are consolidated and significantinvestmentsaredeductedaspertheBaselIIguidelines(alsoconsistentwithIFRSguidelines).

103
As at 31st December 2012 Amount (AED 000)
Tier 1 Capital
1.Paidupsharecapital/commonstock 3,874,558
2.Reserves
a.Statutoryreserve 1,937,279
b.Specialreserve 2,128,253
c.Generalreserve 13,463,135
d.RetainedEarnings 5,009,129
e.Others 21,420
3.Minorityinterestsintheequityofsubsidiaries
4.Innovativecapitalinstruments 4,000,000
5.Othercapitalinstruments
6.Surpluscapitalfrominsurancecompanies
Sub-total 30,433,774
Less:Deductionsforregulatorycalculation
Less:DeductionsfromTier1capital
i.Tier1Capital-Subtotal 30,433,774
ii.Tier2capital 6,877,131
iii.Otherdeductionsfromcapitals 44,764
iv.Totaleligiblecapitalafterdeductions 37,266,141
Table 1: Subsidiaries and Significant Investments
Table 2: Consolidated Capital Structure as at 31st December 2012
As at December 2012 Country of % Description Accounting Incorporation Ownership TreatmentSubsidiaries:
AbuDhabiInternationalBankInc. Curacao,NetherlandsAntilles 100% Banking FullyConsolidated
AbuDhabiFinancialServicesLLC AbuDhabi,UAE 100% Shares&Securites FullyConsolidated
AbuDhabiNationalLeasingLLC AbuDhabi,UAE 100% Leasing FullyConsolidated
AbuDhabiNationalPropertiesPrJC AbuDhabi,UAE 100% PropertyManagement FullyConsolidated
NBADTrustCompany(Jersey)Limited Jersey,ChannelIslands 100% FundManagement FullyConsolidated
NBADPrivateBank(Suisse)SA Geneva,Switzerland 100% PrivateBanking FullyConsolidated
AbuDhabiNationalIslamicFinanceCompany AbuDhabi,UAE 100% IslamicFinance FullyConsolidated
AmpleChinaHoldingLimited HongKong,China 100% Leasing FullyConsolidated
AbuDhabiBrokerageEgypt Egypt 100% Brokerage FullyConsolidated
National Bank of Abu Dhabi MalaysiaBerhad KualaLumpur,Malaysia 100% Banking FullyConsolidated
NBADInvestmentManagement(DIFC)Limited Dubai,UAE 100% FundManagement FullyConsolidated
Significant Investments:
Special Purpose Entities
NBADNomineesLimited England 100% SharesRegistration NotIncluded
NBADFundManagers(Guernsey)Limited BailiwickofGuernsey 100% Equity/AssetManagement NotIncluded
NBADGlobalGrowthFundPCCLimited BailiwickofGuernsey 100% Equity/AssetManagement NotIncluded
OneSharePLC RepublicofIreland 100% InvestmentCompany NotIncluded
NBADPrivateEquity CaymanIsland 57% FundManagement NotIncluded
NBADDeucalionInvestmentManagerLimited CaymanIsland 50% FundManagement NotIncluded
NBAD(Cayman)Limited CaymanIsland 100% FundManagement NotIncluded
NBADGlobalMulti-StrategyFund CaymanIsland 100% FundManagement NotIncluded
Others:
NationalTakafulPJSC AbuDhabi,UAE 16% Insurance DeductedfromCapital
MisrIranOffice&TouristicBuildingsCo Egypt 20% Leasing DeductedfromCapital
TheconsolidatedeligiblecapitalforcapitaladequacycomputationasatDecember2012asperthesaidguidelinesispresentedbelow:

Asat31stDecember2012,thecapitaladequacyratiooftheNBADGroupis:
Table 3: Capital Adequacy as at 31st December 2012
(AED 000)
Quantitative Disclosures Capital Charge Capital Ratio (%)
Capital Requirements
1. Credit Risk
a.StandardizedApproach 19,153,961
b.FoundationIRB
c.AdvancedIRB
2. Market Risk
a.StandardizedApproach 907,622
b.ModelsApproach
3. Operational Risk
a.BasicIndicatorApproach 1,186,539
b.StandardizedApproach
c.AdvancedMeasurementApproach
Total Capital requirements 21,248,122
Capital Ratio
a.TotalforTopconsolidatedGroup 21.05%
b.Tier1ratioonlyfortopconsolidatedGroup 17.19%
c.Totalforeachsignificantbanksubsidiary
New Regulations
During2011,BaselCommitteeonBankingSupervision (BCBS)officiallyannounced thefinal setof regulatorycapital rules,dubbedasBaselIII,asperwhichthreeimportantratioswillbephasedinby2015whilekeepingtheCapitalAdequacyRatio(CAR)intactatcurrentlevel.Complyingwiththenewruleswillincreasecapitalandliquidityrequirements.Thefinaldetailedguidelines from CBUAE concerning the same are still awaited; however the Group is generally in a strong position to comply withtheexpectedBaselIIIrules(includingphasing-inperiod).
First,bankswillberequiredtoincreasetheminimumCommonEquityRatiofromexisting2%to4.5%andinaddition,theywillalsoberequiredtoholdacapitalconservationbufferof2.5%leadingtonewregulatoryminimumat7%.Second,thebanksareprogressivelyrequiredtoincreasetheminimumTierICapitalto6%bytheendof2018.Third,BCBShassuggestedaminimumLeverageRatioof3%whichmaybechangedbeforethefullimplementation.Inthiscontext,therespectiveratiosfortheGroupasat31stDecember2012areasbelow.
Table 4: Basel III Ratio as at 31st December 2012
As at 31st December 2012 Ratio
CommonEquityratio 14.92%
TierIratio 17.19%
Leverageratio 7.12%

105
GROUP RISK GOVERNANCE STRUCTURE
Structure and Organization of the Risk Management Function vis-à-vis Group
TheBoardofDirectors(the“Board”)hasoverallresponsibilityfortheestablishmentandoversightoftheGroup’sriskmanagementframework.TheBoardisassistedbyaBoardlevelriskcommittee–RiskManagementCommitteeaswellassixmanagementriskcommitteesshownbelow.
NBAD Group Risk Governance Structure
Board
Board CommitteeRisk Management Committee
Management Committee
Group Assets & Liabilities Committee
Group Credit Committee
InvestmentCommittee BankEquity
Reputational Risk Committee
OperationalRiskManagement Committee
Group Chief Executive
Business Unit Risk Management UnitGroup Risk Management
Division
GroupChiefRiskOfficer
Business Continuity
Management Steering
Committee
Business Division

Board Committee
RiskManagement Committee (RMC), comprises ofmembersfrom the Board, and is responsible for recommending and setting the Group’s risk strategy and policy guidelines, and subsequently monitoring adherence. RMC takes creditdecisions above management’s discretionary powers, defines market risk limits under which the Group’s management operates and also monitors the overall credit, operational and marketrisksfortheGroup.
Management Committees
The management committees are responsible for implementing theriskmanagementframework.Themajorfunctionsofthesix management committees are given below:
• Group Assets and Liabilities Committee (G-ALCO) TheprincipalaimofG-ALCOistoachievesustainableand
stable profits within a framework of acceptable financial risks, which includes market risk for proprietary trading andinvestmentportfolio,liquidityrisk,interestraterisk,and foreign exchange risk for Treasury and Banking Book andcapitalmanagement.
• Group Credit Committee (GCC) GCC is responsible for approving credit proposals under authority delegated by the Board. Credit proposalsexceeding the authority of the GCC are referred to the RMC.TheGCCinturndelegatesauthoritytodivisionalcreditcommittees.Thecommitteealsoimplementscreditrisk strategy and policy in line with the risk appetite approvedbytheBoard,throughtheRMC.Thecommitteealso periodically monitors the Group’s credit portfolio, reviews classification of Non-Performing Loans andassessesprovisionadequacy.
• Operation Risk Management Committee (ORMC) ORMCensuresappropriateinvolvementandcoordinationofbusinessmanagementintheORMactivitiesatSeniorManagement levels and also acts as the key sponsor for ORMUnitactivities.
• Investment Committee Bank Equity The key responsibilities of the committee are to assess the capital required for the Group’s growthand expansion plans, maintain capital adequacy forthe Group operations and regulatory requirement, tomanageGroup’scapitalwithinauthorizedlimitsand,toformulateinvestmentstrategiesforGroup’sfreecapital.
• Reputational Risk Committee The committee is responsible for reviewing and making
final determination on all reputational risk issues where escalation of such issue is made by senior management or required under group policies and procedures. The
committee also ensures that reputation risk is embedded intoacomprehensiveriskmanagementprogram.
• BusinessContinuityManagementCommittee The committee is responsible for providing oversight
and strategy for Business Continuity Management and Disaster Recovery Management at the Group.The committee gathers inputs from the business and the support functions from within the Group to aid in decision making and priority setting to ensure the successofbusinesscontinuityintheGroup.
A separate Group Risk Management Division (GRMD),reportingtotheRMCandGroupChiefExecutive(G-CE),assistsincarryingouttheoversightresponsibilityoftheBoard.Thereare four main independent functions of the GRMD, which are:
• GroupCreditUnderwriting Itcoversallaspectsofcreditapprovalfromendtoend,
definition of credit appetite and strategies at the business segment level, purview of overall portfolio quality,approvalofindividualtransactionsandsanctionissuance.
• Group Independent Risk Management (GIRM) Responsible for overall management of portfolio credit risk, market risk, liquidity risk, operational risk, andbusiness continuity management as well as overall risk architecture of the Group
• GroupRiskQualityAssurance(RQA) Supports theGCRO in enhancing overall quality of therisk function including risk decisions, processes, portfolio quality,servicestandards,riskhumanresources/cultureandskillsenhancement.
• SatelliteRiskUnits Each business division / international unit has an
embedded risk management function, headed by a Risk Officer (RO). The embedded ROs and their teamsare responsible for assisting business heads in the identification and management of their business risk profilesandforimplementingappropriatecontrols.Theseteams also assist GIRM in the formulation of Grouppoliciesandtheir implementationacross thebusinesses.TheembeddedROsreportjointly(twosolidlines)totheirrespectivebusinessheadsandtotheGCRO
The Group has established risk management functions within business units over the last two years in order for GRMD to assist the Group to build a strong scalable risk based infrastructure andsupportfuturegrowth.Thisinvolvescreating‘satelliteriskunits’ responsible for risk management within each business unit, both for domestic and overseas operation.ROsassignedwithin business unit have two solid reporting lines – one to the business head and the other to the GCRO. The keyobjectives for the satellite risk units are to ensure efficientcoordination between business units and GRMD on all credit

107
andriskinitiatives,ensurefullutilizationofriskarchitecture(models,systems,processetcetera)withinthebusinessunitsand improved risk governance by embedding and enhancing riskcultureatbusinessunitlevel.Risk Quality Assurance (RQA) Department has been newlyestablishedwithinGRMDtoperformthreemajorfunctionsviz.RiskQualityAssessment,RiskGovernance andPerformanceManagement, Risk Development and Communication. Theprimary focus of this department is to carry out the following functions:
• Identify gaps & early warning signals by undertakingCredit & Investment adjudication reviews of Groupportfolioaswellasassessmentof the IndependentRiskManagementfunctions.
• Implement the Group Risk Strategy through a robustRisk Governance framework and adequate PerformanceManagement.
• Deploy a strong risk culture through risk skillsenhancement programs across the Group, implementation of Risk Based remuneration practices and proper jobevaluationforriskprofessionals.
Additionally, RQA ensures alignment of GRMD to meetISO 9001 standards in terms of standardizing processes,maintaining service standards and identifying on going improvementobjectives.
Risk Appetite
The Group has established a risk appetite framework, which defines the amount and the type of risk acceptable to the Bank while pursuing its strategic/business objectives. The Bank’scurrent risk appetite framework primarily reflects the top-down view of its capacity to take risk, defined in terms of RiskAppetiteParameters(RAPs)whicharecircumscribedbyself-imposed constraints and tolerance levels around them.These constraints are limits and triggers to avoid adverse outcomes which would be out of line with internal and external expectations, and may lead to unexpected losses of a scale that would be detrimental to the stability of the relevant businessunitsoroftheGroupasawhole.
The Group’s risk appetite statement is governed by seven broad metrics:
• Creditrating• Capitaladequacy• Earningsvolatility• Assetquality&provisioncoverage• Liquidityrisk• Marketrisk• Operationalrisk
These metrics are converted to measurable risk assessment parameters and tolerance levels at Group level as well as business unit level. The Group level statement outlines the
key risk parameters, their current level and medium term targets.Atbusinessunitlevel,alongwithriskparameters,theriskappetiteprovides specificguidance in termsof ‘what isencouraged’and‘whatisdiscouraged’aswellasoverarchingkeyriskmessages.
CREDIT RISK
Credit risk is the risk that a customer or counterparty to a financial asset fails to meet its contractual obligations and causestheGrouptoincurafinancialloss.Itarisesprincipallyfrom the Group’s loans and advances, due from banks including reverse repo, off balance sheet contingent liabilities andnon-tradinginvestments.
a) Management of Credit Risk
The Group’s Credit Risk Management framework includes policies & procedures to monitor and manage these risks.The Group Risk Management function ensures centralizedoversight for credit risk management including:
• Establishmentofauthorizationstructureandlimitsfortheapproval and renewal of credit facilities;
• Reviewingandassessingcreditexposuresinaccordancewithauthorizationstructureandlimits,priortofacilitiesbeing committed to customers. Review and renewal offacilitiesaresubjecttothesameprocess;
• Diversificationoflendingandinvestmentactivities;• Limitingconcentrationsofexposureto industrysectors,
geographic locations and counterparties; and• Reviewingcompliance,onanongoingbasis,withagreed
exposure limits relating to counterparties, industries and countries and reviewing limits in accordance with risk managementstrategyandmarkettrends.
The Group uses an internal risk rating system to assess the creditqualityofborrowersandcounterparties.EachCorporateand Public Sector Enterprise (PSE) exposure is assigned arating.Theriskratingsystemhas11grades,furthersegregatedinto24notches.Grades1-7areperforming,Grade8isWatch-listandGrades9-11arenon–performingeachwitharatingdescription. These grades aremapped to the external creditratings(StandardandPoor,Moody’sandFitch).
• For Corporate, SMEs, and High Net-Worth IndividualsthesearemappedtoanInternalRatingBased(IRB)expertsystem,validatedforGCCconditions.
• EachgradeintheratingsystemislinkedtoastatisticalProbabilityofDefault(PD).
The internal risk rating system plays a significant role in efficient use of credit risk measurement and management including:
• Risk based pricing and determination of Risk adjustedreturn on capital

• Risk based monitoring (Frequency and intensity ofmonitoring)
• Determining riskbaseddelegationof powers at varioussanction authority levels
• Estimationofcollectiveprovisioning• EstimationofregulatorycapitalasperBaselIIF-IRB
Theratingsystemissubjectedtoanannualvalidationprocess.During 2011, the rating models were validated by an external third party and a roadmap created for building new models for specific portfolio segments and to perform validation and enhancement, as required, of existing models. New modelsfor specific portfolios of the Group were introduced in 2012 and select existing model enhanced; these new models and previously existing models would be validated in 2013 based on information collected in 2012 and enhancements made as required.
The Group currently uses rating models based on statistical analysisbutsupplementsthemwithexpertjudgment.Asdataavailability (bothqualitativeandquantitative) improves, therating system would tend more towards statistical models, butwouldretainexpert judgmenttoensurethatmodelsaresuitable for banks portfolio and in line with the banks policies andculture.
Retail lending business is governed by product programs vetted by the Risk Management Division and employs credit scoringtechniquetoprocesssmallscale,largevolumecreditdecisions.Thescoresarecombinedwithmanagementjudgmentto ensure effective ongoing process of approval, review and enhancement.Majorityoftheretailcreditoriginationprocesshas been automated which significantly reduces operational riskarisingoutofthecreditapprovalandmonitoringprocess.
Sovereign and bank exposures are governed by the ratings fromexternalcreditratingagencies.
The Group has implemented Global Limits & CollateralManagement System (GLCMS), as a limit and exposureaggregator over all transaction systems in U.A.E. UsingGLCMS,counterpartyandgroupexposurecanbeaggregatedand reported across portfolios in U.A.E. The information ismade available through an application interface as well as through periodically scheduled reports. The system enablesvarious Credit Administration Units to monitor security documentcomplianceandfollowuponcollateralvaluations.GLCMScalculatesnetexposuresforthecounterpartyadjustingforeligiblecreditmitigants.Thesystemisintegratedwiththecredit approval system and internal rating platform on a real timebasis.TheGroupisworkingtonextenhanceGLCMSwiththecapabilitytomonitorlimitutilizationinrealtimewhichwouldidentifyexceptionsbeforetransactionauthorization.
The Group is in final stages of completing Enterprise Data WarehouseprojectwithBusinessIntelligencelayerontop.Theprojectenablesdatahistorizationforriskandalsoenhancesreportingcapabilitiesmanifold.
b) Credit risk is monitoring is performed at various levels
• Monitoringofriskquality(Obligorlevel):TheGrouphasaprocess of periodic review of credit based on the internal rating grades. More frequent reviews are made for theweakercreditsandlessfrequentreviewsforthesuperiorcredits.TheGrouphasaprocessofdefiningandreportingall the potential problem accounts. Consumer bankingportfolio is monitored based on delinquency buckets,which are calculated based on the number of installments duefromthecustomer.
• Monitoring of risk quality (Portfolio Level): The Groupmonitors the existing portfolio based on the economic sectors, industry, geography, ratings and business lines.These portfolio reports are generated periodically and the seniormanagementisinformedonthesame.
• Monitoringofpastduesonprincipalandinterest:Allthepast dues on principal and interest on loans and advances portfolio of the Group are reported periodically to the seniormanagement.Measures to realize suchpast duesareinitiatedwithstringentfollowupthereafter.
• Monitoringofexcessoverlimits:Grouphasapolicyformonitoring of all excesses over limits. The monitoringreports are submitted to the senior management and processes are initiated to realize and regularize suchexcesses.
• Monitoring of potential loss accounts (Watch-list): Thiscategory comprises of accounts where principal or interest are past due and which show some potential weakness in the borrower’s financial position and credit worthiness, whichrequiresgreaterfollow-upandmonitoring.
• Rating migration: The Group reviews transition matrixforalltheinternallyratedcustomersonaquarterlybasiswhich provides insights regarding the credit qualitymigrationaswellasmodelperformance.
• Tradedcreditrisk:TheGrouphasinternallydesignedandimplemented the methodology to estimate the potential future exposure (PFE) associated with FX, interest rateand commodity OTC derivatives. The PFEs are usedby the Group to set the risk limit as well as to monitor counterpartyexposureondailybasis.
• Collateralmanagement:TheGrouphasadoptedarigoroussystem of controls, reviews and approvals to ensure effectivecollateralmanagement.Thisincludesminimumloantovalue(LTV)requirementforeachfacility,specificcollateral requirement for lending against shares andreal estate portfolio, margin calls for treasury products and ensuring legal enforceability of contracts including perfectionofsecurityinterests.

109
RQAwill further strengthen the post facto review of creditand investment underwriting process and supplement Group Audit and Group Compliance Divisions. The Loan ReviewMechanism (LRM) ensures that credit and investmentunderwriting operates within a sound, well defined framework with appropriate use of expert judgment. The review alsocovers the risk rating framework, methodology and process for managing credit and investment transactions as well as monitoring of early warning triggers, remedial action and loss estimation.
c) Concentration Risk
Credit concentration risk refers to the level of exposure to any individual or related group of customers, specific industry or sector, country or geographical locations. The first levelof protection against concentration risk is through country and industry thresholds limits set by the Risk Management CommitteeandGroupCreditCommittee.Creditexposurestoindividual customers or customer groups is controlled through ariskbaseddelegationofpowers(DoP)matrixwithborrower’sRisk Rating and collateral forming the inputs to the DoP matrix.
Single Name Concentration:Single name concentration is monitored on an individual basis with the top 10 corporate exposures for overseas countries and top 20 corporate exposures for UAE being reported to the GCC onaquarterlybasis.TheGroupabidesbysingleobligorlimitsset byCBUAE requiring thebanks to seekCBUAEapprovalfor any planned exposure to a single counterparty or groups of connected counterparties exceeding the limit applicable to thatcounterparty.
Sector Concentration:The Group has consciously adopted measures to diversify the exposures to various sectors. Real Estate exposure remainswithin the limits prescribed by CBUAE, with sufficient collateral coverage.TheGrouphasestablishedindustrylimitstoensureportfolio diversification and employs stringent lending guidelinesinconjunctionwithcloseportfoliomonitoringforvulnerableportfoliostosystematicdownturns.
Geographic Concentration:The Group’s operations are mainly concentrated within UAE. The Group as part of its business expansion strategyhas consciously diversified its business across geographies to reduce the dependence on localmarkets. Diversificationsacross geographies expose the Group to legal, transfer and sovereign risk.Exposuresagainst these limitsaremonitoredperiodicallytoensurecompliance.
d) Credit Risk Policy
Credit risk policies are an integral part of the Group’s risk managementframework.Policiesgovernallactivitiesrelatedto credit appraisal and underwriting appraisal of credit and extension of credit such as product risk review and approval,
stress testing, risk limits, risk approval authorities, and model risk management. Business segments specific policies andproceduresareestablishedtomanagetherisksthatareuniquetotheiroperations.
During 2012, the Bank completed the revamp of its Group credit policy manual, which was independently validated byErnst&Young,which ismeant togovern thecredit riskactivitiesoftheBank.Therevampwasinthemakingforthelast two years, and is designed to embed the nature of the Group’s existing business, its future road map, international bestpractices,andlessonsfromtherecentfinancialcrisis.Thekey highlights are as below:
• PartA:Group levelcreditpoliciesare thehigh-leveloroverarching policies for all the entities within the Group, domestic as well as international. These policies coverthegeneralcreditpoliciesandrequirementssuchasriskappetite and credit portfolio planning, risk budgeting, credit risk governance, fundamental credit principles and credit criteria, credit risk rating and pricing, credit risk mitigationandremedialmanagement.
• Part B: Business segment credit policies articulate thepolicies specific to individual business segments within the Bank that originate or take on credit exposures.These policies govern the stages of credit approval life cycle, viz. origination, assessment and measurement,pricing, approval, commitment, high-level principles ofcredit administration and credit operations, monitoring, reportingandremedialmanagement.
• PartC:Thispartcoverstwosectionsviz.policiesgoverning(a)creditproductsand(b)specializedlendingcategories.Product policies detail the product specific policies for all permissible generic credit products that may be offered by one or more business segments as well as traded credit products. Programmed lending in consumer bankingwhich are covered by individual products programmes serveasanextensionofthesepolicies.Specializedlendingcategoriescoverareassuchassyndicatedcredit,projectfinancing, contractor financing, real estate financing, sharefinancingandassetbackedlending.Thispartalsocovers the process and authority for introduction and approvalofnewcreditproducts.
• PartD:Thisincludesportfoliomanagementpolicieswhicharticulatethepoliciesoncreditriskadjudicationreview,credit risk quality assurance and portfoliomanagementincludingcreditrisklimitsandstresstesting.
To facilitate Bank-wide usage, the credit policies are beingrolled out on a web-based platform with advanced searchfunctionalitiestoenhanceeaseofuse.

Geo
grap
hic,
Sec
tora
l, Te
nor
clas
sifi
cati
on o
f G
ross
Cre
dit
Expo
sure
s
ThegeographicdistributionofGrossCreditExposures(fundedandnon-funded)asat31stDecember2012isasfollows:
Tabl
e 5:
Gro
ss C
redi
t Ex
posu
res
by G
eogr
aphy
as
at 3
1st
Dec
embe
r 20
12
(AED
000
)
Geo
grap
hic
Dis
trib
utio
nLo
ans
Secu
riti
esTo
tal F
unde
dCo
mm
itm
ents
OTC
Der
ivat
ives
Oth
er O
ff-
Bal
ance
She
etTo
tal N
on-
Fund
edTo
tal
Uni
ted
Ara
b Em
irat
es 1
10,6
33,1
89
15,
695,
915
126
,329
,104
2
0,35
3,27
6 6
2,73
0,52
9 4
4,08
9,18
6 1
27,1
72,9
91
253
,502
,095
GCC
exc
ludi
ng U
AE
7,9
30,7
56
5,1
94,7
06
13,
125,
462
1,0
53,5
14
12,
463,
294
3,9
04,4
49
17,
421,
257
30,
546,
719
ArabLeague(excludingGCC)
5,3
73,6
48
2,5
94,1
89
7,9
67,8
37
173
,291
1
76,1
81
1,9
01,6
33
2,2
51,1
05
10,
218,
942
Asi
a 8
,213
,888
3
17,0
13
8,5
30,9
01
725
,056
2
,419
,828
9
,717
,140
1
2,86
2,02
4 2
1,39
2,92
5
Afr
ica
5,9
03
-
5,9
03
-
-
401
,500
4
01,5
00
407
,403
Nor
th A
mer
ica
2,2
22,4
62
854,
900
3,07
7,36
2 2
,395
,496
1
12,0
83,8
81
6,6
70,6
45
121
,150
,022
1
24,2
27,3
84
Sout
h A
mer
ica
1,3
43,6
44
241
,398
1
,585
,042
-
-
389
,072
3
89,0
72
1,9
74,1
14
Cari
bbea
n 3
32,2
77
-
332
,277
-
-
-
-
332
,277
Euro
pe 2
8,52
1,47
8 7
,048
,966
3
5,57
0,44
4 1
,104
,397
3
39,5
86,7
76
25,
466,
318
366
,157
,491
4
01,7
27,9
35
Aus
tral
ia-
339
,770
3
39,7
70
-
1,5
69,1
38
1,6
29,2
99
3,1
98,4
37
3,5
38,2
07
Others
22,
133
-
22,
133
-
-
10,
412
10,
412
32,
545
Tota
l 1
64,5
99,3
78
32,
286,
857
196
,886
,235
2
5,80
5,03
0 5
31,0
29,6
27
94,
179,
654
651
,014
,311
8
47,9
00,5
46

111
ClassificationofGrossCreditExposures(fundedandnon-funded)byIndustrySegmentsasat31stDecember2012isasfollows:
Tabl
e 6:
Gro
ss C
redi
t Ex
posu
re b
y In
dust
ry S
egm
ent
as a
t 31
st D
ecem
ber
2012
(AED
000
)
Indu
stry
Seg
men
tLo
ans
Secu
riti
esTo
tal F
unde
dCo
mm
itm
ents
OTC
Der
ivat
ives
Oth
er O
ff-
Bal
ance
She
etTo
tal N
on-
Fund
edTo
tal
Agr
icul
ture
, Fis
hing
& r
elat
ed a
ctiv
ities
86,2
35
-
86,
235
248,
575
-
147,
663
396
,238
4
82,4
73
CrudeOil,Gas,Mining&Quarrying
16,2
90,7
80
3,40
7,71
5 1
9,69
8,49
5 1,
735,
782
457,
654
1,00
5,28
9 3
,198
,725
2
2,89
7,22
0
Man
ufac
turi
ng8,
676,
273
-
8,6
76,2
73
1,06
4,61
9 1,
467,
499
15,7
28,4
86
18,
260,
604
26,
936,
877
Elec
tric
ity &
Wat
er8,
826,
224
1,29
7,94
5 1
0,12
4,16
9 3,
490,
730
4,73
4,55
1 1,
226,
496
9,4
51,7
77
19,
575,
946
Cons
truc
tion
3,51
7,59
3 -
3,5
17,5
93
1,45
1,01
9 1,
752,
072
6,19
6,65
7 9
,399
,748
1
2,91
7,34
1
Real
Est
ate
26,5
30,6
13
661,
069
27,
191,
682
5,25
7,57
8 6,
167,
588
248,
873
11,
674,
039
38,
865,
721
Trad
e3,
328,
986
-
3,3
28,9
86
1,32
2,76
0 5,
538,
229
3,76
7,15
9 1
0,62
8,14
8 1
3,95
7,13
4
Tran
spor
t, St
orag
e &
Com
mun
icat
ion
6,43
8,35
5 41
6,73
6 6
,855
,091
1,
202,
441
2,19
9,02
5 1,
646,
903
5,0
48,3
69
11,
903,
460
Financial Institutions
27,8
49,0
48
15,7
73,1
47
43,
622,
195
463,
439
496,
851,
919
27,6
36,8
59
524
,952
,217
5
68,5
74,4
12
Serv
ices
17,4
30,4
00
519,
428
17,
949,
828
1,30
5,14
7 5,
889,
975
1,53
9,30
4 8
,734
,426
2
6,68
4,25
4
Gov
ernm
ent
21,1
41,3
61
10,2
10,8
17
31,
352,
178
5,79
7,27
1 3,
269,
899
29,8
32,6
93
38,
899,
863
70,
252,
041
Loans toIndividualsforBusiness&
Cons
umpt
ion
Purp
ose
24,4
13,8
07
-
24,
413,
807
937,
013
1,17
0,79
9 11
8,32
8 2
,226
,140
2
6,63
9,94
7
All Others
69,7
03
-
69,
703
1,52
8,65
6 1,
530,
417
5,08
4,94
4 8
,144
,017
8
,213
,720
Tota
l16
4,59
9,37
8 32
,286
,857
19
6,88
6,23
5 25
,805
,030
53
1,02
9,62
7 94
,179
,654
65
1,01
4,31
1 84
7,90
0,54
6

GrossCreditExposure(fundedandnon-funded)breakupbycurrencyasat31stDecember2012isasfollows:
Tabl
e 7:
Gro
ss C
redi
t Ex
posu
res
by T
ype
as a
t 31
st D
ecem
ber
2012
(AED
000
)
Curr
ency
Loan
sSe
curi
ties
Tota
l Fun
ded
Com
mit
men
tsO
TC D
eriv
ativ
es*
Oth
er O
ff-
Bal
ance
She
etTo
tal N
on-F
unde
dTo
tal
For
eign
Cur
renc
y 8
6,43
2,06
6 3
0,79
9,06
6 1
17,2
31,1
32
8,8
91,9
76
531
,021
,617
8
3,02
6,45
8 6
22,9
40,0
51
740
,171
,183
AED
78,
167,
312
1,4
87,7
91
79,
655,
103
16,
913,
054
8,0
10
11,
153,
196
28,
074,
260
107
,729
,363
Tot
al 1
64,5
99,3
78
32,
286,
857
196
,886
,235
2
5,80
5,03
0 5
31,0
29,6
27
94,
179,
654
651
,014
,311
8
47,9
00,5
46
TenorclassificationbyContractualMaturityoftheGrossCreditGrossCreditExposures(fundedandnon-funded)asat31stDecember2012isasfollows:
Tabl
e 8:
Gro
ss C
redi
t Ex
posu
res
by R
esid
ual C
ontr
actu
al M
atur
ity
as a
t 31
st D
ecem
ber
2012
(AED
000
)
Resi
dual
Con
trac
tual
Mat
urit
yLo
ans
Secu
riti
esTo
tal F
unde
dCo
mm
itm
ents
OTC
D
eriv
ativ
esO
ther
Off
-Bal
ance
Sh
eet
Tota
l Non
-Fu
nded
Tota
l
Lessthan3months
30,9
48,6
13
1,36
1,78
1 32
,310
,394
1,
556,
430
142,
526,
182
34,6
44,1
83
178,
726,
795
211,
037,
189
3 m
onth
s to
one
yea
r29
,832
,358
3,
743,
716
33,5
76,0
74
1,64
6,94
6 15
9,63
7,89
8 13
,536
,714
17
4,82
1,55
8 20
8,39
7,63
2
Onetofiveyears
48,9
34,8
01
7,75
2,45
0 56
,687
,251
8,
359,
417
163,
704,
084
27,1
81,8
53
199,
245,
354
255,
932,
605
Overfiveyears
54,8
83,6
06
19,4
28,9
10
74,3
12,5
16
14,2
42,2
37
65,1
61,4
63
18,8
16,9
04
98,2
20,6
04
172,
533,
120
Tota
l16
4,59
9,37
8 32
,286
,857
19
6,88
6,23
5 25
,805
,030
53
1,02
9,62
7 94
,179
,654
65
1,01
4,31
1 84
7,90
0,54
6

113
e) Classification and Provisioning Policy
Past Due but not Impaired Accounts
The Group classifies accounts where principal or interest is past due for more than 30 days and which show some potential weakness in the borrower’s financial position and creditworthinessas‘pastduebutnotimpaired’.Suchpotentialweakness may also be due to inadequate loan agreements,the condition and/or control over collateral, failure to obtain properinformation,documentation,etc.
These accounts aremonitored on amonthly basis. In caseswhere there is a possibility of adverse developments, exit strategy or workout plans are formulated to proactively manage theaccountbeforepossibleadversesituationcanmaterialize.At this stage no special action relating to provisioning and incomerecognitionfortheparticularaccountistaken.
Restructured Accounts
The Group considers an account to be restructured if there is any change in the facility structure which results in a loss to thegroup.Restructuringisaffectedthroughmaterialrevisionor alteration of the terms and conditions of the borrower’s existingcreditfacilitiesonnon-commercialtermswhichmayinclude reduced or deferred repayments, extended terms, reduced interest rates or interest roll-up or forgiveness,relaxation of covenants or terms and conditions, or relaxed collateralorsecurityrequirements.
Restructuring of existing credit facilities is only considered to avoid an impending default, address an existing payment default or rehabilitate delinquent debt as restructuring isconsidered a better alternative than acceleration towards legal redress. Such accounts are monitored regularly postrestructuring to ensure proactive management in case of any recurrence in the borrower’s financial position and creditworthiness.
The Group provides for the difference of the carrying amount of the asset and the present value of estimated future cash flows discounted at the facility’s original effective interest rate (i.e.theeffectiveinterestratecomputedatinitialrecognition).
Individually Impaired accounts
The classification policy currently implemented by the Group classifies delinquent borrowers as Substandard, Doubtful
or Loss in line with the guidelines laid down in CBUAEcircular 28/2010. To ensure strict compliance, the Grouphad implemented an automated solution that classifies delinquentaccountswithexposurebelowasetthreshold.Theclassification into Substandard, Doubtful or Loss is carriedoutdailyfortheseaccountsbasedondelinquency(‘dayspastdue’).Foraccountswithexposuregreaterthanthethresholdvalue,classificationasSubstandard,DoubtfulorLossisbasedon a thorough assessment of the account by means of a detailedcreditriskassessment.
Accounts, automatically classified by the system are provided foronamonthlybasisasabove.Foraccountswithexposuregreater than the threshold amount, provisioning policy is applied manually and centrally monitored to ensure strict compliance to CBUAE regulations. In case of internationalunits, the Group assesses both home and host regulations and appliesthestricterone.
Write-off Policy
The Group currently has a policy to write-off historicalaccounts based on the time elapsed since the account was fully provided for as per the provisioning and classification policy of the Group taking into account the possibility of recovery throughlegalmeasures.ExposuresarewrittenoffusingoneormoreofthecriteriadefinedintheGroupCreditPolicyManual.However,write-offmaybedeferredinspecificcasesbasedonthediscretionoftheHeadofRemedialAdvances.Write-offofinterest and/or principal requires approval from authorities,as defined in the credit policy of the Group, depending on the amountincludinganyexposurepreviouslyprovidedfor.
Collective Provisioning
The Group maintains collective provisions in line with CBUAE guidelines which mandate all Banks to achieve a minimum collectiveprovisionlevelof1.5%ofnetCreditRiskWeightedAssets(CRWA)by2014.NetCRWAisdefinedastheCRWAforallperformingcredits (includingpastduebutnot impaired)as calculatedusing theBasel II Standardized approach. TheGroupholdscollectiveprovisionsofAED2.428billionasat31stDecember2012,whichis1.54%ofnetCRWA.

Nor
mal
Watch-list
Sub-standardloans
Dou
btfu
l loa
ns
Lossloans
Clas
sifi
cati
onCr
iter
iaPr
ovis
ions
Corp
orat
e lo
ans
norm
al b
anki
ng r
isk
for
repa
ymen
t as
agr
eed
som
e w
eakn
ess
in fi
nanc
ial c
ondi
tion
Som
e lo
ss d
ue t
o ad
vers
e fa
ctor
s to
hin
der
repa
ymen
t or
wea
knes
s of
sec
urity
full
reco
very
dou
btfu
l, fi
nanc
ial p
ositi
on
not
soun
d
exha
uste
d al
l cou
rses
of
actio
n, m
ay r
ecov
er
noth
ing
Colle
ctiv
e pr
ovis
ioni
ng
Colle
ctiv
e pr
ovis
ioni
ng
Specificprovision-25%oftheexposureamountnetof
disc
ount
ed v
alue
of
colla
tera
l hel
d
Specificprovision-50%oftheexposureamountnetof
disc
ount
ed v
alue
of
colla
tera
l hel
d
Specificprovision-100%oftheexposureamountnetof
disc
ount
ed v
alue
of
colla
tera
l hel
d
arre
ars
grea
ter
than
90
days
arre
ars
grea
ter
than
120
day
s
arre
ars
grea
ter
than
180
day
s
Reta
il lo
ans
Subsequently,theGroupprovidesfortheclassifiedaccountsbasedonCBUAEguidelines,asbelow:
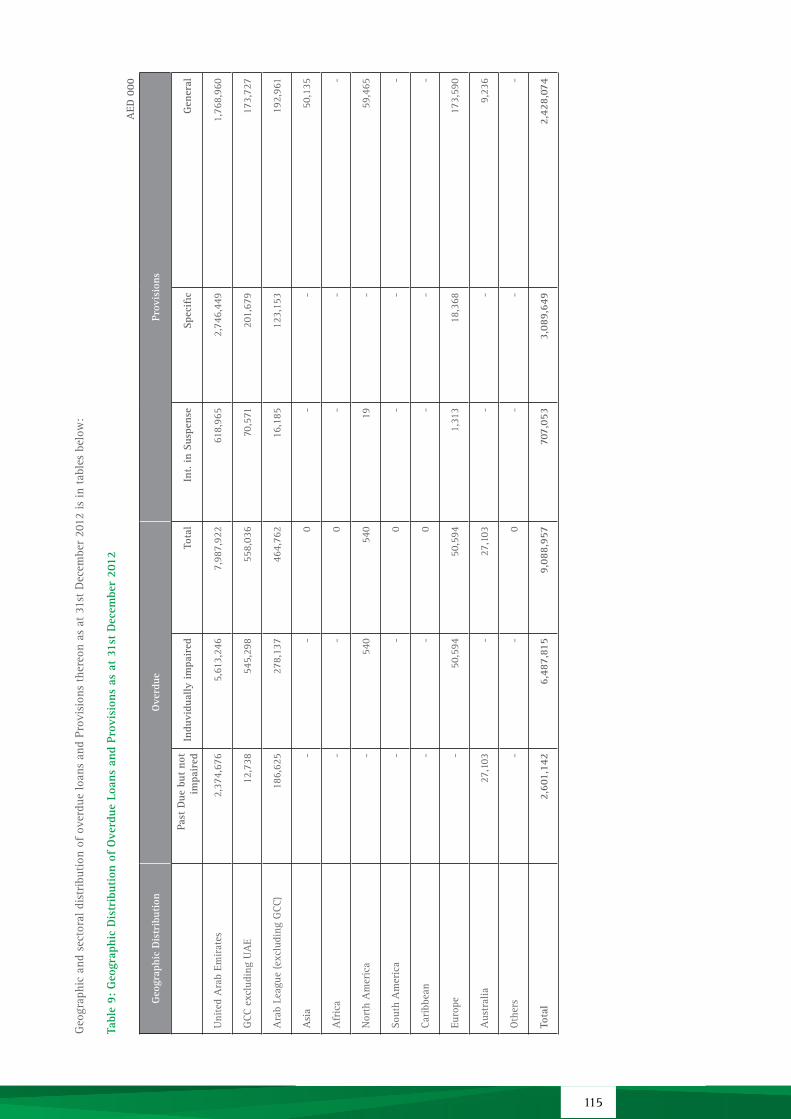
115
Geo
grap
hic
and
sect
oral
dis
trib
utio
n of
ove
rdue
loan
s an
d Pr
ovis
ions
the
reon
as
at 3
1st
Dec
embe
r 20
12 is
in t
able
s be
low
:
Tabl
e 9:
Geo
grap
hic
Dis
trib
utio
n of
Ove
rdue
Loa
ns a
nd P
rovi
sion
s as
at
31st
Dec
embe
r 20
12
AED
000
Geo
grap
hic
Dis
trib
utio
nO
verd
uePr
ovis
ions
Past
Due
but
not
im
pair
edIn
duvi
dual
ly im
pair
edTo
tal
Int.
in S
uspe
nse
Spec
ific
Gen
eral
Uni
ted
Ara
b Em
irat
es 2
,374
,676
5,6
13,2
46
7,98
7,92
2 6
18,9
65
2,7
46,4
49
1,7
68,9
60
GCC
exc
ludi
ng U
AE
12,
738
545
,298
55
8,03
6 7
0,57
1 2
01,6
79
173
,727
ArabLeague(excludingGCC)
186
,625
2
78,1
37
464,
762
16,
185
123
,153
1
92,9
61
Asi
a-
-
0-
-
50,
135
Afr
ica
-
-
0-
-
-
Nor
th A
mer
ica
-
540
54
0 1
9 -
59,
465
Sout
h A
mer
ica
-
-
0-
-
-
Cari
bbea
n-
-
0-
-
-
Euro
pe-
50,
594
50,5
94 1
,313
1
8,36
8 1
73,5
90
Aus
tral
ia 2
7,10
3 -
27,1
03-
-
9,2
36
Others
-
-
0-
-
-
Tota
l
2,60
1,14
2 6
,487
,815
9,
088,
957
707
,053
3
,089
,649
2
,428
,074

Tabl
e 10
: Se
ctor
al D
istr
ibut
ion
of O
verd
ue L
oans
and
Pro
visi
ons
as a
t 31
st D
ecem
ber
2012
(AED000)
Indu
stry
Seg
men
tO
verd
uePr
ovis
ions
Past
Due
but
not
im
pair
edIn
divi
dual
ly im
pair
edTo
tal
Int.
in S
uspe
nse
Spec
ific
Gen
eral
Agr
icul
ture
, Fis
hing
& r
elat
ed
activ
ities
2
3,03
73,
039
130
1,53
084
5
CrudeOil,Gas,Mining&Quarrying
31,
806
11,0
1942
,825
244
11,2
6434
,172
Man
ufac
turi
ng 4
11,7
16
285,
667
697,
383
12,4
5410
6,41
415
6,23
5
Elec
tric
ity &
Wat
er 5
0,24
0 7
50,2
471
-
62,6
67
Cons
truc
tion
15,
789
214,
065
229,
854
9,88
364
,60 7
122,
091
Real
Est
ate
936
,265
2,
172,
088
3,10
8,35
322
7,25
31,
058,
788
684,
689
Trad
e 5
3,71
8 10
9,49
016
3,20
87,
376
72,0
9594
,542
Tran
spor
t, St
orag
e &
Co
mm
unic
atio
n 1
0,88
1 76
,133
87,0
1413
,817
62,3
3639
,249
FinancialInstitutions
257
,695
23
6,54
649
4,24
13,
462
100,
957
357,
909
Serv
ices
353
,563
40
6,89
876
0,46
128
,750
190,
898
286,
189
Gov
ernm
ent
-
18,2
0718
,207
429,
080
3,49
1
LoanstoIndividualsforBusiness&
Cons
umpt
ion
Purp
ose
479
,396
2,
936,
388
3,41
5,78
440
1,22
71,
409,
450
579,
300
AllOthers
71
18,2
7018
,341
2,41
42,
230
6,69
5
Tota
l 2
,601
,142
6
,487
,815
9,
088,
957
707
,053
3
,089
,649
2
,428
,074

117
MovementintheprovisionforimpairedloansfortheperiodJanuary-December2012isshownbelow:
Table 11: Reconciliation of Changes in Provision for Impaired Loans for the Period Jan-Dec 2012
(AED 000)
Description Amount
Opening Balance of Provisions for Impaired Loans 4,800,705
Add: Charge for the year
•Specificprovisions 1,709,070
•Generalprovisions 291,874
Add: Write off of impaired loans to income statement -
Less: Recovery of loan loss provisions (218,723)
Less: Write back of provisions for loans (579,717)
Less: Amount written off (485,486)
Closing Balance of Provisions for Impaired Loans 5,517,723
Adoption of F-IRB Approach
The Group has voluntarily decided to prepare for migration to theF-IRBapproachforcreditrisk.Aspartofthepreparations,the Group has completed independent third party validation ofitsratingsystemsandpresentedtheresultstoCBUAE.Therating models used by the Group for its corporate portfolio (includingcommercialPSEborrowers)havebeenvalidatedandtheir performancehas been found satisfactory.Additionally,the usage of rating models by the Group in the credit approval process and subsequentmonitoring and reporting has beenvalidated against “Use Test” regulatory requirements andfoundcompliant.
AspartofthepreparationsformigrationtoF-IRB,theGrouphasestablishedaroadmap(forthenextfiveyears)toachievebest-in-class practices by improving its rating models andassociatedsystems.Keystepsintheroadmapare:
• Improvementinratingmodels:Inadditiontotheexistingmodels, portfolio segments were identified for which specific models have been built. Further, validationexercises would be conducted for rating models on an annual basis and incremental changes would be performed tooptimizemodelperformancewhenevernecessary.
• Increase in IRB coverage: The fraction of the portfoliocovered by IRB models is being increased (which isalready in excess of theminimum required by CBUAE)by ensuring all borrowers covered by existing models are rated and models developed for specific uncovered portfoliosegments.TheGrouphasrolledoutnewratingmodels for specific portfolio segments in 2012 and additional models are in development for deployment in 2013.
• Capitalcomputation:Thecapitalcalculationprocesswillbe automated in addition to other initiatives to streamline the data integrity, storage, controls and reporting capabilitiesoftheGroup’sITinfrastructure.
TheGroupcontinuestomakeparallelBasel-IIsubmissionstoCBUAEundertheF-IRBframeworkonquarterlybasisbased
ontheinternalratings.ThedistributionofperformingloansandadvancesasatDecember2012isasbelow.
Table 12: Rating Distribution of Performing Loan Portfolio as at 31st December 2012
Rating grade % of total performing loans and advances
1 – 4 52.9%
5 – 6 24.9%
7 13.6%
8 1.1%
Retail programme lending 7.4%
The Group has linked the monitoring frequency to its riskrating.Obligorswithlowerriskprofilearemonitoredatlowerfrequency unless otherwise required.More frequent reviewsfor lower rated borrowers ensure focused monitoring and earlyidentificationofpotentialimpairments.Themonitoringfrequencyisasbelow:
Risk Rating Frequency
RiskRatingbetween1+to4 12 months or lower
RiskRatingbetween4-to6 6 months or lower
RiskRatingbetween6-to8 3 months or lower
Classified Accounts To be monitored by Remedial Advances
Use of ratings by External Credit Assessment Institutions (ECAIs):
For banks and sovereign exposures, the risk ratings given by leading External Credit Assessment Institutions – Moody’s,StandardandPoor’sandFitchareconsidered.ForPSEsandcorporate exposures, issuer ratings are used, if available.Wherever multiple ratings are available, mapping provided in the guidelines by the supervisor is used for arriving at the requiredriskweightingunderStandardizedApproach.

Asset class
On balance sheet
Off balance sheet Credit risk mitigation (CRM)
Risk weighted assetsGross
outstanding
Net exposure after credit conversion
factors (CCF)
Exposure before CRM CRM After CRM
Claims on sovereigns 85,275,944 10,695,802 95,971,747 - 95,971,747 3,453,972
Claimsonnon-centralgovernmentpublicsectorentities(PSEs)
50,148,834 5,046,829 55,195,663 2,184,749 53,010,914 20,156,786
Claimsonmulti-lateraldevelopmentbanks
555 - 555 - 555 -
Claims on banks 60,400,941 22,739,451 83,140,392 13,134,134 70,006,258 31,434,555
Claims on securities firms 5,150,774 667,408 5,818,182 3,366,075 2,452,107 1,714,349
Claims on corporates 56,267,989 27,248,167 83,444,262 11,139,098 72,305,164 70,074,421
Claims included in the regulatory retail portfolio
12,414,905 - 12,400,973 325,599 12,075,374 9,401,400
Claims secured by residential property 2,373,796 - 2,373,796 67,619 2,306,177 2,087,895
Claims secured by commercial real estate
13,004,532 - 13,004,532 286,909 12,717,623 12,717,623
Past due loans 6,487,815 - 2,691,114 772,773 1,918,341 2,242,350
Higher-riskcategories - - - - - -
Otherassets 10,043,151 - 10,042,966 - 10,042,966 5,505,336
Claimsonsecuritizedassets 4,157,980 - 4,157,981 - 4,157,981 827,654
CreditDerivatives(Bankssellingprotection)
- - - - - -
Total Claims 305,727,216 66,397,657 368,242,163 31,276,956 336,965,207 159,616,341
Basel II Reporting of Credit Risk Exposures
Credit risk exposures reported under Basel II differ in anumber of respects from those reported in the consolidated financialstatements.
• As per CBUAE Basel II framework, off balance sheetexposures are converted, by applying a credit conversion factor(CCF),intodirectcreditexposureequivalents.
• UndertheBaselIIcapitaladequacyframework,eligiblecollateralisappliedtoreduceexposure.
Credit Risk Mitigation (CRM) & Collateral Valuation
While extending credit facilities, the Group primarily relies on theborrower’sabilitytopay.Securityisthemeansbywhich,in the last resort, the Group should be able to obtain the repaymentofoutstandingamountowingtoitbyacustomer.It may take many forms, but any item of security shouldpossess the following attributes:
• Itshouldbeofadeterminablevalue;
• Itshouldhaveastablevalue;
• It should be of a value in excess of the amount it isintended to be securing so as to provide a margin of safety;
• It should be readily realizable, i.e. an asset such as aproperty, should be capable of being readily sold; and
• It should be enforceable, preferably without needingrecourse to the Courts or the involvement of other legal processes.
Security with such attributes could be described as being of good quality. Acceptable forms of collateral are definedwithin the Group risk framework and conservative valuation parameters applied and frequently reviewed to reflect anychanges inmarket conditions.Security structuresand legalcovenantsarealsosubjecttoregularreview.
Broad types of collateral taken by the bank are cash, land andbuildings(realestate),mortgagedebentures,stocksandshares,merchandise,goodsetcetera.
Gross Credit Risk Exposures subject to Credit Risk Mitigation (CRM)
Under the Standardised Approach of Basel II, banks maychoose between two options when calculating credit risk mitigation capital relief. These are the Simple Approachwhich substitutes the risk weight of the collateral from that of the exposure and the Comprehensive Approach where theexposureisadjustedbytheactualvalueascribedtothecollateral,thelatterbeingmorerobustasamethodology.
The Group uses the comprehensive method, where eligible collateral is in form of financial securities (e.g. cash, highqualitydebtsecurities,equities inmain index). Inaddition,on-balance sheet netting, guarantees by specific protectionproviders and credit derivatives are also allowed as Credit Risk Mitigants (CRM). TheGroup follows theBasel II guidelinesspecifying minimum operating and documentation criteria thatneedtobesatisfiedforeligibilityasBaselIIcollateral.
Following table below provides on and off-Balance Sheetexposures for the Group along with the effect of Credit Risk MitigationineachBaselIIassetclass.
Table 13: Loan Portfolio as per Standardized Approach as at 31st December 2012(AED 000)
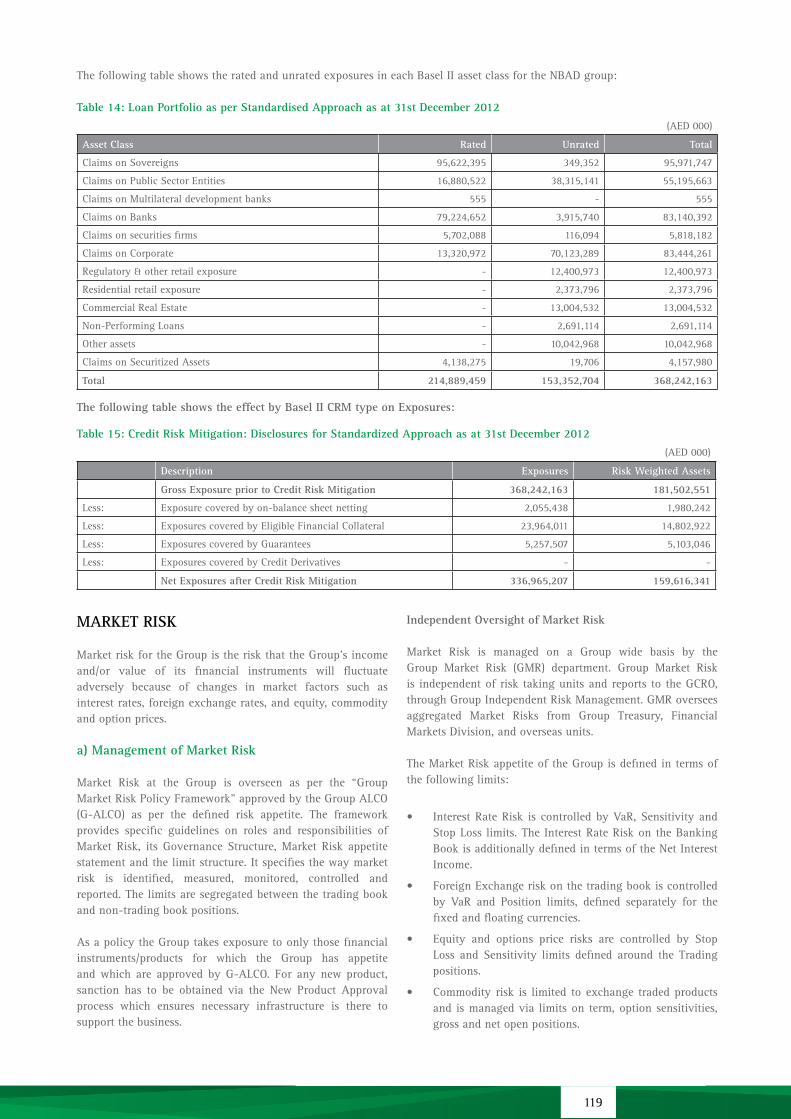
119
ThefollowingtableshowstheratedandunratedexposuresineachBaselIIassetclassfortheNBADgroup:
Table 14: Loan Portfolio as per Standardised Approach as at 31st December 2012(AED000)
Asset Class Rated Unrated Total
Claims on Sovereigns 95,622,395 349,352 95,971,747
Claims on Public Sector Entities 16,880,522 38,315,141 55,195,663
Claims on Multilateral development banks 555 - 555
Claims on Banks 79,224,652 3,915,740 83,140,392
Claims on securities firms 5,702,088 116,094 5,818,182
Claims on Corporate 13,320,972 70,123,289 83,444,261
Regulatory & other retail exposure - 12,400,973 12,400,973
Residential retail exposure - 2,373,796 2,373,796
Commercial Real Estate - 13,004,532 13,004,532
Non-PerformingLoans - 2,691,114 2,691,114
Otherassets - 10,042,968 10,042,968
ClaimsonSecuritizedAssets 4,138,275 19,706 4,157,980
Total 214,889,459 153,352,704 368,242,163
The following table shows the effect by Basel II CRM type on Exposures:
Table 15: Credit Risk Mitigation: Disclosures for Standardized Approach as at 31st December 2012(AED000)
Description Exposures Risk Weighted Assets
Gross Exposure prior to Credit Risk Mitigation 368,242,163 181,502,551
Less: Exposurecoveredbyon-balancesheetnetting 2,055,438 1,980,242
Less: Exposures covered by Eligible Financial Collateral 23,964,011 14,802,922
Less: Exposures covered by Guarantees 5,257,507 5,103,046
Less: Exposures covered by Credit Derivatives - -
Net Exposures after Credit Risk Mitigation 336,965,207 159,616,341
MARKET RISK
Market risk for the Group is the risk that the Group’s income and/or value of its financial instruments will fluctuate adversely because of changes in market factors such as interestrates,foreignexchangerates,andequity,commodityandoptionprices.
a) Management of Market Risk
Market Risk at the Group is overseen as per the “Group MarketRiskPolicyFramework”approvedbytheGroupALCO(G-ALCO) as per the defined risk appetite. The frameworkprovides specific guidelines on roles and responsibilities of Market Risk, its Governance Structure, Market Risk appetite statementandthelimitstructure.Itspecifiesthewaymarketrisk is identified, measured, monitored, controlled and reported.Thelimitsaresegregatedbetweenthetradingbookandnon-tradingbookpositions.
As a policy the Group takes exposure to only those financial instruments/products for which the Group has appetite andwhich are approved byG-ALCO. For anynewproduct,sanction has to be obtained via the New Product Approval process which ensures necessary infrastructure is there to supportthebusiness.
Independent Oversight of Market Risk
Market Risk is managed on a Group wide basis by the Group Market Risk (GMR) department. Group Market RiskisindependentofrisktakingunitsandreportstotheGCRO,throughGroupIndependentRiskManagement.GMRoverseesaggregated Market Risks from Group Treasury, Financial MarketsDivision,andoverseasunits.
The Market Risk appetite of the Group is defined in terms of the following limits:
• InterestRateRisk iscontrolledbyVaR,SensitivityandStopLosslimits.TheInterestRateRiskontheBankingBookisadditionallydefinedintermsoftheNetInterestIncome.
• ForeignExchangeriskonthetradingbookiscontrolledby VaR and Position limits, defined separately for the fixedandfloatingcurrencies.
• Equity and options price risks are controlled by StopLoss and Sensitivity limits defined around the Tradingpositions.
• Commodityrisk is limited toexchangetradedproductsand is managed via limits on term, option sensitivities, grossandnetopenpositions.

The above risk limits are approved by the RMC and are closely monitoredbyGroupMarketRisk.Theriskpositionsagainstthelimits and all limit breaches are regularly reported to Senior ManagementandtheG-ALCO.
Proprietary Investments Risk
GRMD has a dedicated Proprietary Investment Risk(PIR) oversight team, within the Group Independent RiskManagement. PIR assesses Market and Credit risk of theInvestmentandTradingportfolioandalsoprovidestechnicalrisk oversight of the bank’s securities holdings, alternative investments, structured products and OTC derivativesportfolios.
Oneof theprimary functionsofPIR is to support FinancialControl Department in performing regular validations / verifications of valuation of assets / securities held by the Group.Theunithasanevaluationgroupwiththecapabilitytoperformverification/valuationofcomplexOTCderivativesand Structured Notes.
Market Risk Reporting
The Middle Office (MO) function of the Group has twofunctions:
• Product control function is responsible for the bookkeepingoftradesintheFinancialMarketDivision(FMD)andGroupTreasury(GT)portfolios.Thespecificfunctionsof the product control function include daily valuations, performanceattribution(P&Landfees),IFRScalculationsandadjustments, reconciliationbetweentradingsystemandgeneralledger,hedgingstrategiesandeffectiveness.Theseactivitiesareperformedattheendofthedaybasis.
• Risk control function is responsible for trade/positionmonitoring, risk limit monitoring, escalation of limit breaches, risk reporting, collateral valuation, margin call validationandmarketdatamaintenance&validation.
MiddleOffice/RiskControlsupportstheMarketRiskfunctionby monitoring market data, trades, limits and escalating breaches.Middle Office utilizes Comprehensive Trading andMarket Risk (CTMR) to generateMarket Risk reports on theFinancial Markets Division and Group Treasury portfolios on adailybasis.Thefollowingaremeasuredagainstlimitsdailyand reported to senior management of both business and risk:
• ValueatRisk(VaR)
• NetPresentValueBasisPoint(PVBP)
• FXNetOpenPosition(NoP)
• StopLoss
OtherMarketriskreportsattheGrouplevelareroutinelytabledtoG-ALCOwhichincludesinvestmentportfolioperformancereports.
Value at Risk (VaR)
Group Market Risk is responsible for VaR which is calculated on the following basis:
• HistoricalSimulation• FullRevaluation• HoldingPeriod,-1day• ConfidenceInterval-99%• FrequencyofCalculation-Daily
The Group has successfully implemented historical simulation VaRontheComprehensiveTradingandMarketRisk (CTMR)platformforthemajorityofitsbusinessesandwillrollitouttotheremainderin2013.ThisprojectallowsfullrevaluationofVaRonaT+1basis,withhistoricalmarketdatasetsupdateddaily.ThenewVaRmodelprovidesanimprovedviewonthecorrelations of all market risk factors in the portfolios, in line withcurrentproductsglobally.
International Branches
Larger overseas entities/subsidiaries of the Group haveindependent risk management functions, and each overseas branch/subsidiary has its own structure responsible for controlling and mitigating market risks. The respective riskmanagement / reporting unit sends the related market risk reporttoGroupMarketRisk.GroupMarketRiskreviewsthesereports along with the local ALCOminutes before they aresubmittedtoGroupALCOforanyspecificissues/deliberations.Group Market Risk also monitors lending by Group Treasury to overseasentities/subsidiariesandvice-versaonadailybasis.
The Group measures the risk weighted assets for Market Risk as per theStandardizedapproach.Accordingly thecomponentsoftheMarketRiskweightedassetsareasgivenbelow.
Table 16: Capital Requirement for Market Risk under Standardised Approach as at 31st December 2012
(AED000)
Market Risk Amount
Interestraterisk 704,875
Equitypositionrisk 82,477
Foreign exchange risk 48,868
Commodity risk 8,732
OptionRisk 62,670
Total Capital Requirement 907,622
b) Management of Interest Rate Risk
The Risk Management Committee of the Board monitors on a periodic basis the interest rate risk taken by the Group.However, the management of interest rate risk is delegated to theG-ALCO. TheG-ALCO is responsible for defining theinterest rate risk limits and implementing strategies to contain interestrateriskwithinacceptablelevels.

121
By the nature of its business, the Group is exposed to interest raterisk.Interestrateriskarisesfrominterestbearingfinancialinstruments and reflects the possibility that changes in interest rates will adversely affect the value of the financial instruments andtherelatedincome.TheGroupisexposedtothisriskbothinitsTradingbookandBankingbook.TheTreasuryMiddleOfficegenerates the interest rate sensitivity report daily for its Treasury TradingandBankingbookpositions.Thenon-TreasuryrelatedBanking book positions are monitored through Interest RateSensitivity reportwhich captures the contractual re-pricing ofvariousassetsandliabilities.Thereportincorporatesalltheratesensitive andnon-sensitive assets and liabilities of theGroup.The Group Market risk team conducts assessment of the interest rate risk exposure to evaluate the impact of yield curve shifts on itsNII.
The Group manages this risk principally through monitoring interest rate gaps on a consolidated basis across various maturities andbymanagingthere-pricingprofileofratesensitiveassetsandliabilitiesbasedonexpected interest rateview.Overall interestrate risk positions are managed by creating floating rate assets against floating rate liabilities and fixed rate assets against fixed rateliabilities.TheGroupusesderivativeinstrumentstomanageinterest rate risk arising from the Group’s financial instruments whichareratesensitiveinnature.
The Group measures the impact of interest rate risk on trading bookintermsPVBPandVaR.OntheBankingbooktheshort-termimpactofinterestrateriskismeasuredintermsofNetInterestIncome (NII) impact or Earnings at Risk (EaR). A substantialportionoftheGroup’sassetsandliabilitiesarere-pricedwithinoneyear.Accordinglythereisalimitedexposuretointerestraterisk. The GroupMarket risk team conducts assessment of theinterest rate risk exposure by measuring the impact of reasonable possiblechangeininterestratemovements.Section4(d)oftheFinancial Statement computes the impact on Equity and NetProfit owing to a “reasonable” change in interest rates as per IFRS.
Table 17: Interest Rate Risk in the Banking Book as at 31st December 2012
(AED 000)
Shift in Yield Curves Net Interest Income Regulatory Capital
±200 basis point ±136,039 ±136,039
c) Management of Liquidity Risk and Funding Profile AdedicatedGroupTreasury functionwasestablished in2012.Group Treasury responsibilities include management of the group’s liquidity and capital, debt issuance platform, internalfundstransferpricingmechanismaswellasAssetandLiabilityManagement(ALM)/InterestRateRiskinBankingBook(IRRBB).
TheGroupdefinesitsliquidityriskasthepotentialimpactfromhaving insufficient financial resources (liquidity) to meet itsobligationsasandwhentheyfalldue,orhavingtoraiseliquidityto meet those obligations at an excessive cost. The Group’sliquidityriskprincipallyarisesfrommismatchesinthematurity
profile of assets and liabilities as well as certain concentration risksontheliabilitysideofthebalancesheet.
TheprimaryobjectiveofliquiditymanagementattheGrouplevelistoensurethattheGroupalwayshasadequateliquiditytomeetall obligations as and when they fall due and to comply with UAEregulatoryrequirementsonliquidityrisk.ItisalsoaprimaryobjectivetoensurethattheGroupsliquiditymanagementisinaccordancewithbest Internationalpracticeandhasa forwardlookingapproachintermsofupcomingregulatoryreforms,e.g.BaselIIIonLCRandNSFR.
The Group’s Board of Directors has delegated the responsibility foroversightandmanagementof theGroup’s liquidity risk toRMC(Boardlevelcommittee).Theauthoritytosetspecificlimits,guidelines and controlling liquidity is delegated by RMC toG-ALCO(Managementlevelcommittee).G-ALCOhasdelegatedtheday-to-dayliquiditymanagementresponsibilitytotheGroupTreasurerwhoisauthorizedtooperatewithintheparametersandlimitsasdefinedbyG-ALCO.Inestablishingtheseparametersandmonitoring liquidity,G-ALCOisprovidedwithvariousreports,scenarios and recommendations from the Group Treasurer which incorporates a reflection of the international and domestic market conditionsplusthemacro-economicandpoliticalenvironmentinwhich theGroup operates. Based upon this input, G-ALCOdetermines the internal liquidity parameters and strategicliquidityobjectivesfortheGroup.
ThemanagementofliquidityattheGrouplevelisinaccordancewith CBUAE requirements and the G-ALCO approved GroupLiquidityManagementPolicy(GLMP).TheobjectiveoftheGLMPis to provide guidance in measuring, monitoring, managing and reportingliquidityrisk.
On a day-to-day basis, the Group manages liquidity in adecentralized manner by assigning to the domestic andinternationalTreasuryunitscertainliquiditylimitssothattheyhave the responsibility for their own liquidity management,including full compliance with any local regulatory guidelines where theyaredomiciled.Day today liquidityneeds/excessesfrom the branches and subsidiaries are met through loans/deposits withHeadOfficewithanystructural longertermrequirementsalsobeingprovidedasandwhenneeded.
Group Treasury also compiles a Funding Gap analysis on an ongoing basis which looks to identify potential Funding Gap issuesataveryearlystagethusallowingtheGrouptobepre-emptiveinclosingthesepotentialissues.Aspartofthisanalysisan extreme stress event is considered whereby the Group would nothaveaccesstowholesalefundingforaperiodof12months.
Group Treasury also looks to diversify the funding base with an appropriateliabilitymaturityprofile.GroupTreasuryhasawell-documented Global Debt platform which gives the Group access tomanydifferentdebtmarketsasandwhenrequired.TheGroupalso maintains a strong level of high quality unencumberedliquidassetstomeetbothinternalandfutureexternalregulatoryrequirementssuchasBaselIIILCR.

Theliquiditymanagementprocessincludesbutisnotrestrictedto the following:
• Preparing thematurity gap reports on residualmaturitybasis for the local currency equivalent exposure. Thisprovides a view on the funding structure as it evolves with the balance-sheet growth. The Group has liquiditygap limits in place through which it monitors its actual liquidityposition.
• Maintaininga targeted liquidity levelbymonitoring theLiquidityratioswhichhavebeendefinedinternallybothfromtheregulatoryandprudentialperspective.
• While constantly striving for the diversification of thefunding sources, monitor the concentration risk for the counterparties/depositors.
• Inordertohavetheabilitytoprovidefundsatalltimesandto honour cash outflow obligations the Banks conducts the stresstestsandscenarioanalysis.
• Maintainingacontingencyfundingplantoenablenormalfunctioninginastressedliquiditysituation.
TomanagetheGroupsliquidityinacontingentcrisissituationthe Group has in place an G-ALCO approved ContingencyFundingPlan(CFP).TheCFPoperatesunderthesupervisionoftheLiquidityContingencyManagementCommittee(LCMC)whichmonitors decisions support indicators emanating from the CFP to takenecessarycorrectiveactions.
The Group measures its liquidity in terms of regulatory andprudentialrequirements.Thisisbothforthedomesticandoverseasoperationsofthegroup.Aspertheregulatoryrequirement,theG-ALCOmonitors:
• LoanstoStableResourcesRatio• LiquidAssetsRatio
• LiquidityCoverageRatio• NetStableFundingRatio
Prudentialrequirementincludesmonitoring:• StructuralLiquidityGap• Depositorconcentration
TheGroupmonitorstheliquidityrisklimitsofitsoverseasunitsaswell.Thestructuralliquiditygaplimitsarecloselymonitoredfor timebucketsup to1month. Incaseofabreachof limits,GroupTreasurywillrecommendtoG-ALCOacorrectivemeasureofaction.
TheGroup’soverseasunitsreporttheirliquiditypositiontotheregionalALCOwhich reports toGroupALCO.The reports andratios asmentioned above aremonitoredby theG-ALCO. Thematurity analysis statement of the Group as at December 31, 2012 isshowninnote4(c)oftheconsolidatedFinancialStatements.
d) Management of Foreign Currency Risk
The Group is a market maker in Foreign Currency markets and the FinancialMarketsDivisionisgrantedNetOpenForeignExchangelimitstofacilitatethisbusiness.TheBanktakesonexposuretothe effects of fluctuations in the prevailing foreign currency exchangeratesonitsfinancialpositionandcashflows.TheRiskManagementCommitteesetsNetOpenPositionlimitsonthelevelof exposure by currency and in aggregate for both overnight and intra-daypositions,VaRandStopLosswhicharemonitoredondailybasis.
e) Management of Equity Price Risk
Equitypriceriskarisesfromthechangesinfairvaluesofequityinvestments.TheGroupmanagesthisriskthroughdiversificationof investments in terms of geographical distribution and industry concentration.
Equity Position in the Banking Book as at 31st December 2012
Table 18: Quantitative Details of Equity Position as at 31st December 2012
(AED 000)
TypeCurrentYear PreviousYear
Publicly Traded Privately Held Publicly Traded Privately Held
Equities 105,702 14,908 72,892 24,279
Collective investment schemes 5,030 748 10,109 292
Any other investment - - - -
Total 110,732 15,657 83,001 24,571
Table 19: Realised, Unrealised and Latent Revaluation Gains (Losses) during the year 2011 - 12
(AED 000)
Type Amount
Gains(Losses) -
Realizedgains(losses)fromsalesandliquidations 139
*Unrealizedgains(losses)recognizedinthebalancesheetbutnotthroughprofitandlossaccount 32,214
**Latentrevaluationgains(losses)forinvestmentrecordedatcostbutnotrecognizedinbalancesheetor profit and loss account
-
Total 32,353

123
OPERATIONAL RISK
a) Operational Risk
OperationalrisksarisefromalloftheGroup’soperationsandarefacedbyallbusinessentities.Thisistheriskofdirectorindirect loss arising from a wide variety of causes associated with the Group’s processes, people, and systems and from externalfactorsotherthancredit,marketandliquidityrisks.Thisincludeslegalandregulatoryrequirementsandgenerallyaccepted standards of corporate behavior but excludes strategicandreputationalaspects.However,reputationalriskisaddressedviavariousORMToolsand theGrouphasalsocreated a separate reputational risk committee to address reputationalriskaspects.
The Group’s objective is to manage operational risk so asto balance the avoidance of financial losses resulting from operational risk events and any damage to the Group’s reputation.TheGrouphasstrivedtowardsaviableriskrewardenvironment that will ensure the businesses to operate in an environmenttobecreativeandbeenabled.
The Board has oversight responsibilities for operational risk managementintheGroup.Theseresponsibilitiesareexercisedthrough a board approved and mandated Operational RiskManagementCommittee(ORMC)thatcomprisesoftheseniorexecutive management of the Group representing all lines of business and activities with established framework of policies and procedures to identify, assess, monitor, control, manage and report risks. The ORMC employs clear internal policiesand procedures to reduce the likelihood of any operational riskrelatedlossesandtominimizetheresultantimpacts.Thisincludesauniqueandeffectiveprocessofassessingassociatedrisks and approving residual risks of new and / or significant change initiatives within the Group and an Internal LossData Collection Process. The Internal Loss Data Collectedis reconciled with the General Ledger. The framework alsoprovidestheinterrelationwithotherriskcategories.
In addition toBusinessContinuityPlanning, theGrouphasadopted appropriate risk mitigating strategies that include but arenot limited to Insurance, InformationSecurity,AntiMoney Laundering and Counter Terrorist Financing etc.These functions are directly overlooked and supervised by a Group Compliance Division that has direct representatives in all key locations including overseas. TheGroup effectivelyaddressestheregulatoryrequirementsbyregularlymonitoringand ensuring compliance through the compliance function.In addition, as part of the mitigation strategy, the Group’s
InsuranceCommitteeisresponsibleforarrangingappropriateinsurance coverage across the Group and employs a majorinternational insurance broker to assist them in meeting their responsibilities. The Group’s information security policiesandrequirementsareintendedtoconformtointernationallyaccepted IT Governance standards. More specifically, ITsecurity is governed by explicit security related policies based on international standards such as ISO27001 and PaymentCardIndustry–DataSecurityStandard(PCI-DSS).
The Group has in place an effective ORM Framework witha defined operational risk management cycle that comprises four major stages – risk identification, risk assessment &measurement, risk control and riskmonitoring& reporting.The operational risk cycle is achieved through the use of one ormore tools. The Group ORM Framework seeks to embedoperational risk management elements into its day-to-dayactivities&processes, through a strategic adoptionofORMtoolsacrossallbusinessunits,branchesandsubsidiaries.
Management at all levels is accountable for managing and mitigatingtheoperationalrisksintheirareasofresponsibility.Day-to-daymanagementofoperationalriskisconductedbythe management of the respective business unit in compliance with theoperational risk frameworkestablished in theORMPolicy., In accordance with the Policy, business units arerequired to conduct risk assessments, report operationallosses on a periodic basis, adopt a monitoring framework and effect suitable mitigating measures for operational risk intheirunits.ORMcoordinatorshavebeendesignatedforallbusiness units, overseas branches and subsidiaries, who act as theprimarysourceforfacilitatingORMwithintheir respective areas of responsibility. The individual entities in the Groupare responsible for ensuring compliance with the different regulations of the various local and overseas regulators under which the Group operates and are assisted in the fulfillment of their responsibilities by the Group Compliance Division in theUAE.
Compliancewith ORM policies and procedures is supportedbyperiodic reviewsundertakenbyGroupAudit.The resultsof these reviews are discussed with the management of the business unit to which they relate, with summaries submitted totheAuditCommitteeandseniormanagementoftheGroup.
b) Business Continuity Management (BCM)
BCM is responsible for assuring operational resilience to the Group’skeybusinessprocessesunderadversecircumstances.ThekeyobjectivesoftheBCMprogramareto:
Table 21: Capital Requirements by Equity Groupings as at 31st December 2012
(AED000)
Grouping Amount
Strategic investments 13,830
Available for sale 1,337
Held for trading -
Total capital requirement 15,167
Table 20: Tier I and Tier II Capital Included in * and ** above are as follows
(AED000)
Tier Capital Amount
AmountincludedinTierIcapital 139
AmountincludedinTierIIcapital 14,496
Total 14,635

• Identify the key processes essential to ensure thedelivery of the Group’s services;
• Identify the interdependencies that each key processrelies upon; and;
• Identify and define time frames for the recovery ofthose key processes, and;
• Establish cost effective strategies and solutions toachieve the recovery time frames of the key processes; and
• Validatetheselectedsolutions.
A key BCM success for 2012 was the full failover test of the new DRfacilityinOctoberthereforedemonstratingitscapabilitytomaintainGroupServices.Thekeyobjectiveforthe2013BCMProgram is to maintain continuous improvement with a number of initiatives such as enhancing the operational resilience of UAEoperationswithan‘outoftheregion’businesscontinuitysolution and automation of the BCM program with a planning softwaretool.
c) Reputational Risk
Reputational risk is defined as the damage to the Group’s reputation due to one or more events such as negative publicityonGroup’spractices,conductorfinancialconditions.The Group has clearly identified the business areas as sources ofreputationaleventssuchas(i)compliancewithregulatoryand legal obligations (ii) business practices followed, (iii)standard of product and service quality, (iv) informationtechnology security and data integrity, (v) association withcustomers,suppliersandpartners,(vi)crisismanagement,(vii)externalcommunication,(viii)achievementiffinancialtargetset cetera. The Group pro-actively manages these identifiedbusinessareasthatmightleadtoreputationalevents.
CAPITAL MANAGEMENT
The Group is governed by CBUAE guidelines on regulatory capitalrequirementsfortheGroupandtheoverseasbranchesandsubsidiariesaredirectlysupervisedbytheirlocalregulators.The capital management process for the Group is linked to the overallbusinessstrategytoensurethatcapitalisadequatetothelevelofinherentriskinthebusiness.TheGroupconductscapitalplanninginconjunctionwiththefinancialbudgetingexercise.
The Group has a rolling five year long-term strategic plan,whichisupdatedannually.Ashort-termbusinessplanforthenext year is developed, based on the long term plan, which provides the foundation for financial and risk budgeting process.CapitalrequirementforeachbusinessunitisassessedandthenconsolidatedataGroup-widelevel.
The Group develops both bottom up plan based on the projectionsfromindividualbusinessunitsaswellasatopdownstrategicplanenvisagedby theBoardandtopmanagement.Thetopdownplanconsistsofahighlevelmulti-yearfinancial
statementbasedonlongtermplanningandstrategicobjectivestobeachieved.Theaggregatenumbersinthisplanarebasedon long term plans and strategic initiatives/decisions that the Groupplanstoundertake/implementinthefuture.Thebottomup plan is based on the budgeting process is conducted at a business unit level, which is consolidated for each business division and finally, for the entire Group. Business units,within each division, develop forecasted balance sheet and P&Lstatementsforthenextyear,byconsideringthefollowingkey parameters:
• theshortterm(oneyear)goals• riskappetite&strategy• targetgrowthrates• targetreturns
The Group’s capital management policies aim to ensure that it has sufficient capital to cover the risks associated with its activities.TheassessmentofthevariousrisksacrosstheGroupandtheirlikelyimpactiscarriedoutinconjunctionwithICAAPundertaken annually. As part of the ICAAP process, GRMDidentifies the various risks the Group is exposed to as part of itsday-to-dayoperations.NexttheGroupsetsinplacepoliciesand procedures, frameworks and methodologies, contingency plans and other processes to measure, manage and mitigate theimpactofsuchrisks.FinallytheGroupdeterminestheriskswhichwouldbecoveredbycapital.
Thekeyobjectivesofgroupcapitalmanagementprocessare:
• Maintain sufficient capital to meet minimum capitalrequirementsetbyCBUAEaswellastoensuretransitiontoBaselIIIintermsofcapitalratios
• Maintain sufficient capital to support Group’s RiskAppetite and strategic objectives as per long-termstrategic plan
• Maintainadequatecapital towithstandstress scenariosincluding increased capital requirements determinedthroughICAAP
• TosupporttheGroup’screditrating
TheGrouphassetupacommittee,namely,theBankEquityCommittee, to manage the investment of capital funds within theauthorizedlimits.
TheGroupconductsamulti-yearstresstestexerciseinwhichtheBalanceSheetandProfit&Lossstatementsaredeterminedforbasecaseandstressscenarios.Theriskfactorsareimpactedby the assumptions made for the base and stress scenarios and the corresponding impact on the capital adequacy isdetermined. The Group uses macroeconomic stress tests inordertoprojectcapitalneedandcapitallevelsundervariousunfavourablescenarios.Thetestsareperceivedasanimportanttoolininternalcapitalplanning.Thestresstestresultduring2012showsthattheGrouphasadequatecapitalintheeventofadversescenariosduringnext3-yearperiod.

125

Corporate Governance Report

127

TheNationalBankofAbuDhabianditsGroupcompanies(together“NBAD”)recognisetheirresponsibilitytodemonstrateethical andsustainablebusinesspracticesintheUnitedArabEmiratesandabroad.AcomprehensivecorporategovernanceframeworkplaysakeyroleinNBAD’sculture,businesspracticesandregulatorycompliance.
NBAD believes that the benefits arising from a commitment to corporate governance are attributable to both documentary and behaviouralelements.Hence,theBoardhasapprovedaframeworkwhichincorporatesabroadrangeofpoliciesforguidanceand control, in addition to approving general principles of behaviour and personal conduct for which all Directors and staff areaccountableasindividualsandasacollectiveentity.
The corporate governance culture of NBAD is driven by:
-TheresponsibilityoftheBoardtodirecttheGroup’saffairsandsetitsobjectives,
-Theselectionofproductivestrategiesandmanagementofrisk,
-Theappropriatedelegationandmonitoringofpowerandaccountabilitytomanagement,
-Satisfyingtheinterestsofstakeholdersthroughrelevantandmaterialdisclosures,
-Ensuringcompliancewithallregulatoryobligations,and
-Engagingwiththecommunity.
ThescopeandsophisticationofthecorporategovernanceframeworkisproportionatetoNBAD’snature,sizeandcomplexity.The Board also recognises that NBAD is operating in an evolving global environment of diverse expectations, constant regulatorychange,andincreasingfocusonstakeholderengagementandaccountability.NBADcontinuallyseekstodevelopandimproveitscorporategovernanceframeworktoenabletheBoardandmanagementtodischargetheirdutieseffectively.
Our Corporate Governance Framework
The Board of NBAD has overall responsibility for directing the Group’s affairs, to create and preserve value through the Group’s operations,andtoconsidertheshareholdersandotherstakeholderinterests.IthasdocumenteditsrolesandresponsibilitiesinaBoardCharterandassociatedpolicies.
The Board has established a number of Committees to consider various topics in more detail, to manage conflicts of interest, tosatisfyregulatoryrules,andforotherrelevantreasons.EachCommitteehasaCharter.ItisaffirmedthattheCommitteesremainanintegralpartoftheBoardandallmembersareDirectors.
Corporate Governance Report
Introduction
1.StrongCorporateGovernanceStandards
2.Leadership
3.Accountability
4.Transparency
NBAD Guiding Principles of Corporate Governance

129
TheBoardisresponsibleformakingdelegationstothemanagement,includingthedefinition,scope,frequency,andnatureofpowers.AsidefromcertainauthoritiesandpowersreservedbytheBoardforitsowndecision-making,theGroupChiefExecutiveisdelegatedfullresponsibilityforthemanagement,operationsandcomplianceofNBAD.Tosatisfyitsoversightrole, the Board has defined a clear control structure which monitors the management’s activities, in addition to creating supporting controls and reporting structuresboth internal and external to thefirm.Thedelegationandcontrol structureisalso subject tocompliancewithandoversightby regulatorsand thirdparties, including theCentralBankof theUAE,Securities&CommoditiesAuthority.
TheBoardhasalsomandatedCodesofConductwhichappliestoDirectors,employeesandagentsofNBAD.Thisencouragesappropriate behaviour, defines inappropriate behaviour, and defines the process and outcomes for the identification and reportingofsuch.
Consistent with NBAD’s approach to employ high standards for transparency and disclosure for the benefit of shareholders andotherstakeholders,NBADpublishesawiderangeofreportscontainingfinancialandnon-financialdata,inadditiontoregulatoryinformation.NBADhasestablishedanumberoffunctionscommittedtocommunicationwithexternalstakeholders,includingfunctionsforInvestorRelations,Sustainability,CompanySecretariatandCorporateCommunications.Additionally,internal transparency and disclosure is considered from operational, ethical and regulatory perspectives, ensuring that staff are aware of NBAD developments, strategies, risks and their personal responsibilities and duties, whilst protecting customer andpersonaldataconfidentiality,sensitiveinformation,andcommercialsecrets.
Shareholder rights and interests include reserved powers in the UAE Commercial Companies Law andNBADArticles ofAssociation,andaresupportedbythedutyoftheBoardtoactintheinterestoftheCompany.NBADacknowledgesthattherearediverseinterestswithintheshareholderbase,andthattheBoardconsiderssuchinterestswhendeterminingtheobjectivesandstrategiesfortheGroup.
Regulatory Compliance
NBAD is regulated by the Central Bank of the UAE and is therefore required to complywith the Central Bank laws inadditiontorulesandcircularsissuedfromtimetotime.Inaddition,NBADisrequiredtocomplywithallapplicablelawandregulationsoftheUAEandjurisdictionsinwhichitoperates,including,withoutlimitation,theUAECommercialCompaniesLaw,rulesandstandardsestablishedbytheSecuritiesandCommoditiesAuthority(SCA)oftheUAE,andtheNBADArticlesofAssociation.TheNBADArticlesofAssociationwerelastamendedin2012aftertheshareholdersapprovedthepaymentofbonussharesattheAnnualGeneralMeeting.
NBAD is committed to complying with good corporate governance practices, and so has regard to the provisions of Ministerial Resolution518of2009ConcerningGovernanceRulesandCorporateDisciplineStandards(“MR518”),althoughthisisnotamandatoryrequirementforBanksintheUAE.
Senior Management has the responsibility to ensure compliance with applicable laws and regulations, and report on this mattertotheBoard.TheBoardprovidesguidanceandoversightintermsofriskappetite,significantcomplianceandriskstrategies,anddealingwithcomplianceandriskoutcomes.TheBoardhasestablishedtheAuditandRiskCommitteeswithdelegated authorities, as noted below, and has also mandated the other Committees to suitably consider compliance and risk intermsoftheirCharters.

Board of Directors
Board Composition in 2012
Six of the 11 Directors, including the Chairman of the Board and the Group Chief Executive, are nominees of the Abu Dhabi Government, and five Directors were elected by the minority shareholders during the Annual General Meeting in 2012. The Group Chief Executive, Mr Michael Tomalin, is the only Executive Director.
The composition of the Board satisfies the generally acceptable corporate governance practice relating to the separation of Chairman and Group Chief Executive and the majority membership of Non-Executive Directors.
Membership of the Board of Directors as at 31 December 2012
H.E. Nasser Ahmed Alsowaidi is the Chairman of Department of Economic Development, Abu Dhabi Securities Exchange, Etihad Rail Company and Higher Corporation for Special Economic Zones.
H.E. is also a Member of Abu Dhabi’s Executive Council and a Board Member of International Petroleum Investment Company (IPIC) and Mubadala Development Company (Mubadala). H.E. has held senior roles in a number of Government organizations, including the Abu Dhabi Investment Authority (ADIA) and the Abu Dhabi National Oil Company.
H.E. holds a degree in Economics from the California State Polytechnic University, USA.
External appointments
• Member–ExecutiveCouncilofAbuDhabiGovernment• Chairman–DepartmentofEconomicDevelopment• Chairman–AbuDhabiSecuritiesExchange• Chairman–HigherCorporationforSpecializedEconomicZones• Chairman–EtihadRailCompany• BoardMember–MubadalaDevelopmentCompany• BoardMember–InternationalPetroleumInvestmentComp
H.E. Dr. Al Dhaheri is the Vice-Chairman of the Board of NBAD. H.E. is also a Member of the Board of Abu Dhabi National Oil Company and Secretary General of the Supreme Petroleum Council. In addition, H.E. also sits as a Board Member of the Abu Dhabi Investment Authority and is the Deputy Chairman of its Investment Committee.
External appointments
• SecretaryGeneral–SupremePetroleumCouncil• BoardMember–AbuDhabiNationalOilCompany• BoardMember–AbuDhabiInvestmentAuthority
H.E. Nasser Ahmed Alsowaidi Chairman
Non-Executive Member since 19/05/2003Appointee of the Abu Dhabi Government
H.E. Dr. Jauan Salem Al Dhaheri Deputy Chairman
Non-Executive Member since 17/08/1982Appointee of the Abu Dhabi Government

131
Sheikh Mohammed Al Nahyan is the Vice Chairman of the Abu Dhabi National Insurance Company (ADNIC) which is a leading and prominent insurance provider in the region. Sheikh Mohammed also holds the role of the Chairman of its Compensation and Remuneration Committee. In addition, Sheikh Mohammed is also the Chairman of the Abu Dhabi Marine Investment Company and the Vice Chairman of the Abu Dhabi International Marine Sports Club (ADIMSC). Sheikh Mohammed holds a degree in International Economics and History from the American University of Paris, France.
External appointments
• Chairman–AbuDhabiMarineInvestmentCompany• ViceChairman–AbuDhabiNationalInsuranceCompany• ViceChairman–AbuDhabiMarineSportsClub
Sheikh Ahmed Al Dhaheri is currently the Chairman of Bin Srour Engineering. Prior to this, Sheikh Ahmed has been the Undersecretary of the Department of Social Services and Commerce Building (DSSCB) from 1996 until 2009.
Sheikh Ahmed holds a Bachelor Degree in Civil Engineering Science.
External appointments
• MemberofAbuDhabiNationalConsultativeCouncil• BoardMember-Etisalat• BoardMember-NationalHotelsCompany• DeputyChairman-AbuDhabiAviation
H.E. Mohammed Omar Abdulla joined the Department of Economic Development (DED) as Undersecretary in March 2007. Before joining DED, H.E. assumed the position of Director General of the Abu Dhabi Chamber of Commerce and Industry from May 1997 to March 2007.
H.E. is a recognized specialist and expert in the field of Law, Banking and Economic Development.
External appointments
• Boardmember-AbuDhabiPortsCompany• Boardmember-SheikhKhalifaFund
H.E. Mohammed Omar Abdulla Director
Non-Executive Member since 19/05/2003Appointee of the Abu Dhabi Government
Sheikh Mohammed Bin Saif Bin Mohammed Al Nahyan Director
Non-Executive Member since 19/03/2006Elected by the Minority shareholders
Sheikh Ahmed Mohammed Sultan Al Dhaheri Director
Non-Executive Member since 01/05/1994Elected by the Minority shareholders

H.E. Sultan Bin Rashid Al Dhaheri is a Member of the Federal National Council. H.E. is one of the most recognised and respected businessman in the UAE and plays an essential role in the economy of the UAE through participation in different industries such as real estate, projects , portfolio management or by owning and acting as partner in commercial and industrial leading companies. H.E. owns and sits as director for several major private companies in the UAE. In addition, H.E. is well recognised for his role on charitable activities both regionally and internationally.
External appointments
• Member–FederalNationalCounciloftheUAE
• BoardMember–AbuDhabiNationalInsuranceCompany
Mr.KhalifaAlSuwaidiisanExecutiveDirectoroftheDirectInvestmentDepartmentattheAbuDhabiInvestmentCouncil.Priortothis, he was the Deputy Director of the External Funds (Americas) Department at the Abu Dhabi Investment Authority. Mr. Al Suwaidi holds a degree in Business Administration (Finance) and MSC in Finance from Seattle University, USA and is a Chartered Financial Analyst. External appointments
• BoardMember–EtihadAirways• BoardMember–AbuDhabiSecuritiesExchange• BoardMember–AldarPropertiesPJSC• BoardMember–UnionNationalBank• BoardMember–AbuDhabiInsuranceCompany• BoardMember–AbuDhabiInvestmentCompany(InvestAD)
Mr.HashimAlKudsiisanExecutiveDirector,ActiveInvestmentStrategies,attheAbuDhabiInvestmentCouncilsinceApril2007.
With a long term investment management background and experience in banking and finance, he has a degree in Business Administration from American University, USA and is also a Chartered Financial Analyst.
External appointments
• ExecutiveDirectorActiveInvestmentStrategies–AbuDhabiInvestmentCouncil• BoardMember–AbuDhabiInvestmentCompany(InvestAD)• BoardMember–AlWathbaCompanyforCentralServices
Mr. Khalifa Sultan Al Suwaidi Director
Non-Executive Member since 19/03/2006Appointee of the Abu Dhabi Government
Mr. Hashim Fawwaz Al Kudsi Director
Non-Executive Member since 19/03/2006Appointee of the Abu Dhabi Government
H.E. Sultan Bin Rashid Al DhaheriDirector
Non-Executive Member since 02/05/1973Elected by the Minority shareholders

133
Mr. Matar Al Ameri has more than 25 years of experience in various roles in Abu Dhabi National Oil Company (ADNOC). Mr. Al Ameri started his career in ADNOC and has been involved in various senior finance roles in the ADNOC Group including secondment to Arthur Andersen for two and half years on assignments across UAE, Australia, UK and USA.
Mr. Al Ameri is currently responsible for the oversight of the ADNOC Group Finance where he also represents as Member or Chairman the ADNOC Group on the Finance Board Advisory and Audit Committees of various companies such as ADCO, ADMA, ZADCO, GASCO, ADGAS, NDC, ESNAAD, FERTIL, BOROUGE, ADNATCO, NGCSO and ADNOC Distribution.
An advocate of developing and maximizing opportunities for UAE Nationals towards building future leaders and is also active in the Al Ain Sports Club where he sits as a Board Member. Mr. Al Ameri holds a Bachelor’s Degree in Accounting and Information System from UAE University.
External appointments
• BoardMember–NationalDrillingCompany• BoardMember–AbuDhabiNationalTankerCompany• BoardMember–ExcelLondon–SubsidiaryofAbuDhabiNationalExhibitonCo.(ADNEC)• BoardMember–AlAinSportsClub• ManagerGroupFCD–AbuDhabiNationalOilCompany(ADNOC)• ManagerofFinance&Control–AbuDhabiOnshoreOilOperatingCompany(ADCO)
Mr. David Beau has been working for the Abu Dhabi Government since November 2003. Currently, he is the Chief Investment Officer of the Direct Investment Department at the Abu Dhabi Investment Council. Prior to this, he was a Fund Manager at the Abu Dhabi Investment Authority. Mr. Beau is a CFA Charter holder and holds NASD Series 3, 7 and 24.
Mr. Beau grew up and went to university in Strasbourg, France and started his career in Finance in New York as a stockbroker before joining Everest Capital in London. He subsequently moved to Bermuda and Dublin where he was a fund manager for Berco Ltd., a family office with substantial assets under management. External appointments
• InvestmentCommitteemember–AbuDhabiNationalInsuranceCompany
Mr. Tomalin joined the National Bank of Abu Dhabi (NBAD) as its Chief Executive (NBAD) in 1999. A senior international wholesale andprivatebankerwithhandsonexecutiveexperienceinUK,Japan,theMiddleEast,Australasia,theCaribbeanandtheFarEast.Trained as an investment manager at Rothschilds and broadened into general management at Barclays, culminating in CEO of Abu Dhabi’s (the capital of United Arab Emirates) largest universal bank. Awards
• AwardedO.B.E.(OfficeroftheOrderoftheBritishEmpire)1991.• Honorarydoctorateinbanking,InstituteofFinancialStudies,London.
External appointments
• DirectorofMorantWrightJapanFund
• AdvisortoMillenniumAssociates:CorporateboutiqueadvisorsspecialisinginAssetManagement
Mr. David BeauDirector
Independent Non-Executive Member since 11/03/2009Elected by the Minority shareholders
Mr. Michael H. Tomalin Group Chief Executive
Executive Member since 13/3/2012Appointee of the Abu Dhabi Government
Mr. Matar Hamdan Al Ameri Director
Independent Non-Executive Member since 11/03/2010Elected by the Minority shareholders

Independent Directors
NBAD’s IndependentDirectors are electedby theminority shareholders during theAnnualGeneralMeeting. The IndependentDirectorsareobligedtoimmediatelyinformtheBoardofanycircumstancewhichmayimpactupontheirIndependentstatus.TheCorporate Governance and Nomination Committee is charged with nominating suitable candidates for the shareholders to consider forelection,andmonitoringtheIndependenceofDirectorsaccordingtoagreedcriteria.
TheSCAhasmandatedthatnominationbyaGovernmentdoesnotbyitselfexcludeDirectorsfrombeingconsideredIndependentintheeventthattheywouldotherwisesatisfytheconditions.WhilsttheGovernmentnominatedDirectorsarenot includedinthenumberofIndependentDirectorsstipulatedbytheArticles,theBoardmaypotentiallyconsidertheattributesofGovernmentnomineestodeterminewhetherIndependentDirectorsconstituteone-thirdofthetotalBoard.
Director Nomination
All Directors serve a maximum term of three years, and there is no restriction on retiring Directors, if considered appropriate, being re-nominatedforelectionatAnnualGeneralMeetingorre-appointedbytheAbuDhabiGovernment.AstheArticlesofAssociationfixes the number of Board Directors, the Board may also appoint new Directors to fill vacancies arising during the year, and any Directorsoappointedmustseekre-electionatthenextAnnualGeneralMeeting.
Terms regarding nomination and election of Directors are stipulated in the NBAD Articles of Association to include certain representation, including a proportional number of Directors to the ownership by the Abu Dhabi Government, and a minimum numberofIndependentDirectors.ThenominationminorityelectedDirectorsaresubjecttoaformalnominationprocessincludingthepubliccallfornominations,reviewofappropriateskillsandexperience,categorisationasIndependentifsuitable,andinclusionofthenominationsreceivedintheNoticeofMeetingforvotingbyshareholders.
ElectionbyminorityshareholdersoftheDirectorsissubjecttosecretballotandshareholdersmaydemandacumulativevotingsystem.
Board Responsibility and Practices
Inordertoconductitsbusinessanddischargeitsdutiestoahighstandardofcorporategovernanceprotocolsandpolicies,theBoardhas committed to several key documents which define the roles, responsibilities, functions, protocols and other matters relevant to the Board and its Members:
• CorporateGovernancePolicy&Principles,whichestablishestheoverarchingapproachofNBAD.
• CharteroftheBoardofDirectorsandofeachCommittee.
• DirectorsCodeofConduct.
• OtherNBADpoliciesreferredtointheabove.
During 2012 pursuant to an initiative of the Corporate Governance and Nomination Committee, the Company Secretariat performed afullreviewofthecorporategovernancepolicies,andthereviseddocumentswereapprovedbytheCommitteeandtheBoard.
a. Role of the Board and its Members
These duties and responsibilities of the Board of Directors include, but are not limited to, the following:
• Strategy,annualbudgetandcorporate/organisationalstructure,
• Financialreportingandcontrols,
• Riskandinternalaudit,
• Delegationofauthority,
• Conflictsofinterest,
• Contracts,
• Boardmembershipandotherappointment,
• RemunerationofDirections,
• Executiveremunerationandhumanresourcespolicies,
• Corporategovernancematters,
• Approvalofsignificantcorporatepolicies,and
• Generalmeetingofshareholdersandcommunicationwithstakeholders.

135
Role of Chairman of the Board
ItistheresponsibilityoftheChairmantoleadtheBoard,ensurethattheBoardisawareofmaterialinformationanddevelopmentspertainingtoNBAD,andencourageallDirectorstoworkinthebestinterestsofNBAD.TheroleisdefinedclearlyintheBoardCharter:
• FacilitatestheworkoftheBoardandapprovestheannualrollingagendafortheBoardaswellastheagendaforeachmeeting;
• EnsuresthatnewDirectorsareproperlyinductedandintroducedtothebusinessofNBAD;
• EnsuresthatDirectorsreceiveingoodtimeallinformationwhichisnecessaryfortheproperperformanceoftheirduties,this information to be accurate, relevant and timely;
• Ensuresthatthereissufficienttimeforconsultationanddecision-makingbytheBoard;
• LiaisesregularlywiththeGroupChiefExecutivetoensureadequatecontactbetweentheBoardandSeniorManagement;
• OverseestheorderlyandefficientconductoftheGeneralMeeting;
• EnsureseffectivecommunicationwithshareholdersandotherstakeholdersandcommunicatesanyconcerntotheBoard.
TheDeputy-ChairmanshallreplacetheChairmaninhisabsenceorwhenevertheChairmanisunabletoperformhisduties.TheroleoftheCommitteeChairmenissubstantiallysimilartothatoftheChairmanoftheBoard.
Role of Directors
Directors are expected to exercise due care and skill in the performance of their duties, and in particular to:
• Provideconstructivechallenge,
• Contributestrategicthought,andutilisetheirskillsandexperience,
• EnsurebusinessperformanceconformstostrategicdirectionandNBADvaluesandethics,
• Ensuringsatisfactorydialoguewithshareholdersandstakeholders.
IndependentDirectorshaveaparticularobligationto:
• ConductthemselvesandparticipateinBoardmatterswithanindependentmind,
• GiveprioritytoNBADuponanyconflictofinterest,
• Haveparticularregardtotheprotectionoftheinterestsoftheminorityshareholders.
Role of Group Chief Executive and Senior Management
TheGroupChiefExecutivehasdelegated responsibility from, anda jobdescriptionwhich is clearlydefinedby, theBoardofDirectorsforensuringthattheCompanyisoperatedinaccordancewithitsmandate.
SeniorManagementmustensurethattheBoardandCommitteesreceivesufficientcompleteinformationonatimelybasis.
b. Board Conduct
The Board has approved, and each Director commits, to particular codes and standards of conduct which are to be considered in termsoftheir“spirit”aswellasthestrictwording.TheDirectorsCodesofConductandBoardCharternotesthepersonaldutiesthatDirectors owe to the Company, and standards attached to:
1. ConflictsofInterest
2. ProvisionofBankingFacilities
3. EmploymentofFamily
4. Gifts,Benefits&BusinessCourtesy
5. BriberyandCorruption
6. Confidentiality
7. InsiderTrading
8. Fair,AccurateandTimelyReportingandDisclosures
9. EthicalBehaviourandWhistleblowing
10. DirectorsandOfficersInsurance

c. Board meetings and attendance
TheBoardcommitstomeetatleastsixtimesperyear,withadditionalmeetingsasrequiredtoconductspecialbusiness.During2012theBoardmet8times.The Board may make unanimous written resolutions by circulation, but did not require the need for this option during 2012. Quorum for meetingsissetatasimplemajorityofDirectors,andvotingduringmeetingsisasimplemajorityofattendees.TheChairmanmaymakeacastingvote.
Directors must disclose potential conflicts of interest as soon as they are aware of the situation, and recuse themselves from further discussionandvotingonthematter.
Attendance during 2012 was as follows:
2012 Board Meeting Attendance 17/1 31/1 14/2 24/4 24/7 16/9 23/10 29/11
H.E.NasserAhmedKhalifaAlsowaidi-Chairman 3 3 3 3 3 3 - 3
H.E.Dr.JauanSalemAlDhaheri-DeputyChairman - 3 3 3 3 3 3 3
Sheikh Mohammed Bin Saif Bin Mohammed Al Nahyan 3 - 3 3 3 3 3 3
H.E.MohammedOmarAbdulla 3 3 - - 3 3 - 3
H.E.SultanBinRashedAlDhaheri - 3 - - 3 3 3 -
Sheikh Ahmed Mohammed Sultan Al Dhaheri 3 3 3 3 3 3 3 -
Mr.KhalifaSultanAlSuwaidi 3 3 - 3 3 3 3 3
Mr.HashimFawwazAlKudsi 3 3 3 3 - 3 3 3
Mr.DavidBeau 3 3 3 3 3 3 3 3
Mr.MatarHamdanAlAmeri 3 3 3 3 3 3 - 3
Mr.MichaelTomalin* GCE GCE GCE 3 3 3 3 3
*GCE denotes the atttendance of Mr. Michael Tomalin prior to his apppointment as a Director
d. Delegation and Accountability
The Board retains specific powers in accordance with the NBAD Articles and the Matters Reserved for the Board included in the BoardCharter,anddelegatesotherresponsibilitiestoitsBoardCommittees.Unlessotherwisestated,allresponsibilityfordaytodayoperationofthebusinesstotheGroupChiefExecutiveandseniormanagement.CertainspecificpowerswhicharesubjecttospecialcontrolsareappropriatelyrecordedintheBoardResolutionsandMinutes.
The Board monitors further delegations and devolution of power through NBAD via management reporting frameworks, independent reviewsandverificationsbyaudit,complianceandlegaldepartmentsandexternaladvisors.
During 2013 NBAD will continue the revision of its delegations of authority pursuant to the evolution of risk strategies, prudential requirements,changesinthebusinessenvironmentandoperationaleffectiveness.
e. Induction, Development, Evaluation and Succession
TheBoard,Committeesandmanagementrequireanappropriatebalanceofskills,experience,independenceandknowledgehavingregardtothenatureandcomplexityofthebusiness,itscommercialenvironment,andtheinterestsofstakeholders.TheproceduresfornominationofNon-ExecutiveDirectorsforshareholderelectionandtheselectionofDirectorsforSubsidiariesarereviewedbytheCorporateGovernanceandNominationCommitteetakesthesefactorsintoaccount.
NewNon-ExecutiveDirectorsreceiveformalinduction,andallDirectorscommittocontinuallyrefreshtheirskillsandknowledge.
The Board and each Committee conducted an annual evaluation of their performance on a collective basis during 2012, with the supportoftheCompanySecretariat.Theresultsoftheself-assessmentweresubmittedtotheCorporateGovernanceandNominationCommitteetoconsiderandidentifyareasofimprovement.AfterreviewbytheChairmanoftheBoardandthefullBoard,variousrecommendationswereincludedinthedevelopmentplanfor2013.

137
f. Remuneration of the Board and Executives
ItisapolicyofNBADtoofferacompetitivecompensationframeworktoattract,retainandmotivatequalifiedandtalentedDirectorsandstaff,whilsthavingregardtoappropriaterisk,accountabilityandtheinterestsofshareholderstobuildvalue.
RemunerationfortheNon-ExecutiveDirectorsisbasedonthetimecommitment,skills,andresponsibilitybornebytheDirectorswhilstundertakingtheirdutiesfortheBoardandCommittees.ThetotalremunerationallocationfortheNon-ExecutiveDirectorsisapproved at the Annual General Meeting based on the recommendation of the Corporate Governance and Nominations Committee andtheBoard,andsubjecttoregulatorylimits.ThecompensationisallocatedtotheDirectorsbasedontheirmembershipandadditionalrolesperformedintheBoard,includingChairmanshipoftheBoardorCommitteeandattendanceatCommitteemeetings.
Title Annual Fee Committee Attendance fee in AED/per meetig
Chairman 800,000 2,500
Deputy Chairman 650,000 2,500
Directors 500,000 2,500
The Group Chief Executive, as an Executive Director, is compensated in accordance with his employment contract, which is approved by the Board after recommendation from the CorporateGovernance andNominations Committee. TheGroupChiefExecutiveandSeniorManagement’sremunerationisstructuredtolinkrewardwithcorporateandindividualperformance.Asnotedbelow, the Corporate Governance and Nominations Committee is tasked with determining appropriate remuneration frameworks forotherseniormanagement,takingaccountofincentivisationmeasures,risk,seniority,responsibilityandindustrybenchmarks.InaccordancewiththeNBADArticlesofAssociation,ExecutiveDirectorsandSeniorManagementmayparticipateintheStaffShareOptionScheme,underwhichallocationsofrightsaremonitoredandapprovedbytheBoardofDirectors.SeniorManagementcompensationisdisclosedintheAnnualReports.
Board Committees
a. Committee Mandates
The Board has established four Committees in order to focus on key initiatives or controls of NBAD and to assist in the efficiency andeffectivenessoftheBoard.EachCommitteeCharterapprovedbytheBoardandoutlinesauthority,responsibilities,meetingfrequencyandpractices,reporting,andself-evaluation.TheCommitteesarerequiredtomeetasfrequentlyasdeemednecessarytofulfiltheirobjectivesandtoallowsufficienttimefordiscussions,presentations,deliberation,anddecisionsorrecommendationstobeclearlyformulated.
The composition and Chairmanship of each Committee is approved by the Board after recommendation by the Corporate Governance andNominationCommittee,andreviewedonanannualbasis.Quorumisasimplemajority,andvotingisasimplemajorityofthoseinattendancewiththeCommitteeChairmanhavingacastingvoteinthecaseoftiedvoting.TheCommitteeChairmanshallescalatetotheChairmanoftheBoardandCompanySecretaryanysignificantmattersarisingfromtheCommittee.
OnlyDirectorsmaybeappointedtoCommittees,howevereachCommitteeshallhavetheauthoritytoobtainadviceandassistancefromoutsidelegal,accountingandotheradvisorsasitdeemsnecessarytocarryoutitsduties.TheCommitteemayalsorequestmanagement and any other internal or external advisors to attend meetings and/or conduct any investigations, reviews or studies ofanymatterwithin the scopeof theCommittee’sduties and responsibilities. In connectionwithany such investigation, theCommitteeshallhaveunrestrictedaccesstoNBAD’spersonnelanddocuments.
During 2012 the Compensation and Nomination Committee was renamed to Remuneration Committee and its scope amended to considercompensationissues,andtheCorporateGovernanceCommitteewasexpandedtocoverNominationduties.

b. Committee Scope and Composition
Audit Committee Meetings: 12
Members: (minimum3,inc1indep)
• Sh.MohammedBinSaifBinMohammedAlNahyan(Chairman)
• Mr.KhalifaSultanAlSuwaidi
• Mr.DavidBeau
• Mr.MatarHamdanAlAmeri
Oversight and review of:
• Integrityoffinancialstatements,accountingpolicies,adjustmentsandfinancialreporting.
• Adequacyofinternalcontrol,ITsecurityandriskmanagementsystems.
• Compliancewithlawsandregulations,whistleblowingandfraud.
• Investigationsintointegrity,conflictsofinterestandadherencetostandardsofconductofSeniorManagement.
• Examinationreportsfromregulatoryauthorities.
• Internalauditfunction,plans,independence,resourcingandeffectiveness.
• Appointment,remunerationandremovalofGroupChiefAuditOfficer.
• Externalauditfunction,includingrecommendationstotheBoardandShareholdersonappointment,remuneration,non-auditfees,independence,auditplans,auditrecommendationsandremoval.
• CompliancewithCodesofConduct.
Risk Management Committee Meetings: 20
Members: (minimum 5)
• H.E.NasserAhmedAlsowaidi(Chairman)
• H.E.Dr.JauanSalemAlDhaheri
• H.E.SultanBinRashedAlDhaheri
• Sh.AhmedMohammedSultanAlDhaheri
• Mr.HashimFawwazAlKudsi
TheRiskManagementCommitteeplaysakeyroleinevaluatingtheriskappetiteandpoliciesfortheGroup.ThisisanextremelyactiveCommitteewithdelegateddecision-makingauthorityonmaterialcreditapprovals,inadditiontothestrategicriskissues.Certainmattersmaybedecided,andlaterratifiedbytheBoard,incaseofextremeurgencywhentheCommitteecannotmeet.
Oversightandreviewof:
• RiskappetiteandtolerancetakingintoaccounttheGroup’sstrategiesandoperatingenvironment.
• Group’sriskmethodology,KPIsandtolerances,includingstresstesting.
• Trading,investment,liquidity,fundingandinterestraterisk,includingtransferpricing.
• Risksofstrategicacquisitionsordisposals.
• Adequacyandallocationofcapital.
• Managementproposals,materialrisktransactionsandseekCentralBankapprovalifrequired.
• Alignmentofremunerationtorisk.
• Riskdisclosuresandreports.
• Compliancewithregulatoryrequirements.
• Overall risk management framework, including adequacy of company procedures, material findings of regulators,independenceandresourcingoftheriskfunction,andassurancefrominternalauditonriskcontrols.
• ChiefRiskOfficerrole.

139
Corporate Governance and Nominations Committee Meetings: 2
Members: (minimum3,inc1indep)
• H.E.NasserAhmedAlsowaidi(Chairman)
• H.E.MohammedOmarAbdulla
• Mr.KhalifaSultanAlSuwaidi
• Mr.MatarHamdanAlAmeri
Oversight and review of:
• CorporateGovernanceCharters,policies,practices,andorganisationalstructure.
• SizeandcompositionoftheBoardanditsCommitteesrelativetotheresponsibilitiesofeach.
• Directorindependence.
• AllocationofresponsibilitiestotheCommittees,DirectorsandCompanySecretary.
• Boardmembershipandmanagementofsubsidiaries.
• Boardremuneration.
• Outsidedirectorships,directorlending,sharetradingandconflictsofinterestofDirectorsandSeniorManagement.
• CompliancewithChartersandpolicies.Members
Remuneration Committee Meetings: 3
Members: (minimum3,inc1indep)
• H.E.MohammedOmarAbdulla(Chairman)
• Sh.MohammedBinSaifBinMohammedAlNahyan
• Sh.AhmedMohammedSultanAlDhaheri
• Mr.KhalifaSultanAlSuwaidi
• Mr.DavidBeau
Oversightandapprovalof:
• Strategichumanresources.
• Remunerationandperformancerelatedpayschemes,policiesandframeworkforNBAD.
• Appointment,promotion,remuneration,retirementanddismissalofSeniorManagement.
• DevelopmentandimplementationofEmiratisationstrategiesandtargets.
• TermsofreferenceandreportingoftheManagementRemunerationCommittee.
• TrainingstrategyforNBAD.
• Highlevelsuccessionplanning.
• ReviewofSeniorManagementperformanceagainstKPI’s.
• Headcountbudgets.
• HRrelatedexpenditureabovedelegatedauthorities.
Risk and Control Framework
The Board of Directors has approved and implemented an extensive internal control system, which includes:
• ControlenvironmentandcodesofconductfortheBoardandstaff.
• Riskmanagement.
• Controlfunctions.
• ManagementInformationsystems
• Monitoring,securityandpreventionsystems.
TheCodesofConductestablishcertainprotocolsandrestrictedactivities.
The significant functionswhich incorporate the control system include InternalAudit, Risk, Compliance, Legal andCompanySecretariat.ControlfunctionswithinNBADfunctionallyreporttotheBoardordesignatedCommittees,andadministrativelyreporttotheGroupChiefExecutive.
Controlfunctionsarecomprisedofskilledandexperiencedstaffwithinternationallyrecognizedqualifications,andareprovidedwithunfetteredandindependentpowerstoinvestigatetheaffairsandinternalcontrolsoftheCorporation.Wherenecessary,thecontrolsfunctionmayalsobeoutsourcedtoreputablethirdpartieswhoarequalifiedtoprovidespecialistexpertise.
Inparticular,theevolutionofriskperspectivesandpoliciesintheinternationalandlocalregulatoryenvironmentwillcontinuetomandateorinfluenceNBAD’sapproachto,andappetitefor,risk.Asriskisanintegralpartofboththeoperationalandcontrolframework, the Board will continue to monitor the appropriate delegation of risk, the continued nature of its risk appetite and strategies,andtheauthoritiesprovidedtotheRiskCommittee.
The ExternalAuditors are paid on afixed annual fee basis. The auditors’ fee is recommended by the Board ofDirectors forshareholders’approvalintheAnnualGeneralMeeting.Non-auditworkorauditworknotwithinthescopeoftheannualreviewwillbe reviewed by the Audit Committee on a case to case basis, although procurement policies may exclude tendering by auditors to avoidanyperceivedorpotentialconflictofinterest.TheexternalauditfeesaredisclosedintheNBADAnnualAuditedAccounts.
AsrequiredbytheCentralBankoftheUAEandasdesirableforinternationalbanksofNBAD’sstature,NBADhasimplementedacomprehensive set of policies for the prevention and detection of fraud, corruption, bribery, money laundering and other criminal andciviloffences.Thesearemonitoredbyanumberofcontrolfunctions,whichultimatelyreporttotheCommitteesandBoardonmattersofsignificantbreach,localandinternationalupdates,monitoringprograms,trendsandrisks.WhilstNBADhasinstitutedasophisticated set of systems and controls to segregate duties, establish limits and approval processes, and monitor and audit employee andstakeholderinteractions,itisrecognisedthatsystemsarenotfailsafe.Hence,NBADhasanover-archingWhistleblowingPolicywhichincorporatesindependentreportingchannels,confidentialityandsensitivity,investigationpowers,escalations,reporting,re-integrationoffindingsintotheoperationalandcontrolframework,andregulatoryco-operation.
Transactions of Directors and Employees in Securities:
ByvirtueofNBAD’sstatusasalistedcompanyontheAbuDhabiStockExchange,DirectorsandstaffaresubjecttocertaintradingrestrictionsonNBADsecurities,includingClosePeriods.AllDirectorsandawideclassofSeniorManagementareclassifiedbyNBADas“Insiders”withrespecttotradingrulessetbytheSCA,whichimposesinternalandpublicdisclosurerequirements.
Also,duetothenatureofNBAD’sbusiness,Directorsandstaffmaycomeintopossessionofmaterialnon-marketinformationwhichmayimpactthepricesoflistedsecurities(includingequities,bonds,ETFs,etc)onmanyglobalexchanges.ThelegalprohibitionofInsiderTradingisenforcedwithintheNBAD’sCodesofConduct,whichspecifiesthattradingwithinsideknowledgeonanysecurity(includingbutnotlimitedtoNBADsecurities)isstrictlyforbiddenandmayexposetheindividualandNBADtoseriousnegativeoutcomes.AllDirectorsandstaffaremadeawareoftheirlegalobligationsandtheneedfortimely,relevantdisclosureinrelationtoreportingontheseissues.

141
Other Policies
Dividends
Provided that no adverse conditions exist regarding domestic and/or global economic circumstances, and after making transfers to themandatoryreservesandensuringthattheBank’scapitaladequacyratioremainsatthetargetedlevel,andsubjecttoapprovalby shareholders, NBAD’s policy is to recommend for the approval of shareholders in the Annual General Meeting a cash dividend whichiscoveredatleastthreetimesbythedistributableprofit.
Sustainability and Corporate Social Responsibility
Since2007,NBADhasaproudhistoryofbeingaleaderinthedisclosureofCorporateSocialResponsibility(“CSR”)andSustainabilityReportsintheUAE.NBADcurrentlyself-declarescompliancewithreportingstandardsundertheGlobalReportingInitiative’s(GRI)internationalguidelinesandtheFinancialSectorSupplement.
In2011NBADformallyestablishedaCorporateSustainabilityroleandcommittedfurtherresourcesforthedevelopmentofstrategiesandimplementationofsustainabilityandcorporatesocialresponsibilityinitiatives.Thisrolehastheresponsibilityforproductionof the annual Sustainability Report, with the assistance of external expertise on technical issues, and continues to identify and redefineperformancemeasuresandrecommendations.
All historical reports and current reports are available on the NBAD website in the Sustainability section, indicating NBAD’s commitmenttofulldisclosureofhistoricaldevelopmentandcontinuedimprovement.
Share Registry Services
NBADisasignificantproviderofshareregistryservicestootherpublicjointstockcompaniesintheUAEandiswellrecognisedbythemarketforprovidingintegratedandsupportservicesfortheconductofshareholderactions.TheSecuritiesandFundsAdministration ServicesDepartment is subject to an extremely high standard of duty and carewith regard to issues such asregulatorycompliance,confidentiality,auditandregulatoryco-operation.
Investor Transparency and Disclosure
Adedicated InvestorRelationssite is includedon theCorporation’swebsite (www.nbad.ae),where investorsareprovidedwithcurrent information relating to the Corporation such as:
• Annualreports
• Financialreports
• CorporateGovernancedocumentation
• Creditprofiles
• Analystcoverage
• Pressreleases
• Securitiesinformation
• Presentations
• Feedbackfacility

Shareholders’ Information

143

Major ShareholdersShareholdersholdingmorethan5%ofNBADsharesasat31December2012
-AbuDhabiInvestmentCouncil(ADIC) 70.48%
Source: Abu Dhabi Securities Exchange (ADX)
NBAD shareholding by NationalityForeignownershipisrestrictedto25%ofthetotalshareslistedontheexchange.Asof31December2012,foreignownershipinNBADsharesamountedto2.42%.
Source: Abu Dhabi Securities Exchange (ADX)
NBAD shareholding by Category
Source: Abu Dhabi Securities Exchange (ADX)
Price & RatiosMarketCapitalisation([email protected]*) 31 Dec 2012 AED39.9bn(US$10.9bn)
Diluted EPS FY2012 1.04
PERatio(onBasicEPS) Dec 2012 9.8
Price / Book Dec 2012 1.5
DividendYield(AED0.35/share) 2012 3.4%
DividendCover(Payout%)$ 2012 3.0x(33.1%)
*ADXclosingprice(unadjusted)ason31December2012^Yieldbasedonclosingpriceasmentionedabove$Dividendcover=(NetprofitslessDividendonGoADTier-Icapitalnotes)/Cashdividendsfor2012
70.48%Abu Dhabi Investment Council
2.42%
1.74% 0.45%
0.23%
27.10%
GCC OthersArabs (excl GCC)
UAE Nationals (excl ADIC)
Foreigners
Abu Dhabi Investment Council
Other Government Institutions
Individuals
Institutional Investors - Private
70.48%21.71%
0.31%
7.49%

145
Shareholders’ rewards
•Distributions
ForFinancialYear 2012 2011 2010 2009 2008 2007 2006
Cash Dividends 35% 30% 30% 10% 30% 40% 40%
Stock Dividends (Bonus shares)
10% 35% 20% 10% 10% 20% 30%
•CapitalAppreciation
- Stock Price Performance
Source: Bloomberg
- Share price CAGR as of 31 December 2012
1-Year 3-Year 5-Year
NBAD 27.0% 14.0% 1.3%
ADX 9.5% -1.4% -10.4%
CAGR - compounded annual growth rateSource: Bloomberg
NBAD vs ADX (indexed performance since 2002 CAGR - 17.1%
ADX1,000
800
600
400
200
2002 2003 2004 2005 2006 2007 2008 2009 2010 2011 2012 20130
NBAD

Group Network

147

Branches - UAE
*Denotes cash offices
Abu DhabiMain BranchTelephone:02-6111111Telefax:02-6275738/9P.O.Box:2993,AbuDhabi
ADIA*Telephone:02-4105168Telefax:02-6212157P.O.Box:2993,AbuDhabi
KhalidiyaTelephone:02-4106000Telefax:02-6667480P.O.Box:46175,AbuDhabi
ADCO*Telephone:02-6112800Telefax:02-6653057P.O.Box:46175,AbuDhabi
ADMA*Telephone:02-6263225Telefax:02-6263295 P.O.Box:46175,AbuDhabi
ADNOC* Telephone:02-6669143Telefax:02-6679869P.O.Box:46175,AbuDhabi
Rental Dispute Judicial Department* Telephone:02-4105170Telefax:02-4450568 P.O.Box:46175,AbuDhabi
ZADCO* Telephone:02-6768821Telefax:02-6768851 P.O.Box:46175,AbuDhabi
Hilton* Telephone:02-6112770P.O.Box:46175,AbuDhabi
Abu Dhabi Municipality* Telephone:02-4103801Telefax:02-6767136P.O.Box:46175,AbuDhabi.
Abu Dhabi Food Control Authority* Telephone:02-4468559Telefax:02-4460184 P.O.Box:46175,AbuDhabi
Abu Dhabi International Airport Telephone:02-5075400Telefax:02-5757593 P.O.Box:5279,AbuDhabi
Sheikh Rashed Bin Saeed Al Maktoum RoadTelephone:02-4104000Telefax:02-6416677 P.O.Box:46727,AbuDhabi
Abu Dhabi Mall Telephone:02-4104666Telefax:02-6452424 P.O.Box:7021,AbuDhabi
Arabian Gulf Road Telephone:02-4103000Telefax:02-4478344 P.O.Box:71230,AbuDhabi
Baniyas Telephone:02-5078100Telefax:02-5833359P.O.Box:11700,Baniyas
Abu Dhabi Municipality – Al Wathba*Telephone:02-5831720Telefax:02-5831740P.O.Box:11700,AbuDhabi
Bateen Telephone:02-6668792Telefax:02-6663925P.O.Box:7644,AbuDhabi
Al Bateen - Abu Dhabi Municipality*Telephone:02-6112795P.O.Box:46175,AbuDhabi
Between The Two Bridges Telephone:02-5589446Telefax:02-5589447 P.O.Box:26380,AbuDhabi
Corniche Telephone:02-6919777Telefax:02-6819122P.O.Box:3699,Bel-GhailamTower,CornicheRd.AbuDhabi
Bawabat Al Sharq Mall Telephone:02-5864096Telefax:02-5864356P.O.Box:149027Abu Dhabi, UAE
Higher Colleges of Technology*Telephone:02-4456588Telefax:02-4456436P.O.Box:31818Abu Dhabi, UAE
Khalifa Port*Telephone:02-5069311P.O.Box:76142Al Taweela, UAE

149
*Denotes cash offices
Boutik MallTelephone:02-6740159Telefax:02-6740135P.O.Box:33166AbuDhabi,ReemIsland
Delma Island Telephone:02-8781240Telefax:02-8781331P.O.Box:50670,Delma,AbuDhabi
Government Complex (TAMM, Delma)*Telephone:02-8945528Telefax:02-8945558P.O.Box:50670,TAMMCenter,Delma, Abu Dhabi
Das IslandTelephone:02-8731099Telefax:02-8731448P.O.Box:46175,AbuDhabi
Liwa Telephone:02-4105388Telefax:02-8822188 P.O.Box:50419,WesternArea,AbuDhabi
Madinat Zayed Telephone:02-8945700Telefax:02-8846496P.O.Box:50019,MadinatZayed,AbuDhabi
Ghayathi Telephone:02-8744609Telefax:02-8744628P.O.Box:77729,GhayathiArea,AbuDhabi
Ghayathi TAMM*Telephone:02-8744712Telefax:02-8744713P.O.Box:77729,TAMMBuilding,GhayathiArea,AbuDhabi
Sir Baniyas*Telephone:02-8013210Telefax:02-8779014P.O.Box:11785,InsideSirBaniyasIsland,AbuDhabi
Government Complex (TAMM, MZD)*Telephone:02-8989128Telefax:02-8846981P.O.Box:50019,MadinatZayed,AbuDhabi
Al Mirfaa Telephone:02-8836330Telefax:02-8836313 P.O.Box:77110,AbuDhabi
Paris GalleryTelephone:02-6651215Telefax:02-6650563P.O.Box:110818,KhalidiyaCenter,AbuDhabi
Al Ruwais Telephone:02-8776343Telefax:02-8776453P.O.Box:11875,AlRuwais,AbuDhabi
Al MuroorTelephone:02-4485833Telefax:02-4484181P.O.Box:2712,AbuDhabi
Mussafah Telephone:02-5029500Telefax:02-5559997P.O.Box:8351,AbuDhabi
NPCC*Telephone:02-5549282 Telefax:02-5549193 P.O.Box:8351,AbuDhabi
Petroleum Institute*Telephone:02-5075220 Telefax:02-6075385 P.O.Box:26380,AbuDhabi
Etihad AirwaysTelephone:02-5562998 Telefax:02-5562993 P.O.Box:131770,AbuDhabi
Mezyad MallTelephone:02-5532922 Telefax:02-5591251 P.O.Box:8350,AbuDhabi
Al Salam StreetTelephone:02-4103900/02-6440051Telefax:02-6446050P.O.Box:7749,AbuDhabi
Al ShahamaTelephone:02-5632411Telefax:02-5633508P.O.Box:76142,AlShahama,AbuDhabi
New Al ShahamaTelephone:02-5635695Telefax:02-5630806P.O.Box:77455,AlShahama,AbuDhabi
Shahama Municipality*Telephone:02-5631385Telefax:02-5631409P.O.Box:77455,AlShahama,AbuDhabi
Abu Dhabi National Exhibition CentreTelephone:02-4494996Telefax:02-4493788P.O.Box:94959,AbuDhabi

Branches - UAE
*Denotes cash offices
Marina MallTelephone:02-6816002Telefax:02-6816018P.O.Box:35835,AbuDhabi
Mina Road Telephone:02-6507186Telefax:02-6507242P.O.Box:48089,AbuDhabi
GHQ Officers Club Telephone:02-6112769Telefax:02-4416326P.O.Box:2993,AbuDhabi
Madinat Zayed Tower Telephone:02-6355390Telefax:02-6355389P.O.Box:111699,AbuDhabi
Al EtihadTelephone:02-4104953Telefax:02-6417812P.O.Box:31818,AbuDhabi
Emirates PalaceTelephone:02-6908900/6112777Telefax:02-6908908P.O.Box:40039,AbuDhabi
Abu Dhabi Chamber of Commerce & IndustryTelephone:02-6177460P.O.Box:662,AbuDhabi
Al Sila’aTelephone:02-8721979Telefax:02-8721959P.O.Box:76900,AbuDhabi
Al-Muroor Municipality Cash Office*Telephone:02-4413169Telefax:02-4413152P.O.Box:2712,AbuDhabi
Sila’a Municipality*Telephone:02-8724296Telefax:02-8724975P.O.Box:76900,AbuDhabi
Liwa Municipality*Telephone:02-8820133Telefax:02-8820115P.O.Box:50419,Liwa,AbuDhabi
Al Mirfa’a Municipality*Telephone:02-8836330Telefax:02-8832460P.O.Box:77110,AlMirfa’a,AbuDhabi
Dalma MallTelephone:02-5512472Telefax:02-5512470P.O.Box:93200,AbuDhabi
Masdar City InstituteTelephone:02-5570401Telefax:02-5570421P.O.Box:93003,KhalifaCityA,AbuDhabi
Sky Park Plaza T3 -Abu Dhabi Airport*Telephone:02-5075402Telefax:02-5757593P.O.Box:5279,AbuDhabi
Municipality Food Distribution Center-Mussafah*Telephone:02-5029501Telefax:02-5559997P.O.Box8351,AbuDhabi
Mushrif MallTelephone:02-4100300Telefax:02-6737095P.O.Box62545,AbuDhabi
Khalifa City (A)Telephone:02-4100202Telefax:02-5577853P.O.Box145545,AbuDhabi
Madinat Zayed Municipality*Telephone:02-8945720Telefax:02-8845021P.O.Box50019,AbuDhabi
Al Ain
Al Ain Clock TowerTelephone:03-7066500Telefax:03-7668150P.O.Box:1138,AlAin
Al Ain New branchTelephone:03-7513246Telefax:03-7517911P.O.Box:17822,AlAin
Emirates Cement Factory*Telephone:03-7224060P.O.Box:17822,AlAin
Al Ain International Airport* Telephone:03-7855511Telefax:03-7855588P.O.Box:17822,AlAin
Al Ain Defence*Telephone:03-7688824Telefax:03-7688879P.O.Box:17822,AlAin
Al SanaiyaTelephone:03-7011111Telefax:03-7610875P.O.Box:19771,AlAin
Sweihan Telephone:03-7346033Telefax:03-7347414P.O.Box:10033,Sweihan

151
*Denotes cash offices
Al HayerTelephone:03-7321414Telefax:03-7322500P.O.Box:17087,AlHayer,AlAin
Al Hayer Municipality*Telephone:03-7322400Telefax:03-7322500P.O.Box:17087,AlHayer,AlAin
Al MaqamTelephone:03-7684009Telefax:03-7684451P.O.Box:85313,AlMaqam,AlAin
Al Maqam Municipality*Telephone:03-7085308Telefax:03-7684451P.O.Box:85313,AlMaqam,AlAin
Al Ain MallTelephone:03-7519900Telefax:03-7513636P.O.Box:59212,AlAin
Al Ain Civic CenterTelephone:03-7625414Telefax:03-7624425P.O.Box:86777,AlAin
Mezyad Municipality*Telephone:03-7085359Telefax:03-7668150P.O.Box:1138,AlAin
Al Wagan Municipality*Telephone:03-7351886Telefax:03-7351451P.O.Box:21844,AlAin
Al Quaa Municipality*Telephone:03-7066592Telefax:03-7356465P.O.Box:21844,AlAin
Al Remah – TAMM*Telephone:03-7371257Telefax:03-7371947P.O.Box:17822,AlAin
Al Khaznah – TAMM*Telephone:02-5663134Telefax:02-5663573P.O.Box:17822,AlAin
Al YaharTelephone:03-7819220Telefax:03-7819351P.O.Box:200600,AlAin
Department of Economic Development*Telephone:03-7011350Al Ain Municipality, Al Ain
Ajman
AjmanTelephone:06-7013400Telefax:06-7425750P.O.Box:988,Ajman
Dubai
Dubai Main BranchTelephone:04-2131900Telefax:04-2504009P.O.Box:4436,Deira,Dubai
Dubai Side (Bur Dubai)Telephone:04-5098500Telefax:04-3583610P.O.Box:2372,Dubai
Jebel AliTelephone:04-8116700Telefax:04-8870553P.O.Box:17177,JebelAliArea,Dubai
Sheikh Zayed RoadTelephone:04-7071111Telefax:04-3861508P.O.Box:33317,Dubai
Al Qusais Telephone:04-7058500Telefax:04-2581613P.O.Box:48111,Dubai
JumeirahTelephone:04-4050990Telefax:04-3499012P.O.Box:333314,Jumeriah,Area1,Dubai
Mall of the EmiratesTelephone:04-3413888Telefax:04-3413889P.O.Box:211875,Dubai
Dubai Health Care CityTelephone:04-4245600Telefax:04-4298350P.O.Box:505115,Dubai
Dubai MallTelephone:04-3398260Telefax:04-3398463P.O.Box:73700,Dubai
Hor Al Anz (Al Mamzar)Telephone:04-2017900Telefax:04-2656186P.O.Box:4436,Dubai
Al QuozTelephone:04-3397499Telefax:04-3397332P.O.Box:282227,Dubai
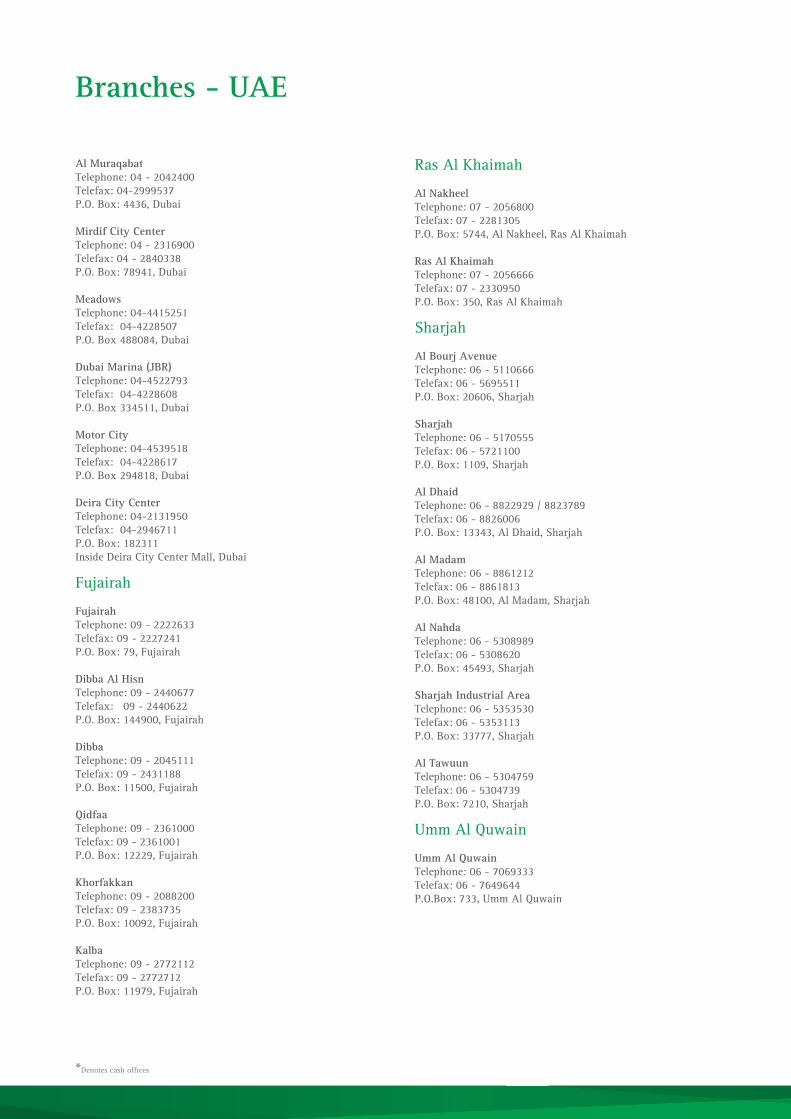
Branches - UAE
*Denotes cash offices
Al MuraqabatTelephone:04-2042400Telefax:04-2999537P.O.Box:4436,Dubai
Mirdif City CenterTelephone:04-2316900Telefax:04-2840338P.O.Box:78941,Dubai
MeadowsTelephone:04-4415251Telefax:04-4228507P.O.Box488084,Dubai
Dubai Marina (JBR)Telephone:04-4522793Telefax:04-4228608P.O.Box334511,Dubai
Motor CityTelephone:04-4539518Telefax:04-4228617P.O.Box294818,Dubai
Deira City CenterTelephone:04-2131950Telefax:04-2946711 P.O.Box:182311InsideDeiraCityCenterMall,Dubai
Fujairah
FujairahTelephone:09-2222633Telefax:09-2227241P.O.Box:79,Fujairah
Dibba Al HisnTelephone:09-2440677Telefax: 09-2440622P.O.Box:144900,Fujairah
DibbaTelephone:09-2045111Telefax:09-2431188P.O.Box:11500,Fujairah
QidfaaTelephone:09-2361000Telefax:09-2361001P.O.Box:12229,Fujairah
Khorfakkan Telephone:09-2088200Telefax:09-2383735P.O.Box:10092,Fujairah
KalbaTelephone:09-2772112Telefax:09-2772712P.O.Box:11979,Fujairah
RasAlKhaimah
Al NakheelTelephone:07-2056800Telefax:07-2281305P.O.Box:5744,AlNakheel,RasAlKhaimah
Ras Al Khaimah Telephone:07-2056666Telefax:07-2330950P.O.Box:350,RasAlKhaimah
Sharjah
Al Bourj AvenueTelephone:06-5110666Telefax:06-5695511P.O.Box:20606,Sharjah
SharjahTelephone:06-5170555Telefax:06-5721100P.O.Box:1109,Sharjah Al DhaidTelephone:06-8822929/8823789Telefax:06-8826006 P.O.Box:13343,AlDhaid,Sharjah
Al MadamTelephone:06-8861212Telefax:06-8861813P.O.Box:48100,AlMadam,Sharjah
Al NahdaTelephone:06-5308989Telefax:06-5308620P.O.Box:45493,Sharjah
Sharjah Industrial AreaTelephone:06-5353530Telefax:06-5353113P.O.Box:33777,Sharjah
Al TawuunTelephone:06-5304759Telefax:06-5304739P.O.Box:7210,Sharjah
UmmAlQuwain
Umm Al QuwainTelephone:06-7069333Telefax:06-7649644P.O.Box:733,UmmAlQuwain

153
Branches - Overseas
*Denotes cash offices
Bahrain
Retail Banking Unit Address:BuildingNo.2611,RoadNo.2833,AlSeefDistrict428 P.O.Box5247Manama-KingdomofBahrain Telephone:+97317560870 Fax:+97317560837 Swift: NBADBHBMBRA Wholesale Banking Unit Address:BuildingNo.2611,RoadNo.2833,AlSeefDistrict428 P.O.Box5886,Manama,KingdomofBahrain Telephone:+97317560870 Fax:+97317583281 Swift: NBADBHBM
Egypt
Regional Office Telephone:+20237475102/37475000Telefax:+20237475295Address:NileTower(18thFloor),21CharlesdeGaulleSt.Cairo,Egypt
6th OctoberTelephone:+20238282900Telefax:+20238282928Swift:NBADEGCAOCTAddress:52,H.ALMahwarAlMarkazy,BanksDistrict,6thOctoberCity,Egypt
Dandy MallTelephone:+20238282960Telefax:+20235391868Swift:NBADEGCAOCTAddress:K.M.28CairoAlex.DesertRoad,UnitNo.23,DandyMall,Giza,Egypt
Elite Banking Unit - GizaTelephone:+20237475006/37475300Telefax:+20237475296Swift: NBADEGCAPSUAddress: Nile Tower – 1st & 3rd Floors,21CharlesdeGaulleSt.Cairo,Egypt
MohandessinTelephone:+20238282941/45Telefax:+20233365569Swift: NBADEGCAMHDAddress:35MohieElDinAbuElEzzStreet,ElMohandessin,Giza,Cairo,Egypt
Talaat HarbTelephone:+20227683240Telefax:+20223931527Swift: NBADEGCATHBAddress:22,KasrElNilStreet,TalaatHarbSq.,Cairo,Egypt
MaadiTelephone:+20227683200/23586015Telefax:+2023588945/235838877Swift: NBADEGCAMAD&PSUAddress: Crossing of Roads 151/152 (nearHorreyaSquare)Maadi,Cairo,Egypt
Maadi City CenterTelephone:+20227683237Telefax:+20227683236Swift: NBADEGCAMADAddress:UnitNo.27,MaadiCityCenter,RingRoad,MedinatElMirage1435–KatameyaRoad,Cairo,Egypt
El ChoueifatTelephone:+20227683275Telefax:+20226182701Swift: NBADEGCA CHFAddress:ElChoueifatSchool-MainGate,NewFifthUrbanCommunity(Kattameya),New Cairo, Egypt
HeliopolisTelephone:+20224177627Telefax:+20224177632Swift:NBADEGCAHLPAddress: 13A, Ramsis Street, From Salah Salem Road,Heliopolis, Cairo, Egypt
City StarsTelephone:+20224137850Telefax:+20224802183Swift:NBADEGCAHLPAddress:UnitNo.148,CityStarsMall,Nasr City, Cairo, Egypt
Al AkkadTelephone:+20224137830Telefax:+20222752376Swift:NBADEGCAAAKDAddress: 36 Abbas Al Akkad Street, Nasr City, Cairo, Egypt
El ObourTelephone:+20224137863Telefax:+20246104972Swift:NBADEGCAOBRAddress:UnitNo.1&2,CityClubWall,IsmailyaDesertRoad,ElObourCity,ElQalubia,Egypt
Salah SalemTelephone:+2034860900/3Telefax:+2034847114Swift:NBADEGCAALXAddress: 28, Salah Salem Street, Alexandria, Egypt
SportingTelephone:+2034203401/4196000Telefax:+2034203409/4240027Swift: NBADEGCASPTAddress:243HorreyaAve.,Sporting,Alexandria, Egypt
Branches - Overseas
*Denotes cash offices
San StefanoTelephone:+2034690029Telefax:+2034690028Swift: NBADEGCASTFAddress:SanStefanoGrandPlaza,Alexandria,Egypt
Alexandria City CenterTelephone:+2034196040Telefax:+2033970081Swift: NBADEGCAACCAddress: City Centre, Alexandria, Egypt
Port SaidTelephone:+20663384400Telefax:+20663235814Swift: NBADEGCAPSDAddress:4,SultanMahmoud&TahrElBaharSt.,ElSalam Tower, Port Said, Egypt
MansouraTelephone:+20502281200Telefax:+20502329980Swift: NBADEGCAMNSAddress: 242 Al Guesh Street, P.O.Box:350,Mansoura,Egypt
TantaTelephone:+20403385800/0105005823Telefax:+20403385811Swift: NBADEGCATNTAddress: 22 El Geish Street, Al Sarayah Tower, Tanta, Gharbia, Egypt
DamiettaTelephone:+2057392201Telefax:+2057392222Swift: NBADEGCADMTAddress:173SaadZaghloulStreet,Damietta, Egypt
LuxorTelephone:+20952399840Telefax:+20952399839Swift:NBADEGCALUXAddress:KhaledIbnAlWaleedStreet,SonestaSt.GeorgeHotel,Luxor,Egypt
AssiutTelephone:+2088228539/6Telefax:+20882285394Swift: NBADEGCAASUAddress: 32A, El Gomhoria Street,Assiut, Upper Egypt
Sharm El SheikhTelephone:+20693602695Telefax:+20693621912Swift:NABDEGCASHKAddress:GoldenCenter,UnitNo.19-GroundFloor,AlSalamStreet-Na´amaBay,SharmElSheikh,South Sinai, Egypt
Sharm El Sheikh*Telephone:+20693621971Telefax:+20693602693Swift:NABDEGCASHKAddress:SanafirHotel,UnitNo.2,Na´amaBay,Sharm El Sheikh South Sinai, Egypt
HurghadaTelephone:+20653443424Telefax:+20653443446Swift: NBADEGCAHURAddress: West Side Touristic Center Shop 1/3,Al Mashaia Area, Hurghada, Red Sea, Egypt
Hurghada Cash Office - Titanic Beach Hotel*Telephone:+20653461420Telefax:+20653461430Address:LTITitanicBeachHotel–SouthMagawish–KM17,Sahl Hashish Road, Hurghada, Red Sea, Egypt
Senzo MallTelephone:+20653412134Telefax:+20653412130Swift:NABDEGCASNZAddress:UnitNo.1ASenzoMall,SouthMagawish,Safaga Road, Hurghada, Red Sea, Egypt
El HegazTelephone:+20226217953/4Telefax:+20224137879Swift:NBADEGCAHGZAddress:50FaridSemeikast.ElHegazsquare,Heliopolis, Cairo, Egypt
ShoubraTelephone:+20222007926Telefax:+20222007784Swift: NBADEGCASHBAddress:21DawletyanSt.,AghaKhanBld.,ShoubraMisr
France
ParisTelephone:+33153230280Telefax:+33147208160Swift:NBADFRPPXXXAddress: 125, Avenue des Champs Elysees, 75008,Paris, France
Kuwait
KuwaitTelephone:+96522904141Telefax:+96522495196Swift:NBADKWKWAddress:AlBaharTower,AhmedAlJaberStreet,Sharq,Kuwait P.O.Box:2620,Safat,13027,Kuwait

155
*Denotes cash offices
Libya
Libya Rep. OfficeTelephone:+218213362283Telefax:+218213362284Address:TripoliTower1,15thFloor,OfficeNo.152,P.OBox:259,Tripoli,Libya
Oman
Regional OfficeTelephone:+96824761000Telefax:+96824761010/110Swift:NBADOMRXXXXAddress:CommercialBusinessDistrict(CBD),BuildingNo.320,WayNo.4010,BlockNo.140,P.O.Box303,PostalCode100,Muscat,SultanateofOman
MainTelephone:+96824761046/47/48/49Telefax:+96824798929Swift:NBADOMRXXXXAddress:CommercialBusinessDistrict(CBD),BuildingNo.320,WayNo.4010,BlockNo.140,P.O.Box303,PostalCode100,Muscat,SultanateofOman
Al QurumTelephone:+96824662200/01/02/03/04/05/06Telefax:+96824563935Address:AlQurum–ROPParkingArea,P.O.Box:988-PostalCode116,AlQurum,SultanateofOman
Al KhuwairTelephone:+96824476701/02/03/04/05Telefax:+96824482329Address:AlKhuwair–Ice-SkatingBuilding,NexttoZawawiMosque,P.O.Box:458-PostalCode130,AlKhuwair,SultanateofOman
Al KhoudhTelephone:+96824533902/03/04/05/06/07/08Telefax:+96824545904Address:AlKhoudhCommercialSt.-BuildingNo.356,P.O.Box:1092,PostalCode132,AlKhoudh,SultanateofOman
SoharTelephone:+96826851800/01/02/03/04/05Telefax:+96826845644Address:AlWaqaiba–BanksArea,P.O.BoxNo25–PostalCode321,AlTarif,SultanateofOman
NizwaTelephone:+96825414700/01/02/03/04/05/06Telefax:+96825414720Address:OppositeFirqRoundabout,P.O.Box:895-PostalCode611,Nizwa,SultanateofOman
SalalahTelephone:+96823207600/01/02/03/04/05/06Telefax:+96823207620Address:HaffaHouse,P.O.Box2715,PostalCode211,CentralSalalah,SultanateofOman
Sur Telephone:+96825563100/01/02/03/04/05/06Telefax:+96825563120P.O.Box421,PostalCode411,Sur,SultanateofOmanAddress:OnMainCommercialRoad, BetweenOmanHousingBankandSurPlazaHotel, Sur,SultanateofOman
Al BuraimiTelephone:+96825658200/01/02/03/04/05/06/07Telefax:+96825658220Address: New Al Sa’ara, Al BuraimiP.O.Box671,PostalCode512,AlBuraimi,SultanateofOman
Sudan
Regional OfficeTelephone:+249183774204/787203/787750Telefax:+249183774892Address:P.O.Box12147,TakaBuilding,AtbaraStreet,Khartoum,RepublicofSudan
KhartoumTelephone:+249183778517Telefax:+249183792347Swift:NBADSDKHAddress:P.O.Box2465,TakaBuilding,AtbaraStreet,Khartoum,RepublicofSudan
Khartoum North*Telephone:+249185343833Telefax:+249185343227Address:SinaatStreet,KhartoumNorth,DALFoodBuildingP.O.Box1138,PostalCode:13311,KhartoumNorth,RepublicofSudan
AmaratTelephone:+249183569656/604/640Telefax:+249183569625Swift:NBADSDKHAMRAddress:Street15,Block9/10,PlotNo.50/1,Hilal Sami Building, P.O.Box:15141,Amarat,Khartoum,RepublicofSudan
Omdurman Telephone:+249187569051Telefax:+249187569165Swift:NBADSDKHAddress: Al Mourada Street, Shekkan Building Block 4/1, PlotNo.617OmdurmanCityP.O.Box:2465,Khartoum,RepublicofSudan

Branches - Overseas
Jordan
ShmeisaniTelephone.:+96265002222Telefax:+96265002220Swift:NBADJOAMAddress: 10 Abdul Hameed Sharaf Street, Al Shmeisani 941110Amman11194-Jordan
Wadi AbdounTelephone:+96265002222Telefax:+96265933763Swift:NBADJOAMAddress:WadiAbdoun-PrincessBasmaStreetP.O.Box941110,Amman11194-Jordan
Hong Kong
Hong KongTelephone:+85234134388Telefax:+85234134343Swift:NBADHKHHAddress: 18/F, Nine Queen’s Road Central,Central, HongKong
United Kingdom
LondonTelephone:+442073933600Telefax:+442073933636Swift:NBADGB2LAddress:OneKnightsbridge, LondonSW1X7LY,UK
China
Shanghai Rep OfficeTel:+862160952388Telefax:+862160952343Address:Unit2304,ShanghaiIFCPhaseII,No.8,CenturyAvenuePudong District, Shanghai200120 China

157
Subsidiaries
United States of America
Abu Dhabi International Bank N.V. Telephone:+12028427900 Telefax:+12028427955 Swift:ADIBUS33 Address:1430Kstreet,N.W.,Suite400, WashingtonD.C.20005,U.S.A.
Curacao
Abu Dhabi International Bank N.V.Telephone:+59994611299Telefax:+59994615392Address:KayaW.F.G.(Jombi)Mensing36P.O.Box:3141Curacao
Switzerland
NBAD Private Bank (Suisse) SA Telephone:+41227075000 Telefax:+41227075010 Address:Quaidel’lle5,P.O.Box:5055, CH-1211Geneva11,Switzerland
Jersey Channel Islands
NBAD Trust Company (Jersey) Limited Telephone:+441534609000 Telefax:+4415346093333 Address:C/OMourantPrivateWealth,22GrenvilleStreet,St.Helier,JerseyJE48PX, P.O.Box:87,Jersey,ChannelIslands
Malaysia
National Bank of Abu Dhabi Malaysia Berhad Tel:+60323303800(General)Telefax:+60323303801(General)SWIFT:NBADMYKLAddress:Level28,MenaraMaxis,KualaLumpurCityCentre,50088KualaLumpur
United Arab Emirates
Abu Dhabi National Leasing LLC Telephone:+97126111629 Telefax:+97126269111 P.O.Box:4 Address:OneNBADTower, SheikhKhalifaStreet,AbuDhabi, United Arab Emirates
Abu Dhabi National Islamic Finance Company Telephone:+97124104444 Telefax:+97126222597 Address:P.O.Box40057,AbuDhabi, United Arab Emirates
NBAD Securities LLC Telephone:+97126161600 Telefax:+97126273285 P.O.Box:28400,AbuDhabi, United Arab Emirates
Abu Dhabi National Properties PrJC Telephone:+97126594888 Telefax:+97126355382 P.O.Box:3520Address:MuroorStreet,OppositeMadinatZayedShopping Centre, Abu Dhabi, United Arab Emirates
NBAD Investment Management (DIFC) Limited Telephone:+97147058520 Telefax:+97147058521 P.O.Box:506659Address:GateVillage1,DIFC,Dubai, United Arab Emirates

www.nbad.ae