investor presentation - nbad uae · pdf fileleading corporatefor investor relations –uae...
TRANSCRIPT
1
Investor Presentation4Q / FY 2013

2
Introduction / Strategic Review4Q / FY 2013Alex Thursby, Group Chief Executive Officer
3
Continued strength in 4Q / FY 2013 results
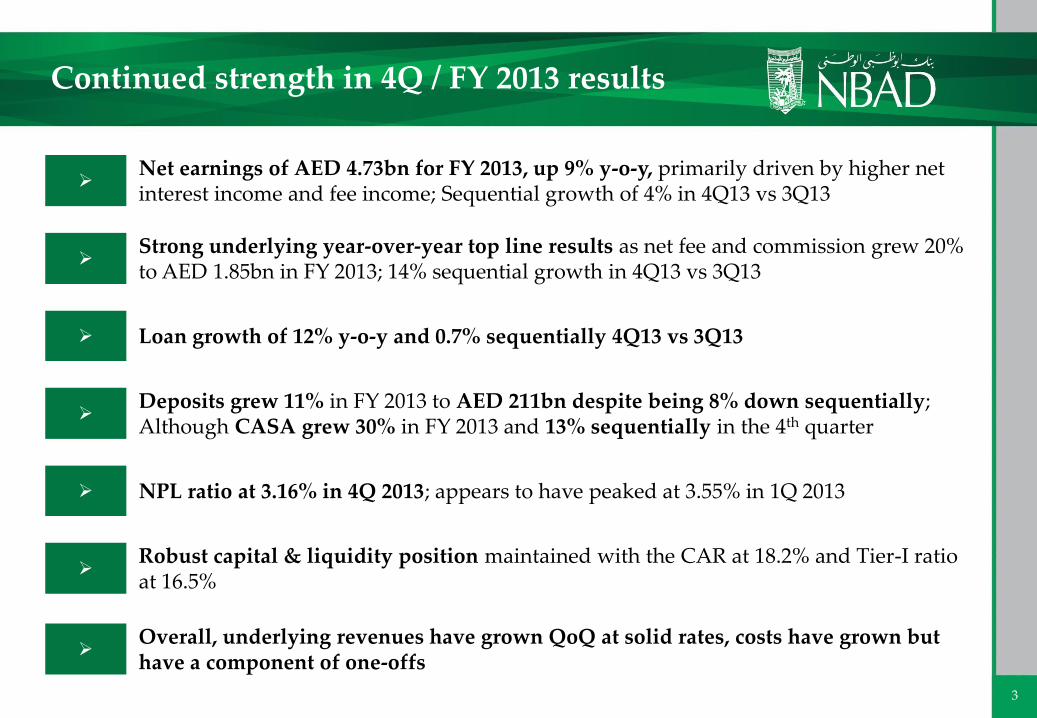
Net earnings of AED 4.73bn for FY 2013, up 9% y-o-y, primarily driven by higher net interest income and fee income; Sequential growth of 4% in 4Q13 vs 3Q13
Strong underlying year-over-year top line results as net fee and commission grew 20% to AED 1.85bn in FY 2013; 14% sequential growth in 4Q13 vs 3Q13
Loan growth of 12% y-o-y and 0.7% sequentially 4Q13 vs 3Q13
Deposits grew 11% in FY 2013 to AED 211bn despite being 8% down sequentially; Although CASA grew 30% in FY 2013 and 13% sequentially in the 4th quarter
NPL ratio at 3.16% in 4Q 2013; appears to have peaked at 3.55% in 1Q 2013
Robust capital & liquidity position maintained with the CAR at 18.2% and Tier-I ratio at 16.5%
Overall, underlying revenues have grown QoQ at solid rates, costs have grown but have a component of one-offs
4
Q4 2013 – Awards & Accomplishments
Named “Safest Bank In the Emerging Markets” - Global Finance
Teamed up with INSEAD to launch “Jauan Al Dhaheri Scholarship”
“Best Private Bank in the UAE” – 5th Annual Global Private Banking Awards
“Leading Corporate for Investor Relations – UAE” – Middle East IR Society
“UAE Best Branch Performance” & “Best Customer Service Initiative” – Ethos Consulting, International Customer Service Institute
“Best Sukuk Fund” – Islamic Business & Finance Awards CPI Financials
5
Strategic Update – Progress Report
Detailed 5-year Group Strategy developed and approved by Board in July
Global Wholesale Banking, Global Wealth and Retail & Commercial 5-yearBusiness Plans presented to the Board and approved in January 2014
Quick wins around building strong flow business in progress. Strategic Initiatives build out plans completed. Implementation under progress.
Operating model developed as part of business plans. Key strategic areas like client on-boarding and client servicing are under review and improvement
Building the Spine to a World Class Level – IT plans developed to support business plans and Shared services project under progress
6
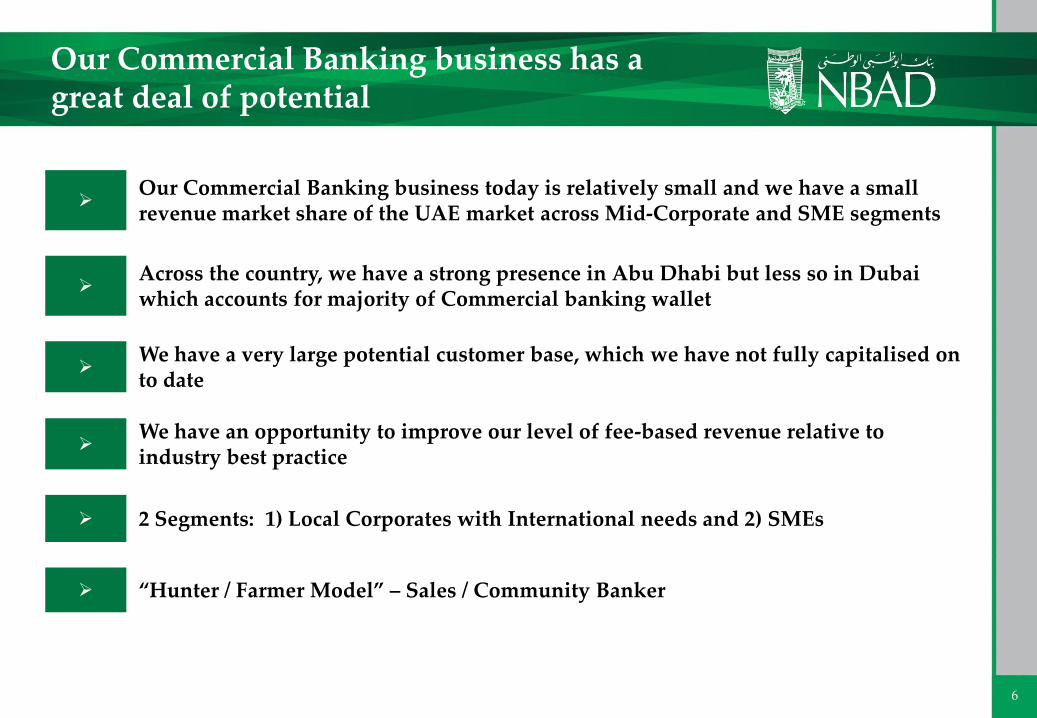
Our Commercial Banking business has a great deal of potential
Our Commercial Banking business today is relatively small and we have a small revenue market share of the UAE market across Mid-Corporate and SME segments
Across the country, we have a strong presence in Abu Dhabi but less so in Dubai which accounts for majority of Commercial banking wallet
We have a very large potential customer base, which we have not fully capitalised on to date
We have an opportunity to improve our level of fee-based revenue relative to industry best practice
2 Segments: 1) Local Corporates with International needs and 2) SMEs
“Hunter / Farmer Model” – Sales / Community Banker
7
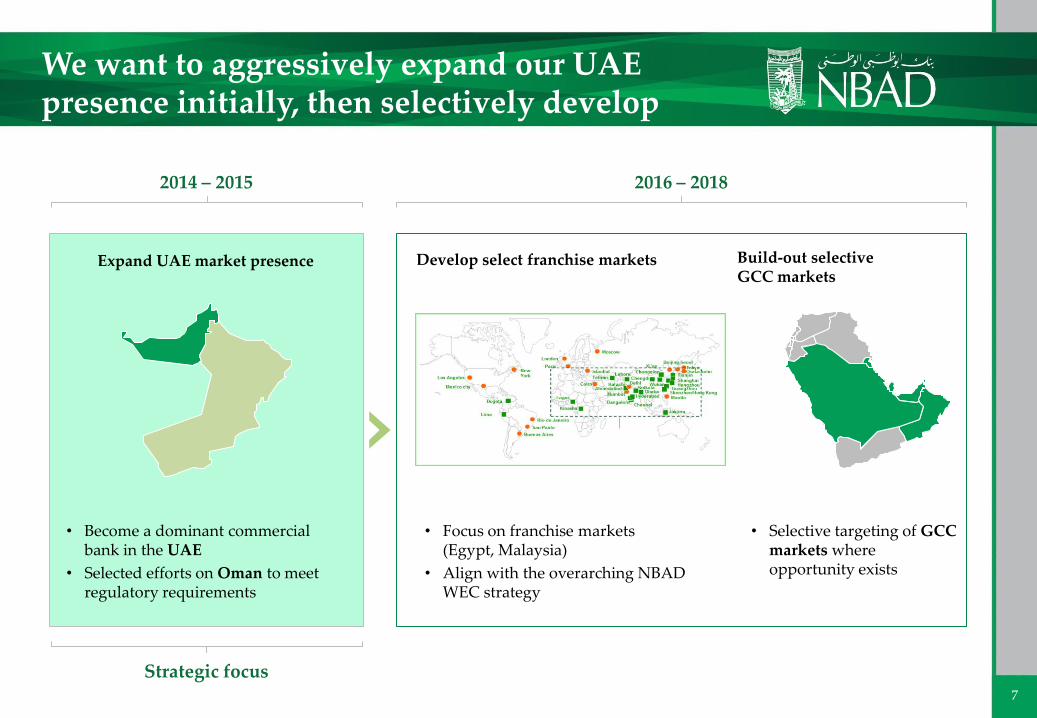
Expand UAE market presence Build-out selective GCC markets
Develop select franchise markets
2014 – 2015 2016 – 2018
• Become a dominant commercial bank in the UAE
• Selected efforts on Oman to meet regulatory requirements
• Focus on franchise markets (Egypt, Malaysia)
• Align with the overarching NBAD WEC strategy
• Selective targeting of GCC markets where opportunity exists
Strategic focus
We want to aggressively expand our UAE presence initially, then selectively develop our franchise and GCC markets
8
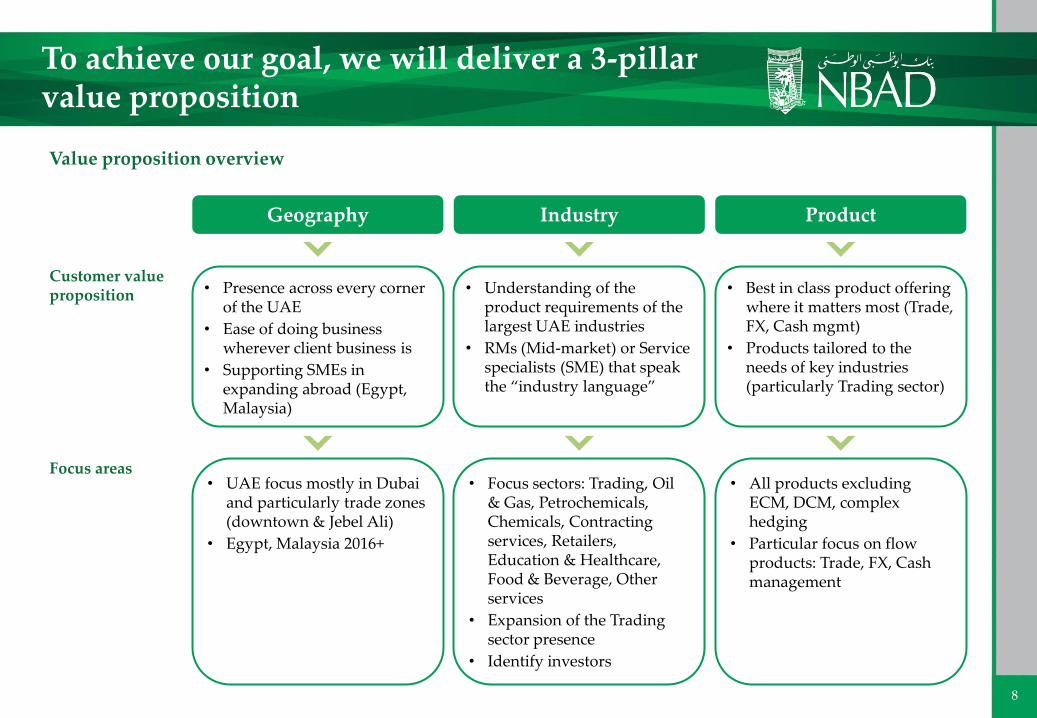
To achieve our goal, we will deliver a 3-pillar value proposition
Geography Industry Product
• Presence across every corner of the UAE
• Ease of doing business wherever client business is
• Supporting SMEs in expanding abroad (Egypt, Malaysia)
• Understanding of the product requirements of the largest UAE industries
• RMs (Mid-market) or Service specialists (SME) that speak the “industry language”
• Best in class product offering where it matters most (Trade, FX, Cash mgmt)
• Products tailored to the needs of key industries (particularly Trading sector)
Customer value proposition
Focus areas• UAE focus mostly in Dubai
and particularly trade zones (downtown & Jebel Ali)
• Egypt, Malaysia 2016+
• Focus sectors: Trading, Oil & Gas, Petrochemicals, Chemicals, Contracting services, Retailers, Education & Healthcare, Food & Beverage, Other services
• Expansion of the Trading sector presence
• Identify investors
• All products excluding ECM, DCM, complex hedging
• Particular focus on flow products: Trade, FX, Cash management
Value proposition overview
9
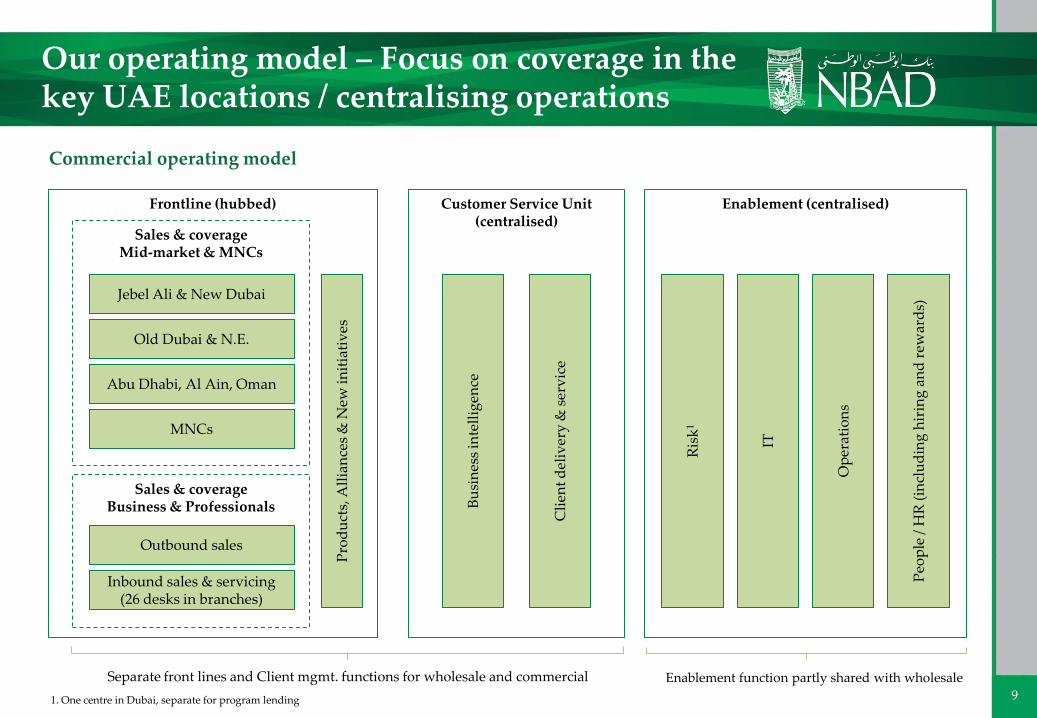
Our operating model – Focus on coverage in the key UAE locations / centralising operations
Sales & coverageMid-market & MNCs
Old Dubai & N.E.
Jebel Ali & New Dubai
Abu Dhabi, Al Ain, Oman
MNCs
Inbound sales & servicing (26 desks in branches)
Outbound sales
Pro
du
cts,
All
ian
ces
& N
ew i
nit
iati
ves
Sales & coverageBusiness & Professionals
Customer Service Unit (centralised)
Bu
sin
ess
inte
llig
ence
Cli
ent
del
iver
y &
ser
vic
e
Enablement (centralised)Frontline (hubbed)
Ris
k1
Op
erat
ion
s
Peo
ple
/ H
R (
incl
ud
ing
hir
ing
an
d r
ewar
ds)
IT
Commercial operating model
Separate front lines and Client mgmt. functions for wholesale and commercial Enablement function partly shared with wholesale
1. One centre in Dubai, separate for program lending
10
Results DiscussionMichael A. Miller, Head of Investor Relations
11
OPERATING INCOME / REVENUES
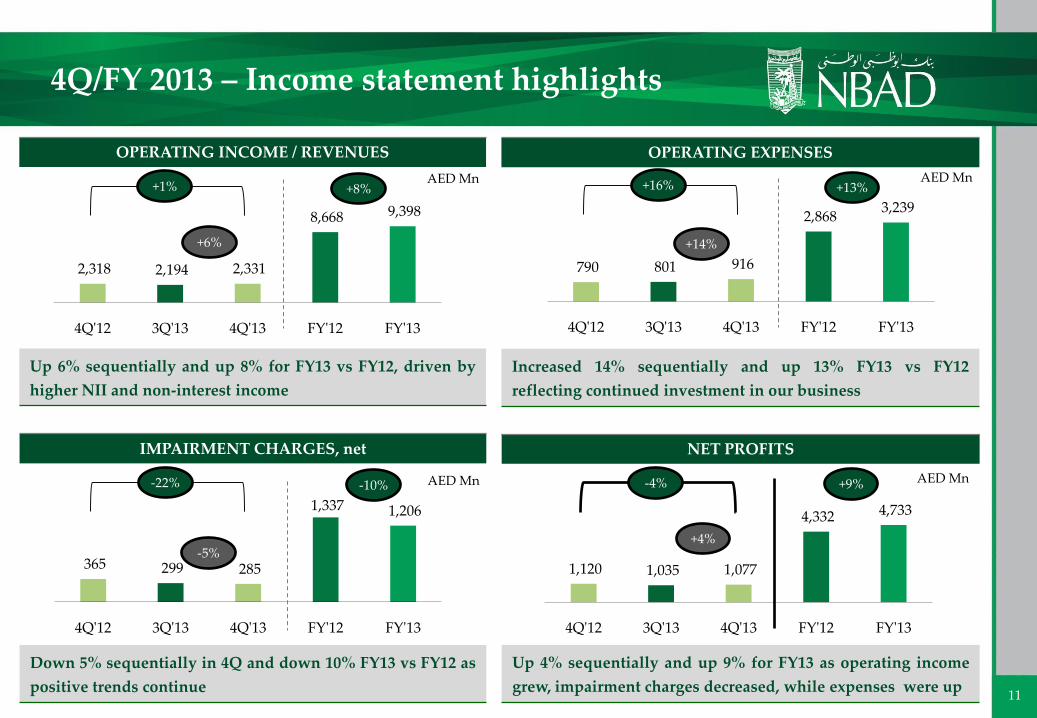
Up 6% sequentially and up 8% for FY13 vs FY12, driven by
higher NII and non-interest income
4Q/FY 2013 – Income statement highlights
OPERATING EXPENSES
Increased 14% sequentially and up 13% FY13 vs FY12
reflecting continued investment in our business
IMPAIRMENT CHARGES, net
Down 5% sequentially in 4Q and down 10% FY13 vs FY12 as
positive trends continue
NET PROFITS
Up 4% sequentially and up 9% for FY13 as operating income
grew, impairment charges decreased, while expenses were up
2,318 2,194 2,331
8,668 9,398
4Q'12 3Q'13 4Q'13 FY'12 FY'13
AED Mn+8%+1%
790 801 916
2,868 3,239
4Q'12 3Q'13 4Q'13 FY'12 FY'13
AED Mn+13%+16%
365 299 285
1,337 1,206
4Q'12 3Q'13 4Q'13 FY'12 FY'13
AED Mn-10%-22%
1,120 1,035 1,077
4,332 4,733
4Q'12 3Q'13 4Q'13 FY'12 FY'13
AED Mn+9%-4%
+6% +14%
-5%+4%
12
ASSETS
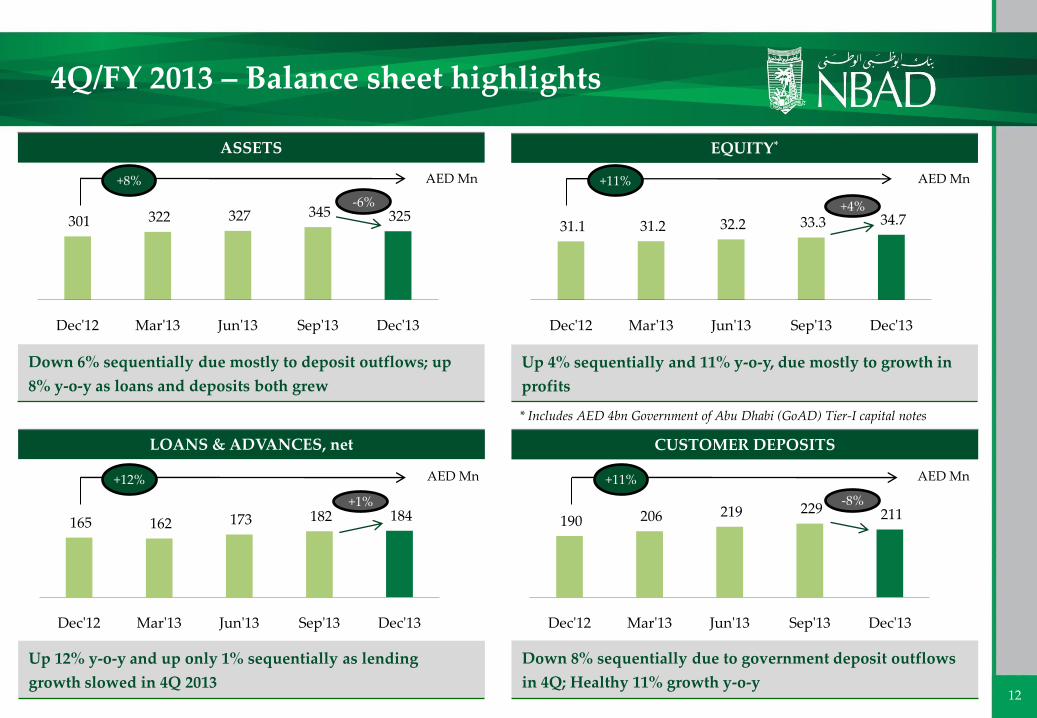
Down 6% sequentially due mostly to deposit outflows; up
8% y-o-y as loans and deposits both grew
4Q/FY 2013 – Balance sheet highlights
EQUITY*
Up 4% sequentially and 11% y-o-y, due mostly to growth in
profits
* Includes AED 4bn Government of Abu Dhabi (GoAD) Tier-I capital notes
LOANS & ADVANCES, net
Up 12% y-o-y and up only 1% sequentially as lending
growth slowed in 4Q 2013
CUSTOMER DEPOSITS
Down 8% sequentially due to government deposit outflows
in 4Q; Healthy 11% growth y-o-y
301 322 327 345 325
Dec'12 Mar'13 Jun'13 Sep'13 Dec'13
AED Mn
-6%
31.1 31.2 32.2 33.3 34.7
Dec'12 Mar'13 Jun'13 Sep'13 Dec'13
AED Mn
+4%
165 162 173 182 184
Dec'12 Mar'13 Jun'13 Sep'13 Dec'13
AED Mn
+1%
190 206 219 229 211
Dec'12 Mar'13 Jun'13 Sep'13 Dec'13
AED Mn
-8%
+8% +11%
+12% +11%
13
Revenues by Segment
Actual Contr % AED Mn % Actual Contr %
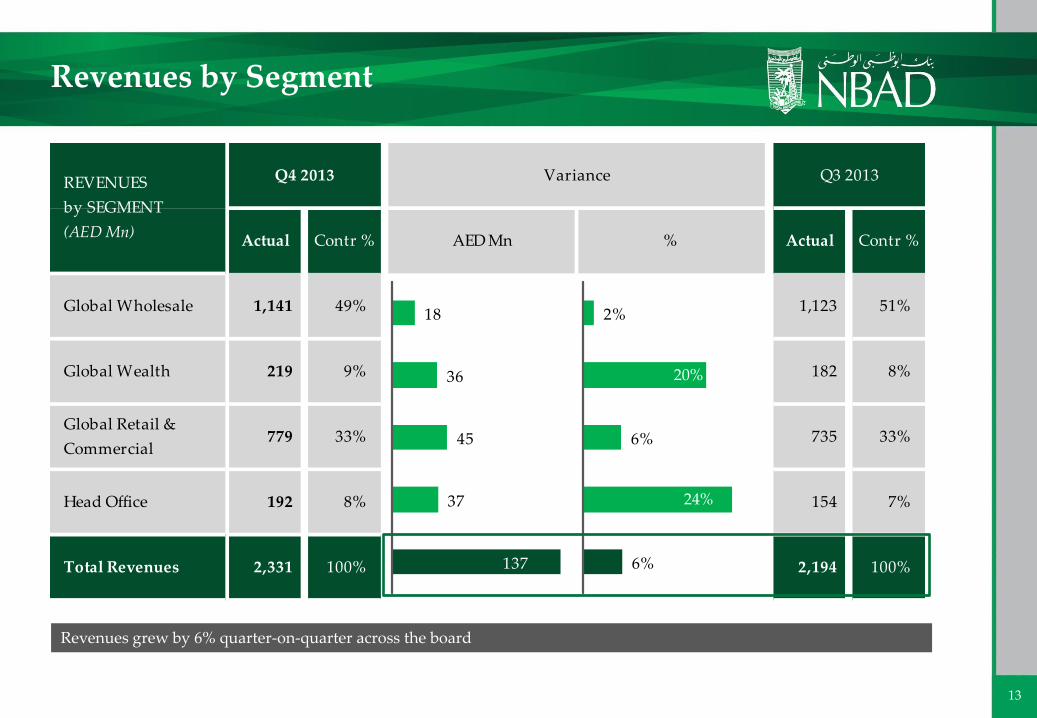
Global Wholesale 1,141 49% 1,123 51%
Global Wealth 219 9% 182 8%
Global Retail &
Commercial779 33% 735 33%
Head Office 192 8% 154 7%
Total Revenues 2,331 100% 2,194 100%
REVENUES
by SEGMENT
(AED Mn)
Q4 2013 Variance Q3 2013
18
36
45
37
137
2%
6%
6%
24%
20%
Revenues grew by 6% quarter-on-quarter across the board
14
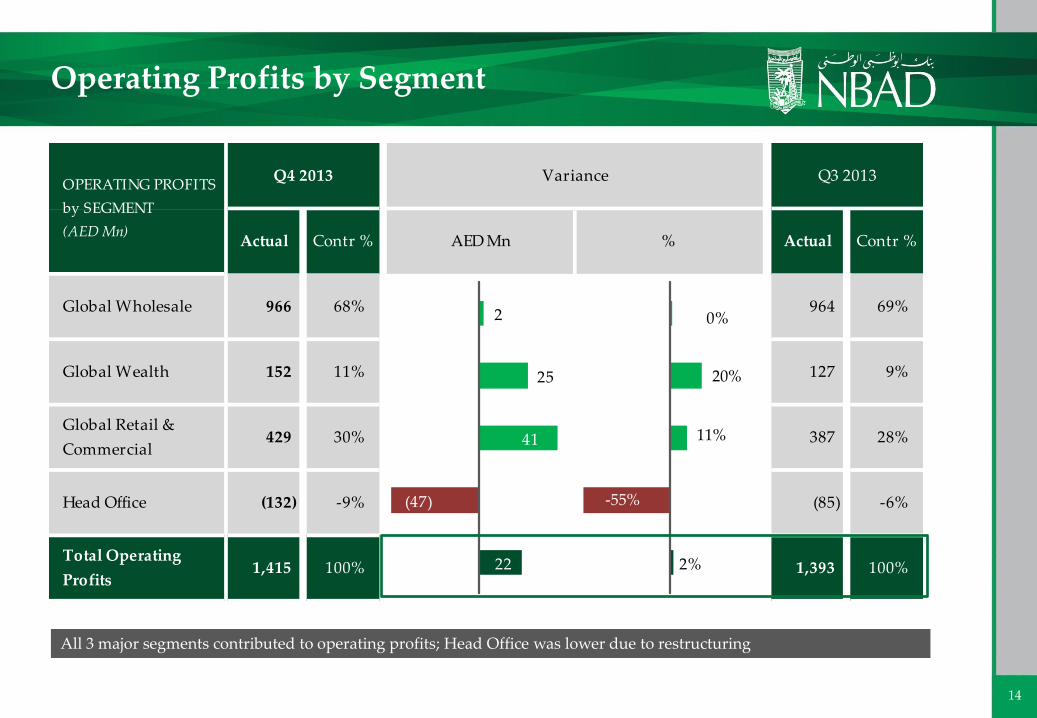
Actual Contr % AED Mn % Actual Contr %
Global Wholesale 966 68% 964 69%
Global Wealth 152 11% 127 9%
Global Retail &
Commercial429 30% 387 28%
Head Office (132) -9% (85) -6%
Total Operating
Profits1,415 100% 1,393 100%
OPERATING PROFITS
by SEGMENT
(AED Mn)
Q4 2013 Variance Q3 2013
2
25
41
(47)
22
0%
2%
Operating Profits by Segment
-55%
20%
All 3 major segments contributed to operating profits; Head Office was lower due to restructuring
11%
15
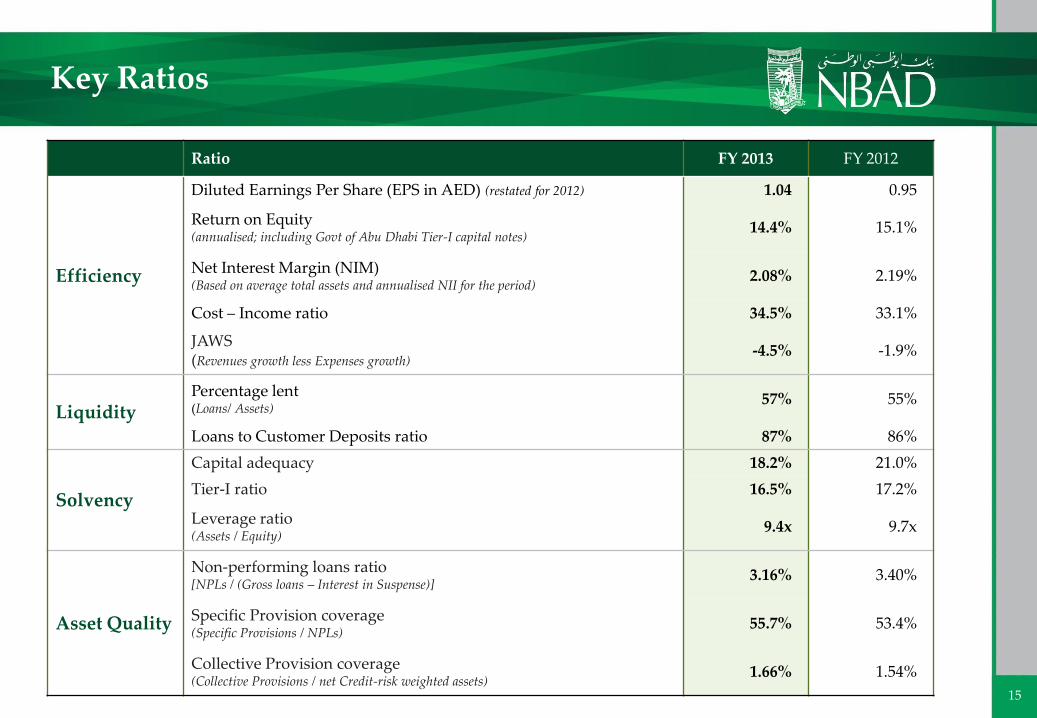
Key Ratios
Ratio FY 2013 FY 2012
Efficiency
Diluted Earnings Per Share (EPS in AED) (restated for 2012) 1.04 0.95
Return on Equity(annualised; including Govt of Abu Dhabi Tier-I capital notes)
14.4% 15.1%
Net Interest Margin (NIM)(Based on average total assets and annualised NII for the period)
2.08% 2.19%
Cost – Income ratio 34.5% 33.1%
JAWS(Revenues growth less Expenses growth)
-4.5% -1.9%
LiquidityPercentage lent(Loans/ Assets)
57% 55%
Loans to Customer Deposits ratio 87% 86%
Solvency
Capital adequacy 18.2% 21.0%
Tier-I ratio 16.5% 17.2%
Leverage ratio(Assets / Equity)
9.4x 9.7x
Asset Quality
Non-performing loans ratio[NPLs / (Gross loans – Interest in Suspense)]
3.16% 3.40%
Specific Provision coverage(Specific Provisions / NPLs)
55.7% 53.4%
Collective Provision coverage(Collective Provisions / net Credit-risk weighted assets)
1.66% 1.54%
16
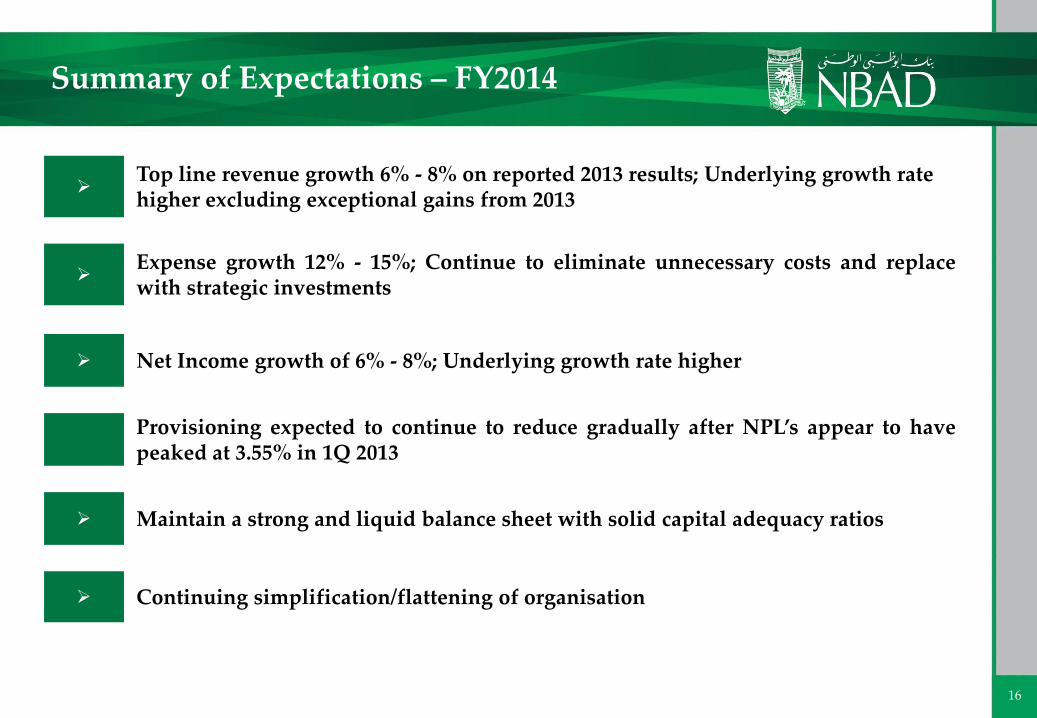
Summary of Expectations – FY2014
Top line revenue growth 6% - 8% on reported 2013 results; Underlying growth rate higher excluding exceptional gains from 2013
Expense growth 12% - 15%; Continue to eliminate unnecessary costs and replacewith strategic investments
Net Income growth of 6% - 8%; Underlying growth rate higher
Provisioning expected to continue to reduce gradually after NPL’s appear to havepeaked at 3.55% in 1Q 2013
Maintain a strong and liquid balance sheet with solid capital adequacy ratios
Continuing simplification/flattening of organisation
17
Corporate access links
Corporate Headquarters:
One NBAD Tower, Sheikh Khalifa StPO Box 4, Abu Dhabi, UAETel : +971-2-6111111Fax : +971-2-6273170Website : http://www.nbad.com
Michael MillerHead – Investor Relations
Abhishek KumatInvestor Relations
Khuloud Al MehairbiInvestor Relations
Ehab KhairiCorporate Communications (Media & PR)
18
Appendix
19
Composition of Non-Interest Income (AED mn)
Fee &
Comm, net
77%
Investments
income
9%
Forex
income
11%
Other
operating
income
3%
Operating Income & Expenses
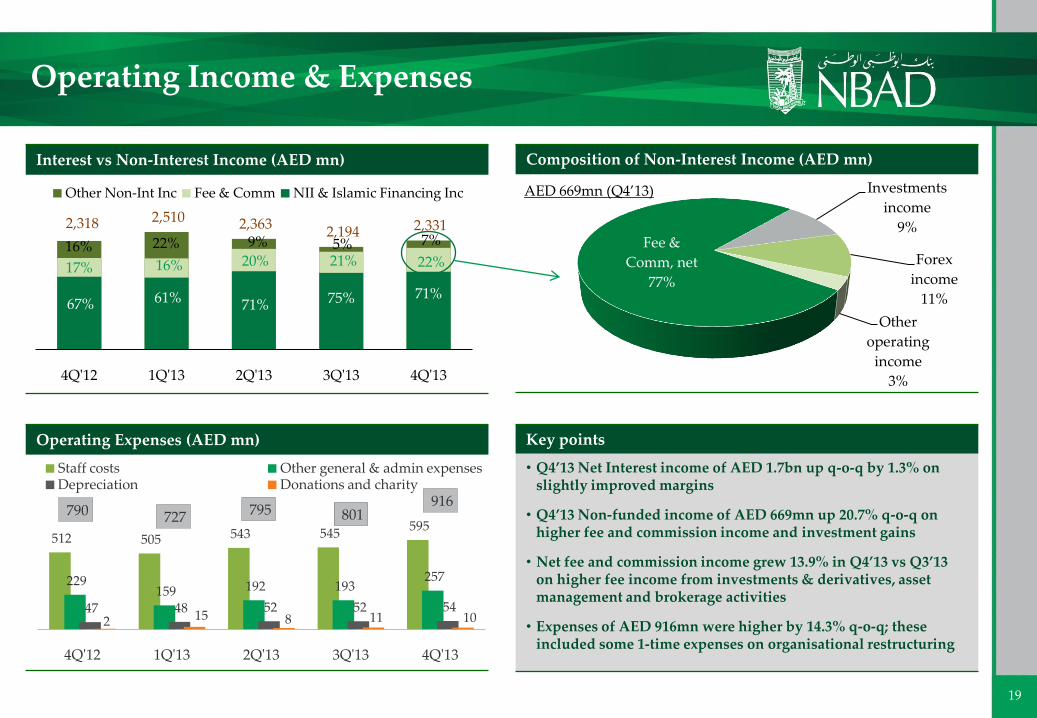
Interest vs Non-Interest Income (AED mn)
2,318 2,510 2,363 2,194 2,331
67% 61% 71% 75% 71%
17% 16% 20% 21% 22%16% 22% 9% 5% 7%
4Q'12 1Q'13 2Q'13 3Q'13 4Q'13
Other Non-Int Inc Fee & Comm NII & Islamic Financing Inc
Operating Expenses (AED mn)
512 505 543 545 595
229 159 192 193
257
47 48 52 52 54 2 15 8 11 10
790 727 795 801 916
4Q'12 1Q'13 2Q'13 3Q'13 4Q'13
Staff costs Other general & admin expensesDepreciation Donations and charity
Key points
• Q4’13 Net Interest income of AED 1.7bn up q-o-q by 1.3% on slightly improved margins
• Q4’13 Non-funded income of AED 669mn up 20.7% q-o-q on higher fee and commission income and investment gains
• Net fee and commission income grew 13.9% in Q4’13 vs Q3’13 on higher fee income from investments & derivatives, asset management and brokerage activities
• Expenses of AED 916mn were higher by 14.3% q-o-q; these included some 1-time expenses on organisational restructuring
AED 669mn (Q4’13)
20
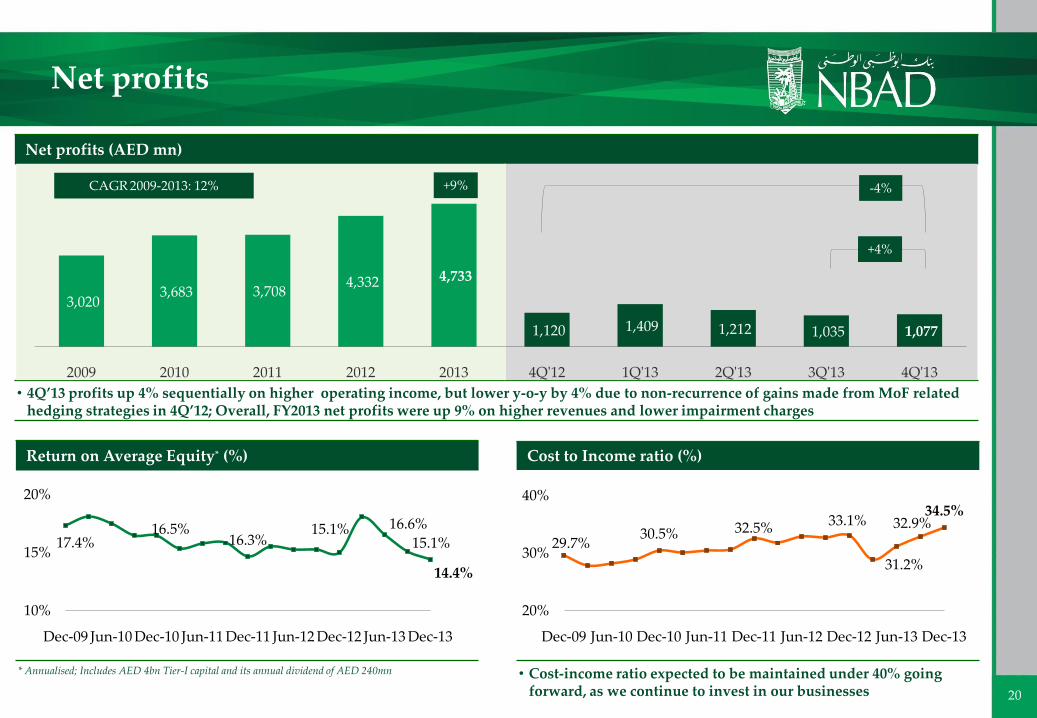
Net profits (AED mn)
• 4Q’13 profits up 4% sequentially on higher operating income, but lower y-o-y by 4% due to non-recurrence of gains made from MoF related hedging strategies in 4Q’12; Overall, FY2013 net profits were up 9% on higher revenues and lower impairment charges
3,020 3,683 3,708
4,332 4,733
1,120 1,409 1,212 1,035 1,077
2009 2010 2011 2012 2013 4Q'12 1Q'13 2Q'13 3Q'13 4Q'13
Cost to Income ratio (%)
• Cost-income ratio expected to be maintained under 40% going forward, as we continue to invest in our businesses
Return on Average Equity* (%)
* Annualised; Includes AED 4bn Tier-I capital and its annual dividend of AED 240mn
Net profits
CAGR 2009-2013: 12%
17.4%16.5%
16.3%15.1% 16.6%
15.1%
14.4%
10%
15%
20%
Dec-09 Jun-10 Dec-10 Jun-11 Dec-11 Jun-12 Dec-12 Jun-13 Dec-13
29.7%30.5% 32.5% 33.1%
31.2%
32.9%34.5%
20%
30%
40%
Dec-09 Jun-10 Dec-10 Jun-11 Dec-11 Jun-12 Dec-12 Jun-13 Dec-13
+9%
+4%
-4%
21
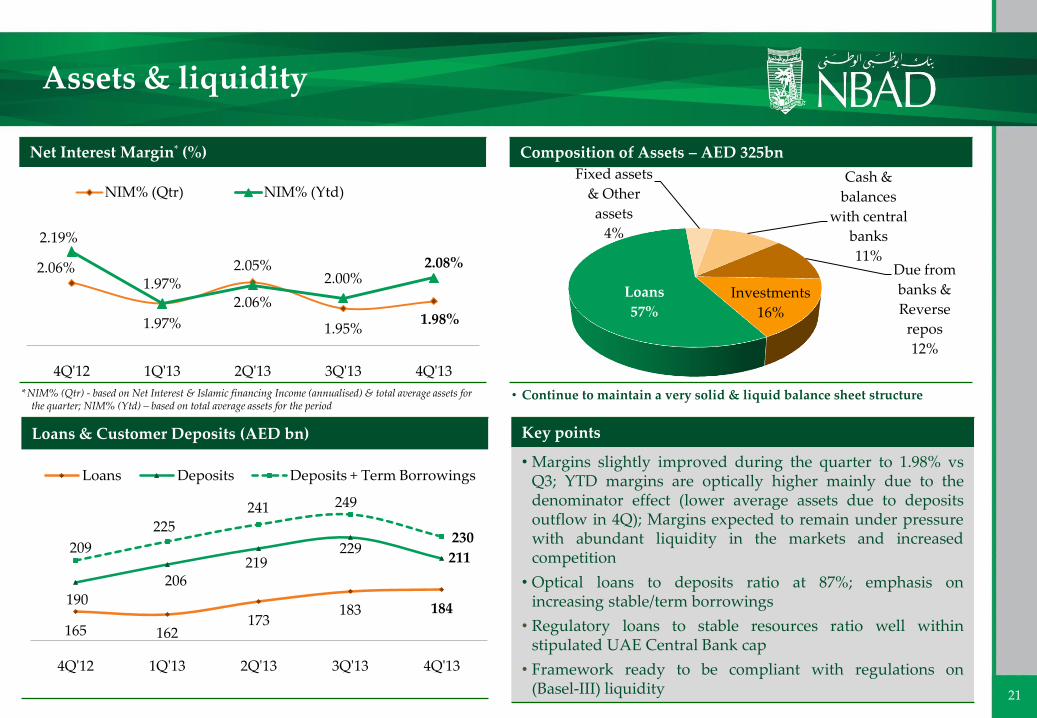
Composition of Assets – AED 325bn
• Continue to maintain a very solid & liquid balance sheet structure
Key points
• Margins slightly improved during the quarter to 1.98% vsQ3; YTD margins are optically higher mainly due to thedenominator effect (lower average assets due to depositsoutflow in 4Q); Margins expected to remain under pressurewith abundant liquidity in the markets and increasedcompetition
• Optical loans to deposits ratio at 87%; emphasis onincreasing stable/term borrowings
• Regulatory loans to stable resources ratio well withinstipulated UAE Central Bank cap
• Framework ready to be compliant with regulations on(Basel-III) liquidity
Loans & Customer Deposits (AED bn)
Net Interest Margin* (%)
* NIM% (Qtr) - based on Net Interest & Islamic financing Income (annualised) & total average assets for the quarter; NIM% (Ytd) – based on total average assets for the period
Assets & liquidity
2.06%
1.97%
2.06%
1.95%1.98%
2.19%
1.97%2.05%
2.00%2.08%
4Q'12 1Q'13 2Q'13 3Q'13 4Q'13
NIM% (Qtr) NIM% (Ytd)Cash &
balances
with central
banks
11%Due from
banks &
Reverse
repos
12%
Investments
16%
Loans
57%
Fixed assets
& Other
assets
4%
165 162173
183 184190
206219
229211
209
225
241 249
230
4Q'12 1Q'13 2Q'13 3Q'13 4Q'13
Loans Deposits Deposits + Term Borrowings
22
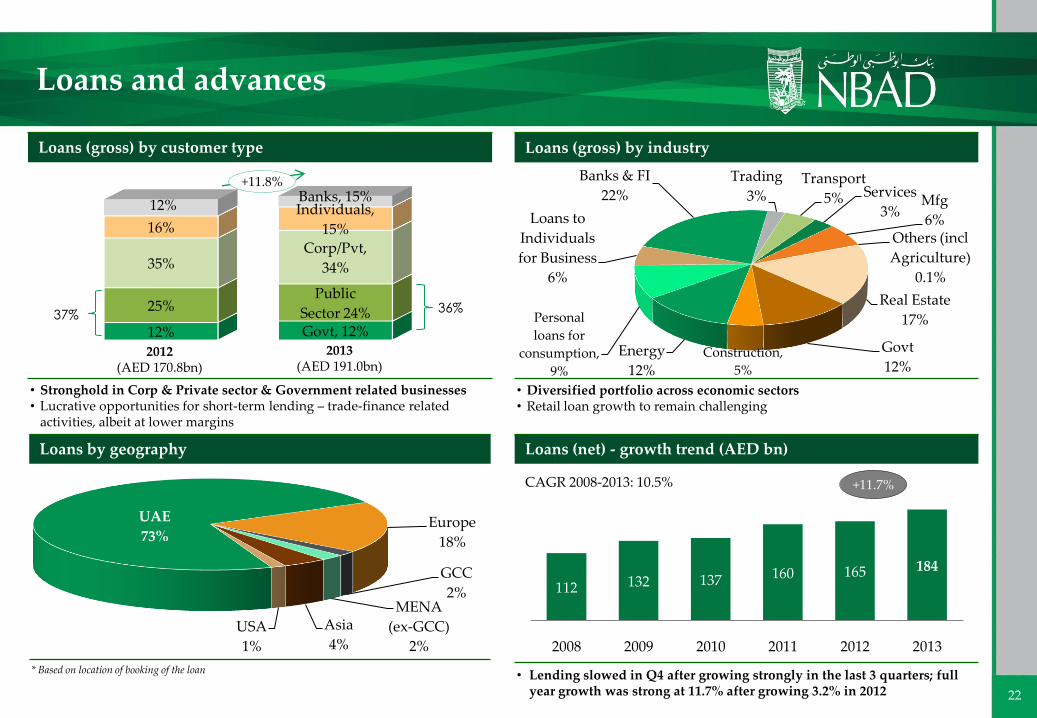
Loans (net) - growth trend (AED bn)
CAGR 2008-2013: 10.5%
• Lending slowed in Q4 after growing strongly in the last 3 quarters; full year growth was strong at 11.7% after growing 3.2% in 2012
112 132 137 160 165 184
2008 2009 2010 2011 2012 2013
Loans (gross) by customer type
• Stronghold in Corp & Private sector & Government related businesses• Lucrative opportunities for short-term lending – trade-finance related
activities, albeit at lower margins
Loans (gross) by industry
• Diversified portfolio across economic sectors• Retail loan growth to remain challenging
Loans by geography
* Based on location of booking of the loan
Loans and advances
UAE
73%Europe
18%
GCC
2%MENA
(ex-GCC)
2%
Asia
4%USA
1%
Real Estate
17%
Govt
12%Construction,
5%
Energy
12%
Personal
loans for
consumption,
9%
Loans to
Individuals
for Business
6%
Banks & FI
22%
Trading
3%Transport
5% Services
3%Mfg
6%Others (incl
Agriculture)
0.1%
Govt, 12%12%
Public
Sector 24%25%
Corp/Pvt,
34%35%
Individuals,
15%16%
Banks, 15%12%
+11.8%
2012(AED 170.8bn)
2013(AED 191.0bn)
37%36%
+11.7%
23
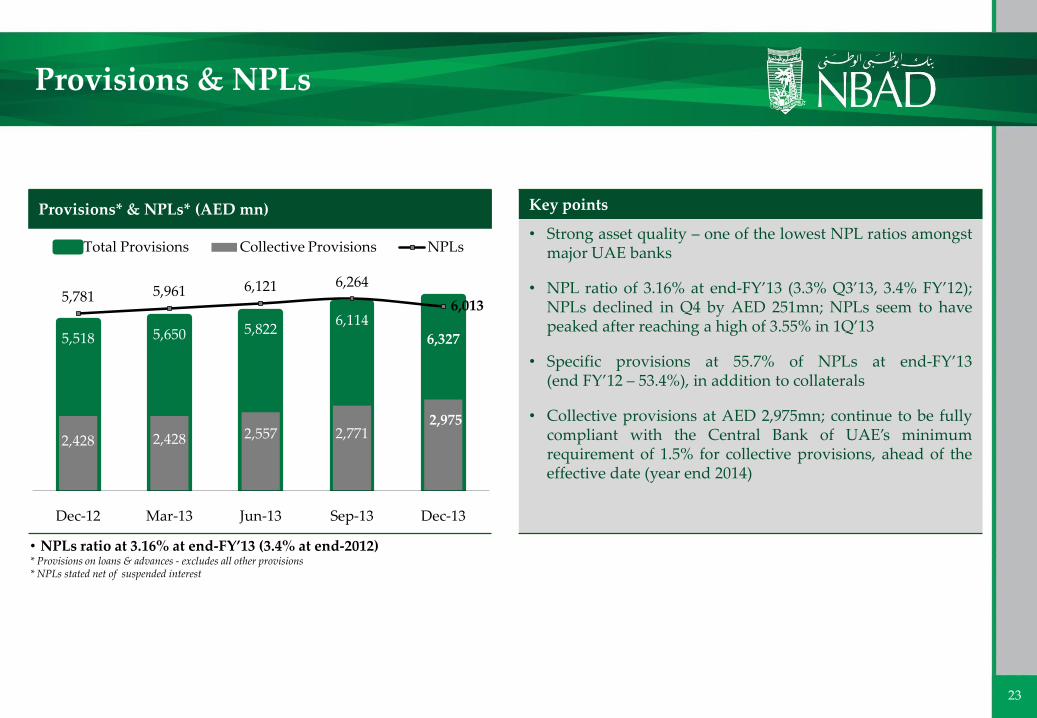
Provisions* & NPLs* (AED mn)
• NPLs ratio at 3.16% at end-FY’13 (3.4% at end-2012)* Provisions on loans & advances - excludes all other provisions* NPLs stated net of suspended interest
Provisions & NPLs
Key points
• Strong asset quality – one of the lowest NPL ratios amongstmajor UAE banks
• NPL ratio of 3.16% at end-FY’13 (3.3% Q3’13, 3.4% FY’12);NPLs declined in Q4 by AED 251mn; NPLs seem to havepeaked after reaching a high of 3.55% in 1Q’13
• Specific provisions at 55.7% of NPLs at end-FY’13(end FY’12 – 53.4%), in addition to collaterals
• Collective provisions at AED 2,975mn; continue to be fullycompliant with the Central Bank of UAE’s minimumrequirement of 1.5% for collective provisions, ahead of theeffective date (year end 2014)
5,518 5,650 5,8226,114
6,327
2,428 2,428 2,557 2,7712,975
5,781 5,961 6,121 6,264
6,013
Dec-12 Mar-13 Jun-13 Sep-13 Dec-13
Total Provisions Collective Provisions NPLs
24
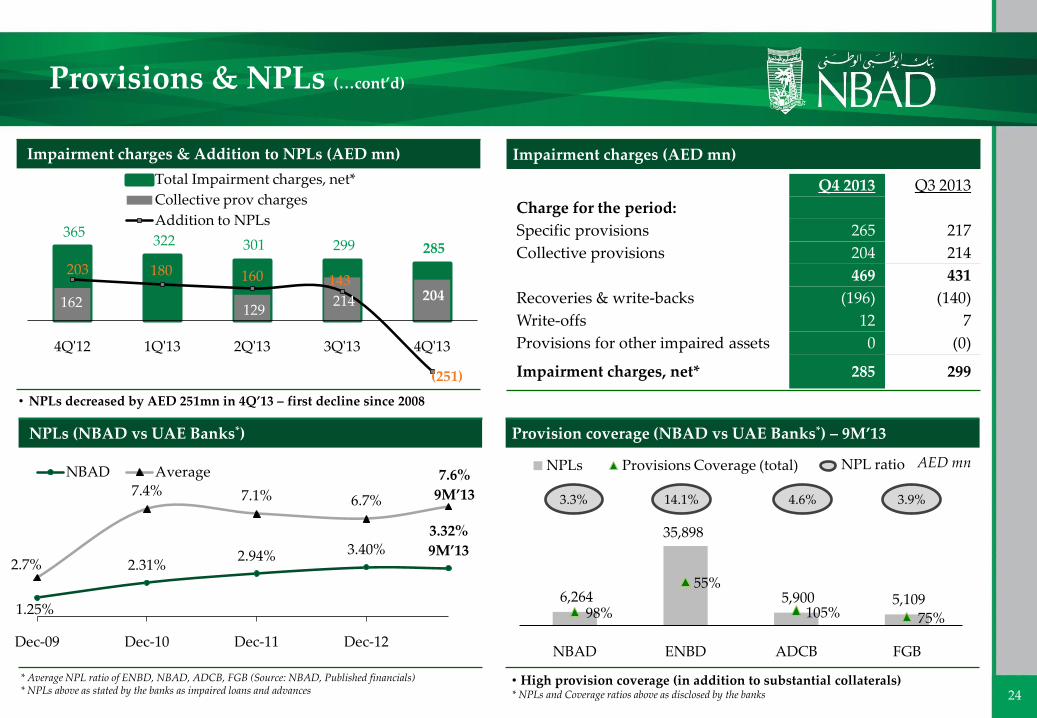
NPLs (NBAD vs UAE Banks*)
* Average NPL ratio of ENBD, NBAD, ADCB, FGB (Source: NBAD, Published financials)* NPLs above as stated by the banks as impaired loans and advances
Provisions & NPLs (…cont’d)
Provision coverage (NBAD vs UAE Banks*) – 9M’13
• High provision coverage (in addition to substantial collaterals)* NPLs and Coverage ratios above as disclosed by the banks
6,264
35,898
5,900 5,109 98%
55%
105% 75%
NBAD ENBD ADCB FGB
NPLs Provisions Coverage (total) AED mn
1.25%
2.31%2.94% 3.40%
3.32%
9M’132.7%
7.4% 7.1% 6.7%
7.6%
9M’13
Dec-09 Dec-10 Dec-11 Dec-12
NBAD Average
Impairment charges & Addition to NPLs (AED mn)
• NPLs decreased by AED 251mn in 4Q’13 – first decline since 2008
Impairment charges (AED mn)
Q4 2013 Q3 2013
Charge for the period:
Specific provisions 265 217
Collective provisions 204 214
469 431
Recoveries & write-backs (196) (140)
Write-offs 12 7
Provisions for other impaired assets 0 (0)
Impairment charges, net* 285 299
365 322 301 299 285
162
-
129 214 204
203 180 160 143
(251)
4Q'12 1Q'13 2Q'13 3Q'13 4Q'13
Total Impairment charges, net*
Collective prov charges
Addition to NPLs
3.3% 14.1% 4.6% 3.9%
NPL ratio
25
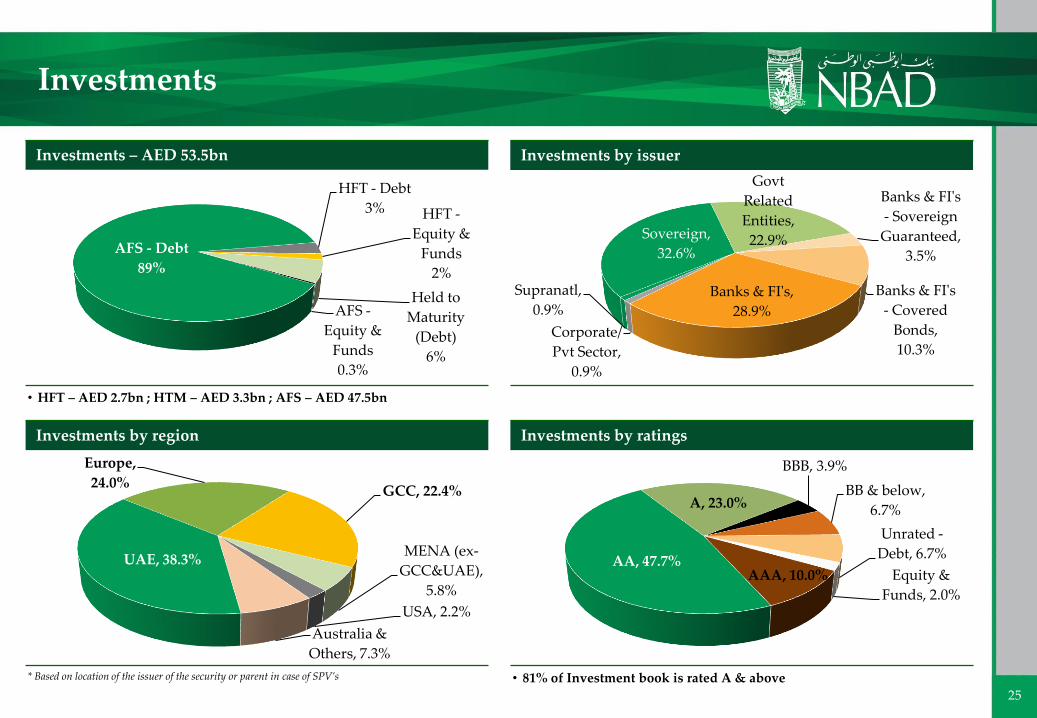
Investments – AED 53.5bn
• HFT – AED 2.7bn ; HTM – AED 3.3bn ; AFS – AED 47.5bn
HFT - Debt
3% HFT -
Equity &
Funds
2%
Held to
Maturity
(Debt)
6%
AFS -
Equity &
Funds
0.3%
AFS - Debt
89%
Investments by issuer
Investments by ratings
• 81% of Investment book is rated A & above
Investments by region
* Based on location of the issuer of the security or parent in case of SPV’s
Investments
Sovereign,
32.6%
Govt
Related
Entities,
22.9%
Banks & FI's
- Sovereign
Guaranteed,
3.5%
Banks & FI's
- Covered
Bonds,
10.3%
Banks & FI's,
28.9%
Corporate/
Pvt Sector,
0.9%
Supranatl,
0.9%
Europe,
24.0%GCC, 22.4%
MENA (ex-
GCC&UAE),
5.8%
USA, 2.2%
Australia &
Others, 7.3%
UAE, 38.3%AAA, 10.0%
AA, 47.7%
A, 23.0%
BBB, 3.9%
BB & below,
6.7%
Unrated -
Debt, 6.7%
Equity &
Funds, 2.0%
26
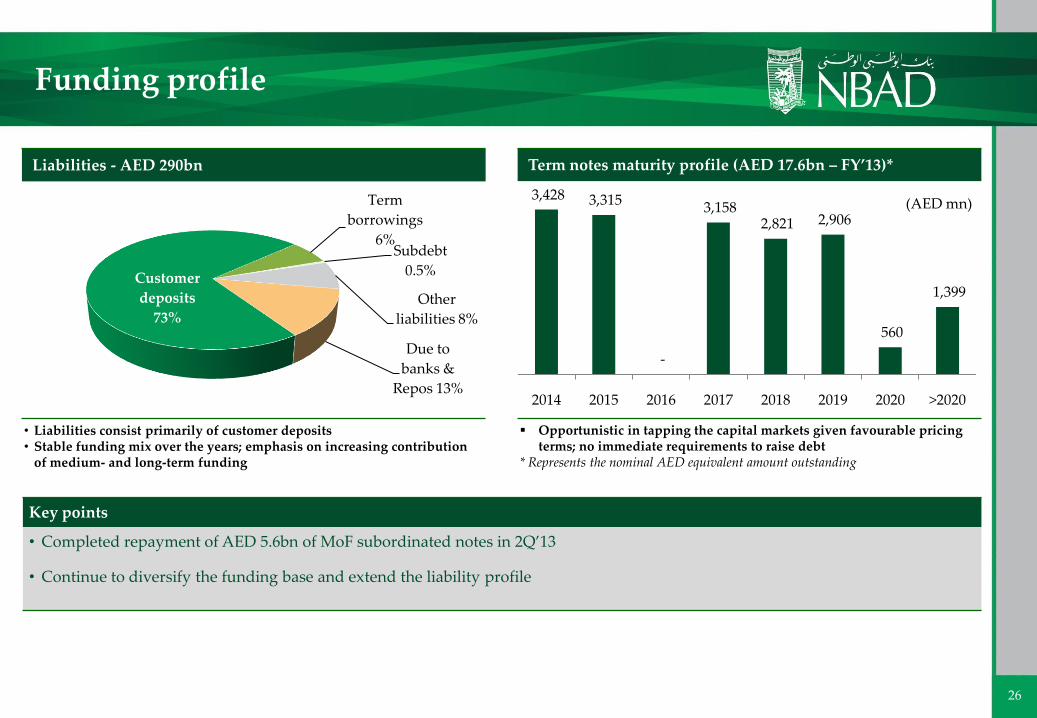
Term notes maturity profile (AED 17.6bn – FY’13)*
Opportunistic in tapping the capital markets given favourable pricing terms; no immediate requirements to raise debt
* Represents the nominal AED equivalent amount outstanding
Key points
• Completed repayment of AED 5.6bn of MoF subordinated notes in 2Q’13
• Continue to diversify the funding base and extend the liability profile
Funding profile
Liabilities - AED 290bn
• Liabilities consist primarily of customer deposits• Stable funding mix over the years; emphasis on increasing contribution
of medium- and long-term funding
3,428 3,315
-
3,158 2,821 2,906
560
1,399
2014 2015 2016 2017 2018 2019 2020 >2020
(AED mn)
Due to
banks &
Repos 13%
Customer
deposits
73%
Term
borrowings
6%Subdebt
0.5%
Other
liabilities 8%
27
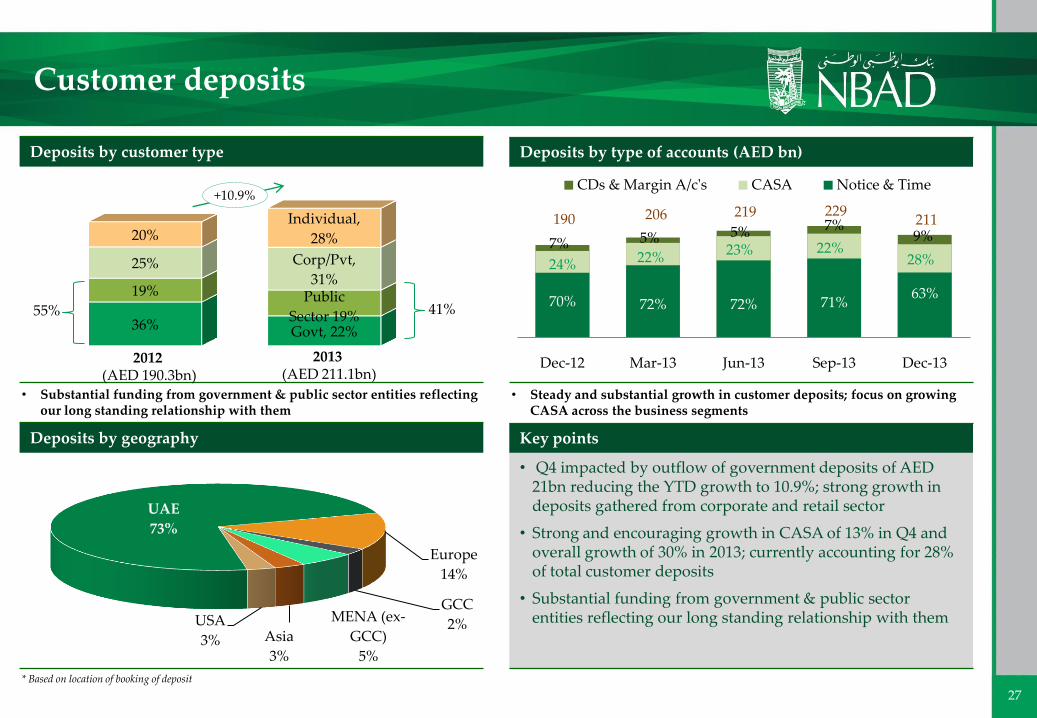
Key points
• Q4 impacted by outflow of government deposits of AED 21bn reducing the YTD growth to 10.9%; strong growth in deposits gathered from corporate and retail sector
• Strong and encouraging growth in CASA of 13% in Q4 and overall growth of 30% in 2013; currently accounting for 28% of total customer deposits
• Substantial funding from government & public sector entities reflecting our long standing relationship with them
Deposits by customer type
• Substantial funding from government & public sector entities reflecting our long standing relationship with them
Govt, 22%36%
Public
Sector 19%
19%
Corp/Pvt,
31% 25%
Individual,
28%20%
Customer deposits
+10.9%
Deposits by type of accounts (AED bn)
• Steady and substantial growth in customer deposits; focus on growing CASA across the business segments
2012 (AED 190.3bn)
2013 (AED 211.1bn)
55% 41%
Deposits by geography
* Based on location of booking of deposit
UAE
73%
Europe
14%
GCC
2%MENA (ex-
GCC)
5%
Asia
3%
USA
3%
190 206 219 229 211
70% 72% 72% 71%63%
24% 22%23% 22%
28%7% 5% 5% 7%
9%
Dec-12 Mar-13 Jun-13 Sep-13 Dec-13
CDs & Margin A/c's CASA Notice & Time
28
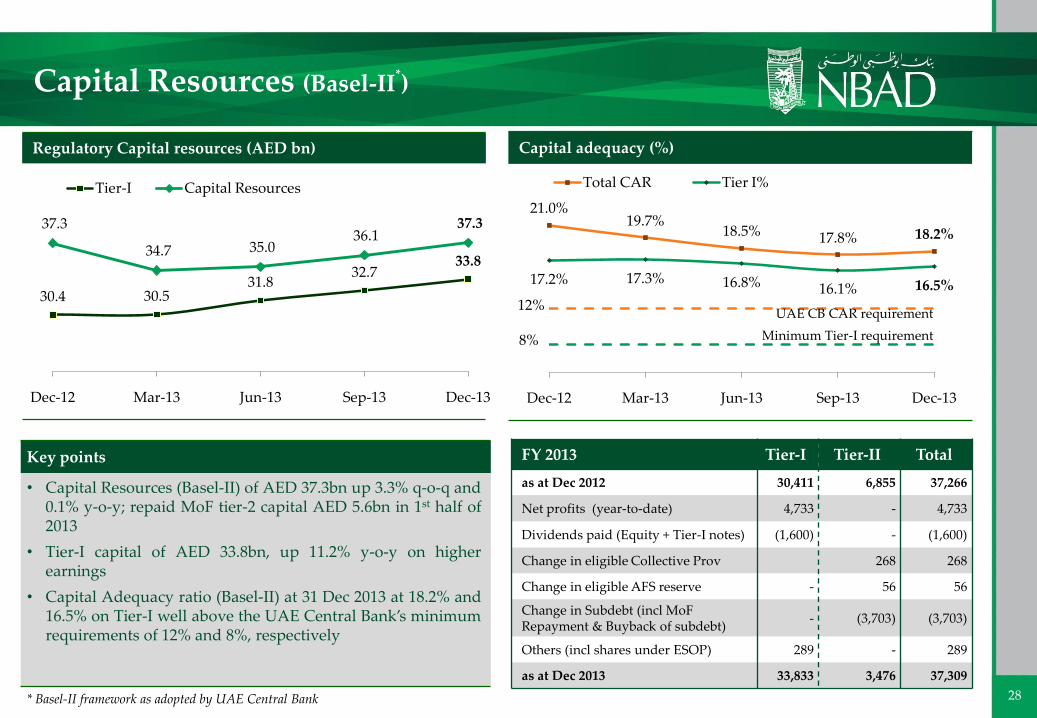
Regulatory Capital resources (AED bn)
30.4 30.5 31.8
32.7 33.8
37.3
34.7 35.0 36.1
37.3
Dec-12 Mar-13 Jun-13 Sep-13 Dec-13
Tier-I Capital Resources
Capital adequacy (%)
21.0%19.7%
18.5% 17.8% 18.2%
17.2% 17.3% 16.8% 16.1% 16.5%
8%
12%
Dec-12 Mar-13 Jun-13 Sep-13 Dec-13
Total CAR Tier I%
Capital Resources (Basel-II*)
UAE CB CAR requirement
Minimum Tier-I requirement
Key points
• Capital Resources (Basel-II) of AED 37.3bn up 3.3% q-o-q and0.1% y-o-y; repaid MoF tier-2 capital AED 5.6bn in 1st half of2013
• Tier-I capital of AED 33.8bn, up 11.2% y-o-y on higherearnings
• Capital Adequacy ratio (Basel-II) at 31 Dec 2013 at 18.2% and16.5% on Tier-I well above the UAE Central Bank’s minimumrequirements of 12% and 8%, respectively
* Basel-II framework as adopted by UAE Central Bank
FY 2013 Tier-I Tier-II Total
as at Dec 2012 30,411 6,855 37,266
Net profits (year-to-date) 4,733 - 4,733
Dividends paid (Equity + Tier-I notes) (1,600) - (1,600)
Change in eligible Collective Prov 268 268
Change in eligible AFS reserve - 56 56
Change in Subdebt (incl MoF Repayment & Buyback of subdebt)
- (3,703) (3,703)
Others (incl shares under ESOP) 289 - 289
as at Dec 2013 33,833 3,476 37,309
29
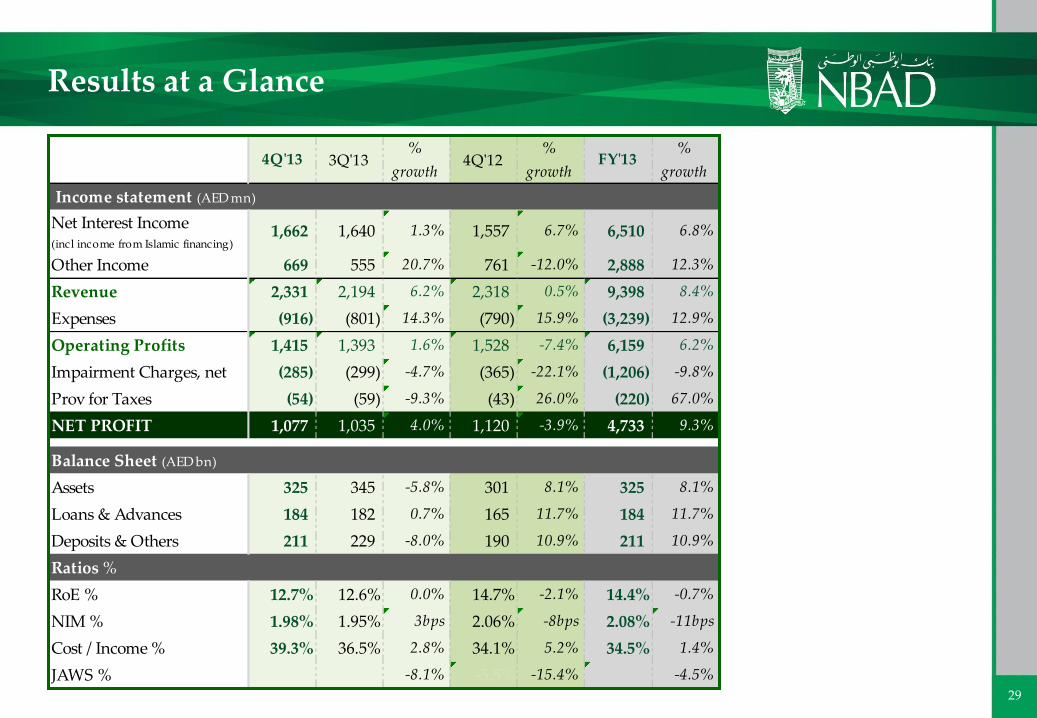
Results at a Glance
4Q'13 3Q'13%
growth4Q'12
%
growthFY'13
%
growth
Income statement (AED mn)
Net Interest Income (incl income from Islamic financing)
1,662 1,640 1.3% 1,557 6.7% 6,510 6.8%
Other Income 669 555 20.7% 761 -12.0% 2,888 12.3%
Revenue 2,331 2,194 6.2% 2,318 0.5% 9,398 8.4%
Expenses (916) (801) 14.3% (790) 15.9% (3,239) 12.9%
Operating Profits 1,415 1,393 1.6% 1,528 -7.4% 6,159 6.2%
Impairment Charges, net (285) (299) -4.7% (365) -22.1% (1,206) -9.8%
Prov for Taxes (54) (59) -9.3% (43) 26.0% (220) 67.0%
NET PROFIT 1,077 1,035 4.0% 1,120 -3.9% 4,733 9.3%
Balance Sheet (AED bn)
Assets 325 345 -5.8% 301 8.1% 325 8.1%
Loans & Advances 184 182 0.7% 165 11.7% 184 11.7%
Deposits & Others 211 229 -8.0% 190 10.9% 211 10.9%
Ratios %
RoE % 12.7% 12.6% 0.0% 14.7% -2.1% 14.4% -0.7%
NIM % 1.98% 1.95% 3bps 2.06% -8bps 2.08% -11bps
Cost / Income % 39.3% 36.5% 2.8% 34.1% 5.2% 34.5% 1.4%
JAWS % -8.1% -5.5% -15.4% -4.5% -4.5%
30
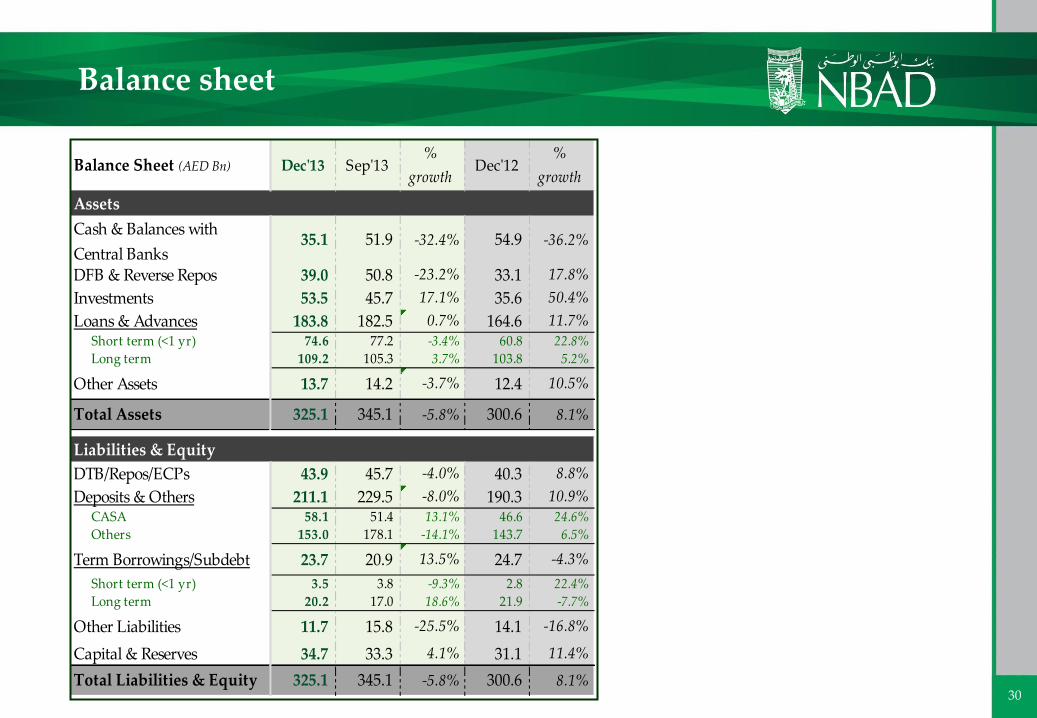
Balance sheet
Balance Sheet (AED Bn) Dec'13 Sep'13%
growthDec'12
%
growth
Assets
Cash & Balances with
Central Banks35.1 51.9 -32.4% 54.9 -36.2%
DFB & Reverse Repos 39.0 50.8 -23.2% 33.1 17.8%
Investments 53.5 45.7 17.1% 35.6 50.4%
Loans & Advances 183.8 182.5 0.7% 164.6 11.7%Short term (<1 yr) 74.6 77.2 -3.4% 60.8 22.8%
Long term 109.2 105.3 3.7% 103.8 5.2%
Other Assets 13.7 14.2 -3.7% 12.4 10.5%
Total Assets 325.1 345.1 -5.8% 300.6 8.1%
Liabilities & Equity
DTB/Repos/ECPs 43.9 45.7 -4.0% 40.3 8.8%
Deposits & Others 211.1 229.5 -8.0% 190.3 10.9%CASA 58.1 51.4 13.1% 46.6 24.6%
Others 153.0 178.1 -14.1% 143.7 6.5%
Term Borrowings/Subdebt 23.7 20.9 13.5% 24.7 -4.3%
Short term (<1 yr) 3.5 3.8 -9.3% 2.8 22.4%
Long term 20.2 17.0 18.6% 21.9 -7.7%
Other Liabilities 11.7 15.8 -25.5% 14.1 -16.8%
Capital & Reserves 34.7 33.3 4.1% 31.1 11.4%
Total Liabilities & Equity 325.1 345.1 -5.8% 300.6 8.1%
31
The information contained herein has been prepared by National Bank of Abu Dhabi P.J.S.C (“NBAD”). NBAD relies on
information obtained from sources believed to be reliable but does not guarantee its accuracy or completeness.
This presentation has been prepared for information purposes only and is not and does not form part of any offer for sale
or solicitation of any offer to subscribe for or purchase or sell any securities nor shall it or any part of it form the basis of or
be relied on in connection with any contract or commitment whatsoever.
Some of the information in this presentation may contain projections or other forward-looking statements regarding future
events or the future financial performance of NBAD. These forward-looking statements include all matters that are not
historical facts. The inclusion of such forward-looking information shall not be regarded as a representation by NBAD or
any other person that the objectives or plans of NBAD will be achieved. NBAD undertakes no obligation to publicly
update or publicly revise any forward-looking statement, whether as a result of new information, future events or
otherwise.
Disclaimer

32
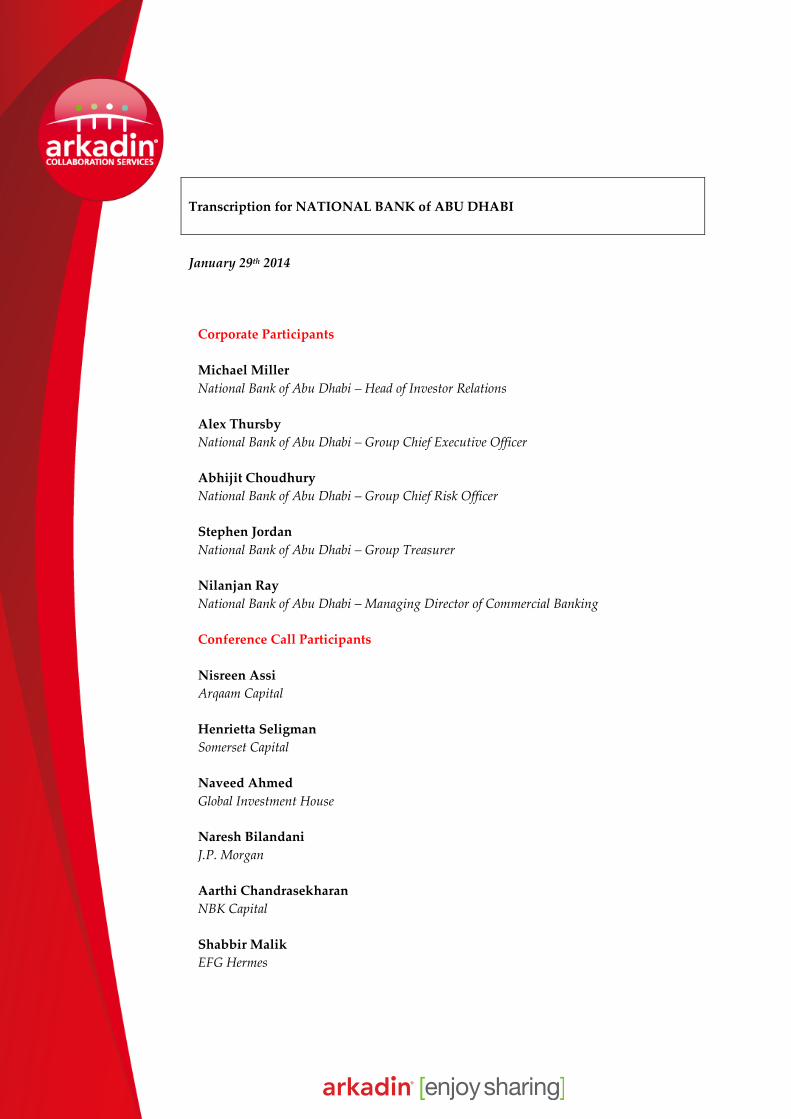
Transcription for NATIONAL BANK of ABU DHABI
January 29th 2014
Corporate Participants
Michael Miller
National Bank of Abu Dhabi – Head of Investor Relations
Alex Thursby
National Bank of Abu Dhabi – Group Chief Executive Officer
Abhijit Choudhury
National Bank of Abu Dhabi – Group Chief Risk Officer
Stephen Jordan
National Bank of Abu Dhabi – Group Treasurer
Nilanjan Ray
National Bank of Abu Dhabi – Managing Director of Commercial Banking
Conference Call Participants
Nisreen Assi
Arqaam Capital
Henrietta Seligman
Somerset Capital
Naveed Ahmed
Global Investment House
Naresh Bilandani
J.P. Morgan
Aarthi Chandrasekharan
NBK Capital
Shabbir Malik
EFG Hermes
Presentation
Operator
Good afternoon, ladies and gentlemen, and welcome to NBAD Full Year 2013
Earnings Results Conference Call. I will now hand over the call to Michael Miller,
Head of Investor Relations at NBAD. Sir, you may begin.
Michael Miller
Good afternoon and welcome to NBAD’s Fourth Quarter and Full Year 2013 Results
call. Today, Alex Thursby, our Group Chief Executive Officer, will provide some
highlights from the fourth quarter and full year 2013. As part of our on-going effort
to continue to update you on our strategic vision for the Bank, we will then have
Nilanjan Ray, Managing Director of Commercial Banking, speak a bit about the
opportunities he sees in Commercial Banking and his strategy to capitalise on the
opportunity. After Nilanjan’s opening remarks, I will provide an overview of the
results for the fourth quarter and full year of 2013, before turning it over once again
to Alex, who will give over our guidance for 2014.
During the call, we will be referring to our investor presentation, which is available
on the IR portion of our website. Following the prepared remarks, we will open the
lines for Q&A. For that portion of the call, we will also have in the room, Abhijit
Choudhury, our Group Chief Risk Officer, Steven Jordan, our Group Treasurer, and
Rohit Kumar, Head of Group Independent Risk.
Now, I will turn it over to Alex.
Alex Thursby
Thank you Michael and welcome to our annual result call and obviously our
quarterly fourth quarter earnings call.
I said right at the outset some 6.5 months ago that we were creating a new strategy
and that strategy has now started its execution, and particularly in our fourth
quarter, we are starting to see the first, but slightly small steps, as we execute this
strategy, which I believe will differentiate us from other banks not only in terms of
what we do and how we do it, but the results of what we do.
If I may really just focus on the year’s results firstly in terms of the net earnings, I'd
like to say that it’s a good result, but there is room for improvement, and when you
look at our quarter-on-quarter results, you are starting to see that we are building
momentum, as I said, within the line of the strategy. I also want to emphasise that
particularly our revenue lines are now normalised, generally normalised, from
where they were in the first and second quarter of 2013. What you now see is the
underlying core business that really is reflective of where we’re positioned and it’s
where you should model from.
What is particularly pleasing that as we start to build our flow businesses across all
businesses (Wealth, Retail, Commercial, and Wholesale), we’re starting to see the
beginnings of that flow coming through in terms of the non-funded revenue. Year-
on-year, we grew some 20% in net fees to about 1.85 billion, but sequentially I think
it’s very impressive. We grew some 14% quarter three to quarter four and this is
deliberate, and we are hoping that our strategy of building fee revenues and
building flow businesses from all of our business that this will continue to grow
going forward.
Our loan growth at the headline doesn’t look as strong as it did in the third quarter
and I do recollect in saying to you that we are starting to see momentum. I do want
to highlight to you that while it’s at 12% year-on-year, and that looks favourable to
the market, we are only 0.7% sequentially. However, I've got to also highlight to
you that we had – well, we actually had two major pay-outs of which one went to
the equity side in the vicinity of mid billions of Dirhams. Underlying that, most of
our businesses are continuing to grow well in the assets that we choose to bank and
we’re moving towards. Trade was reasonably successful, although our short-term
loans were slightly down in some of the other product areas.
Now, let me move onto deposits. Going ahead, we wish to grow our deposits at
reasonable levels similar to our asset side, so that we can run a continuous and
conservative balance sheet. Year-on-year, we saw 11% growth; clearly, versus the
third quarter where we had a lot of Government funds, which has now moved on,
for a period of time, we have dropped and you’ve seen that in the sequential
movement. I do hasten to add though that this appears to be looking seasonal when
compared certainly to the same period last year versus prior quarters. What I am
very happy about, though, is to that our CASA, one of the key product areas that
we’re looking to develop, again through all of our businesses, but predominantly
our Retail and Wealth, and Retail and Commercial, and as we get our Cash
Management product up and running through our Wholesale, we’re beginning to
see very strong growth year-on-year, but we sequentially have also seen 13%
growth. There were a couple of one-offs in there, but even stripping those out, the
underlying growth continues and this will be the core foundation of our strategy.
We are well provisioned. You'll see that our NPLs have dropped from year-to-year
and, clearly, have moved off their peaks of Q1 of 2013.
Capital-wise, we remain very strong and that is very important to us as we move
forward and wish to retain our rating, and our liquidity position remained strong
despite the loss of some of those Government deposits.
I'd like to say that we have in the quarter I think won the fourth round on our own
points and that we believe that our strategy is beginning to take effect. It’s still early
days, but it is moving forward.
I won't dwell too much on page four, as I think they're relatively self-explanatory,
but just to quickly dwell on page five, where I will give you a little bit of the update.
As you remember, we in July had the high-level strategy, which we have obviously
spoken to you about, approved by the Board. Subsequent to this, we now have
approved five-year business plans for our Wholesale Banking, Global Wealth, and
Retail and Commercial. These plans are very bottom-up and are highly numeric,
but also high around what is this that we have to execute and by when. There is still
a little bit more clarification, but I want to assure you that we will give you more
detail of this not only today, but also when we do our small road show potentially at
the Investor Forum. This also includes capital movements and it does indicate that
we will expand in a manner, which will throw off capital for our expansion and
allow us to pay reasonable to good dividends. This is important, as I see the
business being built in a way, in a paced way that allows us to grow from one-self
rather than having to make capital calls. I will never say that we won't make a
capital call, but at this stage it looks unlikely.
We have also improved our trade businesses, foreign exchange businesses, and
wealth businesses have focused on some quick wins that we see being critical for us
through to at least the middle of this year before all of our strategic initiatives take a
meaningful grip. Those quick wins I'd hasten to add are built around flow products
predominantly.
We have a number of what I would call ‘building our spine’ activities going on,
including the build-out of a number of systems etc, of which we finished some eight
projects. We are expecting to release our first version of our new cash management
system somewhere in the vicinity of late-March/mid-April and look on line for that.
We’re also putting our core banking system into Egypt and that, again, would be in
the period of late-March to possible late-April, depending on where we can get clean
dates for what is obviously a critical swap over for the existing systems.
What we are trying to build in our systems is common platforms across our major
product groups and clearly our core banking platform and this is moving forward,
and forward at a relatively good rate to what I first expected when I first joined the
Bank.
The activity of the Bank is changing dramatically. The performance, management,
the size of the Bank is changing dramatically. This is essential, as we now move into
the hard-core delivery and execution of our strategies. I am pleased with the quarter
four results and they look positive relative to building more momentum in the
business in the new year. I will obviously talk a little bit more about this when we
talk to the guidance near the end of the presentation.
Michael, back to you, sir, and then obviously, Nilanjan.
Michael Miller
Yes, we have Nilanjan , who will give us a review of the Commercial Banking
business for some of the opportunities there.
Nilanjan Ray
Good afternoon. We believe our Commercial Banking has a great deal of potential
as we see it today. We have a relatively small business and a small revenue market
share of the UAE market across both the mid-corporates and the SME segments. We
do have a strong presence in this segment in Abu Dhabi, but less so in Dubai and
Northern Emirates, which also accounts for a large part of the Commercial Banking
wallet.
We have our large existing customers, which we have not fully capitalised on, and
we do see a lot of linkages across Retail and Wealth customers to be able to to be
able to leveragefor Commercial. We are working on to improve our level of fee-
based revenue related to the industry best practice and this remains an area of focus
for our five-year plan that Alex mentioned about.
We are looking at this segment from two sub-segment perspectives:
1) The local mid-corporates and corporates, who have international trade and
banking needs
2) The SMEs
We are deploying a hunter and farmer model around this segment by deploying
sales and community bankers, who will focus to tap the SME, who, at the last
information, were almost close to a million number alone.
In terms of geographical strategy, we want to initially focus in 2014 and 2015
becoming a dominant player in the Commercial Banking segment in UAE, with
selected efforts in Oman, primarily to meet regulatory requirement and perhaps
some select opportunities. Thereafter, we’d like to focus on the key franchise market
for NBAD in line with the overarching West-East Corridor strategy and we are
looking at markets like Egypt and Malaysia; however, this will be crystallised as we
go over implementing the strategy. We would also look at selective build-out in
GCC markets in the third or fourth year of the plan.
In terms of our value proposition, we have a three-pillar value proposition to deliver
across geography, industry, and products. We talked about geography and the
within UAE will be across our large branch networks, so that we are there as a
community delivering Commercial Banking services, and a few differentiators than
the competition.
In terms of industry, we have some focus sectors that we identified that we have
identified, which we believe have good risk and revenue profiles, as well as a critical
mass in UAE market and we will focus on them. We’d like to expand our trading
desk portfolio where we believe we are underweight and at the same time, we are
investing significantly in hiring bankers, who will be well versed with the industry
language. We are right now developing on the world class trade, FX, and cash
management offering, and we mentioned about the systems before that we support
this. We will continue to focus on the different segments and also deliver industry-
specific solutions as we go forward.
Our operating model requires us to be present across 26 branches on the Retail side,
where we serve the community and also supplement that with outbound sales. Our
mid-market and the MNC segment will be covered out of four major hubs across
UAE; these are supported by a centralised service unit as well as the enablement
functions, which are largely shared across other areas of the Bank to keep costs
down.
Alex Thursby
I would just like to reiterate a couple of very important points here. We are a small
player in this niche segment relative to the market. We believe it’s a lucrative
market, but we believe that we have to focus on certain types of customers that align
us to our product capabilities that we are building for not only the Commercial, but
the Wholesale sector. The specialisation is similar, but not totally the same in terms
of focus segments; again, it’s an approach where we’re not trying to win every
Commercial customer in the UAE, but we believe that these are the segments that
give us the ability to grow the products that we want to grow, which we believe in
the long run makes us a less risk-orientated bank and, at the same time, breeding a
flow and cross-sell potential. This is essential.
We have very strong ambitions in this business, of which you’ve just seen a little bit
of our strategy, and we believe that we are beginning to get well positioned to
attack. The hiring has started, the build-outs have started, and I am very pleased to
see what we have really done in the last six or seven weeks in this sector from a very
small base.
On that note, sir, Michael, if you could take on the next part of the results
Michael Miller
Again, our performance in the fourth quarter reflected a continuation of the
momentum we saw in the third quarter, and in particular we continued to see
healthy growth in non-interest income, particularly in fees and commissions, growth
in capital, which is very much in line with our strategy for this part of the business.
Now, turning to page 11, operating revenue grew 6% sequentially and 8% on a full
year basis compared with 2012. The growth was driven primarily by growth in fees
and commissions, which were up 14% sequentially and up 20% year-on-year; also,
impacting sequential growth were higher net investment gains, which were 62
million in Q4 versus 9 million in Q3.
Operating expenses were up 13% sequentially and 13% for the full year. The
increase was due to investments we were making in our business, as well as our
reorganisation efforts. Please note, there were some one-time expenses in the fourth
quarter, which we did not expect to repeat, and we will provide expectations for
expense growth in 2014 a little later in the presentation.
Impairment charges were 285 million in the fourth quarter and more importantly
1.206 billion for the full year of 2013, reflecting a decrease of 5% sequentially and
down 10% for the full year respectively, as we continued to see positive trend.
Net profits were 1.077 billion in Q4, up 4% sequentially and full year earnings were
AED 4.733 billion, growing 9% in 2013. This growth reflects the solid trends we are
seeing in revenue growth and impairment trends, slightly offset by higher expenses,
as we invest in the Bank.
Now, turning to the balance sheet on page 12, assets ended the year at 325 billion,
declining 6% sequentially due to outflows of some Government deposits in the
fourth quarter. For the full year, assets were up 8% as loans and deposits grew.
Equity grew 4% sequentially to 34.7 billion in the fourth quarter and 11% for the full
year, primarily due to growth in profits.
Customer loans were up 1% sequentially and 12% year-over-year. Customer
deposits were down 8% sequentially, once again resulting from Government deposit
outflows, and up 11% for the full year, as we saw growth in deposits across all
customer types.
Now, turning to page 13, here we show the sequential growth in revenues by
segment and contributions of each segment to the overall revenue total. All of the
segments contributed to a combined 6% growth in the fourth quarter with strong
percentage gains in Global Wealth and Head Office. Global Wholesale made up 49%
of revenues, Global Retail and Commercial 33%, Global Wealth 9%, and Head Office
8%.
Now, for slide 14. You can see all three major segments, Global Wholesale, Global
Retail and Commercial, and Global Wealth, contributed to operating profits. The
breakdown for operating profits by segment was Global Wholesale 68%, 30% for
Retail and Commercial, 11% Global Wealth and -9% from Head Office due mostly to
costs related to reorganisation.
Turning to the key ratios on slide 15, we look at these from an efficiency, liquidity,
solvency, and asset quality perspective. For the full year 2013, first the efficiency
ratio, diluted EPS of 1.04 versus AED 0.95 in full year 2012; ROE was 14.4% versus
15.1% in 2012; net interest margin was 2.08% for the full year 2013, down from 2.19%
for the full year 2012; cost to income ratio was 34.5, up from 33.1% for full year 2012;
and JAWS, which is revenue growth less expense growth, was -4.5% in 2013 versus -
1.9 in 2012, as expense growth was again driven by investment.
Now, liquidity, percentage lent was 57%; loan to deposit ratio was 87%.
Capital adequacy was 18.2%, Tier-1 came in at 16.5%, and leverage 9.4 times.
Finally, to the asset quality ratio, the NPL ratio was 3.16% for full year 2013, down
from 3.4% in 2012. As we have told you before, rather than looking at total
provision coverage, such as provisions over NPLs, and was 105.2% in Q4 2013, we
prefer to look at specific and collective coverage separately and both are shown here.
Specific provision coverage was 55.7% in addition to collateral and collective
provision coverage was fully compliant with the Central Bank requirement of 1.5%,
which goes into effect in 2014.
Now, I will turn it back to Alex for a review of our 2014 guidance and his final
remarks before we open the line to Q&A.
Alex Thursby
Thank you Michael. I just want to reemphasise what I said right at the very
beginning that this year, this upcoming year, will see growth rates that on a year-on-
year basis will take into effect certain one-offs that we had in 2013 and they are
mainly attributed to the first half of the year 2013.
We expect top line revenue growth to be 6-8%, but our underlying customer
business and our underlying business that’s built around our customers will be
growing at a much higher rate than that. This is important to the organisation to
build sustainability around what we’re doing.
We are investing in our business and for next year we will continue to invest
somewhere in the region of 12-15%, but we’re also taking bad costs out to put good
costs in, and we will continue to look at how we can reorganise ourselves, as we
continue on that process. We are also prioritising, but I will give an indication going
forward that the underlying revenue and the underlying cost growth brings the
JAWS much closer together than the headline numbers will show you. If we can
achieve this, it will bode well for future years.
Our net income growth will be somewhere in the vicinity of 6-8%, again on an
underlying basis I would expect that to grow at a higher basis, and we do see that
our provisioning will gradually – and I emphasise gradually – reduce after our NPLs
seemed to have peaked at 3.55% in the first quarter of 2013.
I'd hasten to add we are very and well provided; that is an approach that we feel is
correct and prudent. We will do this in a way that will continue to throw up capital,
while maintaining our capital ratios and our strong liquidity balance sheet, as I
mentioned earlier. Growing liabilities is as important as growing any other part of
the balance sheet and our place to the market and continue to do so.
We will continue to roll out new projects. That’s the higher cost growth and invest
in more sales staff in a number of areas; Commercial Banking and Wholesale
Banking have already started that and we’re in the process of doing this within our
Retail Bank right now and over the next three to four months.
That’s our rough expectations of where we’ll be in 2014. I now leave it to Michael to
host the Q&A and obviously any of the members of the team here would be
delighted to take questions.
Michael Miller
Operator, if you can please open the lines for Q&A.
Question and Answer Session
Operator
Ladies and gentlemen, we will now start the question and answer session. If you
wish to ask a question, please press 01 on your telephone keypad. Thank you for
holding until we have the first question.
We have a question from Nisreen Assi of Arqaam Capital. Please go ahead.
Nisreen Assi
Hello and good afternoon. I have a couple of questions. I will start with loan
growth, so what's your expectation for loan growth after the 12% growth this year
and which sectors are expected to be a driver for growth? For ROE, is the target of
15% over the medium-term still valid? What's your outlook on cost of risk? Thank
you.
Alex Thursby
If I can take the first two parts of the question and then I think on the risk question,
if I could pass to Abhijit.
Loan growth, we do expect to be at similar levels this year give or take 1 or 2% each
way. The underlying is showing good growth. Where we’re seeing the growth for
all our businesses is predominantly…we expect to see next year reasonable growth
in the Wholesale side, underlying it would be very good, particularly non-funded
revenue, and good asset growth and non-funded revenue growth from Commercial,
and also we’re continuing to see good growth in our Wealth and Retail businesses,
but we do expect to see growth across all sectors, but that the headline Wholesale
will be less than the other three businesses, because of some of the one-offs of the
prior year. I also emphasise a lot of our growth out of Wholesale will continue to
come out of the growth of our non-funded revenue, thus giving some elements of
capital efficiency.
Let me now talk about return on equity, it is our strive to remain on or about
somewhere around 15%, give or take a percent or so. I will, however, give you two
criteria; if there is severe margin compression, clearly that will be an issue for all of
the banking industry here, so I'd give that one out, but what I will say is that as we
continue to grow our businesses in the non-funded product groups, you can assume
that there was some protection from an ROE base if we are successful in doing that.
Abhijit Choudhury
I think there was a question regarding our perception of the cost of risk going into
2014. To an extent, I think it was answered in the guidance statement by the Chief
Executive when he said in terms of provisioning, we are possibly seeing – will be
seeing some kind of reduction, gradually. As you know, our cost of risk I think for
2013 was 63 basis points, I think to be precise, a drop from the earlier year and in
terms of percentage…as a percentage…our provisions as a percentage of operating
income, is about 14%, looking against a market average of 24%. We have given an
indication to the market earlier on in terms of our NPL, and I think even, yes,
indeed, we have seen a drop in terms of our NPLs for the first time this quarter. We
had a good quarter, we had a few resolutions, recoveries within this quarter, but it
would be around this level, I think north of 3%, let’s say between 3% and I would
say, 3.3%-3.4%, but we would obviously want to contain it as much as possible, but
we feel positive moving forward. Overall, in terms of the cost of risk, we expect to
maintain it around this level of around 50 basis points or slightly middling the 50
going into 2014.
Nisreen Assi
If you may allow me one more question, please. Regarding margins, which have
dropped to 2.08% in FY13, could you please explain the reason behind the drop and
what are your expectations for the coming year?
Alex Thursby
I think if I heard you right, it is a very bad line, but if I heard you right, I think your
question was, what happened to our margins in the back end of this year, and what
is our expectation of margins going forward.
Let me answer the first bit of that question very categorically. We were able to give
ourselves a +2/+3 (bps) margin, which was probably counter to most of the market,
for a couple of reasons, three reasons:
1. We have been getting more efficient in the way that we manage our treasury
book.
2. The growth of our current accounts has helped during that.
3. As I highlighted to you at the last quarter’s meeting, we have very limited
place to put our excess liquidity for Government deposits with tenor when
they climb high.Limited upside means very small margins, there is an
averaging effect.
Let me then just give you some indication of what you can expect from the asset
side. There is still asset price margin in the market and we will not be restricted
from that, so I think you have got to assume that there will continue to be on the full
balance sheet position margin compression into the first part of next year and
possibly even longer.
The only thing that I would suggest is that, that maybe negated if US interest rates
go up in the short end of the yield curve, but our expectation of that happening in
the first half, certainly, is probably very limited at this stage, but our margins are
tossed around and are a little bit more volatile, depending on the amount of
Government deposits we have and where we place that liquidity.
Operator
We have a question from Henrietta Seligman, Somerset Capital. Please go ahead.
Henrietta Seligman
In your five-year strategy period, where are you expecting the cost-to-income ratio
to peak?
Alex Thursby
I don’t set a specific cost-to-income ratio level. I am much firmer on our growth and
ROE, as I feel that is in long-term shareholders’ interest. What I will say to you that
where we see opportunity to grow in the right way, we will invest. We see that in
our budget next year, or this year should I say, and you certainly see that. We are
not looking to be the lowest cost-to-income ratio player in the market, because we
want to grow, but grow in the right areas that slowly but surely brings risk out of
the book as we move forward.
I won’t be locked in onto a cost-to-income ratio, but rather much more firm with our
ROE and our growth rate.
Henrietta Seligman
Okay, thank you. Do you have a sort of maximum level you would let it get to?
Alex Thursby
I don’t think it is worthwhile to talk about maximum levels, but clearly, we are
going to be sensible. We are investing in our plans where we do pace investment
and we do look for reasonable close jaws on our underlying businesses. If we have
one-off revenues, that makes it look better than we really are, if we don’t have one-
off revenues, I think you can assume that that is the real play and you will see
reasonable good discipline around the cost/income relationship.
As I said to you in the guidance, our underlying revenues will be a lot closer to our
cost level increases and we will continue to run the business in that manner. We will
invest where we see opportunity and we won’t hold back.
Henrietta Seligman
Thank you very much.
Operator
We have a question from Naveed Ahmed, Global Investment House. Please go
ahead.
Naveed Ahmed
Thank you, gentlemen for the presentation. I have a few questions, starting with, if
you may, can I have a long-term view on the interest rates, especially if you're
looking beyond 2015. My second question is regarding the health of the Egyptian
assets. The third, which is a two-part question is regarding…
Michael Miller
Sorry, what was the second question?
Alex Thursby
What was the second question, sorry.
Naveed Ahmed
The health of the Egyptian assets, the Egyptian assets.
Alex Thursby
The health of the Egyptian assets, yes.
Naveed Ahmed
The third question is regarding…do you have a target in mind regarding the NPL
coverage ratio, and related to that itself, I understand that currently the general
provisioning to the credit risk-weighted assets ratio is around 1.66%, so will the
Bank be happy in keeping it at this current level or reducing it to 1.5% over a bit of
time.
Alex Thursby
Steve will take the currency – the interest rate question, our Treasurer and we will
stick our comments predominantly to Dirhams and US Dollars. We’re not here to
forecast Kenyan Shillings.
Stephen Jordan
I think for 2014 we’re not expecting any real change in official rates, either from the
US or from the UAE, obviously, that will affect currency. I think if we look at
longer-term yields, we do expect those to rise gradually throughout the year. I see,
for example, in the US leaving closer to 3.5% in the 10-year as we progress
throughout the year.
In Dirhams, it is a little bit more challenging, because its quite a bit of spread, but I
would expect to see a similar movement in Dirham long-term rates because of the
peg to the currency.
Naveed Ahmed
Okay.
Abhijit Choudhury
On the second question with regard to the health of our Egyptian assets, actually we
fared a lot better than the rest of the market in Egypt. As you know, our total loan
book in Egypt, in country assets are in the region of a billion Dollars, slightly more,
now it is about 1.2 billion. We have an NPL percentage of roughly in the region of
about 7-8%, as events or market averages a lot higher. We are very vigilant in terms
of the portfolio and we have adequately provided, even for the performing non-
classified portfolio, we have provided adequately under our general provisioning.
Of course, in addition to this in-country portfolio, we also have cross-border
exposure, and in terms of our cross-border exposure, we have been very, very
mindful about this portfolio. As you know, generally, whichever market we have
gone to, we have followed our clients and most of our exposure relating to cross-
border exposure relates to principals from the UAE who would go and invest in
Egypt, who have gone in for that kind of financing. We’re very comfortable with the
quality of borrowers, which we have on our cross-border exposure book.
Overall, well provided, a percentage on NPL much below the market, pretty much
that. As you know, if you look at it in terms of the size of the book, out of our total
loan book of about AED 183 billion, so in country, approximately about AED 4
billion, that gives you an idea in terms of the magnitude.
Going onto the question regarding collective provisions, I think as you have seen, if
you look at the trends in terms of our collective provisions over the last couple of
years, we have very much in advance achieved the requirements of the Central
Bank. Our collective provisioning is determined not just by the Central Bank’s
requirements, we have our internal model based – which is an expected loss model
in line with the Basel requirements on provisioning, and therefore, you will see,
based on our internal modelling approach and our close assessment of our credit
quality, you would have seen that this band of…or the amount or percentage of
collective provisioning has fluctuated between 1.54 and 1.6 or so, so we expect it to
be around this sort of level, so we feel fairly well covered both on the specific as well
as on the general, so the bank is roughly, I would say, something between 1.55/1.65,
that is the sort of level at which we would like to maintain it.
Naveed Ahmed
Regarding the target NPL coverage ratio, if there is a number…
Abhijit Choudhury
Target NPL coverage ratio, we have given an indication to the market I think back in
2011/2012 that we expect it to peak between 3.5 and 3.75. we believe that we peaked
in the first quarter at 3.55, last quarter we went down for the first time, but I reckon
moving forward, as I said a bit earlier, it should be a band, I would say, max, if it
had to go for any one-off, it would go to a 3.3 or a 3.4, but that is the sort of level
within which we would like to maintain it.
Naveed Ahmed
I was speaking regarding the NPL coverage ratio.
Abhijit Choudhury
The NPL coverage ratio, as you have the number already, we look at is…Michael
mentioned, we look at the NPL coverage separately, we roughly would like to
maintain it at between 50 and 60%, in terms of provisioning coverage, in terms of
specific to NPL.
Naveed Ahmed
Perfect, thank you. Thank you so much.
Operator
We have a question from Naresh Bilandani, J.P. Morgan. Sir, please go ahead.
Naresh Bilandani
Hi, good afternoon, it is Naresh Bilandani from J.P. Morgan. Thanks for the call. I
have a few questions please. The first one comes on the point that Alex had
mentioned earlier in the presentation with regards to the expectation for revenue
growth for this year, 2014, being somewhere in the range of around 6-8% on the top
line, but the underlying customer business expected to deliver much better. Alex, I
would appreciate if you could just throw some more light on what exactly did you
mean with this. Is this with regards to growth in the total return, on the
relationship? Was this with regards to the fee incomes or the spreads that you
would be expecting, or this is just pure volume growth?
The second question was with regards to looking beyond 2014, and sorry for
dwelling again on the costs, but it seems to be that an increase in the costs is taking
away much of your effort on the growth on the revenue side. Beyond 2014, do you
expect this trend to change in any manner where the growth on the revenue side is
much more aligned to the costs, or do you expect to continue to see a higher growth
on the expenses side moving forward also in 2015?
Alex Thursby
Yes, look, I think, let me take the second question first, I think I have made my
statement on this that we will be disciplined in our cost-to-income ratio, but if I see
an opportunity in the market and it means I have to go 2 or 3% negative jaws for one
year, I will, and this is versus the underlying element of it. I do not want to hold up
growth, particularly where I see good ROE opportunity, as I think those are the two
primary drivers of the share price going forward.
Clearly, what I will say secondly is what I again repeat, general though, you can
expect me to be fairly close, sometimes under, sometimes slightly over on my cost-
to-income ratio year-by-year, depending on the pace. What we are trying to suggest
to you though, is that our underlying growth that we wish to participate in the next
two to three years, will generally be pretty high, and maybe I am not yet an expert
enough on this marketplace to suggest that it will be higher than others, but it
certainly will be pretty close to it, and it is the way that we make our revenues, so if I
can then sort of take linkage into the first part of your first question.
I would go right back to what we suggested right at the front end of our strategy, we
want to be core bank to the customers or the customer segments that we choose to
play in. Core bank does mean cross-sell; it does mean deeper relationships, whether
it be in Wealth Management, whether it be ultimately in Retail, whether it be in
Wholesale, or whether it be in Commercial.
Clearly, the cross-sell in Commercial and Wholesale, we have been pretty explicit
about, and when we come to talk about Wealth Management, we will also talk about
that at one of the calls, or thereafter, but cross-sell is a critical ingredient.
We will in Retail lead with specific products, but our Retail business is beginning to
be built around a transactional relationship. That transactional relationship is
critical for us in our view to get a long-term, medium to long-term cross-sell into the
Retail business. If we don’t hold the customer’s transactional relationships, we will
always fight very hard to get meaningful cross-sell.
When I say underlying growth, and I think we mentioned it in the commercial
structure, there are a number of customers where we are fourth, fifth, maybe third
banker. Clearly, we want to elevate that, as well as hunt out new customers that are
in line with the industry segment and have the wallet shapes that we want, and our
whole growth is built around wallet shape; it is not built around single product
engines that just grow, grow, grow. We believe in the long run, for a bank like
ourselves, that is the appropriate strategy in view of our rating, but also we believe
that is how we will get sustainable superior growth in the long run.
Naresh Bilandani
Thank you very much. If I could just please ask a follow-on question, at one point in
the presentation Alex, you mentioned a point on capital, and you said, depending
on how the growth is, we may look to – did I get your point – we may look to raise
further capital?
Alex Thursby
No, no, no, you didn’t get my point. What I did say, the preface to that, and I really
want to really emphasise this, so you do not pick up the wrong end of the thing
here, is that the growth models that we looked like coming through our five year
plans are that capital can be raised within our business growth. Yes, what I did say,
as I will never say that I will raise capital and you wouldn’t expect me to say that,
that I will never raise capital, because that would be…no Chief Executive of any
bank can.
What I am saying is our model and our strategy throws off capital to fund growth
and pay reasonable dividends. That is what I am saying.
Naresh Bilandani
A point I understand. Yes, no, this is very clear. I am sorry, I misunderstood it,
because I was surprised that 16.5% Tier 1 when you talk about a capital raise, that
doesn’t seem very comfortable. Anyway, maybe just…
[All talking]
[Laughter]
Alex Thursby
Rating agencies would love me, but I don’t think you would.
Naresh Bilandani
No, absolutely. Your current pace of dividend pay-out has been relatively lower
versus the levels of pay-out that have been in some of your peers, and I understand
this is probably – you would like to maintain a high level of capital for future
growth, but when you look at the banking business in this region currently, and
maybe the numbers that have been reported, it looks like the level of consumption of
capital has been relatively faster versus the yield that is coming from that capital,
which is why the ROEs – we’re not seeing an expansion in ROEs here. Do you
reckon that a change…there was a previous question on the interest rates. Do you
reckon that a rising rate environment is one-on-one beneficial to the NIMs that the
regional banks can expect to deliver next year, or do you believe there will be a
quarter or two of relative pressure on the NIMs before we could start seeing an
elevation of the spreads going forward into the second half of this year. This is
assuming the US consensus where some of the economists are starting to build in a
rising rate environment end Q1 or somewhere during Q2 of next year.
Alex Thursby
Yes, it is a very good question. My basic premise is that if you have a structure of a
balance sheet that has substantive core relationships and therefore, current accounts
and savings accounts that you are able to, in a rising interest, move your spreads up,
generally, generally. You tend to move your assets up quicker than your liabilities.
I think that is sort of dying in today’s world, because of the liquidity rules, but
current accounts, if you can get a big portion of current accounts, that helps your
balance sheet spreads overall.
Of course there are many other factors, including your rating, which is the cost of
what you're borrowing at, and I think that is becoming more and more – the market
is becoming more and more disseminating on that. We don’t have to enter into price
wars at this stage on our liabilities, so that would be my general key thoughts, but
generally, your current account is your one weapon to keep spreads moving
positively.
Part of the reason why banks around the world are struggling to get really above
12% ROE, is because they have got flat horrible loan yield curves and that is why
they're there. How much loans will improve, time will tell, but I would suggest that
current account balances are important, and savings accounts balances are important
in doing that, getting those ROEs up.
I think 15% ROE is pretty cool at the moment in global terms.
Naresh Bilandani
Thank you very much, that was very helpful. Thanks a lot.
Operator
We have one last question from Aarthi Chandrasekaran, from NBK Capital. Please
go ahead.
Aarthi Chandrasekaran
Hi, good afternoon, thank you for the call. I have two questions. The first one being
the non-interest income in 2012 and 2013 grew at a much faster pace compared to
your net interest income. Even if you had to strip out your one-off exceptional gains
in 2013, this argument will still hold good. My question is do you expect this trend
to carry forward in 2014 as well? That is my first question.
My second question is on the low cost deposits. We saw a significant increase in the
fourth quarter on the low cost deposits. I am not sure if I heard you correctly in the
presentation, but did you say that there were a couple of one-offs in these deposits.
My question is basically are these levels sustainable and if they are, what kind of
impact do you think would happen to margins for this year? Thank you.
[Line muted] Missing audio for a couple of minutes
Operator
We have a question from Mr Shabbir Malik. Please go ahead.
Shabbir Malik
EFG Hermes, just one question from me. In light of the problems in EM markets,
emerging markets and the devaluation of the currencies, is there going to be any
impact on NBADs profitability because of these events?
Alex Thursby
[Off microphone]
…we don’t have huge capital levels allocated to a number of the countries at this
stage, so the emerging markets piece I think balances off. Steve you know how Gulf
countries there is much more sustainability around Dollar.
Stephen Jordan
Yes, obviously it is a risk that us and many partners are going to keep an eye on at
this stage, but the spill over into the regional currencies has not happened to date,
and in terms of exposure in the countries that you're talking about, we have
absolutely minimal exposure there, so I don’t personally see an impact on our
earnings at this point in time, but obviously, we have to keep a close eye on the
developments.
Shabbir Malik
Thanks a lot.
Michael Miller
All right, thank you so much. I do believe we’re out of time and I will turn it over to
Alex for final comments.
Alex Thursby
Thank you guys for spending some time with us. I do want to tell you that on the 4th
March we will be doing a small one-hour roadshow at the investor conference here
in Abu Dhabi and I will, plus myself and three or four of our business heads will be
presenting to you at that and there will obviously be time to ask questions
strategically about the business plans more than day-to-day quarterly earnings. I do
ask if you do come, I would like it to be more around the five-year aspiration than
the next week aspiration. If it is really critical, we will answer, trust me. But it will
be at the Emirates Palace on the 4th March, and you will get more information from
Michael and his team and we would be delighted to host you and let you further
into what we’re doing and how. I will also say that at the next quarterly meeting
one of the businesses will be showcased at a very high level, today as we talked
about Commercial becoming increasingly an important part of our business.
Thank you so much and I look forward to talking with you on 4th March.