investor presentation - personal banking | nbad uae · pdf file ·...
TRANSCRIPT

1
Investor Presentation
July 2015

2 2
Disclaimer
The information contained herein has been prepared by National Bank of Abu Dhabi P.J.S.C (“NBAD”). NBAD relies on information obtained
from sources believed to be reliable but does not guarantee its accuracy or completeness.
This presentation has been prepared for information purposes only and is not and does not form part of any offer for sale or solicitation of any
offer to subscribe for or purchase or sell any securities nor shall it or any part of it form the basis of or be relied on in connection with any
contract or commitment whatsoever.
Some of the information in this presentation may contain projections or other forward-looking statements regarding future events or the
future financial performance of NBAD. These forward-looking statements include all matters that are not historical facts. The inclusion of such
forward-looking information shall not be regarded as a representation by NBAD or any other person that the objectives or plans of NBAD will
be achieved. NBAD undertakes no obligation to publicly update or publicly revise any forward-looking statement, whether as a result of new
information, future events or otherwise.

3 3
UAE, Abu Dhabi & Banking Sector
NBAD Overview
Strategy
Financial Review - 2Q/1H 2015
Appendix
Contents

4 4
UAE Economic Overview
1 IMF World Economic Outlook, 2013 2 Moody’s 3 National Bureau of Statistics, UAE
• The United Arab Emirates comprises seven Emirates with Abu Dhabi being the largest contributor to its GDP
• Rating: Aa2 stable by Moody’s (unsolicited)
• Nominal GDP for 2013 estimated at USD 402.3bn, making it the 2nd largest economy in the GCC (after Saudi Arabia)1
• 6.06% of proven global oil reserves as of 20122
• UAE Banking sector offers the largest asset base within the GCC (NBAD is 4th largest bank by assets in the MENA region)
• UAE banking sector is dominated by domestic players domiciled within the market
24.5% 22.5% 23.6%
26.2% 26.2% 26.8%
2010 2011 2012 2013 2014F 2015F
131%
86%
44% 35%
26%
7% 6% 3%
Lebanon Jordan Bahrain Qatar UAE Oman Kuwait SaudiArabia
Oil & Gas 33%
Manufacturing 9%
Construction 9%
Real Estate 12%
Transport, storage and
communication 10%
Trade 12%
Financial Institutions
7%
Government Services
6%
Other 2%
UAE Public Debt vs GDP2 Per cent (%)
Composition of UAE Real GDP by Sector (2013)3 Per cent (%) Public Debt in MENA Region (2013)² Per cent (%)
5 5
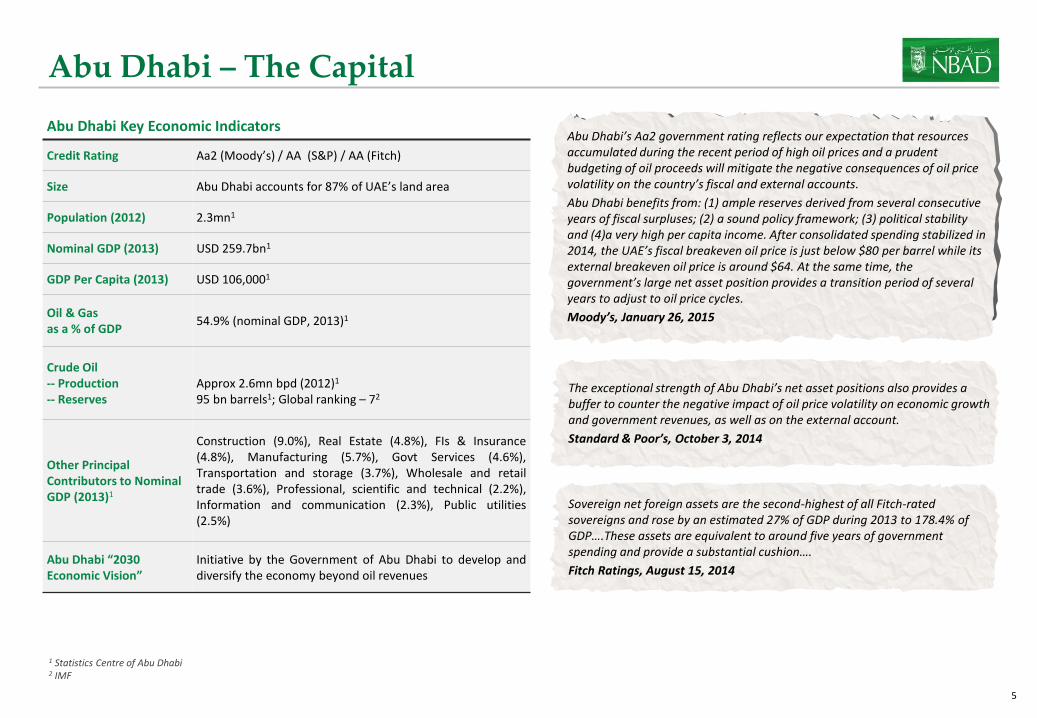
Abu Dhabi – The Capital
Abu Dhabi Key Economic Indicators
Credit Rating Aa2 (Moody’s) / AA (S&P) / AA (Fitch)
Size Abu Dhabi accounts for 87% of UAE’s land area
Population (2012) 2.3mn1
Nominal GDP (2013) USD 259.7bn1
GDP Per Capita (2013) USD 106,0001
Oil & Gas as a % of GDP
54.9% (nominal GDP, 2013)1
Crude Oil -- Production -- Reserves
Approx 2.6mn bpd (2012)1 95 bn barrels1; Global ranking – 72
Other Principal Contributors to Nominal GDP (2013)1
Construction (9.0%), Real Estate (4.8%), FIs & Insurance (4.8%), Manufacturing (5.7%), Govt Services (4.6%), Transportation and storage (3.7%), Wholesale and retail trade (3.6%), Professional, scientific and technical (2.2%), Information and communication (2.3%), Public utilities (2.5%)
Abu Dhabi “2030 Economic Vision”
Initiative by the Government of Abu Dhabi to develop and diversify the economy beyond oil revenues
1 Statistics Centre of Abu Dhabi 2 IMF
Abu Dhabi’s Aa2 government rating reflects our expectation that resources accumulated during the recent period of high oil prices and a prudent budgeting of oil proceeds will mitigate the negative consequences of oil price volatility on the country’s fiscal and external accounts.
Abu Dhabi benefits from: (1) ample reserves derived from several consecutive years of fiscal surpluses; (2) a sound policy framework; (3) political stability and (4)a very high per capita income. After consolidated spending stabilized in 2014, the UAE’s fiscal breakeven oil price is just below $80 per barrel while its external breakeven oil price is around $64. At the same time, the government’s large net asset position provides a transition period of several years to adjust to oil price cycles.
Moody’s, January 26, 2015
Sovereign net foreign assets are the second-highest of all Fitch-rated sovereigns and rose by an estimated 27% of GDP during 2013 to 178.4% of GDP….These assets are equivalent to around five years of government spending and provide a substantial cushion….
Fitch Ratings, August 15, 2014
The exceptional strength of Abu Dhabi’s net asset positions also provides a buffer to counter the negative impact of oil price volatility on economic growth and government revenues, as well as on the external account.
Standard & Poor’s, October 3, 2014

6 6
The UAE Banking Sector
• As at 30 June 2015 there were a total of 49 banks (23 locally incorporated banks and 26 foreign banks)1
• 8 Islamic banks
• Strong capitalisation driven by cautious lending and healthy internal capital growth
• Most domestic banks focus on the UAE and GCC region, while the largest banks have international presence
• Regulated by the Central Bank of the UAE
UAE Banking System Key Indicators1 USD Bn
UAE Banking System – Capital & Liquidity1 Per cent (%) GCC banking sector assets2 Per cent (%)
97.0%
69.0%
16.2%
18.2%
100.2%
87.6%
16.5%
18.3%
Loans to Deposit
Net Credit toStable Resources*
Tier-I ratio
CAR
Jun-15
511 572
628 659
318 348 387 393
323 347 375
394
2012 2013 2014 Jun-15
Total Assets Deposits Loans & Advances
659
542
280
192 190
71
UAE Saudi Arabia Qatar Bahrain Kuwait Oman
1 UAE Central Bank Qatar & Oman as of 31 May 2015, Bahrain as of 30 April 2015 Kuwait, Saudi Arabia & UAE as of 30 June 2015
* Stable Resources = Deposits + Term borrowings + Capital & Reserves
7 7
UAE, Abu Dhabi & Banking Sector
NBAD Overview
Strategy
Financial Review - 2Q/1H 2015
Appendix
Contents

8 8
NBAD at a Glance (1/2)
Banker to the Abu Dhabi Government
70% owned by the Government of Abu Dhabi through ADIC (Abu Dhabi Investment Council)
Strongest ratings of any bank in the Middle East & Emerging Markets at Aa3/AA-/AA- - ‘Safest Bank in the Middle East & Emerging Markets’*
Largest bank by assets in the UAE (AED 400 billion as of 31st March 2015)
Well diversified Financial Group – across businesses and geography - Largest international presence among the UAE banks
Consistent profitability and value creation to shareholders
Well positioned for growth from global economic recovery
Clear and focused strategy for growth
* By Global Finance – Safest Bank in Middle East & Emerging Markets; Among the World’s 50 Safest Banks since 2009

9 9
NBAD at a Glance (2/2)
Overview Incorporated in 1968 to serve as Banker to the Emirate of Abu Dhabi
Owned 70%1 by Government of Abu Dhabi, via the Abu Dhabi Investment Council (ADIC)
Listed on Abu Dhabi Securities Exchange (ADX)
Credit Rating
Fitch Moody’s S&P RAM
(Malaysia) R&I
(Japan)
LT AA- Aa3 AA- AAA A+
ST F1+ P-1 A-1+ P1
Outlook Stable Stable Stable Stable Stable
Presence Domestic - 121 branches*, 596 ATMs+ across all the 7 emirates
Overseas – 54 units*, 68 ATMs across 17 countries
Financial Info
(based on 1H’15 financials)
Market Cap (Price @ AED 11.00)
AED 57.2bn (US$ 15.6bn)
Diluted EPS (1H 2015) 0.53
PE Ratio 10.2
Price / Book 1.6
Shares Issued (@ AED 1) Free float:
5,209.7mn 30%
Dubai
Abu Dhabi & Eastern
Region
Ras al-Khaimah
Fujairah Umm al-Quwain
Ajman
Sharjah
* Including cash offices, NBAD Suisse & Malaysian subsidiary, offshore units & representative office in Libya & Shanghai + includes Cash deposit machines
Washington, D.C.
London
Paris Geneva
Egypt
Sudan
Kuwait Bahrain
Oman
Libya
Hong Kong
Jordan
UAE
Channel Islands
Malaysia Brazil
Shanghai

10 10
NBAD vs Global banks
NBAD
HSBC
StanChart
Barclays RBS
Lloyds
BNP Paribas Deutsche Bank
SocGen
Credit Suisse
UBS
Credit Agricole
ING Groep
Commerzbank
UniCredit
JP Morgan Chase
Goldman Sachs
Morgan Stanley Citigroup
BofA
30
40
50
60
70
80
90
100
110
120
CD
S (
bp
s)
Aa3S Aa3- A1+ A1S A1- A2+ A2S A2- A3+ A3S A3- Baa1+ Baa1S Baa1- Baa2+ Baa2S Baa2- Aa3+
Notes: X-axis represents the rating assigned by Moody’s. The ratings have been arranged from higher to lower based on the outlook assigned by Moody’s at each rating level. For example ‘Aa3+’ is the highest rating level for ‘Aa3’ rating category, where (+) refers to positive outlook. ‘Aa3+’ is followed by ‘Aa3S ‘ and ‘Aa3-’, where (S) refers to ‘stable outlook ‘ and (-) refers to ‘negative outlook’; CDS levels are for 26th January 2015; Source: Bloomberg
NBAD has the strongest rating from Moody’s (Aa3 with a Stable outlook), within the selected peer group below; Indeed NBAD is the only bank within the selected peer group here, to be rated in the double-A category by all three major agencies with Stable outlook

11 11
UAE, Abu Dhabi & Banking Sector
NBAD Overview
Strategy
Financial Review - 2Q/1H 2015
Appendix
Contents

12 12
Our mission to be core to our chosen customers
Vision To be recognised as the World’s Best Arab Bank
Mission Be core to our chosen customers, helping them grow by providing exceptional
products and services across our West-East Corridor and provide an environment to attract and develop exceptional and diverse talent
Our Values Value our
people and foster great team work
Put our customers at the forefront and “do the
right things the right way”
Empower our people and
hold each other accountable for
performance and behaviour
Customer Value Proposition
Safety Relationship Connected Service Insight
Respect our heritage and be
loyal to our stakeholders

13 13
4 Geographical Pillars of our Strategy
Vision: To be recognised as the World’s Best Arab Bank to be achieved around four pillars…
Home Market
Build the largest, safest and best performing bank first in UAE, and over time
in the GCC
1
Wholesale / Wealth Network Markets
Deepen our network across the West-East
corridor & integrate our existing European & North American platforms into
this network
2
New Franchise Markets
Build 5 international bank franchises in the largest
and fastest growing economies in the West-
East corridor
3
Building the Spine
Supported by a world class spine (Operations & Technology, Risk, Finance, Legal, Compliance) combining best-in-class customer service with leading cost efficiency
4

14 14
SOURCE: United Nations, World Urbanization Prospects 2007; McKinsey Global Institute China All City Model; McKinsey Global Institute analysis
1 Cities with 10 million or more inhabitants
Megacities1 2007
Additional megacities by 2025
West-East corridor
Los Angeles
Mexico city
Bogotá
Lima Rio de Janeiro
Sao Paulo
Buenos Aires
London
Paris
Moscow
Cairo
Lagos
Kinshasa
Istanbul
Tehran Lahore
Karachi Ahmedabad
Mumbai
Bangalore Chennai
Hyderabad
Chengdu
Dhaka
Chongqing
Xi’an Beijing Seoul
Tianjin
Shanghai Hangzhou
Guangzhou Shenzhen/Hong Kong
Manila
Jakarta
Osaka-kobe New York
Wukan
Our primary drivers are trade and investment flows across the West/East corridor: We want to bank the customers from within the corridor We want to bank customers located outside of the corridor who trade and invest inside the corridor We want to support our chosen UAE customers in London, Paris, Switzerland and Washington
Banking the West-East corridor
Kolkata
Delhi
Tokyo

15 15
Trade and FDI flow across the West-East corridor
SOURCE: EIU estimates
Figures in USD Billion Trade = Sum of imports and exports FDI = Sum of M&A and Greenfield investments
Trade flows
1.1 Intra Middle East
Trade
2011
112
1.2 Middle East and Asia
2011
1.3 Middle East and Africa
2011
2.1 Asia and Africa 3.1 Intra Asia
Trade 3302 6607 8%
3.2 Intra Africa
50 Trade 103 8%
FDI flow 17
2020
270
2020
2020
38
CAGR 11-20
10%
CAGR 11-20
CAGR 11-20
9% FDI flow 213 614 12%
FDI flow 2 15 25%
2011 2020 CAGR 11-20 2011 2020
CAGR 11-20
2011 2020 CAGR 11-20
Trade
FDI flow
334
35
888
69
11%
8%
Trade
FDI flow
Trade
FDI flow
1008
26
2743
82
12%
14%
10%
19%
163
29
67
6

16 16
Key sectors
Financial Institutions
Aviation, rail and transport services
Real Estate and family conglomerates
Traders and retailers
Energy and Resources
Why is it an opportunity? Illustrations
Significant and fastest growing segment globally
40% contributor to the global Wholesale bank and the biggest volume segment in flow products
Controls 70% of the volumes in certain products
Strategic sector in the UAE & aligned with Abu Dhabi 2030
Attractive sector for corporate credit with low counterparty risk
Substantial growth & potential of supply chain business
Strategic sector the UAE & aligned with Abu Dhabi vision 2030
National champions with significant growth aspirations
Big 6 airlines within the new West-East corridor
Strategic sector the UAE (20% of UAE GDP) & aligned with Abu Dhabi vision 2030
Highly attractive sector for Arab investors
Attractive for GCC/Asian and other investors
Strategic and high growth sectors in the region
UAE is the 18th biggest trading country in world ahead of countries like India, Brazil and Australia
Retailing is USD ~$48Bn market in GCC expected to grow at ~8% annually from 2013/17
Key industry sectors aligned to our network markets strategy
17 17
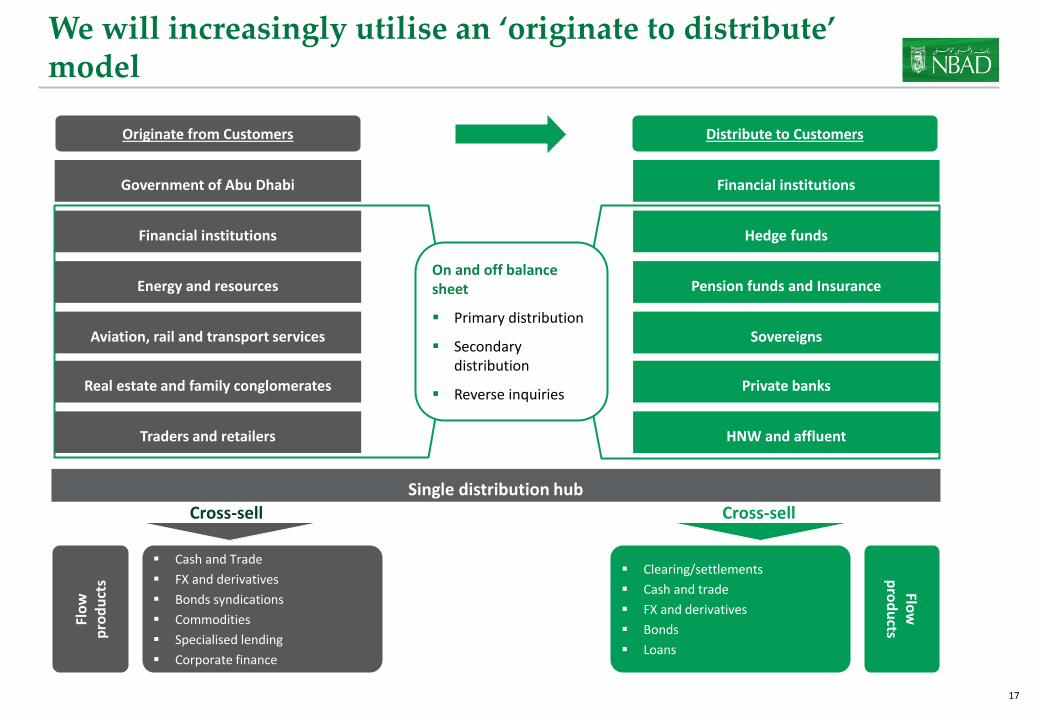
We will increasingly utilise an ‘originate to distribute’ model
Originate from Customers Distribute to Customers
Government of Abu Dhabi
Financial institutions
Energy and resources
Aviation, rail and transport services
Real estate and family conglomerates
Traders and retailers
Financial institutions
Hedge funds
Pension funds and Insurance
Sovereigns
Private banks
HNW and affluent
On and off balance sheet
Primary distribution
Secondary distribution
Reverse inquiries
Cross-sell Cross-sell
Cash and Trade
FX and derivatives
Bonds syndications
Commodities
Specialised lending
Corporate finance
Flo
w
pro
du
cts
Clearing/settlements
Cash and trade
FX and derivatives
Bonds
Loans
Flow
p
rod
ucts
Single distribution hub
18 18
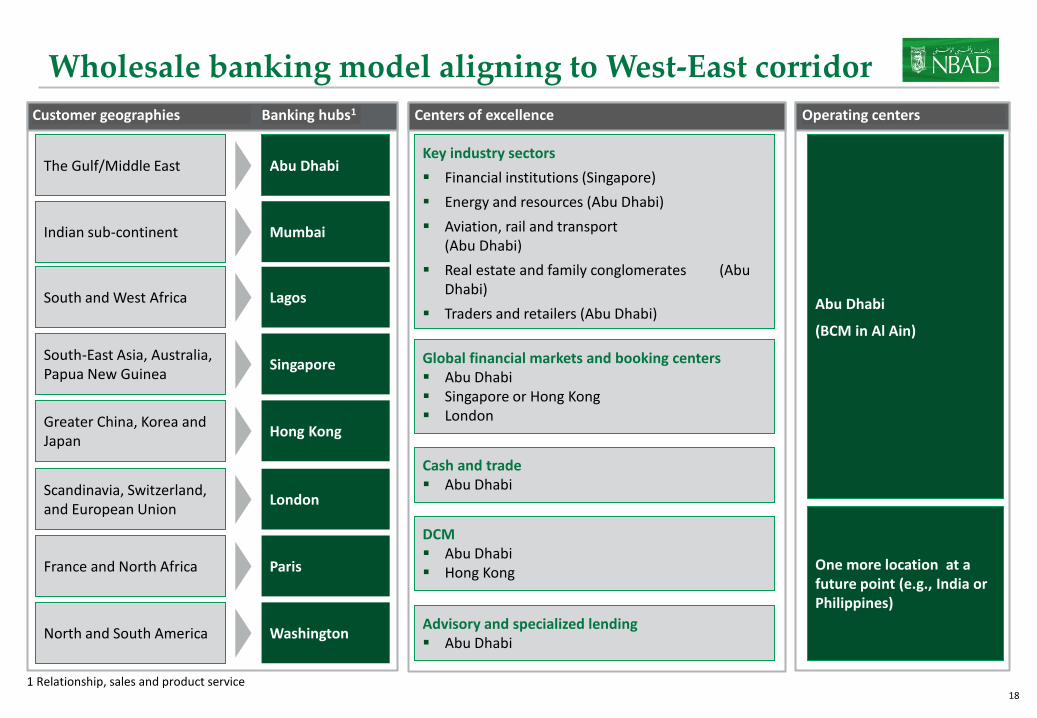
Wholesale banking model aligning to West-East corridor
1 Relationship, sales and product service
Abu Dhabi The Gulf/Middle East
Mumbai Indian sub-continent
Lagos South and West Africa
Singapore South-East Asia, Australia, Papua New Guinea
Hong Kong Greater China, Korea and Japan
London Scandinavia, Switzerland, and European Union
Washington North and South America
Global financial markets and booking centers Abu Dhabi Singapore or Hong Kong London
Key industry sectors
Financial institutions (Singapore)
Energy and resources (Abu Dhabi)
Aviation, rail and transport (Abu Dhabi)
Real estate and family conglomerates (Abu Dhabi)
Traders and retailers (Abu Dhabi)
Cash and trade Abu Dhabi
DCM Abu Dhabi Hong Kong
Advisory and specialized lending Abu Dhabi
Banking hubs1 Customer geographies Centers of excellence Operating centers
Abu Dhabi
(BCM in Al Ain)
One more location at a future point (e.g., India or Philippines)
Paris France and North Africa

19 19
UAE, Abu Dhabi & Banking Sector
NBAD Overview
Strategy
Financial Review - 2Q/1H 2015
Appendix
Contents
20 20
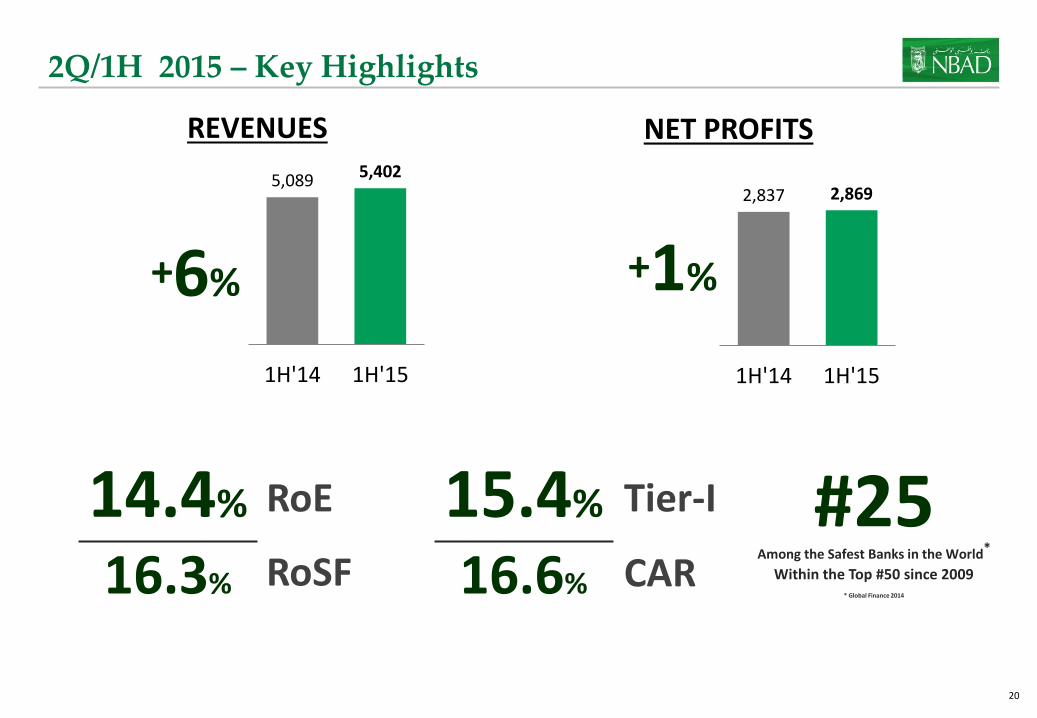
2Q/1H 2015 – Key Highlights
+6%
REVENUES
5,089 5,402
1H'14 1H'15
+1%
NET PROFITS
2,837 2,869
1H'14 1H'15
Among the Safest Banks in the World* Within the Top #50 since 2009
* Global Finance 2014
#25 RoE 14.4%
RoSF 16.3%
Tier-I 15.4%
CAR 16.6%

21 21
Business Drivers Grow in Line with Strategy
• UAE Banking Sector growth as per UAE CB Banking Indicators, June 2015
Assets were up year-over-year, driven by lending growth; Trade & Market Contingencies grew year-over-year as we continued to execute against our strategy.
Balance sheet indicators 1H 2014 1H 2015 Variance UAE Banking
Sector Growth
AED Bn AED Bn % YoY %*
Assets 348 393 8.2%
Equity 36 42 8.3%
Customer Loans 182 218 8.8%
Customer Deposits 237 230 3.1%
- CASA 64 71 NA
Contingencies (Trade & Market) 1,259 1,306 NA
12.7%
15.5%
19.9%
-3.1%
11.2%
3.7%

22 22
Growth continues amidst headwinds
• Gaining share in Retail/Commercial
• Rapid growth in flow products
• Strong growth in Wholesale and Wealth international network markets
• Continuing to build on capital and liquidity strength
• Headwinds from market-linked businesses and softer activity
• Returns remain attractive
Recently refurbished NBAD Head Office branch, Abu Dhabi
Growing revenue in the right areas
NBAD sponsorship of Dubai Aquarium at Dubai Mall, Dubai

23 23
Environment
Sheikh Zayed Grand Mosque, Abu Dhabi
• Changing macro environment
• Differentiation between banks to increase over short to medium term
• Evolving environment favours NBAD
− Strong credit rating
− Highly liquid
− International growth options
− Prudent risk management
We remain strongly positioned
24 24
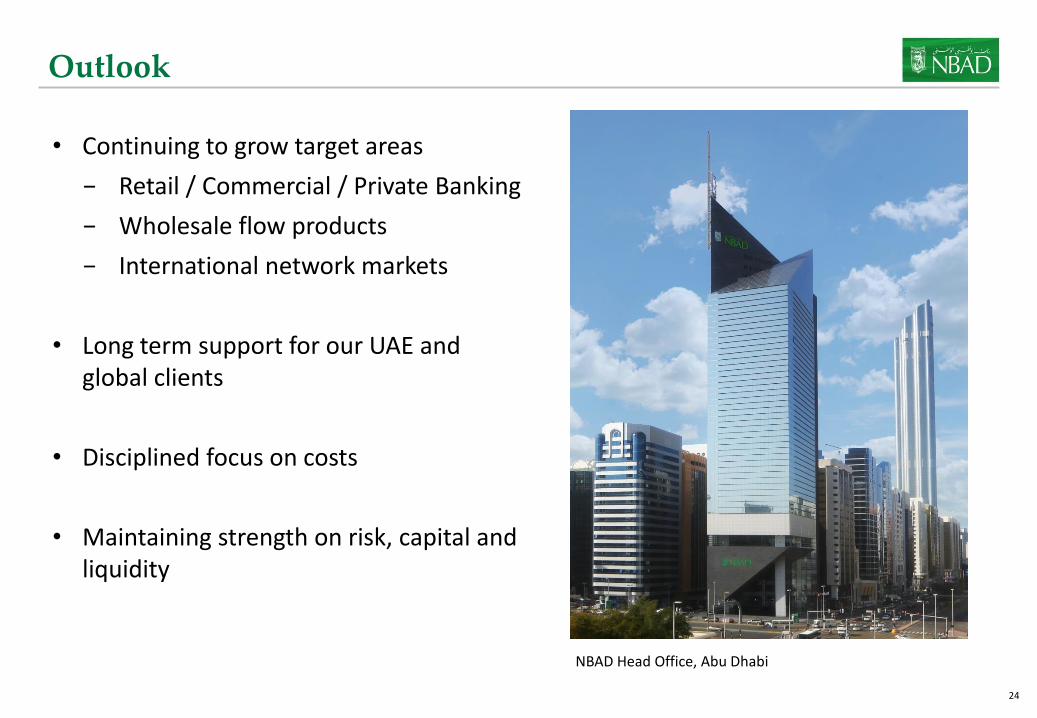
Outlook
• Continuing to grow target areas
− Retail / Commercial / Private Banking
− Wholesale flow products
− International network markets
• Long term support for our UAE and global clients
• Disciplined focus on costs
• Maintaining strength on risk, capital and liquidity
NBAD Head Office, Abu Dhabi

25 25
2,509 2,580 2,570 2,757 2,684 2,718
1Q14 2Q14 3Q14 4Q14 1Q15 2Q15
1,410 1,428 1,370 1,372 1,423 1,446
1Q14 2Q14 3Q14 4Q14 1Q15 2Q15
Franchise growth in strategically targeted areas
• Retail & Commercial
• Wholesale flow products
• International network
Headwinds impacted our results
• Weaker economic tailwind on lower oil prices
• Competition for tighter liquidity impacted margins
• Lower non-customer income in Markets
Cost growth moderating as expected
Continue to prudently manage the bank
• Used our balance sheet strength to support clients in a tighter liquidity environment
• Raised $750m Tier-I capital in line with target to maintain Tier-I ratio ~15%
Returns on equity remain attractive
Franchise growth in strategically targeted areas… …despite headwinds impacting overall profitability
Headwinds impacted growth in profitability
Solid revenue growth, led by targeted areas
Quarterly revenue (AEDm)
Quarterly NPAT (AEDm)
Growth rates expressed vs prior comparable period
Growth YTD ↑6%
2Q ↑5%
Growth YTD ↑1%
2Q ↑1%
26 26
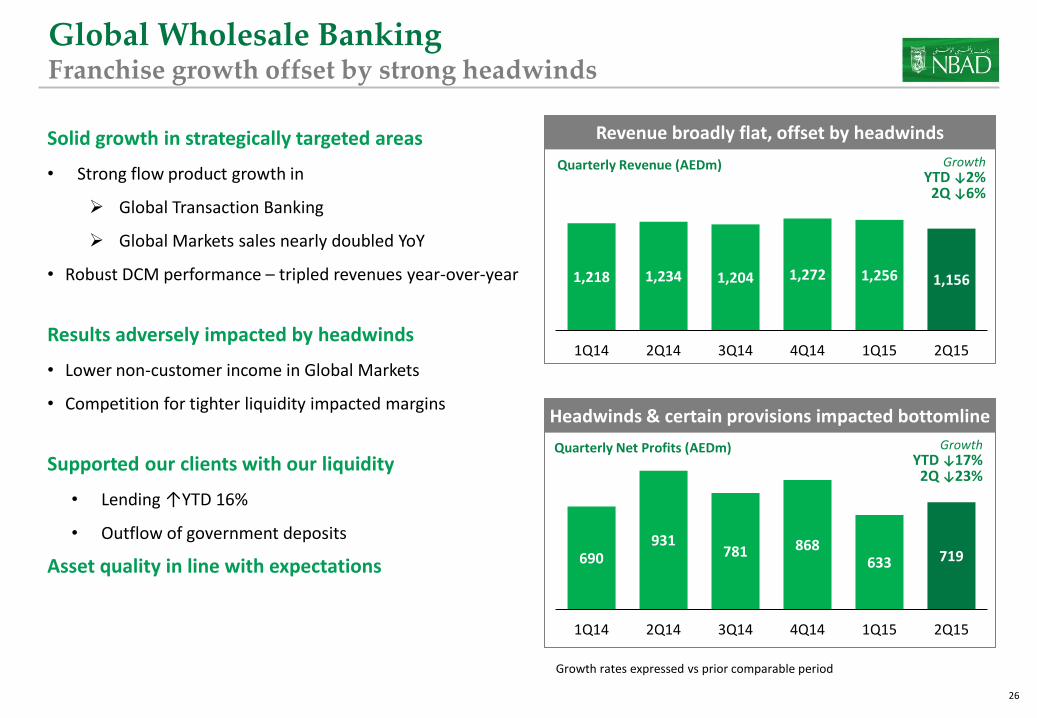
690 931
781 868 633 719
1Q14 2Q14 3Q14 4Q14 1Q15 2Q15
1,218 1,234 1,204 1,272 1,256 1,156
1Q14 2Q14 3Q14 4Q14 1Q15 2Q15
Global Wholesale Banking Franchise growth offset by strong headwinds
Revenue broadly flat, offset by headwinds
Quarterly Revenue (AEDm)
Headwinds & certain provisions impacted bottomline
Growth rates expressed vs prior comparable period
Solid growth in strategically targeted areas
• Strong flow product growth in
Global Transaction Banking
Global Markets sales nearly doubled YoY
• Robust DCM performance – tripled revenues year-over-year
Results adversely impacted by headwinds
• Lower non-customer income in Global Markets
• Competition for tighter liquidity impacted margins
Supported our clients with our liquidity
• Lending ↑YTD 16%
• Outflow of government deposits
Asset quality in line with expectations
Growth YTD ↓2%
2Q ↓6%
Quarterly Net Profits (AEDm) Growth YTD ↓17%
2Q ↓23%
27 27
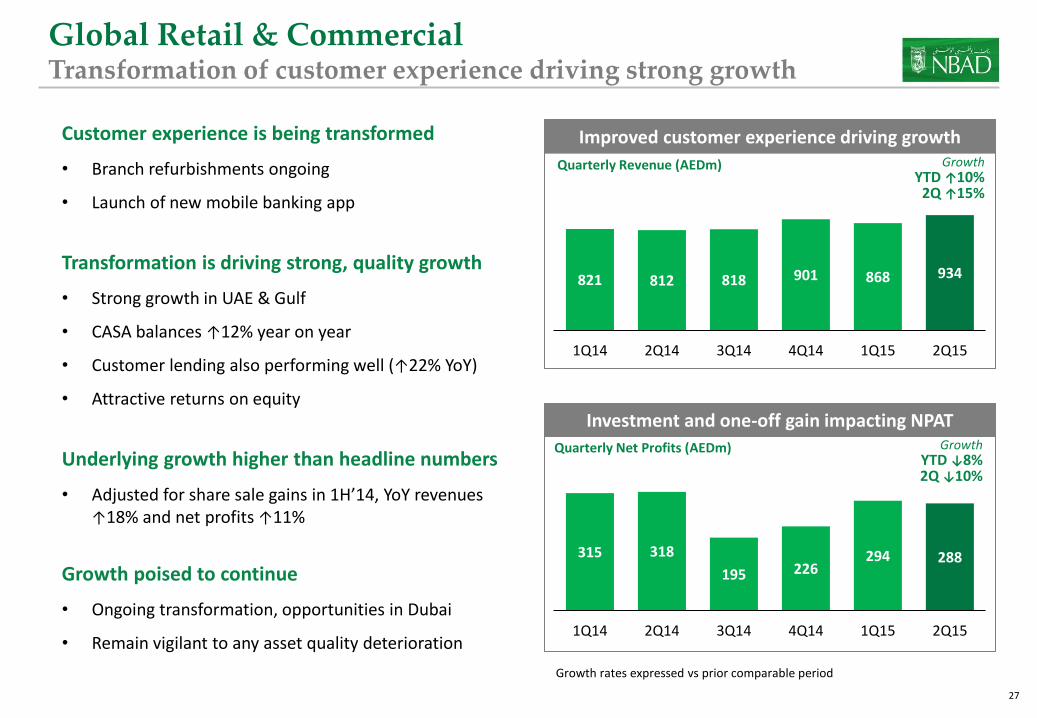
315 318
195 226 294 288
1Q14 2Q14 3Q14 4Q14 1Q15 2Q15
821 812 818 901 868 934
1Q14 2Q14 3Q14 4Q14 1Q15 2Q15
Global Retail & Commercial Transformation of customer experience driving strong growth
Improved customer experience driving growth
Investment and one-off gain impacting NPAT
Growth rates expressed vs prior comparable period
Customer experience is being transformed
• Branch refurbishments ongoing
• Launch of new mobile banking app
Transformation is driving strong, quality growth
• Strong growth in UAE & Gulf
• CASA balances ↑12% year on year
• Customer lending also performing well (↑22% YoY)
• Attractive returns on equity
Underlying growth higher than headline numbers
• Adjusted for share sale gains in 1H’14, YoY revenues ↑18% and net profits ↑11%
Growth poised to continue
• Ongoing transformation, opportunities in Dubai
• Remain vigilant to any asset quality deterioration
Quarterly Revenue (AEDm) Growth YTD ↑10%
2Q ↑15%
Quarterly Net Profits (AEDm) Growth YTD ↓8% 2Q ↓10%
28 28
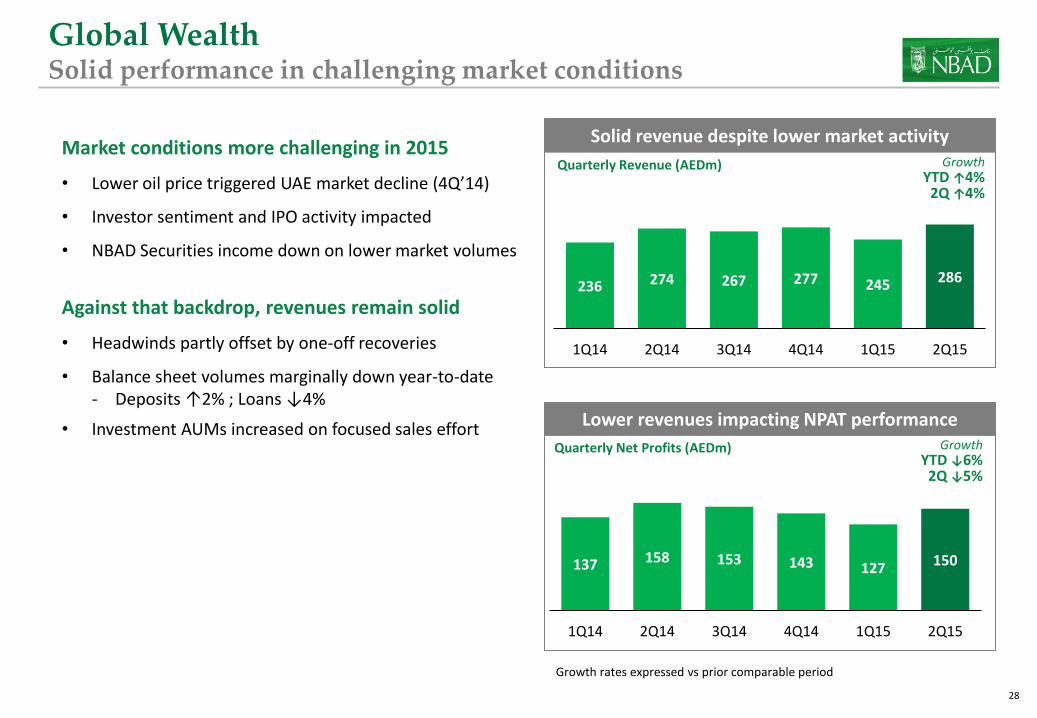
236 274 267 277 245 286
1Q14 2Q14 3Q14 4Q14 1Q15 2Q15
137 158 153 143 127 150
1Q14 2Q14 3Q14 4Q14 1Q15 2Q15
Global Wealth Solid performance in challenging market conditions
Solid revenue despite lower market activity
Lower revenues impacting NPAT performance
Growth rates expressed vs prior comparable period
↑71% Investment AUM
Market conditions more challenging in 2015
• Lower oil price triggered UAE market decline (4Q’14)
• Investor sentiment and IPO activity impacted
• NBAD Securities income down on lower market volumes
Against that backdrop, revenues remain solid
• Headwinds partly offset by one-off recoveries
• Balance sheet volumes marginally down year-to-date - Deposits ↑2% ; Loans ↓4%
• Investment AUMs increased on focused sales effort
NBAD Securities: Quarterly Traded Value (Dh bn)
31 33
17 19
912
1Q14 2Q14 3Q14 4Q14 1Q15 2Q15
Market activity significantly lower
Quarterly Revenue (AEDm) Growth YTD ↑4%
2Q ↑4%
Quarterly Net Profits (AEDm) Growth YTD ↓6%
2Q ↓5%

29 29
1.1% 1.3%
1H'14 1H'15
1.0% 0.5%
2.6%
Jun'14 Jun'15 Group
888 1,041
1H'14 1H'15
Our international network is a key differentiator … Improving returns at lower risk
Our international* network provides unique benefits
• Strong growth potential
• Attractive business characteristics
• Options for sourcing and deploying liquidity
International* revenues are growing strongly
• YoY revenues growing >3x faster than NBAD Group
• Revenues under our Pillar 2 of our strategy (excluding Int’l Retail) growing faster: ↑23% YoY
Well ahead of peer UAE banks internationally
• Wider scope of operations
• Clearly defined strategy and strategic purpose
• Network investment will continue to provide growth opportunities for years to come
International*: providing attractive growth
Rev
enu
e (A
EDm
) N
PLs
R
oR
WA
↑17%
↑20bp
Strong growth
Improving returns
Lower risk
NBAD International* financials
* International includes all overseas operations
Split Intl revenue
by Franchise

30 30
789 867
930
1,110 1,014 1,012
1Q14 2Q14 3Q14 4Q14 1Q15 2Q15
Expense growth is moderating (as expected) Continuing to invest through cost efficiencies
After necessary investment in 2014, expense growth is now moderating
Future cost uplift will be controlled
Improving customer proposition and Building the Spine
Continuing to invest, but funded through cost efficiencies
Quarterly expenses expected to be broadly consistent over 2015
• Branches
• E-channels
• Cash & Trade platforms
• Continued talent upgrades
Current Investment
Priorities
Quarterly operating expenses (AEDm) Growth YTD ↑22%
2Q ↑17%

31 31
80%
95% 10% 5%
L/D ratio -FY2014
Incr in loans Net outflow ofDeposits
L/D ratio -1H'15
Deposits declined… … driven by lending growth and deposit outflows
Growth rates expressed vs prior comparable period
Market liquidity is tighter than 2014 NBAD continues to operate from a position of strength
We continue to have a large funding surplus Using our balance sheet strength to support clients
Deposits plus equity less loans (AEDbn)
Total deposits (AED Bn)
Loan to deposit ratio
YoY ↓3% YTD ↓5%
235 237
265
243 250 230
1Q14 1H14 9M14 FY14 1Q15 1H15
76% 77% 75%
80% 80%
95%
1Q14 1H14 9M14 FY14 1Q15 1H15
91 91 104
86 87
54
1Q14 1H14 9M14 FY14 1Q15 1H15
AED 23b
AED 13b

32 32
Govt, 10% 12% 20%
Corp/Pvt, 39% 40%
Retail, 15% 16%
Banks, 14% 12%
1H'152014
6,160 5,845
3,123 2,851
3,545 3,702
Dec'14 Jun'15
NPLs Specific Prov Collective Prov
251 215 202 200
170 166
0.54% 0.46% 0.40% 0.40%
0.33% 0.30%
1Q14 2Q14 3Q14 4Q14 1Q15 2Q15
Impairment Charges (AED Mn)
CoR% (avg gross loans)
Maintaining a high quality client base
Impairment charges continue to remain low
Growth rates expressed vs prior comparable period
NPLs continue to remain low
Conservative provision coverage
Gross loans by customer type (AED Bn)
Asset quality remains very strong Maintain strong coverage ratios and reduced cost of risk
YTD ↓28% 2Q ↓23%
6.1 6.2 6.2 6.2 6.0 5.8
3.3% 3.3% 3.1% 3.1% 2.9% 2.6%
1Q14 1H14 9M14 FY14 1Q15 1H15
NPLs NPL Ratio
1.76% of CrRWA
112% of NPLs
49% of NPLs
(AED Bn)
(AED Mn)
PublicSector, 21%
202 226

33 33
RoSF continues to remain attractive
Maintaining strong capital ratios
Quarterly Return on Shareholder Funds (annualised)
We continue to generate attractive returns … …while maintaining a very strong capital position
Despite profitability headwinds, RoSF remains strong
• Growth in targeted areas helps boost RoSF
• Margin compression is a drag
Capital ratios maintained despite strong growth
• Organic generation and RWA optimisation
• Highly successful US$750m AT1 issuance
• Exploring options to add greater capital flexibility
Minimum Tier 1 regulatory requirement = 8%
Minimum Total Capital regulatory requirement = 12%
US$750m Add’l Tier 1 Perpetual Bond Launched June 2015
Lowest ever coupon for US$ AT1 offering from a Middle Eastern bank
Investment grade rating
Strong investor interest
Highly diverse geographical distribution
17.7% 17.8% 16.4% 15.9% 16.5% 16.5%
1Q14 2Q14 3Q14 4Q14 1Q15 2Q15
13.7% 14.7% 14.8% 15.0% 14.3%
15.4%
15.2% 16.2% 16.3% 16.4%
15.5% 16.6%
1Q14 1H14 9M14 FY14 1Q15 1H15
Tier 1 CAR
34 34
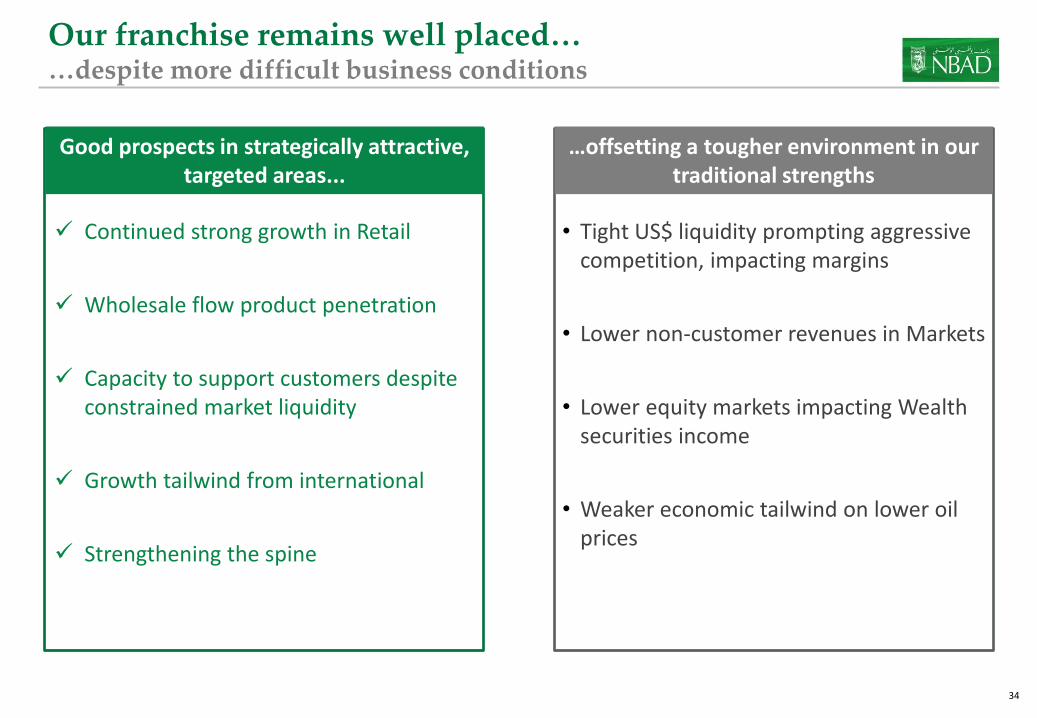
Good prospects in strategically attractive, targeted areas...
…offsetting a tougher environment in our traditional strengths
Continued strong growth in Retail
Wholesale flow product penetration
Capacity to support customers despite constrained market liquidity
Growth tailwind from international
Strengthening the spine
• Tight US$ liquidity prompting aggressive competition, impacting margins
• Lower non-customer revenues in Markets
• Lower equity markets impacting Wealth securities income
• Weaker economic tailwind on lower oil prices
Our franchise remains well placed… …despite more difficult business conditions

35 35
Corporate Access Links
Corporate Headquarters:
One NBAD Tower, Sheikh Khalifa St PO Box 4, Abu Dhabi, UAE Tel : +971-2-6111111 Fax : +971-2-6273170 Website : http://www.nbad.com
Michael Miller Head – Investor, Media & Public Relations
Abhishek Kumat Investor Relations
Fadeela Khamis Corporate Communications (Media & PR)

36 36
UAE, Abu Dhabi & Banking Sector
NBAD Overview
Strategy
Financial Review - 2Q/1H 2015
Appendix
Contents

37 37
1,128
1,077
533 634
99 61
1,761
1,773
1H'14 1H'15
5,089
5,402
65% 67%
35% 33%
1H'14 1H'15
2,580 2,570 2,757 2,684 2,718
68% 70% 69% 67% 68%
32% 30% 31% 33% 32%
2Q'14 3Q'14 4Q'14 1Q'15 2Q'15
Non-Interest IncomeNet Interest Income
Operating Income
1.91%
1.96% 1.94% 1.94%
1.97% 1.98%
1Q'14 1H'14 9M'14 FY'14 1Q'15 1H'15
* NIM% (Ytd) – annualised; based on daily average outstanding balances for performing assets
596 563 619 517
560
213 196 231 351 283 21 14 12 26 35 830 774 862 894 878
2Q'14 3Q'14 4Q'14 1Q'15 2Q'15
Other income FX & Investment income
Fees & comissions
GWB 45%
GRC 33%
GW 10%
HO 12%
Operating Income / Revenues
YTD ↑6% / 2Q ↑5%
2,580 2,570 2,757 2,684 2,718
2Q'14 3Q'14 4Q'14 1Q'15 2Q'15
5,089
5,402
1H'14 1H'15
AED Mn Non-interest Income
UAE 81%
Overseas 19%
Revenue by Segment / Geography (1H’15) Net Interest Margin* Per cent (%)
AED Mn
Per cent (%)
* GWB – Global Wholesale, GRC – Global Retail & Commercial, GW – Global Wealth, HO – Head Office

38 38
3,433
3,376
1H'14 1H'15
867 930 1,110
1,014 1,012
71% 69% 65% 69% 69%
29% 31%
35% 31% 31%
2Q'14 3Q'14 4Q'14 1Q'15 2Q'15
Staff costs Others
1,656
2,026
71% 69%
29% 31%
1H'14 1H'15
Expenses & Operating Profits
GWB 47%
GRC 32%
GW 9%
HO 12%
Operating Expenses
YTD ↑22% / 2Q ↑17%
1,713 1,640 1,646 1,670 1,706
2Q'14 3Q'14 4Q'14 1Q'15 2Q'15
Cost-Income ratio (YTD)
UAE 80%
Overseas 20%
Operating Profits by Segment / Geography (1H’15) Operating Profits
Per cent (%)
AED Mn
34.5%
31.6% 32.7%
33.9%
35.5%
37.8% 37.5%
FY'13 1Q'14 1H'14 9M'14 FY'14 1Q'15 1H'15
YTD ↓2% / 2Q ↓0.4%
AED Mn
* GWB – Global Wholesale, GRC – Global Retail & Commercial, GW – Global Wealth, HO – Head Office
Per cent (%)

39 39
14.6% 13.6% 13.2% 12.9% 10.2% 10.0%
0.54% 0.49% 0.44% 0.43% 0.33% 0.30%
1Q'14 1H'14 9M'14 FY'14 1Q'15 1H'15
CoR as % of Pre-provision ProfitsCoR as % of Gross Loans
121 173
345 163
465
336
1H'14 1H'15
118 123 49 71 102
97 79 151 99 64
215 202 200 170 166
2Q'14 3Q'14 4Q'14 1Q'15 2Q'15
Collective prov chargesSpecific prov charges & Others
6,160 5,845
3,123 2,851
3,545 3,702
6,668 6,552
Dec'14 Jun'15
NPLs Specific Prov Collective Prov
Impairment Charges & Asset Quality
Impairment Charges, net
YTD ↓28% / 2Q ↓23%
Cost of Risk (YTD)
NPLs & Provisions Non-performing loans & NPL ratio AED Mn
AED Mn
6.1 6.2 6.2 6.2 6.0 5.8
3.3% 3.3% 3.1% 3.1% 2.9%
2.6%
1Q14 1H14 9M14 FY14 1Q15 1H15
Dec’14 Jun’15
Specific Prov / NPLs
51% 49%
Collective Prov / CrRWAs
1.88% 1.76%
Total Prov / NPLs
108% 112%
Per cent (%)
AED Bn

40 40
361 348 398 376 400 393
1Q'14 1H'14 9M'14 FY'14 1Q'15 1H'15
Assets & Liquidity
Assets
YTD ↑4% / YoY ↑13%
Asset Mix
Loans to Deposit ratio Risk Weighted Assets Per Cent %
AED Bn Per cent (%)
AED Bn
Loans 55%
Investments 18% DFB &
Reverse repos
6% Cash &
balances with CentralBanks
16% Fixed &
Other assets 5%
76% 77% 75% 80% 80%
95%
1Q14 1H14 9M14 FY14 1Q15 1H15
205 198 205 210 220 229
23 24 24 24 23 21
16 16 17 17 17 17 244 238 246 250 260 268
1Q'14 1H'14 9M'14 2014 1Q'15 1H'15
Credit Market Operational YTD ↑7% / YoY ↑13%
1H’15 AED 393bn
41 41
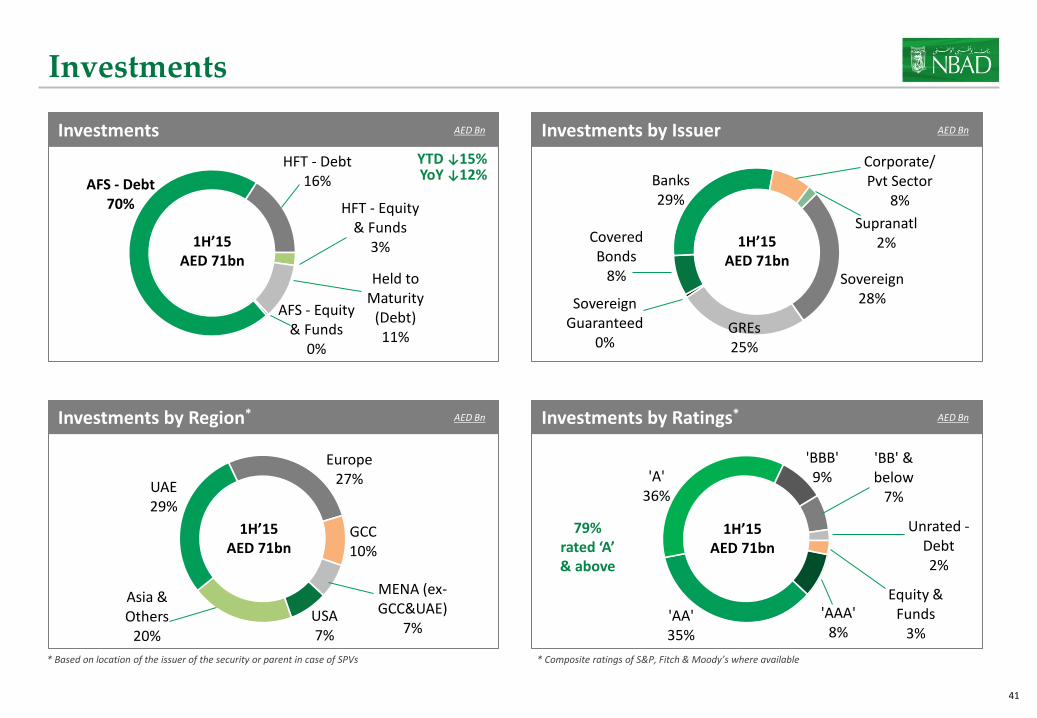
'AAA' 8%
'AA' 35%
'A' 36%
'BBB' 9%
'BB' & below
7%
Unrated - Debt 2%
Equity & Funds
3%
HFT - Debt 16%
HFT - Equity & Funds
3%
Held to Maturity
(Debt) 11%
AFS - Equity & Funds
0%
AFS - Debt 70%
Investments
1H’15 AED 71bn
* Based on location of the issuer of the security or parent in case of SPVs
Investments
YTD ↓15% YoY ↓12%
AED Bn
Sovereign 28%
GREs 25%
Sovereign Guaranteed
0%
Covered Bonds
8%
Banks 29%
Corporate/ Pvt Sector
8%
Supranatl 2% 1H’15
AED 71bn
Investments by Issuer AED Bn
Europe 27%
GCC 10%
MENA (ex-GCC&UAE)
7% USA 7%
Asia & Others
20%
UAE 29%
1H’15 AED 71bn
Investments by Region* AED Bn
1H’15 AED 71bn
Investments by Ratings* AED Bn
79% rated ‘A’ & above
* Composite ratings of S&P, Fitch & Moody’s where available

42 42
1H'152014
Govt
Public Sector
Corp/Pvt
Personal/ Retail
Banks
178 182 198 194 200
218
1Q'14 1H'14 9M'14 FY'14 1Q'15 1H'15
Loans and Advances
32%
202 226
Real Estate, 15%
Govt, 10%
Construction, 4%
Energy, 8%
Personal loans for
consumption, 11%
Personal loans -
others, 4%
Banks, 14%
Other FIs, 9%
Trading, 5%
Transport, 8%
Services, 3%
Mfg, 7%
Others 0%
1H’15 AED 226bn
Loans & advances, net AED Bn
YTD ↑12% YoY ↑20%
Gross loans by customer type AED Bn
40%
16% 12%
40%
16% 12%
31%
Gross loans by industry Per Cent %
UAE 74%
Europe 16% GCC
3%
MENA 2%
Asia 3%
USA 2%
1H’15 AED 218bn
Net loans by region* Per Cent %
* Based on location of booking of the loan
43 43
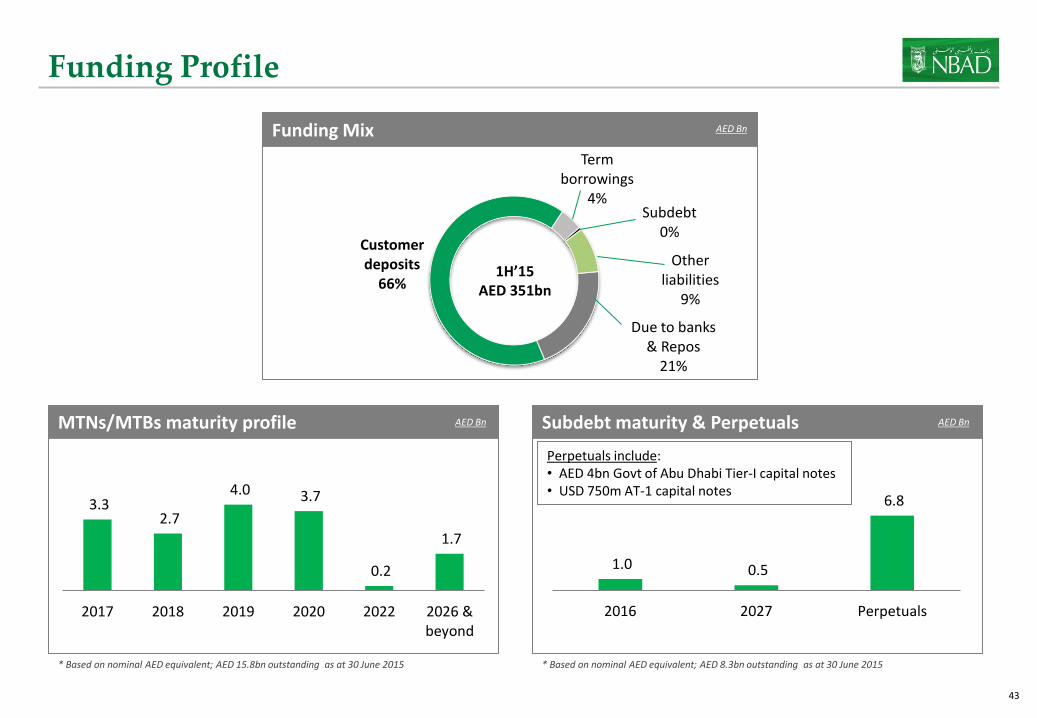
Funding Profile
Funding Mix AED Bn
MTNs/MTBs maturity profile AED Bn
Due to banks & Repos
21%
Customer deposits
66%
Term borrowings
4% Subdebt
0%
Other liabilities
9%
1H’15 AED 351bn
Subdebt maturity & Perpetuals AED Bn
* Based on nominal AED equivalent; AED 8.3bn outstanding as at 30 June 2015 * Based on nominal AED equivalent; AED 15.8bn outstanding as at 30 June 2015
3.3 2.7
4.0 3.7
0.2
1.7
2017 2018 2019 2020 2022 2026 &beyond
1.0 0.5
6.8
2016 2027 Perpetuals
Perpetuals include: • AED 4bn Govt of Abu Dhabi Tier-I capital notes • USD 750m AT-1 capital notes

44 44
1H'152014
Govt
Public Sector
Corp/Pvt
Retail
235 237 265 243 250 230
1Q'14 1H'14 9M'14 FY'14 1Q'15 1H'15
Customer Deposits
28%
243 230
Customer deposits AED Bn
YTD ↓5% YoY ↓3%
Deposits by customer type AED Bn
16%
30%
26%
22%
34%
30%
14%
Deposits by account type AED Bn
UAE 67%
Europe 19% GCC
3%
MENA 6%
Asia 3%
USA 2%
1H’15 AED 230bn
Deposits by region* Per Cent %
* Based on location of booking of the deposit
235 237 265 243 250 230
67% 66% 69% 66% 66% 60%
27% 27% 26% 28% 28%
31%
6% 6% 5% 6% 7% 8%
1Q'14 1H'14 9M'14 FY'14 1Q'15 1H'15
CDs & Margin A/c's CASA Notice & Time

45 45
Results at a Glance
2Q'15 1Q'15 QoQ
% growth2Q'14
YoY
% growth1H'15
YoY
% growth
Income statement (AED mn)
Net Interest Income
(incl income from Islamic financing)1,840 1,789 2.8% 1,749 5.2% 3,629 9.1%
Non Interest Income 878 894 -1.8% 830 5.8% 1,773 0.7%
Revenue 2,718 2,684 1.3% 2,580 5.4% 5,402 6.2%
Expenses (1,012) (1,014) -0.2% (867) 16.8% (2,026) 22.4%
Operating Profits 1,706 1,670 2.2% 1,713 -0.4% 3,376 -1.7%
Impairment Charges, net (166) (170) -2.3% (215) -22.6% (336) -27.7%
Prov for Taxes (93) (76) 22.2% (70) 33.0% (170) 30.6%
NET PROFIT 1,446 1,423 1.6% 1,428 1.3% 2,869 1.1%
Balance Sheet (AED bn)
Assets 393 400 -1.9% 348 12.7% 393 12.7%
Loans & Advances 218 200 8.8% 182 19.9% 218 19.9%
Deposits & Others 230 250 -7.9% 237 -3.1% 230 -3.1%
Ratios %
RoE % 14.6% 15.1% -46bps 16.2% -156bps 14.4% -163bps
RoSF % 16.5% 16.5% -1bps 17.8% -135bps 16.3% -126bps
NIM % 1.98% 1.97% 1bps 1.96% 2bps 1.98% 2bps
Cost / Income % 37.2% 37.8% -57bps 33.6% 360bps 37.5% 497bps
JAWS % 1.4% -11.4% -16.2%

46 46
Balance Sheet
Balance Sheet (AED Bn) Jun'15 Mar'15 qoq %
growthJun'14
yoy %
growth
Assets
Cash & Balances with Central Banks 61.9 73.1 -15.3% 33.9 82.5%
DFB & Reverse Repos 22.4 32.7 -31.4% 39.1 -42.7%
Investments 70.9 74.6 -5.0% 80.3 -11.8%
Loans & Advances 217.9 200.2 8.8% 181.7 19.9%
Other Assets 19.5 19.8 -1.3% 13.3 46.5%
Total Assets 392.6 400.3 -1.9% 348.5 12.7%
Liabilities & Equity
DTB/Repos/ECPs 80.4 69.7 15.4% 38.2 110.6%
Deposits & Others 230.1 249.8 -7.9% 237.4 -3.1%
CASA 71.5 69.6 2.7% 64.3 11.2%
Others 158.6 180.3 -12.0% 173.2 -8.4%
Term Borrowings/Subdebt 17.0 16.5 3.0% 20.4 -16.6%
Short term (<1 yr) 0.9 1.5 -39.1% 6.8 -86.6%
Long term 16.1 15.0 7.3% 13.6 18.4%
Other Liabilities 23.5 26.8 -12.3% 16.5 42.5%
Capital & Reserves 41.6 37.6 10.8% 36.0 15.5%
Total Liabilities & Equity 392.6 400.3 -1.9% 348.5 12.7%
47 47
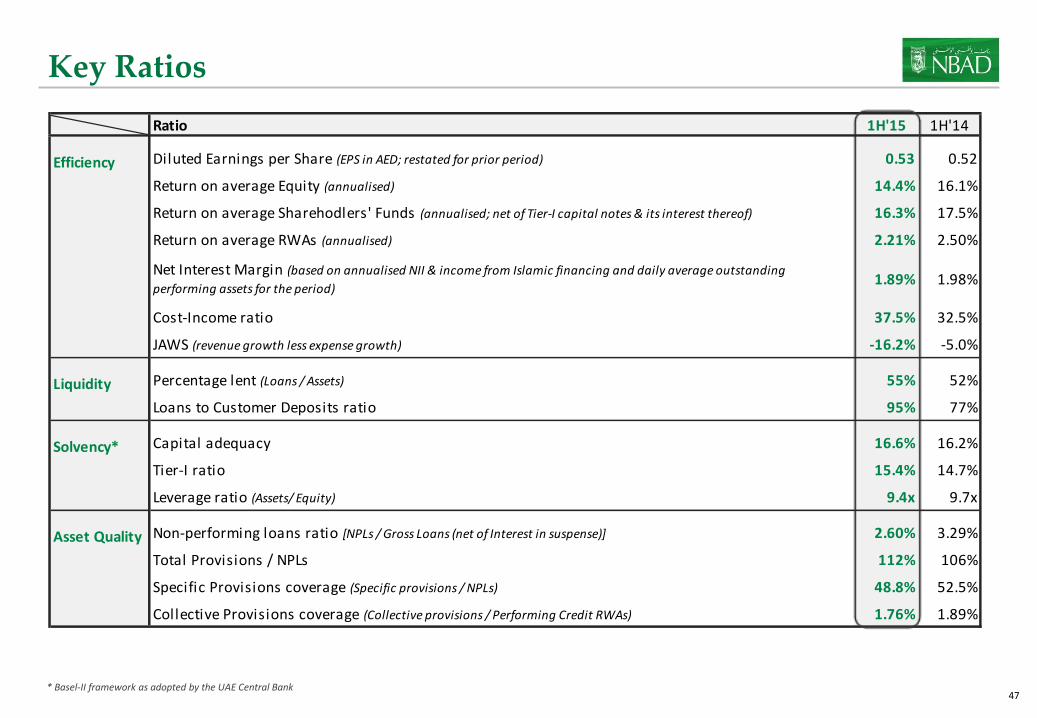
Key Ratios
* Basel-II framework as adopted by the UAE Central Bank
Ratio 1H'15 1H'14
Efficiency Diluted Earnings per Share (EPS in AED; restated for prior period) 0.53 0.52
Return on average Equity (annualised) 14.4% 16.1%
Return on average Sharehodlers' Funds (annualised; net of Tier-I capital notes & its interest thereof) 16.3% 17.5%
Return on average RWAs (annualised) 2.21% 2.50%
Net Interest Margin (based on annualised NII & income from Islamic financing and daily average outstanding
performing assets for the period)1.89% 1.98%
Cost-Income ratio 37.5% 32.5%
JAWS (revenue growth less expense growth) -16.2% -5.0%
Liquidity Percentage lent (Loans / Assets) 55% 52%
Loans to Customer Deposits ratio 95% 77%
Solvency* Capital adequacy 16.6% 16.2%
Tier-I ratio 15.4% 14.7%
Leverage ratio (Assets/ Equity) 9.4x 9.7x
Asset Quality Non-performing loans ratio [NPLs / Gross Loans (net of Interest in suspense)] 2.60% 3.29%
Total Provisions / NPLs 112% 106%
Specific Provisions coverage (Specific provisions / NPLs) 48.8% 52.5%
Collective Provisions coverage (Collective provisions / Performing Credit RWAs) 1.76% 1.89%

48