annual report 2013 - tradedoubler€¦ · 2 tradedoubler annual report 2013 dear reader,...
TRANSCRIPT

Annual Report 2013
financials.tradedoubler.com

Tradedoubler Annual Report 20132
Dear reader,Tradedoubler’s business is online and therefore we think it is natural that it is also the main focus of our financial communication. We have chosen to publish the main description of our operations on our home page and focus in the annual report on describing the performance during 2013. Our ambition is to offer sha-reholders and other investors an effective and easily accessible way of reading
up-to-date and relevant information on: www.financials.tradedoubler.com.
A print version of the annual report may be ordered from:
Tradedoubler ABBirger Jarlsgatan 57A
113 56 StockholmTel. +46 8 40 50 800
E-mail: [email protected]
Give us your views!
Can we make the annual report better?
We would love to receive your suggestions and views,
e-mail: [email protected]

Tradedoubler Annual Report 2013 3
Financial calendar
Interim report (January-March 2014) 6 May 2014
Annual general meeting 6 May 2014
Interim report (January-June 2014) 25 July 2014
Interim report (January-September 2014) 29 October 2014
Year-end report 2014 6 February 2015
Contents
AnnuAl REpORT 2013
Board of Director’s Report 4
Risks and uncertainty factors 9
Corporate governance 10
Financial information
Consolidated accounts 16
notes to the consolidated accounts 20
parent company accounts 35
notes to the parent company accounts 39
Board and CEO’s signatures 44
Auditer s report 45
Board of Directors 46
Group Management 47
Definitions and glossary 48
5-year summary
SEK M 2013* 2012* 2011* 2010* 2009
net sales 2,001 2,308 2,613 2,478 3,014
Gross profit 455 541 627 622 690
Gross margin % 22.7 23.5 24.0 25.1 22.9
Costs -432 -541 -499 -529 -795
Operating profit 24 0 127 93 -105
Operating margin % 1.2 0.0 4.9 3.7 -3.5
* For 2010, 2011, 2012 and 2013 the numbers are related to continu-ing operations after the divestment of the Search business. no adjustments are made for 2009.
Key figures 2013
net sales amounted to SEK 2,001.3 M (2,307.7), a decrease adjusted for changes in exchange rates of 11.5%.
Gross profit amounted to SEK 455.3 M (541.5), a decrease adjusted for changes in exchange rates of 14.4%.
Operating profit (EBIT) amounted to SEK 23.5 M (0,0).
Cash flow from operating activities was SEK 125.5 M (-14.9).
Earings per share for continuing operations amounted to SEK 0.3 (-0.2).
The Board proposes a dividend of SEK 0.25 (0.0) per share.
The information in the annual report
TradeDoubler AB (publ), 556575-7423, is a Swedish public limited liability company with its registered office in Stock-holm. The company is subject to Swedish laws and as a listed company is obliged to comply with nASDAQ OMX Stockholm’s rules and regulations which govern information disclosure to the market.
All values are stated in Swedish kronor. Kronor expressed in millions is abbreviated to SEK M and kronor expressed in thousands is abbreviated to SEK ’000. numerical data in brackets refers to 2012 unless otherwise stated. Infor-mation about markets and the competitive situation is Tradedoubler’s own assessment, unless a specific source is provided. You can subscribe to press releases and financial reports on Tradedoubler’s website.
The Annual Report is prepared in Swedish and translated into English. Should differences occur between the Swedish Annual Report and the English translation, the Swedish version shall prevail.

Tradedoubler Annual Report 2013
Board of Director’s Report
4
Tradedoublers operations Tradedoubler is a leading international performance mar-keting company. It implements performance marketing campaigns for over 2,000 advertisers through its network of more than 130,000 publishers in over 30 countries. In 2013 it generated SEK 27bn incremental revenue for its clients through e-commerce and m-commerce.
Business Model
Tradedoubler devises and implements performance market-ing strategies for companies who want to boost their online revenue.
Working through Tradedoubler’s advanced performance marketing technology platform, publishers select advertise-ments and place them on their websites. These advertise-ments drive traffic back to the advertiser’s website and if that traffic results in the desired transaction the publisher receives a payment from the advertiser. Tradedoubler is paid a commission for every successful transaction. This busi-ness model is distinct from other forms of online marketing such as display and search in that the advertiser only pays for results.
Performance marketing – Tradedoubler’s core business
Tradedoubler’s core business is based on its Technology platform which gives the advertisers a broad range of tech-nical possibilities combined with a vast range of publishers connected to the network. The performance marketing busi-ness is measuring what activity is generated by the adver-tisement enabling payment to be linked to a specific action, such as a sale or lead.
One of the key competitive advantages of Tradedoubler’s performance marketing solution is its ability to track across between online, mobile web and app solutions.
Tradedoubler’s international network enables it to help its advertisers expand into markets where they do not have a physical presence. Its client services team can offer a single point of contact for advertisers requiring account manage-ment across multiple markets. Tradedoubler has vertical expertise in travel, fashion, health & beauty, retail, electronic consumer goods, finance and telecoms and counts some of the most renowned companies in the world among its clients.
The Technology Offering
The Tradedoubler Technology platform is also offered as
an advanced, Software-as-a-Service solution that provides larger advertisers and digital media agencies with the means to manage performance marketing programmes in-house. More than 200 clients currently use the company’s technol-ogy platform.
Tradedoubler’s powerful Technology platform enables clients to run their own private network. Alternatively, they can combine their own private network with the reach and performance benefits of Tradedoubler’s fully managed international publisher network. The company’s ability to offer larger clients a powerful technology solution is vital in order to achieve the goal of creating long-term and strategic added value for clients.
The Tradedoubler Technology platform supports the administration and management of performance market-ing programmes as well as tracking of other online market-ing channels such as email, search and display campaigns. Advertisers can benefit from lower costs, direct contact with their partners and the mapping of the entire customer journey across all channels, with real-time monitoring and reporting.
Market Tradedoubler operates in the dynamic and rapidly growing European online market. This broad field encompasses a host of different marketing disciplines, of which perfor-mance marketing is one. While overall consumer spend has been constrained in recent times, online expenditure has remained buoyant. E-commerce is forecast to increase by an average 8 per cent a year from €225bn in 2013 to €315bn by 20171. Internet advertising in Western Europe is forecast to continue to grow as online takes a larger share of total ad spend. The media service agency ZenithOptimedia2 fore-casts that online ad spend in Western Europe will increase from €18bn in 2013 to around €23.6bn by 2016, an average annual growth of close to 10 per cent. While most online marketing occurs via traditional websites, marketing on smartphones and tablets is growing very rapidly
The combination of increased online and mobile commerce and digital advertising spend implies continued growth for performance marketing in Europe. However, growth is expected to be lower than the near double digit growth in total online marketing spend and margin pressure is
Board of Director s ReportThe board of directors and the chief executive officer of TradeDoubler AB (publ), corporate registration number 556575-7423, hereby submit the annual accounts for the operations in the parent company and the group for the financial year 2013.
1. eMarketer Worldwide B2C Ecommerce. Q1 2014 Forecast and Comparative Estimates’.
2. Advertising Expenditure Forecast, December 2013.

Tradedoubler Annual Report 2013
Board of Director’s Report
5
Long term financial targetsIn the year-end report the Board communicated a new long term financial target for the Tradedoubler group. The new financial targets are to grow net sales in excess of 5 per cent annually in local currency and deliver an EBITDA/Gross profit-ratio in excess of 20 per cent over a business cycle.
Significant events during the yearIn December 2013 a restructuring programme was announced. The change measures are expected to reduce operating costs by SEK 55 M annually with full impact from the second half of 2014. The programme affected total costs with SEK 32 M in Q4 2013. The programme includes the closure of the offices in Copenhagen and Helsinki with these operations run from a strengthened office in Stockholm. Also, it was decided to close the office in Brazil due to its continued dependence on the non-core campaign market-ing business. latin America will continue to be a focus area for Tradedoubler, primarily for its Technology offering.
For further details see the section about events after the balance sheet date on page 8.
Product developmentTradedoubler’s overall objective within the product devel-opment area is to maintain and strengthen its position as a leading technology supplier in performance marketing.
An important change in Tradedoubler’s development strat-egy in 2013 was to further emphasise the product life cycle framework. The framework is based on a comprehensive perspective in order to develop, launch and maintain mar-ket-leading products, thereby providing more added value to the group’s clients. This successful approach has resulted in shortened development times, improved delivery precision and closer collaboration with clients.
In order to further strengthen Tradedoubler’s client focus regular customer workshops are being held with the group’s key clients across the different geographies in which Trade-doubler operates. The aim is to present product innovations and boost awareness of Tradedoubler’s latest releases at an early stage. During 2013 Tradedoubler added significant new functionality to its already strong product portfolio. The foundation for the core performance marketing busi-ness is Tradedoublers strong tracking functionalities which were enhanced further during 2013. For example, mobile in-app tracking possibilities has improved the company’s already strong, award winning3 mobile offering. Some of the other products released in 2013 are; a new software within product feeds and voucher codes, enhancements to the billing and payment processes and an enhanced mobile reporting suite.
Costs referring to research and development and product maintenance (product development) amounted to SEK 40.2 M (58.9) in 2013, corresponding to 8.8 (10.9) per cent of gross profit. In addition, Tradedoubler capitalised SEK 18.8 M (15.6) attributable to product development.
expected to continue as the sector matures. Tradedoublers largest competitors are the pan European companies Zanox and Affilinet both of which are headquartered in Germany.
Key building blocks for profitable growth in place In 2014, Tradedoubler expects underlying market growth in most of its markets, supporting the company’s overall target of profitable growth within its core business performance marketing. The restructuring of the company, the appoint-ment of a Chief Revenue Officer and the 250 MSEK corporate bond issue – all announced close to the beginning of 2014 – are key building blocks to deliver profitable growth.
To further increase focus on the Company’s core business and geographical markets all relevant campaign activity is being integrated into the performance marketing business unit and offices in non-core markets have been closed. The recent restructure also includes the transfer of additional administrative tasks to the support centre in Telford, uK. The overall aim of the restructure and other ongoing efforts is to create a simpler, more streamlined and cost efficient organi-zation that can deliver revenue growth at a low marginal cost.
The strengthening of the management team with a Chief Revenue Officer (CRO) is an important step in addressing the negative revenue trend within Tradedoublers core business. The CRO is responsible for leading the Regional Directors, the international sales and corporate client teams.
The well received SEK 250 million corporate bond issue strengthens Tradedoubler’s financial position and is an important step in improving long-term prospects for expanding the core performance marketing business. The Company is currently evaluating strategic opportunities to drive growth organically as well as through acquisitions. 3. Best Mobile Affiliate Campaign 2012, uK Effective Mobile Marketing
Awards.
The illustration displays the market units 2013. A new ope-rational organisation with six regional units was established ahead of 2013. A special Client Support Team has been set up in Telford, uK for handling client administration.

Tradedoubler Annual Report 2013
Board of Director’s Report
6
Sales, earnings and profitabilityConsolidated net sales during 2013 amounted to SEK 2,001.3 M (2,307.7), a fall of 11.5 per cent adjusted for changes in exchange rates. The year has seen a significant decline in the non-strategic campaign segment. During the recent restruc-ture the campaign teams in most markets were integrated into the larger client facing performance marketing teams. This makes it possible to continue to deliver campaign prod-ucts while simultaneously strengthening the focus on per-formance marketing. There will still be dedicated campaign teams in a small number of markets where Tradedoubler still has a significant footprint within that niche.
net sales within performance marketing were adversely affected by the loss of a small number of significant clients, during 2013 and 2012. The negative developments in France and Southern Europe also impacted the performance. Tradedoubler France was negatively affected by a significant reduction within the e-mail channel due to a change in prac-tice in the French market, while in southern Europe Trade-doubler was hampered by the macro economic conditions.
In summary, the recent restructure has allowed Tradedoubler to increase its strategic focus on performance marketing. While a return to growth has taken longer than anticipated, the overall decline in revenues has slowed and we are seeing positive signs of growth in a number of markets.
Gross margin in 2013 decreased by 0,8 percentage points to 22.7 per cent (23.5) compared to 2012. Gross margin was negatively impacted by the decrease in campaigns as well as the maturing market conditions resulting in price pressure within performance marketing.
Gross profit in 2013 was SEK 455.3 M (541.5), a decline of 14.4 per cent adjusted for changes in exchange rates.
Operating costs excluding depreciation during 2013 amounted to SEK 401.9 M (519.3), a decrease of 21.4 per cent adjusted for changes in exchange rates. The operating costs were affected by change related costs amounting to SEK 22.0 M (31.1). The change related costs in the forth quarter 2013 of SEK 22.0 M (10.9) included mainly severance pay and costs for closing the unprofitable offices in Copenhagen and Helsinki.
Operating costs, excluding change related costs, in 2013 corresponded to an average of SEK 31.7 M per month, a decrease of 20.9 per cent adjusted for changes in exchange rates compared to 2012.
Depreciation, amortisation and impairment losses amounted to SEK 29.9 M (22.2). The difference compared to 2012 can mainly be explained by a write down of intangible assets related to administration and support systems of SEK 10.0 M (0).
Operating profit (EBIT) amounted to SEK 23.5 M (0.0). Exclud-ing change-related costs and impairment of intangible fixed assets, the equivalent figure was SEK 55.5 M (30.9).
Financial income and expenses amounted to SEK -3.4 M (0.3). In December Tradedoubler issued a bond loan and invested the proceeds in corporate bonds and subordinated loans as well as short term commercial paper. The issue of the bonds and its subsequent investments did not have any material impact on the financial income and expense.
profit after tax for continuing operations amounted to SEK 11.4 M (-10.2). Tax affected profit by SEK -8.7 M (-10.5). Of this amount, SEK 3.5 M (17.9) was related to deferred tax and SEK -0.6 M (-13.6) to tax adjustments from previous years.
Discontinued operationsThe operations in the Search market unit were sold during the fourth quarter of 2011, after which these operations are reported as discontinued operations in the income state-ment.
The net effect on consolidated equity from the disposal amounted to SEK 0.0 M (2.2). During 2012, the transaction was completed which meant further sales-related adjust-ments, amounting to SEK 2.2 M in total.
The total impact from the divestment on consolidated equity was SEK -42.8 M and an adjustment was made in equity from translation difference to net profit for the year of SEK -101.8 M in total.
Net sales per operating unit 2013 EBITDA per operating unit 2013
DACH
East
France & Benelux
Nordics
South
UK & Ireland
Technology
SEK M 100 200 300 400 500
DACH
East
France & Benelux
Nordics
South
UK & Ireland
Technology
SEK M 10 20 30 40 50

Tradedoubler Annual Report 2013
Board of Director’s Report
7
Cash flow Cash flow from operating activities during 2013 was SEK 125.5 M (-14.9). Increased earnings together with favour-able changes in working capital contributed to the positive development. However, the positive working capital devel-opments are related to temporary effects mainly relating to lower publisher payments than usual at the end of 2013. For further information, see Financial position below.
net investments in intangible assets decreased to SEK -29.8 M (-36.2). These investments mainly consisted of improve-ments to production and business systems as well as product development. A number of large projects that have spanned the last few years were finalized which reduced the investments in intangible assets.
The cash flow from financing activities has been positively affected by the corporate bond issue in December with SEK 244.6 M (0.0). The proceeds from the bond issue have been invested in interest-bearing financial instruments amounting to SEK -203.1 M (0.0).
Cash flow for the year from remaining operations was SEK 129.1 M (-120.1).
Financial position
Bond Loan
In December Tradedoubler issued a five-year senior unse-cured bond loan of SEK 250 M with maturity on December 20, 2018. The bond loan has an annual fixed coupon rate of 6.75% and a total framework amount of SEK 375 M. The bond loan was listed on nASDAQ OMX Stockholm in January 2014. The offering was oversubscribed after broad interest from individual investors as well as institutions.
The proceeds of SEK 244.6 M after transaction costs were invested in interest-bearing financial instruments, according to the financial policy adopted by the Board of Directors. As of December 31, investments were made in corporate bonds and subordinated loans with a book value of SEK 201.8 SEK. The remaining part of the bond proceeds was as of Decem-ber 31 invested in short term commercial papers, which are included in cash and cash equivalents in the balance sheet.
According to the terms and conditions of the bond loan, dividend distributions are subject to that the ratio of the Group’s net interest bearing debt to EBITDA does not exceed 2.0 and that the Group’s interest coverage ratio exceeds 3.0. Dividend distributions are also restricted to the higher of (A) the Group’s consolidated net profit according to the annual audited financial statements for the previous financial year and (B) an amount equal to the net cash position less SEK 100 M. The full terms and conditions of the bond loan are provided in the prospectus, which is available on the com-pany’s website and from the Swedish Financial Supervisory Authority.
Other
Working capital at year-end amounted to SEK -223.6 M (-128.6), a decrease of SEK 95.0 M. Working capital primarily decreased due to a favourable change in accounts receiv-able and publisher debt at year-end compared to last year. At the beginning of 2014 the company saw a normalisation of working capital. Cash and cash equivalents amounted to SEK 304.7 M (164.4) while short term investments amounted to SEK 201.8 M (0.0). The total assets amounted to SEK 1,468.9 M (1,190.1).
Consolidated shareholders’ equity amounted to SEK 506.5 M (488.4) at the end of 2013. The return on equity was 2.3 per cent (neg.).
The equity/assets ratio decreased to 34.5 per cent (41.0). The negative variance compared to previous year is mainly due to the issue of the corporate bond.
Tradedoubler has a significant goodwill item due to a previ-ous acquisition in the uK. This goodwill item has been allo-cated to the group’s cash-generating units, the six market units and Technology, and is tested for impairment at least on an annual basis.
Parent Company The parent company’s net sales amounted to SEK 121.6M (128.9). Revenue primarily consisted of licensing revenue and remuneration from subsidiaries for centrally performed services. licensing revenues are based on the underlying profitability in subsidiaries in accordance with the group’s transfer pricing agreement.
Financial income and expenses amounted to SEK 63.8 M (-1.0). Financial income and expenses is mainly affected by dividends from subsidiaries of SEK 86.1 M (2.4) and impair-ment related write downs of shares in subsidiaries in the uK, Russia and Brazil amounting to SEK 26.1 M ( 9,2).
profit after tax amounted to SEK 50.2 M ( 38.1).
The parent company’s receivables from group companies amounted to SEK 109.9 M (121.1) at year-end, of which none (0.0) were non-current. The parent company’s liabilities to group companies amounted to SEK 156.2 M (191.1), of which none (0.0) were non-current. Cash and cash equivalents amounted to SEK 154.4 M (57.1).
EmployeesAt the end of 2013, Tradedoubler’s staff corresponded to 449 (465) full-time equivalents (FTEs), which includes full-time, temporary and contract employees. The average number of full-time equivalents was 463 (488).

Tradedoubler Annual Report 2013
Board of Director’s Report
8
The share and ownershipTradedoubler’s share was listed on nASDAQ OMX Stockholm on 8 november 2005 and is traded on the list for Small Cap companies on nASDAQ OMX Stockholm. The share is clas-sified as Information Technology. The share capital on 31 December 2013 amounted to SEK 17.1 M distributed among 42,807,449 shares, each with a quota value of SEK 0.40. All shares carry equal rights to share in the company’s assets and profits. Each share carries one vote. At the general meeting, each shareholder is entitled to vote for all shares he/she holds and represents without restriction as to the number of votes cast.
Tradedoubler’s share price increased during the year by 49.6 per cent from SEK 12.50 to SEK 18.70 on 31 December 2013. The highest price recorded during the year was SEK 23.50 and the lowest price was SEK 11.80. The market capitalisa-tion on 31 December 2013 amounted to SEK 792 M.
At year-end Tradedoubler had 3,036 (2,937) shareholders. The company’s largest shareholder was Monterro 1A AB with 18.1 per cent of the capital and votes. The five largest share-holders, consisting of financial and institutional players, jointly owned 42,7 (40.5) per cent of the shares. At year-end, Swedish financial and institutional players owned 32.0 per cent (56.7) of the shares and Swedish private individuals owned 12.3 per cent (7.2) of the shares. Other and non-cat-egorized legal entities have increased to 35.4 per cent from 6.7 per cent last year. Foreign ownership decreased during 2013 to 17.0 per cent (26.1). The board of directors and group management jointly owned approx. 0.4 percent (0.3) of the votes and capital.
Tradedoubler has 475,000 shares (130,000) in its own custody related to the long-term incentive programmes for the company management.
For more information regarding the share, see Tradedou-bler’s investor site: http:// financials.tradedoubler.com/en-gb/Investor-Relations/ Tradedoubler-share
Dividend Tradedoubler has a policy of distributing at least 50 per cent of its profit after tax provided that a suitable capital structure is maintained. The distribution may occur through share dividends, share redemption and share buybacks.
The Board proposes that a dividend of SEK 0.25 (0.0) should be paid to the owners in accordance with the dividend policy for the group. The dividend of SEK 0.25 corresponds to 93 per cent of profit after tax. For additional information regarding future dividends see the bond loan section, page 7.
Events after the balance sheet dateAs a result of the restructuring communicated at the end of the year Tradedoubler will change the way the company reports its operating segments. Operations within affiliate will continue to be divided on market units with the change that nordic and East will be merged into one unit, and that the campaign activities will be broken out and reported separately.
Technology and cost for group-management and other supporting units will continue to be reported as separate segments.
The new segmentation will look as follows:
DACH: Austria, Germany, Switzerland,
France & Benelux: Belgium, France, netherlands
North: Denmark, Finland, norway, poland, Sweden
South: Brazil, Italy, portugal, Spain
UK & Ireland: uK, Ireland
Technology
Other: Campaign and other
Changes to group managementAt the beginning of 2014 the Company communicated two additions to the group management. Tomas ljunglöf was appointed as CFO filling the vacancy after the resignation of Jonas Ragnarsson. Richard Julin was appointed to the newly created position as CRO with the responsibility for new sales and the market units.
With the changes to the senior management of the company the management team will consist of: Rob Wilson (CEO), Tomas ljunglöf (CFO), Richard Julin (CRO), Andrew Buckman (CSO) and Magnus nyström (CTO).
Proposed distribution of earningsAt the disposal of the Annual General Meeting of the parent company:
SEK
Share premium reserve 352,540,285
Retained earnings -292,470,336
net profit for the year 50,174,610
Total non-restricted equity 110,244,559
The Board of Directors propose to declare an ordinary divi-dend of SEK 0.25 per share (0.0). Adjusted for 475,000 shares in own custody, the dividend will utilise SEK 10,583,112. It is proposed that the remaining profit of SEK 99,661,447 be carried forward.

Tradedoubler Annual Report 2013
Board of Director’s Report
9
Risks and uncertainty factorsIdentifying and managing risks is a central component in the governance and control of Tradedoubler’s business and is incorporated in all parts of the operations. In addition to the ongoing work on identifying and managing risks in the group, a thorough annual review is also performed in con-junction with the strategic overview. Risks are continuously reported to the board and company management. Through clear processes and routines, the company’s goal is to take advantage of the opportunities presented in a rapidly chang-ing market, while, minimising the risk for damage and losses.
Tradedoubler distinguishes between market-related risks, operational risks, financial risks and legal risks.
As all businesses Tradedoubler has market-related risks which primarily are related to the surrounding environ-ment such as macroeconomic conditions, competition, and technical development. It is the group management that primarily is responsible for monitoring and finding oppor-tunities in this changing environment. Tradedoubler also has a significant goodwill item which is tested for impair-ment on annual basis. If a change in the market conditions significantly affects the earnings potential of Tradedoubler it cannot be ruled out that a future impairment test would lead to an impairment need.
The primary operational risks of Tradedoubler are related to its IT-infrastructure which is essential to deliver the services provided. Tradedoubler has a CISO, Chief Internet Security Officer, which leads the risk management of the IT-infrastructure together with a board of internal and external resources. The completion of the migration of the produc-tion environment as significantly reduced the risks related to the IT-infrastructure.
The treatment of financial risks are centralised to the finance function of Tradedoubler and is conducted in accordance with the assumed treasury policy accepted by the Board of Tradedoubler. For more information regarding the financial risks see note C21 for the consolidated statement.
As a multinational company Tradedoubler is subject to local regulations. legal risks could be tax related, intellectual property rights or privacy legislation. Tradedoubler con-stantly monitors and mitigates legal risks through internal and external resources as well as through trade associations.

Tradedoubler Annual Report 2013
Board of Director’s Report
10
Tradedoubler is a Swedish public limited liability company with its registered office in Stockholm. Tradedoubler’s share has been quoted on nASDAQ OMX Stockholm since 8 november 2005. This section describes Tradedoubler’s corporate governance, management and administration and well as the internal control.
The governance of Tradedoubler is divided among the shareholders at the annual general meeting (AGM), the board of directors, the CEO and the group management in accordance with the Swedish Companies Act, the articles of association and the Swedish Code of Corporate Governance (the Code). The board of directors has elected to jointly handle the duties pertaining to the audit committee accor-ding to the Code and the Swedish Companies Act, but which also may be handled by the board as a whole – see more information under “Audit Committee”. In other respects, Tradedoubler has applied the Code without deviation during 2013.
Tradedoubler’s articles of association and other information regarding corporate governance in the company is available on Tradedoubler’s website at http://financials.tradedoubler.com/ under the corporate governance heading.
General meeting of shareholdersThe annual general meeting is Tradedoubler’s highest decision-making body in which shareholders exercise their rights to decide on the affairs of the company and where each share carries one vote. Shareholders are informed via Tradedoubler’s website of their entitlement to have an item addressed at the AGM. Shareholders who are registered in the share register on the record day, (five weekdays prior to the date of the AGM) and who have provided notification of
Corporate Governance their intention to attend in accordance with what is stated in the convening notice, are entitled to participate in the AGM, either in person or by proxy.
Minutes from the annual general meeting and extraordinary general meeting 2013 and previous general meetings of shareholders are available on Tradedoubler’s website (http://financials.tradedoubler.com/en-GB/Corporate-Governance/Annual-General-Meeting/).
Annual General Meeting 2013
The AGM was held on 7 May 2013 in Stockholm. 56.34 per cent of the shares were represented at the AGM. The AGM passed resolutions on election of board members and approved the board’s proposal on introduction of a long-term performance-related Share programme (“lTI”), among other resolutions.
The AGM resolved, in connection with the lTI program, to authorise the board to decide on acquisition of a maximum of 345,000 own shares and to approve the board’s propo-sal concerning transfer of own shares in relation to this. Repurchase of shares took place on 25 June 2013. For more information, see page 8.
Extraordinary General Meeting 2013
On 26 September 2013, an extraordinary general meeting (EGM) was held at the request of SEB Fonder at Tradedoubler’s premises in Stockholm. 58.47 per cent of the shares were represented at the EGM.
At the EGM, it was resolved to elect Thomas Bill, Martin Henricson, peter larsson (Chairman), Caroline Sundewall, lars Sveder and Simon Turner to a new board of directors. In addition, it was resolved that directors’ fees would be adjusted downwards in accordance with the nomination committee’s proposal (also see “Remuneration to the board of directors”)
Tradedoublers corporate governance
Information
Audit
Audit
Election
Nomination
Proposals
Reports
Nomination committee
INTERNAl STEERING INSTRUMENTS
Articles of Association, Rules of Procedure of the board, instructions to president, instruction in respect of financial reporting to the board, business concept and goals, strategies, core values, policies etc.
Exeample of policies: • Treasury Policy• Finance Manual• Authorisation Manual• External Information and IR Policy• Insider Policy• IT Security Policy
EXTERNAl STEERING INSTUMENTS The Swedish Companies Act, the Swedish Annula Accounts Act, NASDAQ OMX Stockholm’s rules and regulations, statements of the Swedish Securities Council and the Code and other relevant legislation etc.
Annual General Meeting
18 markets
AuditorBoard of directors
Renumeration committee
President & CEO and Group management
Operativeunit
Operativeunit
Operativeunit
Operativeunit
Operativeunit
Goals, strategies & internal steering instruments
Election

Tradedoubler Annual Report 2013
Board of Director’s Report
11
Nomination CommitteeTradedoubler’s AGM passes resolutions regarding a nomina-tion committee before the next AGM. The nomination com-mittee shall consist of four members and shall be composed of one representative of each of the three largest sharehol-ders in terms of the number of votes, as of the last banking day in August, who wish to appoint such a representative, as well as the chairman of the board.
The composition of the nomination committee ahead of the AGM 2014 was announced on 23 October 2013. The nomina-tion committee was composed of Thomas Bill, appointed by Monterro 1A AB (chairman), Henrik Kvick, appointed by Henrik Kvick AB, Johan Strandberg, appointed by SEB and peter larsson, chairman of the board. SEB Fonder was the third largest shareholder on the record day (30 September 2013). SEB Fonder has subsequently sold parts of its holding, which means that it is no longer the third largest owner. As a result of this change, Johan Strandberg has contacted other major owners who are not represented on the nomination committee and has made SEB’s place available. Since these parties have declined a place in the nomination committee, and in view of the work already performed in the nomina-tion committee up to the date of the change, SEB’s repre-sentative decided to remain on the nomination committee together with representatives of the two largest sharehol-ders and the chairman of the board.
An internal evaluation of the board and its work was carried out during the year. The nomination committee held individual meetings with all board members and inter-viewed various candidates for the board. The nomination
committee’s proposals to the AGM 2014 regarding board members, fees and other remuneration etc. are presented in the notice convening the AGM 2014 and are also available on the company’s website.
The members of the nomination committee receive no remuneration from Tradedoubler. However, the chairman of the board receives remuneration from Tradedoubler in the form of ordinary directors’ fees.
The Board of Directors and its committeesAccording to Tradedoubler’s articles of association, the board shall be composed of between five and nine members. The CEO is not a member of the board, but attends board meetings. Other employees in Tradedoubler participate in board meetings when required, for instance to present reports. The company’s legal counsel serves as the secretary to the board.
Namn Born Nationality Elected
The Board of directors
The Audit Committee****
The Remuneration Committee
Independant in relation to the company, the company management and the company s major shareholders*
Fee in SEK (incl. commit
tee work)**
Own or related
party share holdings***
peter larsson 1964 Swedish 2013 Chairman _ Chairman no* 250,000 150,000
Thomas Bill 1965 Swedish 2013 Member _ _ no* 250,000 0
lars Sveder 1973 Swedish 2013 Member _ _ no* 250,000 0
Martin Henricson 1961 Swedish 2001 Memberprev. Member _ Yes 250,000 15,000
Simon Turner 1951 British 2010 Member _
Member (prev. Chairman) Yes 250,000 5,300
Mats Sundström 1955 Swedish 2009prev. Chairman _
prev. Member Yes _ 0
Kristofer Arwin 1970 Swedish 2007prev. Member _ _ Yes _ 31,150
Caroline Sundewall 1958 Swedish 2009
prev. Member
prev. Chairman _ Yes _ 0
Heléne Vibbleus Berquist 1958 Swedish 2009
prev. Member
prev. Member
prev. Chairman Yes _ 0
SUMMA 1,250,000
* peter larsson, Thomas Bill and lars Sveder are independent to the company, company management but dependent in relation to the company s major owners.** The annual general meeting 2013 adopted the nomination committee s proposal regarding director s fees to be unchanged from the previous year, corresponding to SEK 670,000 for the Chairman and SEK 310,000 to each of the other Board members. SEK 100 000 is payable to the Chairman of the Audit Committee and SEK 50,000 to each of the other members of the Audit Committee. SEK 50,000 is payable to the Chairman of the Remuneration Committee and SEK 25,000 to each of the other members of the Remuneration Committee. The extraordinary general meeting 2013 approved the nomination committee’s proposal for modified compensation to the Chairman of the board and the other Board members corresponding to SEK 250,000. no compensation is payable for committee work. Compensation relates to the annual payable amount.*** Holdings of shares or other equal financial instruments by private or related persons or legal entities in Tradedoubler according to the latest available information to Tradedoubler.****Abolished 26 September, 2013
Composition, independence and remuneration of the Board 2013
*Source: Euroclear Sweden, as at 30 December 2013**Source: Euroclear Sweden, as at 30 September 2013*** SEB has since the constitution of the nomination committee sold part of its holding, see more details in the Corporate Governance Report.
Representing NameShareholding*/**
Monterro 1A AB Thomas Bill 18.1%/18.1%
Henrik Kvick AB Henrik Kvick 10.0%/10.0%
SEB Fonder*** Johan Strandberg 2.4%/6.8%
Styrelsens ordförande peter larsson 0.4%/0.4%
The nomination committee 2014

Tradedoubler Annual Report 2013
Board of Director’s Report
12
The composition of the company’s board of directors has changed several times during 2013. During 2013, Tradedoubler’s board of directors was composed until the AGM on 7 May 2013 of Kristofer Arwin, Martin Henricson, Caroline Sundewall, Mats Sundström (chairman), Simon Turner and Heléne Vibbleus Bergquist.
At the AGM, Heléne Vibbleus Bergquist declined re-election and the board was subsequently composed of Kristofer Arwin, Martin Henricson, Caroline Sundewall, Mats Sund-ström (chairman) and Simon Turner.
From the date of the EGM on 26 September 2013 until 4 December 2013, the board was composed of six members; Thomas Bill, Martin Henricson, peter larsson (chairman), Caroline Sundewall, lars Sveder and Simon Turner. Caro-line Sundewall resigned at her own request from the board of directors on 4 December 2013 and the board has sub-sequently been composed of five members; Thomas Bill, Martin Henricson, peter larsson (chairman), lars Sveder and Simon Turner.
The following table illustrates the periods on the board for each member during 2013.
Member Period
Mats Sundström From 26 September 2013
Kristofer Arwin From 26 September 2013
Caroline Sundewall until 4 December 2013
Heléne Vibbleus Bergquist until 7 May 2013
Martin Henricson Full-year 2013, current member
Simon Turner Full-year 2013, current member
peter larsson From 26 September 2013, current member
Thomas Bill From 26 September 2013, current member
lars Sveder From 26 September 2013, current member
The nomination committee considers that Thomas Bill, peter larsson and lars Sveder in their capacity as Managing partners of Monterro 1A AB are dependent in relation to the company’s major owners, but independent in relation to the company and the company management. Other board members who held positions during 2013 were independent during their term of office in relation to the company and the company management and in relation to the company’s major owners. The composition of board members during 2013 has therefore met the requirements imposed in relation to independence. The current board is presented on page 46.
under the Code, the company shall aim for a uniform gender distribution in the board. Tradedoubler’s board of directors during 2013 was overwhelmingly composed of men, and after Caroline Sundewall’s resignation, is only composed of men. The nomination committee aims for a uniform gender distribution and had this balance in consideration in its work on a proposal for a new board of directors (also see informa-tion in the nomination committee’s proposal to the board of directors etc.).
Formal work plan
The work of the board is guided by a formal work plan
that is adopted each year, usually at the statutory board meeting. The formal work plan sets out the responsibilities of the board and regulates the board, its committees and its members’ internal division of work, the decision-making order within the board, notifications of board meetings, agendas and minutes, and the board’s work on internal control, risk management and the financial reporting. The current formal work plan was approved by the board of directors on 5 February 2014.
Chairman of the board
According to the current formal work plan, the chairman of the board shall ensure that the board work is conducted effectively and that the board fulfils its duties. In particular, the chairman shall:
• organiseandleadtheworkoftheboard,
• ensurethatnewboardmembersundergorequisiteintro-ductory training and training in other respects that the chairman and the member collectively find suitable,
• ensurethattheboardcontinuallyupdatesandadvancesitsknowledge about the company,
• takeresponsibilityforcontactswiththeownersregardingownership questions and for communicating viewpoints from the owners to the board,
• ensurethattheboardreceivessufficientinformationanddecision data for its work,
• inconsultationwiththeCEO,adoptproposalsfortheagenda of board meetings,
• ensurethattheboard’sdecisionsareexecutedandensurethat the work of the Board is evaluated on an annual basis
Work during the year
The board held 20 recorded board meetings during 2013, of which one took place by telephone and four were held per capsulam. The individual members’ attendance at board and committee meetings is shown in the table on page 13 “Attendance at board and committee meetings and indepen-dence 2013”.
During the year, the board’s work mainly focused on the strategy for the company and the group, reorganisation and cost control, budget and business plan for 2014, business analysis and trends in the industry.
Committees
Audit Committee
The Code and the Swedish Companies Act (2005:551) contain provisions regarding the establishment of an audit committee. The entire board of directors may fulfil the committee’s duties in accordance with what is prescribed in Chapter 8 Sections 49 a-b second paragraph of the Com-panies Act. The board of directors resolved at the statutory meeting after the EGM on 26 September 2013 to abolish the audit committee as a separate function. The duties of the audit committee are instead handled by the entire board.
until the AGM 2013, the company had an audit committee, which was composed of Caroline Sundewall, Mats Sund-ström and Heléne Vibbleus Bergquist. During the period between the AGM and the EGM on 26 September 2013, the audit committee was composed of Caroline Sundewall and Martin Henricson.

Tradedoubler Annual Report 2013
Board of Director’s Report
13
The committee held five recorded meetings during 2013. The committee’s work focused on strengthening the internal control and risk management in respect of the financial reporting and on improving the quality of the financial reporting. For more information about the internal control and risk management, see page 14.
Remuneration Committee
The board has also appointed a remuneration committee, which during the year was composed of at least two board members, of which one was chairman. The remuneration committee shall hold meetings when necessary. When considered appropriate, the remuneration committee may invite the CEO, the company’s CFO, the company’s auditor or others to participate in the committee’s meetings. The company’s HR director serves as the secretary to the remu-neration committee. Minutes are taken of the remuneration committee’s meetings and a copy of the minutes is distribu-ted to all board members.
During 2013, the remuneration committee was composed until the AGM on 7 May 2013 of Mats Sundström (chairman), Simon Turner and Heléne Vibbleus Bergquist. During the period between the AGM and the EGM on 26 September 2013, the committee was composed of Mats Sundström and Simon Turner. From 26 September and subsequently, the committee has been composed of peter larsson and Simon Turner.
The remuneration committee held eight recorded meetings during 2013. The work mainly focused on follow up of the application of guidelines for remuneration to senior execu-tives adopted by the AGM 2013, follow up of the outcome of programmes for variable remuneration for 2013 and the outcome of long-term incentive programmes, programmes for variable remuneration for 2014, future long-term incentive programmes, preparation of resolutions on terms of remune-ration and other conditions of employment for the CEO and approval of terms of remuneration and conditions of employ-ment for other members of the company management.
Remuneration to the board of directors The AGM 2013 approved annual remuneration to the board of directors amounting to SEK 670,000 to the chairman of the board and SEK 310,000 to each of the other board members elected by the AGM who are not employed by Tradedoubler. In addition to this, the AGM approved remu-neration for committee work, to the members appointed by the board, of SEK 100,000 to the chairman of the audit committee and SEK 50,000 to each of the other members of the audit committee, and SEK 50,000 to the chairman of the remuneration committee and SEK 25,000 to each of the other members of the remuneration committee.
The EGM 2013 approved changes in annual remunera-tion to the board of directors amounting to SEK 250,000 to the chairman of the board and to each of the other board members elected by the AGM who are not employed by Tradedoubler. The EGM also resolved that no remuneration shall be paid for committee work. no board member was employed by any company in the group during 2013.
Remuneration to each board member is shown in the table “Composition, independence and remuneration of the Board 2013 on page 11.
CEO and Group ManagementThe president and CEO leads the day-to-day operations and is assisted by a group management team (company mana-gement). The company’s group management under 2013 was composed of:
Rob Wilson CEO
Jonas Ragnarsson1 Chief Financial Officer
Andrew Buckman2 Chief Operational Officer
Magnus nyström Chief Technology Officer
The group management is presented on page 47.
NameBoard of directors
Attendance, board meetings*****
The Audit Committee
Attendance Audit committee****
The remuneration committee
Attendance Remuneration committee****
Independent in relation to the company, company management and the company's major shareholders
peter larsson Chairman* 10/10 _ _ Chairman 2/2 no*
Thomas Bill Member* 10/10 _ _ _ _ no*
lars Sveder Member* 10/10 _ _ _ _ no*
Martin Henricson Member 19/20 prev. Member 5/5 _ _ Yes
Simon Turner Member 20/20 _ Member (prev. Chairman) 8/9 Yes
Mats Sundström prev. Chairman** 10/10 _ _ prev. Member 7/7 Yes
Kristofer Arwin prev. Member** 10/10 _ _ _ _ Yes
Caroline Sundewall prev. Member*** 16/16 prev. Chairman 5/5 _ _ Yes
Heléne Vibbleus Berquist prev. Member**** 4/4 prev. Member 3/3 prev. Chairman 4/4 Yes
* From 27 September 2013** To 26 September 2013*** To 4 December 2013****To 7 May 2013*****Out of the meetings that took place during the person’s terms of office in 2013
Attendance at board and committee meetings and independence 2013
1. On December 23, 2013 the company released that Jonas Ragnarsson had resigned as CFO and would leave his position during spring 2014. Since February 2014 Tomas ljunglöf is CFO for the company.
2. From January 2014 Andrew Buckman is Chief Strategy Officer. Richard Juhlin assumed the position as Chief Revenue Officer in January 2014.

Tradedoubler Annual Report 2013
Board of Director’s Report
14
Principles for remuneration and other terms of employment for the company management
The AGM resolves on guidelines for remuneration and other terms of employment to senior executives, in other words, the chief executive officer and other members of the group management. The annual general meeting 2013 resolved on the following guidelines for remuneration to senior execu-tives, which refers to the chief executive officer and other members of the group management (the company mana-gement). The total remuneration shall be competitive in the local market in which the employee is based in order to attract, motivate and retain skilled employees. The individual remuneration shall be based on the employee’s experience, skills, responsibilities and performance. The total remunera-tion should be based on four main components; fixed salary, variable remuneration, pension benefits and long-term incentive programme.
Fixed salary: The fixed salary shall be commercially competi-tive and shall be based on experience, skills, responsibilities and performance.
Variable remuneration: Variable remuneration shall be com-mercially competitive and reward growth, operating profit and shall be applied consistently throughout the group. It should be based on predetermined measurable targets, both quantitative and qualitative, and agreed in writing with the employee. The outcome of the variable remuneration shall have an upper ceiling, which normally should not exceed 50 per cent of the fixed salary.
pension benefits: pension benefits may be offered to certain members of the company management depending on local market conditions. Swedish-based employees are offered a solution which largely corresponds with the ITp plan.
notice and termination benefits: A mutual period of notice of 3–9 months shall apply for the company management. In the event of termination by the company, termination benefits, in applicable cases, should not exceed an amount equivalent to 12 fixed monthly salaries. In the event of termination by the employee, he/she shall not normally be entitled to any termination benefits.
long-term incentive programme: In addition to variable remuneration, which rewards growth and operating profit during the financial year, the board considers that long-term incentive programmes are an important part of the long-term compensation strategy. The board intends to propose that the company shall continue to invite the company management and other key people to participate in a long-term share-related or share-price-related incentive programme equivalent to the programme that was adopted by the annual general meeting 2011. The board considers that such a programme should be performance-based, imply continued employment in the group and require a personal investment, to the extent deemed necessary. Alternatively, the board may propose a cash-based programme which is not share-related or share-price-related. The board consi-ders that such a programme should be performed-based and that the maximum possible payment to the company management may amount to 50 per cent of the fixed salary. Share-related and share-price-related incentive programmes must be approved by the general meeting of shareholders.
Other benefits: Other benefits, such as car benefit, shall have a limited value in relation to the total remuneration package.
Questions regarding terms of employment for the chief executive officer are determined by the board. The chief executive officer determines terms of employment for other members of the company management after approval by the remuneration committee.
The board of directors or the remuneration committee may depart from these guidelines if special grounds exist in a particular case.
The board’s proposed guidelines for remuneration and other terms of employment for the company management in 2014 shall be resolved upon by the AGM 2014. The guidelines essentially correspond with the guidelines that were appro-ved at the AGM 2013.
Remuneration to the CEO and senior executives
As chief executive officer, Rob Wilson received remuneration for 2013, amounting to SEK 2,727,000 in fixed salary inclu-ding other benefits, SEK 0 in variable remuneration and SEK 273,000 as remuneration for payment into private pension insurance.
Other senior executives apart from the chief executive officer received a total of SEK 5,387,000 in fixed salary, SEK 0 in variable remuneration as well as SEK 743,000 as remune-ration for payment into private pension insurance.
AuditorsErnst & Young AB was elected as auditor at the AGM 2013 for the period until the AGM 2014, with the authorised public accountant Thomas Forslund as auditor-in-charge.
During 2013, the auditor reviewed the annual accounts, the consolidated accounts and accounting records as well as the administration of the board of directors and the CEO. In addition, the auditor reviewed the corporate governance report. The auditor has also reviewed the interim report for the period January-September 2013 and has been retained for certain advice, most of which pertained to audit-related consultations regarding accounting and tax matters.
Total remuneration of SEK 4,772,000 was paid during 2013, of which SEK 4,368,000 was paid to Ernst & Young AB and SEK 404,000 to other auditing companies.
Longterm incentive programmes and bonus programmeThe AGM 2013 resolved on a performance-related Share programme 2013 with up to 365,000 shares (and a further maximum of 110,000 shares for securing social security contributions). 13 persons including the CEO were invited to participate in the performance-related Share programme 2013. The performance-related Share programme 2013 was equivalent to the programmes approved in 2011 and 2012. The incentive programme is described in its entirety at http://financials.tradedoubler.com/en-GB/Corporate-Gover-nance/Annual-General-Meeting/; see the document “The board proposal for an incentive programme”.

Tradedoubler Annual Report 2013
Board of Director’s Report
15
The company’s long-term incentive programme has been revised for 2014 and is presented in its entirety in the notice convening the AGM 2014, which is available at: http://finan-cials.tradedoubler.com/en-GB/Corporate-Governance/Annual-General-Meeting/.
The group also operates an annual performance- and results-based variable remuneration programme for all employees within the group. In the 2013 programme, various quantitative and qualitative performance- and earnings targets were set for different occupational categories, based on company-wide, and regional targets for employees.
Internal controlThe board’s responsibility for internal control and risk management is governed by the Companies Act and by the Code. Internal control and risk management in respect of the financial reporting constitute a part of the total internal control and risk management within Tradedoubler, which is based on the COSO framework3 and represent an essential part of Tradedoubler’s corporate governance.
COSO describes the internal control as divided into five components – Control environment, Risk management, Control activities, Information and communication as well as Monitoring.
Control environment
The board has the overall responsibility for the internal control and risk management in respect of the financial reporting. The board has adopted a formal work plan, which is an internal control instrument setting out the responsibi-lities of the board and regulating the board, its committees and members’ internal division of work. The board also works with the duties that under the Code shall be handled by the audit committee, primarily control of the financial reporting and monitoring the effectiveness of the company’s internal control and risk management in respect of the financial reporting.
The board has also established internal control instruments in the form of an instruction for the CEO and an instruc-tion in respect of the financial reporting for Tradedoubler’s board.
The responsibility for maintaining an effective control envi-ronment and the day-to-day work regarding internal control and risk management has been delegated to the CEO.
Internal control instruments for the financial reporting mainly consist of the company’s Treasury policy, Finance Manual and Authorisation Manual. Among other things, these policies govern how the company shall handle its management of assets, financial reporting and investments/purchasing. The company’s External Information and Inves-tor Relations policy and Insider policy as well as its IT Secu-rity policy are also important internal control instruments for the financial reporting.
The CEO in conjunction with the rest of the group manage-ment is responsible for ensuring that the above-mentioned internal control instruments are complied with and updated if necessary.
Risk assessment
The area of internal control and risk management in respect of the financial reporting is part of the board’s and group management’s overall work on identifying and managing risks. This work aims to identify and evaluate the most critical risks affecting the internal control in respect of the financial reporting in the group’s companies and processes, as a basis for how to handle risks through different control structures. The most significant risks for the group are des-cribed under “Risks and uncertainty factors” on page 9.
Control activities
Control structures are concerned with what controls are chosen to manage risks in respect of the financial reporting in the group’s companies and processes. The controls may be general or detailed, preventive or discovery-based and automated or manual in character.
Information and Communication
The internal control instruments are available for the rele-vant employees on Tradedoubler’s Intranet.
The CEO and other members of the group management inclu-ding the company’s CFO report the work on strengthening the company’s internal control and risk management to the board and the result in the form of observations, recommendations and proposals for decision and actions is continually discus-sed and reported to the board at board meetings.
Monitoring
Follow up in order to ensure the effectiveness of the internal control and risk management in respect of the financial reporting is conducted by the board, the CEO and the rest of the group management, including the company’s CFO. Follow up includes review of monthly financial reports against the budget and targets.
The follow up also encompasses review of reports including project plans from the CEO and the rest of the group mana-gement including the company’s CFO regarding work that is being conducted in order to strengthen the company’s internal control and risk management.
The IT security work is continually ongoing with monthly follow up meetings with the CISO (Chief Internet Security Officer), CTO and group managers for development and operations in attendance. IT security-related incidents are reported at these meetings and follow up takes place of IT security-related projects and activities. When required, the CISO reports to the CEO and other members of the group management including the company’s CFO. There are agreements with external security experts in order to receive advice and support regarding implementation, assessments, and priorities of IT security-related issues.
Internal audit
At present, the company does not have any special audit function. The work on strengthening the internal gover-nance and control of Tradedoubler’s operations and proces-ses has instead been carried out during the year by project teams consisting of a combination of internal and external resources, which report the results of their work to the board on an ongoing basis. The question of formally establishing a special audit function is reviewed continually.
3. published by the Committee of Sponsoring Organizations of the Treadway Commission (COSO), (www.coso.org)

16 Tradedoubler Annual Report 2013
Financial information
Consolidated income statement
SEK ‘000 Note 2013 2012
Net sales C3, C4 2,001,339 2,307,718
Cost of goods sold -1,546,038 -1,766,240
Gross profit 455,301 541,478
Selling expenses -254,911 -304,447
Administrative expenses -136,675 -178,127
Research & development expenses -40,207 -58,903
Operating profit C4, C5, C6, C7, C8, C9 23,508 1
Financial income 1,135 1,284
Financial expenses -4,548 -967
Net financial items C10 -3,413 317
Profit before tax 20,096 317
Tax C11 -8,702 -10,475
Net profit for the year for continuing operations 11,393 -10,158
Net profit for discontinued operations C26 - 2,192
Total net profit 11,393 -7,965
Statement of comprehensive income
Profit for the year 11,393 -7,965
Other comprehensive income
Other comprehensive income to be reclassified to profit or loss in subsequent periods
Translation differences, net after tax 12,650 -20,480
Total other comprehensive income to be reclassified to profit or loss in subsequent periods 12,650 -20,480
Total comprehensive income for the year 24,043 -28,445
Total comprehensive income for the year attributable to:
The parent company's shareholders 11,393 -7,965
Comprehensive income attributable to:
The parent company's shareholders 24,043 -28,445
Earnings per share C17
Earnings per share for continuing operations 0.27 -0.24
Earnings per share 0.27 -0.19

17Tradedoubler Annual Report 2013
Financial information
Consolidated statement of financial position
SEK ‘000 Note Dec 31, 2013 Dec 31, 2012
Assets
Non-current assets
Intangible assets C13 423,569 408,364
Equipment, tools, fixtures and fittings C14 5,909 10,117
Other non-current receivables 4,228 3,647
Deferred tax receivables C11 40,125 36,007
Total non-current assets 473,832 458,135
Current assets C12
Trade receivables 459,910 519,268
Tax receivables C11 7,284 11,819
Other receivables 8,547 19,031
Prepaid expenses and accrued income C15 12,890 17,376
Short term investments C21 201,794 -
Cash and cash equivalents C21 304,662 164,445
Total current assets 995,085 731,939
Total assets 1,468,917 1,190,074
Equity and liabilities
Shareholders' equity C16
Share capital 17,123 17,123
Share premium 441,600 441,600
Translation reserve 2,805 -9,845
Retained earnings including net profit for the year 45,007 39,504
Total equity 506,535 488,382
Non-current liabilities C12, C21
Deferred tax liabilities C11 4,597 4,597
Provisions: non-current 945 1,013
Provisions: non-current C18 244,586 -
Total non-current liabilities 250,128 5,609
Current liabilities C12, C21
Trade payables 21,689 20,642
Current liabilities to publishers 451,261 402,514
Tax liabilities C11 4,020 6,112
Other liabilities C19 163,494 188,183
Accrued expenses and deferred income C20 71,790 78,632
Total current liabilities 712,254 696,083
Total equity and liabilities 1,468,917 1,190,074
Pledged assets C22 5,759 3,647
Contingent liabilities C22 None None

18 Tradedoubler Annual Report 2013
Financial information
Consolidated statement of changes in equity
SEK ‘000Share
capitalShare
premiumTranslation
reserve
Retained earnings incl. Net profit for
the yearTotal
equity
Opening balance at Januari 1, 2012 17,123 441,600 10,635 111,485 580,843
Comprehensive income
Net profit for the year -7,965 -7,965
Other comprehensive income
Translation differences, net after tax - - -20,480 - -20,480
Total other comprehensive income - - -20,480 - -20,480
Total comprehensive income - - -20,480 -7,965 -28,445
Transactions with shareholders
Dividend - - - -64,016 -64,016
Total transactions with shareholders - - - -64,016 -64,016
Closing balance at December 31, 2012 17,123 441,600 -9,845 39,504 488,382
Opening balance at Januari 1, 2013 17,123 441,600 -9,845 39,504 488,382
Comprehensive income
Net profit for the year 11,393 11,393
Other comprehensive income
Translation differences, net after tax - - 12,650 - 12,650
Total other comprehensive income - - 12,650 - 12,650
Total comprehensive income - - 12,650 11,393 24,043
Transactions with shareholders
Repurchase of own shares - - - -6,071 -6,071
Equity-settled share-based payments - - - 181 181
Total transactions with shareholders - - - -5,890 -5,890
Closing balance at December 31, 2013 17,123 441,600 2,805 45,007 506,535
All equity is tributed to the shareholders of the Parent Company.

19Tradedoubler Annual Report 2013
Financial information
Consolidated cash flow statement
SEK '000 Note 2013 2012
Operating activities C24
Profit before tax 20,096 317
Adjustment for items not included in the cash flow 54,004 49,825
Taxes paid -10,241 -15,106
Cash flow from operating activities before changes in working capital 63,859 35,036
Cash flow from changes in working capital
Increase (-)/Decrease (+) in operating receivables 110,011 98,600
Increase (-)/Decrease (+) in operating liabilities -48,329 -148,580
Cash flow from operating activities 125,541 -14,944
Investing activities
Net investments in intangible assets -29,834 -36,220
Net investments in property, plant and equipment -1,559 -4,721
Net investments in financial assets -446 -209
Net investments in shares -203,098 -
Cash flow from investing activities -234,937 -41,150
Financing activities
Repurchase of own shares -6,071 -
External loans 244,586 -
Dividend - -64,016
Cash flow from financing activities 238,515 -64,016
Cash flow for the year from continuing operations 129,119 -120,110
Cash flow for the year 129,119 -120,110
Cash and cash equivalents at the beginning of the year 164,445 290,745
Exchange difference in cash and cash equivalents 11,098 -6,189
Cash and cash equivalents at the end of the year 304,662 164,445

20 Tradedoubler Annual Report 2013
Notes
C1. Accounting policies
General informationTradedoubler AB (the parent company) and its subsidiaries together make up the Tradedoubler group.
Tradedoubler AB (publ), corporate registration number 556575-7423, is a Swedish registered limited liability company with its regis-tered office in Stockholm. The address of the head office is Birger Jarlsgatan 57A, 113 56
Stockholm. The parent company’s shares are listed on NASDAQ OMX Stockholm.
The board of directors approved these annual accounts for publi-cation on 31 March 2014. The annual accounts will be considered for adoption by the annual general meeting.
Summary of significant accounting policiesThe consolidated accounts were prepared in accordance with the International Financial Reporting Standards (IFRS) issued by the International Accounting Standards Board (IASB) as well as interpre-tations from the International Financial Reporting Interpretations Committee (IFRIC), as adopted by the European Commission for application within the EU. In addition, the Swedish Financial Report-ing Board’s recommendation RFR 1, Supplementary Accounting Rules for Groups is applied.
The parent company applies the same accounting policies as the group except in the instances described below in the section “Parent Company’s accounting policies”. Discrepancies between the princi-ples applied by the parent company and the group arise due to restrictions on the ability to apply IFRS within the parent company imposed by the Swedish Annual Accounts Act, the Pension Obliga-tions Vesting Act (“tryggandelagen”) and, in some cases, by tax con-siderations.
Assets and liabilities are recognised at historical cost unless oth-erwise stated below.
The parent company’s functional currency is the Swedish krona (SEK), which is also the presentation currency for the parent com-pany and the group. This means that the financial statements are presented in SEK. All amounts are rounded off to the nearest thou-sand, unless otherwise stated.
Assessments and estimates in the financial statements.Preparing the financial statements in conformity with IFRS requires the group management to make judgements and estimates as well as assumptions that affect the application of the accounting policies and the recognised amounts of assets, liabilities, revenue and expenses. The actual outcome may deviate from these estimates and judgements.
Estimates and assumptions are reviewed regularly. Changes in estimates are recognised in the period in which they arise if the change affects that period alone or, alternatively, in the period in which they arise and during future periods if the change affects both the period in question and future periods.
Judgements made by the group management in the application of IFRS, which have a material impact on the financial statements and estimates made, which may give rise to significant adjustments in future financial statements are described in more detail in the notes to the consolidated accounts C2, Critical estimates and judgements.
Amended accounting policies and disclosure requirements 2013The amendments to IAS 1 introduce a grouping of items presented in other comprehensive income. Items that will be reclassified toprofit or loss at a future point in time have to be presented separately from items that will not be reclassified. The amendment affected the group by adding a header in the income statement to showing that there are only items to be reclassified to profit or loss at a future point in time.
IFRS 13 establishes a single source of guidance under IFRS for all fair value measurements. The amendment of IFRS 13 adds additional disclosures where required of assets and liabilities whose fair values were determined.
New accounting standards in 2014 and onwardsNew IFRS amendments or interpretations of these standards, which are published but have not yet become effective, have not been adopted. To the extent that expected effects on the financial state-ments arising from the application of the following new or amended standards and interpretations are not described below, no assess-ment has yet been made of their effect. The new accounting stand-ards, which are deemed capable of affecting Tradedoubler’s account-ing in 2014 and subsequently are:
IFRS 9 Financial Instruments, which is intended to replace IAS 39 Financial instruments: Recognition and Measurement. The revised standard principally deals with the number of categories of financial assets and what financial assets and liabilities should be measured at fair value and amortised cost respectively via profit or loss. This standard will be supplemented with impairment and hedge account-ing rules. The IASB decided during 2013 not to set a date for initial application for the time being until all subprojects have been com-pleted.
IFRS 10 Consolidated Financial Statements and amendment to IAS 27 Separate Financial Statements. IFRS 10 replaces the section in IAS 27 dealing with preparation of consolidated financial statements. What remains in IAS 27 in the future relates to the treatment of sub-sidiaries, joint ventures and associated companies in separate finan-cial statements. The rules pertaining to how the consolidated finan-cial statements shall be prepared have not been changed. More specifically, the amendment addresses how a company is to deter-mine whether control exists and thus whether a company is to be consolidated. IFRS 10 and the amendment to IAS 27 shall be applied for annual periods beginning on or after 1 January 1 2014.
IAS 19 Employee Benefits - amendment. The IASB has amended the principles in IAS 19 as regards recognition of employee or third party contributions to defined-benefit plans linked to service. The amendment introduces a difference in the recognition of the contri-bution depending on whether or not it is contingent on the number of years of service. The amendment to IAS 19 Defined Benefit Plans: Employee Contributions shall be applied for annual periods begin-ning on or after 1 July 2014.
IAS 32 Financial Instruments: Classification – amendment. With the amendment to IAS 32, the application guidance section has been clarified regarding offsetting financial assets and financial liabilities. Clarification has been provided of the definition of “a legally enforce-able right of set-off” and what is meant by “items that can be settled net” in various contexts. The amendment to IAS 32 shall be applied for annual periods beginning on or after 1 January 2014.
IAS 36 Impairment of Assets – amendment. The amendment in IAS 36 means that the requirement to disclose the recoverable amount for all cash-generating units to which goodwill is allocated, introduced in connection with the introduction of IFRS 13 Fair Value Measurement, is removed. Instead, additional fair value disclosure requirements are introduced when the recovery amount of an impaired asset is based on fair value less selling expenses. In addi-tion, disclosure requirements are harmonized when the recovery amount is calculated on the basis of fair value less selling expenses and based on value in use. Finally, it should be noted that a new dis-closure requirement is introduced if the recovery amount of the asset (cash-generating unit), which either has been impaired during the year or alternatively where a previous impairment loss has been reversed during the year. The amendment in IAS 36 Recoverable Amount Disclosures for Non-Financial Assets shall be applied for annual periods beginning on or after 1 January 2014.
IAS 39 Financial Instruments: Recognition and measurement – amendment. The amendment introduces relief in connection with hedge accounting by allowing hedge accounting to continue even when a derivative instrument, which is designed as a hedging instru-ment, is novated to a central counterparty if certain conditions are met, including those required by law or other regulations, for exam-ple under EMIR legislation. The amendment does not cover volun-tary novation of a derivative instrument to a central counterparty. The amendment to IAS 39 Novation of Derivatives and Continuation of Hedge Accounting shall be applied to annual periods beginning on or after 1 January 2014.
The company has still not evaluated how these new standards will affect the financial statements.
Other amendments of accounting policies that are effective in the future are not expected to have any impact on the consolidated accounts:

21Tradedoubler Annual Report 2013
Notes
Classification Non-current assets and non-current liabilities in the parent company and the group largely consist of amounts that are expected to be recovered or paid after more than twelve months, calculated from the end of the reporting period. Current assets and current liabilities in the parent company and the group largely consist of amounts that are expected to be recovered or paid within twelve months, calcu-lated from the end of the reporting period.
Segment reportingIdentification of segments is made based on the internal reporting to the chief operating decision-maker, which as far as Tradedoubler is concerned is deemed to be the CEO.
The group’s internal reporting system is based on a combination of country and segment, where one or more countries within Net-work amount to one Network segment. The Technology segment is a summation of countries where these operations are conducted, see a further description in notes to the consolidated accounts, C4 Segment reporting.
Basis of consolidationSubsidiariesThe group’s accounts comprise the financial statements of the parent company and all of its subsidiaries. Subsidiaries are the com-panies over which the parent company exercises control. Control means, directly or indirectly, a right to set the company’s financial and operational strategies with the aim of obtaining economic bene-fits. When determining whether control exists, potential voting shares that can be called upon or converted without delay should be considered.
All subsidiaries are consolidated using the purchase method. This method means that acquisition of a subsidiary is treated as a transaction by which the group indirectly acquires the subsidiary’s assets and assumes its liabilities and contingent liabilities. The con-solidated historical cost is determined through a purchase price allo-cation in connection with the acquisition. The analysis establishes the cost of the shares or entity, as well as the fair value on the date of acquisition of the identifiable assets acquired and liabilities and con-tingent liabilities assumed. The cost of the subsidiary’s shares or entity consists of the fair values of the assets on the date of exchange, liabilities incurred or assumed and equity instruments issued as consideration in exchange for the acquired net assets. In business combinations where the cost of acquisition exceeds the net value of acquired assets, and liabilities and contingent liabilities assumed, the difference is recognised as goodwill. When the differ-ence is negative, this is recognised directly in the income statement.
The subsidiaries’ financial statements are included in the consoli-dated financial statements from the date of acquisition until the date when control ceases.
Transactions eliminated on consolidationIntra-group receivables and liabilities, revenue or expenses, and unrealised gains or losses arising from transactions between group companies, are eliminated in full on preparation of the consolidated financial statements.
Foreign currencyTransactions in foreign currenciesTransactions in foreign currencies are translated to the functional currency at the exchange rate prevailing on the transaction date. The functional currency is the currency which applies in the primary economic environments in which the companies conduct their oper-ations. Monetary assets and liabilities denominated in foreign cur-rencies are translated to the functional currency at the prevailing year-end exchange rate. Exchange differences arising on translation are recognised in the income statement, as financial income and expenses, with the exception of exchange differences in respect of intra-group loans which are treated as a net investment in a foreign operation (increased/reduced net investment) where exchange dif-ferences are recognised in other comprehensive income in the same way as translation differences.
Financial statements of foreign operationsThe group’s presentation currency is the Swedish krona (SEK). Assets and liabilities in foreign operations, including goodwill and other
goodwill/negative goodwill arising on consolidation, are translated from the foreign operation’s functional currency to the group’s pres-entation currency, Swedish krona, at the exchange rate prevailing at the end of the reporting period. Income and expenses in a foreign operation are translated to Swedish kronor at an average rate that represents an approximation of the prevailing exchange rates on the date of each transaction. Translation differences arising on such translation are recognised in other comprehensive income.
The exchange rates used in translation of the financial statements for consolidation purposes are as follows:
Closing day rate Average rate
2013 2012 2013 2012
EUR 8.94 8.62 8.65 8.71
GBP 10.73 10.49 10.19 10.73
NOK 1.06 1.17 1.11 1.16
DKK 1.20 1.16 1.16 1.17
LTL 2.59 2.50 2.51 2.52
PLN 2.15 2.12 2.06 2.08
CHF 7.29 7.13 7.03 7.22
RUB 0.20 0.21 0.20 0.22
BRL 2.78 3.19 3.03 3.48
The company does not currently hedge foreign exchange exposure. In connection with the disposal of a foreign operation, the accumu-lated translation differences attributable to the operation are recog-nised in the consolidated income statement.
RevenueSales revenue, which is synonymous with net sales, is recognised at the fair value of the consideration received, or which shall be received, taking into account any discounts and rebates. Revenue recognition takes place in the income statement when it is probable that the future economic benefits will accrue to the group and these benefits can be measured in a reliable manner. Revenue includes only the gross inflow of economic benefits that the company receives or can receive for its own benefit. Revenue from rendering services is recognised when the economic benefits for the services performed can be measured reliably and the economic benefits accrue to the group.
Group revenue consists of payments from the companies and organisations that advertise and market their products and services via the group. Revenue consists of variable transaction and consulting revenue (called Transaction revenue) and of fixed start-up and monthly fees (called Other revenue).
For the parent company, revenue mainly consists of licensing fees charged to subsidiaries. The parent company’s license fees are based on the current rules for transfer pricing and calculated so that a mar-ket margin remains in the subsidiary with respect to the services the subsidiary perform and the risks that the business causes.
Transaction revenueMost of the company’s revenue consists of transaction revenues. These are mainly variable and may be compared with the economic benefit from rendering a service without any specific time con-straints. Within the terms of rendering a service, revenue is continu-ously calculated based on transaction volume and price per transac-tion. The criteria for recognition of this revenue are applied to each individual transaction or summation of transactions.
Other revenueMost of the company’s other revenue consists of fixed start-up and monthly fees. These revenues are connected to rendering services in which the company gives the customer the right to use the compa-ny’s technology, among other things. The right of use is mainly gov-erned via a rendering of services. The criteria for recognition of these revenues are applied to each rendering of a service.
Operating expenses and financial income and expensesCost of goods soldCost of goods sold consists of payments to publishers and search engines and is recognised as revenue recognition takes place.

22 Tradedoubler Annual Report 2013
Notes
Financial income and expensesInterest income is primarily interest on bank deposits and is recog-nised in the income statement as it arises by application of the effec-tive interest method. Dividend income is recognised in the income statement when the group secures the right to receive payments. Financial expenses consist of interest costs on borrowings, the effect of dissolution of present value computation of provisions, loss on changes in value of financial assets measured at fair value via the income statement, impairment of financial assets and such losses on hedging instruments that are recognised in the income statement. Exchange gains and exchange losses are recognised net.
Financial instrumentsFinancial instruments on the asset side that are recognised in the balance sheet include cash and cash equivalents, trade and financial receivables. Liabilities include trade payables, liabilities to publishers and liabilities to credit institutions.
Recognition and derecognition in the balance sheetA financial asset or financial liability is carried in the balance sheet when the company or one of its subsidiaries becomes a party under the commercial terms of the instrument. Trade receivables are car-ried in the balance sheet when the invoice has been sent. Liabilities are carried when the counterparty has performed and there is a con-tractual obligation to pay, even if the invoice has not yet been received. Trade payables are recognised upon receipt of invoice.
A financial asset is derecognised when the contractual rights to the asset are realised, extinguished or the company loses control over them. The same rule applies for part of a financial asset. A financial liability is derecognised when the contractual obligation has been discharged or in some other manner has been extin-guished. The same rule applies for part of a financial liability.
Acquisition and disposal of financial assets are recognised on the transaction date, which represents the day when the company committed to acquire or dispose of the asset.
The fair value of investments in securities and derivative instru-ments is determined using official market quotations at the end of the reporting period. In cases where these are not available, meas-urement occurs using generally accepted methods such as discount-ing of future cash flows at quoted market rates of interest for each maturity. Translation to Swedish kronor takes place using the Riks-bank’s rates at the end of the reporting period.
Classification and measurementFinancial instruments that are not derivatives are initially recognised at the cost of acquisition corresponding to the fair value of the instrument plus transaction costs for all financial instruments, apart from those classified as financial assets recognised at fair value via the income statement, which are recognised at fair value excluding transaction costs. A financial instrument is classified on initial recog-nition based on the purpose for which the instrument was acquired. The classification determines how the financial instrument is meas-ured after the initial reporting date, as described below.
Loan receivables and trade receivablesLoans and receivables are financial assets that are not derivative instruments, which have fixed or determinable payments and which are not quoted on an active market. These assets are measured at amortised cost according to the effective interest method.
Trade receivables are recognised at the amount that is expected to be received less doubtful debts, which are assessed individually. Trade receivables have short expected maturities, which is why the value of each receivable is carried at its nominal amount without dis-counting. Impairment losses on trade receivables are recognised in operating expenses.
Receivables with expected maturities of more than one year are classified as non-current receivables and those with shorter maturi-ties are classified as other receivables.
Financial assets measured at fair value through profit or lossFinancial assets measured at fair value through profit or loss are divided into two subcategories: Financial assets held for trading as well as financial assets identified at initial recognition as belonging to this category. Financial assets held for trading are defined as financial assets acquired principally for the purpose of selling or repurchasing in the short-term. The group’s investments in corpo-
rate bonds and related derivatives for hedging of foreign currency bonds have been classified in the category of financial assets held for trading.
Assets in this category are measured initially and in subsequent financial statements at fair value. All changes in value arising are rec-ognised in profit or loss.
Financial liabilitiesFinancial liabilities are measured at amortised cost. Accrued cost is determined on the basis of the effective interest rate measured when the liability was carried. This means that surplus and deficit values, as well as direct issue expenses, are allocated over the term of the liability.
Trade payables have short expected maturities and are measured at their nominal value without discounting.
Cash and cash equivalentsCash and cash equivalents consist of cash in hand and directly accessible balances at banks and similar institutions as well as short-term highly liquid investments with original maturities of less than three months which are only subject to an insignificant risk of fluctu-ation in value.
Property, plant and equipmentOwned assetsProperty, plant and equipment is recognised as an asset in the bal-ance sheet if it is probable that the future economic benefits will accrue to Tradedoubler and the cost of the asset can be reliably measured. The cost of acquisition is defined as the purchase price and the costs of putting the asset in place.
Property, plant and equipment is recognised in the group at cost less accumulated depreciation and any impairment losses. Addi-tional expenditure is added at cost only if it is probable that the future economic benefit associated with the asset will increase. All other expenditure is expensed.
Property, plant and equipment consisting of units with different useful lives are treated as separate items of property, plant and equipment.
The carrying amount of an item of property, plant and equip-ment is derecognised on retirement or disposal or when no future economic benefits can be expected from its use. Gains or losses aris-ing from disposal or retirement of an asset consist of the difference between the selling price and the asset’s carrying amount less directly related selling expenses. Gains and losses are recognised as other operating income/expenses.
Leased assetsThe leases in the group have been classified as operating leases, which means that the lessor retains the absolute majority of the risks and the benefits of ownership of an asset. Operating leases mean that leasing fees are expensed on a straight-line basis over the term of the lease, which may differ in practice from the amount of leasing fees paid during the year.
Depreciation methodsDepreciation takes place on a straight-line basis over the estimated useful life of the asset.
Equipment Three to five years
An assessment is made of an asset’s residual value and useful life every year.
Intangible non-current assetsGoodwillGoodwill is measured at cost less any accumulated impairment losses. Goodwill is distributed to cash-generating units and is tested at least once annually for any impairment need. Impairment testing is carried out more frequently if there are indications that the unit may need to be impaired. If the recoverable amount of the cash-gen-erating unit is less than the unit’s carrying amount, the impairment loss is allocated first to reduce any goodwill carrying amount allo-cated to the unit and is then allocated proportionately to the unit’s other assets based on the carrying amount of each asset in the unit.
In business combinations where the cost of acquisition is less than the net value of acquired assets, and liabilities and contingent liabilities assumed, the difference is recognised directly in net profit.

23Tradedoubler Annual Report 2013
Notes
DevelopmentExpenses for new or substantially improved products or processes are carried as assets in the balance sheet only if the product or pro-cess is technologically or commercially viable and the group has suf-ficient resources to complete development. Capitalisation may occur when a new platform or functionality is developed and includes costs of materials, direct work and a reasonable share of the indirect costs. System maintenance costs are expensed as they arise. Capital-ised development expenses are recognised at cost less accumulated depreciation and impairment losses.
Administration and support This category includes system tools for customer management and finance among other things. These intangible assets are deemed to have a longer useful life than those within the Development cate-gory, mainly due to a longer product lifecycle in the market. In this category, capitalised expenditure is also recognised at cost less accumulated amortisation and impairment losses.
Other intangible assetsOther intangible assets acquired by the group consist of client rela-tions, technology platforms and trademarks, and are recognised at cost less accumulated amortisation (see below) and impairment losses.
Additional expenditureAdditional costs for capitalised intangible assets are recognised as an asset in the balance sheet only when they increase the future economic benefits of the specific asset to which they relate to. All other costs are expensed as they arise.
Amortisation methods Amortisation is recognised in the income statement on a straight-line basis over the estimated useful lives of the intangible assets, provided such useful lives are determinable. Goodwill and intangible assets with an indeterminable useful life are tested for impairment on an annual basis and as soon as there are indications suggesting that the asset in question has decreased in value. Intangible assets that may be amortised are amortised from the date from which they are available for use. The estimated useful lives are:
Client relations Seven years
Technology platforms Three years
Trademarks Five years
Development Three years
Administration and support Five years
Impairment lossesThe carrying amounts of the group’s assets are tested on each balance sheet date in order to determine if there is any indication of an impair-ment need. IAS 36 is applied for testing impairment needs of assets other than financial assets, which are tested in accordance with IAS 39, assets for sale and disposal groups, which are tested in line with IFRS 5, and deferred tax receivables. For exempted assets, as above, the carrying amount is tested in accordance with each standard.
Impairment testing of property, plant and equipment and intangi-ble assets and participations in subsidiaries. If there is an indication that an asset may be impaired, the asset’s recoverable amount is calculated using IAS 36 (see below). If it is impossible to determine significant independent cash flows to a single asset, the assets should be grouped, in conjunction with impairment testing, at the lowest level at which it is possible to iden-tify significant independent cash flows – a so-called cash-generating unit.
An impairment loss is recognised when the carrying amount of an asset or cash-generating unit (group of units) exceeds its recovera-ble amount. An impairment loss is charged to the income statement.
The recoverable amount is the higher of the fair value less selling expenses and value in use. In calculating value in use, future cash flows are discounted using a discounting factor that takes into account the risk-free rate of interest and the risk relating to the spe-cific asset.
Impairment testing of goodwillGoodwill consists of the amount by which the acquisition cost exceeds the fair value of the net assets acquired by the group in con-junction with a company acquisition or acquisition of assets and lia-bilities Goodwill arising from the acquisition of an associated com-pany is included in the carrying amount for the associated company.Goodwill is allocated to cash-generating units upon acquisition and is not amortised, but is tested annually to identify any impairment needs. Goodwill is measured at acquisition cost less any accumu-lated impairment losses. Impairments of goodwill are not reversed. The recognised revenue from the disposal of a group company includes the remaining carrying amount of the goodwill attributable to the divested unit.
Impairment testing of financial assetsIn connection with quarterly financial reporting, Tradedoubler assesses whether there is objective evidence that a financial asset or group of assets requires impairment. Objective evidence consists partly of observable circumstances that occurred and which have a negative impact on the possibility to recover the cost of acquisition.
The recoverable amount of assets belonging to the categories of loan receivables and trade receivables, which are recognised at amortised cost, is measured as the present value of future cash flows discounted by the effective rate that applied upon initial recognition of the asset. Assets with short maturities are not discounted. An impairment loss is charged to the income statement.
Reversal of impairment lossesAn impairment loss is reversed if there is an indication that an impairment need no longer exists and a change has occurred in the assumptions that provided the basis for the measurement of the recoverable amount. A reversal is only made to the extent that the carrying amount of the asset after reversal does not exceed the car-rying amount that would have been recognised, less amortisation where appropriate, if no impairment had been made. Impairment of goodwill is never reversed.
Impairments of loan receivables and trade receivables recog-nised at amortised cost are reversed if a later increase in the recover-able amount can be objectively attributed to an event that occurred after the impairment was made.
Earnings per shareThe calculation of earnings per share is based on the group’s net profit for the year attributable to the parent company’s shareholders and on the weighted average number of shares in issue during the year. In the calculation of earnings per share after dilution, the profit and the average number of shares are adjusted to take account of the effects of dilutive potential ordinary shares, which consisted of options issued to employees during the presented periods.
Employee benefitsDefined-contribution plansThe group mainly operates defined contribution pension plans. In defined contribution plans, Tradedoubler pays fixed fees to an insur-ance company and has no obligation to pay further amounts.
Obligations in respect of charges for defined contribution plans are recognised as an expense in the income statement as they arise.
Compensation on termination of employmentA provision is recognised in conjunction with the termination of employment only if it is evident that Tradedoubler is obligated, with-out any realistic possibility of withdrawal, by a formal detailed plan to terminate employment before the normal retirement date. When remuneration is offered to encourage voluntary retirement, it is rec-ognised as a cost if it is likely that the offer will be accepted and the number of employees accepting the offer can be reliably estimated.
Share-based paymentThe company’s share programme allows selected persons to acquire shares in the parent company. The fair value of the shares is recog-nised as a personnel cost with a corresponding increase in share-holders’ equity. The fair value of the shares is calculated according to the Black-Scholes method, taking into consideration the terms and conditions prevailing on the allotment date, including the market value when available. The amount, which is recognised as an expense is adjusted to reflect the actual number of shares earned.

24 Tradedoubler Annual Report 2013
Notes
During every year-end closing, an assessment is made as to whether, and to what degree, the vesting conditions will be fulfilled. If this assessment results in an estimate of a lower number of shares being earned during the vesting period, previously expensed amounts are reversed in the income statement. This means that in those cases where the vesting requirements are not fulfilled, no costs will be recognised in the income statement, as viewed over the entire vesting period.
Social security contributions attributable to the share pro-gramme are recognised as a personnel cost and a personnel-related liability, respectively. Provisions for social security contributions are calculated using the best estimate at each closing date of the group’s future liability for social security contributions. The provision for social security contributions is allocated over the vesting period. The calculations are based on the fair value of the shares on each closing date. The provision for social security contributions also includes social security contributions for equity instruments.
ProvisionsProvisions are recognised in the balance sheet when the group has an existing legal or informal obligation as a result of past events, and it is probable that an outflow of financial resources will be required to settle the obligation and that the amount can be reliably esti-mated. Provisions include leases where the outlay exceeds the eco-nomic benefits. In cases where the effect of payment timing is signif-icant, provisions are calculated by discounting the expected future cash flow at an interest rate before tax that reflects current market assessments of the time value of money, and if applicable, the risks specific to the liability.
TaxesIncome taxes in the income statement include both current tax and deferred tax. Taxes are recognised in the income statement except where the underlying transaction is recognised in other comprehen-sive income or directly against equity.
Current tax is tax that shall be paid or received in respect of the current year, using the tax rates which, have been enacted or which in practice were enacted on the balance sheet date. This also includes adjustments of current tax relating to previous periods.
Deferred taxes are estimated in accordance with the liability method, based on temporary differences between the tax bases of assets and liabilities and their carrying amounts. The following tem-porary differences not taken into consideration; temporary differ-ences arising on the initial recognition of goodwill, the initial recog-nition of assets and liabilities that are not business combinations and, which on the transaction date did not affect the recognised or taxable result. Furthermore, temporary differences are not taken into consideration that are attributable to investments in subsidiaries and associated companies and, which are not expected to be reversed within the foreseeable future. The measurement of deferred tax is based on how the carrying amounts of assets or liabilities are expected to be realised or settled. Deferred tax is measured using the tax rates and tax regulations which, have been enacted or which in practice were enacted on the balance sheet date.
Deferred tax assets in respect of deductible temporary differ-ences and loss carry-forwards are only recognised to the extent that it is probable that they can be utilised. The value of deferred tax assets is reduced when it is no longer considered probable that they can be utilised.
Any additional income tax arising on dividends is recognised at the same time as the dividend is recognised as a liability.
Contingent liabilitiesA contingent liability is recognised when there is a possible obliga-tion arising from past events and whose occurrence can only be confirmed by one or more uncertain future events or when an obli-gation arises which cannot be recognised as a liability or provision as it is not probable that an outflow of resources will be required or the size of the obligation cannot be estimated with sufficient reliability.
C2. Critical estimates and judgementsThe preparation of accounts and the application of accounting poli-cies is often based on the management’s judgements and on esti-mates and assumptions that are deemed to be reasonable at the time the judgement was made. However, the result may be different using different judgements, assumptions and estimates and events can occur which can require a significant adjustment of the carrying amount of the asset or liability in question. The accounting policies whose application is based on such judgements are described below and the most important sources of uncertainty in the estimates that the company believes may have the most important impact on the group’s reported results and financial position. The information in this note refers to those areas, where risk of future adjustments of carrying amounts is greatest.
GoodwillTesting of goodwill is based on estimates and assumptions regarding the future. As the company conducts operations in a relatively young industry, which is characterised by development and constant changes, these assumptions are an uncertainty factor. The uncer-tainty in these assumptions is partly offset by a good margin in the comparison of recoverable amounts and carrying amounts.
Goodwill amounted to SEK 362.7 M (353.3).
Deferred tax assetsThe group recognises deferred tax assets on loss carryforwards of SEK 16.2 M (17.9). The deferred tax assets are primarily attributable to tax loss carryforwards in the parent company and in the UK. The val-uation of loss carryforwards and the ability to utilise these are based on management’s estimates of future taxable income in the various tax areas.
Trade receivablesThe group monitors the financial stability of its customers and the conditions under which they operate to estimate the probability of payment in the case of each individual receivable. As of December 31, 2013 the total provisions for doubtful receivables in the balance sheet amounted to SEK 38.0 M (19.5).
Intangible assetsThe company’s intangible assets comprise, in addition to Goodwill, of internally-developed and acquired products. The products that are directly related to the company’s core business have a shorter estimated useful life and are amortised at a faster rate. Each year an impairment test is performed, both for the intangible assets that are in use as well as for those not yet in use. See Note C13 and C1 for more information.
C3. Distribution of revenue
SEK ´000 2013 2012
Transaction revenue 1,939,759 2,229,746
Other revenue 61,580 77,972
Net sales 2,001,339 2,307,718

25Tradedoubler Annual Report 2013
Notes
C4. Segment reportingTradedoubler had seven segments during the year. Six of the seg-ments consisted of market units within Network (DACH, France & Benelux, Nordics, East, South and UK & Ireland) and the seventh seg-ment consisted of the business unit Technology.
Network’s market units consisted of the following countries; - Germany, Switzerland and Austria (DACH) - Poland and Lithuania (East) - France, Belgium and the Netherlands (France & Benelux) - Sweden, Norway, Denmark and Finland (Nordics) - Italy, Brazil and Spain (South) - UK and Ireland (UK & Ireland)
IIdentification of segments is based on the internal reporting to the chief operating decision-maker. Reporting and follow up took place based on the geographical regions that served as the basis of divi-sion for the segment reporting.
The group’s chief operating decision-maker continually moni-tored Net Sales and EBITDA per segment.
Intra-group transfer prices between different segments are set based on the “arm’s length” principle, in other words, between par-ties that are independent of each other, well informed and with an interest in completing the transactions.
Operating profit for the parent company, central functions and eliminations are allocated to the segments.
The same accounting policies as for the group are applied in the segment reporting.
Tradedoubler will change its segment reporting from 2014. See more information in Note C26 Events after the balance sheet date.
Tradedoubler has no customers which account for revenues of more than 10 per cent of the company’s total revenues for the years 2013 or 2012.
Net Sales EBITDA*
SEK ´000 2013 2012 2013 2012
Market Unit DACH 288,090 327,050 31,554 35,754
Market Unit East 103,205 103,016 6,368 3,442
Market Unit France & Benelux 505,026 584,236 42,582 47,916
Market Unit Nordics 284,601 317,824 23,475 31,592
Market Unit South 263,623 304,722 31,258 40,057
Market Unit UK & Ireland 496,781 606,890 31,258 30,891
Total Network 1,941,325 2,243,747 161,643 189,650
Business Unit Technology 60,014 63,971 43,108 42,034
Group management and supporting functions - - -151,348 -209,496
Total continued operations 2,001,339 2,307,718 53,403 22,187
Discontinued operations - 4,624 - 2,205
* The variance between EBITDA and group EBIT according to the Consolidated financial statements is attributed to depreciation and amortization of SEK 29,893,000 (20,324,000).
Gegraphical information Net Sales
SEK ´000 2013 2012
Sweden 137,406 138,240
Great Britain 497,209 593,935
France 432,891 480,253
Germany 202,701 228,690
Italy 130,242 148,542
Spain 128,267 151,722
Other 472,623 566,336
Total 2,001,339 2,307,718
Revenue from external customers is recognised per geographical area in which the revenue was generated.
C5. Remuneration to employees, group management and board of directors
Average number of employees 2013 2012
men (%) men (%)
Parent company
Sweden 50 52 73 56
Subsidiaries
Belgium 0 0 11 72
Brasil 2 50
Denmark 8 70 10 68
Finland 10 41 11 55
France 49 53 49 52
Ireland 1 100 3 66
Italy 26 46 30 38
Lithuania 9 47 10 50
Netherlands 22 48 19 57
Norway 11 63 13 67
Poland 34 50 24 46
Portugal 1 0 2 0
Russia 0 0 7 49
Switzerland 12 63 14 65
Spain 25 39 27 39
UK 144 57 112 55
Sweden 19 74 26 75
Germany 40 50 44 54
Austria 0 0 3 55
Total subsidiaries 413 54 415 54
Total group 463 54 488 54
Distribution of men and women in board of directors and group management
Share women (%) 2013 2012
The board of directors 0.0 33.3
President and other senior executives 0.0 0.0
Remuneration to employees distributed between the Parent Company and subsidiaries
Salaries and other
remuneration
Social fees (of which pension)
Salaries and other
remuneration
Social fees (of which pension)
SEK ‘000 2013 2012
Parent Company 40,731 13,607 57,053 21,276
(4,308) (5,874)
Subsidiaries 174,642 34,037 201,793 41,374
(6,155) (7,267)
Total 215,373 47,644 258,846 62,650
Cost of remuneration to employees
SEK ‘000 2013 2012
Salaries and remuneration 215,192 258,846
Share-based payments 181 -
215,373 258,846
Pension expenses 10,463 13,140
Social security contributions 37,135 49,510
Social security contributions attributable to share-based payments 46 -
47,644 62,650
Total 263,450 321,496

26 Tradedoubler Annual Report 2013
Notes
Remuneration to the president, group management and board of directors
2013 2012
Remuneration and other benefits, (SEK ‘000)
Basic salary, directors’
fees3
Variable remune-
ration
Long-term incentive programs
Pension obligations Total
Basic salary, directors’
fees3
Variable remune-
ration
Long-term incentive programs
Pension obligations Total
The Board of Directors
Peter Larsson 66 66 - - - - -
Mats Sundström 512 - - - 512 738 - - - 738
Kristofer Arwin 228 - - - 228 307 - - - 307
Heléne Vibbleus Bergquist 134 - - - 134 407 - - - 407
Thomas Bill 66 - - - 66 - - - - -
Martin Henricson 331 - - - 331 315 - - - 315
Martina King - - - - - 100 - - - 100
Caroline Sundewall 408 - - - 408 407 - - - 407
Lars Sveder 66 - - - 66 - - - - -
Simon Turner 331 - - - 331 323 - - - 323
Urban Gillström (CEO)1 - - - - - 6,672 - - 871 7,543
Rob Wilson (CEO)2 2,727 - 40 273 3,040 1,197 272 - 120 1,589
Other group management 5,387 - 26 743 6,156 20,128 576 - 1,627 22,331
Total 10,256 - 66 1,016 11,330 30,594 848 - 2,618 34,060
1 Urban Gillström was President and CEO between February 2010 and July 2012. Severance pay and termination benefits were paid after the termination of employment. Termination benefits amounted to SEK 3,182,000.
2 From 1 of August, 20123 Directors’ fees are periodised based on the calendar year.
On 31 December 2013, the group management was composed of four people (8 people on 31 December 2012), of which 2 (3) persons were employed by TradeDoubler AB. The change was mainly due to reorganisations.
Remuneration to the Board and group managementFees to board members and members of the board’s committeesThe annual general meeting 2013 approved the following remunera-tion to the board of directors: SEK 670,000 to the chairman of the board and SEK 310,000 to each of the other board members elected by the annual general meeting who are not employed in TradeDou-bler. In addition to this, the annual general meeting approved remu-neration for committee work, to the members appointed by the board, of SEK 100,000 to the chairman of the audit committee and SEK 50,000 to each of the other members of the audit committee, and SEK 50,000 to the chairman of the remuneration committee and SEK 25,000 to each of the other members of the remuneration committee.
The Extraordinary General Meeting 2013 approved altered remu-neration to the Board of directors as follows: SEK 250,000 to the chairman of the board and each of the other elected board members who are not employed in Tradedoubler. The EGM also resolved that no compensation shall be paid for committee work.
Guidelines for remuneration to group managementThe annual general meeting 2013 resolved on the following guide-lines for remuneration to senior executives, which refers to the chief executive officer and other members of the group management (the company management).
The total remuneration shall be competitive in the local market in which the employee is based in order to attract, motivate and retain skilled employees. The individual remuneration should be based on the employee’s experience, skills, responsibilities and performance.”
The total remuneration should be based on four main compo-nents; fixed salary, variable remuneration, pension benefits and long-term incentive programme. The fixed salary shall be commer-cially competitive and based on experience, skills, responsibilities and performance. Variable remuneration should be commercially competitive and reward growth, operating profit and should be applied consistently throughout the group. It should be based on predetermined measurable targets, both quantitative and qualitative, and agreed in writing with the employee.
The outcome of the variable remuneration programme should have an upper ceiling, which normally should not exceed 50 per cent of the fixed salary.
Pension benefits may be offered to certain members of the com-pany management depending on local market conditions. Swedish-based employees are offered a solution which largely corresponds with the ITP plan.
A mutual period of notice of 3-9 months shall apply for the com-pany management. In the event of termination by the Company, ter-mination benefits, in applicable cases, should not exceed an amount equivalent to 12 fixed monthly salaries. In the event of termination by the employee, he/she should not normally be entitled to any ter-mination benefits.
In addition to variable remuneration, which rewards growth and operating profit during the financial year, the board considers that long-term incentive programmes are an important part of the long-term compensation strategy. The board intends to propose that the Company shall continue to invite the company management and other key people to participate in a long-term share-related or share-price-related incentive programme equivalent to the programme that was adopted by the annual general meeting 2011. The board considers that such a programme should be performance-based, imply continued employment in the group and require a personal investment, to the extent deemed necessary. Alternatively, the board may propose a cash-based programme which is not share-related or share-price-related. The board considers that such a programme should be performed-based and that the maximum possible pay-ment to the company management shall amount to 50 percent of the fixed salary. Share-related and share-price-related incentive pro-grammes must be approved by the general meeting of shareholders.
Other benefits, such as car benefit, should have a limited value in relation to the total remuneration package.
Questions regarding terms of employment for the chief executive officer are determined by the board. The chief executive officer determines terms of employment for other members of the company management after approval by the remuneration committee.
The board of directors or the remuneration committee may depart from these guidelines if special grounds exist in a particular case.
Remuneration policy for employeesThe aim of Tradedoubler’s remuneration policy is to offer fair, com-petitive, market-based remuneration that promotes recruitment and retention of skilled employees.
Pension benefitsTradedoubler offers pension plans in some markets that are adapted to local market conditions. The pension plans are mainly defined contribution plans, i.e. Tradedoubler pays fixed fees to an insurance company and has no further obligations subsequently. Obligations regarding fees for defined contribution pension plans are recognised

27Tradedoubler Annual Report 2013
Notes
as a cost in the income statement when they arise. The retirement age for all senior executives is 65. No right to early retirement exists.
Variable remunerationTradedoubler operates a performance- and results-based annual programme for variable remuneration for employees within the group. Various quantitative and qualitative performance- and results-based targets are set for different occupational categories, based on company-wide, and regional targets for the employees. The company management receives variable remuneration which is mainly linked to the group’s financial performance. The variable remuneration has a ceiling. The ceiling lies in the range of between 10 and 50 per cent of the fixed salary for the majority of employees. For the group management, the variable remuneration may amount to a maximum of 50 per cent of the fixed salary.
Variable remuneration is paid annually in arrears, however, por-tions of the variable salary are determined and disbursed on a quar-terly basis for employees within the occupational categories ? Sales and customer service.
During 2013, SEK 1.8 M including social security contributions was expensed for the performance- and results-based programme for vari-able remuneration. No variable remuneration was paid to group man-agement. In the event of maximum allotment, variable remuneration for the year would have amounted to approximately SEK 71.6 M (88.5), including variable remuneration to the group management, of which approximately SEK 11.9 M (14.5) related to social security contribu-tions. With the former composition of the group management (as of 31 December 2013), the maximum outcome for the variable remunera-tion programme in 2013 would have amounted to approximately SEK 4.4 M (6.0), of which approximately SEK 1.6 M (1.6) relates to the CEO.
Chief executive officerFor the CEO a mutual period of notice of 6 months shall apply. In the event of termination by the Company, the CEO is entitled to termination benefits of 6 months fixed salary to be paid out monthly in 6 equal shares.
The pension plan for the CEO consists of a defined contribution plan, in which the premium amounts to 10 percent of the fixed sal-ary. Payment of premiums to the pension plan will end at retirement or earlier if the CEO leaves the company for any other reason.
C6. Share-based remuneration
Long-term incentive programmesThe group had three outstanding long-term incentive programmes during 2012 and 2013.
Supply of shares to the participants of the Performance-related share programme has been secured through previous purchases of own shares in Tradedoubler AB and additional purchases during the year. Tradedoubler has 475,000 shares in its own custody after pur-chasing 345,000 shares during the year. It is the view of the board that existing shares in own custody will in all materiality cover the outcome of the Performance-related share programmes.
Personnel expense (including social security contribution) arising from share-based remuneration
SEK ‘000 2013 2012
Personnel expense (including social social security contributions) arising from share-based remuneration 227 -
Total personnel expense arising from share-based remuneration 227 -
Performance-related share programme 2011 and 2012The annual general meetings 2011, 2012 and 2013 resolved on per-formance-related share programmes for key people in the group. The programmes aim to boost the group’s attractiveness as an employer and to encourage key personell to continued loyalty and continued good performance.
The programmes were offered to up to 17 key employees. In order to participate in the programmes, employees domiciled in Sweden are required, to own TradeDoubler shares (Saving shares) corre-sponding to a value of a maximum of 10 per cent of the participant’s
basic salary (fixed salary) divided by the average volume-weighted price paid at NASDAQ OMX Stockholm during a period of ten trading days immediately after the annual general meeting when the deci-sion on each programme was taken.
If the Savings shares are retained by the employee during a three-year period and he/she was employed in the Tradedoubler Group dur-ing the entire period, the employee is entitled to gratuitous allotment of shares (performance shares), provided that the performance require-ments related to earnings per share stated in the table below are met.
If the Savings shares are sold during the three-year period, the pos-sibility of obtaining performance shares decreases proportionally.
For employees domiciled outside of Sweden, no Savings shares requirement exists. Allotment, according to the table below, occurs based on if the participant would invest up to ten per cent of his /her basic salary before tax on corresponding terms as participants domi-ciled in Sweden.
No of remaining participants
Total no of outstanding savings shares
Share programme 2011 3 7,801
Share programme 2012 7 52,018
Share programme 2013 9 67,017
Base year EPS
Target average
annual EPS growth range
Perfor-mance shares
awarded
Maximum oppurtunity
as percentage of fixed salary
Share programme 2011
1.44 20% 0.6 to 0.8 6-8%
20.1 to 39.9% 0.7 to 3.9 7-39%
40% - 3 to 4 30-40%
Share programme 2012
2.16 20% 0.6 to 0.8 6-8%
20.1 to 39.9% 0.7 to 3.9 7-39%
40% - 3 to 4 30-40%
Share programme 2013
-0.24* 20% 0.6 to 0.8 6-8%
20.1 to 39.9% 0.7 to 3.9 7-3%
40% - 3 to 4 30-40%
* As the EPS is negative for the base year, the percentage increase is calculated from the corresponding positive value which is then added to the negative value. A 20 per cent increase would thus be calculated 0.24 * 20% = 0,048. This is then added to the base EPS -0.24 +0.048 = -0.192, which then represents an increase of 20 per cent.
C7 Remuneration for auditor
SEK ‘000 2013 2012
Ernst & Young
Audit assignments 3,944 5,128
Audit related fees 277 47
Tax services 38 392
Other assignments 109 414
Other auditors
Audit assignments 325 185
Tax services - -
Other assignments 79 208
Total 4,772 6,374
Audit assignments refers to the examination of the annual accounts, the consolidated accounts and accounting records as well as the administration of the board of directors and the CEO, other duties that the Company s auditors are obliged to perform as well as advice or other assistance arising from observations during such examina-tion and implementation of such duties. In addition, the auditor reviewed the corporate governance report. The auditor has also reviewed the interim report for the period January-September 2013 and has been retained for certain advice, most of which pertained to audit-related consultations regarding accounting and tax matters.
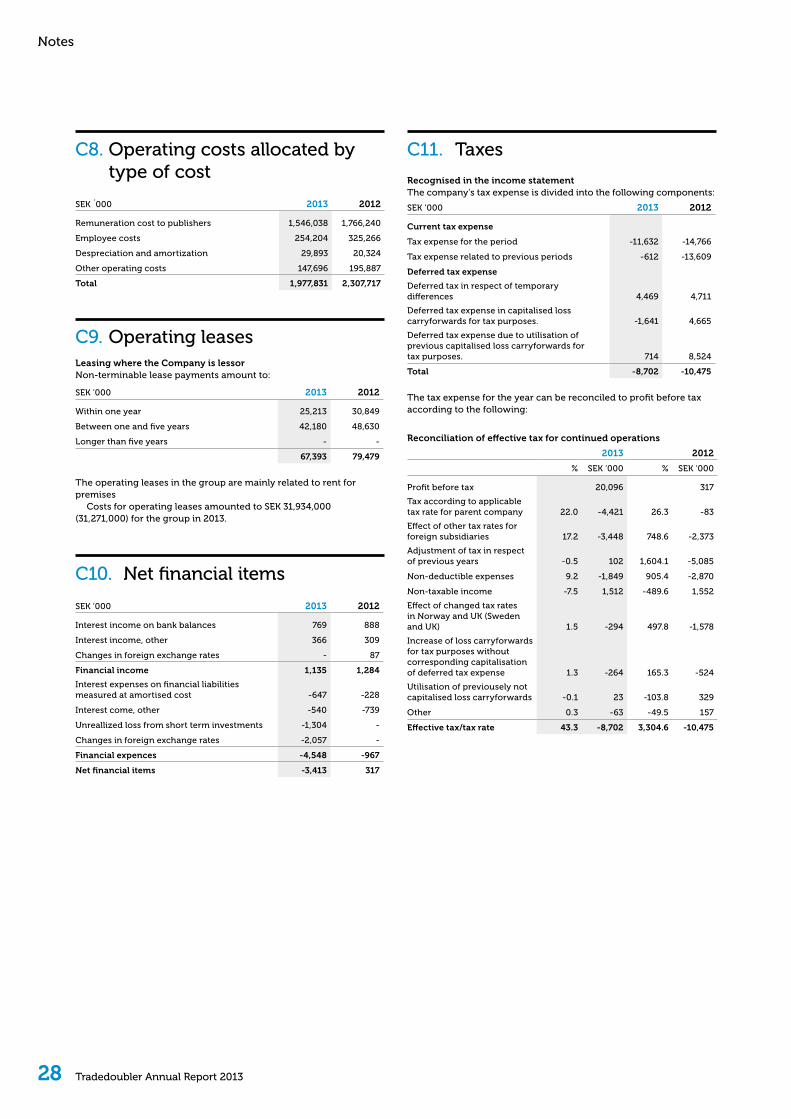
28 Tradedoubler Annual Report 2013
Notes
C8. Operating costs allocated by type of cost
SEK ´000 2013 2012
Remuneration cost to publishers 1,546,038 1,766,240
Employee costs 254,204 325,266
Despreciation and amortization 29,893 20,324
Other operating costs 147,696 195,887
Total 1,977,831 2,307,717
C9. Operating leasesLeasing where the Company is lessorNon-terminable lease payments amount to:
SEK ‘000 2013 2012
Within one year 25,213 30,849
Between one and five years 42,180 48,630
Longer than five years - -
67,393 79,479
The operating leases in the group are mainly related to rent for premises
Costs for operating leases amounted to SEK 31,934,000 (31,271,000) for the group in 2013.
C10. Net financial items
SEK ‘000 2013 2012
Interest income on bank balances 769 888
Interest income, other 366 309
Changes in foreign exchange rates - 87
Financial income 1,135 1,284
Interest expenses on financial liabilities measured at amortised cost -647 -228
Interest come, other -540 -739
Unreallized loss from short term investments -1,304 -
Changes in foreign exchange rates -2,057 -
Financial expences -4,548 -967
Net financial items -3,413 317
C11. Taxes
Recognised in the income statementThe company’s tax expense is divided into the following components:
SEK ‘000 2013 2012
Current tax expense
Tax expense for the period -11,632 -14,766
Tax expense related to previous periods -612 -13,609
Deferred tax expense
Deferred tax in respect of temporary differences 4,469 4,711
Deferred tax expense in capitalised loss carryforwards for tax purposes. -1,641 4,665
Deferred tax expense due to utilisation of previous capitalised loss carryforwards for tax purposes. 714 8,524
Total -8,702 -10,475
The tax expense for the year can be reconciled to profit before tax according to the following:
Reconciliation of effective tax for continued operations
2013 2012
% SEK ‘000 % SEK ‘000
Profit before tax 20,096 317
Tax according to applicable tax rate for parent company 22.0 -4,421 26.3 -83
Effect of other tax rates for foreign subsidiaries 17.2 -3,448 748.6 -2,373
Adjustment of tax in respect of previous years -0.5 102 1,604.1 -5,085
Non-deductible expenses 9.2 -1,849 905.4 -2,870
Non-taxable income -7.5 1,512 -489.6 1,552
Effect of changed tax rates in Norway and UK (Sweden and UK) 1.5 -294 497.8 -1,578
Increase of loss carryforwards for tax purposes without corresponding capitalisation of deferred tax expense 1.3 -264 165.3 -524
Utilisation of previousely not capitalised loss carryforwards -0.1 23 -103.8 329
Other 0.3 -63 -49.5 157
Effective tax/tax rate 43.3 -8,702 3,304.6 -10,475

29Tradedoubler Annual Report 2013
Notes
Deferred tax assets and tax liabilities recognised in the balance sheetDeferred tax assets and tax liabilities are attributable to the following:
Deferred tax assets Deferred tax liabilities Net
SEK ‘000 2013 2012 2013 2012 2013 2012
Loss carryforwards 16,193 17,872 - - 16,193 17,872
Other receivables 767 555 - - 767 555
Other liabilities 21,888 16,459 -4,597 -4,597 17,291 11,862
Other non-current assets 1,277 1,121 - - 1,277 1,121
Deferred tax assets and tax liabilities 40,125 36,007 -4,597 -4,597 35,528 31,410
Non-recognised deferred tax assetsDeductible temporary differences and loss carryforwards for tax purposes for which deferred tax assets have not been recognised in the income statement and balance sheet:
SEK ‘000 2013 2012
Tax on loss carryforwards 361 919
Total 361 919
The value for tax purposes of capital loss carryforwards of SEK 16,193,000 and non-capital loss carryforwards of SEK 361,000 amounting to SEK 16,554,000 in total, have a perpetual term. For information on capital loss carryforwards, see notes to the consolidated financial statements C2 Critical estimates and judgements.
SEK ‘000Capitalisation of
loss carryforwards Other receivables Other liabilitiesOther non-current
assetsDeferred tax assets
and tax liabilities
Balance at Jan 1, 2012 18,913 2,198 -5,495 -2,130 13,487
Recognised via income statement 13,189 -1,653 3,113 3,251 17,900
Reclassification -14,000 - 14,000 - -
Translation difference -230 10 244 - 24
Balance at Dec 31, 2012 17,872 555 11,862 1,121 31,410
Balance at Jan 1, 2013 17,872 555 11,862 1,121 31,410
Recognised via income statement -1,619 223 4,780 158 3,542
Reclassification - - - - -
Translation difference -60 -11 649 -2 576
Balance at Dec 31, 2013 16,193 767 17,291 1,277 35,528
C12. Financial assets and liabilities distributed per category
2013 2012
SEK ‘000Loans and
receivables
At fair value via the Profit & Loss
Other financial liabilities
Total carrying amount
Loans and receivables
At fair value via the Profit & Loss
Other financial liabilities
Total carrying amount
Trade receivables 459,910 459,910 519,268 519,268
Short term investments 201,794 201,794 - -
Cash and bank balances 304,662 304,662 164,445 164,445
Total financial assets 764,572 201,794 966,366 683,713 - 683,713
Bond loan 244,586 244,586 - -
Trade payables 21,689 21,689 20,642 20,642
Liabilities to publishers 451,261 451,261 402,514 402,514
Total financial liabilities 717,536 717,536 423,156 423,156
Determination of fair value is as a valuation hierarchy consisting of three levels. The levels reflect the extent to which fair value is based on observable market data or assumptions.
Level 1 fair value is determined based on the observed (unadjusted) quoted prices in active markets for identical assets and liabilities.Level 2 fair value is determined using valuation models based on observable for the asset or liability other than quoted prices included in Level 1.Level 3 fair value is determined using valuation models where significant inputs are based on observable market data.
All Tradedoublers assets at fair value through profit or loss are measured at Level 1. Tradedoubler currently has no liabilities measured to fair value.

30 Tradedoubler Annual Report 2013
Notes
C13. Intangible assets
SEK ‘000Development
expensesAdministration
& Support Goodwill Other Total
Accumulated acquisition costs
Opening balance at Jan 1, 2012 10,658 17,333 504,922 26,751 559,664
Investments for the year 15,586 20,656 - 16 36,258
Sales/disposals - -3,406 - -13,750 -17,156
Translation difference - - -17,831 63 -17,768
Closing balance at Dec 31, 2012 26,244 34,583 487,091 13,080 560,998
Opening balance at Jan 1, 2013 26,244 34,583 487,091 13,080 560,999
Investments for the year 18,765 11,042 - 27 29,834
Sales/disposals - -350 - -51 -401
Translation difference - - 12,481 162 12,643
Closing balance at Dec 31, 2013 45,009 45,275 499,572 13,219 603,075
Accumulated amortisation and impairment losses
Opening balance at Jan 1, 2012 -1,282 -107 -134,592 -19,629 -155,610
Amortisation -4,071 -4,335 - -6,522 -14,928
Sales/disposals - 3,406 - 13,750 17,156
Translation difference - - 829 -82 748
Closing balance Dec 31, 2012 -5,354 -1,036 -133,762 -12,482 -152,634
Opening balance at Jan 1, 2013 -5,354 -1,036 -133,762 -12,482 -152,634
Amortisation -9,071 -14,551 - -475 -24,096
Sales/disposals - 350 - 51 401
Translation difference - - -3,102 -75 -3,177
Closing balance Dec 31, 2013 -14,424 -15,237 -136,864 -12,981 -179,506
Carrying amounts
At Jan 1, 2012 9,376 17,226 370,331 7,122 404,054
At Dec 31, 2012 20,890 33,547 353,328 598 408,364
At Dec 31, 2013 30,585 30,038 362,708 238 423,569
Amortisation of intangible assets is included in administrative expenses. All intangible assets, aside from Goodwill, are amortised. For further information about depreciation methods, see Note C1 Accounting Policies.
Goodwill is tested annually for impairment or as soon as there are indications of a decline in value. In 2013, this testing was based on value in use, i.e. discounted cash flows for the different operating segments. To support this impairment testing, an overall analysis has been performed of the sensitivity of the variables used in the model. An increase in the WACC after tax of 2 percentage units combined with a decreased growth rate after the forecast period of a half per-centage unit, each of which is reasonably likely, shows that a good margin still exists between recoverable amounts and carrying amounts. The management has therefore made the assessment that there was no further need for impairment of goodwill at the end of 2013.
In the discounted cash flow statements, a discount rate (WACC) is used based on the risk-free rate of interest plus a stock market pre-mium. WACC before tax in the estimates for the seven cash-generat-ing units on 31 December 2013 lies in the range 20.4 to 21.9 (15.5 to 16.2) per cent. The estimated WACC is significantly higher compared to the previous year, mainly due to the expected risk premium (through the so-called beta value) has risen sharply for Tradedoubler share. Tradedoubler have chosen to use the same calculation princi-ple as previous years.
For estimation of future revenue and growth, external and internal assumptions are used. Tradedoubler’s forecast period extends until
2022. The growth rate in the forecast period is in line with the out-look for the company’s market. The growth rate after the forecast period is set at 1.5 (1.5) per cent per year. The forecast period exceeds five years since the market for internet marketing is a rela-tively new market and we expect strong growth over the next ten years.
Goodwill allocated per cash generating unit
SEK ‘000 2013 2012
Nordics 48,356 49,157
UK & Ireland 37,228 36,390
France & Benelux 80,907 77,954
DACH 53,839 52,142
East 11,807 11,605
South 83,594 80,541
Technology 46,977 45,539
Total 362,708 353,328
From 1 January 2013, Tradedoubler has been organised into six new geographical market units and the comparative figures for 2012 were recalculated according to the currently effective segments. For fur-ther information see Note C4 Segment Reporting.

31Tradedoubler Annual Report 2013
Notes
C16. Shareholder’s equity
Share capitalShare capital refers to the parent company’s share capital. Each share carries one vote and those entitled to vote may vote for the full number of shares represented and owned without any restriction in voting rights. All shares carry equal rights to share in the company’s assets and profits and in any surplus on liquidation.
At December 31, 2013, TradeDoubler AB had a share capital of SEK 17.1 M distributed among 42,807,449 shares, each share with a par value of SEK 0.40.
Reconciliation of number of sharesNumber of
shares issuedIssued
share capital
Number of shares issued January 1, 2013* 42,807,449 17,122,979
Number of shares issued December 1, 2013* 42,807,449 17,122,979
*Of which 475,000 (130,000) shares are in own custody
Translation reserveThe translation reserve included all exchange differences that arise on translation of financial statements from foreign operations that have prepared their financial statements in another currency than the currency which the group’s financial statements are presented in. The parent company and group present their financial statements in Swedish kronor (SEK).
Retained earnings including net profit for the yearRetained earnings including net profit for the year includes profits earned in the parent company and its subsidiaries. Previous alloca-tions to the statutory reserve, excluding transferred share premium reserves, are included in this equity item.
DividendThe board and CEO will propose to Tradedoubler’s Annual General Meeting 2013 that a dividend of SEK 0.25 per share (0.0) should be declared for 2013 in accordance with Tradedoubler’s guidelines.
Tradedoubler has a policy of distributing at least 50 per cent of the profit after tax, provided that a suitable capital structure is main-tained. Distribution may occur through share dividends, share redemption and share buyback.
Group capital managementGroup capital under management is composed of shareholders’ equity, which at the end of 2013 amounted to SEK 506.5 M (488.4) in total. The measures of the company’s capital structure used for con-trol purposes are the interest coverage ratio, defined as profit before tax, plus interest expense, divided by interest expense; and the debt/equity ratio, defined as the total of interest-bearing liabilities and pension provisions less cash and cash equivalents and interest-bear-ing receivables, divided by shareholders’ equity.
Shares in own custodyDuring 2013, Tradedoubler purchased its own shares on two occa-sions in order to secure the outcome of ongoing incentive pro-grammes. 15,000 shares were repurchased at a price of SEK 17.53 per share and 330,000 shares were repurchased at a price of SEK 17.60 per share.
Total holdings of own shares at the end of 2013 amounted to 475,000 ordinary shares after buy-backs and an investment of SEK 17.1 M.
No outcome occurred during 2013 in ongoing programmes. For more information regarding long-term incentive programmes, see notes to the consolidated accounts, C6 Share-based remuneration.
C14. Property, plant and equipment
SEK ‘000Equipment, tools,
fixtures and fittings
Accumulated cost
Opening balance Jan 1, 2012 58,721
Investments 4,755
Sales/Disposals -24,104
Translation difference -833
Closing balance Dec 31, 2012 38,539
Opening balance Jan 1, 2013 38,539
Investments 1,713
Sales/Disposals -12,836
Translation difference 207
Closing balance Dec 31, 2013 27,622
Accumulated depreciation
Opening balance Jan 1, 2012 -47,753
Depreciation -5,396
Sales/Disposals 24,143
Translation difference 585
Closing balance Dec 31, 2012 -28,421
Opening balance Jan 1, 2013 -28,421
Depreciation -5,797
Sales/Disposals 12,682
Translation difference -178
Closing balance Dec 31, 2013 -21,713
Carrying amounts
At Jan 1, 2012 10,968
At Dec 31, 2012 10,117
At Dec 31, 2013 5,909
C15. Prepaid expenses and accrued income
SEK ‘000 2013 2012
Rent of promises 6,299 8,239
Accrued income 1,651 4,552
Accrued interest income 905 -
Other 4,035 4,586
Total 12,890 17,376
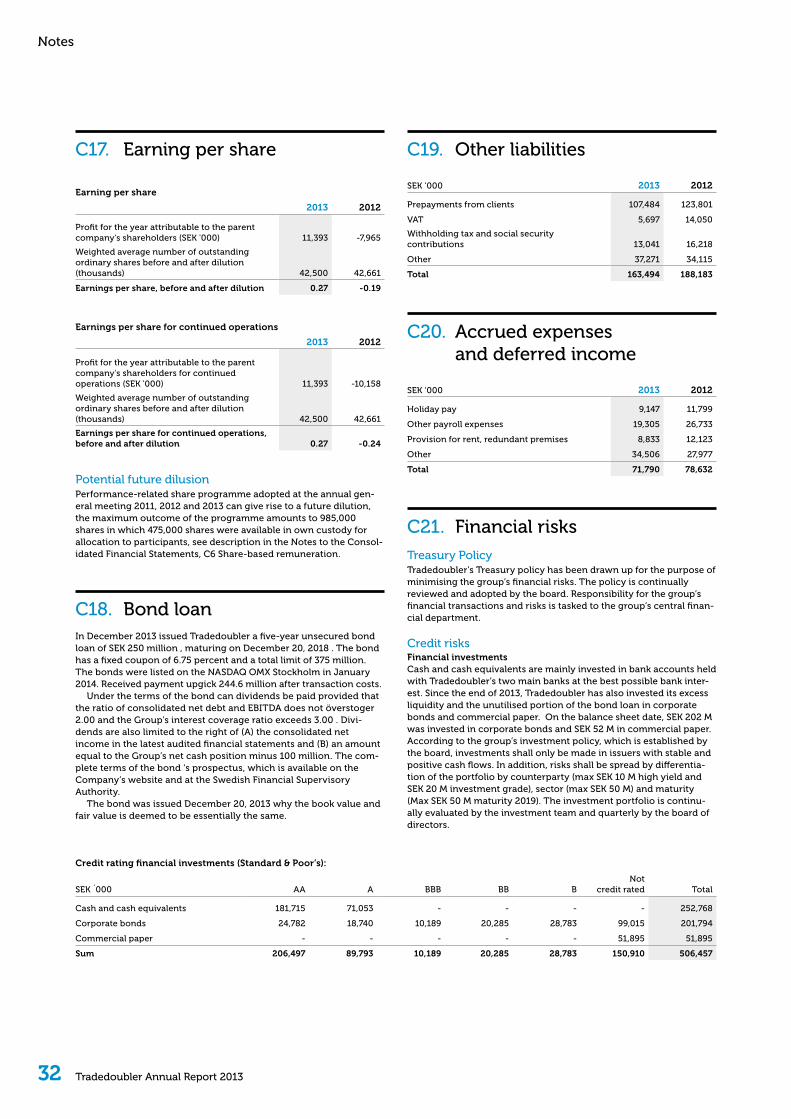
32 Tradedoubler Annual Report 2013
Notes
C17. Earning per share
Earning per share
2013 2012
Profit for the year attributable to the parent company's shareholders (SEK '000) 11,393 -7,965
Weighted average number of outstanding ordinary shares before and after dilution (thousands) 42,500 42,661
Earnings per share, before and after dilution 0.27 -0.19
Earnings per share for continued operations
2013 2012
Profit for the year attributable to the parent company's shareholders for continued operations (SEK '000) 11,393 -10,158
Weighted average number of outstanding ordinary shares before and after dilution (thousands) 42,500 42,661
Earnings per share for continued operations, before and after dilution 0.27 -0.24
Potential future dilusionPerformance-related share programme adopted at the annual gen-eral meeting 2011, 2012 and 2013 can give rise to a future dilution, the maximum outcome of the programme amounts to 985,000 shares in which 475,000 shares were available in own custody for allocation to participants, see description in the Notes to the Consol-idated Financial Statements, C6 Share-based remuneration.
C18. Bond loanIn December 2013 issued Tradedoubler a five-year unsecured bond loan of SEK 250 million , maturing on December 20, 2018 . The bond has a fixed coupon of 6.75 percent and a total limit of 375 million. The bonds were listed on the NASDAQ OMX Stockholm in January 2014. Received payment upgick 244.6 million after transaction costs.
Under the terms of the bond can dividends be paid provided that the ratio of consolidated net debt and EBITDA does not överstoger 2.00 and the Group’s interest coverage ratio exceeds 3.00 . Divi-dends are also limited to the right of (A) the consolidated net income in the latest audited financial statements and (B) an amount equal to the Group’s net cash position minus 100 million. The com-plete terms of the bond ‘s prospectus, which is available on the Company’s website and at the Swedish Financial Supervisory Authority.
The bond was issued December 20, 2013 why the book value and fair value is deemed to be essentially the same.
C19. Other liabilities
SEK ‘000 2013 2012
Prepayments from clients 107,484 123,801
VAT 5,697 14,050
Withholding tax and social security contributions 13,041 16,218
Other 37,271 34,115
Total 163,494 188,183
C20. Accrued expenses and deferred income
SEK ‘000 2013 2012
Holiday pay 9,147 11,799
Other payroll expenses 19,305 26,733
Provision for rent, redundant premises 8,833 12,123
Other 34,506 27,977
Total 71,790 78,632
C21. Financial risks
Treasury PolicyTradedoubler’s Treasury policy has been drawn up for the purpose of minimising the group’s financial risks. The policy is continually reviewed and adopted by the board. Responsibility for the group’s financial transactions and risks is tasked to the group’s central finan-cial department.
Credit risksFinancial investmentsCash and cash equivalents are mainly invested in bank accounts held with Tradedoubler’s two main banks at the best possible bank inter-est. Since the end of 2013, Tradedoubler has also invested its excess liquidity and the unutilised portion of the bond loan in corporate bonds and commercial paper. On the balance sheet date, SEK 202 M was invested in corporate bonds and SEK 52 M in commercial paper. According to the group’s investment policy, which is established by the board, investments shall only be made in issuers with stable and positive cash flows. In addition, risks shall be spread by differentia-tion of the portfolio by counterparty (max SEK 10 M high yield and SEK 20 M investment grade), sector (max SEK 50 M) and maturity (Max SEK 50 M maturity 2019). The investment portfolio is continu-ally evaluated by the investment team and quarterly by the board of directors.
Credit rating financial investments (Standard & Poor’s):
SEK ´000 AA A BBB BB BNot
credit rated Total
Cash and cash equivalents 181,715 71,053 - - - - 252,768
Corporate bonds 24,782 18,740 10,189 20,285 28,783 99,015 201,794
Commercial paper - - - - - 51,895 51,895
Sum 206,497 89,793 10,189 20,285 28,783 150,910 506,457

33Tradedoubler Annual Report 2013
Notes
Customer credit riskThe group and the company are exposed to credit risk, which arises primarily in connection with trade receivables. Trade receivables at year-end amounted to SEK 460 M (519). New clients are subjected to credit rating reports, which provides the basis for setting credit and payment terms and conditions for each client. The credit controls provide an assessment of clients’ financial position based on infor-mation obtained from various credit information companies.
The group has established a credit policy that determines how cli-ents are managed, with decision-making levels set for various credit limits. Tradedoubler’s business model is based on advance payment from clients. When deviations from the advance payment policy are made, the company’s credit policy serves as the basis for decision.
Tradedoubler has not noticed increased bad debt losses in any geographical area. However, the group management is actively monitoring the situation, particularly as regards Southern Europe. No specific risk concentration exists for any customer category.
Incurred bad debt losses during the year amounted to SEK 2,047,000 (3,867,000) in the group, net after reversal of liabilities to publishers.
Provision for feared bad debt losses in the balance sheet amounted to SEK 38,045,000 (19,513,000).
Since a publisher in most cases only gets paid when the customer has paid the invoice, the company’s customer credit risk is reduced in this way.
Maturity analysis, amount less doubtful debts
2013 2012
SEK ´000Carrying amount
Carrying amount
Trade receivables not due 287,800 391,209
Trade receivables, due 0-30 days 82,821 63,956
Trade receivables, due 31-90 days 69,080 41,401
Trade receivables, due >90+ days 20,209 22,703
459,910 519,268
Foreign exchange riskForeign exchange risk refers to the risk that changes in exchange rates may affect the consolidated income statement, balance sheet and cash flow statement. Foreign exchange risk exists in the form of transaction risk and translation risk. Tradedoubler is exposed to for-eign exchange risk in 18 countries involving nine different curren-cies, with Euro (EUR) and British pounds (GBP) representing the majority share.
In 2013, approximately 52 (53) per cent of group sales were made in EUR and approximately 25 (26) per cent in GBP. In 2012, approxi-mately 34 (31) per cent of the group’s costs were in EUR and approxi-mately 20 (17) percent in GBP.
Transaction riskExposure attributable to exchange rate fluctuations in client and supplier invoices is limited since invoicing to customers and from suppliers largely occurs in local currency for all companies in the group.
Tradedoubler is also exposed to foreign exchange risk in the parent company’s intra-group lending to subsidiaries, which takes place in the subsidiary’s currency, as well as deposits from subsidiaries of excess liquidity. Exchange rate differences due to deposits and lend-ing from subsidiaries are recognised in the income statement.
Intra-group lending and deposits are not hedged.
Translation riskChanges in foreign exchange rates impact the group’s earnings on translation of the income statements of foreign subsidiaries to the group’s presentation currency, SEK.
Translation exposure also arises in connection with translation of the group’s investments in foreign subsidiaries to the group’s pres-entation currency, SEK, which is recognised as a component of “other comprehensive income” (outside the income statement).
In the event of a weakening of the group’s underlying currencies of 10 per cent, this would affect the company’s profit before tax neg-atively by approx. SEK 4 M, of which SEK 2 M relates to subsidiaries in euro zone countries, SEK 1 M relates to the UK subsidiary and SEK 1 M to other foreign subsidiaries. If the company’s underlying currencies weakened by 10 per cent at the end of the reporting period, it would weaken consolidated equity by approx. SEK 38 M, of which SEK 27 M relates to the subsidiaries in euro zone countries, SEK 3 M relates to the UK subsidiary and SEK 8 M to other foreign companies in the group.
The group’s net investments in foreign currency primarily involve EUR and GBP. Net investments in foreign currency are not currently hedged.
Interest riskInterest risk refers to the risk that changes in market interest rates may affect the consolidated income statement and cash flow or the fair value of financial assets and liabilities. A significant factor affect-ing the interest risk is the interest rate refixing period. The group’s interest rate exposure is managed centrally, which means that the finance function is responsible for identifying and managing this exposure.
On 31 December 2013, interest-bearing assets in the form of bank balances amounted to SEK 253 M, commercial paper SEK 52 M and investments in securities SEK 202 M. Bank balances run according to variable rates of interest, mainly linked to market rates for each cur-rency that the asset relates to. Commercial paper has fixed rates of interest during the term while investments in securities run accord-ing to both fixed and variable interest. A change in the variable inter-est rate of + / - 1 percent on the closing date affect the Group’s net financial items by SEK 4 million.
During 2013, Tradedoubler has issued a bond loan for a nominal amount of SEK 250 M, and the loan runs according to fixed interest of 6.75%. There was no other external borrowing on the balance sheet date.
Liquidity riskTradedoubler works actively to minimise the group’s liquidity risk by not taking risks in the cash flow. A publisher in most cases is only paid when the customer has paid the invoice to Tradedoubler. Trade-doubler limits its liquidity risk in this way. Credit ratings are per-formed on new clients and Tradedoubler normally requires advance payments from clients for which adequate financial information is not available.
Tradedoubler also has counterparty risk related to liquidity risks, which are principally related to banks in existing markets. The cur-rent uncertainty in Southern Europe is affecting a number of the banks that the group is working with. The group management con-tinually monitors the risk level of the banks concerned and works actively to minimise the exposure to banks that are considered risky. During 2013, Tradedoubler has worked to limit counterparty risk by reducing the number of banks that the group works with and by cen-tralising liquidity to the parent company.
Duration analysis, financial liabilities
2013 2012
SEK ´000 TotalWithin 1
monthWithin 1-3
monthsOver 4
months TotalWithin 1
monthWithin 1-3
monthsOver 4
months
Bond Loan* 250,000 - - 250,000 - - - -
Trade payables 21,689 21,003 686 - 20,642 19,744 477 421
Short-term liabilities to publishers 451,261 206,958 217,239 27,064 402,514 150,663 228,432 23,419
Total 722,950 227,961 217,925 277,064 423,156 170,407 228,909 23,840
*Tradedoubler bond will be paid in whole on maturity, 2018-12-20.

34 Tradedoubler Annual Report 2013
Notes
C22. Pledged assets and contingent liabilities
SEK ‘000 2013 2012
Pledged assets
Rental deposits 5,759 3,647
Total pledged assets 5,759 3,647
Contingent liabilities None None
C23. Transactions with related partiesTransactions with related parties are priced on commercial terms. The group has during the year had transactions between the parent company and its subsidiaries. The transactions consist primarily of license invoices from the parent company to the subsidiaries. See further description in Notes to the Parent company’s financial state-ments, M15 Investments and M23 Transactions with related parties.
Transactions with key people in executive positions During the year, a board member acquired SEK 1.0 (-) M of Tradedou-bler’s bond. No other transactions have taken place during the year except the ones specified in the notes to the consolidated accounts, Note C4 Remuneration to employees, group management and board of directors and Note C6 Share-based remuneration.
C24. Cash flow statement, supplementary information
Cash and cash equivalents
SEK ‘000 2013 2012
The following sub-components are included in cash and cash equivalents:
Commercial paper 51,895 -
Cash and bank balances 252,767 164,445
Total according to the balance sheet 304,662 164,445
Total according to the cash flow statement 304,662 164,445
SEK ‘000 2013 2012
Interest received 979 1,198
Interest paid -632 -829
Adjustment for items not included in the cash flow
SEK ‘000 2013 2012
Depreciation and amortization 29,893 20,324
Provisions for severance payments 22,043 26,765
Other 2,068 2,736
54,004 49,825
C25. Events after the balance sheet dateAs a result of the restructuring communicated at the end of the year Tradedoubler will change the way the company reports its operating segments. Operations within affiliate will continue to be divided on market units with the change that Nordic and East will be merged into one unit, and that the campaign activities will be broken out and reported separately.
Technology and cost for group-management and other support-ing units will continue to be reported as separate segments.
C26. Discontinued operationsOn 20 December, the company management announced the board’s decision to sell the Search market unit to NetBooster SA. The opera-tion was divested in full and the deal was concluded on 20 December.
The market unit did not fulfil the goals that the board had set for the operation and the board’s view is that a divestment will strengthen the group’s future competitiveness and enable the com-pany management to focus more clearly on the core business.
In connection with the divestment, a cooperation agreement was signed with the NetBooster Group in order to continue taking advan-tage of a comprehensive range to customers while offering Net-Booster a greater range of services.
The operation displayed a negative operating result and the pur-chaser took over the operation and its future contracted undertak-ings. The agreed purchase price of EUR 1 should be considered together with the negative result that the operation displayed and the shared undertaking to continue supplying a better offering in conjunction with NetBooster.
The capital loss amounted to SEK -146.9 M, which mostly con-sisted of a reversal of increased net investment of SEK-98.1 M and translation difference in equity of SEK -3.8 M that were both reversed in the consolidated statement of comprehensive income. The capital loss also included impairment of client relations that arose in con-nection with the acquisition of the Search operations amounting to SEK -28.3 M and transaction costs of SEK -7.0 M. Total effect on equity from the transaction was SEK -45.0 M.
SEK ‘000 2013 2012
Net sales - -290
Cost of goods sold - 4,914
Gross profit - 4,624
Selling expenses - -
Administrative expenses - -2,419
Operating profit - 2,205
Financial income - 31
Financial expenses - -2
Net financial items - 29
Profit before tax - 2,234
Tax - -42
Net profit excl capital loss for the year for discontinuing operations - 2,192
Capital loss - -
Net profit for the year for discontinuing operations - 2,192
Other comprehensive income
Net profit from discontinued operations - 2,192
Total other comprehensive income from discontinued operations - 2,192

35Tradedoubler Annual Report 2013
Financial information
Parent company income statement
SEK ‘000 Note 2013 2012
Net sales P3 121,568 128,906
Cost of goods sold -1,831 -8,636
Gross profit 119,737 120,270
Selling expenses -1,099 -2,105
Administrative expenses -107,498 -127,848
Research & development expenses -28,312 -46,625
Operating profit P4, P5, P6, P7, P8 -17,173 -56,308
Profit from financial items
Profit from participations in group companies 65,188 -2,354
Other interest income and similar income statement items -457 2,864
Interest expenses and similar income statement items -883 -1,508
Net financial items P9 63,849 -998
Profit before tax 46,676 -57,306
Tax P10 3,499 19,230
Net profit for the year 50,175 -38,076
Statement of comprehensive income
Profit for the year 50,175 -38,076
Other comprehensive income
Exchange difference on increased net investment, net after tax - -
Reversal of exchange difference on increased net investment, net after tax - -
Total other comprehensive income - -
Total comprehensive income for the year 50,175 -38,076

36 Tradedoubler Annual Report 2013
Financial information
Parent company balance sheet
SEK ‘000 Note Dec 31, 2013 Dec 31, 2012
Assets
Non-current assets
Intangible assets P12 60,624 54,438
Equipments, tools, fixtures and fittings P13 1,047 3,458
Participations in group companies P14, P15 160,881 198,105
Deferred tax asset P10 28,321 24,802
Total non-current assets 250,872 280,802
Current assets P11, P20
Trade receivables 4,430 2,846
Receivables from group companies 109,888 121,053
Tax receivables P10 1,599 2,407
Other receivables 4,158 5,762
Prepaid expenses and accrued income P16 4,605 3,688
Short-term investments 201,794 -
Cash and cash equivalents 154,374 57,094
Total current assets 480,847 192,849
Total assets 731,719 473,651
Equity and liabilities
Shareholders’ equity P17
Restricted equity
Share capital 17,123 17,123
Statuatory reserve 89,022 89,022
Non-restricted equity
Share premium reserve 352,540 352,540
Retained earnings -292,470 -248,504
Net profit for the year 50,175 -38,076
Total equity 216,390 172,105
Long-term liabilities P11, P20
Bond loan P18 244,586 -
Total long-term liabilities 244,586 -
Current liabilities P11, P20
Trade payables 11,291 12,150
Liabilities to group companies 156,205 191,076
Other liabilities P19 91,187 75,979
Accrued expenses and deferred income P20 12,060 22,340
Total current liabilities 270,743 301,546
Total equity and liabilities 731,719 473,651
Pledged assets P22 1,530 None
Contingent liabilities P22 2,715 2,259

37Tradedoubler Annual Report 2013
Financial information
Parent company changes in equity
Restricted Non-restricted
SEK ‘000 Share capital StatutoryShare premium
reserve
Retained earnings inc. net profit for
the year Total equity
Opening balance at January 1, 2012 17,123 89,022 352,540 -184,488 274,198
Comprehensive income -
Net profit for the year -38,076 -38,076
Total comprehensive income -38,076 -38,076
Transactions with shareholders
Dividend -64,016 -64,016
Closing balance at December 31, 2012 17,123 89,022 352,540 -286,580 172,106
Opening balance at January 1, 2013 17,123 89,022 352,540 -286,580 172,106
Comprehensive income -
Net profit for the year 50,175 50,175
Total comprehensive income 50,175 50,175
Transactions with shareholders
Repurchase of own shares -6,071 -6,071
Equity-settled share-based payments 181 181
Closing balance at December 31, 2013 17,123 89,022 352,540 -242,296 216,390

38 Tradedoubler Annual Report 2013
Financial information
Parent company cash flow statement
SEK '000 Note 2013 2012
Operating activities P24
Profit before tax 46,676 -57,306
Adjustment for items not included in the cash flow 58,399 36,311
Taxes paid 788 -788
Cash flow from operating activities before changes in working capital 105,863 -21,783
Cash flow from changes in working capital
Increase (-)/Decrease (+) in operating receivables 9,937 36,487
Increase (-)/Decrease (+) in operating liabilities -34,815 92,086
Cash flow from operating activities 80,985 106,790
Investing activities
Net investments in intangible assets -29,807 -36,242
Net investments in property, plant and equipment -482 -666
Investment in financial assets -203,098 -
Repayment of shareholders' contribution 12,184 -
Divestment of shares 100 -
Investment in shares -1,117 -996
Cash flow from investing activities -222,220 -37,904
Financing activities
Dividend - -64,016
Repurchase of own shares -6,071 -
External loan 244,586 -
Cash flow from financing activities 238,515 -64,016
Cash flow for the year 97,280 4,870
Cash and cash equivalents at the beginning of the year 57,094 52,224
Cash and cash equivalents at the end of the year 154,374 57,094

39Tradedoubler Annual Report 2013
Notes
P1. Accounting policiesThe parent company has prepared its annual accounts and consoli-dated accounts according to the Swedish Annual Accounts Act (1995:1554) and the Swedish Financial Reporting Board’s recommen-dation, RFR 2 Accounting for Legal Entities. RR 2 means that the parent company, in the annual accounts for the legal entity, shall apply all EU adopted IFRS and statements whenever possible within the framework of the Swedish Annual Accounts Act and taking into account the relationship between recognition and taxation. The rec-ommendation states which exemptions and amendments from IFRS should be utilised. Statements issued by the Swedish Financial Reporting Board are also applied.
Differences between the accounting policies of the group and the parent companyThe differences between the accounting policies applied by the group and the parent company are shown below. The accounting policies set out for the parent company below have been applied consistently for all periods presented in the parent company’s financial statements.
Classification and formatThe parent company’s income statement and balance sheet are pre-pared according to the Swedish Annual Accounts Act’s layout. The difference in relation to IAS 1: Presentation of financial statements that was applied in the presentation of the consolidated financial statements is mainly in recognition of financial income and expenses, non-current assets and shareholders’ equity, discontinued operations and the presence of provisions as a separate heading in the balance sheet.
SubsidiariesParticipations in subsidiaries are recognised in accordance with the cost method.
Group contributions and shareholders’ contributions for legal entitiesThe parent company reports group contributions and shareholders’ contributions in accordance with RFR 2. The company has chosen to account for group contributions paid and received in the income statement.
Shareholders’ contributions are carried directly against equity in the case of the receiver and capitalised as shares and participations by the grantor, to the extent that impairment is not required.
P2. Critical estimates and judgementsThe parent company mainly has intangible assets that are affected by estimates and judgements. For information regarding critical esti-mates and judgements in the annual accounts see the note to the Consolidated accounts, C2 Critical estimates and judgements.
P3. Distribution of revenue
SEK ´000 2013 2012
Transaction revenue - 8,177
Other revenue 639 800
License fees 120,929 119,929
Total revenue 121,568 128,906
P4. Remuneration to employees
Average number of employees 2013 2012
men (%) men (%)
Sweden 50 52 73 56
Remunerations and social security contributions
Salaries and other remuneration
2013 2012
Salaries and remuneration 45,348 57,053
of which share-based payments (181) -
Social security contributions 13,607 21,276
of which pensions (4,308) (5,874)
Total 58.995 78.329
For further information regarding remuneration to the board and company management and the remuneration policies within the group, see notes to the consolidated statements, Note C5 Remunera-tion to employees, group management and board of directors.
P5. Share-based remuneration
Performance-Based Share Programme 2011/2012/2013The parent company has in 2013 reported a cost of SEK 227,000 (0) for the long-term incentive plan that was decided at the annual general meeting 2011, 2012 and 2013. For more information regard-ing the share-based remunerations in the group, see notes to the consolidated statements, Note C6 Share-based remuneration.
P6. Remuneration for auditor
SEK ´000 2013 2012
Ernst & Young
Audit assignments 2,532 3,612
Audit related fees - -
Tax services - -
Other assignments 103 355
Total 2,635 3,967
Audit assignments refers to the examination of the annual accounts, the consolidated accounts and accounting records as well as the administration of the board of directors and the CEO, other duties that the Company s auditors are obliged to perform as well as advice or other assistance arising from observations during such examina-tion and implementation of such duties. In addition, the auditor reviewed the corporate governance report. The auditor has also reviewed the interim report for the period January-September 2013 and has been retained for certain advice, most of which pertained to audit-related consultations regarding accounting and tax matters.

40 Tradedoubler Annual Report 2013
Notes
P7. Operating costs allocated by type of cost
SEK ´000 2013 2012
Remuneration cost to publishers -1,831 -8,636
Employee costs -46,634 -84,020
Depreciation and amortization -26,514 -11,135
Other operating costs -63,761 -81,423
Total -138,741 -185,214
P8. Operating leasesLeasing where the Company is lessorNon-terminable lease payments amount to:
SEK ´000 2013 2012
Within one year 5,303 9,233
Between one and five years 14,734 1,122
Longer than five years
20,037 10,355
The operating leases in the group are mainly related to rent for premises.
Costs for operating leases 2013 amounted to SEK 9,545,000 (10,484,000)
P9. Net financial items
SEK ´000 2013 2012
Dividends from group companies 86,073 2,367
Group contributions received 5,306 4,550
Interest income, group companies 525 855
Interest income, other 469 355
Change in foreign exchenge rates - 1,654
Financial income 92,372 9,781
Write-down of investments in subsidiary -26,057 -9,218
Interest expense, group companies -228 -1,277
Interest expense, other -649 -231
Unrealized result at fair valuation of short term investments -1,304 -
Change in foreign exchenge rates -146 -
Other financial expenses -139 -53
Financial expenses -28,524 -10,779
Net financial items 63,849 -998
P10. Taxes
The company’s tax expense is divided into the following components:
SEK ´000 2013 2012
Current tax expense
Tax expense for the period - -
Tax expense related to previous periods -20 -5,572
Deferred tax
Deferred tax revenue in capitalised loss carrying forwards for tax purposes during the year 1,560 10,802
Deferred tax related to temporary differences 1,213
Deferred tax expense due to utilisation and revision of previous capitalised loss carryfor-wards for tax purposes. 746 14,000
Total 3,499 19,230
The tax expense for the year can be reconciled to profit before tax according to the following:
Reconciliation of effective tax
2013 2012
% SEK ´000 % SEK ´000
Profit before tax 46,676 -57,306
Tax according to applicable tax rate 22.0 -10,269 26.3 15,071
Adjustment of tax in respect of previous years -1.6 726 14.7 8,428
Non-deductible expenses 12.6 -5,896 -5.2 -2,956
Non-taxable income -40.6 18,937 1.4 798
Affect of changed tax rate in Sweden - - -3.7 -2,111
Effective tax/tax rate -7.5 3,499 33.6 19,230

41Tradedoubler Annual Report 2013
Notes
P11. Financial assets and liabilities distributed per category
2013 2012
SEK ‘000Loans and
receivables
Valued to fair value over the
profit & loss
Other financial liabilities
Total carrying amount
Loans and receivables
Valued to fair value over the
profit & loss
Other financial liabilities
Total carrying amount
Trade receivables 4,430 4,430 2,846 2,846
Receivables from group companies 109,888 109,888 121,053 121,053
Short term investments 201,794 201,794 - -
Cash and bank balances 154,374 154,374 57,094 57,094
Total financial assets 268,691 201,794 470,485 180,993 180,993
Liabilities to group companies 244,586 244,586 - -
Debt to group companies 156,205 156,205 191,076 191,076
Trade payables 11,291 11,291 12,150 12,150
Total financial liabilities 412,082 412,082 203,226 203,226
Trade receivables, trade payables, other current receivables and liabilities that are measured at cost have short terms and thus fair value corre-sponds with the carrying amount. For further information regarding financial assets and liabilities distrubuted per category, see notes to the consolidated statements, Note C12 Financial assets and liabilities distrubuted per category.
P12. Intangible assets
SEK ‘000Development
expensesAdministration
and support
Accumulated acquisition costs
Opening balance at Jan 1, 2012 10,658 17,333
Reclassification 15,586 20,656
Investments for the year - -3,406
Closing balance at Dec 31, 2012 26,244 34,583
Opening balance at Jan 1, 2013 26,244 34,583
Investments for the year 18,765 11,042
Sales/disposals - -350
Closing balance at Dec 31, 2013 45,009 45,275
Accumulated amortisation
Opening balance at Jan 1, 2012 -1,283 -107
Amortisation for the year -4,071 -4,335
Sales/disposals - 3,406
Closing balance Dec 31, 2012 -5,354 -1,036
Opening balance at Jan 1, 2013 -5,354 -1,036
Amortisation for the year -9,070 -14,551
Sales/disposals - 350
Closing balance Dec 31, 2013 -14,424 -15,237
Carrying amounts
At Jan 1, 2012 9,374 17,227
At Dec 31, 2012 20,890 33,547
At Dec 31, 2013 30,585 30,038
P13. Property, plant and equipment
SEK ‘000Equipment, tools,
fixtures and fittings
Accumulated acquisition
Opening balance Jan 1, 2012 35,891
Investments 666
Sales/Disposals -24,141
Closing balance Dec 31, 2012 12,416
Opening balance Jan 1, 2013 12,416
Investments 482
Sales/Disposals -1,180
Utgående balans 2013-12-31 11,717
Accumulated depreciation
Opening balance Jan 1, 2012 -30,370
Depreciation for the year -2,729
Sales/Disposals 24,141
Closing balance Dec 31, 2012 -8,958
Opening balance Jan 1, 2013 -8,958
Depreciation for the year -2,860
Sales/Disposals 1,147
Closing balance Dec 31, 2013 -10,671
Carrying amounts
At Jan 1, 2012 5,521
At Dec 31, 2012 3,458
At Dec 31, 2013 1,047

42 Tradedoubler Annual Report 2013
Notes
P14. Financial assets
SEK ´000 2013 2012
Accumulated acquisition costs
Opening balance 198,105 206,327
Acquisitions and stock issues in subsidiaries 1,117 996
Sold group companies -100 -
Repayment of shareholders' contribution -12,184 -
Write-down of shares in subsidiaries -26,057 -9,218
Closing balance Dec 31, 2012 160,881 198,105
P15. InvestmentsSpecification of the parent company’s direct holdings of participations in subsidiaries
Book value
Subsidiary Corporate identity numberRegistered office
Number of shares
Participation as % Dec 31, 2013 Dec 31, 2012
TradeDoubler Ireland Ltd 422593 Dublin 1 100 7 7
TradeDoubler OY 777468 Helsingfors 100 100 70 4,269
TradeDoubler A/S 25137884 Köpenhamn 125 100 5,772 5,772
TradeDoubler LDA 507810007 Lissabon 1 100 46 46
TradeDoubler Ltd 3921985 London 5,000 100 140,000 164,061
TradeDoubler Espana SL B82666892 Madrid 100 100 62 62
TradeDoubler BVBA 874694629 Mechelen 371 100 172 172
TradeDoubler Srl 210954 (rep)/26762 (Rac) Milano 1 100 2,683 2,683
TradeDoubler LLC 7707589545 Moskva 1 100 0 1,000
TradeDoubler GmbH 76167/URNo R181/2001 München 1 100 250 8,235
TradeDoubler AS 982006635 Oslo 1,000 100 7,957 7,957
The Search Works SARL 501439194 Paris 1,000 100 0 0
TradeDoubler SARL B431573716 (2000B08629) Paris 500 100 119 119
TradeDoubler BV 20100140 Rotterdam 40 100 189 189
TradeDoubler Services AB 556695-6511 Stockholm 1,000 100 - 100
TradeDoubler International AB 556833-1200 Stockholm 500 100 268 51
TradeDoubler Media AB 556745-5414 Stockholm 1,000 100 100 100
TradeDoubler Software AB 556745-2999 Stockholm 1,000 100 100 100
TradeDoubler Sweden AB 556592-4007 Stockholm 1,000 100 2,003 1,103
UAB TradeDoubler 1411537 Vilnius 100 100 36 36
TradeDoubler Sp zoo 015792506 Warszawa 1,000 100 114 114
TradeDoubler Austria Gmbh FN296915 Wien 1 100 324 324
TradeDoubler AG CH020.3.3.028.851-0 Zürich 997 100 609 609
Tradedoubler Performance Marketing LTDA 14.273.556/0001-66 Sao Paolo 297,923 100 0 996
160,881 198,105
P16. Prepaid expenses and accrued income
SEK ´000 2013 2012
Rent of premises 1,026 2,091
Accrued interest on short term investments 905 0
Other 2,675 1,597
Total 4,605 3,688
P17. Shareholders’ equity
Share capitalShare capital refers to the parent company’s share capital. Each share carries one vote and those entitled to vote may vote for the full number of shares represented and owned without any restriction in voting rights. All shares carry equal rights to share in the Company’s assets and profits and in any surplus on liquidation.
Net write-down of shares in subsidiaries is attributable to:- Two subsidiaries decided to be liquidated in connection with Tradedoubler’s restructuring program- Write-down of a subsidiary primarily attributable to prior acquisi-tions value from the divested business segment Search

43Tradedoubler Annual Report 2013
Notes
At December 31, 2013, TradeDoubler AB had a share capital of SEK 17,1 M distributed among 42,807,449 shares, each share with a par value of SEK 0.40.
Reconciliation of number of sharesNumber of
shares issuedIssued share
capital
Number of shares issued January 1, 2013* 42,807,449 17,122,979
Number of shares issued December 31, 2013* 42,807,449 17,122,979
* of which 475,000 (130,000) shares are in own custody
P18. Bond loanThe Parent Company has during December issued a bond loan. For more information regarding the bond issue, see Note to Consoli-dated Financial Statements, C18 Bond loan.
P19. Other liabilities
SEK ´000 2013 2012
Current liabilities to publishers 86,704 71,763
Withholding tax and social security contributions 3,085 4,047
Other 1,398 169
Total 91,187 75,979
P20. Accrued expenses and deferred income
SEK ´000 2013 2012
Holiday pay 2,323 2,732
Other payroll expenses 4,010 13,574
Accrued interest expense from bond loan 555 -
Other 5,173 6,034
Total 12,060 22,340
P21. Financial risks
Financial risks and risk managementTradeDoubler’s financial risk management is handled and monitored at Group level. For more information regarding the financial risks, see notes to the Consolidated statements, Note C21 Financial risks.
P22. Pledged assets and contingent liabilities
SEK ´000 2013 2012
Pledged assets 1,530 None
Contingent liabilities 2,715 2,259
Contingent liabilities consists of performance guarantees to subsidi-aries.
P23. Transactions with related partiesTransactions with related parties are priced on commercial terms.
Transactions with related parties for TradeDoubler AB mainly con-sists of licensing fees corresponding to SEK 120.9 M (119.9), invoiced by the parent company to subsidiaries and other other revenue of SEK 0.6 M (0.8). The parent company’s receivables from subsidiaries amounted to SEK 109.9 M (121.1). The parent company s liabilities to subsidiaries amount to SEK 156.2 M (191.1). Receivables and liabilities from subsidiaries have been netted off in the balance sheet.
Transactions with key people in executive positionsA member of the board of directors has during the year acquired SEK 1.0 M (0.0) in the issue of corporate bonds. No other transactions with key people in executive positions have taken place except the ones specified in the notes to the Consolidated statements, Note C5 Remuneration to employees, group management and board of direc-tors and Note C6 Share-based remuneration.
P24. Cash flow statement, supplementary information
Cash and cash equivalents
SEK ´000 2013 2012
The following sub-components are included in cash and cash equivalents
Commercial paper 51,895 -
Cash and bank balances 102,479 57,094
Total according to the balance sheet 154,374 57,094
Total according to the cash flow statement 154,374 57,094
SEK ´000 2013 2012
Interest received 837 1,210
Interest paid -319 -1,508
Adjustment for items not included in the cash flow
SEK ´000 2013 2012
Depreciation and amortization 26,481 11,135
Write-down of investments in subsidiary companies 26,057 9,218
Other provisions 4,010 11,050
Unrealized exchange rate differences 331 4,662
Other 1,520 246
58,399 36,311
P25. Events after the balance sheet dateNo known events have occured after the balance sheet date.

44 Tradedoubler Annual Report 2013
Board’s signatures
The undersigned assure that the consolidated accounts and annual report have been prepared in accordance with international accounting standards, IFRS, as adopted by the EU, and pursuant to generally accepted
accounting standards and provide a true and fair view of the group’s and parent company’s operations, financial position and results of operations and describe significant risks and uncertainties facing the group. The consolidated
income statement and statement of financial position and the parent company’s income statement and balance sheet are subject to approval by the annual general meeting to be held on 6 May 2014.
Stockholm, 31 March 2014
Peter Larsson
Chariman
Thomas Bill
Board Member
Martin Henricson
Board Member
Lars Sveder
Board Member
Simon Turner
Board Member
Robert Wilson
President and CEO
Our Audit report was submitted on 31 March 2014
Ernst & Young AB
Thomas Forslund Authorised Public Accountant

45Tradedoubler Annual Report 2013
Auditor’s report
Report on the annual accounts and consolidated accountsWe have audited the annual accounts and consolidated accounts of TradeDoubler AB (publ) for the year 2013, except for the corporate governance statement on pages 10–15. The annual accounts and consolidated accounts of the company are included in the printed version of this document on pages 4–44.
Responsibilities of the Board of Directors and the Managing Director for the annual accounts and consolidated accountsThe Board of Directors and the Managing Director are responsible for the preparation and fair presentation of these annual accounts and consolidated accounts in accordance with International Finan-cial Reporting Standards, as adopted by the EU, and the Annual Accounts Act, and for such internal control as the Board of Directors and the Managing Director determine is necessary to enable the preparation of annual accounts and consolidated accounts that are free from material misstatement, whether due to fraud or error.
Auditor’s responsibilityOur responsibility is to express an opinion on these annual accounts and consolidated accounts based on our audit. We conducted our audit in accordance with International Standards on Auditing and generally accepted auditing standards in Sweden. Those standards require that we comply with ethical requirements and plan and perform the audit to obtain reasonable assurance about whether the annual accounts and consolidated accounts are free from material misstatement.
An audit involves performing procedures to obtain audit evidence about the amounts and disclosures in the annual accounts and con-solidated accounts. The procedures selected depend on the auditor’s judgement, including the assessment of the risks of material misstate-ment of the annual accounts and consolidated accounts, whether due to fraud or error. In making those risk assessments, the auditor con-siders internal control relevant to the company’s preparation and fair presentation of the annual accounts and consolidated accounts in order to design audit procedures that are appropriate in the circum-stances, but not for the purpose of expressing an opinion on the effec-tiveness of the company’s internal control. An audit also includes eval-uating the appropriateness of accounting policies used and the reasonableness of accounting estimates made by the Board of Direc-tors and the Managing Director, as well as evaluating the overall presentation of the annual accounts and consolidated accounts.
We believe that the audit evidence we have obtained is sufficient and appropriate to provide a basis for our audit opinions.
OpinionsIn our opinion, the annual accounts have been prepared in accord-ance with the Annual Accounts Act and present fairly, in all material respects, the financial position of the parent company as of 31 December 2013 and of its financial performance and its cash flows for the year then ended in accordance with the Annual Accounts Act, and the consolidated accounts have been prepared in accordance with the Annual Accounts Act and present fairly, in all material respects, the financial position of the group as of 31 December 2013 and of their financial performance and cash flows in accordance with International Financial Reporting Standards, as adopted by the EU, and the Annual Accounts Act. Our opinions do not cover the corporate governance statement on pages 10–15. The statutory administration report is consistent with the other parts of the annual accounts and consolidated accounts.
We therefore recommend that the annual meeting of shareholders adopt the income statements and balance sheets of the parent com-
pany and the income statement and the statement of financial posi-tion for the group.
Report on other legal and regulatory requirementsIn addition to our audit of the annual accounts and consolidated accounts, we have examined the proposed appropriations of the company’s profit or loss and the administration of the Board of Directors and the Managing Director of TradeDoubler AB (publ) for the year 2013. We have also conducted a statutory examination of the corporate governance statement.
Responsibilities of the Board of Directors and the Managing DirectorThe Board of Directors is responsible for the proposal for appropria-tions of the company’s profit or loss.The Board of Directors and the Managing Director are responsible for administration under the Com-panies Act and that the corporate governance statementon pages 10–15 has been prepared in accordance with the Annual Accounts Act.
Auditor’s responsibilityOur responsibility is to express an opinion with reasonable assurance on the proposed appropriations of the company’s profit or loss and on the administration based on our audit. We conducted the audit in accordance with generally accepted auditing standards in Sweden.
As a basis for our opinion on the Board of Directors’ proposed appropriations of the company’s profit or loss, we examined the Board of Directors’ reasoned statement and a selection of supporting evidence in order to be able to assess whether the proposal is in accordance with the Companies Act.
As a basis for our opinion concerning discharge from liability, in addition to our audit of the annual accounts and consolidated accounts, we examined significant decisions, actions taken and cir-cumstances of the company in order to determine whether any member of the Board of Directors or the Managing Director is liable to the company. We also examined whether any member of the Board of Directors or the Managing Director has, in any other way, acted in contravention of the Companies Act, the Annual Accounts Act or the Articles of Association.
We believe that the audit evidence which we have obtainedis suffi-cient and appropriate in order to provide a basis for our opinions.
Furthermore, we have read the corporate governance statement and based on that reading andour knowledge of the company and the group we believe that we have obtained a sufficient basis for our opinion. This means that our statutory examination of the corporate governance statement is different and substantially lessin scope than an audit conducted in accordance with International Standards on Auditing and generally accepted auditing standards in Sweden.
OpinionsWe recommend to the annual meeting of shareholders that the profit be appropriated in accordance with the proposal in the statutory adminis-tration report and that the members of the Board of Directors and the Managing Director be discharged from liability for the financial year.
A corporate governance statement has been prepared, and its statutory contentis consistent with the other parts of the annual accounts and the consolidated accounts.
Stockholm, 31 March 2014Ernst & Young AB
Thomas ForslundAuthorised Public Accountant
Auditor’s reportTo the annual meeting of the shareholders of TradeDoubler AB (publ), corporate identity number 556575-7423

46 Tradedoubler Annual Report 2013
Board of Directors
Board of Directors
Peter Larsson, born 1964
Chairman of the Board of Directors since 2013 and Chairman of the Remuneration Committtee.
Education: BSc Data and Systems Science from the University of Stockholm.
Other assignments: Managing Partner Monterro 1 AB (one of Tradedoubler’s large owners). Chairman of the Board of EpiServer Group AB and Q-Matic AB. Member of the Board of IAR Systems AB and NorNor Holding AB.
Former assignments: Peter Larsson has, inter alia, held positions as Head of Opera-tions at Front Capital Systems AB and CEO of EpiServer Group AB and Protect Data AB. Chairman of the board of Pricer AB and IAR Systems AB.
Shareholding: 150,000 shares.
Thomas Bill, born 1965
Member of the Board of Directors since 2013.
Education: MSc Computer Science and Engineering from Stockholm royal Institute of technology.
Other Assignments: Managing Partner Monterro 1 AB (one of Tradedoubler’s large owners). Chairman of the Board of Ledstier-nan AB.
Former Assignments: Thomas Bill has held positions as Global VP Sales at Front Capital Systems as well as CEO of Protect Data AB and Orc Software AB. Furthermore, Thomas Bill was previously member of the Board in FormPipe Software AB.
Shareholding: 0 shares.
Martin Henricson, born 1961
Member of the Board of Directors since 2001.
Education: M.Sc from Stockholm University.
Other Assignments: Managing Director of EPiServer Group AB, Board Member of Pro-jectplace AB and Besedo Group AB.
Former Assignments: Martin Henricson was previously a Board member of AcadeMedia AB and Chairman of the Board and Board Member of Mercuri International Group AB, Anew Learning AB and Vittra AB. Further-more, Martin Henricson has been the external Managing Director of Bure Equity AB and Mercuri International Group AB. From 2001 until February, 2007, Martin Henricson was the Managing Director and Group CEO of TradeDoubler.
Shareholding: 15,000 shares.
Lars Sveder, born 1973
Member of the Board of Directors since 2013.
Education: Master in Mathematics Economics University of Karlstad.
Other Assignments: Managing Partner of Monterro 1 AB (one of Tradedoubler’s large owners).
Former Assignments: Chairman of the Board of Flexpay AB. Equity Research SEB Enskilda Equities, Nordea, Skandiabanken, Partner at HDR partners AB.
Shareholding: 0 shares
Simon Turner, born 1951
Member of the Board of Directors since 2010 and member of the Remuneration Committtee.
Education: Bachelor of Science from Univer-sity of Surrey.
Other Assignments: Board member of York-shire Building Society and Identive Group Inc, and Senior Director at Acer Computers.
Former Assignments: Simon Turner was Group Managing Director of Dixons Retail Group and a member of their Executive Committee. He was also Managing Director of Philips Consumer Electronics UK Division and Board Member and Commercial Director of Belling Ltd. Other than this, he has held several senior executive positions within the software and advertising industry.
Shareholding: 5,300 shares.
Board of directors as described above from 31 March 2014.

47Tradedoubler Annual Report 2013
Company Management
Company Management
Rob Wilson, born 1972
President and CEO (Chief Executive Officer) since August 2012.
Education: Studied International Business technology at University of Teesside.
Previous assignments: Rob Wilson was Market Unit Leader North west between May 2011 - August 2012. Prior to that he was Chief Revenue Officer and responsible for global sales at the US advertising network, Epic Media Group. He brings over 10 years’ experi-ence in digital marketing having previously held key leadership positions with Zanox, 24/7 Real Media and Yahoo throughout Europe and the US.
Based: London
Holdings: 0 shares
Tomas Ljunglöf, born 1966
CFO (Chief Financial Officer) since February 2014.
Education: Degree in Master of Science in Business and Economics from Stockholm University.
Previous assignments: Tomas Ljunglöf has worked as Business Controller and CFO for more than 20 year and has experience from Swedish publically listed companies, global company groups held by non-Swedish own-ers and private equity companies. Tomas holds almost 10 years’ experience from the telecom industry, initially as CFO at Glocalnet (publ.) year 2000-2006 and subsequently as CFO at Telenor Sverige year 2006-2009. Further, Tomas has managed his own con-sultancy business and most recently held the position as CFO at ORC Software (publ.).
Based: Stockholm
Holdings: 0 shares
Andrew Buckman, born 1972
CSO (Chief Strategy Officer) since January 2014.
Education: BA (Hons) Marketing, Middlesex University.
Previous assignments: Andrew Buckman was appointed COO at Tradedoubler in January 2013 after a successful career with high-profile digital brands in senior revenue-generation, product and management roles. He spent five years at Yahoo! Search Market-ing where he set up and ran the Product and Monetization organization; was Vice-Presi-dent of Strategic Partnerships at Criteo and led Webloyalty France as Managing Director. He joined Tradedoubler from Swedish online payments company Klarna.
Based: Paris
Holdings: 6 000 shares
Magnus Nyström, born 1974
CTO (Chief Technical Officer) since October 2012.
Education: MBA-studies at Executive Manage-ment Institute (in cooperation with Edinburgh Business school) and System architecture at the University of Dalarna.
Previous assignments: Magnus Nyström has held several management positions within IT since 2001, within Telecom as well as Online Marketing. He has worked in international environments, where he has held manage-ment roles within program/project steering and system development. Before joining Tradedoubler as Development Manager in 2008 Magnus spent almost 10 years at TDC, the leading Danish provider of communica-tions solutions and Pay-TV.
Based: Stockholm
Holdings: 0 shares
Richard Julin, born 1973
CRO (Chief Revenue Officer) since January 2014.
Education: Studies in Finance and Marketing at IHM Business School in Stockholm.
Previous assignments: Richard Julin previ-ously worked at Mediaplanet International AB for six years, four as CEO/President. He brings over 15 years of experience within the Media industry in Europe and North America. Prior to Mediaplanet, Richard worked for MTG AB during 11 years in various sales- and marketing positions within their business unit Broadcasting i Sweden. He spent the last four years at MTG AB as Sales Director for TV3/TV6/ZTV.
Based: Stockholm
Holdings: 0 shares
Company Management as described above from 31 March 2014.

48 Tradedoubler Annual Report 2013
Definitions and glossary
DefinitionsActive publisherA publisher that has, during the last month, generated a recordable transaction in the Tradedoubler network.
Capital employed Total assets less current and long-term non-interest-bearing liabilities, including deferred tax liabilities.
EBITDAEBITDA is revenue before tax, net financial items and depreciation/amortization and impairment.
EBITDA-margin EBITDA as a percentage of revenue.Equity/assets ratio - Shareholders’ equity as a percentage of total assets.
Net margin Profit after tax as a percentage of sales.
Operating margin Operating profit as a percentage of revenue.
Percentage of risk-bearing capitalTotal of shareholders’ equity, minority inter-ests, shareholder loans and deferred tax lia-bilities divided by total assets.
Price/equity ratio Price of the share divided by shareholders’ equity per share.
P/E ratio Share price divided by revenue for the year per share.
Return on shareholders’ equity Revenue for the period as a percentage of the average shareholders’ equity, calculated as open and closing shareholders’ equity divided by two.
Return on capital employed Operating profit plus interest income as a percentage of average capital employed, calculated as opening and closing capital employed divided by two.
Revenue per share Revenue of the year divided by the average number of shares.
Revenue per share after full dilutionRevenue of the year divided by the average number of shares after full dilution.
SolidityTotal equity as a percentage of total assets.
Working capitalTotal current assets less cash and cash equivalents, short term investments and total current liabilities.
GlossaryAffiliate Describes a website that through advertise-ments generates online traffic of Internet visitors to the advertising company’s web-site.
Affiliate networkA system in which advertisers that want to increase sales via the Internet are matched together with website owners who wish to increase their advertising revenue through so-called affiliate programs.
Affiliate marketing A form of performance based Internet advertising in which online publishers advertise in return for compensation based on specific actions of Internet users – such as clicking, user registration or purchase, in response to their advertisements.
Affiliate program An agreement in which advertisers pay a fee to the publisher to forward traffic to the advertiser’s website.
API (Application Programming Interface)Is a set of rules that governs how a certain software can communicate with another software.
Cost-per-action (CPA) A price model in which advertisers pay a fee based either on the sale of advertised prod-ucts or a number of specific activities such as leads – primarily registration – that their advertise ment generates.
Cost-per-click (CPC) A price model in which advertisers pay a fee based on the number of clicks or unique vis-itors that their advertisements generate.
Cost-per-lead (CPL) Means that the advertiser pays a fee based either on the number of leads – primarily registration – that their advertisements generate .
Cost-per-thousand impressions (CPM) A price model in which the advertisers pay a fee based on the number of timed the advertise ment is displayed.
E-mail publishers Use e-mail to send targeted offers to a recipi-ent list.
Keyword publishers Do not always have an own website but use search engines to initiate display of adver-tisements and to generate Internet traffic for advertisers. This is carried out primarily through purchasing keywords via a search engine that then sends to the advertisers.
Performance-based A general term for online marketing activi-ties in which publishers only receive pay-ment when a predetermined transaction is generated.
Premium websites (Also referred to as loyalty websites) Web-sites with relatively large traffic volumes that generate sales through offers to members from advertisers. Users regain part of the sales value in the form of money, bonus points or discounts.
Portals Websites that serve as an entrance (portal) and offer a broad content and large traffic volume. There are many links at a portal, a search engine and other services, for exam-ple, free e-mail or filtering or blocking ser-vices.
Publisher (Also referred to as an affiliate) Websites that agree to display advertisements and gener-ate online traffic of Internet visitors to the advertising company’s website.
Search-engine-optimised publishers Own websites that use search engines, for example Google and Yahoo!, combined with own know-how about search engines to dis-play the advertiser at the top of the list of the search results.
Tracking The process and method used to follow up website traffic, primarily through the use of cookies.
Vertical websites (Also referred to as content websites) Web-sites with lower traffic volumes that focus on online users with specific demographic fea-tures or special interests.
Websites for price comparison and retail cataloguesShows competitive offerings from advertis-ers which facilitates for users to make com-parisons and find stores or products.
Definitions and glossary

