annual report 2013 - linamar
TRANSCRIPT
ANNUAL REPORT 2013
Linamar Corporation

TABLE OF CONTENTS 1. Letter to Our Shareholders 5
2. Management Discussion & Analysis 13 3. Consolidated Financial Statements 37
(a) Management’s Responsibility for the Consolidated Financial Statements 38 (b) Independent Auditor’s Report to the Shareholders of Linamar Corporation 39
4. Annual Meeting of Shareholders 81 5. Officers and Directors 81 6. Auditors, Transfer Agent & Registrar 81
3
LETTER TO OUR SHAREHOLDERS Linamar Corporation
5
Dear Shareholders, We are pleased to report to you on another very successful year at Linamar, another record in our history in terms of both sales
and earnings performance. We would characterize 2013 as a year of growth, teamwork and exceptional financial performance,
exactly what we set out to do at the outset of the year.
Creative Growth -- Innovation, Process Diversification and Performance We enjoyed a very successful year in 2013 in terms of both outstanding performance for our customers and securing
targeted business wins to continue to support our growth into the future.
Innovation continues to play a key role in meeting customer needs and enabling our growth. Our innovation agenda has 2 key
paths; product innovation to develop products our customers need and process innovation to find ways to produce those
products as cost effectively as possible.
Clearly, our product innovation agenda on the vehicle side is about light weighting, fuel efficiency and noise reduction. At
Skyjack it continues to focus on simple, high quality, easy to use designs that our customers can rely on. Both have been
winning strategies in helping us to grow market share.
Process innovation happens every day in every plant and office as we continually challenge ourselves to find a better, quicker,
more reliable, less costly way to do the work we do.
On the product side, our E-Axle, an electronically actuated axle, has been receiving rave reviews by our customers. The design
is compact, lightweight, quiet and can be easily adapted to a variety of vehicle architectures to basically turn almost any vehicle
into a hybrid. We hope to see this product in production over the next 3 to 4 years.
In a combination product and process innovation play we made a small acquisition this year of a great company in Germany
which had developed a highly efficient method to hydroform camshafts. The process is more modular, less capital intensive and
can be applied to a wider variety of engine configurations and volumes than traditional hydroforming methods. We are very
excited about bringing this technology to our other camshaft facilities globally and in fact have already won a major program in
North America using this technology.
Skyjack has been continuing to develop and launch new boom products which are helping to deepen our market share in these
products. Market share in booms increased at a rate 3 times the overall access equipment growth rate indicative of our
customers loving our products and snapping them up.
We continue to explore opportunities for process diversification to ensure we are most effectively delivering our products to our
customers. Finding ways to combine casting or forging technology with our machining and assembly strength is a great way to
optimize technology to meet customer needs. As an example, in our new camshaft acquisition we are forging our own lobes to
assemble onto the cam, eliminating intermediate costs and streamlining the quality process as a result.
6

Our customer performance was exceptional in 2013 with more than 150 programs launching representing more than $500 million
of additional business launched during the year. Continued business wins have resulted in a backlog of close to $2.8 billion in
annualized sales still under launch at Linamar. In fact, 2013 was a record year in new business wins, particularly in the back half
of the year, and we continue to quote a large book of opportunities. New business wins in total for the year exceeded $1.3 billion
which will be an important factor in helping us reach future growth goals. All in all, we have secured enough new business to see
us well on our way to longer term growth goals; in fact we have nearly $5 billion of annual sales based on booked business
already lined up to be reached in the next 3 to 4 years.
Teamwork -- Training, Accountability and Focus We have continued to build our global employee base, now over 18,000 strong, through a focus on readiness of our
people in targeted areas, accountability and focus. We spent a lot of time in 2013 developing our top talent to help us grow
into the future. We launched a pivotal Linamar developed Leadership Development Program (LLDP2) designed to hone the
skills of our General Managers and Directors which has proven to be extremely effective and well received by our people. It is
only by careful grooming of our top talent that we will continue to build the bench strength we need for future growth.
Equally important is developing a deep bench of skilled tradespeople to guide technical improvements in our plants. With more
than 400 apprentices in our plants globally alongside continued setup training and international recruitment efforts we are
definitely growing that bench and gaining some momentum.
Our Linamar Entrepreneurial Advancement Program, LEAP, continues to deliver in terms of developing young enthusiastic team
members for managing our facilities. Each year we pick a handful of talented future leaders to put through a comprehensive
cross functional multiyear training program designed to make them our General Managers of the future. Our first graduate has
just taken on his first plant with 6 more people highly engaged in the program. LEAP is a pivotal part of helping us to deepen our
leadership bench strength to support future growth.
We have focused our team in 2013 on a One Team One Linamar approach to accountability and focus. Fewer initiatives mean
flawless execution and complete alignment which is exactly the goal. Driving this concept of ownership and accountability which
so successfully drove performance in 2013 will be a continued theme in 2014.
Turnover is at record lows, employee engagement is up and motivation levels high as we continue to strengthen and build the
employee base.
Meeting Financial Commitments -- Lean Discipline, Cash Generation and Implementing Effective Systems Finally, 2013 was a year of exceptional financial performance and sales and earnings growth and cash generation at Linamar.
Sales reached a new record, up more than 11% or nearly $375 million thanks to new program launches, a moderately
growing global vehicle market and Skyjack’s solid performance. Earnings also reached record levels up an incredible
$84 million or 57% driving another year of great margin improvements. This contributed to a solid year of cash
generation of nearly $224 million to bring our balance sheet to one of the strongest in our industry.
7

2013 was a year to refocus our people on lean principles. All year long, we reiterated the concepts of lean and saw great
improvements as a result. Our lean journey started a long time ago but clearly needs refreshing from time to time with a growing
employee base that needs to understand the basics and be the drivers of change.
Effective systems to get people accurate information they need when they need it were also a priority in 2013. We implemented
new systems in each of the financial, customer/market and employee areas to more efficiently and accurately collect and analyze
key data. We are already seeing the results of these efforts.
Return on Capital Employed improved dramatically to 18.3% compared to 13.1% last year and Return on Equity hit 19.1%, the
highest level seen in more than a decade. The Powertrain/Driveline segment powered ahead with great improvements in both
sales, earnings and margins as did the Industrial segment thanks mainly to continued growth and market share penetration at
Skyjack. Industrial segment sales grew by nearly 17% but earnings well over doubled resulting in margins twice last year’s
levels.
Our strategy at Linamar is the formula to this success.
Strategy Our enterprise strategy is to focus on “Diversified Manufactured Products to Power Vehicles, Motion, Work and Lives”. Our business basically splits into 2 buckets – Precision Products where we make precision metallic/machined components,
modules and systems for global vehicle, industrial and energy markets and Mobile Products where we make fabricated
assemblies and vehicles for global access, industrial, agricultural, consumer and construction markets.
These markets are hugely opportunistic. Take the global vehicle machined component and assembly business as an example.
There is roughly $3,000 of content in the engine, transmission and driveline systems of a passenger car, much more in a
commercial vehicle. Coupled with global vehicle production volumes this represents a market that today is north of $450
billion and will grow to more than $600 billion over the next 5 years. 70-80% of this work is still done by our OEM
customers themselves but they are increasingly looking to tap into great supplier technology and efficiency by outsourcing this
work. Powertrain/Driveline is the last major area of the vehicle to undergo this transition. This outsourcing won’t happen
overnight; it will take a decade or two to manifest itself. This is exciting because it means a sustained period of time where
Linamar can enjoy superior growth to what will come strictly from market growth. Linamar is perfectly aligned to be the supplier
of choice to these companies given our outstanding processing and product technology in every machined part in these systems
and our unparalleled performance on quality and delivery for such.
The access market where our Skyjack business is based is also highly opportunistic. Although a smaller market at $10 billion
globally, the number of players in this business is much smaller meaning the potential for a much larger slice of the market is
very real.
Our growth strategy at Linamar remains focused in three key areas – Diversification, Globalization, and Green
Technologies.
Diversification has taken many forms for us over the years at Linamar. It has meant expanding our product offering in our
targeted markets as well as finding new customers and markets for the products we already make. Increasingly diversification is
translating into process diversification as we vertically integrate forwards into more complex modules or assemblies of the
8

products we already make and potentially backwards into selective, strategic types of castings or forgings. That vertical
integration can come through a variety of vehicles, from strategic partnerships to direct investments or joint ventures. Having
more control over our material means having more influence in terms of product design and closer relationships with customers
to drive value add solutions. A more integrated casting or forging and machining operation for certain types of products can also
mean improved quality and efficiency to drive more competitiveness and opportunity.
We continue to explore opportunities in this important area of diversification. The forging capability acquired through our
camshaft acquisition noted is a good first step and teaching us something about forging production. Our priority continues to be
in the forging area as well as in aluminum products mainly thanks to their alignment with weight reduction and near net shape
products.
Of course we continue to focus on customer diversification as well and achieved a major milestone in that regard in 2013 with the
award of a major camshaft program with a Japanese OEM. Traditionally made in house or with a tightly controlled keiretsu
supplier this business win represents a significant shift in outsourcing strategies for the Japanese. We continue to quote other
quite meaningful programs for these important customers and believe this program will help tip the scales in our favor thanks to
the credibility it lends us in the Japanese eyes.
We have been steadily diversifying our product lineup at Skyjack as we add to our growing boom offering. Building out our
telehandler lineup will be the next step in diversifying the Skyjack offering and will begin to happen over the next few years.
Globalization is really just an element of diversification in terms of finding new geographic markets but is important to separately
identify in light of the huge impact that growing globally can bring us.
Look at the automotive business as an example. In 2013 the industry made approximately 16.6 million vehicles in North America
while Europe made 19.3 million and Asia 42.6 million. Markets outside of North America are vastly larger than the markets within
it. We have grown Linamar to $3.6 billion in sales based largely on North American business – imagine what we can do with the
world’s market to work with! Growth is prioritized in Europe and Asia. In Europe the economy has stabilised and we are seeing
opportunities for healthy suppliers with available cash such as ourselves needed to start to ramp production back up and to help
launch new programs. In China continued strong growth is painting many exciting opportunities for suppliers such as ourselves
with proven technology and quality performance. In India the auto market is really just starting to build to more meaningful levels
which is creating opportunities in a variety of areas as our customers look for suppliers to help them put needed capacity in
place.
In 2013 we expanded our European presence through building a third manufacturing plant in Germany. Some production will
start in this facility in the spring of 2014 with additional programs launching later in 2014.
In 2013 we also established our first foothold in India. We have rented a small facility in India and started to put a team together
to launch programs in the area. Production will start late 2015; our focus currently is building the team and establishing the
systems needed for program launch and production. We are starting slowly in the region in order to build our understanding of
the culture and business environment there.
9

We continue to keep Brazil on the radar as an area of future expansion but are cautious about moving too quickly into the market
given challenges there today. We will continue to monitor market conditions and opportunities to ensure we time our entry into
the region properly and are carefully mitigating risks.
Current booked business will drive our non North American sales to close to 40% of our total from about 20% today, almost
doubling our global reach.
Of our 42 plants globally 19 or almost half are now located outside of Canada indicative of our global strategy playing out. That
said we did win an unprecedented level of new business for our Canadian plants in 2013 meaning our business in Canada is
strong and growing as well.
Finally focusing on Green Technologies is important because developing products that are more fuel efficient, drive lower
emissions or are environmentally beneficial in some other way are the products the market is looking for. These are the markets
of the future, whether it is more fuel efficient vehicles, rail products, wind energy installations or more efficient access equipment,
and we want to be a key part of them. Today we have more content in smaller, more fuel efficient vehicles such as cars, electric
cars and crossovers than we do in less fuel efficient large pickups or SUVs. We have specifically targeted the smaller engines
and multi speed or dual clutch technology transmissions. Our priority in product development is around light weighting, smaller
packages and noise reduction, all to drive better fuel economy. A customer in our AWD system business recently called our
product “the global benchmark” in terms of technology and capability. What a fantastic nod to the capabilities of our hard
working R&D team!
Our new camshaft business plays a key role in light weighting and fuel efficiency and we have developed a roadmap for
continued product development to drive additional fuel efficiency through a variety of ideas.
Our balance shaft assembly designs allow for more efficient use of smaller engines with fewer cylinders.
Our AWD business is absolutely making great progress in this area as well with our disconnect technology allowing the vehicle to
disconnect the AWD systems when it is not needed thus significantly reducing parasitic losses. And of course our E-axle allows
for immediately fuel improvement by shifting any vehicle into hybrid mode.
We continue to develop our gear manufacturing capabilities to drive superior gears with better fit to drive out noise, another key
issue in fuel efficiency.
Our design ideas for clutch modules and differential assemblies are also playing an important role in helping us win business on
new 9 and 10 speed transmissions, another key driver of improved fuel efficiency. These transmissions are key to the future in
North America where they will eventually displace the 4, 5 and 6 speed transmissions currently in production. Our target is to
significantly increase our content on these platforms compared to existing ones, a strategy that is playing out extremely well
given important contracts already won in 2013 for the 9 and 10 speed transmissions. We continue to quote a significant amount
of business for these platforms as we enter 2014.
10

As we turn to 2014, our focus has sharpened to:
Growth through a continued focus on Innovation and Process Diversification for our Customers;
Accountability through Training and Development and Deepening our Global Bench for our Employees; and
Improvement through continued Lean Initiatives, Cash Generation and Earnings Growth to drive continued
Financial improvement.
Grow It, Own It and Improve It are the key simple messages we are focusing on.
At Linamar we are very excited about our future growth plans. We have the business in hand to drive meaningful growth in the
next couple of years and a market focus and strategy in massive growing markets to drive substantial opportunities for the longer
term, the perfect combination for meeting both short and long term shareholder growth goals. We have a 1 year plan, a 5 year
plan and a 50 year plan all centred on success, growth and balance.
We have the business, we have the markets, we have the innovation, we have a talented and growing group of people
and we will continue to turn that into consistent sustainable growth for you our shareholders.
Sincerely,
Linda Hasenfratz Jim Jarrell Chief Executive Officer President and Chief Operating Officer
11

MANAGEMENT DISCUSSION & ANALYSIS
Linamar Corporation December 31, 2013 and December 31, 2012 (in millions of dollars)
13

LINAMAR CORPORATION Management’s Discussion and Analysis For the Year Ended December 31, 2013 This Management’s Discussion and Analysis of Financial Condition and Results of Operations ("MD&A") of Linamar Corporation (“Linamar” or the “Company”) should be read in conjunction with its consolidated financial statements for the year ended December 31, 2013. This MD&A has been prepared as at March 5, 2014. The financial information presented herein has been prepared on the basis of International Financial Reporting Standards (“IFRS”). All amounts in this MD&A are in millions of Canadian dollars, unless otherwise noted. Additional information regarding Linamar, including copies of its continuous disclosure materials such as its annual information form, is available on its website at www.linamar.com or through the SEDAR website at www.sedar.com.
OVERALL CORPORATE PERFORMANCE Overview of the Business Linamar Corporation (TSX:LNR) is a diversified global manufacturing Company of highly engineered products powering vehicles, motion, work and lives. The Company is made up of 2 operating segments – the Powertrain/Driveline segment and the Industrial segment which are further divided into 4 key divisions – Manufacturing, Driveline, Industrial Commercial Energy (“ICE”) and Skyjack, all world leaders in the design, development and production of highly engineered products. The Company’s Manufacturing and Driveline divisions focus on precision metallic components, modules and systems for engine, transmission and driveline systems designed for passenger vehicle markets. The ICE group concentrates on similar products for on and off highway vehicle, energy and other industrial markets. The Company’s Skyjack division is noted for its innovative, high quality mobile industrial equipment, notably its class-leading aerial work platforms and telehandlers. With more than 18,000 employees in 42 manufacturing locations, 5 R&D centers and 15 sales offices in 12 countries in North America, Europe and Asia, Linamar generated sales of more than $3.5 billion in 2013. For more information about Linamar Corporation and its industry leading products and services, visit www.linamar.com.
Overall Corporate Results The following table sets out certain highlights of the Company’s performance in 2013 and 2012:
Three Months Ended Year Ended
December 31 December 31
(in millions of dollars, except content per vehicle numbers)
2013 2012 +/- +/- 2013 2012 +/- +/-
$ $ $ % $ $ $ %
Sales 926.1 756.5 169.6 22.4% 3,595.5 3,221.9 373.6 11.6% Gross Margin 136.7 91.9 44.8 48.7% 506.1 385.6 120.5 31.3% Operating Earnings (Loss)1 84.8 48.3 36.5 75.6% 320.1 218.5 101.6 46.5% Earnings (Loss) from Continuing Operations 68.7 30.7 38.0 123.8% 229.8 146.1 83.7 57.3%
Net Earnings (Loss) 68.7 30.7 38.0 123.8% 229.8 146.1 83.7 57.3%
Unusual items12 (13.7) - (13.7) (13.7) (1.2) (12.5)
Net Earnings (Loss) – Adjusted1 55.0 30.7 24.3 79.2% 216.1 144.9 71.2 49.1%
Net Earnings (Loss) per Share – Adjusted1 0.85 0.47 0.38 80.9% 3.34 2.24 1.10 49.1%
Net Earnings (Loss) per Share 1.06 0.47 0.59 125.5% 3.55 2.26 1.29 57.1%
Content per Vehicle – North America 129.91 116.87 13.04 11.2% 125.15 121.35 3.80 3.1% Content per Vehicle – Europe 17.38 14.78 2.60 17.6% 14.45 12.24 2.21 18.1% Content per Vehicle – Asia Pacific 6.12 4.65 1.47 31.6% 5.40 4.16 1.24 29.8%
The changes in these financial highlights are discussed in detail in the following sections of this analysis.
1 For more information refer to the “Non-GAAP and Additional GAAP Measures” section of this MD&A
14

Certain unusual items affected earnings in 2013 and 2012 as noted in the table below: Three Months Ended Year Ended December 31 December 31 2013 2012 2013 2012 (in millions of dollars, except per share figures) $ $ $ $
Net Earnings (Loss) 68.7 30.7 229.8 146.1 Earnings (Loss) per Share 1.06 0.47 3.55 2.26 Adjustments due to unusual items Taxable Items before Tax 1) Exchange loss (gain) on the Private Placement Notes - - - (1.6) 2) Premature ending of a customer program (6.3) - (6.3) -
Tax Impact 1.4 - 1.4 0.4
(4.9) - (4.9) (1.2) Non-Taxable Items 3) Bargain purchase gain on the acquisition of MMKG’s business (8.8) - (8.8) -
Adjusted Net Earnings (Loss) 55.0 30.7 216.1 144.9
As a percentage of Sales 6.0% 4.1% 6.0% 4.5% Change over Prior Year 79.2% 49.1% Adjusted Earnings (Loss) per Share 0.85 0.47 3.34 2.24
1) The weakening US dollar against the Canadian dollar in the first quarter of 2012 (“Q1 2012”) resulted in a foreign exchange gain
on the translation of the USD $130 million of private placement senior unsecured notes (“2021 Notes”) that were issued on September 15, 2011. During Q1 2012, the Company entered into a series of forward exchange contracts to lock in the exchange rate related to the 2021 Notes.
2) In 2013, a customer program ended prematurely and an appropriate settlement for the sale of certain capital assets back to the
customer and recovery of certain start-up costs previously incurred was negotiated. As a result, the company recorded a recovery of $6.3 million related to start-up costs previously incurred on the program.
3) During the fourth quarter of 2013, Linamar acquired certain assets from Muhr und Bender KG (“MKG”) and Mubea
Motorkomponenten GmbH (“MMKG”) for MMKG’s business of manufacturing and distributing assembled camshafts, in Germany, which resulted in a bargain purchase gain that was recognized during the quarter. The purchase price allocation method used for accounting determined that the fair value of assets were in excess of the purchase price. This difference is considered to be a bargain purchase gain which is required to be reported in the income statement under IFRS. See the “Current and Proposed Transactions” section of this document for additional information.
15
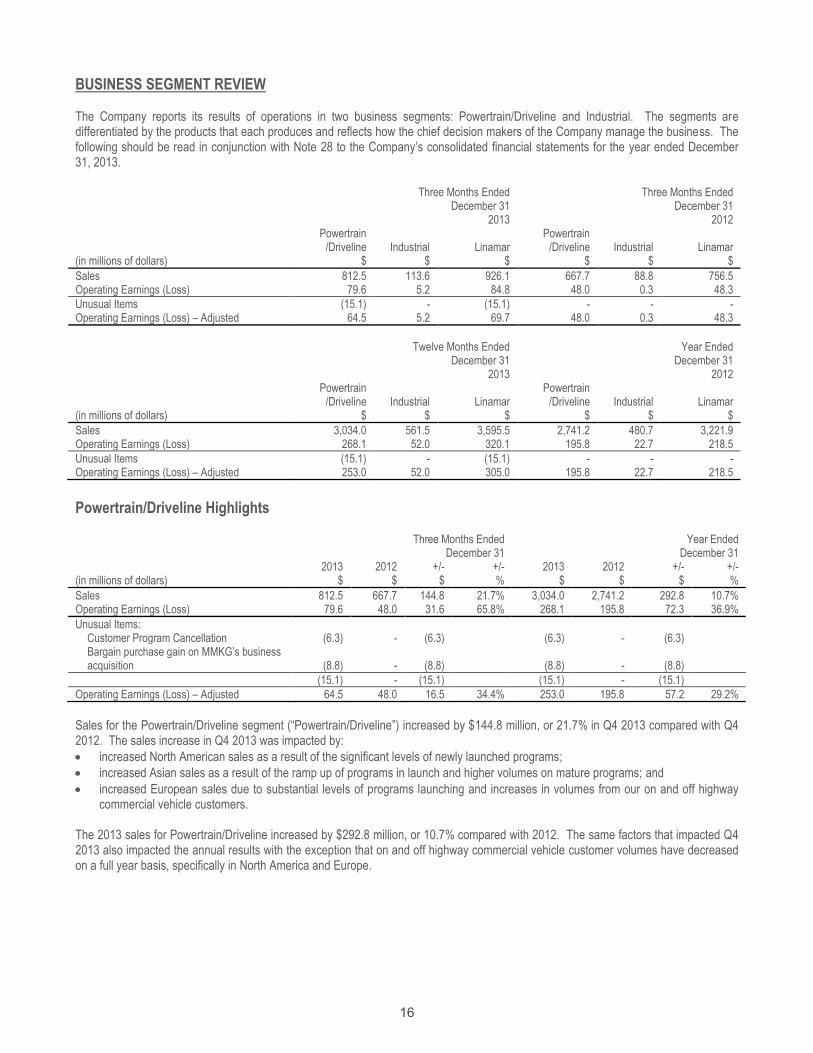
BUSINESS SEGMENT REVIEW The Company reports its results of operations in two business segments: Powertrain/Driveline and Industrial. The segments are differentiated by the products that each produces and reflects how the chief decision makers of the Company manage the business. The following should be read in conjunction with Note 28 to the Company’s consolidated financial statements for the year ended December 31, 2013.
Three Months Ended Three Months Ended
December 31 December 31 2013 2012
Powertrain
/Driveline Industrial Linamar Powertrain
/Driveline Industrial Linamar (in millions of dollars) $ $ $ $ $ $
Sales 812.5 113.6 926.1 667.7 88.8 756.5 Operating Earnings (Loss) 79.6 5.2 84.8 48.0 0.3 48.3
Unusual Items (15.1) - (15.1) - - - Operating Earnings (Loss) – Adjusted 64.5 5.2 69.7 48.0 0.3 48.3
Twelve Months Ended Year Ended
December 31 December 31 2013 2012
Powertrain
/Driveline Industrial Linamar Powertrain
/Driveline Industrial Linamar (in millions of dollars) $ $ $ $ $ $
Sales 3,034.0 561.5 3,595.5 2,741.2 480.7 3,221.9 Operating Earnings (Loss) 268.1 52.0 320.1 195.8 22.7 218.5
Unusual Items (15.1) - (15.1) - - - Operating Earnings (Loss) – Adjusted 253.0 52.0 305.0 195.8 22.7 218.5
Powertrain/Driveline Highlights
Three Months Ended Year Ended
December 31 December 31 2013 2012 +/- +/- 2013 2012 +/- +/- (in millions of dollars) $ $ $ % $ $ $ %
Sales 812.5 667.7 144.8 21.7% 3,034.0 2,741.2 292.8 10.7% Operating Earnings (Loss) 79.6 48.0 31.6 65.8% 268.1 195.8 72.3 36.9%
Unusual Items: Customer Program Cancellation (6.3) - (6.3) (6.3) - (6.3) Bargain purchase gain on MMKG’s business acquisition (8.8) - (8.8) (8.8) - (8.8)
(15.1) - (15.1) (15.1) - (15.1)
Operating Earnings (Loss) – Adjusted 64.5 48.0 16.5 34.4% 253.0 195.8 57.2 29.2%
Sales for the Powertrain/Driveline segment (“Powertrain/Driveline”) increased by $144.8 million, or 21.7% in Q4 2013 compared with Q4 2012. The sales increase in Q4 2013 was impacted by:
increased North American sales as a result of the significant levels of newly launched programs;
increased Asian sales as a result of the ramp up of programs in launch and higher volumes on mature programs; and
increased European sales due to substantial levels of programs launching and increases in volumes from our on and off highway commercial vehicle customers.
The 2013 sales for Powertrain/Driveline increased by $292.8 million, or 10.7% compared with 2012. The same factors that impacted Q4 2013 also impacted the annual results with the exception that on and off highway commercial vehicle customer volumes have decreased on a full year basis, specifically in North America and Europe.
16

Q4 2013 operating earnings for Powertrain/Driveline were higher by $31.6 million or 65.8% over Q4 2012. The Powertrain/Driveline segment experienced the following in Q4 2013:
improved margins as production volumes increased on launching and mature programs;
the bargain purchase gain recognized as a result of acquiring MMKG’s business of manufacturing and distributing assembled camshafts;
the recovery related to premature ending of a customer program;
better margins as a result of productivity and efficiency improvements; and
a lower amount of start-up costs in comparison to the level of start-up activity in Q4 2012.
The 2013 operating earnings increased by $72.3 million or 36.9% compared with 2012. 2013 was impacted by:
improved margins as production volumes increased on launching and mature programs;
a lower amount of start-up costs in comparison to the level of start-up activity in 2012;
better margins as a result of productivity and efficiency improvements;
the bargain purchase gain recognized as a result of acquiring MMKG’s business of manufacturing and distributing assembled camshafts; and
the recovery related to premature ending of a customer program; partially offset by:
continued investments in labour and overhead costs to support the future growth of the market; and to a lesser extent
decreases due to the reduced volumes in the on and off highway commercial vehicle markets in North America and Europe experienced earlier in the year.
Industrial Highlights Three Months Ended Year Ended December 31 December 31 2013 2012 +/- +/- 2013 2012 +/- +/- (in millions of dollars) $ $ $ % $ $ $ %
Sales 113.6 88.8 24.8 27.9% 561.5 480.7 80.8 16.8% Operating Earnings (Loss) 5.2 0.3 4.9 1,633.3% 52.0 22.7 29.3 129.1%
The Industrial segment (“Industrial”) product sales increased 27.9% or $24.8 million to $113.6 million in Q4 2013 from Q4 2012. The sales increase was due to:
increases in demand in the access equipment markets in both North America and Europe;
increased market share particularly in boom products at Skyjack; and
higher sales from emerging global markets such as Brazil.
The 2013 sales for the Industrial segment increased by $80.8 million, or 16.8% compared with 2012. The same factors that impacted Q4 2013 also impacted 2013 with a greater weighting on the higher sales from emerging global markets experienced earlier in the year. Industrial segment operating earnings in Q4 2013 increased $4.9 million or 1,633.3% over Q4 2012. The increase in Industrial operating earnings was predominantly driven by:
market share growth and increased demand in the access equipment market; and
productivity and efficiency improvements driven by higher volumes on new products and cost savings initiatives on mature products.
The 2013 operating earnings increased by $29.3 million or 129.1% compared with 2012. 2013 was impacted by the same factors as Q4 2013 with a heavier weighting on margin improvements in the access equipment market; partially offset by continued investment in labour and fixed overhead costs at Skyjack to support the future growth in the market.
17

AUTOMOTIVE SALES AND CONTENT PER VEHICLE1 Automotive sales by region in the following discussion are determined by the final vehicle production location and, as such, there are differences between these figures and those reported under the geographic segment disclosure, which are based primarily on the Company’s location of manufacturing and include both automotive and non-automotive sales. These differences are the result of products being sold directly to one continent, and the final vehicle being assembled on another continent. It is necessary to show the sales based on the vehicle build location to provide accurate comparisons to the production vehicle units for each continent. In addition to automotive Original Equipment Manufacturers (“OEMs”), the Company sells powertrain parts to a mix of automotive and non-automotive manufacturers that service various industries such as power generation, construction equipment, marine and automotive. The final application of some parts sold to these manufacturers is not always clear; however the Company estimates the automotive portion of the sales for inclusion in its content per vehicle calculations. The allocation of sales to regions is based on vehicle production volume estimates from industry sources, published closest to the quarter end date. As these estimates are updated, the Company’s sales classifications can be impacted. For informational purposes, the tables below present content per vehicle calculations with the automotive sales allocations for 2013 and 2012, updated where applicable. Three Months Ended Year Ended December 31 December 31 (in millions of dollars except Content Per Vehicle figures) 2013 2012 +/- % 2013 2012 +/- % North America
Vehicle Production Units2 4.14 3.89 0.25 6.4% 16.61 15.85 0.76 4.8% Automotive Sales $ 537.6 $ 454.2 $ 83.4 18.4% $ 2,078.5 $ 1,923.8 $ 154.7 8.0% Content Per Vehicle $ 129.91 $ 116.87 $ 13.04 11.2% $ 125.15 $ 121.35 $ 3.80 3.1%
Europe
Vehicle Production Units2 4.77 4.63 0.14 3.0% 19.27 19.21 0.06 0.3% Automotive Sales $ 82.8 $ 68.4 $ 14.4 21.1% $ 278.4 $ 235.2 $ 43.2 18.4% Content Per Vehicle $ 17.38 $ 14.78 $ 2.60 17.6% $ 14.45 $ 12.24 $ 2.21 18.1%
Asia Pacific
Vehicle Production Units2 11.15 9.90 1.25 12.6% 42.61 38.45 4.16 10.8% Automotive Sales $ 68.2 $ 46.1 $ 22.1 47.9% $ 230.1 $ 159.8 $ 70.3 44.0% Content Per Vehicle $ 6.12 $ 4.65 $ 1.47 31.6% $ 5.40 $ 4.16 $ 1.24 29.8%
North American automotive sales for Q4 2013 increased 18.4% from Q4 2012 in a market that saw an increase of 6.4% in production volumes for the same period. As a result, content per vehicle in Q4 2013 increased from $116.87 in Q4 2012 to $129.91. The increase in North American content per vehicle was a result of significant sales increases on launching programs which was partially offset by the market share gain for OEMs that the Company does not sell to. European automotive sales increased 21.1% or $14.4 million in a market that increased 3.0% compared to Q4 2012. As a result, the content per vehicle increased 17.6% to $17.38 from $14.78 in Q4 2012. The increase in European content per vehicle is primarily due to significant sales increases on launching programs in Europe. Asia Pacific automotive sales increased $22.1 million or 47.9% to $68.2 million as compared to Q4 2012. Vehicle production volumes increased 1.25 million to 11.15 million, a 12.6% increase, and as a result, content per vehicle increased 31.6% to $6.12 from $4.65 in Q4 2012. Asia Pacific content per vehicle increased due to higher sales from launching programs and increased volumes on existing programs.
1 Measured as the amount of the Company’s automotive sales dollars per vehicle, not including tooling sales. Content per vehicle (“CPV”) does not have a standardized
meaning and therefore is unlikely to be comparable to similar measures presented by other issuers. CPV is an indicator of the Company’s market share for the automotive markets that it operates in.
2 Vehicle production units are derived from industry sources and are shown in millions of units. North American vehicle production units used by the Company for the determination of the Company’s content per vehicle include medium and heavy truck volumes. European and Asia Pacific vehicle production units exclude medium and heavy trucks and the off-road (heavy equipment) market. All vehicle production volume information is as regularly reported by industry sources. Industry sources release vehicle production volume estimates based on the latest information from the Automotive Manufacturers and update these estimates as more accurate information is obtained. The Company will, on a quarterly basis, update Content per Vehicle for the current fiscal year in its MD&A as these volume estimates are revised by the industry sources. The Content per Vehicle figures in this MD&A reflect the volume estimates that were published closest to the quarter end date by the industry sources. These updates to vehicle production units have no effect on the Company’s financial statements for those periods.
18

SELECTED ANNUAL INFORMATION The following table sets out selected financial data relating to the Company’s years ended December 31, 2013, 2012 and 2011. This financial data should be read in conjunction with the Company’s audited consolidated financial statements for these years: 2013 2012 2011 (in millions of dollars, except per share amounts) $ $ $
Sales 3,595.5 3,221.9 2,861.4 Earnings (Loss) from Continuing Operations attributable to Shareholders of the Company 229.8 146.1 101.4 Net Earnings (Loss) attributable to Shareholders of the Company 229.8 146.1 101.4 Unusual Items (13.7) (1.2) 4.6 Net Earnings (Loss) - Adjusted 216.1 144.9 106.0 Total Assets 2,629.1 2,411.8 2,221.2 Total Long-term Liabilities 567.2 789.8 711.7 Cash Dividends declared per share 0.32 0.32 0.32 Earnings Per Share From Continuing Operations: Basic 3.55 2.26 1.57 Diluted 3.52 2.25 1.56 Earnings Per Share From Net Earnings: Basic 3.55 2.26 1.57 Diluted 3.52 2.25 1.56
The unusual items in the above table were previously discussed in this analysis for 2013 and 2012. The unusual items for 2011 consisted of the following items: 1) In 2011, the Sterling Energy Systems (“SES”) Solar program was on hold pending the outcome of SES’s process to obtain additional
financing. SES was not successful in obtaining the necessary financing and as a result on September 29, 2011, SES filed for Chapter 7 bankruptcy. As a result, the Company recorded a charge to income in Q4 2011 of $9.8 million which relates to costs to terminate supply contracts and impairment charges on certain fixed assets related to the SES program.
2) The weakening US dollar against the Canadian dollar in the fourth quarter of 2011 (“Q4 2011”) and the first quarter of 2012 (“Q1 2012”) resulted in a foreign exchange gain on the translation of the USD $130 million 2021 Notes that were issued on September 15, 2011. During Q1 2012, the Company entered into a series of forward exchange contracts to lock in the exchange rate related to the 2021 Notes.
3) The Company experienced a lower than expected tax rate during the fourth quarter of 2011 in comparison to the expected rate of 23%. The lower rate was primarily due to valuation allowance reversals in Q4 2011.
RESULTS OF OPERATIONS Gross Margin Three Months Ended Year Ended December 31 December 31 (in millions of dollars) 2013 2012 2013 2012
Sales $926.1 $756.5 $3,595.5 $3,221.9 Cost of sales before amortization 731.5 615.3 2,874.1 2,647.0 Amortization 57.9 49.3 215.3 189.3
Cost of Sales 789.4 664.6 3,089.4 2,836.3
Gross Margin $136.7 $91.9 $506.1 $385.6
Gross Margin Percentage 14.8% 12.1% 14.1% 12.0%
Gross margin percentage increased to 14.8% in Q4 2013 from 12.1% in Q4 2012. Cost of sales before amortization as a percentage of sales decreased in Q4 2013 to 79.0% compared to 81.3% for the same quarter of last year.
19
The decrease in cost of sales before amortization as a percentage of sales between Q4 2013 and Q4 2012 is a result of the items discussed earlier in this analysis such as:
improved margins as production volumes increased on launching and mature programs;
the bargain purchase gain;
the customer program recovery;
better margins as a result of productivity and efficiency improvements; and
reduced launch costs.
Q4 2013 amortization increased to $57.9 million from $49.3 million in Q4 2012 due to the significant number of programs that have been launching over the past year. Amortization as a percentage of sales decreased to 6.3% of sales as compared to 6.5% in Q4 2012, which reflects the improved utilization of fixed assets.
2013 gross margin increased to 14.1% from 12.0% in 2012. The increase in the annual gross margin was a result of the items discussed earlier in this analysis such as:
improved margins as production volumes increased on launching and mature programs;
reduced launch costs;
better margins as a result of productivity and efficiency improvements;
the bargain purchase gain; and
the customer program cancellation recovery; partially offset by:
reduced volumes in the on and off highway commercial vehicle markets in North America and Europe experienced earlier in the year.
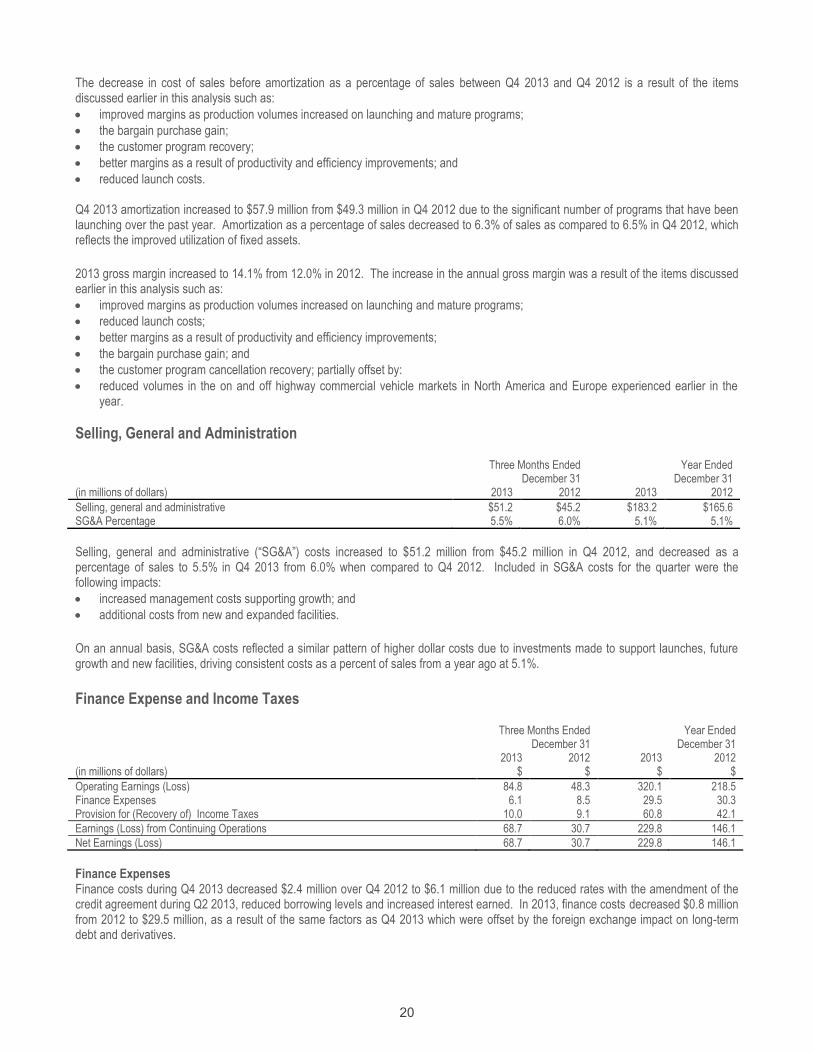
Selling, General and Administration Three Months Ended Year Ended December 31 December 31 (in millions of dollars) 2013 2012 2013 2012
Selling, general and administrative $51.2 $45.2 $183.2 $165.6 SG&A Percentage 5.5% 6.0% 5.1% 5.1%
Selling, general and administrative (“SG&A”) costs increased to $51.2 million from $45.2 million in Q4 2012, and decreased as a percentage of sales to 5.5% in Q4 2013 from 6.0% when compared to Q4 2012. Included in SG&A costs for the quarter were the following impacts:
increased management costs supporting growth; and
additional costs from new and expanded facilities.
On an annual basis, SG&A costs reflected a similar pattern of higher dollar costs due to investments made to support launches, future growth and new facilities, driving consistent costs as a percent of sales from a year ago at 5.1%.
Finance Expense and Income Taxes Three Months Ended Year Ended December 31 December 31 2013 2012 2013 2012 (in millions of dollars) $ $ $ $
Operating Earnings (Loss) 84.8 48.3 320.1 218.5 Finance Expenses 6.1 8.5 29.5 30.3 Provision for (Recovery of) Income Taxes 10.0 9.1 60.8 42.1
Earnings (Loss) from Continuing Operations 68.7 30.7 229.8 146.1
Net Earnings (Loss) 68.7 30.7 229.8 146.1
Finance Expenses Finance costs during Q4 2013 decreased $2.4 million over Q4 2012 to $6.1 million due to the reduced rates with the amendment of the credit agreement during Q2 2013, reduced borrowing levels and increased interest earned. In 2013, finance costs decreased $0.8 million from 2012 to $29.5 million, as a result of the same factors as Q4 2013 which were offset by the foreign exchange impact on long-term debt and derivatives.
20
Interest on long-term debt during Q4 2013 decreased $1.3 million over Q4 2012 to $7.5 million. Interest on long-term debt in the quarter was:
decreased due to lower borrowing rates with the amendment of the revolving credit facility in Q2 2013 and a further reduction in borrowing rates in Q3 2013 due to the Company’s improved leverage ratio; and
decreased due to lower borrowing levels. Interest on long-term debt during 2013 decreased $2.3 million over 2012 to $30.6 million due to the same factors that impacted Q4 2013. The consolidated effective interest rate for Q4 2013 decreased to 4.5% (4.5% in 2013) compared to 4.6% for Q4 2012 (4.6% in 2012). Without the impacts of the ineffective portion of interest rate swaps, the effective rate would have been 4.7% for Q4 2013 (4.6% in 2013) and 4.8% for Q4 2012 (4.7% in 2012). The foreign exchange gain on debt and derivatives during Q4 2013 increased $0.8 million over Q4 2012 to a gain of $0.7 million. The primary factors were the foreign exchange impact on the hedges of the USD $130 million private placement notes (the “2017 Notes”) that were placed during 2010 and the 2021 Notes. The foreign exchange loss on debt and derivatives during 2013 increased $2.4 million over the gain in 2012 to a loss of $0.5 million. The primary factors were:
a foreign exchange gain in Q1 2012 on the revaluation of the 2021 Notes before they were hedged in Q1 2012; and
the marked to market adjustment on the 2014 Notes fair value hedge. Provision for Income Taxes The effective tax rate for Q4 2013 was 12.7%, a decrease from the 22.9% rate in the same quarter of 2012. The effective tax rate in Q4 2013 was:
decreased due to the impact of a tax rate change in Mexico on deferred tax assets that occurred in Q4 2013;
decreased based on increased valuation allowance reversals related to certain Mexico, Canadian and German operations over Q4 2012 levels;
decreased due to downward adjustments recognized in Q4 2013 in relation to the tax of prior years that did not occur in Q4 2012;
decreased because the bargain purchase gain added to income in Q4 2013 is not subject to income tax; and
decreased based on a favourable mix of foreign tax rates in Q4 2013 compared to Q4 2012; partially offset by:
an increase from the unrecognized benefit of losses experienced in Europe. The effective tax rate for 2013 was 20.9% compared to 22.4% in 2012. The reduction is a result of the same factors that impacted the quarter.
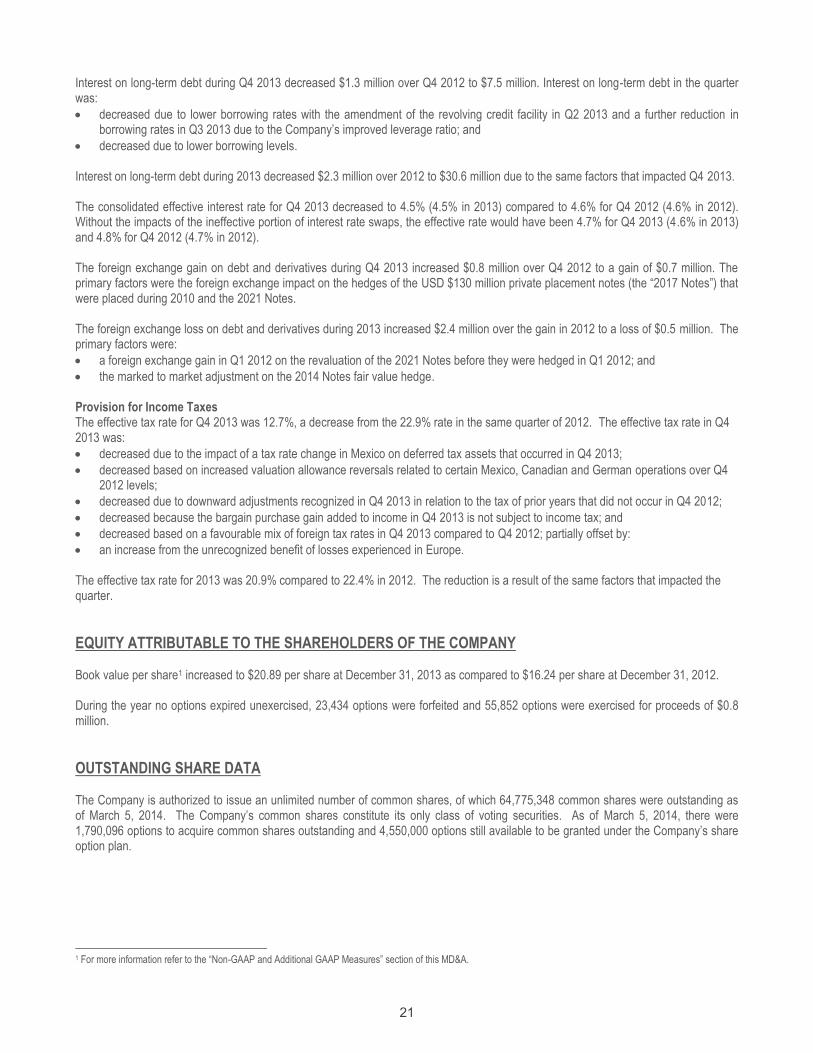
EQUITY ATTRIBUTABLE TO THE SHAREHOLDERS OF THE COMPANY Book value per share1 increased to $20.89 per share at December 31, 2013 as compared to $16.24 per share at December 31, 2012. During the year no options expired unexercised, 23,434 options were forfeited and 55,852 options were exercised for proceeds of $0.8 million.
OUTSTANDING SHARE DATA The Company is authorized to issue an unlimited number of common shares, of which 64,775,348 common shares were outstanding as of March 5, 2014. The Company’s common shares constitute its only class of voting securities. As of March 5, 2014, there were 1,790,096 options to acquire common shares outstanding and 4,550,000 options still available to be granted under the Company’s share option plan.
1 For more information refer to the “Non-GAAP and Additional GAAP Measures” section of this MD&A.
21

SUMMARY OF QUARTERLY RESULTS OF OPERATIONS The following table sets forth unaudited information for each of the eight quarters ended March 31, 2012 through December 31, 2013. This information has been derived from the Company’s unaudited consolidated financial statements which, in the opinion of management, have been prepared on a basis consistent with the audited consolidated financial statements and include all adjustments, consisting only of normal recurring adjustments, necessary for fair presentation of the financial position and results of operations for those periods.
Mar 31 Jun 30 Sep 30 Dec 31 Mar 31 Jun 30 Sep 30 Dec 31
2012 2012 2012 2012 2013 2013 2013 2013 (in millions of dollars, except per share figures) $ $ $ $ $ $ $ $
Sales 839.8 852.3 773.4 756.5 846.6 929.4 893.3 926.1 Earnings (Loss) from Continuing Operations 39.6 42.1 33.7 30.7 48.4 60.7 52.0 68.7 Net Earnings (Loss) 39.6 42.1 33.7 30.7 48.4 60.7 52.0 68.7 Earnings (Loss) per Share from Continuing Operations: Basic 0.61 0.65 0.52 0.47 0.75 0.94 0.80 1.06 Diluted 0.61 0.65 0.52 0.47 0.74 0.93 0.80 1.05 Net Earnings (Loss) per Share: Basic 0.61 0.65 0.52 0.47 0.75 0.94 0.80 1.06 Diluted 0.61 0.65 0.52 0.47 0.74 0.93 0.80 1.05
The quarterly results of the Company are impacted by the seasonality of certain operational units. Earnings in the second quarter are generally positively impacted by the high selling season for the aerial work platform, other industrial and agricultural businesses. The third and fourth quarters are generally negatively impacted by the scheduled shutdowns at automotive customers and seasonal slowdowns in the aerial work platform and agricultural businesses. The Company takes advantage of shutdowns for maintenance activities that would otherwise disrupt normal production schedules.
FINANCIAL CONDITION, LIQUIDITY AND CAPITAL RESOURCES Cash Flows Three Months Ended Year Ended December 31 December 31 2013 2012 2013 2012 ( in millions of dollars) $ $ $ $
Cash provided by (used in): Operating Activities 251.2 113.9 583.7 352.8 Financing Activities (150.9) (11.0) (272.3) (6.2) Investing Activities (92.3) (82.2) (270.9) (364.6) Effect of Translation Adjustment 4.4 1.8 7.7 0.5
Net Increase/(Decrease) in Cash Position 12.4 22.5 48.2 (17.5)
Cash and Cash Equivalents – Beginning of Period 117.4 59.1 81.6 99.1
Cash and Cash Equivalents – End of Period 129.8 81.6 129.8 81.6
Comprised of: Cash and Cash Equivalents 145.0 93.9 145.0 93.9 Unpresented Cheques (15.2) (12.3) (15.2) (12.3)
129.8 81.6 129.8 81.6
The Company’s cash and cash equivalents (net of unpresented cheques) at December 31, 2013 were $129.8 million, an increase of $48.2 million compared to December 31, 2012. Cash provided by operating activities was $251.2 million, $137.3 million more than was provided in Q4 2012 due to less cash being used to fund non-cash working capital than in Q4 2012, and the increase in net earnings over Q4 2012.
Cash provided by operating activities in 2013 was $583.7 million, $230.9 million more than was provided in 2012, due to the same factors that impacted the quarter.
22

During the quarter, financing activities used $150.9 million due to repayments on long-term debt, dividend payments and interest payments. Financing activities used $272.3 million in 2013 which was also used for the same purpose. Investing activities used $92.3 million in Q4 2013 mainly for the purchase of property, plant and equipment. Investing activities in 2013 used $270.9 million for the same purpose.
Operating Activities Three Months Ended Year Ended December 31 December 31 2013 2012 2013 2012 (in millions of dollars) $ $ $ $
Net earnings (loss) for the period 68.7 30.7 229.8 146.1 Adjustments to earnings 60.7 56.0 242.8 217.6
129.4 86.7 472.6 363.7 Changes in non-cash working capital 121.8 27.2 111.1 (10.9)
Cash provided (used) from operating activities 251.2 113.9 583.7 352.8
Cash provided by continuing operations before the effect of changes in non-cash working capital increased $42.7 million in Q4 2013 to $129.4 million, compared to $86.7 million in Q4 2012. The annual cash provided by continuing operations before the effect of changes in non-cash working capital increased to $472.6 million in 2013 compared to $363.7 million in 2011. Non-cash working capital for Q4 2013 decreased $121.8 million, compared to $27.2 million in Q4 2012. The decrease in Q4 2013 was due to significant decreases in accounts receivable and inventory, which were partially offset by increases in accounts payable. Non-cash working capital decreased $111.1 million in 2013, compared to an increase of $10.9 million in 2012. 2013 experienced decreases in inventory along with increases in accounts and taxes payable. 2012 also experienced a significant improvement in non-cash working capital due to the sale of receivables agreement the Company entered into during the year.
Financing Activities Three Months Ended Year Ended December 31 December 31 2013 2012 2013 2012 (in millions of dollars) $ $ $ $
Proceeds from (repayment of) long-term debt (123.6) 9.3 (192.2) 69.1 Proceeds from exercise of stock options 0.4 0.1 0.8 0.1 (Increase) decrease in long-term receivables (19.4) (10.1) (34.2) (24.4) Dividends to shareholders (5.2) (5.2) (20.7) (20.7) Interest received (paid) (3.1) (5.1) (26.0) (30.3)
Cash provided (used) from financing activities (150.9) (11.0) (272.3) (6.2)
Financing activities for Q4 2013 used $150.9 million of cash compared to $11.0 million in Q4 2012. Financing activities in 2013 used $272.3 million of cash compared to $6.2 million in 2012. In March 2012, the Company exercised the $100 million accordion feature on the revolving credit facility to increase the facility amount to $700 million. The exercise of this feature did not impact any other terms or conditions within the revolving credit facility including the term or covenant requirements of the agreement. In April 2013, the Company amended and extended the revolving credit facility under substantially the same terms and conditions. The facility amount remains at $700 million with a new expiry date of April 2018.
23

Investing Activities Three Months Ended Year Ended December 31 December 31 2013 2012 2013 2012 (in millions of dollars) $ $ $ $
Payments for purchase of property, plant and equipment (64.7) (83.6) (244.9) (366.9) Proceeds on disposal of property, plant and equipment 5.7 1.8 7.5 2.7 Payments for purchase of intangible assets (15.0) (0.4) (15.2) (0.4) Business acquisition (18.3) - (18.3) -
Cash used for investing activities (92.3) (82.2) (270.9) (364.6)
Cash spent on investing activities for Q4 2013 was $92.3 million, down from Q4 2012 levels of $82.2 million, due to:
the ramp curve timing of program launches and uplift program awards that occurred in Q4 2012 as compared to Q4 2013;
the acquisition of the manufacturing and distributing assembled camshafts business; and
expenditures related to technology development; partially offset by:
the proceeds on the sale of assets related to the customer program recovery.
Cash spent on investing activities in 2013 was $270.9 million compared to $364.6 million in 2012. 2013 experienced the same factors as Q4 2013. At December 31, 2013, outstanding commitments for capital expenditures under purchase orders and contracts amounted to $99.5 million ($151.5 million at December 31, 2012), which relates to the purchase of manufacturing equipment and buildings. All of these commitments are due within the next twelve months.
Capital Resources The Company’s financial condition remains solid given its strong balance sheet, which can be attributed to the Company’s low cost structure, reasonable level of debt, prospects for growth and significant new programs launches. Management expects that all future capital expenditures will be financed by cash flow from operations or utilization of existing financing facilities. At December 31, 2013, cash on hand was $129.8 million, and the Company’s syndicated revolving facility had available credit of $504.8 million.
Contractual Obligations The following table summarizes contractual obligations by category and the associated payments for the next five years:
Total Not later than 1 year
Later than 1 year and not later than 5
years Later than 5 years (in millions of dollars) $ $ $ $
Long-Term Debt Principal, excluding Capital Leases 540.9 56.0 331.2 153.7 Capital Lease Obligations1 2.7 0.3 1.3 1.1 Operating Leases 32.3 9.9 20.2 2.2 Purchase Obligations2 99.5 99.5 - -
Total Contractual Obligations 675.4 165.7 352.7 157.0
Foreign Currency Activities The Company pursues a strategy of balancing its foreign currency cash flows, to the largest extent possible, in each region in which it operates. The Company’s foreign currency outflows for the purchases of materials and capital equipment denominated in foreign currencies are naturally hedged when contracts to sell products are denominated in those same foreign currencies. To manage the residual exposure, the Company employs hedging programs, where rate-appropriate, through the use of forward exchange contracts. The contracts are purchased based on the projected net foreign cash flows from operations.
1 “Capital Lease Obligations” includes the interest component in accordance with the definition of minimum lease payments under IFRS. 2 “Purchase Obligations” means an agreement to purchase goods or services that is enforceable and legally binding that specifies all significant terms, including: fixed or minimum quantities to be purchased; fixed, minimum or variable price provisions; and the approximate timing of the transaction.
24

The amount and timing of forward contracts is dependent upon a number of factors, including anticipated production delivery schedules, anticipated customer payment dates, anticipated foreign currency costs, and expectations with respect to future foreign exchange rates. The Company is exposed to credit risk from potential default by counterparties on its foreign exchange contracts and attempts to mitigate this risk by dealing only with relationship banks in our credit facility. Despite these measures, significant long-term movements in relative currency values could affect the Company’s results of operations. The Company does not hedge the business activities of its foreign subsidiaries and, accordingly, results of operations could be further affected by a significant change in the relative values of the Canadian dollar, U.S. dollar, Euro, British pound, Hungarian forint, Mexican peso, Chinese renminbi, Japanese yen, Australian dollar, South Korean won, Swedish krona, Brazilian real and Indian rupee. The Company is committed to long-dated forward contracts to buy U.S. dollars to hedge the changes in exchange rates on the principal portion of the U.S. $130 million Private Placement Notes (“2017 Notes”) that were placed during 2010 and the U.S. $130 million 2021 Notes that were placed during 2011. These forward exchange contracts qualify as cash flow hedges for accounting purposes and any fair value unrealized gains and losses are included in other comprehensive earnings with reclassifications to net earnings for the effective portion to match the net earnings impact of the principal portion. The Company is committed to a series of forward exchange contracts to lock in the exchange rate on the semi-annual coupon payments related to the 2017 Notes and the 2021 Notes that were placed during 2011. These forward exchange contracts qualify as cash flow hedges for accounting purposes and any fair value unrealized gains and losses are included in other comprehensive earnings with reclassifications to net earnings for the effective portion to match the net earnings impact of the coupon portion. The Company is committed to long-dated forward contracts to buy U.S. dollars to hedge the changes in exchange rates on the principal portion of the U.S. $40 million Private Placement Notes (“2014 Notes”) that were placed during 2004. These forward exchange contracts qualify as fair value hedges for accounting purposes and any fair value unrealized gains and losses are included in net earnings.
Off Balance Sheet Arrangements The Company leases various land and buildings under cancellable and non-cancellable operating lease arrangements. The lease terms are between 1 and 20 years, and the majority of lease arrangements are renewable at the end of the lease period at market rates. The Company also leases various machinery and transportation equipment under non-cancellable operating lease arrangements. The lease terms are between 1 and 5 years and require notice for termination of the agreements. The Company expects that existing leases will either be renewed or replaced, or alternatively, capital expenditures will be incurred to acquire equivalent capacity. Please see Note 26 of the December 31, 2013 consolidated financial statements.
Guarantees The Company is a party to certain financial guarantees and contingent liabilities as discussed in Notes 3, 16, 17 and 26 of the December 31, 2013 consolidated financial statements.
TRANSACTIONS with RELATED PARTIES Included in the costs of property, plant and equipment is the construction of buildings, building additions and building improvements in the aggregate amount of $4.3 million at December 31, 2013 ($13.4 million at December 31, 2012) paid to a company owned by the spouse of an officer and director. Included in the cost of sales is maintenance costs and rent of $0.4 million for Q4 2013 and $0.8 million for 2013 ($0.1 million for Q4 2012, and $0.7 million for 2012) paid to the same company. The maintenance and construction costs represent general contracting and construction activities related to plant construction, improvements, additions and maintenance for a number of facilities. Amounts owed to this company at December 31, 2013 were $1.3 million ($0.8 million as of December 31, 2012). The Company has designed an independent process to ensure building construction and improvements are transacted at estimated fair value.
25

CURRENT and PROPOSED TRANSACTIONS On October 1, 2013, the Company announced that it had completed its acquisition from MKG and MMKG of MMKG’s business of manufacturing and distributing assembled camshafts, located in Hildburghausen, Thale and Thale-Warnstedt, Germany. The assets acquired consist of three facilities employing approximately 110 people. This acquisition will add lightweight and fuel efficient hydroformed and assembled camshaft technology to the Company’s existing technology portfolio on camshafts. The purchase price of the assets acquired amounts to $25.4 million, with $18.3 million paid on the date of acquisition and the remainder paid over four years. The purchase price allocation method used for accounting determined fair value of assets in excess of the purchase price. This difference is considered a bargain purchase gain which is required to be reported in the income statement under IFRS.
RISK MANAGEMENT The following risk factors, as well as the other information contained in this MD&A, and the Company’s Annual Information Form for the year ended December 31, 2013 or otherwise incorporated herein by reference, should be considered carefully. These risk factors could materially and adversely affect the Company’s future operating results and could cause actual events to differ materially from those described in forward-looking statements related to the Company.
Operational Risk Dependence on Certain Customers The Company’s Powertrain/Driveline segment is a world leader in the collaborative design, development and manufacture of prec ision metallic components, modules and systems for global vehicle markets. As a result, the Company typically has a limited number of customers that individually account for more than 10% of its consolidated revenues or receivables at any given time. For 2013, the Company’s four largest Powertrain/Driveline customers accounted for 59.4% of consolidated revenue (62.3% of revenue for the Powertrain/Driveline operational segment). Typically, sales are similarly concentrated for the Industrial operational segment as product distribution is largely through major rental companies. In 2012, two major rental companies amalgamated and as a result, sales to these customers did not occur to the level anticipated in 2013. However, sales to other customers increased significantly due to the improvement in the market as the economy recovered from the economic slowdown that occurred in 2009. As a consequence, 2013 sales to the two largest Industrial customers were 3.6% of consolidated revenue (22.9% of revenue for the Industrial operational segment). Any disruption in the Company’s relationships with these major customers or any decrease in revenue from these major customers, as a consequence of current or future conditions or events in the economy or markets in general or in the automotive (including medium/heavy duty trucks) and industrial industries in particular, could have a material adverse effect on the Company’s business, financial condition, or results of operations. Sources and Availability of Raw Materials The primary raw materials utilized by the precision machining operations are iron and aluminum castings and forgings, which are readily obtained from a variety of suppliers in North America for the Canadian, U.S. and Mexican operations. The Company is not dependent on any one supplier. Occasionally, raw material is consigned to the Company by its customers and any disruption in supply is the responsibility of that customer. The European segment sources its raw materials primarily from Europe. The Company is continuing its efforts to locate and develop strategic suppliers in Asia to deliver parts to the Company's North American facilities for further manufacturing and to create opportunities to supply the rapidly growing Asian automotive sector. During the year the Company continued to source some of its requirements from Asia. This effort will continue as the Company’s presence in Asia increases. Raw materials supply factors such as allocations, pricing, quality, timeliness of delivery, transportation and warehousing costs may affect the raw material sourcing decisions of the Company and its plants. When appropriate and available, the Company may negotiate long-term agreements with raw material suppliers to ensure continued availability of certain raw materials on favourable terms. In the event of significant unanticipated increase in demand for the Company’s products and the supply of raw materials, the Company may in the future be unable to manufacture certain products in a quantity sufficient to meet its customers’ demand in any particular period. Technological Change and Product Launches The automotive and non-automotive precision machining industry may encounter technological change, new product introductions, product abandonment, and evolving industry requirements and standards. Accordingly, the Company believes that its future success depends on its ability to launch new programs as well as enhance or develop current and future products at competitive prices and in a timely manner. The Company’s inability, given technological or other reasons, to enhance, develop, or launch products in a timely
26

manner in response to changing market conditions or customer requirements could have a material adverse effect on the Company ’s results of operations. For the development and production of products, the ability for the Company to compete successfully will depend on its ability to acquire and retain competent trades people, management, and product development staff that allow the Company to quickly adapt to technological change and advances in processes. In addition, there can be no assurance that products or technologies developed by others will not render the Company’s products uncompetitive or obsolete.
Financial and Capital Management Risk Capital and Liquidity Risk The Company is engaged in a capital-intensive business and it has fewer financial resources than some of its principal competitors. There is no assurance that the Company will be able to obtain additional debt or equity financing that may be required to successfully achieve its strategic plans. The Company’s current revolving credit facility, the 2014 Notes, the 2017 Notes and the 2021 Notes require the Company to comply with certain financial covenants, including the following: Revolving credit facility key covenants: (1) Net Funded Debt1,6 (“NFD”) to Earnings Before Interest, Taxes, Depreciation and Amortization2,6 (“EBITDA”) must be not more than
2.75 for the trailing four quarters on a rolling basis; and (2) EBITDA must be not less than 3.0 times interest expense for the trailing four quarters on a rolling basis. Mar 31 Jun 30 Sep 30 Dec 31 Mar 31 Jun 30 Sep 30 Dec 31 2012 2012 2012 2012 2013 2013 2013 2013
NFD to EBITDA 1.9 1.7 1.7 1.6 1.5 1.3 1.2 0.9 Interest Coverage 11.8 12.0 12.6 12.5 12.9 14.1 15.5 17.6
The 2014 Notes key covenants: (1) Book value of Consolidated Shareholders’ Equity3,6 must be not less than $450.0 million; and (2) Consolidated Debt4,6 to Consolidated Capitalization5,6 must be not greater than 50%.6 Mar 31 Jun 30 Sep 30 Dec 31 Mar 31 Jun 30 Sep 30 Dec 31 (in millions of dollars) 2012 2012 2012 2012 2013 2013 2013 2013
Consolidated Shareholders' Equity $998.6 $1,030.3 $1,058.9 $1,084.5 $1,132.9 $1,183.6 $1,230.6 1,294.7 Consolidated Debt to Consolidated Capitalization 42.8% 42.1% 40.8% 40.6% 40.6% 37.4% 35.4% 30.7%
The 2017 Notes key covenants: (1) NFD to EBITDA must be not more than 2.75 for the trailing four quarters on a rolling basis; and (2) EBITDA must be not less than 2.5 times interest expense for the trailing four quarters on a rolling basis. Mar 31 Jun 30 Sep 30 Dec 31 Mar 31 Jun 30 Sep 30 Dec 31 (in millions of dollars) 2012 2012 2012 2012 2013 2013 2013 2013
NFD to EBITDA 1.9 1.7 1.7 1.6 1.5 1.4 1.2 0.9 Interest Coverage 11.8 12.0 12.6 12.5 12.9 14.1 15.5 17.6
1 “NFD” is defined in the respective agreement (the credit facility agreement or the 2017 and 2021 Notes agreements) as applicable and means, in summary, all
indebtedness of the consolidated Company net of cash and cash equivalents of the Borrower and Guarantors. 2 “EBITDA” is defined in the respective agreement (the credit facility agreement or the 2017 and 2021 Notes agreements) as appl icable and means, in summary, Net
Income of the consolidated Company before deduction of interest expense, taxes, depreciation, amortization and non-cash extraordinary items less any cash payments on previously provided extraordinary items made during such period, determined on a consolidated basis in accordance with GAAP.
3 “Consolidated Shareholders’ Equity” is defined in the 2014 Notes and means, in summary, the amount of the capital stock accounts plus the surplus in retained earnings of the Company and its designated Restricted Subsidiaries on a consolidated basis in accordance with GAAP.
4 “Consolidated Debt” is defined in the 2014 Notes and means, in summary, all liabilities for borrowed money including capital leases, guarantees and letters of credit for the consolidated Company.
5 “Consolidated Capitalization” is defined in the 2014 Notes and means, in summary, the Consolidated Debt plus Consolidated Shareholders’ Equity less the capital of any unrestricted subsidiaries.
6 The measures above do not have a standardized meaning and therefore are unlikely to be comparable to similar measures presented by other issuers.
27
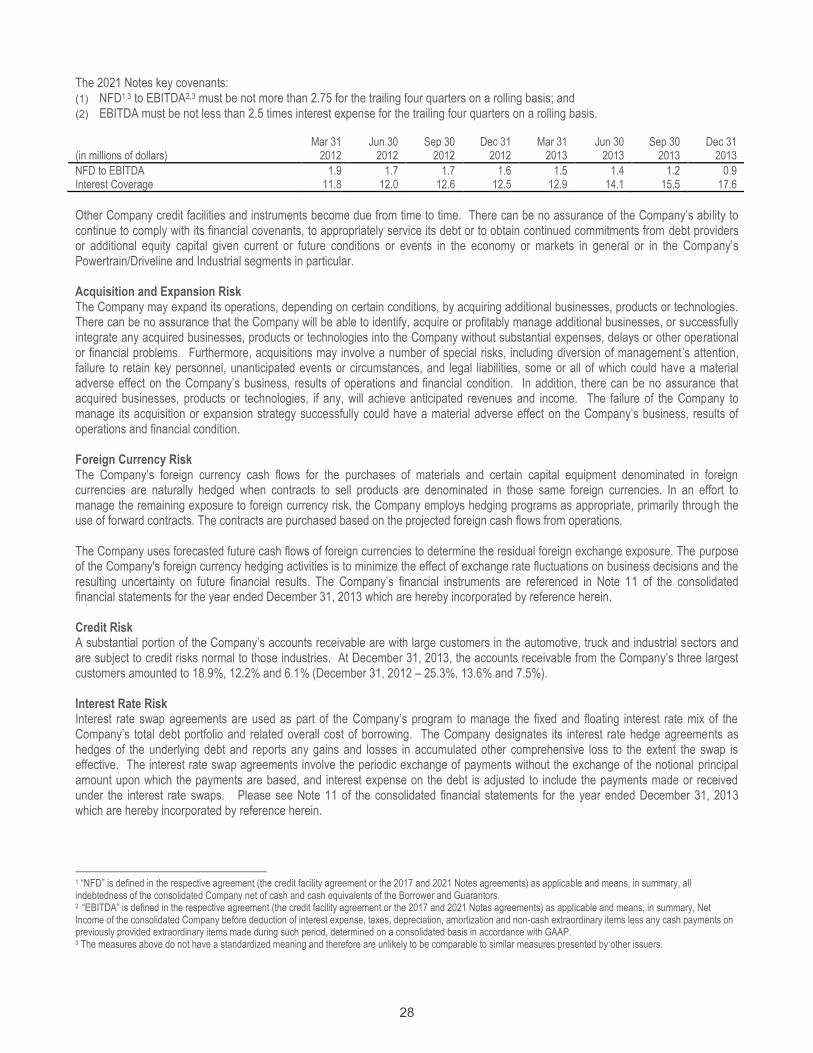
The 2021 Notes key covenants: (1) NFD1,3 to EBITDA2,3 must be not more than 2.75 for the trailing four quarters on a rolling basis; and (2) EBITDA must be not less than 2.5 times interest expense for the trailing four quarters on a rolling basis. Mar 31 Jun 30 Sep 30 Dec 31 Mar 31 Jun 30 Sep 30 Dec 31 (in millions of dollars) 2012 2012 2012 2012 2013 2013 2013 2013
NFD to EBITDA 1.9 1.7 1.7 1.6 1.5 1.4 1.2 0.9 Interest Coverage 11.8 12.0 12.6 12.5 12.9 14.1 15.5 17.6
Other Company credit facilities and instruments become due from time to time. There can be no assurance of the Company’s ability to continue to comply with its financial covenants, to appropriately service its debt or to obtain continued commitments from debt providers or additional equity capital given current or future conditions or events in the economy or markets in general or in the Company’s Powertrain/Driveline and Industrial segments in particular. Acquisition and Expansion Risk The Company may expand its operations, depending on certain conditions, by acquiring additional businesses, products or technologies. There can be no assurance that the Company will be able to identify, acquire or profitably manage additional businesses, or successfully integrate any acquired businesses, products or technologies into the Company without substantial expenses, delays or other operational or financial problems. Furthermore, acquisitions may involve a number of special risks, including diversion of management’s attention, failure to retain key personnel, unanticipated events or circumstances, and legal liabilities, some or all of which could have a material adverse effect on the Company’s business, results of operations and financial condition. In addition, there can be no assurance that acquired businesses, products or technologies, if any, will achieve anticipated revenues and income. The failure of the Company to manage its acquisition or expansion strategy successfully could have a material adverse effect on the Company’s business, results of operations and financial condition. Foreign Currency Risk The Company’s foreign currency cash flows for the purchases of materials and certain capital equipment denominated in foreign currencies are naturally hedged when contracts to sell products are denominated in those same foreign currencies. In an effort to manage the remaining exposure to foreign currency risk, the Company employs hedging programs as appropriate, primarily through the use of forward contracts. The contracts are purchased based on the projected foreign cash flows from operations. The Company uses forecasted future cash flows of foreign currencies to determine the residual foreign exchange exposure. The purpose of the Company's foreign currency hedging activities is to minimize the effect of exchange rate fluctuations on business decisions and the resulting uncertainty on future financial results. The Company’s financial instruments are referenced in Note 11 of the consolidated financial statements for the year ended December 31, 2013 which are hereby incorporated by reference herein. Credit Risk A substantial portion of the Company’s accounts receivable are with large customers in the automotive, truck and industrial sectors and are subject to credit risks normal to those industries. At December 31, 2013, the accounts receivable from the Company’s three largest customers amounted to 18.9%, 12.2% and 6.1% (December 31, 2012 – 25.3%, 13.6% and 7.5%). Interest Rate Risk Interest rate swap agreements are used as part of the Company’s program to manage the fixed and floating interest rate mix of the Company’s total debt portfolio and related overall cost of borrowing. The Company designates its interest rate hedge agreements as hedges of the underlying debt and reports any gains and losses in accumulated other comprehensive loss to the extent the swap is effective. The interest rate swap agreements involve the periodic exchange of payments without the exchange of the notional principal amount upon which the payments are based, and interest expense on the debt is adjusted to include the payments made or received under the interest rate swaps. Please see Note 11 of the consolidated financial statements for the year ended December 31, 2013 which are hereby incorporated by reference herein.
1 “NFD” is defined in the respective agreement (the credit facility agreement or the 2017 and 2021 Notes agreements) as applicable and means, in summary, all indebtedness of the consolidated Company net of cash and cash equivalents of the Borrower and Guarantors. 2 “EBITDA” is defined in the respective agreement (the credit facility agreement or the 2017 and 2021 Notes agreements) as applicable and means, in summary, Net Income of the consolidated Company before deduction of interest expense, taxes, depreciation, amortization and non-cash extraordinary items less any cash payments on previously provided extraordinary items made during such period, determined on a consolidated basis in accordance with GAAP. 3 The measures above do not have a standardized meaning and therefore are unlikely to be comparable to similar measures presented by other issuers.
28

Seasonality, Industry Growth, and Competition Historically, earnings in the second quarter are positively impacted by the high selling season for both the general lift platform and agricultural businesses. Vehicle production is typically at its lowest level during the months of July and August due to model changeovers by the OEMs. Since the Company’s working capital requirements are dependent upon industry production volumes, they are typically at their lowest level at this time. The Company takes advantage of summer shutdowns for maintenance activities that would otherwise disrupt normal production schedules. Production volumes in the month of December are usually negatively affected by the holiday season. Through its Powertrain/Driveline businesses, the Company principally engages in machining and assembly for the automotive industry, which generally involves long-run processes for long-term contracts. Outsourcing of brake components and assemblies, engine components, and powertrain components by the OEMs has increased. Management believes there is more powertrain and driveline work performed in-house by the OEMs than is currently outsourced, and therefore there is large potential for growth. However, because of various factors affecting the OEMs, such as the level of consumer spending on automobiles, labour contracts, and other economic factors, the OEMs are constantly facing volume changes and decisions on whether to outsource work or not; such changes and decisions are reflected in Linamar’s results through reduced volume on some existing programs and the ability to bid on, and receive, new business. Through its Skyjack subsidiary, the Company engages in the production and sale of aerial work platforms and telehandlers. There is a relatively defined sales cycle in this industry segment, as it is closely related to, and affected by, product life cycle and the construction sector. Therefore, the risks and fluctuations in the construction industry in the countries that Skyjack operates in also affect Skyjack’s sales. The precision machining industry in North America is characterized by a large number of manufacturers. As a result, manufacturers such as the Company tend to have a relatively small share of the North American market. Nonetheless, the Company believes that it is currently the sole supplier being used by its customers worldwide for products that represent more than half of the Company’s consolidated sales. The Company faces numerous sources of competition, including its OEM customers and their affiliated parts manufacturers, other direct competitors and product alternatives. In many product areas, the primary competition comes from in-house divisions of the OEMs. As Linamar’s North American customers have faced increased cost pressures, some have decided to “outsource” some of their requirements. This outsourcing has continued to represent an additional source of new business for the Company. Other competition in metal machining and assembly work comes from high precision machining companies which typically have several manufacturing locations and substantial capital resources to invest in equipment for high volume, high precision, and long-term contracts. Several of these companies are heavily involved in the automotive industry and are suppliers to major OEMs. The Company believes that there are a large number of independent suppliers which have the capability to produce some or all of the components, modules and systems which the Company currently produces. In addition, some of these competitors are larger and may have access to greater resources than the Company, but the Company believes that none of them are dominant in the markets in which the Company operates. The basis for supplier selection by OEMs is not typically determined solely by price, but would also typically include such elements as quality, service, historical performance, timeliness of delivery, proprietary technologies, scope of in-house capabilities, existing agreements, responsiveness and the supplier’s overall relationship with the OEM, as well as being influenced by the degree of available and unutilized capacity of resources in the OEMs’ manufacturing facilities, labour relations issues and other factors. The number of competitors that OEMs solicit to bid on any individual product has, in certain circumstances, been significantly reduced and management expects that further reductions will occur as a result of the OEMs’ stated intention to deal with fewer suppliers and to award those suppliers longer-term contracts. Foreign Business Risk The Company’s operations in Europe, Mexico, and Asia, are subject to general business risks that do not exist in Canada or the United States. The political climate and government policies are less stable and less predictable in these countries. As well, Hungary, Mexico, and Asia do not currently have the same economic infrastructure as exists in Canada or the United States. Operations outside the United States and Canada subject Linamar to other potential risks associated with international operations, including, but not limited to: complications in both compliance with and unexpected changes in foreign government laws and regulations, tariffs and other trade barriers, potential adverse tax consequences, fluctuations in currency exchange rates, difficulty in collecting accounts receivable, difficulty in staffing and managing foreign operations, events of international terrorism, economic effects of public health threats, recessionary environments in foreign economies, uncertainties in local commercial practices, and uncertainties in local
29
accepted business practices and standards which may not be similar to accepted business practices and standards in Canada and which may create unforeseen business or public relations situations. Insurance The Company’s business subjects it to the risk that it may incur product liability claims, warranty or recall claims, as well as business interruption claims. No assurance can be given that the insurance coverage or insurance coverage limits of the Company would be adequate to protect it against any claims for product liability claims, warranty or recall claims, or business interruption claims that may arise. The Company may require additional insurance coverage in these areas as the Company advances its involvement with product design and development. This insurance is expensive and may not be available on acceptable terms, or at all. Any uninsured or underinsured product liability claims, warranty or recall claims, or business interruption claims could have a material adverse effect on the Company’s financial condition, results of operations and prospects. Dependence on Key Personnel Loss of certain members of the executive team or key technical leaders of the Company could have a disruptive effect on the implementation of the Company’s business strategy and the efficient running of day-to-day operations until their replacement is found. Competition for personnel throughout the industry is intense. The Company may be unable to retain its key employees or attract, assimilate, train or retain other necessary qualified employees, which may restrict its growth potential.
Regulatory Risk Securities Laws Compliance and Corporate Governance Standards The securities laws in Canada and abroad have been changing since the collapse of Enron Corporation in the United States and the subsequent introduction of strengthened securities and governance laws such as the Sarbanes-Oxley Act. Canada has implemented similar laws. The Company has complied with Canadian Securities Administrators (“CSA”) National Instruments 52-109, and 52-110, among others. Tax Laws The tax laws in Canada and abroad are continuously changing. Over the past several years, the corporate tax rate in Canada has been decreasing. There is no assurance that the tax rate will continue to decrease in Canada or remain unchanged in other countries. The Company currently has tax losses and credits in Canada, Mexico, France, China, Germany and the U.S. that, given unforeseen changes in tax laws, may not continue indefinitely. Finally, the Company’s expansion into emerging markets subjects the Company to a new tax regimes that may change based on political or social conditions. Emission Standards Recent changes in emission standards in the U.S. in certain states, such as California, may affect the future sale of certain automotive products. Even though the Company continues to implement changes to certain products via specifications from customers, there can be no assurance that the Company will be able to keep pace with these changes. The introduction of the experimental fuel cell automobile by all major automotive manufacturers may affect the products and processes the Company employs, the effect of which is currently undetermined. Some countries where the Company’s products are sold, have implemented or intend to implement the Kyoto Protocol, which sets limits for emission standards. The effect of this standard has not been fully analyzed by the automotive industry and its full effect on the financial stability of the Company and its customers is as yet undetermined. Environmental Matters The Company’s manufacturing operations are subject to a wide range of environmental laws and regulations imposed by governmental authority in the jurisdictions in which the Company conducts business. The Company has regular environmental compliance audits performed to check that wastes are disposed of in accordance with such laws. Thirty-five of the Company’s manufacturing facilities meet the ISO 14001 standard. All other facilities are working towards qualifying under ISO 14001. To date, environmental laws and regulations have not had a material effect on the Company’s operations or financial condition. The Company has made, and will continue to make, significant expenditures in connection with environmental matters. Changes in laws and regulations, however, and the enforcement of such laws and regulations, are ongoing and may make environmental compliance, such as emissions control, site clean-ups and waste disposal, increasingly expensive. Senior management regularly assesses the work and costs required to address environmental matters, but is not able to predict the future costs (whether or not material) that may be incurred to meet environmental obligations. Senior management is not aware of any material environmental liability facing the Company at this time.
30
DISCLOSURE CONTROLS AND PROCEDURES AND INTERNAL CONTROLS OVER FINANCIAL REPORTING Disclosure Controls and Procedures National Instrument 52-109, “Certification of Disclosure in Issuers’ Annual and Interim Filings”, issued by the CSA requires Chief Executive Officers (“CEOs”) and Chief Financial Officers (“CFOs”) to certify that they are responsible for establishing and maintaining disclosure controls and procedures for the issuer, that disclosure controls and procedures have been designed and are effective in providing reasonable assurance that material information relating to the issuer is made known to them, that they have evaluated the effectiveness of the issuer’s disclosure controls and procedures, and that their conclusions about the effectiveness of those disclosure controls and procedures at the end of the period covered by the relevant annual filings have been disclosed by the issuer. As of December 31, 2013, the Company’s management evaluated the effectiveness of the Company’s disclosure controls and procedures, as defined under rules adopted by the CSA. This evaluation was performed under the supervision of, and with the participation of, the CEO and the CFO. The Company’s management, inclusive of the CEO and the CFO, does not expect that the Company’s disclosure controls and procedures will prevent or detect all error and all fraud. The inherent limitations in all control systems are such that they can provide only reasonable, not absolute, assurance that all control issues and instances of fraud or error, if any, within the Company have been detected. Based on this evaluation, the CEO and the CFO have concluded that, subject to the inherent limitations noted above, the Company’s disclosure controls and procedures are effective in providing reasonable, not absolute assurance that the objectives of our disclosure control system have been met.
Internal Control over Financial Reporting National Instrument 52-109 also requires CEOs and CFOs to certify that they are responsible for establishing and maintaining internal controls over financial reporting for the issuer, that those internal controls have been designed and are effective in providing reasonable assurance regarding the reliability of financial reporting and the preparation of financial statements in accordance with Canadian generally accepted accounting principles, and that the issuer has disclosed any changes in its internal controls during its most recent interim period that has materially affected, or is reasonably likely to materially affect, its internal control over financial reporting. As of December 31, 2013, the Company’s management evaluated the effectiveness of the Company’s internal control over financial reporting, as defined under rules adopted by the CSA. This evaluation was performed under the supervision of, and with the participation of, the CEO and the CFO. The Company’s internal control over financial reporting is designed to provide reasonable assurance regarding the reliability of financial reporting and the preparation of financial statements for external purposes in accordance with generally accepted accounting principles. Internal control over financial reporting, no matter how well designed, has inherent limitations. Therefore, internal control over financial reporting can provide only reasonable, not absolute assurance with respect to financial statement preparation and may not prevent or detect all misstatements. Based on this evaluation, the CEO and the CFO have concluded that, subject to the inherent limitations noted above, the Company ’s internal control over financial reporting is effective in providing reasonable, not absolute assurance regarding the reliability of financial reporting and the preparation of financial statements for external purposes in accordance with generally accepted accounting principles.
31

Changes in Internal Controls over Financial Reporting There were no changes in the Company’s internal control over financial reporting during the quarter ended December 31, 2013, which have materially affected, or is reasonably likely to materially affect, the Company’s internal control over financial reporting, except as outlined below. See “Limitation on Scope of Design” below. Limitation on Scope of Design The Company has limited the scope of design of our internal controls and procedures and internal controls over financial reporting to exclude controls, policies and procedures of MMKG’s business of manufacturing and distributing assembled camshafts, which the Company acquired effective October 1, 2013. The chart below presents the summary financial information of MMKG’s business of manufacturing and distributing assembled camshafts.
(in millions of dollars) December 31
2013 (in millions of dollars) Three Months Ended December 31, 2013
Year Ended December 31, 2013
Current assets 11.9 Sales 6.4 6.4 Long-term assets 24.1 Net Earnings (Loss) 6.7 6.7
Current liabilities 21.1 Unusual item – bargain purchase gain (8.8) (8.8) Long-term liabilities 8.1 Net Earnings (Loss) - Adjusted (2.1) (2.1)
The scope limitation is in accordance with section 3.3(1) (b) of National Instrument 52-109 to which this MD&A relates, which allows an issuer to limit its design of disclosure controls and procedures and internal controls over financial reporting to exclude controls, policies and procedures of a business that the issuer acquired not more than 365 days prior to the end of the fiscal period. CRITICAL ACCOUNTING ESTIMATES AND JUDGEMENTS The preparation of financial statements in conformity with IFRS requires management to make estimates and judgements about the future. Estimates and judgements are continually evaluated and are based on the historical experience and other factors, including expectations of future events that are believed to be reasonable under the circumstances. Actual results could differ from those estimates under different assumptions or conditions. The following discussion sets forth management’s most critical estimates and assumptions in determining the value of assets and liabilities and most critical judgements in applying accounting policies that have a significant risk of causing a material adjustment to the carrying amounts of assets and liabilities within the next year.
Impairment of Non-Financial Assets Management assesses goodwill and non-financial assets for impairment based on the accounting policies stated in Note 3 of the consolidated financial statements for the year ended December 31, 2013, which are hereby incorporated by reference herein. The Company believes that the estimate of impairment for goodwill and non-financial assets is a “critical accounting estimate” because management is required to make significant forward looking assumptions. The recoverable amounts of CGU’s have been determined based on the higher of fair value less costs of disposal or value in use calculations, which require the use of estimates. Uncertain changes in the discount rate used, and forward looking assumptions regarding improvement plans, costing assumptions, timing of program launches, and production volumes may affect the fair value of estimates used. No known trends, commitments, events or other uncertainties are currently believed to materially affect the assumptions used with the exception of the length and extent of the current economic conditions that are impacting the overall global economy. As at December 31, 2013, goodwill of $24.6 million (2012 - $23.4 million) was recorded on the consolidated balance sheet of the Company. The amount of goodwill acquired during the current year and prior year was nil. There were no impairment charges with respect to goodwill on the Company’s consolidated statements of earnings for 2013 (2012 – nil). During the year, the Company recorded an impairment of $1.3 million (2012 – nil) for plant, property and equipment related to powertrain/drivelines programs that had ended or were cancelled during the year.
32
Current Income Taxes The Company is subject to income taxes in numerous jurisdictions where it has foreign operations. Significant judgement is required in determining the worldwide provision for income taxes. There are many transactions and calculations for which the ultimate tax determination is uncertain. The Company recognizes liabilities for anticipated tax audit issues based on estimates of whether additional taxes will be due. Where the final tax outcome of these matters is different from the amounts that were initially recorded, such differences will impact the current and deferred income tax assets and liabilities in the period in which such determination is made.
Deferred Income Tax Assets and Liabilities Deferred income tax assets and liabilities result from timing differences between the financial reporting and tax bases of assets and liabilities. Loss carry forwards also comprise a portion of the temporary differences and result in a deferred income tax asset. Deferred income tax assets are only recognized to the extent that management considers it probable that a deferred income tax asset will be realized. The assessment for the recognition of a deferred tax asset requires significant judgement. The factors used to assess the likelihood of realization are the Company’s forecast of future taxable income and available tax planning strategies that could be implemented to realize the deferred tax assets. The Company has and continues to use tax planning strategies to realize deferred tax assets in order to avoid the potential loss of benefits. Unknown future events and circumstances, such as changes in tax rates and laws, may materially affect the assumptions and estimates made from one period to the next. Any significant change in events, tax laws, and tax rates beyond the control of the Company may materially affect the consolidated financial statements. As at December 31, 2013, the valuation allowance against the tax benefit of tax credits and loss carry forwards as well as other assets with tax value in excess of book value was $18.9 million (2012 - $12.2 million). The valuation allowance is reflected in the net deferred tax liability from continuing operations balance of $18.9 million (2012 - $17.0 million) on the Company’s consolidated statement of financial position.
Useful Lives of Depreciable Assets Due to the significance of property, plant and equipment on the Company’s statement of financial position, the Company considers the amortization policy relating to property, plant and equipment to be a “critical accounting estimate”. The Company considers the expected useful life of the assets, expected residual value, and contract length when setting the amortization rates of its assets. Judgement is involved when establishing these estimates as such factors as technological innovation, maintenance programs, and relevant market information must be taken into consideration. The assets’ residual values, useful lives and amortization methods are reviewed at the end of each reporting period and are adjusted if expectations differ from previous estimates. If circumstances impacting these assumptions and estimates change, the change in accounting estimates may represent a material impact to the consolidated financial statements.
RECENT ACCOUNTING CHANGES AND EFFECTIVE DATES Refer to Note 4 of the consolidated financial statements for the year ended December 31, 2013, that are hereby incorporated by reference herein for information pertaining to accounting changes effective in 2013 and for information on issued accounting pronouncements that will be effective in future fiscal years.
NON-GAAP AND ADDITIONAL GAAP MEASURES Non-GAAP Measures The Company uses the following non-GAAP financial measures: net earnings (loss) – adjusted, earnings (loss) per share – adjusted, book value per share, and debt to total capitalization. The Company believes these non-GAAP financial measures provide useful information to both management and investors in assessing the financial performance and financial condition of the Company. Certain expenses and income that must be recognized under GAAP are not necessarily reflective of the Company’s underlying operational performance. For this reason, management uses certain non-GAAP financial measures to exclude the impact of these items when analyzing consolidated and segment underlying operational performance, on a consistent basis. The exclusion of certain items does not imply that they are non-recurring. These non-GAAP financial measures do not have a standardized meaning prescribed by GAAP and therefore they are unlikely to be
33
comparable to similarly titled measures presented by other publicly traded companies, and they should not be construed as an alternative to other financial measures determined in accordance with GAAP. Net Earnings (Loss) – Adjusted The Company believes net earnings (loss) – adjusted is useful in assessing the Company’s underlying operational performance and in making decisions regarding the ongoing operations of the business. Net earnings (loss) – adjusted is calculated as net earnings (loss) as presented in the Company’s consolidated financial statements less any unusual items that are considered not to be indicative of underlying operational performance. See the “Overall Corporate Results” section of this MD&A for a description of the unusual items impacting the operational performance discussed in this MD&A and a reconciliation of net earnings (loss) – adjusted to GAAP net earnings (loss). Earnings (Loss) per Share - Adjusted The Company believes net earnings (loss) per share – adjusted is useful in assessing the Company’s underlying operational performance and in making decisions regarding the ongoing operations of the business. Net earnings (loss) per share – adjusted is calculated as net earnings (loss) - adjusted (as defined above) divided by the weighted average number of shares outstanding as at the period end date. See the “Overall Corporate Results” section of this MD&A for a description of the unusual items impacting the operational performance discussed in this MD&A and a reconciliation of net earnings (loss) per share – adjusted to GAAP net earnings (loss) per share. Book Value per Share This measure, as used by the chief operating decision makers and management, indicates the value of the Company based on the carrying value of the Company’s net assets. Book value per share is calculated by the Company as equity attributable to shareholders of the Company divided by shares outstanding at the end of the period. December 31 December 31 (in millions of dollars except share and per share figures) 2013 2012
Equity attributable to shareholders of the Company $1,352.3 $1,050.6 Shares outstanding at the end of the period 64,762,148 64,706,296 Book value per share $20.88 $16.24
Debt to Total Capitalization This measure, as used by the chief operating decision makers and management, indicates the Company’s reliance on debt and its financial flexibility. This measure is not the same as the measure previously discussed in terms of the Company’s debt covenants. Debt to total capitalization is calculated by the Company as the sum of short-term bank borrowings, current portion of long-term debt, and long-term debt divided by the sum of this total, capital stock and retained earnings. December 31 December 31 (in millions of dollars) 2013 2012
Current portion of long-term debt 56.3 1.4 Long-term debt 487.3 717.7
Total Debt $543.6 $719.1 Capital Stock and Retained Earnings $1,294.7 $1,084.5
Debt to Total Capitalization 29.6% 39.9%
Additional GAAP Measures IFRS mandates certain minimum line items for financial statements and requires presentation of additional line items, headings and subtotals when such presentation is relevant to an understanding of an entity’s financial position and performance. The Company presents the following additional GAAP measures in the Company’s consolidated financial statements. Operating Earnings Operating earnings is calculated as net earnings (loss) before taxes and finance expenses, as presented on the Company’s consolidated statements of earnings. This measure, along with other GAAP and non-GAAP measures are used by the chief operating decision makers and management to assess operating performance and the effective use and allocation of resources and to provide more meaningful comparisons of operating results.
34

SUMMARY OF CONTENT PER VEHICLE BY QUARTER Estimates as of Dec. 31, 2013 (in millions of dollars except content per vehicle figures)
Three Months Ended Year to Date
March 31 June 30
Sep 30
Dec 31
March 31
June 30
Sep 30
Dec 31 North America 2013 2013 2013 2013 2013 2013 2013 2013
Vehicle Production Units 4.11 4.37 4.00 4.14 4.11 8.48 12.47 16.61 Automotive Sales $ 503.4 $ 517.0 $ 520.6 $ 537.6 $ 503.4 $ 1,020.4 $ 1,540.9 $ 2,078.5 Content Per Vehicle $ 122.60 $ 118.33 $ 130.29 $ 129.91 $ 122.60 $ 120.40 $ 123.57 $ 125.15
Europe
Vehicle Production Units 4.82 5.14 4.54 4.77 4.82 9.96 14.50 19.27 Automotive Sales $ 56.4 $ 68.3 $ 70.8 $ 82.8 $ 56.4 $ 124.8 $ 195.6 $ 278.4 Content Per Vehicle $ 11.71 $ 13.29 $ 15.58 $ 17.38 $ 11.71 $ 12.53 $ 13.48 $ 14.45
Asia Pacific
Vehicle Production Units 10.78 10.38 10.30 11.15 10.78 21.16 31.46 42.61 Automotive Sales $ 45.1 $ 57.6 $ 59.1 $ 68.2 $ 45.1 $ 102.7 $ 161.9 $ 230.1 Content Per Vehicle $ 4.19 $ 5.55 $ 5.74 $ 6.12 $ 4.19 $ 4.86 $ 5.15 $ 5.40
Estimates as of Sep 30, 2013 Three Months Ended Year to Date
March 31 June 30 Sep 30 March 31 June 30 Sep 30 North America 2013 2013 2013 2013 2013 2013
Vehicle Production Units 4.11 4.37 4.03 4.11 8.48 12.51 Automotive Sales $ 500.9 $516.5 $ 522.7 $ 500.9 $ 1,017.4 $ 1,540.1 Content Per Vehicle $ 121.97 $ 118.13 $ 129.62 $ 121.97 $ 119.99 $ 123.09
Europe
Vehicle Production Units 4.82 5.15 4.31 4.82 9.96 14.28 Automotive Sales $ 54.9 $ 65.3 $ 69.0 $ 54.9 $ 120.3 $ 189.3 Content Per Vehicle $ 11.40 $ 12.70 $ 16.00 $ 11.40 $ 12.07 $ 13.26
Asia Pacific
Vehicle Production Units 10.74 10.37 10.13 10.74 21.12 31.24 Automotive Sales $ 47.0 $ 57.7 $ 57.2 $ 47.0 $ 104.6 $ 161.9 Content Per Vehicle $ 4.37 $ 5.56 $ 5.65 $ 4.37 $ 4.95 $ 5.18
Change in Estimates from Prior Quarter
Three Months Ended Year to Date March 31 June 30 Sep 30 March 31 June 30 Sep 30
2013 2013 2013 2013 2013 2013 North America +/- +/- +/- +/- +/- +/-
Vehicle Production Units - - (0.03) - - (0.04) Automotive Sales $ 2.5 $ 0.5 $ (2.1) $ 2.5 $ 3.0 $ 0.8 Content Per Vehicle $ 0.63 $ 0.20 $ 0.67 $ 0.63 $ 0.41 $ 0.48
Europe
Vehicle Production Units - (0.01) 0.23 - - 0.22 Automotive Sales $ 1.5 $ 3.0 $ 1.8 $ 1.5 $ 4.5 $ 6.3 Content Per Vehicle $ 0.31 $ 0.59 $ (0.42) $ 0.31 $ 0.46 $ 0.22
Asia Pacific
Vehicle Production Units 0.04 0.01 0.17 0.04 0.04 0.22 Automotive Sales $ (1.9) $ (0.01) $ 1.9 $ (1.9) $ (1.9) - Content Per Vehicle $ (0.18) $ (0.01) $ 0.09 $ (0.18) $ (0.09) $ (0.03)
35

OUTLOOK Since 2006, the Company determined it was not appropriate to provide outlook guidance.
FORWARD LOOKING INFORMATION Certain information provided by Linamar in this MD&A, in the Annual Report and other documents published throughout the year which are not recitation of historical facts may constitute forward-looking statements. The words “may”, “would”, “could”, “will”, “likely”, “estimate”, “believe”, “expect”, “plan”, “forecast” and similar expressions are intended to identify forward-looking statements. Readers are cautioned that such statements are only predictions and the actual events or results may differ materially. In evaluating such forward-looking statements, readers should specifically consider the various factors that could cause actual events or results to differ materially from those indicated by such forward-looking statements. Such forward-looking information may involve important risks and uncertainties that could materially alter results in the future from those expressed or implied in any forward-looking statements made by, or on behalf of, Linamar. Some of the factors and risks and uncertainties that cause results to differ from current expectations discussed in this MD&A and elsewhere in the Annual Report include, but are not limited to, changes in the various economies in which Linamar operates, fluctuations in interest rates, environmental emission and safety regulations, the extent of OEM outsourcing, industry cyclicality, trade and labour disruptions, world political events, pricing concessions and cost absorptions, delays in program launches, the Company’s dependence on certain engine and transmission programs and major OEM customers, currency exposure, technological developments by Linamar’s competitors, governmental, environmental and regulatory policies and changes in the competitive environment in which Linamar operates. The foregoing is not an exhaustive list of the factors that may affect Linamar’s forwarding looking statements. These and other factors should be considered carefully and readers should not place undue reliance on Linamar’s forward-looking statements. Linamar assumes no obligation to update the forward-looking statements, or to update the reasons why actual results could differ from those reflected in the forward-looking statements.
36

CONSOLIDATED FINANCIAL STATEMENTS
Linamar Corporation December 31, 2013 and December 31, 2012 (in thousands of dollars)
37

MANAGEMENT’S RESPONSIBILITY FOR THE CONSOLIDATED FINANCIAL STATEMENTS The management of Linamar Corporation is responsible for the preparation of all information included in this annual report. The consolidated financial statements have been prepared in accordance with International Financial Reporting Standards, and necessarily include some amounts that are based on management’s best estimates and judgments. Financial information included elsewhere in this annual report is consistent with that in the consolidated financial statements. Management maintains a system of internal accounting controls to provide reasonable assurance that the consolidated financial statements are accurate and reliable and that the assets are safeguarded from loss or unauthorized use. The Company’s external auditors, appointed by the shareholders, have prepared their report, which outlines the scope of their examination and expresses their opinion on the consolidated financial statements. The Board of Directors, through its Audit Committee, is responsible for assuring that management fulfills its financial reporting responsibilities. The Audit Committee is composed of independent directors who are not employees of the company. The Audit Committee meets periodically with management and with the auditors to review and to discuss accounting policy, auditing and financial reporting matters. The Committee reports its findings to the Board of Directors for their consideration in reviewing and approving the consolidated financial statements for issuance to the shareholders.
Linda Hasenfratz Dale Schneider Chief Executive Officer Chief Financial Officer March 5, 2014
38

March 5, 2014 Independent Auditor’s Report To the Shareholders of Linamar Corporation We have audited the accompanying consolidated financial statements of Linamar Corporation, which comprise the consolidated balance sheets as at December 31, 2013 and 2012, and the consolidated statements of earnings, comprehensive earnings, changes in equity and cash flows for the years then ended and the related notes, which comprise a summary of significant accounting policies and other explanatory information. Management’s responsibility for the consolidated financial statements Management is responsible for the preparation and fair presentation of these consolidated financial statements in accordance with International Financial Reporting Standards, and for such internal control as management determines is necessary to enable the preparation of consolidated financial statements that are free from material misstatement, whether due to fraud or error. Auditor’s responsibility Our responsibility is to express an opinion on these consolidated financial statements based on our audits. We conducted our audits in accordance with Canadian generally accepted auditing standards. Those standards require that we comply with ethical requirements and plan and perform the audit to obtain reasonable assurance about whether the consolidated financial statements are free from material misstatement. An audit involves performing procedures to obtain audit evidence about the amounts and disclosures in the consolidated financial statements. The procedures selected depend on the auditor’s judgment, including the assessment of the risks of material misstatement of the consolidated financial statements, whether due to fraud or error. In making those risk assessments, the auditor considers internal control relevant to the entity’s preparation and fair presentation of the consolidated financial statements in order to design audit procedures that are appropriate in the circumstances, but not for the purpose of expressing an opinion on the effectiveness of the entity’s internal control. An audit also includes evaluating the appropriateness of accounting policies used and the reasonableness of accounting estimates made by management, as well as evaluating the overall presentation of the consolidated financial statements. We believe that the audit evidence we have obtained in our audits is sufficient and appropriate to provide a basis for our audit opinion. Opinion In our opinion, the consolidated financial statements present fairly, in all material respects, the financial position of Linamar Corporation as at December 31, 2013 and 2012 and its financial performance and its cash flows for the years then ended in accordance with International Financial Reporting Standards.
Chartered Professional Accountants, Licensed Public Accountants
39
LINAMAR CORPORATION Consolidated Statements of Financial Position (in thousands of Canadian dollars)
December 31 December 31 2013 2012 $ $
ASSETS Cash and cash equivalents 129,843 81,574 Accounts and other receivables (Notes 6, 7, 8, 21) 587,133 495,851 Inventories (Note 9) 380,282 419,173 Income taxes recoverable (Note 10) 8,776 10,339 Current portion of long-term receivables (Notes 7, 8) 20,533 11,559 Current portion of derivative financial instruments (Note 11) 493 - Other current assets 8,015 8,739
Total Current Assets 1,135,075 1,027,235
Long-term receivables (Notes 7, 8) 65,804 37,075 Property, plant and equipment (Note 12) 1,311,576 1,257,373 Deferred tax assets (Note 10) 60,993 54,909 Goodwill (Note 13) 24,564 23,350 Intangible assets (Note 14) 28,108 11,872 Derivative financial instruments (Note 11) 2,971 -
Total Assets 2,629,091 2,411,814
LIABILITIES Accounts payable and accrued liabilities (Note 15) 597,589 527,214 Provisions (Note 16) 21,596 19,087 Income taxes payable (Note 10) 34,092 22,246 Current portion of derivative financial instruments (Note 11) - 1,478 Current portion of long-term debt (Note 17) 56,337 1,349
Total Current Liabilities 709,614 571,374
Long-term debt (Note 17) 487,244 717,720 Derivative financial instruments (Note 11) - 163 Deferred tax liabilities (Note 10) 79,895 71,933
Total Liabilities 1,276,753 1,361,190
EQUITY Capital stock (Note 18) 109,474 108,307 Retained earnings 1,185,229 976,152 Contributed surplus (Note 19) 19,699 18,327 Accumulated other comprehensive loss 37,936 (52,162)
Total Equity 1,352,338 1,050,624
Total Liabilities and Equity 2,629,091 2,411,814
The accompanying Notes are an integral part of these consolidated financial statements.
On behalf of the Board of Directors:
Frank Hasenfratz Linda Hasenfratz
Director Director
40

LINAMAR CORPORATION Consolidated Statements of Earnings For the years ended December 31, 2013 and December 31, 2012 (in thousands of Canadian dollars, except per share figures)
2013 2012 $ $
Sales 3,595,489 3,221,936 Cost of sales (Notes 20, 21, 29) 3,089,365 2,836,331
Gross Margin 506,124 385,605 Selling, general and administrative (Notes 20, 21, 22) 183,246 165,597 Other income and (expenses) (Note 23) (2,794) (1,513)
Operating Earnings 320,084 218,495 Finance expenses (Note 24) 29,525 30,312
290,559 188,183 Provision for (Recovery of) Income Taxes (Note 10) 60,770 42,081
Net Earnings (Loss) for the Year 229,789 146,102
Net Earnings (Loss) per Share: (Note 25)
Basic 3.55 2.26 Diluted 3.52 2.25
The accompanying Notes are an integral part of these consolidated financial statements.
41
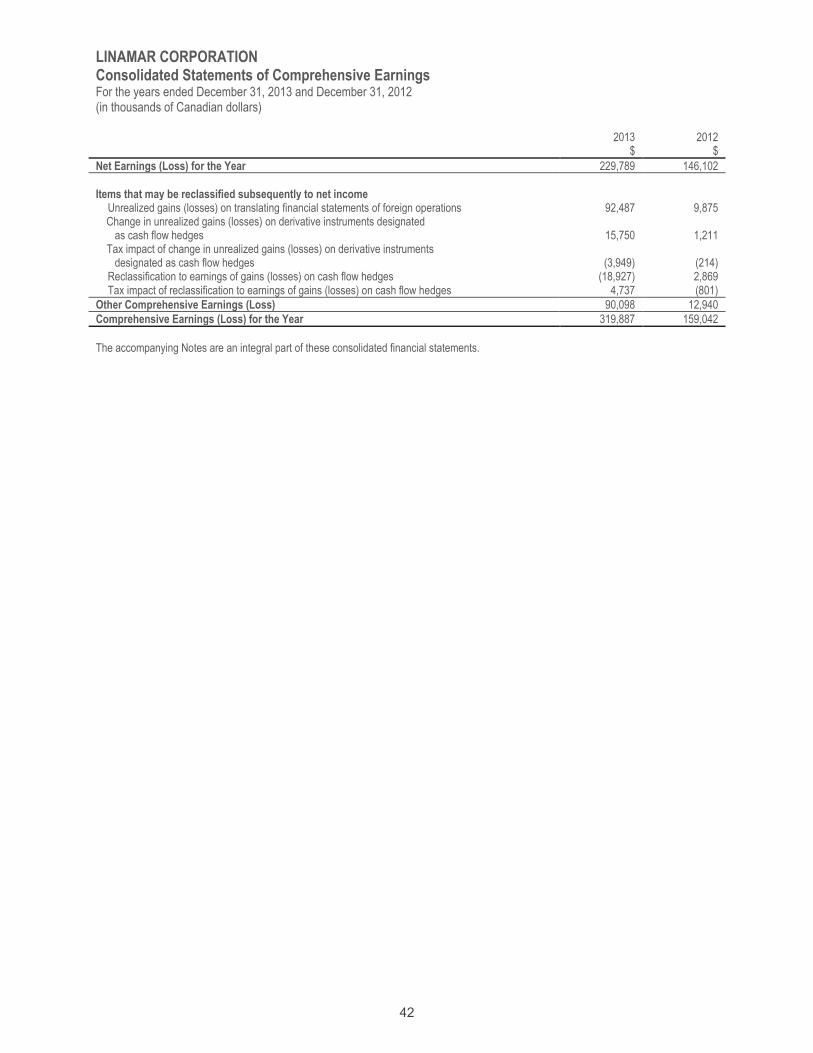
LINAMAR CORPORATION Consolidated Statements of Comprehensive Earnings For the years ended December 31, 2013 and December 31, 2012 (in thousands of Canadian dollars)
2013 2012 $ $
Net Earnings (Loss) for the Year 229,789 146,102
Items that may be reclassified subsequently to net income
Unrealized gains (losses) on translating financial statements of foreign operations 92,487 9,875 Change in unrealized gains (losses) on derivative instruments designated as cash flow hedges 15,750 1,211 Tax impact of change in unrealized gains (losses) on derivative instruments designated as cash flow hedges (3,949) (214) Reclassification to earnings of gains (losses) on cash flow hedges (18,927) 2,869 Tax impact of reclassification to earnings of gains (losses) on cash flow hedges 4,737 (801)
Other Comprehensive Earnings (Loss) 90,098 12,940
Comprehensive Earnings (Loss) for the Year 319,887 159,042
The accompanying Notes are an integral part of these consolidated financial statements.
42

LINAMAR CORPORATION Consolidated Statements of Changes in Equity For the years ended December 31, 2013 and December 31, 2012 (in thousands of Canadian dollars)
Capital
stock Retained earnings
Contributed surplus
Cumulative translation adjustment
Hedging reserves Total Equity
$ $ $ $ $ $
Balance at January 1, 2012 108,215 850,755 16,022 (63,705) (1,397) 909,890 Net earnings - 146,102 - - - 146,102 Other comprehensive earnings (loss) - - - 9,875 3,065 12,940
Comprehensive earnings - 146,102 - 9,875 3,065 159,042 Share-based compensation - - 2,332 - - 2,332 Shares issued on exercise of options 92 - (27) - - 65 Dividends - (20,705) - - - (20,705)
Balance at December 31, 2012 108,307 976,152 18,327 (53,830) 1,668 1,050,624 Net earnings - 229,789 - - - 229,789 Other comprehensive earnings (loss) - - - 92,487 (2,389) 90,098
Comprehensive earnings - 229,789 - 92,487 (2,389) 319,887 Share-based compensation - - 1,718 - - 1,718 Shares issued on exercise of options 1,167 - (346) - - 821 Dividends - (20,712) - - - (20,712)
Balance at December 31, 2013 109,474 1,185,229 19,699 38,657 (721) 1,352,338
The accompanying Notes are an integral part of these consolidated financial statements.
43

LINAMAR CORPORATION Consolidated Statements of Cash Flows For the years ended December 31, 2013 and December 31, 2012 (in thousands of Canadian dollars)
2013 2012 $ $
Cash provided by (used in) Operating Activities Net earnings (loss) for the year 229,789 146,102 Adjustments for:
Amortization of property, plant and equipment 214,710 188,699 Amortization of other intangible assets 3,760 2,259 Deferred income taxes 2,389 (1,909) Share-based compensation (Note 22) 1,718 2,332 Finance expense 29,525 30,312 Gain on a bargain purchase (Note 29) (8,757) - Other (512) (4,090)
472,622 363,705
Changes in non-cash working capital
(Increase) decrease in accounts receivable 1,647 18,759 (Increase) decrease in inventories 60,029 (37,464) (Increase) decrease in other current assets 1,003 (1,328) Increase (decrease) in income taxes 12,638 23,441 Increase (decrease) in accounts payable and accrued liabilities 34,044 (18,459) Increase (decrease) in provisions 1,752 4,107
111,113 (10,944)
Cash generated from (used in) operations 583,735 352,761
Financing Activities Proceeds from (repayments of) long-term debt (192,151) 69,146 Proceeds from exercise of stock options 821 65 (Increase) decrease in long-term receivables (34,211) (24,382) Dividends to shareholders (20,712) (20,705) Interest received (paid) (25,994) (30,311)
(272,247) (6,187)
Investing Activities Payments for purchase of property, plant and equipment (244,873) (366,939) Proceeds on disposal of property, plant and equipment 7,514 2,718 Payments for purchase of intangible assets (15,197) (368) Business acquisitions (Note 29) (18,314) -
(270,870) (364,589)
40,618 (18,015) Effect of translation adjustment on cash 7,651 460
Increase (decrease) in cash and cash equivalents 48,269 (17,555) Cash and cash equivalents - Beginning of Year 81,574 99,129
Cash and cash equivalents - End of Year 129,843 81,574
Comprised of: Cash and cash equivalents 145,035 93,839 Unpresented cheques (15,192) (12,265)
129,843 81,574
The accompanying Notes are an integral part of these consolidated financial statements.
44

LINAMAR CORPORATION Notes to Consolidated Financial Statements For the years ended December 31, 2013 and December 31, 2012 (in thousands of Canadian dollars, except where otherwise noted)
1 General Information Linamar Corporation (the “Company”) is a diversified global manufacturing company of highly engineered products. The Company is an Ontario, Canada corporation with common shares listed on the Toronto Stock Exchange. The Company is domiciled in Canada and its registered office is 287 Speedvale Avenue West, Guelph, Ontario, Canada. The annual consolidated financial statements of the Company for the year ended December 31, 2013 were authorized for issue in accordance with a resolution of the Company’s Board of Directors on March 5, 2014. No changes were made to the consolidated financial statements subsequent to board authorization.
2 Basis of Preparation The Company has prepared its consolidated annual financial statements in accordance with International Financial Reporting Standards (“IFRS”) as issued by the International Accounting Standards Board (“IASB”) and with interpretations of the International Financial Reporting Issues Committee (“IFRIC”) which the Canadian Accounting Standards Board has approved for incorporation into Part 1 of the CPA Canada Handbook - Accounting. The preparation of financial statements in conformity with IFRS requires the use of certain critical accounting estimates. It also requires management to exercise its judgment in the process of applying the Company’s accounting policies. The areas involving a higher degree of judgment or complexity, or areas where assumptions and estimates are significant to the consolidated financial statements are disclosed in Note 5. The Company presents the expenses recognized in the Consolidated Statements of Earnings on the basis of the function of the expense. The Company discloses the nature of the expenses in the Notes to the financial statements including but not limited to the following notes: Note 9 Inventories; Note 12 Property, Plant and Equipment; Note 14 Intangible Assets; Note 16 Provisions; Note 20 Employee Benefits; and Note 26 Commitments and Guarantees.
3 Significant Accounting Policies The principal accounting policies applied in the preparation of these consolidated financial statements are set out below. These policies have been consistently applied to all the periods presented, unless otherwise stated.
Basis of Measurement These consolidated financial statements were prepared on a going concern basis, under the historical cost convention, as modified by the revaluation of financial assets and financial liabilities (including derivative instruments) at fair value.
Basis of Consolidation Subsidiaries are all entities over which the Company has control. These consolidated financial statements include the accounts of the Company and its subsidiaries. Control is achieved when the Company has the power to govern the financial and operating policies generally accompanying a shareholding of more than one half of the voting rights and may also arise as a result of shareholder agreement. Subsidiaries are fully consolidated from the date on which control is transferred to the Company and are deconsolidated from the date that control ceases. All significant inter-company transactions are eliminated on consolidation. Acquisitions of subsidiaries and businesses are accounted for using the acquisition method. The consideration transferred for the acquisition of a subsidiary is the fair values (at the date of exchange) of the assets acquired, liabilities incurred or assumed, and equity instruments issued by the Company in exchange for control of the acquiree. Any excess of the acquisition cost over the fair value of the net assets acquired and liabilities and contingent liabilities recognized, is recorded in assets as goodwill. If this consideration is lower than the fair value of the net assets acquired, the difference is recognized in profit or loss. Acquisition-related costs are expensed as incurred.
45

LINAMAR CORPORATION Notes to Consolidated Financial Statements For the years ended December 31, 2013 and December 31, 2012 (in thousands of Canadian dollars, except where otherwise noted)
Any contingent consideration to be transferred by the acquirer is recognized and estimated at fair value at the acquisition date. Subsequent changes to the fair value of the contingent consideration which is deemed to be an asset or liability will be recognized in accordance with the applicable standard either in net earnings or as a change to other comprehensive earnings. If the contingent consideration is classified as equity, it shall not be re-measured and shall be accounted for within equity.
Segment Reporting Operating segments are reported in a manner consistent with the internal reporting provided to the chief operating decision-makers. The chief operating decision-makers for the Company who are responsible for allocating resources and assessing performance of the operating segments have been identified as the senior executive group that makes strategic decisions.
Foreign Currency Translation Functional and presentation currency The Company’s consolidated financial statements are presented in Canadian dollars (“dollars”), which is also the Company’s functional currency. Each entity in the Company maintains its accounting records in its functional currency. An entity’s functional currency is the currency of the principal economic environment in which it operates. Transactions and balances Foreign currency transactions are translated into the functional currency using the average exchange rate of the period. At the end of each reporting period, monetary assets and liabilities denominated in foreign currencies are re-translated at period end exchange rates. Non-monetary assets and liabilities that are measured in terms of historical cost in a foreign currency are not re-translated. Foreign exchange gains and losses arising from cash and cash equivalents and borrowings are presented in the statement of earnings within finance expenses and all other foreign exchange gains and losses are presented within operating earnings except for those which relate to qualifying cash flow hedges, which are presented in other comprehensive earnings within accumulated other comprehensive earnings until realized. Foreign Operations For the purposes of presenting consolidated financial statements, the results and financial position of all entities that have a functional currency different from the presentation currency are translated into the presentation currency as follows: a) Assets and liabilities are translated at the closing rate at the reporting period end date; b) Income and expenses are translated at average exchange rates for the reporting period; and c) All resulting exchange differences are recognized as a separate component of equity. On consolidation, exchange differences arising from the translation of the net investment in foreign operations are taken to equity. When a foreign operation is sold or there is a disposal involving a loss of control, exchange differences that were recorded in equity are recognized in the statement of earnings as part of the gain or loss on sale or disposal.
Cash and Cash Equivalents Cash and cash equivalents include cash on hand and short-term deposits with maturities of three months or less.
Accounts Receivable Accounts receivable are amounts due from customers for products sold or services performed in the ordinary course of business. If collection is expected in one year or less, they are classified as current assets. If not, they are presented as non-current assets. Accounts receivable are recognized initially at fair value and subsequently measured at amortized cost using the effective interest method, less allowances for doubtful accounts. The allowance for bad debts is determined by taking into consideration the age of the receivables, the Company’s prior experience with the customer including their ability to pay, and/or an assessment of the current economic conditions. Accounts receivable and allowance for bad debts are written off when the balance is no longer considered to be collectible.
Sale of Receivables The sale of receivables is recognized when the Company transfers the financial asset and substantially all the risks and rewards of ownership of the asset to another entity. If the Company retains substantially all the risks and rewards of ownership of a transferred financial asset, the Company continues to recognize the financial asset and also recognizes a borrowing for the proceeds received.
46

LINAMAR CORPORATION Notes to Consolidated Financial Statements For the years ended December 31, 2013 and December 31, 2012 (in thousands of Canadian dollars, except where otherwise noted)
Financial Instruments A financial instrument is any contract that at the same time gives rise to a financial asset of one entity and a financial liability or equity instrument of another entity. Financial instruments are recognized as soon as the Company becomes a contracting party to the financial instrument. Financial instruments stated as financial assets or financial liabilities are generally not offset; they are only offset when a legal right to offset exists at that time and settlement on a net basis is intended.
Financial assets are classified into the following specified categories: financial assets “at fair value through profit or loss”, “held to maturity” investments, “available for sale” financial assets and “loans and receivables”. The classification depends on the nature and purpose of the financial assets and is determined at the time of initial recognition.
Financial liabilities are classified “at fair value through profit or loss” or “other financial liabilities”. Derivatives are initially recognized at fair value on the date a derivative contract is entered into and are subsequently re-measured at their fair value. The method of recognizing the resulting gain or loss depends on whether the derivative is designated as a hedging instrument, and if so, the nature of the item being hedged.
Classification and fair value of financial instruments: a) Financial assets at fair value through profit or loss are financial assets held for trading. A financial asset is classified in this
category if acquired principally for the purposes of selling in the short term. Derivatives are also categorized as held for trading unless they are designated as hedges. Assets in this category are classified as current assets if expected to be settled within 12 months; otherwise, they are classified as non-current. Financial assets carried at fair value through profit or loss are initially recognized, and subsequently carried at fair value, with changes recognized in net earnings. Transaction costs are expensed.
b) Loans and receivables are non-derivative financial assets with fixed or determinable payments that are not quoted in an active market. They are included in current assets, except for maturities greater than 12 months after the end of the reporting period. These are classified as non-current assets. The Company’s loans and receivables comprise cash and cash equivalents, accounts and other receivables and long-term receivables in the statement of financial position. They are recorded at cost, which upon their initial measurement is equal to their fair value. The carrying amounts of accounts and other receivables approximate their fair values due to the relatively short periods to maturity. Subsequent measurements on long-term receivables are recorded at amortized cost using the effective interest method.
c) Available-for-sale financial assets are non-derivatives that are either designated in this category or not classified in any of the other categories. They are included in non-current assets unless the investment matures or management intends to dispose of it within 12 months of the end of the reporting period. Investments are initially recognized at fair value plus transaction costs and are subsequently carried at fair value with changes recognized in other comprehensive earnings. Upon sale or impairment, the accumulated fair value adjustments recognized in other comprehensive earnings are included in net earnings.
d) Other financial liabilities include short-term bank borrowings, accounts payable and accrued liabilities and long-term debt. They are recorded at cost, which upon their initial measurement is equal to their fair value. The carrying amounts of accounts payable and accrued liabilities approximate their fair values due to the relatively short periods to maturity. Subsequent measurements of the long-term debt are recorded at amortized cost using the effective interest method. Debt issue and other transaction costs are netted against the carrying value of the long-term debt and are then amortized over the life of the debt using the effective interest rate method.
e) Cash flow hedges are derivative financial instruments measured at fair value at the end of each period with the gains or losses resulting from re-measurement recognized in other comprehensive earnings, with any ineffective portion recognized in net earnings.
f) Fair value hedges are derivative financial instruments measured at fair value at the end of each period with the gains or losses resulting from the re-measurement recognized in net earnings together with any changes in the fair value of the hedged asset or liability that are attributable to the hedged risk.
Fair Value Measurement The Company classifies fair value measurements using a fair value hierarchy that reflects the significance of the inputs used in making the measurements. The Level 1, 2 and 3 classifications utilized by the Company are defined as follows: Level 1 - Fair values are determined using inputs from quoted prices (unadjusted) in active markets for identical assets or
liabilities. Level 2 - Fair values are determined using inputs other than quoted prices included in Level 1 that are observable for the asset
or liability either directly or indirectly. Derivative financial instruments are valued based on observable market data.
47

LINAMAR CORPORATION Notes to Consolidated Financial Statements For the years ended December 31, 2013 and December 31, 2012 (in thousands of Canadian dollars, except where otherwise noted)
Level 3 - Fair values are determined based on inputs which are not based on observable market data.
The fair value hierarchy is used for all fair value measurement requirements. The Company recognizes transfers into and transfers out of fair value hierarchy levels as of the date of the event or change in circumstances that caused the transfer.
Hedge Accounting The Company documents at the inception of the hedging transaction the relationship between hedging instruments and hedged items, as well as its risk management objectives and strategy for undertaking various hedging transactions. The Company also documents its assessment, both at hedge inception and on an ongoing basis, of whether the derivatives that are used in hedging transactions are highly effective in offsetting changes in fair values or cash flows of hedged items. The Company applies hedge accounting for certain foreign exchange forward contracts and interest rate swaps as cash flow hedges. The Company applies hedge accounting for its long-dated foreign exchange forwards as either fair value hedges or as cash flow hedges. Amounts accumulated in other comprehensive earnings are reclassified to net earnings in the period in which the hedged transaction occurs. The fair values are determined based on observable market data. When a hedging instrument expires or is sold, or when a hedge no longer meets the criteria for hedge accounting, any cumulative gain or loss existing in accumulated other comprehensive income at that time remains in accumulated other comprehensive income until the forecasted transaction is eventually recognized in net earnings. When a forecasted transaction is no longer expected to occur, the cumulative gain or loss that was reported in accumulated other comprehensive income is immediately transferred to net earnings.
Inventories Inventories are valued at the lower of cost and net realizable value determined using the first-in, first-out (FIFO) method. The cost of finished goods and work in progress is comprised of material costs, direct labour costs and other direct costs and related production overheads (based on normal operating capacity). Net realizable value is the estimated selling price in the ordinary course of business, less estimated costs of completion and applicable variable selling expenses. The amount of inventories recognized as an expense during the period is shown as costs of sales. Impairment losses for inventories are recorded when the net realizable value is lower than cost. The impairment losses may be reversed if the circumstances which caused them no longer exist. Property, Plant and Equipment Property, plant and equipment are recorded at cost less accumulated amortization and impairment. Amortization of property, plant and equipment commences when they are ready for their intended use. Amortization is charged to earnings in amounts sufficient to depreciate the cost of property, plant and equipment over their estimated useful lives using the diminishing balance and straight-line methods as follows:
Land-use rights Straight-line over the life of the contract Buildings 5% diminishing balance Machinery Straight-line over 5 - 10 years or 15% - 20% diminishing balance Office equipment Straight-line over 2 - 3 years or 20% diminishing balance Transportation equipment 10% - 30% diminishing balance Tooling Straight-line over 1 year
Where components of more substantial assets have differing useful lives, these are depreciated separately. The assets' residual values, useful lives and amortization methods are reviewed, and adjusted if appropriate, at the end of each reporting period. Repair and maintenance costs are expensed as incurred, except where they serve to increase productivity or to prolong the useful life of an asset, in which case they are capitalized.
48

LINAMAR CORPORATION Notes to Consolidated Financial Statements For the years ended December 31, 2013 and December 31, 2012 (in thousands of Canadian dollars, except where otherwise noted)
Intangibles Intangible assets acquired through purchase are initially measured at cost. Intangible assets acquired through business combinations are initially measured at fair value at the date of acquisition. Amortization is charged to earnings in amounts sufficient to depreciate the cost of intangible assets over their estimated useful lives using the straight-line method or a units of production basis as follows:
Trade names Straight-line over 20 years Customer contracts Straight-line over the life of contract Customer relationships Straight-line over 12 years Enterprise resource planning (“ERP”) software Straight-line over 4 years Technology Straight-line over 10 years; or units of production basis Intellectual property Straight-line over 7 years
The assets' residual values, useful lives and amortization methods are reviewed, and adjusted if appropriate, at the end of each reporting period.
Goodwill Goodwill represents the excess of the cost of the acquisition over the fair value of the Company’s share of the net identifiable assets of the acquired subsidiary at the date of acquisition. Goodwill is not amortized but is reviewed for impairment annually, or more frequently when there is an indication of impairment..
Research and Development Research costs are expensed as incurred. Where the criteria under IFRS are met, development costs are accounted for as intangible assets and capitalized and amortized. Investment tax credits related to research and development are credited against the related qualifying expense or against the carrying amount of the related asset.
Start-up Costs All start-up costs, including pre-production and organization costs, are expensed as incurred.
Impairment of Non-Financial Assets For the purpose of impairment testing, goodwill is allocated to each of the Company’s (cash-generating unit or “CGU”) expected to benefit from the synergies of the combination. CGU’s to which goodwill has been allocated are tested for impairment annually, or more frequently when there is an indication that the unit may be impaired. At the end of each reporting period, the Company reviews the carrying amounts of its non-financial assets to determine whether there is any indication that those assets have suffered an impairment loss. If any such indication exists, the recoverable amount of the asset is estimated in order to determine the extent of the impairment loss (if any). Where it is not possible to estimate the recoverable amount of an individual asset, the assets are grouped at the lowest level for which there are separately identifiable cash inflows (CGU) and the Company estimates the recoverable amount at the CGU level. Where a reasonable and consistent basis of allocation can be identified, corporate assets are also allocated to individual CGU’s, or otherwise they are allocated to the smallest group of CGU’s for which a reasonable and consistent allocation basis can be identified. The recoverable amount is the higher of the fair value less costs of disposal or value in use. In assessing value in use, the estimated future cash flows are discounted to their present value using a pre-tax discount rate that reflects current market assessments of the time value of money and the risks specific to the asset for which the estimates of future cash flows have not been adjusted. If the recoverable amount of an asset (or CGU) is estimated to be less than its carrying amount, the full impairment loss is charged against earnings and the impairment loss is allocated first to reduce the carrying amount of any goodwill allocated to the CGU and then to the other assets of the unit on a pro-rata basis to the carrying amount of each asset in the unit. Where an impairment loss subsequently reverses, the carrying amount of the asset (or CGU) is increased to the revised estimate of its recoverable amount, but not in excess of the carrying amount that would have been determined had no impairment loss been recognized for the asset (or CGU) in prior years. A reversal of an impairment loss is recognized immediately in net earnings. Any impairment loss recognized for goodwill is not reversed in a subsequent period.
49

LINAMAR CORPORATION Notes to Consolidated Financial Statements For the years ended December 31, 2013 and December 31, 2012 (in thousands of Canadian dollars, except where otherwise noted)
Borrowing Costs Borrowing costs that are directly attributable to the acquisition, construction or production of qualified assets are capitalized as part of the acquisition costs of the qualified asset. All other borrowing costs are recognized in net earnings.
Leases Leases are classified as finance leases whenever the terms of the lease transfer substantially all the risks and rewards of ownership. All other leases are classified as operating leases. Company as a lessee The Company leases certain property, plant and equipment under both finance leases and operating leases. Payments made under operating leases are charged to net earnings on a straight-line basis over the period of the lease. Assets leased by the Company that qualify as finance leases are initially recognized as assets of the Company at their fair value at the inception of the lease or, if lower, at the present value of the minimum lease payments. The corresponding liability is included in the statement of financial position as a finance lease obligation. Lease payments under finance leases are allocated between finance charges and a reduction of the outstanding lease obligation. Finance charges are recognized immediately in net earnings, unless they are directly attributable to qualifying assets, in which case they are capitalized in accordance with the Company’s general policy on borrowing costs. The property, plant and equipment acquired under finance leases are depreciated over the shorter of the useful life of the asset and the lease term. Company as a lessor The Company leases certain industrial access products to customers under both finance leases and operating leases. Amounts due from lessees under operating lease arrangements are recognized as revenue over the course of the lease arrangement. Contingent rents are recognized as revenue in the period in which they are earned. Amounts due from lessees under finance lease arrangements are recognized as receivables at the amount of the Company’s net investments in the leases. Finance lease income is allocated to accounting periods so as to reflect a constant rate of return on the Company’s net investment outstanding.
Government Grants Grants from the government are recognized at their fair value where there is a reasonable assurance that the grant will be received and the Company will comply with all attached conditions. The benefit of a government loan at a below-market rate of interest is treated as a government grant, measured as the difference between proceeds received and the fair value of the loan based on prevailing market interest rates. Government grants relating to costs are deferred and recognized in net earnings over the period necessary to match them with the costs that they are intended to compensate. These government grants are presented as a reduction of the related expense. Government grants relating to property, plant and equipment are recognized as a reduction in the carrying amount of the related asset.
Provisions Provisions are recognized when the Company has a present obligation (legal or constructive) as a result of a past event, it is probable that the Company will be required to settle the obligation, and a reliable estimate can be made of the amount of the obligation. The amount recognized as a provision is the best estimate of the consideration required to settle the present obligation at the end of the reporting period, taking into account the risks and uncertainties surrounding the obligation. Where a provision is measured using the cash flows estimated to settle the present obligations, its carrying amount is the present value of those cash flows. The increase in the provision due to passage of time is recognized as interest expense. A provision for warranties is recognized when the underlying products or services are sold. The provision is based on historical warranty data and a weighting of all possible outcomes against their associated probabilities.
50

LINAMAR CORPORATION Notes to Consolidated Financial Statements For the years ended December 31, 2013 and December 31, 2012 (in thousands of Canadian dollars, except where otherwise noted)
A provision for restructuring costs is recognized when the Company has a detailed formal plan for the restructuring and has notified the affected parties.
Pension Costs The Company has various contributory and non-contributory defined contribution pension plans which cover most employees. The Company pays these contributions to a privately administered pension insurance plan after which the Company incurs no further payment obligations. The contributions are accrued and recognized as employee benefit expense when they are due.
Taxation Income tax expense represents the sum of the tax currently payable and deferred tax. Current tax The tax currently payable is based on taxable earnings for the reporting period. Taxable earnings differs from earnings as reported in the consolidated statement of earnings because of items of income or expense that are taxable or deductible in other years and items that are never taxable or deductible. The Company’s liability for current tax is calculated using tax rates that have been enacted or substantively enacted by the end of the reporting period, in each jurisdiction that the Company operates in. Deferred tax Deferred tax is recognized on temporary differences between the carrying amounts of assets and liabilities in the financial statements and the corresponding tax bases used in the computation of taxable earnings. Deferred tax liabilities are generally recognized for all taxable temporary differences. Deferred tax assets are generally recognized for all deductible temporary differences to the extent that it is probable that taxable earnings will be available against which those deductible temporary differences can be utilized. Such deferred tax assets and liabilities are not recognized if the temporary difference arises from goodwill. Deferred income tax is provided on temporary differences arising on investments in subsidiaries and associates, except in the case of subsidiaries, where the timing of the reversal of the temporary difference is controlled by the Company, and it is probable that the temporary differences will not reverse in the foreseeable future. Deferred tax assets arising from deductible temporary differences associated with such investments and interests are only recognized to the extent that it is probable that there will be sufficient taxable earnings against which to utilize the benefits of the temporary differences and they are expected to reverse in the foreseeable future. The carrying amount of deferred tax assets is reviewed at the end of each reporting period and reduced to the extent that it is no longer probable that sufficient taxable earnings will be available to allow all or part of the asset to be recovered. Deferred tax assets and liabilities are measured at the tax rates that are expected to apply in the period in which the liability is settled or the asset realized, based on tax rates (and tax laws) that have been enacted or substantively enacted by the end of the reporting period. The measurement of deferred tax liabilities and assets reflects the tax consequences that would follow from the manner in which the Company expects, at the end of the reporting period, to recover or settle the carrying amount of its assets and liabilities. Deferred tax assets and liabilities are offset when there is a legally enforceable right to offset current tax assets against current tax liabilities and when they relate to income taxes levied by the same taxation authority and the Company intends to settle its current tax assets and liabilities on a net basis. Current and deferred tax for the period Current and deferred tax are recognized as an expense or income in net earnings, except when they relate to items that are recognized outside net earnings (whether in other comprehensive earnings or directly in equity), in which case the tax is also recognized outside net earnings, or where they arise from the initial accounting for a business acquisition. In the case of a business acquisition, the tax effect is included in the accounting for the business acquisition.
51

LINAMAR CORPORATION Notes to Consolidated Financial Statements For the years ended December 31, 2013 and December 31, 2012 (in thousands of Canadian dollars, except where otherwise noted)
Revenue Recognition Revenue from the sale of products is recognized when the risks and rewards incidental to ownership are transferred. This generally corresponds to when goods are shipped to customers. Revenue from services is recognized when services are rendered. Revenue from the sale of tooling is recognized once the tooling is substantially complete and the customer approves the initial production sample. Engineering services are accounted for as a separate revenue element only in circumstances where the engineering has value to the customer on a standalone basis. Revenues from significant engineering services contracts that qualify as separate revenue elements are recognized on a percentage of completion basis. Percentage of completion is generally determined based on the proportion of accumulated expenditures to date as compared to total anticipated expenditures.
Share-based Compensation Under the Company’s share-based compensation plan, the Company with the approval of the Board of Directors may grant equity-settled stock options and, if they so choose, tandem share appreciation rights (“SARs”) to its key employees and directors. The Company recognizes a compensation expense for stock options granted and measures the compensation expense at fair value calculated on the grant date using the Black-Scholes option pricing model. The expense is recognized on a graded-vesting basis in which the fair value of each tranche is recognized over its respective vesting period when all of the specified vesting conditions are satisfied.
Accumulated Other Comprehensive Earnings Reserves Hedging reserve The cash flow hedge reserve contains the effective portion of the cash flow hedge relationships incurred as at the reporting date. Cumulative translation adjustment The cumulative translation adjustment reserve is used to record exchange differences arising from the translation of the financial statements of foreign subsidiaries.
4 Changes in Accounting Policies
New Standards and Amendments Adopted The following new standards and amendments became effective during the current fiscal year or were adopted during the current fiscal year. The adoption of these new standards and amendments did not impact the Company’s net earnings or financial position. IFRS 7 Financial Instruments: Disclosures Effective for interim and annual financial statements relating to fiscal years beginning on or after January 1, 2013, the IASB issued further disclosures required that will enable users of financial statements to evaluate the effect or potential effect of netting arrangements including rights of set-off associated with an entity’s recognized financial assets and recognized financial liabilities, on the entity’s financial position. IFRS 10 Consolidated Financial Statements Effective for interim and annual financial statements relating to fiscal years beginning on or after January 1, 2013 the IASB issued a new standard to replace IAS 27 Consolidation and separate financial statements and SIC 12 Consolidation – special purpose entities. This new standard revises the definition of control to focus on the need for power and variable returns. IFRS 11 Joint Arrangements
Effective for interim and annual financial statements relating to fiscal years beginning on or after January 1, 2013 the IASB issued a new standard to replace the IAS 31 Interests in joint ventures. This new standard reduces the joint arrangements definition to joint operations and joint ventures and restricts joint venture recognition to equity accounting method.
52

LINAMAR CORPORATION Notes to Consolidated Financial Statements For the years ended December 31, 2013 and December 31, 2012 (in thousands of Canadian dollars, except where otherwise noted)
IFRS 12 Disclosures of Interests in Other Entities Effective for interim and annual financial statements relating to fiscal years beginning on or after January 1, 2013 the IASB issued a new standard to replace the requirements in IAS 28 Investments in associates. This new standard provides guidance on the required disclosures to assist users in evaluating the nature, risk and financial impact of subsidiaries, associates, joint arrangements and unconsolidated structure entities. IAS 1 Financial Statement Presentation Effective for interim and annual financial statements relating to fiscal years beginning on or after July 1, 2012 the IASB issued amendments regarding presentation of other comprehensive earnings on the statement of other comprehensive earnings based on whether the item is recycled to earnings in the future. IFRS 13 Fair Value Measurements Effective for interim and annual financial statements relating to fiscal years beginning on or after January 1, 2013 the IASB issued a new standard to define fair value, provide a framework for measuring fair value and disclosure requirements for fair value. IFRS 13 will be applied in most cases when another IFRS requires fair value measurement. IFRS 13 Fair Value Measurement has been further amended as part of the Annual Improvements 2011-2013 Cycle, issued by the IASB in November 2012. The amendment is effective for interim and annual financial statements relating to fiscal years beginning on or after July 1, 2014. However, an entity shall apply the amendment prospectively from the beginning of the first annual period in which IFRS 13 is applied. The IASB amended this standard to clarify the portfolio exemption in IFRS 13. As IFRS 13 is effective for the Company on January 1, 2013, this amendment was applied prospectively at the same time. IAS 36 Impairment of Assets Effective for interim and annual financial statements relating to fiscal years beginning on or after January 1, 2014, the IASB amended this standard to address the disclosure of information about the recoverable amount of impaired assets if that amount is based on fair value less costs of disposal. Early adoption was available and the Company adopted these amendments for the current fiscal year. IAS 19 Employee Benefits Effective for interim and annual financial statements relating to fiscal years beginning on or after January 1, 2013 the IASB issued amendments regarding recognition and measurement of defined benefit pension plans, definition and recognition of termination benefits and disclosure requirements. The following standards have been amended to reflect Annual Improvements 2009-2011 Cycle, issued by the IASB in May 2012:
IFRS 1 First-time Adoption of International Financial Reporting Standards Effective for interim and annual financial statements relating to fiscal years beginning on or after January 1, 2013, the IASB issued amendments to allow for the repeat application of IFRS 1. IAS 1 Presentation of Financial Statements Effective for interim and annual financial statements relating to fiscal years beginning on or after January 1, 2013, the IASB amended this standard to clarify the requirements for providing comparative information in the financial statements. IAS 16 Property, Plant and Equipment Effective for interim and annual financial statements relating to fiscal years beginning on or after January 1, 2013, the IASB amended this standard to clarify classification requirements for servicing equipment. IAS 32 Financial Instruments: Presentation Effective for interim and annual financial statements relating to fiscal years beginning on or after January 1, 2013, the IASB amended this standard to clarify the income tax consequences of distributions to holders of an equity instrument and of transaction costs of an equity transaction.
53

LINAMAR CORPORATION Notes to Consolidated Financial Statements For the years ended December 31, 2013 and December 31, 2012 (in thousands of Canadian dollars, except where otherwise noted)
IAS 34 Interim Financial Reporting Effective for interim and annual financial statements relating to fiscal years beginning on or after January 1, 2013, the IASB amended this standard to clarify the requirements on segment information for total assets and liabilities for each reporting segment. The standard was also amended to require disclosures about fair value of financial instruments.
New Standards and Interpretations Not Yet Adopted At the date of authorization of these financial statements, certain new standards, amendments and interpretations to existing standards have been published but are not yet effective, and have not been adopted early by the Company. Management anticipates that all of the pronouncements will be adopted in the Company's accounting policies for the first period beginning after the effective date of the pronouncement. Information on new standards, amendments and interpretations that are expected to be relevant to the Company’s financial statements is provided below. Certain other new standards and interpretations have been issued but are not expected to have a material impact on the Company's financial statements. IFRS 9 Financial Instruments and IFRS 7 Financial Instruments: Disclosures IFRS 9 was a previously issued new standard to partially replace IAS 39 Financial Instruments: Recognition and Measurement. Originally it was to be effective for interim and annual financial statements relating to fiscal years beginning on or after January 1, 2013, but the IASB has changed the mandatory effective date and included additional disclosures about its initial adoption. The mandatory effective date of IFRS 9 has been changed to annual periods beginning on or after January 1, 2015. In November 2013, the IASB has made further amendments regarding hedge accounting and regarding the impacts of an entity’s own credit risk on liabilities elected to be measured at fair value. Disclosures that illustrate the effect of adopting IFRS 9 have been added to IFRS 7. The amendments to IFRS 7 have been incorporated into Appendix C of IFRS 9. Further chapters dealing with impairment methodology are still being developed. Because the impairment phase of the IFRS 9 project has not yet been completed, the IASB decided that a mandatory date of January 1, 2015 would not allow sufficient time for entities to prepare to apply the new standard. Therefore, a new date should be decided upon when the entire IFRS 9 project is closer to completion. Management is currently assessing the impact that these amendments will have on the financial statements of the Company. However, they do not expect to implement the amendments until all chapters of the IAS 39 replacement have been published and they can comprehensively assess the impact of all changes. IAS 19 Employee Benefits Effective for interim and annual financial statements relating to fiscal years beginning on or after July 1, 2014, the IASB amended this standard for contributions from employees or third parties to defined benefit plans. The objective of the amendments is to simplify the accounting for contributions that are independent of the number of years of employee service. The Company does not anticipate a significant impact to the financial statements related to these amendments. IAS 32 Financial Instruments: Presentation Effective for interim and annual financial statements relating to fiscal years beginning on or after January 1, 2014, the IASB amended this standard in regards to offsetting financial assets and financial liabilities to clarify the meaning of the offsetting criterion “currently has a legally enforceable right to set off” and the principle behind net settlement, including identifying when some gross settlement systems may be considered equivalent to net settlement. The Company does not anticipate a significant impact to the financial statements related to these amendments. IAS 39 Financial Instruments: Recognition and Measurement Effective for interim and annual financial statements relating to fiscal years beginning on or after January 1, 2014, the IASB amended this standard to allow hedge accounting to continue in a situation where a derivative, which has been designated as a hedging instrument, is novated to effect clearing with a central counterparty as a result of laws or regulation. The Company does not anticipate a significant impact to the financial statements related to these amendments. IFRIC 21 Accounting for Levies Imposed by Governments Effective for interim and annual financial statements relating to fiscal years beginning on or after January 1, 2014, an interpretation was issued which clarifies that the obligating event giving rise to a liability to pay a levy is the activity described in the relevant legislation that triggers the payment of the levy. The Company does not anticipate a significant impact to the financial statements related to this interpretation.
54
LINAMAR CORPORATION Notes to Consolidated Financial Statements For the years ended December 31, 2013 and December 31, 2012 (in thousands of Canadian dollars, except where otherwise noted)
The following standards have been amended to reflect Annual Improvements 2010-2012 Cycle, issued by the IASB in May 2012:
IFRS 2 Share-based Payments Effective for share-based payment transactions for which the grant dated is on or after July 1, 2014, the IASB amended this standard to clarify the definition of a vesting condition and separately defines ‘performance condition’ and ‘service condition’. The Company does not anticipate a significant impact to the financial statements related to these amendments. IFRS 3 Business Combinations Effective for business combinations where the acquisition date is on or after July 1, 2014, the IASB amended this standard to clarify contingent consideration in a business combination. The Company does not anticipate a significant impact to the financial statements related to these amendments. IFRS 8 Operating Segments Effective for interim and annual financial statements relating to fiscal years beginning on or after July 1, 2014, the IASB amended this standard to require disclosure of the judgements made by management in aggregating operating segments along with the requirement to include a reconciliation of segment assets to the entity’s assets when segment assets are reported. The Company does not anticipate a significant impact to the financial statements related to these amendments. IFRS 16 Property, Plant and Equipment and IAS 38 Intangible Assets Effective for interim and annual financial statements relating to fiscal years beginning on or after July 1, 2014, the IASB amended these standards to clarify how the gross carrying amount and the accumulated depreciation are treated where an entity uses the revaluation model. The Company does not anticipate a significant impact to the financial statements related to these amendments.
IAS 24 Related Party Disclosures Effective for interim and annual financial statements relating to fiscal years beginning on or after July 1, 2014, the IASB amended this standard to include, as a related party, an entity that provides key management personnel services to the reporting entity. The Company does not anticipate a significant impact to the financial statements related to these amendments.
The following standards have been amended to reflect Annual Improvements 2011-2013 Cycle, issued by the IASB in November 2012:
IFRS 3 Business Combinations Effective for interim and annual financial statements relating to fiscal years beginning on or after July 1, 2014, the IASB amended this standard to clarify the scope exemption for joint arrangements. The Company does not anticipate a significant impact to the financial statements related to these amendments. IAS 40 Investment Property Effective for interim and annual financial statements relating to fiscal years beginning on or after July 1, 2014, the IASB amended this standard to clarify the interrelationship between IFRS 3 and IAS 40 when classifying property as investment property or owner-occupied property. The Company does not anticipate a significant impact to the financial statements related to these amendments.
55

LINAMAR CORPORATION Notes to Consolidated Financial Statements For the years ended December 31, 2013 and December 31, 2012 (in thousands of Canadian dollars, except where otherwise noted)
5 Critical Accounting Estimates and Judgments The preparation of financial statements in conformity with IFRS requires management to make estimates and judgements about the future. Estimates and judgements are continually evaluated and are based on the historical experience and other factors, including expectations of future events that are believed to be reasonable under the circumstances. Actual results could differ from those estimates under different assumptions or conditions. The following discussion sets forth management’s most critical estimates and assumptions in determining the value of assets and liabilities and most critical judgements in applying accounting policies that have a significant risk of causing a material adjustment to the carrying amounts of assets and liabilities within the next year.
Impairment of Non-Financial Assets Management assesses goodwill and non-financial assets for impairment based on the accounting policies stated in Note 3. The Company believes that the estimate of impairment for goodwill and non-financial assets is a “critical accounting estimate” because management is required to make significant forward looking assumptions. The recoverable amounts of CGU’s have been determined based on the higher of fair value less costs of disposal or value in use calculations, which require the use of estimates. Uncertain changes in the discount rate used, and forward looking assumptions regarding improvement plans, costing assumptions, timing of program launches, and production volumes may affect the fair value of estimates used. No known trends, commitments, events or other uncertainties are currently believed to materially affect the assumptions used with the exception of the length and extent of the current economic conditions that are impacting the overall global economy.
Current Income Taxes The Company is subject to income taxes in numerous jurisdictions where it has foreign operations. Significant judgement is required in determining the worldwide provision for income taxes. There are many transactions and calculations for which the ultimate tax determination is uncertain. The Company recognizes liabilities for anticipated tax audit issues based on estimates of whether additional taxes will be due. Where the final tax outcome of these matters is different from the amounts that were initially recorded, such differences will impact the current and deferred income tax assets and liabilities in the period in which such determination is made.
Deferred Income Tax Assets and Liabilities Deferred income tax assets and liabilities result from timing differences between the financial reporting and tax bases of assets and liabilities. Loss carry forwards also comprise a portion of the temporary differences and result in a deferred income tax asset. Deferred income tax assets are only recognized to the extent that management considers it probable that a deferred income tax asset will be realized. The assessment for the recognition of a deferred tax asset requires significant judgement. The factors used to assess the likelihood of realization are the Company’s forecast of future taxable income and available tax planning strategies that could be implemented to realize the deferred tax assets. The Company has and continues to use tax planning strategies to realize deferred tax assets in order to avoid the potential loss of benefits. Unknown future events and circumstances, such as changes in tax rates and laws, may materially affect the assumptions and estimates made from one period to the next. Any significant change in events, tax laws, and tax rates beyond the control of the Company may materially affect the consolidated financial statements.
Useful Lives of Depreciable Assets Due to the significance of property, plant and equipment on the Company’s statement of financial position, the Company considers the amortization policy relating to property, plant and equipment to be a “critical accounting estimate”. The Company considers the expected useful life of the assets, expected residual value, and contract length when setting the amortization rates of its assets. Judgement is involved when establishing these estimates as such factors as technological innovation, maintenance programs, and relevant market information must be taken into consideration. The assets’ residual values, useful lives and amortization methods are reviewed at the end of each reporting period and are adjusted if expectations differ from previous estimates. If circumstances impacting these assumptions and estimates change, the change in accounting estimates may represent a material impact to the consolidated financial statements.
56
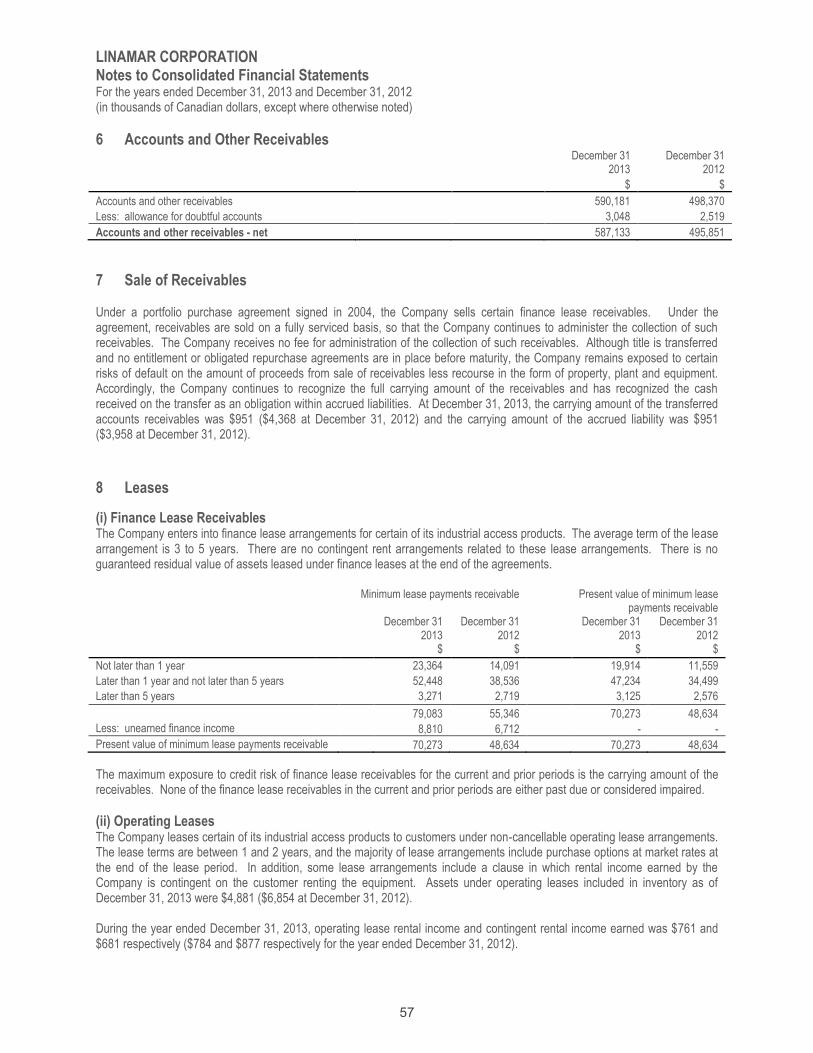
LINAMAR CORPORATION Notes to Consolidated Financial Statements For the years ended December 31, 2013 and December 31, 2012 (in thousands of Canadian dollars, except where otherwise noted)
6 Accounts and Other Receivables
December 31
2013 December 31
2012
$ $
Accounts and other receivables 590,181 498,370
Less: allowance for doubtful accounts 3,048 2,519
Accounts and other receivables - net 587,133 495,851
7 Sale of Receivables Under a portfolio purchase agreement signed in 2004, the Company sells certain finance lease receivables. Under the agreement, receivables are sold on a fully serviced basis, so that the Company continues to administer the collection of such receivables. The Company receives no fee for administration of the collection of such receivables. Although title is transferred and no entitlement or obligated repurchase agreements are in place before maturity, the Company remains exposed to certain risks of default on the amount of proceeds from sale of receivables less recourse in the form of property, plant and equipment. Accordingly, the Company continues to recognize the full carrying amount of the receivables and has recognized the cash received on the transfer as an obligation within accrued liabilities. At December 31, 2013, the carrying amount of the transferred accounts receivables was $951 ($4,368 at December 31, 2012) and the carrying amount of the accrued liability was $951 ($3,958 at December 31, 2012).
8 Leases
(i) Finance Lease Receivables The Company enters into finance lease arrangements for certain of its industrial access products. The average term of the lease arrangement is 3 to 5 years. There are no contingent rent arrangements related to these lease arrangements. There is no guaranteed residual value of assets leased under finance leases at the end of the agreements. Minimum lease payments receivable Present value of minimum lease
payments receivable
December 31
2013 December 31
2012 December 31
2013 December 31
2012
$ $ $ $
Not later than 1 year 23,364 14,091 19,914 11,559
Later than 1 year and not later than 5 years 52,448 38,536 47,234 34,499
Later than 5 years 3,271 2,719 3,125 2,576
79,083 55,346 70,273 48,634
Less: unearned finance income 8,810 6,712 - -
Present value of minimum lease payments receivable 70,273 48,634 70,273 48,634
The maximum exposure to credit risk of finance lease receivables for the current and prior periods is the carrying amount of the receivables. None of the finance lease receivables in the current and prior periods are either past due or considered impaired.
(ii) Operating Leases The Company leases certain of its industrial access products to customers under non-cancellable operating lease arrangements. The lease terms are between 1 and 2 years, and the majority of lease arrangements include purchase options at market rates at the end of the lease period. In addition, some lease arrangements include a clause in which rental income earned by the Company is contingent on the customer renting the equipment. Assets under operating leases included in inventory as of December 31, 2013 were $4,881 ($6,854 at December 31, 2012). During the year ended December 31, 2013, operating lease rental income and contingent rental income earned was $761 and $681 respectively ($784 and $877 respectively for the year ended December 31, 2012).
57

LINAMAR CORPORATION Notes to Consolidated Financial Statements For the years ended December 31, 2013 and December 31, 2012 (in thousands of Canadian dollars, except where otherwise noted)
The future minimum lease payments receivable were as follows:
December 31
2013 December 31
2012
$ $
Not later than 1 year 382 611
Later than 1 year and not later than 5 years 331 142
713 753
9 Inventories
December 31
2013 December 31
2012
$ $
General stores 82,401 80,451
Raw materials 125,330 128,886
Work-in-process 76,131 107,225
Finished goods 96,420 102,611
380,282 419,173
The cost of inventories recognized as an expense during the year ended December 31, 2013 was $2,671,312 (2012 - $2,527,836). A provision for obsolescence for slow moving inventory items is estimated by management based on historical and expected future sales and is included in cost of goods sold. Lower of cost or net realizable value adjustments are made on a regular basis. In the year ended December 31, 2013 the Company recognized a charge to cost of goods sold for the write-down of slow moving and obsolete inventory, and adjustments to net realizable value aggregating $19,912 (2012 - $11,437). In the year ended December 31, 2013 the Company recognized a gain to cost of goods sold for reversal of inventory provisions with a value of $263 (2012 – $637). The inventory balance has been reduced by a provision of $39,759 as at December 31, 2013 ($27,350 as at December 31, 2012).
58

LINAMAR CORPORATION Notes to Consolidated Financial Statements For the years ended December 31, 2013 and December 31, 2012 (in thousands of Canadian dollars, except where otherwise noted)
10 Income Taxes
(i) Income Tax Recognized in Net Earnings 2013 2012
$ % $ %
Earnings before taxes from continuing operations 290,559 188,183
Combined basic Canadian Federal and Ontario Provincial income taxes, including manufacturing and processing reduction 72,640 25.00% 47,045 25.00%
Increase (decrease) in income taxes resulting from:
Rate changes on deferred income taxes (1,132) -0.39% (118) -0.06%
Effect of expenses that are not deductible in determining taxable earnings 2,047 0.70% 1,836 0.98%
Effect of unused tax losses not recognized as deferred tax assets 4,200 1.45% 719 0.38%
Effect of previously unrecognized deferred tax assets (4,370) -1.50% (1,628) -0.87% Effect of different tax rates of subsidiaries operating in other jurisdictions (7,227) -2.49% (6,863) -3.65% Adjustments recognized in the current year in relation to the current tax of prior years (3,840) -1.32% - -
Non-taxable gain on a bargain purchase (2,129) -0.73% - -
Other 581 0.19% 1,090 0.58%
Income tax expense and effective income tax rate 60,770 20.91% 42,081 22.36%
Current tax 58,381 43,990
Deferred tax 2,389 (1,909)
Income tax expense 60,770 42,081
The tax rate used in the reconciliation above is the Canadian corporate tax rate of 25.0% (2012 – 25.0%). Deferred income tax recovery directly recognized in equity for the year was $788 (2012 – expense of $1,015).
(ii) Deferred Tax Balances
December 31
2013 December 31
2012
$ $
Tax benefit of tax credits and loss carry forwards 35,378 34,473
Goodwill deductible for tax 2,829 3,237
Tax benefit (liability) of derivative financial instruments 174 (620)
Other assets - tax value in excess of book value 21,759 20,442
Cumulative tax amortization in excess of book amortization (71,507) (64,040)
Other liabilities - book value in excess of tax value (7,535) (10,516)
Deferred tax net position (18,902) (17,024)
Reconciliation of deferred tax net balance: 2013 2012
$ $
At January 1 (17,024) (14,128)
Tax recovery (expense) during the period recognized in earnings (2,389) 1,909
Tax recovery (expense) during the period recognized in other comprehensive income 788 (1,015)
Net tax benefit of tax credits earned (received) in the year (922) (4,346)
Impact of foreign currency translation adjustment 3,768 167
Net tax liability related to business acquisition (3,609) -
Other 486 389
At December 31 (18,902) (17,024)
59

LINAMAR CORPORATION Notes to Consolidated Financial Statements For the years ended December 31, 2013 and December 31, 2012 (in thousands of Canadian dollars, except where otherwise noted)
Net deferred tax balances in the statement of financial position are comprised of the following:
December 31
2013 December 31
2012
$ $
Deferred tax assets to be recovered after more than 12 months 62,262 56,615
Deferred tax assets to be recovered within 12 months 4,443 5,344
Total deferred tax assets 66,705 61,959
Deferred tax liabilities to be recovered after more than 12 months (83,412) (76,429)
Deferred tax liabilities to be recovered within 12 months (2,195) (2,554)
Total deferred tax liabilities (85,607) (78,983)
Deferred tax balances (net) (18,902) (17,024)
Deferred tax assets are recognized for tax loss carry-forwards to the extent that the realization of the related tax benefit through future taxable profits is probable. The ability to realize the tax benefits of these losses is dependent upon a number of factors, including the future profitability of operations in the jurisdictions in which the tax losses arose. Unrecognized deferred tax assets were as follows:
December 31
2013 December 31
2012
$ $
Tax losses 8,610 1,941
Unused tax credits 3,100 3,549
Temporary differences 7,142 6,753
Total deferred tax assets not recognized 18,852 12,243
No deferred tax is recognized on the unremitted earnings of non-Canadian subsidiaries to the extent that the Company is able to control the timing of the reversal of the temporary differences, and it is probable that the temporary differences will not reverse in the foreseeable future. The temporary difference in respect of the amount of undistributed earnings of non-Canadian subsidiaries was approximately $271,461 (2012 - $213,166). 11 Financial Instruments The financial instrument measurement classification of financial assets and financial liabilities were as follows:
December 31, 2013
December 31, 2012 Subsequent Carrying Value Fair Value Carrying Value Fair Value Classification Measurement $ $ $ $
Loans and receivables Cash and cash equivalents Amortized cost (Level 1) 129,843 129,843 81,574 81,574 Accounts and other receivables Amortized cost (Level 2) 587,133 587,133 495,851 495,851 Long-term receivables Amortized cost (Level 2) 86,337 87,521 48,634 51,445 Fair value through other comprehensive loss Derivative financial instruments Fair value (Level 2) 3,464 3,464 - -
Total Financial Assets 806,777 807,961 626,059 628,870
Fair value through other comprehensive loss Derivative financial instruments Fair value (Level 2) - - 1,641 1,641 Other financial liabilities Accounts payable and accrued liabilities Amortized cost (Level 2) 597,589 597,589 527,214 527,214 Long-term debt Amortized cost (Level 2) 543,581 574,012 719,069 736,213
Total Financial Liabilities 1,141,170 1,171,601 1,247,924 1,265,068
All fair value disclosures for financial assets and financial liabilities are recurring fair value measurements. The fair value of cash and cash equivalents, accounts and other receivables and accounts payable and accrued liabilities approximates their carrying values due to the short-term maturities of these instruments. The fair value of the derivative financial instruments, long-term receivables and long-term debt are determined by using valuation techniques. These valuation techniques maximize the use of observable market data where it is available and rely as little as possible on entity specific estimates. If all significant inputs
60

LINAMAR CORPORATION Notes to Consolidated Financial Statements For the years ended December 31, 2013 and December 31, 2012 (in thousands of Canadian dollars, except where otherwise noted)
required to fair value an instrument are observable, the instrument is included in Level 2. If one or more of the significant inputs is not based on observable market data, the instrument is included in Level 3. There were no transfers between Level 1 and Level 2 during the year. Specific valuation techniques used to value financial instruments include:
a) Quoted market prices for similar instruments; b) The fair value of interest rate swaps is calculated as the present value of the estimated future cash flows based on
observable yield curves; c) The fair value of forward foreign exchange contracts is determined using forward exchange rates at the reporting date; d) Other techniques, such as discounted cash flow analysis, are used to determine fair value for the remaining financial
instruments.
Derivative Financial Instruments (“Derivatives”) The Company uses derivatives as part of its risk management program to mitigate variability associated with changing market values related to the hedged item. Some of the derivatives used meet hedge effectiveness criteria and are designated in a hedge accounting relationship. Certain derivatives are designated as either hedges of the fair value of recognized assets or liabilities (“fair value hedges”) or hedges of highly probable forecasted transactions and firm commitments (“cash flow hedges”). Some of the derivatives are effective in achieving the Company’s risk management objectives; however they do not meet the strict hedge effectiveness criteria. These derivatives are considered to be “non-hedge” derivatives.
Summary of Derivatives December 31, 2013 Cash Flow Hedge Fair Value Hedge Marked to Market
Fair Value
(notional values in foreign currency) $ $ CAD$
(i) US dollar interest payment forward contracts 77,948 USD - 3,464
(ii) US dollar debt principal forward contracts 260,000 USD 40,000 USD (1,938)
Summary of Derivatives December 31, 2012 Cash Flow Hedge Fair Value Hedge Marked to Market
Fair Value
(notional values in foreign currency) $ $ CAD$
(i) US dollar interest payment forward contracts 91,143 USD - (576)
(ii) US dollar debt principal forward contracts 260,000 USD 40,000 USD (13,557)
(iii) Interest rate swap contracts 60,000 USD - (1,065)
(i) US Dollar Interest Payment Forward Contracts
Cash Flow Hedges In 2012, the Company entered into a series of forward exchange contracts to lock in the exchange rate on the semi-annual coupon payments on the USD $130 million of senior unsecured Notes due 2021. The forward exchange contracts have been designated as cash flow hedges for accounting purposes. In 2011, the Company entered into a series of forward exchange contracts to lock in the exchange rate on the semi-annual coupon payments on the USD $130 million of senior unsecured Notes due 2017. The forward exchange contracts have been designated as cash flow hedges for accounting purposes. Further terms of the forward exchange contracts are disclosed in Note 17.
(ii) US Dollar Debt Principal Forward Contracts
Cash Flow Hedges In 2011, the Company completed the placement of USD $130 million of senior unsecured Notes due 2021. During the first quarter of 2012, the Company entered into a long-dated forward exchange contract to lock in the exchange rate on the principal repayment component upon maturity of the Notes and to hedge the effective changes in exchange rates. The long-dated forward exchange contracts have been designated as cash flow hedges for accounting purposes.
61

LINAMAR CORPORATION Notes to Consolidated Financial Statements For the years ended December 31, 2013 and December 31, 2012 (in thousands of Canadian dollars, except where otherwise noted)
In 2010, the Company completed the placement of USD $130 million of senior unsecured Notes due 2017. During the first quarter of 2011, the Company entered into a long-dated forward exchange contract to lock in the exchange rate on the principal repayment component upon maturity of the Notes and to hedge the effective changes in exchange rates. The long-dated forward exchange contracts have been designated as cash flow hedges for accounting purposes. Fair Value Hedges The Company elected to apply hedge accounting to its long-dated foreign exchange forward contract on USD $40 million of senior unsecured Notes due 2014 which is accounted for as a fair value hedge. As at December 31, 2013, the contract in place matures in 2014. This derivative is measured at fair value at the end of each period and the gains or losses resulting from this measurement are recognized in net earnings. To the extent that the hedge is effective, the gains or losses resulting from the measurement of the derivative designated as the hedging item offsets the hedged risk attributable to the hedged item. For the year ending December 31, 2013, the Company recognized an effective portion on the derivative designated as the hedging item of a gain of $2,748 (2012 loss - $884). The ineffective portion of the hedging item amounted to a loss of $249 (2012 gain - $312), net of $89 (2012 - $113) in related income taxes. Further terms of the long-dated foreign exchange forward contracts are disclosed in Note 17.
(iii) Interest Rate Swap Contracts
Cash Flow Hedges During 2008 the Company entered into an interest rate swap transaction in the amount of $60 million, which matured during the year. This transaction involves a swap of interest payments from a three month Canadian Bankers Acceptance floating interest rate to fixed interest rates. The swap transaction is completely independent from and has no direct effect on the relationship between the Company and its lenders. The interest rate swap was considered ineffective as its maturity date was greater than the maturity date of the then revolving credit facility in place at the time the swap was entered into. Further terms of the interest rate swap transaction are disclosed in Note 17.
The cash flow hedge gains (losses) were as follows:
Derivatives in cash flow hedging
Amount of gain/(loss) recognized in other
comprehensive earnings
Amount of gain/(loss) reclassified from other comprehensive
earnings to earnings (effective portion)
Amount of gain/(loss) recognized in
earnings (ineffective portion)
$ relationships $ $
(i) Interest payment forward contracts 3,705 - - (ii) Principal forward contracts 10,980 (17,862) - (iii) Interest rate swap contracts 1,065 (1,065) 1,065
Year Ended December 31, 2013 15,750 (18,927) 1,065
(i) Interest payment forward contracts (644) 13 - (ii) Principal forward contracts 577 4,134 - (iii) Interest rate swap contracts 1,278 (1,278) 1,278
Year Ended December 31, 2012 1,211 2,869 1,278
Any gains or losses are recognized through finance expenses. There are controls in place to detect the holding or issuance of derivative financial instruments for trading or speculative purposes.
Financial Risk Management Foreign Exchange Risk The Company operates in several different geographical regions in the world and has many business arrangements with customers and suppliers also based in different geographical regions. The Company therefore is impacted by changes in foreign exchange rates. These foreign exchange rate changes affect net sales and expenses based in foreign currencies and the translation of monetary balances in relation to functional currencies.
62

LINAMAR CORPORATION Notes to Consolidated Financial Statements For the years ended December 31, 2013 and December 31, 2012 (in thousands of Canadian dollars, except where otherwise noted)
Approximate Foreign Exchange Exposure as related to the following currencies : December 31
2013 December 31
2012
Euro activity 55.3% 27.5% Mexican peso activity 33.0% 4.4% U.S. dollar activity 5.0% 66.2% Korean won activity 1.8% 0.5%
The Company has foreign operations with the following functional currencies that differ from the parent: Hungarian forint, Mexican peso, U.S. dollar, Euro, British pound, Korean won, Chinese renminbi, Japanese yen, Australian dollar, Swedish krona, Brazilian real and Indian rupee. Assuming all other variables are constant, at December 31, 2013, a 5% strengthening of the following currencies against the functional currency of the Company and its foreign subsidiaries would result in gains/(losses) by the amounts shown below: Impact on net earnings
gain/(loss) Impact on other comprehensive
earnings gain/(loss)
December 31
2013 December 31
2012 December 31
2013 December 31
2012 $ $ $ $
Euro 838 603 - - Mexican peso 500 97 - - U.S. dollar 76 (1,453) 16,181 16,194 Korean won (27) (11) - -
A weakening of the same above currencies at December 31 would have had the equal but opposite effect, on the basis that all other variables remain constant.
Interest Rate Risk Due to the Company’s capital structure, there is some degree of exposure to changes in the Canadian and US money market rates of interest. The Company does invest excess funds at times to maximize interest income earned. The investment quality must meet internal standards for ratings and liquidity to safeguard the Company’s cash and cash equivalents. Interest rate swap agreements are used by the Company from time to time to manage the fixed and floating interest rate mix of the Company’s total debt portfolio and related overall cost of borrowing. The Company elected to apply hedge accounting for interest rate swaps purchased as cash flow hedges.
The interest rate swap agreements involve the periodic exchange of interest payments without the exchange of the notional principal amount upon which the payments are based. Interest expense on the debt is then adjusted to include the payments made or received under the interest rate swaps.
As at December 31, 2013, an interest rate change of 50 basis points (all other variables held constant) would have an impact on net earnings for the year of $235 (2012 - $893). An interest rate change of 50 basis points would have no impact on other comprehensive earnings as the only interest rate swaps matured in 2013 and in 2012 they were considered ineffective as the maturity dates were greater than the maturity date of the then current revolving credit facility. Liquidity Risk Liquidity risk is the Company’s ability to meet its financial obligations when they come due. The Company manages the liquidity risk of forecasted cash flows from operations, by ensuring that there are cash resources available to meet these needs. As at December 31, 2013, the Company’s syndicated revolving bank facility had available credit of $504,759. The facility does not mature until 2018. The amount of financial resources available to invest in a Company’s growth is dependent upon its size and willingness to utilize debt and issue equity. The Company has fewer financial resources than some of its principal competitors. If the Company deviates from its growth expectations, it may require additional debt or equity financing. There is no assurance that the Company will be able to obtain additional financial resources that may be required to successfully compete in its markets on
63

LINAMAR CORPORATION Notes to Consolidated Financial Statements For the years ended December 31, 2013 and December 31, 2012 (in thousands of Canadian dollars, except where otherwise noted)
favourable commercial terms. Failure to obtain such financing could result in the delay or abandonment of certain strategic plans for product manufacturing or development. The Company’s current credit facility, Private Placement Senior Unsecured Notes due October 2014 (“the 2014 Notes”), Private Placement Senior Unsecured Notes due July 23, 2017 (“the 2017 Notes”) and Private Placement Senior Unsecured Notes due September 15, 2021 (“the 2021 Notes”) require the Company to comply with certain financial covenants, including the following: Revolving credit facility key covenants: (1) Net Funded Debt1,6 (“NFD”) to Earnings Before Interest Depreciation and Amortization2,6 (“EBITDA”) must be not more than
2.75 for the trailing four quarters on a rolling basis; and (2) EBITDA must be not less than 3.0 times interest expense for the trailing four quarters on a rolling basis.
(in millions of dollars) December 31
2013 December 31
2012
NFD/EBITDA 0.9 1.6
Interest Coverage 17.6 12.5
The 2014 Notes key covenants: (1) Book value of Consolidated Shareholders’ Equity3,6 must be not less than $450.0 million; and (2) Consolidated Debt4,6 to Consolidated Capitalization5,6 must be not greater than 50%.
(in millions of dollars) December 31
2013 December 31
2012
Consolidated Shareholders' Equity 1,294.7 1,084.5
Consolidated Debt to Consolidated Capitalization 30.7% 40.6%
The 2017 Notes key covenants: (1) NFD1,6 to EBITDA2,6 must be not more than 2.75 for the trailing four quarters on a rolling basis; and (2) EBITDA must be not less than 2.5 times interest expense for the trailing four quarters on a rolling basis.
(in millions of dollars) December 31
2013 December 31
2012
NFD/EBITDA 0.9 1.6
Interest Coverage 17.6 12.5
The 2021 Notes key covenants: (1) NFD1,6 to EBITDA2,6 must be not more than 2.75 for the trailing four quarters on a rolling basis; and (2) EBITDA must be not less than 2.5 times interest expense for the trailing four quarters on a rolling basis.
(in millions of dollars) December 31
2013 December 31
2012
NFD/EBITDA 0.9 1.6
Interest Coverage 17.6 12.5
1 “NFD” is defined in the respective agreement (the credit facility agreement or the 2017 and 2021Notes agreements) as applicable and means, in summary, all indebtedness of the consolidated Company net of
cash and cash equivalents of the Borrower and Guarantors. 2 “EBITDA” is defined in the respective agreement (the credit facility agreement or the 2017 and 2021 Notes agreements) as applicable and means, in summary, Net Income of the consolidated Company before
deduction of interest expense, taxes, amortization and non-cash extraordinary items less any cash payments on previously provided extraordinary items made during such period, determined on a consolidated basis in accordance with GAAP.
3 “Consolidated Shareholders’ Equity” is defined in the 2014 Notes and means, in summary, the amount of the capital stock accounts plus the surplus in retained earnings of the Company and its designated Restricted Subsidiaries on a consolidated basis in accordance with GAAP.
4 “Consolidated Debt” is defined in the 2014 Notes and means, in summary, all liabilities for borrowed money including capital leases, guarantees and letters of credit for the consolidated Company. 5 “Consolidated Capitalization” is defined in the 2014 Notes and means, in summary, the Consolidated Debt plus Consolidated Shareholders’ Equity less the capital of any unrestricted subsidiaries. 6 The measures above do not have a standardized meaning and therefore are unlikely to be comparable to similar measures presented by other issuers.
64

LINAMAR CORPORATION Notes to Consolidated Financial Statements For the years ended December 31, 2013 and December 31, 2012 (in thousands of Canadian dollars, except where otherwise noted)
The undiscounted contractual maturities of the Company’s financial liabilities are as follows:
Current year Maturing in
1 to 2 years Maturing
after 2 years Total As at December 31, 2013 $ $ $ $
Accounts payable and accrued liabilities 597,589 - - 597,589 Long-term debt and contractual interest payments 73,008 16,999 545,710 635,717
670,597 16,999 545,710 1,233,306
Current year Maturing in 1
to 2 years Maturing
after 2 years Total As at December 31, 2012 $ $ $ $
Accounts payable and accrued liabilities 527,214 - - 527,214 Long-term debt and contractual interest payments 16,989 69,677 733,801 820,467 Derivative financial instruments, non-hedge 1,065 - - 1,065
545,268 69,677 733,801 1,348,746
Credit Risk The maximum exposure to credit risk at the reporting date is represented by the net carrying amount of the Company’s cash and cash equivalents, accounts and other receivables, long-term receivables, derivative financial instruments and financial guarantees (see Note 26). The Company is exposed to credit risk from potential default by counterparties that carry the Company’s cash and cash equivalents and derivative financial instruments. The Company attempts to mitigate this risk by dealing only with large financial institutions with good credit ratings. All of the financial institutions within the bank syndicate providing the Company’s credit facility meet these qualifications. Any short term investments are made in products rated R1 Mid or higher.
Credit risk can arise from the inability of customers to discharge their obligation to the Company. A substantial portion of the Company’s accounts receivables are with large customers in the automotive, truck and industrial sectors and are subject to normal industry credit risks. At December 31, 2013, the accounts receivable from the Company’s three largest customers amounted to 18.9%, 12.2% and 6.1% (December 31, 2012 – 25.3%, 13.6%, and 7.5%) of total receivables. The level of accounts receivable that were past due as at December 31, 2013 are part of normal payment patterns within the industry and the allowance for doubtful accounts is less than 1.0% of total trade receivables for all periods and movements in the current year are minimal. The aging of accounts receivables not impaired is as follows:
December 31 December 31
2013 2012
$ $
Current 566,840 460,392
Past due 1-30 days 68,075 55,756
Past due 31-60 days 22,240 11,745
Past due 61-90 days 6,600 6,331
Past due >91 days 9,715 10,261
673,470 544,485
65

LINAMAR CORPORATION Notes to Consolidated Financial Statements For the years ended December 31, 2013 and December 31, 2012 (in thousands of Canadian dollars, except where otherwise noted)
12 Property, Plant and Equipment
Land
Land use
rights Buildings Machinery Office
equipment Transportation
equipment Tooling Total
$ $ $ $ $ $ $ $
Cost 23,810 484 225,677 1,789,769 11,612 15,798 13,565 2,080,715
Accumulated amortization - (63) (70,754) (873,823) (7,215) (9,970) (8,606) (970,431)
Net book amount at January 1, 2012 23,810 421 154,923 915,946 4,397 5,828 4,959 1,110,284
Effect of cumulative translation adjustment 95 (26) 1,166 3,180 2 14 (9) 4,422
Additions 1,993 3,003 54,233 271,470 1,754 376 4,170 336,999
Disposals (156) - (497) (4,844) (91) (41) (4) (5,633)
Amortization - (10) (10,014) (171,274) (1,606) (813) (4,982) (188,699)
Net book amount at December 31, 2012 25,742 3,388 199,811 1,014,478 4,456 5,364 4,134 1,257,373
Cost 25,742 3,460 277,265 1,965,744 9,001 16,033 11,230 2,308,475
Accumulated amortization - (72) (77,454) (951,266) (4,545) (10,669) (7,096) (1,051,102)
Net book amount at December 31, 2012 25,742 3,388 199,811 1,014,478 4,456 5,364 4,134 1,257,373
Effect of cumulative translation adjustment 653 338 8,813 51,762 127 70 110 61,873
Additions 1,202 - 20,842 182,305 1,433 605 3,109 209,496
Business acquisition (Note 29) 855 - 9,693 16,011 - - - 26,559
Impairment provision - - - (1,273) - - - (1,273)
Disposals - - (37) (27,559) (17) (27) (102) (27,742)
Amortization - (44) (11,191) (196,199) (1,854) (798) (4,624) (214,710)
Net book amount at December 31, 2013 28,452 3,682 227,931 1,039,525 4,145 5,214 2,627 1,311,576
Cost 28,452 3,806 316,459 2,152,208 9,643 16,457 9,180 2,536,205
Accumulated amortization - (124) (88,528) (1,112,683) (5,498) (11,243) (6,553) (1,224,629)
Net book amount at December 31, 2013 28,452 3,682 227,931 1,039,525 4,145 5,214 2,627 1,311,576
Amortization expense of $212,856 (2012 - $187,060) has been charged in cost of sales, $1,854 (2012 - $1,639) in selling, general and administration. As of December 31, 2013, property, plant and equipment includes $108,463 (December 31, 2012 - $181,977) of assets in the course of construction for production purposes and are recorded at cost in accordance with the Company’s accounting po licy. Amortization of these assets commences when the assets are ready for their intended use. The Company leases a building under non-cancellable finance lease agreement with a 13 year term. The following amounts are included in plant, property and equipment where the Company is a lessee under a finance lease:
December 31
2013 December 31
2012
$ $
Cost 2,742 7,951
Accumulated amortization 394 5,147
Net book amount 2,348 2,804
Leased assets are pledged as security for finance lease obligations.
66

LINAMAR CORPORATION Notes to Consolidated Financial Statements For the years ended December 31, 2013 and December 31, 2012 (in thousands of Canadian dollars, except where otherwise noted)
13 Goodwill 2013 2012
$ $
Cost 31,987 32,238
Accumulated impairment losses 8,637 8,829
Net book amount at January 1 23,350 23,409
Effect of cumulative translation adjustment 1,214 (59)
Net book amount at December 31 24,564 23,350
Cost 33,797 31,987
Accumulated impairment losses 9,233 8,637
Net book amount at December 31 24,564 23,350
Goodwill has been allocated for impairment testing purposes to the following CGU’s:
December 31
2013 December 31
2012
$ $
Skyjack 12,983 12,983
Linamar Antriebstechnik GmbH 11,581 10,367
24,564 23,350
Management performed the annual goodwill impairment analysis during the fourth quarter of 2013 and found that goodwill was not impaired at the end of the year. The recoverable amounts of the CGU’s is determined on a value in use calculation, which uses cash flow projections based on financial budgets and forward projections approved by the Board, covering a five-year period. Key assumptions used in the estimated impairment of goodwill include: a) Operating costs and capital expenditures are based on internal management forecasts. Cost assumptions incorporate the
Company’s experience and expertise, current operating costs, the nature and location of each CGU and the risk associated with each CGU. Future capital expenditure is based on the Company’s best estimate of required capital requirements. All committed and anticipated capital expenditures adjusted for future cost estimates have been included in the projected cash flows.
b) Forecast growth rates are principally based on the Company’s expectations for future performance. For the purpose of the impairment test, the Company adjusted the terminal value to reflect a zero growth rate for the present value calculation.
c) Discount rates used reflect specific risks relating to the relevant segments and the countries in which they operate. The pre-tax discount rates used range from 9.5% to 11.3% (2012 – 8.6% to 9.9%).
A sensitivity of goodwill impairment tests relating to discount rates was performed. A 1% increase in the discount rate would have no impact on the results of goodwill impairment tests in the year ended December 31, 2013. Based on current projected cash flows, it would require an increase in the discount rate in excess of 10% to trigger an impairment.
67
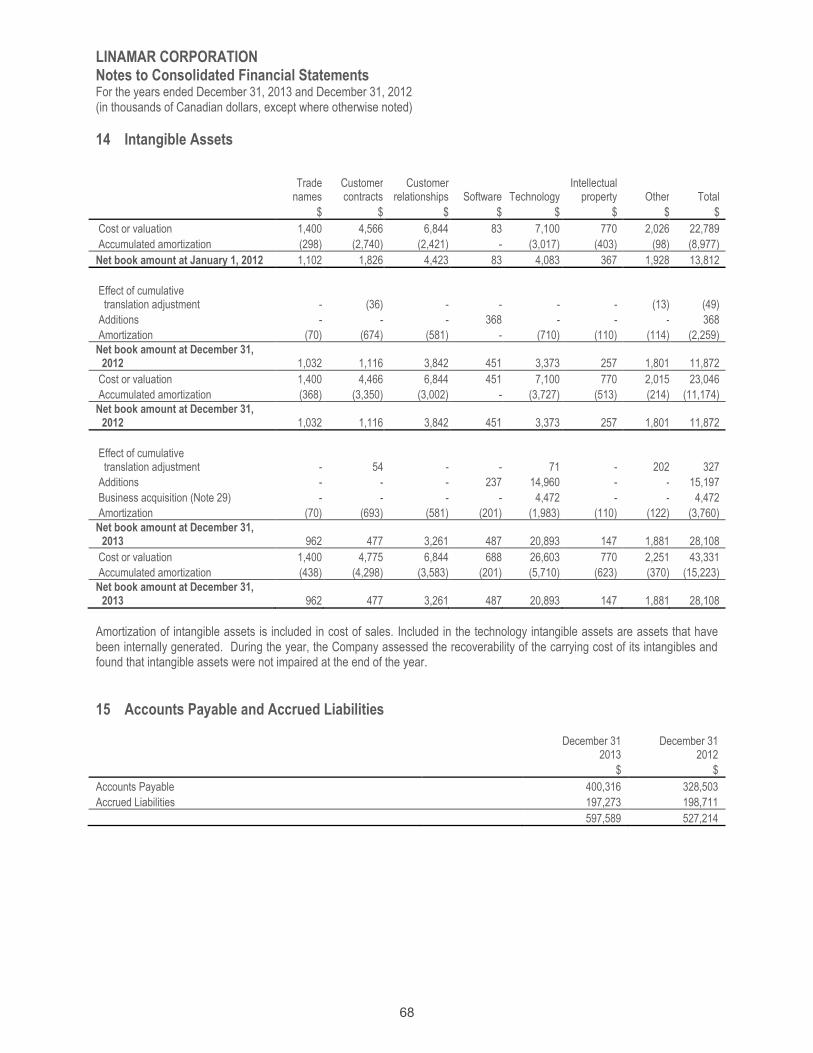
LINAMAR CORPORATION Notes to Consolidated Financial Statements For the years ended December 31, 2013 and December 31, 2012 (in thousands of Canadian dollars, except where otherwise noted)
14 Intangible Assets
Trade names
Customer contracts
Customer relationships Software Technology
Intellectual property Other Total
$ $ $ $ $ $ $ $
Cost or valuation 1,400 4,566 6,844 83 7,100 770 2,026 22,789
Accumulated amortization (298) (2,740) (2,421) - (3,017) (403) (98) (8,977)
Net book amount at January 1, 2012 1,102 1,826 4,423 83 4,083 367 1,928 13,812
Effect of cumulative translation adjustment - (36) - - - - (13) (49)
Additions - - - 368 - - - 368
Amortization (70) (674) (581) - (710) (110) (114) (2,259)
Net book amount at December 31, 2012 1,032 1,116 3,842 451 3,373 257 1,801 11,872
Cost or valuation 1,400 4,466 6,844 451 7,100 770 2,015 23,046
Accumulated amortization (368) (3,350) (3,002) - (3,727) (513) (214) (11,174)
Net book amount at December 31, 2012 1,032 1,116 3,842 451 3,373 257 1,801 11,872
Effect of cumulative translation adjustment - 54 - - 71 - 202 327
Additions - - - 237 14,960 - - 15,197
Business acquisition (Note 29) - - - - 4,472 - - 4,472
Amortization (70) (693) (581) (201) (1,983) (110) (122) (3,760)
Net book amount at December 31, 2013 962 477 3,261 487 20,893 147 1,881 28,108
Cost or valuation 1,400 4,775 6,844 688 26,603 770 2,251 43,331
Accumulated amortization (438) (4,298) (3,583) (201) (5,710) (623) (370) (15,223)
Net book amount at December 31, 2013 962 477 3,261 487 20,893 147 1,881 28,108
Amortization of intangible assets is included in cost of sales. Included in the technology intangible assets are assets that have been internally generated. During the year, the Company assessed the recoverability of the carrying cost of its intangibles and found that intangible assets were not impaired at the end of the year.
15 Accounts Payable and Accrued Liabilities
December 31
2013 December 31
2012
$ $
Accounts Payable 400,316 328,503
Accrued Liabilities 197,273 198,711
597,589 527,214
68
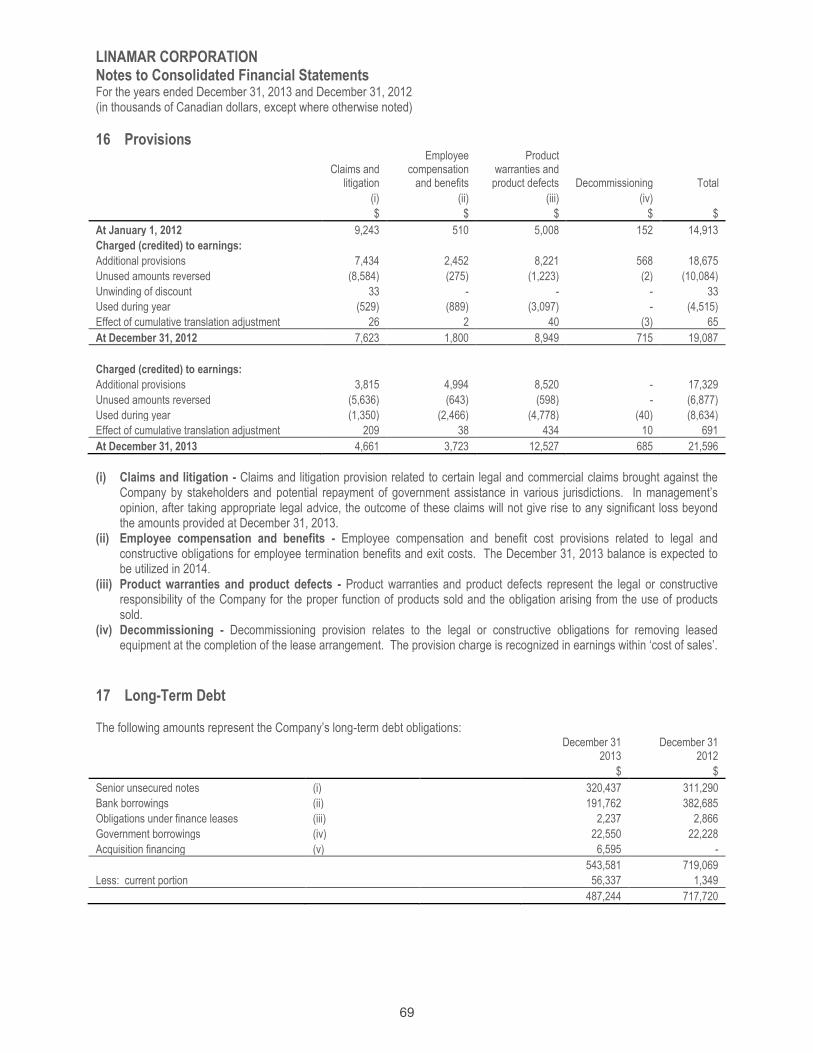
LINAMAR CORPORATION Notes to Consolidated Financial Statements For the years ended December 31, 2013 and December 31, 2012 (in thousands of Canadian dollars, except where otherwise noted)
16 Provisions
Claims and
litigation
Employee compensation
and benefits
Product warranties and
product defects Decommissioning Total
(i) (ii) (iii) (iv)
$ $ $ $ $
At January 1, 2012 9,243 510 5,008 152 14,913
Charged (credited) to earnings:
Additional provisions 7,434 2,452 8,221 568 18,675
Unused amounts reversed (8,584) (275) (1,223) (2) (10,084)
Unwinding of discount 33 - - - 33
Used during year (529) (889) (3,097) - (4,515)
Effect of cumulative translation adjustment 26 2 40 (3) 65
At December 31, 2012 7,623 1,800 8,949 715 19,087
Charged (credited) to earnings:
Additional provisions 3,815 4,994 8,520 - 17,329
Unused amounts reversed (5,636) (643) (598) - (6,877)
Used during year (1,350) (2,466) (4,778) (40) (8,634)
Effect of cumulative translation adjustment 209 38 434 10 691
At December 31, 2013 4,661 3,723 12,527 685 21,596
(i) Claims and litigation - Claims and litigation provision related to certain legal and commercial claims brought against the
Company by stakeholders and potential repayment of government assistance in various jurisdictions. In management’s opinion, after taking appropriate legal advice, the outcome of these claims will not give rise to any significant loss beyond the amounts provided at December 31, 2013.
(ii) Employee compensation and benefits - Employee compensation and benefit cost provisions related to legal and constructive obligations for employee termination benefits and exit costs. The December 31, 2013 balance is expected to be utilized in 2014.
(iii) Product warranties and product defects - Product warranties and product defects represent the legal or constructive responsibility of the Company for the proper function of products sold and the obligation arising from the use of products sold.
(iv) Decommissioning - Decommissioning provision relates to the legal or constructive obligations for removing leased equipment at the completion of the lease arrangement. The provision charge is recognized in earnings within ‘cost of sales’.
17 Long-Term Debt The following amounts represent the Company’s long-term debt obligations:
December 31
2013 December 31
2012
$ $
Senior unsecured notes (i) 320,437 311,290
Bank borrowings (ii) 191,762 382,685
Obligations under finance leases (iii) 2,237 2,866
Government borrowings (iv) 22,550 22,228
Acquisition financing (v) 6,595 -
543,581 719,069
Less: current portion 56,337 1,349
487,244 717,720
69

LINAMAR CORPORATION Notes to Consolidated Financial Statements For the years ended December 31, 2013 and December 31, 2012 (in thousands of Canadian dollars, except where otherwise noted)
(i) Senior unsecured notes consist of the following:
Note Amounts Description Effective Date Due Date Interest Rate
U.S. $40 million “The 2014 Notes” October 2004 October 2014 5.33%
U.S. $130 million “The 2017 Notes” July 2010 July 2017 5.31%
U.S. $130 million “The 2021 Notes” September 2011 September 2021 4.84%
The senior unsecured notes are guaranteed by material subsidiaries of the Company as defined in the bank credit agreement. The senior unsecured notes require the Company to maintain certain financial ratios (Note 11) and impose limitations on specific activities. The Company entered into long-dated forward exchange contracts to lock in the exchange rate on the principal repayment component upon maturity of the 2014, 2017 and 2021 Notes. The unrealized foreign exchange loss determined at inception of the principal swaps are being accrued over the term of the forward contracts and are being treated as additional costs of the notes recorded through interest. The Company also entered into a series of forward exchange contracts to lock in the exchange rate on the semi-annual coupon payments of the 2017 and 2021 Notes and to hedge the effective changes in exchange rates. The hedge has the effect of converting the U.S. stated coupon rate of 5.31% to a Canadian interest rate of 5.47% for the 2017 Notes and converting the U.S. stated coupon rate of 4.84% to a Canadian interest rate of 5.00%.
(ii) Bank borrowings In March 2011, the Company successfully renewed the bank revolving credit facility with an expiry date of March 4, 2015 and increased the size to $600 million on substantially the same terms. Current borrowings are subject to rates according to the short term bank product utilized, plus applicable margin. The facility is unsecured and is guaranteed by material subsidiaries of the Company as defined in the credit agreement. The bank borrowings require the Company to maintain certain financial ratios (Note 11) and impose limitations on specified activities. In March 2012, the Company exercised the $100 million accordion feature on this credit facility to increase the facility amount to $700 million. The exercise of this feature does not impact any other terms or conditions within the credit facility including the term or covenant requirements of the agreement. In April 2013, the Company amended and extended the credit facility under substantially the same terms and conditions. The facility amount remains at $700 million with a new maturity date of April 23, 2018. As of December 31, 2013, $504,759 was available under the credit facility. In December 2008, the Company entered into a swap transaction to convert $60 million of variable rate obligations to a fixed rate obligation of 3.12%. The swap matured during the current year.
(iii) Obligations under finance leases The Company has a finance lease for a building which is included in property, plant and equipment. The Company’s obligation under the finance lease is secured by the Lessors’ title to the leased assets.
Minimum lease payments Present value of minimum lease payments
December 31
2013 December 31
2012 December 31
2013 December 31
2012
$ $ $ $
Not later than 1 year 326 973 219 860
Later than 1 year and not later than 5 years 1,263 1,150 951 829
Later than 5 years 1,166 1,320 1,067 1,177
2,755 3,443 2,237 2,866
Less: future finance charges 518 577 - -
Present value of minimum lease payments 2,237 2,866 2,237 2,866
70

LINAMAR CORPORATION Notes to Consolidated Financial Statements For the years ended December 31, 2013 and December 31, 2012 (in thousands of Canadian dollars, except where otherwise noted)
(iv) Government Borrowings Government borrowings are comprised of three non-revolving interest free term loans: a) The Advanced Manufacturing Investment Strategy is a program provided by the Ministry of Economic Development
and Trade in the Province of Ontario. The loan is due in four annual payments starting in 2014 with the final 80% due the following year. The loan was completely repaid during the current year.
b) The Technology Partnerships Canada is a program provided by the Ministry of Industry by the Federal Canadian Government. The loan is due in ten equal annual payments starting in 2013. Further loans are available to a maximum of $8,970 based on future investment related measures until June 2013.
c) The Automotive Innovation Fund is a program provided by the Ministry of Industry by the Federal Canadian Government. The loan is due in nine equal annual payments starting in 2019 with the final amount due the following year.
(v) Acquisition Financing
Related to the 2013 acquisition of MMKG’s business of manufacturing and distributing assembled camshafts, the asset purchase agreement calls for future payments to be made by the Company consisting of installments of 1.25 million Euros in each of 2014, 2015 and 2016 and a final installment of 0.75 million Euros in 2017. See Note 29 for more information related to this acquisition.
Principal payments required to meet the long-term obligations were as follows:
December 31
2013 December 31
2012
$ $
Not later than 1 year 56,337 1,349
Later than 1 year and not later than 5 years 332,453 568,930
Later than 5 years 157,427 150,980
Total principal payments 546,217 721,259
Less: debt issue costs (2,636) (2,190)
543,581 719,069
18 Capital Stock The Company is incorporated under the Ontario Business Corporations Act in Canada and is authorized to issue an unlimited number of common and special shares. Common shares Stated capital
Issued $
At January 1, 2013 64,706,296 108,307
Stock options exercised 55,852 1,167
At December 31, 2013 64,762,148 109,474
19 Contributed Surplus Contributed surplus consists of accumulated share-based compensation expense less the fair value of options at the grant date that have been exercised and credited to common shares. The following is a continuity schedule of contributed surplus: 2013 2012
$ $
At January 1 18,327 16,022
Share-based compensation expense (Note 22) 1,718 2,332
Stock options exercised (346) (27)
At December 31 19,699 18,327
71

LINAMAR CORPORATION Notes to Consolidated Financial Statements For the years ended December 31, 2013 and December 31, 2012 (in thousands of Canadian dollars, except where otherwise noted)
20 Employee Benefits
Year Ended December 31
2013
Year Ended December 31
2012
$ $
Wages, salaries and commissions 631,697 592,687
Social charges and other personnel expenses 177,048 154,299
Termination benefits 3,532 2,416
Share-based compensation 1,718 2,332
Pension expenses under defined contribution plans 15,519 14,239
829,514 765,973
21 Government Assistance As of December 31, 2013, government assistance recorded in ‘accounts and other receivables’ was $11,325 ($10,703 at December 31, 2012), and a further $9,370 ($20,969 – 2012) was received during the year. $10,109 of the amount received and receivable was credited to capital assets ($13,038 – 2012) and $10,586 was credited against expenditures ($18,634 - 2012) during the year. There were no government assistance amounts deferred as of December 31, 2013 and December 31, 2012. In all cases, repayment of government assistance is contingent on employment related measures, investment related measures or both. The Company assessed the likelihood of repayment of government assistance and has recorded a provision of $1,300 as at December 31, 2013 ($1,306 at December 31, 2012).
22 Share-Based Compensation
The Company is authorized to grant options for common stock to its key employees and directors. The exercise price of each option equals the average of the high and low market price of the Company’s stock for the five trading days prior to the date of grant. An option’s maximum term is 10 years and vesting is determined by the Board of Directors. The Company issues new common shares to satisfy stock options exercised. Options are forfeited when the option holder ceases to be an employee or director of the Company. 2013 2012
Number of options
Weighted average
exercise price Number of options
Weighted average
exercise price
$ $
At January 1 1,832,582 15.64 1,787,002 15.44
Granted 50,000 41.11 50,000 21.59
Forfeited (23,434) 14.70 - -
Exercised (55,852) 14.70 (4,420) 14.70
At December 31 1,803,296 16.38 1,832,582 15.64
Vested at December 31 981,322 15.65 854,731 15.49
The average share price during the period the share options were exercised in 2013 was $30.69 (2012 - $21.43).
72
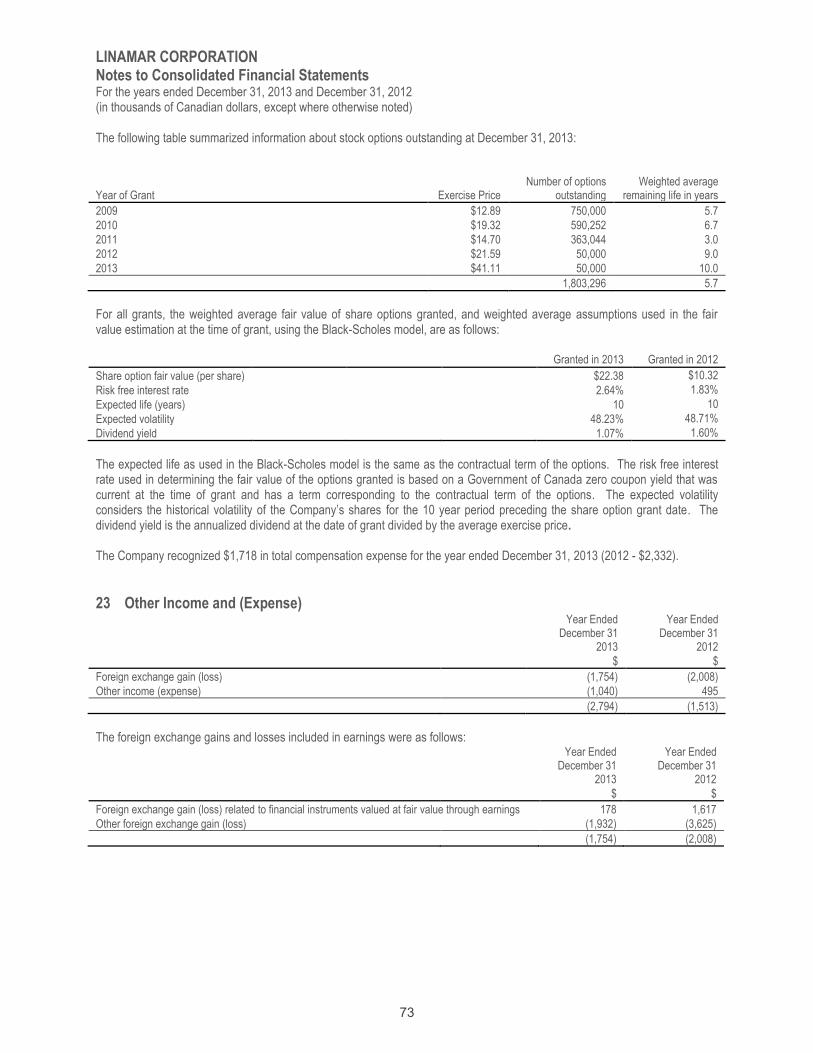
LINAMAR CORPORATION Notes to Consolidated Financial Statements For the years ended December 31, 2013 and December 31, 2012 (in thousands of Canadian dollars, except where otherwise noted)
The following table summarized information about stock options outstanding at December 31, 2013:
Year of Grant Exercise Price
Number of options
outstanding
Weighted average
remaining life in years
2009 $12.89 750,000 5.7
2010 $19.32 590,252 6.7
2011 $14.70 363,044 3.0
2012 $21.59 50,000 9.0
2013 $41.11 50,000 10.0
1,803,296 5.7
For all grants, the weighted average fair value of share options granted, and weighted average assumptions used in the fair value estimation at the time of grant, using the Black-Scholes model, are as follows: Granted in 2013 Granted in 2012
Share option fair value (per share) $22.38 $10.32
Risk free interest rate 2.64% 1.83%
Expected life (years) 10 10
Expected volatility 48.23% 48.71%
Dividend yield 1.07% 1.60%
The expected life as used in the Black-Scholes model is the same as the contractual term of the options. The risk free interest rate used in determining the fair value of the options granted is based on a Government of Canada zero coupon yield that was current at the time of grant and has a term corresponding to the contractual term of the options. The expected volatility considers the historical volatility of the Company’s shares for the 10 year period preceding the share option grant date. The dividend yield is the annualized dividend at the date of grant divided by the average exercise price.
The Company recognized $1,718 in total compensation expense for the year ended December 31, 2013 (2012 - $2,332).
23 Other Income and (Expense)
Year Ended December 31
2013
Year Ended December 31
2012
$ $
Foreign exchange gain (loss) (1,754) (2,008)
Other income (expense) (1,040) 495
(2,794) (1,513)
The foreign exchange gains and losses included in earnings were as follows:
Year Ended December 31
2013
Year Ended December 31
2012
$ $
Foreign exchange gain (loss) related to financial instruments valued at fair value through earnings 178 1,617
Other foreign exchange gain (loss) (1,932) (3,625)
(1,754) (2,008)
73

LINAMAR CORPORATION Notes to Consolidated Financial Statements For the years ended December 31, 2013 and December 31, 2012 (in thousands of Canadian dollars, except where otherwise noted)
24 Finance Expenses
Year Ended December 31
2013
Year Ended December 31
2012
$ $
Interest on long-term debt 30,616 32,871
Translation adjustments related to foreign currency borrowings 325 (1,555)
Changes in fair value of fair value hedges 338 (425)
Changes in fair value of cash flow hedges (202) 49
Other interest expense/(earned) and finance charges (1,552) (628)
29,525 30,312
25 Earnings per Share Basic earnings per share are calculated by dividing the net earnings attributable to equity holders of the Company by the weighted average number of ordinary shares outstanding throughout the year. Diluted earnings per share are calculated by adjusting the weighted average number of shares outstanding during the year to assume conversion of all dilutive potential shares. There were 1,803,296 options outstanding as at December 31, 2013.
Year Ended December 31
2013
Year Ended December 31
2012
$ $
Net earnings (loss) 229,789 146,102
Weighted average common shares 64,723,781 64,701,909
Incremental shares from assumed conversion of stock options 482,592 202,089
Adjusted weighted average common shares for diluted earnings per share 65,206,373 64,903,998
Net earnings (loss) per share:
Basic 3.55 2.26
Diluted 3.52 2.25
26 Commitments and Guarantees
(i) Commitments The Company leases various land and buildings under cancellable and non-cancellable operating lease arrangements. The lease terms are between 1 and 20 years, and the majority of lease arrangements are renewable at the end of the lease period at market rate. The Company also leases various machinery and transportation equipment under non-cancellable operating lease arrangements. The lease terms are between 1 and 5 years and require notice for termination of the agreements. The operating lease expenditure charged to earnings during the year ended December 31, 2013 was $10,212 (2012 - $9,094). The future aggregate minimum lease payments under non-cancellable operating leases were as follows: December 31
2013 December 31
2012 $ $
Not later than 1 year 9,932 9,312
Later than 1 year and not later than 5 years 20,161 18,097
Later than 5 years 2,193 2,405
32,286 29,814
As at December 31, 2013, outstanding commitments for capital expenditures under purchase orders and contracts amounted to approximately $99,517 ($151,452 at December 31, 2012). Of this amount $98,623 ($141,152 at December 31, 2012) relates to the purchase of manufacturing equipment and $894 ($10,300 at December 31, 2012) relates to general contracting and
74

LINAMAR CORPORATION Notes to Consolidated Financial Statements For the years ended December 31, 2013 and December 31, 2012 (in thousands of Canadian dollars, except where otherwise noted)
construction costs in respect of plant construction. All of these commitments are due within the next twelve months. $321 of the outstanding commitments ($6,690 at December 31, 2012) represents amounts committed to a company owned by the spouse of an officer and director.
(ii) Guarantees The Company occasionally provides guarantees to third parties who, in turn, provide financing to credit worthy Linamar customers under finance leases for certain industrial access products. The guarantees are for a certain percentage of the total financing amount with a maximum potential future payment of $926 at December 31, 2013 ($1,230 at December 31, 2012) over various terms of 3 to 5 years. The Company had estimated recourse, in the form of equipment, in the amount of $903 at December 31, 2013 ($834 at December 31, 2012). 27 Related Party Transactions Balances and transactions between the Company and its subsidiaries have been eliminated on consolidation. Details of the transactions between the Company and other related parties are disclosed below. (i) Key Management Personnel The Company’s key management includes members of the Senior Executive Group and Board of Directors. The compensation paid, or payable, to key management for employee services during the year was as follows:
Year Ended December 31
2013
Year Ended December 31
2012
$ $
Short-term benefits 21,350 13,888
Share-based compensation 1,207 2,332
Total Compensation 22,557 16,220
The remuneration of the Chairman and Chief Executive Officer (“CEO”) is ultimately the responsibility of the Board of Directors who receives significant support and recommendations from the Human Resource and Corporate Governance Committee. The remuneration of other members of the Senior Executive Group is determined and approved by the CEO. All key management remuneration is determined having regard to the performance of individuals and market trends.
(ii) Other Related Parties Linamar entities entered into the following trading transactions with other related parties:
Year Ended December 31
2013 $
Year Ended December 31
2012 $
Sale of goods and services 17 36
Purchases of goods, services and rent 791 692
Purchase of capital assets 4,325 13,385
December 31
2013 $
December 31 2012
$
Amounts owed from related parties - 4
Amounts owed to related parties 1,303 834
Other related parties primarily include transactions between the Company and a company owned by the spouse of an officer and director. The Company has designed an independent process to ensure building construction and improvements are transacted at the exchange amount which is the estimated fair value. The amounts owed by other related parties arise mainly from sale transactions. No expense has been recognized in the current or prior periods for bad or doubtful debts in respect of the amounts owed by other related parties. The amounts owed to other
75
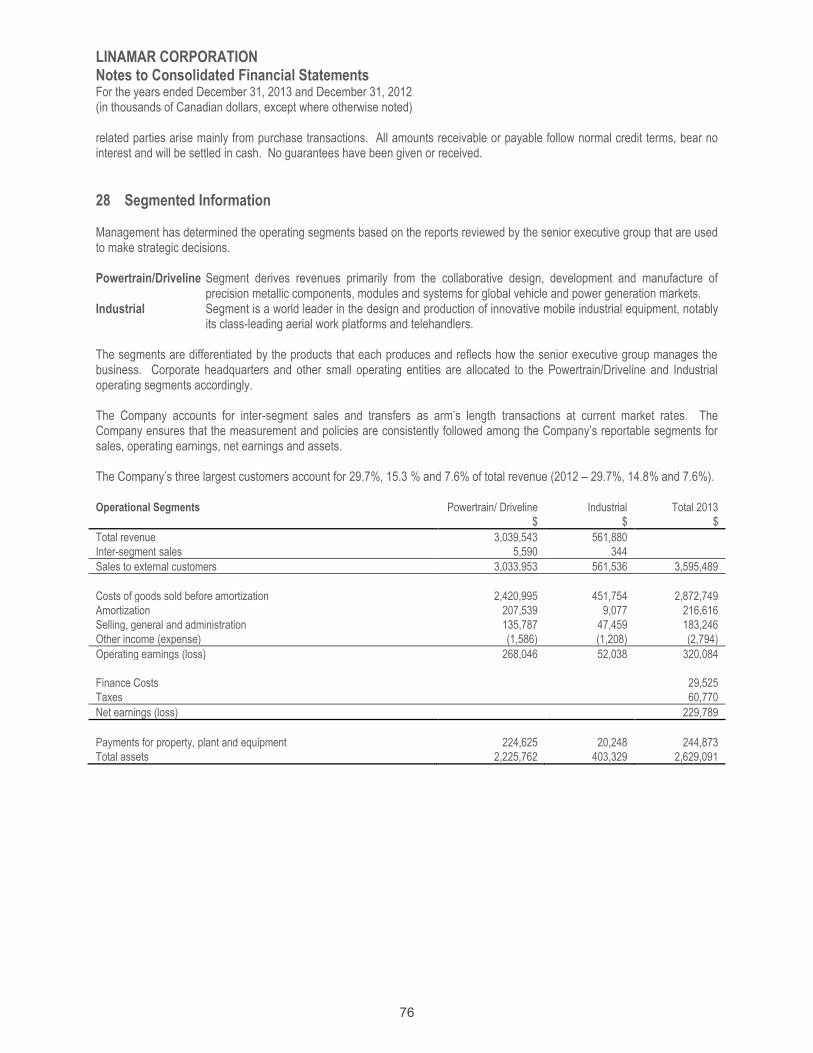
LINAMAR CORPORATION Notes to Consolidated Financial Statements For the years ended December 31, 2013 and December 31, 2012 (in thousands of Canadian dollars, except where otherwise noted)
related parties arise mainly from purchase transactions. All amounts receivable or payable follow normal credit terms, bear no interest and will be settled in cash. No guarantees have been given or received.
28 Segmented Information Management has determined the operating segments based on the reports reviewed by the senior executive group that are used to make strategic decisions. Powertrain/Driveline Segment derives revenues primarily from the collaborative design, development and manufacture of
precision metallic components, modules and systems for global vehicle and power generation markets. Industrial Segment is a world leader in the design and production of innovative mobile industrial equipment, notably
its class-leading aerial work platforms and telehandlers. The segments are differentiated by the products that each produces and reflects how the senior executive group manages the business. Corporate headquarters and other small operating entities are allocated to the Powertrain/Driveline and Industrial operating segments accordingly. The Company accounts for inter-segment sales and transfers as arm’s length transactions at current market rates. The Company ensures that the measurement and policies are consistently followed among the Company’s reportable segments for sales, operating earnings, net earnings and assets. The Company’s three largest customers account for 29.7%, 15.3 % and 7.6% of total revenue (2012 – 29.7%, 14.8% and 7.6%). Operational Segments Powertrain/ Driveline Industrial Total 2013
$ $ $
Total revenue 3,039,543 561,880
Inter-segment sales 5,590 344
Sales to external customers 3,033,953 561,536 3,595,489
Costs of goods sold before amortization 2,420,995 451,754 2,872,749
Amortization 207,539 9,077 216,616
Selling, general and administration 135,787 47,459 183,246
Other income (expense) (1,586) (1,208) (2,794)
Operating earnings (loss) 268,046 52,038 320,084
Finance Costs 29,525
Taxes 60,770
Net earnings (loss) 229,789
Payments for property, plant and equipment 224,625 20,248 244,873
Total assets 2,225,762 403,329 2,629,091
76
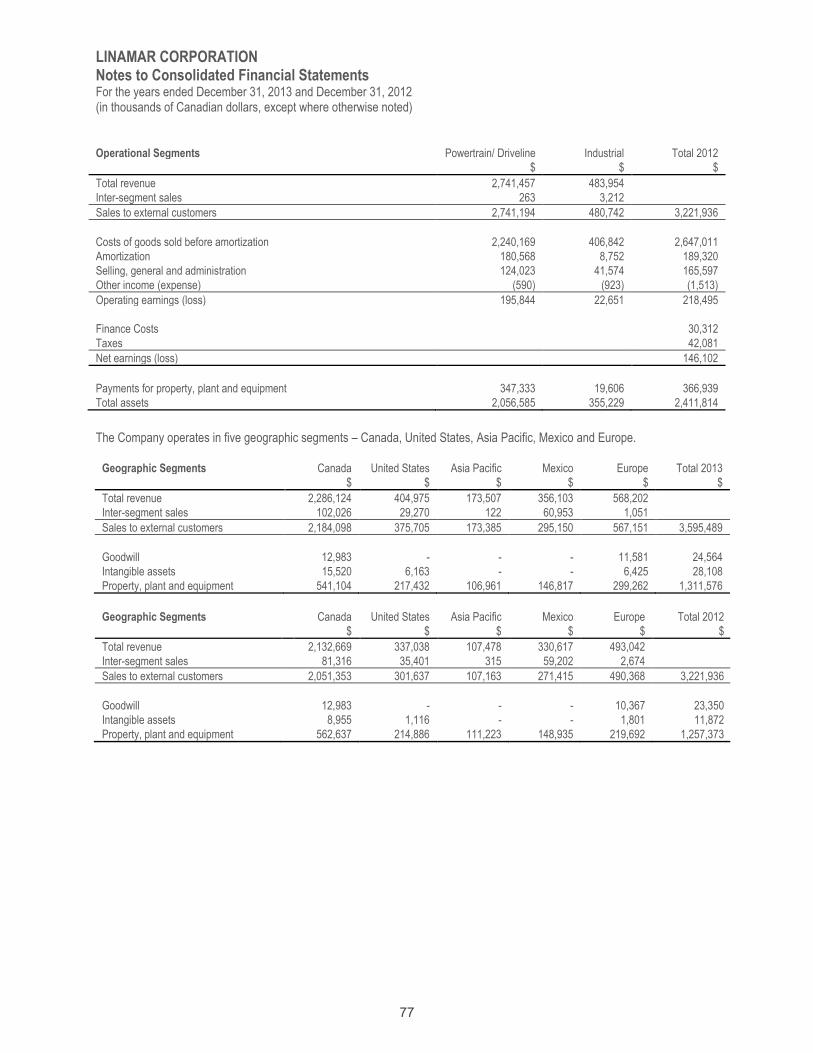
LINAMAR CORPORATION Notes to Consolidated Financial Statements For the years ended December 31, 2013 and December 31, 2012 (in thousands of Canadian dollars, except where otherwise noted)
Operational Segments Powertrain/ Driveline Industrial Total 2012
$ $ $
Total revenue 2,741,457 483,954
Inter-segment sales 263 3,212
Sales to external customers 2,741,194 480,742 3,221,936
Costs of goods sold before amortization 2,240,169 406,842 2,647,011
Amortization 180,568 8,752 189,320
Selling, general and administration 124,023 41,574 165,597
Other income (expense) (590) (923) (1,513)
Operating earnings (loss) 195,844 22,651 218,495
Finance Costs 30,312
Taxes 42,081
Net earnings (loss) 146,102
Payments for property, plant and equipment 347,333 19,606 366,939
Total assets 2,056,585 355,229 2,411,814
The Company operates in five geographic segments – Canada, United States, Asia Pacific, Mexico and Europe.
Geographic Segments Canada United States Asia Pacific Mexico Europe Total 2013
$ $ $ $ $ $
Total revenue 2,286,124 404,975 173,507 356,103 568,202
Inter-segment sales 102,026 29,270 122 60,953 1,051
Sales to external customers 2,184,098 375,705 173,385 295,150 567,151 3,595,489
Goodwill 12,983 - - - 11,581 24,564
Intangible assets 15,520 6,163 - - 6,425 28,108
Property, plant and equipment 541,104 217,432 106,961 146,817 299,262 1,311,576
Geographic Segments Canada United States Asia Pacific Mexico Europe Total 2012
$ $ $ $ $ $
Total revenue 2,132,669 337,038 107,478 330,617 493,042
Inter-segment sales 81,316 35,401 315 59,202 2,674
Sales to external customers 2,051,353 301,637 107,163 271,415 490,368 3,221,936
Goodwill 12,983 - - - 10,367 23,350
Intangible assets 8,955 1,116 - - 1,801 11,872
Property, plant and equipment 562,637 214,886 111,223 148,935 219,692 1,257,373
77
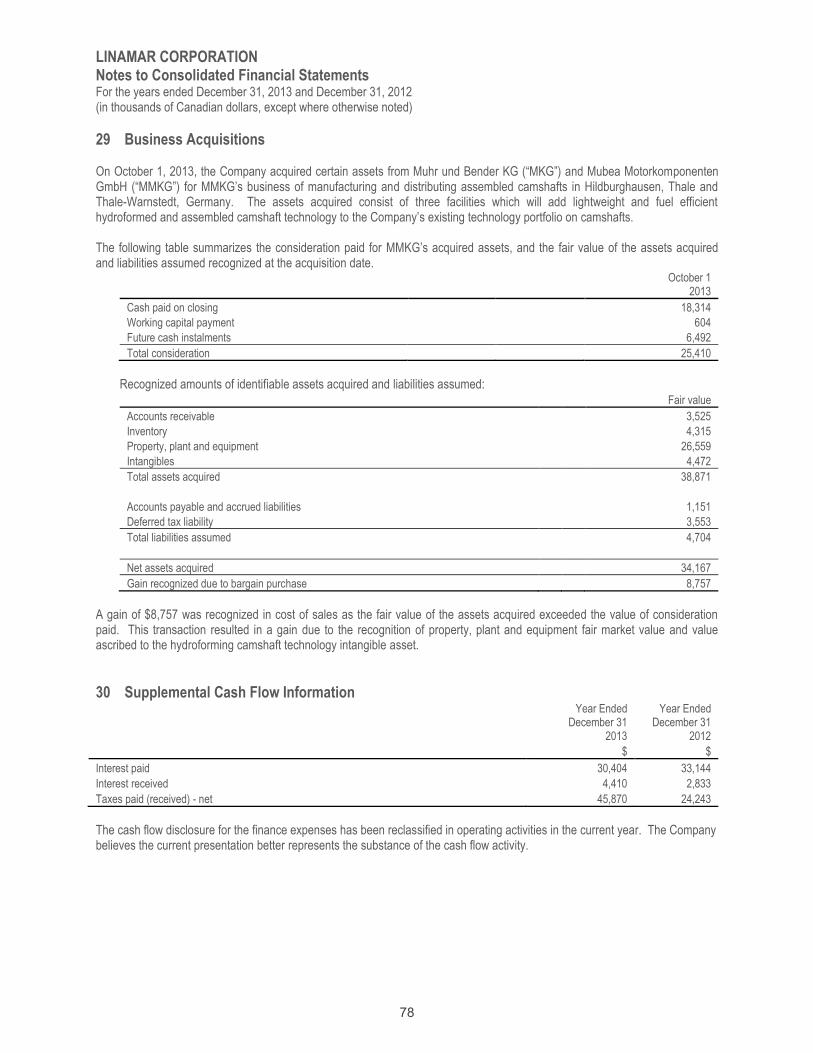
LINAMAR CORPORATION Notes to Consolidated Financial Statements For the years ended December 31, 2013 and December 31, 2012 (in thousands of Canadian dollars, except where otherwise noted)
29 Business Acquisitions On October 1, 2013, the Company acquired certain assets from Muhr und Bender KG (“MKG”) and Mubea Motorkomponenten GmbH (“MMKG”) for MMKG’s business of manufacturing and distributing assembled camshafts in Hildburghausen, Thale and Thale-Warnstedt, Germany. The assets acquired consist of three facilities which will add lightweight and fuel efficient hydroformed and assembled camshaft technology to the Company’s existing technology portfolio on camshafts. The following table summarizes the consideration paid for MMKG’s acquired assets, and the fair value of the assets acquired and liabilities assumed recognized at the acquisition date.
October 1
2013
Cash paid on closing 18,314
Working capital payment 604
Future cash instalments 6,492
Total consideration 25,410
Recognized amounts of identifiable assets acquired and liabilities assumed:
Fair value
Accounts receivable 3,525
Inventory 4,315
Property, plant and equipment 26,559
Intangibles 4,472
Total assets acquired 38,871
Accounts payable and accrued liabilities 1,151
Deferred tax liability 3,553
Total liabilities assumed 4,704
Net assets acquired 34,167
Gain recognized due to bargain purchase 8,757
A gain of $8,757 was recognized in cost of sales as the fair value of the assets acquired exceeded the value of consideration paid. This transaction resulted in a gain due to the recognition of property, plant and equipment fair market value and value ascribed to the hydroforming camshaft technology intangible asset.
30 Supplemental Cash Flow Information
Year Ended December 31
2013
Year Ended December 31
2012
$ $
Interest paid 30,404 33,144
Interest received 4,410 2,833
Taxes paid (received) - net 45,870 24,243
The cash flow disclosure for the finance expenses has been reclassified in operating activities in the current year. The Company believes the current presentation better represents the substance of the cash flow activity.
78
LINAMAR CORPORATION Notes to Consolidated Financial Statements For the years ended December 31, 2013 and December 31, 2012 (in thousands of Canadian dollars, except where otherwise noted)
31 Capital Risk Management The Company’s capital management objectives are to ensure the stability of its capital so as to support continued operations, provide an adequate return to shareholders and generate benefits for other stakeholders. The Company’s capital is composed of shareholders’ equity, and is not subject to any capital requirements imposed by a regulator. The Company’s private placement note holders require the Company to maintain a minimum book value of equity attributable to shareholders of the Company of $450,000. The Company is in compliance with this covenant. Further details can be found in Note 11. The Company manages the capital structure and makes adjustments to it in light of changes in economic conditions and the risk characteristics of the underlying assets. To maintain or adjust the capital structure, the Company may attempt to issue or re-acquire shares, acquire or dispose of assets, and adjust the amount of cash and cash equivalents balances. There were no changes in the Company’s capital risk management strategy during the period.
79

ANNUAL MEETING OF SHAREHOLDERS The Company’s Annual Meeting of Shareholders will take place in May 2014: Date: May 8, 2014 Time: 10:00 a.m. (EST) Location: The Frank Hasenfratz Centre of Excellence in Manufacturing
700 Woodlawn Road West, Guelph, Ontario Officers: Frank Hasenfratz Chairman of the Board
Linda Hasenfratz Chief Executive Officer
Jim Jarrell President & Chief Operating Officer
Roger Fulton Executive Vice President – Human Resources, General Counsel & Corporate Secretary
Mark Stoddart Chief Technology Officer & Executive Vice President - Marketing
Dale Schneider Chief Financial Officer
Brian Ahlborn Group President, Driveline Systems Group – Global Industrial, Commercial & Energy Group – North America
Brad Boehler President, Skyjack Inc.
Ken McDougall Group President, Linamar Manufacturing Group Americas
Directors: Frank Hasenfratz Chairman of the Board
Linda Hasenfratz Director
Mark Stoddart Director
David Buehlow* Director Chair, Audit Committee Member of the Human Resources & Corporate Governance Committee * Mr. Buehlow passed away on December 22, 2013
William Harrison Director Member of the Human Resources & Corporate Governance Committee and Audit Committee
Terry Reidel Director Chair, Human Resources & Corporate Governance Committee Member of Audit Committee
Auditors, Transfer Agent & Registrar PricewaterhouseCoopers LLP, Chartered Accountants, Kitchener, Ontario are the auditors of Linamar Corporation. The transfer agent and registrar for the common shares of the Company is Computershare Investor Services Inc. at its principal offices in Toronto. Linamar shares are listed on the Toronto Stock Exchange, trading under LNR.
81