annual report 2014 - accueil |...
TRANSCRIPT

201420142014Annual ReportAnnual ReportAnnual Report
Table of Contents
Message to Shareholders …….…………………………………………………………………….Page 2
Alain Bouchard, President & CEO
Operations Review …………………………………………………………………………………….Page 6
Brian Hannasch, Chief Operating Officer
Financial Review …………………………………………………………………………………….Page 10
Raymond Paré, Vice President & Chief Financial Officer
Management’s Discussion and Analysis …...…………………………………………………..Page 12
Management’s Report ……………………………………………………………………………..Page 43
Independent Auditor’s Report .……………………………………………………………………Page 45
Consolidated Financial Statements ..…………………………………………………………….Page 47

Annual Report © 2014 Alimentation Couche-Tard Inc. Page 2 of 81
Alain Bouchard President & Chief Executive Officer
Building momentum
I am proud of our annual results that provide us with our sixth straight year of record earnings. Our convenience stores and service stations in North America and Europe continue to build momentum in the face of challenging market conditions. Our same-store merchandise sales on both continents improved in fiscal year 2014, gaining market share in the majority of our markets. And while fuel volumes across the industry are generally flat or slightly declining our best-performing stores grew their volumes while we continued to gain fuel market share.
The numbers speak for themselves
For the sixth year in a row our net earnings have increased, amounting to $812.2 million for fiscal 2014, up 41.8% over fiscal 20131. Excluding non-recurring gains and costs, net earnings for fiscal 2014 would have been approximately $766.0 million or $1.35 per share on a diluted basis, an increase of 23.3% compared with fiscal 2013. EBITDA for fiscal 2014 was $1,640.2 million, an increase of $264.6 million or 19.2% compared with fiscal 2013, including a contribution from acquisitions (net of acquisition costs recorded to earnings) of $153.0 million.
Since the acquisition of Statoil Fuel & Retail, we estimate that total realized annual synergies and cost savings amount to approximately $85.0 million, before income taxes. These savings were in part offset by investments related to the continued rollout of our new Enterprise Resource Planning (ERP) systems and other key strategic convenience and fuel initiatives. Our ERP replacement roll-out in Europe is now complete.
Our work in the area of costs savings and synergy identification continues. We maintain our goal for annual synergies as previously announced.
Winning on all fronts
The strong results for fiscal year 2014 can be attributed to the performance of both the convenience and fuel aspects of our business.
We saw strong growth in same-store sales from merchandise this year. Our North American operations delivered an increase in same-store merchandise revenues of 3.8% in the U.S. and 1.9% in Canada. This is attributable to effective merchandising strategies, investments in the enhancement of our service and
1 Note that the scale of the increases stated in this report are, in part, due to 2014 being the first full year of incorporating our European operations into the Corporation’s financial results.

Annual Report © 2014 Alimentation Couche-Tard Inc. Page 3 of 81
product offerings, and pricing strategies aimed at boosting in-store traffic, as well as food service in several of our markets.
According to current NACS State of the Industry data, Couche-Tard outperformed the US market with an increase of 3.8% in same-store sales year-on-year, as opposed to the 2.4% reported in total industry merchandise sales2.
Our European operations continued to perform well, helped by new and sustainable merchandising strategies. Strong food service and coffee sales have driven growth in these markets. Our European business units delivered a 1.6% increase in same-store merchandise revenues compared with the same period last year, despite a still-challenging European convenience market. Initiatives such as a “coin offer” - a permanent campaign which promises customers they can always purchase a hot dog for a coin - and the continent-spanning “XL summer” campaign promoting a longer summer, XL offers and XL service, aimed at improving price perception, a significant step-up in merchandising, and new products in fresh food all proved effective.
Food in focus
Our people can be proud of our fresh food initiatives in North America and Europe. Customers are buying food at our stores in increasing numbers, not only because of the convenience factor but also because we offer a broader menu selection and the improved quality and taste they demand.
For example, in North America, our five fresh food pilot markets are delivering very encouraging early results, which show our customers really care about food quality. In Europe, thanks to an increased focus on the category, our hot dog sales have seen double-digit growth - in a category that has been essentially flat over the last few years.
Social investment
Millions of customers visit our stores and stations across North America and Europe every day. This puts Couche-Tard in a powerful position to mobilize its surrounding communities. We are proud to say there are dozens of organizations across North America and Europe that have benefitted from our corporate and customer contributions, totaling over $11.7 million, from our awareness-building activities and our employee volunteers.
Our North American business units build awareness and raise funds for an array of local community causes through powerful fund drives. This Spring, our Midwest and Great Lakes business units asked our customers to “Put Their Money Where The Miracles Are”, raising over $1.3 million in just three weeks for Children’s Miracle Network Hospitals (CMN). CMN is a care facility that provides approximately $6,500 worth of charity care every minute.
2 Convenience Stores Hit Record In-Store Sales in 2013 - NACS Online, April 3 2014
Fresh food pilots in North America are delivering very
encouraging early results

Annual Report © 2014 Alimentation Couche-Tard Inc. Page 4 of 81
Our European group has aligned its social investments in eight countries around the theme of “youth at risk”. Less than one year into its collaboration with BRIS (“Barnens Rätt i Samhället” or “Children’s Rights in Society”), an organization that assists vulnerable children and young people with advice and support, our Swedish business unit was named their “most creative partner”.
Senior management changes
In March, we announced my decision to take on a new role as Founder and Executive Chairman of the Board of Directors with effect from the date of Couche-Tard’s 2014 shareholders’ annual meeting. At the same time, it was announced that our Chief Operating Officer, Brian Hannasch, would be promoted to the position of President and Chief Executive Officer.
After more than three decades with the same President and CEO, this change is an evolutionary one for our corporation. In my new role, I will be focusing on acquisitions and new industry opportunities while continuing to take part in results reviews and the budgeting process. I will also continue to engage in our strategic discussions and serve as a mentor and coach to our next generation of leaders.
We have an exceptional senior leadership team, and Brian Hannasch is the right person to lead it. He has been intimately involved in developing our strategy and improving our business. He has played a pivotal role in the material acquisitions we made over the last thirteen years, including our largest and most recent, Statoil Fuel & Retail in Europe. His decisive leadership, management skills and deep experience across the entire value chain of our business uniquely qualify him to step into this role.
Outlook
In Fiscal 2014 we have made great progress in growing our business and we are particularly pleased with the performance of our new-to-industry sites. As has been the case in the past, we have made great progress in deleveraging our balance sheet and in this respect we are currently ahead of our plans. We will further increase our focus on new builds in the coming year, aided by our great land bank on both continents.
In my new role, I will focus on our ongoing expansion into new markets and new opportunities - at the right time and on the right terms. I look forward to continuing the Couche-Tard journey, full steam ahead with Brian at the helm and our 80,000 talented, committed, skilled and experienced people, propelling Couche-Tard to even greater heights.
Alain Bouchard accepting NACS Insight International
Convenience Leader of the Year 2014 from award sponsor
Cary Crook, Vice President/General Manager International
Sales at PepsiCo
Annual Report © 2014 Alimentation Couche-Tard Inc. Page 5 of 81
Thank you
Renewal is a prerequisite for success in today’s fast-moving, ever-more-competitive retail landscape. I am impressed by the ability of our people around the world to strive for continuous improvement each and every day. I thank them all for their endless energy and commitment.
Alain Bouchard President & Chief Executive Officer
Annual Report © 2014 Alimentation Couche-Tard Inc. Page 6 of 81
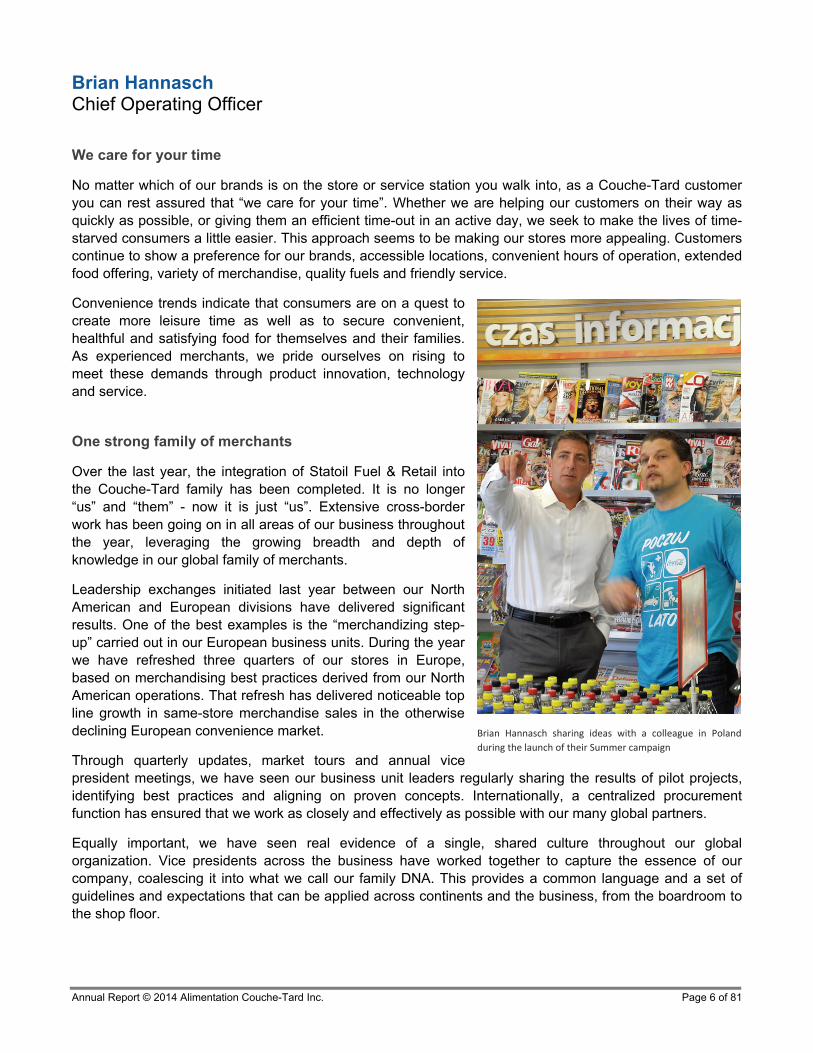
Brian Hannasch sharing ideas with a colleague in Poland
during the launch of their Summer campaign
Brian Hannasch Chief Operating Officer
0B0BWe care for your time
No matter which of our brands is on the store or service station you walk into, as a Couche-Tard customer you can rest assured that “we care for your time”. Whether we are helping our customers on their way as quickly as possible, or giving them an efficient time-out in an active day, we seek to make the lives of time-starved consumers a little easier. This approach seems to be making our stores more appealing. Customers continue to show a preference for our brands, accessible locations, convenient hours of operation, extended food offering, variety of merchandise, quality fuels and friendly service.
Convenience trends indicate that consumers are on a quest to create more leisure time as well as to secure convenient, healthful and satisfying food for themselves and their families. As experienced merchants, we pride ourselves on rising to meet these demands through product innovation, technology and service.
1B1BOne strong family of merchants
Over the last year, the integration of Statoil Fuel & Retail into the Couche-Tard family has been completed. It is no longer “us” and “them” - now it is just “us”. Extensive cross-border work has been going on in all areas of our business throughout the year, leveraging the growing breadth and depth of knowledge in our global family of merchants.
Leadership exchanges initiated last year between our North American and European divisions have delivered significant results. One of the best examples is the “merchandizing step-up” carried out in our European business units. During the year we have refreshed three quarters of our stores in Europe, based on merchandising best practices derived from our North American operations. That refresh has delivered noticeable top line growth in same-store merchandise sales in the otherwise declining European convenience market.
Through quarterly updates, market tours and annual vice president meetings, we have seen our business unit leaders regularly sharing the results of pilot projects, identifying best practices and aligning on proven concepts. Internationally, a centralized procurement function has ensured that we work as closely and effectively as possible with our many global partners.
Equally important, we have seen real evidence of a single, shared culture throughout our global organization. Vice presidents across the business have worked together to capture the essence of our company, coalescing it into what we call our family DNA. This provides a common language and a set of guidelines and expectations that can be applied across continents and the business, from the boardroom to the shop floor.

Annual Report © 2014 Alimentation Couche-Tard Inc. Page 7 of 81
2B2BEye-opening Offerings
In North America we have rolled out fresh food pilots in five markets. Customers are reacting well to these trials, delivering encouraging results in all locations and categories. Proprietary foods designed to cover eating occasions from early morning to late evening are planned for further trials across the U.S. and Canada.
Simply Great Coffee, our new European coffee concept, has been rolled out in most of our markets in Europe. It is creating a growing movement among coffee lovers on the road in these markets. Sites with the new offer have typically shown double-digit coffee sales growth.
Also in Europe, we have turned our attention to reviving the humble hot dog. Building on a trend for gourmet hot dogs, customers now find our Statoil hot dog on menu boards with local varieties, smothered with regional flavors and personalized with premium condiments. Lifting sales significantly, this reinvigorated offer has successfully increased both sales and margins in an otherwise stagnant category.
3B3BFueling growth
In general terms, road transportation fuel markets have been flat, slightly decreasing in Europe and showing only small increases in the U.S. and in Canada, largely as a result of increasing fuel efficiency and challenging macroeconomic conditions. Despite that, in most of our markets we have seen our same-store transportation fuel volumes improving and our market share growing.
Our proprietary fuel brand, milesTM, which was launched last year, has now been rolled out in five of our eight markets in Europe. The promise that “milesTM takes you further at no extra cost” has quickly gained traction in the markets where it has been introduced.
In April 2014, we introduced a replacement for the JET brand, previously licensed from a third party for our automat stations in Sweden and Denmark. Building on the customer promise that has been so successful for the JET brand - “Quick and easy” - INGO is attracting crowds with its unveiling in each region. The message for customers is “New name, same low price”, and it is generating promising customer feedback. Rebranding our existing JET stations to INGO in these markets is expected to be complete by the third quarter of fiscal 2015.
4B4BNetwork expansion
We have realized another strong year of organic growth. Altogether, a net total of 113 stores have been added to our network in 2014. 25 new stores were built and 166 acquired in North America and Europe.
Under an existing agreement with ExxonMobil dating from June 2011, we acquired 60 stores operated by independent operators. In addition, we acquired 9 stores in Illinois from Baron-Huot Oil Company; 23 stores in New Mexico from Albuquerque Convenience and Retail LLC; 11 stores in Florida and Georgia from Publix Super Markets Inc. and 10 additional company-operated stores through distinct transactions.
EVP Scandinavia Hans‐Olav Høidahl with Danish business
unit leader Pia Bach Henriksen at our most recent miles™
fuel brand launch
Annual Report © 2014 Alimentation Couche-Tard Inc. Page 8 of 81
Our International Franchise Group has enabled our Circle K brand to be seen in three new markets during the year including Honduras, Malaysia and the Philippines. In addition our Mexican operator, Circulo K, under its licensing agreement, has reached an agreement to acquire 878 stores in Mexico.
5B5BMarketing a cause
A recent international survey found that 62% of consumers appreciate and want to support companies that donate to important social causes. Our stores and stations are delivering on that today.
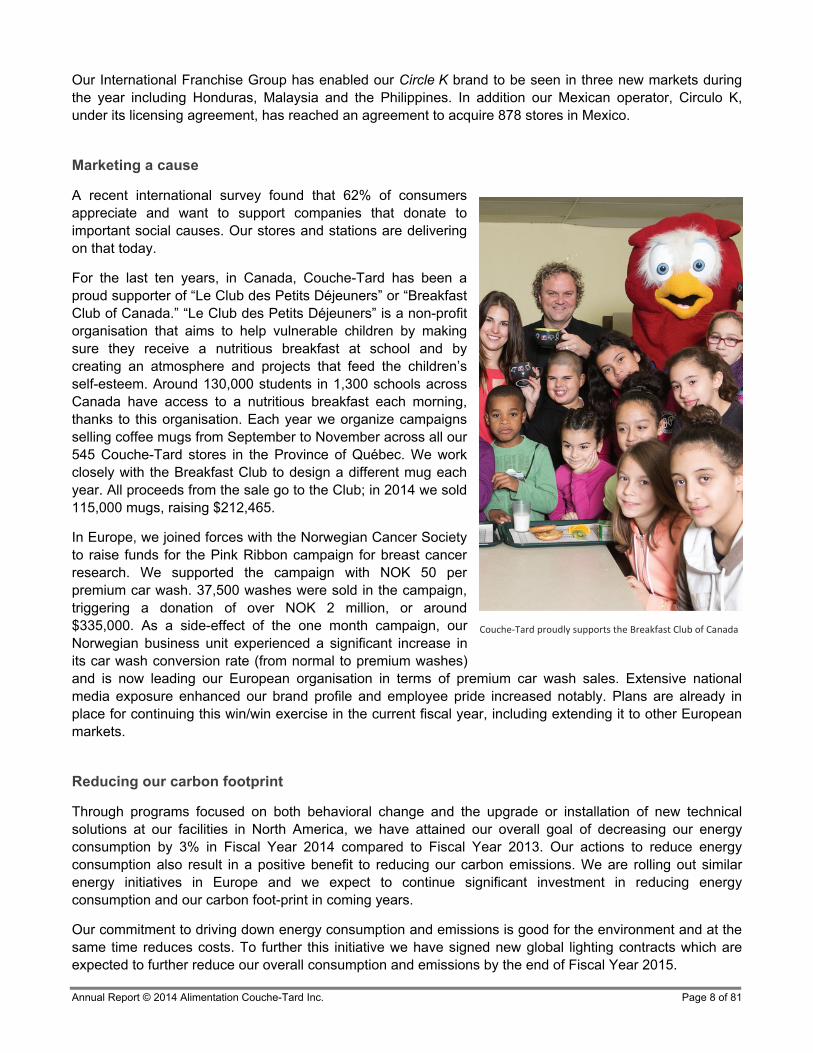
For the last ten years, in Canada, Couche-Tard has been a proud supporter of “Le Club des Petits Déjeuners” or “Breakfast Club of Canada.” “Le Club des Petits Déjeuners” is a non-profit organisation that aims to help vulnerable children by making sure they receive a nutritious breakfast at school and by creating an atmosphere and projects that feed the children’s self-esteem. Around 130,000 students in 1,300 schools across Canada have access to a nutritious breakfast each morning, thanks to this organisation. Each year we organize campaigns selling coffee mugs from September to November across all our 545 Couche-Tard stores in the Province of Québec. We work closely with the Breakfast Club to design a different mug each year. All proceeds from the sale go to the Club; in 2014 we sold 115,000 mugs, raising $212,465.
In Europe, we joined forces with the Norwegian Cancer Society to raise funds for the Pink Ribbon campaign for breast cancer research. We supported the campaign with NOK 50 per premium car wash. 37,500 washes were sold in the campaign, triggering a donation of over NOK 2 million, or around $335,000. As a side-effect of the one month campaign, our Norwegian business unit experienced a significant increase in its car wash conversion rate (from normal to premium washes) and is now leading our European organisation in terms of premium car wash sales. Extensive national media exposure enhanced our brand profile and employee pride increased notably. Plans are already in place for continuing this win/win exercise in the current fiscal year, including extending it to other European markets.
6B6BReducing our carbon footprint
Through programs focused on both behavioral change and the upgrade or installation of new technical solutions at our facilities in North America, we have attained our overall goal of decreasing our energy consumption by 3% in Fiscal Year 2014 compared to Fiscal Year 2013. Our actions to reduce energy consumption also result in a positive benefit to reducing our carbon emissions. We are rolling out similar energy initiatives in Europe and we expect to continue significant investment in reducing energy consumption and our carbon foot-print in coming years.
Our commitment to driving down energy consumption and emissions is good for the environment and at the same time reduces costs. To further this initiative we have signed new global lighting contracts which are expected to further reduce our overall consumption and emissions by the end of Fiscal Year 2015.
Couche‐Tard proudly supports the Breakfast Club of Canada

Annual Report © 2014 Alimentation Couche-Tard Inc. Page 9 of 81
7B7BFull steam ahead
With the rest of our executive leadership team, I share a strong belief in the DNA of Couche-Tard. Our stores are our livelihood. The customer experience we deliver is what generates value for our stakeholders. Every day, each one of us - whether we are on the shop floor or in a boardroom - must challenge ourselves to think like customers and act like owners to be competitive.
We are succeeding in every aspect of our business, in sales, margins and costs. Our strategies are proven and effective and we have an experienced management team that has shown it can deliver, time after time. We plan to continue our disciplined approach to cost, further strengthening our platform for growth both organically and through carefully-selected acquisitions in the coming years.
Together with the incredible teams around the world that make up the Couche-Tard family, I am proud to continue contributing to the company’s success.
Brian Hannasch Chief Operating Officer

Annual Report © 2014 Alimentation Couche-Tard Inc. Page 10 of 81
Raymond Paré Vice President & Chief Financial Officer
Building and improving resilience
Business continuity is often described as “just common sense”. It is about taking responsibility for your business and enabling it to stay on course for the long run. At Couche-Tard, building and improving business resilience is our focus in everything we do. This past year we have been in a process of attaining close and seamless coordination between several departments, groups, organizations, and systems in the integration of our European organisation. We have made great headway in streamlining our operations globally and reduced overhead as well as personnel costs, while keeping our eye on the ball of daily business and meeting our customers’ needs in all our markets.
As a result, Couche-Tard completed its sixth straight year of record earnings in 2014 and double-digit growth. Adjusted net earnings and cash flows from operations both grew by more than 23%. On a normalized basis, expenses increased by only 0.2%, return on capital employed reached 13.3% and return on equity 22.6%. And in a bit more than two years, our share has tripled in price.
Out-performing the Competition
It has been a year of growth for all aspects of our business. We have out-performed our fuel competitors, increasing volumes and gaining market share in generally flat fuel markets. We have out-performed our convenience competitors on same-store merchandise sales, also while gaining market share and we have achieved all this while working to drive down costs and realising further synergies.
Overall, excluding effect from currency translation, merchandise and service sales increased by about 5.8%. Road transportation fuel volume growth was strong, with an increase of 7.8% in the U.S., 3.6% in Canada and 16.6% in Europe. The growth in revenues was not at the expense of margin: excluding the effect from currency translation, total merchandise and service gross profit increased by 4.4%, thanks to a growing contribution from our fresh food offering. Fuel margins increased in Europe and Canada and, once again, our teams were successful at keeping costs under control. All of this, taken together, allowed us to record an adjusted EBITDA of $1,590.9 million, an increase of $205.1 million or 14.8% over fiscal 2013, despite the slight decrease in U.S. fuel margins net of the electronic mode of payment and unfavorable currency translation effect. Last but not least, net cash from operating activities for fiscal 2014 was $1,429.3 million, an increase of 23.1% over fiscal 2013, reflecting our strong earnings as well as efficient management of working capital. Note that the scale of the increases for our European operations stated here are in part due to 2014 being the first full year of incorporating those operations into the Corporation’s financial results.

Annual Report © 2014 Alimentation Couche-Tard Inc. Page 11 of 81
Discipline is the Key
Our disciplined approach to profitable growth and optimization continues to play a central role in our success. We can look back on a year of significant and steady development in our net earnings, against a backdrop of competitive market conditions in both North America and Europe.
These factors enabled us to significantly improve our balance sheet. In fiscal 2014, we reduced our adjusted net debt on EBITDAR (Earnings Before Interest, Taxation, Depreciation and Rentals) from 3.06 to 2.44. With our strong cash flows and our strong balance sheet, we were able to increase our quarterly dividend for the third time this year, an increase of 60%.
Leveraging our Global Family
In the past year, our operational momentum has continued to build. This is no small achievement in an organization where integration activities have been in full swing. Our experienced management team successfully walked the line between planning and analysis, and delivering on the daily demands of satisfying customers.
The implementation of our ERP system in Europe is complete and we are well into working as one team with one culture. Our work in the area of costs savings and synergy identification continues. We maintain our goal for annual synergies as previously announced.
Our benchmarking activities across the group paved the way for successful collaboration in fiscal 2014. We are leveraging our intellectual capital in concept development and operational excellence globally, as well as coordinating procurement and training. Our focus on lean operations - eliminating waste, optimizing labor utilization and focusing marketing spend - in all our stores contributed to these efforts. The result: increased product innovation, more satisfied customers and cost savings for the company as a whole.
Discipline Today, Discipline Tomorrow
We continue to balance our debt structure while developing our revolving credit facilities. We do this to maintain the health of our balance sheet and optimize our options for growth. The discipline this demands has resulted in an improvement of our return on capital employed (ROCE) by 230 basis points in just one year. Looking ahead, we see opportunities to improve our financial performance still further and retain our investment-grade rating in the markets.
Raymond Paré Vice President & Chief Financial Officer

Annual Report © 2014 Alimentation Couche-Tard Inc. Page 12 of 81
Management’s Discussion and Analysis
The purpose of this Management’s Discussion and Analysis (“MD&A”) is, as required by regulators, to explain management’s point of view on Alimentation Couche-Tard Inc.’s (“Couche-Tard”) financial condition and results of operations as well as its performance during the fiscal year ending April 27, 2014. More specifically, it aims to let the reader better understand our development strategy, performance in relation to objectives, future expectations and how we address risk and manage our financial resources. This MD&A also provides information to improve the reader’s understanding of the consolidated financial statements and related notes. It should therefore be read in conjunction with those documents. By “we”, “our”, “us” and “the Corporation”, we refer collectively to Couche-Tard and its subsidiaries.
Except where otherwise indicated, all financial information reflected herein is expressed in United States dollars (“US dollars”) and determined on the basis of International Financial Reporting Standards (“IFRS”) as issued by the International Accounting Standards Board (“IASB”). We also use measures in this MD&A that do not comply with IFRS. When such measures are presented, they are defined and the reader is informed. This MD&A should be read in conjunction with the annual consolidated financial statements and related notes included in our 2014 Annual Report, which, along with additional information relating to Couche-Tard, including the most recent Annual Information Form, is available on SEDAR at www.sedar.com and on our website at www.couche-tard.com/corporate.
Forward-Looking Statements
This MD&A includes certain statements that are “forward-looking statements” within the meaning of the securities laws of Canada. Any statement in this MD&A that is not a statement of historical fact may be deemed to be a forward-looking statement. When used in this MD&A, the words ”believe”, “could”, “should”, “intend”, “expect”, “estimate”, “assume” and other similar expressions are generally intended to identify forward-looking statements. It is important to know that the forward-looking statements in this MD&A describe our expectations as at July 7, 2014, which are not guarantees of the future performance of Couche-Tard or its industry, and involve known and unknown risks and uncertainties that may cause Couche-Tard’s or the industry’s outlook, actual results or performance to be materially different from any future results or performance expressed or implied by such statements. Our actual results could be materially different from our expectations if known or unknown risks affect our business, or if our estimates or assumptions turn out to be inaccurate. A change affecting an assumption can also have an impact on other interrelated assumptions, which could increase or diminish the effect of the change. As a result, we cannot guarantee that any forward-looking statement will materialize and, accordingly, the reader is cautioned not to place undue reliance on these forward-looking statements. Forward-looking statements do not take into account the effect that transactions or special items announced or occurring after the statements are made may have on our business. For example, they do not include the effect of sales of assets, monetization, mergers, acquisitions, other business combinations or transactions, asset write-downs or other charges announced or occurring after forward-looking statements are made.
Unless otherwise required by applicable securities laws, we disclaim any intention or obligation to update or revise the forward-looking statements, whether as a result of new information, future events or otherwise.
The foregoing risks and uncertainties include the risks set forth under “Business Risks” in our 2014 Annual Report as well as other risks detailed from time to time in reports filed by Couche-Tard with securities regulators in Canada.
Our Business
We are the leader in the Canadian convenience store industry. In the United States, we are the largest independent convenience store operator in terms of number of company-operated stores. In Europe, we are a leader in convenience store and road transportation fuel in Scandinavian countries and in the Baltic States while we have a growing presence in Poland.
As of April 27, 2014, our network comprises 6,241 convenience stores throughout North America, including 4,756 stores with road transportation fuel dispensing. Our North-American network consists of 13 business units, including nine in the United States covering 39 states and the District of Columbia and four in Canada covering all ten provinces. More than 60,000 people are employed throughout our network and at the service offices in North America.
In Europe, we operate a broad retail network across Scandinavia (Norway, Sweden, Denmark), Poland, the Baltics (Estonia, Latvia, Lithuania) and Russia with 2,258 stores as at April 27, 2014, the majority of which offer road transportation fuel and convenience products while the others are unmanned automated service-stations which offer road transportation fuel only. We also offer other products, including stationary energy, marine fuel, aviation fuel, lubricants and chemicals. We operate key fuel
Annual Report © 2014 Alimentation Couche-Tard Inc. Page 13 of 81
terminals and fuel depots in eight countries. Including employees at Statoil branded franchise stations, about 17,500 people work in our retail network, terminals and service offices across Europe.
In addition, under licensing agreements, about 4,600 stores are operated under the Circle K banner in 12 other countries worldwide (China, Guam, Honduras, Hong Kong, Indonesia, Japan, Macau, Malaysia, Mexico, Philippines, Vietnam and United Arab Emirates) which brings to slightly more than 13,100 the number of sites in our network.
Our mission is to offer our clients a quick and outstanding service by developing a customized and friendly relationship while still finding ways to surprise them on a daily basis. In this regard, we strive to meet the demands and needs of our clientele based on their regional requirements. To do so, we offer consumers food and beverage items, road transportation fuel and other high-quality products and services designed to meet clients’ demands in a clean and welcoming environment. Our positioning in the industry stems primarily from the success of our business model, which is based on a decentralized management structure, an ongoing comparison of best practices and operational expertise that is enhanced by our experience in the various regions of our network. Our positioning is also a result of our focus on in-store merchandise, as well as our continued investments in our stores.
Value creation
In the United States, the convenience store sector is fragmented and in a consolidation phase. We are participating in this process through our acquisitions and the market shares we gain when competitors close sites as well as by improving our offering. In Europe and Canada, the convenience store sector is often dominated by a few major players, including integrated oil companies. Some of these integrated oil companies are in the process of selling or are expected to sell their retail assets. We intend to study investment opportunities that might come to us through this process.
However, despite this context, acquisitions have to be concluded at reasonable conditions in order to create value for our Corporation and its shareholders. Therefore, we do not favour store count growth to the detriment of profitability. In addition to our participation in the consolidation phase of our sector and in the selling by integrated oil companies of their retail assets, it has to be noted that in recent years, organic contribution has played an important role in the growth of our net earnings. The on-going improvement of our offer, including fresh products, supply terms and efficiency of our business has been a highlight, especially with the absence of significant acquisitions and net growth in store count in the recent years, prior to the acquisition of Statoil Fuel & Retail. Thus, all these elements contributed to the growth in net earnings and to value creation for our shareholders and other stakeholders. We intend to continue in this direction.
Exchange Rate Data
We use the US dollar as our reporting currency which provides more relevant information given the predominance of our operations in the United States and the significant portion of our debt denominated in US dollars.
The following table sets forth information about exchange rates based upon closing rates expressed as US dollars per comparative currency unit:
12-week periods ended 52-week periods ended 53-week periods ended April 27, 2014 April 28, 2013 April 27, 2014 April 28, 2013 April 29, 2012Average for period
Canadian Dollar (1) 0.9045 0.9821 0.9439 0.9966 1.0051Norwegian Krone (2) 0.1659 0.1749 0.1665 0.1737 -Swedish Krone (2) 0.1542 0.1554 0.1533 0.1513 -Danish Krone (2) 0.1845 0.1757 0.1805 0.1730 -Zloty (2) 0.3289 0.3156 0.3200 0.3117 -Euro (2) 1.3770 1.3104 1.3466 1.2893 -Lats (3) - 1.8703 1.9002 1.8481 -Litas (2) 0.3989 0.3796 0.3897 0.3735 -Ruble (2) 0.0280 0.0325 0.0300 0.0320 -

Annual Report © 2014 Alimentation Couche-Tard Inc. Page 14 of 81
As at April 27, 2014 As at April 28, 2013Period end
Canadian Dollar 0.9061 0.9834Norwegian Krone (4) 0.1681 0.1734Swedish Krone (4) 0.1537 0.1543Danish Krone (4) 0.1858 0.1766Zloty (4) 0.3301 0.3163Euro (4) 1.3870 1.3170Lats (3) - 1.8822Litas (4) 0.4018 0.3814Ruble (4) 0.0281 0.0322
(1) Calculated by taking the average of the closing exchange rates of each day in the applicable period. (2) Average rate for the period from February 1st, 2014 to April 30, 2014 for the 12-week period ended April 27, 2014, from May 1st, 2013 to April 30, 2014 for the 52-week period
ended April 27, 2014, from February 1st, 2013 to April 30, 2013 for the 12-week period ended April 28, 2013 and from June 20, 2012 to April 30, 2013 for the 52-week period ended April 28, 2013. Calculated using the average exchange rate at the close of each day for the stated period.
(3) On January 1, 2014, Latvia changed its currency from Lats to Euro. The average rate is for the period from May 1st, 2013 to December 31, 2013 for the 52-week period ended April 27, 2014, from February 1st, 2013 to April 30, 2013 for the 12-week period ended April 28, 2013 and from June 20, 2012 to April 30, 2013 for the 52-week period ended April 28, 2013. Calculated using the average exchange rate at the close of each day for the stated period.
(4) As at April 30, 2014.
On January 1, 2014, Latvia changed its official currency from the Lats to Euro. Results from the Latvian operations prior to the conversion date were converted using the Lats exchange rates as described in footnote 3 above while results from the Latvian operations following this date were converted using Euro exchange rates. Balance sheet items from Latvian operations as at April 27, 2014 were converted using the Euro exchange rate. This change in currency did not materially affect our consolidated financial statements.
Considering we use the US dollar as our reporting currency, in our consolidated financial statements and in the present document, unless indicated otherwise, results from our Canadian, European and corporate operations are translated into US dollars using the average rate for the period. Unless otherwise indicated, variances and explanations related to variations in the foreign exchange rate and the volatility of the Canadian dollar and European currencies which we discuss in the present document are therefore related to the translation in US dollars of our Canadian, European and corporate operations results.
Fiscal 2014 Overview
On March 11, 2014, the Corporation’s Board of Directors approved a three-for-one split of all of the Corporation’s issued and outstanding Class “A” and “B” shares. This share split has been approved by regulatory authorities and was effective on April 14, 2014. Accordingly, all per share amounts in this document are presented on a comparable basis.
Net earnings amounted to $812.2 million for fiscal 2014, up 41.8% over fiscal 2013. Some items affected the results of fiscal 2014, mainly negative goodwill of $48.4 million, a non-recurring income tax recovery of $21.6 million over a foreign exchange loss only deductible and recognized for tax purposes, a net foreign exchange loss of $10.1 million, a $6.8 million impairment charge over a non-operational lubricant plant in Poland, an income tax recovery of $6.6 million over the decrease in the income tax rate in Norway and Denmark, as well as a curtailment gain on pension plans obligation. On the other hand, the results of fiscal 2013 included a non-recurring loss of $102.9 million on foreign exchange forward contracts, a non-recurring income tax recovery of $34.7 million, restructuring expenses of $34.0 million, a curtailment gain on pension plans obligation of $19.4 million, negative goodwill of $4.4 million as well as a net foreign exchange gain of $3.2 million.
Excluding these items as well acquisition costs from both periods, fiscal 2014 net earnings would have been approximately $766.0 million ($1.35 per share on a diluted basis) compared to $621.0 million ($1.11 per share on a diluted basis) for fiscal 2013, an increase of $145.0 million, or 23.3%. This strong increase is mainly attributable to the contribution from acquisitions, to the growth in both same-store merchandise revenues and road transportation fuel volumes, to higher road transportation fuel margins in Europe and in Canada as well as to our continuous focus on our costs. These items, which contributed to the growth in net earnings, were partially offset by a lower road transportation fuel margin in the United States, the negative net impact from the translation of revenues and expenses from our Canadian and European operations into the United States dollar following the appreciation of the United States dollar, namely against the Canadian dollar and the Norwegian Krone as well as by lower revenues following the divesture of our Liquid Petrolum Gas (“LPG”) business in December 2012.

Annual Report © 2014 Alimentation Couche-Tard Inc. Page 15 of 81
Statoil Fuel & Retail
Period results
Our results for the 12 and 52-week periods ended April 27, 2014 include those of Statoil Fuel & Retail for the period beginning February 1st, 2014 and ending April 30, 2014 and for the period beginning May 1st, 2013 and ending April 30, 2014, respectively. Our results for the 12 and 52-week periods ended April 28, 2013 include those of Statoil Fuel & Retail for the period beginning February 1st, 2013 and ending April 30, 2013 and for the period beginning June 20, 2012 and ending April 30, 2013, respectively. Thus, our results of the 52-week periods ended April 27, 2014 and April 28, 2013 include those of Statoil Fuel & Retail for a period of 365 and 315 days, respectively.
Our consolidated balance sheet and store count as of April 27, 2014 include Statoil Fuel & Retail’s balance sheet and store count as of April 30, 2014, as adjusted for significant transactions, if any, which occurred between those two dates.
The following table provides an overview of Statoil Fuel & Retail’s accounting periods that will be incorporated in our upcoming consolidated financial statements:
Couche-Tard Quarters Statoil Fuel & Retail Equivalent Accounting Periods Statoil Fuel & Retail Balance Sheet Date (1)
12-week period ending July 20, 2014 (1st quarter of fiscal 2015)
From May 1st, 2014 to July 20, 2014 June 30, 2014
12-week period ending October 12, 2014 (2nd quarter of fiscal 2015)
From July 21, 2014 to October 12, 2014 September 30, 2014
16-week period ending February 1st, 2015 (3rd quarter of fiscal 2015)
From October 13, 2014 to October 31, 2014, November and December 2014 and January 2015
January 31, 2015
12-week period ending April 26, 2015 (4th quarter of fiscal 2015)
February, March and April 2015 April 30, 2015
(5) The consolidated balance sheet will be adjusted for significant transactions, if any, occurring between Statoil Fuel & Retail balance sheet date and Couche-Tard balance sheet date.
We expect that the work toward the alignment of Statoil Fuel & Retail’s accounting periods with those of Couche-Tard should start once we have finalized replacing Statoil Fuel & Retail financial systems, which is now scheduled to be completed at the beginning of fiscal 2015.
Synergies and cost reduction initiatives
Since the acquisition of Statoil Fuel & Retail, we have been actively working on identifying and implementing available synergies and cost reduction opportunities. Our analysis shows that opportunities are numerous and promising. Some can be implemented immediately while others may take more time to implement since they require rigorous analysis and planning. The optimization of our new ERP system in Europe will also be required before we can put in place some of the identified opportunities. The goal is to find the right balance in order not to jeopardize ongoing activities and projects already underway.
During the 12-week period ended April 27, 2014, we recorded synergies and cost savings we estimated at approximately $21.0 million, before income taxes. These synergies and cost reductions mainly impacted operating, selling, administrative and general expenses as well as the cost of sales. Since the acquisition, we estimate that total realized annual synergies and cost savings amount to approximately $85.0 million, before income taxes. We believe these amounts do not necessarily represent the full annual impact of all of our initiatives.
These synergies and cost reductions came from a variety of sources including cost reductions following the delisting of Statoil Fuel & Retail, the renegotiation of certain agreements with our suppliers, the reduction of in-store costs and the restructuring of certain departments.
Our work for the identification and implementation of available synergies and cost reduction opportunities is far from over. Our teams continue to work actively on various projects that seem promising and which, along with the implementation of new systems, should allow us to achieve our objectives. We therefore maintain our goal of annual synergies ranging from $150.0 million to $200.0 million before the end of December 2015.
As our goal previously stated is considered a forward looking statement, we are required pursuant to securities laws, to clarify that our synergies and cost reductions estimate is based on a number of important factors and assumptions. Among other things, our synergies and cost savings objective is based on our comparative analysis of organizational structures and current level of spending across our network as well as on our ability to bridge the gap, where relevant. Our synergies and cost reduction objective is also based on our assessment of current contracts in Europe and North America and how we expect to be able to renegotiate these contracts to take advantage of our increased purchasing power. In addition, our synergies and

Annual Report © 2014 Alimentation Couche-Tard Inc. Page 16 of 81
cost reduction objective assumes that we will be able to establish and maintain an effective process for sharing best practices across our network. Finally, our objective is also based on our ability to implement effectively and timely a new ERP system. A significant change in these facts and assumptions could significantly impact our synergies and cost reductions estimate.
Issuance of Canadian dollar denominated senior unsecured notes
On August 21, 2013, we issued Canadian dollar denominated senior unsecured notes totalling CA$300.0 million, maturing August 21st, 2020 and bearing interest at a rate of 4.214%. Interest is payable semi-annually on August 21st and February 21st of each year and notional amount will be repaid at maturity.
In addition to allowing us to spread the maturities of a portion of our long-term debt, this issuance allows us to secure the interest rate of a portion of our long-term debt at favourable rates. The net proceeds from the issuance, which were approximately CA$298.3 million ($285.6 million), were used to repay a portion of our acquisition facility.
Impairment
During fiscal 2014, we recorded an impairment charge of $6.8 million for a non-operational lubricant production plant located in Ostroweic, Poland, due to challenging market conditions for this type of asset.
Network growth
Completed transactions
In June 2013, under the June 2011 agreement with ExxonMobil, we acquired 60 stores operated by independent operators along with the related road transportation fuel supply agreements and for which we own the land and building for all sites. Additionally, we were transferred 53 road transportation fuel supply agreements in connection with this same agreement. This transaction consisted of the last stage to close the June 2011 agreement with ExxonMobil. A negative goodwill of $41.6 million was recorded in relation with this transaction during fiscal 2014. Historically, those sites sold annually approximately 162.0 million gallons of road transportation fuel.
In September 2013, we acquired nine stores operating in Illinois, United States from Baron-Huot Oil Company. Eight of these stores are company-operated and one is operated by an independent operator. We own the land and building for eight sites while we lease these assets for the other site.
In December 2013, we completed the acquisition, from Publix Super Markets Inc., of 11 company-operated stores, nine of which are located in Florida and the other two in Georgia, United States. We own the land and buildings for eight sites and lease these assets for the other three sites.
In December 2013, we also completed the acquisition of 23 company-operated stores operating in New Mexico, United States from Albuquerque Convenience and Retail LLC. We own the land and buildings for all sites. In June 2014, subsequent to fiscal year 2014, we acquired 15 company operated-stores operating in South Carolina, United States from Garvin Oil Company. We own the land and buildings for all sites.
In addition, during fiscal 2014, we acquired ten additional company-operated stores through distinct transactions.
Available cash was used for these acquisitions.
Store construction
We completed the construction of 25 new stores and razed and rebuilt 14 stores during fiscal 2014. As of April 27, 2014, 14 stores were under constructions and should open in the upcoming quarters.
Additional changes to our network
During the first quarter of fiscal 2014, we, along with a third-party, formed a new corporation, Circle K Asia LLC (“Circle K Asia”), in which both parties hold a 50% interest. During the 12-week period ended July 21, 2013, each party made a capital contribution of $13.2 million. The total contribution was used to purchase a portion of Circle K’s international franchise agreements as well as a master franchise in Asia. Under the contract signed between the parties, we, under certain circumstances, may repurchase all of the other party’s shares in Circle K Asia. Consequently, the new corporation was fully consolidated in our consolidated financial statements and the third party’s interest was recorded under “Non-controlling interest” in the consolidated statements of earnings, changes in equity and consolidated balance sheet. Furthermore, we must, under certain circumstances, repurchase all of the third-party’s shares in Circle K Asia. Consequently, a redemption liability

Annual Report © 2014 Alimentation Couche-Tard Inc. Page 17 of 81
was recorded in our consolidated balance sheet. Circle K Asia should contribute to the expansion of our licensee’s network in Asia. We do not expect this transaction to have a significant impact on our financial performance.
In February, 2014, our Mexican operator, Circulo K, under its licensing agreement, has reached an agreement to acquire 878 stores in Mexico. We do not expect that this transaction will have a significant impact on our consolidated financial statements. As of April 27, 2014, this transaction has not been completed.
In May 2014, subsequent to fiscal 2014, we have completed, through Circle K Asia, a Circle K Master license agreement in India with RJ Corp for 25 years. The Circle K Master license addresses the four major Regions of India, including the major cities of Deli, Mumbai, Goa, Gujarat, Bangalore and Madras.
Summary of changes in our stores network during the fourth quarter and fiscal 2014
The following table presents certain information regarding changes in our stores network over the 12-week period ended April 27, 2014 (1):
12-week period ended April 27, 2014
Type of site Company-
operated (2) CODO (3) DODO (4) Franchised and
other affiliated (5) Total
Number of sites, beginning of period 6,234 614 534 1,102 8,484
Acquisitions 3 - - - 3
Openings / constructions / additions 17 1 3 44 65
Closures / disposals / withdrawals (23) (2) (7 ) (21) (53)
Store conversion 5 (4) (1 ) - -
Number of sites, end of period 6,236 609 529 1,125 8,499
Number of automated service stations included in the period end figures (6) 912 - 27 - 939
The following table presents certain information regarding changes in our stores network over the 52-week period ended April 27, 2014 (1):
52-week period ended April 27, 2014
Type of site Company-
operated (2) CODO (3) DODO (4) Franchised and
other affiliated (5) Total
Number of sites, beginning of period 6,235 579 478 1,094 8,386
Acquisitions 51 61 54 - 166
Openings / constructions / additions 41 6 28 135 210
Closures / disposals / withdrawals (117) (11) (29 ) (106) (263)
Store conversion 26 (26) (2 ) 2 -
Number of sites, end of period 6,236 609 529 1,125 8,499
(1) These figures include 50% of the stores operated through RDK, a joint venture. (2) Sites for which the real estate is controlled by Couche-Tard (through ownership or lease agreements) and for which the stores (and/or the service-stations) are operated by
Couche-Tard or one of its commission agent. (3) Sites for which the real estate is controlled by Couche-Tard (through ownership or lease agreements) and for which the stores (and/or the service-stations) are operated by an
independent operator in exchange for rent and to which Couche-Tard supplies road transportation fuel through supply contracts. Some of these sites are subject to a franchise agreement, licensing or other similar agreement under one of our main or secondary banners.
(4) Sites controlled and operated by independent operators to which Couche-Tard supplies road transportation fuel through supply contracts. Some of these sites are subject to a franchise agreement, licensing or other similar agreement under one of our main or secondary banners.
(5) Stores operated by an independent operator through a franchising, licensing or another similar agreement under one of our main or secondary banners. (6) These sites sell road transportation fuel only.
In addition, under licensing agreements, about 4,600 stores are operated under the Circle K banner in 12 other countries worldwide (China, Guam, Honduras, Hong Kong, Indonesia, Japan, Macau, Malaysia, Mexico, Philippines, Vietnam and United Arab Emirates) which brings to more than 13,100 the number of sites in our network.
Dividends
The Board of Directors (“the Board”) decided to increase the quarterly dividend by CA0.67¢ per share to CA4.0¢ per share, an increase of 20.0%.
During its July 7, 2014 meeting, the Board of Directors declared a quarterly dividend of CA4.0¢ per share for the fourth quarter of fiscal 2014 to shareholders on record as at July 16, 2014 and approved its payment for July 30, 2014. This is an eligible dividend within the meaning of the Income Tax Act of Canada.
During fiscal 2014, the Board declared total dividends CA13.6¢ per share.

Annual Report © 2014 Alimentation Couche-Tard Inc. Page 18 of 81
Outstanding shares and stock options
As at July 4, 2014, Couche-Tard had 148,101,840 Class A multiple voting shares and 417,655,558 Class B subordinate voting shares issued and outstanding. In addition, as at the same date, Couche-Tard had 3,505,905 outstanding stock options for the purchase of Class B subordinate voting shares.
Statement of Earnings Categories
Merchandise and Service Revenues. In-store merchandise revenues are comprised primarily of the sale of tobacco products, fresh food products, including quick service restaurants, beer/wine, grocery items, candy, snacks and various beverages. Merchandise sales in Europe also include wholesale of merchandise and goods to certain independent operators and franchisees made from our distribution center. Service revenues include fees from automatic teller machines, sales of calling cards and gift cards, revenues from car washes, the commission on sale of lottery tickets and issuance of money orders, fees for cashing cheques as well as sales of postage stamps and bus tickets. Service revenues also include franchise fees, license fees from affiliates and royalties from franchisees.
Road Transportation Fuel Revenues. We include in our revenues the total dollar amount of road transportation fuel sales, including any embedded taxes when they are included in the purchase price, if we take ownership of the road transportation fuel inventory. In the United States and in Europe, in some instances, we purchase road transportation fuel and sell it to certain independent store operators at cost plus a mark-up. We record the full value of these revenues (cost plus mark-up) as road transportation fuel revenues. Where we act as a selling agent for a petroleum distributor, only the commission we earn is recorded as revenue.
Other Income. Other income includes the sale of stationary energy, marine and aviation fuel, lubricants and chemical products. Other income also includes rent revenue from operating leases for certain land and buildings we own as well as car rental revenues.
Gross Profit. Gross profit consists mainly of revenues less the cost of merchandise and road transportation fuel sold. Cost of sales is mainly comprised of the specific cost of merchandise and road transportation fuel sold, including applicable freight less vendor rebates. For in-store merchandise, the cost of inventory is generally determined using the retail method (retail price less a normal margin), and for road transportation fuel, it is generally determined using the average cost method. The road transportation fuel gross margin for stores generating commissions corresponds to the sales commission.
Operating, Selling, Administrative and General Expenses. The primary components of operating, selling, administrative and general expenses are labour, net occupancy costs, electronic payment modes fees, commissions to dealers and overhead.
Key performance indicators used by management, which can be found under “Analysis of consolidated results for the fiscal year ended April 27, 2014 - Other Operating Data”, are merchandise and service gross margin, growth of same-store merchandise revenues, road transportation fuel gross margin and growth of same-store road transportation fuel volume, return on equity and return on capital employed.

Annual Report © 2014 Alimentation Couche-Tard Inc. Page 19 of 81
Summary analysis of consolidated results for the fourth quarter of fiscal 2014
The following table highlights certain information regarding our operations for the 12-week periods ended April 27, 2014 and April 28, 2013.
(In millions of US dollars, unless otherwise stated)
12-week period endedApril 27, 2014
12-week period ended April 28, 2013 Change %
Revenues 8,952.3 8,776.0 2.0
Operating income 154.3 154.6 14.0
Net earnings 145.1 146.4 (0.9)
Selected Operating Data:
Merchandise and service gross margin (1):
Consolidated 34.4% 34.3% 0.1
United States 33.1% 32.7% 0.4
Europe 42.9% 43.7% (0.8)
Canada 32.5% 33.1% (0.6)
Growth of same-store merchandise revenues (2) (3):
United States 4.4% 0.1%
Europe 2.5% -
Canada 1.6% 0.9%
Road transportation fuel gross margin:
United States (cents per gallon) (3) 14.85 19.30 (23.1)
Europe (cents per litre) (4) 10.54 9.83 7.2
Canada (CA cents per litre) (3) 5.86 6.01 (2.5)
Growth (decrease) of same-store road transportation fuel volume (3):
United States 2.8% 1.1%
Europe 3.2% -
Canada 1.7% (1.4%)
(1) Includes other revenues derived from franchise fees, royalties and rebates on some purchases made by franchisees and licensees. (2) Does not include services and other revenues (as described in footnote 1 above). Growth in Canada and Europe is calculated based on local currencies. (3) For company-operated stores only. (4) Total road transportation fuel.
Revenues
Our revenues were $9.0 billion in the fourth quarter of fiscal 2014, up $176.3 million, an increase of 2.0%, mainly attributable to the contribution from acquisitions as well as by the nice growth in same-store merchandise revenues and road transportation fuel volume in both North America and Europe. These items contributing to the growth in revenues were partly offset by lower road transportation fuel average retail prices in the United States, by the negative net impact from the translation of revenues from our Canadian and European operations into US dollars as well as by the divesture and closure of stores as part of our continuous work to improve the quality of our network.
More specifically, the growth of merchandise and service revenues for the fourth quarter of fiscal 2014 was $26.3 million or 1.5%. Excluding the negative impact from the translation of our European and Canadian operations into US dollars, which was approximately $32.0 million, consolidated merchandise and service sales increased by $58.3 million. This increase is attributable to the contribution from acquisitions which amounted to approximately $10.0 million as well as to strong organic growth. Same-store merchandise revenues increased by 4.4% in the United States and by 1.6% in Canada. Our performance in the United States is noteworthy when compared to the performance of the convenience store industry and is attributable to our dynamic merchandising strategies as well as to the investments we made to enhance service and the offering of products in our stores. Our performance in the United States is even more impressive considering we were able to increase store traffic without investing as much in our margins as in previous quarters. In Europe, the exchange of best practices, the implementation of new and sustainable merchandising strategies as well as the investments made through extensive marketing campaigns to promote in-store offering allowed us to turn around the negative sales trend that existed when we acquired Statoil Fuel & Retail. Consequently, for a sixth consecutive quarter, same-store merchandise revenues in Europe posted a growth which was of 2.5% for the fourth quarter, driven by strong fresh food services and coffee sales.
Road transportation fuel revenues increased by $145.9 million or 2.3% in the fourth quarter of fiscal 2014. Excluding the negative net impact from the translation of revenues from our Canadian and European operations into US dollars, which amounted to approximately $59.0 million, road transportation fuel revenues increased by $204.9 million or 3.2%. This increase was mainly attributable to the contribution from acquisitions of approximately $156.0 million and to organic growth. In the
Annual Report © 2014 Alimentation Couche-Tard Inc. Page 20 of 81
United States and in Canada, same-store road transportation fuel volume increased by 2.8% and 1.7%, respectively. This was also the sixth consecutive quarter during which same-store road transportation fuel volume showed positive development in Europe where same-store road transportation fuel volume increased by 3.2% which represents a strong improvement over the trend our that European network was posting before we acquired Statoil Fuel & Retail. Our new fuel brand “milesTM” which we launched in some of our European markets is delivering encouraging results and was again a nice contributor to this quarter performance. Organic growth and the contribution from acquisitions were partly offset by lower average road transportation fuel retail price in the United States.
On a consolidated basis, the variations in average road transportation fuel prices had a negative impact on revenues of approximately $100.0 million. The impact of the lower average retail price of road transportation fuel in the United States was partly offset by the impact of the higher average price in Europe and in Canada as shown in the following table, starting with the first quarter of the fiscal year ended April 28, 2013:
Quarter 1st 2nd 3rd 4thWeighted
average52-week period ended April 27, 2014 United States (US dollars per gallon) 3.51 3.45 3.24 3.47 3.41 Europe (US cents per litre) 100.72 103.25 107.49 104.11 104.38 Canada (CA cents per litre) 114.53 117.05 113.11 118.74 115.6352-week period ended April 28, 2013 United States (US dollars per gallon) 3.49 3.65 3.35 3.61 3.51 Europe (US cents per litre) - 103.96 104.71 103.80 104.21 Canada (CA cents per litre) 112.62 117.41 110.43 115.65 113.77
Other revenues were quite stable with a slight increase of $4.1 million in the fourth quarter of fiscal 2014.
Gross profit
In the fourth quarter of fiscal 2014, the consolidated merchandise and service gross margin was $616.0 million, an increase of $10.1 million or 1.7% compared with the corresponding quarter of fiscal 2013. Excluding the negative impact from the translation of our European and Canadian operations into US dollars, which was approximately $11.0 million, consolidated merchandise and service gross margin increased by $21.1 million or 3.5%. This increase is attributable, in part, to the contribution from acquisitions which amounted to approximately $3.0 million. In the United States, the gross margin was up 0.4% from 32.7% to 33.1% while it decreased by 0.6% in Canada, to 32.5% and by 0.8% in Europe to 42.9%. Overall, this performance reflects changes in the product-mix, the modifications we brought to our supply terms as well as our merchandising strategy in line with market competitiveness and economic conditions within each market. More specifically, in the United States, the increase in gross margin as a percentage of sales mainly reflects the impact of the shift of revenues toward higher margin categories, including a strong growth in fresh food. In Canada, in addition to the impact of our pricing strategies aimed at increasing store traffic, the decrease in margin as a percentage of sales was caused by changes in our product mix. In Europe, the margin as a percentage of sales was negatively impacted by lower carwash sales due to challenging weather in Scandinavia compared to the previous year, to changes in our product mix as well as to the impact of our pricing strategies to improve the value perception by our customers.
In the fourth quarter of fiscal 2014, the road transportation fuel gross margin for our company-operated stores in the United States decreased by 4.45 ¢ per gallon, from 19.30 ¢ per gallon last year to 14.85 ¢ per gallon this year. In Canada, the gross margin slightly decreased to CA5.86 ¢ per litre compared with CA6.01 ¢ per litre for the fourth quarter of fiscal 2013. In Europe, the total road transportation fuel gross margin was 10.54 ¢ per litre for the fourth quarter of fiscal 2014, an increase of 0.71 ¢ per litre compared with 9.83 ¢ per litre for the fourth quarter of fiscal 2013. The road transportation fuel gross margin of our company-operated stores in the United States as well as the impact of expenses related to electronic payment modes for the last eight quarters, starting with the first quarter of fiscal year ended April 28, 2013, were as follows:
(US cents per gallon) Quarter 1st 2nd 3rd 4th
Weighted average
52-week period ended April 27, 2014 Before deduction of expenses related to electronic payment modes 19.42 21.56 17.02 14.85 18.11 Expenses related to electronic payment modes 4.99 5.04 4.79 4.98 4.94 After deduction of expenses related to electronic payment modes 14.43 16.52 12.23 9.87 13.18
52-week period ended April 28, 2013 Before deduction of expenses related to electronic payment modes 23.20 15.20 17.80 19.30 18.77 Expenses related to electronic payment modes 4.97 5.15 4.79 5.03 4.97 After deduction of expenses related to electronic payment modes 18.23 10.05 13.01 14.27 13.80
Annual Report © 2014 Alimentation Couche-Tard Inc. Page 21 of 81
As demonstrated by the table above, although road transportation fuel margin can be volatile from a quarter to another, they tend to normalize on an annual basis.
Operating, selling, administrative and general expenses
For the fourth quarter of fiscal 2014, operating, selling, administrative and general expenses increased by 0.8% compared with the fourth quarter of fiscal 2013 and increased by 1.5% if we exclude certain items, as demonstrated by the following table:
12-week period ended April 27, 2014
Total variance as reported 0.8% Subtract:
Increase from incremental expenses related to acquisitions 0.7% Increase from higher electronic payment fees, excluding acquisitions 0.3% Decrease from the net impact of foreign exchange translation (1.7%)
Remaining variance 1.5%
The variance for the fourth quarter of fiscal 2014 is mainly due higher expenses to support our organic growth and normal inflation. We continue to favour a tight control of our costs throughout the organization while making sure to maintain the quality of the service we offer our clients.
In Europe, expense level is still affected by the implementation of a new IT infrastructure and the rollout of an ERP system. Our IT costs should continue to go down progressively over the course of the next quarters.
Earnings before interests, taxes, depreciation, amortization and impairment (EBITDA) and adjusted EBITDA
During the fourth quarter of fiscal 2014, EBITDA increased by 1.5% compared to the corresponding period of the previous fiscal year, reaching $300.2 million. Net of acquisition costs recorded to earnings, acquisitions contributed approximately $7.0 million to EBITDA, while the variation in exchange rates had a negative impact of approximately $5.0 million.
Excluding the restructuring expenses, the curtailment gain on certain defined benefits pension plans obligation as well as the negative goodwill from both comparable periods, the fourth quarter of fiscal 2014 adjusted EBITDA decreased by $7.5 million or 2.4% compared to the corresponding period of the previous fiscal year, totalling $300.0 million.
It should be noted that EBITDA and adjusted EBITDA are not performance measures defined by IFRS, but we, as well as investors and analysts, use these measures to evaluate the Corporation’s financial and operating performance. Note that our definition of these measures may differ from the one used by other public corporations:
12-week period ended (in millions of US dollars) April 27, 2014 April 28, 2013
Net earnings, as reported 145.1 146.4Add:
Income taxes (13.8 ) (9.5) Net financial expenses 26.9 20.7
Depreciation and amortization and impairment of property and equipment and other assets 142.0 138.1EBITDA 300.2 295.7Remove:
Restructuring costs - 34.0Curtailment gain on pension plan obligation - (19.4) Negative goodwill (0.2 ) (2.8)
Adjusted EBITDA 300.0 307.5
Depreciation, amortization and impairment of property and equipment and other assets
For the fourth quarter of fiscal 2014, depreciation, amortization and impairment expense increased due to investments made through acquisitions, replacement of equipment, addition of new stores and ongoing improvement of our network.
Net financial expenses
The fourth quarter of fiscal 2014 shows net financial expenses of $26.9 million, an increase of $6.2 million compared to the fourth quarter of fiscal 2013. Excluding the net foreign exchange loss of $8.7 million and the net foreign exchange gain of $6.8 million recorded respectively in the fourth quarter of fiscal 2014 and in the fourth quarter of fiscal 2013, the decrease in net financial expenses is $9.3 million. The decrease is mainly attributable to the reduction of our long-term debt following
Annual Report © 2014 Alimentation Couche-Tard Inc. Page 22 of 81
repayments we made on our revolving and acquisition facilities partly offset by the higher average effective interest rate of our senior unsecured notes compared with the average effective rate of our acquisition facility. With respect to the net foreign exchange loss of $8.7 million, it is mainly due to the impact of the exchange rate fluctuations on certain inter-company balances and external long term debt as well as to the impact of exchange rates fluctuations on US dollars denominated sales made by our European operations.
Income taxes
The fourth quarter of fiscal 2014 shows an income tax recovery of $13.8 million, compared to an income tax recovery of $9.5 million for the corresponding quarter of the previous year. The income tax recovery in the fourth quarter of fiscal 2014 emanated mainly from a foreign loss only deductible and recognized for tax purposes as well as from the effect on deferred income taxes of a decrease in our statutory income tax rate in Norway and in Denmark. The income tax recovery in the fourth quarter of fiscal 2013 emanated mainly from the effect on deferred income taxes of a decrease in our statutory income tax rate in Sweden.
Excluding those items, the income tax rate for the fourth quarter of fiscal 2014 would have been 11.0% compared to a rate of 18.4% for the fourth quarter of the previous fiscal year.
Net earnings
We closed the fourth quarter of fiscal 2014 with net earnings of $145.1 million, compared to $146.4 million for the fourth quarter of the previous fiscal year. Diluted net earnings per share stood at $0.25, compared to $0.26 for the previous year. The translation of revenues from our Canadian and European operations into the US dollars had a negative impact of approximately $3.0 million on net earnings of the fourth quarter of fiscal 2014.
Excluding from the fourth quarter of fiscal 2014 earnings the non-recurring income tax recovery on a foreign loss only deductible and recognized for tax purposes and from the decrease in our statutory tax rate in Norway and in Denmark, the net foreign exchange loss, the negative goodwill as well as acquisition costs and excluding from the fourth quarter of fiscal 2013 earnings the restructuring costs, the curtailment gain on defined benefits pension plans obligation, acquisition costs, the non-recurring income tax recovery from the decrease in our statutory income tax rate in Sweden, the negative goodwill as well as the net foreign exchange gain, the fourth quarter of fiscal 2014 net earnings would have been approximately $123.0 million, compared to $116.0 million, an increase of $7.0 million. Adjusted diluted net earnings per share were $0.22 for the fourth quarter of fiscal 2014 compared to $0.20 for the corresponding period of fiscal 2013, an increase of 10%.
Annual Report © 2014 Alimentation Couche-Tard Inc. Page 23 of 81
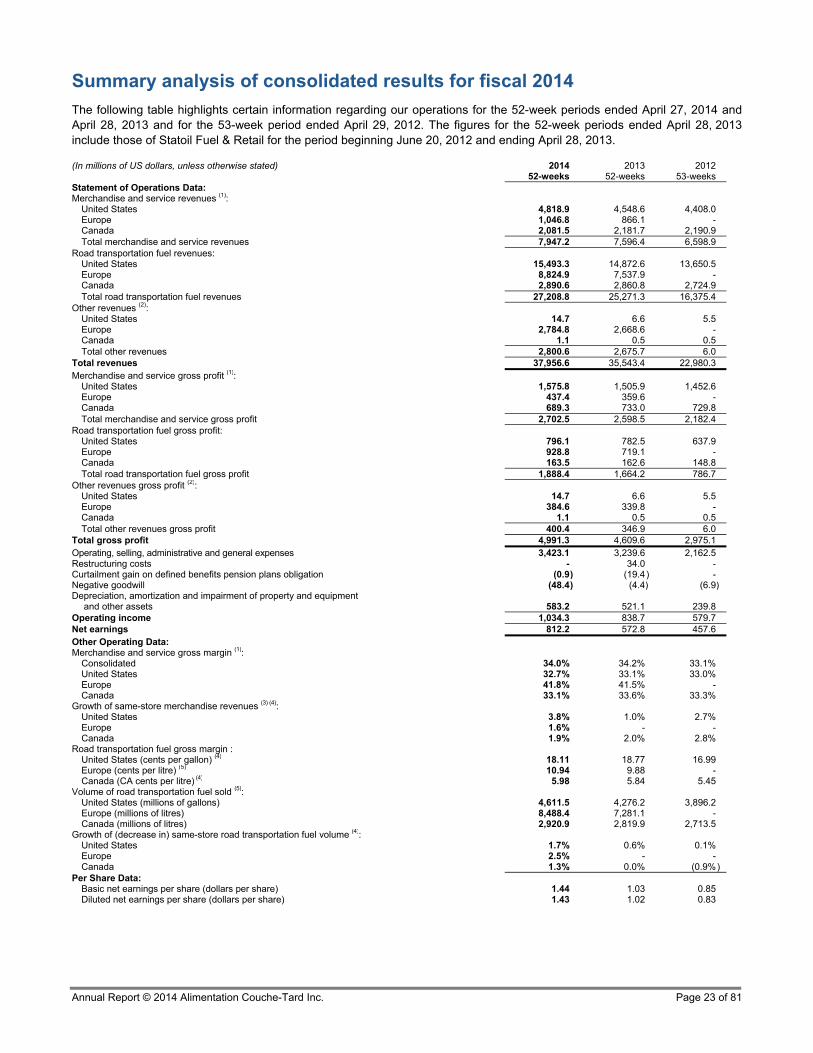
Summary analysis of consolidated results for fiscal 2014
The following table highlights certain information regarding our operations for the 52-week periods ended April 27, 2014 and April 28, 2013 and for the 53-week period ended April 29, 2012. The figures for the 52-week periods ended April 28, 2013 include those of Statoil Fuel & Retail for the period beginning June 20, 2012 and ending April 28, 2013.
(In millions of US dollars, unless otherwise stated) 201452-weeks
2013 52-weeks
201253-weeks
Statement of Operations Data: Merchandise and service revenues (1):
United States 4,818.9 4,548.6 4,408.0Europe 1,046.8 866.1 -Canada 2,081.5 2,181.7 2,190.9Total merchandise and service revenues 7,947.2 7,596.4 6,598.9
Road transportation fuel revenues: United States 15,493.3 14,872.6 13,650.5Europe 8,824.9 7,537.9 -Canada 2,890.6 2,860.8 2,724.9Total road transportation fuel revenues 27,208.8 25,271.3 16,375.4
Other revenues (2): United States 14.7 6.6 5.5Europe 2,784.8 2,668.6 -Canada 1.1 0.5 0.5Total other revenues 2,800.6 2,675.7 6.0
Total revenues 37,956.6 35,543.4 22,980.3Merchandise and service gross profit (1):
United States 1,575.8 1,505.9 1,452.6Europe 437.4 359.6 -Canada 689.3 733.0 729.8Total merchandise and service gross profit 2,702.5 2,598.5 2,182.4
Road transportation fuel gross profit: United States 796.1 782.5 637.9Europe 928.8 719.1 -Canada 163.5 162.6 148.8Total road transportation fuel gross profit 1,888.4 1,664.2 786.7
Other revenues gross profit (2): United States 14.7 6.6 5.5Europe 384.6 339.8 -Canada 1.1 0.5 0.5Total other revenues gross profit 400.4 346.9 6.0
Total gross profit 4,991.3 4,609.6 2,975.1Operating, selling, administrative and general expenses 3,423.1 3,239.6 2,162.5Restructuring costs - 34.0 -Curtailment gain on defined benefits pension plans obligation (0.9 ) (19.4 ) -Negative goodwill (48.4) (4.4 ) (6.9) Depreciation, amortization and impairment of property and equipment
and other assets 583.2 521.1 239.8Operating income 1,034.3 838.7 579.7Net earnings 812.2 572.8 457.6Other Operating Data: Merchandise and service gross margin (1):
Consolidated 34.0% 34.2% 33.1%United States 32.7% 33.1% 33.0%Europe 41.8% 41.5% - Canada 33.1% 33.6% 33.3%
Growth of same-store merchandise revenues (3) (4): United States 3.8% 1.0% 2.7%Europe 1.6% - -Canada 1.9% 2.0% 2.8%
Road transportation fuel gross margin : United States (cents per gallon) (4) 18.11 18.77 16.99Europe (cents per litre) (5) 10.94 9.88 -Canada (CA cents per litre) (4) 5.98 5.84 5.45
Volume of road transportation fuel sold (5): United States (millions of gallons) 4,611.5 4,276.2 3,896.2Europe (millions of litres) 8,488.4 7,281.1 -Canada (millions of litres) 2,920.9 2,819.9 2,713.5
Growth of (decrease in) same-store road transportation fuel volume (4): United States 1.7% 0.6% 0.1%Europe 2.5% - -Canada 1.3% 0.0% (0.9%)
Per Share Data: Basic net earnings per share (dollars per share) 1.44 1.03 0.85Diluted net earnings per share (dollars per share) 1.43 1.02 0.83
Annual Report © 2014 Alimentation Couche-Tard Inc. Page 24 of 81
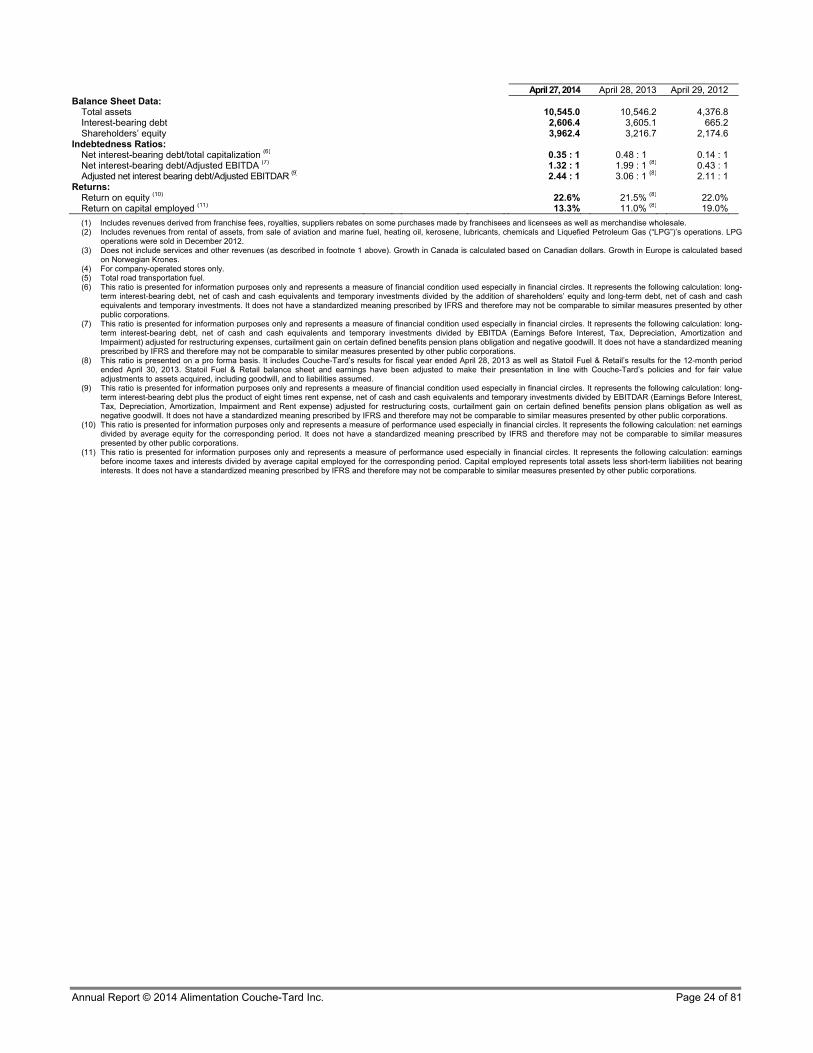
April 27, 2014 April 28, 2013 April 29, 2012Balance Sheet Data:
Total assets 10,545.0 10,546.2 4,376.8Interest-bearing debt 2,606.4 3,605.1 665.2Shareholders’ equity 3,962.4 3,216.7 2,174.6
Indebtedness Ratios: Net interest-bearing debt/total capitalization (6) 0.35 : 1 0.48 : 1 0.14 : 1Net interest-bearing debt/Adjusted EBITDA (7) 1.32 : 1 1.99 : 1 (8) 0.43 : 1Adjusted net interest bearing debt/Adjusted EBITDAR (9) 2.44 : 1 3.06 : 1 (8) 2.11 : 1
Returns: Return on equity (10) 22.6% 21.5% (8) 22.0%Return on capital employed (11) 13.3% 11.0% (8) 19.0%
(1) Includes revenues derived from franchise fees, royalties, suppliers rebates on some purchases made by franchisees and licensees as well as merchandise wholesale. (2) Includes revenues from rental of assets, from sale of aviation and marine fuel, heating oil, kerosene, lubricants, chemicals and Liquefied Petroleum Gas (“LPG”)’s operations. LPG
operations were sold in December 2012. (3) Does not include services and other revenues (as described in footnote 1 above). Growth in Canada is calculated based on Canadian dollars. Growth in Europe is calculated based
on Norwegian Krones. (4) For company-operated stores only. (5) Total road transportation fuel. (6) This ratio is presented for information purposes only and represents a measure of financial condition used especially in financial circles. It represents the following calculation: long-
term interest-bearing debt, net of cash and cash equivalents and temporary investments divided by the addition of shareholders’ equity and long-term debt, net of cash and cash equivalents and temporary investments. It does not have a standardized meaning prescribed by IFRS and therefore may not be comparable to similar measures presented by other public corporations.
(7) This ratio is presented for information purposes only and represents a measure of financial condition used especially in financial circles. It represents the following calculation: long-term interest-bearing debt, net of cash and cash equivalents and temporary investments divided by EBITDA (Earnings Before Interest, Tax, Depreciation, Amortization and Impairment) adjusted for restructuring expenses, curtailment gain on certain defined benefits pension plans obligation and negative goodwill. It does not have a standardized meaning prescribed by IFRS and therefore may not be comparable to similar measures presented by other public corporations.
(8) This ratio is presented on a pro forma basis. It includes Couche-Tard’s results for fiscal year ended April 28, 2013 as well as Statoil Fuel & Retail’s results for the 12-month period ended April 30, 2013. Statoil Fuel & Retail balance sheet and earnings have been adjusted to make their presentation in line with Couche-Tard’s policies and for fair value adjustments to assets acquired, including goodwill, and to liabilities assumed.
(9) This ratio is presented for information purposes only and represents a measure of financial condition used especially in financial circles. It represents the following calculation: long-term interest-bearing debt plus the product of eight times rent expense, net of cash and cash equivalents and temporary investments divided by EBITDAR (Earnings Before Interest, Tax, Depreciation, Amortization, Impairment and Rent expense) adjusted for restructuring costs, curtailment gain on certain defined benefits pension plans obligation as well as negative goodwill. It does not have a standardized meaning prescribed by IFRS and therefore may not be comparable to similar measures presented by other public corporations.
(10) This ratio is presented for information purposes only and represents a measure of performance used especially in financial circles. It represents the following calculation: net earnings divided by average equity for the corresponding period. It does not have a standardized meaning prescribed by IFRS and therefore may not be comparable to similar measures presented by other public corporations.
(11) This ratio is presented for information purposes only and represents a measure of performance used especially in financial circles. It represents the following calculation: earnings before income taxes and interests divided by average capital employed for the corresponding period. Capital employed represents total assets less short-term liabilities not bearing interests. It does not have a standardized meaning prescribed by IFRS and therefore may not be comparable to similar measures presented by other public corporations.

Annual Report © 2014 Alimentation Couche-Tard Inc. Page 25 of 81
Revenues
Our revenues were $38.0 billion in fiscal 2014, up $2.4 billion, an increase of 6.8%, mainly attributable to the contribution from acquisitions as well as by the growth in same-store merchandise revenues and road transportation fuel volume in both North America and Europe. These items contributing to the growth in revenues were partly offset by the divestiture of our European Liquefied Petroleum Gas (“LPG”) business in December 2012, to lower average road transportation fuel retail prices in the United States as well as to the negative net impact from the translation of revenues from our Canadian and European operations into US dollars.
More specifically, the growth of merchandise and service revenues for fiscal 2014 was $350.8 million or 4.6%. Excluding the negative impact from the translation of our European and Canadian operations into US dollars, which was approximately $91.0 million, consolidated merchandise and service sales increased by $441.8 million. This increase is attributable to the contribution from acquisitions which amounted to approximately $309.0 million as well as to organic growth. Same-store merchandise revenues increased by 3.8% in the United States and 1.9% in Canada. Those increases in same-store merchandise sales are attributable to our merchandising strategies, to the economic conditions in each of these two markets as well as to the investments we made to enhance service and the offering of products in our stores. For a large part of the fiscal year, we favoured pricing strategies aimed at boosting in-store traffic which helped us gain momentum in terms of transactions count while the fresh food category continued to post a nice growth in several of our markets. In Europe, the exchange of best practices, the implementation of new and sustainable merchandising strategies as well as the investments made through extensive marketing campaigns to promote in-store offering allowed us to turn around the negative sales trend that existed when we acquired Statoil Fuel & Retail. As a consequence, same-store merchandise revenues in Europe posted a growth of 1.6% for fiscal 2014, driven by strong fresh food and coffee sales.
Road transportation fuel revenues increased by $1.9 billion or 7.7% in fiscal 2014. Excluding the negative net impact from the translation of revenues from our Canadian and European operations into US dollars which amounted to approximately $110.0 million, road transportation fuel revenues increased by $2.0 billion or 8.1%. Acquisitions contributed to an increase in revenues of approximately $2,563.0 million while same-store road transportation fuel volume increased by 1.7% in the United States, by 2.5% in Europe and by 1.3% in Canada. In Europe, this same-store road transportation fuel volume increase is a strong improvement over the trend our European network was posting before we acquired Statoil Fuel & Retail. Our new fuel brand “milesTM” which we launched in some of our European markets is delivering encouraging results and was a nice contributor to this fiscal year performance. Items that contributed to the increase were partly offset by the lower average retail price of road transportation fuel in the United States as well as by the divesture and closure of stores as part of our continuous work to improve the quality of our network. Overall, the variations in road transportation fuel average prices had a negative impact on revenues of approximately $372.0 million. The impact of the lower average retail price of road transportation fuel in the United States was partly offset by the impact of the higher average price in Europe and in Canada as shown in the following table, starting with the first quarter of the fiscal year ended April 28, 2013:
Quarter 1st 2nd 3rd 4thWeighted
average52-week period ended April 27, 2014 United States (US dollars per gallon) 3.51 3.45 3.24 3.47 3.41 Europe (US cents per litre) 100.72 103.25 107.49 104.11 104.38 Canada (CA cents per litre) 114.53 117.05 113.11 118.74 115.6352-week period ended April 28, 2013 United States (US dollars per gallon) 3.49 3.65 3.35 3.61 3.51 Europe (US cents per litre) - 103.96 104.71 103.80 104.21 Canada (CA cents per litre) 112.62 117.41 110.43 115.65 113.77
Other revenues increased by $124.9 million in fiscal 2014, mostly attributable to the contribution from acquisitions, partially offset by the divesture of our European LPG business in December 2012.
Gross profit
In fiscal 2014, the consolidated merchandise and service gross margin was $2,702.5 million, an increase of $104.0 million or 4.0% compared with fiscal 2013. Excluding the negative impact from the translation of our European and Canadian operations into US dollars, which was approximately $11.0 million, consolidated merchandise and service gross margin increased by $115.0 million. This increase is attributable to the contribution from acquisitions which amounted to approximately $118.0 million, partly offset by the impact of our pricing strategies. In the United States, the gross margin was down 0.4% to 32.7% while it decreased by 0.5% in Canada, to 33.1%. Gross margin increased by 0.3% in Europe to 41.8%. Overall, this performance reflects changes in the product-mix, the modifications we brought to our supply terms as well as our merchandising strategy in line with market competitiveness and economic conditions within each market. In North America, the decrease in the margin as a percentage of sales mainly reflects the impact of our pricing strategies aimed at increasing store

Annual Report © 2014 Alimentation Couche-Tard Inc. Page 26 of 81
traffic which had a favourable impact on revenues but brought the margin percentage down. However, on a net basis, this strategy had an overall positive impact since the merchandise and service gross profit shows a healthy increase. In Europe, the increase in margin as a percentage of sales is the result of changes in our product mix as well as to the impact of our pricing strategies to improve the value perception by our customers.
The road transportation fuel gross margin for our company-operated stores in the United States decreased by 0.66 ¢ per gallon, from 18.77 ¢ per gallon during fiscal 2013 to 18.11 ¢ per gallon in fiscal 2014. In Canada, the gross margin was CA5.98¢ per litre for fiscal 2014 compared with CA5.84 ¢ per litre for fiscal 2013. In Europe, the total road transportation fuel gross margin was 10.94 ¢ per litre for fiscal 2014, a strong increase of 1.07 ¢ per litre compared with 9.88 ¢ per litre for fiscal 2013. The road transportation fuel gross margin of our company-operated stores in the United States as well as the impact of expenses related to electronic payment modes for the last eight quarters, starting with the first quarter of fiscal year ended April 28, 2013, were as follows:
(US cents per gallon) Quarter 1st 2nd 3rd 4th
Weighted average
52-week period ended April 27, 2014 Before deduction of expenses related to electronic payment modes 19.42 21.56 17.02 14.85 18.11 Expenses related to electronic payment modes 4.99 5.04 4.79 4.98 4.94 After deduction of expenses related to electronic payment modes 14.43 16.52 12.23 9.87 13.18
52-week period ended April 28, 2013 Before deduction of expenses related to electronic payment modes 23.20 15.20 17.80 19.30 18.77 Expenses related to electronic payment modes 4.97 5.15 4.79 5.03 4.97 After deduction of expenses related to electronic payment modes 18.23 10.05 13.01 14.27 13.80
As demonstrated by the table above, although road transportation fuel margin can be volatile from a quarter to another, they tend to normalize on an annual basis.
Operating, selling, administrative and general expenses
For fiscal 2014, operating, selling, administrative and general expenses increased by 5.7% compared with fiscal 2013, but increased by only 0.2% if we exclude certain items, as demonstrated by the following table:
Total variance as reported 5.7% Subtract:
Increase from incremental expenses related to acquisitions 6.6% Decrease from divesture of LPG business (0.1%) Increase from higher electronic payment fees, excluding acquisitions 0.3% Decrease from the net impact of foreign exchange translation (1.2%) Acquisition costs recognized to earnings of fiscal 2013 (0.1%)
Remaining variance 0.2%
The remaining variance for fiscal 2014 comes from higher expenses to support our organic growth and normal inflation, partly offset by sound management of our expenses across our operations as well as from the impact of synergies. We continue to favour a tight control of our costs throughout the organization while making sure to maintain the quality of the service we offer our clients.
In Europe, expense level is still affected by the implementation of a new IT infrastructure and the rollout of an ERP system. Our IT costs should continue to go down progressively over the course of the next quarters.
Earnings before interests, taxes, depreciation, amortization and impairment (EBITDA) and adjusted EBITDA
During fiscal 2014, EBITDA increased by 19.2% compared to the previous fiscal year, reaching $1,640.2 million. Net of acquisition costs recorded to earnings, acquisitions contributed approximately $153.0 million to EBITDA, while the variation in exchange rates had a negative impact of approximately $11.0 million.
Excluding the restructuring expenses, the curtailment gain on certain defined benefits pension plans obligations as well as the negative goodwill from both comparable periods, fiscal 2014 adjusted EBITDA increased by $205.1 million or 14.8% compared to the corresponding period of the previous fiscal year, reaching $1,590.9 million.
It should be noted that EBITDA and adjusted EBITDA are not performance measures defined by IFRS, but we, as well as investors and analysts, use these measures to evaluate the Corporation’s financial and operating performance. Note that our definition of these measures may differ from the one used by other public corporations:

Annual Report © 2014 Alimentation Couche-Tard Inc. Page 27 of 81
52-weeks periods ended
(in millions of US dollars) April 27, 2014 April 28, 2013
Net earnings, as reported 812.2 572.8Add:
Income taxes 134.2 73.9Net financial expenses 110.6 207.8
Depreciation and amortization and impairment of property and equipment and other assets 583.2 521.1EBITDA 1,640.2 1,375.6Remove:
Restructuring costs - 34.0Curtailment gain on pension plan obligation (0.9 ) (19.4) Negative goodwill (48.4 ) (4.4)
Adjusted EBITDA 1,590.9 1,385.8
Depreciation, amortization and impairment of property and equipment and other assets
For fiscal 2014, depreciation, amortization and impairment expense increased due to an impairment charge of $6.8 million on a non-operational lubricant production plant as well as to investments made through acquisitions, replacement of equipment, addition of new stores and ongoing improvement of our network.
During fiscal 2014, we have completed the analysis of the remaining useful lives of Statoil Fuel & Retail property and equipment in order to modify the depreciation periods accordingly. Based on our analysis, we concluded that the modification of depreciation periods would reduce the depreciation expense but the final results are not significantly different from the preliminary estimates reflected in the depreciation expense of the previous year.
Net financial expenses
For fiscal 2014, we recorded net financial expenses of $110.6 million compared to $207.8 million for the comparable period of fiscal 2013. Excluding the net foreign exchange loss of $10.1 million and the net foreign gain of $3.2 million recorded respectively in fiscal 2014 and in fiscal 2013 as well as the $102.9 million non-recurring loss on foreign exchange forward contracts recorded in fiscal 2013, fiscal 2014 posted net financial expenses of $100.5 million, down $7.6 million compared to fiscal 2013. The decrease is mainly due to the reduction in our long-term debt following repayments we made on our acquisition facility partly offset by the higher average effective interest rate of our senior unsecured notes compared with the average effective rate of our acquisition facility as well as by the fact that fiscal 2013 did not include a complete year of the financing costs related to the acquisition of Statoil Fuel & Retail.
Income taxes
The income tax rate for fiscal 2014 was 14.2%, compared to 11.4% for the previous fiscal year. The income tax rate for fiscal 2014 was impacted by the effect on deferred taxes of a foreign loss only deductible and recognized for tax purposes as well as by a decrease in our statutory income tax rates in Norway and in Denmark. The income tax rate for fiscal 2013 was impacted by the effect on deferred income taxes of a decrease in our statutory income tax rate in Sweden. Excluding those non-recurring items, as well as the negative goodwill recorded in the first quarter of fiscal 2014, the income tax rate for fiscal 2014 would have been 15.5% compared to an income tax rate of 16.8% for fiscal 2013.
Net earnings
We closed fiscal 2014 with net earnings of $812.2 million, compared to $572.8 million for the previous fiscal year, an increase of $239.4 million or 41.8%. Diluted net earnings per share stood at $1.43 compared to $1.02 the previous year, an increase of 40.2%. The translation of revenues from our Canadian and European operations into the US dollars had a negative impact of approximately $8.0 million on net earnings of fiscal 2014.
Excluding from net earnings of fiscal 2014 the negative goodwill, the net foreign exchange loss, the non-recurring income tax recovery on a foreign exchange loss only deductible and recognized for tax purposes and from the decrease in income tax rate in Norway and Denmark, the impairment charge on a non-operational lubricant plant in Poland, the curtailment gain on pension plans obligation as well as acquisition costs and excluding from net earnings of fiscal 2013 the non-recurring loss on forwards, the non-recurring income tax recovery over the decrease in income tax rate in Sweden, the restructuring expense, the curtailment gain on pension plans obligation, the net foreign exchange gain, the negative goodwill as well as acquisition costs, net earnings would have stood at approximately $766.0 million, up $145.0 million or 23.3%, while diluted earnings per share would have stood at approximately $1.35, an increase of 21.6%.

Annual Report © 2014 Alimentation Couche-Tard Inc. Page 28 of 81
Financial Position as at April 27, 2014
As shown by our indebtedness ratios included in the “Selected Consolidated Financial Information” section and our net cash provided by operating activities, our financial position is excellent.
Our total consolidated assets amounted to $10.5 billion as at April 27, 2014, a decrease of $1.2 million over the balance as at April 28, 2013. This decrease stems primarily from the negative impact of the net appreciation of the US dollar compared to the functional currencies of our operations in Canada and Europe at the balance sheet date, partly offset by the overall rise in assets resulting from the acquisitions we made during fiscal 2014 as well as from the increase in accounts receivable.
During the 52-week period ended on April 27, 2014, we recorded a return on capital employed of 13.3%1.
Significant balance sheet variations are explained as follows:
Accounts receivable
Accounts receivable increased by $110.4 million, from $1,616.0 million as at April 28, 2013 to $1,726.4 million as at April 27, 2014. The increase mainly stems from timing effects and increased road transportation fuel sales to third parties.
Long-term debt and current portion of long-term debt
Long-term debt decreased by $998.7 million, from $3,605.1 million as at April 28, 2013 to $2,606.4 million as at April 27, 2014, partly as a result of the impact of the weakening of the Canadian dollar against the United States dollar, which was approximately $92.0 million. Excluding the foreign exchange impact, our long-term debt decreased by approximately $906.7 million. In August 2013, we issued CA$300.0 million Canadian dollar denominated senior unsecured notes for net proceeds of US$285.6 million. Subsequently, we repaid approximately $1,200.0 million of our acquisition and revolving facilities from the net proceeds of this issuance as well as from available cash. As a result, our debt, net of cash and cash equivalents, amounted to $2,095.3 million as at April 27, 2014, a reduction of $851.5 million compared to the balance as at April 28, 2013.
Other financial liabilities
Other financial liabilities increased by $53.5 million, from $20.4 million as at April 28, 2013 to $73.9 million as at April 27, 2014. The increase stems from the change in fair value of our cross-currency interest rate swaps, which is determined based on market rates obtained from our financial institutions for similar financial instruments. Change in fair value of this financial instrument is recorded in other comprehensive income and partly offset the impact of the conversion of our Canadian denominated long-term debt.
Shareholders’ Equity
Shareholders’ equity amounted to $4.0 billion as at April 27, 2014, up $745.7 million compared to April 28, 2013, mainly reflecting net earnings of fiscal 2014, partly offset by dividends declared and other comprehensive loss. For the 52-week period ended April 27, 2014, we recorded a return on equity of 22.6% 2.
Liquidity and Capital Resources
Our principal sources of liquidity are our net cash provided by operating activities and our credit facilities. Our principal uses of cash are to reimburse our debt, finance our acquisitions and capital expenditures, pay dividends, as well as provide for working capital. We expect that cash generated from operations and borrowings available under our revolving unsecured credit facilities will be adequate to meet our liquidity needs in the foreseeable future.
1 This ratio is presented for information purposes only and represents a measure of performance used especially in financial circles. It represents the following calculation: earnings before income taxes and interests divided by average capital employed. Capital employed represents total assets less short-term liabilities not bearing interests. It does not have a standardized meaning prescribed by IFRS and therefore may not be comparable to similar measures presented by other public corporations. It includes Couche-Tard’s results for the four quarters of fiscal year ending April 27, 2014. 2 This ratio is presented for information purposes only and represents a measure of performance used especially in financial circles. It represents the following calculation: net earnings divided by average equity. It does not have a standardized meaning prescribed by IFRS and therefore may not be comparable to similar measures presented by other public corporations. It includes Couche-Tard’s results for the four quarters of fiscal year ending April 27, 2014.

Annual Report © 2014 Alimentation Couche-Tard Inc. Page 29 of 81
Our revolving credit facilities are detailed as follow:
US dollar term revolving unsecured operating credit D, maturing in December 2017
Credit agreement consisting of a revolving unsecured facility of a maximum amount of $1,275.0, with an initial term of five years. On November 4, 2013, we extended the term of this agreement by one year. As at April 27, 2014, $793.5 million of our revolving unsecured operating credit D had been used. As at the same date, the effective interest rate was 1.19% and standby letters of credit in the amount of CA$2.3 million and $29.4 million were outstanding.
On May 16, 2014, subsequent to the end of the year, we amended our term revolving unsecured operating credits D to increase the maximum amount available from $1,275.0 million to $1,525.0 million, an increase of $250.0 million, without incurring additional fee. All other terms remain unchanged.
Term revolving unsecured operating credit E, maturing in December 2016
Credit agreement consisting of a revolving unsecured facility of an initial maximum amount of $50.0 with an initial term of 50 months. The credit facility is available in the form of a revolving unsecured operating credit, available in US dollars. The amounts borrowed bear interest at variable rates based on the US base rate or the LIBOR rate plus a variable margin. As at April 27, 2014, the term revolving unsecured operating credit E was unused.
Available liquidities
As at July 4, 2014, following the amended to our term revolving unsecured operating credits D, a total of approximately $750.0 million were available under our revolving unsecured credit facilities and we were in compliance with the restrictive covenants and ratios imposed by the credit agreements at that date. Thus, at the same date, we had access to approximately $1.3 billion through our available cash and revolving unsecured operating credit agreements.
Selected Consolidated Cash Flow Information 52-week periods ended
(In millions of US dollars) April 27,
2014 April 28,
2013 VariationOperating activities Net cash provided by operating activities 1,429.3 1,161.4 267.9Investing activities
Purchase of property and equipment and other assets, net of proceeds from the disposal of property and equipment and other assets (459.0 ) (486.9 ) 28.0
Business acquisitions (159.6 ) (2,644.6 ) 2,485.0Proceeds from sale and lease back transaction - 30.3 (30.3) Net settlement of foreign exchange forward contracts - (86.4) 86.4Other 20.6 1.1 19.4
Net cash used in investing activities (598.0 ) (3,186.5) 2,588.5 Financing activities
Repayment of the acquisition facility (1,648.0 ) (995.5) (652.5) Net increase (decrease) in other debt 431.3 (314.5) 745.8 Issuance of Canadian dollar denominated senior unsecured notes, net of financing costs 285.6 997.5 (711.9) Dividends (64.6 ) (55.6) (9.0) Issuance of shares upon exercise of stock-options 9.4 8.1 1.3 Borrowings under the acquisition facility, net of financing costs - 3,190.2 (3,190.2) Repayment of non-current debt assumed on business acquisition - (800.5) 800.5 Issuance of shares on public offering, net of issuance costs - 333.4 (333.4)
Net cash (used in) provided by financing activities (986.3 ) 2,363.1 (3,349.4) Credit rating
Standard and Poor’s BBB- BBB-Moody’s (1) Baa3 Baa3
(1) Moody’s credit rating for Couche-Tard’s senior unsecured notes
Operating activities
During fiscal 2014, net cash from our operations reached $1,429.3 million, up $267.9 million compared to fiscal year 2013, mainly due to higher net earnings not taking into account non-cash items, including depreciation, amortization and impairment of property and equipment and other assets, as well as negative goodwill.

Annual Report © 2014 Alimentation Couche-Tard Inc. Page 30 of 81
Investing activities
During fiscal 2014, investing activities were primarily for net investment in property and equipment and other assets which amounted to $459.0 million and for acquisitions for an amount of $159.6 million. Following the closing of the business acquisition transaction with ExxonMobil, an amount of $20.6 million placed in escrow was repaid to us during fiscal 2014.
Net investments in property and equipment and other assets were primarily for the replacement of equipment in some of our stores in order to enhance our offering of products and services, the addition of new stores, the ongoing improvement of our network as well as for information technology.
Financing activities
During fiscal 2014, we repaid an amount of $1,648.0 million under our acquisition facility using amounts drawn from our operating credits, the net proceeds from the issuance of Canadian dollar denominated senior unsecured notes as well as available cash. During fiscal year, an amount of $903.0 million was drawn from our operating credit, of which, $455.0 million was repaid using available cash, for a net increase of $448.0 million. During the same period, we paid $64.6 million in dividends.
Contractual Obligations and Commercial Commitments
Set out below is a summary of our material contractual obligations as at April 27, 2014 (1):
2015 2016 2017 2018 2019 Thereafter Total
(in millions of US dollars)
Long-term debt (2) 1.8 555.0 2.5 1,065.3 2.2 906.1 2,532.9
Finance lease obligations 19.6 32.5 11.5 5.9 5.4 28.6 103.5
Operating lease obligations 321.4 294.3 269.6 243.4 214.2 1.060.6 2,403.8
Total 342.8 881.8 283.6 1,314.9 221.8 1,995.3 5,040.2
(1) The summary does not include the payments required under defined benefit pension plans. (2) Does not include future interest payments.
Long-Term Debt. As at April 27, 2014, our long-term debt reached $2,606.4 million, the details of which are as follows:
i. Borrowing of $552.3 million under our acquisition facility denominated in US dollars, maturing in June 2015. The effective interest rate was 2.38% as at April 27, 2014.
ii. Canadian dollar denominated senior unsecured notes totalling $1,172.7 million, divided into four tranches:
a. Tranche 1 with a notional amount of CA$300.0 million, maturing on November 1st, 2017, bearing interest at 2.861%
b. Tranche 2 with a notional amount of CA$450.0 million, maturing on November 1st, 2019 bearing interest at 3.319% c. Tranche 3 with a notional amount of CA$250.0 million, maturing on November 1st, 2022 bearing interest at
3.899%. d. Tranche 4 with a notional amount of CA$300.0 million, maturing on August 21st, 2020 bearing interest at 4.214%.
iii. US Dollar denominated borrowings of $793.5 million under our revolving unsecured operating credits denominated in US dollars, maturing in December 2017. The effective interest rate was 1.19% as at April 27, 2014. Standby letters of credit in the amount of CA$2.1 million and $29.4 million were outstanding as at April 27, 2014.
iv. Floating-rate bonds denominated in NOK totalling $2.5 million, maturing in February 2017. As at April 27, 2014, the effective interest rate was 5.04%.
v. Fixed-rate bonds denominated in NOK totalling $2.2 million, maturing in February 2019, bearing interest at 5.75%.
vi. Other long-term debts of $83.2 million, including obligations related to building and equipment under finance leases.
Finance Leases and Operating Leases Obligations. We lease an important portion of our real estate using conventional operating leases and finance leases mainly for the rental of stores, land, equipment and office buildings. Generally our real estate leases in Canada are for primary terms of five to ten years and in the United States, they are for ten to 20 years, in both cases, usually with options to renew. In Europe, the lease terms range from short-term contracts to contracts with maturities up to 100 years and most lease contracts include options to renew at market prices. When leases are determined to be operating leases, obligations and related assets are not included in our consolidated balance sheets. Under certain of the store leases, we are subject to additional rent based on store revenues as well as future escalations in the minimum lease
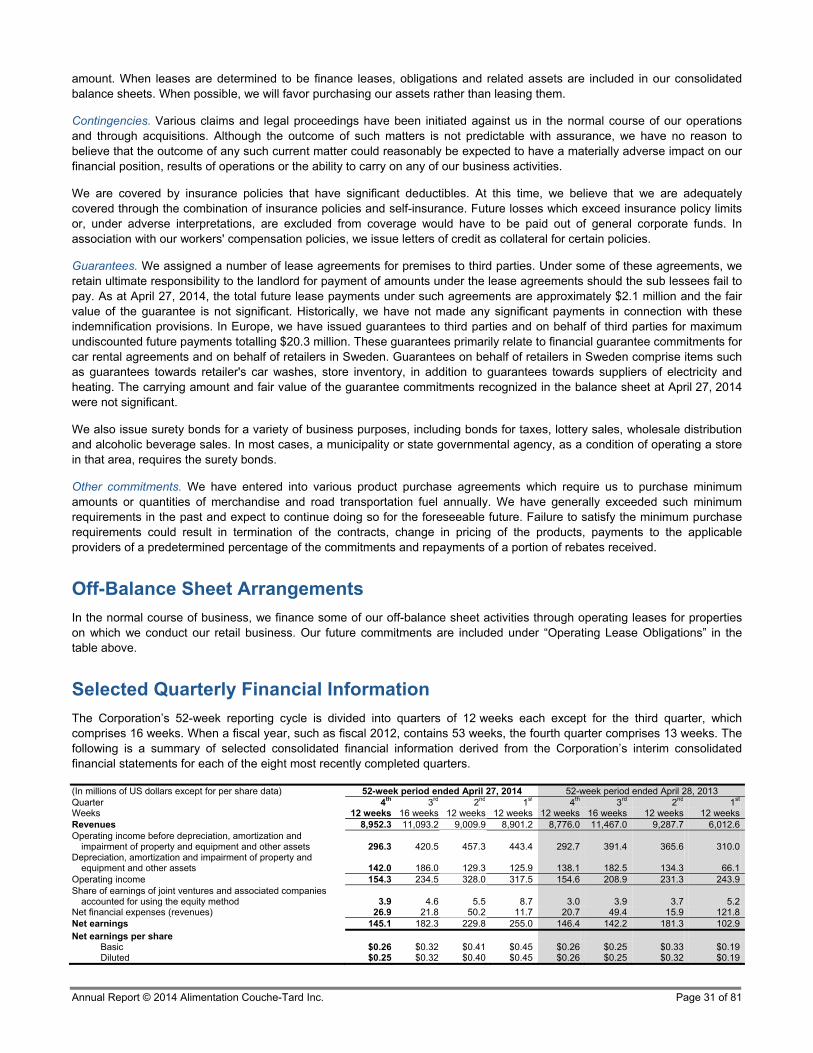
Annual Report © 2014 Alimentation Couche-Tard Inc. Page 31 of 81
amount. When leases are determined to be finance leases, obligations and related assets are included in our consolidated balance sheets. When possible, we will favor purchasing our assets rather than leasing them.
Contingencies. Various claims and legal proceedings have been initiated against us in the normal course of our operations and through acquisitions. Although the outcome of such matters is not predictable with assurance, we have no reason to believe that the outcome of any such current matter could reasonably be expected to have a materially adverse impact on our financial position, results of operations or the ability to carry on any of our business activities.
We are covered by insurance policies that have significant deductibles. At this time, we believe that we are adequately covered through the combination of insurance policies and self-insurance. Future losses which exceed insurance policy limits or, under adverse interpretations, are excluded from coverage would have to be paid out of general corporate funds. In association with our workers' compensation policies, we issue letters of credit as collateral for certain policies.
Guarantees. We assigned a number of lease agreements for premises to third parties. Under some of these agreements, we retain ultimate responsibility to the landlord for payment of amounts under the lease agreements should the sub lessees fail to pay. As at April 27, 2014, the total future lease payments under such agreements are approximately $2.1 million and the fair value of the guarantee is not significant. Historically, we have not made any significant payments in connection with these indemnification provisions. In Europe, we have issued guarantees to third parties and on behalf of third parties for maximum undiscounted future payments totalling $20.3 million. These guarantees primarily relate to financial guarantee commitments for car rental agreements and on behalf of retailers in Sweden. Guarantees on behalf of retailers in Sweden comprise items such as guarantees towards retailer's car washes, store inventory, in addition to guarantees towards suppliers of electricity and heating. The carrying amount and fair value of the guarantee commitments recognized in the balance sheet at April 27, 2014 were not significant.
We also issue surety bonds for a variety of business purposes, including bonds for taxes, lottery sales, wholesale distribution and alcoholic beverage sales. In most cases, a municipality or state governmental agency, as a condition of operating a store in that area, requires the surety bonds.
Other commitments. We have entered into various product purchase agreements which require us to purchase minimum amounts or quantities of merchandise and road transportation fuel annually. We have generally exceeded such minimum requirements in the past and expect to continue doing so for the foreseeable future. Failure to satisfy the minimum purchase requirements could result in termination of the contracts, change in pricing of the products, payments to the applicable providers of a predetermined percentage of the commitments and repayments of a portion of rebates received.
Off-Balance Sheet Arrangements
In the normal course of business, we finance some of our off-balance sheet activities through operating leases for properties on which we conduct our retail business. Our future commitments are included under “Operating Lease Obligations” in the table above.
Selected Quarterly Financial Information
The Corporation’s 52-week reporting cycle is divided into quarters of 12 weeks each except for the third quarter, which comprises 16 weeks. When a fiscal year, such as fiscal 2012, contains 53 weeks, the fourth quarter comprises 13 weeks. The following is a summary of selected consolidated financial information derived from the Corporation’s interim consolidated financial statements for each of the eight most recently completed quarters.
(In millions of US dollars except for per share data) 52-week period ended April 27, 2014 52-week period ended April 28, 2013 Quarter 4th 3rd 2nd 1st 4th 3rd 2nd 1st
Weeks 12 weeks 16 weeks 12 weeks 12 weeks 12 weeks 16 weeks 12 weeks 12 weeksRevenues 8,952.3 11,093.2 9,009.9 8,901.2 8,776.0 11,467.0 9,287.7 6,012.6Operating income before depreciation, amortization and
impairment of property and equipment and other assets 296.3 420.5 457.3 443.4 292.7 391.4 365.6 310.0Depreciation, amortization and impairment of property and
equipment and other assets 142.0 186.0 129.3 125.9 138.1 182.5 134.3 66.1Operating income 154.3 234.5 328.0 317.5 154.6 208.9 231.3 243.9Share of earnings of joint ventures and associated companies
accounted for using the equity method 3.9 4.6 5.5 8.7 3.0 3.9 3.7 5.2Net financial expenses (revenues) 26.9 21.8 50.2 11.7 20.7 49.4 15.9 121.8Net earnings 145.1 182.3 229.8 255.0 146.4 142.2 181.3 102.9Net earnings per share
Basic $0.26 $0.32 $0.41 $0.45 $0.26 $0.25 $0.33 $0.19Diluted $0.25 $0.32 $0.40 $0.45 $0.26 $0.25 $0.32 $0.19
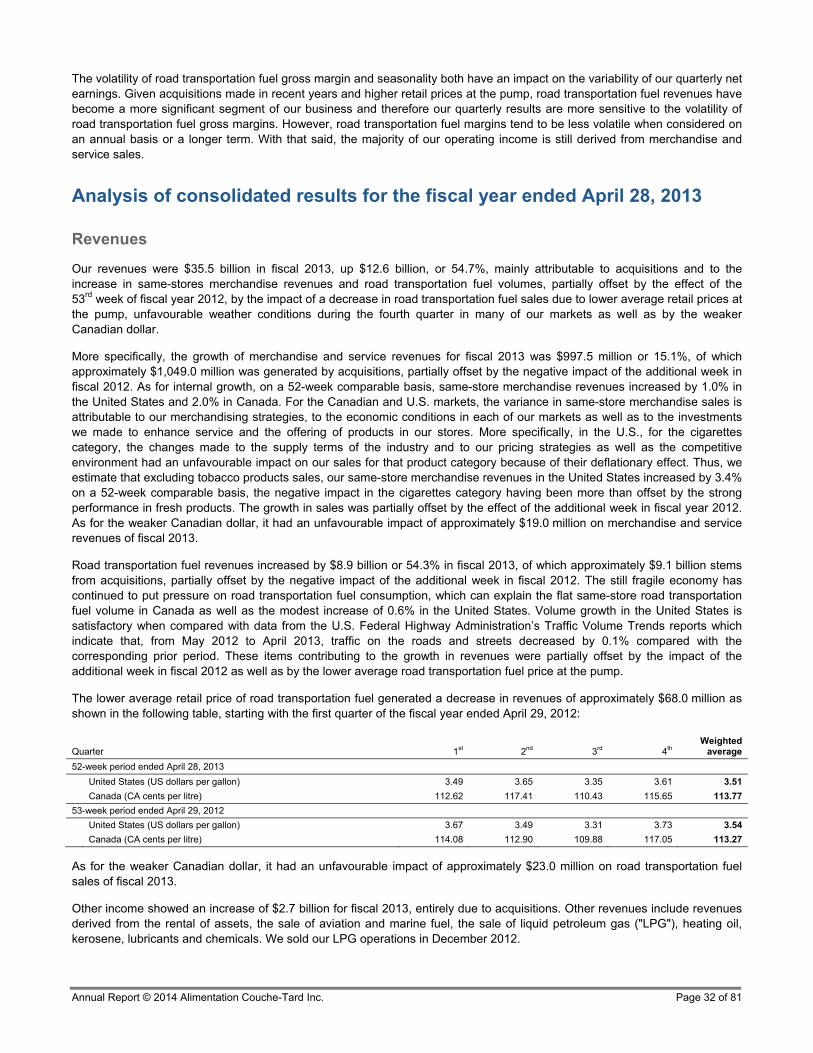
Annual Report © 2014 Alimentation Couche-Tard Inc. Page 32 of 81
The volatility of road transportation fuel gross margin and seasonality both have an impact on the variability of our quarterly net earnings. Given acquisitions made in recent years and higher retail prices at the pump, road transportation fuel revenues have become a more significant segment of our business and therefore our quarterly results are more sensitive to the volatility of road transportation fuel gross margins. However, road transportation fuel margins tend to be less volatile when considered on an annual basis or a longer term. With that said, the majority of our operating income is still derived from merchandise and service sales.
Analysis of consolidated results for the fiscal year ended April 28, 2013
Revenues
Our revenues were $35.5 billion in fiscal 2013, up $12.6 billion, or 54.7%, mainly attributable to acquisitions and to the increase in same-stores merchandise revenues and road transportation fuel volumes, partially offset by the effect of the 53rd week of fiscal year 2012, by the impact of a decrease in road transportation fuel sales due to lower average retail prices at the pump, unfavourable weather conditions during the fourth quarter in many of our markets as well as by the weaker Canadian dollar.
More specifically, the growth of merchandise and service revenues for fiscal 2013 was $997.5 million or 15.1%, of which approximately $1,049.0 million was generated by acquisitions, partially offset by the negative impact of the additional week in fiscal 2012. As for internal growth, on a 52-week comparable basis, same-store merchandise revenues increased by 1.0% in the United States and 2.0% in Canada. For the Canadian and U.S. markets, the variance in same-store merchandise sales is attributable to our merchandising strategies, to the economic conditions in each of our markets as well as to the investments we made to enhance service and the offering of products in our stores. More specifically, in the U.S., for the cigarettes category, the changes made to the supply terms of the industry and to our pricing strategies as well as the competitive environment had an unfavourable impact on our sales for that product category because of their deflationary effect. Thus, we estimate that excluding tobacco products sales, our same-store merchandise revenues in the United States increased by 3.4% on a 52-week comparable basis, the negative impact in the cigarettes category having been more than offset by the strong performance in fresh products. The growth in sales was partially offset by the effect of the additional week in fiscal year 2012. As for the weaker Canadian dollar, it had an unfavourable impact of approximately $19.0 million on merchandise and service revenues of fiscal 2013.
Road transportation fuel revenues increased by $8.9 billion or 54.3% in fiscal 2013, of which approximately $9.1 billion stems from acquisitions, partially offset by the negative impact of the additional week in fiscal 2012. The still fragile economy has continued to put pressure on road transportation fuel consumption, which can explain the flat same-store road transportation fuel volume in Canada as well as the modest increase of 0.6% in the United States. Volume growth in the United States is satisfactory when compared with data from the U.S. Federal Highway Administration’s Traffic Volume Trends reports which indicate that, from May 2012 to April 2013, traffic on the roads and streets decreased by 0.1% compared with the corresponding prior period. These items contributing to the growth in revenues were partially offset by the impact of the additional week in fiscal 2012 as well as by the lower average road transportation fuel price at the pump.
The lower average retail price of road transportation fuel generated a decrease in revenues of approximately $68.0 million as shown in the following table, starting with the first quarter of the fiscal year ended April 29, 2012:
Quarter 1st 2nd 3rd 4th Weighted
average
52-week period ended April 28, 2013
United States (US dollars per gallon) 3.49 3.65 3.35 3.61 3.51
Canada (CA cents per litre) 112.62 117.41 110.43 115.65 113.77
53-week period ended April 29, 2012
United States (US dollars per gallon) 3.67 3.49 3.31 3.73 3.54
Canada (CA cents per litre) 114.08 112.90 109.88 117.05 113.27
As for the weaker Canadian dollar, it had an unfavourable impact of approximately $23.0 million on road transportation fuel sales of fiscal 2013.
Other income showed an increase of $2.7 billion for fiscal 2013, entirely due to acquisitions. Other revenues include revenues derived from the rental of assets, the sale of aviation and marine fuel, the sale of liquid petroleum gas ("LPG"), heating oil, kerosene, lubricants and chemicals. We sold our LPG operations in December 2012.

Annual Report © 2014 Alimentation Couche-Tard Inc. Page 33 of 81
Gross profit
The consolidated merchandise and service gross margin grew by $438.1 million or 20.1% in fiscal 2013. In the United States, the gross margin is up by 0.1% to 33.1% while in Canada, it increased by 0.3% to 33.6%. This performance reflects the shift in our product-mix toward higher margin categories, including fresh products, the modifications we brought to our supply terms as well as our merchandising strategy in line with market competitiveness and economic conditions within each market. In the United States, the improvement in margin as a percentage of sales was partially offset by our price strategies in the cigarettes category. In Europe, the margin was 44.1%, which is consistent with our expectations and historical margins recorded by Statoil Fuel & Retail. The higher merchandise and services gross margin as a percentage of sales in Europe reflects price and cost structures as well as a product-mix that are different from those in North America.
In fiscal 2013, the road transportation fuel gross margin for our company-operated stores in the United States increased by 1.78¢ per gallon, from 16.99¢ per gallon in fiscal 2012 to 18.77¢ per gallon in fiscal 2013. In Canada, the road transportation fuel gross margin reached CA 5.84¢ per liter in fiscal 2013 compared to CA 5.45¢ in fiscal 2012. The road transportation fuel gross margin of our company-operated stores in the United States as well as the impact of expenses related to electronic payment modes for the last eight quarters, starting with the first quarter of fiscal year ended April 29, 2012, were as follows:
(US cents per gallon)
Quarter 1st 2nd 3rd 4th Weighted
average
52-week period ended April 28, 2013
Before deduction of expenses related to electronic payment modes 23.20 15.20 17.80 19.30 18.77
Expenses related to electronic payment modes 4.97 5.15 4.79 5.03 4.97
After deduction of expenses related to electronic payment modes 18.23 10.05 13.01 14.27 13.80
53-week period ended April 29, 2012
Before deduction of expenses related to electronic payment modes 19.95 17.04 14.84 16.98 16.99
Expenses related to electronic payment modes 5.29 5.20 4.74 5.06 5.04
After deduction of expenses related to electronic payment modes 14.66 11.84 10.10 11.92 11.95
Operating, selling, administrative and general expenses
For fiscal 2013, operating, selling, administrative and general expenses rose by 50.1% compared with fiscal 2012, but decreased by 0.9% if we exclude certain items, as demonstrated by the following table:
Total variance as reported 50.1%
Subtract:
Increase from incremental expenses related to acquisitions 51.4%
Decrease from lower electronic payment fees (excluding acquisitions) (0.1%)
Decrease from the weakening of the Canadian dollar (0.3%)
Acquisition costs recognized to earnings of fiscal 2012 (0.3%)
Acquisition costs recognized to earnings of fiscal 2013 0.2%
Negative goodwill recognized to earnings of fiscal 2012 0.3%
Negative goodwill recognized to earnings of fiscal 2013 (0.2%)
Remaining variance, including the impact of the additional week in fiscal 2012 (0.9%)
The decrease in electronic payment fees stems mainly from the lower average retail price of road transportation fuel. The remaining variance is mainly due to the impact of the 53rd week in fiscal 2012. We continue to favour a tight control of our costs throughout the organization while making sure to maintain the quality of the service we offer our clients.
In Europe, the decrease in expenses recorded in relation with our cost reduction initiatives were more than offset by costs incurred for projects aimed at creating value, including the implementation of a new IT infrastructure and the rollout of an Enterprise Resource Planning ("ERP") system. Our IT costs should go down progressively along with the completion of these projects over the course of the next quarters. Fiscal 2013 expenses also include marketing costs to support our sales initiatives to boost sales, including "milesTM", our new signature fuel brand as well as "Coin Offer", a new in-store program to promote our value fresh food offering.

Annual Report © 2014 Alimentation Couche-Tard Inc. Page 34 of 81
Restructuring costs
During fiscal 2013, we recorded restructuring expenses of $34.0 million in line with the planned restructuring of Statoil Fuel & Retail’s operations.
Curtailment gain on certain defined benefits pension plans obligation
During fiscal 2013, in connection with the planned restructuring of Statoil Fuel & Retail’s, we recorded to earnings a $19.4 million non-recurring curtailment gain related to certain defined benefits pension plans with a corresponding offset to the defined benefit plan obligation.
Earnings before interests, taxes, depreciation, amortization and impairment (EBITDA) and Adjusted EBITDA
During fiscal 2013, EBITDA increased by 63.5% compared to fiscal 2012, reaching $1,375.6 million. Net of acquisition costs recorded to earnings, acquisitions contributed approximately $450.0 million to EBITDA while the exchange rate variation had a negative impact of approximately $2.0 million.
Excluding from fiscal 2013 the negative goodwill, restructuring costs and the curtailment gain on certain defined benefits pension plans obligation and excluding negative goodwill from fiscal 2012, adjusted EBITDA increased by $551.6 million or 66.1% compared to fiscal 2012, reaching $1,385.8 million.
It should be noted that EBITDA and Adjusted EBITDA are not performance measures defined by IFRS, but we, as well as investors and analysts, use these measures to evaluate the Corporation’s financial and operating performance. Note that our definition of these measures may differ from the one used by other public corporations:
(in millions of US dollars) 52-week period ended April 28, 2013
53-week period ended April 29, 2012
Net earnings, as reported 572.8 457.6
Add:
Income taxes 73.9 146.3
Net financial expenses (revenues) 207.8 (2.6)
Depreciation, amortization and impairment of property and equipment and other assets 521.1 239.8
EBITDA 1,375.6 841.1
Add:
Negative goodwill (4.4) (6.9)
Restructuring costs 34.0 -
Curtailment gain on defined benefits pension plans obligation (19.4) -
Adjusted EBITDA 1,385.8 834.2
Depreciation, amortization and impairment of property and equipment and other assets
For fiscal 2013, depreciation expense increased due to the investments made through acquisitions, replacement of equipment, addition of new stores and ongoing improvement of our network.
In addition, following the acquisition of Statoil Fuel & Retail, we have undertaken an analysis of the remaining useful lives of Statoil Fuel & Retail property and equipment in order to modify the depreciation periods accordingly. Based on our preliminary analysis, we concluded that the modification of depreciation periods would reduce the depreciation expense, which was reflected in the depreciation expense for fiscal 2013. However, given the volume of assets to process, our analytical work has not been completed yet. Additional changes to the depreciation expense could be made.
Net financial expenses (revenues)
For fiscal 2013, we recorded net financial expenses of $207.8 million compared to net financial revenues of $2.6 million in fiscal 2012. Excluding the non-recurring loss of $102.9 million on foreign exchange forwards contracts and the net foreign exchange gain of $3.2 million recorded during fiscal 2013, as well as excluding the $17.0 million gain recorded on foreign exchange forwards contracts in fiscal 2012, net financial expenses posted an increase of $93.7 million compared to fiscal
Annual Report © 2014 Alimentation Couche-Tard Inc. Page 35 of 81
year 2012, mainly due to the additional debt required to finance the acquisition of Statoil Fuel & Retail and debt assumed through its acquisition. With respect to the net foreign exchange gain of $3.2 million, it is mainly due to a gain from the impact of the exchange rate fluctuations on certain inter-company balances, a non-recurring foreign exchange gain of $7.4 million recorded on our NOK cash held by our U.S. operations in connection with the financing of the acquisition of Statoil Fuel & Retail partially offset by the impact of exchange rates fluctuations on U.S. dollars denominated sales made by our European operations.
Income taxes
The income tax rate for fiscal 2013 is 11.4%. The decrease is partly due to the effect on deferred income taxes of a decrease in our statutory income tax rate in Sweden. Excluding this non-recurring item, the income tax rate for fiscal 2013 would have been 16.8% compared to a rate of 24.2% for fiscal 2012.
Net earnings
We closed fiscal 2013 with net earnings of $572.8 million, compared to $457.6 million the previous fiscal year, an increase of $115.2 million or 25.2%. Diluted net earnings per share stood at $1.02 compared to $0.83 the previous year, an increase of 22.9%. The exchange rate variation did not have a significant impact on net earnings of fiscal 2013.
Excluding from fiscal 2013 net earnings the non-recurring loss on foreign exchange forward contracts, restructuring costs, the non-recurring curtailment gain on certain defined benefits pension plan, the net foreign exchange gain, the non-recurring income tax recovery, acquisition costs as well as the negative goodwill and excluding the non-recurring gain on foreign exchange forward contracts, acquisition costs and the negative goodwill from earnings of fiscal 2012, net earnings for fiscal 2013 would have stood at approximately $620.9 million ($1.11 per share on a diluted basis) compared to $444.7 million ($0.81 per share on a diluted basis) for fiscal 2012, up $176.2 million, or 39.6%, despite the negative impact of the additional week in fiscal 2012.
Internal Controls
We maintain a system of internal controls over financial reporting designed to safeguard assets and ensure that financial information is reliable. We also maintain a system of disclosure controls and procedures designed to ensure the reliability, completeness and timeliness of the information we disclose in this MD&A and other public disclosure documents, also taking into account materiality. Disclosure controls and procedures are designed to ensure that information required to be disclosed by the Corporation in reports filed with securities regulatory agencies is recorded and/or disclosed on a timely basis, as required by law, and is accumulated and communicated to the Corporation’s management, including its Chief Executive Officer and its Chief Financial Officer, as appropriate, to allow timely decisions regarding required disclosure. As at April 27, 2014, our management, following their assessment, certifies the design and operating effectiveness of disclosure controls and procedures.
We undertake ongoing evaluations of the effectiveness of internal controls over financial reporting and implement control enhancements, when appropriate. As at April 27, 2014, our management and our external auditors reported that these internal controls were effective.
Critical Accounting Policies and Estimates
Estimates. This MD&A is based on our consolidated financial statements, which have been prepared in accordance with IFRS. These standards require us to make certain estimates and assumptions that affect our financial position and results of operations as reflected in our consolidated financial statements. On an ongoing basis, we review our estimates. These estimates are based our best knowledge of current events and actions that we may undertake in the future. Actual results could differ from those estimates. The most significant accounting judgments and estimates that we have made in the preparation of the consolidated financial statements are discussed along with the relevant accounting policies when applicable and relate primarily to the following topics: Vendor rebates, determination of the useful lives of tangible and intangible assets, income taxes, leases, employee future benefits, provisions, impairment and business combinations.
Inventory. Our inventory is comprised mainly of products purchased for resale including tobacco products, fresh goods, beer and wine, grocery items, candies and snacks, other beverages and road transportation fuel. Inventories are valued at the lesser of cost and net realizable value. Cost of merchandise is generally valued based on the retail price less a normal margin and the cost of road transportation fuel inventory is generally determined according to the average cost method. The cost of

Annual Report © 2014 Alimentation Couche-Tard Inc. Page 36 of 81
lubricant inventory and aviation fuel is determined using the first in first out method. Inherent in the determination of margins are certain management judgments and estimates, which could affect ending inventory valuations and results of operations.
Impairment of Long-lived Assets. Property and equipment are tested for impairment should events or circumstances indicate that their book value may not be recoverable, as measured by comparing their net book value to their recoverable amount, which corresponds to the higher of fair value less costs to sell and value in use. Should the carrying amount of long-lived assets exceed their fair value, an impairment loss in the amount of the excess would be recognized. Our evaluation of the existence of impairment indicators is based on market conditions and our operational performance. The variability of these factors depends on a number of conditions, including uncertainty about future events. These factors could cause us to conclude that impairment indicators exist and require that impairment tests be performed, which could result in determining that the value of certain long-lived assets is impaired, resulting in a write-down of such long-lived assets.
Goodwill and Other Intangibles Assets. Goodwill and other intangibles assets with indefinite-life are evaluated for impairment annually, or more often if events or changes in circumstances indicate that the value of certain goodwill or intangibles may be impaired. For the purpose of this impairment test, management uses estimates and assumptions to establish the fair value of our reporting units and intangible assets. If these assumptions and estimates prove to be incorrect, the carrying value of our goodwill or other intangible assets may be overstated. Our annual impairment test is performed in the first quarter of each fiscal year.
Asset retirement obligations. Asset retirement obligations relate to estimated future costs to remove underground road transportation fuel storage tanks and are based on our prior experience in removing these tanks, estimated tank useful life, lease terms for those tanks installed on leased properties, external estimates and governmental regulatory requirements. A discounted liability is recorded for the present value of an asset retirement obligation with a corresponding increase to the carrying value of the related long-lived asset at the time an underground storage tank is installed. To determine the initial liability, the future estimated cash flows are discounted using a pre-tax rate that reflects current market assessments of the time value of money and the risks specific to the liability. The amount added to property and equipment is amortized and an accretion expense is recognized in connection with the discounted liability over the remaining life of the tank or lease term for leased properties.
Following the initial recognition of the asset retirement obligation, the carrying amount of the liability is increased to reflect the passage of time and then adjusted for variations in the current market-based discount rate or the scheduled underlying cash flows required to settle the liability.
Environmental Matters. We provide for estimated future site remediation costs to meet government standards for known site contamination when such costs can be reasonably estimated. Estimates of the anticipated future costs for remediation activities at such sites are based on our prior experience with remediation sites and consideration of other factors such as the condition of the site contamination, location of sites and the experience of the contractors that perform the environmental assessments and remediation work.
In each of the U.S. states in which we operate, with the exception of Michigan, Iowa, Florida, Arizona, Texas, West Virginia, Maryland and Washington State, there is a state fund to cover the cost of certain environmental remediation activities after applicable trust fund deductible is met, which varies by State. These state funds provide insurance for road transportation fuel facilities operations to cover some of the costs of cleaning up certain contamination to the environment caused by the usage of underground road transportation fuel equipment. Underground road transportation fuel storage tank registration fees and/or a road transportation fuel tax in each of the states finance the trust funds. We pay the annual registration fees and remit the sales taxes to the applicable states where we are a member of the trust fund. Insurance coverage is different in the various states.
Income Taxes. Deferred income tax assets and liabilities are recognized for the future income tax consequences attributable to temporary differences between the financial statement carrying values of assets and liabilities and their respective income tax bases. Deferred income tax assets or liabilities are measured using enacted or substantively enacted income tax rates expected to apply to taxable income in the years in which those temporary differences are expected to be recovered or settled. The calculation of current and deferred income taxes requires management to make estimates and assumptions and to exercise a certain amount of judgment regarding the financial statement carrying values of assets and liabilities which are subject to accounting estimates inherent in those balances, the interpretation of income tax legislation across various jurisdictions, expectations about future operating results and the timing of reversal of temporary differences and possible audits of tax fillings by the regulatory authorities. Management believes it has adequately provided for income taxes based on current available information.
Annual Report © 2014 Alimentation Couche-Tard Inc. Page 37 of 81
Changes or differences in these estimates or assumptions may result in changes to the current or deferred income tax balances on the consolidated balance sheets, a charge or credit to income tax expense in the consolidated statement of earnings and may result in cash payments or receipts.
Employee future benefits. We accrue our obligations under employee pension plans and the related costs, net of plan assets. We have adopted the following accounting policies with respect to the defined benefit plans:
The accrued benefit obligations and the cost of pension benefits earned by active employees are actuarially determined using the projected unit credit method pro-rated on service and pension expense is recorded in earnings as the services are rendered by active employees. The calculations reflect our best estimate of salary escalation and retirement ages of employees;
The discount rate on the benefit obligation is equal to the yield at the measurement date on high quality corporate bonds that have maturity dates approximating the terms of our obligations;
Plan assets are valued at fair value;
Actuarial gains and losses arise from increases or decreases in the present value of the defined benefit obligation because of changes in actuarial assumptions and experience adjustments. Actuarial gains and losses are recognized immediately in Other comprehensive income with no impact on net earnings;
Past service costs are recorded to earnings at the earlier of the following dates:
- When the plan amendment or curtailment occurs;
- When we recognize related restructuring costs or termination benefits;
Net interest on the defined benefit liability (asset) represents the net defined benefit liability (asset), multiplied by the discount rate and is recorded in financial expenses.
The pension cost recorded in net earnings for the defined contribution plans is equivalent to the contribution which we are required to pay in exchange for services provided by the employees.
The present value of pension obligations depends on a number of factors that are determined on an actuarial basis using a number of assumptions. Any changes in these assumptions will impact the carrying amount of pension obligations. We determine the appropriate discount rate at the end of each fiscal year. This is the rate that should be used to determine the present value of estimated future cash outflows expected to be required to settle the pension obligations. In determining the appropriate discount rate, we consider the interest rates of high-quality corporate bonds that are denominated in the currency in which the benefits will be paid and that have terms to maturity approximating the terms of the related pension obligation.
Insurance and Workers' Compensation. We use a combination of insurance, self-insured retention, and self-insurance for a number of risks including workers' compensation (in certain U.S. states), property damages and general liability claims. Accruals for loss incidences are made based on our claims experience and actuarial assumptions followed in the insurance industry. A material revision to our liability could result from a significant change to our claims experience or the actuarial assumptions of our insurers. Actual losses could differ from accrued amounts. Workers' compensation is covered by government-imposed insurance in Canada and in Europe and by third-party insurance in our United States operations, except in certain states where we are self-insured. With respect to the third-party insurance in the United States, independent actuarial estimates of the aggregate liabilities for claims incurred serve as a basis for our share of workers' compensation losses.
Annual Report © 2014 Alimentation Couche-Tard Inc. Page 38 of 81
Recently Issued Accounting Standards
Revised Standards
Financial Statement Presentation
On April 29, 2013, we adopted amendments to International Accounting Standard (“IAS”) 1, “Presentation of Financial Statements”. The amendments govern the presentation of Other Comprehensive Income (“OCI”) in the financial statements, primarily by requiring OCI items that may be reclassified to the consolidated statements of earnings to be presented separately from those that will not be reclassified. We have adopted this presentation and there was no other significant impact on our consolidated financial statements.
Consolidated financial statements
On April 29, 2013, we adopted the new standard IFRS 10, “Consolidated Financial Statements”, which requires an entity to consolidate an investee when it is exposed, or has rights, to variable returns from its involvement with the investee and has the ability to affect those returns through its power over the investee. Under previous IFRS, consolidation was required when an entity had the power to govern the financial and operating policies of an entity so as to obtain benefits from its activities. IFRS 10 replaces SIC-12, “Consolidation—Special Purpose Entities” and parts of IAS 27, “Consolidated and Separate Financial Statements”. The adoption of this standard had no impact on our consolidated financial statements.
Joint Arrangements
On April 29, 2013, we adopted the new standard IFRS 11, “Joint Arrangements”, which requires a venturer to classify its interest in a joint arrangement as a joint venture or joint operation. Joint ventures must be accounted for using the equity method of accounting whereas for a joint operation the venturer must recognize its share of the assets, liabilities, revenue and expenses of the joint operation. Under previous IFRS, entities had the choice to proportionately consolidate or equity account for interests in joint ventures. IFRS 11 supersedes IAS 31, “Interests in Joint Ventures” and SIC-13, “Jointly Controlled Entities—Non-monetary Contributions by Venturers”. The adoption of this standard had no impact on our consolidated financial statements as we were already accounting for our joint ventures using the equity method.
Disclosure of Interest in Other Entities
On April 29, 2013, we adopted the new standard IFRS 12, “Disclosure of Interest in Other Entities”. IFRS 12 establishes disclosure requirements for interests in other entities, such as joint arrangements, associates, special purpose vehicles and off balance sheet vehicles. The standard includes existing disclosures and also introduces significant additional disclosure requirements that address the nature of, and risks associated with, an entity’s interests in other entities. The adoption of this standard had no impact on our consolidated financial statements. The required disclosures under IFRS 12 were included in our consolidated financial statements.
Fair Value Measurement
On April 29, 2013, we adopted the new standard IFRS 13, “Fair Value Measurement”. IFRS 13 is a comprehensive standard for fair value measurement and disclosure requirements for use across essentially all IFRS. The new standard clarifies that fair value is the price that would be received to sell an asset, or paid to transfer a liability in an orderly transaction between market participants, at the measurement date. It also establishes disclosures about fair value measurement. Under previous IFRS, guidance on measuring and disclosing fair value was dispersed among the specific standards requiring fair value measurements and in many cases did not reflect a clear measurement basis or consistent disclosures. The adoption of this standard had no impact on our consolidated financial statements with respect to measurement but has required additional disclosures.
Impairment of Assets
On April 29, 2013, we early-adopted amendments to IAS 36 requiring additional disclosures about the recoverable amount of impaired non-financial assets if that amount is based on fair value less costs to sell. The adoption of these amendments had no impact on our consolidated financial statements.
Annual Report © 2014 Alimentation Couche-Tard Inc. Page 39 of 81
Offsetting financial assets and financial liabilities
On April 29, 2013, we early-adopted amendments to IAS 32 “Financial Instruments - Presentation” which was amended to clarify the requirements for offsetting financial assets and financial liabilities. We also early-adopted amendments to IFRS 7 “Financial Instruments - Disclosures” which was amended to improve disclosures on offsetting of financial assets and financial liabilities. These amendments did not impact our consolidated financial statements, but additional information is disclosed.
Recently issued accounting standards not yet implemented
Classification and measurement of financial assets and financial liabilities
In November 2009, the IASB issued IFRS 9, “Financial Instruments”, which will replace the various rules of IAS 39, “Financial Instruments: Recognition and Measurement” with a single approach to determine whether a financial asset is measured at amortized cost or fair value. In October 2010, the IASB revised IFRS 9, adding requirements for classification and measurement of financial liabilities. In November 2013, the IASB incorporated a new hedge accounting model into IFRS 9 to enable financial statement users to better understand an entity’s risk exposure and its risk management activities. Also, the IASB deferred mandatory application of IFRS 9 to an unspecified date with early adoption permitted. We will assess, in due course, the impact of IFRS 9 on our consolidated financial statements.
Business Risks
We are constantly looking to control and improve our operations. In this perspective, identification and management of risks are key components of such activities. We have identified and assessed key risk factors that could negatively impact the Corporation’s objectives and its ensuing performance.
We manage risks on an ongoing basis and implement a series of measures designed to mitigate key risks described in the present section and their financial impact.
Road Transportation Fuel. Our results are sensitive to the changes in road transportation fuel retail price and gross margin. Factors beyond our control such as market-driven changes in supply terms, road transportation fuel price fluctuations due to, amongst other things, general political and economic conditions, as well as the market’s limited ability to absorb road transportation fuel retail price fluctuations, are factors that could influence road transportation fuel retail price and related gross margin. During fiscal 2014, road transportation fuel revenues accounted for approximately 72.0% of our total revenue, yet the road transportation fuel gross margin represented only about 38.0% of our overall gross profits. In fiscal 2014, a change of one cent per gallon (26 cents per litre) would have resulted in a change of approximately $76.0 million in road transportation fuel gross profit, with a corresponding impact on net earnings of approximately $0.09 per share on a diluted basis.
Electronic Payment Modes. We are exposed to significant fluctuations in expenses related to electronic payment modes resulting from large changes in road transportation fuel retail prices, particularly in our U.S. markets, because the majority of this expense is based on a percentage of the retail prices of road transportation fuel. For fiscal 2014, a variation of 10% in our expenses associated with electronic payment modes would have had an impact on net earnings of approximately $0.07 per share on a diluted basis.
Seasonality and Natural Disasters. Weather conditions can have an impact on our revenues as historical purchase patterns indicate that our customers increase their transactions and also purchase higher margin items when weather conditions are favourable. We have operations in the Southeast and West coast regions of the United States and, although these regions are generally known for their mild weather, these regions are susceptible to severe storms, hurricanes, earthquakes and other natural disasters.
Economic Conditions. Our revenues may be negatively influenced by changes in global, national, regional and/or local economic variables and consumer confidence. Changes in economic conditions could adversely affect consumer spending patterns, travel and tourism in certain of our market areas.
For several years, the global capital and credit markets and the global economy have experienced significant uncertainty, characterized by the bankruptcy, failure, collapse or sale of various financial institutions, the European sovereign debt crisis and a considerable level of intervention from governments around the world. These conditions may, in particular, adversely affect the demand for our products. As the contraction of the global capital and credit markets spreads throughout the broader economy, major markets around the world have experienced very weak or negative economic growth. Although there may be signs of economic recovery, the markets remain fragile and could again enter periods of negative economic growth. There can be no assurance that our business will not be affected by adverse global economic conditions.

Annual Report © 2014 Alimentation Couche-Tard Inc. Page 40 of 81
Tobacco Products. Tobacco products represent our largest product category of merchandise and service revenues. For fiscal 2014, revenues of tobacco products were approximately 38.0% of total merchandise and service revenues. Significant increases in wholesale cigarette costs and a tax increase on tobacco products, as well as current and future legislation and national and local campaigns to discourage smoking in the United States, Canada and Europe, may have an adverse impact on the demand for tobacco products, and may therefore adversely affect our revenues and profits in light of the competitive landscape and consumer sensitivity to the price of such products.
In addition, we sell brands of cigarettes that are manufactured to be sold by Couche-Tard on an exclusive basis and we could be sued for health problems caused by the use of tobacco products. In fact, various health-related legal actions, proceedings and claims arising out of the sale, distribution, manufacture, development, advertising and marketing of cigarettes have been brought against vendors of tobacco products. Any unfavourable verdict against us in a health-related suit could adversely affect our business, financial condition and results of operations. In conformity with accounting standards, we have not established any reserves for the payment of expenses or adverse results related to any potential health-related litigation.
Competition. The industries and geographic areas in which we operate are highly competitive and marked by a constant change in terms of the number and type of retailers offering the products and services found in our stores. We compete with other convenience store chains, independent convenience stores, gas station operators, large and small food retailers, quick service restaurants, local pharmacies and pharmacy chains and dollar stores. There can be no assurance that we will be able to compete successfully against our competitors. Our business may also be adversely affected if we do not sustain our ability to meet customer requirements relative to price, quality, customer service and service offerings.
Environmental Laws and Regulations. Our operations, particularly those relating to the storage, transportation and sale of fuel products, are subject to numerous environmental laws and regulations in the countries in which we operate, including laws and regulations governing the quality of fuel products, ground pollution and emissions and discharges into air and water, the implementation of targets regarding the use of certain bio-fuel or renewable energy products, the handling and disposal of hazardous wastes, the use of vapour reduction systems to capture fuel vapour, and the remediation of contaminated sites.
Our operations expose us to certain risks, particularly at our terminals and other storage facilities, where large quantities of fuel are stored, and at our fuel stations. These risks include equipment failure, work accidents, fires, explosions, vapour emissions, spills and leaks at storage facilities and/or in the course of transportation to or from our or a third party’s terminals, fuel stations, airports or other sites. In addition, we are also exposed to the risk of accidents involving the tanker trucks used in our fuel product distribution system. These types of hazards and accidents may cause personal injuries or the loss of life, business interruptions and/or property, equipment and environmental contamination and damage. Further, we may be subject to litigation, compensation claims, governmental fines or penalties or other liabilities or losses in relation to such incidents and accidents and may incur significant costs as a result. Under various national, provincial, state and local laws and regulations, we may, as the owner or operator, be liable for the costs of removal or remediation of contamination at our current or former sites, whether or not we knew of, or caused, the presence of such contamination. Such incidents and accidents may also affect our reputation or our brands, leading to a decline in the sales of our products and services and may adversely impact our business, financial condition and results of operations.
Acquisitions. Acquisitions have been and will continue to be a significant part of our growth strategy. Our ability to identify strategic acquisitions in the future may be limited by the number of attractive acquisition targets with motivated sellers, internal demands on our resources and, to the extent necessary, our ability to obtain financing on satisfactory terms for larger acquisitions, if at all.
Achieving anticipated benefits and synergies of an acquisition will depend in part on whether the operations, systems, management and cultures of our corporation and the acquired business can be integrated in an efficient and effective manner and whether the presumed bases or sources of synergies produce the benefits anticipated. We may not be able to achieve anticipated synergies and cost savings for an acquisition for many reasons, including contractual constraints, an inability to take advantage of expected synergistic savings and increased operating efficiencies, loss of key employees, or changes in tax laws and regulations. The process of integrating an acquired business may lead to greater than expected operating costs, significant one-time write-offs or restructuring charges, customer loss and business disruption (including, without limitation, difficulties in maintaining relationships with employees, customers, or suppliers). Failure to successfully integrate an acquired business may have an adverse effect on our business, financial condition and results of operations.
Although we perform a due diligence investigation of the businesses or assets that we acquire, there may be liabilities or expenses of the acquired business or assets that we do not uncover during our due diligence investigation and for which we, as a successor owner, may be responsible. The discovery of any material liabilities relating to an acquisition could have a material adverse effect on our business, financial condition and results of operations.

Annual Report © 2014 Alimentation Couche-Tard Inc. Page 41 of 81
Legislative and Regulatory Requirements. As discussed above under “Environmental Laws and Regulations”, our operations are subject to numerous environmental laws and regulations. In addition, convenience store operations are subject to extensive regulations, including regulations relating to the sale of alcohol and tobacco products, various food safety and product quality requirements, minimum wage laws, and tax laws and regulations. We currently incur substantial operating and capital costs for compliance with existing health, safety, environmental and other laws and regulations applicable to our operations. If we fail to comply with any laws and regulations or permit limitations or conditions, or fail to obtain any necessary permits or registrations, or to extend current permits or registrations upon expiry of their terms, or to comply with any restrictive terms contained in our current permits or registrations, we may be subject to, among other things, civil and criminal penalties and, in certain circumstances, the temporary or permanent curtailment or shutdown of a part of our operations. In addition, the laws and regulations applicable to our operations are subject to change and it is expected that, given the nature of our business, we will continue to be subject to increasingly stringent health, safety, environmental laws and regulations and other laws and regulations that may increase the cost of operating our business above currently expected levels and require substantial future capital and other expenditures. As a result, there can be no assurance that the effect of any future laws and regulations or any changes to existing laws and regulation, or their current interpretation, on our business, financial condition and results of operations would not be material.
Our business may also be affected by laws and regulations addressing global climate change and the role in it played by fossil fuel combustion and the resulting carbon emissions. Some jurisdictions in which we operate have enacted measures to limit carbon emissions, and such measures increase the costs of petroleum-based fuels above what they otherwise would be and may adversely affect the demand for road transportation fuel. Similarly, adoption of other environmental protection measures affecting the petroleum supply chain, such as more stringent requirements applicable to the exploration, drilling, and transportation of crude oil and to the refining and transportation of petroleum products, may also increase the costs of petroleum-based fuels with similar effects on demand for road transportation fuel. The impact of such developments, individually or in combination, could adversely affect our sales of road transportation fuel.
Interest Rates. We are exposed to interest rate fluctuations associated with changes in the short-term interest rate. Borrowings under our credit facilities bear interest at variable rates, and other debt we incur could likewise be variable-rate debt. As of April 27, 2014, we carried variable rate debt of approximately $1,352.0 million. Based on the amount of our variable rate debt as at April 27, 2014, a one percentage point increase in interest rates would increase our total annual interest expense by approximately $10.0 million or $0.02 per share on a diluted basis. If market interest rates increase, variable-rate debt will create higher debt service requirements, which could adversely affect our cash flow. We do not currently use derivative instruments to mitigate this risk.
Liquidity. Liquidity risk is the risk that we will encounter difficulties in meeting our obligations associated with financial liabilities and lease commitments. We are exposed to this risk mainly through our long-term debt, accounts payable and accrued expenses and our lease agreements. Our liquidities are provided mainly by cash flows from operating activities and borrowings available under our revolving credit facilities.
Litigation. In the ordinary course of business, we are a defendant in a number of legal proceedings, suits, and claims common to companies engaged in our business and an adverse outcome in such proceedings could adversely affect our business, financial condition and results of operations.
Insurance. We carry comprehensive liability, fire and extended coverage insurance on most of our facilities, with policy specifications and insured limits customarily carried in our industry for similar properties. There can be no assurance that we will be able to continue to obtain such insurance on favourable terms or at all. Some types of losses, such as losses resulting from wars, acts of terrorism, or natural disasters, generally are not insured because they are either uninsurable or not economically practical.
Acts of War or Terrorism. Acts of war and terrorism could impact general economic conditions and the supply and price of crude oil. Such events could adversely impact our business, financial condition and results of operations.
Exchange Rate. Our functional currency is the Canadian dollar. As such, our investments in our U.S. and European operations are exposed to net changes in currency exchange rates. Should changes in currency exchange rates occur, the amount of our net investment in our U.S. and European operations could increase or decrease. From time to time, we use cross-currency interest rate swap agreements to hedge a portion of this risk.
We are also exposed to foreign currency risk with respect to a portion of our long-term debt denominated in U.S. dollars and certain intercompany loans. As at April 27, 2014, all else being equal, a hypothetical variation of 5.0% of the U.S. dollar

Annual Report © 2014 Alimentation Couche-Tard Inc. Page 42 of 81
against the Canadian dollar would have had a net impact of $12.5 million on net earnings. We do not currently use derivative instruments to mitigate this risk.
We use the U.S. dollar as our reporting currency. As such, changes in currency exchange rates could materially increase or decrease our foreign currency-denominated net assets on consolidation which would increase or decrease, as applicable, shareholders’ equity. In addition, changes in currency exchange rates will affect the translation of the revenue and expenses of our Canadian and European operations and will result in lower or higher net earnings than would have occurred had the exchange rate not changed.
In addition to currency translation risks, we incur a currency transaction risk, mostly in Europe, whenever one of our subsidiaries enters into a revenue contract with a different currency than its functional currency. Given the volatility of exchange rates, we may not be able to manage our currency transaction and/or translation risks effectively, and volatility in currency exchange rates could have an adverse effect on our business, financial condition and results of operations.
Credit Risk. We are exposed to credit risk arising from our embedded total return swaps and cross-currency interest rate swaps when these swaps result in a receivable from financial institutions. We do not currently use derivative instruments to mitigate this risk.
Dependence on Third Party Suppliers. Our fuel business is dependent upon the supply of refined oil products from a relatively limited number of suppliers and upon a distribution network serviced principally by third-party tanker trucks. In the case of our key suppliers, an event causing disruptions to any of these suppliers’ supply chains or refineries could have a significant effect on our ability to receive refined oil products for sale or raw materials for use in the production of our lubricants, or result in us paying a higher cost to obtain such products.
Accounts Receivable. We are exposed to risk relating to the creditworthiness and performance of our customers, suppliers and contract counterparties. At April 27, 2014, we had outstanding accounts receivable totaling $1,726.4 million. This amount primarily consists of credit card receivables, vendor rebates due from our suppliers and receivables arising from the sale of fuel to independent, franchised or licensed gas station operators as well as to other industrial and commercial clients. Contracts with longer payment cycles or difficulties in enforcing contracts or collecting accounts receivables could lead to material fluctuations in our cash flows and could adversely impact our business, financial condition and results of operations.
Long-Term Changes in Customer Behaviour. In the road transportation fuel and convenience business sector, customer traffic is generally driven by consumer preferences and spending trends, growth rates for automobile and truck traffic and trends in travel and tourism. A decline in the number of potential customers using our fuel stations and convenience stores due to changes in consumer preferences, changes in discretionary consumer spending or modes of transportation could adversely impact our business, financial condition and results of operations.
Global Operations. We have significant operations in multiple jurisdictions throughout the world. Some of the risks inherent in the scope of our international operations include: the difficulty of enforcing agreements and collecting receivables through certain foreign legal systems; more expansive legal rights of foreign labor unions and employees; foreign currency exchange rate fluctuations; the potential for changes in local economic conditions; potential tax inefficiencies in repatriating funds from foreign subsidiaries; and exchange controls and restrictive governmental actions, such as restrictions on transfer or repatriation of funds and trade protection matters, including prohibitions or restrictions on acquisitions or joint ventures. Any of these factors could materially and adversely affect our business, financial condition and results of operations.
Outlook
During fiscal year 2015, we expect to pursue our investments with caution in order to, amongst other things, improve our network and build additional stores. We also intend to keep an ongoing focus on our sales, supply terms and operating expenses while keeping an eye on growth opportunities that may be available.
We will continue to pay special attention to the realization of Statoil Fuel & Retail’s synergies and to the reduction of our debt level in order to improve our financial flexibility and hopefully improve the quality of our credit rating.
Finally, in line with our business model, we intend to continue focussing on the sale of fresh products and on innovation, including the introduction of new products and services, in order to satisfy the needs of our large clientele.
July 7, 2014
Annual Report © 2014 Alimentation Couche-Tard Inc. Page 43 of 81
Management’s Report
The consolidated financial statements of Alimentation Couche-Tard Inc. and the financial information contained in this Annual Report are the responsibility of management. This responsibility is applied through a judicious choice of accounting procedures and principles, the application of which requires the informed judgment of management. The consolidated financial statements were prepared according to generally accepted accounting principles in Canada as set out in Part I of the Chartered Professional Accountants of Canada (CPA Canada) Handbook - Accounting, which incorporates International Financial Reporting Standards (“IFRS’’), as issued by the International Accounting Standards Board (“IASB”) and were approved by the Board of Directors. In addition, the financial information included in the Annual Report is consistent with the consolidated financial statements.
Alimentation Couche-Tard Inc. maintains accounting and administrative control systems which, in the opinion of management, ensure reasonable accuracy, relevance and reliability of financial information and well-ordered, efficient management of the Corporation’s affairs.
The Board of Directors is responsible for approving the consolidated financial statements included in this Annual Report, primarily through its Audit Committee. This committee, which holds periodic meetings with members of management as well as with the external auditors, reviewed the consolidated financial statements of Alimentation Couche-Tard Inc. and recommended their approval to the Board of Directors.
The consolidated financial statements for the fiscal years ended April 27, 2014 and April 28, 2013 were audited by PricewaterhouseCoopers LLP, a partnership of chartered professional accountants, and their report indicates the extent of their audit and their opinion on the consolidated financial statements.
July 7, 2014
/s/ Alain Bouchard /s/ Raymond Paré Alain Bouchard Raymond Paré President and Chief Executive Officer
Vice-President and Chief Financial Officer
Annual Report © 2014 Alimentation Couche-Tard Inc. Page 44 of 81
Management’s Report on Internal Control over Financial Reporting
Management is responsible for establishing and maintaining adequate internal control over financial reporting for Alimentation Couche-Tard Inc, as such term is defined in Canadian securities regulations. With our participation management carried out an evaluation of the effectiveness of our internal control over financial reporting, as of the end of our fiscal year ended April 27, 2014. The framework on which such evaluation was based is contained in the report entitled Internal Control - Integrated Framework (1992) issued by the Committee of Sponsoring Organizations of the Treadway Commission (“COSO”). This evaluation included review of the documentation of controls, evaluation of the design effectiveness of controls, testing of the operating effectiveness of controls and a conclusion on this evaluation. Because of its inherent limitations, internal control over financial reporting may not prevent or detect misstatements. Also, projections of any evaluation of effectiveness to future periods are subject to the risk that controls may become inadequate because of changes in conditions, or that the degree of compliance with the policies or procedures may deteriorate. Based on this evaluation, management concluded that Alimentation Couche-Tard Inc.’s internal control over financial reporting was effective as at April 27, 2014.
PricewaterhouseCoopers LLP, a partnership of chartered professional accountants, audited the effectiveness of Alimentation Couche-Tard Inc.’s internal control over financial reporting as at April 27, 2014 and have issued their unqualified opinion thereon, which is included herein.
July 7, 2014
/s/ Alain Bouchard /s/ Raymond Paré Alain Bouchard Raymond Paré President and Chief Executive Officer
Vice-President and Chief Financial Officer
Annual Report © 2014 Alimentation Couche-Tard Inc. Page 45 of 81
Independent Auditor’s Report To the Shareholders of Alimentation Couche-Tard Inc.
July 7, 2014
We have completed integrated audits of Alimentation Couche-Tard Inc. and its subsidiaries’ consolidated financial statements for the fiscal year ended April 27, 2014 and April 28, 2013 and its internal control over financial reporting as at April 27, 2014. Our opinions, based on our audits, are presented below.
Consolidated financial statements
We have audited the accompanying consolidated financial statements of Alimentation Couche-Tard Inc. and its subsidiaries, which comprise the consolidated balance sheets as at April 27, 2014 and April 28, 2013 and the consolidated statements of earnings, comprehensive income, changes in shareholders’ equity and cash flows for the fiscal years ended April 27, 2014 and April 28, 2013, and the related notes, which comprise a summary of significant accounting policies and other explanatory information.
Management’s responsibility for the consolidated financial statements
Management is responsible for the preparation and fair presentation of these consolidated financial statements in accordance with International Financial Reporting Standards and for such internal control as management determines is necessary to enable the preparation of consolidated financial statements that are free from material misstatement, whether due to fraud or error.
Auditor’s responsibility
Our responsibility is to express an opinion on these consolidated financial statements based on our audits. We conducted our audits in accordance with Canadian generally accepted auditing standards. Those standards require that we comply with ethical requirements and plan and perform the audits to obtain reasonable assurance about whether the consolidated financial statements are free from material misstatement.
An audit involves performing procedures to obtain audit evidence about the amounts and disclosures in the consolidated financial statements. The procedures selected depend on the auditor’s judgment, including the assessment of the risks of material misstatement of the consolidated financial statements, whether due to fraud or error. In making those risk assessments, the auditor considers internal control relevant to the company’s preparation and fair presentation of the consolidated financial statements in order to design audit procedures that are appropriate in the circumstances. An audit also includes evaluating the appropriateness of accounting policies used and the reasonableness of accounting estimates made by management, as well as evaluating the overall presentation of the consolidated financial statements.
We believe that the audit evidence we have obtained in our audits is sufficient and appropriate to provide a basis for our audit opinion on the consolidated financial statements.
Opinion
In our opinion, the consolidated financial statements present fairly, in all material respects, the financial position of Alimentation Couche-Tard Inc. and its subsidiaries as at April 27, 2014 and April 28, 2013 and their financial performance and their cash flows for fiscal years ended April 27, 2014 and April 28, 2013 in accordance with International Financial Reporting Standards.
Report on internal control over financial reporting
We have also audited the effectiveness of Alimentation Couche-Tard Inc. and its subsidiaries’ internal control over financial reporting as at April 27, 2014.
Management’s responsibility for internal control over financial reporting
Management is responsible for maintaining effective internal control over financial reporting and for its assessment of the effectiveness of internal control over financial reporting included in the accompanying Management’s Report on Internal Control over Financial Reporting.
Auditor’s responsibility
Our responsibility is to express an opinion, based on our audit, on whether the company’s internal control over financial reporting was effectively maintained in accordance with criteria established in Internal Control - Integrated Framework (1992), issued by the Committee of Sponsoring Organizations of the Treadway Commission (COSO).

Annual Report © 2014 Alimentation Couche-Tard Inc. Page 46 of 81
We conducted our audit in accordance with the standard for audits of internal control over financial reporting set out in the CPA Canada Handbook – Assurance. This standard requires that we plan and perform the audit to obtain reasonable assurance about whether effective internal control over financial reporting was maintained in all material respects. Our audit of internal control over financial reporting included obtaining an understanding of internal control over financial reporting, assessing the risk that a material weakness exists, testing and evaluating the design and operating effectiveness of internal control, based on the assessed risk, and performing such other procedures as we consider necessary in the circumstances.
We believe that the audit evidence we have obtained is sufficient and appropriate to provide a basis for our audit opinion. A company’s internal control over financial reporting is a process designed to provide reasonable assurance regarding the reliability of financial reporting and the preparation of financial statements for external purposes in accordance with Canadian generally accepted accounting principles. A company’s internal control over financial reporting includes those policies and procedures that (i) pertain to the maintenance of records that, in reasonable detail, accurately and fairly reflect the transactions and dispositions of the assets of the company; (ii) provide reasonable assurance that transactions are recorded as necessary to permit preparation of financial statements in accordance with Canadian generally accepted accounting principles, and that receipts and expenditures of the company are being made only in accordance with authorizations of management and directors of the company; and (iii) provide reasonable assurance regarding prevention or timely detection of unauthorized acquisition, use, or disposition of the company’s assets that could have a material effect on the financial statements.
Opinion
In our opinion, Alimentation Couche-Tard Inc. and its subsidiaries maintained, in all material respects, effective internal control over financial reporting as at April 27, 2014 in accordance with criteria established in Internal Control - Integrated Framework (1992), issued by COSO.
Because of its inherent limitations, internal control over financial reporting may not prevent or detect misstatements. Also, projections of any evaluation of effectiveness to future periods are subject to the risk that controls may become inadequate because of changes in conditions or that the degree of compliance with the policies or procedures may deteriorate.
Montreal, Canada
1 CPA auditor, CA, public accountancy permit No. A119427
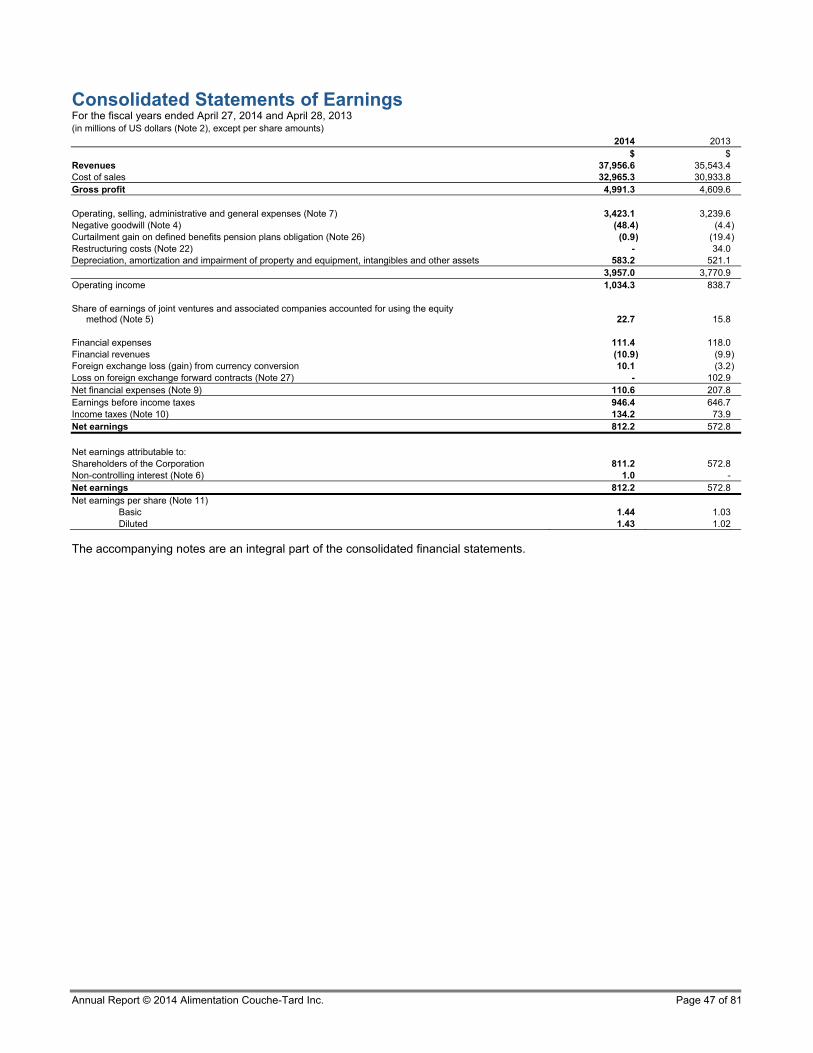
Annual Report © 2014 Alimentation Couche-Tard Inc. Page 47 of 81
Consolidated Statements of Earnings For the fiscal years ended April 27, 2014 and April 28, 2013 (in millions of US dollars (Note 2), except per share amounts)
2014 2013 $ $Revenues 37,956.6 35,543.4Cost of sales 32,965.3 30,933.8Gross profit 4,991.3 4,609.6 Operating, selling, administrative and general expenses (Note 7) 3,423.1 3,239.6Negative goodwill (Note 4) (48.4 ) (4.4) Curtailment gain on defined benefits pension plans obligation (Note 26) (0.9 ) (19.4) Restructuring costs (Note 22) - 34.0Depreciation, amortization and impairment of property and equipment, intangibles and other assets 583.2 521.1 3,957.0 3,770.9Operating income 1,034.3 838.7 Share of earnings of joint ventures and associated companies accounted for using the equity
method (Note 5) 22.7 15.8 Financial expenses 111.4 118.0Financial revenues (10.9 ) (9.9) Foreign exchange loss (gain) from currency conversion 10.1 (3.2) Loss on foreign exchange forward contracts (Note 27) - 102.9Net financial expenses (Note 9) 110.6 207.8Earnings before income taxes 946.4 646.7Income taxes (Note 10) 134.2 73.9Net earnings 812.2 572.8
Net earnings attributable to: Shareholders of the Corporation 811.2 572.8Non-controlling interest (Note 6) 1.0 -Net earnings 812.2 572.8Net earnings per share (Note 11) Basic 1.44 1.03 Diluted 1.43 1.02
The accompanying notes are an integral part of the consolidated financial statements.

Annual Report © 2014 Alimentation Couche-Tard Inc. Page 48 of 81
Consolidated Statements of Comprehensive Income For the fiscal years ended April 27, 2014 and April 28, 2013 (in millions of US dollars (Note 2), except per share amounts) 2014 2013 $ $Net earnings 811.2 572.8Other comprehensive income
Items that may be reclassified to earnings Translation adjustments
Changes in cumulative translation adjustments (1) 42.4 183.3Change in fair value of financial instruments designated as a hedge of the Corporation’s net investment
in its U.S. operations (2) (45.7 ) (16.9) Net interest on financial instruments designated as a hedge of the Corporation’s net investment
in its U.S. operations (3) 2.6 1.8Cash flow hedges
Change in fair value of financial instruments (4) (Note 27) 2.8 7.6Gain realized on financial instruments transferred to earnings (5) (Note 27) (1.1 ) (7.8)
Items that will never be reclassified to earnings Net actuarial gain (Note 26) (6) 0.1 1.0
Other comprehensive income 1.1 169.0Comprehensive income 812.3 741.8 Comprehensive income attributable to: Shareholders of the Corporation 811.3 749.7Non-controlling interest 1.0 (7.9) Comprehensive income 812.3 741.8
(1) For the fiscal year ended April 28, 2013 this amount includes a gain of $20.7, arising from the translation of US dollar denominated long-term debt which was previously designated as a foreign exchange hedge of the Corporation’s net investment in its US operations (net of income taxes of $3.2).
(2) For the fiscal years ended April 27, 2014 and April 28, 2013 these amounts are net of income taxes of $7.8 and $3.4, respectively. (3) For the fiscal years ended April 27, 2014 and April 28, 2013 these amounts are net of income taxes of $0.9 and $0.8, respectively. (4) For the fiscal years ended April 27, 2014 and April 28, 2013 these amounts are net of income taxes of $1.0 and $2.6, respectively. (5) For the fiscal years ended April 27, 2014 and April 28, 2013 these amounts are net of income taxes of $0.4 and $2.8, respectively. (6) For the fiscal years ended April 27, 2014 and April 28, 2013 these amounts are net of income taxes of $0.2 and $0.3, respectively.
The accompanying notes are an integral part of the consolidated financial statements.

Annual Report © 2014 Alimentation Couche-Tard Inc. Page 49 of 81
Consolidated Statements of Changes in Shareholders’ Equity For the fiscal years ended April 27, 2014 and April 28, 2013 (in millions of US dollars (Note 2))
2014
Attributable to shareholders of the Corporation
Capital stock
Contributed surplus
Retained earnings
Accumulated other
comprehensive income Total
Non-controlling
interest Total equity
$ $ $ $ $ $ $
Balance, beginning of year 670.4 16.5 2,344.0 185.8 3,216.7 - 3,216.7 Comprehensive income:
Net earnings 811.2 811.2 1.0 812.2 Other comprehensive income 1.1 1.1 1.1
Comprehensive income 812.3 1.0 813.3 Dividends (64.6) (64.6 ) (64.6) Addition to non-controlling interest (Note 6) - 13.2 13.2 Redemption liability (Note 6) (13.2) (13.2 ) (13.2) Stock option-based compensation expense
(Note 24) 1.8 1.8 1.8 Initial fair value of stock options exercised 6.7 (6.7) - - Cash received upon exercise of stock options 9.4 9.4 9.4 Balance, end of year 686.5 11.6 3,077.4 186.9 3,962.4 14.2 3,976.6
2013
Attributable to shareholders of the Corporation
Capital stock
Contributed surplus
Retained earnings
Accumulated other
comprehensive income Total
Non-controlling
interest Total equity
$ $ $ $ $ $ $
Balance, beginning of year 321.0 17.9 1,826.8 8.9 2,174.6 2,174.6 Comprehensive income:
Net earnings 572.8 572.8 572.8 Other comprehensive income (loss) 176.9 176.9 (7.9) 169.0
Comprehensive income 749.7 (7.9) 741.8 Dividends (55.6) (55.6 ) (55.6) Acquisition of control of Statoil Fuel & Retail
ASA (Note 4) - 487.2 487.2 Acquisition of non-controlling interest in
Statoil Fuel & Retail ASA (Note 4) - (479.3) (479.3) Class B subordinate voting shares issued for
cash on public offering, net of transaction costs (1) (Note 23) 337.2 337.2 337.2
Stock option-based compensation expense (Note 24) 2.7 2.7 2.7
Initial fair value of stock options exercised 4.1 (4.1) - - Cash received upon exercise of stock options 8.1 8.1 8.1 Balance, end of year 670.4 16.5 2,344.0 185.8 3,216.7 - 3,216.7
(1) This amount is net of transaction costs which are net of a related income tax benefit of $3.8.
The accompanying notes are an integral part of the consolidated financial statements.
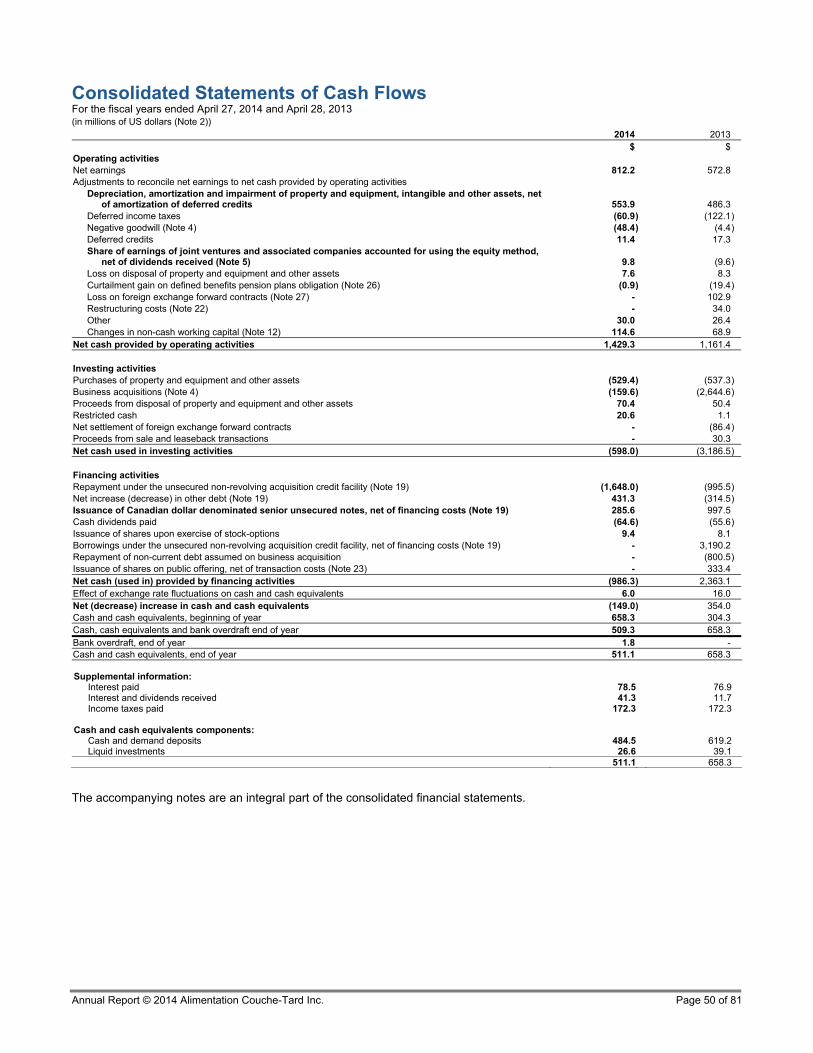
Annual Report © 2014 Alimentation Couche-Tard Inc. Page 50 of 81
Consolidated Statements of Cash Flows For the fiscal years ended April 27, 2014 and April 28, 2013 (in millions of US dollars (Note 2))
2014 2013 $ $
Operating activities Net earnings 812.2 572.8Adjustments to reconcile net earnings to net cash provided by operating activities
Depreciation, amortization and impairment of property and equipment, intangible and other assets, net of amortization of deferred credits 553.9 486.3
Deferred income taxes (60.9 ) (122.1) Negative goodwill (Note 4) (48.4 ) (4.4) Deferred credits 11.4 17.3Share of earnings of joint ventures and associated companies accounted for using the equity method,
net of dividends received (Note 5) 9.8 (9.6) Loss on disposal of property and equipment and other assets 7.6 8.3Curtailment gain on defined benefits pension plans obligation (Note 26) (0.9 ) (19.4) Loss on foreign exchange forward contracts (Note 27) - 102.9Restructuring costs (Note 22) - 34.0Other 30.0 26.4Changes in non-cash working capital (Note 12) 114.6 68.9
Net cash provided by operating activities 1,429.3 1,161.4 Investing activities Purchases of property and equipment and other assets (529.4 ) (537.3) Business acquisitions (Note 4) (159.6 ) (2,644.6) Proceeds from disposal of property and equipment and other assets 70.4 50.4Restricted cash 20.6 1.1Net settlement of foreign exchange forward contracts - (86.4) Proceeds from sale and leaseback transactions - 30.3Net cash used in investing activities (598.0 ) (3,186.5) Financing activities Repayment under the unsecured non-revolving acquisition credit facility (Note 19) (1,648.0 ) (995.5) Net increase (decrease) in other debt (Note 19) 431.3 (314.5) Issuance of Canadian dollar denominated senior unsecured notes, net of financing costs (Note 19) 285.6 997.5Cash dividends paid (64.6 ) (55.6) Issuance of shares upon exercise of stock-options 9.4 8.1Borrowings under the unsecured non-revolving acquisition credit facility, net of financing costs (Note 19) - 3,190.2Repayment of non-current debt assumed on business acquisition - (800.5) Issuance of shares on public offering, net of transaction costs (Note 23) - 333.4Net cash (used in) provided by financing activities (986.3 ) 2,363.1Effect of exchange rate fluctuations on cash and cash equivalents 6.0 16.0Net (decrease) increase in cash and cash equivalents (149.0 ) 354.0Cash and cash equivalents, beginning of year 658.3 304.3Cash, cash equivalents and bank overdraft end of year 509.3 658.3Bank overdraft, end of year 1.8 -Cash and cash equivalents, end of year 511.1 658.3 Supplemental information:
Interest paid 78.5 76.9Interest and dividends received 41.3 11.7Income taxes paid 172.3 172.3
Cash and cash equivalents components: Cash and demand deposits 484.5 619.2Liquid investments 26.6 39.1 511.1 658.3
The accompanying notes are an integral part of the consolidated financial statements.

Annual Report © 2014 Alimentation Couche-Tard Inc. Page 51 of 81
Consolidated Balance Sheets As at April 27, 2014 and April 28, 2013 (in millions of US dollars (Note 2))
2014 2013 $ $ Assets Current assets
Cash and cash equivalents 511.1 658.3 Restricted cash 1.0 21.6 Accounts receivable (Note 13) 1,726.4 1,616.0 Inventories (Note 14) 848.0 846.0 Prepaid expenses 60.0 57.8 Income taxes receivable 68.4 81.6
3,214.9 3,281.3 Property and equipment (Note 15) 5,131.0 5,079.9 Goodwill (Note 16) 1,088.7 1,081.0 Intangible assets (Note 16) 823.5 834.7 Other assets (Note 17) 159.8 136.3 Investment in joint ventures and associated companies (Note 5) 75.4 84.2 Deferred income taxes (Note 10) 51.7 48.8 10,545.0 10,546.2
Liabilities Current liabilities
Accounts payable and accrued liabilities (Note 18) 2,510.3 2,351.1 Provisions (Note 22) 102.4 96.5 Income taxes payable 29.8 70.0 Current portion of long-term debt (Note 19) 20.3 620.8
2,662.8 3,138.4 Long-term debt (Note 19) 2,586.1 2,984.3 Provisions (Note 22) 390.5 358.8 Pension benefit liability (Note 26) 119.8 109.7 Other financial liabilities (Note 20) 73.9 20.4 Deferred credits and other liabilities (Note 21) 169.5 156.7 Deferred income taxes (Note 10) 565.8 561.2 6,568.4 7,329.5
Equity Capital stock (Note 23) 686.5 670.4 Contributed surplus 11.6 16.5 Retained earnings 3,077.4 2,344.0 Accumulated other comprehensive income (Note 25) 186.9 185.8 Equity attributable to shareholders of the Corporation 3,962.4 3,216.7 Non-controlling interest 14.2 - 3,976.6 3,216.7 10,545.0 10,546.2
The accompanying notes are an integral part of the consolidated financial statements.
On behalf of the Board,
/s/ Alain Bouchard
/s/ Réal Plourde Alain Bouchard Réal PlourdeDirector Director
Notes to the Consolidated Financial Statements For the fiscal years ended April 27, 2014 and April 28, 2013 (in millions of US dollars, except share and stock option data)
Annual Report © 2014 Alimentation Couche-Tard Inc. Page 52 of 81
1. GOVERNING STATUTES AND NATURE OF OPERATIONS
Alimentation Couche-Tard Inc. (the “Corporation”) is governed by the Business Corporations Act (Quebec). The Corporation’s head office is located in Laval, at 4204 Boulevard Industriel, Quebec, Canada.
As at April 27, 2014, the Corporation operates and licenses 8,499 convenience stores across North America, Scandinavia (Norway, Sweden and Denmark), Poland, the Baltics (Estonia, Latvia, Lithuania), and Russia, of which 6,236 are company-operated, and generates income primarily from the sales of tobacco products, grocery items, beverages, fresh food offerings, including quick service restaurants, car wash services, other retail products and services, road transportation fuel, stationary energy, marine and aviation fuel, lubricants and chemicals.
2. BASIS OF PRESENTATION
Year-end date
The Corporation’s year-end is the last Sunday of April of each year. The fiscal years ended April 27, 2014 and April 28, 2013 are referred to as 2014 and 2013.
Basis of presentation
The Corporation prepares its consolidated financial statements in accordance with generally accepted accounting principles in Canada as set out in Part I of the CPA Canada Handbook - Accounting, which incorporates International Financial Reporting Standards (“IFRS’’), as issued by the International Accounting Standards Board (“IASB”).
Reporting currency
The parent corporation’s functional currency is the Canadian dollar. However, the Corporation uses the US dollar as its reporting currency to provide more relevant information considering its predominant operations in the United States and its debt largely denominated in US dollars.
Approval of the financial statements
The Corporation’s consolidated financial statements were approved on July 7, 2014 by the board of directors who also approved their publication.
3. ACCOUNTING POLICIES
Change in accounting policies
Financial Statement Presentation
On April 29, 2013, the Corporation adopted amendments to International Accounting Standard (“IAS”) 1, “Presentation of Financial Statements”. The amendments govern the presentation of Other Comprehensive Income (“OCI”) in the financial statements, primarily by requiring OCI items that may be reclassified to the consolidated statements of earnings to be presented separately from those that will not be reclassified. The Corporation adopted this presentation and there was no other significant impact on the Corporation’s consolidated financial statements.
Consolidated financial statements
On April 29, 2013, the Corporation adopted the new standard IFRS 10, “Consolidated Financial Statements”, which requires an entity to consolidate an investee when it is exposed, or has rights, to variable returns from its involvement with the investee and has the ability to affect those returns through its power over the investee. Under previous IFRS, consolidation was required when an entity had the power to govern the financial and operating policies of an entity so as to obtain benefits from its activities. IFRS 10 replaces SIC-12, “Consolidation—Special Purpose Entities” and parts of IAS 27, “Consolidated and Separate Financial Statements”. The adoption of this standard had no impact on the Corporation’s consolidated financial statements.
Joint Arrangements
On April 29, 2013, the Corporation adopted the new standard IFRS 11, “Joint Arrangements”, which requires a venturer to classify its interest in a joint arrangement as a joint venture or joint operation. Joint ventures must be accounted for using the equity method of accounting whereas for a joint operation the venturer must recognize its share of the assets, liabilities, revenue and expenses of the joint operation. Under previous IFRS, entities had the choice to proportionately consolidate or equity account for interests in joint ventures. IFRS 11 supersedes IAS 31, “Interests in Joint Ventures” and SIC-13, “Jointly Controlled Entities—Non-monetary Contributions by Venturers”. The adoption of this standard had no impact on the Corporation’s consolidated financial statements as the Corporation was already accounting for its joint ventures using the equity method.
Disclosure of Interest in Other Entities
On April 29, 2013, the Corporation adopted the new standard IFRS 12, “Disclosure of Interest in Other Entities”. IFRS 12 establishes disclosure requirements for interests in other entities, such as joint arrangements, associates, special purpose vehicles and off balance sheet vehicles. The standard includes existing disclosures and also introduces significant additional disclosure requirements that address the nature of, and risks associated with, an entity’s interests in other entities. The adoption of this standard had no impact on the Corporation’s consolidated financial statements. The required disclosures under IFRS 12 were included by the Corporation in these consolidated financial statements.
Notes to the Consolidated Financial Statements For the fiscal years ended April 27, 2014 and April 28, 2013 (in millions of US dollars, except share and stock option data)
Annual Report © 2014 Alimentation Couche-Tard Inc. Page 53 of 81
Fair Value Measurement
On April 29, 2013, the Corporation adopted the new standard IFRS 13, “Fair Value Measurement”. IFRS 13 is a comprehensive standard for fair value measurement and disclosure requirements for use across essentially all IFRS. The new standard clarifies that fair value is the price that would be received to sell an asset, or paid to transfer a liability in an orderly transaction between market participants, at the measurement date. It also establishes disclosures about fair value measurement. Under previous IFRS, guidance on measuring and disclosing fair value was dispersed among the specific standards requiring fair value measurements and in many cases did not reflect a clear measurement basis or consistent disclosures. The adoption of this standard had no impact on the Corporation’s consolidated financial statements with respect to measurement but has required additional disclosures.
Impairment of Assets
On April 29, 2013, the Corporation early-adopted amendments to IAS 36 requiring additional disclosures about the recoverable amount of impaired non-financial assets if that amount is based on fair value less costs to sell. The adoption of these amendments had no impact on the Corporation’s consolidated financial statements.
Offsetting financial assets and financial liabilities
On April 29, 2013, the Corporation early-adopted amendments to IAS 32 “Financial Instruments - Presentation” which was amended to clarify the requirements for offsetting financial assets and financial liabilities. The Corporation also early-adopted amendments to IFRS 7 “Financial Instruments - Disclosures” which was amended to improve disclosures on offsetting of financial assets and financial liabilities. These amendments did not impact the Corporation's consolidated financial statements, but additional information is disclosed in notes 13 and 18.
Use of estimates and judgments
The preparation of consolidated financial statements in accordance with IFRS requires management to make estimates and assumptions that affect the amounts reported in the consolidated financial statements and accompanying notes. On an ongoing basis, management reviews its estimates. These estimates are based on management’s best knowledge of current events and actions that the Corporation may undertake in the future. Actual results could differ from those estimates. The most significant accounting judgments and estimates that the Corporation has made in the preparation of the consolidated financial statements are discussed along with the relevant accounting policies when applicable and relate primarily to the following topics: Vendor rebates, determination of the useful lives of tangible and intangible assets, income taxes, leases, employee future benefits, provisions, impairment and business combinations.
Principles of consolidation
The consolidated financial statements include the accounts of the Corporation and its subsidiaries, which are generally wholly owned. They also include the Corporation’s share of earnings of joint ventures and associated companies accounted for using the equity method. All intercompany balances and transactions have been eliminated on consolidation.
Subsidiaries are entities over which the Corporation has control, where control is defined as the power to govern financial and operating policies. The Corporation generally has a direct or indirect shareholding of 100% of the voting rights in its subsidiaries. These criteria are reassessed regularly and subsidiaries are fully consolidated from the date control is transferred to the Corporation, and are deconsolidated from the date control ceases.
The Corporation holds contracts with franchisees. These franchisees manage their store and are responsible for merchandising and financing their inventory. The franchised stores' financial statements are not included in the Corporation's consolidated financial statements.
Foreign currency translation
Functional currency
The functional currency is the currency of the primary economic environment in which an entity operates. The functional currency of the parent corporation and its Canadian operations is the Canadian dollar. The functional currency of foreign subsidiaries is generally their local currency, mainly the US dollar for US operations and various other European currencies for operations in Europe.
Foreign currency transactions
Transactions denominated in foreign currencies are translated into the relevant functional currency as follows: Monetary assets and liabilities are translated at the exchange rate in effect at the balance sheet date and revenues and expenses are translated at the average exchange rate on a 4-week period basis. Non-monetary assets and liabilities are translated at historical rates or at the rate on the date they were valued at fair value. Gains and losses arising from such translation, if any, are reflected in the consolidated statement of earnings except when deferred in equity as qualifying net investment hedge.
Consolidation and foreign operations
The consolidated financial statements are consolidated in Canadian dollars using the following procedure: Assets and liabilities are translated into Canadian dollars using the exchange rate in effect at the balance sheet date. Revenues and expenses are translated at the average exchange rate on a 4-week period basis. Individual transactions with a significant impact on the consolidated statement of earnings are translated using the transaction date exchange rate.
Gains and losses arising from such translation are included in Accumulated other comprehensive income in Shareholders’ equity. The translation difference derived from each foreign subsidiary, associated company or joint venture is transferred to the consolidated statement of

Notes to the Consolidated Financial Statements For the fiscal years ended April 27, 2014 and April 28, 2013 (in millions of US dollars, except share and stock option data)
Annual Report © 2014 Alimentation Couche-Tard Inc. Page 54 of 81
earnings as part of the gain or loss arising from the divestment or liquidation of such a foreign entity when there is a loss of control, joint control or significant influence, respectively.
Reporting currency
The Corporation has adopted the US dollar as its reporting currency. The Canadian dollar consolidated financial statements are translated into the reporting currency using the procedure described above. Capital stock, Contributed surplus and Retained earnings are translated using historical rates. Non-monetary assets at fair value are translated at the rate on the date on which their fair value was determined. Gains and losses arising from translation are included in Accumulated other comprehensive income in Shareholders' equity.
Net earnings per share
Basic net earnings per share is calculated by dividing the net earnings available to Class A and Class B shareholders by the weighted average number of Class A and Class B shares outstanding during the year. Diluted net earnings per share is calculated using the average weighted number of shares outstanding plus the weighted average number of shares that would be issued upon the conversion of all potential dilutive stock-options into common shares.
Revenue recognition
For its three major product categories, merchandise and services, road transportation fuel and other, the Corporation generally recognizes revenue at point of sales for convenience operations. Merchandise sales primarily comprise the sale of tobacco products, grocery items, candy and snacks, beverages, beer, wine and fresh food offerings, including quick service restaurants. Merchandise sales in Europe also include sale of merchandise and goods to certain independent operators and franchisees made from the Corporation’s distribution center which are generally recognized on the passing of possession of the goods and when the transfer of the associated risk is made.
Service revenues include the commission on sale of lottery tickets and issuance of money orders, fees from automatic teller machines, sales of calling cards and gift cards, fees for cashing cheques, sales of postage stamps and bus tickets and car wash revenues. These revenues are recognized at the time of the transaction. Service revenues also include franchise and license fees, which are recognized in revenues over the period of the agreement to which the fees relate as well as royalties from franchisees and licensees, which are recognized periodically based on sales reported by franchise and license operators.
In markets where refined oil products are purchased excluding excise duties, revenues from sales to customers are reported net of duties taxes. In markets where refined oil products are purchased including excise duties, revenues and costs of goods sold are reported including these duties.
Other revenues include sale of stationary energy, marine fuel, aviation fuel, lubricants and chemicals which are generally recognized on the passing of possession of the goods and when the transfer of the associated risk is made. Other revenues also include rental income from operating leases, which is recognized on a straight-line basis, over the term of the lease.
Cost of sales and vendor rebates
Cost of sales mainly comprises the cost of finished goods, input materials and transportation costs when they are incurred to bring products to the point of sale. For the Corporation's own production, such as production of lubricants, the cost of goods sold also includes direct labour costs, production overheads, and production facility operating costs.
The Corporation records cash received from vendors related to vendor rebates as a reduction in the price of the vendors’ products and reflects them as a reduction of cost of sales and related inventory in its consolidated statements of earnings and balance sheets when it is probable that they will be received. The Corporation estimates the probability based on the consideration of a variety of factors, including quantities of items sold or purchased, market shares and other conditions specified in the contracts. The accuracy of the Corporation’s estimates can be affected by many factors, some of which are beyond its control, including changes in economic conditions and consumer buying trends. Historically, the Corporation has not experienced significant differences in its estimates compared with actual results. Amounts received but not yet earned are presented in deferred credits.
Operating, selling, administrative and general expenses
The main items comprising Operating, selling, administrative and general expenses are labour, net occupancy costs, credit and debit card fees, overhead as well as transportation costs incurred to bring products to the final customer.
Cash and cash equivalents
Cash includes cash and demand deposits. Cash equivalents include highly liquid investments that can be readily converted into cash for a fixed amount and that mature less than three months from the date of acquisition.
Restricted cash
Restricted cash comprises escrow deposits for pending acquisitions.
Inventories
Inventories are valued at the lesser of cost and net realizable value. The cost of merchandise is generally valued based on the retail price less a normal margin. The cost of road transportation motor fuel inventory is generally determined according to the average cost method. The cost of lubricant products and aviation fuel is determined according to the first-in, first-out method.

Notes to the Consolidated Financial Statements For the fiscal years ended April 27, 2014 and April 28, 2013 (in millions of US dollars, except share and stock option data)
Annual Report © 2014 Alimentation Couche-Tard Inc. Page 55 of 81
Income taxes
The income tax expense recorded to earnings is the sum of the deferred income taxes and current income taxes that are not recognized in Other comprehensive income or directly to Shareholders’ equity.
The Corporation uses the balance sheet liability method to account for income taxes. Under this method, deferred tax assets and liabilities are determined based on differences between the carrying amounts and tax bases of assets and liabilities using enacted or substantively enacted tax rates and laws, as appropriate, at the date of the consolidated financial statements for the years in which the temporary differences are expected to reverse. Deferred tax assets are reviewed at each reporting date and are reduced to the extent that it is no longer probable that the related tax benefit will be realized.
Deferred tax liabilities are recognized for taxable temporary differences associated with investments in subsidiaries and interests in joint ventures, except where the Corporation is able to control the reversal of the temporary difference and it is probable that the temporary difference will not reverse in the foreseeable future. Deferred tax assets arising from deductible temporary differences associated with such investments and interests are only recognized to the extent that it is probable that there will be sufficient taxable profits against which to utilize the benefits of the temporary differences and they are expected to reverse in the foreseeable future.
Deferred tax assets and liabilities are offset when there is a legally enforceable right to set off current tax assets against current tax liabilities and when they relate to income taxes levied by the same taxation authority and the Corporation intends to settle its current tax assets and liabilities on a net basis.
The Corporation is subject to income taxes in numerous jurisdictions. Significant judgement is required in determining the worldwide provision for income taxes. There are many transactions and calculations for which the ultimate tax determination is uncertain. The Corporation recognizes liabilities for anticipated tax audit issues based on estimates of whether additional taxes will be due. Where the final tax outcome of these matters is different from the amounts that were initially recorded, such differences will impact the current and deferred income tax assets and liabilities in the period in which such determination is made.
Property and equipment, depreciation, amortization and impairment
Property and equipment are stated at cost less accumulated depreciation and are depreciated over their estimated useful lives using the straight-line method based on the following periods:
Buildings and building components 3 to 40 yearsEquipment 3 to 40 yearsBuildings under finance leases Lease term Equipment under finance leases Lease term
Building components include air conditioning and heating systems, plumbing and electrical fixtures. Equipment includes signage, fuel equipment and in-store equipment.
Leasehold improvements and property and equipment on leased properties are amortized and depreciated over the lesser of their useful lives and the term of the lease.
Property and equipment are tested for impairment should events or circumstances indicate that their book value may not be recoverable, as measured by comparing their net book value to their recoverable amount which corresponds to the higher of fair value less costs to sell and value in use of the asset or cash-generating unit (“CGU”). Should the carrying amount of property and equipment exceed their recoverable amount, an impairment loss in the amount of the excess would be recognized.
The Corporation performs an annual evaluation of residual values, estimated useful lives and depreciation methods used for property and equipment and any change resulting from this evaluation is applied prospectively by the Corporation.
Goodwill
Goodwill is the excess of the cost of an acquired business over the fair value of underlying net assets acquired from the business at the time of acquisition. Goodwill is not amortized. Rather it is tested for impairment annually during the Corporation’s first quarter or more frequently should events or changes in circumstances indicate that it might be impaired or if necessary due to the timing of acquisitions. Should the carrying amount of a CGU’s goodwill exceed its recoverable amount, an impairment loss would be recognized.
Intangible assets
Intangible assets mainly comprise trademarks, franchise agreements, customer relationships, motor fuel supply agreements, software and licenses. Licenses and trademarks that have indefinite lives since they do not expire, are recorded at cost, are not amortized and are tested for impairment annually during the first quarter, or more frequently should events or changes in circumstances indicate that they might be impaired or if necessary due to the timing of acquisitions. Motor fuel supply agreements, franchise agreements and trademarks with finite lives are recorded at cost and are amortized using the straight-line method over the term of the agreements they relate to. Customer relationships, software and other intangible assets are amortized using the straight-line method over a period of 3 to 15 years.
Deferred charges
Deferred charges are mainly expenses incurred in connection with the analysis and signing of the Corporation’s revolving unsecured operating credits and are amortized using the straight-line method over the period of the corresponding contract. Deferred charges also include

Notes to the Consolidated Financial Statements For the fiscal years ended April 27, 2014 and April 28, 2013 (in millions of US dollars, except share and stock option data)
Annual Report © 2014 Alimentation Couche-Tard Inc. Page 56 of 81
expenses incurred in connection with the analysis and signing of operating leases which are deferred and amortized on a straight-line basis over the lease term.
Leases
Determining whether an arrangement contains a lease
At inception of an arrangement, the Corporation analyzes whether an arrangement is or contains a lease by assessing if:
fulfilment of the arrangement is dependent on the use of a specified asset or assets; and the arrangement conveys a right to use the asset or assets.
The Corporation has assessed that some arrangements with franchisees contain embedded lease agreements and accordingly, accounts for a portion of those agreements as lease agreement.
The Corporation distinguishes between lease contracts and capacity contracts. Lease contracts provide the right to use a specific asset for a period of time. Capacity contracts confer the right to and the obligation to pay for availability of certain capacity volumes related primarily to transportation. Such capacity contracts that do not involve specified single assets or that do not involve substantially all the capacity of an undivided interest in a specific asset are not considered to qualify as leases for accounting purposes. Capacity payments are recognized in the consolidated statements of earnings in Operating, selling, administrative and general expenses.
Lease arrangements in which the Corporation is a lessee
The Corporation accounts for finance leases in instances where it has acquired substantially all the benefits and risks incidental to ownership of the leased property. In some cases, the characterisation of a lease transaction is not always evident, and management uses judgment in determining whether the lease is a finance lease arrangement that transfers substantially all the risks and benefits incidental to ownership to the Corporation. Judgement is required on various aspects that include, but are not limited to, the fair value of the leased asset, the economic life of the leased asset, whether or not to include renewal options in the lease term and determining an appropriate discount rate to calculate the present value of the minimum lease payments. The Corporation’s activities involve a considerable number of lease agreements, most of which are determined to be operational in nature. The cost of assets under finance leases represents the present value of minimum lease payments or the fair value of the leased property, whichever is lower, and is amortized on a straight-line basis over the term of the lease or useful life of the asset, whichever is shorter. Assets under finance leases are presented under Property and equipment in the consolidated balance sheets.
Leases that do not transfer substantially all the benefits and risks incidental to ownership of the property are accounted for as operating leases. When a lease contains a predetermined fixed escalation of the minimum rent, the Corporation recognizes the related rent expense on a straight-line basis over the term of the lease and, consequently, records the difference between the recognized rental expense and the amounts payable under the lease as deferred rent expense.
The Corporation also receives tenant allowances, which are amortized on a straight-line basis over the term of the lease or useful life of the asset, whichever is shorter.
Gains and losses resulting from sale and leaseback transactions are recorded in the consolidated statements of earnings at the transaction date except if:
the sale price is below fair value and the loss is compensated for by future lease payments below market price, in which case it shall be deferred and amortized in proportion to the lease payments over the period during which the asset is expected to be used; or
the sale price is above fair value, in which case the excess shall be deferred and amortized over the period during which the asset is expected to be used.
Lease arrangements in which the Corporation is a lessor
Leases in which the Corporation transfers substantially all the risks and rewards of ownership of an asset to a third party are classified as finance leases. The Corporation recognizes assets held under a finance lease in the consolidated balance sheets and presents them as accounts receivable. Lease payments received under finance leases are apportioned between financial revenues and reduction of the receivable.
Leases that do not transfer substantially all the benefits and risks incidental to ownership of the property to a third party are accounted for as operating leases. When a lease contains a predetermined fixed escalation of the minimum rent, the Corporation recognizes the related rent revenue on a straight-line basis over the term of the lease and, consequently, records the difference between the recognized rental revenue and the amounts receivable under the lease as deferred rent revenue.
Financing costs
Financing costs related to term loans and debt securities are included in the initial carrying amount of the corresponding debt and are amortized using the effective interest rate method that is based on the estimated cash flow over the expected life of the liability. Financing costs related to revolving loans are included in other assets and are amortized using the straight-line method over the expected life of the underlying agreement.

Notes to the Consolidated Financial Statements For the fiscal years ended April 27, 2014 and April 28, 2013 (in millions of US dollars, except share and stock option data)
Annual Report © 2014 Alimentation Couche-Tard Inc. Page 57 of 81
Stock-based compensation and other stock-based payments
Stock-based compensation costs are measured at the grant date of the award based on the fair value method for all transactions entered into starting in fiscal year 2003.
The fair value of stock options is recognized over the vesting period of each respective vesting portion as compensation expense with a corresponding increase in contributed surplus. When stock options are exercised, the corresponding contributed surplus is transferred to capital stock.
The Phantom Stock Units (“PSU”) compensation cost and the related liability are recorded on a straight-line basis over the corresponding vesting period based on the fair market value of Class B shares and the best estimate of the number of PSUs that will ultimately be paid. The recorded liability is adjusted periodically to reflect any variation in the fair market value of the Class B shares and revisions to the estimated number of PSUs that will ultimately be paid.
Employee future benefits
The Corporation accrues its obligations under employee pension plans and the related costs, net of plan assets. The Corporation has adopted the following accounting policies with respect to the defined benefit plans:
The accrued benefit obligations and the cost of pension benefits earned by active employees are actuarially determined using the projected unit credit method pro-rated on service and pension expense is recorded in earnings as the services are rendered by active employees. The calculations reflect management’s best estimate of salary escalation and retirement ages of employees;
Plan assets are valued at fair value;
Actuarial gains and losses arise from increases or decreases in the present value of the defined benefit obligation because of changes in actuarial assumptions and experience adjustments. Actuarial gains and losses are recognized immediately in Other comprehensive income with no impact on net earnings;
Past service costs are recorded to earnings at the earlier of the following dates: o When the plan amendment or curtailment occurs; o When the Corporation recognizes related restructuring costs or termination benefits;
Net interest on the defined benefit liability (asset) represents the net defined benefit liability (asset), multiplied by the discount rate and is recorded in financial expenses.
The pension cost recorded in net earnings for the defined contribution plans is equivalent to the contribution which the Corporation is required to pay in exchange for services provided by the employees.
The present value of pension obligations depends on a number of factors that are determined on an actuarial basis using a number of assumptions. Any changes in these assumptions will impact the carrying amount of pension obligations. The Corporation determines the appropriate discount rate at the end of each fiscal year. This is the rate that should be used to determine the present value of estimated future cash outflows expected to be required to settle the pension obligations. In determining the appropriate discount rate, the Corporation considers the interest rates of high-quality corporate bonds that are denominated in the currency in which the benefits will be paid and that have terms to maturity approximating the terms of the related pension obligation.
Provisions
Provisions are recognized when the Corporation has a present obligation (legal or constructive) as a result of a past event, it is probable that the Corporation will be required to settle the obligation and a reliable estimate of the amount of the obligation can be made. The amount recognized as a provision is the best estimate of the consideration required to settle the present obligation at the balance sheet date, taking into account the risks and uncertainties surrounding the obligation. Where a provision is measured using the cash flows estimated to settle the present obligation, its carrying amount is the present value of those cash flows.
The present value of provisions depends on a number of factors that are assessed on a regular basis using a number of assumptions, including the discount rate, the expected cash flow to settle the obligation and the number of years until the realization of the provision. Any changes in these assumptions or in governmental regulations will impact the carrying amount of provisions. Where the actual cash flows are different from the amounts that were initially recorded, such differences will impact earnings in the period in which the payment is made. Historically, the Corporation has not experienced significant differences in its estimates compared with actual results.
Environmental costs
The Corporation provides for estimated future site remediation costs to meet government standards for known site contaminations when such costs can be reasonably estimated. Estimates of the anticipated future costs for remediation activities at such sites are based on the Corporation’s prior experience with remediation sites and consideration of other factors such as the condition of the site contamination, location of sites and experience with contractors that perform the environmental assessments and remediation work. In order to determine the initial recorded liability, the present value of estimated future cash flows was calculated using a pre-tax rate that reflects current market assessments of the time value of money and the risks specific to the liability.
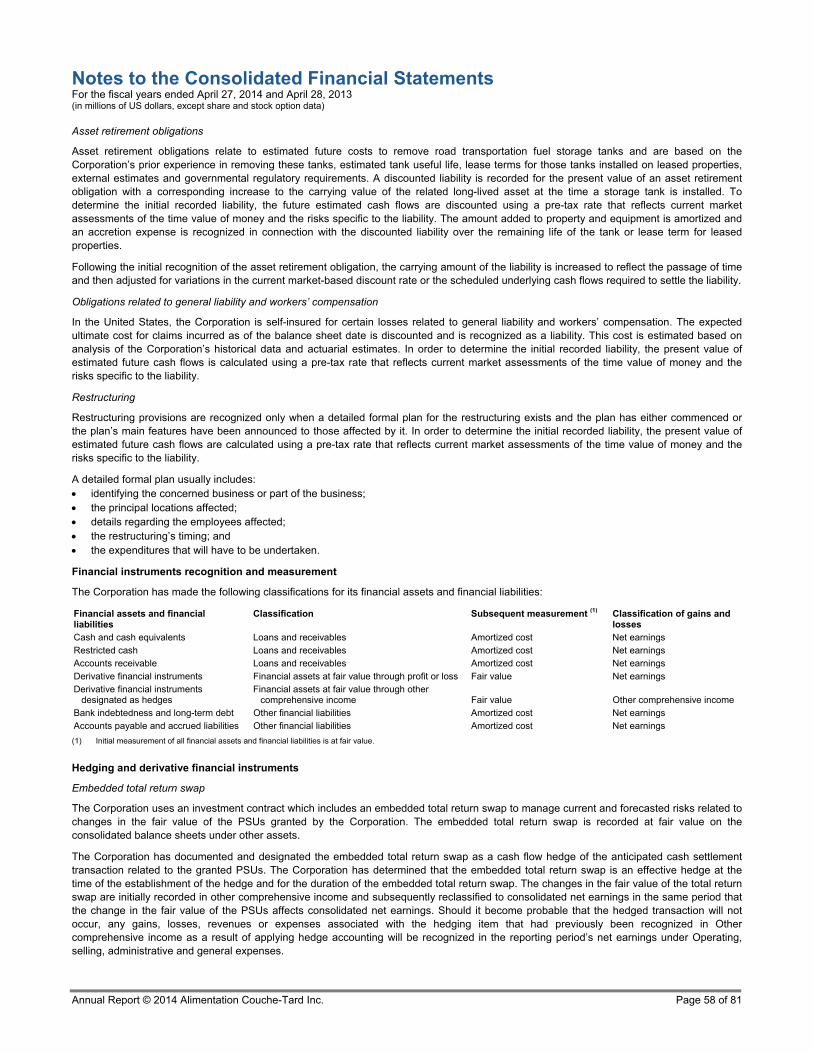
Notes to the Consolidated Financial Statements For the fiscal years ended April 27, 2014 and April 28, 2013 (in millions of US dollars, except share and stock option data)
Annual Report © 2014 Alimentation Couche-Tard Inc. Page 58 of 81
Asset retirement obligations
Asset retirement obligations relate to estimated future costs to remove road transportation fuel storage tanks and are based on the Corporation’s prior experience in removing these tanks, estimated tank useful life, lease terms for those tanks installed on leased properties, external estimates and governmental regulatory requirements. A discounted liability is recorded for the present value of an asset retirement obligation with a corresponding increase to the carrying value of the related long-lived asset at the time a storage tank is installed. To determine the initial recorded liability, the future estimated cash flows are discounted using a pre-tax rate that reflects current market assessments of the time value of money and the risks specific to the liability. The amount added to property and equipment is amortized and an accretion expense is recognized in connection with the discounted liability over the remaining life of the tank or lease term for leased properties.
Following the initial recognition of the asset retirement obligation, the carrying amount of the liability is increased to reflect the passage of time and then adjusted for variations in the current market-based discount rate or the scheduled underlying cash flows required to settle the liability.
Obligations related to general liability and workers’ compensation
In the United States, the Corporation is self-insured for certain losses related to general liability and workers’ compensation. The expected ultimate cost for claims incurred as of the balance sheet date is discounted and is recognized as a liability. This cost is estimated based on analysis of the Corporation’s historical data and actuarial estimates. In order to determine the initial recorded liability, the present value of estimated future cash flows is calculated using a pre-tax rate that reflects current market assessments of the time value of money and the risks specific to the liability.
Restructuring
Restructuring provisions are recognized only when a detailed formal plan for the restructuring exists and the plan has either commenced or the plan’s main features have been announced to those affected by it. In order to determine the initial recorded liability, the present value of estimated future cash flows are calculated using a pre-tax rate that reflects current market assessments of the time value of money and the risks specific to the liability.
A detailed formal plan usually includes: identifying the concerned business or part of the business; the principal locations affected; details regarding the employees affected; the restructuring’s timing; and the expenditures that will have to be undertaken.
Financial instruments recognition and measurement
The Corporation has made the following classifications for its financial assets and financial liabilities:
Financial assets and financial liabilities
Classification Subsequent measurement (1) Classification of gains and losses
Cash and cash equivalents Loans and receivables Amortized cost Net earnings Restricted cash Loans and receivables Amortized cost Net earnings Accounts receivable Loans and receivables Amortized cost Net earnings Derivative financial instruments Financial assets at fair value through profit or loss Fair value Net earnings Derivative financial instruments
designated as hedges Financial assets at fair value through other
comprehensive income Fair value Other comprehensive income Bank indebtedness and long-term debt Other financial liabilities Amortized cost Net earnings Accounts payable and accrued liabilities Other financial liabilities Amortized cost Net earnings
(1) Initial measurement of all financial assets and financial liabilities is at fair value.
Hedging and derivative financial instruments
Embedded total return swap
The Corporation uses an investment contract which includes an embedded total return swap to manage current and forecasted risks related to changes in the fair value of the PSUs granted by the Corporation. The embedded total return swap is recorded at fair value on the consolidated balance sheets under other assets.
The Corporation has documented and designated the embedded total return swap as a cash flow hedge of the anticipated cash settlement transaction related to the granted PSUs. The Corporation has determined that the embedded total return swap is an effective hedge at the time of the establishment of the hedge and for the duration of the embedded total return swap. The changes in the fair value of the total return swap are initially recorded in other comprehensive income and subsequently reclassified to consolidated net earnings in the same period that the change in the fair value of the PSUs affects consolidated net earnings. Should it become probable that the hedged transaction will not occur, any gains, losses, revenues or expenses associated with the hedging item that had previously been recognized in Other comprehensive income as a result of applying hedge accounting will be recognized in the reporting period’s net earnings under Operating, selling, administrative and general expenses.

Notes to the Consolidated Financial Statements For the fiscal years ended April 27, 2014 and April 28, 2013 (in millions of US dollars, except share and stock option data)
Annual Report © 2014 Alimentation Couche-Tard Inc. Page 59 of 81
Hedge of the Corporation’s net investment in its US operations
Until November 1, 2012, the Corporation had designated its entire US dollar denominated long-term debt as a foreign exchange hedge of its net investment in its US operations. Accordingly, the portion of the gains or losses arising from the translation of the US dollar denominated debt that was determined to be an effective hedge was recognized in Other comprehensive income, counterbalancing gains and losses arising from translation of the Corporation’s net investment in its US operations. Since November 1, 2012, the Corporation no longer designates its US dollar denominated long-term debt as a foreign exchange hedge of its net investment in its US operations. Accordingly, the gains or losses arising from the translation of the US dollar denominated debt are now recorded in the consolidated statements of earnings under Financial expenses.
As of November 1, 2012, the Corporation has documented and designated its cross-currency interest rate swap agreements (Note 20) as a foreign exchange hedge of its net investment in its US operations. The Corporation has determined that the cross-currency interest rate swap is an effective hedge at the time of the establishment of the hedge and for the duration of the cross-currency interest rate swap. The gains or losses arising from the fair value variation of the cross-currency interest rate swaps are recognized in Other comprehensive income along with the difference between interests received and interests paid. Should a portion of the hedging relationship become ineffective, the ineffective portion would be recorded in the consolidated statements of earnings under financial expenses.
Foreign exchange forward contracts
The Corporation, from time to time, uses foreign exchange forward contracts (“forwards”) to manage the currency fluctuation risk associated with forecasted cash disbursements denominated in foreign currencies. The Corporation is exposed to foreign currency risk with respect to a portion of its aviation fuel operations for which purchases and sales are denominated in different currencies. Forwards are recorded at fair value on the consolidated balance sheets. Changes in the fair value of forwards are recorded in financial expenses.
Cross currency swaps
The Corporation, from time to time, uses cross currency swaps to manage the currency fluctuation risk associated with forecasted cash disbursements in foreign currency. Cross currency swaps are recorded at fair value on the consolidated balance sheets. Changes in their fair value are recorded in financial expenses.
Commodity futures
The Corporation, from time to time, uses commodity futures to manage the price fluctuation risk associated with forecasted purchases of aviation fuel. Commodity futures are recorded at fair value on the consolidated balance sheets. Changes in their fair value are recorded in cost of sales.
Guarantees
A guarantee is defined as a contract or an indemnification agreement contingently requiring a Corporation to make payments to a third party based on future events. These payments are contingent on either changes in an underlying or other variables that are related to an asset, liability, or an equity security of the indemnified party or the failure of another entity to perform under an obligating agreement. It could also be an indirect guarantee of the indebtedness of another party. Guarantees are initially recognized at fair value and subsequently revaluated when the loss becomes probable.
Business combinations
Business combinations are accounted for using the purchase method. The cost of a business combination is measured as the aggregate of the fair values (at the date of acquisition) of assets given, liabilities incurred or assumed, and equity instruments issued by the Corporation in exchange for control of the acquiree. The acquiree’s identifiable assets, liabilities and contingent liabilities that meet the conditions for recognition under IFRS 3, “Business Combinations”, are recognized at their fair values at the acquisition date. Direct acquisition costs are recorded to earnings when incurred.
Goodwill arising from business combinations is recognized as an asset and initially measured at cost, being the excess of the cost of the business combination over the net fair value of the identifiable assets, liabilities and contingent liabilities recognized. If, after reassessment, the net fair value of the acquiree’s identifiable assets, liabilities and contingent liabilities exceeds the cost of the business combination, the excess (“Negative goodwill”) is recognized immediately to earnings.
Determination of the fair value of the acquired assets and liabilities requires judgement and the use of assumptions that, if changed, may affect the consolidated statements of earnings and consolidated balance sheets.
For purchase price allocation and impairment testing purposes, goodwill and other intangible assets with indefinite useful lives are allocated to CGUs based on the lowest level at which management reviews the results which is not higher than the operating segment. The allocation is made to those CGUs which are expected to benefit from the business combination and in which the goodwill and trademarks arose.
Earnings from the businesses acquired are included in the consolidated statements of earnings from their respective dates of acquisition.
Recently issued accounting standards not yet implemented
Classification and measurement of financial assets and financial liabilities
In November 2009, the IASB issued IFRS 9, “Financial Instruments”, which will replace the various rules of IAS 39, “Financial Instruments: Recognition and Measurement” with a single approach to determine whether a financial asset is measured at amortized cost or fair value. In

Notes to the Consolidated Financial Statements For the fiscal years ended April 27, 2014 and April 28, 2013 (in millions of US dollars, except share and stock option data)
Annual Report © 2014 Alimentation Couche-Tard Inc. Page 60 of 81
October 2010, the IASB revised IFRS 9, adding requirements for classification and measurement of financial liabilities. In November 2013, the IASB incorporated a new hedge accounting model into IFRS 9 to enable financial statement users to better understand an entity’s risk exposure and its risk management activities. Also, the IASB deferred mandatory application of IFRS 9 to an unspecified date with early adoption permitted. The Corporation will assess, in due course, the impact of IFRS 9 on its consolidated financial statements.
4. BUSINESS ACQUISITIONS
The Corporation has made the following business acquisitions:
2014
On December 13, 2013, the Corporation acquired 23 company-operated stores operating in New Mexico, United States from Albuquerque Convenience and Retail LLC. The Corporation owns the land and buildings for all sites.
On December 10, 2013, the Corporation acquired, from Publix Super Markets Inc., 11 company-operated stores, nine of which are located in Florida and the other two in Georgia, United States. The Corporation owns the land and buildings for eight sites and leases the land and owns the building for the other three sites.
On September 24, 2013, the Corporation acquired nine stores located in Illinois, United States from Baron-Huot Oil Company. Eight of these stores are company-operated and one is operated by an independent operator. The Corporation owns the real estate for eight sites and leases the land and building for one site.
During fiscal year 2014, under the June 2011 agreement with ExxonMobil, the Corporation acquired 60 stores operated by independent operators along with the related road transportation fuel supply agreements. The Corporation owns the real estate for all sites. Also, an additional 53 road transportation fuel supply agreements were acquired by the Corporation during this period.
During fiscal year 2014, the Corporation also acquired ten other stores through distinct transactions. The Corporation leases the land and buildings for five sites, leases the land and owns the building for one site and owns these same assets for the other sites.
Acquisition costs of $1.3 in connection with these acquisitions and other unrealized acquisitions are included in Operating, selling, administrative and general expenses. These acquisitions were settled for a total cash consideration of $159.6. Since the Corporation has not completed its fair value assessment of the assets acquired, the liabilities assumed and goodwill for all transactions, the preliminary allocations of certain acquisitions are subject to adjustments to the fair value of the assets, liabilities and goodwill until the process is completed. Purchase price allocations based on the estimated fair value on the date of acquisition and available information as at the date of publication of these consolidated financial statements is as follows:
$ Tangible assets acquired
Inventories 4.6 Property and equipment 162.3 Other assets 14.3
Total tangible assets 181.2 Liabilities assumed
Accounts payable and accrued liabilities 0.4 Provisions 19.6
Total liabilities 20.0 Net tangible assets acquired 161.2 Intangible assets 30.8 Goodwill 16.0 Negative goodwill recorded to earnings (48.4 ) Total cash consideration paid 159.6
The Corporation expects that $3.0 of the goodwill related to these transactions will be deductible for tax purposes. These acquisitions were concluded in order to expand the Corporation’s market share, to penetrate new markets and to increase its economies of scale. These acquisitions generated goodwill mainly due to the strategic location of stores acquired and negative goodwill due to the difference between the acquisition price and the fair value of net assets acquired. Since the date of acquisition, revenues and net earnings from these stores amounted to $504.0 and $4.2, respectively. Considering the nature of these acquisitions, the available financial information does not allow for the accurate disclosure of pro-forma revenues and net earnings had the Corporation concluded these acquisitions at the beginning of its fiscal year.
2013
Acquisition of Statoil Fuel & Retail ASA (“Statoil Fuel & Retail”)
On June 19, 2012, the Corporation acquired 81.2% of the 300,000,000 issued and outstanding shares of Statoil Fuel & Retail for a cash consideration of 51.20 Norwegian Kroners (“NOK”) per share for a total amount of NOK 12.47 billion or approximately $2.10 billion through a voluntary public offer (the “offer”). From June 22, 2012 to June 29, 2012, the Corporation acquired 53,238,857 additional shares of Statoil Fuel & Retail for a cash consideration of NOK 51.20 per share, totalling NOK 2.73 billion or approximately $0.45 billion, increasing the Corporation’s participation to 98.9%. Having reached a shareholding of more than 90%, on June 29, 2012, in accordance with Norwegian laws, the Corporation initiated the compulsory acquisition of all of the remaining Statoil Fuel & Retail shares not deposited under the offer from the holders thereof and, as a result, since such date, the Corporation owns 100% of the issued and outstanding shares of Statoil Fuel & Retail. The NOK 51.20 per share cash consideration for the compulsory acquisition of all of the remaining shares of Statoil Fuel & Retail not
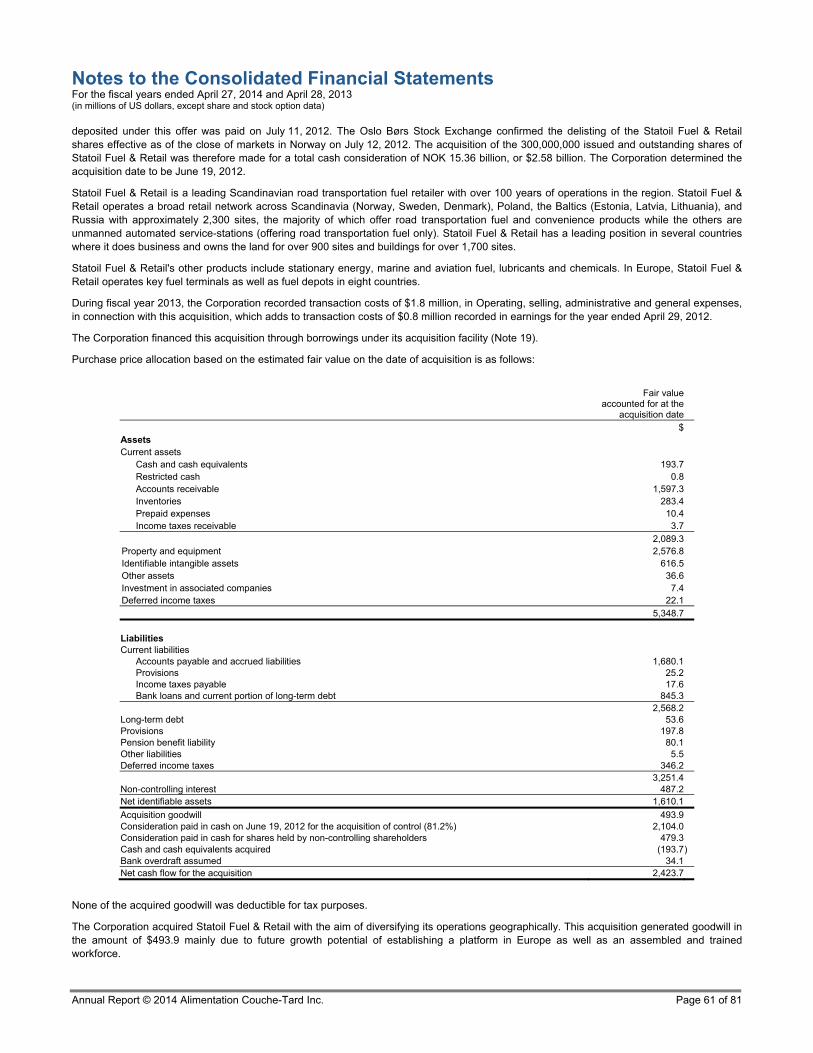
Notes to the Consolidated Financial Statements For the fiscal years ended April 27, 2014 and April 28, 2013 (in millions of US dollars, except share and stock option data)
Annual Report © 2014 Alimentation Couche-Tard Inc. Page 61 of 81
deposited under this offer was paid on July 11, 2012. The Oslo Børs Stock Exchange confirmed the delisting of the Statoil Fuel & Retail shares effective as of the close of markets in Norway on July 12, 2012. The acquisition of the 300,000,000 issued and outstanding shares of Statoil Fuel & Retail was therefore made for a total cash consideration of NOK 15.36 billion, or $2.58 billion. The Corporation determined the acquisition date to be June 19, 2012.
Statoil Fuel & Retail is a leading Scandinavian road transportation fuel retailer with over 100 years of operations in the region. Statoil Fuel & Retail operates a broad retail network across Scandinavia (Norway, Sweden, Denmark), Poland, the Baltics (Estonia, Latvia, Lithuania), and Russia with approximately 2,300 sites, the majority of which offer road transportation fuel and convenience products while the others are unmanned automated service-stations (offering road transportation fuel only). Statoil Fuel & Retail has a leading position in several countries where it does business and owns the land for over 900 sites and buildings for over 1,700 sites.
Statoil Fuel & Retail's other products include stationary energy, marine and aviation fuel, lubricants and chemicals. In Europe, Statoil Fuel & Retail operates key fuel terminals as well as fuel depots in eight countries.
During fiscal year 2013, the Corporation recorded transaction costs of $1.8 million, in Operating, selling, administrative and general expenses, in connection with this acquisition, which adds to transaction costs of $0.8 million recorded in earnings for the year ended April 29, 2012.
The Corporation financed this acquisition through borrowings under its acquisition facility (Note 19).
Purchase price allocation based on the estimated fair value on the date of acquisition is as follows:
Fair value accounted for at the
acquisition date $Assets Current assets
Cash and cash equivalents 193.7Restricted cash 0.8Accounts receivable 1,597.3Inventories 283.4Prepaid expenses 10.4Income taxes receivable 3.7
2,089.3Property and equipment 2,576.8Identifiable intangible assets 616.5Other assets 36.6Investment in associated companies 7.4Deferred income taxes 22.1 5,348.7
Liabilities Current liabilities
Accounts payable and accrued liabilities 1,680.1Provisions 25.2Income taxes payable 17.6Bank loans and current portion of long-term debt 845.3
2,568.2Long-term debt 53.6Provisions 197.8Pension benefit liability 80.1Other liabilities 5.5Deferred income taxes 346.2 3,251.4Non-controlling interest 487.2Net identifiable assets 1,610.1
Acquisition goodwill 493.9Consideration paid in cash on June 19, 2012 for the acquisition of control (81.2%) 2,104.0Consideration paid in cash for shares held by non-controlling shareholders 479.3Cash and cash equivalents acquired (193.7) Bank overdraft assumed 34.1Net cash flow for the acquisition 2,423.7
None of the acquired goodwill was deductible for tax purposes.
The Corporation acquired Statoil Fuel & Retail with the aim of diversifying its operations geographically. This acquisition generated goodwill in the amount of $493.9 mainly due to future growth potential of establishing a platform in Europe as well as an assembled and trained workforce.

Notes to the Consolidated Financial Statements For the fiscal years ended April 27, 2014 and April 28, 2013 (in millions of US dollars, except share and stock option data)
Annual Report © 2014 Alimentation Couche-Tard Inc. Page 62 of 81
Statoil Fuel & Retail’s fiscal year does not coincide with the Corporation’s fiscal year. The Corporation’s consolidated statements of earnings, comprehensive income, changes in equity and cash flows include those of Statoil Fuel & Retail for the period beginning May 1, 2013 and ending April 30, 2014 for fiscal year 2014 and the period beginning June 20, 2012 and ending April 30, 2013 for fiscal year 2013. The Corporation’s consolidated balance sheets as at April 27, 2014 and April 28, 2013 include the balance sheets of Statoil Fuel & Retail as at April 30, 2014 and April 30, 2013, respectively.
The Corporation expects that the work toward the alignment of Statoil Fuel & Retail’s accounting periods with those of Couche-Tard should start once replacing Statoil Fuel & Retail financial systems is finalized, which is now scheduled to be completed at the beginning of fiscal 2015.
Other acquisitions
On May 8, 2012, the Corporation purchased 20 company-operated stores located in Texas, United States from Signature Austin Stores. The Corporation leases the land and buildings for all sites.
On August 27, 2012, the Corporation purchased 29 company-operated stores located in Florida, United States from Florida Oil Holdings, LLC. The Corporation owns the land and buildings for 24 sites while it leases the land and owns the buildings for the other sites. The Corporation was also transferred a road transportation fuel supply agreement for one store owned and operated by an independent operator.
On November 2, 2012, the Corporation acquired, from Sun Pacific Energy, 27 company-operated stores operating in Washington State, United States. The Corporation owns the land and buildings for 26 sites while it leases these assets for the other site.
On November 28, 2012, the Corporation acquired, from Davis Oil Company, seven company-operated stores operating in Georgia, United States. The Corporation owns the land and buildings for all sites.
On December 31, 2012, the Corporation acquired, from Kum & Go, L.C., seven company-operated stores operating in Oklahoma, United States. The Corporation leases the land and buildings for all sites.
On February 11, 2013, the Corporation acquired 29 company-operated stores located in the states of Illinois, Missouri and Oklahoma in the United States from Dickerson Petroleum Inc. The Corporation owns the land and building for 25 sites while it leases the land and owns the buildings for the other sites. In addition, 21 road transportation fuel supply agreements were acquired by the Corporation, 20 of which are for sites owned and operated by independent operators while one site is leased by the Corporation.
During fiscal year 2013, under the June 2011 agreement with ExxonMobil, the Corporation acquired four stores operated by independent operators for which the real estate is owned by the Corporation along with the related road transportation fuel supply agreements. Additionally, 23 road transportation fuel supply agreements were transferred to the Corporation during this period.
During fiscal year 2013, the Corporation also acquired 32 other stores through distinct transactions. The Corporation leases the land and owns the building for one site, leases the land and buildings for ten sites and owns these same assets for the other sites.
Acquisition costs in connection with these acquisitions and other unrealized acquisitions of $2.3 are included in Operating, selling, administrative and general expenses.
These acquisitions were settled for a total cash consideration of $220.9. Purchase price allocations based on the estimated fair value on the date of acquisition and available information as at the date of publication of these consolidated financial statements is as follows:
$Tangible assets acquired
Inventories 14.2Property and equipment 159.0Other assets 0.4
Total tangible assets 173.6Liabilities assumed
Accounts payable and accrued liabilities 2.1Provisions 7.6Deferred credit and other liabilities 3.8
Total liabilities 13.5Net tangible assets acquired 160.1Intangible assets 3.0Goodwill 62.2Negative goodwill recorded to earnings (4.4) Total cash consideration paid 220.9
Approximately $44.5 of the goodwill related to these transactions was deductible for tax purposes.
These acquisitions were concluded in order to expand the Corporation’s market share, to penetrate new markets and to increase its economies of scale. These acquisitions generated goodwill in the amount of $62.2 mainly due to the strategic location of stores acquired.
Disposal of the liquefied petroleum gas sales (“LPG”) operations
On December 7, 2012, the Corporation sold Statoil Fuel & Retail’s LPG operations for NOK 130.0 (approximately $23.0). No gain or loss was generated from this disposal.
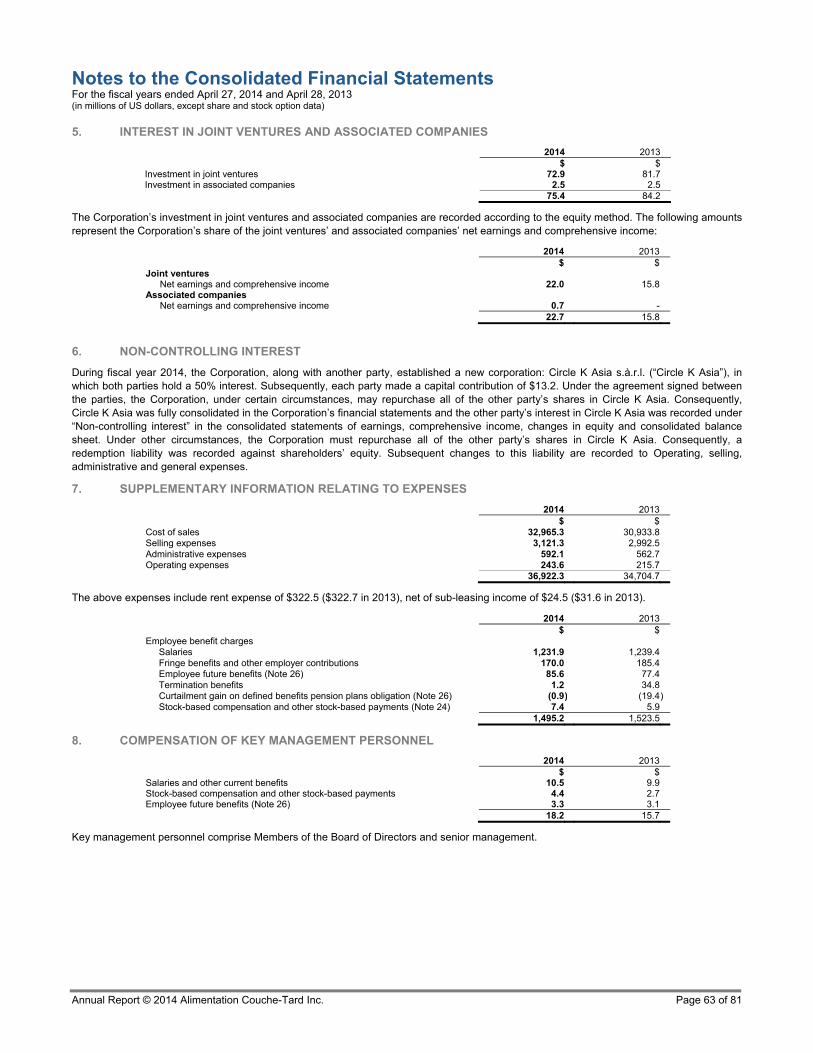
Notes to the Consolidated Financial Statements For the fiscal years ended April 27, 2014 and April 28, 2013 (in millions of US dollars, except share and stock option data)
Annual Report © 2014 Alimentation Couche-Tard Inc. Page 63 of 81
5. INTEREST IN JOINT VENTURES AND ASSOCIATED COMPANIES
2014 2013 $ $ Investment in joint ventures 72.9 81.7 Investment in associated companies 2.5 2.5 75.4 84.2
The Corporation’s investment in joint ventures and associated companies are recorded according to the equity method. The following amounts represent the Corporation’s share of the joint ventures’ and associated companies’ net earnings and comprehensive income:
2014 2013 $ $Joint ventures
Net earnings and comprehensive income 22.0 15.8Associated companies
Net earnings and comprehensive income 0.7 - 22.7 15.8
6. NON-CONTROLLING INTEREST
During fiscal year 2014, the Corporation, along with another party, established a new corporation: Circle K Asia s.à.r.l. (“Circle K Asia”), in which both parties hold a 50% interest. Subsequently, each party made a capital contribution of $13.2. Under the agreement signed between the parties, the Corporation, under certain circumstances, may repurchase all of the other party’s shares in Circle K Asia. Consequently, Circle K Asia was fully consolidated in the Corporation’s financial statements and the other party’s interest in Circle K Asia was recorded under “Non-controlling interest” in the consolidated statements of earnings, comprehensive income, changes in equity and consolidated balance sheet. Under other circumstances, the Corporation must repurchase all of the other party’s shares in Circle K Asia. Consequently, a redemption liability was recorded against shareholders’ equity. Subsequent changes to this liability are recorded to Operating, selling, administrative and general expenses.
7. SUPPLEMENTARY INFORMATION RELATING TO EXPENSES
2014 2013 $ $Cost of sales 32,965.3 30,933.8Selling expenses 3,121.3 2,992.5Administrative expenses 592.1 562.7Operating expenses 243.6 215.7 36,922.3 34,704.7
The above expenses include rent expense of $322.5 ($322.7 in 2013), net of sub-leasing income of $24.5 ($31.6 in 2013).
2014 2013 $ $
Employee benefit charges Salaries 1,231.9 1,239.4Fringe benefits and other employer contributions 170.0 185.4Employee future benefits (Note 26) 85.6 77.4Termination benefits 1.2 34.8Curtailment gain on defined benefits pension plans obligation (Note 26) (0.9) (19.4) Stock-based compensation and other stock-based payments (Note 24) 7.4 5.9 1,495.2 1,523.5
8. COMPENSATION OF KEY MANAGEMENT PERSONNEL
2014 2013 $ $Salaries and other current benefits 10.5 9.9Stock-based compensation and other stock-based payments 4.4 2.7Employee future benefits (Note 26) 3.3 3.1 18.2 15.7
Key management personnel comprise Members of the Board of Directors and senior management.
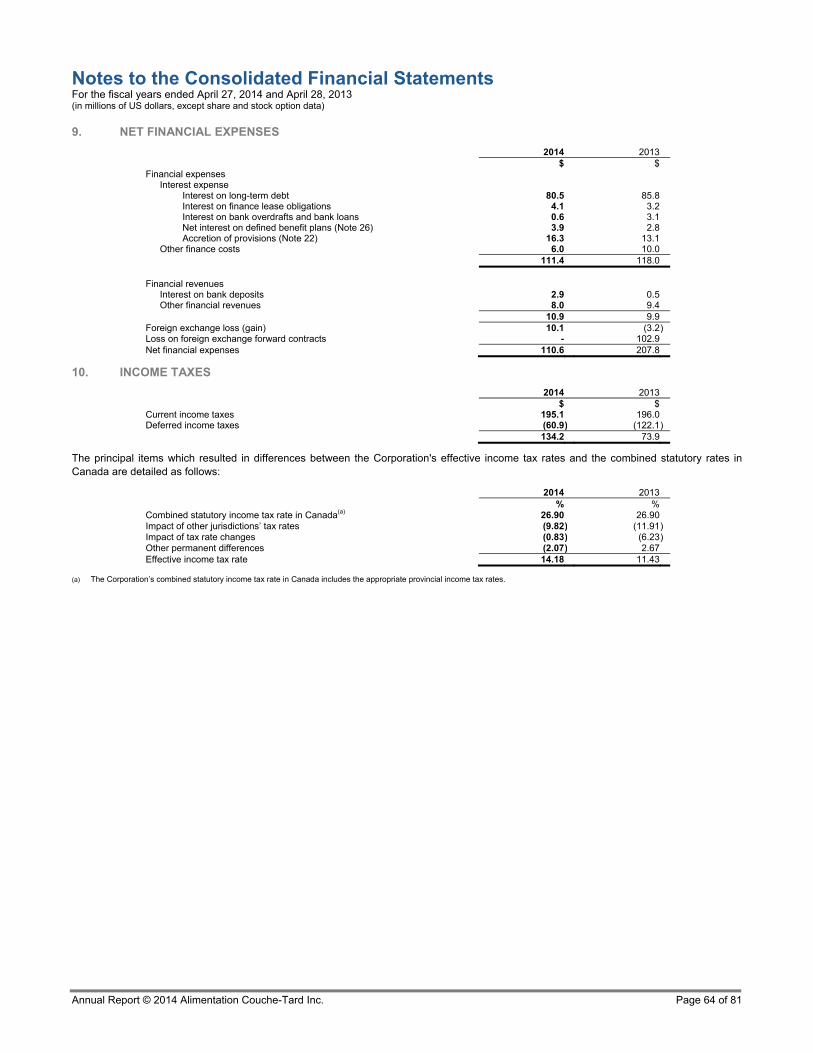
Notes to the Consolidated Financial Statements For the fiscal years ended April 27, 2014 and April 28, 2013 (in millions of US dollars, except share and stock option data)
Annual Report © 2014 Alimentation Couche-Tard Inc. Page 64 of 81
9. NET FINANCIAL EXPENSES
2014 2013 $ $Financial expenses
Interest expense Interest on long-term debt 80.5 85.8Interest on finance lease obligations 4.1 3.2Interest on bank overdrafts and bank loans 0.6 3.1Net interest on defined benefit plans (Note 26) 3.9 2.8Accretion of provisions (Note 22) 16.3 13.1
Other finance costs 6.0 10.0 111.4 118.0 Financial revenues
Interest on bank deposits 2.9 0.5Other financial revenues 8.0 9.4
10.9 9.9Foreign exchange loss (gain) 10.1 (3.2) Loss on foreign exchange forward contracts - 102.9Net financial expenses 110.6 207.8
10. INCOME TAXES
2014 2013 $ $Current income taxes 195.1 196.0Deferred income taxes (60.9) (122.1) 134.2 73.9
The principal items which resulted in differences between the Corporation's effective income tax rates and the combined statutory rates in Canada are detailed as follows:
2014 2013 % %Combined statutory income tax rate in Canada(a) 26.90 26.90Impact of other jurisdictions’ tax rates (9.82) (11.91) Impact of tax rate changes (0.83) (6.23) Other permanent differences (2.07) 2.67Effective income tax rate 14.18 11.43
(a) The Corporation’s combined statutory income tax rate in Canada includes the appropriate provincial income tax rates.

Notes to the Consolidated Financial Statements For the fiscal years ended April 27, 2014 and April 28, 2013 (in millions of US dollars, except share and stock option data)
Annual Report © 2014 Alimentation Couche-Tard Inc. Page 65 of 81
The components of deferred income tax assets and liabilities are as follows:
2014
Balance as at April 28, 2013
Recognized to earnings
Recognized directly to other comprehensive
income or equity
Transfer from income taxes
payable
Recognized through
business acquisitions
Balance as at April 27, 2014
$ $ $ $ $ $Deferred income tax assets
Property and equipment 28.2 1.7 - - - 29.9Expenses deductible during the
following years 17.1 2.8 (0.6) - - 19.3Goodwill (9.6 ) 0.3 - - - (9.3) Deferred charges 6.6 (4.0) - - - 2.6Tax attributes 4.1 (2.7) (0.2) - - 1.2Asset retirement obligations 3.7 - - - - 3.7Deferred credits (2.1 ) 0.1 (0.6) - - (2.6) Unrealized exchange (gain) loss (0.8 ) 12.7 (3.4) - - 8.5Other 1.6 (3.1) (0.1) - - (1.6)
48.8 7.8 (4.9) - - 51.7 Deferred income tax liabilities
Property and equipment 524.7 21.4 (0.7) - - 545.4Goodwill 145.7 (39.8) 12.0 - - 117.9Expenses deductible during the
following years (87.9 ) (10.1) 0.2 - - (97.8) Intangible assets 64.6 (3.7) - - - 60,9Asset retirement obligations (64.6 ) (0.4) 0.2 - - (64.8) Tax attributes (46.7 ) (31.3) 0.2 50.6 - (27.2) Deferred charges 28.9 (38.0) - - - (9.1) Deferred credits (12.2 ) 2.2 - - - (10.0) Revenues taxable during the following
years 3.6 50.3 - - - 53.9Unrealized exchange gain 1.0 15.5 (4.6) - - 11.9Other 4.1 (19.1) (0.3) - - (15.3) 561.2 (53.0) 7.0 50.6 - 565.8
2013
Balance as at April 29, 2012
Recognized to earnings
Recognized directly to other comprehensive
income or equity
Transfer from income taxes
payable
Recognized through business
acquisitions Balance as at April 28, 2013
$ $ $ $ $ $Deferred income tax assets
Property and equipment (1.8 ) 4.3 0.7 - 25.0 28.2Expenses deductible during the
following years 11.5 (2.4) 3.4 - 4.6 17.1Goodwill (0.6 ) (0.6) (0.2) - (8.2 ) (9.6) Deferred charges 3.3 3.3 - - - 6.6Tax attributes 2.3 1.2 - - 0.6 4.1Asset retirement obligations 1.5 2.2 - - - 3.7Deferred credits (1.6 ) (0.4) (0.1) - - (2.1) Unrealized exchange gain (2.3 ) 3.7 (2.2) - - (0.8) Other 2.1 (2.3) 1.7 - 0.1 1.6
14.4 9.0 3.3 - 22.1 48.8 Deferred income tax liabilities
Property and equipment 254.0 (32.9) 17.6 - 286.0 524.7Goodwill 26.2 (22.4) 3.8 - 138.1 145.7Expenses deductible during the
following years (55.2 ) 17.6 (2.2) - (48.1 ) (87.9) Intangible assets 68.0 (6.4) 3.0 - - 64.6Asset retirement obligations (21.8 ) (12.8) (1.9) - (28.1 ) (64.6) Tax attributes (1.2 ) (72.7) (2.6) 43.5 (13.7 ) (46.7) Deferred charges 2.3 26.6 - - - 28.9Deferred credits (10.2 ) (2.0) - - - (12.2) Revenues taxable during the following
years 3.9 (0.3) - - - 3.6Unrealized exchange gain 1.9 (0.1) (0.8) - - 1.0Other (5.8 ) (7.7) 5.6 - 12.0 4.1 262.1 (113.1) 22.5 43.5 346.2 561.2

Notes to the Consolidated Financial Statements For the fiscal years ended April 27, 2014 and April 28, 2013 (in millions of US dollars, except share and stock option data)
Annual Report © 2014 Alimentation Couche-Tard Inc. Page 66 of 81
The analysis of deferred tax assets and deferred tax liabilities is as follows:
2014 2013 $ $Deferred tax assets:
Deferred tax assets to be recovered in more than 12 months 47.1 45.6Deferred tax assets to be recovered within 12 months 4.6 3.2
51.7 48.8 Deferred tax liabilities:
Deferred tax liabilities to be settled in more than 12 months 609.7 581.5Deferred tax liabilities to be settled within 12 months (43.9) (20.3)
565.8 561.2
Deferred income tax liabilities that would be payable on the retained earnings of certain subsidiaries have not been recognized because such amounts are not expected to materialize in the foreseeable future. Temporary differences related to these investments amounted to $1,015.8 ($709.0 in 2013).
11. NET EARNINGS PER SHARE
The following table presents the information for the computation of basic and diluted net earnings per share, adjusted for the share split described in note 23:
2014 2013 $ $Net earnings available to Class A and B shareholders 811.2 572.8 Weighted average number of shares (in thousands) 564,511 555,083Dilutive effect of stock options (in thousands) 3,629 5,484Weighted average number of diluted shares (in thousands) 568,140 560,567 Basic net earnings per share available for Class A and B shareholders 1.44 1.03 Diluted net earnings per share available for Class A and B shareholders 1.43 1.02
In calculating diluted net earnings per share for 2014, no stock options are excluded due to their antidilutive effect (105,000 excluded stock options in 2013).
During fiscal 2014, the Board declared total dividends of CA$0.136 per share.
12. SUPPLEMENTARY INFORMATION RELATING TO THE CONSOLIDATED STATEMENTS OF CASH FLOWS
The changes in non-cash working capital are detailed as follows:
2014 2013 $ $Accounts receivable (53.4) 372.5Inventories (9.0) 8.1Prepaid expenses (2.1) (17.2) Accounts payable and accrued liabilities 154.9 (319.1) Income taxes payable 24.2 24.6 114.6 68.9
13. ACCOUNTS RECEIVABLE
2014 2013 $ $Trade accounts receivable and vendor rebates receivable (a) 932.2 966.5Provision for doubtful accounts (27.6) (31.1) Trade accounts receivable and vendor rebates receivable - net 904.6 935.4Credit and debit cards receivable 718.7 572.5Other accounts receivable 103.1 108.1 1,726.4 1,616.0
(a) This amount is presented net of an amount of $162.5 presented in reduction of Accounts payables and accrued expenses due to netting arrangements.
The following details the aging of trade accounts receivable and vendor rebates receivable that are not impaired:
2014 2013 $ $Not past due 803.6 827.2Past due 1-30 days 44.2 80.2Past due 31-60 days 11.8 6.7Past due 61-90 days 15.8 7.8Past due 91 days and over 29.2 13.5 904.6 935.4

Notes to the Consolidated Financial Statements For the fiscal years ended April 27, 2014 and April 28, 2013 (in millions of US dollars, except share and stock option data)
Annual Report © 2014 Alimentation Couche-Tard Inc. Page 67 of 81
Movements in the provision for doubtful accounts are as follows: 2014 2013 $ $Balance, beginning of year 31.1 1.6Business acquisitions - 30.1Provision for doubtful accounts, net of unused beginning balance 7.2 6.9Receivables written off during the year (11.7) (9.2) Effect of exchange rate variations 1.0 1.7Balance, end of year 27.6 31.1
14. INVENTORIES
2014 2013 $ $ Merchandise 455.2 446.4 Road transportation fuel 329.0 329.5 Lubricant products 36.6 34.9 Aviation fuel 23.0 31.6 Other products 4.2 3.6 848.0 846.0
15. PROPERTY AND EQUIPMENT
Land
Building and building
components EquipmentLeasehold
improvements Total $ $ $ $ $Year ended April 27, 2014 Net book amount, beginning 1,379.4 1,805.9 1,692.1 202.5 5,079.9Additions 26.4 66.0 344.3 31.5 468.2Business acquisitions (Note 4) 99.0 30.8 32.5 - 162.3Disposals (17.5) (13.9) (49.6) (2.3) (83.3) Depreciation and amortization expense (0.3) (116.5) (298.8) (41.9) (457.5) Impairment expense (7.8) (1.0) (2.9) - (11.7) Transfers (23.3) (9.2) 32.2 0.3 -Effect of exchange rate variations (8.8) 0.9 (14.2) (4.8) (26.9) Net book amount, end 1,447.1 1,763.0 1,735.6 185.3 5,131.0 As at April 27, 2014 Cost 1,456.5 2,219.1 3,073.4 484.3 7,233.3Accumulated depreciation, amortization and impairment (9.4) (456.1) (1,337.8) (299.0) (2,102.3) Net book amount 1,447.1 1,763.0 1,735.6 185.3 5,131.0Portion related to finance leases 34.0 31.6 43.4 - 109.0 Year ended April 28, 2013 Net book amount, beginning 683.3 434.5 925.0 205.5 2,248.3Additions 93.6 169.4 180.6 42.5 486.1Business acquisitions (Note 4) 615.8 1,247.9 870.2 1.9 2,735.8Disposals (46.5) (8.5) (41.6) (1.9) (98.5) Depreciation and amortization expense (0.4) (97.8) (277.3) (43.1) (418.6) Impairment expense - - (2.5) - (2.5) Transfers - 0.4 (0.2) (0.2) -Effect of exchange rate variations 33.6 60.0 37.9 (2.2) 129.3Net book amount, end 1,379.4 1,805.9 1,692.1 202.5 5,079.9 As at April 28, 2013 Cost 1,379.9 2,095.9 2,808.1 481.0 6,764.9Accumulated depreciation, amortization and impairment (0.5) (290.0) (1,116.0) (278.5) (1,685.0) Net book amount 1,379.4 1,805.9 1,692.1 202.5 5,079.9Portion related to finance leases 30.8 32.1 41.4 - 104.3
During the year ended April 27, 2014, the Corporation recorded an impairment charge of $6.8 on a non-operational lubricant production plant located in Ostroweic, Poland, due to challenging market conditions for this type of asset. The fair value measurement of this asset is categorized as level 3 as it is based on purchase offers received by the Corporation. The fair value less cost to sell of this asset was determined to be $4.5.

Notes to the Consolidated Financial Statements For the fiscal years ended April 27, 2014 and April 28, 2013 (in millions of US dollars, except share and stock option data)
Annual Report © 2014 Alimentation Couche-Tard Inc. Page 68 of 81
16. GOODWILL AND INTANGIBLE ASSETS
Goodwill
2014 2013 $ $ Net book amount, beginning of year 1,081.0 502.9 Business acquisitions (Note 4) 16.0 556.1 Effect of exchange rate variations (8.3) 22.0 Net book amount, end of year 1,088.7 1,081.0
Intangible assets
Trademarks Franchise
agreements Software (a)Customer
relationships LicensesFuel supply agreements Other Total
$ $ $ $ $ $ $ $Year ended April 27, 2014 Net book amount, beginning 429.7 132.0 131.5 97.1 19.6 12.0 12.8 834.7Additions - - 86.0 - - - 0.2 86.2Business acquisitions (Note 4) - - - - 5.0 25.7 0.1 30.8Disposals - - (1.2) - - (6.4 ) (0.2) (7.8) Depreciation and amortization
expense (19.9 ) (19.6) (10.3) (45.6) - (21.0 ) (1.7) (118.1) Effect of exchange rate variations 1.6 (2.3) (4.1) 2.6 (0.1) - - (2.3) Net book amount, end 411.4 110.1 201.9 54.1 24.5 10.3 11.2 823.5 As at April 27, 2014 Cost 447.9 146.3 253.2 139.4 24.5 58.0 15.7 1,085.0Accumulated depreciation and
amortization (36.5 ) (36.2) (51.3) (85.3) - (47.7 ) (4.5) (261.5) Net book amount 411.4 110.1 201.9 54.1 24.5 10.3 11.2 823.5 Year ended April 28, 2013 Net book amount, beginning 154.7 - 12.7 - 19.4 29.9 0.3 217.0Additions - - 76.7 - 0.2 - 0.5 77.4Business acquisitions (Note 4) 275.3 141.8 44.7 144.3 - 0.8 12.6 619.5Disposals - - (0.2) (11.6) - (0.1 ) - (11.9) Depreciation and amortization
expense (15.8 ) (15.9) (5.6) (39.3) - (18.6 ) (0.9) (96.1) Effect of exchange rate variations 15.5 6.1 3.2 3.7 - - 0.3 28.8Net book amount, end 429.7 132.0 131.5 97.1 19.6 12.0 12.8 834.7 As at April 28, 2013 Cost 445.9 148.5 173.7 136.9 19.6 45.9 15.8 986.3Accumulated depreciation and
amortization (16.2 ) (16.5) (42.2) (39.8) - (33.9 ) (3.0) (151.6) Net book amount 429.7 132.0 131.5 97.1 19.6 12.0 12.8 834.7
(a) The net book amount as at April 27, 2014 includes $40.6 related to software in progress ($113.7 as at April 28, 2013).
Goodwill and intangible assets with indefinite useful lives are allocated to CGUs based on the geographical location of the acquired stores. Allocation as at April 27, 2014 and April 28, 2013 is as follows:
2014 2013
CGU Trademarks with
indefinite useful lives GoodwillTrademarks with
indefinite useful lives Goodwill$ $
Canada - 178.5 - 194.0United States 154.7 374.5 154.7 361.2Scandinavia 83.4 523.9 83.6 514.2Central and Eastern Europe 33.2 2.0 32.0 1.9Aviation 2.0 1.7 2.0 1.5Lubricants 5.6 8.1 5.7 8.2
278.9 1,088.7 278.0 1,081.0
The trademark with indefinite useful life for the United States CGU is the Circle K trademark and is the droplet logo for Scandinavia, Central and Eastern Europe (“CEE”), Aviation and Lubricants CGUs. The Scandinavia CGU, includes the activities of Norway, Sweden and Denmark while the CEE CGU includes the activities of Poland, Latvia, Lithuania, Estonia and Russia. For the annual impairment test, the recoverable amount of the CGU has been determined based on fair value less costs to sell and the Corporation uses an approach based on earnings to determine this value. Under this method, the cash flows of the CGU for a 3-year period were used. The key assumptions on which management has based its determination of fair value less costs to sell are the discount rate, the growth rate and the exchange rate. These assumptions primarily reflect past experience. For the Scandinavia CGU, the main assumptions used are as follows:
2014 2013 Discount rate before taxes 12.8% 12.8% Growth rate 1.0% 1.0% NOK-USD exchange rate 0.1687 0.1687

Notes to the Consolidated Financial Statements For the fiscal years ended April 27, 2014 and April 28, 2013 (in millions of US dollars, except share and stock option data)
Annual Report © 2014 Alimentation Couche-Tard Inc. Page 69 of 81
These assumptions represent management’s best estimate given current market conditions and risks specific to each of these assets.
The recoverable amounts of the United States and Canada CGUs were determined on the basis of their fair value less costs to sell and the Corporation uses an approach based on EBITDA multiples of comparable corporations to determine these values.
17. OTHER ASSETS
2014 2013 $ $ Pension benefit asset (Note 26) 30.0 22.1 Investment contract including an embedded total return swap (Note 27) 25.1 19.1 Environmental costs receivable (Note 22) 11.8 11.7 Deposits 8.5 7.7 Deferred charges, net 7.1 8.1 Other 77.3 67.6 159.8 136.3
18. ACCOUNTS PAYABLE AND ACCRUED LIABILITIES
2014 2013 $ $ Accounts payable and accrued expenses (a) 1,547.3 1,386.1 Sales and excise taxes 639.9 633.6 Salaries and related benefits 191.0 178.9 Deferred credits 17.4 18.4 Other 114.7 134.1 2,510.3 2,351.1
(a) This amount is presented net of an amount of $162.5 from Trade accounts receivable and vendor rebates receivable due to netting arrangements.
19. LONG-TERM DEBT
2014 2013 $ $Canadian dollar denominated senior unsecured notes (a) 1,172.7 978.7US dollar term revolving unsecured operating credit D, maturing in December 2017 (b) 793.5 345.5Unsecured non-revolving acquisition credit facility, maturing in June 2015 (c) 552.3 2,197.3NOK floating-rate bonds, 5.04%, maturing in February 2017 2.5 2.6NOK fixed-rate bonds, 5.75%, maturing in February 2019 2.2 2.3Note payable, secured by the assets of certain stores, 8.75%, repayable in monthly instalments, maturing in 2019 1.8 2.0Borrowing under bank overdraft facilities, maturing at various dates 1.8 -Obligations related to buildings and equipment under finance leases, rates varying from 1.42% to 12.28%, payable
on various dates until 2080 79.6 76.7 2,606.4 3,605.1Bank loans and current portion of long-term debt 20.3 620.8 2,586.1 2,984.3
(a) Canadian dollar denominated senior unsecured notes
As at April 27, 2014, the Corporation had Canadian dollar denominated senior unsecured notes totalling CA$1.3 billion, divided as follows:
Notional amount Maturity Coupon rate
Effective rate as at April 27, 2014
Tranche 1 - November 1, 2012 issuance CA$300.0 November 1, 2017 2.861% 3.0% Tranche 2 - November 1, 2012 issuance CA$450.0 November 1, 2019 3.319% 3.4% Tranche 3 - November 1, 2012 issuance CA$250.0 November 1, 2022 3.899% 4.0% Tranche 4 - August 21, 2013 issuance CA$300.0 August 21, 2020 4.214% 4.3%
The net proceeds from their issuance, which were approximately $285.6 (CA$298.3) for fiscal 2014 and $997.5 (CA$995.0) for fiscal 2013, were mainly used to repay a portion of the Corporation’s unsecured non-revolving acquisition credit facility. Notes issued on November 1, 2012 are subject to cross-currency interest rate swaps (Note 20).
(b) Term revolving unsecured operating credit D
As at April 27, 2014, the Corporation has a credit agreement consisting of a revolving unsecured facility of an initial maximum amount of $1,275.0, with an initial term of five years. On November 4, 2013, the Corporation extended the term of this agreement by one year, which brings its maturity to December 2017. The credit facility is available in the following forms:
A term revolving unsecured operating credit, available i) in Canadian dollars, ii) in US dollars, iii) in the form of Canadian dollar bankers’ acceptances, with stamping fees and iv) in the form of standby letters of credit not exceeding $100.0 or the equivalent in Canadian dollars, with applicable fees. Depending on the form and the currency of the loan, the amounts borrowed bear interest at variable rates based on the Canadian prime rate, the bankers’ acceptance rate, the US base rate or LIBOR plus a variable margin; and

Notes to the Consolidated Financial Statements For the fiscal years ended April 27, 2014 and April 28, 2013 (in millions of US dollars, except share and stock option data)
Annual Report © 2014 Alimentation Couche-Tard Inc. Page 70 of 81
An unsecured line of credit in the maximum amount of $50.0, available in Canadian or US dollars, bearing interest at variable rates based, depending on the form and currency of the loan, on the Canadian prime rate, the US prime rate or the US base rate plus a variable margin.
Standby fees, which vary based on a leverage ratio and on the utilization rate of the credit facility, apply to the unused portion of the credit facility. Stamping fees, standby letters of credit fees and the variable margin used to determine the interest rate applicable to borrowed amounts are determined according to a leverage ratio of the Corporation. Under the credit agreement, the Corporation must maintain certain financial ratios and respect certain restrictive provisions.
As at April 27, 2014, the effective interest rate is 1.19% (1.75% in 2013). In addition, as at April 27, 2014, CA$2.3 (CA$2.2 in 2013) and $29.4 ($28.4 in 2013) are used for standby letters of credit. As at April 27, 2014 and April 28, 2013, the available line of credit was unused and the Corporation was in compliance with the restrictive provisions and ratios imposed by the credit agreement.
On May 16, 2014 the Corporation increased the maximum amount of this credit facility form $1,275.0 to $1,525.0. All other conditions related to this agreement remain unchanged.
(c) Unsecured non-revolving acquisition credit facility
As at April 27, 2014, the Corporation has a credit agreement consisting of an unsecured non-revolving acquisition credit facility of an initial maximum amount of $3,200.0 (“acquisition facility”) with an initial term of three years. The acquisition facility was available exclusively to finance, directly or indirectly, the acquisition of Statoil Fuel & Retail ASA and the related acquisition costs or the repayment of any of Statoil Fuel & Retail ASA and its subsidiaries’ outstanding debt. The acquisition facility was available i) in Canadian dollars by the way of prime rate loans or bankers’ acceptances, ii) in US dollars by the way of US base rate loans or LIBOR loans. Depending on the form and the currency of the loan, the amounts borrowed bear interest at variable rates based on the Canadian prime rate, the bankers’ acceptance rate, the US base rate or LIBOR plus a variable margin. Having reached the maximum amount that can be borrowed under the acquisition facility, and given its non-revolving nature, the Corporation can no longer borrow additional amounts under this facility. Under the credit agreement, the Corporation needs to maintain certain financial ratios and respect certain restrictive provisions.
As at April 27, 2014, the effective interest rate is 2.38% (rate of 1.94% on borrowed amounts) and the Corporation was in compliance with the restrictive provisions and ratios imposed by the credit agreement.
Term revolving unsecured operating credit E
As at April 27, 2014, the Corporation has a credit agreement consisting of a revolving unsecured facility of an initial maximum amount of $50.0 with an initial term of 50 months. The credit facility is available in the form of a revolving unsecured operating credit, available in US dollars. The amounts borrowed bear interest at variable rates based on the US base rate or the LIBOR rate plus a variable margin.
Standby fees, which vary based on a leverage ratio and on the utilization rate of the credit facility, apply to the unused portion of the credit facility. The variable margin used to determine the interest rate applicable to amounts borrowed is determined according to a leverage ratio of the Corporation. Under the credit agreement, the Corporation must maintain certain financial ratios and respect certain restrictive provisions.
As at April 27, 2014 and April 28, 2013, operating credit E was unused.
Bank overdraft facilities
The Corporation has access to bank overdraft facilities totalling approximately $271.5 ($336.0 in 2013). As at April 27, 2014, they were used in the amount of $1.8 (unused as at April 28, 2013).
Obligations related to finance leases
Instalments on obligations related to finance leases for the next fiscal years are as follows:
Obligations related to buildings and equipment
under finance leases
$ 2015 19.6 2016 32.5 2017 11.5 2018 5.9 2019 5.4 2020 and thereafter 28.4
103.3 Interest expense included in minimum lease payments 23.7 79.6
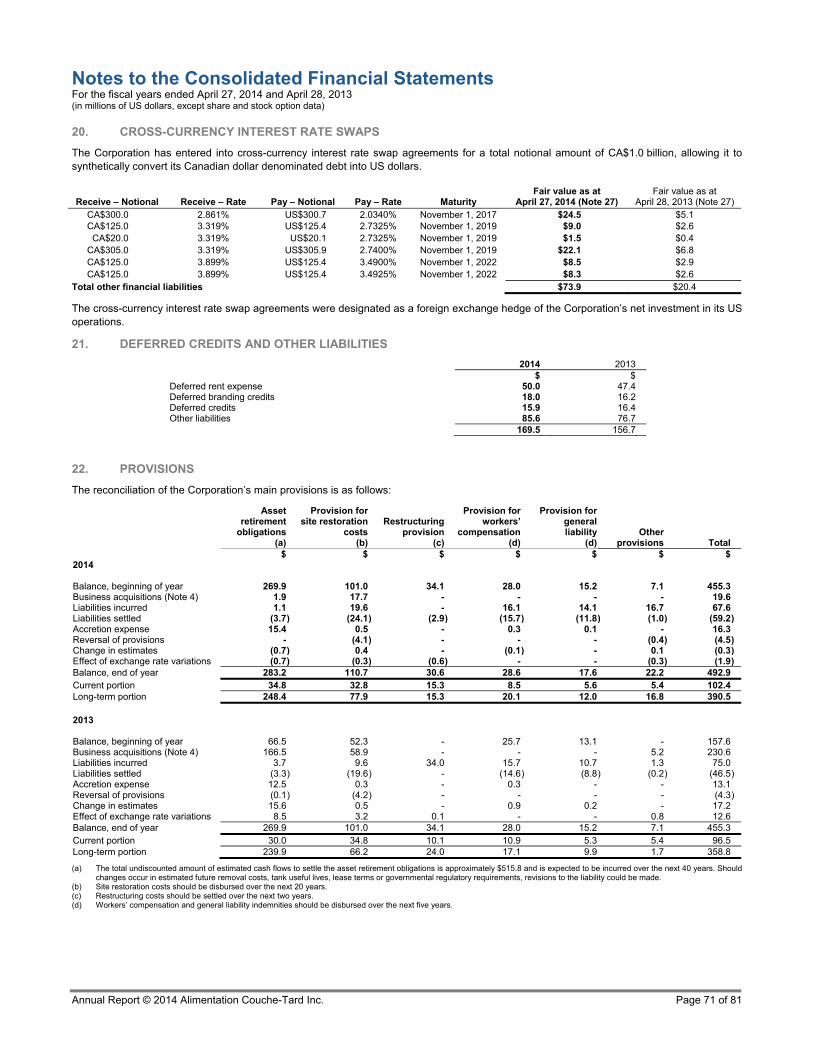
Notes to the Consolidated Financial Statements For the fiscal years ended April 27, 2014 and April 28, 2013 (in millions of US dollars, except share and stock option data)
Annual Report © 2014 Alimentation Couche-Tard Inc. Page 71 of 81
20. CROSS-CURRENCY INTEREST RATE SWAPS
The Corporation has entered into cross-currency interest rate swap agreements for a total notional amount of CA$1.0 billion, allowing it to synthetically convert its Canadian dollar denominated debt into US dollars.
Receive – Notional Receive – Rate Pay – Notional Pay – Rate Maturity Fair value as at
April 27, 2014 (Note 27) Fair value as at
April 28, 2013 (Note 27) CA$300.0 2.861% US$300.7 2.0340% November 1, 2017 $24.5 $5.1CA$125.0 3.319% US$125.4 2.7325% November 1, 2019 $9.0 $2.6CA$20.0 3.319% US$20.1 2.7325% November 1, 2019 $1.5 $0.4
CA$305.0 3.319% US$305.9 2.7400% November 1, 2019 $22.1 $6.8CA$125.0 3.899% US$125.4 3.4900% November 1, 2022 $8.5 $2.9CA$125.0 3.899% US$125.4 3.4925% November 1, 2022 $8.3 $2.6
Total other financial liabilities $73.9 $20.4
The cross-currency interest rate swap agreements were designated as a foreign exchange hedge of the Corporation’s net investment in its US operations.
21. DEFERRED CREDITS AND OTHER LIABILITIES
2014 2013 $ $ Deferred rent expense 50.0 47.4 Deferred branding credits 18.0 16.2 Deferred credits 15.9 16.4 Other liabilities 85.6 76.7 169.5 156.7
22. PROVISIONS
The reconciliation of the Corporation’s main provisions is as follows:
Asset retirement
obligations (a)
Provision for site restoration
costs (b)
Restructuring provision
(c)
Provision for workers’
compensation (d)
Provision for general liability
(d) Other
provisions Total $ $ $ $ $ $ $2014 Balance, beginning of year 269.9 101.0 34.1 28.0 15.2 7.1 455.3Business acquisitions (Note 4) 1.9 17.7 - - - - 19.6Liabilities incurred 1.1 19.6 - 16.1 14.1 16.7 67.6Liabilities settled (3.7 ) (24.1) (2.9) (15.7) (11.8 ) (1.0) (59.2) Accretion expense 15.4 0.5 - 0.3 0.1 - 16.3Reversal of provisions - (4.1) - - - (0.4) (4.5) Change in estimates (0.7 ) 0.4 - (0.1) - 0.1 (0.3) Effect of exchange rate variations (0.7 ) (0.3) (0.6) - - (0.3) (1.9) Balance, end of year 283.2 110.7 30.6 28.6 17.6 22.2 492.9Current portion 34.8 32.8 15.3 8.5 5.6 5.4 102.4Long-term portion 248.4 77.9 15.3 20.1 12.0 16.8 390.5 2013 Balance, beginning of year 66.5 52.3 - 25.7 13.1 - 157.6Business acquisitions (Note 4) 166.5 58.9 - - - 5.2 230.6Liabilities incurred 3.7 9.6 34.0 15.7 10.7 1.3 75.0Liabilities settled (3.3 ) (19.6) - (14.6) (8.8 ) (0.2) (46.5) Accretion expense 12.5 0.3 - 0.3 - - 13.1Reversal of provisions (0.1 ) (4.2) - - - - (4.3) Change in estimates 15.6 0.5 - 0.9 0.2 - 17.2Effect of exchange rate variations 8.5 3.2 0.1 - - 0.8 12.6Balance, end of year 269.9 101.0 34.1 28.0 15.2 7.1 455.3Current portion 30.0 34.8 10.1 10.9 5.3 5.4 96.5Long-term portion 239.9 66.2 24.0 17.1 9.9 1.7 358.8
(a) The total undiscounted amount of estimated cash flows to settle the asset retirement obligations is approximately $515.8 and is expected to be incurred over the next 40 years. Should changes occur in estimated future removal costs, tank useful lives, lease terms or governmental regulatory requirements, revisions to the liability could be made.
(b) Site restoration costs should be disbursed over the next 20 years. (c) Restructuring costs should be settled over the next two years. (d) Workers’ compensation and general liability indemnities should be disbursed over the next five years.
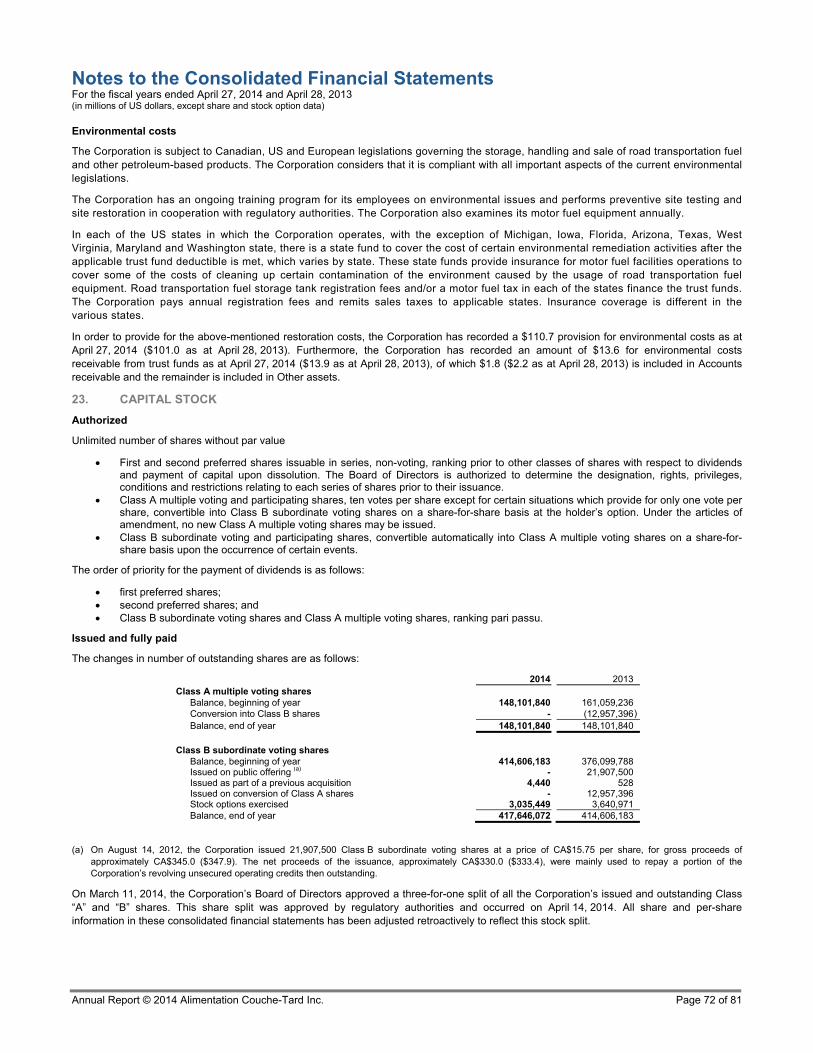
Notes to the Consolidated Financial Statements For the fiscal years ended April 27, 2014 and April 28, 2013 (in millions of US dollars, except share and stock option data)
Annual Report © 2014 Alimentation Couche-Tard Inc. Page 72 of 81
Environmental costs
The Corporation is subject to Canadian, US and European legislations governing the storage, handling and sale of road transportation fuel and other petroleum-based products. The Corporation considers that it is compliant with all important aspects of the current environmental legislations.
The Corporation has an ongoing training program for its employees on environmental issues and performs preventive site testing and site restoration in cooperation with regulatory authorities. The Corporation also examines its motor fuel equipment annually.
In each of the US states in which the Corporation operates, with the exception of Michigan, Iowa, Florida, Arizona, Texas, West Virginia, Maryland and Washington state, there is a state fund to cover the cost of certain environmental remediation activities after the applicable trust fund deductible is met, which varies by state. These state funds provide insurance for motor fuel facilities operations to cover some of the costs of cleaning up certain contamination of the environment caused by the usage of road transportation fuel equipment. Road transportation fuel storage tank registration fees and/or a motor fuel tax in each of the states finance the trust funds. The Corporation pays annual registration fees and remits sales taxes to applicable states. Insurance coverage is different in the various states.
In order to provide for the above-mentioned restoration costs, the Corporation has recorded a $110.7 provision for environmental costs as at April 27, 2014 ($101.0 as at April 28, 2013). Furthermore, the Corporation has recorded an amount of $13.6 for environmental costs receivable from trust funds as at April 27, 2014 ($13.9 as at April 28, 2013), of which $1.8 ($2.2 as at April 28, 2013) is included in Accounts receivable and the remainder is included in Other assets.
23. CAPITAL STOCK
Authorized
Unlimited number of shares without par value
First and second preferred shares issuable in series, non-voting, ranking prior to other classes of shares with respect to dividends and payment of capital upon dissolution. The Board of Directors is authorized to determine the designation, rights, privileges, conditions and restrictions relating to each series of shares prior to their issuance.
Class A multiple voting and participating shares, ten votes per share except for certain situations which provide for only one vote per share, convertible into Class B subordinate voting shares on a share-for-share basis at the holder’s option. Under the articles of amendment, no new Class A multiple voting shares may be issued.
Class B subordinate voting and participating shares, convertible automatically into Class A multiple voting shares on a share-for-share basis upon the occurrence of certain events.
The order of priority for the payment of dividends is as follows:
first preferred shares; second preferred shares; and Class B subordinate voting shares and Class A multiple voting shares, ranking pari passu.
Issued and fully paid
The changes in number of outstanding shares are as follows:
2014 2013 Class A multiple voting shares
Balance, beginning of year 148,101,840 161,059,236 Conversion into Class B shares - (12,957,396 ) Balance, end of year 148,101,840 148,101,840
Class B subordinate voting shares
Balance, beginning of year 414,606,183 376,099,788 Issued on public offering (a) - 21,907,500 Issued as part of a previous acquisition 4,440 528 Issued on conversion of Class A shares - 12,957,396 Stock options exercised 3,035,449 3,640,971 Balance, end of year 417,646,072 414,606,183
(a) On August 14, 2012, the Corporation issued 21,907,500 Class B subordinate voting shares at a price of CA$15.75 per share, for gross proceeds of approximately CA$345.0 ($347.9). The net proceeds of the issuance, approximately CA$330.0 ($333.4), were mainly used to repay a portion of the Corporation’s revolving unsecured operating credits then outstanding.
On March 11, 2014, the Corporation’s Board of Directors approved a three-for-one split of all the Corporation’s issued and outstanding Class “A” and “B” shares. This share split was approved by regulatory authorities and occurred on April 14, 2014. All share and per-share information in these consolidated financial statements has been adjusted retroactively to reflect this stock split.

Notes to the Consolidated Financial Statements For the fiscal years ended April 27, 2014 and April 28, 2013 (in millions of US dollars, except share and stock option data)
Annual Report © 2014 Alimentation Couche-Tard Inc. Page 73 of 81
24. STOCK-BASED COMPENSATION AND OTHER STOCK-BASED PAYMENTS
Stock option plan
All information related to stock-based compensation and other stock-based payments has been adjusted retroactively to reflect the stock split described in Note 23.
The Corporation has a stock option plan (the “Plan”) under which it has authorized the grant of up to 50,676,000 stock options for the purchase of its Class B subordinate voting shares.
Stock options have up to a ten-year term, vest 20.0% on the date of the grant and cumulatively thereafter on each anniversary date of the grant and are exercisable at the designated market price on the date of grant. The grant price of each stock option shall not be set below the weighted average closing price for a board lot of the Class B shares on the Toronto Stock Exchange for the five days preceding the grant. Each stock option is exercisable into one Class B share of the Corporation at the price specified in the terms of the stock option. To allow option holders to proceed with a cashless exercise of their options, the Plan allows them to elect to receive a number of subordinate shares equivalent to the difference between the total number of subordinate shares underlying the options exercised and the number of subordinate shares required to settle the exercise of the options.
The table below presents the status of the Corporation’s stock option plan as at April 27, 2014 and April 28, 2013 and the changes therein during the years then ended:
2014 2013
Number of
stock optionsWeighted average
exercise priceNumber of
stock options Weighted average
exercise price CA$ CA$Outstanding, beginning of year 6,758,280 5.48 10,465,512 4.47Granted - - 105,000 15.87Exercised (3,167,925) 3.95 (3,810,972 ) 3.00Forfeited (11,550) 6.74 (1,260 ) 5.52Outstanding, end of year 3,578,805 6.83 6,758,280 5.48
Exercisable stock options, end of year 3,515,805 6.67 6,540,690 5.34
For options exercised in fiscal 2014, the weighted average share price at the date of exercise was CA$21.84 (CA$16.05 in 2013).
The following table presents information on the stock options outstanding and exercisable as at April 27, 2014:
Options outstanding Options exercisable
Range of exercise prices
Number of stock options
outstanding as at April 27, 2014
Weighted average remaining
contractual life (years)
Weighted average
exercise price
Number of stock options
exercisable as at April 27, 2014
Weighted average
exercise price CA$ CA$ CA$ 3 – 4 9,900 0.12 3.86 9,900 3.86 4 – 5 224,535 4.46 4.62 224,535 4.62 5 – 6 1,724,490 1.52 5.76 1,724,490 5.76 6 – 9 1,514,880 3.12 7.77 1,514,880 7.77 9 – 16 105,000 8.26 15.87 42,000 15.87 3,578,805 6.83 3,515,805 6.67
The fair value of stock options granted is estimated at the grant date using the Black-Scholes option pricing model on the basis of the following weighted average assumptions for the stock options granted during the year:
2013 Expected dividends (per share) CA$0.10 Expected volatility 30.00% Risk-free interest rate 1.55% Expected life 8 years
No stock options were granted in 2014. The weighted average fair value of stock options granted was CA$5.57 in 2013.
Compensation cost charged to the consolidated statements of earnings amounts to $0.3 ($0.5 in 2013).
Deferred Share Unit Plan
The Corporation has a Deferred Share Unit Plan for the benefit of its external directors allowing them, at their option, to receive all or a portion of their annual compensation and directors’ fee in the form of Deferred Share Units (“DSU”). A DSU is a notional unit, equivalent in value to the Corporation’s Class B share. Upon leaving the Board of Directors, participants are entitled to receive the payment of their cumulated DSUs either a) in the form of cash based on the price of the Corporation’s Class B shares as traded on the open market on the date of payment, or b) in Class B shares bought by the Corporation on the open market on behalf of the participant.
The DSU expense and the related liability are recorded at the grant date. The liability is adjusted periodically to reflect any variation in the market value of the Class B shares. As at April 27, 2014, the Corporation has a total of 221,551 DSUs outstanding (201,975 as at

Notes to the Consolidated Financial Statements For the fiscal years ended April 27, 2014 and April 28, 2013 (in millions of US dollars, except share and stock option data)
Annual Report © 2014 Alimentation Couche-Tard Inc. Page 74 of 81
April 28, 2013) and an obligation of $6.1 ($4.0 as at April 28, 2013) is recorded in deferred credits and other liabilities. The obligation is subject to an embedded total return swap (Note 17). The compensation cost amounts to $2.6 in 2014 ($1.7 in 2013).
Phantom Stock Units
The Corporation has a Phantom Stock Units (“PSU”) Plan allowing the Board of Directors, through its Human Resources and Corporate Governance Committee, to grant PSUs to the officers and selected key employees of the Corporation (the “Participants”). A PSU is a notional unit whose value is based on the weighted average reported closing price for a board lot of the Corporation’s Class B subordinated voting share (the “Class B share”) on the Toronto Stock Exchange for the five trading days immediately preceding the grant date. The PSU provides the Participant with the opportunity to earn a cash award. Each PSU initially granted vests no later than one day prior to the third anniversary of the grant date subject namely to the achievement of performance objectives of the Corporation, based on external and internal benchmarks, over a three-year performance period. PSUs are not dilutive since they are payable solely in cash.
The table below presents the status of the Corporation’s PSU plan as at April 27, 2014 and April 28, 2013 and the changes therein during the years then ended in number of units:
2014 2013 Outstanding, beginning of year 1,507,935 1,307,649 Granted 274,740 652,884 Paid (326,904) (405,363 ) Cancelled (204,234) (47,235 ) Outstanding, end of year 1,251,537 1,507,935
As at April 27, 2014, an obligation of $7.5 is recorded in accounts payable and accrued liabilities ($6.8 in 2013) and $11.4 is recorded in Deferred credits and other liabilities ($7.7 as at April 28, 2013). The obligation is subject to an embedded total return swap (Note 17). For 2014, the compensation cost amounts to $4.5 ($3.7 for 2013).
25. ACCUMULATED OTHER COMPREHENSIVE INCOME
As at April 27, 2014
Attributable to shareholders of the Corporation
Items that may be reclassified to earnings
Will never be reclassified to
earnings
Net interest on investment
hedge Net investment
hedge
Cumulative translation
adjustmentsCash flow
hedgeCumulative net
actuarial loss
Accumulated other comprehensive
income
$ $ $ $ $ $
Balance, before income taxes 6.1 (73.9) 246.7 4.4 (6.8 ) 176.5Less: Income taxes 1.7 (11.3) - 1.0 (1.8 ) (10.4)
Balance, net of income taxes 4.4 (62.6) 246.7 3.4 (5.0 ) 186.9
As at April 28, 2013
Attributable to shareholders of the Corporation
Items that may be reclassified to earnings
Will never be reclassified to
earnings
Net interest on investment
hedge Net investment
hedge
Cumulative translation
adjustmentsCash flow
hedgeCumulative net
actuarial loss
Accumulated other comprehensive
income
$ $ $ $ $ $
Balance, before income taxes 2.6 (20.4) 204.3 2.1 (7.1 ) 181.5Less: Income taxes 0.8 (3.5) - 0.4 (2.0 ) (4.3)
Balance, net of income taxes 1.8 (16.9) 204.3 1.7 (5.1 ) 185.8
26. EMPLOYEE FUTURE BENEFITS
The Corporation has a number of funded and unfunded defined benefit and defined contribution plans that provide retirement benefits to certain employees.
Defined benefit plans
The Corporation measures its accrued defined benefit obligation and the fair value of plan assets for accounting purposes on the last Sunday of April of each year.
The Corporation has defined benefit plans in Canada, the United States, Norway and Sweden. Those plans provide benefits based on average earnings at retirement, or based on the years with the highest salaries, and the number of years of service. The most recent actuarial
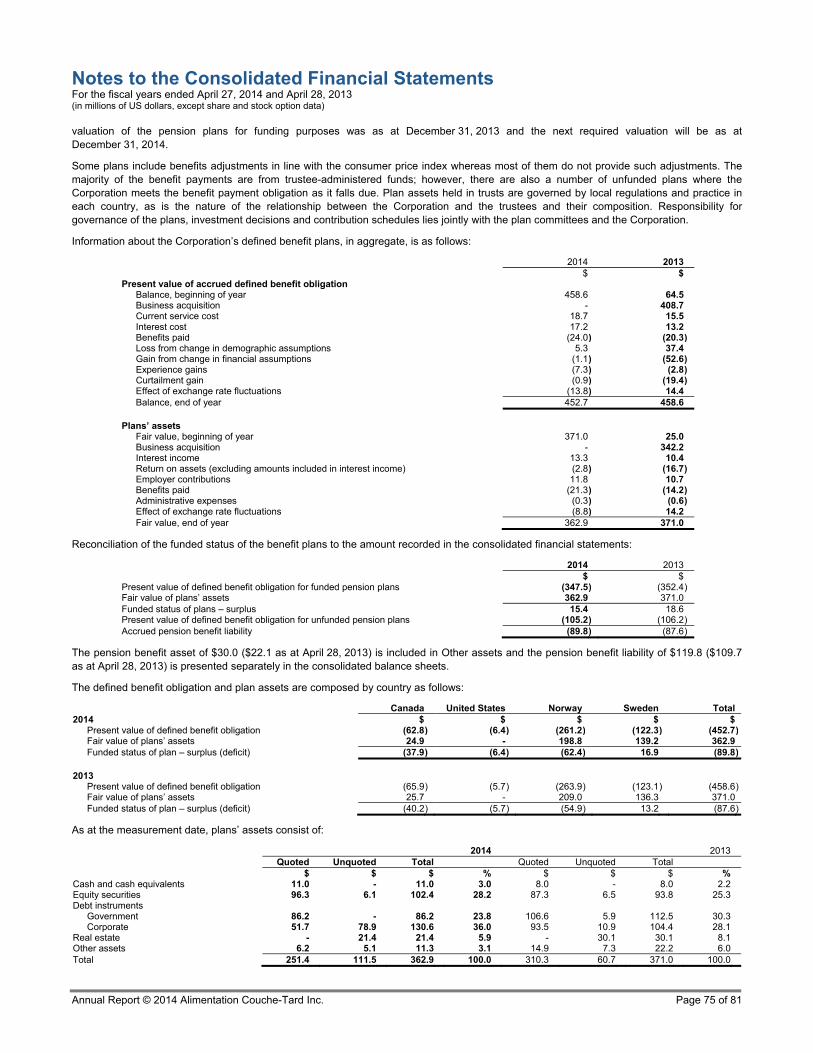
Notes to the Consolidated Financial Statements For the fiscal years ended April 27, 2014 and April 28, 2013 (in millions of US dollars, except share and stock option data)
Annual Report © 2014 Alimentation Couche-Tard Inc. Page 75 of 81
valuation of the pension plans for funding purposes was as at December 31, 2013 and the next required valuation will be as at December 31, 2014.
Some plans include benefits adjustments in line with the consumer price index whereas most of them do not provide such adjustments. The majority of the benefit payments are from trustee-administered funds; however, there are also a number of unfunded plans where the Corporation meets the benefit payment obligation as it falls due. Plan assets held in trusts are governed by local regulations and practice in each country, as is the nature of the relationship between the Corporation and the trustees and their composition. Responsibility for governance of the plans, investment decisions and contribution schedules lies jointly with the plan committees and the Corporation.
Information about the Corporation’s defined benefit plans, in aggregate, is as follows:
2014 2013 $ $
Present value of accrued defined benefit obligation Balance, beginning of year 458.6 64.5Business acquisition - 408.7Current service cost 18.7 15.5Interest cost 17.2 13.2Benefits paid (24.0 ) (20.3) Loss from change in demographic assumptions 5.3 37.4Gain from change in financial assumptions (1.1 ) (52.6) Experience gains (7.3 ) (2.8) Curtailment gain (0.9 ) (19.4) Effect of exchange rate fluctuations (13.8 ) 14.4Balance, end of year 452.7 458.6
Plans’ assets Fair value, beginning of year 371.0 25.0Business acquisition - 342.2Interest income 13.3 10.4Return on assets (excluding amounts included in interest income) (2.8 ) (16.7) Employer contributions 11.8 10.7Benefits paid (21.3 ) (14.2) Administrative expenses (0.3 ) (0.6) Effect of exchange rate fluctuations (8.8 ) 14.2Fair value, end of year 362.9 371.0
Reconciliation of the funded status of the benefit plans to the amount recorded in the consolidated financial statements:
2014 2013 $ $Present value of defined benefit obligation for funded pension plans (347.5 ) (352.4) Fair value of plans’ assets 362.9 371.0Funded status of plans – surplus 15.4 18.6Present value of defined benefit obligation for unfunded pension plans (105.2 ) (106.2) Accrued pension benefit liability (89.8 ) (87.6)
The pension benefit asset of $30.0 ($22.1 as at April 28, 2013) is included in Other assets and the pension benefit liability of $119.8 ($109.7 as at April 28, 2013) is presented separately in the consolidated balance sheets.
The defined benefit obligation and plan assets are composed by country as follows:
Canada United States Norway Sweden Total2014 $ $ $ $ $
Present value of defined benefit obligation (62.8) (6.4) (261.2 ) (122.3) (452.7)Fair value of plans’ assets 24.9 - 198.8 139.2 362.9Funded status of plan – surplus (deficit) (37.9) (6.4) (62.4 ) 16.9 (89.8)
2013 Present value of defined benefit obligation (65.9) (5.7) (263.9 ) (123.1) (458.6)Fair value of plans’ assets 25.7 - 209.0 136.3 371.0Funded status of plan – surplus (deficit) (40.2) (5.7) (54.9 ) 13.2 (87.6)
As at the measurement date, plans’ assets consist of:
2014 2013 Quoted Unquoted Total Quoted Unquoted Total $ $ $ % $ $ $ %Cash and cash equivalents 11.0 - 11.0 3.0 8.0 - 8.0 2.2Equity securities 96.3 6.1 102.4 28.2 87.3 6.5 93.8 25.3Debt instruments
Government 86.2 - 86.2 23.8 106.6 5.9 112.5 30.3Corporate 51.7 78.9 130.6 36.0 93.5 10.9 104.4 28.1
Real estate - 21.4 21.4 5.9 - 30.1 30.1 8.1Other assets 6.2 5.1 11.3 3.1 14.9 7.3 22.2 6.0Total 251.4 111.5 362.9 100.0 310.3 60.7 371.0 100.0

Notes to the Consolidated Financial Statements For the fiscal years ended April 27, 2014 and April 28, 2013 (in millions of US dollars, except share and stock option data)
Annual Report © 2014 Alimentation Couche-Tard Inc. Page 76 of 81
The Corporation’s pension benefit expense for the fiscal year is determined as follows:
2014 2013 $ $
Current service cost, net of employee contributions 19.6 15.5Administrative expenses 0.3 0.6Pension expense for the year 19.9 16.1Net interest expense 3.9 2.8Curtailment gain (0.9) (19.4) Amount recognized in earnings for the year 22.9 (0.5)
The pension expense for the year is included in Operating, selling, administrative and general expenses in the consolidated statement of earnings. The curtailment gain is presented separately in the consolidated statement of earnings while the net interest expense is included in Financial expenses.
The amount recognized in Other comprehensive income for the fiscal year is determined as follows:
2014 2013 $ $Loss from change in demographic assumptions 5.4 37.4Gain from change in financial assumptions (1.1) (52.6) Experience gain (7.3) (2.8) Return on asset (excluding amounts included in interest income) 2.7 16.7
Amount recognized in Other comprehensive income (0.3) (1.3)
The Corporation expects to make a contribution of $10.7 to the defined benefit plans during the next financial year.
The significant weighted average actuarial assumptions which management considers the most likely to determine the accrued benefit obligations and the pension expense are the following:
2014 2013 Canada United States Norway Sweden Canada United States Norway Sweden % % % % % % % %Discount rate 4.35 4.35 3.75 3.50 3.95 3.95 4.00 3.25Rate of compensation increase 3.70 4.00 3.50 2.75 3.70 4.00 3.75 2.50Rate of benefit increase 2.25 2.25 0.75 1.50 2.25 2.25 0.75 1.50Rate of social security base amount
increase (G-amount) - - 3.25 2.75 - - 3.50 2.50
The Corporation uses mortality tables provided by regulatory authorities and actuarial associations in each country. In 2013, a new mortality table was issued by The Financial Supervisory Authority of Norway. This had an impact on the defined benefit obligation in Norway. In 2014, a new mortality table was published by The Canadian Institute of Actuaries affecting the defined benefit obligation in North America. The G-amount is the expected increase of pensions paid from the state. In some European countries, the Corporation is responsible for the difference between what the pensioners receive from the state and the entitled pension based on their salary at the time of retirement.
The weighted average duration of the defined benefit obligation of the Corporation is 19 years.
The sensitivity of the defined benefit obligation to changes in the weighted principal actuarial assumptions is as follows:
Change in assumption Increase in assumption Decrease in assumption % Discount rate 0.50 Decrease by 8.4% Increase by 9.7% Rate of compensation increase 0.50 Increase by 3.0% Decrease by 2.8% Rate of benefit increase 0.50 Increase by 6.9% Decrease by 7.0% Increase of life expectancy 1 year Increase by 3.6% -
The above sensitivity analysis is based on a change in an assumption while holding all other assumptions constant. In practice, this is unlikely to occur, because changes in some of the assumptions may be correlated. When calculating the above sensitivity analyses, the same method has been applied as when calculating the pension liability recognized in the consolidated balance sheet.
Through its defined benefit pension plans, the Corporation is exposed to the following risks:
Asset returns: The value of the plans’ defined benefit obligations is calculated using a discount rate set with reference to corporate bond yields. If plan assets underperform this yield, this will create a deficit. All of the capitalized plans hold a significant proportion of equities, which are expected to outperform corporate bonds in the long term. Furthermore, the Corporation actively monitors the performance of the assets to ensure the expected return. To mitigate the risks of assets underperforming, investment policies require a diversified portfolio that spreads risk across different types of instruments.
Changes in bond yields: A decrease in corporate bond yields will increase plan defined benefit obligations. However, this same decrease will increase existing bond values held by the various plans.
Change in demographic assumptions: A change in demographic assumptions (rate of salary increase or pension increase, change in mortality table) will increase or decrease the obligation.

Notes to the Consolidated Financial Statements For the fiscal years ended April 27, 2014 and April 28, 2013 (in millions of US dollars, except share and stock option data)
Annual Report © 2014 Alimentation Couche-Tard Inc. Page 77 of 81
For funded plans, the individual plans have investment policy objectives to have investment average length in line with the average expected life of the obligation and scheduled benefits payments. The Corporation and the trustees actively monitor the duration and the expected yield of the investments to ensure they match the expected cash outflows arising from the pension benefits payments. Also, as presented above, to mitigate the risks, the investments are well diversified. The Corporation does not use derivatives to offset its risk and has not changed the processes from previous fiscal year.
In Europe, it is the Corporation’s responsibility to make contributions or not to the defined benefit plans. The Corporation contributes to these plans except when they are overcapitalized. The majority of funded plans in Europe are currently in surplus position. For the other funded plans, the Corporation makes payments based on the actuaries’ recommendations and existing regulations. In Canada, only one plan is funded and currently runs a deficit. The Corporation is committed to making special payments in the coming years to eliminate the deficit. These contributions have no significant impact on the Corporation’s cash flows. The Corporation does not have a funded plan in the United States.
The Corporation recorded a curtailment gain on its pension obligation on some of its defined benefit pension plans. This planned curtailment results from Statoil Fuel & Retail’s restructuring.
Defined contribution plans
The Corporation’s total pension expense under its defined contribution plans and mandatory governmental plans for 2014 is $66.9 ($61.9 in 2013).
Deferred compensation plan – United States operations
The Corporation sponsors a deferred compensation plan that allows certain employees in its US operations to defer up to 25.0% of their base salary and 100.0% of their cash bonuses for any given year. Interest accrued on the deferral and amounts due to the participants are generally payable on retirement, except in certain limited circumstances. Obligations under this plan amount to $22.6 as at April 27, 2014 ($18.3 as at April 28, 2013) and are included in Deferred credits and other liabilities.
27. FINANCIAL INSTRUMENTS AND CAPITAL RISK MANAGEMENT
Financial risk management objectives and policies
The Corporation’s activities expose it to a variety of financial risks: foreign currency risk, interest rate risk, credit risk, liquidity risk and price risk. The Corporation uses forward contracts to hedge certain risk exposures, primarily foreign currency and price risk as well as a cross currency interest rate swap to hedge its foreign currency risk related to its net investment in its US operations.
Foreign currency risk
A large portion of the Corporation’s consolidated revenues and expenses are received or denominated in the functional currency of the markets in which it does business. Accordingly, the Corporation’s sensitivity to variations in foreign exchange rates is economically limited.
The Corporation is exposed to foreign currency risk with respect to a portion of its aviation fuel operations for which purchases and sales are denominated in different currencies. To mitigate this risk, the Corporation holds foreign exchange forward contracts.
The Corporation is also exposed to foreign currency risk with respect to a portion of its long-term debt denominated in US dollars and certain intercompany loans. As at April 27, 2014, with all other variables held constant, a hypothetical variation of 5.0% of the US dollar against the Canadian dollar would have had a net impact of $12.5 on net earnings. As at April 27, 2014, the Corporation did not hold any other derivative instruments to mitigate this risk.
The Corporation was also exposed to foreign currency risk with respect to its acquisition of Statoil Fuel & Retail for which the purchase price was denominated in Norwegian kroners (“NOK”) and was financed using the Corporation’s acquisition facility denominated in US dollars. The hypothetical weakening of the US dollar against the NOK would have increased the Corporation’s US dollar cash requirements in order to close the acquisition of Statoil Fuel & Retail. To mitigate this risk, the Corporation entered into foreign exchange forward contracts (hereinafter, “forwards”) with reputable financial institutions allowing it to predetermine a significant portion of the disbursement it planned to make in US dollars for the acquisition of Statoil Fuel & Retail.
In total, from April 10, 2012 to June 12, 2012, the Corporation entered into forwards requiring it to deliver US$3.47 billion in exchange for NOK 20.14 billion, representing a weighted average rate of NOK 5.8082 per US dollar which is a favorable rate compared to the rate of NOK 5.75 per US dollar in effect on April 18, 2012, date of the announcement of the offer to acquire Statoil Fuel & Retail.
Subsequently, the Corporation modified the original maturity dates of certain forwards to make them coincide with the actual disbursement dates for the payment of Statoil Fuel & Retail shares and the repayment of certain of Statoil Fuel & Retail’s debts. Thus, from June 15, 2012 to August 24, 2012, the Corporation settled all of the forwards to pay for Statoil Fuel & Retail shares and certain of its debts.
During fiscal 2013, the Corporation recorded to earnings losses of $102.9, in relation with these forwards.
Interest rate risk
The Corporation’s fixed rate long-term debt is exposed to a risk of change in fair value due to changes in interest rates. As at April 27, 2014, the Corporation did not hold any derivative instruments to mitigate this risk.
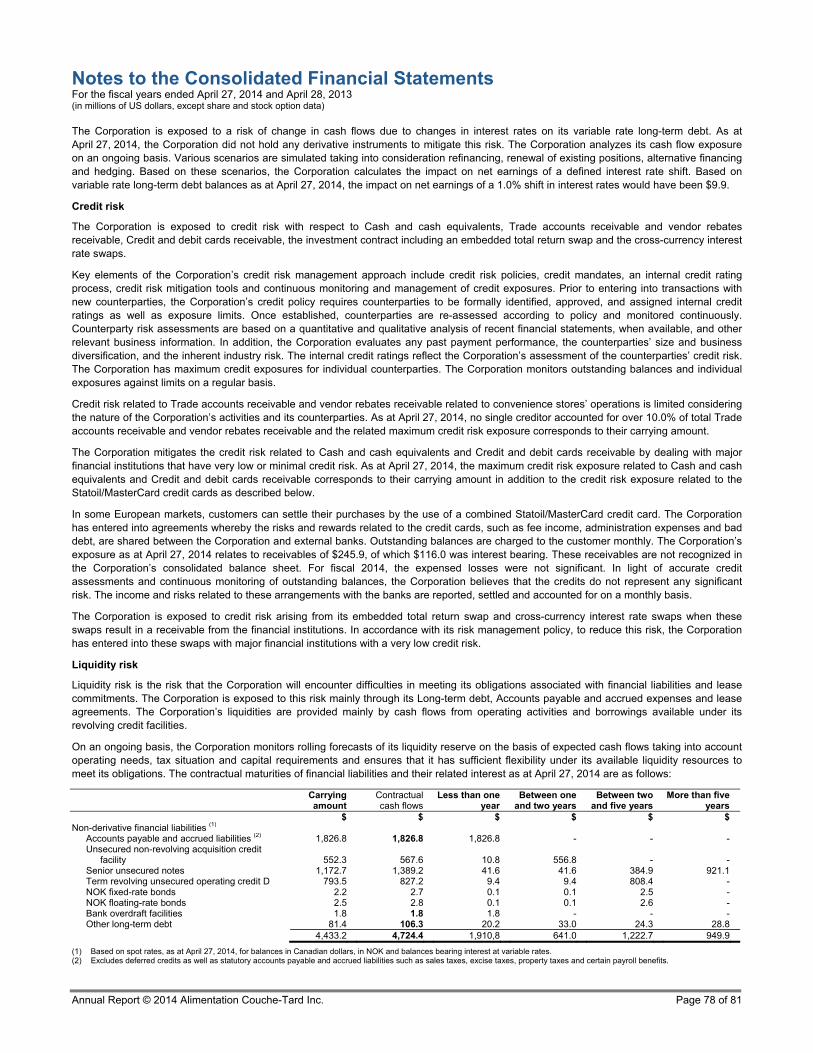
Notes to the Consolidated Financial Statements For the fiscal years ended April 27, 2014 and April 28, 2013 (in millions of US dollars, except share and stock option data)
Annual Report © 2014 Alimentation Couche-Tard Inc. Page 78 of 81
The Corporation is exposed to a risk of change in cash flows due to changes in interest rates on its variable rate long-term debt. As at April 27, 2014, the Corporation did not hold any derivative instruments to mitigate this risk. The Corporation analyzes its cash flow exposure on an ongoing basis. Various scenarios are simulated taking into consideration refinancing, renewal of existing positions, alternative financing and hedging. Based on these scenarios, the Corporation calculates the impact on net earnings of a defined interest rate shift. Based on variable rate long-term debt balances as at April 27, 2014, the impact on net earnings of a 1.0% shift in interest rates would have been $9.9.
Credit risk
The Corporation is exposed to credit risk with respect to Cash and cash equivalents, Trade accounts receivable and vendor rebates receivable, Credit and debit cards receivable, the investment contract including an embedded total return swap and the cross-currency interest rate swaps.
Key elements of the Corporation’s credit risk management approach include credit risk policies, credit mandates, an internal credit rating process, credit risk mitigation tools and continuous monitoring and management of credit exposures. Prior to entering into transactions with new counterparties, the Corporation’s credit policy requires counterparties to be formally identified, approved, and assigned internal credit ratings as well as exposure limits. Once established, counterparties are re-assessed according to policy and monitored continuously. Counterparty risk assessments are based on a quantitative and qualitative analysis of recent financial statements, when available, and other relevant business information. In addition, the Corporation evaluates any past payment performance, the counterparties’ size and business diversification, and the inherent industry risk. The internal credit ratings reflect the Corporation’s assessment of the counterparties’ credit risk. The Corporation has maximum credit exposures for individual counterparties. The Corporation monitors outstanding balances and individual exposures against limits on a regular basis.
Credit risk related to Trade accounts receivable and vendor rebates receivable related to convenience stores’ operations is limited considering the nature of the Corporation’s activities and its counterparties. As at April 27, 2014, no single creditor accounted for over 10.0% of total Trade accounts receivable and vendor rebates receivable and the related maximum credit risk exposure corresponds to their carrying amount.
The Corporation mitigates the credit risk related to Cash and cash equivalents and Credit and debit cards receivable by dealing with major financial institutions that have very low or minimal credit risk. As at April 27, 2014, the maximum credit risk exposure related to Cash and cash equivalents and Credit and debit cards receivable corresponds to their carrying amount in addition to the credit risk exposure related to the Statoil/MasterCard credit cards as described below.
In some European markets, customers can settle their purchases by the use of a combined Statoil/MasterCard credit card. The Corporation has entered into agreements whereby the risks and rewards related to the credit cards, such as fee income, administration expenses and bad debt, are shared between the Corporation and external banks. Outstanding balances are charged to the customer monthly. The Corporation’s exposure as at April 27, 2014 relates to receivables of $245.9, of which $116.0 was interest bearing. These receivables are not recognized in the Corporation’s consolidated balance sheet. For fiscal 2014, the expensed losses were not significant. In light of accurate credit assessments and continuous monitoring of outstanding balances, the Corporation believes that the credits do not represent any significant risk. The income and risks related to these arrangements with the banks are reported, settled and accounted for on a monthly basis.
The Corporation is exposed to credit risk arising from its embedded total return swap and cross-currency interest rate swaps when these swaps result in a receivable from the financial institutions. In accordance with its risk management policy, to reduce this risk, the Corporation has entered into these swaps with major financial institutions with a very low credit risk.
Liquidity risk
Liquidity risk is the risk that the Corporation will encounter difficulties in meeting its obligations associated with financial liabilities and lease commitments. The Corporation is exposed to this risk mainly through its Long-term debt, Accounts payable and accrued expenses and lease agreements. The Corporation’s liquidities are provided mainly by cash flows from operating activities and borrowings available under its revolving credit facilities.
On an ongoing basis, the Corporation monitors rolling forecasts of its liquidity reserve on the basis of expected cash flows taking into account operating needs, tax situation and capital requirements and ensures that it has sufficient flexibility under its available liquidity resources to meet its obligations. The contractual maturities of financial liabilities and their related interest as at April 27, 2014 are as follows:
Carrying amount
Contractual cash flows
Less than one year
Between one and two years
Between two and five years
More than five years
$ $ $ $ $ $Non-derivative financial liabilities (1)
Accounts payable and accrued liabilities (2) 1,826.8 1,826.8 1,826.8 - - -Unsecured non-revolving acquisition credit
facility 552.3 567.6 10.8 556.8
- -Senior unsecured notes 1,172.7 1,389.2 41.6 41.6 384.9 921.1Term revolving unsecured operating credit D 793.5 827.2 9.4 9.4 808.4 -NOK fixed-rate bonds 2.2 2.7 0.1 0.1 2.5 -NOK floating-rate bonds 2.5 2.8 0.1 0.1 2.6 -Bank overdraft facilities 1.8 1.8 1.8 - - -Other long-term debt 81.4 106.3 20.2 33.0 24.3 28.8 4,433.2 4,724.4 1,910,8 641.0 1,222.7 949.9
(1) Based on spot rates, as at April 27, 2014, for balances in Canadian dollars, in NOK and balances bearing interest at variable rates. (2) Excludes deferred credits as well as statutory accounts payable and accrued liabilities such as sales taxes, excise taxes, property taxes and certain payroll benefits.
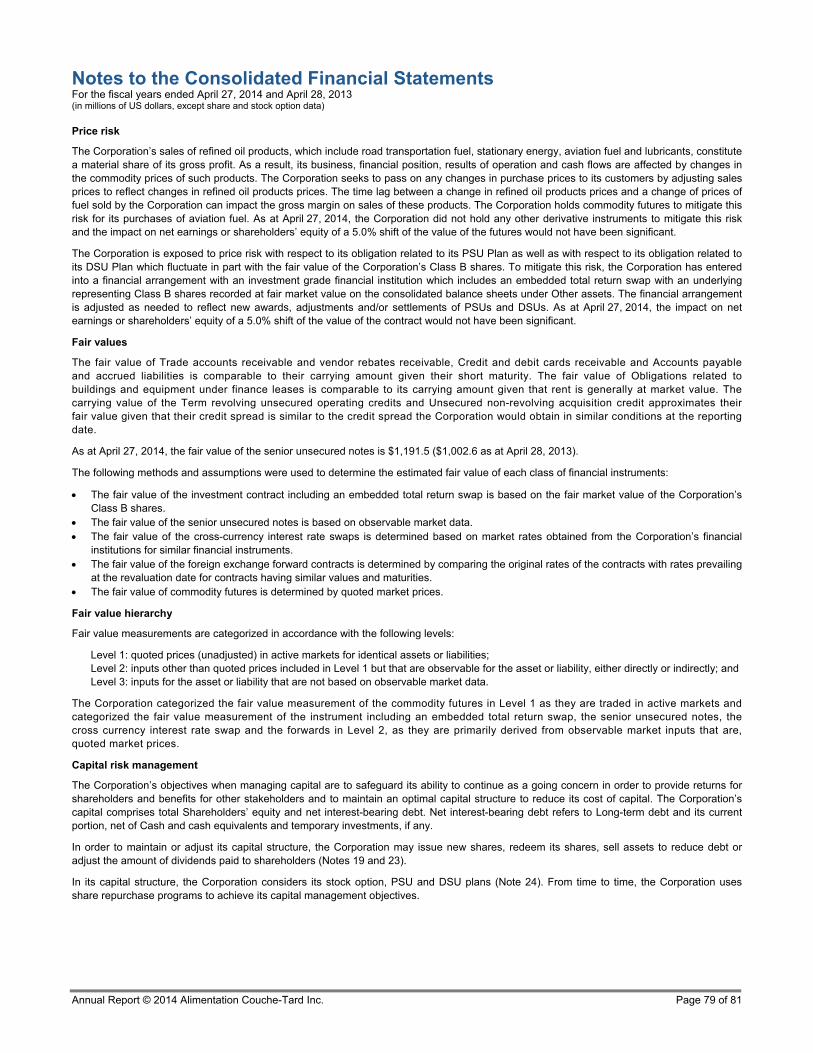
Notes to the Consolidated Financial Statements For the fiscal years ended April 27, 2014 and April 28, 2013 (in millions of US dollars, except share and stock option data)
Annual Report © 2014 Alimentation Couche-Tard Inc. Page 79 of 81
Price risk
The Corporation’s sales of refined oil products, which include road transportation fuel, stationary energy, aviation fuel and lubricants, constitute a material share of its gross profit. As a result, its business, financial position, results of operation and cash flows are affected by changes in the commodity prices of such products. The Corporation seeks to pass on any changes in purchase prices to its customers by adjusting sales prices to reflect changes in refined oil products prices. The time lag between a change in refined oil products prices and a change of prices of fuel sold by the Corporation can impact the gross margin on sales of these products. The Corporation holds commodity futures to mitigate this risk for its purchases of aviation fuel. As at April 27, 2014, the Corporation did not hold any other derivative instruments to mitigate this risk and the impact on net earnings or shareholders’ equity of a 5.0% shift of the value of the futures would not have been significant.
The Corporation is exposed to price risk with respect to its obligation related to its PSU Plan as well as with respect to its obligation related to its DSU Plan which fluctuate in part with the fair value of the Corporation’s Class B shares. To mitigate this risk, the Corporation has entered into a financial arrangement with an investment grade financial institution which includes an embedded total return swap with an underlying representing Class B shares recorded at fair market value on the consolidated balance sheets under Other assets. The financial arrangement is adjusted as needed to reflect new awards, adjustments and/or settlements of PSUs and DSUs. As at April 27, 2014, the impact on net earnings or shareholders’ equity of a 5.0% shift of the value of the contract would not have been significant.
Fair values
The fair value of Trade accounts receivable and vendor rebates receivable, Credit and debit cards receivable and Accounts payable and accrued liabilities is comparable to their carrying amount given their short maturity. The fair value of Obligations related to buildings and equipment under finance leases is comparable to its carrying amount given that rent is generally at market value. The carrying value of the Term revolving unsecured operating credits and Unsecured non-revolving acquisition credit approximates their fair value given that their credit spread is similar to the credit spread the Corporation would obtain in similar conditions at the reporting date.
As at April 27, 2014, the fair value of the senior unsecured notes is $1,191.5 ($1,002.6 as at April 28, 2013).
The following methods and assumptions were used to determine the estimated fair value of each class of financial instruments:
The fair value of the investment contract including an embedded total return swap is based on the fair market value of the Corporation’s Class B shares.
The fair value of the senior unsecured notes is based on observable market data. The fair value of the cross-currency interest rate swaps is determined based on market rates obtained from the Corporation’s financial
institutions for similar financial instruments. The fair value of the foreign exchange forward contracts is determined by comparing the original rates of the contracts with rates prevailing
at the revaluation date for contracts having similar values and maturities. The fair value of commodity futures is determined by quoted market prices.
Fair value hierarchy
Fair value measurements are categorized in accordance with the following levels:
Level 1: quoted prices (unadjusted) in active markets for identical assets or liabilities; Level 2: inputs other than quoted prices included in Level 1 but that are observable for the asset or liability, either directly or indirectly; and Level 3: inputs for the asset or liability that are not based on observable market data.
The Corporation categorized the fair value measurement of the commodity futures in Level 1 as they are traded in active markets and categorized the fair value measurement of the instrument including an embedded total return swap, the senior unsecured notes, the cross currency interest rate swap and the forwards in Level 2, as they are primarily derived from observable market inputs that are, quoted market prices.
Capital risk management
The Corporation’s objectives when managing capital are to safeguard its ability to continue as a going concern in order to provide returns for shareholders and benefits for other stakeholders and to maintain an optimal capital structure to reduce its cost of capital. The Corporation’s capital comprises total Shareholders’ equity and net interest-bearing debt. Net interest-bearing debt refers to Long-term debt and its current portion, net of Cash and cash equivalents and temporary investments, if any.
In order to maintain or adjust its capital structure, the Corporation may issue new shares, redeem its shares, sell assets to reduce debt or adjust the amount of dividends paid to shareholders (Notes 19 and 23).
In its capital structure, the Corporation considers its stock option, PSU and DSU plans (Note 24). From time to time, the Corporation uses share repurchase programs to achieve its capital management objectives.
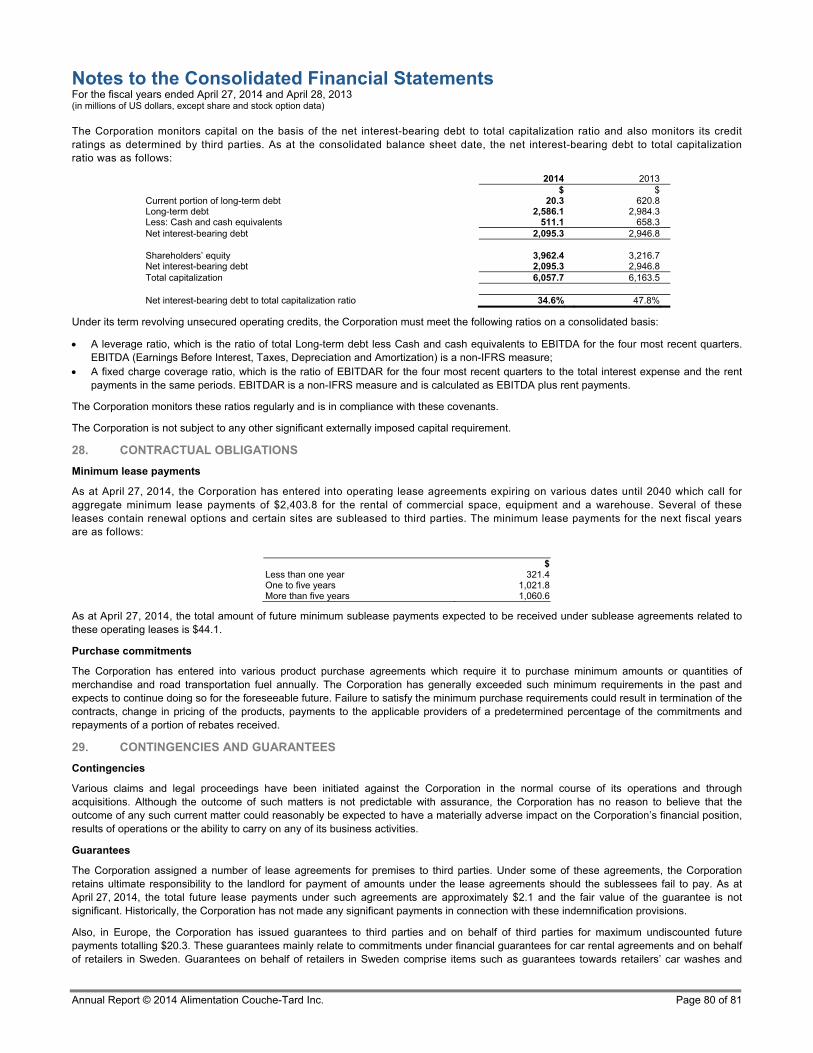
Notes to the Consolidated Financial Statements For the fiscal years ended April 27, 2014 and April 28, 2013 (in millions of US dollars, except share and stock option data)
Annual Report © 2014 Alimentation Couche-Tard Inc. Page 80 of 81
The Corporation monitors capital on the basis of the net interest-bearing debt to total capitalization ratio and also monitors its credit ratings as determined by third parties. As at the consolidated balance sheet date, the net interest-bearing debt to total capitalization ratio was as follows:
2014 2013 $ $Current portion of long-term debt 20.3 620.8Long-term debt 2,586.1 2,984.3Less: Cash and cash equivalents 511.1 658.3Net interest-bearing debt 2,095.3 2,946.8 Shareholders’ equity 3,962.4 3,216.7Net interest-bearing debt 2,095.3 2,946.8Total capitalization 6,057.7 6,163.5 Net interest-bearing debt to total capitalization ratio 34.6% 47.8%
Under its term revolving unsecured operating credits, the Corporation must meet the following ratios on a consolidated basis:
A leverage ratio, which is the ratio of total Long-term debt less Cash and cash equivalents to EBITDA for the four most recent quarters. EBITDA (Earnings Before Interest, Taxes, Depreciation and Amortization) is a non-IFRS measure;
A fixed charge coverage ratio, which is the ratio of EBITDAR for the four most recent quarters to the total interest expense and the rent payments in the same periods. EBITDAR is a non-IFRS measure and is calculated as EBITDA plus rent payments.
The Corporation monitors these ratios regularly and is in compliance with these covenants.
The Corporation is not subject to any other significant externally imposed capital requirement.
28. CONTRACTUAL OBLIGATIONS
Minimum lease payments
As at April 27, 2014, the Corporation has entered into operating lease agreements expiring on various dates until 2040 which call for aggregate minimum lease payments of $2,403.8 for the rental of commercial space, equipment and a warehouse. Several of these leases contain renewal options and certain sites are subleased to third parties. The minimum lease payments for the next fiscal years are as follows:
$Less than one year 321.4One to five years 1,021.8More than five years 1,060.6
As at April 27, 2014, the total amount of future minimum sublease payments expected to be received under sublease agreements related to these operating leases is $44.1.
Purchase commitments
The Corporation has entered into various product purchase agreements which require it to purchase minimum amounts or quantities of merchandise and road transportation fuel annually. The Corporation has generally exceeded such minimum requirements in the past and expects to continue doing so for the foreseeable future. Failure to satisfy the minimum purchase requirements could result in termination of the contracts, change in pricing of the products, payments to the applicable providers of a predetermined percentage of the commitments and repayments of a portion of rebates received.
29. CONTINGENCIES AND GUARANTEES
Contingencies
Various claims and legal proceedings have been initiated against the Corporation in the normal course of its operations and through acquisitions. Although the outcome of such matters is not predictable with assurance, the Corporation has no reason to believe that the outcome of any such current matter could reasonably be expected to have a materially adverse impact on the Corporation’s financial position, results of operations or the ability to carry on any of its business activities.
Guarantees
The Corporation assigned a number of lease agreements for premises to third parties. Under some of these agreements, the Corporation retains ultimate responsibility to the landlord for payment of amounts under the lease agreements should the sublessees fail to pay. As at April 27, 2014, the total future lease payments under such agreements are approximately $2.1 and the fair value of the guarantee is not significant. Historically, the Corporation has not made any significant payments in connection with these indemnification provisions.
Also, in Europe, the Corporation has issued guarantees to third parties and on behalf of third parties for maximum undiscounted future payments totalling $20.3. These guarantees mainly relate to commitments under financial guarantees for car rental agreements and on behalf of retailers in Sweden. Guarantees on behalf of retailers in Sweden comprise items such as guarantees towards retailers’ car washes and

Notes to the Consolidated Financial Statements For the fiscal years ended April 27, 2014 and April 28, 2013 (in millions of US dollars, except share and stock option data)
Annual Report © 2014 Alimentation Couche-Tard Inc. Page 81 of 81
store inventory, in addition to guarantees towards suppliers of electricity and heating. The carrying amount and fair value of the guarantee commitments recognized in the consolidated balance sheet as at April 27, 2014 were not significant.
30. SEGMENTED INFORMATION
The Corporation operates convenience stores in the United States, Europe and Canada. It essentially operates in one reportable segment, the sale of goods for immediate consumption, road transportation fuel and other products mainly through corporate stores and franchise operations. The Corporation operates its convenience store and road transportation fuel retailing chain under several banners, including Circle K, Statoil, Couche-Tard and Mac’s. Revenues from external customers fall mainly into three categories: merchandise and services, road transportation fuel and other.
Information on the principal revenue classes as well as geographic information is as follows:
2014 2013 US Europe Canada Total US Europe Canada Total $ $ $ $ $ $ $ $External customer revenues(a) Merchandise and services 4,818.9 1,046.8 2,081.5 7,947.2 4,548.6 866.1 2,181.7 7,596.4Road transportation fuel 15,493.3 8,824.9 2,890.6 27,208.8 14,872.6 7,537.9 2,860.8 25,271.3Other 14.7 2,784.8 1.1 2,800.6 6.6 2,668.6 0.5 2,675.7 20,326.9 12,656.5 4,973.2 37,956.6 19,427.8 11,072.6 5,043.0 35,543.4 Gross profit Merchandise and services 1,575.8 437.4 689.3 2,702.5 1,505.9 359.6 733.0 2,598.5Road transportation fuel 796.1 928.8 163.5 1,888.4 782.5 719.1 162.6 1,664.2Other 14.7 384.6 1.1 400.4 6.6 339.8 0.5 346.9 2,386.6 1,750.8 853.9 4,991.3 2,295.0 1,418.5 896.1 4,609.6 Total long-term assets(b) 2,862.2 3,769.9 591.2 7,223.3 2,678.3 3,861.0 635.6 7,174.9 (a) Geographic areas are determined according to where the Corporation generates operating income (where the sale takes place) and according to the location of the long-term assets. (b) Excluding financial instruments, deferred tax assets and post-employment benefit assets.
31. SUBSEQUENT EVENTS
Acquisition On June 23, 2014, the Corporation acquired, from Garvin Oil Company, 15 company-operated stores operating in South Carolina, United States. The Corporation owns the land and buildings for all sites. Since the Corporation has not completed its fair value assessment of the assets acquired, the liabilities assumed and goodwill for this transaction, its preliminary purchase price allocation is not presented.
Dividends During its July 7, 2014 meeting, the Corporation’s Board of Directors (the “Board”) declared a dividend of CA$0.04 per share to shareholders on record as at July 16, 2014 and approved its payment for July 30, 2014.
Term revolving unsecured operating credit D On May 16, 2014, the Corporation increased the maximum amount of this credit facility form $1,275.0 to $1,525.0. All other conditions related to this agreement remain unchanged.

Eco-logo certified paper, process chlorine free, 100% post-consumer fiber content, acid-free, manufactured with Biogaz.
www.couche-tard.com