annual report 2014 - · pdf filethe strategy 3 the brand 5 ... oriflame seeks to offer the...
TRANSCRIPT

ANNUAL REPORT
2014
QUICK guide
The Vision 2The Mission 3The Strategy 3The Brand 52014 in Brief 6Financial Overview 8Statement from the CEO 12The Company in brief 16Sustainability 22The Markets 26
Key fi gures, year on year and quarterly 32The Orifl ame share 34Top 10 shareholders 34The share capital and development 35Ownership structure 35Directors’ Report 37Corporate Governance Report 42Report on Internal Control and Monitoring 49Statement from the Board of Directors 51Consolidated fi nancial statement 52 – 56Consolidated income statements 52Consolidated statements of comprehensive income 53Consolidated statements of fi nancial position 54Consolidated statements of changes in equity 55Consolidated statements of cash fl ows 56Notes to the consolidated fi nancial statement 57 – 90Note 1: Status and principal activity 57Note 2: Basis of preparation and summary
of signifi cant accounting policies 57Note 3: Segment reporting 63Note 4: Other income 65Note 5: Employee benefi t expense 65Note 6: Auditor’s remuneration 65Note 7: Research and development 65Note 8: Depreciation and amortisation 66Note 9: Financial income and expenses 66Note 10: Income tax expense 67Note 11: Earnings per share 67Note 12: Property, plant and equipment 68
Note 13: Intangible assets 70Note 14: Investment property 72Note 15: Deferred tax 72Note 16: Inventories 73Note 17: Trade and other receivables 73Note 18: Cash and cash equivalents net
of bank overdrafts 74Note 19: Share capital 74Note 20: Reserves 75Note 21: Interest-bearing loans 75Note 22: Trade and other payables 76Note 23: Equity compensation plans 76Note 24: Related parties 77Note 25: Group companies 78Note 26: Provisions, commitments
and contingent liabilities 80Note 27: Pensions 80Note 28: Financial instruments and
fi nancial risk management 80Note 29: Restructuring and other
non-recurring items 89Note 30: Hyperinfl ation 89Note 31: Accrued expenses 90Note 32: Fire case in India 90Note 33: Disposals of subsidiary 90Note 34: Events subsequent to the reporting date 90Report of the Réviseur d’Entreprises agréé 91Board of Directors 92Global Senior Management Team 94Financial calendar 2015 95Distribution principles of the annual report 95
Statement FROM THE CEO page 12
2014 was a year with increased macro economic challenges in our largest markets, where the sharp devaluation of key currencies negatively affected the business, sales and margins. At the same time 2014 was a very successful year in our key growth areas – showing the benefi ts of being a truly global company.
Magnus Brännström, CEO

In order to ensure a highly competitive business opportunity, additional improvements were made to the Orifl ame Success Plan during the year, primarily in the CIS. The work continues in 2015 with the main focus on Europe.
STRENGTHENING THE BUSINESS OPPORTUNITY
The Wellness Pack Woman took the
as the globally top selling product in Orifl ame in 2014.
A GREAT RESULT!
SUCCESSFUL LAUNCHESThe ONE
True Perfection
The biggest Orifl ame launch ever within the Color Cosmetics category was done in the beginning of the year; the new make-up brand The ONE. The brand was launched at both Stockholm and Moscow fashion weeks and was supported by the introduction of The ONE Collective, a collaboration of both beauty and fashion infl uencers from around the world.
In the Skin Care category, True Perfection, a premium range targeting women above 25 years of age was launched. In Q2 Skin Care launched a complete Orifl ame routine for the premium ranges, the Youth Enhancing Skin Care Routine, promising the most effective clinically proven anti-ageing result by using the full routine. The roll-out was strongly endorsed by the Orifl ame Global Skin Expert Panel.
№1 position
SUCCESSFUL LAUNCHES
1

The VISION To be the No 1 Beauty Company Selling Direct
2

Oriflame’s aim is to increase sales with improved efficiency – driven by the best people in the world. This is, in short, how the largest sales force in the world shall be built. The key to drive sales is to focus on the Company’s primary customer – the Oriflame Consultant – by offering the market’s most competitive opportunity, great customer experience and attractive leadership development. In addition, Oriflame has to continuously develop a strong and customer relevant product portfolio – with reduced complexity, focusing on the core categories Skin Care and Wellness – and an IT-enabled business model.
Furthermore, to reach improved operational efficiency and gross margin improvements, Oriflame shall continue to be cost conscious and capture product cost reduction as well as price increase opportunities where they arise.
The MISSION To fulfil dreams
The STRATEGY To build the largest sales force in the world
3
CO
MPA
NY
OVE
RVIE
W O
RIFL
AME

4

Oriflame’s brand promise Your Dreams – Our Inspiration™ is based on its mission of fulfilling dreams. Dreams of beauty and personal development – in the spirit of its Swedish origins. By nurturing ideas, hopes and dreams, Oriflame seeks to offer the latest beauty solutions for everybody and the most attractive business opportunity for its Consultants.
The BRAND
5
CO
MPA
NY
OVE
RVIE
W O
RIFL
AME

2014IN BRIEFOperational highlights of the year A YEAR OF CHALLENGES – AND POSSIBILITIES
During the year important strategic initiatives were taken, focusing on:• Core product categories – introduction of Skin Care
Routines and Wellness product sets
• Further improvement of Success Plan, primarily in CIS
• Roll-out of a new online platform
• Pricing and gross margin initiatives
• Effi ciency measures
• Sustainability improvements
6

SUCCESS PLAN Orifl ame introduced an improved Success Plan in the CIS region in March 2013 to strengthen loyalty and sales development. A year later, in March 2014, Orifl ame implemented further fi ne-tuning of the plan, with the aim to strengthen the momentum among its Consultants. The Success Plan is a global tool, but with local adaptations to fi t different needs in different markets.
EFFICIENCY MEASURES During the year Orifl ame continued to focus on organisational effi ciency, waste reduction and cost reductions, in both the direct and indirect spend areas. The initiatives have delivered benefi ts throughout the year and Orifl ame will continue to strive to improve its effi ciency.
The factory building at the Noginsk site, Russia, was fi nalised during the year and production started in low scale in the last quarter of 2014. The offi cial opening ceremony took place in February 2015. As a natural consequence of the production start in the new factory, Orifl ame sold the manufacturing sites in Ekerö, Sweden, and in Krasnogorsk, Russia and will consolidate the production in the new factory.
The fi rst commercial production in the new Wellness factory in Rorkee, India, started in December 2014.
ONLINE DEVELOPMENT A new digital platform was implemented in several markets during the year and is planned to reach full coverage during 2015. The platform will help harmonising cross-channel communication, support brand alignment and user experience for Consultants and customers visiting Orifl ame sites, and also optimising mobile access of Orifl ame’s online services. A new mobile application was also launched globally to top Consultants to assist business results and leadership development.
ORGANISATIONTo support the implementation of Orifl ame’s strategy and initiatives a new Group Management team was appointed during the year. The team covers the following responsibilities; CEO & President, Deputy CEO, CFO, Product Range and R&D, Human Resources, Global Operations, Commercial Marketing and Brand & Communication, Global Business Area CIS, Global Business Area Turkey, Africa and Asia, Global Direct Sales and Sustainability & Quality.
NEW CHAIRMAN OF THE BOARDAlexander af Jochnick was elected to serve as new Chairman of the Board at the Annual General Meeting on May 19 2014. Alexander has been a member of the Board since 2007 and he is member of the Remuneration Committee, the Audit Committee and the Nomination Committee. He was an employee of the company during 1999-2007. Robert af Jochnick, one of the founders and former Chairman of the Board, remains as member of the Board. Further information about the Board of Directors on page 92-93.
consolidate the production in the new factory.
The fi rst commercial production in the new Wellness factory in Rorkee, India, started in December 2014.
7
CO
MPA
NY
OVE
RVIE
W O
RIFL
AME

• Geopolitical instability in Russia and Ukraine.
• Sharply devaluating currencies.
• Latin America, Turkey, Africa & Asia delivering strong sales growth and increasing their importance for the Group.
LONG-TERM FINANCIAL TARGETS• Orifl ame Cosmetics aims to achieve local currency
sales growth of approximately 10 percent per annum and an operating margin of 15 percent.
2014 – a year of exceptional external challenges and strong development in key growth markets
2014FINANCIAL overview
8

KEY fi gures
1) Adjusted for non-recurring items of €3.1m.2) Adjusted for non-recurring items of €5.8m.3) Adjusted for additional non-recurring tax items of €6.4m.4) Net interest-bearing debt includes US Loan fair value. The net interest-bearing
debt at hedged values would be €196.8m (2014) and €263.3m (2013).
€ million unless stated otherwise 1) 2014 2) 2013Sales 1,265.8 1,406.7Gross profi t 866.4 986.4Gross margin, % 68.4 70.1EBITDA 122.9 166.5Operating profi t 94.7 136.6Operating margin, % 7.5 9.7Adjusted operating profi t 97.8 142.4Adjusted operating margin, % 7.7 10.1Net profi t 37.5 78.6Adjusted net profi t 3) 47.0 84.4Return on capital employed, ROCE, % 19.9 25.4Return on operating capital, % 21.8 29.8Cash fl ow from operating activities 90.0 112.1Cash fl ow from operating activities, per share, € 1.62 2.02Equity/assets ratio, % 20.2 21.9Net interest-bearing debt 4) 245.4 4) 275.9Net interest-bearing debt / EBITDA 1.6 1.6Interest cover 5.4 7.6Adjusted earnings per share, diluted, € 3) 0.84 2) 1.52Active Consultants (‘000) 3,473 3,460Sales per active consultants, € 362.4 404.0Average number of full-time equivalent employees 7,039 7,340
1) 2014 Sales 1,265.8 1,406.7Gross profi t 866.4 986.4Gross margin, % 68.4 70.1EBITDA 122.9 166.5Operating profi t 94.7 136.6Operating margin, % 7.5 9.7Adjusted operating profi t 97.8 142.4Adjusted operating margin, % 7.7 10.1Net profi t 37.5 78.6
3) 47.0 84.4Return on capital employed, ROCE, % 19.9 25.4Return on operating capital, % 21.8 29.8Cash fl ow from operating activities 90.0 112.1Cash fl ow from operating activities, per share, € 1.62 2.02Equity/assets ratio, % 20.2 21.9
4) 245.4 Net interest-bearing debt / EBITDA 1.6 1.6Interest cover 5.4 7.6
3) 0.84 Active Consultants (‘000) 3,473 3,460Sales per active consultants, € 362.4 404.0Average number of full-time equivalent employees 7,039 7,340
9
CO
MPA
NY
OVE
RVIE
W O
RIFL
AME
FINANCIAL ACHIEVEMENTS 2014• Local currency sales increased by 1% and Euro
sales decreased by 10% to €1,265.8m (€1,406.7m).
• EBITDA amounted to €122.9m (€166.5m).
• Adjusted* operating margin was 7.7% (10.1%), negatively impacted by approximately 350 bps from currency movements, resulting in an adjusted* operating profi t of €97.8m (€142.4m). Operating margin was 7.5% (9.7%) and operating profi t €94.7 (€136.6).
• Adjusted** net profi t amounted to €47.0m (€84.4m) and adjusted** EPS amounted to €0.84 (€1.52). Net profi t was €37.5 m (€78.6) and EPS €0.67 (€1.41).
• Cash fl ow from operating activities amounted to €90.0m (€112.1m).
• The Board of Directors will continue to prioritise reducing the debt during the forthcoming quarters. As a consequence, the Board of Directors will not seek a mandate for distribution of dividend during the forthcoming four quarters (quarter 2 2015 up until quarter 1 2016).
* Adjusted for restructuring costs of €4.2m, gain from sale of manufacturing assets of €9.2m and VAT cost related to the Russian tax claim of €8.1m for the full- year 2014 and restructuring costs of €5.8m for the full-year 2013.
** Adjusted for tax costs from the Russian tax claim of €6.4m
FINANCIAL ACHIEVEMENTS 2014
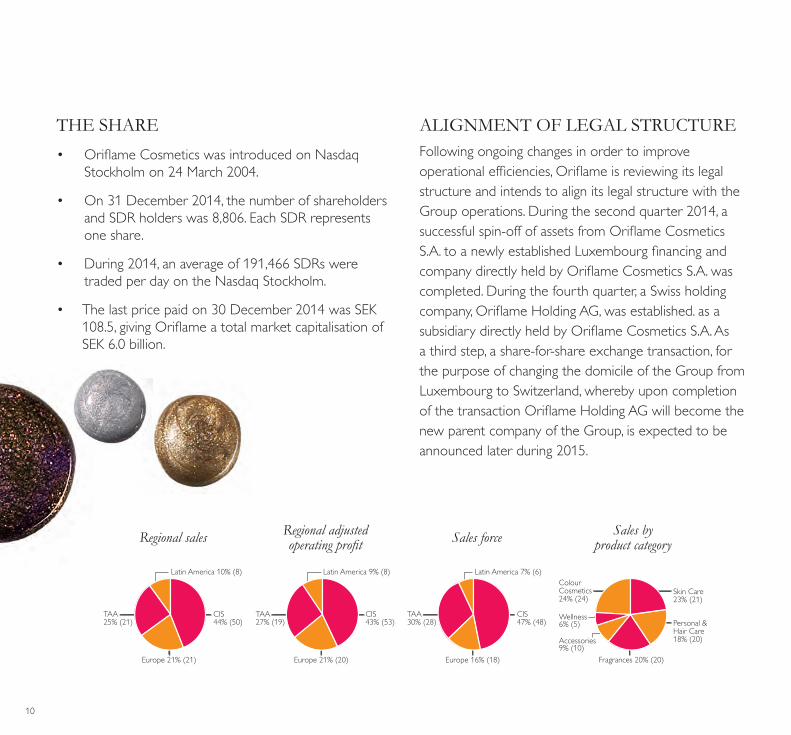
THE SHARE• Orifl ame Cosmetics was introduced on Nasdaq
Stockholm on 24 March 2004.
• On 31 December 2014, the number of shareholders and SDR holders was 8,806. Each SDR represents one share.
• During 2014, an average of 191,466 SDRs were traded per day on the Nasdaq Stockholm.
• The last price paid on 30 December 2014 was SEK 108.5, giving Orifl ame a total market capitalisation of SEK 6.0 billion.
ALIGNMENT OF LEGAL STRUCTUREFollowing ongoing changes in order to improve operational effi ciencies, Orifl ame is reviewing its legal structure and intends to align its legal structure with the Group operations. During the second quarter 2014, a successful spin-off of assets from Orifl ame Cosmetics S.A. to a newly established Luxembourg fi nancing and company directly held by Orifl ame Cosmetics S.A. was completed. During the fourth quarter, a Swiss holding company, Orifl ame Holding AG, was established. as a subsidiary directly held by Orifl ame Cosmetics S.A. As a third step, a share-for-share exchange transaction, for the purpose of changing the domicile of the Group from Luxembourg to Switzerland, whereby upon completion of the transaction Orifl ame Holding AG will become the new parent company of the Group, is expected to be announced later during 2015.
Regional sales Sales forceRegional adjusted operating profi t
Sales by product category
CIS 44% (50)
Regional sales 2014
Latin America 10% (8)
TAA 25% (21)
Europe 21% (21)
CIS 43% (53)
Regional adjusted operating profit 2014
Latin America 9% (8)
TAA 27% (19)
Europe 21% (20)
CIS 47% (48)
Sales force 2014
Latin America 7% (6)
TAA 30% (28)
Europe 16% (18)
Skin Care 23% (21)
Sales by product category 2014
Accessories 9% (10)
Wellness 6% (5)
ColourCosmetics24% (24)
Fragrances 20% (20)
Personal & Hair Care 18% (20)
10
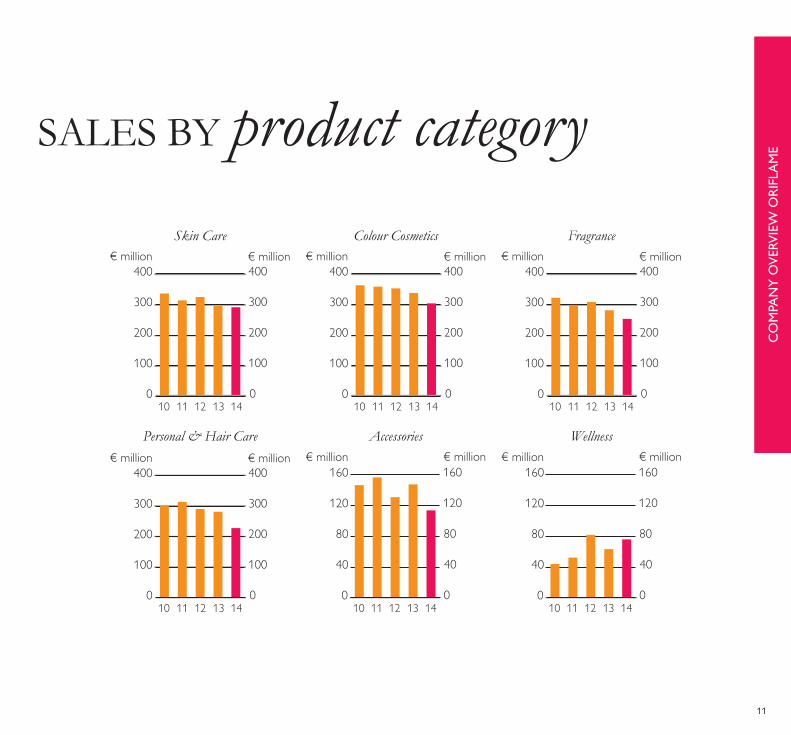
SALES BY product category
Personal & Hair Care Accessories Wellness€ million
0
100
200
300
400
0
100
200
300
400€ million
10 11 12 13 140
40
80
120
160
0
40
80
120
160€ million € million
10 11 12 13 140
40
80
120
160
0
40
80
120
160€ million € million
10 11 12 13 14
Skin Care Colour Cosmetics Fragrance€ million
0
100
200
300
400
0
100
200
300
400€ million
10 11 12 13 14
€ million
0
100
200
300
400
0
100
200
300
400€ million
10 11 12 13 14
€ million
0
100
200
300
400
0
100
200
300
400€ million
10 11 12 13 14
11
CO
MPA
NY
OVE
RVIE
W O
RIFL
AME
11
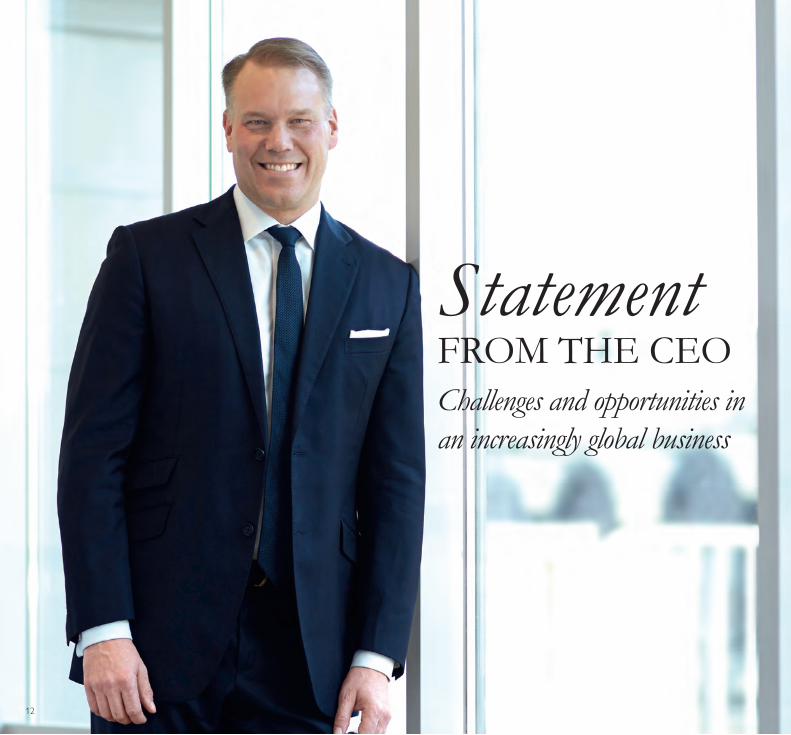
Statement FROM THE CEOChallenges and opportunities in an increasingly global business
12

Being a truly global company has its advantages; when facing tough conditions in certain parts of the operations, the situation is bright somewhere else. For Oriflame, 2014 was distinguished by a number of challenges: the geopolitical instability in our key markets Russia and Ukraine – and the sharp devaluation of their currencies – negatively impacted the business, sales and margins. At the same time, 2014 was a very successful year in other parts of the world. We noted very strong growth in Turkey, Africa & Asia, and we continued to strengthen our position in Latin America.
From an operational perspective, we implemented many important measures to strengthen our position. Our focus has been on driving sales by, for example, strengthening our offer in the Skin Care and Wellness categories, making further improvements to the Success Plan and rolling out a new online platform – Oriflame Beauty Destination. In financial terms, 2014 was a challenging year and the outcome was marginal sales growth in local currencies and, given the strong currency headwinds, a decline of 10 percent in euro sales – with margins under pressure. We are consistent in our efforts to compensate the negative exchange rate movements by price increases and cost-saving initiatives - reviewing how we can work more efficiently in all areas of operations.
Driving salesOriflame is essentially a growth-oriented company and we expect to see growth in all of our markets over time.
While we aim for solid growth in our more mature markets, we believe that the largest potential comes from what we refer to as high-growth regions. Turkey, Africa & Asia and Latin America continued to perform strongly, in terms of both sales and margins. In 2014, these markets accounted for just around 35 percent of total regional sales and regional operating profit.
A critical growth initiative is the improved Success Plan that we launched in CIS in spring 2013, and which was fine-tuned and rolled out in other parts of the world during 2014. It aims to improve our competitiveness and secure our consultants’ income opportunities by offering even better incentives. The implemented improvements are showing positive results in many markets, while some work remains to be done before we have reversed the trend in others, particularly in Europe.
13
CO
MPA
NY
OVE
RVIE
W O
RIFL
AME
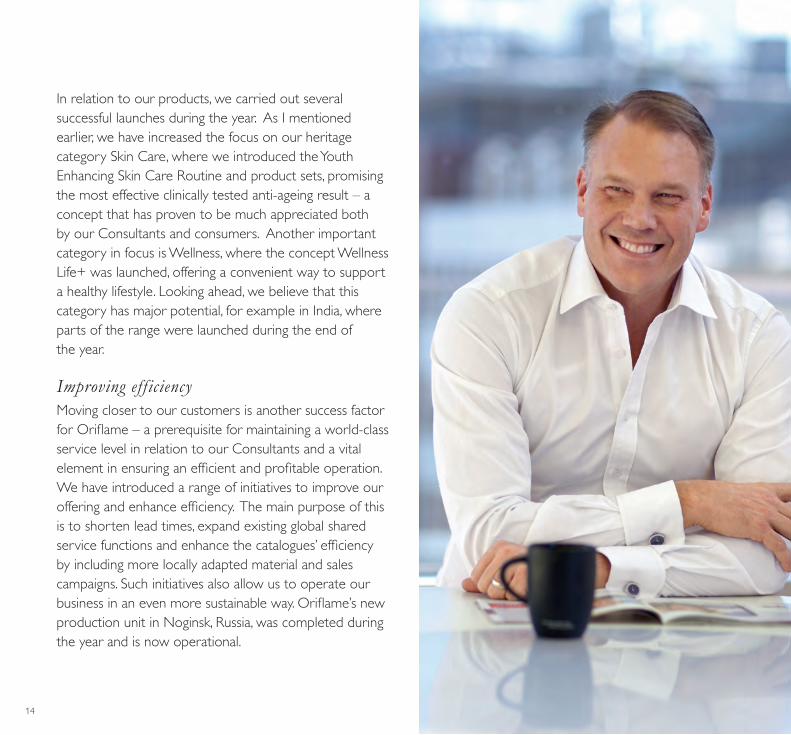
In relation to our products, we carried out several successful launches during the year. As I mentioned earlier, we have increased the focus on our heritage category Skin Care, where we introduced the Youth Enhancing Skin Care Routine and product sets, promising the most effective clinically tested anti-ageing result – a concept that has proven to be much appreciated both by our Consultants and consumers. Another important category in focus is Wellness, where the concept Wellness Life+ was launched, offering a convenient way to support a healthy lifestyle. Looking ahead, we believe that this category has major potential, for example in India, where parts of the range were launched during the end of the year.
Improving eff iciencyMoving closer to our customers is another success factor for Oriflame – a prerequisite for maintaining a world-class service level in relation to our Consultants and a vital element in ensuring an efficient and profitable operation. We have introduced a range of initiatives to improve our offering and enhance efficiency. The main purpose of this is to shorten lead times, expand existing global shared service functions and enhance the catalogues’ efficiency by including more locally adapted material and sales campaigns. Such initiatives also allow us to operate our business in an even more sustainable way. Oriflame’s new production unit in Noginsk, Russia, was completed during the year and is now operational.
14
We have entered a new year with the ambition to leverage the strong momentum in our high-growth markets and to improve the development in our more mature markets. Oriflame has an attractive offering that is evolving over time and a geographical footprint that enables long-term profitable growth. We have a strong brand, a highly competitive beauty and business offer and a proven business model – both offline and online. And we have a clear strategic direction for the coming five years; to focus our efforts on business critical activities and to simplify the way we work by reducing complexity and driving profitability.
Magnus Brännström, CEO
The environmental-friendly distribution center, which is part of the facility, is LEED certified, being the largest industrial site with such a certification level in Russia.
The completion of Noginsk has enabled us to divest two production facilities located in Sweden and Russia. The Wellness manufacturing facility in Roorkee, India, became operational at the end of the year.
With a business model that is based on social selling, a clear digital strategy is key to success. During the year, we rolled out a new online platform – the Oriflame Beauty Destination – and the total share of orders placed online is consistently more than 90 percent. Oriflame currently has 6 million followers on its Facebook pages and 56 million site visitors annually.
One Oriflame – One TeamTo summarise, I feel confident that we will overcome the challenges we faceand I am very proud of the togetherness, spirit and passion that exist in and around the Company. I am therefore happy to take this opportunity to thank all of our employees, Consultants, partners and shareholders for the past year – for your loyalty and dedication. On behalf of the Company, I would also like to thank the founding family for their great support during the year and to congratulate Alexander af Jochnick as the new Chairman of the Board.
15
CO
MPA
NY
OVE
RVIE
W O
RIFL
AME

YOUR DREAMS – OUR INSPIRATION™
2014THE COMPANYin brief
The combination of an attractive beauty offering, an easily accessible business opportunity and an organisation of passionate people create the foundation for fulfilling dreams - The mission of Oriflame.
16
THE BUSINESSmodel
THE HISTORYin brief
Through its unique business concept – Make Money Today and Fulfi l Your Dreams Tomorrow™ – Orifl ame offers a leading business opportunity. People can start making or saving money the day they join and work towards fulfi lling their personal dreams and ambitions as they develop their business. A sales force of over 3 million independent Orifl ame Consultants has seized this opportunity and is consuming or marketing Orifl ame’s extensive portfolio of beauty products, creating combined annual net sales of around €1.3 billion.
The basis for Orifl ame has always been social selling. The business model is evolving and is today to a large extent an online model with a digital strategy aiming to support the overall vision of becoming the number one direct selling beauty company. As demand for online availability increases, the Orifl ame Consultants are provided with new, effi cient tools to enable them to conduct their business activities in an effi cient way. Moreover, the digital arena provides an increasingly important branding channel. Today 90 percent of the Consultants are active online and over 90 percent of all orders are placed online.
Orifl ame was founded in Sweden in 1967 by the brothers Jonas and Robert af Jochnick and Bengt Hellsten. They wanted to give people the opportunity to benefi t from good skin care and attractive cosmetics through products inspired by the natural beauty associated with Sweden. Rather than investing in a chain of stores, they decided to move the retail operations into the homes of Swedish consumers. For over 45 years, Orifl ame has remained true to its original concept of beauty products inspired by Swedish nature and an entrepreneurial spirit. Today, Orifl ame is a global beauty company selling direct in more than 60 markets.
17
CO
MPA
NY
OVE
RVIE
W O
RIFL
AME

THE MARKET entries
1989
Chile
1967
SwedenDenmark
1968
Finland
1969
Norway
1970
UK
1972
Netherlands
1978
Spain
1985
Portugal
1986
Indonesia
1993
UkraineSlovakiaGreece
1990
Czechoslovakia
1991
PolandHungaryMexico
1992
RussiaTurkeyLatvia
1994
Bulgaria
1995
PeruLithuaniaRomania
1996
MacedoniaEcuadorCroatiaIndia
1997
EstoniaMoroccoEgyptSloveniaSri Lanka
1998
AzerbaijanColombiaBosnia
2000
KazakhstanThailandGeorgia
2001
Serbia &Montenegro
2002
Mongolia
2003
ArmeniaMoldovaVietnam
2005
Belarus
2006
China
2008
PakistanKosovoKyrgyzstan
2011
Algeria
2012
KenyaUganda Tanzania
2013
Tunisia Nigeria Myanmar
18

Orifl ame’s product offering builds on more than four decades of skin care and cosmetics expertise – combining innovation and inspiration from nature. The company provides a broad range of high-quality products for everyday use at affordable prices, following the main principles for its product offering:
• High purity ingredients and strict manufacturing standards
• Assured product performance at value for money
• High ethical standards and stringent environmental policies
Orifl ame offers products in six categories – Skin Care, Colour Cosmetics, Fragrance, Personal & Hair Care, Accessories and Wellness.
THE PRODUCToffering
19
CO
MPA
NY
OVE
RVIE
W O
RIFL
AME

20

Around 500 million units are sourced annually from about 60 suppliers and shipped to Oriflame’s markets worldwide. Oriflame manufactures around 50 percent of its cosmetics product volumes in-house and aims to increase this share over time. Oriflame’s global operations focuses on cutting lead times and increasing flexibility in the end-to-end supply chain by consolidating inventories in Group Distribution Centres closer to main markets and eliminating intermediate warehouses.
The SUPPLY CHAIN
21
CO
MPA
NY
OVE
RVIE
W O
RIFL
AME

As an inseparable part of its future success, Orifl ame is integrating sustainability throughout its operational framework and business strategies. In order to expand and deepen its work on sustainability, Orifl ame adopted a new comprehensive sustainability strategy in 2013, with a broad set of commitments covering product development, social issues and environmentally focused targets. The new strategy is based on a materiality assessment and focuses on areas with the greatest relevance for Orifl ame, and where initiatives can have the most impact. For each of the three key areas, Orifl ame has set a range of commitments and time-bound targets designed to improve performance and move the Company closer to its long-term vision of becoming sustainable.
Sustainability
22

1. Successful PeopleA cornerstone in Orifl ame’s operations is, and has always been, to create opportunities to improve people’s lives – for consultants and customers, employees and suppliers, but also in a broader sense by its community involvement and support for social causes.
2. Great ProductsContinuously improving the sustainability profi le of product ranges is part of Orifl ame’s strategy to bring beauty and wellbeing in a responsible way. Orifl ame’s goal is to continue developing products that meet the highest social, ethical and environmental standards.
3. Thriving PlanetDriving environmental sustainability, not only across Orifl ame’s own activities but throughout the value chain, is a key long term goal. Focus areas include the sourcing of renewable and sustainable materials whenever possible, reduction of emissions to air and water, and reducing the amount of waste produced.
Sustainability has a permanent place on the management agenda where targets and commitments are regularly followed-up and reviewed. Whilst progress is being made, Orifl ame recognises that this is a continual journey – there is still much more to be done and new challenges lie ahead. The Company’s full Sustainability Report will be published on the orifl ame.com site later during the year.
23
CO
MPA
NY
OVE
RVIE
W O
RIFL
AME

24 24

Orifl ame sustainability work continued to gain recognition from external stakeholders in 2014.
• In May, the Orifl ame Ecobeauty cross-category range was given the prestigious 2014 Eco Beauty Award at the CEW Beauty Awards (Cosmetic Executive Women), for being the fi rst range of its kind in the industry focusing on sustainability in each step of the production process.
• In May, Orifl ame was presented with the “Sustainable Standard Setter” award from the Rainforest Alliance.
• In September, the LEED certifi ed Noginsk Distribution Center was nominated as a fi nalist in the 2014 “Best of Buildings Awards” presented by the U.S. Green Building Council.
• In October, Orifl ame was recognised as a leader for corporate action on climate change for its actions to reduce carbon emissions by being awarded with a position on the “A List”: “The CDP Climate Performance Leadership Index 2014”.
SustainabilityACHIEVEMENTS AND AWARDS
The index presents 187 listed companies identifi ed as demonstrating a superior approach to climate change mitigation.
• A research publication by Orifl ame’s Skin Research Institute was awarded winner of 2014’s “Best Paper” by the International Journal of Cosmetic Science.
25
CO
MPA
NY
OVE
RVIE
W O
RIFL
AME

2014markets
26

CISArmenia, Azerbaijan, Belarus, Georgia, Kazakhstan, Kyrgyzstan, Moldova, Mongolia, Russia, Ukraine
2014 development in brief• Local currency sales decreased by 4%
• Active consultants decreased by 1% to 1.6 million Oriflame Consultants
• Sales in the region’s largest market Russia decreased by 1% in local currency
• Adjusted operating margin was 12.2%
The region faced several macro-economic and geopolitical challenges during the year, with sharp devaluations of some of Oriflame’s key currencies. The Success Plan was further strengthened during the year and started to deliver results with improved leadership and sales development.
OPERATIONS ProductionKRASNAGORSK, RUSSIA – Global factory supplying all regions. Lipsticks and Lipglosses. Divested in November 2014.NOGINSK, RUSSIA – Global factory supplying all regions. Shampoos, deodorants, liquid soaps, lipsticks and other cosmetic products. Officially opened in February 2015.
Group Distribution CentresKIEV, UKRAINE – Serving the Ukrainian market.Noginsk, Russia – Serving primarily the Russian market.
Offices Regional office in Moscow, Russia.
Catalogue creation and printingCIS catalogue created in Russia. Russia and CIS markets printed in Ukraine.
Active consultants
Active consultants 2014
CIS 47%
Operating profit
Operating profit 2014
CIS 43%
Sales
CIS 44%
Regional sales 2014
27
CO
MPA
NY
OVE
RVIE
W O
RIFL
AME
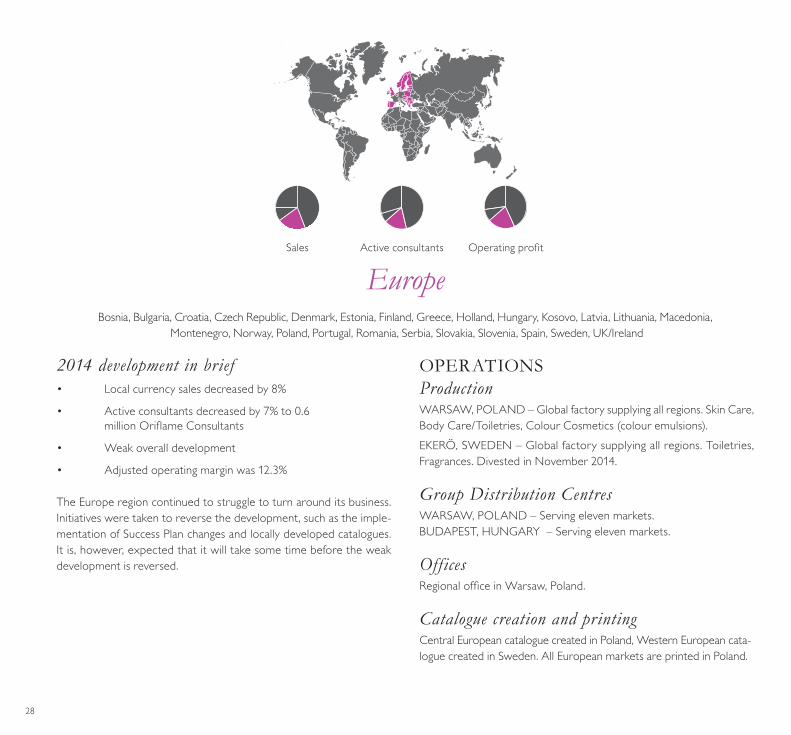
Europe Bosnia, Bulgaria, Croatia, Czech Republic, Denmark, Estonia, Finland, Greece, Holland, Hungary, Kosovo, Latvia, Lithuania, Macedonia,
Montenegro, Norway, Poland, Portugal, Romania, Serbia, Slovakia, Slovenia, Spain, Sweden, UK/Ireland
2014 development in brief• Local currency sales decreased by 8%
• Active consultants decreased by 7% to 0.6 million Oriflame Consultants
• Weak overall development
• Adjusted operating margin was 12.3%
The Europe region continued to struggle to turn around its business. Initiatives were taken to reverse the development, such as the imple-mentation of Success Plan changes and locally developed catalogues. It is, however, expected that it will take some time before the weak development is reversed.
OPERATIONS ProductionWARSAW, POLAND – Global factory supplying all regions. Skin Care, Body Care/Toiletries, Colour Cosmetics (colour emulsions).EKERÖ, SWEDEN – Global factory supplying all regions. Toiletries, Fragrances. Divested in November 2014.
Group Distribution CentresWARSAW, POLAND – Serving eleven markets.BUDAPEST, HUNGARY – Serving eleven markets.
Offices Regional office in Warsaw, Poland.
Catalogue creation and printingCentral European catalogue created in Poland, Western European cata-logue created in Sweden. All European markets are printed in Poland.
Sales Active consultants Operating profitEurope 21%
Regional sales 2014 Active consultants 2014
Europe 17%
Operating profit 2014
Europe 21%
28

Latin America Chile, Colombia, Ecuador, Mexico, Peru
2014 development in brief• Local currency sales increased by 12%
• Active consultants increased by 4% to 0.2 million Oriflame Consultants
• Continued strong sales growth particularly in Mexico and Colombia while Ecuador was impacted by import restrictions
• Adjusted operating margin was 12.0%
The positive momentum continued in Latin America during the year, especially in the largest markets Mexico and Colombia, driven by an increase in active consultants as well as improved productivity. Import restrictions in Ecuador affected sales in the market negatively.
OPERATIONS Offices The regional office in Santiago, Chile, is being relocated to Mexico City, Mexico, during mid 2015.
Catalogue creation and printingCreated and printed in Chile for all Latin American markets.
Sales Active consultants Operating profit
LA 10%
Regional sales 2014 Active consultants 2014
LA 7%
Operating profit 2014
LA 9%
29
CO
MPA
NY
OVE
RVIE
W O
RIFL
AME

Turkey, Africa & Asia Algeria, China, Egypt, India, Indonesia, Kenya, Morocco, Myanmar, Nigeria, Pakistan, Sri Lanka, Tanzania,
Thailand, Tunisia, Turkey, Uganda, Vietnam
2014 development in brief• Local currency sales increased by 18%
• Active consultants increased by 7% to 1.0 million Oriflame Consultants
• Strong sales growth especially in China as well as Indonesia, India and Africa
• Adjusted operating margin was 13.4%
Overall strong sales development and higher operating margin. The development in China was sequentially improved during the year, driven by sales of Skin Care routines and Wellness products. Indo-nesia remained strong largely driven by active online leaders. Parts of the Wellness range were pre-launched in India during the end of the year with promising results. Direct sales started in Nigeria during the third quarter.
OPERATIONS ProductionNOIDA, INDIA – Skin Care, Body Care/ Toiletries, Colour Cosmetics.KUNSHAN AND BEIJING, CHINA – Skin Care, Body Care/Toiletries, Colour Cosmetics, Wellness. RORKEE, INDIA – Wellness. Production started in December.
Offices Regional office in Bangkok, Thailand and Delhi, India.
Catalogue creation and printingTurkish catalogue created in Turkey. Asian catalogue created in Thailand. African catalogue created in Poland. Turkey and the majority of the Asian and African markets are printed locally in each market.
Sales Active consultants Operating profit
Turkey, Africa& Asia 25%
Regional sales 2014 Active consultants 2014
Turkey, Africa& Asia 30%
Operating profit 2014
Turkey, Africa& Asia 27%
30

Group Oriflame is currently present in more than 60 markets, including markets operated by franchisees
2014 development in brief• Local currency sales increased by 1%
• Active consultants amounted to 3.5 million Oriflame Consultants
• Adjusted operating margin was 7.7%
2014 was a year of mixed development in the different regions – with continued challenges in many parts of CIS and Europe while strong development in Latin America, Turkey, Africa and Asia. Efficiency mea-sures and price and mix improvements continued to deliver under- lying margin improvement however overshadowed by strong currency headwind and lack of leverage on overhead costs.
OPERATIONS ProductionEight production facilities in five countries of which two divested during the year.
Group Distribution CentresFour Group Distribution Centres in four countries
Offices Corporate Offices in Schaffhausen and Fribourg, Switzerland and in Luxembourg. Group Support Offices in Dublin, Ireland; Prague, Czech Republic; Stockholm, Sweden, and Warsaw, Poland.IT, finance and HR Service Centers in New Delhi, India; Mexico City, Mexico; Olomouc, Czech Republic; Voronezh, Russia and Warsaw, Poland.
Sales Active consultants Operating profit
Regional sales 2014 Active consultants 2014 Operating profit 2014
31
CO
MPA
NY
OVE
RVIE
W O
RIFL
AME
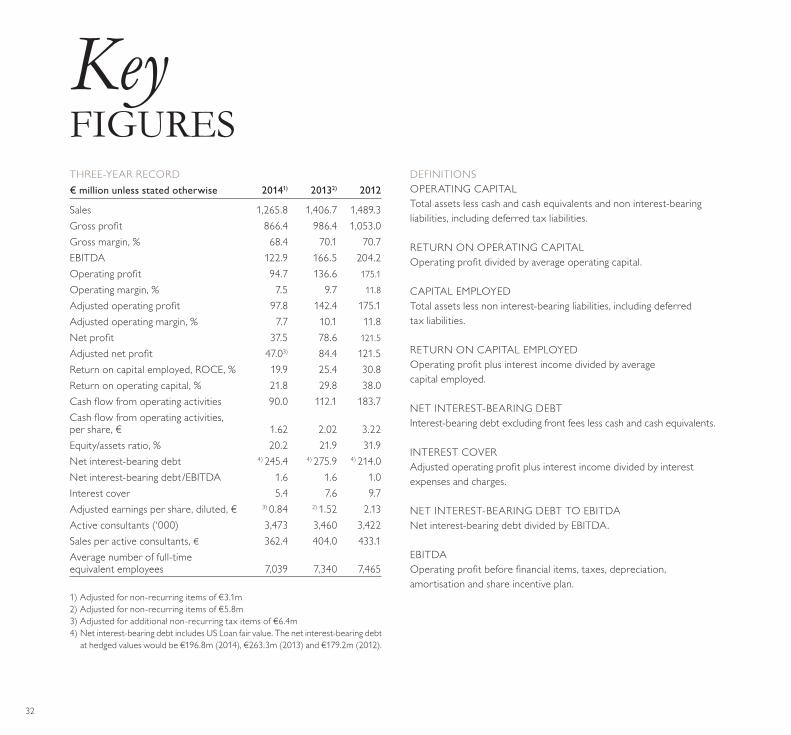
Key FIGURESTHREE-YEAR RECORD€ million unless stated otherwise 20141) 20132) 2012
Sales 1,265.8 1,406.7 1,489.3Gross profit 866.4 986.4 1,053.0Gross margin, % 68.4 70.1 70.7EBITDA 122.9 166.5 204.2Operating profit 94.7 136.6 175.1
Operating margin, % 7.5 9.7 11.8
Adjusted operating profit 97.8 142.4 175.1Adjusted operating margin, % 7.7 10.1 11.8Net profit 37.5 78.6 121.5
Adjusted net profit 47.03) 84.4 121.5Return on capital employed, ROCE, % 19.9 25.4 30.8Return on operating capital, % 21.8 29.8 38.0Cash flow from operating activities 90.0 112.1 183.7Cash flow from operating activities, per share, € 1.62 2.02 3.22Equity/assets ratio, % 20.2 21.9 31.9Net interest-bearing debt 4) 245.4 4) 275.9 4) 214.0Net interest-bearing debt /EBITDA 1.6 1.6 1.0Interest cover 5.4 7.6 9.7Adjusted earnings per share, diluted, € 3) 0.84 2) 1.52 2.13Active consultants (‘000) 3,473 3,460 3,422Sales per active consultants, € 362.4 404.0 433.1Average number of full-time equivalent employees 7,039 7,340 7,465
1) Adjusted for non-recurring items of €3.1m2) Adjusted for non-recurring items of €5.8m3) Adjusted for additional non-recurring tax items of €6.4m4) Net interest-bearing debt includes US Loan fair value. The net interest-bearing debt
at hedged values would be €196.8m (2014), €263.3m (2013) and €179.2m (2012).
DEFINITIONSOPERATING CAPITAL Total assets less cash and cash equivalents and non interest-bearing liabilities, including deferred tax liabilities.
RETURN ON OPERATING CAPITAL Operating profit divided by average operating capital.
CAPITAL EMPLOYED Total assets less non interest-bearing liabilities, including deferred tax liabilities.
RETURN ON CAPITAL EMPLOYED Operating profit plus interest income divided by average capital employed. NET INTEREST-BEARING DEBT Interest-bearing debt excluding front fees less cash and cash equivalents.
INTEREST COVER Adjusted operating profit plus interest income divided by interest expenses and charges.
NET INTEREST-BEARING DEBT TO EBITDA Net interest-bearing debt divided by EBITDA.
EBITDA Operating profit before financial items, taxes, depreciation, amortisation and share incentive plan.
32
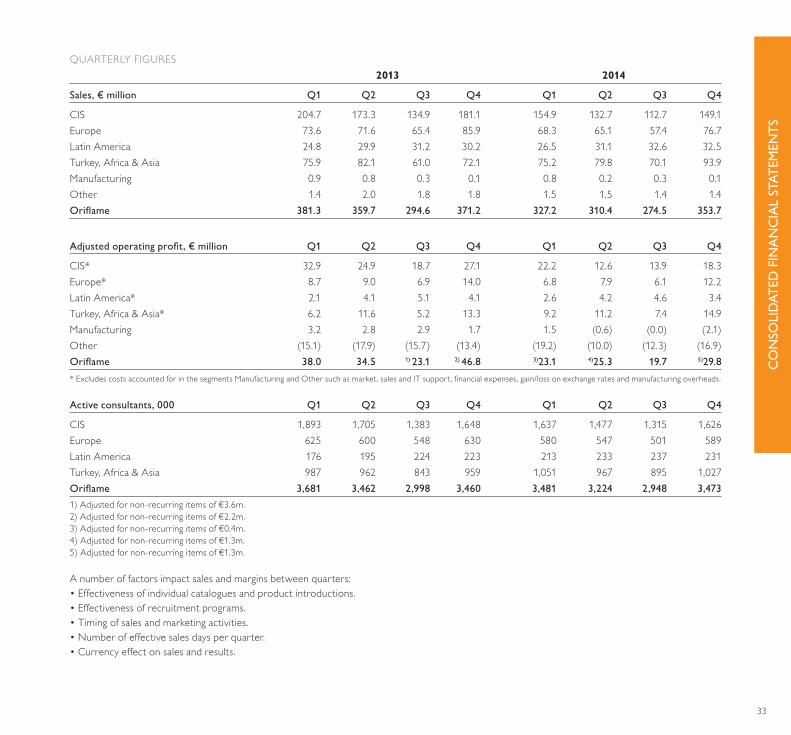
QUARTERLY FIGURES 2013 2014
Sales, € million Q1 Q2 Q3 Q4 Q1 Q2 Q3 Q4
CIS 204.7 173.3 134.9 181.1 154.9 132.7 112.7 149.1Europe 73.6 71.6 65.4 85.9 68.3 65.1 57.4 76.7Latin America 24.8 29.9 31.2 30.2 26.5 31.1 32.6 32.5Turkey, Africa & Asia 75.9 82.1 61.0 72.1 75.2 79.8 70.1 93.9Manufacturing 0.9 0.8 0.3 0.1 0.8 0.2 0.3 0.1Other 1.4 2.0 1.8 1.8 1.5 1.5 1.4 1.4Oriflame 381.3 359.7 294.6 371.2 327.2 310.4 274.5 353.7
Adjustedoperatingprofit,€million Q1 Q2 Q3 Q4 Q1 Q2 Q3 Q4
CIS* 32.9 24.9 18.7 27.1 22.2 12.6 13.9 18.3Europe* 8.7 9.0 6.9 14.0 6.8 7.9 6.1 12.2Latin America* 2.1 4.1 5.1 4.1 2.6 4.2 4.6 3.4Turkey, Africa & Asia* 6.2 11.6 5.2 13.3 9.2 11.2 7.4 14.9Manufacturing 3.2 2.8 2.9 1.7 1.5 (0.6) (0.0) (2.1)Other (15.1) (17.9) (15.7) (13.4) (19.2) (10.0) (12.3) (16.9)Oriflame 38.0 34.5 1) 23.1 2) 46.8 3)23.1 4)25.3 19.7 5)29.8
Activeconsultants,000 Q1 Q2 Q3 Q4 Q1 Q2 Q3 Q4
CIS 1,893 1,705 1,383 1,648 1,637 1,477 1,315 1,626Europe 625 600 548 630 580 547 501 589Latin America 176 195 224 223 213 233 237 231Turkey, Africa & Asia 987 962 843 959 1,051 967 895 1,027Oriflame 3,681 3,462 2,998 3,460 3,481 3,224 2,948 3,4731) Adjusted for non-recurring items of €3.6m.2) Adjusted for non-recurring items of €2.2m.3) Adjusted for non-recurring items of €0.4m.4) Adjusted for non-recurring items of €1.3m.5) Adjusted for non-recurring items of €1.3m.
A number of factors impact sales and margins between quarters:• Effectiveness of individual catalogues and product introductions.• Effectiveness of recruitment programs.• Timing of sales and marketing activities.• Number of effective sales days per quarter.• Currency effect on sales and results.
* Excludes costs accounted for in the segments Manufacturing and Other such as market, sales and IT support, financial expenses, gain/loss on exchange rates and manufacturing overheads.
33
CO
NSO
LID
ATED
FIN
ANC
IAL
STAT
EMEN
TS
2 column grid
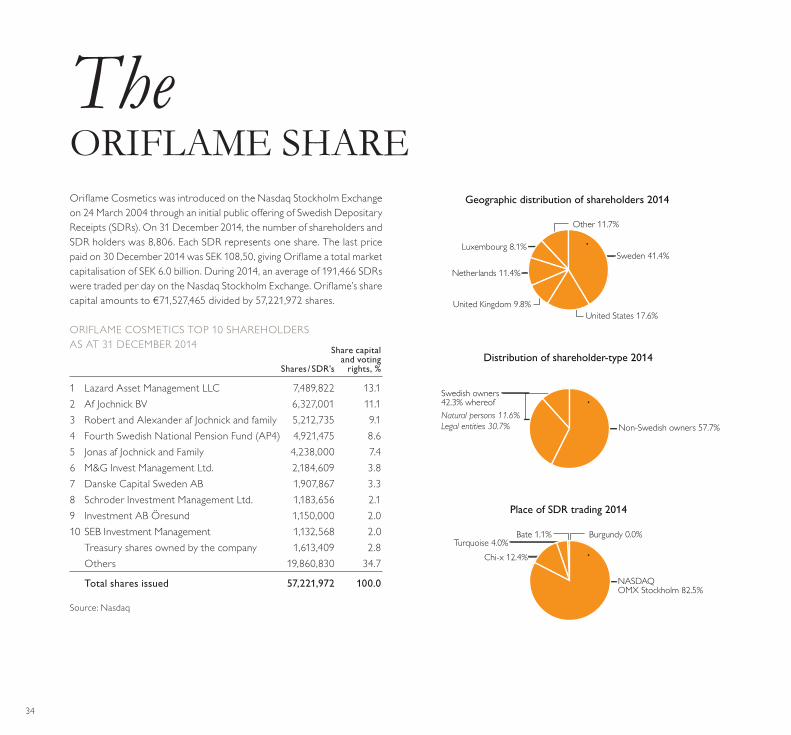
The ORIFLAME SHAREOriflame Cosmetics was introduced on the Nasdaq Stockholm Exchange on 24 March 2004 through an initial public offering of Swedish Depositary Receipts (SDRs). On 31 December 2014, the number of shareholders and SDR holders was 8,806. Each SDR represents one share. The last price paid on 30 December 2014 was SEK 108,50, giving Oriflame a total market capitalisation of SEK 6.0 billion. During 2014, an average of 191,466 SDRs were traded per day on the Nasdaq Stockholm Exchange. Oriflame’s share capital amounts to €71,527,465 divided by 57,221,972 shares.
ORIFLAME COSMETICS TOP 10 SHAREHOLDERS AS AT 31 DECEMBER 2014 Share capital and voting Shares / SDR’s rights, %
1 Lazard Asset Management LLC 7,489,822 13.12 Af Jochnick BV 6,327,001 11.13 Robert and Alexander af Jochnick and family 5,212,735 9.14 Fourth Swedish National Pension Fund (AP4) 4,921,475 8.65 Jonas af Jochnick and Family 4,238,000 7.46 M&G Invest Management Ltd. 2,184,609 3.87 Danske Capital Sweden AB 1,907,867 3.38 Schroder Investment Management Ltd. 1,183,656 2.19 Investment AB Öresund 1,150,000 2.010 SEB Investment Management 1,132,568 2.0 Treasury shares owned by the company 1,613,409 2.8 Others 19,860,830 34.7
Totalsharesissued 57,221,972 100.0
Source: Nasdaq
Sweden 41.4%
United Kingdom 9.8%
Other 11.7%
Geographic distribution of shareholders 2014
Netherlands 11.4%
United States 17.6%
Luxembourg 8.1%
Non-Swedish owners 57.7%
Distribution of shareholder-type 2014
Swedish owners 42.3% whereofNatural persons 11.6%Legal entities 30.7%
NASDAQ OMX Stockholm 82.5%
Chi-x 12.4%
Burgundy 0.0%
Place of SDR trading 2014
Turquoise 4.0%Bate 1.1%
34

2 column grid
Change in Total share Change in share capital Total number capitalYear Transaction numbers of shares €’000 of shares €’000
2006 (1) Cancellation of redeemed shares (3,813,304) (4,766) 55,669,886 69,5882007 (2) New issue 71,828 90 55,741,714 69,6782008 (3) New issue 551,601 689 56,293,315 70,3672009 (4) New issue 521,343 651 56,814,658 71,0182010 (5) New issue 165,569 207 56,980,227 71,2252011 (6) New issue 60,907 76 57,041,134 71,3012012 (7) New issue 80,000 100 57,121,134 71,4012013 (8) New issue 92,928 116 57,214,062 71,5172014 (9) New issue 7,910 10 57,221,972 71,527
(1) On 30 October 2006 the Company cancelled 3,813,304 shares, which were redeemed during the summer of 2006 (2) New issue of shares relating to the 2007 share incentive program.(3) New issue of shares relating to the 2008 share incentive program and vesting of the 2005 share incentive plan.(4) New issue of shares relating to the 2009 share incentive program and vesting of the 2006 share incentive plan. (5) New issue of shares relating to the 2010 share incentive program and vesting of the 2007 share incentive plan. (6) New issue of shares relating to the 2011 share incentive program.(7) New issue of shares relating to the 2012 share incentive program.(8) New issue of shares relating to the 2013 share incentive program and vesting of the 2010 share incentive plan. (9) New issue of shares relating to the 2014 share incentive program.
HISTORY OF SHARE CAPITALThe table below presents the changes in the Company’s share capital since 2006. Documents pertaining to the changes in Oriflame’s share capital prior to and during this period may be consulted at the Luxembourg Register of Commerce and Companies:
OWNERSHIP STRUCTURE AS AT 31 DECEMBER 2014(EXCLUDING TREASURY SHARES) Number of Number ofShareholding shareholders % shares / SDR’s %
1 – 1,000 7,684 87.3 1,534,222 2.8 1,001 – 10,000 861 9.8 2,657,175 4.8 10,001 – 50,000 152 1.7 3,639,696 6.5 50,001 – 500,000 89 1.0 14,614,449 26.3 500,001 – 1,000,000 8 0.1 5,241,755 9.4 1,000,001 – 11 0.1 27,921,266 50.2
Total 8,805 100.0 55,608,563 100.0
Source: Euroclear and share register
DIVIDEND POLICY AND DIVIDEND PROPOSALThe Board of Directors has adopted a dividend policy to the effect that, absent changes in the Company’s operations or capital structure, Oriflame intends to distribute, over the long term, at least 50 percent of the Compa-ny’s annual profit after tax as dividends. In May 2014, the Annual General Meeting (AGM) decided that payments will be made on a quarterly basis and that the Board will be given a mandate to decide the timing and size of the quarterly payments.
Due to the uncertain macro-economic and geopolitical situation as well as the unfavourable movements of some of the Oriflame’s main currencies, the Board of Directors will continue to prioritise reducing the debt during the forthcoming quarters. As a consequence, the Board of Directors will not seek a mandate for distribution of dividend during the forthcoming four quarters (quarter 2 2015 up until quarter 1 2016).
35
CO
NSO
LID
ATED
FIN
ANC
IAL
STAT
EMEN
TS

SHARE PRICE
SHARE TRADEA total number of 58 million SDRs were traded on Nasdaq Stockholm during 2014, accounting for 82 percent of total turnover in the SDR. Oriflame’s SDR is also traded in marketplaces outside of Nasdaq Stockholm such as Bats Chi-X, Turquoise and Burgundy.
SHARE DATAListing Nasdaq StockholmNo of shares issued 57,221,972Earnings per share €0.67Dividend per share €0.00Market capitalisation at 31 December 2014 SEK 6.0 billionTicker code ORI SDBISIN-code SE0001174889
ANALYSTS FOLLOWING ORIFLAMEAndreas Lundberg ABG SecuritiesNiklas Ekman CarnegieNic Sachovsky Credit SuisseHaakon Aschehoug DnB Nor MarketsAnders Hansson Danske BankRosie Edwards Goldman SachsErik Sandstedt HandelsbankenErik Sjögren Morgan StanleyGuillaume Delmas NomuraStellan Hellström NordeaSergej Kasatchenko Pareto ÖhmanStefan Nelson SEB EnskildaChristian Anderson SwedbankErik Hegedus WOOD & Company
Number of shares SEK
Source: SIX
0
5,000
10,000
15,000
20,000
25,000
30,000
Shares traded (thousands)
201420132012201120102009200820072006200520040
100
200
300
400
500
SX3000 OMX Stockholm Consumer Goods_PIOMX Stockholm_PI
Oriflame
36
Directors’REPORTThe Board of Directors (the “Board of Directors”) presents the Annual Report and the audited consolidated financial statements of Oriflame Cosmetics S.A. (the “Company”) and its subsidiaries (together with the Company, the “Group”) for the financial year ended 31 December 2014 (the “Annual Report”).
The 2014 in brief, 2014 financial overview, and the Statement from the CEO on page 6–15, the corporate governance report (the “Corporate Governance Report”) as well as the report on internal control and mon-itoring (the “Internal Control and Monitoring Report”) included on pages 42–50 all form part, together with the present directors’ report, the annual management report (the “Report”).
ACTIVITIES OF THE COMPANY AND OF THE GROUPThe Company is a public limited liability company (société anonyme) gov-erned by the laws of the Grand-Duchy of Luxembourg and registered with the Luxembourg Trade and Companies Register under number B. 8835, which main purpose is to act as holding company of the Group whose principal activity is the sale of high quality skin care, fragrances, cosmetic products and related nature-inspired innovative beauty products through an independent sales force of over 3 million independent Oriflame Consultants.
BUSINESS REVIEWThe 2014 in brief, 2014 finanical overview and the Statement from the CEO on page 6 through 15 include a fair review of the development of the activities of the Company and of its subsidiaries over the year in consideration and likely future development of the Group’s activities.
REORGANISATION PROCESS OF THE GROUP STRUCTUREIn the course of the year 2014, the Board of Directors continued with its process to further align the legal structure of the Group with the Group operations and activities.
As explained earlier in press releases dated 17 April 2013 and 14 April 2014, the Group has in recent years gradually improved operational efficiencies through the implementation of Global Shared Services in the areas of IT, Finance and HR as well as e-Commerce, cash pooling initiatives and inventory risk management. As part of this, Oriflame has moved activities, risks, management and functions to Switzerland.
As a consequence of these operational changes, the Board of Oriflame Cosmetics S.A. decided to pursue a process to modify the legal structure of the Group which is intended to change the domicile from Luxembourg to Switzerland later during 2015.
These changes to the legal structure of Oriflame are to be implemented in several steps, where the first step was taken at the Extraordinary General Meeting held on 19 May 2014, when the shareholders approved the launch of a Universal Contribution process made by way of an apport d’universalité as provided in article 308bis-4 of the Luxembourg Company Law, whereby the Company contributed all of its assets and liabilities (to the limited exclusion of certain assets and liabilities) to Oriflame Cosmetics Global S.A. (“OCG”) – a Luxembourg financing and holding company, incorporated during Q1 2013 and directly and wholly owned by the Com-pany – in consideration of shares in OCG (the “Universal Contribution”).
As a result of the Universal Contribution, the Company’s title and interests in the subsidiaries of the Group have all1) been transferred to OCG, the latter continuing to be fully owned and controlled by the Company.
As a second step, a Swiss holding company, Oriflame Holding AG, was established during the fourth quarter of 2014. As a third step, a share-for-share exchange transaction, for the purpose of changing the domicile of the Group from Luxembourg to Switzerland, is expected to be announced later during 2015.
Key performance indicatorsThe key figures of the performance of the Group can be found on page 32–33 of this Annual Report.
1) Exempted the Algerian subsidiary of the Group (Natural Swedish Cosmetics SARL).
37
CO
NSO
LID
ATED
FIN
ANC
IAL
STAT
EMEN
TS
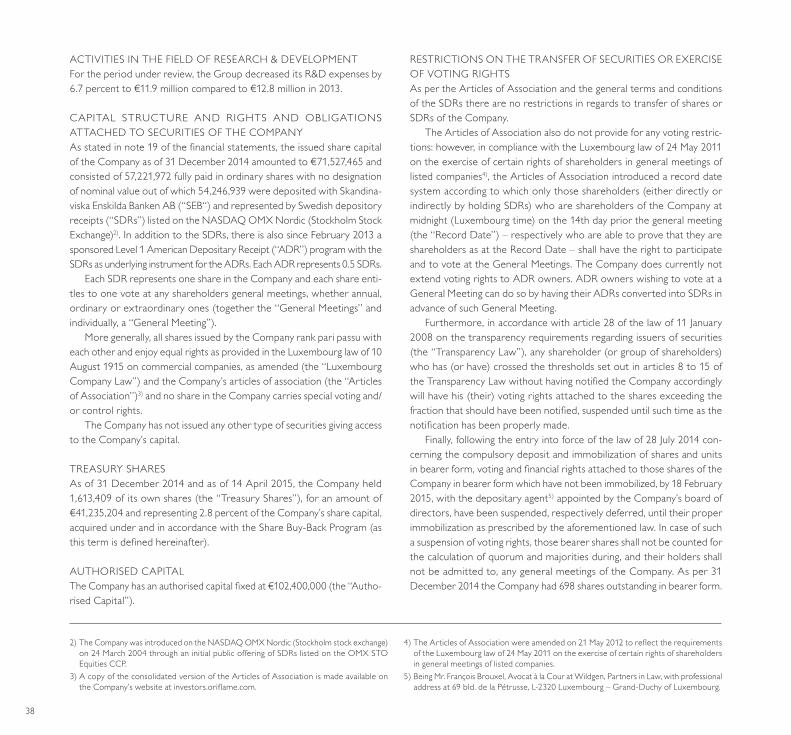
ACTIVITIES IN THE FIELD OF RESEARCH & DEVELOPMENTFor the period under review, the Group decreased its R&D expenses by 6.7 percent to €11.9 million compared to €12.8 million in 2013.
CAPITAL STRUCTURE AND RIGHTS AND OBLIGATIONS ATTACHED TO SECURITIES OF THE COMPANYAs stated in note 19 of the financial statements, the issued share capital of the Company as of 31 December 2014 amounted to €71,527,465 and consisted of 57,221,972 fully paid in ordinary shares with no designation of nominal value out of which 54,246,939 were deposited with Skandina-viska Enskilda Banken AB (“SEB“) and represented by Swedish depository receipts (“SDRs”) listed on the NASDAQ OMX Nordic (Stockholm Stock Exchange)2). In addition to the SDRs, there is also since February 2013 a sponsored Level 1 American Depositary Receipt (“ADR”) program with the SDRs as underlying instrument for the ADRs. Each ADR represents 0.5 SDRs.
Each SDR represents one share in the Company and each share enti-tles to one vote at any shareholders general meetings, whether annual, ordinary or extraordinary ones (together the “General Meetings” and individually, a “General Meeting”).
More generally, all shares issued by the Company rank pari passu with each other and enjoy equal rights as provided in the Luxembourg law of 10 August 1915 on commercial companies, as amended (the “Luxembourg Company Law”) and the Company’s articles of association (the “Articles of Association”)3) and no share in the Company carries special voting and/or control rights.
The Company has not issued any other type of securities giving access to the Company’s capital.
TREASURY SHARESAs of 31 December 2014 and as of 14 April 2015, the Company held 1,613,409 of its own shares (the “Treasury Shares”), for an amount of €41,235,204 and representing 2.8 percent of the Company’s share capital, acquired under and in accordance with the Share Buy-Back Program (as this term is defined hereinafter).
AUTHORISED CAPITALThe Company has an authorised capital fixed at €102,400,000 (the “Autho-rised Capital”).
RESTRICTIONS ON THE TRANSFER OF SECURITIES OR EXERCISE OF VOTING RIGHTSAs per the Articles of Association and the general terms and conditions of the SDRs there are no restrictions in regards to transfer of shares or SDRs of the Company.
The Articles of Association also do not provide for any voting restric-tions: however, in compliance with the Luxembourg law of 24 May 2011 on the exercise of certain rights of shareholders in general meetings of listed companies4), the Articles of Association introduced a record date system according to which only those shareholders (either directly or indirectly by holding SDRs) who are shareholders of the Company at midnight (Luxembourg time) on the 14th day prior the general meeting (the “Record Date”) – respectively who are able to prove that they are shareholders as at the Record Date – shall have the right to participate and to vote at the General Meetings. The Company does currently not extend voting rights to ADR owners. ADR owners wishing to vote at a General Meeting can do so by having their ADRs converted into SDRs in advance of such General Meeting.
Furthermore, in accordance with article 28 of the law of 11 January 2008 on the transparency requirements regarding issuers of securities (the “Transparency Law”), any shareholder (or group of shareholders) who has (or have) crossed the thresholds set out in articles 8 to 15 of the Transparency Law without having notified the Company accordingly will have his (their) voting rights attached to the shares exceeding the fraction that should have been notified, suspended until such time as the notification has been properly made.
Finally, following the entry into force of the law of 28 July 2014 con-cerning the compulsory deposit and immobilization of shares and units in bearer form, voting and financial rights attached to those shares of the Company in bearer form which have not been immobilized, by 18 February 2015, with the depositary agent5) appointed by the Company’s board of directors, have been suspended, respectively deferred, until their proper immobilization as prescribed by the aforementioned law. In case of such a suspension of voting rights, those bearer shares shall not be counted for the calculation of quorum and majorities during, and their holders shall not be admitted to, any general meetings of the Company. As per 31 December 2014 the Company had 698 shares outstanding in bearer form.
2) The Company was introduced on the NASDAQ OMX Nordic (Stockholm stock exchange) on 24 March 2004 through an initial public offering of SDRs listed on the OMX STO Equities CCP.
3) A copy of the consolidated version of the Articles of Association is made available on the Company’s website at investors.oriflame.com.
4) The Articles of Association were amended on 21 May 2012 to reflect the requirements of the Luxembourg law of 24 May 2011 on the exercise of certain rights of shareholders in general meetings of listed companies.
5) Being Mr. François Brouxel, Avocat à la Cour at Wildgen, Partners in Law, with professional address at 69 bld. de la Pétrusse, L-2320 Luxembourg – Grand-Duchy of Luxembourg.
38

MAJOR SHAREHOLDINGSThe major direct and indirect6) holdings and voting rights in the Company as per 31 December 2014 can be found in the table on page 34 of the Annual Report.
CONTROL SYSTEM IN EMPLOYEE/MANAGEMENT SHARE SCHEMEThe Company is not aware of any issues regarding item e) of article 11 of the Luxembourg Takeover Law as the shares issued by the Company under the employee stock schemes (the “Share Incentive Plans” and indi-vidually a “Share Incentive Plan”) are transferred directly to the Company’s employees and/or to the Group’s key management.
The beneficiary employees and/or Group’s key management, who hold Company shares, may exercise their rights in the same way as any other shareholders of the Company in accordance with the Articles of Association and the Luxembourg Company Law.
Further details of the Share Incentive Plans can be found in note 23 – “Equity compensation plans” of the financial statements.
AGREEMENTS BETWEEN SHAREHOLDERS RESULTING IN SECURITIES AND/OR VOTING RIGHTS TRANSFER RESTRICTION As of 31 December 2014, the Company was not aware of any agreements between shareholders that may result in restrictions on the transfer of securities (i.e. shares or SDRs in the Company) and/or affect their voting rights.
RELATED PARTIESInformation about related parties can be found in note 24 of these financial statements.
RULES GOVERNING THE APPOINTMENT AND REMOVAL OF THE MEMBERS OF THE BOARD OF DIRECTORS AND THE AMEND-MENTS OF THE ARTICLES OF ASSOCIATIONAppointment and removal of the members of the Board of Directors are subject to the provisions of article 12 of the Articles of Association according to which directors of the Company (the “Director(s)”) are appointed and removed by ordinary resolution (simple majority) of the General Meeting. In the event of one or more vacancies by reason of death, retirement or otherwise, the Board of Directors may elect by co-optation a Director to fill such vacancy.
The Articles of Association may be amended from time to time by a decision taken by a two third (2/3) majority of the shareholders of the Company present or represented at the General Meeting convened for this purpose, representing at least fifty percent (50%) of the Company’s share capital in accordance with the provisions of article 67–1 of the Luxembourg Company Law. However, the shareholders of the Company may change the nationality of the Company only by unanimous decision.
Further details of rules governing the appointment and replacement of Board of Directors members and the amendment of the Articles of Association can be found hereafter in the Corporate Governance Report attached to the Report.
POWERS OF THE BOARD OF DIRECTORSThe Board of Directors is vested with the broadest powers to manage the business of the Company and perform all acts of administration and disposition on behalf of the Company, in its interests. As a result, all powers not expressly reserved by the Luxembourg Company Law or by the Articles of Association to the General Meeting fall within the competence of the Board of Directors.
Authorisation to issue shares of the Company The Board of Directors has, by resolutions passed at the Company’s Extraordinary General Meeting held on May 2011, been authorised to issue on a non-preemptive basis up to 2,700,000 Company shares under the Authorised Capital to persons exercising their rights under the 2011 Share Incentive Plan implemented for a period ending five years after 19 May 2011 (the “2011 Share Incentive Plan”).
At the Annual General Meeting held on 21 May 2013, the shareholders gave a mandate to the Board of Directors to introduce a technical amend-ment to the 2011 Share Incentive Plan enabling participants in this plan to going forward elect to – as an alternative to purchasing newly issued shares under the 2011 Share Incentive Plan (known as the “Investments Shares”) – designate as Investment Shares any Company’ shares/SDRs already owned by the participant under this plan and not already part of any non-vested Share Incentive Plan.
During the financial year 2014, 7,910 shares were issued under the 2011 Share Incentive Plan, bringing the total number of shares issued under this plan since the year 2011 to 158,507.
6) As above stated, as of 31 December 2014, 54,246,939 shares in the Company were deposited – under the SDR listing mechanism – with SEB acting as a result as depositary.
39
CO
NSO
LID
ATED
FIN
ANC
IAL
STAT
EMEN
TS

The Board of Directors indeed proceeded on 13 August 2014, within the limits of the Authorised Capital and with exclusion of pre-emption rights of existing Company’s shareholders, with the effective increase of the Company’s share capital by an amount of €9,887.50, so as to bring it from €71,517,577.50 to €71,527,465, by the issue of these 7,910 new shares, vested with the same rights and obligations as the existing shares as set out in the Articles of Association.
Further details about share issuances under the Share Incentive Plans may be found in note 23 – “Equity compensation plans” of the financial statements.
Authorisation to buy-back shares of the Company On 19 December 2012, the Company’s Extraordinary General Meeting authorised the Board of Directors, with the right to delegate this power, to acquire – until the Annual General Meeting held on 19 May 2014 and under a share buy-back program implemented in accordance with the objectives, conditions and restrictions provided by the Regulation (EC) No. 2273/2003 of 22 December 2003 implementing Directive 2003/6/EC of the European Parliament and of the Council as regards exemption for buyback programs and stabilisation of financial instruments (the “Share Buy-Back Program”) – up to 5,712,113 Company shares and/or SDRs (i.e. the Treasury Shares), representing a maximum of 10 percent of the subscribed capital of the Company.
Under the authorisation so granted by the General Meeting, the Board of Directors instructed in January 2013 the Company’s management to effectively launch a first tranche of the Share Buy-Back Program with a repurchase notional of around SEK 350,000,000 corresponding to approx-imately 3 percent of the outstanding Company’s share capital at that time.
This first tranche of the Share Buy-Back Program was effectively com-pleted on 12 April 2013, by which date the Company had then repurchased a total of 1,613,409 shares/SDRs (corresponding to 2.8 percent of the total number of issued shares at the time) for an aggregate redemption price of SEK 349,999,848 (corresponding to an average price of SEK 216.9 per share/SDR). There was no launch of any subsequent tranches of the Share Buy-Back Program and at the time of the expiry of the share buy-back mandate (on 19 May 2014) so that the final number of shares held as Treasury Shares by the Company was and is still be 1,613,409. In accor-dance with relevant provisions of the Luxembourg Company Law, voting rights attached to these Treasury Shares have been suspended since then.
The purpose of the Share Buy-Back Program was to optimise the capital structure of the Company. The Treasury Shares so acquired are intended to ultimately be cancelled and reduce the capital accordingly.
Further details on the Share Buy-Back Program may be found in the General Meeting minutes dated 19 December 2012 published on the Company’s website at investors.oriflame.com.
Significantagreementstakingeffect,beingalteredorterminatedupona change of control of the company following a takeover bidThe Board of Directors has identified the following significant agreements to which the Company is party to and that could be altered or terminated as a result of a takeover bid process:
– a €330,000,000 revolving credit facility agreement;
– the 2010 and 2011 U.S. Private Placement agreements amounting to USD 360,000,000 and €25,000,000.
Agreements between the Company and its directors or employees providingforcompensationforlossofofficeoremploymentoccurringbecause of a takeover bidThere is no specific agreement in place between the Company and its Directors or employees whereby the latter would receive compensation in case they resign or are made redundant without valid reason, or if their employment contracts cease because of a takeover bid and the require-ments the Company shall follow in that matter under such circumstances are those provided by local applicable laws.
As general consideration, under current contract terms, no compensa-tion is provided for employees of the Group who resign except as follows: in connection with the 2007 Group restructuring, employees who chose to accept to relocate to other offices within the Group were offered a redundancy package.
In terms of dismissal by the employer, no contract stipulates any severance or other additional compensation except as follows:– Members of executive management are entitled to additional notice
periods if they have been employed in the Group for more than 10 years and/or are above 45 years of age;
– as part of the 2007 Group restructuring;– as part of any non-competition obligation, such non-competition obli-
gation and related severance being exercisable in the sole discretion of the employer.
40
Contractually, an employee of the Group is also entitled to his notice period. By law, the Group entities are normally also required to provide statutory payments depending on the length of service. If an employee is made redundant or dismissed without a valid reason, there is a risk that the individual can bring a legal claim against the company which has employed him or her for damages. This is not stipulated in the employment contracts but is established by law.
MARKET ABUSE RELATED CONSIDERATIONSThe Company has adopted and applies an insider trading policy published on the Company’s web site at investors.oriflame.com.
PRINCIPAL RISKS AND UNCERTAINTIESStrategic and operational risks In the long term, Oriflame’s business depends significantly upon its ability to retain its existing Oriflame Consultants and recruit new Consultants. If management is unsuccessful in this regard, the Company’s sales are likely to decline.
Oriflame’s operations in the CIS region accounted for over 40 percent of Group turnover in 2014. The Company’s business could be adversely affected by political, regulatory and economic instability in this region. Such instability also could impact Oriflame Consultants’ activity, and sub-sequently the Company’s sales.
Sales of Oriflame products depend to a significant extent upon brand recognition and the goodwill associated with the Company’s trademarks and trade names, and its business could be harmed if its brand recogni-tion is hurt or if management is unable to protect the trademarks and trade names.
Oriflame is dependent on its manufacturing facilities and other Supply Chain assets in Poland, India, China and Russia as well as on third-party manufacturing facilities and logistic services. Any interruption in these facilities, or the loss of a third-party supplier, could negatively impact the business, financial condition and results of operations.
Oriflame is partly dependent on its information systems hosted in Czech Republic and Russia, and supported and monitored in India. More than 90 per cent of orders are placed online, and any interruption in these facilities due to natural disasters or durable software malfunction could negatively impact the Company’s operations.
Environmental compliance costs and liabilities could as well impact adversely the Group’s financial condition.
Financial risks Given the international nature of Oriflame’s business, the Oriflame Group is exposed to double-taxation risks. The tax and transfer pricing strategies utilized in Oriflame are based on best practice interpretations of current tax laws, treaties and regulations of the various countries involved and the requirements of the relevant tax authorities. In the event that Oriflame’s interpretation of these laws, treaties and regulations or their applicability is incorrect, if one or more governmental authorities successfully assert conflicting claims over the ability to tax profits in the respective subsidiary or the Oriflame Group or if the applicable laws, treaties, regulations or governmental interpretations thereof or administrative practice in relation thereto change, Oriflame’s effective tax rate could increase and could adversely affect the results. In the event tax authorities were to successfully challenge the Oriflame Group’s past or current tax positions, this could result in an increased effective tax rate.
Oriflame is exposed to the risk of currency fluctuations in many coun-tries where it operates and these fluctuations may have a material effect on the results of operations and financial condition. The Company expe-riences both currency translation and currency transaction exposure. Currency fluctuations may affect the comparability of Oriflame’s results between financial periods.
For a further detailed analysis of financial risks, please see note 28 of the financial statements. In terms of going concern, the Group’s own cash flow should together with existing facilities secure the Company’s financing needs for the foreseeable future.
Other risks Oriflame is exposed to economic, political, legal and business risks asso-ciated with its international sales and operations, particularly in emerging markets, where legal and political landscapes may evolve rapidly. The imposition of legal, tax or financial burden on Oriflame Consultants could affect negatively the Company’s operations and ability to recruit new Consultants in concerned markets.
In many of the markets where the Company operates, there is no legislation regulating the Direct Selling industry or this legislation is currently being developed, which may create legal risks that affect the Company’s business, financial condition and results of operations.
The cosmetics industry is highly competitive in many of the markets where Oriflame operates, thus creating a risk of material adverse effect if the Company is unable to compete effectively.
SUBSEQUENT EVENTS SINCE THE END OF THE FINANCIAL YEARNo significant event has occurred since the closing of the financial state-ments as of 31 December 2014.
41
CO
NSO
LID
ATED
FIN
ANC
IAL
STAT
EMEN
TS

Corporate Governance ReportCorporate governance, management and control of the Oriflame Group is apportioned between the shareholders / SDR holders at the General Meetings of shareholders (“General Meeting(s)”), the Board of Direc-tors (the “Board”), its elected committees and the Corporate Officers in accordance with Luxembourg law, Oriflame’s Articles of Association together with the Board and Officer Instructions. Oriflame complies with the Swedish Code of Corporate Governance1) (the “Code”) to the extent that the Code is not in conflict with Luxembourg law or regulations.
This Corporate Governance Report has been reviewed by Oriflame’s auditors. As most EU corporate governance codes, the Swedish Code sets out recommendations rather than mandatory rules. The Code is based on the principle of “comply or explain”, where deviations from the Code’s recommendations are to be reported and explained in the Corporate Governance report. Oriflame’s deviations are reported under the heading “Comply or Explain”.
COMPLY OR EXPLAIN According to the Code, the Nomination Committee is to make recom-mendations on audit fees. The Nomination Committee has resolved not to propose the Auditor’s remuneration to the Annual General Meeting as this is not a matter for General Meetings under the Articles of Association of the Company or under the laws of Luxembourg.
Oriflame does not host its General Meetings in the Swedish language as it is a Luxembourg Company, the location for Oriflame General Meetings is Luxembourg and as the majority of voting rights is held by individuals and entities located outside Sweden. General Meetings are therefore hosted in English.
GENERAL MEETINGS In accordance with Oriflame’s Articles of Association, the Annual General Meeting (AGM) of Oriflame shall be held on 19 May of each calendar year, or the next following weekday should 19 May be a holiday or weekend.
At the General Meetings, being Oriflame’s highest decision making forum, resolutions are passed with respect to adoption of the profit
and loss account and balance sheet as well as the consolidated income statement and consolidated statement of financial position; dispositions of Oriflame’s profit and loss according to the adopted balance sheet; discharge from liability for the Board members and Auditor; election of Board members and certain other matters provided by law and the Articles of Association. In accordance with Luxembourg law, any change to the Articles of Association needs to be approved by an Extraordinary General Meeting (EGM), which is why the Company sometimes hosts an EGM in connection with the AGM.
A shareholder may attend and vote at General Meetings in person or by proxy. An SDR holder who has been duly registered as such with the Swedish Securities Register Centre (Euroclear) may attend the meeting in person, but may only vote by proxy. SDR holders can convert their SDRs into shares if they wish. More information about conversion can be found on investors.oriflame.com. An SDR holder wishing to attend a General Meeting must notify Oriflame of his/her intention to attend. The manner in which to notify Oriflame and in which to issue proxy cards is described in the notice convening the General Meeting.
The General Meetings offer shareholders and SDR holders the oppor-tunity to raise matters and questions concerning Oriflame and the results of the year under review, whereby shareholders and SDR holders are entitled to have matters considered at the General Meetings. To ensure inclusion in the convening notice, a request for a matter to be raised must have reached Oriflame ([email protected]) at the latest seven weeks before the General Meeting. Notice to convene the General Meeting shall be submitted by Oriflame at the earliest six and at the latest four weeks before the meeting.
The location for Oriflame General Meetings is Luxembourg. Oriflame does not enable for participation in General Meetings at a distance. Ori-flame did however, in order to compensate for the above and in light of being listed on the NASDAQ OMX Nordic Exchange, host a shareholders’ day in Stockholm on 7 May 2014 where shareholders/SDR holders had the opportunity to meet with members of the Board and Management and to ask questions related to the Annual General Meeting. In advance
1) The Swedish Code of Corporate Governance effective as of 1 February 2010, including any amendments and instructions issued by the Swedish Corporate Governance Board.
42

of the Annual General Meeting 2015 such shareholders’ day will be held on 11 May 2015 (exact time and location will be announced no later than in connection with the notice to the Annual General Meeting and will be posted under the Investor section on Oriflame’s corporate web site).
BOARD OF DIRECTORS In accordance with Luxembourg law, the Board is responsible for the management of the Company’s affairs. The Board also monitors the per-formance of the obligations of the CEO, CFO and COO, is responsible for ensuring that the Company’s organisation fulfils its purpose, and conducts continuous evaluations of the Company’s procedures and guidelines for management and investment of the Company’s funds.
The Board has established rules of procedure which set forth how and when the Board convenes, and include instruction for the allocation of duties and responsibilities within and between the Board and the CEO, the CFO and the COO. The rules of procedure also contain instructions for financial reporting and set forth how reporting to the Board is to proceed. During 2014, the Board reviewed and reconfirmed the rules of procedure for the Board and its committees as well as the instructions for the CEO, CFO and COO.
At the 2014 Annual General Meeting the nomination process for the election of Nomination Committee members was adopted. The task of the Nomination Committee is to prepare and submit proposals to the Annual General Meeting for the election of the Board members and the size of the fees paid to Board members and other Committees of the Board (currently being the Audit Committee and Remuneration Committee).
Although Luxembourg law and Oriflame’s Articles of Association per-mit a Board member to remain in office for up to six years, Oriflame’s Board members are appointed at the Annual General Meeting and, unless re-elected, remain in office for a term of one year. If a vacancy arises during the course of the financial year, the Board is entitled to elect a replacing Board member to fill the vacancy for the period until the next Annual General Meeting of the Company.
In accordance with Oriflame’s Articles of Association, the Board shall consist of not less than three, and not more than ten, Board members without deputies. Currently, the Board consists of nine members. The Board consists of principal shareholders and persons independent of such shareholders. The CEO is also a member of the Board. Remuneration
to the Chairman of the Board and the Board members is determined by resolution adopted by the Annual General Meeting. The 2014 Annual General Meeting resolved, as suggested by the Nomination Committee, that the director’s and committee remuneration would be maintained unchanged compared to previous year, i.e. €65,500 to the Chairman of the Board, €29,000 to each non-Executive Director, €10,000 to each member of the Audit Committee, and €5,000 to each member of the Remuneration Committee.
According to the rules of procedure, the Board shall convene at least four times per year, of which at least one meeting is to focus on business strategy issues. During the financial year 2014, Oriflame held fourteen Board meetings, out of which one was a two-day strategy meeting. Secretary at the meetings is Pontus Andreasson, in-house legal counsel for the Group.
The Board meetings usually begin with a discussion of the business and financial performance of the Group. The various financial reports and the Annual Report are reviewed and approved before being published. Other topics discussed at Board meetings include general strategies, overall busi-ness reviews, long and short-term targets, human resources, investments, capital distribution, compliance and remuneration. At the end of each year, the CEO and the CFO present the target and budget proposition for next year to the Board, who then reviews and discusses the proposal during one or several Board meetings. Following discussions and eventual adjustments, the Board approves the target.
The Board members participate in all discussions. Board members may however not vote or deliberate on any motion in which they have a conflict of interest. A Board member is not counted in the quorum of a meeting if a conflict of interest disallows him/her from voting on a particular motion. Board members shall declare the nature of any conflict of interest prior to deliberating and voting on the issue, and such declaration is entered in the minutes of the meeting. Any conflicts of interest are reported at the forthcoming Annual General Meeting of shareholders.
The CFO is generally invited to all Board meetings, and always to the Board meetings approving the quarterly results. Other members of the Oriflame Management are from time to time invited to meetings with the Board in order to present issues related to their specific areas of responsibility. Auditing and Internal Control issues are carefully considered by the Audit Committee and then reported to the Board of Directors.
43
CO
NSO
LID
ATED
FIN
ANC
IAL
STAT
EMEN
TS
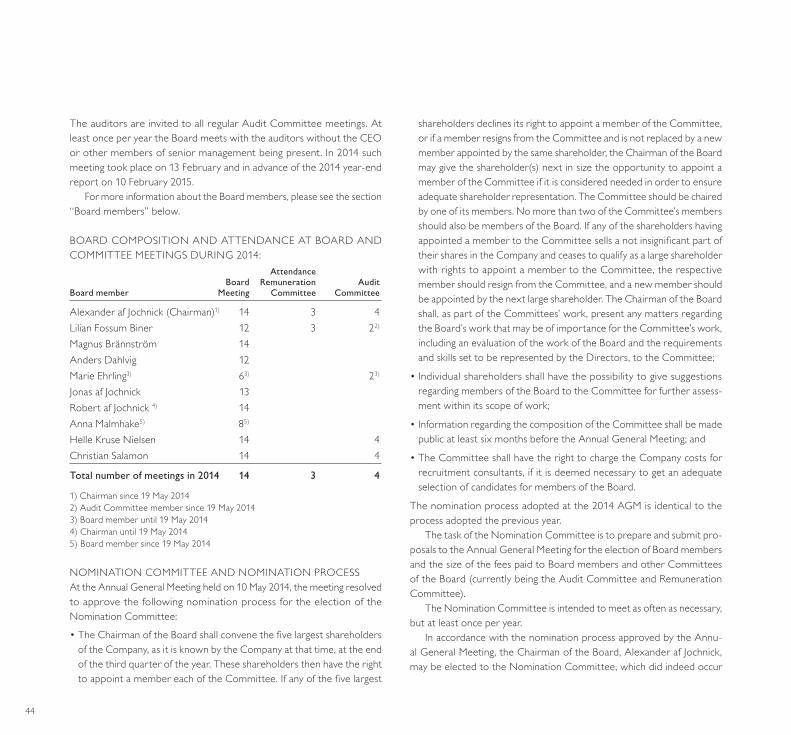
The auditors are invited to all regular Audit Committee meetings. At least once per year the Board meets with the auditors without the CEO or other members of senior management being present. In 2014 such meeting took place on 13 February and in advance of the 2014 year-end report on 10 February 2015.
For more information about the Board members, please see the section “Board members” below.
BOARD COMPOSITION AND ATTENDANCE AT BOARD AND COMMITTEE MEETINGS DURING 2014: Attendance Board Remuneration AuditBoard member Meeting Committee Committee
Alexander af Jochnick (Chairman)1) 14 3 4Lilian Fossum Biner 12 3 22)
Magnus Brännström 14Anders Dahlvig 12Marie Ehrling3) 63) 23)
Jonas af Jochnick 13Robert af Jochnick 4) 14Anna Malmhake5) 85)
Helle Kruse Nielsen 14 4Christian Salamon 14 4
Total number of meetings in 2014 14 3 4
1) Chairman since 19 May 20142) Audit Committee member since 19 May 20143) Board member until 19 May 20144) Chairman until 19 May 20145) Board member since 19 May 2014
NOMINATION COMMITTEE AND NOMINATION PROCESSAt the Annual General Meeting held on 10 May 2014, the meeting resolved to approve the following nomination process for the election of the Nomination Committee:
• The Chairman of the Board shall convene the five largest shareholders of the Company, as it is known by the Company at that time, at the end of the third quarter of the year. These shareholders then have the right to appoint a member each of the Committee. If any of the five largest
shareholders declines its right to appoint a member of the Committee, or if a member resigns from the Committee and is not replaced by a new member appointed by the same shareholder, the Chairman of the Board may give the shareholder(s) next in size the opportunity to appoint a member of the Committee if it is considered needed in order to ensure adequate shareholder representation. The Committee should be chaired by one of its members. No more than two of the Committee’s members should also be members of the Board. If any of the shareholders having appointed a member to the Committee sells a not insignificant part of their shares in the Company and ceases to qualify as a large shareholder with rights to appoint a member to the Committee, the respective member should resign from the Committee, and a new member should be appointed by the next large shareholder. The Chairman of the Board shall, as part of the Committees’ work, present any matters regarding the Board’s work that may be of importance for the Committee’s work, including an evaluation of the work of the Board and the requirements and skills set to be represented by the Directors, to the Committee;
• Individual shareholders shall have the possibility to give suggestions regarding members of the Board to the Committee for further assess-ment within its scope of work;
• Information regarding the composition of the Committee shall be made public at least six months before the Annual General Meeting; and
• The Committee shall have the right to charge the Company costs for recruitment consultants, if it is deemed necessary to get an adequate selection of candidates for members of the Board.
The nomination process adopted at the 2014 AGM is identical to the process adopted the previous year.
The task of the Nomination Committee is to prepare and submit pro-posals to the Annual General Meeting for the election of Board members and the size of the fees paid to Board members and other Committees of the Board (currently being the Audit Committee and Remuneration Committee).
The Nomination Committee is intended to meet as often as necessary, but at least once per year.
In accordance with the nomination process approved by the Annu-al General Meeting, the Chairman of the Board, Alexander af Jochnick, may be elected to the Nomination Committee, which did indeed occur
44

in 2014, where he represents the af Jochnick Family. Per Hesselmark (Af Jochnick BV), Hans Ek (SEB Investment Management AB) and Per Colleen (Fourth Swedish National Pension Fund) were also appointed to the Committee. Per Hesselmark has been the chairman of the Nomination Committee. No remuneration was paid to the members of the Nomi-nation Committee. The Nomination Committee formed in 2014 has in advance of the 2015 AGM met three times. All meetings were attended by all committee members.
The work of the Nomination Committee constituted in advance of the 2015 AGM comprised the following:
As a basis for the Committee’s work, information on the Company’s operations and strategic focus was presented by the Chairman of the Board at the first meeting. The Chairman of the Board also reported on the Board’s work during the year. As a basis for its work, the Nomination Committee also received a presentation and report of an evaluation conducted by an external consultant concerning the Board and its work. The evaluation revealed that the Board is very well-functioning, also in comparison with other listed companies and that there is clarity between the roles of the owners, the Board and management. The evaluation furthermore concluded that the Board is composed by individuals with relevant and complementary expertise and that all Board members demonstrated a high level of commitment. After evaluating the work of the Board, the Committee drew the conclusion that the Board has been functioning well and that the critical competences have been adequately represented on the Board. The aim of the Nomination Committee is that elected Board members shall represent knowledge and competence relevant for Oriflame’s operations. Independent Board members are included in full compliance with requirements that apply for publicly listed companies in Sweden.
The Nomination Committee has thereafter formulated proposals for the Annual General Meeting to be held on 19 May 2015. The proposals relates to the: i. composition of the Board of Directors; ii. fees paid to Board members; and iii. appointment of Auditors.
The Nomination Committee has decided to propose to the 2015 Annu-al General Meeting that it re-elects all current Board members, being Alexander af Jochnick (Chairman), Magnus Brännström, Anders Dahlvig,
Lilian Fossum Biner, Jonas af Jochnick, Robert af Jochnick, Anna Malmhake, Helle Kruse Nielsen and Christian Salamon. Anders Dahlvig, Lilian Fos-sum Biner, Helle Kruse Nielsen, Anna Malmhake and Christian Salamon are independent of the Company, the Company’s Management and the Company’s large shareholders.
Magnus Brännström is not independent from the Company, being the Company’s CEO. Robert, Jonas and Alexander af Jochnick are not inde-pendent from the Company nor from its major shareholders: Robert and Jonas af Jochnick are co-founders of the Company and together with other members of the af Jochnick family they constitute the largest shareholder of the Company. They have been members of the Board since 1970. Alex-ander af Jochnick was an employee of the Company from 1999 to 2007.
After a review of the Board’s compensation, the Nomination Commit-tee resolved to propose to the 2015 Annual General Meeting to maintain the Director’s remuneration to €65,500 for the Chairman and €29,000 to each non-executive Director, as well as unchanged committee fees of €10,000 to each member of the Audit Committee, and €5,000 to each member of the Remuneration Committee.
The Nomination Committee furthermore resolved to propose to the 2015 Annual General Meeting that the current Auditors, KPMG, be re-elected.
Remuneration CommitteeEach year following the Annual General Meeting, the Board appoints a Remuneration Committee. The Remuneration Committee elected in 2014 consisted of Lilian Fossum Biner and Alexander af Jochnick. The purpose and aim of the Remuneration Committee is to safeguard that the Com-pany has access to the competence required at a cost appropriate to the company, and that the existing and future remuneration schemes have the intended effects for the company’s operations. The tasks of the Commit-tee are to review remuneration and other material terms of employment for the Company’s executive directors, senior executives and other key personnel, monitor and evaluate programs for variable remuneration for the executive management, and in particular monitor and evaluate any share-based incentive program implemented in the Company.
Based on its reviews the Remuneration Committee prepares proposals for resolutions, to be discussed and approved by the Board. The Remuneration Committee meets when necessary. During 2014 the
45
CO
NSO
LID
ATED
FIN
ANC
IAL
STAT
EMEN
TS

Remuneration Committee has met three times. AUDIT COMMITTEEThe Company’s Audit Committee is appointed by the Board each year following the Annual General Meeting. The Audit Committee reviews internal and external information, works with the external Auditor on the audit plan and internal controls, and discusses with management the audit results. The Audit Committee reviews matters related to the Company’s and the Group’s accounting, financial reporting and internal control as well as financial risk exposure and risk management. It furthermore reviews the work of the Auditors. Based on their reviews the Audit Committee prepares proposals for resolutions, subject to final approval by the Board. The Audit Committee meets at least biannually. In 2014 the Audit Com-mittee met four times. The members of the Audit Committee comprised Marie Ehrling (until 19 May 2014), Lilian Fossum Biner (from 19 May 2014) Alexander af Jochnick, Helle Kruse Nielsen and Christian Salamon. Christian Salamon has acted chairman of the committee. The CFO and the Vice President Group Risk and Compliance report to the Audit Committee and are together with the Company’s auditors invited to all regular meetings.
AUDITORThe Annual General Meeting held on 19 May 2014 resolved to re-elect KPMG Luxembourg, Société coopérative as independent auditor in respect of the statutory accounts and consolidated financial statements until the close of business of the next Annual General Meeting to be held on 19 May 2015. KPMG Luxembourg, Société coopérative is the Luxembourg member firm of KPMG International and has been engaged as Oriflame’s independent auditor since 21 May 2007. KPMG Luxembourg, Société coopérative team is since 2013 headed by Stephen Nye. During the past seven years, KPMG has provided advice to the Company on fiscal and other matters. Apart from his engagement with Oriflame, Stephen Nye holds no assignments for any persons affiliated with Oriflame or for any of Oriflame’s larger shareholders. In connection to the year-end audit, KPMG met with the Board on 10 February 2015 in order to present their findings and report on their views on the quality of Group reporting and affiliated matters related to Group auditing. KPMG audit team is also regularly invited and attending the Audit Committee meetings throughout the year.
ORIFLAME MANAGEMENT AND ORGANISATIONCEO and Corporate Committee The CEO is appointed by the Board and is responsible for the day-to-day control of the Group. Oriflame’s Chief Executive Officer Magnus Brännström was born in Sweden in 1966. Graduate of Uppsala University, Sweden, he joined Oriflame as Managing Director of Russia in 1997. He then became Regional Director for CIS, Baltics and Asia. CEO since 2005.
The Corporate Committee is responsible for the implementation of the Group strategy, business control and the distribution of resources between the regions. The Corporate Committee is headed by the CEO. In addition to the CEO, the Corporate Committee consists of Jesper Martinsson (Executive Vice President Global Sales & Markets and Deputy CEO) and Gabriel Bennet (Chief Financial Officer). The allocation of duties and responsibilities within and between the Board and the CEO, the CFO and the Deputy CEO are set out in the Officer Instructions drawn up by the Board. The Instructions are reviewed and reconfirmed or amended by the Board at least once per year.
Group ManagementTo support the continued implementation of Oriflame’s strategy and initiatives Oriflame’s Corporate Committee appointed a new Group Man-agement team in November 2014. In addition to the Corporate Committee Members, Group Management consists of the following Vice Presidents:
• Jonathan Kimber, Senior Vice President and Head of Product Range and R&D
• Mats Palmquist, Senior Vice President and Head of Global Operations
• Johan Rosenberg, Senior Vice President and Head of CIS
• Thomas Ekberg, Senior Vice President and Head of Global Business Area Turkey, Africa and Asia
• Michael Cervell, Senior Vice President Global Direct Sales
• Antonia Simon-Stenberg, Vice President Sustainability and Quality
46

Management Business Review The Oriflame Corporate Committee has a full end to end review once a month to secure compliance with the business strategy and the desired position. The process is led by an appointed business review leader, and executives and senior managers in the business are invited to review certain areas. The Management Business Review covers all core business processes within Oriflame, such as New Product Development, Demand & Commercial and Operations. The process is illustrated in the model presented below.
Regional management Oriflame distributes its products through a network of over 3 million independent Oriflame Consultants in more than 60 countries. Group segmentation is based on geographic cosmetics sales by region, being CIS, Europe, Latin America and Turkey, Africa & Asia. Each region has its own staff and resources to facilitate its effective control and is headed by a Regional Director. Each Regional Director reports to the Deputy CEO.
In addition to daily operations, the tasks of regional management include drawing up proposals for strategic regional development and investment. These are reviewed by the corporate functions and presented to the Board for approval within the strategy and target review meetings.
Oriflame has local presence in each region in the form of wholly-owned sales companies in a total of 55 markets. In 11 markets, Oriflame acts through franchise arrangements with local distributors rather than through subsidiaries. Some sales companies operate with their own warehouse facilities, others are supplied by regional distribution hubs.
Global Support and Service The sales companies are supported by global service functions. The global support and service functions consist of Finance, Supply, IT and Online, Marketing and Sales Support functions. Oriflame’s global support and service functions are located primarily in Schaffhausen and Fribourg, Swit-zerland; Warsaw, Poland; Stockholm, Sweden; Prague, Czech Republic; Delhi, India and Bray, Ireland where support functions in the fields of R&D,
Financial appraisal
STRATEGY BUSINESS PLANPERFORMANCE
Demand & Commercial Review
Management Business Review
Product ReviewOperations Review
Integrated Reconcilitation
Latest view &recommendation
47
CO
NSO
LID
ATED
FIN
ANC
IAL
STAT
EMEN
TS

Marketing, Sales Support, Global Supply, IT, Online, HR, and Finance are placed. The teams work together with the common objective of giving Oriflame a competitive advantage by supplying first class service and support to the local sales companies.
PRINCIPLES OF REMUNERATION FOR SENIOR EXECUTIVESSalaries Oriflame offers competitive salaries according to position and market in order to attract and retain the best individuals for the positions.
Fixed and variable components Oriflame allocates 6.5 percent of any increase in operating profit to profit sharing to be shared with management among those on Executive Vice President level and up, however for each individual never more than an equivalent of 12 months salary. The allocation is according to position and flexed according to performance in the year. The 6.5 percent includes company cost for social charges.
Moreover, the Company currently offers a share incentive plan which covers the top (approx.) 100 Executives and Managers. Each year the individuals covered by the plan are invited to invest in a number of shares at the current market price. In return for this they will in three years time receive a number of free shares. For further information, see note 23 in the financial statements.
Pensions Senior Executives are offered pension benefits that are competitive in the country where the individual is resident. Oriflame pays pensions into an independent defined contribution scheme. In addition, Oriflame has defined contribution schemes for some of its employees in compliance with pension requirements in the countries in which it operates.
Non-monetarybenefitsMembers of the Corporate Committee and certain other Executives are entitled to customary non-monetary benefits such as company cars and company health care. Moreover, expatriate individuals may be offered company housing and other benefits including school fees.
48

This report on internal control and monitoring has been prepared in accordance with the Swedish Corporate Governance Code and has been reviewed by the Company’s auditor.
Back in 2010, the Group selected the COSO framework as a basis for internal control. The COSO framework was issued by the Committee of Sponsoring Organisations of the Treadway Commission. The framework consists of five components:
– Control environment,
– Risk assessment,
– Control activities,
– Information and communication,
– Monitoring.
Since then, Internal Control is a permanent function within the Group.
CONTROL ENVIRONMENTThe Board has the overall responsibility to ensure that the Group’s system for management and internal control is effective. The Group’s internal con-trol system includes policies for measurement, acquisition and protection of assets, controlling the accuracy and reliability of reports, and ensuring compliance with defined guidelines. The policies and guidelines are the foundation for appropriate internal control.
The Board has also ensured that the organisational structure is logical and transparent, with clear roles, responsibilities and processes that facili-tate the effective management of operational risks and enable the Group to fulfil its goals. This process includes the evaluation by the Board of the business performance and results through reports that contain results, forecasts and targets. Also, the Board reviews the interim and annual reports before they are presented externally.
The Audit Committee (composed of board members) monitors effectiveness of internal controls, considers critical questions regarding accounting and regulatory compliance. The Group’s auditor is invited to participate in the regular meetings of the Audit Committee. The Group Risk and Compliance Director is also regular invitee to the Audit Committee meetings, in his position of head of internal control, in order to present the latest developments on internal controls, related policies, procedures and to formally request approval of the Audit Committee, where relevant.
For each business area and corporate function, the Chief Financial Officer has appointed a Vice President Finance, who is responsible for the imple-mentation and maintenance of internal control processes, as well as for reporting in accordance with Group guidelines and ensuring compliance with local laws and regulations. In addition, Internal Control Managers for each business area coordinate and verify internal control in their area of responsibility, under the supervision of the Group Risk and Compliance Director.
Since 2011, the Group has deployed an internal control software plat-form, allows real time monitoring, as well as the storage of historical data.
Finance Managers of each entity are in charge of implementation and documentation of the internal controls. Internal Control Managers, Regional Finance Directors, the Vice Presidents Finance of functions and business areas are in charge of verifying internal controls implemented locally.
Furthermore, in order to further strengthen the attention to risk and compliance matters within the organisation, Oriflame has appointed a Vice President Group Risk and Compliance since 2013.
RISK ASSESSMENT As for controls related to the financial area, the major risk areas for mate-rial misstatements in the financial reporting were already in 2009 defined as follows: inventory, cash and bank, credit process, sales, performance discount and bonuses, and information technology system. These financial reporting risks were addressed during 2011, as well as together with two additionally identified financial risks: Accounts payables and risks related to the hedging function of the Treasury department. In 2012, the Group has added legal compliance and fixed assets control processes to the management of risks related to corporate integrity.
In 2013, the management of risks related to the hedging function of the Treasury department was further addressed by implementing a dedicated control process. In addition, all the relevant control processes already in force in the sales entities were extended to the manufacturing entities and to the main trading branch.
In 2014, the Group implemented internal control processes for Tax reporting & Consolidation, as well as expanded the scope and depth of Treasury-related controls.
Report on Internal Control and Monitoring
49
CO
NSO
LID
ATED
FIN
ANC
IAL
STAT
EMEN
TS
CONTROL ACTIVITIES A process description follows the logical structure of the business and reporting flow, with a clear definition of steps and related key controls. It also assigns responsibilities to different positions involved in the process and states the reasons for the control.
The key controls encompass the controls that are most critical to the integrity of financial statements. Non-key controls are also in place for risks that may not affect the financial statements, but are critical to the good execution of operations.
The Vice Presidents Finance monitor the operations by performing analytical controls such as follow-up on forecasts and budgets, analysis of results and balance sheet items, business reviews and commentaries on markets’ and functions’ (supply, marketing) performance. The result of this work is periodically reported to management and group functions concerned. The functional departments regularly monitor their respec-tive areas of responsibility in order to identify potential risks and errors.
INFORMATION AND COMMUNICATION The Group maintains information and communication channels intended to ensure the effective provision of accurate information regarding financial information. Policies and guidelines on financial reporting are revised and updated continuously and are made available internally on the Group’s intranet and via memorandums and internal meetings. There are also formal and informal information channels that enable employees to communicate important information to relevant recipients. A policy for communication and information with external parties is in place on the Group’s intranet to ensure that accurate and appropriate information is provided to external parties.
The control process descriptions, internal controls and documentation are available to the relevant employees through the Internal Control software platform.
MONITORING The internal control system is continuously monitored at group level by the Group Risk and Compliance Director, and pending matters or concerns are addressed to the relevant personnel immediately. If an internal control is not implemented or if the documentation is not relevant, the Finance Manager in charge is asked to perform or correct the control procedure and provide new or relevant evidence. Internal control managers are also involved in the continuous improvement of the internal control system, along with the Group Risk and Compliance Director.
50

Statements from the Board of DirectorsThe consolidated financial statements are prepared in accordance with IFRS as adopted by the European Union and give a true and fair view of the consolidated financial position of Oriflame and of its consolidated financial performance. The Directors’ report includes a fair review of the development and performance of the business and the position of the entity and the undertakings included in the consolidation taken as a whole, together with a description of the principal risks and uncertainties that the Group faces.
Luxembourg, 14 April 2015
Alexander af JochnickChairman of the Board
Anders Dahlvig Lilian Fossum Biner Jonas af Jochnick Robert af Jochnick
Helle Kruse Nielsen Anna Malmhake Christian Salamon Magnus Brännström CEO
51
CO
NSO
LID
ATED
FIN
ANC
IAL
STAT
EMEN
TS

Consolidated income statementsYEAR ENDED 31 DECEMBER
€’000 Note 2014 2013
Sales 3 1,265,849 1,406,721Cost of sales (399,468) (420,291)
Grossprofit 866,381 986,430
Other income 4 44,998 51,811Selling and marketing expenses (474,496) (525,847)Distribution and infrastructure (103,560) (114,724)Administrative expenses 6, 7 (238,597) (261,062)
Operatingprofit 94,726 136,608
Analysisofoperatingprofit: Adjusted operating profit 97,795 142,394 Non-recurring items 29 (3,069) (5,786)
Operatingprofit 94,726 136,608
Financial income 9 77,694 38,959Financial expenses 9, 30 (98,220) (68,538)
Netfinancingcosts (20,526) (29,579)
Netprofitbeforeincometax 74,200 107,029 Current tax 10 (32,930) (25,784)Deferred tax 10, 15 (3,818) (2,602)
Total income tax expense 10 (36,748) (28,386)
Netprofit 37,452 78,643
Earnings per share, € 11Basic 0.67 1.41Diluted 0.67 1.41
The attached notes on pages 57 to 90 form an integral part of the consolidated financial statements.
52

Consolidated statements of comprehensive incomeYEAR ENDED 31 DECEMBER
€’000 Note 2014 2013
Netprofit 37,452 78,643
Other comprehensive incomeItems that will not be reclassified subsequently to profit or loss:Revaluation reserve 9, 20 (446) (454)Items that are or may be reclassified subsequently to profit or loss:Foreign currency translation differences for foreign operations 9, 20 (52,276) (24,797)Effective portion of changes in fair value of cash flow hedges, net of tax 9 2,379 (261)
Total items that are or may be reclassified subsequently to profit or loss (49,897) (25,058)
Othercomprehensivelossfortheyear,netoftax (50,343) (25,512)
Totalcomprehensive(loss)/incomefortheyear (12,891) 53,131
The attached notes on pages 57 to 90 form an integral part of the consolidated financial statements.
53
CO
NSO
LID
ATED
FIN
ANC
IAL
STAT
EMEN
TS

Consolidated statements of financial position 31 December 31 December
€’000 Note 2014 2013
AssetsProperty, plant and equipment 12 172,904 254,537Intangible assets 13 19,532 20,802Investment property 14 542 928Deferred tax assets 15 19,201 26,614Other long-term receivables 1,008 1,129
Totalnon-currentassets 213,187 304,010
Inventories 16 169,478 196,876Trade and other receivables 17 81,410 83,597Tax receivables 5,865 2,894Prepaid expenses 43,563 53,412Derivative financial assets 28.3 90,067 18,973Cash and cash equivalents 18 95,569 107,336
Totalcurrentassets 485,952 463,088
Totalassets 699,139 767,098
31 December 31 December
€’000 Note 2014 2013
EquityShare capital 19 71,527 71,517Treasury shares 19 (41,235) (41,235)Reserves 20 (135,306) (84,458)Retained earnings 245,931 222,379
Totalequity 140,917 168,203
LiabilitiesInterest-bearing loans 21 310,329 379,672Other long-term non interest-bearing liabilities 1,433 2,592Deferred income 279 406Deferred tax liabilities 15 3,232 4,621
Totalnon-currentliabilities 315,273 387,291
Current portion of interest-bearing loans 21 30,163 2,744Trade and other payables 22 86,915 82,357Deferred income 2,948 3,148Tax payables 12,492 10,878Accrued expenses 31 88,769 98,082Derivative financial liabilities 28.3 14,652 6,440Provisions 26 7,010 7,955
Totalcurrentliabilities 242,949 211,604
Totalliabilities 558,222 598,895
Totalequityandliabilities 699,139 767,098
The attached notes on pages 57 to 90 form an integral part of the consolidated financial statements.
54
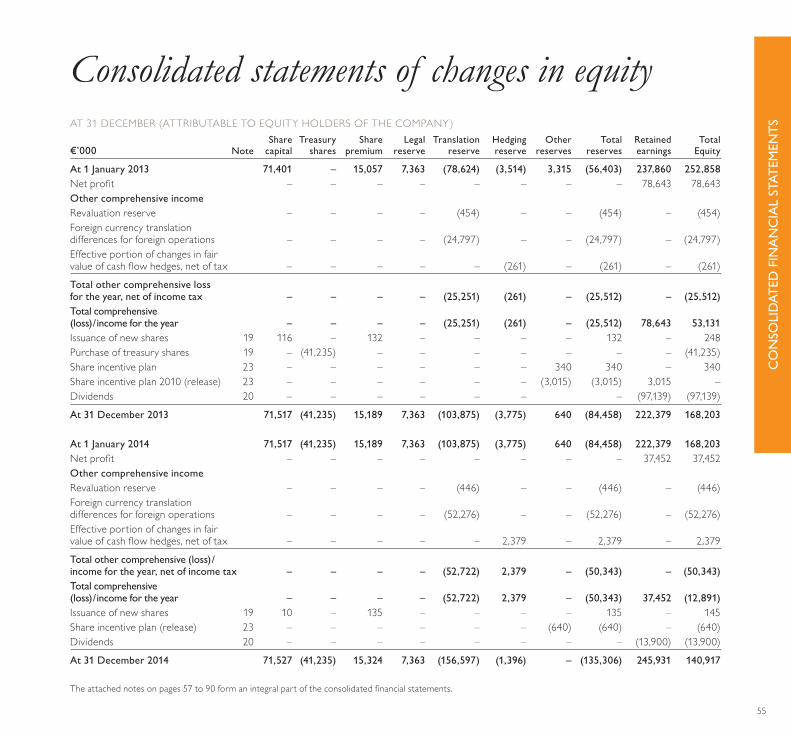
Consolidated statements of changes in equityAT 31 DECEMBER (ATTRIBUTABLE TO EQUITY HOLDERS OF THE COMPANY) Share Treasury Share Legal Translation Hedging Other Total Retained Total€’000 Note capital shares premium reserve reserve reserve reserves reserves earnings Equity
At1January2013 71,401 – 15,057 7,363 (78,624) (3,514) 3,315 (56,403) 237,860 252,858Net profit – – – – – – – – 78,643 78,643Other comprehensive incomeRevaluation reserve – – – – (454) – – (454) – (454)Foreign currency translation differences for foreign operations – – – – (24,797) – – (24,797) – (24,797)Effective portion of changes in fairvalue of cash flow hedges, net of tax – – – – – (261) – (261) – (261)
Total other comprehensive lossfortheyear,netofincometax – – – – (25,251) (261) – (25,512) – (25,512)Total comprehensive (loss)/incomefortheyear – – – – (25,251) (261) – (25,512) 78,643 53,131Issuance of new shares 19 116 – 132 – – – – 132 – 248Purchase of treasury shares 19 – (41,235) – – – – – – – (41,235)Share incentive plan 23 – – – – – – 340 340 – 340Share incentive plan 2010 (release) 23 – – – – – – (3,015) (3,015) 3,015 – Dividends 20 – – – – – – – (97,139) (97,139)
At31December2013 71,517 (41,235) 15,189 7,363 (103,875) (3,775) 640 (84,458) 222,379 168,203 At1January2014 71,517 (41,235) 15,189 7,363 (103,875) (3,775) 640 (84,458) 222,379 168,203Net profit – – – – – – – – 37,452 37,452Other comprehensive incomeRevaluation reserve – – – – (446) – – (446) – (446)Foreign currency translation differences for foreign operations – – – – (52,276) – – (52,276) – (52,276)Effective portion of changes in fair value of cash flow hedges, net of tax – – – – – 2,379 – 2,379 – 2,379
Totalothercomprehensive(loss)/incomefortheyear,netofincometax – – – – (52,722) 2,379 – (50,343) – (50,343)Total comprehensive (loss)/incomefortheyear – – – – (52,722) 2,379 – (50,343) 37,452 (12,891)Issuance of new shares 19 10 – 135 – – – – 135 – 145Share incentive plan (release) 23 – – – – – – (640) (640) – (640)Dividends 20 – – – – – – – – (13,900) (13,900)
At31December2014 71,527 (41,235) 15,324 7,363 (156,597) (1,396) – (135,306) 245,931 140,917
The attached notes on pages 57 to 90 form an integral part of the consolidated financial statements.
55
CO
NSO
LID
ATED
FIN
ANC
IAL
STAT
EMEN
TS
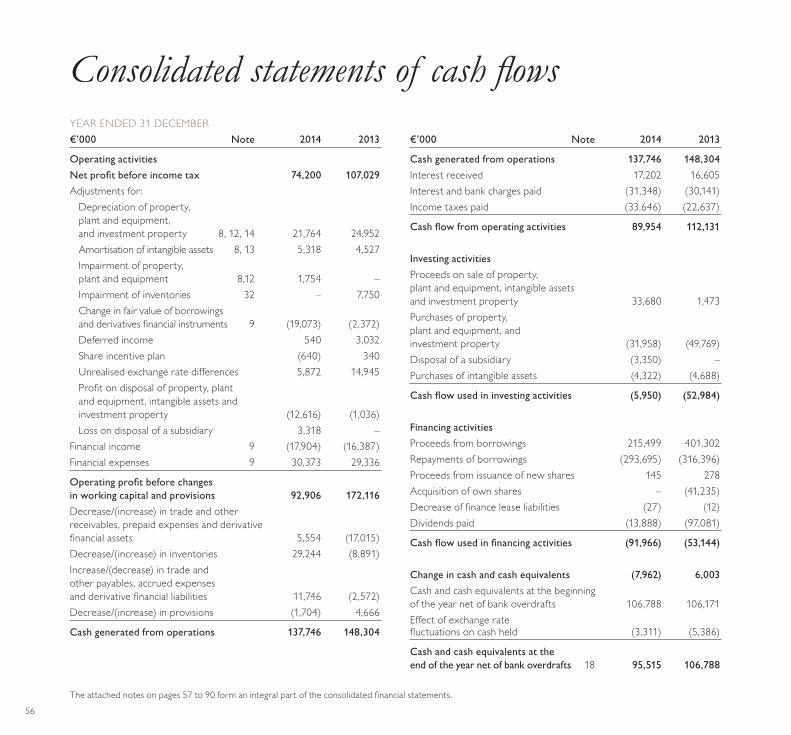
Consolidated statements of cash flowsYEAR ENDED 31 DECEMBER€’000 Note 2014 2013
Operating activitiesNetprofitbeforeincometax 74,200 107,029Adjustments for: Depreciation of property, plant and equipment, and investment property 8, 12, 14 21,764 24,952 Amortisation of intangible assets 8, 13 5,318 4,527 Impairment of property, plant and equipment 8,12 1,754 – Impairment of inventories 32 – 7,750 Change in fair value of borrowings and derivatives financial instruments 9 (19,073) (2,372) Deferred income 540 3,032 Share incentive plan (640) 340 Unrealised exchange rate differences 5,872 14,945 Profit on disposal of property, plant and equipment, intangible assets and investment property (12,616) (1,036) Loss on disposal of a subsidiary 3,318 –Financial income 9 (17,904) (16,387)Financial expenses 9 30,373 29,336
Operatingprofitbeforechangesinworkingcapitalandprovisions 92,906 172,116Decrease/(increase) in trade and other receivables, prepaid expenses and derivative financial assets 5,554 (17,015)Decrease/(increase) in inventories 29,244 (8,891)Increase/(decrease) in trade and other payables, accrued expenses and derivative financial liabilities 11,746 (2,572)Decrease/(increase) in provisions (1,704) 4,666
Cashgeneratedfromoperations 137,746 148,304
€’000 Note 2014 2013
Cashgeneratedfromoperations 137,746 148,304Interest received 17,202 16,605Interest and bank charges paid (31,348) (30,141)Income taxes paid (33,646) (22,637)
Cashflowfromoperatingactivities 89,954 112,131
Investing activitiesProceeds on sale of property, plant and equipment, intangible assets and investment property 33,680 1,473Purchases of property, plant and equipment, and investment property (31,958) (49,769)Disposal of a subsidiary (3,350) –Purchases of intangible assets (4,322) (4,688)
Cashflowusedininvestingactivities (5,950) (52,984)
Financing activitiesProceeds from borrowings 215,499 401,302Repayments of borrowings (293,695) (316,396)Proceeds from issuance of new shares 145 278Acquisition of own shares – (41,235)Decrease of finance lease liabilities (27) (12)Dividends paid (13,888) (97,081)
Cashflowusedinfinancingactivities (91,966) (53,144)
Changeincashandcashequivalents (7,962) 6,003Cash and cash equivalents at the beginningof the year net of bank overdrafts 106,788 106,171Effect of exchange rate fluctuations on cash held (3,311) (5,386)
Cash and cash equivalents at the end of the year net of bank overdrafts 18 95,515 106,788
The attached notes on pages 57 to 90 form an integral part of the consolidated financial statements.
56
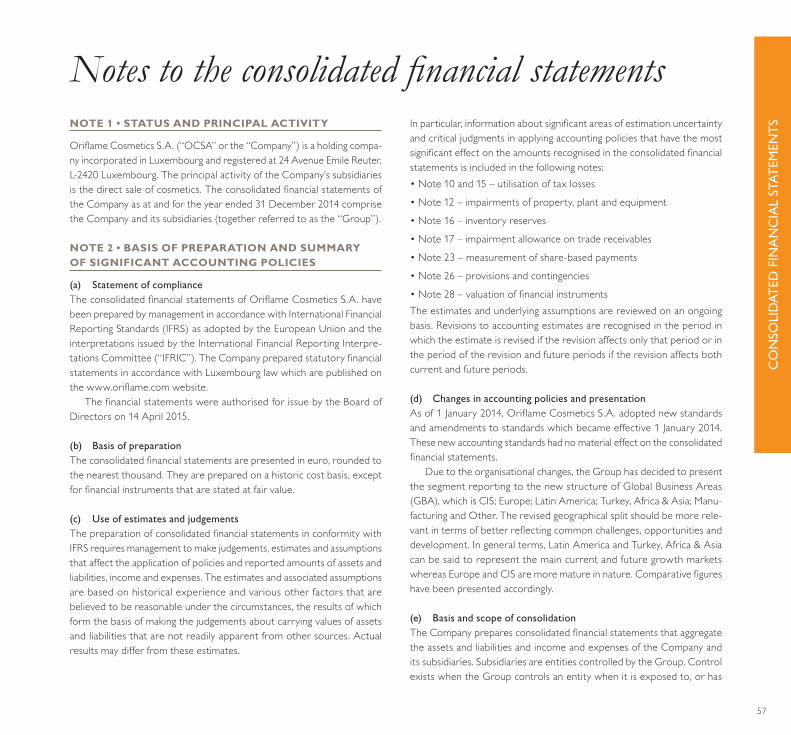
Notes to the consolidated financial statementsNOTE 1 • STATUS AND PRINCIPAL ACTIVITY
Oriflame Cosmetics S.A. (“OCSA” or the “Company”) is a holding compa-ny incorporated in Luxembourg and registered at 24 Avenue Emile Reuter, L-2420 Luxembourg. The principal activity of the Company’s subsidiaries is the direct sale of cosmetics. The consolidated financial statements of the Company as at and for the year ended 31 December 2014 comprise the Company and its subsidiaries (together referred to as the “Group”).
NOTE 2 • BASIS OF PREPARATION AND SUMMARY OF SIGNIFICANT ACCOUNTING POLICIES
(a) StatementofcomplianceThe consolidated financial statements of Oriflame Cosmetics S.A. have been prepared by management in accordance with International Financial Reporting Standards (IFRS) as adopted by the European Union and the interpretations issued by the International Financial Reporting Interpre-tations Committee (“IFRIC”). The Company prepared statutory financial statements in accordance with Luxembourg law which are published on the www.oriflame.com website.
The financial statements were authorised for issue by the Board of Directors on 14 April 2015.
(b) BasisofpreparationThe consolidated financial statements are presented in euro, rounded to the nearest thousand. They are prepared on a historic cost basis, except for financial instruments that are stated at fair value.
(c) UseofestimatesandjudgementsThe preparation of consolidated financial statements in conformity with IFRS requires management to make judgements, estimates and assumptions that affect the application of policies and reported amounts of assets and liabilities, income and expenses. The estimates and associated assumptions are based on historical experience and various other factors that are believed to be reasonable under the circumstances, the results of which form the basis of making the judgements about carrying values of assets and liabilities that are not readily apparent from other sources. Actual results may differ from these estimates.
In particular, information about significant areas of estimation uncertainty and critical judgments in applying accounting policies that have the most significant effect on the amounts recognised in the consolidated financial statements is included in the following notes: • Note 10 and 15 – utilisation of tax losses
• Note 12 – impairments of property, plant and equipment
• Note 16 – inventory reserves
• Note 17 – impairment allowance on trade receivables
• Note 23 – measurement of share-based payments
• Note 26 – provisions and contingencies
• Note 28 – valuation of financial instrumentsThe estimates and underlying assumptions are reviewed on an ongoing basis. Revisions to accounting estimates are recognised in the period in which the estimate is revised if the revision affects only that period or in the period of the revision and future periods if the revision affects both current and future periods.
(d) ChangesinaccountingpoliciesandpresentationAs of 1 January 2014, Oriflame Cosmetics S.A. adopted new standards and amendments to standards which became effective 1 January 2014. These new accounting standards had no material effect on the consolidated financial statements.
Due to the organisational changes, the Group has decided to present the segment reporting to the new structure of Global Business Areas (GBA), which is CIS; Europe; Latin America; Turkey, Africa & Asia; Manu-facturing and Other. The revised geographical split should be more rele-vant in terms of better reflecting common challenges, opportunities and development. In general terms, Latin America and Turkey, Africa & Asia can be said to represent the main current and future growth markets whereas Europe and CIS are more mature in nature. Comparative figures have been presented accordingly.
(e) BasisandscopeofconsolidationThe Company prepares consolidated financial statements that aggregate the assets and liabilities and income and expenses of the Company and its subsidiaries. Subsidiaries are entities controlled by the Group. Control exists when the Group controls an entity when it is exposed to, or has
57
CO
NSO
LID
ATED
FIN
ANC
IAL
STAT
EMEN
TS

the rights to, variable returns from its involvement with the entity and has the ability to affect those returns through its power over the entity. The financial statements of subsidiaries are included in the consolidated financial statements from the date that control commences until the date control ceases.
Intra-group balances and any unrealised gains and losses or income and expenses arising from intra-group transactions, are eliminated in preparing the consolidated financial statements.
The scope of consolidation is affected by acquisitions and disposals.
(f) ForeigncurrenciesTransactions in foreign currencies are translated at the foreign exchange rate ruling at the date of the transaction. Monetary assets and liabilities denominated in foreign currencies at the reporting date are translated to euro at the foreign exchange rate ruling at that date. Foreign exchange differences arising on revaluation of monetary assets and liabilities are recognised in the consolidated income statements. Non-monetary assets and liabilities that are measured in terms of historical cost in a foreign cur-rency are translated using the exchange rate at the date of the transaction. Non-monetary assets and liabilities denominated in foreign currencies that are stated at fair value are translated to euro at foreign exchange rates ruling at the dates the fair value was determined.
Assets and liabilities of foreign operations, including goodwill and fair value adjustments arising on consolidation, are translated at the closing rate of exchange at the reporting date and profits and losses at monthly average rates. Exchange differences arising on trading transactions are included in earnings for the period and exchange differences arising on the translation of the financial statements of foreign subsidiaries are reported as movements in translation reserves. Exchange differences arising on loans between subsidiaries which are of a long term investment nature, where settlement is not planned or anticipated in the foreseeable future, are reported as movements in translation reserves until the disposal of the net investment, at which time they are recognised in the consolidated income statements.
(g) BusinesscombinationsandrelatedgoodwillBusiness combinations are accounted for using the acquisition method. Identifiable assets acquired and liabilities and contingent liabilities assumed in a business combination are measured initially at their fair values at the acquisition date. The consideration transferred is measured at fair value and includes the fair value of any contingent consideration. Subsequent changes in contingent consideration, when not classified as equity, are recognised in profit or loss. The acquisition-related costs are charged to the income statement in the period in which they are incurred.
Goodwill is recorded as the surplus of the consideration transferred over the Group’s interest in the fair value of the acquired net assets. Goodwill is not amortised but tested for impairment annually and upon the occur-rence of an indication of impairment. The impairment testing process is described in the section (s) of the accounting policy.
(h) DerivativefinancialassetsandliabilitiesThe Group uses derivative financial instruments to hedge its exposure to foreign exchange and interest rate risks arising from operational, invest-ing and financing activities. The Group does not hold or issue derivative financial instruments for trading purposes. However, derivates that do not qualify for hedge accounting are accounted for as trading instruments.
Derivative financial instruments are recognised initially at cost. Subse-quent to initial recognition, derivative financial instruments are stated at fair value. The gain or loss on re-measurement to fair value is recognised immediately in profit or loss. However, where derivatives qualify for hedge accounting, recognition of any resultant gain or loss depends on the nature of the item being hedged (see accounting policy (i)).
(i) Hedging(i) Cash flow hedgesWhere a derivative financial instrument is designated as a hedge of the variability on cash flows of a recognised liability, a firm commitment or a highly probable transaction, the effective part of any gain or loss on the derivative financial instrument is recognised directly in equity. When the firm commitment or forecasted transaction results in the recognition of an asset or a liability, the cumulative gain or loss is removed from equity and included in the initial measurement of the asset or liability. Other-wise the cumulative gain or loss is removed from equity and recognised in the consolidated income statements at the same time as the hedged transaction. The ineffective part of any gain or loss is recognised in the consolidated income statements immediately.
When a hedging instrument expires or is sold, terminated or exer-cised, or the entity revokes designation of the hedge relationship but the hedged forecast transaction is still expected to occur, the cumulative gain or loss at that point remains in equity and is recognised in accordance with the above policy when the transaction occurs. If the hedged transaction is no longer expected to take place, the cumulative unrealised gain or loss recognised in equity is recognised immediately in the consolidated income statements.
Note 2 continued
58

(ii) Hedges of monetary assets and liabilitiesWhere a derivative financial instrument is used economically to hedge the foreign exchange exposure of a recognised monetary asset or liability, no hedge accounting is applied and any gain or loss on the hedging instrument is recognised in the consolidated income statements.
(iii) Hedge of net investment in foreign operationWhere a foreign currency liability hedges a net investment in a foreign operation, foreign exchange differences arising on translation of the liability are recognised directly in equity.
(j) Salesrevenueandotherincome(i) Sale of goodsRevenue, which excludes value added tax and other applicable turnover taxes, represent sales to individual sales consultants and licensed distri- butors or, in the case of mail order and retail sales, to individual customers or, in case of 3rd party suppliers, royalties income. Sales are recognised in the consolidated income statements when the significant risks and rewards of ownership have been transferred to the buyer. No revenue is recognised if there are significant uncertainties regarding recovery of the consideration due.
(ii) Loyalty programmesRevenue is allocated between the loyalty programmes and the other com-ponents of sale. The amount allocated to loyalty programmes is deferred, and is recognised as revenue when the Group has fulfilled its obligation to supply the free or discounted products under the terms of the programmes or when it is no longer probable that the points under the programmes will be redeemed.
(iii) Other incomeOther income comprises catalogues sales, freight income and rental income.
(k) Employeebenefits(i) Pension obligationsObligations for contributions to defined contribution pension plans are recognised as an expense in the consolidated income statements as incurred.
(ii) Equity related compensationShare options granted under Company stock option programs allow employees to acquire shares of the Company. The fair value of the options granted is recognised as an employee expense with a corresponding increase in equity. The fair value is measured at the grant date and spread
over the period during which the employees become unconditionally entitled to the options. The amount recognised as an expense is adjusted to reflect the actual number of share options that vest.
(l) TaxationIncome taxes for the year comprise current and deferred taxes, calculated using rates enacted or substantively enacted at the balance sheet date.
Current tax is the expected tax payable on taxable income for the year, any adjustments to tax payable in respect to previous years and other corporate taxes payable.
Deferred tax is provided using the liability method and thus is cal-culated on temporary differences between the tax bases of assets and liabilities and their respective carrying amounts in the consolidated balance sheet. Deferred tax assets, including those related to unused tax losses, are recognised to the extent that it is probable that future taxable profit will be available against which the assets can be utilised. Deferred tax liabilities associated with investments in subsidiaries are not recognised as the Group is able to control the timing of the reversal of the temporary differences.
The Group’s policy is to comply fully with applicable tax regulations in all jurisdictions in which the operations are subject to income taxes.
The Group’s estimates of current income tax expense and liabilities are calculated assuming that all tax computations filed by the subsidiaries will be subject to review or audit by the relevant tax authorities. Taxes and fiscal risks recognised in the consolidated financial statements reflect Group Management’s best estimate of the outcome based on the facts known at the balance sheet date in each individual country. These facts may include but are not limited to change in tax laws and interpretation thereof in the various jurisdictions where the Group operates. The recorded provisions are released when the tax audit of the applicable year is completed or otherwise the statute of limitations for the applicable year expires, unless there is evident reason for earlier release.
(m) Intangibleassets(i) Goodwill Goodwill arising on acquisition represents the excess of the cost of acqui-sition over the fair value of the net identifiable assets acquired. Goodwill is stated at cost less any accumulated impairment losses. Goodwill is allo-cated to cash-generating units and is not amortised but is tested annually for impairment.
(ii) Other intangible assetsOther intangible assets acquired by the Group including licenses, software and trademarks are stated at cost less accumulated amortisation and impairment losses.
Note 2 continued
59
CO
NSO
LID
ATED
FIN
ANC
IAL
STAT
EMEN
TS

Property rights have an indefinite useful life. These are not amortised but tested annually for impairment.
(iii) Subsequent expenditureSubsequent expenditure on capitalised intangible assets is capitalised only when it increases the future economic benefits embodied in the specific asset to which it relates. All other expenditures are expensed as incurred.
(iv) Research and developmentDevelopment regarding the design and production of software applications is capitalised if the application is technically sound and the Group has suf-ficient resources to complete development. The expenditure capitalised includes cost for own staff and an appropriate proportion of identifiable overheads. Capitalised development expenditure is stated at cost less accumulated amortisation and impairment losses.
(v) AmortisationAmortisation is charged to the consolidated income statements on a straight-line basis over the estimated useful life of intangible assets unless such lives are indefinite. Goodwill and intangible assets with an indefinite useful life are systematically tested for impairment at each reporting date. Intangible assets, except goodwill and property rights, are amortised from the date they are available for use. The estimated useful life for licenses is 10 years, trademarks between 5 and 10 years, capitalised development costs between 3 and 5 years and software between 3 and 5 years.
(n) Property,plantandequipment(i) Owned assetsItems of property, plant and equipment are stated at purchase price less accumulated depreciation and impairment losses. The cost of assets under construction includes the cost of materials, direct labour and an appropriate proportion of overheads. Borrowing costs are capitalised insofar as they can be allocated directly to the acquisition or production of a qualifying asset. The carrying amounts of tangible assets are reviewed to determine whether they are in excess of their recoverable amount as at each report-ing date. If any such excess exists, the carrying amount is reduced to the recoverable amount with the amount of the reduction recognised as an expense in the consolidated income statements.
Where parts of an item of property, plant and equipment have dif-ferent useful lives, they are accounted for as separate items of property, plant and equipment.
ii) Leased assetsLeases in which the Group assumes substantially all the risks and rewards of ownership are classified as finance leases. The owner-occupied property acquired by way of finance lease is stated at an amount equal to the lower of its fair value and its present value of the minimum lease payments at inception of the lease, less accumulated depreciation and impairment losses.
(iii) Subsequent costsThe Group recognises in the carrying amount of an item of property, plant and equipment the cost of replacing part of such an item when that cost is incurred if it is probable that the future economic benefits embodied with the item will flow to the Group and the cost of the item can be mea-sured reliably. All other costs are recognised in the consolidated income statements as an expense as incurred.
(iv) DepreciationDepreciation is charged to the consolidated income statements on a straight-line basis over the estimated useful life of the assets. For assets under construction, the asset will be depreciated when it is commissioned. Improvements to leasehold property are depreciated over their useful economic life or the duration of the lease, whichever is shortest. Land is not depreciated. Other depreciation rates are as follows:
Buildings 2% – 5% per annum Leasehold improvements 15% – 50% per annumPlant and machinery 7% – 15% per annum Furniture and equipment 15% – 25% per annumComputer equipment 15% – 33% per annumMotor vehicles 15% – 25% per annum
(o) InvestmentpropertyInvestment properties are properties that are held either to earn rental income or for capital appreciation or for both. Investment property is recorded at cost less accumulated depreciation. Depreciation is charged to the consolidated income statements on a straight line basis with rates between 2 to 5 percent per year. The rental income is recognised within other income in the consolidated income statements.
Note 2 continued
60
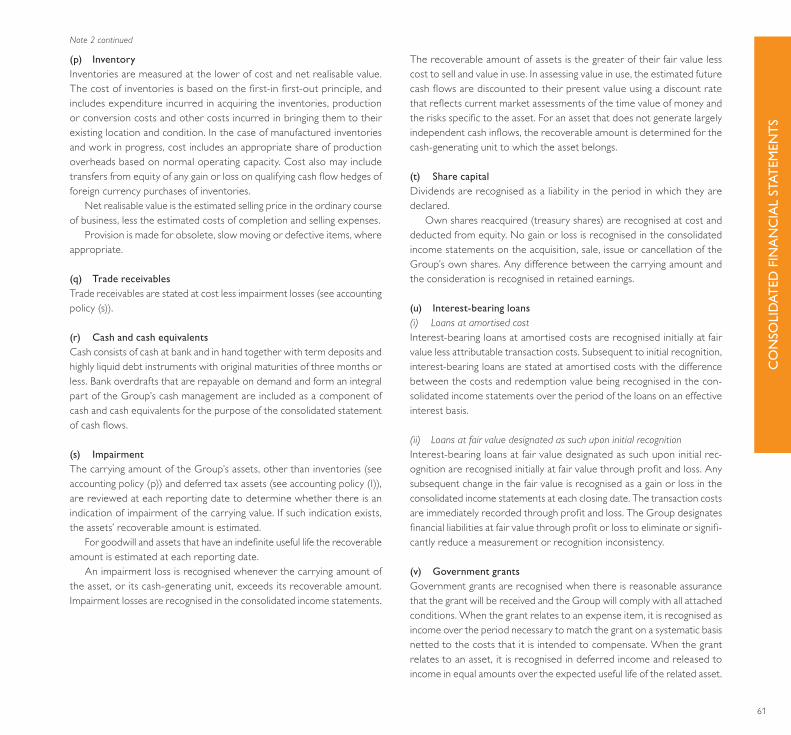
(p) InventoryInventories are measured at the lower of cost and net realisable value. The cost of inventories is based on the first-in first-out principle, and includes expenditure incurred in acquiring the inventories, production or conversion costs and other costs incurred in bringing them to their existing location and condition. In the case of manufactured inventories and work in progress, cost includes an appropriate share of production overheads based on normal operating capacity. Cost also may include transfers from equity of any gain or loss on qualifying cash flow hedges of foreign currency purchases of inventories.
Net realisable value is the estimated selling price in the ordinary course of business, less the estimated costs of completion and selling expenses.
Provision is made for obsolete, slow moving or defective items, where appropriate.
(q) TradereceivablesTrade receivables are stated at cost less impairment losses (see accounting policy (s)).
(r) CashandcashequivalentsCash consists of cash at bank and in hand together with term deposits and highly liquid debt instruments with original maturities of three months or less. Bank overdrafts that are repayable on demand and form an integral part of the Group’s cash management are included as a component of cash and cash equivalents for the purpose of the consolidated statement of cash flows.
(s) ImpairmentThe carrying amount of the Group’s assets, other than inventories (see accounting policy (p)) and deferred tax assets (see accounting policy (l)), are reviewed at each reporting date to determine whether there is an indication of impairment of the carrying value. If such indication exists, the assets’ recoverable amount is estimated.
For goodwill and assets that have an indefinite useful life the recoverable amount is estimated at each reporting date.
An impairment loss is recognised whenever the carrying amount of the asset, or its cash-generating unit, exceeds its recoverable amount. Impairment losses are recognised in the consolidated income statements.
The recoverable amount of assets is the greater of their fair value less cost to sell and value in use. In assessing value in use, the estimated future cash flows are discounted to their present value using a discount rate that reflects current market assessments of the time value of money and the risks specific to the asset. For an asset that does not generate largely independent cash inflows, the recoverable amount is determined for the cash-generating unit to which the asset belongs.
(t) SharecapitalDividends are recognised as a liability in the period in which they are declared.
Own shares reacquired (treasury shares) are recognised at cost and deducted from equity. No gain or loss is recognised in the consolidated income statements on the acquisition, sale, issue or cancellation of the Group’s own shares. Any difference between the carrying amount and the consideration is recognised in retained earnings.
(u) Interest-bearingloans(i) Loans at amortised costInterest-bearing loans at amortised costs are recognised initially at fair value less attributable transaction costs. Subsequent to initial recognition, interest-bearing loans are stated at amortised costs with the difference between the costs and redemption value being recognised in the con-solidated income statements over the period of the loans on an effective interest basis.
(ii) Loans at fair value designated as such upon initial recognitionInterest-bearing loans at fair value designated as such upon initial rec-ognition are recognised initially at fair value through profit and loss. Any subsequent change in the fair value is recognised as a gain or loss in the consolidated income statements at each closing date. The transaction costs are immediately recorded through profit and loss. The Group designates financial liabilities at fair value through profit or loss to eliminate or signifi-cantly reduce a measurement or recognition inconsistency. (v) GovernmentgrantsGovernment grants are recognised when there is reasonable assurance that the grant will be received and the Group will comply with all attached conditions. When the grant relates to an expense item, it is recognised as income over the period necessary to match the grant on a systematic basis netted to the costs that it is intended to compensate. When the grant relates to an asset, it is recognised in deferred income and released to income in equal amounts over the expected useful life of the related asset.
Note 2 continued
61
CO
NSO
LID
ATED
FIN
ANC
IAL
STAT
EMEN
TS
(w) TradepayablesTrade payables are stated at cost.
(x) ProvisionsA provision is recognised in the consolidated statement of financial position when the Group has a present legal or constructive obligation as a result of a past event, and it is probable that an outflow of economic benefits will be required to settle the obligation. If the effect is material, provisions are determined by discounting the expected future cash flows at a pre-tax rate that reflects current market assessments of the time value of money and, where appropriate, the risks specific to the liability.
(i) RestructuringA provision for restructuring is recognised when the Group has approved a detailed and formal restructuring plan, and the restructuring either has commenced or has been announced publicly. Future operating losses are not provided for.
(y) Expenses(i) Operating lease paymentsPayments made under operating leases are recognised in the consolidated income statements on a straight-line basis over the term of the lease. Lease incentives received are recognised in the consolidated income statements as an integral part of the total lease expense.
(ii) Finance lease paymentsMinimum lease payments are apportioned between the finance charge and the reduction of the outstanding liability. The finance charge is allocated to each period during the lease term so as to produce a constant periodic rate of interest on the remaining balance of the liability.
(iii) Net financing costsNet financing costs comprise interest payable on borrowings calculated using the effective interest rate method, net foreign exchange gains or losses, gains and losses on hedging instruments that are recognised in the consolidated income statements and gains and losses on derivative financial assets and liabilities, bank charges and changes in fair value of financial assets and liabilities.
Interest income is recognised in the consolidated income statements as it accrues, using the effective interest method.
The interest expense component of finance lease payments is recognised in the consolidated income statements using the effective interest rate method.
(z) SegmentreportingThe Group determines and presents operating segments based on the information that internally is provided to the Corporate Committee, who is the Group’s chief operating decision maker.
An operating segment is a component of the Group that engages in business activities from which it may earn revenues and incur expenses. Operating segment’s operating results are reviewed regularly by the Cor-porate Committee to make decisions about resources to be allocated to the segment and assess its performance, and for which discrete financial information is available. Segment results that are reported to the Corpo-rate Committee include items directly attributable to a segment as well as those that can be allocated on a reasonable basis. Unallocated items comprise mainly corporate and overhead assets, liabilities and expenses not allocated to the operating segments. Segment capital expenditure is the total cost incurred during the period to acquire property, plant and equipment, and intangible assets other than goodwill. In the framework of the entity-wide disclosures regarding “information about geographical areas”, the Management is of the opinion that materiality threshold is 20 percent for Group purposes.
(aa)HyperinflationaccountingThe income and expenses of foreign operations in hyperinflationary economies are translated to euro at the exchange rate at the reporting date. Prior to translating the financial statements of foreign operations in hyperinflationary economies, their financial statements for the current year are restated to account for changes in the general purchasing power of the local currency. The restatement is based on relevant price indices at the reporting date.
(ab)NewstandardsandinterpretationsnotyetadoptedThe following new and revised Standards and Interpretations have been issued, but are not yet effective. They have not been applied early in these consolidated financial statements. Their impact on the consolidated financial statements of the Group has not yet been systematically analysed. However, a preliminary assessment has been conducted by Group manage- ment and the expected impact of each new or amended Standard and Interpretation is presented below.
Note 2 continued
62
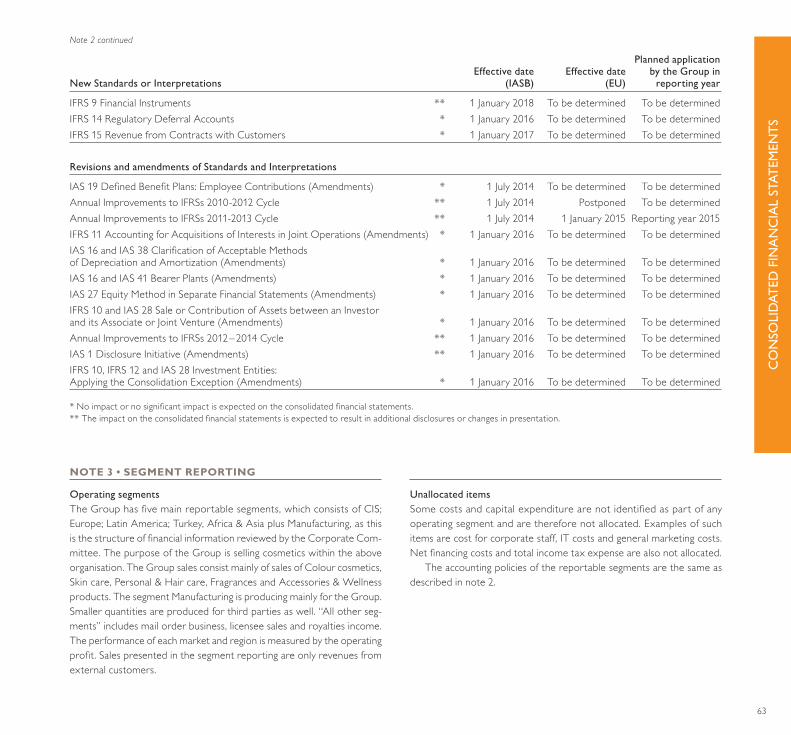
Planned application Effective date Effective date by the Group inNewStandardsorInterpretations (IASB) (EU) reportingyear
IFRS 9 Financial Instruments ** 1 January 2018 To be determined To be determinedIFRS 14 Regulatory Deferral Accounts * 1 January 2016 To be determined To be determinedIFRS 15 Revenue from Contracts with Customers * 1 January 2017 To be determined To be determined
Revisions and amendments of Standards and Interpretations
IAS 19 Defined Benefit Plans: Employee Contributions (Amendments) * 1 July 2014 To be determined To be determinedAnnual Improvements to IFRSs 2010-2012 Cycle ** 1 July 2014 Postponed To be determinedAnnual Improvements to IFRSs 2011-2013 Cycle ** 1 July 2014 1 January 2015 Reporting year 2015IFRS 11 Accounting for Acquisitions of Interests in Joint Operations (Amendments) * 1 January 2016 To be determined To be determinedIAS 16 and IAS 38 Clarification of Acceptable Methods of Depreciation and Amortization (Amendments) * 1 January 2016 To be determined To be determinedIAS 16 and IAS 41 Bearer Plants (Amendments) * 1 January 2016 To be determined To be determinedIAS 27 Equity Method in Separate Financial Statements (Amendments) * 1 January 2016 To be determined To be determinedIFRS 10 and IAS 28 Sale or Contribution of Assets between an Investor and its Associate or Joint Venture (Amendments) * 1 January 2016 To be determined To be determinedAnnual Improvements to IFRSs 2012 – 2014 Cycle ** 1 January 2016 To be determined To be determinedIAS 1 Disclosure Initiative (Amendments) ** 1 January 2016 To be determined To be determinedIFRS 10, IFRS 12 and IAS 28 Investment Entities:Applying the Consolidation Exception (Amendments) * 1 January 2016 To be determined To be determined * No impact or no significant impact is expected on the consolidated financial statements.** The impact on the consolidated financial statements is expected to result in additional disclosures or changes in presentation.
NOTE 3 • SEGMENT REPORTING
Operating segmentsThe Group has five main reportable segments, which consists of CIS; Europe; Latin America; Turkey, Africa & Asia plus Manufacturing, as this is the structure of financial information reviewed by the Corporate Com-mittee. The purpose of the Group is selling cosmetics within the above organisation. The Group sales consist mainly of sales of Colour cosmetics, Skin care, Personal & Hair care, Fragrances and Accessories & Wellness products. The segment Manufacturing is producing mainly for the Group. Smaller quantities are produced for third parties as well. “All other seg-ments” includes mail order business, licensee sales and royalties income. The performance of each market and region is measured by the operating profit. Sales presented in the segment reporting are only revenues from external customers.
UnallocateditemsSome costs and capital expenditure are not identified as part of any operating segment and are therefore not allocated. Examples of such items are cost for corporate staff, IT costs and general marketing costs. Net financing costs and total income tax expense are also not allocated.
The accounting policies of the reportable segments are the same as described in note 2.
Note 2 continued
63
CO
NSO
LID
ATED
FIN
ANC
IAL
STAT
EMEN
TS

Summarised financial information concerning the reportable segments is shown in the following tables:
As per 31 December 2014 Turkey, Latin Africa Manu- Allother Total Unallocated€’000 CIS Europe America & Asia facturing segments segments items Total
Sales 549,440 267,437 122,724 319,021 1,321 5,906 1,265,849 – 1,265,849Operating profit 58,955 30,867 14,684 42,589 (1,820) 2,273 147,548 (52,822) 94,726Net financing costs (20,526)Net profit before income tax 74,200Total income tax expense (36,748)Net profit 37,452Capital expenditure (4,824) (803) (1,153) (4,002) (17,925) – (28,707) (7,573) (36,280)Depreciation & amortisation (4,891) (1,919) (1,084) (2,799) (3,041) (2) (13,736) (13,346) (27,082)Impairment of property, plant and equipment (1,754) – – – – – (1,754) – (1,754)Goodwill – 1,053 – 4,345 – – 5,398 – 5,398
As per 31 December 2013 Turkey, Latin Africa Manu- Allother Total Unallocated€’000 CIS Europe America & Asia facturing segments segments items Total
Sales 694,098 296,452 116,074 291,030 2,171 6,896 1,406,721 – 1,406,721Operating profit 103,247 38,131 15,313 36,355 10,729 1,503 205,278 (68,670) 136,608Net financing costs (29,579)Net profit before income tax 107,029Total income tax expense (28,386)Net profit 78,643Capital expenditure (4,273) (944) (1,366) (4,051) (35,050) (22) (45,706) (8,751) (54,457)Depreciation & amortisation (7,024) (1,819) (1,088) (2,676) (8,906) (18) (21,531) (7,948) (29,479)Goodwill – 1,053 – 4,345 – – 5,398 – 5,398
Sales by major country and the country of domicile of the Company
€ million 2014 2013
Russia 342.0 418.7 Luxembourg* 5.4 6.4 All other 918.4 981.6
Total 1,265.8 1,406.7
* Including Swiss Branch.
A major country is defined as one with total sales greater than 20 percent of consolidated sales. The revenue information above is based on the sales performed by each location.
Note 3 continued
64
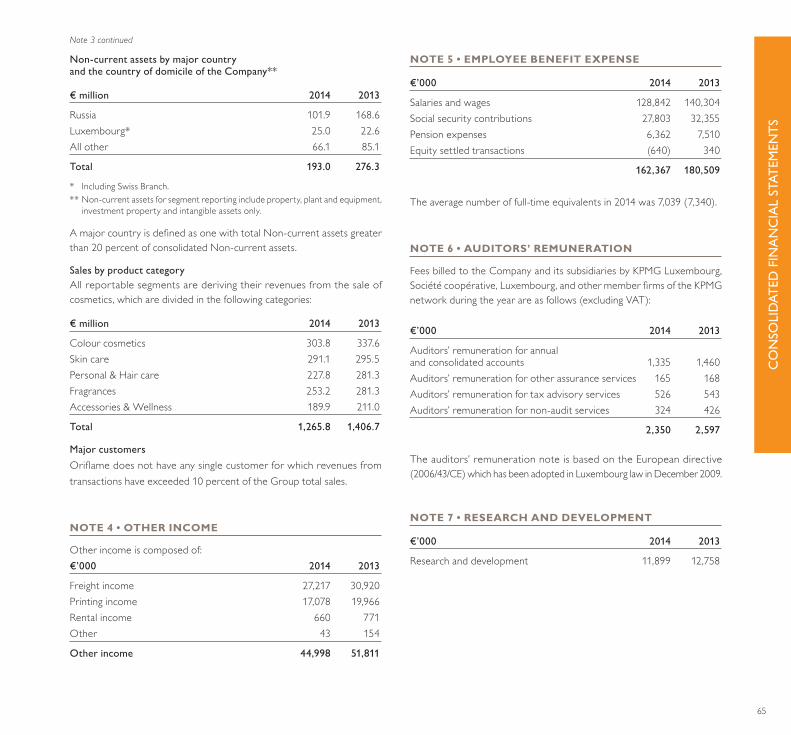
Non-current assets by major country and the country of domicile of the Company**
€ million 2014 2013
Russia 101.9 168.6 Luxembourg* 25.0 22.6 All other 66.1 85.1
Total 193.0 276.3
* Including Swiss Branch.** Non-current assets for segment reporting include property, plant and equipment,
investment property and intangible assets only.
A major country is defined as one with total Non-current assets greater than 20 percent of consolidated Non-current assets.
Sales by product categoryAll reportable segments are deriving their revenues from the sale of cosmetics, which are divided in the following categories:
€ million 2014 2013
Colour cosmetics 303.8 337.6 Skin care 291.1 295.5 Personal & Hair care 227.8 281.3 Fragrances 253.2 281.3 Accessories & Wellness 189.9 211.0
Total 1,265.8 1,406.7
Major customersOriflame does not have any single customer for which revenues from transactions have exceeded 10 percent of the Group total sales.
NOTE 4 • OTHER INCOME
Other income is composed of:€’000 2014 2013
Freight income 27,217 30,920Printing income 17,078 19,966Rental income 660 771Other 43 154
Otherincome 44,998 51,811
NOTE 5 • EMPLOYEE BENEFIT EXPENSE
€’000 2014 2013
Salaries and wages 128,842 140,304Social security contributions 27,803 32,355Pension expenses 6,362 7,510Equity settled transactions (640) 340
162,367 180,509
The average number of full-time equivalents in 2014 was 7,039 (7,340).
NOTE 6 • AUDITORS’ REMUNERATION
Fees billed to the Company and its subsidiaries by KPMG Luxembourg, Société coopérative, Luxembourg, and other member firms of the KPMG network during the year are as follows (excluding VAT):
€’000 2014 2013
Auditors’ remuneration for annualand consolidated accounts 1,335 1,460Auditors’ remuneration for other assurance services 165 168Auditors’ remuneration for tax advisory services 526 543Auditors’ remuneration for non-audit services 324 426
2,350 2,597
The auditors’ remuneration note is based on the European directive (2006/43/CE) which has been adopted in Luxembourg law in December 2009.
NOTE 7 • RESEARCH AND DEVELOPMENT
€’000 2014 2013
Research and development 11,899 12,758
Note 3 continued
65
CO
NSO
LID
ATED
FIN
ANC
IAL
STAT
EMEN
TS

NOTE 8 • DEPRECIATION AND AMORTISATION
€’000 2014 2013
Depreciation 21,764 24,952Amortisation 5,318 4,527Impairment 1,754 −
Depreciationandamortisationexpenses 28,836 29,479
In 2014 amortisation expenses include €81 (€15) which were presented in Cost of sales.
In 2014 the Group impaired property, plant and equipment as explained in note 12.
NOTE 9 • FINANCIAL INCOME AND EXPENSES
Recognised in the consolidated income statements€’000 2014 2013
Interest income on bank deposits 2,166 1,326Interest received on finance lease receivable 42 78Cross currency interest rate swaps income 15,696 14,983Change in fair value of financialassets and liabilities at fair value held for trading:– Forward exchange rate contracts gain 29,530 4,108– Interest rate caps gain – 363– Cross currency interest rate swaps gain 26,294 –– Option exchange rate contract gain 3,966 –Change in fair value of financial assets and liabilities at fair value designated as such upon initial recognition:– USD loan fair value gain – 18,101
Totalfinancialincome 77,694 38,959
€’000 2014 2013
Bank charges and interest expense on loans carried at amortised cost (8,926) (9,440)Interest expense on loan carried at fair value (10,735) (10,253)Cross currency interest rate swaps expense (9,620) (9,643)Option expense (1,092) –Change in fair value of financialassets and liabilities at fair value held for trading:– Forward exchange rate contracts loss (15,753) (1,754)– Interest rate caps loss (1,210) (75)– Cross currency interest rate swaps loss – (18,371)Change in fair value of financial assets and liabilities at fair value designated as such upon initial recognition:– USD loan fair value loss (23,754) –Foreign exchange losses, net (27,130) (19,002)
Totalfinancialexpenses (98,220) (68,538)
Netfinancingcosts (20,526) (29,579)
Recognised in other comprehensive income€’000 2014 2013
Changes in fair value of cash flow hedges 6,833 343 Tax on changes in fair value of cash flow hedges (1,513) (34)Change in fair value of cash flow hedges reclassified to profit or loss:– Cost of sales (3,129) (652)– Selling and marketing expenses (1) (60)– Financial (expenses) / income (138) 79– Current tax 327 63
Effective portion of changes in fairvalueofcashflowhedges,netoftax 2,379 (261)Foreign currency translation differencesfor foreign operations and revaluation reserve (52,722) (25,251)
Financial expenses recognised in othercomprehensiveincome,netoftax (50,343) (25,512)
66

NOTE 10 • INCOME TAX EXPENSE
Recognised in the consolidated income statements€’000 2014 2013
Current tax expense 29,328 26,743Adjustments for prior years* 3,602 (959)
Currenttax 32,930 25,784
Deferred tax expense / (income): – Origination and reversal of temporary differences (1,672) 933– Changes in tax rates (17) (307)– Utilisation of tax losses carried forward** 4,125 1,003– Change in recognition of deductible temporary difference (reversal) 2,575 2,420
– Recognition of previously unrecognised deductible temporary differences (134) (63)
– Recognition of previously unrecognised tax losses carried forward (1,059) (1,384)
Deferredtax 3,818 2,602
Total income tax expense intheconsolidatedincomestatements 36,748 28,386
Reconciliation of effective tax rateNet profit before income tax 74,200 107,029Average applicable tax rate, % 22.1 21.9
% 2014 2013
Adjustments to tax expensesNon-deductible expenses 14.8 3.6Utilisation of previously unrecognisedtax losses carried forward (1.2) (0.2)Recognition of previously unrecognisedtax losses carried forward (1.4) (1.3)Recognition of previously unrecogniseddeductible temporary differences (0.2) (0.1)Increase/(release) of tax provision 1.9 (0.3)Withholding taxes 7.2 3.0Other taxes 1.4 0.8Adjustments for prior years* 4.9 (0.9)Effectivetaxrate 49.5 26.5
Average applicable tax rate is calculated as weighted average from separate countries tax reconciliations using the domestic tax rate in each individual jurisdiction.
The tax rates of the Group’s subsidiaries vary between 0 percent and 34 percent.
Following several years of ongoing tax investigation in Russia, in August 2014 Oriflame received an official claim from the authorities amounting to RUB 0.9 billion (€14.5 million) relating to non-deductibility of royalty payments. The claim corresponds to income tax, VAT and penalty for the years 2009 and 2010. In November 2014 the first level of tax court decision was not in favour of the Company despite confirmations from several local and international experts of adopted tax practices which have been submitted to the court. Oriflame recognised the full amount of the claim, out of which the VAT and VAT penalties amounting to €8.1 million were expensed in Administrative expenses. The impact on the income tax expense is as follows:* € 2.5 million prior year adjustment ** € 3.9 million utilisation of deferred tax assets on losses carried forward
Non-deductible expenses increase mainly in Russia by €5.8 million prin-cipally due to royalties and related VAT.
Withholding tax increases mainly due to Group reorganisation for €1.4 million.
NOTE 11 • EARNINGS PER SHARE
(a)BasicEarnings per share are based on the net profit attributable to ordinary shareholders of €37,452 (€78,643) and the weighted average number of shares outstanding during the year.
Number of shares 2014 2013
Weighted average number of shares outstanding 55,603,362 55,722,934
(b)DilutedNo dilution effect is recognised in the earning per share calculation in 2014 and 2013.
67
CO
NSO
LID
ATED
FIN
ANC
IAL
STAT
EMEN
TS
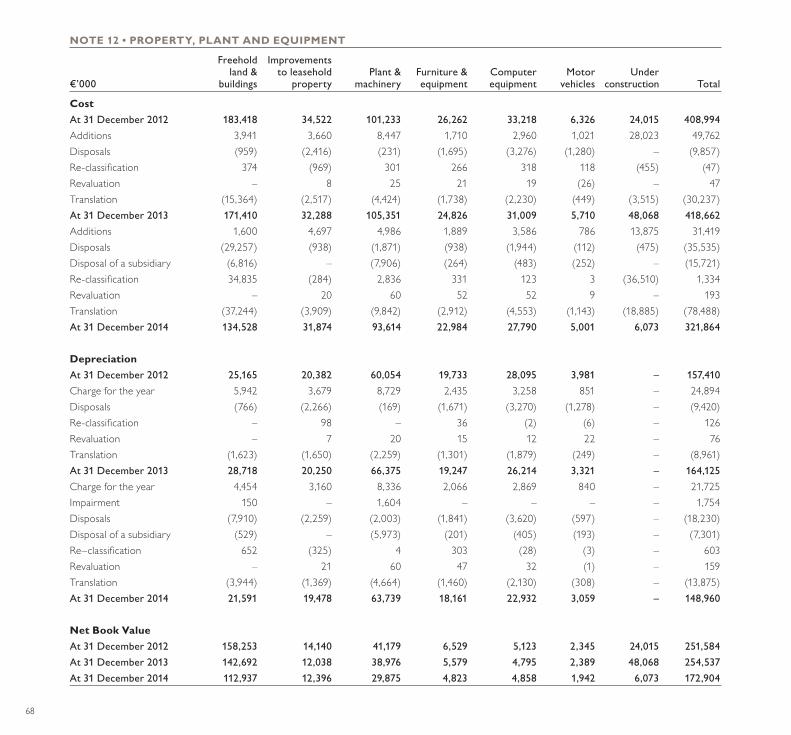
NOTE 12 • PROPERTY, PLANT AND EQUIPMENT
Freehold Improvements land& toleasehold Plant& Furniture& Computer Motor Under€’000 buildings property machinery equipment equipment vehicles construction Total
CostAt31December2012 183,418 34,522 101,233 26,262 33,218 6,326 24,015 408,994Additions 3,941 3,660 8,447 1,710 2,960 1,021 28,023 49,762Disposals (959) (2,416) (231) (1,695) (3,276) (1,280) – (9,857)Re-classification 374 (969) 301 266 318 118 (455) (47)Revaluation – 8 25 21 19 (26) – 47Translation (15,364) (2,517) (4,424) (1,738) (2,230) (449) (3,515) (30,237)At31December2013 171,410 32,288 105,351 24,826 31,009 5,710 48,068 418,662Additions 1,600 4,697 4,986 1,889 3,586 786 13,875 31,419Disposals (29,257) (938) (1,871) (938) (1,944) (112) (475) (35,535)Disposal of a subsidiary (6,816) – (7,906) (264) (483) (252) – (15,721)Re-classification 34,835 (284) 2,836 331 123 3 (36,510) 1,334Revaluation – 20 60 52 52 9 – 193Translation (37,244) (3,909) (9,842) (2,912) (4,553) (1,143) (18,885) (78,488)At31December2014 134,528 31,874 93,614 22,984 27,790 5,001 6,073 321,864
Depreciation At31December2012 25,165 20,382 60,054 19,733 28,095 3,981 – 157,410Charge for the year 5,942 3,679 8,729 2,435 3,258 851 – 24,894Disposals (766) (2,266) (169) (1,671) (3,270) (1,278) – (9,420)Re-classification – 98 – 36 (2) (6) – 126Revaluation – 7 20 15 12 22 – 76Translation (1,623) (1,650) (2,259) (1,301) (1,879) (249) – (8,961)At31December2013 28,718 20,250 66,375 19,247 26,214 3,321 – 164,125Charge for the year 4,454 3,160 8,336 2,066 2,869 840 – 21,725Impairment 150 – 1,604 – – – – 1,754Disposals (7,910) (2,259) (2,003) (1,841) (3,620) (597) – (18,230)Disposal of a subsidiary (529) – (5,973) (201) (405) (193) – (7,301)Re–classification 652 (325) 4 303 (28) (3) – 603Revaluation – 21 60 47 32 (1) – 159Translation (3,944) (1,369) (4,664) (1,460) (2,130) (308) – (13,875)At31December2014 21,591 19,478 63,739 18,161 22,932 3,059 – 148,960
Net Book ValueAt31December2012 158,253 14,140 41,179 6,529 5,123 2,345 24,015 251,584At31December2013 142,692 12,038 38,976 5,579 4,795 2,389 48,068 254,537At31December2014 112,937 12,396 29,875 4,823 4,858 1,942 6,073 172,904
68
Property, plant and equipment under construction Property, plant and equipment under construction category was mainly related to the construction of the new manufacturing facility in Russia. The global distribution centre is under activity from the fourth quarter 2012 and the manufacturing from the fourth quarter 2014, therefore they have been reclassified to the respective property, plant and equipment categories.
Borrowing costs €’000Capitalised borrowing costs related to the construction of the new factory amounted to €1,779 (€1,222) with a capitalisation rate of 4.0 percent (4.0 percent).
Finance leases €’000Included in property, plant and equipment at 31 December 2014 is the net book value of assets under finance leases totalling €29 (€85), of which computer equipment €29 (€50) and motor vehicles €0 (€35).
ImpairmentDue to the difficult economic situation in Ukraine, an impairment of an amount of €1.8 million was booked as Administrative expenses in the income statement.
Contractual commitmentAt December 2014, there is no contractual commitment (€8.2 million).
DisposalsIn 2014, Oriflame sold property, plant and equipment relative to the fac-tory in Russia for a total amount of €33.1 million. The gross book value of the corresponding property, plant and equipment was €27.6 million and the corresponding accumulated depreciation was €7.0 million. Thus, the net book value was €20.6 million. The gain on asset sold amounted to €12.5 million and was booked as Administrative expenses in the income statement.
Disposal of a subsidiaryThe impact of the disposal of the Swedish factory on the consolidated financial statements is disclosed in note 33.
Note 12 continued
69
CO
NSO
LID
ATED
FIN
ANC
IAL
STAT
EMEN
TS

NOTE 13 • INTANGIBLE ASSETS
€’000 Software Trademarks Property rights Goodwill Total
Cost At31December2012 34,980 1,342 3,330 10,673 50,325Additions 4,543 145 – – 4,688Disposals (790) – – – (790)Re-classification 47 – – – 47Revaluation 4 – – – 4Translation (1,543) – – – (1,543)At31December2013 37,241 1,487 3,330 10,673 52,731Additions 4,218 103 – – 4,321Disposals (25) – – – (25)Re-classification 5 – – – 5Translation (2,123) – – – (2,123)At31December2014 39,316 1,590 3,330 10,673 54,909
Amortisation At31December2012 23,667 608 30 5,275 29,580Charge for the year 4,377 150 – – 4,527Disposals (790) – – – (790)Re-classification (126) – – – (126)Revaluation 4 – – – 4Translation (1,266) – – – (1,266)At31December2013 25,866 758 30 5,275 31,929Charge for the year 5,170 148 – – 5,318Disposals (25) – – – (25)Re-classification 5 – – – 5Revaluation 4 – – – 4Translation (1,854) – – – (1,854)At31December2014 29,166 906 30 5,275 35,377
Net Book ValueAt31December2012 11,313 734 3,300 5,398 20,745At31December2013 11,375 729 3,300 5,398 20,802At31December2014 10,150 684 3,300 5,398 19,532
70
GoodwillDuring 1997, the Company acquired the remaining 49 percent of the Group’s interest in Portugal from a party related to the af Jochnick family. This resulted in a goodwill amount of €2.3 million. During 2001, goodwill of €4.6 million arose on acquisition of Rockport Mauritius Ltd and at the end of 2001, the minority shareholders of Oriflame India Pvt. Ltd were bought out which resulted in goodwill of €1.8 million. Upon issuance of IFRS 3 – Business combinations, the Company discontinued amortisation of existing goodwill and the carrying amount of the accumulated amortisation (€3.3 million) was eliminated with a corresponding decrease in goodwill.
For the purpose of impairment testing, goodwill is allocated by geo-graphical segment as reported in note 3. At reporting date, the goodwill was tested for impairment with discount rate of 9 percent (9 percent). The recoverable amounts of the goodwill are determined based on value-in-use calculations. These calculations use pre-tax cash flow projections based on financial forecasts made by Group Management covering a five year period (five year period).
The preparation of the forecast requires a number of key assumptions such as volume, price, product mix, which will create a basis for future growth and gross profit. These figures are set in relation to historic figures and external reports on market growth. Growth rate assumptions used for the evaluation are in line with market growth data. Average market growth rates for the five year period (five year period) are for Portugal 1 percent (0 percent) and India 16 percent (14 percent).
Termination value has been calculated based on the result of the fifth year result without any future growth assumptions divided by the discount rate.
Based on the above assumptions Management made several sensitivity analyses and came to the conclusion that any reasonably possible adverse change in the key assumptions would not reduce the recoverable amount below its carrying amount. No impairment loss was recognised in 2014 and 2013.
Property rightsAt the beginning of 2009 the Group has purchased the property rights for a dry food composition technology used in some of our wellness products. This technology is used throughout the Group where wellness products are sold, and therefore is not allocated to a specific geographic segment. The useful life of this technology was classified as indefinite as Oriflame has an exclusive, perpetual, unlimited right to use it. The recover- able amount is determined based on value-in-use calculations. These calculations use pre-tax cash flow projection based on financial forecast covering a five year period (five year period). Calculation was based on an annual discount rate of 9 percent (9 percent) and a market growth rate of 7 percent (7 percent).
Termination value has been calculated based on the result of the fifth year result without any future growth assumptions divided by the discount rate.
Based on the above assumptions Management made several sensitivity analyses and came to the conclusion that any reasonably possible adverse change in the key assumptions would not reduce the recoverable amount below its carrying amount. No impairment loss was recognised in 2014 and 2013.
Software Property rightsIncluded in software additions during the year are costs for own developed software for an amount of €179 (€167).
Note 13 continued
71
CO
NSO
LID
ATED
FIN
ANC
IAL
STAT
EMEN
TS
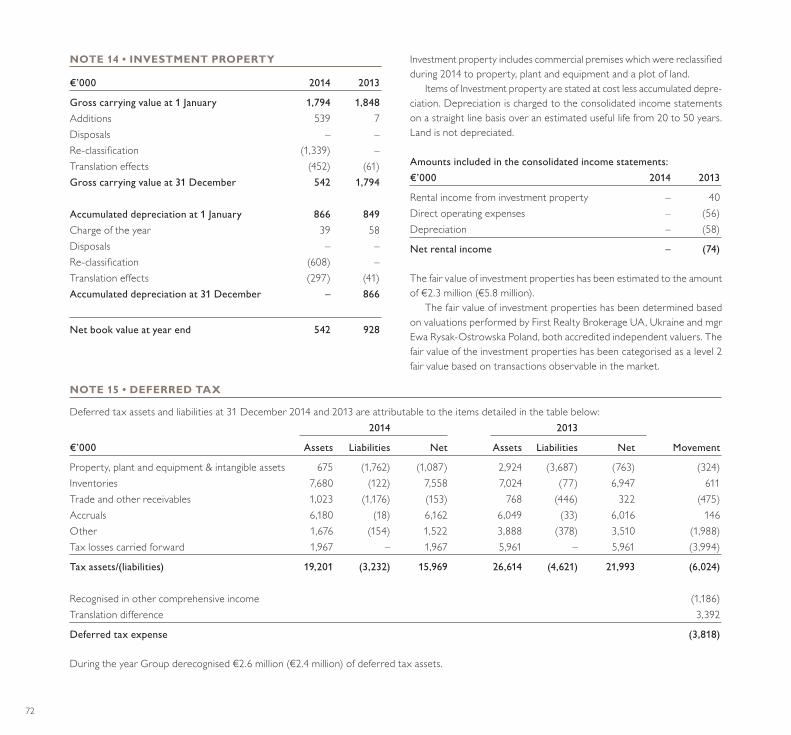
NOTE 14 • INVESTMENT PROPERTY
€’000 2014 2013
Grosscarryingvalueat1January 1,794 1,848Additions 539 7Disposals – –Re-classification (1,339) –Translation effects (452) (61)Grosscarryingvalueat31December 542 1,794
Accumulateddepreciationat1January 866 849Charge of the year 39 58Disposals – –Re-classification (608) –Translation effects (297) (41)Accumulateddepreciationat31December – 866
Netbookvalueatyearend 542 928
Investment property includes commercial premises which were reclassified during 2014 to property, plant and equipment and a plot of land.
Items of Investment property are stated at cost less accumulated depre-ciation. Depreciation is charged to the consolidated income statements on a straight line basis over an estimated useful life from 20 to 50 years. Land is not depreciated.
Amountsincludedintheconsolidatedincomestatements:€’000 2014 2013
Rental income from investment property – 40Direct operating expenses – (56)Depreciation – (58)
Netrentalincome – (74)
The fair value of investment properties has been estimated to the amount of €2.3 million (€5.8 million).
The fair value of investment properties has been determined based on valuations performed by First Realty Brokerage UA, Ukraine and mgr Ewa Rysak-Ostrowska Poland, both accredited independent valuers. The fair value of the investment properties has been categorised as a level 2 fair value based on transactions observable in the market.
NOTE 15 • DEFERRED TAX
Deferred tax assets and liabilities at 31 December 2014 and 2013 are attributable to the items detailed in the table below: 2014 2013
€’000 Assets Liabilities Net Assets Liabilities Net Movement
Property, plant and equipment & intangible assets 675 (1,762) (1,087) 2,924 (3,687) (763) (324)Inventories 7,680 (122) 7,558 7,024 (77) 6,947 611Trade and other receivables 1,023 (1,176) (153) 768 (446) 322 (475)Accruals 6,180 (18) 6,162 6,049 (33) 6,016 146Other 1,676 (154) 1,522 3,888 (378) 3,510 (1,988)Tax losses carried forward 1,967 – 1,967 5,961 – 5,961 (3,994)
Taxassets/(liabilities) 19,201 (3,232) 15,969 26,614 (4,621) 21,993 (6,024)
Recognised in other comprehensive income (1,186)Translation difference 3,392
Deferredtaxexpense (3,818)
During the year Group derecognised €2.6 million (€2.4 million) of deferred tax assets.
72
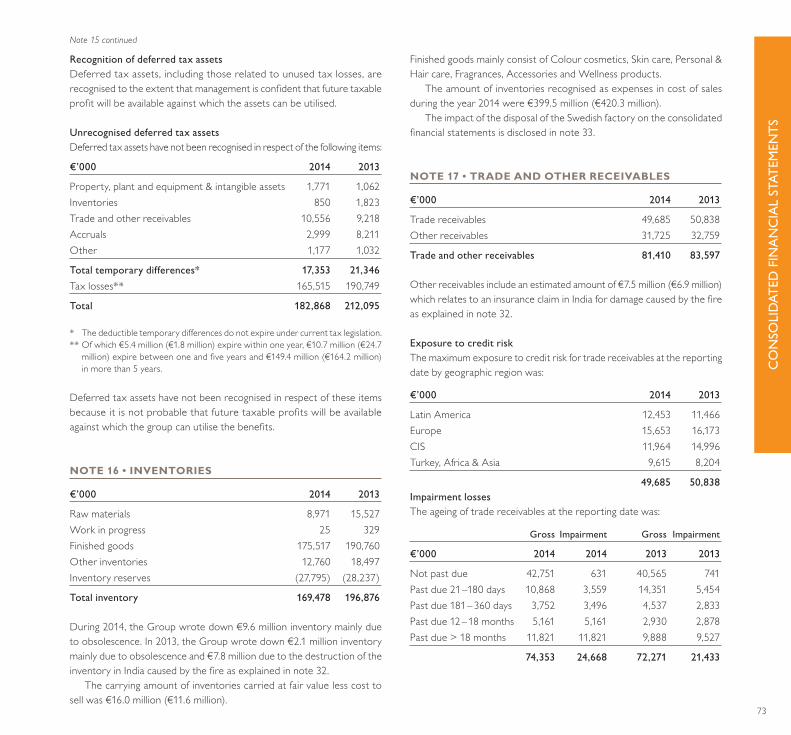
Recognition of deferred tax assetsDeferred tax assets, including those related to unused tax losses, are recognised to the extent that management is confident that future taxable profit will be available against which the assets can be utilised.
UnrecogniseddeferredtaxassetsDeferred tax assets have not been recognised in respect of the following items:
€’000 2014 2013
Property, plant and equipment & intangible assets 1,771 1,062Inventories 850 1,823Trade and other receivables 10,556 9,218Accruals 2,999 8,211Other 1,177 1,032
Totaltemporarydifferences* 17,353 21,346Tax losses** 165,515 190,749
Total 182,868 212,095
* The deductible temporary differences do not expire under current tax legislation.** Of which €5.4 million (€1.8 million) expire within one year, €10.7 million (€24.7
million) expire between one and five years and €149.4 million (€164.2 million) in more than 5 years.
Deferred tax assets have not been recognised in respect of these items because it is not probable that future taxable profits will be available against which the group can utilise the benefits.
NOTE 16 • INVENTORIES
€’000 2014 2013
Raw materials 8,971 15,527Work in progress 25 329Finished goods 175,517 190,760Other inventories 12,760 18,497Inventory reserves (27,795) (28,237)
Totalinventory 169,478 196,876
During 2014, the Group wrote down €9.6 million inventory mainly due to obsolescence. In 2013, the Group wrote down €2.1 million inventory mainly due to obsolescence and €7.8 million due to the destruction of the inventory in India caused by the fire as explained in note 32.
The carrying amount of inventories carried at fair value less cost to sell was €16.0 million (€11.6 million).
Finished goods mainly consist of Colour cosmetics, Skin care, Personal & Hair care, Fragrances, Accessories and Wellness products.
The amount of inventories recognised as expenses in cost of sales during the year 2014 were €399.5 million (€420.3 million).
The impact of the disposal of the Swedish factory on the consolidated financial statements is disclosed in note 33.
NOTE 17 • TRADE AND OTHER RECEIVABLES
€’000 2014 2013
Trade receivables 49,685 50,838Other receivables 31,725 32,759
Tradeandotherreceivables 81,410 83,597
Other receivables include an estimated amount of €7.5 million (€6.9 million) which relates to an insurance claim in India for damage caused by the fire as explained in note 32.
Exposure to credit riskThe maximum exposure to credit risk for trade receivables at the reporting date by geographic region was:
€’000 2014 2013
Latin America 12,453 11,466Europe 15,653 16,173CIS 11,964 14,996Turkey, Africa & Asia 9,615 8,204
49,685 50,838Impairment lossesThe ageing of trade receivables at the reporting date was:
Gross Impairment Gross Impairment
€’000 2014 2014 2013 2013
Not past due 42,751 631 40,565 741Past due 21 –180 days 10,868 3,559 14,351 5,454Past due 181 – 360 days 3,752 3,496 4,537 2,833Past due 12 – 18 months 5,161 5,161 2,930 2,878Past due > 18 months 11,821 11,821 9,888 9,527
74,353 24,668 72,271 21,433
Note 15 continued
73
CO
NSO
LID
ATED
FIN
ANC
IAL
STAT
EMEN
TS

Based on experience the Group records an impairment allowance on trade receivables not past due, which usually is around 1 to 3 percent. This allowance varies from market to market depending on the latest trends in collectability of the trade receivables.
The movement in the allowance for impairment in respect of trade receivables during the year was as follows:
€’000 2014 2013
Balanceat1January 21,433 27,264Impairment loss recognised 6,024 7,184Specific debt write offs against provision (2,789) (13,015)Balanceat31December 24,668 21,433
The allowance accounts in respect of trade receivables are used to record impairment losses unless the Group is satisfied that no recovery of the amount owing is possible. At that point the amount considered irrecover- able is written off against the financial asset directly.
The impairment loss on trade receivables recognised in the consoli-dated income statements is included in Selling and marketing expenses.
The impact of the disposal of the Swedish factory on the consolidated financial statements is disclosed in note 33.
NOTE 18 • CASH AND CASH EQUIVALENTS NET OF BANK OVERDRAFTS
Cash and cash equivalents net of bank overdrafts included in the conso-lidated statements of cash flows comprise the following consolidated statements of financial position amounts: Short Bank term Total over-€’000 Cash deposits cash drafts Total
At31December2012 85,400 20,846 106,246 (76) 106,171Net flow 21,922 (15,446) 6,476 (472) 6,003Exchange differences (5,128) (258) (5,386) – (5,386)At31December2013 102,194 5,142 107,336 (548) 106,788Net flow (12,466) 5,127 (7,339) 494 (6,845)Exchange differences (3,974) (454) (4,428) – (4,428)At31December2014 85,754 9,815 95,569 (54) 95,515
The Group’s exposure to interest rate risk and a sensitivity analysis for financial assets and liabilities is disclosed in note 28.
The impact of the disposal of the Swedish factory on the consolidated financial statements is disclosed in note 33.
NOTE 19 • SHARE CAPITAL
The Company has one class of share capital with an authorised share capital of €102.4 million. All shares have equal rights to dividends and shareholders are entitled to one vote per share at annual and general meetings of the Company. The shares have a par value of €1.25. A reconciliation of the movements in share capital is detailed below:
No.ofshares €’000
Share capitalBalance31December2012 57,121,134 71,401Issue of new shares (i) 83,238 104Issue of new shares (ii) 9,690 12Balance31December2013 57,214,062 71,517Issue of new shares (iii) 7,910 10Balance31December2014 57,221,972 71,527
Treasury sharesBalance31December2012 – –Acquisition (iv) 1,613,409 41,235Balance31December2013 1,613,409 41,235Acquisition – –Balance31December2014 1,613,409 41,235
(i) On 15 July 2013 the Group issued 83,238 achievement shares to Oriflame employees at no consideration for the maturity of the 2010 share incentive plan. The issue of these shares amounting to €0.1 million was financed through share premium, as approved by the EGM of 19 May 2008.
(ii) On 25 September 2013 the Group issued 9,690 shares to Oriflame employees as part of the 2013 share incentive plan. The consideration received was €0.25 million, of which €0.01 million was credited to share capital and €0.24 million was credited to share premium.
(iii) On 13 August 2014 the Group issued 7,910 shares to Oriflame employees as part of the 2014 share incentive plan. The consideration received was €0.14 million, of which €0.01 million was credited to share capital and €0.13 million was credited to share premium.
(iv) During the first half of 2013, the Group invested €41.2 million on its share buyback programme. A total of 1,613,409 shares were acquired at the total purchase price of €41.2 million (including bank fees), at an average price of €25.56 per share. The purpose of the share buybacks was to optimise the capital structure. At 31 December 2014, the treasury shares held by the Group represent 2.8 percent (2.8 percent) of the total number of issued shares of 57,221,972 (57,214,062).
Note 17 continued
74

NOTE 20 • RESERVES
(i) LegalreserveThe Company is required by Luxembourg law to appropriate to a legal reserve at least 5 percent of its statutory net profit, until the aggregate reserve equals 10 percent of its issued share capital. The legal reserve is not available for distribution.
(ii) TranslationreserveIncluded in the translation reserve in 2014 are the following:(a) Exchange loss of €39.2 million (€6.3 million loss) arising on long term
inter-company debt of an investment nature, and;
(b) A foreign exchange loss of €13.5 million (€19.0 million loss) arising from the translation of financial statements of foreign subsidiaries.
Included in the translation reserve is a revaluation reserve related to certain assets of €7.4 million (€7.9 million).
(iii) HedgingreserveThe hedging reserve comprises the effective portion of the cumulative net change in fair value of the cash flow hedging instruments.
(iv) DividendsIn May 2013, the AGM of the Company approved a dividend of €1.75 per share, as proposed by the Board of Directors, i.e. €97.1 million in total.
In May 2014, the AGM of the Company approved a dividend of €0.25 per share, as proposed by the Board of Directors, i.e. €13.9 million in total.
Due to the uncertain macro-economic and geopolitical situation as well as the unfavourable movements of some of the Oriflame’s main currencies, the Board of Directors will continue to prioritise reducing the debt during the forthcoming quarters. As a consequence, the Board of Directors will not seek a mandate for distribution of dividend during the forthcoming four quarters (quarter 2 2015 up until quarter 1 2016).
The total amount of dividend is reduced by the acquired treasury shares, which are not eligible for a dividend, at the date of the dividend.
(v) OtherreserveThe other reserve comprises the increase in equity from services received with respect to the equity settled share based payments plan.
NOTE 21 • INTEREST-BEARING LOANS
€’000 2014 2013
Non-current liabilitiesLoans 310,316 379,637Finance lease long-term liabilities 13 35
310,329 379,672
Current liabilitiesShort-term loans 30,088 2,168 Bank overdrafts 54 548 Finance lease short-term liabilities 21 28
30,163 2,744
On 23 May 2011, the Group signed a €330 million five-year revolving, multi-currency, committed, Credit Facility.
In July 2011, the Group successfully completed the issuance of $195 million and €25 million private placement notes. The Note Purchase Agreement, which was signed on the 13 July 2011, identifies four series of fixed-rates’ Senior Notes with different maturities: $75 million due July 2018, €25 million due July 2018, $70 million due July 2021 and $50 million due July 2023. Interest is paid semi-annually and it is in the range between 4.70 percent and 5.70 percent per annum.
In April 2010, the Group successfully entered into a $165 million loan in the U.S. Private Placement market. The Note Purchase Agreement, which was signed the 20 April 2010, identifies three series of fixed-rates’ Senior Notes with different maturities: $25 million due April 2015, $70 million due April 2017 and $70 million due 2020. Interest is paid semi-annually and it is in the range between 5.00 percent and 6.50 percent per annum.
The Credit Facility provides that utilisations may be in Euros or other freely convertible currencies, as agreed. The interest payable is calculated at the relevant inter-bank rate plus the applicable margin.
Both the Credit Facility and the Note Purchase Agreements contain a number of operating covenants, including restrictions on subsidiary borrowings, restrictions on lending and giving guarantees for financial indebtedness, and restrictions on the disposal of material assets. It also contains a number of financial covenants which include required ratios of consolidated net debt to consolidated EBITDA of the Group, consol-idated EBIT to consolidated finance costs and net worth. The Group was in compliance with these covenants as of 31 December 2014 and 31 December 2013.
75
CO
NSO
LID
ATED
FIN
ANC
IAL
STAT
EMEN
TS
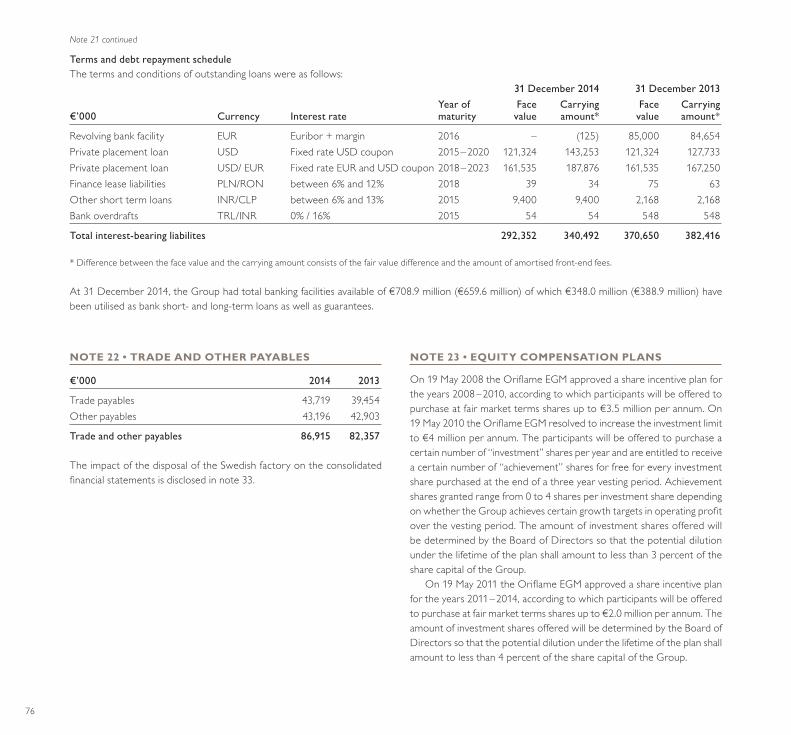
Terms and debt repayment scheduleThe terms and conditions of outstanding loans were as follows: 31 December 2014 31 December 2013 Year of Face Carrying Face Carrying€’000 Currency Interest rate maturity value amount* value amount*
Revolving bank facility EUR Euribor + margin 2016 – (125) 85,000 84,654 Private placement loan USD Fixed rate USD coupon 2015 – 2020 121,324 143,253 121,324 127,733 Private placement loan USD/ EUR Fixed rate EUR and USD coupon 2018 – 2023 161,535 187,876 161,535 167,250 Finance lease liabilities PLN/RON between 6% and 12% 2018 39 34 75 63 Other short term loans INR/CLP between 6% and 13% 2015 9,400 9,400 2,168 2,168 Bank overdrafts TRL/INR 0% / 16% 2015 54 54 548 548
Totalinterest-bearingliabilites 292,352 340,492 370,650 382,416
* Difference between the face value and the carrying amount consists of the fair value difference and the amount of amortised front-end fees.
At 31 December 2014, the Group had total banking facilities available of €708.9 million (€659.6 million) of which €348.0 million (€388.9 million) have been utilised as bank short- and long-term loans as well as guarantees.
NOTE 22 • TRADE AND OTHER PAYABLES
€’000 2014 2013
Trade payables 43,719 39,454Other payables 43,196 42,903
Tradeandotherpayables 86,915 82,357
The impact of the disposal of the Swedish factory on the consolidated financial statements is disclosed in note 33.
NOTE 23 • EQUITY COMPENSATION PLANS
On 19 May 2008 the Oriflame EGM approved a share incentive plan for the years 2008 – 2010, according to which participants will be offered to purchase at fair market terms shares up to €3.5 million per annum. On 19 May 2010 the Oriflame EGM resolved to increase the investment limit to €4 million per annum. The participants will be offered to purchase a certain number of “investment” shares per year and are entitled to receive a certain number of “achievement” shares for free for every investment share purchased at the end of a three year vesting period. Achievement shares granted range from 0 to 4 shares per investment share depending on whether the Group achieves certain growth targets in operating profit over the vesting period. The amount of investment shares offered will be determined by the Board of Directors so that the potential dilution under the lifetime of the plan shall amount to less than 3 percent of the share capital of the Group.
On 19 May 2011 the Oriflame EGM approved a share incentive plan for the years 2011 – 2014, according to which participants will be offered to purchase at fair market terms shares up to €2.0 million per annum. The amount of investment shares offered will be determined by the Board of Directors so that the potential dilution under the lifetime of the plan shall amount to less than 4 percent of the share capital of the Group.
Note 21 continued
76
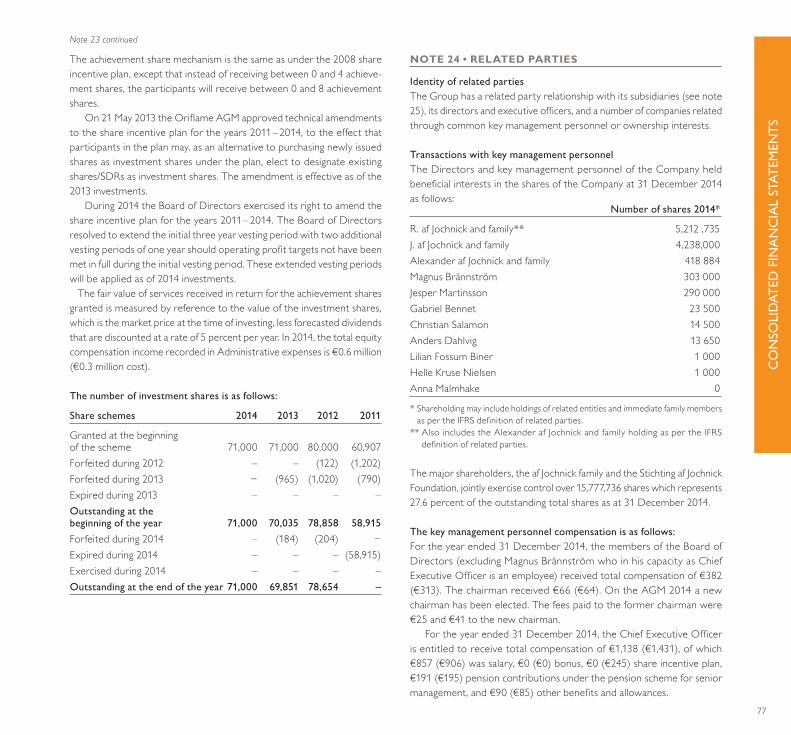
The achievement share mechanism is the same as under the 2008 share incentive plan, except that instead of receiving between 0 and 4 achieve-ment shares, the participants will receive between 0 and 8 achievement shares.
On 21 May 2013 the Oriflame AGM approved technical amendments to the share incentive plan for the years 2011 – 2014, to the effect that participants in the plan may, as an alternative to purchasing newly issued shares as investment shares under the plan, elect to designate existing shares/SDRs as investment shares. The amendment is effective as of the 2013 investments.
During 2014 the Board of Directors exercised its right to amend the share incentive plan for the years 2011 – 2014. The Board of Directors resolved to extend the initial three year vesting period with two additional vesting periods of one year should operating profit targets not have been met in full during the initial vesting period. These extended vesting periods will be applied as of 2014 investments. The fair value of services received in return for the achievement shares granted is measured by reference to the value of the investment shares, which is the market price at the time of investing, less forecasted dividends that are discounted at a rate of 5 percent per year. In 2014, the total equity compensation income recorded in Administrative expenses is €0.6 million (€0.3 million cost).
Thenumberofinvestmentsharesisasfollows:
Share schemes 2014 2013 2012 2011
Granted at the beginning of the scheme 71,000 71,000 80,000 60,907 Forfeited during 2012 – – (122) (1,202)Forfeited during 2013 − (965) (1,020) (790)Expired during 2013 – – – –Outstanding at the beginningoftheyear 71,000 70,035 78,858 58,915Forfeited during 2014 – (184) (204) − Expired during 2014 – – – (58,915)Exercised during 2014 – – – –Outstandingattheendoftheyear71,000 69,851 78,654 –
NOTE 24 • RELATED PARTIES
Identity of related partiesThe Group has a related party relationship with its subsidiaries (see note 25), its directors and executive officers, and a number of companies related through common key management personnel or ownership interests.
Transactions with key management personnelThe Directors and key management personnel of the Company held beneficial interests in the shares of the Company at 31 December 2014 as follows: Number of shares 2014*
R. af Jochnick and family** 5,212 ,735J. af Jochnick and family 4,238,000Alexander af Jochnick and family 418 884Magnus Brännström 303 000Jesper Martinsson 290 000Gabriel Bennet 23 500Christian Salamon 14 500Anders Dahlvig 13 650Lilian Fossum Biner 1 000Helle Kruse Nielsen 1 000Anna Malmhake 0
* Shareholding may include holdings of related entities and immediate family members as per the IFRS definition of related parties.
** Also includes the Alexander af Jochnick and family holding as per the IFRS definition of related parties.
The major shareholders, the af Jochnick family and the Stichting af Jochnick Foundation, jointly exercise control over 15,777,736 shares which represents 27.6 percent of the outstanding total shares as at 31 December 2014.
Thekeymanagementpersonnelcompensationisasfollows:For the year ended 31 December 2014, the members of the Board of Directors (excluding Magnus Brännström who in his capacity as Chief Executive Officer is an employee) received total compensation of €382 (€313). The chairman received €66 (€64). On the AGM 2014 a new chairman has been elected. The fees paid to the former chairman were €25 and €41 to the new chairman.
For the year ended 31 December 2014, the Chief Executive Officer is entitled to receive total compensation of €1,138 (€1,431), of which €857 (€906) was salary, €0 (€0) bonus, €0 (€245) share incentive plan, €191 (€195) pension contributions under the pension scheme for senior management, and €90 (€85) other benefits and allowances.
Note 23 continued
77
CO
NSO
LID
ATED
FIN
ANC
IAL
STAT
EMEN
TS

For the year ended 31 December 2014 the members of the Corporate Committee, which consists of the Chief Executive Officer, the Chief Oper-ating Officer and the Chief Financial Officer (excluding the Chief Executive Officer) are entitled to receive €2,133 (€2,272), of which €1,440 (€1,266) was salaries, €0 (€0) bonus, €0 (€320) share incentive plan, €223 (€216) pension contributions under the pension scheme for senior management and €470 (€470) of other benefits and allowances.
The bonus compensation figures are based on the entitlement of the personnel to receive the bonus compensation as in previous year.
Other related party transactionsThe aggregate value of transactions and outstanding balances relating to key management personnel and entities over which they have control or significant influence were as follow: Transaction value Balance outstanding Year ended 31 December As at 31 December
€’000 2014 2013 2014 2013
Expenses and employee costs incurred on behalf of and recharged to Medicover S.A. (92) (2,430) (5) (462)Services provided by Credus Management AB – 84 – –Medicover health care services 334 338 2 3
All transactions with related parties are done on arm’s length basis. During the year ending 31 December 2014 and 2013, no provision for doubtful debts and expense in respect of bad or doubtful debts due from related parties were recognised.
Credus Management AB, a Swedish company wholly owned by Robert af Jochnick, Chairman of the company, from time to time provides Oriflame with consultancy outside the board director assignments of Robert af Jochnick and Alexander af Jochnick.
Administrative and employee costs are incurred on behalf of Medicover Holdings SA in connection with the shared office facilities in Waterloo, Brussels. These costs are recharged to Medicover. Jonas af Jochnick is the Chairman of, and a major shareholder in Medicover. Robert af Jochnick is a board member of Medicover. In addition, Medicover has entered into agreements with certain of the Group’s subsidiaries in Poland, Romania, Hungary, the Czech Republic and Estonia (Medicover is now called Qual-itas Artikeskus As in Estonia) to provide private health care benefits to employees.
NOTE 25 • GROUP COMPANIES
The Company holds, whether directly or indirectly, 20 percent or more of the issued share capital of the following companies: Percentage Country of share capitalName incorporation held, %
SARL Natural Swedish Cosmetics Algeria 100Oriflame Cosmetics LLC Armenia 100Oriflame LLC Azerbaijan 100Oriflame Cosmetics Foreign LLC Belarus 100Oriflame Management SA Belgium 100Oriflame Kozmetika BH. D.o.o. Sarajevo Bosnia 100Oriflame Bulgaria EOOD Bulgaria 100Oriflame de Chile SA Chile 100Oriflame Cosmetics (China) Co. Ltd China 100Oriflame Health Food (Beijing) Co Ltd China 100Oriflame Services Hong Kong Limited* China 100Oriflame de Colombia SA Colombia 100Oriflame Kozmetika Croatia doo. Croatia 100Oriflame Cyprus Limited Cyprus 100Tyndelca Trading Limited Cyprus 100Oriflame Czech Republic sro Czech Republic 100Oriflame Software sro Czech Republic 100Oriflame International ApS Denmark 100Oriflame del Ecuador SA Ecuador 100Oriflame Egypt Ltd Egypt 100Oriflame Estonia OU Estonia 100Oriflame Oy Finland 100Oriflame Georgia LLC Georgia 100Special Trading Company Oriflame Caucasus Georgia 100Oriflame Kosmetik Vertriebs GmbH Germany 100Oriflame Hellas Sole Shareholder Ltd Greece 100Oriflame Hungary Kozmetika Kft Hungary 100Oriflame India Pvt. Ltd. India 100PT Oriflame Cosmetics Indonesia Indonesia 100PT Orindo Alam Ayu Indonesia 100Oriflame Research & Development Ltd. Ireland 100Oriflame LLP Kazakhstan 100Oriflame Cosmetics LLC Kosovo 100
Note 24 continued
78
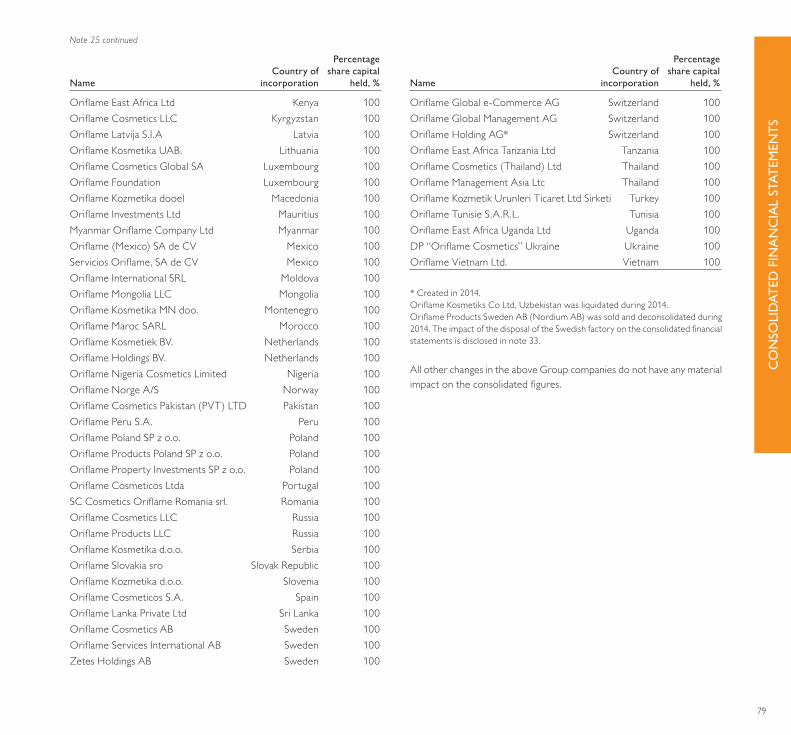
Percentage Country of share capitalName incorporation held, %
Oriflame East Africa Ltd Kenya 100Oriflame Cosmetics LLC Kyrgyzstan 100Oriflame Latvija S.I.A Latvia 100Oriflame Kosmetika UAB. Lithuania 100Oriflame Cosmetics Global SA Luxembourg 100Oriflame Foundation Luxembourg 100Oriflame Kozmetika dooel Macedonia 100Oriflame Investments Ltd Mauritius 100Myanmar Oriflame Company Ltd Myanmar 100Oriflame (Mexico) SA de CV Mexico 100Servicios Oriflame, SA de CV Mexico 100Oriflame International SRL Moldova 100Oriflame Mongolia LLC Mongolia 100Oriflame Kosmetika MN doo. Montenegro 100Oriflame Maroc SARL Morocco 100Oriflame Kosmetiek BV. Netherlands 100Oriflame Holdings BV. Netherlands 100Oriflame Nigeria Cosmetics Limited Nigeria 100Oriflame Norge A/S Norway 100Oriflame Cosmetics Pakistan (PVT) LTD Pakistan 100Oriflame Peru S.A. Peru 100Oriflame Poland SP z o.o. Poland 100Oriflame Products Poland SP z o.o. Poland 100Oriflame Property Investments SP z o.o. Poland 100Oriflame Cosmeticos Ltda Portugal 100SC Cosmetics Oriflame Romania srl. Romania 100Oriflame Cosmetics LLC Russia 100Oriflame Products LLC Russia 100Oriflame Kosmetika d.o.o. Serbia 100Oriflame Slovakia sro Slovak Republic 100Oriflame Kozmetika d.o.o. Slovenia 100Oriflame Cosmeticos S.A. Spain 100Oriflame Lanka Private Ltd Sri Lanka 100Oriflame Cosmetics AB Sweden 100Oriflame Services International AB Sweden 100Zetes Holdings AB Sweden 100
Percentage Country of share capitalName incorporation held, %
Oriflame Global e-Commerce AG Switzerland 100Oriflame Global Management AG Switzerland 100Oriflame Holding AG* Switzerland 100Oriflame East Africa Tanzania Ltd Tanzania 100Oriflame Cosmetics (Thailand) Ltd Thailand 100Oriflame Management Asia Ltc Thailand 100Oriflame Kozmetik Urunleri Ticaret Ltd Sirketi Turkey 100Oriflame Tunisie S.A.R.L. Tunisia 100Oriflame East Africa Uganda Ltd Uganda 100DP “Oriflame Cosmetics” Ukraine Ukraine 100Oriflame Vietnam Ltd. Vietnam 100
* Created in 2014.Oriflame Kosmetiks Co Ltd, Uzbekistan was liquidated during 2014.Oriflame Products Sweden AB (Nordium AB) was sold and deconsolidated during 2014. The impact of the disposal of the Swedish factory on the consolidated financial statements is disclosed in note 33.
All other changes in the above Group companies do not have any material impact on the consolidated figures.
Note 25 continued
79
CO
NSO
LID
ATED
FIN
ANC
IAL
STAT
EMEN
TS
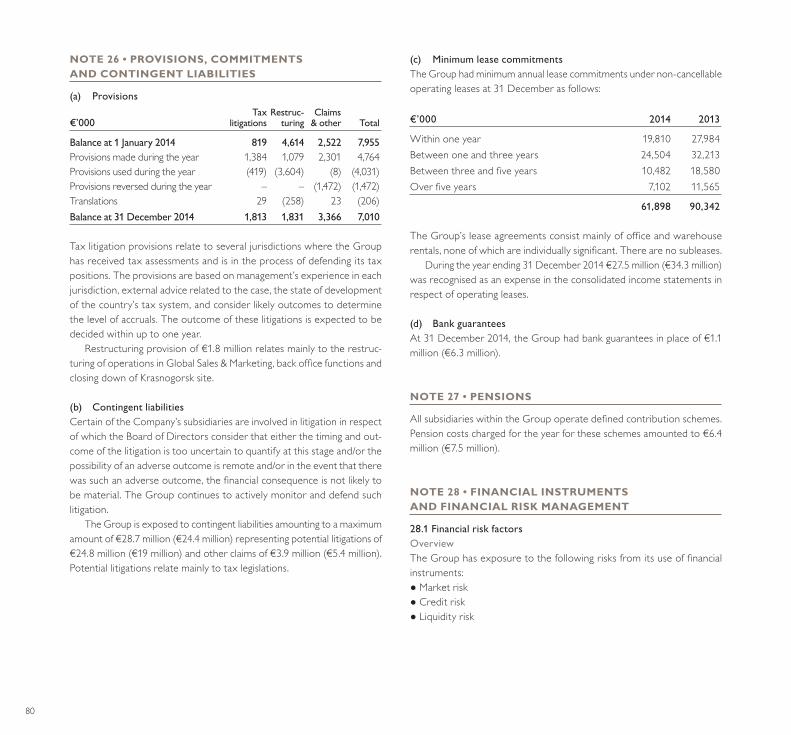
NOTE 26 • PROVISIONS, COMMITMENTSAND CONTINGENT LIABILITIES
(a) Provisions Tax Restruc- Claims€’000 litigations turing & other Total
Balanceat1January2014 819 4,614 2,522 7,955Provisions made during the year 1,384 1,079 2,301 4,764Provisions used during the year (419) (3,604) (8) (4,031)Provisions reversed during the year – – (1,472) (1,472)Translations 29 (258) 23 (206)Balanceat31December2014 1,813 1,831 3,366 7,010
Tax litigation provisions relate to several jurisdictions where the Group has received tax assessments and is in the process of defending its tax positions. The provisions are based on management’s experience in each jurisdiction, external advice related to the case, the state of development of the country’s tax system, and consider likely outcomes to determine the level of accruals. The outcome of these litigations is expected to be decided within up to one year.
Restructuring provision of €1.8 million relates mainly to the restruc-turing of operations in Global Sales & Marketing, back office functions and closing down of Krasnogorsk site.
(b) ContingentliabilitiesCertain of the Company’s subsidiaries are involved in litigation in respect of which the Board of Directors consider that either the timing and out-come of the litigation is too uncertain to quantify at this stage and/or the possibility of an adverse outcome is remote and/or in the event that there was such an adverse outcome, the financial consequence is not likely to be material. The Group continues to actively monitor and defend such litigation.
The Group is exposed to contingent liabilities amounting to a maximum amount of €28.7 million (€24.4 million) representing potential litigations of €24.8 million (€19 million) and other claims of €3.9 million (€5.4 million). Potential litigations relate mainly to tax legislations.
(c) MinimumleasecommitmentsThe Group had minimum annual lease commitments under non-cancellable operating leases at 31 December as follows:
€’000 2014 2013
Within one year 19,810 27,984Between one and three years 24,504 32,213Between three and five years 10,482 18,580Over five years 7,102 11,565
61,898 90,342
The Group’s lease agreements consist mainly of office and warehouse rentals, none of which are individually significant. There are no subleases.
During the year ending 31 December 2014 €27.5 million (€34.3 million) was recognised as an expense in the consolidated income statements in respect of operating leases.
(d) BankguaranteesAt 31 December 2014, the Group had bank guarantees in place of €1.1 million (€6.3 million).
NOTE 27 • PENSIONS
All subsidiaries within the Group operate defined contribution schemes. Pension costs charged for the year for these schemes amounted to €6.4 million (€7.5 million).
NOTE 28 • FINANCIAL INSTRUMENTS AND FINANCIAL RISK MANAGEMENT
28.1FinancialriskfactorsOverviewThe Group has exposure to the following risks from its use of financial instruments:● Market risk● Credit risk● Liquidity risk
80
This note presents information about the Group’s exposure to each of the above risks, the Group’s objectives, policies and processes for measuring and managing risk, and the Group’s capital management. Further quan-titative disclosures are included throughout these consolidated financial statements.
The Board of Directors has overall responsibility for the establishment and oversight of the Group’s risk management framework. The Group’s risk management policies are established to identify and analyse the risks to which the Group is exposed, to set appropriate risk limits and controls, and to monitor risks and adherence to limits. Risk management policies and systems are reviewed on a regular basis to reflect changes in market conditions and in the Group’s activities.
I Market RiskMarket risk is the risk that changes in market prices, such as foreign exchange rates or interest rates will affect the Group’s income or the value of its holdings of financial instruments. The market risk management objective is to manage and control market risk exposures within acceptable parameters, while optimising return on risk.
The Group buys and sells derivatives in the ordinary course of busi-ness, and also incurs financial liabilities, in order to manage market risks. Generally the Group seeks to apply hedge accounting in order to manage volatility in profit or loss.
(a) ForeigncurrencyriskTranslation exposureTranslation exposure arises due to the financial results and balance sheet positions of operating subsidiaries reported in the respective currencies of their country of incorporation. Profits and losses and assets and liabilities in the various local currencies are translated into euro, the presentation currency. Countries having a functional currency other than euro, profits and losses are translated at average exchange rates and assets and liabilities are translated at closing exchange rates. Fluctuations in exchange rates against the euro will give rise to differences. These differences are recorded as translation gains or losses in the shareholders’ equity.
Transaction exposureCurrency transaction exposure arises whenever a subsidiary enters into a transaction using a currency other than its measurement currency. If the relevant exchange rates move between the date of the transaction and the date of final payment, the resulting currency balance will produce a gain or loss on exchange. Such gains or losses are included in financial income and expense.
Strategic currency exposureStrategic currency exposure arises in countries, which are not part of the European Monetary Union (EMU), or whose currencies are not pegged to the euro. When the exchange rate of the non-EMU currencies fluc-tuates against the euro, it affects the gross margin in those countries, as approximately 58.2 percent (60 percent) of the Group’s products are sourced and produced within the EMU.
The objective of the Group is to hedge any currency transaction exposure by seeking to match revenues and costs or to match assets and liabilities in the same currency. However, given the geographical diversity of the Group’s operations, a significant portion of sales is generated in currencies other than those in which the majority of expenses are incurred. In circumstances where revenues and costs cannot be matched, the cur-rency transaction exposure may be hedged by periodically adjusting prices or by entering into hedging transactions.
The Group hedges up to 100 percent of selected currency transaction exposures by entering into a variety of forward contracts in currencies in which subsidiaries of the Group transact business, to the extent that forward contracts are available in the market at a reasonable cost.
The Group has also decided to hedge the foreign exchange rate risk of selected forecasted foreign currency denominated sales, which pres-ent an exposure to variations in cash flows that could ultimately affect profit or loss.
As at 31 December 2014 there were a variety of forward and option exchange contracts outstanding for a nominal amount equivalent of €161.7 million (€204.9 million) with maturities ranging from January 2015 to Sep-tember 2016, to hedge selected currency transaction exposures and highly probable forecast transactions.
The Group uses a variety of forward and option exchange contracts with a nominal amount equivalent of €41.8 million (€107 million) to eco-nomically hedge monetary assets and liabilities in foreign currencies, mainly intra-group. The derivatives are not designated as hedge accounting rela-tionships and therefore the changes in fair value of the derivatives and the foreign exchange gains and losses relating to the monetary assets and liabilities are recognised in the consolidated income statement. As of 31 December 2014, the fair value of these contracts was €20.7 million gain (€1.3 million gain).
The Group claims cash flow hedge accounting for a variety of forward contracts at a nominal amount of €119.9 million (€97.9 million) that hedge the cash flow variability due to foreign currency risk inherent in either future transactions that result in recognition of non-financial liability or highly probable forecast transactions, mainly intra-group. The effective portion of changes in the fair value of derivatives is recognised in oth-er comprehensive income within equity. The ineffective portion of the
Note 28 continued
81
CO
NSO
LID
ATED
FIN
ANC
IAL
STAT
EMEN
TS

gain or loss is recognised immediately in the income statement. As of 31 December 2014, the fair value of these forward contracts was €9.0 million gain (€2.1 million gain).
In July 2011, the Group successfully entered into a €25 million and $195 million loan in the U.S. private placement market (USD loan) and at the same time entered into a series of cross currency interest rate swaps, effectively converting USD denominated private placement loan proceeds and obligations (principal and semi annual interest) into euro denominated flows.
The Group designated $70 million loan maturing in July 2021 as financial liability at fair value through profit and loss. Both the $70 million loan and the related cross currency interest rate swaps are measured at fair value in the consolidated statements of financial position. The Group accounts for the $75 million loan maturing in July 2018 and $50 million loan maturing in July 2023 as a financial liability at amortised costs. The Group applies cash
flow hedge accounting for related cross currency interest rate swaps, where the effective portion of changes in the fair value of cross currency interest rate swaps is recognised in other comprehensive income within equity and the ineffective portion of the gain or loss is recognised immediately in the consolidated income statements.
In April 2010, the Group successfully entered into a $165 million loan in the U.S. private placement market (USD loan) and at the same time entered into a series of cross currency interest rate swaps, effectively con-verting USD denominated private placement loan proceeds and obligations (principal and semi-annual interest) into euro denominated flows. The Group designated the USD loan as financial liability at fair value through profit and loss. Both the USD loan and related cross currency interest rate swaps are measured at fair value in the consolidated statements of financial position.
Exposure to currency risk The Group’s exposure for some of its main currencies was as follow:
2014 CNY INR CZK MXN KZT PLN RUB SEK TRY UAH IDR
In €’000 equivalentsIntra-group trading balances 5,876 11,565 (1,392) (41) 3,177 (13,068) 29,274 2,890 3,108 10,163 2,004Trade receivables/(payables) - – – – – 3,969 – (455) – – –Grossbalancesheetexposure 5,876 11,565 (1,392) (41) 3,177 (9,099) 29,274 2,435 3,108 10,163 2,004Forward and option exchange rate contracts* (2,017) – (4,869) (13,152) – (9,441) (53,301) (5,855) (17,726) – (17,577)NetExposure 3,859 11,565 (6,261) (13,193) 3,177(18,540)(24,027) (3,420) (14,618) 10,163(15,573)
2013 CNY INR CZK MXN KZT PLN RUB SEK TRY UAH IDR
In €’000 equivalentsIntra-group trading balances 3,809 9,912 (3,488) (29) 7,253 (3,813) 111,126 9,010 3,385 10,738 (119)Trade receivables/(payables) – 16 – – – 6,403 – (883) – – –Grossbalancesheetexposure 3,809 9,928 (3,488) (29) 7,253 2,590 111,126 8,127 3,385 10,738 (119)Forward exchange rate contracts* – – (5,105) (12,781) (7,548) (10,041) (129,888) (6,489) (12,532) – (4,533)NetExposure 3,809 9,928(8,593) (12,810) (295) (7,451) (18,762) 1,638 (9,147) 10,738 (4,652)
* Total of forward exchange contracts includes hedges related to uncommitted exposures. The Group continued to increase the hedging volumes for selected currency transaction exposures and highly probable forecast transactions covering more than 60 percent (50 percent) of the intra-group cost of sales. This strategy has been deployed in key markets such as Russia, Mexico, Czech Republic amongst others.
Note 28 continued
82
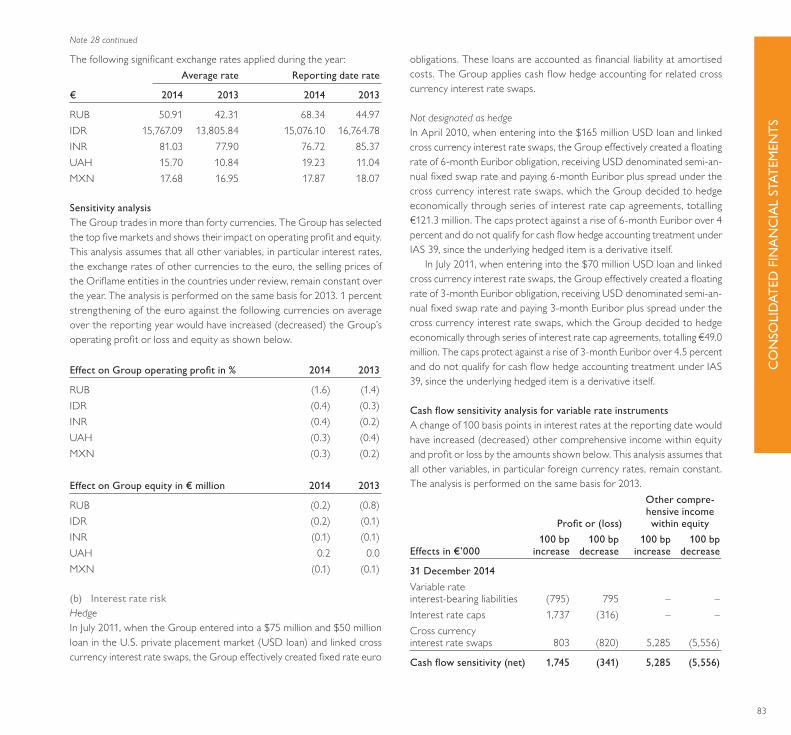
The following significant exchange rates applied during the year: Average rate Reporting date rate
€ 2014 2013 2014 2013
RUB 50.91 42.31 68.34 44.97IDR 15,767.09 13,805.84 15,076.10 16,764.78INR 81.03 77.90 76.72 85.37UAH 15.70 10.84 19.23 11.04MXN 17.68 16.95 17.87 18.07
Sensitivity analysisThe Group trades in more than forty currencies. The Group has selected the top five markets and shows their impact on operating profit and equity. This analysis assumes that all other variables, in particular interest rates, the exchange rates of other currencies to the euro, the selling prices of the Oriflame entities in the countries under review, remain constant over the year. The analysis is performed on the same basis for 2013. 1 percent strengthening of the euro against the following currencies on average over the reporting year would have increased (decreased) the Group’s operating profit or loss and equity as shown below.
EffectonGroupoperatingprofitin% 2014 2013
RUB (1.6) (1.4)IDR (0.4) (0.3)INR (0.4) (0.2)UAH (0.3) (0.4)MXN (0.3) (0.2)
Effect on Group equity in € million 2014 2013
RUB (0.2) (0.8)IDR (0.2) (0.1)INR (0.1) (0.1)UAH 0.2 0.0MXN (0.1) (0.1)
(b) InterestrateriskHedgeIn July 2011, when the Group entered into a $75 million and $50 million loan in the U.S. private placement market (USD loan) and linked cross currency interest rate swaps, the Group effectively created fixed rate euro
obligations. These loans are accounted as financial liability at amortised costs. The Group applies cash flow hedge accounting for related cross currency interest rate swaps.
Not designated as hedgeIn April 2010, when entering into the $165 million USD loan and linked cross currency interest rate swaps, the Group effectively created a floating rate of 6-month Euribor obligation, receiving USD denominated semi-an-nual fixed swap rate and paying 6-month Euribor plus spread under the cross currency interest rate swaps, which the Group decided to hedge economically through series of interest rate cap agreements, totalling €121.3 million. The caps protect against a rise of 6-month Euribor over 4 percent and do not qualify for cash flow hedge accounting treatment under IAS 39, since the underlying hedged item is a derivative itself.
In July 2011, when entering into the $70 million USD loan and linked cross currency interest rate swaps, the Group effectively created a floating rate of 3-month Euribor obligation, receiving USD denominated semi-an-nual fixed swap rate and paying 3-month Euribor plus spread under the cross currency interest rate swaps, which the Group decided to hedge economically through series of interest rate cap agreements, totalling €49.0 million. The caps protect against a rise of 3-month Euribor over 4.5 percent and do not qualify for cash flow hedge accounting treatment under IAS 39, since the underlying hedged item is a derivative itself.
CashflowsensitivityanalysisforvariablerateinstrumentsA change of 100 basis points in interest rates at the reporting date would have increased (decreased) other comprehensive income within equity and profit or loss by the amounts shown below. This analysis assumes that all other variables, in particular foreign currency rates, remain constant. The analysis is performed on the same basis for 2013. Other compre- hensive income Profitor(loss) withinequity 100 bp 100 bp 100 bp 100 bpEffects in €’000 increase decrease increase decrease
31 December 2014Variable rate interest-bearing liabilities (795) 795 – –Interest rate caps 1,737 (316) – –Cross currency interest rate swaps 803 (820) 5,285 (5,556)
Cashflowsensitivity(net) 1,745 (341) 5,285 (5,556)
Note 28 continued
83
CO
NSO
LID
ATED
FIN
ANC
IAL
STAT
EMEN
TS

Other compre- hensive income Profitor(loss) withinequity 100 bp 100 bp 100 bp 100 bpEffects in €’000 increase decrease increase decrease
31 December 2013Variable rate interest-bearing liabilities (661) 661 – –Interest rate caps 2,336 (1,224) – –Cross currency interest rate swaps 862 (883) 5,589 (5,943)
Cashflowsensitivity(net) 2,537 (1,446) 5,589 (5,943)
II Credit riskCredit risk is the risk of financial loss to the Group if a customer or coun-terparty to a financial instrument fails to meet its contractual obligations, and arises principally from the Group’s receivables from customers.
There is a credit policy in place and the exposure to credit risk is monitored on an ongoing basis. Management performs ongoing evalua-tions of the credit position of its consultants. Due to the nature of the direct sales industry, the Group does not have significant exposure to any individual customer (see note 17).
At reporting date there was no significant concentration of credit risk. The maximum exposure to credit risk is represented by the carrying amount of each financial asset in the statement of financial position:
€’000 2014 2013
Trade and other receivables 81,410 83,597Cash and cash equivalents 95,569 107,336Interest rate caps for trading 213 1,425Forward exchange rate contracts for trading 28,184 2,179Forward exchange rate contracts for hedging 10,249 2,212Option exchange contract for trading 3,966 –Cross currency interest rate swaps for trading 37,709 11,005Cross currency interest rate swaps for hedging 9,746 2,152
267,046 209,906
III Liquidity riskLiquidity risk is the risk that the Group will not be able to meet its financial obligations as they fall due. The Group’s approach to managing liquidity is to ensure, as far as possible, that it will always have sufficient liquidity to meet its liabilities when due, under both normal and stressed conditions, without incurring unacceptable losses or risking damage to the Group’s reputation.
Note 28 continued
84

31 December 2014 Carrying Contractual Lessthan 1–3 3–5 Morethan€’000 amount cashflows 1year years years 5years
Non-derivativefinancialliabilitiesLoans 340,404 345,023 39,127 70,911 90,714 144,271Other long term liabilities 591 591 – 591 – –Finance lease liabilities 34 39 25 14 – –Trade and other payables 86,915 86,915 86,915 – – –Bank overdrafts 54 54 54 – – –
Derivativefinancialliabilities Cross currency interest rate swaps for trading 954 954 954 – – –Forward exchange rate contracts for trading 11,428 11,428 11,428 – – –Cross currency interest rate swapsfor hedging (cash flow hedge) 1,020 1,020 1,020 – – –Forward exchange rate contracts for hedging (cash flow hedge) 1,250 1,250 1,250 – – –
Total 442,650 447,274 140,773 71,516 90,714 144,271
31 December 2013 Carrying Contractual Lessthan 1–3 3–5 Morethan€’000 amount cashflows 1year years years 5years
Non-derivativefinancialliabilitiesLoans 381,805 412,403 14,796 125,990 141,727 129,890Other long term liabilities 1,763 1,763 – 1,763 – –Finance lease liabilities 63 75 35 38 2 –Trade and other payables 82,357 82,357 82,357 – – –Bank overdrafts 548 548 548 – – –
Derivativefinancialliabilities Cross currency interest rate swaps for trading 1,013 1,013 1,013 – – –Forward exchange rate contracts for trading 794 794 516 278 – –Cross currency interest rate swapsfor hedging (cash flow hedge) 4,483 4,483 1,033 – 461 2,989Forward exchange rate contracts for hedging (cash flow hedge) 150 150 150 – – –
Total 472,976 503,586 100,448 128,069 142,190 132,879
The following are the contractual maturities of financial liabilities, including estimated interest payments:
Note 28 continued
85
CO
NSO
LID
ATED
FIN
ANC
IAL
STAT
EMEN
TS
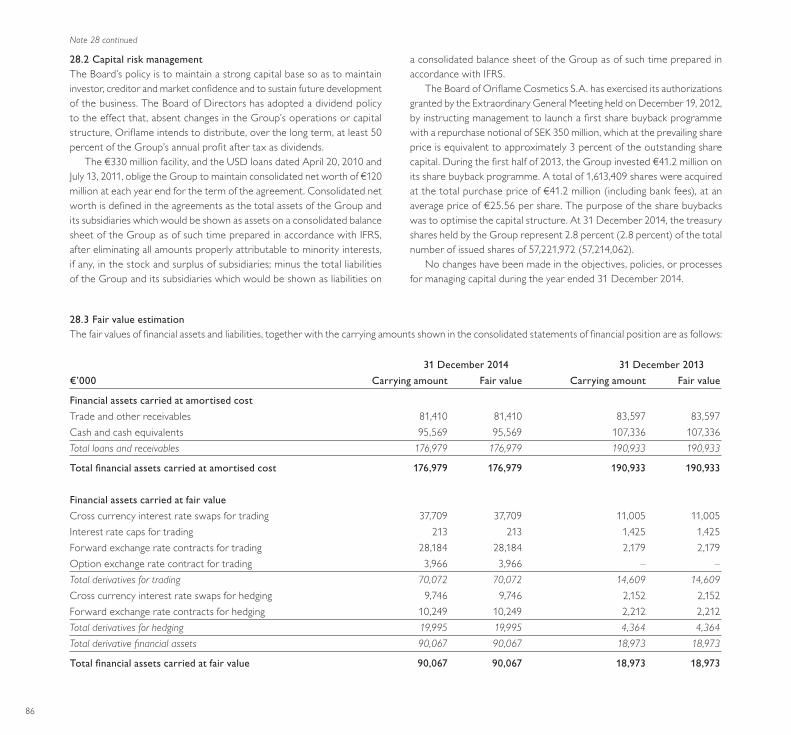
28.2CapitalriskmanagementThe Board’s policy is to maintain a strong capital base so as to maintain investor, creditor and market confidence and to sustain future development of the business. The Board of Directors has adopted a dividend policy to the effect that, absent changes in the Group’s operations or capital structure, Oriflame intends to distribute, over the long term, at least 50 percent of the Group’s annual profit after tax as dividends.
The €330 million facility, and the USD loans dated April 20, 2010 and July 13, 2011, oblige the Group to maintain consolidated net worth of €120 million at each year end for the term of the agreement. Consolidated net worth is defined in the agreements as the total assets of the Group and its subsidiaries which would be shown as assets on a consolidated balance sheet of the Group as of such time prepared in accordance with IFRS, after eliminating all amounts properly attributable to minority interests, if any, in the stock and surplus of subsidiaries; minus the total liabilities of the Group and its subsidiaries which would be shown as liabilities on
a consolidated balance sheet of the Group as of such time prepared in accordance with IFRS.
The Board of Oriflame Cosmetics S.A. has exercised its authorizations granted by the Extraordinary General Meeting held on December 19, 2012, by instructing management to launch a first share buyback programme with a repurchase notional of SEK 350 million, which at the prevailing share price is equivalent to approximately 3 percent of the outstanding share capital. During the first half of 2013, the Group invested €41.2 million on its share buyback programme. A total of 1,613,409 shares were acquired at the total purchase price of €41.2 million (including bank fees), at an average price of €25.56 per share. The purpose of the share buybacks was to optimise the capital structure. At 31 December 2014, the treasury shares held by the Group represent 2.8 percent (2.8 percent) of the total number of issued shares of 57,221,972 (57,214,062).
No changes have been made in the objectives, policies, or processes for managing capital during the year ended 31 December 2014.
28.3FairvalueestimationThe fair values of financial assets and liabilities, together with the carrying amounts shown in the consolidated statements of financial position are as follows:
31 December 2014 31 December 2013€’000 Carrying amount Fair value Carrying amount Fair value
Financial assets carried at amortised costTrade and other receivables 81,410 81,410 83,597 83,597 Cash and cash equivalents 95,569 95,569 107,336 107,336 Total loans and receivables 176,979 176,979 190,933 190,933
Totalfinancialassetscarriedatamortisedcost 176,979 176,979 190,933 190,933
Financial assets carried at fair valueCross currency interest rate swaps for trading 37,709 37,709 11,005 11,005Interest rate caps for trading 213 213 1,425 1,425Forward exchange rate contracts for trading 28,184 28,184 2,179 2,179Option exchange rate contract for trading 3,966 3,966 – –Total derivatives for trading 70,072 70,072 14,609 14,609 Cross currency interest rate swaps for hedging 9,746 9,746 2,152 2,152 Forward exchange rate contracts for hedging 10,249 10,249 2,212 2,212 Total derivatives for hedging 19,995 19,995 4,364 4,364 Total derivative financial assets 90,067 90,067 18,973 18,973
Totalfinancialassetscarriedatfairvalue 90,067 90,067 18,973 18,973
Note 28 continued
86
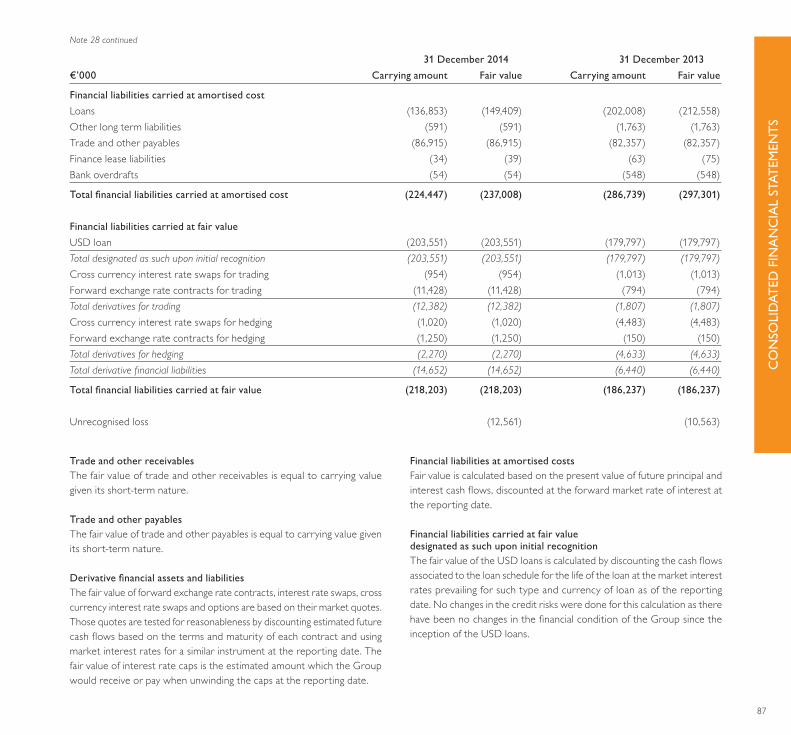
31 December 2014 31 December 2013€’000 Carrying amount Fair value Carrying amount Fair value
Financial liabilities carried at amortised costLoans (136,853) (149,409) (202,008) (212,558)Other long term liabilities (591) (591) (1,763) (1,763)Trade and other payables (86,915) (86,915) (82,357) (82,357)Finance lease liabilities (34) (39) (63) (75)Bank overdrafts (54) (54) (548) (548)
Totalfinancialliabilitiescarriedatamortisedcost (224,447) (237,008) (286,739) (297,301)
Financial liabilities carried at fair valueUSD loan (203,551) (203,551) (179,797) (179,797)Total designated as such upon initial recognition (203,551) (203,551) (179,797) (179,797)Cross currency interest rate swaps for trading (954) (954) (1,013) (1,013)Forward exchange rate contracts for trading (11,428) (11,428) (794) (794)Total derivatives for trading (12,382) (12,382) (1,807) (1,807)Cross currency interest rate swaps for hedging (1,020) (1,020) (4,483) (4,483)Forward exchange rate contracts for hedging (1,250) (1,250) (150) (150)Total derivatives for hedging (2,270) (2,270) (4,633) (4,633)Total derivative financial liabilities (14,652) (14,652) (6,440) (6,440)
Totalfinancialliabilitiescarriedatfairvalue (218,203) (218,203) (186,237) (186,237) Unrecognised loss (12,561) (10,563)
Trade and other receivablesThe fair value of trade and other receivables is equal to carrying value given its short-term nature.
Trade and other payablesThe fair value of trade and other payables is equal to carrying value given its short-term nature.
DerivativefinancialassetsandliabilitiesThe fair value of forward exchange rate contracts, interest rate swaps, cross currency interest rate swaps and options are based on their market quotes. Those quotes are tested for reasonableness by discounting estimated future cash flows based on the terms and maturity of each contract and using market interest rates for a similar instrument at the reporting date. The fair value of interest rate caps is the estimated amount which the Group would receive or pay when unwinding the caps at the reporting date.
Financial liabilities at amortised costs Fair value is calculated based on the present value of future principal and interest cash flows, discounted at the forward market rate of interest at the reporting date.
Financial liabilities carried at fair value designated as such upon initial recognitionThe fair value of the USD loans is calculated by discounting the cash flows associated to the loan schedule for the life of the loan at the market interest rates prevailing for such type and currency of loan as of the reporting date. No changes in the credit risks were done for this calculation as there have been no changes in the financial condition of the Group since the inception of the USD loans.
Note 28 continued
87
CO
NSO
LID
ATED
FIN
ANC
IAL
STAT
EMEN
TS

28.4FairvaluehierarchyThe table below shows fair value of financial assets and financial liabilities, including their levels in the fair value hierarchy, by valuation method. It does not include fair value information for financial assets and financial liabilities not measured at fair value if the carrying amount is a reasonable approxi- mation of fair value. The different levels have been defined as follows:
Level 1: quoted prices (unadjusted) in active markets for identical assets or liabilities
Level 2: inputs other than quoted prices included within Level 1 that are observable for the asset or liability, either directly (i.e., as prices) or indirectly (i.e., derived from prices)
Level 3: inputs for the asset or liability that are not based on observable market data (unobservable inputs)
€’000 Level 1 Level 2 Level 3 Total
31 December 2014Financial assets and liabilities measured at fair value
USD loans – (203,551) – (203,551)Derivative financial assets – 90,067 – 90,067 Derivative financial liabilities – (14,652) – (14,652)
– (128,136) – (128,136)
Financial assets and liabilities not measured at fair value
Loans – (149,409) – (149,409)Finance lease liabilities – (39) – (39)
– (149,448) – (149,448)
€’000 Level 1 Level 2 Level 3 Total
31 December 2013Financial assets and liabilities measured at fair value
USD loans – (179,797) – (179,797)Derivative financial assets – 18,973 – 18,973Derivative financial liabilities – (6,440) – (6,440)
– (167,264) – (167,264)
Financial assets and liabilities not measured at fair value
Loans – (212,558) – (212,558)Finance lease liabilities – (75) – (75)
– (212,633) – (212,633)
28.5MasternettingorsimilaragreementsThe Group enters into derivative transactions under International Swaps and Derivatives Association (ISDA) master netting agreements. In general, under such agreements the amounts owed by each counterparty on a single day in respect of all transactions outstanding in the same currency are aggregated into a single net amount that is payable by one party to the other.
In certain circumstances – e.g. when a credit event such as a default occurs, all outstanding transactions under the agreement are terminated, the termination value is assessed and only a single net amount is payable in settlement of all transactions.
The ISDA agreements do not meet the criteria for offsetting in the statement of financial position. This is because the Group does not have any currently legally enforceable right to offset recognised amounts, because the right to offset is enforceable only on the occurrence of future events such as a default on the bank loans or other credit events.
Note 28 continued
88
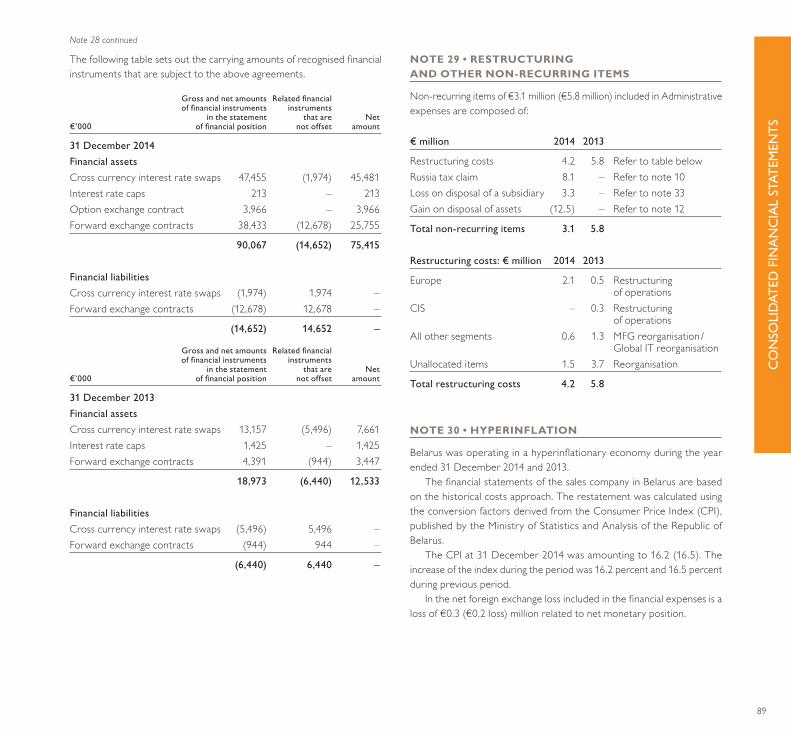
The following table sets out the carrying amounts of recognised financial instruments that are subject to the above agreements.
Grossandnetamounts Relatedfinancial offinancialinstruments instruments in the statement that are Net€’000 offinancialposition notoffset amount
31 December 2014Financial assetsCross currency interest rate swaps 47,455 (1,974) 45,481Interest rate caps 213 – 213Option exchange contract 3,966 – 3,966Forward exchange contracts 38,433 (12,678) 25,755
90,067 (14,652) 75,415
Financial liabilitiesCross currency interest rate swaps (1,974) 1,974 –Forward exchange contracts (12,678) 12,678 –
(14,652) 14,652 –
Grossandnetamounts Relatedfinancial offinancialinstruments instruments in the statement that are Net€’000 offinancialposition notoffset amount
31 December 2013Financial assetsCross currency interest rate swaps 13,157 (5,496) 7,661 Interest rate caps 1,425 – 1,425 Forward exchange contracts 4,391 (944) 3,447
18,973 (6,440) 12,533
Financial liabilitiesCross currency interest rate swaps (5,496) 5,496 –Forward exchange contracts (944) 944 –
(6,440) 6,440 –
NOTE 29 • RESTRUCTURING AND OTHER NON-RECURRING ITEMS
Non-recurring items of €3.1 million (€5.8 million) included in Administrative expenses are composed of:
€ million 2014 2013
Restructuring costs 4.2 5.8 Refer to table below Russia tax claim 8.1 – Refer to note 10Loss on disposal of a subsidiary 3.3 – Refer to note 33Gain on disposal of assets (12.5) – Refer to note 12
Totalnon-recurringitems 3.1 5.8
Restructuringcosts:€million 2014 2013
Europe 2.1 0.5 Restructuring of operationsCIS – 0.3 Restructuring of operationsAll other segments 0.6 1.3 MFG reorganisation / Global IT reorganisationUnallocated items 1.5 3.7 Reorganisation
Totalrestructuringcosts 4.2 5.8
NOTE 30 • HYPERINFLATION
Belarus was operating in a hyperinflationary economy during the year ended 31 December 2014 and 2013.
The financial statements of the sales company in Belarus are based on the historical costs approach. The restatement was calculated using the conversion factors derived from the Consumer Price Index (CPI), published by the Ministry of Statistics and Analysis of the Republic of Belarus.
The CPI at 31 December 2014 was amounting to 16.2 (16.5). The increase of the index during the period was 16.2 percent and 16.5 percent during previous period.
In the net foreign exchange loss included in the financial expenses is a loss of €0.3 (€0.2 loss) million related to net monetary position.
Note 28 continued
89
CO
NSO
LID
ATED
FIN
ANC
IAL
STAT
EMEN
TS

NOTE 31 • ACCRUED EXPENSES
€’000 2014 2013
PD & Bonus 28,891 35,031Staff related accruals 10,927 17,225Other accruals 48,951 45,826
Totalaccruedexpenses 88,769 98,082
NOTE 32 • FIRE CASE IN INDIA
One of the main warehouses in India was completely destroyed by fire during the final quarter of 2013. The destroyed inventory and property, plant and equipment were fully insured. The warehouse was not owned by Oriflame.
The write off of inventory and property, plant and equipment as well as the estimated insurance recoverable were recognised as follows:
€’000 2014 2013
Inventory write off – 7,750Property, plant & equipment write off – 185
Total – 7,935Insurance recoverable* (7,516) (6,870)
* The amount of insurance recoverable was an estimated amount in local currency and was booked in Other Receivables as reported in note 17. The gain in EUR is mainly due to exchange rate difference.
In 2013, the inventory write off and the related insurance recoverable were booked in cost of sale in the consolidated income statements.
The property, plant and equipment write off was booked in depreci-ation presented in Administrative expenses in the consolidated income statements and no related insurance recoverable was booked as at 31 December 2013.
Subsequent event The insurance claim was settled and the Group received €7.8 million on 6 January 2015. The gain in EUR is due to exchange rate difference.
NOTE 33 • DISPOSAL OF SUBSIDIARY
Effective 30 November 2014 the Group sold its wholly owned subsidiary Oriflame Products Sweden AB (Nordium AB).
LossondisposaloftheSwedishfactory:€’000 2014
Consideration 1,873
Net assets disposed Property, plant and equipment 8,420Cash and cash equivalents 3,453Other net assets (5,759)Accumulated currency translation adjustment (1,077)
Totalnetassetsdisposed 5,037
Transaction costs (154)Lossondisposalofsubsidiary (3,318)
The loss on disposal of the Swedish factory was booked in Administrative expenses.
NOTE 34 • EVENTS SUBSEQUENT TO THE REPORTING DATE
After the reporting date there was a weakening of the UAH against the EUR by approximately 35 percent. The Group is presenting on a quarterly basis exchange rates impacts.
90

Report of the Réviseur d’Entreprises agrééTo the Shareholders of Oriflame Cosmetics S.A.
REPORT ON THE CONSOLIDATED FINANCIAL STATEMENTS Following our appointment by the General Meeting of the Shareholders dated 19 May 2014, we have audited the accompanying consolidated financial statements of Oriflame Cosmetics S.A., which comprise the consolidated statement of financial position as at 31 December 2014 and the consolidated income statement, consolidated statement of compre-hensive income, consolidated statement of changes in equity and conso-lidated statement of cash flows for the year then ended, and a summary of significant accounting policies and other explanatory information as set out on pages 52 to 90.
BOARD OF DIRECTORS’ RESPONSIBILITY FOR THE CONSOLIDATED FINANCIAL STATEMENTSThe Board of Directors is responsible for the preparation and fair pre-sentation of these consolidated financial statements in accordance with International Financial Reporting Standards as adopted by the European Union, and for such internal control as the Board of Directors determines is necessary to enable the preparation of consolidated financial statements that are free from material misstatement, whether due to fraud or error.
RESPONSIBILITY OF THE RÉVISEUR D’ENTREPRISES AGRÉÉOur responsibility is to express an opinion on these consolidated financial statements based on our audit. We conducted our audit in accordance with International Standards on Auditing as adopted for Luxembourg by the Commission de Surveillance du Secteur Financier. Those standards require that we comply with ethical requirements and plan and perform the audit to obtain reasonable assurance about whether the consolidated financial statements are free from material misstatement.
An audit involves performing procedures to obtain audit evidence about the amounts and disclosures in the consolidated financial statements. The procedures selected depend on the judgement of the Réviseur d’Entre-prises agréé, including the assessment of the risks of material misstate-ment of the consolidated financial statements, whether due to fraud or
error. In making those risk assessments, the Réviseur d’Entreprises agréé considers internal control relevant to the entity’s preparation and fair presentation of the consolidated financial statements in order to design audit procedures that are appropriate in the circumstances, but not for the purpose of expressing an opinion on the effectiveness of the entity’s internal control. An audit also includes evaluating the appropriateness of accounting policies used and the reasonableness of accounting estimates made by the Board of Directors, as well as evaluating the overall presen-tation of the consolidated financial statements.
We believe that the audit evidence we have obtained is sufficient and appropriate to provide a basis for our audit opinion.
OPINIONIn our opinion, the consolidated financial statements, as set out on pages 52 to 90, give a true and fair view of the consolidated financial position of Oriflame Cosmetics S.A. as of 31 December 2014, and of its consolidated financial performance and its consolidated cash flows for the year then ended in accordance with International Financial Reporting Standards as adopted by the European Union.
REPORT ON OTHER LEGAL AND REGULATORY REQUIREMENTSThe consolidated directors’ report, including the corporate governance statement, which is the responsibility of the Board of Directors, is consis-tent with the consolidated financial statements and includes the information required by the law with respect to the Corporate Governance Statement.
Luxembourg, 14 April 2015
KPMG Luxembourg, Société coopérativeCabinet de révision agréé
S. Nye
91
CO
NSO
LID
ATED
FIN
ANC
IAL
STAT
EMEN
TS
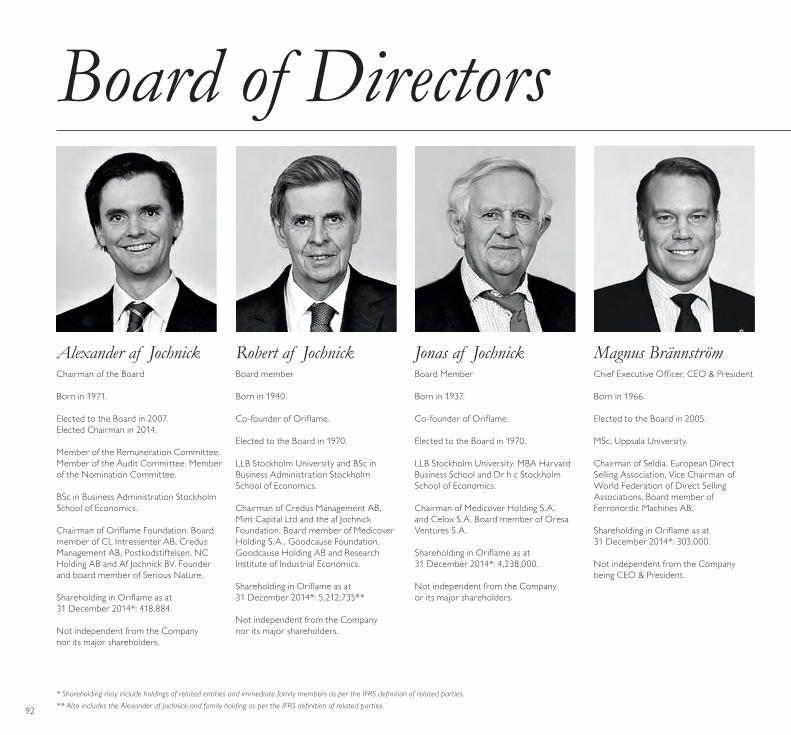
Board of Directors
* Shareholding may include holdings of related entities and immediate family members as per the IFRS definition of related parties.** Also includes the Alexander af Jochnick and family holding as per the IFRS definition of related parties.
Alexander af JochnickChairman of the Board
Born in 1971.
Elected to the Board in 2007. Elected Chairman in 2014.
Member of the Remuneration Committee. Member of the Audit Committee. Member of the Nomination Committee.
BSc in Business Administration Stockholm School of Economics.
Chairman of Oriflame Foundation. Board member of CL Intressenter AB, Credus Management AB, Postkodstiftelsen, NC Holding AB and Af Jochnick BV. Founder and board member of Serious Nature.
Shareholding in Oriflame as at 31 December 2014*: 418,884.
Not independent from the Company nor its major shareholders.
Jonas af JochnickBoard Member
Born in 1937.
Co-founder of Oriflame.
Elected to the Board in 1970.
LLB Stockholm University. MBA Harvard Business School and Dr h c Stockholm School of Economics.
Chairman of Medicover Holding S.A. and Celox S.A. Board member of Oresa Ventures S.A.
Shareholding in Oriflame as at 31 December 2014*: 4,238,000.
Not independent from the Company or its major shareholders.
Magnus BrannstromChief Executive Officer, CEO & President
Born in 1966.
Elected to the Board in 2005.
MSc, Uppsala University.
Chairman of Seldia, European Direct Selling Association, Vice Chairman of World Federation of Direct Selling Associations. Board member of Ferronordic Machines AB.
Shareholding in Oriflame as at 31 December 2014*: 303,000.
Not independent from the Company being CEO & President.
Robert af JochnickBoard member
Born in 1940.
Co-founder of Oriflame.
Elected to the Board in 1970.
LLB Stockholm University and BSc in Business Administration Stockholm School of Economics.
Chairman of Credus Management AB, Mint Capital Ltd and the af Jochnick Foundation. Board member of Medicover Holding S.A., Goodcause Foundation, Goodcause Holding AB and Research Institute of Industrial Economics.
Shareholding in Oriflame as at 31 December 2014*: 5,212,735**
Not independent from the Company nor its major shareholders.
92
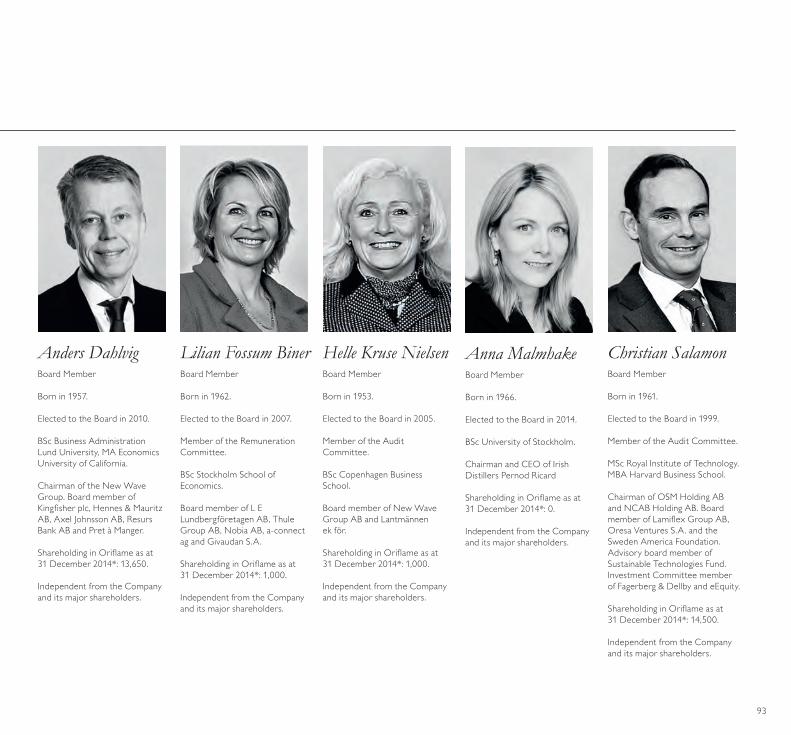
Anna MalmhakeBoard Member
Born in 1966.
Elected to the Board in 2014.
BSc University of Stockholm.
Chairman and CEO of Irish Distillers Pernod Ricard
Shareholding in Oriflame as at 31 December 2014*: 0.
Independent from the Company and its major shareholders.
Christian SalamonBoard Member
Born in 1961.
Elected to the Board in 1999.
Member of the Audit Committee. MSc Royal Institute of Technology. MBA Harvard Business School.
Chairman of OSM Holding AB and NCAB Holding AB. Board member of Lamiflex Group AB, Oresa Ventures S.A. and the Sweden America Foundation. Advisory board member of Sustainable Technologies Fund. Investment Committee member of Fagerberg & Dellby and eEquity.
Shareholding in Oriflame as at 31 December 2014*: 14,500.
Independent from the Company and its major shareholders.
Lilian Fossum BinerBoard Member
Born in 1962.
Elected to the Board in 2007.
Member of the Remuneration Committee.
BSc Stockholm School of Economics.
Board member of L E Lundbergföretagen AB, Thule Group AB, Nobia AB, a-connect ag and Givaudan S.A.
Shareholding in Oriflame as at 31 December 2014*: 1,000.
Independent from the Company and its major shareholders.
Anders DahlvigBoard Member
Born in 1957.
Elected to the Board in 2010.
BSc Business Administration Lund University, MA Economics University of California.
Chairman of the New Wave Group. Board member of Kingfisher plc, Hennes & Mauritz AB, Axel Johnsson AB, Resurs Bank AB and Pret à Manger.
Shareholding in Oriflame as at 31 December 2014*: 13,650.
Independent from the Company and its major shareholders.
Helle Kruse NielsenBoard Member
Born in 1953.
Elected to the Board in 2005.
Member of the Audit Committee.
BSc Copenhagen Business School.
Board member of New Wave Group AB and Lantmännen ek för.
Shareholding in Oriflame as at 31 December 2014*: 1,000.
Independent from the Company and its major shareholders.
93
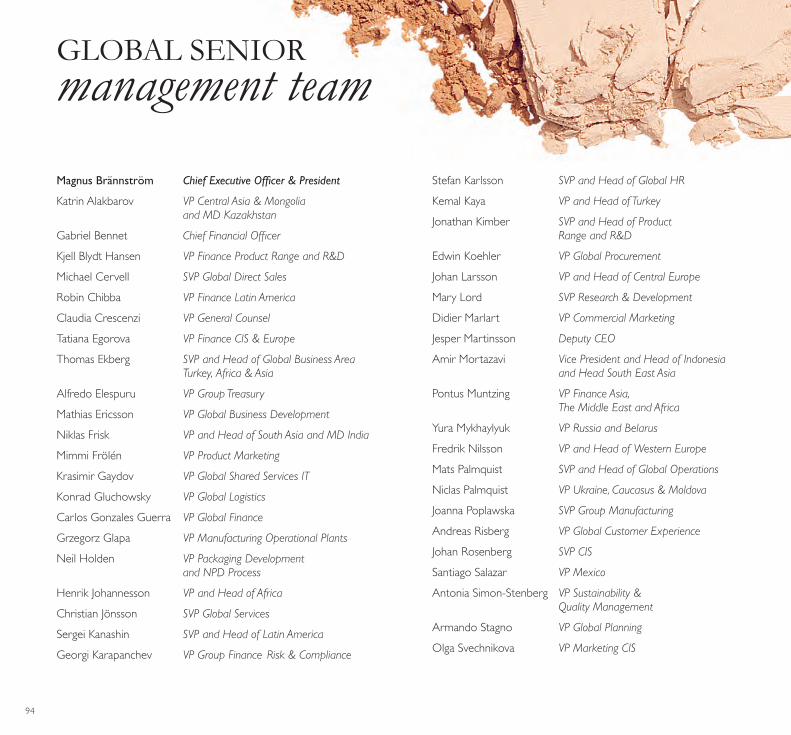
94
Magnus Brännström Chief Executive Offi cer & President
Katrin Alakbarov VP Central Asia & Mongolia and MD Kazakhstan
Gabriel Bennet Chief Financial Offi cer
Kjell Blydt Hansen VP Finance Product Range and R&D
Michael Cervell SVP Global Direct Sales
Robin Chibba VP Finance Latin America
Claudia Crescenzi VP General Counsel
Tatiana Egorova VP Finance CIS & Europe
Thomas Ekberg SVP and Head of Global Business Area Turkey, Africa & Asia
Alfredo Elespuru VP Group Treasury
Mathias Ericsson VP Global Business Development
Niklas Frisk VP and Head of South Asia and MD India
Mimmi Frölén VP Product Marketing
Krasimir Gaydov VP Global Shared Services IT
Konrad Gluchowsky VP Global Logistics
Carlos Gonzales Guerra VP Global Finance
Grzegorz Glapa VP Manufacturing Operational Plants
Neil Holden VP Packaging Development and NPD Process
Henrik Johannesson VP and Head of Africa
Christian Jönsson SVP Global Services
Sergei Kanashin SVP and Head of Latin America
Georgi Karapanchev VP Group Finance Risk & Compliance
Stefan Karlsson SVP and Head of Global HR
Kemal Kaya VP and Head of Turkey
Jonathan Kimber SVP and Head of Product Range and R&D
Edwin Koehler VP Global Procurement
Johan Larsson VP and Head of Central Europe
Mary Lord SVP Research & Development
Didier Marlart VP Commercial Marketing
Jesper Martinsson Deputy CEO
Amir Mortazavi Vice President and Head of Indonesia and Head South East Asia
Pontus Muntzing VP Finance Asia, The Middle East and Africa
Yura Mykhaylyuk VP Russia and Belarus
Fredrik Nilsson VP and Head of Western Europe
Mats Palmquist SVP and Head of Global Operations
Niclas Palmquist VP Ukraine, Caucasus & Moldova
Joanna Poplawska SVP Group Manufacturing
Andreas Risberg VP Global Customer Experience
Johan Rosenberg SVP CIS
Santiago Salazar VP Mexico
Antonia Simon-Stenberg VP Sustainability & Quality Management
Armando Stagno VP Global Planning
Olga Svechnikova VP Marketing CIS
management teamGLOBAL SENIOR

95
FinancialCALENDAR 2015
• First quarter 2015 report on 8 May
• 2015 Annual General Meeting on 19 May
• Second quarter 2015 report on 13 August
• Third quarter 2015 report on 12 November
The annual report is available at www.orifl ame.com, as are interim reports, previous annual reports and other fi nancial material.
Distribution principles
Copyright ©2015 by Orifl ame Cosmetics Global SA. All rights reserved.This annual report is produced by Orifl ame Cosmetics in cooperation with Vero Kommunikation and Soformia.Photos: Orifl ame Cosmetics.
Johanna PalmSenior Director Investor Relations & Finance ProjectsPhone: +46 765 422 672ir@orifl ame.com
Orifl ame investor relations contacts

Reports and information can be obtained from: www.orifl ame.com