annual report 2015 - oman power and water … (7).pdf · opwp annual report 2015 | 3 ... of...
TRANSCRIPT
ANNUAL REPORT 2015


His Majesty Sultan Qaboos Bin Said


OPWP ANNUAL REPORT 2015 | 3
LIST OF TABLES & FIGURES 4GLOSSARY 4
1 ABOUT US 51.1 BoardofDirectorsandExecutiveManagement 51.2 Chairman’sForeword 61.3 CompanyProfile 81.4 Company’sStrategy 91.5 OrganizationStructure&Functions 10
2 BUSINESS REVIEW 122.1 SignificantAchievementsoftheYear2015 122.2 2016KeyPriorities 12
3 FINANCIAL HIGHLIGHTS 14
4 OPERATIONAL HIGHLIGHTS (As per Regulatory Framework) 164.1 MIS–Electricity 164.2 DhofarPowerSystem-Electricity 164.3 WaterPurchase 16
5 OPERATIONAL PERFORMANCE 175.1 ProcurementandBulkSupplyArrangements 175.2 PurchaseandSaleofPowerandWaterduring2015 195.3 ElectricityDemandandGenerationResources(2009-2015) 205.4 FuelEfficiency 215.5 YearoverYearPerformanceofPowerGenerationResources 215.6 PowerPurchaseCost 225.7 ElectricityBulkSupplyStatistics 22
6 HUMAN RESOURCES 256.1 KeyHumanResourcesInitiativesin2015 25
7 QUALITY, HEALTH & SAFETY AND ENVIRONMENT 25
8 CORPORATE GOVERNANCE REPORT 258.1 CorporateGovernance: 258.2 InternalAudit 268.3 RiskManagement 268.4 BoardMeetingsandSittingFees 27
9 FINANCIAL STATEMENTS 28
TABLE OF CONTENTS
4 | OPWP ANNUAL REPORT 2015
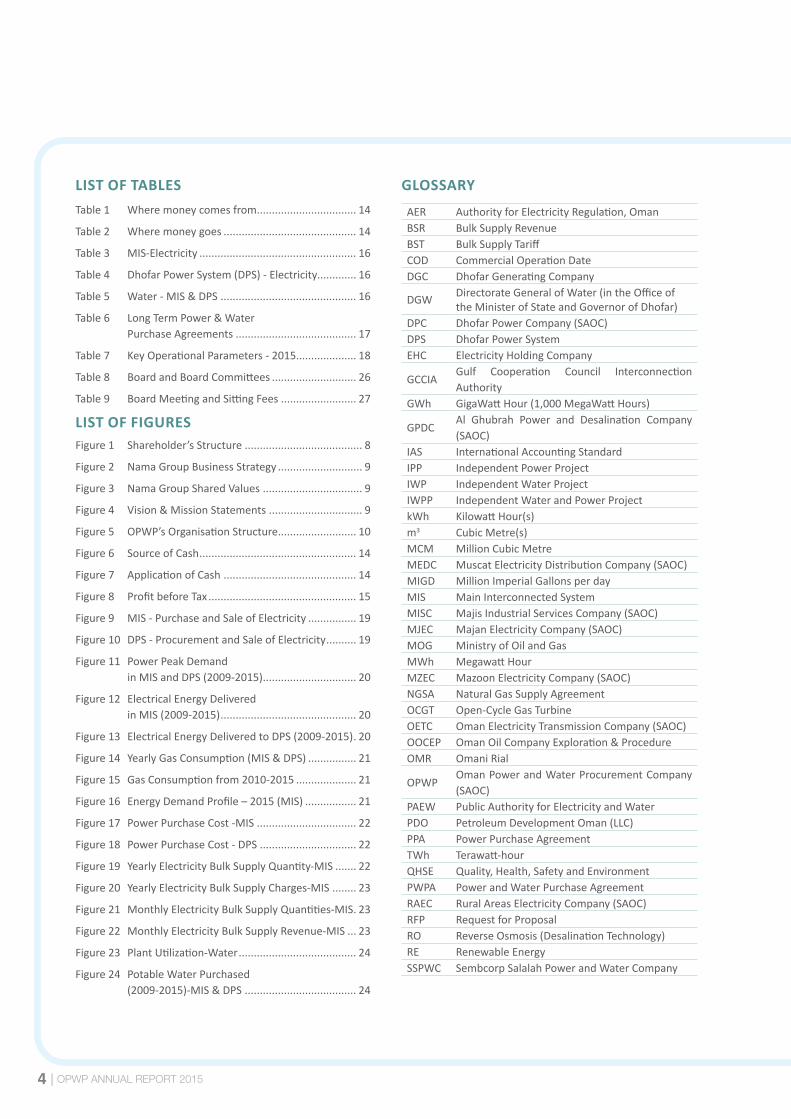
LIST OF TABLESTable1 Wheremoneycomesfrom ................................. 14
Table2 Wheremoneygoes ............................................ 14
Table3 MIS-Electricity .................................................... 16
Table4 DhofarPowerSystem(DPS)-Electricity............. 16
Table5 Water-MIS&DPS ............................................. 16
Table6 LongTermPower&Water PurchaseAgreements ........................................ 17
Table7 KeyOperationalParameters-2015.................... 18
Table8 BoardandBoardCommittees ............................ 26
Table9 BoardMeetingandSittingFees ......................... 27
LIST OF FIGURESFigure1 Shareholder’sStructure ....................................... 8
Figure2 NamaGroupBusinessStrategy ............................ 9
Figure3 NamaGroupSharedValues ................................. 9
Figure4 Vision&MissionStatements ............................... 9
Figure5 OPWP’sOrganisationStructure .......................... 10
Figure6 SourceofCash .................................................... 14
Figure7 ApplicationofCash ............................................ 14
Figure8 ProfitbeforeTax ................................................. 15
Figure9 MIS-PurchaseandSaleofElectricity ................ 19
Figure10DPS-ProcurementandSaleofElectricity .......... 19
Figure11PowerPeakDemand inMISandDPS(2009-2015) ............................... 20
Figure12 ElectricalEnergyDelivered inMIS(2009-2015) ............................................. 20
Figure13 ElectricalEnergyDeliveredtoDPS(2009-2015) . 20
Figure14 YearlyGasConsumption(MIS&DPS) ................ 21
Figure15GasConsumptionfrom2010-2015 .................... 21
Figure16 EnergyDemandProfile–2015(MIS) ................. 21
Figure17 PowerPurchaseCost-MIS ................................. 22
Figure18 PowerPurchaseCost-DPS ................................ 22
Figure19 YearlyElectricityBulkSupplyQuantity-MIS ....... 22
Figure20 YearlyElectricityBulkSupplyCharges-MIS ........ 23
Figure21MonthlyElectricityBulkSupplyQuantities-MIS . 23
Figure22MonthlyElectricityBulkSupplyRevenue-MIS ... 23
Figure23PlantUtilization-Water ....................................... 24
Figure24 PotableWaterPurchased (2009-2015)-MIS&DPS ..................................... 24
GLOSSARY
AER AuthorityforElectricityRegulation,OmanBSR BulkSupplyRevenueBST BulkSupplyTariffCOD CommercialOperationDateDGC DhofarGeneratingCompany
DGW DirectorateGeneralofWater(intheOfficeoftheMinisterofStateandGovernorofDhofar)
DPC DhofarPowerCompany(SAOC)DPS DhofarPowerSystemEHC ElectricityHoldingCompany
GCCIAGulf Cooperation Council InterconnectionAuthority
GWh GigaWattHour(1,000MegaWattHours)
GPDCAl Ghubrah Power and Desalination Company(SAOC)
IAS InternationalAccountingStandardIPP IndependentPowerProjectIWP IndependentWaterProjectIWPP IndependentWaterandPowerProjectkWh KilowattHour(s)m3 CubicMetre(s)MCM Million Cubic MetreMEDC MuscatElectricityDistributionCompany(SAOC)MIGD MillionImperialGallonsperdayMIS MainInterconnectedSystemMISC MajisIndustrialServicesCompany(SAOC)MJEC MajanElectricityCompany(SAOC)MOG MinistryofOilandGasMWh MegawattHourMZEC MazoonElectricityCompany(SAOC)NGSA NaturalGasSupplyAgreementOCGT Open-CycleGasTurbineOETC OmanElectricityTransmissionCompany(SAOC)OOCEP OmanOilCompanyExploration&ProcedureOMR OmaniRial
OPWPOmanPowerandWaterProcurementCompany(SAOC)
PAEW PublicAuthorityforElectricityandWaterPDO PetroleumDevelopmentOman(LLC)PPA PowerPurchaseAgreementTWh Terawatt-hourQHSE Quality,Health,SafetyandEnvironmentPWPA PowerandWaterPurchaseAgreementRAEC RuralAreasElectricityCompany(SAOC)RFP RequestforProposalRO ReverseOsmosis(DesalinationTechnology)RE RenewableEnergySSPWC SembcorpSalalahPowerandWaterCompany

OPWP ANNUAL REPORT 2015 | 5
1. ABOUT US
1.1 BOARD OF DIRECTORS AND EXECUTIVE MANAGEMENT
BOARD OF DIRECTORS
EXECUTIVE MANAGEMENT
Mr. Hamdan Bin Ali Al HinaiChairmanoftheBoard
Otherposition:DirectorGeneralofPurchasing&Contracts,Ministry of Defence
Mr. Saleh Bin Ali Al HarthyMemberoftheBoard
Otherposition:DirectorofGasRevenue, MinistryofFinance
Mr. S. VishwanathMemberoftheBoard
Otherposition:ChiefFinancialOfficer, ElectricityHoldingCompany
Eng. Ahmed Bin Saleh Al Jahdhami ChiefExecutiveOfficer
Eng. Saleh Bin Nasser Al-RumhiDeputyChairmanoftheBoard
Otherposition:GeneralManagerforPolicy&StrategyStudies,PublicAuthorityforElectricity&Water
Mr. Sean O’HareMemberoftheBoard
Otherposition:FounderofBoardroomDialogueLtd,focusedonBoardEffectivenessReviews,BusinessCoaching,andLeadershipandPersonalDevelopment
Eng. Yaqoob Bin Saif Al Kiyumi ChiefOperatingOfficer

6 | OPWP ANNUAL REPORT 2015
1.2 CHAIRMAN’S FOREWORD
Dear Shareholders,
OnbehalfofthemembersoftheBoard,IhavethepleasureinpresentingtheAnnualReportofOmanPowerandWaterProcurementCompanySAOCfortheyear2015.
2015 Achievements
Theyear2015wasanother challengingbut successful yearfor OPWP with the company accomplishing a number ofmajorinitiatives,including:
SignedtheWPAfortheQurayyatIWP(44MIGD)withaplannedCODinMay2017.
SignedtheWPAfortheBarkaIPhaseIIExpansion(12.5MIGD)withaplannedCODinJan2016.
SignedthePPAfortheMusandamIPP(120MW)withaplannedCODinFeb2017.
SignedPPAfortheSalalahIIIPP(445MW)withaplannedCODforJanuary2018.
Awarded the PPA for the Ibri/ Sohar III IPPs (combinedcontractedcapacityaround3,200MW)withearlypowerinApril2018forIbriIPPandfullcapacityinJanuary2019forSoharIIIandApril2019forIbri.
AwardedWPAfortheSoharII/BarkaIVIWPs(55MIGDand61.8MIGDrespectively)withaplannedCODinApril2018.
AwardedWPAfortemporarywaterprojectsinQurayyatand Aseelah (1.8 and 2.2 MIGD respectively) with aplannedCODinJune2016andJuly2016respectively.
SignedaPowerSalesandPurchaseAgreementwithPDOfortheHarweel–Thumraitinterconnectionproject.
Commissioned 10 MIGD of water capacity at Barka IPhaseIIexpansion.
Signed extension of PWPA with Al Ghubrah Power &DesalinationCompany,andextensionofPPAwithWadiAlJizziPowerCompanyto2018inbothcases.
SignedextensionofPPAwithSoharAluminiumCompanyto2018.
OPWPandOETC achieved 8% reduction in the averageamount of gas required for each unit of electricitygeneratedcomparedto2014.
Financial Highlights
OPWP’searningsbeforetaxaspertheRegulatoryframeworkstood at OMR 1.138 million. However, financial accountscontinuetobemateriallyaffectedbychangesintheaccountingtreatment of its Power and Water Purchase Agreements inline with recommendations by its auditors to comply withInternational Accounting Standards. OPWP has booked anetlossbeforetaxofOMR1.628million.Sincethecompanycontinuestohaveanegativeequity,adividendisnotproposed.
Corporate Governance
It is very important to highlight the fact that the Board iscommittedtothehigheststandardsofcorporategovernance.In order to facilitate efficient and effective management,theAuditCommitteeoverseestheinternalcontrolsandriskmanagementwiththehelpofindependentinternalauditors.
Icanconfirmthatthereareadequateinternalcontrolsystemsin placewithin the company to protect the interest of theshareholdersandotherstakeholders.
2016 Key Priorities
OPWPlooksforwardto2016withanumberofkeyprioritiesandprojectswhichincludethefollowing:
Ensure the successful implementation of new projectsaccordingtoprojecttimelines.
SignPPAwithRAECOfortheDhofarWindPowerproject(50MW)withaplannedCODin2017.
Sign and award WPAs for Salalah and Sharqiyah IWPs (22MIGDand17.6MIGDrespectively).
Continue improvement of gas utilization in electricitygeneration,incollaborationwithOETC
Develop demand management initiatives with largeindustrialcustomers.
FinalizeagreementsforGCCIApowertrading,andexecuteonetradein2016.
WorkwithOETCandPDOtoevaluatecostsandbenefitsof the proposed 400 kV interconnection fromNizwa toDuqm,PDO,andtheDhofarPowerSystem.
Initiateprocurementof800MWnewpowercapacity inMISforCODin2021.
TenderforDuqmIWP(13MIGD)withaplannedCODinlate2019.
TenderforKhasabIWP(3.5MIGD)withaplannedCODinlate2019.
Completedevelopmentofdetailedmarket rules for theElectricitySpotMarket.
Improve the Quality, Health & Safety and EnvironmentfunctionwithintheCompany.

OPWP ANNUAL REPORT 2015 | 77 | OPWP ANNUAL REPORT 2015
Pro-active adoption of the group rebranding initiative(theNAMAinitiative).
Advance a procurement process for renewable energyprojectsincooperationwithAER.
Build a sustainable Omani led organisation byimplementing Succession Plans, Personal DevelopmentPlansandGraduateDevelopmentProgram.
General
During2015,StandardandPoor's(S&P)revisedtheiroutlookonOPWPto‘BBB+’from‘A-’.ThiswasduetothesharpdropinoilpriceswhichhasanegativeimpactontheassessmentofOman’sfiscalandexternalpositions.SuchreviewfollowedinlinewiththereviewoftheoutlookforOmannationallyanddoesnotrepresentanyOPWPspecificissue.
IwouldliketoexpressmysinceregratitudetotheMembersof the Board of Directors, Executive Management andCompany employees whose commitment and dedicationhave enabled us to have yet another successful year. I amconfident that their relentless hard work will continue todrivesuccessfortheyear2016.IwouldalsoliketothanktheElectricityHolding Company, Public Authority for Electricityand Water, Authority for Electricity Regulation and otheraffiliated Government agencies and sector companies fortheiron-goingsupport.Iwouldliketoextendmyappreciationtoourgeneratorsandcustomersfortheircontributiontoouraccomplishmentsthisyear.
Finally, on behalf of the Board Members, the ExecutiveManagementandtheCompanyStaff,ItakethisopportunitytoconfirmourutmostallegianceanddevotiontoHisMajestySultan Qaboos Bin Said and His Majesty’s Governmentfor their continuous guidance and relentless support inpursuanceofthedevelopmentandimprovementofboththeElectricity and Water Sectors in the Sultanate.
Hamdan Bin Ali Al Hinai Chairman
8 | OPWP ANNUAL REPORT 2015
1.3 COMPANY PROFILE
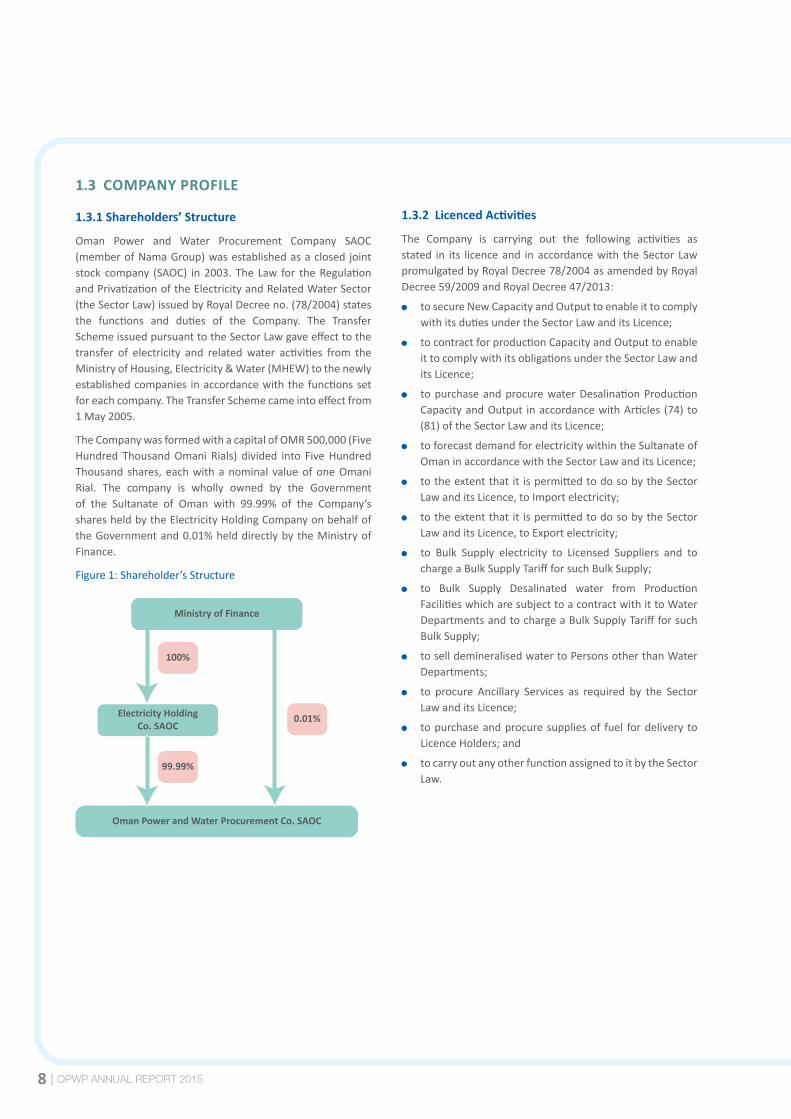
1.3.1 Shareholders’ Structure
Oman Power and Water Procurement Company SAOC(memberofNamaGroup)wasestablishedasaclosed jointstock company (SAOC) in2003.The Law for theRegulationandPrivatizationoftheElectricityandRelatedWaterSector(theSectorLaw)issuedbyRoyalDecreeno.(78/2004)statesthe functions and duties of the Company. The TransferSchemeissuedpursuanttotheSectorLawgaveeffecttothetransfer of electricity and relatedwater activities from theMinistryofHousing,Electricity&Water(MHEW)tothenewlyestablishedcompanies inaccordancewiththefunctionssetforeachcompany.TheTransferSchemecameintoeffectfrom1May2005.
TheCompanywasformedwithacapitalofOMR500,000(FiveHundred ThousandOmani Rials) divided into FiveHundredThousand shares, eachwithanominal valueofoneOmaniRial. The company is wholly owned by the Governmentof the Sultanate of Oman with 99.99% of the Company’ssharesheldbytheElectricityHoldingCompanyonbehalfoftheGovernmentand0.01%helddirectlybytheMinistryofFinance.
Figure1:Shareholder’sStructure
Oman Power and Water Procurement Co. SAOC
Electricity HoldingCo. SAOC
Ministry of Finance
100%
0.01%
99.99%
1.3.2 Licenced Activities
The Company is carrying out the following activities asstated in its licenceand inaccordancewith theSector LawpromulgatedbyRoyalDecree78/2004asamendedbyRoyalDecree59/2009andRoyalDecree47/2013:
tosecureNewCapacityandOutputtoenableittocomplywithitsdutiesundertheSectorLawanditsLicence;
tocontractforproductionCapacityandOutputtoenableittocomplywithitsobligationsundertheSectorLawanditsLicence;
topurchaseandprocurewaterDesalinationProductionCapacityandOutput inaccordancewithArticles (74)to(81)oftheSectorLawanditsLicence;
toforecastdemandforelectricitywithintheSultanateofOmaninaccordancewiththeSectorLawanditsLicence;
totheextentthat it ispermittedtodosobytheSectorLawanditsLicence,toImportelectricity;
totheextentthat it ispermittedtodosobytheSectorLawanditsLicence,toExportelectricity;
to Bulk Supply electricity to Licensed Suppliers and tochargeaBulkSupplyTariffforsuchBulkSupply;
to Bulk Supply Desalinated water from ProductionFacilitieswhicharesubjecttoacontractwithittoWaterDepartmentsandtochargeaBulkSupplyTariffforsuchBulkSupply;
toselldemineralisedwatertoPersonsotherthanWaterDepartments;
to procure Ancillary Services as required by the SectorLawanditsLicence;
topurchaseandprocuresuppliesof fuel fordelivery toLicenceHolders;and
tocarryoutanyotherfunctionassignedtoitbytheSectorLaw.

OPWP ANNUAL REPORT 2015 | 9
1.4 COMPANY’S STRATEGY
1.4.1 Nama Group Business Strategy and Shared Values
The Company Business strategy is aligned with the NamaGroupBusinessStrategy,whichfocusesonfivekeyelementsas illustrated below. Similarly, the Company embraces thesharedvaluesofNamaGroup.
Figure2:NamaGroupBusinessStrategy
HSE CUSTOMER SERVICE
COMMUNICATIONHUMAN
RESOURCES DEVELOPMENT
ASSET MANAGEMENT
Figure3:NamaGroupSharedValues
TEAM WORK
INTEGRITY
RESPECT
QUALITY
CUSTOMER FOCUS
PROFESSIONALISM
GROUP SHAREDVALUES
1.4.2 Vision and Mission Statements
Figure4:Vision&MissionStatements
VISIONTo be a regional leader insustainable procurement
of power and water
MISSIONTo plan and deliver adequate reliable power and water
production capacity at economic cost
Engaged Leadership
Relia
bilit
y
Cost
Effi
cien
t
Sust
aina
bilit
y1.4.3 Strategic Themes and Business Objectives
Reliability: AdequateandreliablePowerCapacity
AdequateandreliableDesalinatedWaterCapacity
DiversityofResources
Cost Efficiency: ReducecostofPower
ReducecostofWater
Sustainability: Curtailgrowthinpowerdemand
DevelopandmaintainpoolofcompetentOmanis
ImproveQuality,HealthandSafety

10 | OPWP ANNUAL REPORT 2015
1.5 ORGANIZATION STRUCTURE & FUNCTIONS
1.5.1 Organization Structure
Figure5:OPWP’sOrganizationStructure
Internal Audit
Senior Advisor
Board of Directors
CEO
COO
Clie
nts’
Con
trac
ts&
Spo
t Mar
ket
Proj
ect D
evel
opm
ent
Proj
ect I
mpl
emen
tatio
n
QHS
E &
Ris
k M
anag
emen
t
Plan
ning
& E
cono
mic
s
HR &
Sup
port
Ser
vice
s
Fina
nce
Regu
lato
ry &
Com
plia
nce
1.5.2 Core Functions Planning & Economics: The Planning and Economics
department is responsible for forecasting demand forelectricity,planningfornewcapacityandoutputtomeetthe generating security planning standard as set out intheOPWPlicence,forecastinggasrequirements,aswellasdeterminingandpublishingtheBulkSupplyTariffsforElectricityandWater.Thedepartmentconductsstrategicstudies toprovideguidance toPAEWandalsoprovidessupport on National Energy Strategy and other policymatters.
Project Development: The Project Developmentdepartment is responsible for developing the projectrequirements of power generation and desalinationcapacity, conducting “fair and transparent” competitionopentolocalandforeigninvestorsforthesupplyofsuchcapacity and ensuring that all relevant contracts are inplace.
Project Implementation: The Project Implementationdepartment is responsible for ensuring that all thecompany’sprojectsaredeliveredontimetomeetCOD.This involvesmanaging the P(W)PAs during their initialphaseofprojectbuildandensuringthatkeymilestonesareachieved.
Clients' Contracts & Spot Market: The CCI departmentmanagesallP(W)PAsandservesasthemaincontactpointforallexistinggenerators.Itisresponsibleformaintainingbusiness relationships with all our key suppliers andclients. Inaddition, ithastheresponsibilityforensuringthat monthly invoices submitted to the company arein accordance with the P(W)PAs and managing Oman-UAE 220 KV Interconnector commercial transactions inaccordancewithPSPA.Thespotmarketsectionwillring-fenceduntil themarket isoperational.Thespotmarketsection will be responsible to implement an electricityspotmarketforMIS.

OPWP ANNUAL REPORT 2015 | 11
1.5.3 Support Functions Finance & Accounting:TheFinancedepartmentoversees
theaccountingandfinancefunctionsofthecompany.Itis responsible for ensuring that the companymaintainsadequate cash-flows to meet its obligations underthe contracts. It is responsible for business planning,price control, budgeting and management reporting.It produces statutory accounts, regulatory accounts tomeetitslegalandlicencerequirements.
Regulatory and Compliance: RegulatoryandCompliancesupportensuresthatthecompanyisfullycompliantwithlicensing conditions and all legal requirements of thebusiness.Inaddition,thedepartmentalsomanagesanylegalmattersrelatedtoP(W)PAsaswellasresolvingthependingdisputesarisingoutoftheP(W)PAsand/orNGSAwiththecounterparties,andotherdisputes.
Human Resources & Support Services: The HRDepartment’s key responsibility is to focus on HR
issues such as recruitment, training & development,Omanizationpolicyandinitiatives,payrollandemployeeperformance. In addition, the department is alsoresponsibleforadministration,documentcontrolandITfunction.
QHSE & Risk Management: ThescopeofQHSEfunctionwill extend to projects under construction and existinggeneratorswith respect toHSE. Thedepartment’s role,in coordination with relevant entities, is to review andupdateHSEpoliciesandprocedures,developHSEauditplan, arrange/conduct audits, identify improvementopportunities and report to the Management. Withrespecttoquality,ensurethattheQualityManagementSystem is effectively implemented in the companycomplying with ISO 9001:2008. The department wouldalso be responsible for managing the Enterprise RiskManagementprocessbyreviewingitonaperiodicbasisandreportingittotheAuditCommittee.
12 | OPWP ANNUAL REPORT 2015
2. BUSINESS REVIEW
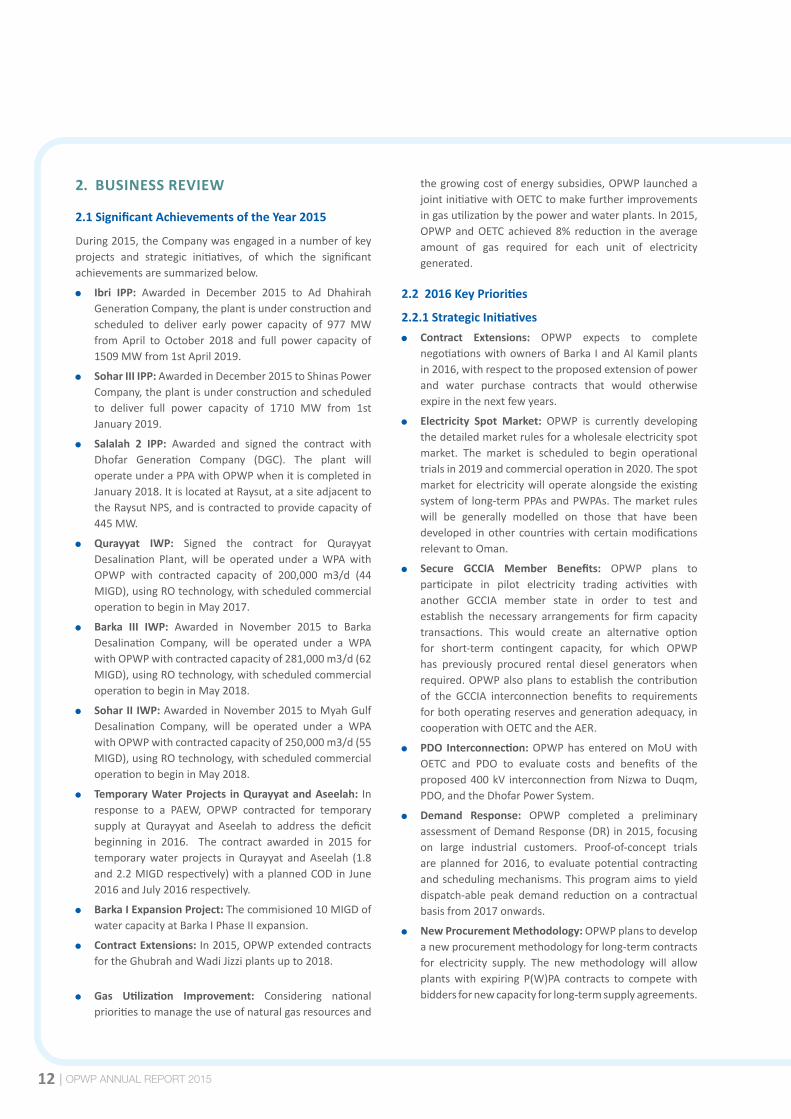
2.1 Significant Achievements of the Year 2015
During2015,theCompanywasengagedinanumberofkeyprojects and strategic initiatives, of which the significantachievementsaresummarizedbelow.
Ibri IPP: Awarded in December 2015 to Ad DhahirahGenerationCompany,theplantisunderconstructionandscheduled to deliver early power capacity of 977 MWfrom April to October 2018 and full power capacity of1509MWfrom1stApril2019.
Sohar III IPP: AwardedinDecember2015toShinasPowerCompany,theplantisunderconstructionandscheduledto deliver full power capacity of 1710 MW from 1stJanuary2019.
Salalah 2 IPP: Awarded and signed the contract withDhofar Generation Company (DGC). The plant willoperateunderaPPAwithOPWPwhenitiscompletedinJanuary2018.ItislocatedatRaysut,atasiteadjacenttotheRaysutNPS,andiscontractedtoprovidecapacityof445MW.
Qurayyat IWP: Signed the contract for QurayyatDesalination Plant, will be operated under aWPAwithOPWP with contracted capacity of 200,000 m3/d (44MIGD),usingROtechnology,withscheduledcommercialoperationtobegininMay2017.
Barka III IWP: Awarded in November 2015 to BarkaDesalination Company, will be operated under a WPAwithOPWPwithcontractedcapacityof281,000m3/d(62MIGD),usingROtechnology,withscheduledcommercialoperationtobegininMay2018.
Sohar II IWP: AwardedinNovember2015toMyahGulfDesalination Company, will be operated under a WPAwithOPWPwithcontractedcapacityof250,000m3/d(55MIGD),usingROtechnology,withscheduledcommercialoperationtobegininMay2018.
Temporary Water Projects in Qurayyat and Aseelah: In response to a PAEW, OPWP contracted for temporarysupply at Qurayyat and Aseelah to address the deficitbeginning in 2016. The contract awarded in 2015 fortemporarywater projects inQurayyat andAseelah (1.8and2.2MIGDrespectively)withaplannedCODinJune2016andJuly2016respectively.
Barka I Expansion Project: Thecommisioned10MIGDofwatercapacityatBarkaIPhaseIIexpansion.
Contract Extensions: In2015,OPWPextendedcontractsfortheGhubrahandWadiJizziplantsupto2018.
Gas Utilization Improvement: Considering nationalprioritiestomanagetheuseofnaturalgasresourcesand
thegrowingcostofenergysubsidies,OPWPlaunchedajointinitiativewithOETCtomakefurtherimprovementsingasutilizationbythepowerandwaterplants.In2015,OPWPandOETC achieved 8% reduction in the averageamount of gas required for each unit of electricitygenerated.
2.2 2016 Key Priorities
2.2.1 Strategic Initiatives Contract Extensions: OPWP expects to complete
negotiationswithownersofBarka IandAlKamilplantsin2016,withrespecttotheproposedextensionofpowerand water purchase contracts that would otherwiseexpireinthenextfewyears.
Electricity Spot Market: OPWP is currently developingthedetailedmarketrulesforawholesaleelectricityspotmarket. The market is scheduled to begin operationaltrialsin2019andcommercialoperationin2020.Thespotmarketforelectricitywilloperatealongsidetheexistingsystemof long-termPPAsandPWPAs.Themarketruleswill be generally modelled on those that have beendeveloped inothercountrieswithcertainmodificationsrelevanttoOman.
Secure GCCIA Member Benefits: OPWP plans toparticipate in pilot electricity trading activities withanother GCCIA member state in order to test andestablish the necessary arrangements for firm capacitytransactions. This would create an alternative optionfor short-term contingent capacity, for which OPWPhas previously procured rental diesel generators whenrequired.OPWPalsoplanstoestablishthecontributionof the GCCIA interconnection benefits to requirementsforbothoperatingreservesandgenerationadequacy,incooperationwithOETCandtheAER.
PDO Interconnection: OPWPhasenteredonMoUwithOETC and PDO to evaluate costs and benefits of theproposed400kV interconnection fromNizwa toDuqm,PDO,andtheDhofarPowerSystem.
Demand Response: OPWP completed a preliminaryassessmentofDemandResponse(DR)in2015,focusingon large industrial customers. Proof-of-concept trialsare planned for 2016, to evaluate potential contractingandschedulingmechanisms.Thisprogramaimstoyielddispatch-able peak demand reduction on a contractualbasisfrom2017onwards.
New Procurement Methodology: OPWPplanstodevelopanewprocurementmethodologyforlong-termcontractsfor electricity supply. The new methodology will allowplantswith expiring P(W)PA contracts to competewithbiddersfornewcapacityforlong-termsupplyagreements.
OPWP ANNUAL REPORT 2015 | 13
2.2.2 Projects under Implementation Thumrait to Harweel PDO Interconnection: InJune2015
OPWP signed a Power Sales and Purchase Agreementwith PDO to facilitate the exchangeof energy betweenthe Dhofar Power System and PDO’s network. Thisexchange ismadepossible viaa132kVconnection thatwasconstructedbetweenthetwosystems.
Al Ghubrah IWP: Al Ghubrah IWP is owned byMuscatCity Desalination Company and is currently underconstruction. The plant has contracted desalinationcapacityof42MIGDusingRO technology. CommercialOperationisexpectedtobeachievedinearly2016.UnderthechangestotheSectorlaw(RD47/2013)thisprojectisthefirsttobeclassifiedasaprojectof“SpecialNature”and will be fully regulated as a licensed entity by theAuthorityofElectricityRegulation(AER).
Barka I Phase II Expansion: AsecondcapacityexpansionprojectisinprogressbyACWAPowerBarka,withatotalcapacityof12.5MIGD,ata siteadjacent to theBarka Iplant.Thefirstphaseoftheprojectprovided7.5MIGDinOctober2015withasecondphaseprovidinganadditional2.5MIGDinNovember2015.Theprojectisexpectedtoachieve full commercial operationof 12.5MIGDduringthefirstquarterof2016.
Sur IWP Expansion: The expansion project at the SurDesalination plant by Sharqiyah Desalination Companyis currently under construction. The project will addcapacityof12.5MIGDtotheexistingcapacityof19MIGD,fordeliveryinSeptember2016.
Qurayyat IWP: Awarded in December 2014 to theQurayyat Desalination Plant, will be operated under aWPA with OPWP with contracted capacity of 200,000m3/d (44MIGD), using RO technology, with scheduledcommercialoperationtobegininMay2017.
Musandam IPP: This project, a 120 MW power plant,is being developed by Oman Oil Company and LG forcommercial operation in December 2016. The PPAbetween OPWP and the developer has been signed inApril2015.
Salalah II IPP: Owned by Dhofar Generation Company(DGC), and currently under construction. The plantwilloperateunderaPPAwithOPWPwhenitiscompletedinJanuary2018.ItislocatedatRaysut,atasiteadjacenttotheRaysutNPS,andiscontractedtoprovidecapacityof445MW.
2.2.3 Projects under Development Salalah IWP: OPWPinitiatedprocurementoftheSalalah
IWP in2015 forcapacityof100,000m3/d,andplannedCODinJanuary2019.ThePlantlocationwillbeadjacenttotheexistingSalalahIWPPnearMirbat.
Sharqiyah IWP: Withcapacityof80,000m3/d(17.6MIGD)atAshkarahusingROtechnology,withCODplannedforQ22020.
2021 IPP: Site evaluation are in progress towardprocurement of an new IPP for the MIS with COD inJanuary2021.TherequestofqualificationisexpectedtobereleasedinQ42016.
Duqm IWP: With capacityof 60,000m3/d (13.2MIGD)usingROtechnology.TheRFQwasreleasedinDecember2015, and the RFP is expected to be issued in 2016,pending final site approval by Special Economic ZoneAuthority of Duqm (SEZAD). The project is expected toreachCODinthefourthquarterof2019.
Khasab IWP: With capacity of 16,000 m3/d (3 MIGD)usingROtechnology,withanticipatedCODinthefourthquarterof2019.Theprocurementprocessisexpectedtobeginin2016,pendingfinalsiteapprovals.
Renewable Energy Projects: OPWPexpectssolarenergyprojects, wind farms, and potentially other renewableenergy(RE)projectstocomplementgas-firedgenerationintheSultanateinthenearfuture.AlthoughOPWPhasno current commitments to RE project developmentin the MIS, a methodoloy is under development withthe AER thatwould allowRE projects to competewithconventionalgenerationprojectsateconomicprices.
14 | OPWP ANNUAL REPORT 2015
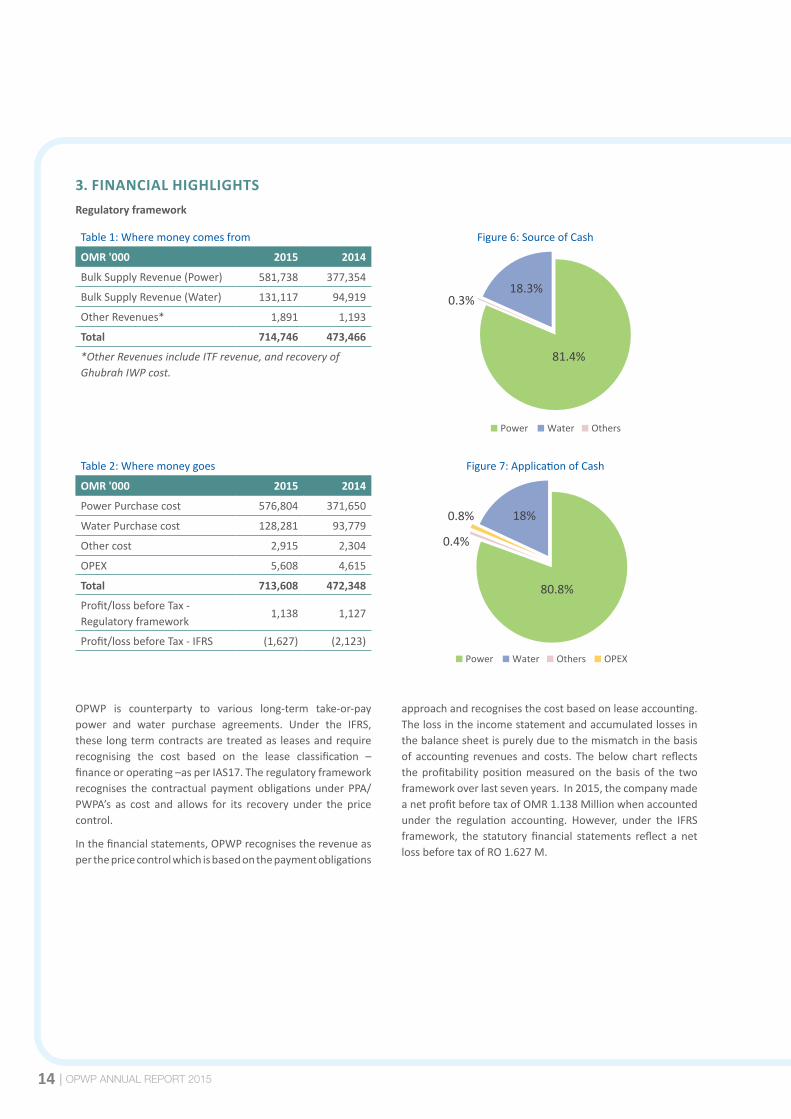
3. FINANCIAL HIGHLIGHTSRegulatory framework
Table1:Wheremoneycomesfrom Figure6:SourceofCash
OMR '000 2015 2014
Power Water Others
81.4%
18.3%0.3%
BulkSupplyRevenue(Power) 581,738 377,354
BulkSupplyRevenue(Water) 131,117 94,919
OtherRevenues* 1,891 1,193
Total 714,746 473,466
*Other Revenues include ITF revenue, and recovery of Ghubrah IWP cost.
Table2:Wheremoneygoes Figure7:ApplicationofCash
OMR '000 2015 2014
Power Water Others OPEX
80.8%
18%0.8%
0.4%
PowerPurchasecost 576,804 371,650
WaterPurchasecost 128,281 93,779
Othercost 2,915 2,304
OPEX 5,608 4,615
Total 713,608 472,348
Profit/lossbeforeTax-Regulatoryframework
1,138 1,127
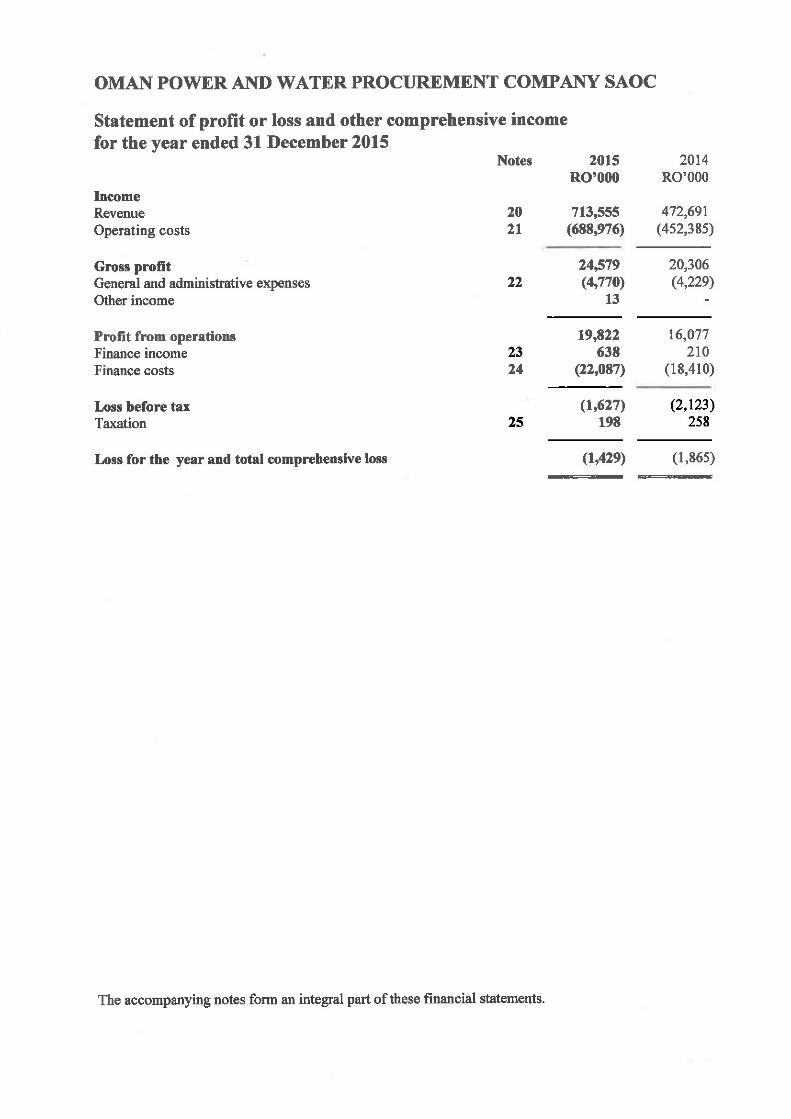
Profit/lossbeforeTax-IFRS (1,627) (2,123)
OPWP is counterparty to various long-term take-or-paypower and water purchase agreements. Under the IFRS,these longtermcontractsaretreatedas leasesandrequirerecognising the cost based on the lease classification –financeoroperating–asperIAS17.Theregulatoryframeworkrecognises the contractual paymentobligationsunder PPA/PWPA’s as cost and allows for its recovery under the pricecontrol.
Inthefinancialstatements,OPWPrecognisestherevenueasperthepricecontrolwhichisbasedonthepaymentobligations
approachandrecognisesthecostbasedonleaseaccounting.Thelossintheincomestatementandaccumulatedlossesinthebalancesheetispurelyduetothemismatchinthebasisof accounting revenues and costs. Thebelow chart reflectstheprofitabilitypositionmeasuredon thebasis of the twoframeworkoverlastsevenyears.In2015,thecompanymadeanetprofitbeforetaxofOMR1.138Millionwhenaccountedunder the regulation accounting. However, under the IFRSframework, the statutory financial statements reflect a netlossbeforetaxofRO1.627M.

OPWP ANNUAL REPORT 2015 | 15
Figure8:ProfitbeforeTax(OMR'000)
2009 2010 2011 2012 2013 2014 2015
As per Refulatory accounts As per IFRS
(3,223)
(559)
1,292 1,049 1,007 7922,000
1,000
0
(1,000)
(2,000)
(3,000)
(4,000)
(5,000)
1,493 1,127
(2,123)
1,138
(1,627)(1,090)
(3,894) (3,995)
Credit ratings
Duetothesharpdropinoilpriceswhichhasanegativeimpacton the assessment ofOman’s fiscal and external positions,StandardandPoor's(S&P)revisedtheiroutlookonOPWPto‘BBB+’from‘A-’.Suchreviewfollowedinlinewiththereviewof theoutlook forOmannationallyanddoesnot representanyOPWPspecificissue.
ThecreditratingsofOPWP,asratedbythetwoleadingratingagenciesin2015,are:
StandardandPoor’sRatingsServices ‘BBB+’
Moody’sInvestorServices -‘A1/Stable’
The credit rating agencies understand the issues regardingtheIAS17treatmentofP(W)PAsintheaccountsofOPWPandconcludethatthesedonothaveanyeffectonthecompany’sability tomeet its obligations. The credit rating reports areavailableonOPWP’swebsite.

16 | OPWP ANNUAL REPORT 2015
4. OPERATIONAL HIGHLIGHTS (AS PER REGULATORY FRAMEWORK)
4.1 MIS – Electricity
Table3:MIS-Electricity
Particular Units 2015 2014 Variance
UnitsPurchased GWh 28,354 24,981 14%
Total Cost OMR'000 492,889 306,659 61%
AverageCostperMWh OMR 17.4 12.3 42%
PowerRevenue(Net) OMR'000 498,374 339,688 47%
PowerRevenueperMWh OMR 17.6 13.6 29%
Higherconsumerdemandhasledto14%increaseinthenumberofunitspurchased.Thisincreaseindemandwasrecordedacrossall thesupplybusinessesMuscat(15%),Mazoon(13%)andMajan(13%).TherevenueofOPWPisregulatedanddeterminedbasedoncostplus formula, the increase in theaveragecostperMWhresulted in increase inpowerrevenueperMWh.Thedoublingofgasprice(fromUS$1.5toUS$3)in2015hassignificantlyincreasedtherevenueandcostofsales.
4.2 Dhofar Power System - Electricity
Table4:DhofarPowerSystem(DPS)-Electricity
Particular Units 2015 2014 Variance
UnitsPurchased GWh 2,941 2,651 11%
Total Cost OMR'000 83,062 64,055 30%
AverageCostperMWh OMR 28.2 24.2 17%
PowerRevenue(Net) OMR'000 52,942 37,665 41%
PowerRevenueperMWh OMR 18.0 14.2 27%
The consumerdemand forDhofar regionwashigherby11%over2014.Doubling gasprices in 2015and increase in energydeliveredhaveresultedinpowerpurchasecostincreaseby30%,increaseinaveragecostperMWhby17%,increaseinannualpowerrevenueby41%,andincreaseinpowerrevenueperMWhby27%.
4.3 Water Purchase
Table5:Water-MIS&DPS
Particular Units 2015 2014 Variance
Waterpurchased 000m3 243,830 207,399 18%
Total Cost OMR'000 128,281 93,779 37%
AverageCostperm3 OMR 0.526 0.452 16%
WaterRevenue(Net) OMR'000 135,101 94,919 42%
WaterRevenueperm3 OMR 0.554 0.457 26%
Higherconsumerdemandledto18%increaseinwaterpurchased.Thekeydriversfortheincreaseinwaterrevenueandwatercostaretheincreaseinwaterdelivered,andincreaseincostatcombinedwaterandpowerplantsduetotheincreaseingaspricefromUS$1.5toUS$3.

OPWP ANNUAL REPORT 2015 | 17
5. OPERATIONAL PERFORMANCE
5.1 Procurement and Bulk Supply Arrangements
OPWPpurchaseselectricityanddesalinatedwaterinaccordancewiththePowerPurchaseAgreements(PPAs),PowerandWaterPurchaseAgreements(PWPAs)andWaterPurchaseAngreements(WPAs)withvariousgeneratorsanddesalinationcompanies.Theseagreementsaregenerallyforaperiodof15years(exceptforIWPwhichisfor20years.)
Table6:LongTermPower&WaterPurchaseAgreements
Plant Type StatusContract
Start Contract
Expiry
Power Capacity
(net MW)
WaterCapacity
(MIGD)
AlGhubrahPowerandDesalinationCo. PWPA Operational 2005 2018 253 31to36.8
RusailPowerCo. PPA Operational 2005 2022 665
WadiAl-JizziPowerCo. PPA Operational 2005 2018 245
UnitedPowerCo.(Manah) PPA Operational 1996 2020 273
AlKamilPowerCo. PPA Operational 2002 2017 281
ACWAPowerBarka(BarkaI) PWPA Operational 2003 2018 435 50
SoharPowerCo. PWPA Operational 2007 2022 585 33
SMNBarkaPowerCo.(BarkaII) PWPA Operational 2009 2024 674 26.4
AlBatinahPowerCo.(SoharII) PPA Operational 2013 2028 744
AlSuwadiPowerCo.(BarkaIII) PPA Operational 2013 2028 741
PhoenixPowerCo.(SurIPP) PPA Operational 2014 2029 2,000
MuscatCityDesalinationPlant(GhubrahIWP) WPA UnderConstruction
2014 2034 42
AlSharqiaDesalination(SurIWP)WPA
Operational2014 2036
18.4
SurIWPexpansion UnderConstruction
10.6
SembcorpSalalahPowerandWaterCo. PWPA Operational 2012 2027 445 15
DhofarGenerationCompany PPA Operational 2014 2034 273
SalalahIIIPP PPA UnderConstruction
2014 2034 445
QurayyatIWP WPA UnderConstruction
2015 2035 44
MusandamIPP PPA UnderConstruction
2015 2030 120

18 | OPWP ANNUAL REPORT 2015
Table7:KeyOperationalParameters-2015
Plant OwnerPower1
(GWh)
Annual Utilisation
Factor (Power) %
Water(MCM)
AnnualUtilisation
Factor (Water) %
Gas Qty(MSCM )
AlGhubrahPowerandDesalinationCo.(GhubrahIWPP)
1,791 93% 42.1 82% 769.2
RusailPowerCo. 3,654 64% 1,198.6
WadiAl-JizziPowerCo. 424 23% 143.6
UnitedPowerCo.(ManahPlant) 1,291 58% 429.2
AlKamilPowerCo. 578 24% 186.1
ACWAPowerBarka(BarkaI+BarkaIext.RO+BarkaIext.II)
3,093 83% 48.3 94% 1,045.9
SoharPowerCo.(SoharI) 3,346 65% 47.9 88% 892.0
SMNBarkaPowerCo.(BarkaII) 1,151 20% 43.1 98% 411.9
AlBatinahPowerCo.(SoharII) 4,142 64% 695.3
AlSuwadiPowerCo.(BarkaIII) 3,834 59% 685.4
PhoenixPowerCo.(SurIPP) 4,390 25% 884.6
AlSharqiaDesalination(SurIWP) 27.5 90% 48.235
SembcorpSalalah(SalalahIIWPP) 1,873 48% 21.8 88% 488.1
DhofarGeneratingCompany 1,066 44% 354.4
MuscatCityDesalinationCompany(GhubrahIWP) 11.6
Others 660 25%
Total 31,293 242.3 8,232.4
1 Theutilizationofplantcapacity isgenerally lowerdueseasonaldemandpatternwhichresults in idlecapacityduringwintermonths.TheDispatchismanagedbyOETCbasedoneconomicmeritorder/efficiencysubjecttotechnicalconstraintssuchastransmissionconstraints,andmustrunplantstomeetwaterdemandandsecurityofthesystem.
Ghubrah Barka I Sohar I Barka II
Sur IWP Salalah I Ghubrah IWP
17%
20%
20%
18%
11%
9%5%
Ghubra Rusail Power Wadi Al-Jizzi Power Manah
Al Kamil Power Barka 1
DPC Others
Sohar I Barka II
Sohar II Barka III Sur IPP Salalah I
12% 1%4%
2%
10%
11%
4%
13%
12%
14%
6%
3% 2%6%
WaterUtilization PowerUtilization
OPWP ANNUAL REPORT 2015 | 19
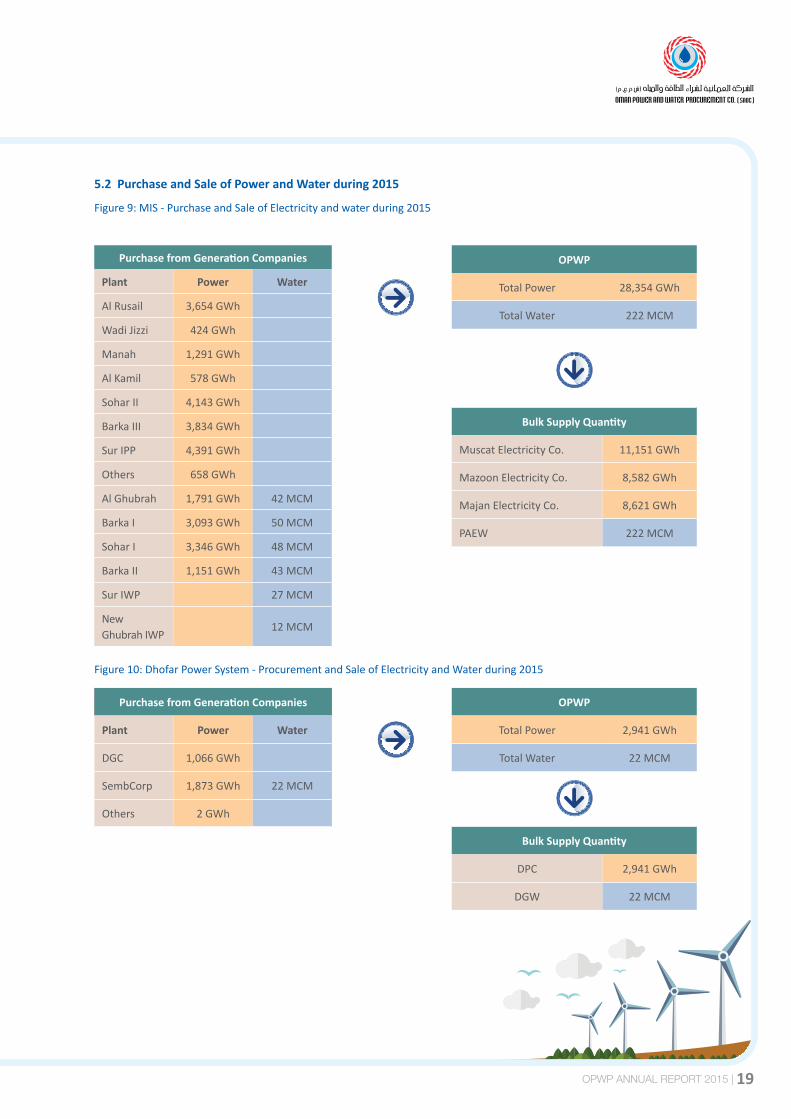
5.2 Purchase and Sale of Power and Water during 2015
Figure9:MIS-PurchaseandSaleofElectricityandwaterduring2015
Figure10:DhofarPowerSystem-ProcurementandSaleofElectricityandWaterduring2015
OPWP
TotalPower 28,354GWh
Total Water 222 MCM
OPWP
TotalPower 2,941GWh
Total Water 22 MCM
Bulk Supply Quantity
Muscat Electricity Co. 11,151GWh
MazoonElectricityCo. 8,582GWh
Majan Electricity Co. 8,621GWh
PAEW 222 MCM
Bulk Supply Quantity
DPC 2,941GWh
DGW 22 MCM
Purchase from Generation Companies
Plant Power Water
DGC 1,066GWh
SembCorp 1,873GWh 22 MCM
Others 2GWh
Purchase from Generation Companies
Plant Power Water
AlRusail 3,654GWh
WadiJizzi 424GWh
Manah 1,291GWh
AlKamil 578GWh
Sohar II 4,143GWh
BarkaIII 3,834GWh
SurIPP 4,391GWh
Others 658GWh
AlGhubrah 1,791GWh 42 MCM
BarkaI 3,093GWh 50MCM
Sohar I 3,346GWh 48MCM
BarkaII 1,151GWh 43 MCM
SurIWP 27MCM
NewGhubrahIWP
12 MCM

20 | OPWP ANNUAL REPORT 2015
5.3 Electricity Demand and Generation Resources (2009-2015)
Figure11:PowerPeakDemandinMISandDPS(2009-2015)
7,000
6,000
5,000
4,000
3,000
2,000
1,000
02009
3,722 3,8334,193
4,670 4,875
MW
2010 2011 2012 2013 2014 2015
MIS DPS
297 341348
389 420
3,425 3,492 3,845 4,281 4,455
5,561439
5,122
6,060
495
5,565
Figure12:ElectricalEnergyDeliveredinMIS(2009-2015)
30,000
25,000
20,000
15,000
10,000
5,000
-
GWh
2009
15,72216,855
18,95021,618 22,702
2010 2011 2012 2013 2014
24,980
2015
28,354
Ghubra Rusail Wadi Jizzi Barka I
Al Kamil Manah Sohar I Barka II
Barka III Sohar II Sur Others
Figure13:ElectricalEnergyDeliveredtoDhofarPowerSystem(2009-2015)
3000
2500
2000
1500
1000
500
02009
1,7341,891 1,912
2,2692,472
2010 2011 2012 2013 2014 2015
2,650
2,942
GWh
DPC/DGC SSPWC Others Total
1688 1819 1752 913 612 941 1066
1873171118601356
13445
7226
ThePeakdemandintheMIShasincreasedfrom3,425MWin2009to5,565MWin2015atanaverageannualgrowthrateofabout8.4%,forMIS(with an increase of 9% in 2015 compared to 2014).DPSalsoincreasedat an average annual growth rate of 8.9% (with anincreaseof13%in2015comparedto2014).
Thefigureshowsanincreaseinelectricalenergyatanaverageannualgrowthrateof10%during2009-2015(with an increase of 14% in 2015 compared to 2014). The key growth drivers include population growth,household formation,generaleconomicdevelopmentandinfrastructureexpansion.
Thefigureshowsanincreaseinelectricalenergyatanaverage annual growth rate of 9% during 2009-2015(with an increase of 11% in 2015 compared to 2014).

OPWP ANNUAL REPORT 2015 | 21
5.4 Fuel Efficiency
TheprimaryfuelresourceforpowergenerationandassociatedwaterproductionintheMISisnaturalgas,suppliedbytheMinistryofOil&Gas.Throughtheintroductionofnewmoreefficientpowerplants,OPWPhassteadilyimprovedsystemefficiencyandtheutilizationofgas.
TotalgasconsumptionintheMISin2015wasabout7.4billionSm³,comparedto7.1billionSm³in2014withanincreaseof4%comparedtothe14%increaseinenergydeliveredduringthisperiod.Overthepastsixyears,whileannualenergydeliveredhasincreasedby10%peryear,fuelefficiencyimprovementhaslimitedgasconsumptionincreasedto6%peryear.
Figure14:YearlyGasConsumption(MIS&DPS)
Mill
ion
S. C
u.M
Ghubrah Barka Wadi JizziBarka II
ManahRusailSur
Barka IIIAl Kamil Sohar
DhofarSohar II
2010 2011 2012 2013 2014 2015
9,0008,0007,0006,0005,0004,0003,0002,0001,000
0
Figure15:GasConsumptionfrom2010-2015
350
300
250
200
343324 321
301291
267
2010 2011 2012 2013 2014 2015
Gas Consumption
MIS Gas Consumption (m3/MWh)
5.5 Year over Year Performance of Power Generation Resources
Figure16:EnergyDemandProfile–2015(MIS)
GWh
Ghubrah Rusail Wadi Jizzi Barka 1
Al Kamil Manah Sohar Barka II
Sur Sohar II OthersBarka III
Jan Feb Mar Apr May June July Aug Sept Oct Nov Dec
3500
3000
2500
2000
1500
1000
500
0
Thefigureaboveshowsthatgasconsumptionsperunitofpowergenerationhasfallenby29%since2009,andby8%from2014to2015.
Theelectricitydemandisseasonalinnatureandpeakrequirement in July is more than twice the energyrequiredinJanuary.

22 | OPWP ANNUAL REPORT 2015
5.6 Power Purchase Cost
Figure17:PowerPurchaseCost-MIS
OM
R in
Mill
ion
Ghubrah Rusail Manah Wadi JizziAl Kamil Sohar I Sohar II Barka I
Barka II Barka III Sur IPP Others Total
2009
177198 216
244290
2010 2011 2012 2013 2014
500450400350300250200150100
500
306
2015
493
Figure18:PowerPurchaseCost-DPS
90.0
80.0
70.0
60.0
50.0
40.0
30.0
20.0
10.0
02009
28.4
44.940.1
52.7
61.8 64.0
2010 2011 2012 2013
OM
R in
Mill
ion
SSPWCDPC/DGC Others Total
2014
83.0
2015
5.7 Electricity Bulk Supply Statistics
Figure19:YearlyElectricityBulkSupplyQuantity-MIS
Twh
Muscat Mazoon Majan Total
30,000
25,000
20,000
15,000
10,000
5,000
02009
3.67
4.77
7.28
4.235.40
6.42 6.75
6.88
9.07
6.35
8.85
5.53
8.02
5.07
7.55
15.72 16.8618.95
21.62 22.70
2010 2011 2012 2013
24.98
2014
7.64
7.62
9.73
28.35
2015
8.62
8.58
11.15
The cost of total energy purchased has increased atan average annual rate of about 12% from 2009 to2014.In2015,thecostofenergypurchasedincreasedby61%duetothedoublingofgasprice(fromUS$1.5 toUS$3).
Thecostoftotalenergypurchasedhasincreasedatanaverageannualrateof19%from2009to2014.In2015,thecostofenergypurchasedincreasedby30%duetothedoublingofgasprice(fromUS$1.5toUS$3).
TheChart showsquantity increase inenergyusedbyMajan, Mazoon and Muscat distribution companiesover 7 years. The bulk supply quantity increased by 10%annually.
https://we.tl/wOpadFLsMG
OPWP ANNUAL REPORT 2015 | 23
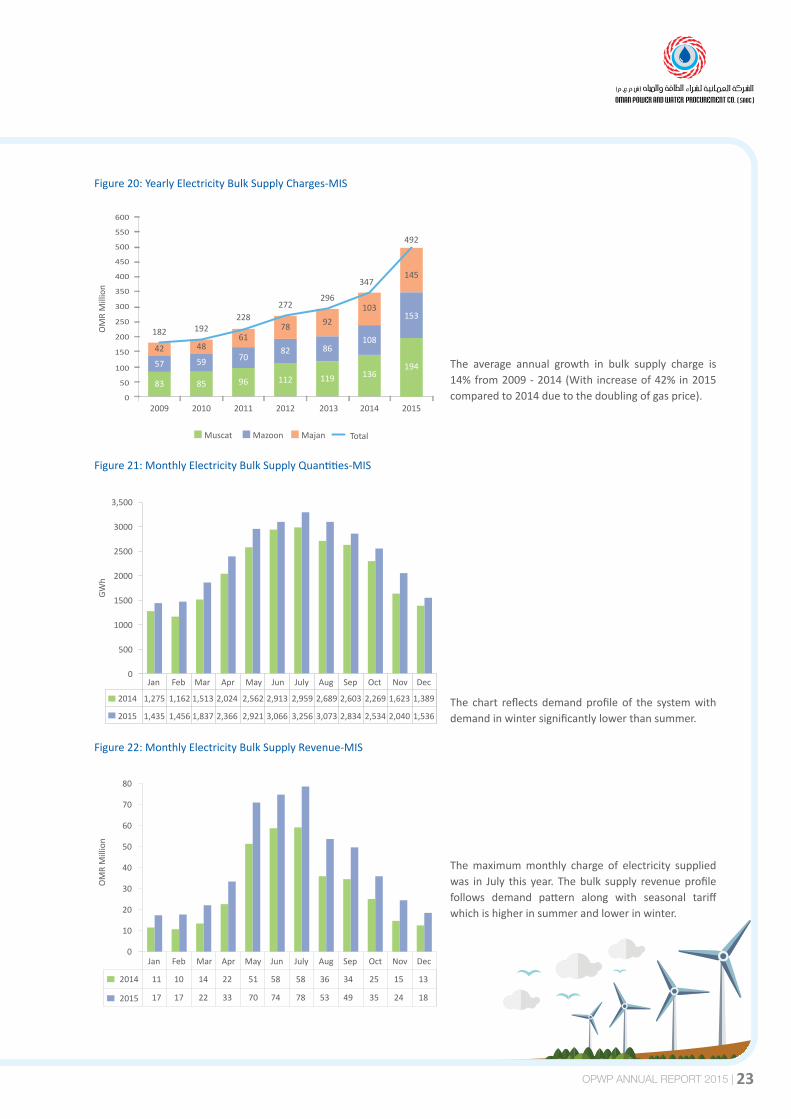
Figure20:YearlyElectricityBulkSupplyCharges-MIS
OM
R M
illio
n
600
550
500
450
400
350
300
250
200
150
100
50
02009 2010 2011 2012 2013 2014
Muscat Mazoon Majan
83 85 96 112 11957 59 70
82 8642 4861
78 92182 192
228272
296
347
136
108
103
Total
2015
492
194
153
145
Figure21:MonthlyElectricityBulkSupplyQuantities-MIS
3,500
3000
2500
2000
1500
1000
500
0Jan Feb Mar Apr May Jun July Aug Sep Oct Nov Dec
2014
2015 1,435 1,456 1,837 2,366 2,921 3,066 3,256 3,073 2,834 2,534 2,040 1,536
1,275 1,162 1,513 2,024 2,562 2,913 2,959 2,689 2,603 2,269 1,623 1,389
GWh
Figure22:MonthlyElectricityBulkSupplyRevenue-MIS
11 10 14 22 51 58 58 36 34 25 15 13
17 17 22 33 70 74 78 53 49 35 24 18
80
70
60
50
40
30
20
10
0
2015
Jan Feb Mar Apr May Jun July Aug Sep Oct Nov Dec
OM
R M
illio
n
2014
The average annual growth in bulk supply charge is14%from2009-2014(With increaseof42%in2015comparedto2014duetothedoublingofgasprice).
The chart reflectsdemandprofileof the systemwithdemandinwintersignificantlylowerthansummer.
Themaximummonthly charge of electricity suppliedwas in July this year. Thebulk supply revenueprofilefollows demand pattern along with seasonal tariffwhichishigherinsummerandlowerinwinter.

24 | OPWP ANNUAL REPORT 2015
Figure23:PlantUtilization-Water
100%
95%
90%
85%
80%
75%
70%
65%
60%
Ghubrah
89%93%
88%
97% 98%
90%
94%
Barka I Barka II Sur IWPSohar I
83%82%
2014 2015
Figure24:PotableWaterPurchased(2009-2015)-MIS&DPS
113129
145174
191207
SSPWCGhubrah IWP Sur IWP Sohar Barka II
Barka 1 Ghubrah Total
2009 2010 2011 2012 2013 2014
244
2014
250
200
150
100
50
0
Mill
ion
Cu.M
The utilization of water capacity at Ghubrah IWPP and Sohar I are marginally lower in 2015 due to plantoutages.
The water delivered to the PAEW has increased onan average annual growth rate of 12% during 2009-2015 (with an increase of 21% in 2015 compared to2014).
OPWP ANNUAL REPORT 2015 | 25
6. HUMAN RESOURCES6.1 Key Human Resources Initiatives in 2015
OPWP has completed various HR initiatives such asimplementing Group Integrated Competency Frameworkmodel for all jobs in senior Grades, and development ofSuccessionplanbyidentifyingaTalentPoolforcriticalroles.
OPWP invests significant resources on training anddevelopment of human resources. In 2015, the Companyinvested about 7% of staff cost on the training anddevelopment.
The company recruited 6 employees during 2015, and thetotalnumberofemployeesat theendof theyear reached63employees.During theyear, thecompanyachieved82%Omanizationlevel.
Nama Group Celebrates 10th Anniversary
NamaGroupmarkedits10thAnniversaryon1May2015withthe startof ahostof commemorativeactivities andeventsacross its eleven subsidiaries in the electricity sector. Thespiritofthecelebrationslinkedtothesuccessachievedinallareasofitsoperations;generation,transmission,distributionandsupplyofelectricityinOman.
7. QUALITY, HEALTH, SAFETY & ENVIRONMENT During 2015 OPWP continued its sustained program toentrenchtheQualityandHSEcultureacrosstheorganizationandplantconstructionsites.ThiswasrewardedbycontinuingacleanLTIfreerecordfor2015.
To provide for continuous internal quality assuranceOPWPobtained the necessary ISO re-certification for QMS 9001.Going forward OPWP will continue to focus its effortsupon enacting the necessary improvement initiatives tocontinuously enhance its HSE performance to meet andwhere possible exceed the level of the expectation of itsdifferentstakeholders.
OPWP will continue to pursue Goal Zero, which involvesdoing no harm to people; safeguarding the environment;assuringcompliancewiththelawsandregulations;deliveringaqualityservice;influencinginternalculturethroughheartsandminds;andendorsingitsroleasaresponsiblepartnerinthesectorthroughfindingmeansofadopting,adaptingandsharinggoodpracticeswithothers.
8. CORPORATE GOVERNANCE REPORT8.1 Corporate Governance
Good governance is fundamental to OPWP being able todeliverwaterandelectricityforOmanthatservestheshort
and long term interests of its shareholders, thenation andtheultimate consumers.OPWP strives to incorporate goodgovernance in its decision making and business practices.It means OPWP is structured to make timely, evidencebased, independent decisions under the auspices of itsregulatory framework. It also serves to ensure that OPWPcan manage risks appropriately, act with transparencyand integrity and engage effectively with its stakeholders.
The role of the Board of OPWP is to approve the strategicdirectionofOPWP,toguideandmonitorthemanagementofOPWPanditsbusinessesinachievingitsstrategicplans,andtooverseegoodgovernancepractice.TheBoardaimstoprotectand enhance the interests of its shareholders, while takinginto account the interests of other stakeholders, includingemployees,customers,counter-parties,suppliers,itsregulatorandthewidercommunity.Inperformingitsrole,theBoardiscommittedtoahighstandardofcorporategovernancepracticeand fostering a culture of compliance which values ethicalbehaviour, personal and corporate integrity, transparency,fairness,accountabilityandrespectforothers.
TheOPWPChiefExecutiveOfficerhas responsibility for theday-to-daymanagementofOPWPanditsbusinesses,andissupportedinthisfunctionbytheOPWPseniormanagementteam.TheBoardmaintainsultimateresponsibilityforstrategyandcontrolofOPWPanditsbusinesses.
Inpursuitofitsaimsinrespecttogoodcorporategovernance,the Board has adopted manuals and policies approvedby Nama Group, which are the Group Board Manual, theGroupOperatingManual,theGroupHRManual,theGroupCompliance Manual, the Group Treasury Policy, the CEORemuneration and Benefits Policy, the Company SecretaryProceduresManual, theSector’sPolicyStatementonFraudDeterrence, the Sector’s Policy Statement on Conflict ofInterest,and theCodeofEthicsandBusinessConduct.TheBoardhas also responded to the change in the jurisdictionof the Tender Board by commissioning, reviewing andadoptingaProcurementProcessMapwhichcomprehensivelyestablishes andgoverns, in conjunctionwith theapplicablelawsofOman,theprocurementprocessfortheCompany.
TheGroupManualsandPoliciesgoverntherelationbetweenEHC and the Subsidiaries, as well as setting forth theproceduresof theBoardclearlysoas toavoidambiguity inthegovernanceoftheCompany.

26 | OPWP ANNUAL REPORT 2015
TheCodeof Ethics andBusinessConduct is aNamaGroupinitiativeintheareaofcorporategovernancewhichappliestoalldirectorsofEHCanditsSubsidiariesandwhichservesto emphasise the Company’s commitment to ethics andcompliancewith the law, set forth standardsofethical andlegalbehaviour,providereportingmechanismsforknownorsuspected ethical or legal violations, and help prevent anddetectwrongdoing.
TheSector’sPolicy StatementonConflictof Interest servesto establish clear guidelines on the identification andmanagementofconflictsofinterest.AtBoardlevela“conflictof interest”occurswhentheprivate interestsofamemberof the Board of Directors interferes in any way with theinterests of EHC or its Subsidiaries. In addition to avoidingconflictsofinterest,memberoftheBoardshouldalsoavoidtheappearanceofaconflictofinterest.
TheSector’sPolicyStatementonFraudDeterrenceintroducedacrosstheNamaGroupservesasthefinalcomponentofthecorporategovernance framework tosafeguard thefinancialviabilityoftheGroupandtransactionswithintheGroup.
Inaddition,theCompanyperiodicallyreportsitscompliancewithallstatutoryobligationstotheBoardandtoitsprimaryshareholder,EHC.
8.2 Internal Audit
The Internal Audit function provides an independent andobjectiveopinionontheadequacyandeffectivenessof theCompany’s systems for risk management, internal control,andgovernancetogetherwithrecommendationstoimprovethose systems. The function operates independently ofmanagement,underamandateapprovedby,andkeptunderreviewby,theAuditCommittee.Ariskbasedapproachisusedto identify, prioritise and focus on internal audit activities.Theannualauditplan ispresentedto theAuditCommitteefor approval. The Audit Committee meets the internalauditorstodiscusstheresultsofthequarterlyinternalaudit.MrSeanO’Hare,anindependentDirectorwithconsiderableexperienceinBoardsupervisoryandenhancementroles,wasthe2015ChairmanoftheBoard’sInternalAuditCommittee.
Table8:BoardandBoardCommittees
Members - 2015 Number of Meetings in 2015
Board of Directors HamdanAlHinai(Chairman)SalehAlRumhi(DeputyChairman)SalehAlHarthy(MOFrepresentative)SeanO’HareS.Vishwanath(EHCrepresentative)
4Meetings
AuditCommittee SeanO’Hare(Chairman)SalehAlRumhiS.Vishwanath
4Meetings
HumanResourceCommittee SalehAlRumhi(Chairman)SalehAlHarthySeanO’Hare
4Meetings
InternalTenderCommittee HamdanAlHinai(Chairman)SalehAlRumhi(DeputyChairman)S.VishwanathAhmedAlJahdhami(CEO)BobWhitelaw(SeniorAdvisor)
11Meetings
8.3 Risk Management
TosecuretheCompany’soperationsandachievekeyobjectives,OPWPhasdevelopedenterpriseriskmanagementframeworktoidentifyandmanagetheriskseffectively.OPWPmanagestherisksassociatedwithitsoperationsbyidentifying;measuringandpreventingkeyuncertainties.Risksareassessedintermsoflikelihoodaswellasfinancialimpact.

OPWP ANNUAL REPORT 2015 | 27
8.4 Board Meetings and Sitting Fees
TheBoardanditscommitteesareresponsibleforestablishingthegeneralpoliciesoftheCompany,supervisingtheexecutionofitsactivities,approvingitsbudgetandtheappointmentofthetopmanagementpositions.ThefollowingtableshowsthenumberofmeetingsheldbytheBoardanditscommitteesandattendanceofmembers:
Table9:Boardmeetingandsittingfees
Board Members
Boar
d M
eetin
g
Inte
rnal
Te
nder
Co
mm
ittee
HR
Com
mitt
ee
Audi
t Co
mm
ittee
Boar
d si
tting
fe
es
Com
mitt
ee
mee
ting
fees
Mr.HamdanBinAliAlHinai Chairman 4(4) 10(11) 2,600 3,400
Eng.SalehBinNasserAl-Rumhi DeputyChairman 4(4) 9(11) 4(4) 3(4) 1,800 4,200
Mr.SalehBinAliAlHarthy BoardMember 4(4) 4(4) 2,000 1,200
Mr.S.Vishwanath BoardMember 4(4) 8(11) 4(4) 2,000 3,600
Mr.SeanO’Hare BoardMember 4(4) 4(4) 4(4) 2,000 2,800
Total 10,400 15,200
()numbersinbracketsrepresentmeetingsheldduringtheyear.ThetotalsittingfeesisOMR25,600

AUDIT REPORT & FINANCIAL STATEMENTS
OPWP ANNUAL REPORT 2015 | 29
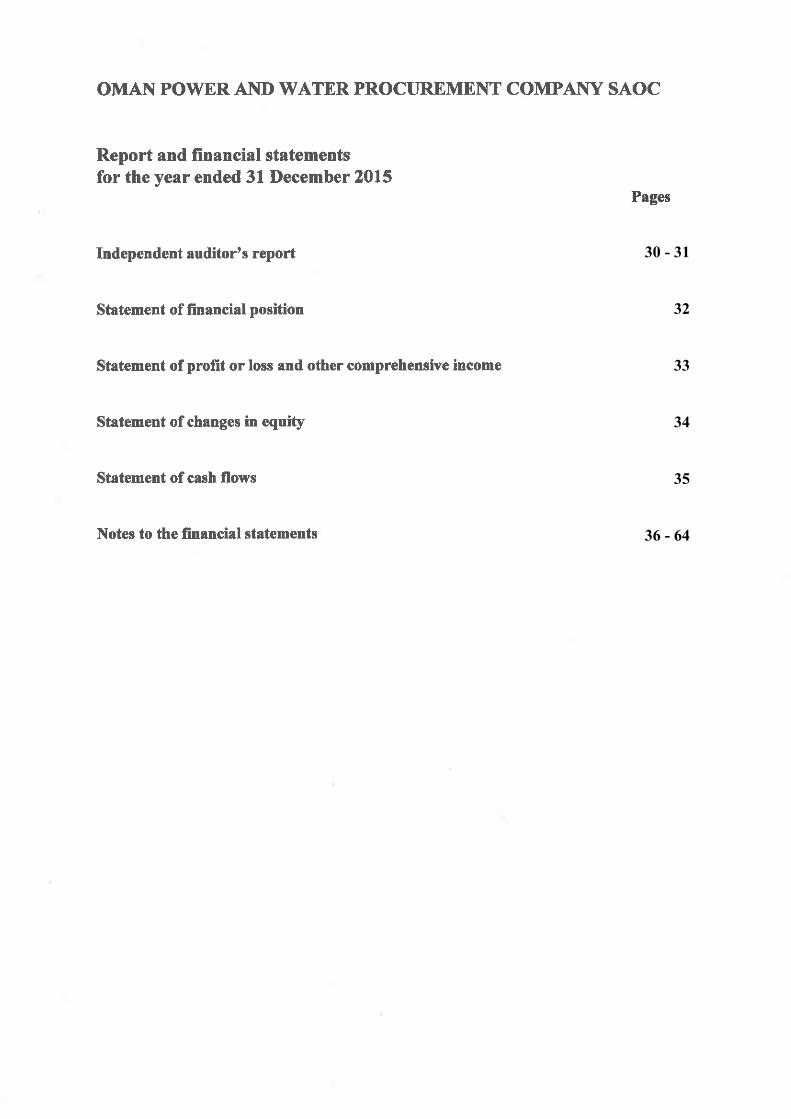
30 - 31
32
33
34
35
36 - 64

36 to 64.
32 | OPWP ANNUAL REPORT 2015
OPWP ANNUAL REPORT 2015 | 33

34 | OPWP ANNUAL REPORT 2015
OPWP ANNUAL REPORT 2015 | 35

36 | OPWP ANNUAL REPORT 2015

OPWP ANNUAL REPORT 2015 | 37

38 | OPWP ANNUAL REPORT 2015

OPWP ANNUAL REPORT 2015 | 39

40 | OPWP ANNUAL REPORT 2015

OPWP ANNUAL REPORT 2015 | 41
42 | OPWP ANNUAL REPORT 2015
OPWP ANNUAL REPORT 2015 | 43
44 | OPWP ANNUAL REPORT 2015

OPWP ANNUAL REPORT 2015 | 45
46 | OPWP ANNUAL REPORT 2015

OPWP ANNUAL REPORT 2015 | 47

48 | OPWP ANNUAL REPORT 2015
OPWP ANNUAL REPORT 2015 | 49
50 | OPWP ANNUAL REPORT 2015
OPWP ANNUAL REPORT 2015 | 51
52 | OPWP ANNUAL REPORT 2015
OPWP ANNUAL REPORT 2015 | 53

54 | OPWP ANNUAL REPORT 2015

OPWP ANNUAL REPORT 2015 | 55

56 | OPWP ANNUAL REPORT 2015
OPWP ANNUAL REPORT 2015 | 57

58 | OPWP ANNUAL REPORT 2015

OPWP ANNUAL REPORT 2015 | 59

60 | OPWP ANNUAL REPORT 2015

OPWP ANNUAL REPORT 2015 | 61
62 | OPWP ANNUAL REPORT 2015
OPWP ANNUAL REPORT 2015 | 63
64 | OPWP ANNUAL REPORT 2015