annual report 2015 - sos international · sos international annual report 2015 preface 2015 was a...
TRANSCRIPT
A N N U A L R E P O R T 2 0 1 5
Nitivej 6, 2000 Frederiksberg, Denmark CVR No. 17 01 37 18

2
SOS INTERNATIONAL ANNUAL REPORT 2015
Preface
2015 was a year with a fast moving and dynamic market within our industry. New market and regulatory demands as well as the technological development within the assistance business have had a significant impact on the year gone by which SOS International leaves behind with a satisfactory result.
The net revenue in 2015 is at the same level as in 2014 even though the activity level has increased. Four overall conditions have impacted the net revenue; 1) a higher activity level of about 7% across product lines, 2) price and claims costs that directly impact net revenue negatively, but improve the company’s competitiveness, 3) our focus on the core business areas means a number of activities have been closed or scaled down and thereby reduced revenue, 4) the full year impact from the acquisition of NAF assistance in Norway in autumn 2014.
The development from 2014 to 2015 with a 7% higher activity level and the radically improved competiveness is very satisfying.
The income from operating activities has been improved from 2014 to 2015 due to different impacts. It has been negatively
impacted by a lower price level, investment of resources to lower claims costs and to keep in touch with increased com pliance and IT development. It has been positively impacted by the focus on the core business, simplification and digitalisation. The profit before tax ends at a satisfying level given the market
conditions and the investments in turning around the company.
Looking back on several strategic achievements, SOS International is succeeding with the SOS Next Generation strategy. Core business is the key word and achievements have only been accomplished due to strategic important specifications, simplifications and continuous focus on compliance.
Provi ding ultimate value to our customers is top of mind, and new digital solutions and sig ni ficant business intelligence program mes have been launched. Increasing competitive
ness is another keyword, and se veral initiatives show how we are a trust ed partner that takes the total cost into account and al ways deliver optimal end-user experiences. Besides stream-lining our foun dation and delivering new innovative solutions, we look towards an interesting future where SOS Interna tional indeed will set the landmarks on a number of new agendas.
I hope you enjoy the report.
Best regards,
Niels Krag Printz
Strong, competitive and ready for the future
3
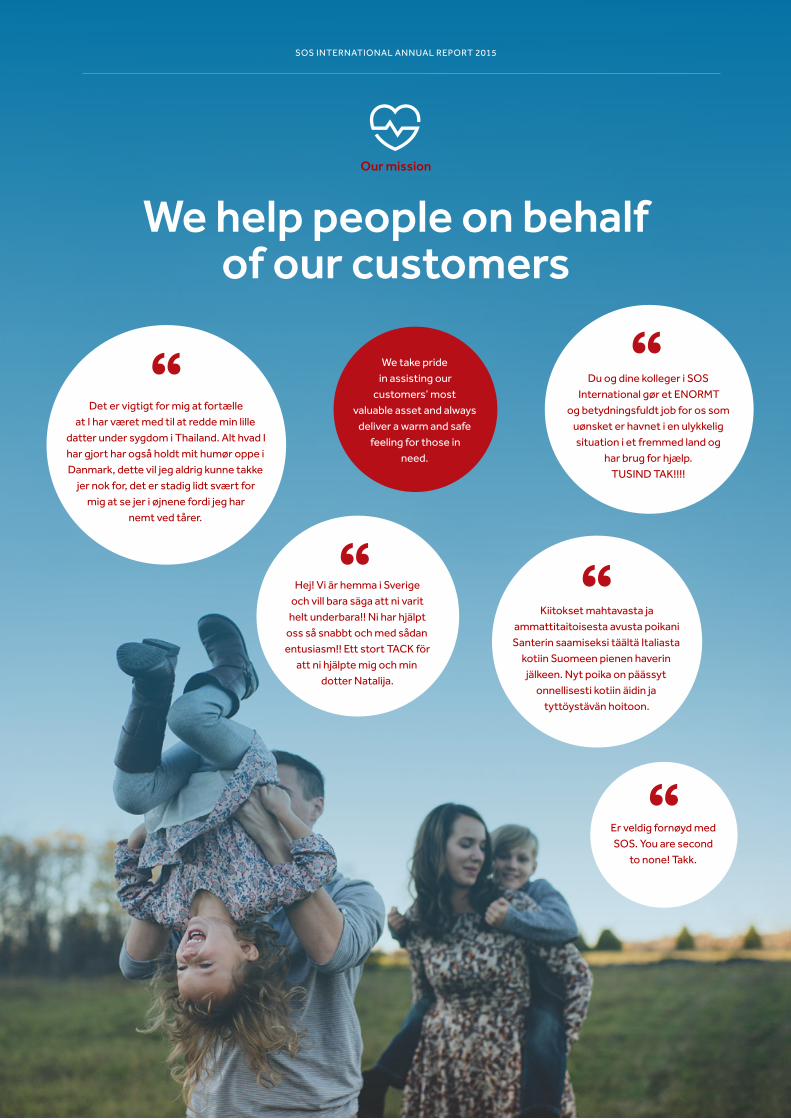
Our mission
We help people on behalf of our customers
Hej! Vi är hemma i Sverige och vill bara säga att ni varit
helt underbara!! Ni har hjälpt oss så snabbt och med sådan entusiasm!! Ett stort TACK för
att ni hjälpte mig och min dotter Natalija.
Er veldig fornøyd med SOS. You are second
to none! Takk.
We take pride in assisting our
customers’ most valuable asset and always
deliver a warm and safe feeling for those in
need.
Du og dine kolleger i SOS International gør et ENORMT
og betydningsfuldt job for os som uønsket er havnet i en ulykkelig situation i et fremmed land og
har brug for hjælp. TUSIND TAK!!!!
Kiitokset mahtavasta ja ammattitaitoisesta avusta poikani Santerin saamiseksi täältä Italiasta
kotiin Suomeen pienen haverin jälkeen. Nyt poika on päässyt
onnellisesti kotiin äidin ja tyttöystävän hoitoon.
Det er vigtigt for mig at fortælle at I har været med til at redde min lille
datter under sygdom i Thailand. Alt hvad I har gjort har også holdt mit humør oppe i Danmark, dette vil jeg aldrig kunne takke
jer nok for, det er stadig lidt svært for mig at se jer i øjnene fordi jeg har
nemt ved tårer.
SOS INTERNATIONAL ANNUAL REPORT 2015
4
SOS INTERNATIONAL ANNUAL REPORT 2015
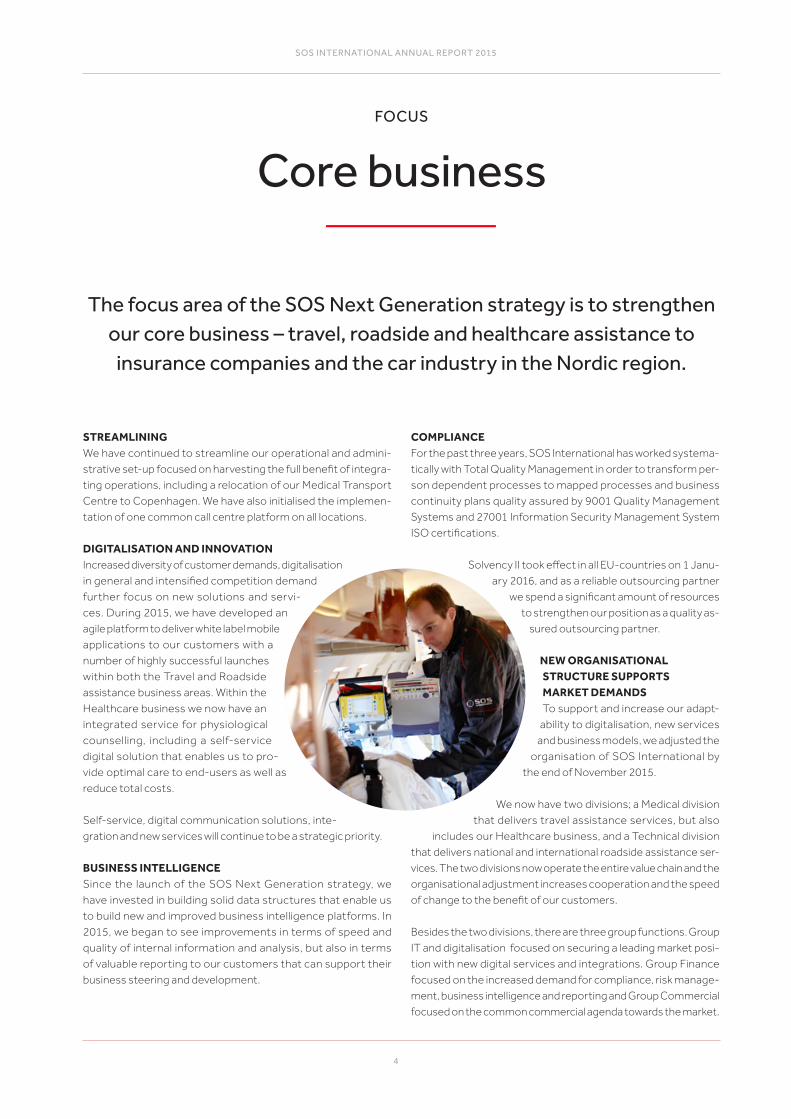
STREAMLININGWe have continued to streamline our operational and administrative set-up focused on harvesting the full benefit of integra-ting operations, including a relocation of our Medical Transport Centre to Copenhagen. We have also initialised the implementation of one common call centre platform on all locations.
DIGITALISATION AND INNOVATIONIncreased diversity of customer demands, digitali sation in general and intensified competition demand further focus on new solutions and services. During 2015, we have developed an agile platform to deliver white label mobile applications to our customers with a number of highly successful launches within both the Travel and Roadside assistance business areas. Within the Healthcare business we now have an integrated service for physiological counselling, including a selfservice digital solution that enables us to provide optimal care to endusers as well as reduce total costs.
Selfservice, digital communication solutions, integration and new services will continue to be a strategic priority.
BUSINESS INTELLIGENCESince the launch of the SOS Next Generation strategy, we have invested in building solid data structures that enable us to build new and improved business intelligence platforms. In 2015, we began to see improvements in terms of speed and quality of internal information and analysis, but also in terms of valuable reporting to our customers that can support their business steering and development.
COMPLIANCE For the past three years, SOS International has worked systematically with Total Quality Management in order to transform person dependent processes to mapped processes and business continuity plans quality assured by 9001 Quality Management Systems and 27001 Information Security Management System ISO certifications.
Solvency II took effect in all EU-countries on 1 January 2016, and as a reliable outsourcing partner
we spend a significant amount of resources to strengthen our position as a quality as
sured outsourcing partner.
NEW ORGANISATIONAL STRUCTURE SUPPORTS MARKET DEMANDSTo support and increase our adapt
ability to digitalisation, new services and business models, we adjusted the
organisation of SOS International by the end of November 2015.
We now have two divisions; a Medical division that delivers travel assistance services, but also
includes our Healthcare business, and a Technical division that delivers national and international roadside assistance ser vi ces. The two divisions now operate the entire value chain and the organisational adjustment increases cooperation and the speed of change to the benefit of our customers.
Besides the two divisions, there are three group functions. Group IT and digitalisation focused on securing a leading market position with new digital services and integrations. Group Finance focused on the increased demand for compliance, risk management, business intelligence and reporting and Group Commercial fo cus ed on the common commercial agenda towards the market.
The focus area of the SOS Next Generation strategy is to strengthen our core business – travel, roadside and healthcare assistance to
insurance companies and the car industry in the Nordic region.
Core businessFOCUS

5
SOS INTERNATIONAL ANNUAL REPORT 2015
YOUR TRUSTED PARTNER As an important part of being a trusted partner we decided to implement a new price model and cost transparency within our travel assistance business. At the beginning of 2015, we adjusted our pricing model radically and have set new standards for transparency in pricing models within the assistance business. A significant transformation within our industry.
OPTIMAL END-USER EXPERIENCES Special attention was paid to the customer journey and how we improve the enduser satisfaction. The majority of our operational setup across SOS International’s business areas is now dedicated to specific customers creating high ownership and proactive behaviour towards the endusers and individual demands from our customers. At the same time a number of selfservice and digital solutions have been implemented to improve efficient case handling and steering of the end-users.
From 2014 to 2015, we have seen a significant improvement of our enduser satisfaction within both Medical and Technical assistance. An analysis performed in 2015 by an external market research company revealed that we now have the highest Net Promoter Score on all Nordic markets for Roadside assistance.
TOTAL COST FOCUSWe have launched a range of new digital selfservice solutions for endusers ensuring the best experiences while at the same time maintaining focus on the total costs.
Digital development enables us to assist end-users in new ways to the benefit of all parties. For example we launched a white label travel app for smartphones that enables a targeted steering of the enduser journey. When using the app, SOS International is the first point of contact when assistance is needed. This secures a high level of quality and reduces claims costs.
Improved competiveness
SOS International secures the value chain on behalf of
our customers as a trusted partner
to provide the optimal end-user experience taking the total cost
into account
Strategic goals were set with the launch of the SOS Next Generation strategy to strengthen our competitiveness
and improve value to our customers. During 2015, a number of initiatives have strengthened our value proposition.
FOCUS

6
SOS INTERNATIONAL ANNUAL REPORT 2015
IN 2016, we will continue to strengthen our competitive ness and continue to make longterm investments in
both our Medical and Roadside business areas. A significant part of this will focus on redefining and developing the future assistance services and business models. A critical prerequisite for this will be our business intelligence development. A comprehensive and intelligent business intelligence setup is crucial in order to be at the forefront of the market and industry development.
Moreover, a continuous investment in our employees is a prerequisite for success within all business areas. Job satisfaction is a strategically important focus area, because we create value for our customers through the end-user experiences delivered by our staff.
Over the next 3-7 years, we expect that the industry will see significantly different models of providing assistance services on the basis of digital innovation. SOS International aims to be in the forefront of this development and set new standards for assistance services on the basis of our experience and leading market position. Customers and endusers will demand a cohe rent journey when in need of assistance and SOS International will be the gathering point for the perfect balance between digital solutions and personal touch.
We are starting to see the technological development of connected cars as well as ecall and bcall materialise in market
activities and in demands from our customers. As a consequence, we are investing in these areas to ensure a sustainable business
model and to maintain our position as an innovative partner.
Investment in the future
Below 50 points
Very low satisfaction and motivation
50 - 59 points
Low satisfaction and motivation
60 - 69 points
Medium satisfaction and motivation
70 - 79 points
High satisfaction and motivation
80 - 100 points
Very high satisfaction and motivation
Target 201770+ points
Result 201567 points
Employee engagement survey
► ► ► ►
FOCUS
7
SOS INTERNATIONAL ANNUAL REPORT 2015
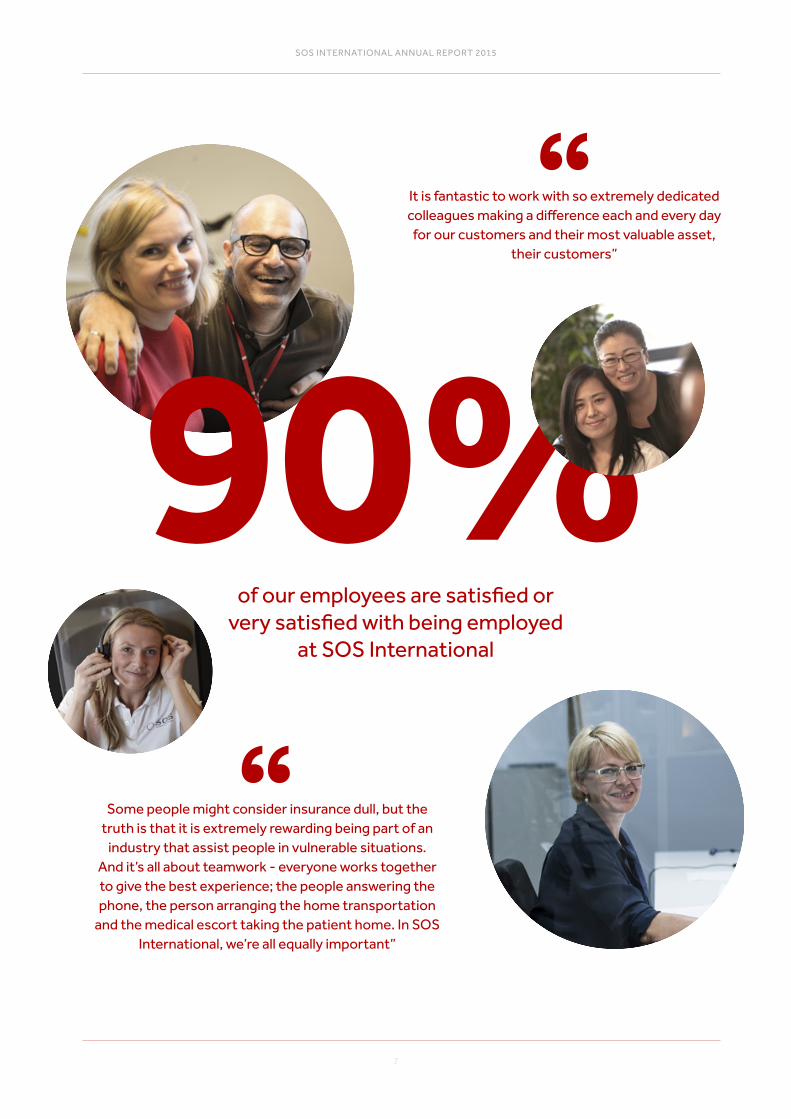
It is fantastic to work with so extremely dedicated colleagues making a difference each and every day
for our customers and their most valuable asset, their customers”
Some people might consider insurance dull, but the truth is that it is extremely rewarding being part of an
industry that assist people in vulnerable situations. And it’s all about teamwork everyone works together to give the best experience; the people answering the phone, the person arranging the home transportation
and the medical escort taking the patient home. In SOS International, we’re all equally important”
90%of our employees are satisfied or
very satisfied with being employed at SOS International
7

8
ACCOUNTING2015
C O N T E N T S
MANAGEMENT'S REVIEW
Consolidated key f igures and f inancial ratios . . . . . . 9Financial review . . . . . . . . . . . . . . . . . . . . . . . . . . . . . . . . 10Expectations for 2016 . . . . . . . . . . . . . . . . . . . . . . . . . . 12Special risks . . . . . . . . . . . . . . . . . . . . . . . . . . . . . . . . . . . 13Social responsibility . . . . . . . . . . . . . . . . . . . . . . . . . . . . 14Company information . . . . . . . . . . . . . . . . . . . . . . . . . . 15Group overview . . . . . . . . . . . . . . . . . . . . . . . . . . . . . . . . 16
MANAGEMENT'S STATEMENT
INDEPENDENT AUDITOR'S REPORT
CONSOLIDATED AND ANNUAL FINANCIAL STATEMENTS 2015
Accounting policies . . . . . . . . . . . . . . . . . . . . . . . . . . . . . 19Statement of income . . . . . . . . . . . . . . . . . . . . . . . . . . . 25Statement of f inancial position . . . . . . . . . . . . . . . . . . 26Statement of changes in equity . . . . . . . . . . . . . . . . . . 28Statement of cash f lows . . . . . . . . . . . . . . . . . . . . . . . . 29Notes . . . . . . . . . . . . . . . . . . . . . . . . . . . . . . . . . . . . . . . . . . 30
9
17
18
19
SOS INTERNATIONAL ANNUAL REPORT 2015

9
SOS INTERNATIONAL ANNUAL REPORT 2015
Consolidated key figuresand financial ratios
DKK’000
KEY FIGURESNet revenueAssistance costsIncome from operating activities (EBIT)Income from net financials
PROFIT BEFORE TAX
Tax on income for the yearProfit for the year
Balance sheet total
EQUITY
Cash flows from operating activitiesCash flows from investment activitiesof which invested in property, plant and equipmentCash flows from financing activities
CASH FLOWS, TOTAL
FINANCIAL RATIOSEBITDA marginNet operating income marginEBT marginProfit marginReturn on capital employedLiquidity ratioSolvency ratioReturn on equity
AVERAGE NUMBER OF FULL-TIME EMPLOYEES
Key ratios have been prepared in accordance with “Recommendations and Financial Ratios 2015” issued by the Danish Society of Financial Analysts.
2015 2014 2013 2012 2011
2,864,136 2,893,001 2,820,747 2,132,168 1,849,848 1,978,719 2,020,933 1,987,875 1,528,404 1,331,833 24,738 8,597 50,670 69,376 51,854 1,871 2,671 13,648 1,694 212 26,088 11,276 37,029 67,687 52,073
6,523 11,017 11,811 18,750 14,434 19,565 259 25,218 48,937 37,639 785,589 943,304 863,814 805,476 479,577 230,104 212,366 221,722 200,170 131,969 107,260 112,681 46,417 89,970 9,428 16,573 74,496 48,025 168,851 18,003 16,642 18,554 19,838 31,170 10,947 113,466 59,168 7,875 93,306 37,514 22,779 97,353 6,267 14,425 46,089 2.6 2.9 4.1 4.5 3.6 8.4 9.8 13.7 15.8 14.3 0.9 0.4 1.3 3.2 2.9 2.9 1.3 4.4 11.2 11.5 4.0 1.1 6.5 10.8 8.5 114.9 106.7 114.4 98.0 138.5 29.3 22.5 25.7 24.9 27.5 8.8 0,1 12.0 29.5 28.8 999 977 789 650 568
MANAGEMENT'S REVIEW

10
SOS INTERNATIONAL ANNUAL REPORT 2015
MANAGEMENT'S REVIEW
Financial review
MAIN ACTIVITIESSOS International A/S is the leading assistance organisation in the Nordic region. From our alarm centres in Denmark, Sweden, Norway and Finland we provide acute personal assistance all over the world.
SOS International offers a wide range of solutions – before, during and after a journey. Our product portfolio includes customisable white label solutions in fields such as worldwide travel and roadside assistance and healthcare solutions.
INCOME STATEMENTThe total profit before tax for the group amounted to DKK 26.1 million for 2015 as opposed to DKK 11.3 million in 2014. The profit is higher than anticipated in the annual report for 2014, where SOS International anticipated the profit to remain on the same level as in 2014.
The expectations in the annual report for 2014 for an unchanged level of the net turnover in 2015 have been fulfilled.
NET REVENUEThe group's net turnover constituted DKK 2,864 million in 2015 as opposed to DKK 2,893 million in 2014, corresponding to a decrease of DKK 0.3 million or 1%.
The activity in 2015 has been on a slightly higher level than in 2014, but because of a general drop in prices, the net turn over ends up at close to an unchanged level in relation to 2014.
ASSISTANCE COSTSAssistance costs are on a lower level than in 2014. Assistance costs amounted to DKK 1,979 million in 2015 as opposed to DKK 2,021 million in 2014.
OTHER OPERATING INCOMEOther operating income is on a higher level and amounted to DKK 18.1 million in 2015 as opposed to DKK 2.1 million in 2014.
EXTERNAL COSTSThe external expenses amounted to DKK 203 million in 2015 as opposed to DKK 188 million in 2014. The costs in 2014 are negatively impacted by nonrecurring costs of DKK 19 million.
STAFF COSTSThe total employee expenses amounted to DKK 627 million in 2015 as opposed to DKK 601 million in 2014, just as the average number of employees increased from 977 to 999.
The increase was partly due to the purchase of the newly founded company SOS International Veihjelp AS in September 2014 which has full effect in 2015. In November 2015, the num-ber of employees was reduced by approximately 30.
DEPRECIATION AND AMORTISATIONThe total depreciation and amortisation for the year amounted to DKK 50 million in 2015 as opposed to DKK 77 million in 2014. The total depreciation and amortisation in 2014 included DKK 24 million in impairment losses.
On the immaterial fixed assets, the total depreciation and amortisation amounted to DKK 29 million in 2015. For material fixed assets the total depreciation and amortisation amounted to DKK 21 million in 2015.
FINANCIAL INCOME AND COSTSThe total financial income and expenses constituted a net income of DKK 2 million in 2015 against a net income of DKK 3 million in 2014.
Exchange rate fluctuations are within the natural risk in connection with the business lines.
TAX ON THE YEAR'S RESULTSThe tax calculated for the group amounted to DKK 7 million for 2015 as opposed to DKK 11 million in 2014.

11
SOS INTERNATIONAL ANNUAL REPORT 2015
MANAGEMENT'S REVIEW
Financial review
BALANCE SHEET
INTANGIBLE ASSETS The carrying amount of intangible fixed assets constituted DKK 226 million at the end of 2015 as opposed to DKK 258 million at the end of 2014. The change can primarily be attributed to depreciation and amortisation of DKK 29 million, while disposals and exchange rate regulation affected the total value in a downward direction by DKK 3 million.
PROPERTY, PLANT AND EQUIPMENTThe total carrying amount of tangible fixed assets constituted DKK 28 million at the end of 2015 as opposed to DKK 32 million at the end of 2014. The change can primarily be attributed to comprise of new assets of DKK 17 million and depreciation and amortisation of DKK 21 million.
RECEIVABLESThe carrying amount of receivables constituted DKK 395 million at the end of 2015 as opposed to DKK 494 million at the end of 2014 as part of the ordinary business activity.
The change can primarily be attributed to a decrease in work in progress.
EQUITYEquity amounted to DKK 230 million at the end of 2015 compared with DKK 212 million at the end of 2014. The annual profit after tax amounted to DKK 20 million in 2015, while exchange rate adjustment of subsidiaries contributed negatively with DKK 2 million.
LIABILITIESThe total carrying amount of liabilities is reduced by DKK 174 million from ultimo 2014 to ultimo 2015. The change can primarily be attributed to a decrease in the debt to credit institutions because of a positive cash flow.
LONG-TERM LIABILITIESThe carrying amount of longterm debt commitments constituted DKK 58 million at the end of 2015 as opposed to DKK 82 million at the end of 2014.
The longterm debt to credit institutions is reduced by DKK 24 million in 2015.
SHORT-TERM LIABILITIESThe carrying amount of shortterm debt commitments constituted DKK 462 million at the end of 2015 as opposed to DKK 612 million at the end of 2014. The change can primarily be attributed to debt to credit institutions, which has decreased by DKK 89 million in 2015 and a decrease in other shortterm liabilities by DKK 57 million.
DIVIDENDThe Board of Directors’ recommendation to the company’s general meeting is to transfer the year’s profit to equity.
CASH FLOW STATEMENTCash flows from operating activities amounted to DKK 107 million, which is a decrease compared to 2014 where cash flow from operating activities amounted to DKK 113 million. The cash flow from operating activities is primarily used to repay debt to credit institutions.
The cash flow from investment activities amounted to DKK 17 million in 2015 as opposed to DKK 74 million in 2014. In 2014, the post is burdened by the purchase of SOS International Veihjelp AS.
The cash flow from financing activities amounted to DKK 113 million in 2015 as opposed to a drawn of DKK 59 million in 2014.
At the end of 2015, the group's liquidity preparedness amounted to DKK 134 million, which is a decrease compared to the end of 2014, where the liquidity amounted to DKK 157 million.
EVENTS AFTER THE BALANCE SHEET DATEAfter the balance sheet date Trygghetssentralen in Norway has been sold. Trygghetssentralen was a part of SOS International AS in Norway. The sale is expected to be final in the beginning of the second quarter of 2016 and is expected to have a positive effect on profit before tax in 2016.
12
SOS INTERNATIONAL ANNUAL REPORT 2015
MANAGEMENT'S REVIEW
Expectations for 2016
In 2016, SOS International will continue its significant investments to further strengthen the competitiveness of the company.
Focus will be on reducing total costs for customers through continued focused actions. Further improvement of the overall enduser satisfaction will continue to be an important strategic goal. Investments in digital and selfservice solutions for endusers, better technological platforms in all alarm centres to support a smoother and more efficient case handling and continuous training and education of the employees are among the initiatives that will strengthen the competitiveness of SOS International going forward.
In 2016, SOS International expects continued pressure on fees and non-core business will be either scaled down or sold off. Given this the turnover in 2016 is expected to be at a lower level compared to 2015.
The profit before tax is expected to be at the same level as in 2015 despite the negative effect of the general price pressure, a high level of investment in new IT systems and more comprehensive compliance demands.
To this date, no event has occurred in 2016 that will change this view.

13
SOS INTERNATIONAL ANNUAL REPORT 2015
MANAGEMENT'S REVIEW
Special risks
RISK MANAGEMENT SOS International continually works with risk management and the overall risk management approach is embedded in the entire organisation including top management. Risks are escalated to Group Management via the Compliance Board which monitors compliance with legal and contractual requirements. A dedicated Information Security Board focuses on IT risks and incidents. Risks are presented to the Board of Directors twice a year and the Audit Committee monitors risks in SOS International on a regular basis.
As a trusted partner, SOS International is mindful of the Solvency II regime when managing risk since our customers are subject to these requirements. Risk management is performed in SOS International’s total quality management system in which risks are identified, addressed and mitigated as appropriate. SOS International has achieved the ISO 9001:2008 and the ISO 27001:2013 certifications regarding quality management and information security in which risk assessment pose an integral part.
FINANCIAL RISKSSOS International is exposed to financial risks which can be divided into the following three main groups: Currency, credit and liquidity risks.
CURRENCY RISKCurrency risk is the risk of suffering a loss caused by change in exchange rates of foreign currencies against the functional currency. SOS International has adopted a finance policy which lays down the framework for identifying, hedging and reporting this risk. The policy contains the basic principle that SOS International does not wish to speculate in foreign currencies. The policy is approved by Group Management and the Board of Directors annually. A significant part of the paid assistance costs are in foreign currencies whereas the reinvoicing in most cases is done in Danish Kroner. SOS International is primarily exposed to foreign exchange risks from EUR, NOK, SEK and USD. Currency risks are typically managed by matching the timing of the income and costs in each foreign currency.
CREDIT RISKCredit risk is the risk of incurring a loss in case SOS International’s customers or other collaboration partners cannot meet their obligations. The credit risk in SOS International is evaluated to be low since some of the major debtors and major customers
make prepayments and since most costumers have a very high credit rating. Accordingly, credit risks are significantly mitigated.
LIQUIDITY RISKLiquidity risk is the risk of not being able to meet present or future financial obligations on time. To ensure the financial resources necessary to perform its tasks, the finance policy establishes continuous monitoring of the cash flow in the orga-nisation and a minimum disposable liquidity is determined.
OPERATIONAL RISKS Operational risks typically stem from inadequate or failed internal processes, from personnel or systems or from external events. SOS International is always on 365 days a year and this requires focus on the operational aspects of the company. Operational risks include nonconformances with procedures and IT disruption. By continually documenting, reviewing and improving corporate policies, processes and instructions, operational risks relating to procedures are mitigated. Business continuity plans for telephone and IT systems limit the operational risk by ensuring responsiveness and quality in case of business disruption. Findings from quality management are documented and communicated to raise awareness about operational risks and ensure ongoing learning across the organisation.
COMPLIANCECompliance with legal and contractual requirements as well as national standards and conventions is embedded in the business model of SOS International. SOS International is very attentive to the rules concerning the protection of personal data and protection of confidential information. SOS International has issued numerous corporate policies on the matter including the Company Code of Conduct, the Information Security Code of Conduct and the Personal Data Policy to mitigate the risk of noncompliance.
OTHER RISKSOther risks include geographical and technological development risks. Within recent years, SOS International has increased the business areas especially within Roadside assistance thus mitigating the geographical risk. The technological development within communications, medical and healthcare solutions and roadside assistance requires SOS International to be able to advance still more rapidly. The quality management system enables SOS International to swiftly identify, commence and implement changes caused by such development.

14
SOS INTERNATIONAL ANNUAL REPORT 2015
MANAGEMENT'S REVIEW
Corporate Social Responsibility
CORPORATE SOCIAL RESPONSIBILITY (CSR)
SOS International actively works with CSR which creates a positive effect for our customers, employees and other stakeholders. We strive to achieve good results within our main CSR focus areas – environment, human rights and anticorruption.
Read more about our CSR initiatives and results for 2015 on our webpage cf. §99a of the Danish Financial Statements Act: https://www.sos.eu/en/aboutsos/aboutsosinternational/Compliance/corporatesocialresponsibility/
SHARE OF THE UNDER-REPRESENTED GENDERSOS International has employees with many different nationalities and competencies, just as there is a large age related spread.We work continuously to create an attractive workplace with equal conditions for all and with space for differences.
SOS International has an equal opportunity policy. The purpose of this is to establish goals for an equal gender representation in the senior management at SOS International.
The goal is that each gender is represented by a minimum of 40% in the Board of Directors and in the Group's top ma-nagement. The Board of Directors is comprised of eight people elected by the General meeting. Of these eight members are six men and two are women, corresponding to 75% and 25% respectively.
SOS International wishes to achieve its goal of a 40 % representation of each gender in the Board of Directors by the end of 2019. The goal was not reached in 2015 since most of the different owners of SOS International represented in the Board of Directors reelected their current representatives.
Group Management is comprised of six people. Of these three are men and two are women, corresponding to 60% and 40% respectively. One position is vacant.
On the next management level it is also the goal that each gender is represented by a minimum of 40%. The percentage of men and women is 43% and 57% respectively at this management level.
SOS International seeks to attract, develop and retain competent employees of both genders. This will contribute to the Group being an attractive career choice for both men and women.
SOS International wants to build up a solid pool of talent of both genders across countries and competencies, which among others will be ensured through interesting and developing career opportunities, just as the equal opportunity policy will be drawn into management appointments and recruitment in the future.
SOS International qualifies, coaches and trains employees on an equal basis independent of their gender. It is expected that this, in the long term, will mean a more even distribution of gender.
EMPLOYEE WELFAREAt SOS International, employee job satisfaction and engagement is a strategically important area of focus as the group wants to be an attractive workplace. We create value for our customers by providing good end-user experiences and satisfied and motivated employees are a precondition for this.
Annual surveys provide the corporate management with im portant information on management, working conditions and cooperation at SOS International. The most recent survey showed that SOS International, among other things, is an organisation of very dedicated employees.
There is always room for improvement and the group places great emphasis on the fact that all managers are continuously working on matters that are relevant for the employee job satisfaction. Work is especially being done to make the employees understand the strategy and feel part of it, to have high confidence in each other and to have a strong common corporate identity.
READ MORE ABOUT CORPORATE SOCIAL RESPONSIBILITY (CSR)

15
SOS INTERNATIONAL ANNUAL REPORT 2015
MANAGEMENT'S REVIEW
Company information
SOS International A/S — Nitivej 6 — DK2000 Frederiksberg
THE BOARD OF DIRECTORS
Amund Skarholt (Chairman)Stig EllkierPedersen (Vice Chairman)
Sigurd Ivar AustinJesper Mørch Sørensen
Ann SommerDag Rehme
Annkristine Vuopio Mogestedt Timo Olavi Ahvonen
Henrik GunolfRikard Livman (Employee representative)
Rune Sixtus Glæser (Employee representative)Alexander Barren (Employee representative)
Markku Reinikainen (Employee representative)
THE EXECUTIVE BOARD
Niels Krag Printz
AUDIT
Ernst & Young – Godkendt RevisionspartnerselskabOsvald Helmuths Vej 4
P.O. Box 250DK2000 Frederiksberg
+45 70 10 50 50 +45 70 10 50 56 [email protected]
17 01 37 1803 May 1961Frederiksberg
1 January 31 December
Telephone: Telefax:
Website: E-mail:
CVR No.Founded:
Municipality of domicile:
Financial year:

16
SOS INTERNATIONAL ANNUAL REPORT 2015
MANAGEMENT'S REVIEW
Group overview
SOS International A/S (Denmark)
SOS
International
AB (Sweden)
100 %
SOS
International
AS (Norway)
100 %
SOS
International
OY (Finland)
100 %
SOS
Dansk
Autohjælp
A/S
(Denmark)
100 %
SOS
International
Veihjelp AS
(Norway)
66 %
SOS
International
Asia Ltd.
(Hong Kong)
100 %
SOS
International Ltd.
(Hong Kong)
100 %
An Yuan Health
Information
Consulting
(Shanghai) Co. Ltd.
(China) 100 %
Kang Rei An Yuan
Ltd. (Singapore)
40 %
Kang Rei
An Yuan
Travel Assistance
Beijing Ltd.
Co. (China)
100 %
Astrum
Assistance
Alliance AG
(Switzerland)
25 %

Amund Skarholt Stig EllkierPedersen Sigurd Ivar AustinChairman Vice Chairman
Jesper Mørch Sørensen Ann Sommer Dag Rehme
Annkristine Vuopio Mogestedt Timo Olavi Ahvonen Henrik Gunolf
Markku Reinikainen Rikard Livman Rune Sixtus Glæser
Alexander Barren
THE BOARD OF DIRECTORS
The Board of Directors and the Executive Board have today discussed and approved the annual report of SOS International A/S for the financial year 1 January - 31 December 2015.
The annual report has been prepared in accordance with the Danish Financial Statements Act.
It is our opinion that the consolidated financial statements and the parent company financial statements give a true and fair view of the Group's and the Company's financial position at 31 December 2015 and of the results of the Group's and the
Company's operations and consolidated cash flows for the financial year 1 January - 31 December 2015.
Further, in our opinion, the Management's review gives a fair report assessment of the development in the Group's and the Company's operations and financial matters and the results of the Group's and the Company's operations and financial position.
The Annual Report will be submitted for approval at the annual general meeting.
Niels Krag PrintzCEO
Copenhagen, 17 March 2016
Ole Joachim JensenCFO
SOS INTERNATIONAL ANNUAL REPORT 2015
REVIEWS
Management's statement
17

18
SOS INTERNATIONAL ANNUAL REPORT 2015
Copenhagen, 17 March 2016Ernst & YoungGodkendt Revisionspartnerselskab – CVR No. 30 70 02 28
Jesper Jørn PedersenState Authorised, Public Accountant
Rasmus BerntsenState Authorised, Public Accountant
TO THE SHAREHOLDERS OF SOS INTERNATIONAL A/S
INDEPENDENT AUDITORS' REPORT ON THE CONSOLI - DATED FINANCIAL STATEMENTS AND THE PARENT COMPANY FINANCIAL STATEMENTSWe have audited the consolidated financial statements and the parent company financial statements of SOS International A/S for the financial year 1 January – 31 December 2015, which comprise income statement, balance sheet, statement of changes in equity and notes, including a summary of significant accounting policies, for the Group as well as for the parent company and consolidated cash flow statement. The consolidated financial statements and the parent company financial statements are prepared in accordance with the Danish Financial Statements Act.
MANAGEMENT'S RESPONSIBILITY FOR THE CONSOLI - DATED FINANCIAL STATEMENTS AND THE PARENT COMPANY FINANCIAL STATEMENTSManagement is responsible for the preparation of consolidated financial statements and parent company financial statements that give a true and fair view in accordance with the Danish Financial Statements Act and for such internal control that Management determines is necessary to enable the preparation of consolidated financial statements and parent company financial statements that are free from material misstatement, whether due to fraud or error.
AUDITORS' RESPONSIBILITY Our responsibility is to express an opinion on the consolidated financial statements and the parent company financial state -ments based on our audit. We conducted our audit in accordance with International Standards on Auditing and additional requirements under Danish audit regulation. This requires that we comply with ethical requirements and plan and perform the audit to obtain reasonable assurance as to whether the consolidated financial statements and the parent company financial statements are free from material misstatement.
An audit involves performing procedures to obtain audit evidence about the amounts and disclosures in the consolidated financial statements and the parent company financial statements. The procedures selected depend on the auditors' judgement, inclu-ding the assessment of the risks of material misstatement of the consolidated financial statements and the parent company financial statements, whether due to fraud or error. In making those risk assessments, the auditors consider internal control relevant to the Company's preparation of consolidated financial statements and parent company financial statements that
give a true and fair view in order to design audit procedures that are appropriate in the circumstances, but not for the purpose of expressing an opinion on the effectiveness of the Company's internal control. An audit also includes evaluating the appropriateness of accounting policies used and the reasonableness of accounting estimates made by Management, as well as evaluating the overall presentation of the consolidated financial statements and the parent company financial statements.
We believe that the audit evidence we have obtained is sufficient and appropriate to provide a basis for our opinion.
Our audit has not resulted in any qualification.
OPINIONIn our opinion, the consolidated financial statements and the parent company financial statements give a true and fair view of the Group's and the parent company's financial position at 31 December 2015 and of the results of the Group's and the parent company's operations and consolidated cash flows for the financial year 1 January – 31 December 2015 in accordance with the Danish Financial Statements Act.
STATEMENT ON THE MANAGEMENT'S REVIEWPursuant to the Danish Financial Statements Act, we have read the Management's review. We have not performed any further procedures in addition to the audit of the consolidated financial statements and the parent company financial statements. On this basis, it is our opinion that the information provided in the Management's review is consistent with the consolidated financial statements and the parent company financial statements.
REVIEWS
Independent auditor's report

19
SOS INTERNATIONAL ANNUAL REPORT 2015
CONSOLIDATED AND ANNUAL FINANCIAL STATEMENTS 2015
Accounting policies
The 2015 annual report of SOS International has been pre pared in accordance with the provisions of the Danish Financial Statements Act for a large classC enterprise.
The accounting policies used in the preparation of the financial statements are consistent with those of last year.
RECOGNITION AND MEASUREMENTThe financial statements are prepared in accordance with the historical cost convention.
Revenue is recognised in the income statement as it is earned. Value adjustments of f inancial assets and liabilities are measured at fair value or amortised cost. The same applies to all expenses incurred to achieve earnings, including depreciations, impairment losses/gains, accruals and reversals due to changes in accounting estimates of amounts previously recognised in the income statement.
Assets are recognised in the balance sheet when it is probable that future economic benefits will flow to the company, and the value of the asset can be reliably measured.
Liabilities are recognised in the balance sheet when it is probable that future economic benefits will flow out of the company and the value of the liability can be reliably measured. On initial recognition, assets and liabilities are measured at cost. Subsequently, assets and liabilities are measured as described for each individual item below:
Certain financial assets and liabilities are measured at amortised cost to achieve a constant effective interest rate over the life of the asset or liability. Amortised cost is stated as the original cost less any repayments plus or minus the cumulative amortisation of any difference between cost and nominal amount. In this way, capital losses and gains are amortised over the life of the asset or liability.
Recognition and measurement take into consideration anticipated losses and risks that arise before the time of presentation of the annual report and which confirm or invalidate affairs and conditions existing at the balance sheet date.
The parent company uses Danish Kroner (DKK) as its functional currency. All other currencies are considered as foreign currency.
CONSOLIDATED FINANCIAL STATEMENTSThe consolidated financial statements include the parent company SOS International A/S, as well as the subsidiaries of which SOS International A/S directly or indirectly holds more than 50% of the voting rights or have a deciding influence in another way. Companies of which the Group holds between 20% and 50% of the voting rights and in addition to considerable but not deciding influence, are considered as associated companies, see the Group overview.
For the consolidated companies, elimination is carried out of intra-group income and expenses, shareholdings, internal debts and dividends as well as realised and unrealised profits and losses for transactions between the consolidated companies.
Investments in subsidiaries are offset with the proportionate share of the subsidiaries' fair value of net assets and liabilities on the purchase date.
COMPANY MERGERSNewly acquired or newly established companies are recognised in the consolidated financial statements from the purchase date. Sold or discontinued companies are recognised in the consolidated income statement up to the divestment date. Comparative figures are not adjusted for newly acquired or discontinued companies.
Profit or loss in the event of divestment of subsidiaries and associated companies is calculated as the difference between the divestment sum and the carrying amount of net assets on the date of sale including goodwill that is not depreciated and the expected costs for the sale or discontinuation.
For the acquisition of new companies, the acquisition method is used after which the newly acquired companies' identified assets and liabilities are measured at fair value on the date of acquisition. Accruals to cover the costs of decided and published restructuring in the acquired company are recognised in connection with the acquisition. Consideration is taken of the tax effect of the conducted revaluations.
Positive differential amounts (goodwill) between cost price and fair value of the identified assets and liabilities taken over, including accruals for restructuring, are recognised under intangible fixed assets and are amortised systematically over the

20
SOS INTERNATIONAL ANNUAL REPORT 2015
income statement after an individual evaluation of the financial service life, however, maximum 20 years.
Goodwill from acquired companies can be adjusted until the end of the year after an acquisition.
INTRA-GROUP COMPANY MERGERSThe consolidation method is used for company consolidations such as the purchase and sale of investments, mergers, demergers, injection of assets and exchange of shares, etc. in the event of participation by companies under the parent company's control. The differences between the agreed payment and the acquired company's carrying amount are recognised in the equity. Furthermore, adjustment of the comparative figures for earlier financial years is carried out.
MINORITY INTERESTSIn the consolidated financial statements, the subsidiaries' accounting items are recognised 100%. The minority interests' proportionate share of the subsidiaries' results and equity are adjusted annually and recognised as separate items under the income statement and balance sheet.
TRANSLATION OF FOREIGN CURRENCYTransactions in foreign currency are translated on the first recog nition at the rate on the date of transaction. Foreign currency differences that arise between the rate on the date of transaction and the rate on the date of payment are recognised in the income statement as a financial item.
Receivables, debt and other monetary items in foreign currency are translated at the exchange rate on the balance sheet date. The difference between the rate on the balance sheet date and the rate on the date of the occurrence of the receivable or debt are recognised in the income statement under financial income and expenses.
Foreign subsidiaries are considered as being independent units. The income statements are translated to an average exchange rate for the month and the balance sheet items are translated to the exchange rates on the balance sheet date. Exchange rate differences that have arisen with the translation of the foreign subsidiaries' equity at the beginning of the year, at the exchange rates on the balance sheet date, as well as with translation of the income statements from average exchange rates, at the exchange rates on the balance sheet date, are recognised directly in equity.
Exchange rate adjustments of debts with independent foreign subsidiaries that are considered as part of the total investment in the subsidiary are recognised directly in equity. Similarly, exchange rate gains and losses on loans to foreign subsidiaries are recognised in equity.
PROFIT AND LOSS ACCOUNT
NET REVENUEThe net revenue for the sale of services is recognised in the income statement if delivery and risk transfer to the buyer has taken place before the end of the year. The net revenue is recognised excluding VAT and tax charges on behalf of a third party, as well as with the deduction of discounts in connection with the sale.
Net revenue is recognised in line with the processing of the projects by which the net revenue corresponds to the sale value of the year's performed work. Net revenue is recognised when the total revenue, costs of the contract and degree of completion on the balance sheet date can be reliably calculated, and it is probable that the economic benefits, including payments, will be received by the company.
ASSISTANCE COSTSAssistance costs regard disbursements on projects that are re-invoiced to SOS International's customers.
OTHER OPERATING INCOME AND COSTSOther operating income and costs contain accounting items of secondary character in relation to the companies' activities.
OTHER EXTERNAL EXPENSESOther external costs include costs for distribution, sale, advertising, administration, facilities, loss on debtors, operational leases, etc.
STAFF COSTSEmployee expenses include payrolls, pensions, other expenses for social security as well as other employee expenses.
RESULTS OF INVESTMENTS IN SUBSIDIARIES AND ASSOCIATED COMPANIESThe proportionate share of the individual subsidiaries' results after tax, after full elimination of internal profits/loss, is recognised in the parent company's income statement.
The proportionate share of the associated companies' results after tax, after elimination of proportionate share of internal profits/loss, is recognised in the income statements of both the Group and parent company.
FINANCIAL INCOME AND COSTSFinancial income and costs contain interest, exchange gains and losses related to debt and transactions in foreign currencies, as well as supplements and allowances under the tax pre- payment scheme, etc.
CONSOLIDATED AND ANNUAL FINANCIAL STATEMENTS 2015

21
SOS INTERNATIONAL ANNUAL REPORT 2015
TAX ON PROFIT FOR THE YEARThe parent company is covered by the Danish rules on compulsory joint taxation of SOS International A/S Group’s Danish subsidiaries. Subsidiaries are covered by joint taxation as of the date they are included in the consolidation in the Consolidated Financial Statement, prior to this they are not part of consolidation.
The parent company is the administrative company for the joint taxation and, as a result of this, settles all payments of corporate taxes with the Danish tax authorities.
The applicable Danish corporate tax is allocated by settling joint taxation contributions among the jointly taxed companies, in relation to their taxable incomes. In this connection, companies with tax losses, receive joint taxation contributions from companies that have been able to apply this loss to reduce their own tax profit.
Tax for the year, consisting of the year’s current corporate tax, the year’s joint taxation contribution and changes in deferred tax rates, is recognised in the Statement of Income, with the portion that can be attributed to the income for the year, and directly to equity, with the portion that can be directly attributed to equity.
BALANCE SHEET
INTANGIBLE FIXED ASSETS
GoodwillAcquired goodwill is measured at cost price with deductions of accumulated depreciation. Goodwill is amortised over its estimated economic life, which is determined based on management’s experience within the individual business areas. Goodwill is amortised on a straightline basis over the amortisation period which cannot exceed 20 years and will be longest for strategically acquired companies with a strong market position and long-term earnings profile.
SoftwareSoftware is measured at cost less accumulated amortisation and impairments. Amortisation is performed on a straight line basis over the estimated service life, based on the following assessment of the remaining service life of the assets.
The cost price includes the purchase price as well as costs directly associated to the purchase, until the time where the asset is ready to be used.
Customer-related assets and trademarksAcquired customer related assets and trademarks are measured at cost price with deductions of accumulated depreciation. Customerrelated assets and trademarks are amortised over their estimated economic life, which is determined based on management’s experience within the individual business areas. Customerrelated assets and trademarks are depreciated or amortised on a straightline basis over the depreciation or amortisation period not to exceed 20 years.
PROPERTY, PLANT AND EQUIPMENTLeasehold improvements as well as fixtures and fittings, tools and equipment are measured at cost less accumulated depreciation.
The cost includes the purchase price as well as costs directly associated to the purchase until the time where the asset is ready to be used.
Depreciation is performed on a straightline basis over the estimated service life, based on the following assessment of the remaining service life of the assets:
Leasehold improvements 5 yearsOther fixtures and fittings, tools and equipment 3-5 years
Gains or losses on the divestment of property, plant and equipment are recognised as the difference between the sales price, less sales costs, and the carrying amount at the time of sale. Gains or losses are recognised in the Income Statement under depreciation.
INVESTMENTS IN SUBSIDIARIES AND ASSOCIATESInvestments in subsidiaries and associates are measured according to the equity method.
Investments in subsidiaries and associates are measured at the proportional share of the companies’ equity value mea sured according to the Group’s accounting policies minus or plus unrealised intra-group profits and losses and plus or minus the residual value of positive or negative goodwill measured according to the acquisition method.
Investments in subsidiaries and associates with a negative net asset value are measured at DKK 0 and any receivables from these companies will be impaired to the extent the receivable is deemed non-collectable. To the extent the parent company has a legal or actual obligation to cover a negative balance that exceeds the receivable; the balance will be recognised under accruals. If SOS International has a legal or actual obligation to the company's deficit, an allocated commitment will be included to this.
CONSOLIDATED AND ANNUAL FINANCIAL STATEMENTS 2015

22
SOS INTERNATIONAL ANNUAL REPORT 2015
Net revaluation of investments in subsidiaries and associates are shown as a reserve for net revaluation according to the equity method in equity to the extent the carrying amount exceeds the cost price. Dividends from subsidiaries expected to be approved before the approval of the annual report for SOS International A/S are not bound on the revaluation reserve. For company acquisitions, the acquisition method is used; cf. description above under the Consolidated Financial Statement.
For company acquisitions, the acquisition method is used; cf. description above under the Consolidated Financial Statement.
IMPAIRMENT TEST OF ASSETSThe carrying amount of intangible assets and property, plant and equipment are measured annually for indications of value impairments other than the decrease in value reflected by amortisation or depreciation.
If there are indications of value impairment, impairment is performed on each individual asset, respectively, group of assets. Writedown is made to the asset’s recoverable amount, if this is lower than the carrying amount.
The recoverable amount that is used will be the highest value of the net selling price and intrinsic value. The intrinsic value is measured as the current value of the estimated net income from the use of the asset or asset group.
RECEIVABLESReceivables are measured at amortised cost.
Impairments for potential losses are made where it is estimated that there is objective indication that a receivable or a portfolio of receivables are impaired. If there is objective indication that an individual receivable is impaired, impairment is made at individual level.
Receivables for which there is no objective indication of impairment at individual level, objective indication for impairment is assessed at portfolio level. The portfolios are primarily based on the domicile of the debtors and a credit assessment in accordance with the Company’s and the Group's credit risk management policy. The objective indicators used for portfolios are established based on historical records of losses.
Impairments are calculated as the difference between the carrying amount of receivables and the present value of anticipated cash flows, including the realisable value of any accepted collaterals. The effective interest rate is used as the discount rate for the individual receivable or portfolio.
WORK IN PROGRESSWork in progress consists of incurred costs for projects measured at the market value. The market value is measured based on the rate of completion at the reporting date and the total anticipated income from work in progress.
PREPAYMENTSPrepayments recognised under current assets cover costs incurred relating to the following financial year.
SECURITIESListed securities recognised under current assets are measured at the fair value at the balance sheet date.
EQUITYReserve for net revaluation according to the equity method.Reserve for net revaluation applying the equity method co vers net revaluations of equity investments in subsidiaries in relation to cost.
The reserve can be eliminated in case of losses, if investments are realised or changes are made to accounting estimates.
The reserve may not be recognised at a negative amount.
DIVIDENDProposed dividends are recognised as a liability at the time of adoption by the Annual General Meeting (the time of declaration). Dividends expected to be declared for the year are shown as a separate item under equity.
CORPORATE TAX AND DEFERRED TAXAs the administrative company, SOS International A/S assumes liability for the subsidiaries’ corporate taxes to the Danish tax authorities concurrently with the subsidiaries’ payment of joint-taxation contributions.
Current tax payable and receivable is recognised in the balance sheet as calculated tax on the taxable income for the year, adjusted for previous years’ taxable income and taxes paid on account. Payable or receivable joint taxation contributions are recognised in the balance sheet as “Payable corporate tax” or “Corporate tax.”
Deferred tax is measured according to the balance sheet lia-bility method on all temporary differences between accounting and tax values of assets and liabilities. However, deferred tax on temporary differences related to taxable non-deductible goodwill, as well as other items where temporary differences
CONSOLIDATED AND ANNUAL FINANCIAL STATEMENTS 2015

23
SOS INTERNATIONAL ANNUAL REPORT 2015
related to taxable non-deductible goodwill, as well as other items where temporary differences – except for acquisitions of companies – have arisen at the time of acquisition without having an effect on the income or taxable income, is not recognised. In cases where the determination of the tax value can be performed under various taxation rules, deferred tax is measured based on management's planned use of the asset, respectively, settlement of the liability.
Deferred tax assets, including the tax base of tax loss carry- forwards, are recognised at the value at which they are ex pec-ted to be used, either by elimination in the tax of future earnings, or by offsets in deferred tax payables in companies within the same legal tax entity or jurisdiction.
Adjustment of deferred tax is made concerning performed elimination of unrealised payable intragroup profits and losses. Deferred tax is measured on the basis of the tax rules and tax rates in the respective countries that will be effective under the legislation, at the reporting date, when the deferred tax is expected to be crystalised as current tax.
PROVISIONSProvisions comprise anticipated costs related to warranties, losses on work in progress, restructurings, etc. Provisions are recognised when, as a result of past events, the Group has a legal or a constructive obligation and it is probable that there may be an outflow of resources embodying economic benefits to settle the obligation. Provisions are measured at net realisable value or fair value. If the obligation is expected to be settled far into the future, the obligation is measured at fair value.
If it is likely that total costs will exceed total income from a construction contract, a provision is made for the total loss anticipated on the contract. The provision is recognised in assistance costs.
LIABILITIESFinancial liabilities are recognised upon raising the loan at the proceeds received, less incurred transaction costs. For subsequent periods, financial liabilities are measured at amortised cost.
PREPAYMENTSPrepayments recognised under liabilities include received payments regarding revenue in the following financial year.
CASH FLOW STATEMENTThe Cash Flow Statement shows consolidated cash flow dis-tri buted on operating, investing and financing activities for the year, changes in cash and cash equivalents for the year, as well as cash and cash equivalents at the beginning and end of the year.The effect on cash flow from the acquisition of companies is shown separately under cash flow from investment activities. Cash flow from acquired companies from the date of the acquisition is recognised in the Cash Flow Statement.
CASH FLOW FROM OPERATING ACTIVITIESCash flow from operating activities is measured as income for the year adjusted for noncash operating items, changes in working capital and corporation tax paid.
CASH FLOW FROM INVESTMENT ACTIVITIESCash flow from investment activities cover payments made related to the purchase and divestment of companies and activities, and the purchase and divestment of property, plant and equipment, intangible assets and other financial assets.
CASH FLOW FROM FINANCING ACTIVITIESCash flow from financing activities comprise changes in the size or structure of the company’s share capital and incidental costs, as well as loans, repayments of principals of interestbearing debt and payment of dividends to shareholders.
CASH AND CASH EQUIVALENTSCash and cash equivalents comprise holdings of shortterm securities that can readily be converted to cash or cash equivalents and for which there is only insignificant risk of changes in value.
SEGMENT INFORMATIONDisclosures include information related to business segments and geographic markets. The segment information follows the Group's accounting policies and internal financial management.
CONSOLIDATED AND ANNUAL FINANCIAL STATEMENTS 2015

24
SOS INTERNATIONAL ANNUAL REPORT 2015
KEY FIGURES
The ratios and key figures shown in the statement of financial highlights and key figures are calculated as follows:
EBITDA margin
Net operating income margin
EBT Margin
Profit margin
Return on capital employed
Operating assets
Liquidity ratio
Solvency ratio
Return on equity
CONSOLIDATED AND ANNUAL FINANCIAL STATEMENTS 2015
Profit before interest, taxes, depreciation and amortisation (EBITDA) × 100
Net revenue
Profit before interest, taxes, depreciation and amortisation (EBITDA) x 100
Contribution margin
Profit before tax × 100
Net revenue
Profit before tax × 100
Contribution margin
Profit from ordinary operating activities (EBIT) × 100
Average operating assets
Current assets × 100
Current liabilities
Equity, end of year × 100
Liabilities, total, end of year
Profit for the year × 100
Average equity
Operating assets are total assets less cash and cash equivalents, other interestbearing assets (incl. shares)
as well as investments in associated companies.

25
SOS INTERNATIONAL ANNUAL REPORT 2015
DKK’000
NET REVENUEAssistance costs
CONTRIBUTION MARGINOther operating incomeExternal costs
GROSS PROFITStaff costsDepreciation and amortisation on tangible and intangible assets
INCOME FROM OPERATING ACTIVITIESIncome from subsidiaries after taxIncome from associates after taxFinancial incomeFinancial expenses
PROFIT BEFORE TAXTax on income for the year
PROFIT FOR THE YEAR
PROPOSED PROFIT APPROPRIATION
DKK’000
Retained incomeProposed dividends
NOTE 2015 2014 2015 2014 1 2,864,136 2,893,001 2,027,068 2,132,276 1,978,719 2,020,933 1,480,398 1,607,370 885,417 872,068 546,670 524,906 18,096 2,051 2,405 405 2 202,735 187,645 107,589 95,076 700,778 686,474 441,486 430,235 3 626,519 601,252 417,933 395,906 7,8 49,521 76,625 14,729 20,112 24,738 8,597 8,824 14,217 9 0 0 10,640 14,447 521 8 0 8 4 39,727 26,573 37,311 25,999 5 37,856 23,902 34,602 21,087 26,088 11,276 22,173 4,690 6 6,523 11,017 2,608 4,431 19,565 259 19,565 259
2015 2014 19,565 259 0 0 19,565 259
PARENT COMPANYGROUP
CONSOLIDATED AND ANNUAL FINANCIAL STATEMENTS 2015
Statement of income
26
SOS INTERNATIONAL ANNUAL REPORT 2015
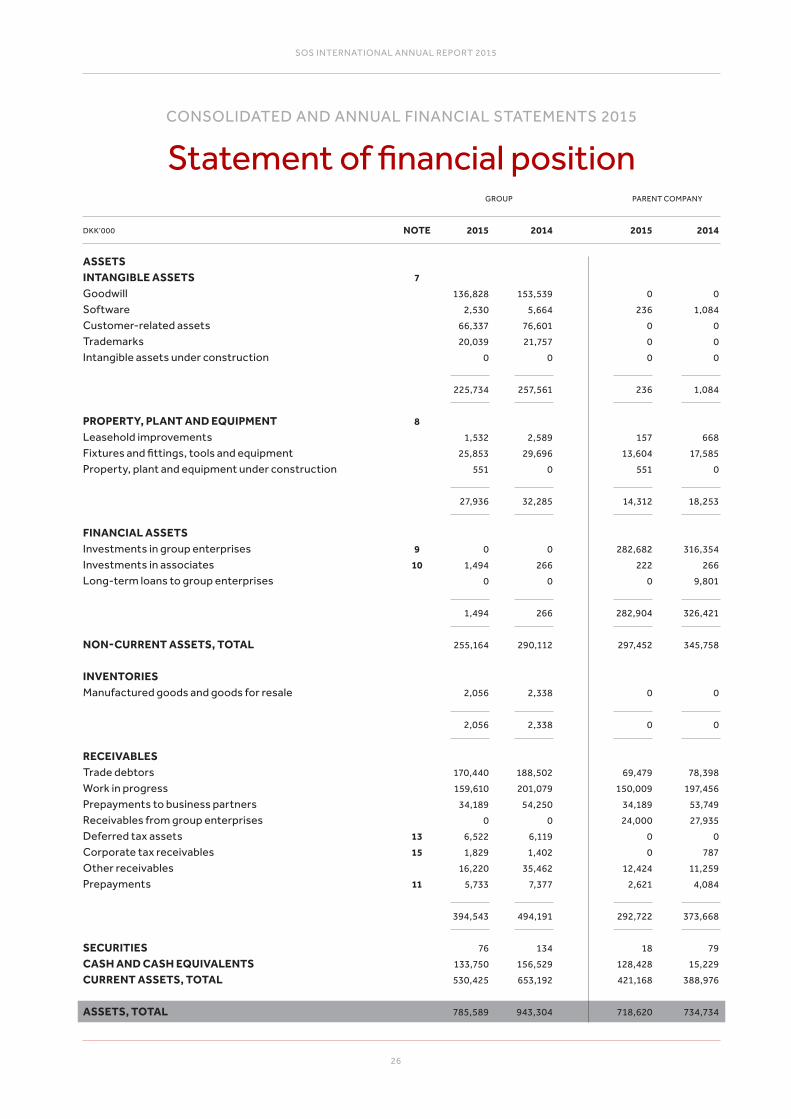
Statement of financial position
DKK’000 NOTE 2015 2014 2015 2014
7 136,828 153,539 0 0 2,530 5,664 236 1,084 66,337 76,601 0 0 20,039 21,757 0 0 0 0 0 0 225,734 257,561 236 1,084
8 1,532 2,589 157 668 25,853 29,696 13,604 17,585 551 0 551 0 27,936 32,285 14,312 18,253
9 0 0 282,682 316,354 10 1,494 266 222 266 0 0 0 9,801 1,494 266 282,904 326,421 255,164 290,112 297,452 345,758 2,056 2,338 0 0 2,056 2,338 0 0
170,440 188,502 69,479 78,398 159,610 201,079 150,009 197,456 34,189 54,250 34,189 53,749 0 0 24,000 27,935 13 6,522 6,119 0 0 15 1,829 1,402 0 787 16,220 35,462 12,424 11,259 11 5,733 7,377 2,621 4,084 394,543 494,191 292,722 373,668 76 134 18 79 133,750 156,529 128,428 15,229 530,425 653,192 421,168 388,976 785,589 943,304 718,620 734,734
ASSETSINTANGIBLE ASSETSGoodwillSoftwareCustomerrelated assetsTrademarksIntangible assets under construction
PROPERTY, PLANT AND EQUIPMENTLeasehold improvementsFixtures and fittings, tools and equipmentProperty, plant and equipment under construction
FINANCIAL ASSETSInvestments in group enterprisesInvestments in associatesLongterm loans to group enterprises
NON-CURRENT ASSETS, TOTAL
INVENTORIESManufactured goods and goods for resale
RECEIVABLESTrade debtorsWork in progressPrepayments to business partnersReceivables from group enterprisesDeferred tax assetsCorporate tax receivablesOther receivablesPrepayments
SECURITIESCASH AND CASH EQUIVALENTSCURRENT ASSETS, TOTAL
ASSETS, TOTAL
PARENT COMPANYGROUP
CONSOLIDATED AND ANNUAL FINANCIAL STATEMENTS 2015

27
SOS INTERNATIONAL ANNUAL REPORT 2015
Statement of financial position
DKK’000 NOTE 2015 2014 2015 2014
12 21,388 21,388 21,388 21,388 208,716 190,978 208,716 190,978 0 0 0 0 230,104 212,366 230,104 212,366 13 25,768 36,672 3,756 8,334 9,870 0 8,600 0 35,638 36,672 12,356 8,334 14 33,719 31,364 33,594 31,305 0 24,000 0 24,000 24,595 26,848 24,141 24,984 58,314 82,212 57,735 80,289 46,883 136,349 46,883 136,349 86,503 83,331 49,048 60,518 0 0 91,323 2,081 196,010 207,697 152,874 140,668 15 5,336 1,045 3,276 0 126,801 183,632 75,021 94,129 461,533 612,054 418,425 433,745 519,847 694,266 476,160 514,034 785,589 943,304 718,620 734,734 16 19 20
EQUITY AND LIABILITIESEQUITY Share capitalRetained incomeProposed dividends
EQUITY, TOTAL
PROVISIONSDeferred taxOther provisions
PROVISIONS, TOTAL
LIABILITIES OTHER THAN PROVISIONSLONG-TERM LIABILITIESCustomer depositsCredit institutionsOther longterm liabilities
SHORT-TERM LIABILITIESCredit institutionsTrade payablesAmounts owed to group enterprisesPrepayments from customersCorporation taxOther shortterm liabilities
LIABILITIES OTHER THAN PROVISIONS, TOTAL
EQUITY AND LIABILITIES, TOTAL
CONTINGENT LIABILITIES
PURCHASE OF SUBSIDIARIES AND ACTIVITIES
RELATED PARTIES
PARENT COMPANYGROUP
CONSOLIDATED AND ANNUAL FINANCIAL STATEMENTS 2015

28
SOS INTERNATIONAL ANNUAL REPORT 2015
DKK’000 21,388 200,334 0 221,722 0 0 0 0 0 259 0 259 0 9,615 0 9,615 21,388 190,978 0 212,366 21,388 190,978 0 212,366 0 0 0 0 0 19,565 0 19,565 0 1,827 0 1,827 21,388 208,716 0 230,104
Equity at 1 Jan 2014Dividends distributedTransferred via distribution of incomeExchange rate adjustment, group enterprises
Equity at 31 Dec 2014
Equity at 1 Jan 2015Dividends distributedTransferred via distribution of incomeExchange rate adjustment, group enterprises
EQUITY AT 31 DEC 2015
GROUP AND PARENT COMPANY
Share capital Retained income
Proposed dividends
Total
CONSOLIDATED AND ANNUAL FINANCIAL STATEMENTS 2015
Statement of changes in equity
29
SOS INTERNATIONAL ANNUAL REPORT 2015
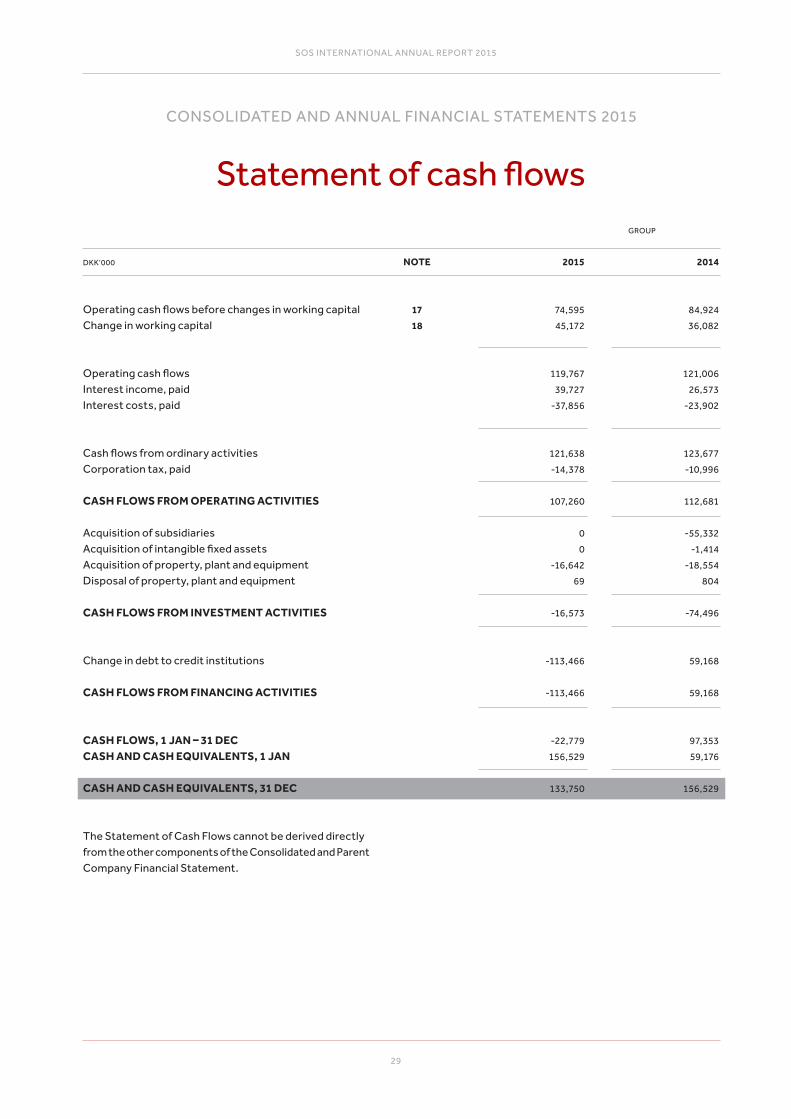
DKK’000 NOTE 2015 2014 17 74,595 84,924 18 45,172 36,082 119,767 121,006 39,727 26,573 37,856 23,902 121,638 123,677 14,378 10,996 107,260 112,681 0 55,332 0 1,414 16,642 18,554 69 804 16,573 74,496 113,466 59,168 113,466 59,168
22,779 97,353 156,529 59,176 133,750 156,529
Operating cash flows before changes in working capitalChange in working capital
Operating cash flowsInterest income, paidInterest costs, paid
Cash flows from ordinary activitiesCorporation tax, paid
CASH FLOWS FROM OPERATING ACTIVITIES
Acquisition of subsidiariesAcquisition of intangible fixed assetsAcquisition of property, plant and equipmentDisposal of property, plant and equipment
CASH FLOWS FROM INVESTMENT ACTIVITIES
Change in debt to credit institutions
CASH FLOWS FROM FINANCING ACTIVITIES
CASH FLOWS, 1 JAN – 31 DECCASH AND CASH EQUIVALENTS, 1 JAN
CASH AND CASH EQUIVALENTS, 31 DEC
The Statement of Cash Flows cannot be derived directlyfrom the other components of the Consolidated and ParentCompany Financial Statement.
GROUP
CONSOLIDATED AND ANNUAL FINANCIAL STATEMENTS 2015
Statement of cash flows

30
SOS INTERNATIONAL ANNUAL REPORT 2015
DKK’000 2015 2014 2015 2014
1,917,107 1,861,279 1,914,641 1,853,941 860,138 740,517 102,295 96,741 86,891 291,205 10,132 181,594 2,864,136 2,893,001 2,027,068 2,132,276 811,641 938,265 486,270 618,472 847,320 891,901 692,543 672,301 741,157 714,679 523,146 542,697 258,485 225,352 207,961 188,380 205,533 122,804 117,148 110,426 2,864,136 2,893,001 2,027,068 2,132,276 33,260 40,700 14,457 14,523 55,797 45,656 38,191 26,639 32,001 21,452 20,926 15,780 81,677 79,837 34,015 38,134 202,735 187,645 107,589 95,076 1,331 1,439 550 581 21 40 5 24 805 1,399 609 674 29 894 0 755 2,186 3,772 1,164 2,034
522,285 501,390 359,249 340,363 53,385 47,351 39,437 33,566 36,566 40,372 10,898 14,497 14,283 12,139 8,349 7,480 626,519 601,252 417,933 395,906 999 977 474 490
NET REVENUESegment information by activityTravelRoadsideHealth
Segment information by geographyDenmarkSwedenNorwayFinlandOther countries
OTHER EXTERNAL COSTSRent, etc.Consultant fee, etc.IT service, software licences, etc.Other external costs
Fees for auditor elected by the annual general meetingStatutory auditOther assurance services with securityTax and VAT advisory servicesOther services
STAFF COSTSWages and salariesPensionsOther social security costsOther staff costs
Average number of fulltime employees
1
2
3
PARENT COMPANYGROUP
Staff costs include wages and salaries accrued byExecutive Management and the Supervisory Board in theamount DKK’000 4,159 (2014: DKK’000 4,021).
CONSOLIDATED AND ANNUAL FINANCIAL STATEMENTS 2015
Notes

31
SOS INTERNATIONAL ANNUAL REPORT 2015
DKK’000 2015 2014 2015 2014
0 0 584 225 39,429 26,075 36,636 25,424 298 498 91 350 39,727 26,573 37,311 25,999 0 0 122 9 33,371 17,723 31,015 16,356 2,564 2,570 1,777 1,257 1,921 3,609 1,688 3,465 37,856 23,902 34,602 21,087 18,541 20,453 7,476 6,329 290 92 290 84 11,728 9,528 4,578 1,982 6,523 11,017 2,608 4,431
FINANCIAL INCOMEInterest income from subsidiariesCurrency gainsOther financial income
FINANCIAL EXPENSESInterest expenses to subsidiariesExchange lossesBank feesInterest expenses
TAX OF INCOME FOR THE YEARCurrent taxAdjustment of tax from previous yearsAdjustment of deferred tax for the year
INTANGIBLE ASSETS
DKK’000
Cost price, 1 Jan 2015Exchange rate adjustmentsAdditionsDisposalsTransfers
Cost price, 31 Dec 2015
Amortisation, 1 Jan 2015Exchange rate adjustmentsDisposalsImpairment lossesAmortisation
Amortisation, 31 Dec 2015
CARRYING AMOUNT, 31 DEC 2015
4
5
6
7
188,552 47,378 94,257 25,765 0 355,952 2,274 358 1,141 0 0 3,773 0 0 0 0 0 0 0 9,945 0 0 0 9,945 0 0 0 0 0 0 186,278 37,075 93,116 25,765 0 342,234 35,013 41,714 17,656 4,008 0 98,391 76 325 466 0 0 867 0 9,945 0 0 0 9,945 0 0 0 0 0 0 14,513 3,101 9,589 1,718 0 28,921 49,450 34,545 26,779 5,726 0 116,500 136,828 2,530 66,337 20,039 0 225,734
GROUP
Goodwill TotalSoftware Customerrelatedassets
Trademarks Intangibleassets underconstruction
PARENT COMPANYGROUP
CONSOLIDATED AND ANNUAL FINANCIAL STATEMENTS 2015
Notes

32
SOS INTERNATIONAL ANNUAL REPORT 2015
18,637 0 18,637 0 0 0 9,945 0 9,945 0 0 0 8,692 0 8,692 17,553 0 17,553 9,945 0 9,945 0 0 0 848 0 848 8,456 0 8,456 236 0 236
14,592 124,350 0 138,942 46 2,425 0 2,471 0 0 0 0 23 16,068 551 16,642 1,378 17,525 0 18,903 0 0 0 0 13,191 120,468 551 134,210 12,003 94,654 0 106,657 45 2,440 0 2,485 1,378 17,456 0 18,834 0 0 0 0 1,079 19,857 0 20,936 11,659 94,615 0 106,274 1,532 25,853 551 27,936
INTANGIBLE ASSETS
DKK’000
Cost price, 1 Jan 2015AdditionsDisposalsTransfers
Cost price, 31 Dec 2015
Amortisation, 1 Jan 2015DisposalsImpairment lossesAmortisation
Amortisation, 31 Dec 2015
CARRYING AMOUNT, 31 DEC 2015
PROPERTY, PLANT AND EQUIPMENT
DKK’000
Cost price, 1 Jan 2015Exchange rate adjustmentsAdditions relating to the acquisition of subsidiariesAdditionsDisposalsTransfers
Cost price, 31 Dec 2015
Amortisation, 1 Jan 2015Exchange rate adjustmentsDisposalsImpairment lossesDepreciation
Amortisation, 31 Dec 2015
CARRYING AMOUNT, 31 DEC 2015
PARENT COMPANY
GROUP
Total
Total
Software Intangibleassets underconstruction
8
Leaseholdimprovements
Fixtures andfittings, tools
and equipment
Property, plant and equipment
under construction
CONSOLIDATED AND ANNUAL FINANCIAL STATEMENTS 2015
Notes
33
SOS INTERNATIONAL ANNUAL REPORT 2015
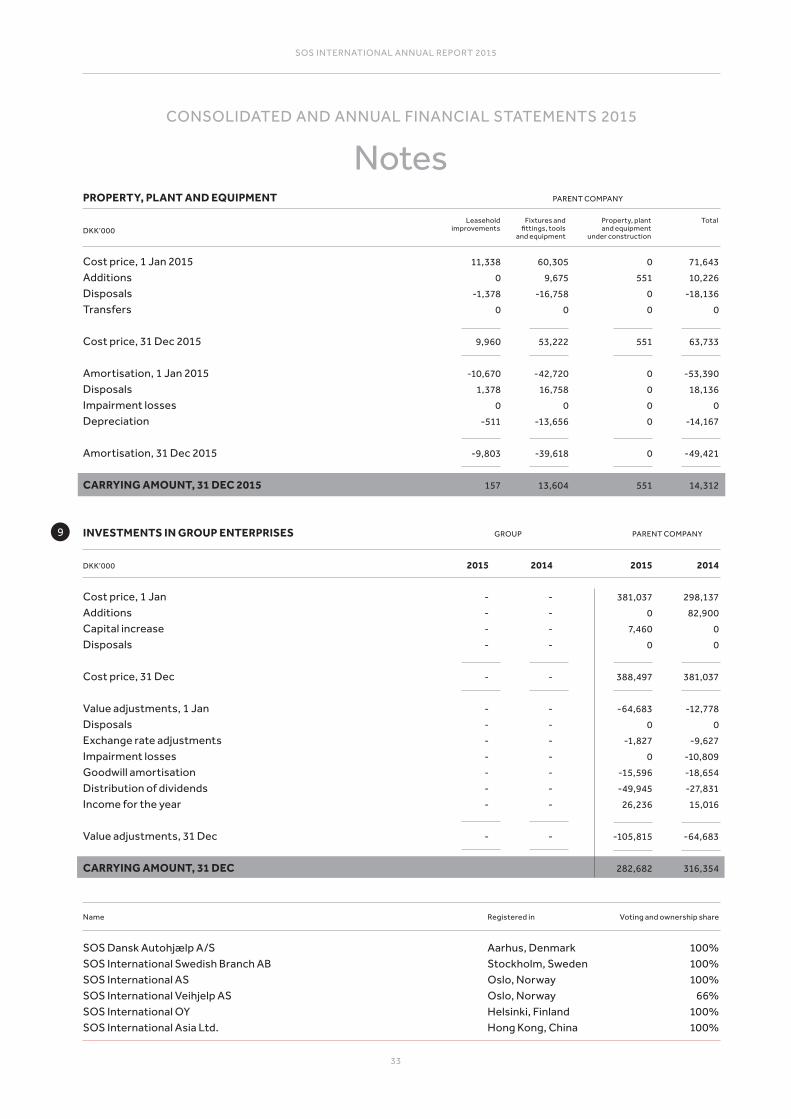
11,338 60,305 0 71,643 0 9,675 551 10,226 1,378 16,758 0 18,136 0 0 0 0 9,960 53,222 551 63,733 10,670 42,720 0 53,390 1,378 16,758 0 18,136 0 0 0 0 511 13,656 0 14,167 9,803 39,618 0 49,421 157 13,604 551 14,312
PARENT COMPANYPROPERTY, PLANT AND EQUIPMENT
DKK’000
Cost price, 1 Jan 2015AdditionsDisposalsTransfers
Cost price, 31 Dec 2015
Amortisation, 1 Jan 2015DisposalsImpairment lossesDepreciation
Amortisation, 31 Dec 2015
CARRYING AMOUNT, 31 DEC 2015
INVESTMENTS IN GROUP ENTERPRISES
DKK’000
Cost price, 1 JanAdditionsCapital increaseDisposals
Cost price, 31 Dec
Value adjustments, 1 JanDisposalsExchange rate adjustmentsImpairment losses Goodwill amortisationDistribution of dividendsIncome for the year
Value adjustments, 31 Dec
CARRYING AMOUNT, 31 DEC
Name
SOS Dansk Autohjælp A/S SOS International Swedish Branch AB SOS International AS SOS International Veihjelp AS SOS International OY SOS International Asia Ltd.
2015 2014 2015 2014 381,037 298,137 0 82,900 7,460 0 0 0 388,497 381,037 64,683 12,778 0 0 1,827 9,627 0 10,809 15,596 18,654 49,945 27,831 26,236 15,016 105,815 64,683 282,682 316,354
Registered in Voting and ownership share
Aarhus, Denmark 100% Stockholm, Sweden 100% Oslo, Norway 100% Oslo, Norway 66% Helsinki, Finland 100% Hong Kong, China 100%
9 PARENT COMPANYGROUP
TotalLeaseholdimprovements
Fixtures andfittings, tools
and equipment
Property, plant and equipment
under construction
CONSOLIDATED AND ANNUAL FINANCIAL STATEMENTS 2015
Notes

34
SOS INTERNATIONAL ANNUAL REPORT 2015
2015 2014 2015 2014
153 153 153 153 1,790 0 0 0 32 0 32 0 1,911 153 121 153 113 101 113 101 9 4 12 4 521 8 0 8 417 113 101 113 1,494 266 222 266
INVESTMENTS IN ASSOCIATES
DKK’000
Cost price, 1 JanAdditionsDisposals
Cost price, 31 Dec
Value adjustments, 1 JanExchange rate adjustmentsIncome for the year
Value adjustments, 31 Dec
CARRYING AMOUNT, 31 DEC
Name
Astrum Assistance Alliance AGKang Rei An Yuan Ltd.
Registered in Voting and ownership share
Switzerland 25 % Singapore 50 %/ 40 %
10 PARENT COMPANYGROUP
2015 2014 2015 2014
5,733 7,377 2,621 4,084 5,733 7,377 2,621 4,084
2015 2014 2015 2014
20,960 20,960 20,960 20,960 428 428 428 428 21,388 21,388 21,388 21,388
PREPAYMENTS
DKK’000
Prepaid expenses
CARRYING AMOUNT, 31 DEC
SHARE CAPITAL
DKK’000
Unlisted share capital:Nominal value at 1 January 2009Capital increase August 2012
NOMINAL VALUE, YEAR-END
The share capital consists of 2,138,766 shares of DKK 10 nominal value and is paid up in full. No shares have special rights.
PARENT COMPANY
PARENT COMPANY
GROUP
GROUP11
12
CONSOLIDATED AND ANNUAL FINANCIAL STATEMENTS 2015
Notes

35
SOS INTERNATIONAL ANNUAL REPORT 2015
2015 2014 2015 2014
30,553 36,102 8,334 11,094 421 72 0 0 0 778 0 778 0 4,829 0 0 11,728 9,528 4,578 1,982 19,246 30,553 3,756 8,334 6,522 6,119 0 0 25,768 36,672 3,756 8,334 19,246 30,553 3,756 8,334
DEFFERRED TAX
DKK’000
Deferred tax, 1 JanExchange rate adjustment Adjustments for previous yearsAdditions relating to the acquisition of subsidiariesAdjustment of deferred tax for the year
CARRYING AMOUNT, 31 DEC
Recognised in the Statement of Financial Position as:Deferred tax assetsProvision for deferred tax
CARRYING AMOUNT, 31 DEC
PARENT COMPANYGROUP13
2015 2014 2015 2014
357 10,690 787 10,175 8 6 0 0 291 870 292 862 18,541 20,453 7,476 6,329 14,378 10,996 3,121 2,197 3,507 357 3,276 787 1,829 1,402 0 787 5,336 1,045 3,276 0 3,507 357 3,276 787
CORPORATION TAX
DKK’000
Corporation tax payable, 1 JanExchange rate adjustmentAdjustments for previous yearsCurrent tax for the yearCorporation tax for the year, paid
CARRYING AMOUNT, 31 DEC
Recognised in the Statement of Financial Position as:Corporate tax receivablesCorporation tax
CARRYING AMOUNT, 31 DEC
15 PARENT COMPANYGROUP
14 LONG-TERM LIABILITIESLong-term liabilities are due within five years from the closing of the financial year.
CONSOLIDATED AND ANNUAL FINANCIAL STATEMENTS 2015
Notes

36
SOS INTERNATIONAL ANNUAL REPORT 2015
2015 2014 2015 2014 9,046 7,046 7,457 2,771 14,856 17,546 2,576 7,457
2015 2014 24,738 8,597 49,521 76,625 336 298 74,595 84,924
2015 2014
282 533 18,062 39,037 41,469 13,310 40,947 15,367 3,172 5,213 9,332 20,372 49,428 14,794 45,172 36,082
CONTINGENT LIABILITIES
SOS International is a party to individual ongoing legal disputes. It is the opinion of the management that the outcome of these legal disputes will not affect the financial situation beyond the receivables and liabilities that have been factored in the balance as of 31 December 2015.
The parent company participates in joint taxation with its Danish subsidiary. The companies bear unlimited joint and several liability for Danish corporation tax and tax at source
OPERATING CASH FLOWS BEFORECHANGES IN WORKING CAPITAL
DKK’000
Operating income
Adjustments for noncash operating items, etc.DepreciationsLosses/gains from the sale of fixed assets
CHANGE IN WORKING CAPITAL
DKK’000
Changes in inventoriesChanges in trade receivablesChanges in work in progressChanges in other receivables, including prepayments, etc.Changes in trade payablesChanges in customer prepaymentsChanges in other debts
on dividends, interest and royalties within the joint taxation scheme. Any subsequent adjustment of the income subject to joint taxation or tax at source on dividend etc. could result in an increase of the companies’ liability. The group as a whole is not liable for others.
The parent company has provided a warranty to support the subsidiary SOS International AS Norway.
16
17
18
DKK’000
Operating lease commitments due within five years
Rent commitments due within five years
PARENT COMPANYGROUP
GROUP
GROUP
CONSOLIDATED AND ANNUAL FINANCIAL STATEMENTS 2015
Notes

37
SOS INTERNATIONAL ANNUAL REPORT 2015
2015 2014 0 21,948 0 1,379 0 278 0 43 0 2,921 0 91 0 4,829 0 4,300 0 17,531 0 65,369 0 82,900
PURCHASE OF SUBSIDIARIES AND ACTIVITIES
DKK’000
Customerrelated assetsIntangible assets otherProperty, plant and equipmentInventoriesReceivablesCash and cash equivalentsDeferred taxShortterm liabilities
Goodwill
COST PRICE
RELATED PARTIES
SOS International A/S has no related parties with controlling influence.
19
20
GROUP
CONSOLIDATED AND ANNUAL FINANCIAL STATEMENTS 2015
Notes
www.sos.eu
A l w a y s o n