annual report 2015 - tivoli
TRANSCRIPT

2015ANNUAL REPORT 2015TIVOLI A/S
Vesterbrogade 3DK-1630 Copenhagen V
Tivoli A/S • VAT 10404916

CONTENTS
❖
3 Chairman’s Report
4 Financial Highlights
6 Management’s Statement and Independent Auditor’s Report
8 Board of Directors, Executive Board and Vice Presidents of Tivoli
12 Statutory Report on Corporate Governance
14 Financial Review
19 Financial Statements
25 Notes
42 Tivoli’s Sponsors
42 Colophon
❖ TIVOLI ANNUAL REPORT 2015 ❖ ❖ TIVOLI ANNUAL REPORT 2015 ❖
Shrimp open-faced sandwich, Fru Nimb restaurant
The Ferris Wheel and the Star Flyer
Come Together, the Tivoli Concert Hall
New illumination experience for Christmas at Tivoli
The main avenue, Halloween
Dog’s Day at Tivoli
Petzi and Park Attendant
Tivoli’s Aquarium
The Tivoli Lake
First girls accepted into the Tivoli Youth Guard
Tony Bennett and Lady Gaga

❖ CHAIRMAN'S REPORT ❖
❖
CHAIRMAN’S REPORT
The 2015 summer season was the longest for more than a century, with Tivoli opening already on 1 April.The Gardens were open for a total of 254 days in 2015. Final attendance figures totalled 4.7 million compared with approximately 4.5 million in 2014. These figures are higher than those for several decades, confirming that Tivoli is evolving in a good way.
One reason for the high attendance figures was the successful Friday Rock season. Better sound and a more ambitious programme brought more visitors to Tivoli on Friday evenings. The additional visitors created more revenue at Tivoli Gardens.
In the autumn, the House of Nimb had good reason to be pleased when the international association Small Luxury Hotels of the World named Nimb Hotel the best in the world, from a pool of 520 hotels in 82 countries. The hotel continues to enjoy high occupancy rates throughout the year.
The profit for the year of DKK 64.1 million is regarded as satisfactory given that it exceeds our initial expectations of a profit before tax for the year of between 50 and 60 million. The good performance is due to the aforementioned high attendance figures, good progress for TivoliCasino.dk as well as the many activities in Tivoli’s halls, also in off-season periods. Profit for the year is 14% higher than last year, equating to 35% higher when adjusting for special items for 2015. Over the past decade, Tivoli A/S has been working in line with the strategy, “From seasonal business to year-round business”. In 2015, an important condition for this mindset was fulfilled. The Tivoli Corner was finally approved by the City of Copenhagen, meaning that we can now build at the corner of Vesterbrogade and Bernstorffsgade. This will give Tivoli a new face on this important corner, featuring shops, a food court and more hotel rooms for the Nimb Hotel.
The debate about Tivoli’s development has been going on ever since its founder, Georg Carstensen, held the directorship. Mr Carstensen was fully aware that evolution is a prerequisite for survival. The changes at Tivoli must keep up with the changes in the world at large. If the gulf between Tivoli’s nostalgic charm and the kind of amusements that are available elsewhere becomes too wide, visitors will eventually choose to go elsewhere. We saw this most recently in the mid-1990s when Tivoli’s attendance figures, and therefore its finances, declined. But Tivoli’s atmosphere, history and traditions are also things that visitors value very highly. Our task is to ensure that tradition and innovation can go hand in hand, just as they have always done, and that we maintain the high quality for which Tivoli is known around the world.
It’s a recipe that works. Tivoli’s visitors are generally very satisfied with their visits and happy to recommend us to others. In fact, 98% of Tivoli’s visitors over the summer season stated that their visit was “Very satisfactory” or “Satisfactory”. In regard to recommen-dations, 96% of visitors state that they “will definitely or probably recommend Tivoli to family/friends”.
The Net Promoter Score for the overall Tivoli experience has been rising steadily, and was 77% for the year 2015, compared with 72% in 2014. NPS defines visitors as “promoters”, “detractors” or “passives”. Promoters are the visitors who rate our service as 9 or 10 on a scale of 0 – 10. For Tivoli employees, the “10/10 experience” has become a day-to-day yardstick for how good service should be.
Jørgen TandrupChairman of the Board of Directors
3

❖ TIVOLI ANNUAL REPORT 2015 ❖
❖
FINANCIAL HIGHLIGHTS
HIGHLIGHTS FOR 2015
Tivoli’s attendance figures for 2015 reached 3,042,000 for the summer season, 541,000 for Halloween, 1,030,000 for Christmas in Tivoli and 120,000 for off-season periods.
Thus, total attendance figures aggregated 4,733,000 in 2015 compared to 4,478,000 in 2014, corresponding to a 5.7% increase.
Consolidated revenue amounted to DKK 955.2 million compared to DKK 861.9 million in 2014, corresponding to a 10.8% increase.
Profit before tax amounted to DKK 64.1 million compared to DKK 56.4 million for 2014. The profit for the year is at the upper end of the upward adjustment to an expected profit before tax of between DKK 60 and 65 million announced in the Stock Exchange Announcement of 14 January 2016. In comparison, an expected profit before tax of between DKK 50 and 60 million was announced in the Annual Report for 2014.
The Board of Directors recommends to the Annual General Meeting distribution of dividend of 25% of profit after tax for the year, corresponding to DKK 11.0 million.
OUTLOOK FOR 2016
Revenue for 2016 is expected to be at the 2015 level (approximately DKK 900 million). The Group is expected to show a profit before tax of between DKK 60 and 70 million.
The weather and other external factors may have great impact on Tivoli’s business and thus the development in profit for the year.
It should be noted that in 2016 Tivoli will be affected by the construction of the Tivoli Corner, which implies that certain leases will be discontinued. Moreover, Tivoli will be open for slightly fewer days in 2016 (246) than in 2015 (254).
SUBSEQUENT EVENTS
No significant events have occurred after the balance sheet date.
4

FINANCIAL HIGHLIGHTS
❖ FINANCIAL HIGHLIGHTS ❖
20112012201320142015DKK million
* 2014-2015 figures are for the Group, whereas 2010-2013 figures are for the Parent Company.
FIVE YEARS' KEY FIGURES*
Revenue incl tenants and lessees 1,311.2 1,244.0 1,144.8 1,124.9 1,061.4
Revenue 955.2 861.9 735.9 708.3 673.9Net revenue 905.9 804.8 697.0 663.2 645.2Expenses before depreciation, amortisation and impairment 792.2 715.9 610.6 582.3 564.9Earnings before interest, tax, depreciation and amortisation (EBITDA) 163.0 146.0 125.3 126.0 109.0Depreciation, amortisation and impairment 94.0 84.4 80.9 78.8 68.2Earnings before interest and tax (EBIT) 69.0 61.6 44.4 47.2 40.8Net financials -4.9 -5.2 -1.8 -5.5 -7.3Profit before tax 64.1 56.4 42.6 41.7 33.5Profit for the year 43.8 44.4 37.0 31.4 24.5Comprehensive income for the year 45.9 40.0 41.9 29.4 17.5 Non-current assets 904.8 910.1 901.0 874.3 864.2Current assets 139.3 121.6 115.8 112.0 92.6Total assets 1,044.1 1,031.7 1,016.8 986.3 956.8Share capital 57.2 57.2 57.2 57.2 57.2Equity 727.4 692.6 661.8 627.7 604.4Non-current liabilities 89.3 94.5 96.9 101.9 99.9Current liabilities 227.4 244.5 258.1 256.7 252.5Invested capital 751.2 769.0 798.0 807.2 768.7Investment in property, plant and equipment 92.1 84.6 105.2 84.9 67.2
Cash flows from operating activities 148.2 167.2 162.1 95.8 117.0Cash flows from investing activities -92.1 -90.2 -107.5 -88.9 -67.2Hereof invested in property, plant and equipment -92.1 -84.2 -102.5 -84.5 -67.2Cash flows from financing activities -27.2 -70.1 -44.4 -4.9 -47.0Total cash flows 28.9 6.9 10.2 2.0 2.8
FIVE YEARS' RATIOS
EBIT margin 7 % 7 % 6 % 7 % 6 %Solvency ratio 70 % 67 % 65 % 64 % 63 %Return on equity (ROE) 6 % 6 % 6 % 5 % 4 %
Earnings in DKK, per share of DKK 100 (EPS) 76.6 77.7 64.7 54.9 42.9Dividend in DKK, per share of DKK 100 19.2 19.5 16.2 13.8 10.7Share price in DKK, end of year 3,821 3,038 2,976 2,929 2,980
Number of employees 886 810 716 711 685
5

❖
❖ TIVOLI ANNUAL REPORT 2015 ❖
❖
MANAGEMENT’S STATEMENT
The Board of Directors and the Executive Board have today considered and adopted the Annual Report of Tivoli A/S for the financial year 1 January - 31 December 2015.
The Consolidated Financial Statements and the Parent Company Financial Statements are prepared in accordance with International Financial Reporting Standards as adopted by the EU. Moreover, the Consolidated Financial Statements and the Parent Company Financial Statements are prepared in accordance with additional Danish disclosure requirements for listed companies. Management’s Review is also prepared in accordance with Danish disclosures requirements for listed companies.
In our opinion, the Consolidated Financial Statements and the Parent Company Financial Statements give a true and fair view of the financial position at 31 December 2015 of the Group and the Parent Company and of the results of the Group and Parent Company operations and cash flows for the financial year 1 January - 31 December 2015.
In our opinion, Management’s Review includes a true and fair account of the development in the operations and financial circumstances of the Group and the Parent Company, of the results for the year and of the financial position of the Group and the Parent Company as well as a description of the most significant risks and elements of uncertainty facing the Group and the Parent Company.
WE RECOMMEND THAT THE ANNUAL REPORT BE ADOPTED AT THE ANNUAL GENERAL MEETING
Copenhagen, 16 March 2016
Executive Board
Lars Liebst Andreas Morthorst Elisabeth Milton HemmingsenCEO CFO Commercial Director
Board of Directors
Jørgen Tandrup Mads Lebech Ulla Brockenhuus-SchackChairman Deputy Chairman
Tommy Pedersen John Høegh Berthelsen Tue Krogh-Lund
6

❖ MANAGEMENT'S STATEMENT ❖
MANAGEMENT’S STATEMENT
INDEPENDENT AUDITOR’S REPORT
TO THE SHAREHOLDERS OF TIVOLI A/S
REPORT ON CONSOLIDATED FINANCIAL STATEMENTS AND PARENT COMPANY FINANCIAL STATEMENTS We have audited the Consolidated Financial Statements and the Parent Company Financial Statements of Tivoli A/S for the financial year 1 January - 31 December 2015, pages 20-41, which comprise income statement, statement of comprehensive income, balance sheet, statement of changes in equity, cash flow statement and notes, including summary of significant accounting policies, for both the Group and the Parent Company. The Consolidated Financial Statements and the Parent Company Financial Statements are prepared in accordance with International Financial Reporting Standards as adopted by the EU and Danish disclosure requirements for listed companies.
Management’s Responsibility for the Consolidated Financial Statements and the Parent Company Financial Statements
Management is responsible for the preparation of Consolidated Financial Statements and Parent Company Financial Statements that give a true and fair view in accordance with International Financial Reporting Standards as adopted by the EU and Danish disclosure requirements for listed companies, and for such internal control as Management determines is necessary to enable the preparation of Consolidated Financial Statements and Parent Company Financial Statements that are free from material misstatement, whether due to fraud or error.
Auditor’s Responsibility Our responsibility is to express an opinion on the Con- solidated Financial Statements and the Parent Company Financial Statements based on our audit. We conducted our audit in accordance with International Standards on Auditing and additional requirements under Danish audit regulation. This requires that we comply with ethical requirements and plan and perform the audit to obtain reasonable assurance whether the Consolidated Financial Statements and the Parent Company Financial Statements are free from material misstatement.
An audit involves performing procedures to obtain audit evidence about the amounts and disclosures in the Consolidated Financial Statements and the Parent Company Financial Statements. The procedures selected depend on the auditor’s judgment, including the assess-ment of the risks of material misstatement of the Consolidated Financial Statements and the Parent Company Financial Statements, whether due to fraud or error. In making those risk assessments, the auditor
considers internal control relevant to the Company’s preparation of Consolidated Financial Statements and Parent Company Financial Statements that give a true and fair view in order to design audit procedures that are appropriate in the circumstances, but not for the purpose of expressing an opinion on the effectiveness of the Company’s internal control. An audit also includes evaluating the appropriateness of accounting policies used and the reasonableness of accounting estimates made by Management, as well as evaluating the overall presentation of the Consolidated Financial Statements and the Parent Company Financial Statements.
We believe that the audit evidence we have obtained is sufficient and appropriate to provide a basis for our audit opinion.
The audit has not resulted in any qualification.
Opinion In our opinion, the Consolidated Financial Statements and the Parent Company Financial Statements give a true and fair view of the Group’s and the Parent Company’s financial position at 31 December 2015 and of the results of the Group’s and the Parent Company’s operations and cash flows for the financial year 1 January - 31 December 2015 in accordance with International Financial Reporting Standards as adopted by the EU and Danish disclosure requirements for listed companies.
STATEMENT ON MANAGEMENT’S REVIEWWe have read Management’s Review in accordance with the Danish Financial Statements Act. We have not performed any procedures additional to the audit of the Consolidated Financial Statements and the Parent Company Financial Statements. On this basis, in our opinion, the information provided in Management’s Review is consistent with the Consolidated Financial Statements and the Parent Company Financial Statements.
Copenhagen, 16 March 2016
PricewaterhouseCoopersStatsautoriseret RevisionspartnerselskabCVR No 33 77 12 31
Kim Füchsel Torben JensenState Authorised State Authorised Public Accountant Public Accountant
7

❖ TIVOLI ANNUAL REPORT 2015 ❖
JØRGEN TANDRUP
Born in 1947MSc in Economics and Business Administration.
Appointed Chairman of the Board of Directors in 2008.Joined the Board of Directors in 2000, dependent.Re-elected to the Board of Directors in 2015.Term of office expires in 2016.
• Chairman of the Board of Directors of Scandinavian Tobacco Group A/S, Skandinavisk Holding A/S, Skandinavisk Holding II, Tivoli A/S, Fritz Hansen A/S, Kurhotel Skodsborg A/S, Skodsborg Sundhedscenter A/S, Jeudan A/S, Chr. Augustinus Fabrikker A/S, CAF Invest A/S.
• Member of the Board of Directors of the Augustinus Foundation, Skodsborg Sundpark A/S, Rungsted Sundpark A/S.
Honorary offices• Expert lay assessor at the Danish
Maritime and Commercial High Court.• Expert member of the Danish Company
Appeals Board.
Particular expertise• Management experience from a large
number of Danish and international companies.
• Business-to-consumer production, sales and branding experience as former CEO of Scandinavian Tobacco Company A/S.
• Industrial policy experience as former Chairman of the Industrial Policy Committee of the Confederation of Danish Industries.
ShareholdingHolding of Tivoli shares at 31 December 2015: 20Tivoli shares sold in the 2015 financial year: 0Tivoli shares acquired in the 2015 financial year: 0
Contact detailsScandinavian Tobacco Group A/S, Sydmarken 42, DK-2860 Søborg.
MADS LEBECH
Born in 1967Master of Laws.
Appointed Deputy Chairman of the Board of Directors in 2010.Joined the Board of Directors in 2010, independent.Re-elected to the Board of Directors in 2015.Term of office expires in 2016.
• CEO of the Danish Industry Foundation.• Chairman of the Advisory Board of the
Ordrupgaard Collection.• Deputy Chairman of CPH City & Port
Development and Copenhagen Malmö Port AB.
• Member of the Board of Directors of eg the Nordea Invest investment funds, the Frederiksberg Foundation and Claus Meyer’s Melting Pot Foundation.
Honorary offices• Chairman of Turismens Vækstråd
(the tourism growth council).• Member of a group of advisers to the
senior management of the University of Copenhagen.
Particular expertise• Board experience from both private-
and public-sector as well as mixed public-private enterprises, eg the Chairmanship of Local Government Denmark, Wonderful Copenhagen, Copenhagen Capacity as well as a large number of boards within eg energy, waste management and transport.
• Political experience as eg Mayor, Chairman of the Greater Copenhagen Development Council, the remuneration and staff committee of Local Govern-ment Denmark and Deputy Chairman of the Danish Conservative Party.
• Strategic development, organisational development and financial management.
• Promotion of tourism and development of the Danish capital.
• Insurance matters.
ShareholdingHolding of Tivoli shares at 31 December 2015: 1Tivoli shares sold in the 2015 financial year: 0Tivoli shares acquired in the 2015 financial year: 0
Contact details Industriens Fond, Esplanaden 34A, DK-1263 Copenhagen K.
TOMMY PEDERSEN
Born in 1949HD Diploma in Accountancy, Organisation and Strategic Planning.
Joined the Board of Directors in 2000, dependent. Re-elected to the Board of Directors in 2015.Term of office expires in 2016.
• CEO of Chr. Augustinus Fabrikker Aktieselskab and the Augustinus Foundation.
• Chairman of the Board of Directors of Maj Invest Equity A/S, Maj Invest Holding A/S, Fondsmæglerselskabet Maj Invest A/S, Rungsted Sundpark A/S and Skodsborg Sundpark A/S.
• Deputy Chairman of Peter Bodum A/S, Bodum Holding a.g., Switzerland and the Løvenholm Foundation.
• Member of the Board of Directors of Jeudan A/S, Nykredit Forsikring A/S, Pharmacosmos Holding A/S and subsidiary, Skandinavisk Holding A/S, Scandinavian Tobacco Group A/S and S.G. Finance A/S Oslo.
Particular expertise• Management experience from a large
number of Danish and international companies.
• Banking and finance as CEO of the Augustinus Foundation and former Bank Manager of Bikuben Girobank A/S.
• Property development and property administration as a member of the Board of Directors of Jeudan A/S.
• Business-to-consumer production, sales and branding experience as a member of the Board of Directors of eg Bodum A/S and Scandinavian Tobacco Company A/S.
ShareholdingHolding of Tivoli shares at 31 December 2015: 14Tivoli shares sold in the 2015 financial year: 0Tivoli shares acquired in the 2015 financial year: 0
Contact detailsChr. Augustinus Fabrikker Aktieselskab, Amaliegade 47, DK-1256 Copenhagen K.
BOARD OF DIRECTORS, EXECUTIVE BOARD AND VICE PRESIDENTS
❖
8

❖ BOARD OF DIRECTORS, EXECUTIVE BOARD AND VICE PRECIDENTS ❖
ULLA BROCKENHUUS-SCHACK
Born in 1961MBA, Columbia Business School N.Y.
Joined the Board of Directors in 2009, independent.Re-elected to the Board of Directors in 2015. Term of office expires in 2016.
• Managing Partner of SEED Capital Denmark I/S.
• Managing Director of Pre-Seed Innovation A/S.
• Member of the Board of Directors of Albeo A/S, Amminex A/S, Expanite A/S, WDI Invest, the Oticon Foundation, DVCA and the Mary Foundation.
Particular expertise• The creative industries economy as
co-founder of Media Invest, former Chairman of the Board of Directors of IO Interactive A/S and executive of the Egmont Group.
• Business strategy, business development and innovation as Managing Partner of SEED Capital Denmark K/S and former management consultant with McKinsey & Co Inc.
• Financial management, accounting and auditing as Managing Partner of SEED Capital Denmark and Managing Director of Pre-Seed Innovation A/S.
ShareholdingHolding of Tivoli shares at 31 December 2015: 10Tivoli shares sold in the 2015 financial year: 0Tivoli shares acquired in the 2015 financial year: 0
Contact detailsSEED Capital Denmark, Diplomvej 381, DK-2800 Kgs. Lyngby.
JOHN HØEGH BERTHELSEN
Born in 1969Senior Coordinator.
Joined the Board of Directors in 2008.Elected by the Company’s employees.Re-elected in 2010.Term of office expires in 2018.
Particular expertise• Coordination of major meetings,
social functions and events at Tivoli and in Nimb.
• Visitor services and sales in relation to the business segment.
ShareholdingHolding of Tivoli shares at 31 December 2015: 0Tivoli shares sold in the 2015 financial year: 0Tivoli shares acquired in the 2015 financial year: 0
Contact detailsTivoli A/S, Vesterbrogade 3, DK-1630 Copenhagen V.
TUE KROGH-LUND
Born in 1971Head of Department.
Joined the Board of Directors at 1 August 2015.Elected by the Company’s employees.Term of office expires in 2018.
Particular expertise• Matters relating to operations and
services, including recycling and reuse. • Visitor services.
ShareholdingHolding of Tivoli shares at 31 December 2015: 0Tivoli shares sold in the 2015 financial year: 0Tivoli shares acquired in the 2015 financial year: 0
Contact detailsTivoli A/S, Vesterbrogade 3, DK-1630 Copenhagen V.
MARIA FERGADIS
Born in 1979F&B Manager.
Joined the Board of Directors in 2010.Elected by the Company’s employees.Resigned from the Board at 31 July 2015.
Particular expertise• Visitor services and development of
new Tivoli concepts.
ShareholdingHolding of Tivoli shares at 31 December 2015: 0Tivoli shares sold in the 2015 financial year: 0Tivoli shares acquired in the 2015 financial year: 0
9

❖ TIVOLI ANNUAL REPORT 2015 ❖
EXECUTIVE BOARD
CEO
Lars LiebstBorn in 1956Appointed CEO in 1996.
• Chairman of the Board of Directors of TV2.• Chairman of the special tourism committee of the
Confederation of Danish Industry.• Chairman of a committee monitoring major cultural
projects.• Member of the Board of Directors of the Schackenborg
Foundation. • Member of Det Nationale Turismeudvalg
(the Danish tourism committee).
ShareholdingHolding of Tivoli shares at 31 December 2015: 15Tivoli shares sold in the 2015 financial year: 0Tivoli shares acquired in the 2015 financial year: 0
CFO
Andreas MorthorstBorn in 1980Appointed CFO in 2015.
ShareholdingHolding of Tivoli shares at 31 December 2015: 0Tivoli shares sold in the 2015 financial year: 0Tivoli shares acquired in the 2015 financial year: 0
CFO
Claus Dyhr (resigned at 31 August 2015)Born in 1967Appointed CFO in 2008.
ShareholdingHolding of Tivoli shares at 31 December 2015: 10Tivoli shares sold in the 2015 financial year: 0Tivoli shares acquired in the 2015 financial year: 0
COMMERCIAL DIRECTOR
Elisabeth Milton HemmingsenBorn in 1967Appointed Commercial Director in 2015.
ShareholdingHolding of Tivoli shares at 31 December 2015: 0Tivoli shares sold in the 2015 financial year: 0Tivoli shares acquired in the 2015 financial year: 0
VICE PRESIDENTS
VICE PRESIDENT, BRAND & COMMUNICATIONS
Dorthe W. BarsøeBorn in 1966Appointed in 2006.
VICE PRESIDENT, SALES & SERVICE
Frans FossingBorn in 1967Appointed in 2009.
VICE PRESIDENT, CULTURE
Nikolaj KoppelBorn in 1969Appointed in 2015.
VICE PRESIDENT, COMMUNICATIONS & ENTERTAINMENT
Stine Lolk (resigned at 31 January 2015)Born in 1972Appointed in 2002.
VICE PRESIDENT, OPERATIONS, SECURITY & SERVICE
Mogens C. RamsløvBorn in 1963Appointed in 2010.
10

❖ BOARD OF DIRECTORS, EXECUTIVE BOARD AND VICE PRECIDENTS ❖
THE BOARD’S WORKThe Board of Directors ensures that the Executive Board observes the objectives, strategies, policies, etc adopted by the Board of Directors. The Executive Board briefs the Board of Directors systematically at meetings and by written and verbal reporting. The reporting includes matters concerning the financial position, profitability, development and circumstances of relevance to the surrounding world.
The Board of Directors meet at least four times a year and as required. In 2015 five board meetings were held.
Board meetings held in 201523 March 201527 April 201515 August 201530 October 20159 December 2015
Board meetings scheduled for 201616 March 201618 April 201615 August 201627 October 20169 December 2016
The Board of Directors is briefed in writing on a conti-nuous basis on the Group’s operations and position and on risks in key areas. In addition to decisions on impor-tant operational matters, the Board of Directors makes decisions on the size and composition of the capital base, long-term obligations, significant policies and audit issues.
The Board of Directors reviews, adjusts and approves its rules of procedure on an annual basis, determining requirements in terms of the reporting to be made to the Board of Directors and communication in general between the two management bodies.
The Chairman and Deputy Chairman of the Board of Directors make up the Chairmanship responsible for, among other things, planning the meetings of the Board of Directors in cooperation with the Executive Board. The responsibilities of the Chairman and, in his absence, the Deputy Chairman are determined in the rules of procedure.
The Board of Directors evaluates the work, performance and composition of the Board of Directors and the Executive Board on an annual basis. At the same time, cooperation between the Board of Directors and the Executive Board is evaluated. The Board of Directors assesses annually whether there is reason to update or strengthen its members’ competences considering the tasks to be undertaken. Moreover, the Board of Directors determines annually its key tasks in relation to the continuous evaluation of the Executive Board’s work and the financial and managerial control of the Group.
Tivoli wants to promote diversity and to create equal opportunities for everyone, irrespective of gender, age, ethnicity as well as political and religious beliefs. In that connection, Tivoli targets a balanced gender distribution among its staff. Tivoli considers strong representation by both genders at management levels a strength, adding value to the Company’s business and its development.
In 2013 Tivoli therefore prepared a policy for the underrepresented gender with a view to ensuring a balance between the number of men and women at all management levels, which is in accordance with section 99b of the Danish Financial Statements Act. The Company thus pursues a target of a minimum representation of both men and women of 33% at top management levels, ie the Board of Directors, the Executive Board and the Senior Management Team, by 2017.
The calculated numbers of male and female members, respectively, are rounded down to the nearest whole number. The same applies to the target, ie a target of 33% for a Board of Directors with four members elected by the general meeting implies that there must be at least one member of one gender and three members of the other gender in order for the target to be met.
Board of Directors The Board of Directors has four members elected by the general meeting, including one woman. The target has thus been met.
Executive BoardAt 1 January 2016, the Executive Board has three members, including one woman. The target has thus been met.
Vice PresidentsIn 2015 the Senior Management Team comprised four and five vice presidents, respectively, as one resigned at the beginning of the year. Two, and later one, of the five, and later four, vice presidents were women, which means that the target was met throughout the period.
For the time being, the Board of Directors has four members elected by the shareholders at the general meeting as well as two members elected by the employees according to the Danish rules on employee representation at board level. The members elected by the shareholders are elected for a term of one year, and the mandatory retirement age is 70. In accordan-ce with Danish legislation, the members elected by the employees are elected for a term of four years.
Tivoli’s complete policy for the underrepresented gender is available on http://www.tivoli.dk/en/om/virksomheden/aktionaerinformation/
11

❖ TIVOLI ANNUAL REPORT 2015 ❖
❖
Tivoli’s Management emphasises corporate governance, and corporate governance is continuously discussed by Tivoli’s Board of Directors.
In 2014 the Committee on Corporate Governance issued updated Recommendations for corporate governance. As previously, the recommendations are based on a “comply or explain” principle, which makes it legitimate for a company either to comply with the recommendations or explain why it does not comply. In April 2014, the European Commission issued a recommendation on the quality of corporate gover-nance reporting. Based on the recommendation, the Committee encourages companies to make supplementary disclosures in respect of the recom-mendations which are considered particularly important to the Company’s shareholders. In light of the fact that Tivoli complies with all of the Committee’s recommendations, except for recommendation 3.4.2., the following supplementary disclosure is made:
Recommendation 3.4.2 points out that a majority of the members of a board committee should be independent members. On Tivoli’s Board of Directors, several committees consist of the full Board of Directors. At the same time, the full Board of Directors, including members elected by the employees, consists of six members, two of four members elected by the general meeting being dependent and the members elected by the employees also being considered dependent as they are employed by Tivoli. Thus, Tivoli does not comply with recommendation 3.4.2. A detailed description of Tivoli’s position on all corporate governance recommendations, in accordance with section 107b of the Danish Financial Statements Act, is available on www.tivoli.dk/en/om/virksomheden/aktionaerinformation/
INTERNAL CONTROLS AND RISK MANAGEMENT RELATING TO FINANCIAL REPORTING
The Board of Directors and the Executive Board have overall responsibility for the Company’s risk manage-ment and internal controls relating to the financial reporting process.
CONTROL ENVIRONMENT
The Board of Directors and the Executive Board determine and approve general policies, procedures and controls in key areas relating to the financial reporting process. This is based on a clear organisa-tional structure, clear reporting lines, authorisation and approval procedures as well as segregation of duties.
Written guidelines have been prepared for book-keeping, budgeting and month-end procedures, including reconciliations and preparation of the regular financial reporting.
Moreover, policies for approval of invoices and other expenditure vouchers have been established so as to ensure due approval.
RISK ASSESSMENT
The Board of Directors and the Executive Board perform an annual overall risk assessment of the financial reporting process with a view to identifying the most significant and risky areas.
The determination of certain items in the financial statements requires estimate and judgment on the part of Management. These items are given special attention in connection with the risk assessment and are described in note 2 to the Annual Report.
STATUTORY REPORT ON CORPORATE GOVERNANCE
12
❖ STATUTORY REPORT ON CORPORATE GOVERNANCE ❖
CONTROL ACTIVITIES
The Group’s internal controls focus on the significant and risky areas identified.
A number of control activities have been established in order to prevent, detect and correct any errors, misstatements and irregularities thus ensuring that the financial reporting is correct and complete.
The Executive Board has prepared minimum require-ments for controls covering the most significant and risky items. These controls have been compiled in a control catalogue submitted to the Board of Directors. The purpose of the control catalogue is to increase the efficiency of the control environment and to ensure an adequate basis for the Board of Directors’ monitoring of the Group’s internal control and risk management systems.
Access to bookkeeping and accounting systems is restricted to relevant functions, and due segregation of duties has been ensured in the accounts department and other departments that supply data for the financial statements. Controls relating to IT applications and IT general controls ensure that financial data are not lost.
The Executive Board’s monthly budget control meetings with all main area managers allow the Board to detect and correct any errors, misstatements and irregularities of the financial reporting at an early stage.
INFORMATION AND COMMUNICATION
The Company’s guidelines of relevance to the financial reporting process are available on the intranet to which all employees have access. Major changes to these guidelines will be communicated directly to all officers with financial responsibility.
MONITORING
All employees with control-related responsibilities report currently to the Executive Board on the execution and documentation of controls. Any control failure or non- compliance with established guidelines are reported currently to the Executive Board which follows up.
A summary of the above reporting is submitted to the Board of Directors at least on an annual basis.
STATUTORY REPORT ON CORPORATE GOVERNANCE
13

Mill
ion
gues
ts
1. quarter 2. quarter 3. quarter 4. quarter
0.2
0.4
0.6
0.8
1.0
1.4
1.2
1.6
20152014
0
❖ TIVOLI ANNUAL REPORT 2015 ❖
❖
FINANCIAL REVIEW FUTURE PLANS FOR TIVOLI
Total attendance figures for 2015 aggregated 4,733,000 visitors compared to 4,478,000 visitors in 2014 (+6%). The increase in the number of visitors is due to the Gardens being open for more days. Quarterly visitor figures are as follows:
• Q1 2015: 119,000 visitors compared to 81,000 visitors in 2014 (+47%)
• Q2 2015: 1,441,000 visitors compared to 1,349,000 visitors in 2014 (+7%)
• Q3 2015: 1,592,000 visitors compared to 1,518,000 visitors in 2014 (+5%)
• Q4 2015: 1,581,000 visitors compared to 1,530,000 visitors in 2014 (+3%)
Consolidated revenue for 2015 amounted to DKK 955.2 million compared to DKK 861.9 million for 2014 (+11%). The increase is primarily due to the Gardens being open for more days in 2015, impressive attendance figures of above 4.7 million as well as many activities in off-season periods.
Expenses excluding depreciation, amortisation and impairment amounted to DKK 792.2 million compared to DKK 715.9 million for 2014 (+10%). The increased expenses are primarily due to a higher activity level.
Depreciation, amortisation and impairment amounted to DKK 94. 0 million compared to DKK 84.4 million in 2014 (+11%). Depreciation, amortisation and impairment for 2015 included special expenses relating to impair-ment of the buildings at the corner of Vesterbrogade and Bernstorffsgade as these buildings will be demolished in 2016.
Earnings before interest, tax, depreciation and amorti-sation (EBITDA) amounted to DKK 163.3 million compared to DKK 146.0 million for 2014 (+12%). Net financials showed an expense of DKK 4.9 million compared to DKK 5.2 million in 2014. The lower level of expenses is primarily due to continuous repayment of debt.
Profit before tax for 2015 amounted to DKK 64.1 million compared to DKK 56.4 million for 2014 (+14%). Adjusted for special items (DKK 12.2 million), including impairment and special several payments, profit before tax showed a 35% increase on 2014.
Tax on profit for the year amounted to DKK 20.3 million compared to DKK 12.0 million for 2014.
The high tax for 2015 is due to non-recognition of deferred tax on foreign activities for the year.
Profit after tax for 2015 amounted to DKK 43.8 million, corresponding to the 2014 level of DKK 44.4 million.
Profit before tax for the year corresponds to the upward adjustment to a profit before tax of between DKK 60 and 65 million announced by Tivoli in the Stock Exchange Announcement of 14 January 2016.
Investments in property, plant and equipment for the year amounted to DKK 92.1 million. In 2015, investments were made in, among other things, the Fatamorgana, a new 3-in-1 ride which will open in 2016, and the renovation of the restaurant Fru Nimb. Substantial investments were made during the year to extend the useful lives of existing rides and buildings and to landscape the Gardens etc.
The Group’s assets amounted to DKK 1,044.1 million at 31 December 2015 compared to DKK 1,031.7 million at 31 December 2014. The increase is primarily due to higher cash at bank and in hand. The equity share of the balance sheet total (solvency ratio) represented 70%, which is slightly higher than at 31 December 2014.
The Board of Directors proposes distribution of dividend of 25% of the profit after tax for the year, corresponding to DKK 11.0 million or 5% of the nominal share capital, compared to dividend in 2014 of DKK 11.1 million, or 5% of the nominal share capital. The remaining profit will be allocated to the Group’s distributable reserves.
GUESTS
14

FINANCIAL REVIEW
❖
FUTURE PLANS FOR TIVOLI
In 2016, Tivoli visitors can look forward to the premiere of the musical Hairspray, featuring a huge cast including some of Denmark’s best dancers and singers. Nanna Rossen, selected through large-scale open auditions, takes the lead role of Tracy, the chubby teenager who wants to dance on television.
The Pantomime Theatre premieres Cinderella, a new artistic partnership between choreographer Yuri Possokhov, musician Oh Land and set designer Queen Margrethe.
The Glass Hall Theatre will once again house the summer revue featuring a strong team of performers.
On the musical side of things, Tivoli’s new music strategy will be rolled out, including a musical camel trail for children and new music features with the Tivoli Ensemble.
Moreover, the Dragon will be replaced by the Fatamorgana, a 3-in-1 ride that will delight both young children and speed demons. Tivoli is world-first with this 45-metre tower.
The Tivoli Corner is now under construction at the corner of Vesterbrogade and Bernstorffsgade. Tivoli’s plans to build Tivoli Centre in Tietgensgade to house the music and ballet school were rejected by the City of Copenhagen’s Technical and Environment Committee. The project is now being reworked with a view to adjusting the architectural expression.
❖ FUTURE PLANS FOR TIVOLI ❖
www.tivoligardens.com/en/om/virksomheden/aarsrapporter/2015
READ ABOUT 2015 IN RETROSPECT
15

❖ TIVOLI ANNUAL REPORT 2015 ❖
Tivoli’s CSR policy focuses extensively on the environ-ment and the working environment as is the case in many other organisations.But it also contains certain points that are unique to Tivoli, such as the topic named cultural historical awareness. Under this title, Tivoli reports on the expenditure on culture at Tivoli and expenditure on maintenance of the historical infrastructure. We do this to emphasise how highly we prioritise traditions and our cultural heritage. In 2015, the accounts for culture at Tivoli show a deficit of DKK 55.5 million, while DKK 41.5 million was spent on maintaining the historical infrastructure.
Tivoli is perhaps also slightly different to other organisations when it comes to charity and other social contributions. Every year, a large number of tickets and multi-ride tickets are donated to under-privileged children. Tickets and multi-ride tickets equating to DKK 1.1 million were donated in 2015.
During Christmas at Tivoli, one of Tivoli’s contributions was of an entirely different nature. Danish school-children from the Google CS First project were tasked with creating one of Tivoli’s new illumination experien-ces, four large banners in the Boulevard area. In partnership with MIT (Massachusetts Institute of Technology) Scratch, a programming language, the children coded the themes to be displayed on the banners.
In a completely different area, Tivoli entered into a partnership with bybi.dk regarding beekeeping on the roof of the Concert Hall. Tivoli’s wealth of flowers and plants are a treat for the bees, and the honey produced by the swarms is sold and used at Nimb. www.tivoligardens.com/en/om/virksomheden/aarsrapporter/2015
MEASURED AGAINST 2013.
THE TARGET IS TO REDUCE ELECTRICITY CONSUMPTION FROM
2014 TO 2016 BY ANOTHER
10%
❖
CORPORATE SOCIAL RESPONSIBILITY
INCANDESCENT AND HALOGEN BULBS IN TOTAL HAVE NOW BEEN REPLACED BY LED BULBS, RESULTING IN TOTAL
ELECTRICITY SAVINGS OF 854,562 KWH.
31,771
16

Tivoli OMXC20
-400
2,100 2,600 3,100 3,600 4,100
12-3
1-20
14
12-3
1-20
15
12-3
1-20
10
12-3
1-20
11
12-3
1-20
12
12-3
1-20
13
1,600 1,100
600 100
300
500
400
600
700
800
900
1000
1100
❖ SHAREHOLDER INFORMATION ❖
CORPORATE SOCIAL RESPONSIBILITY
❖
SHAREHOLDER INFORMATION
Tivoli A/S is listed on Nasdaq OMX Copenhagen. At 31 December 2015, the share capital amounted to DKK 57.2 million distributed on 571,666 shares of DKK 100. Each share amount of DKK 100 carries one vote. At 31 December 2015, the market price of 3,821 correspon-ded to a market capitalisation of DKK 2.2 billion. At 31 December 2014, the market price of 3,038 correspon-ded to a market capitalisation of DKK 1.7 billion.
Shareholders with a shareholding registered to their name with a nominal value of at least DKK 1,000 receive an annual card to Tivoli. The annual card entitles the holder and one companion to free admission to Tivoli in all Tivoli seasons. The entitlement to an annual card is decided upon by the Board of Directors for one year at a time. The Board of Directors currently assesses the Group’s capital and share structure. The share structure comprises solely A shares, and there are no plans of changing this structure. Moreover, the existing capital structure is considered adequate for the current business foundation.
SHARE PRICE DEVELOPMENT
The following chart shows the price development in the period from 31 December 2010 to 31 December 2015 compared with the OMXC20:
DIVIDEND POLICY AND DIVIDEND
The Board of Directors has established a general policy for payment of dividend. It is the intention that, in normal investment years, dividend corresponding to 25% of the consolidated profit after tax be distributed. In years when investments are particularly high, the Board of Directors may decide that the dividend should deviate from the policy.
Tivoli A/S’ profit after tax for 2015 amounted to DKK 43.8 million compared to DKK 44.4 million in 2014. The Board of Directors recommends to the Annual General Meeting distribution of dividend of 25% of the profit after tax for the year, corresponding to DKK 11.0 million compared to DKK 11.1 million last year. The remaining profit of the Group will be allocated to the Group’s distributable reserves as the Group is also expecting a high level of investments in the coming years.
SHAREHOLDERS
At 31 December 2015, Tivoli had 19,459 registered shareholders. According to the Group’s register of shareholders, shareholdings in excess of 5% break down as follows:
Skandinavisk Holding A/S, Søborg, Denmark 31.8%Chr. Augustinus Fabrikker Aktieselskab, Copenhagen, Denmark 25.4%
STOCK EXCHANGE ANNOUNCEMENTS
Attendance 2014 5 January 2015Upward Adjustment of Anticipated Profit for the Year 2014 9 January 2015Announcement of 2014 Annual Report 23 March 2015Correction to 2014 Annual Report of Tivoli 24 March 2015Annual General Meeting of Tivoli A/S 30 March 2015Interim Report for the Period 1 January – 31 March 2015 27 April 2015Tivoli A/S - Minutes of the Annual General Meeting 2015 27 April 2015Replacement of CFO 16 June 2015Replacement of Employee Representative 3 August 2015Interim Report for the Period 1 January – 30 June 2015 15 August 2015Attendance, Summer Season 2015 21 September 2015Interim Report for the Period 1 January – 30 September 2015 30 October 2015Attendance, Halloween at Tivoli 2 November 2015Financial Calendar 24 November 2015Attendance 2015 4 January 2016Upward Adjustment of Expected Earnings for the Year 2015 14 January 2016
17

❖ TIVOLI ANNUAL REPORT 2015 ❖
QUARTERLY RESULTS
20112012201320142015DKK million
SHARE AND DIVIDEND RATIOS Average number of shares (1,000) 571.7 571.7 571.7 571.7 571.7Earnings in DKK, per share of DKK 100 (EPS) 76.6 77.7 64.7 54.9 42.9 Cash flows from operating activitiesin DKK per share (CFPS) 259.2 292.5 284 168 205 Net asset value in DKK per share, end of year 1,272 1,211 1,158 1,098 1,057Share price in DKK, end of year 3,821 3,038 2,976 2,929 2,980 Dividend in DKK, per share of DKK 100 19.2 19.5 16.2 13.7 10.7 % payout ratio 25 % 25 % 25 % 25 % 25 %Price/earnings ratio (PE) 50 39 46 53 70 Price/cash flow (PCF) 15 10 10 17 15 Price/net asset value (P/NAV) 3.00 2.51 2.57 2.67 2.82
The share and dividend ratios have been calculated in accordance with the “Recommendations and Financial Ratios 2015” issued by the Danish Society of Financial Analysts, except for earnings per share (EPS) and diluted earnings per share (EPS-D) which have been calculated in accordance with IAS 33. The basis of accounting for all years is IFRS.
FINANCIAL CALENDAR
Annual Report 2015 16 March 2016 Interim Report (Q1 2016) 18 April 2016Annual General Meeting 18 April 2016Interim Report (H1 2016) 15 August 2016Interim Report (Q3 2016) 27 October 2016
INVESTOR RELATIONS (IR)
Tivoli aims at meeting the disclosure requirements of the Copenhagen Stock Exchange. Therefore, an-nouncements are filed with the Copenhagen Stock Exchange on a correct and timely basis and are released simultaneously at Tivoli’s website www.tivoli.dk/da/om/virksomheden. Further corporate infor-mation and all company announcements are accessi-ble at the website.
Inquiries on investor relations and the share market may also be addressed to the IR officer, Dorthe Weinkouff Barsøe, Vice President, Brand & Communications, e-mail: [email protected]
AMENDMENT OF ARTICLES OF ASSOCIATION
The Group’s Articles of Association may be amended by simple majority at a general meeting provided that the proposed amendment has been communicated to shareholders not later than two weeks before the date of the ordinary or extraordinary general meeting, and provided that 66.7% of the shares issued are represented at the general meeting.
CHANGE OF CONTROL CLAUSES
There are no agreements, rights, etc that will change in the event of a takeover bid.
If members of the Executive Board resign in connection with a takeover of the Group, there will be no payment other than the usual salary for a period of notice of 1.5 years to the Group CEO and 1 year to the Group CFO and the Group Commercial Director.
ANNUAL GENERAL MEETING (AGM)
The Group’s AGM will be held on Monday, 18 April 2016, at 13:00 at the Tivoli Concert Hall.
PROPOSED RESOLUTIONS FOR THE AGM
The Board of Directors proposes that the AGM authori-se the Board, for the period up until the next AGM, to have the Group acquire shares for treasury of up to 10% of the share capital at the current market price at the time of acquisition with a divergence of up to 10%.
The Board of Directors proposes a share split to the effect that each share of a nominal value of DKK 100 is split into 10 shares of a nominal value of DKK 10 each as well as an ensuing amendment of Article 4 of the Articles of Association.
The Board of Directors proposes amendment of the Company’s Articles of Association to the effect that the Company’s shares change from bearer shares to registered shares.
The Board of Directors proposes a DKK 15,000 increase of the basic fee to the members of the Board of Directors.
The Board of Directors proposes reappointment of PricewaterhouseCoopers as auditors.
18

❖ QUARTERLY RESULTS ❖
❖
QUARTERLY RESULTS
DKK million
Revenue incl tenants and lessees 332.1 486.7 369.8 122.6 353.1 439.2 356.9 94.8
Revenue 277.0 314.4 262.9 100.9 259.4 291.0 235.5 75.9 Net revenue 264.1 305.1 249.1 87.6 245.5 274.1 220.2 65.0 Expenses before depreciation. amortisation and impairment -209.1 -220.5 -218.3 -144.3 -199.0 -198.9 -197.8 -120.2 Earnings before interest, tax, depreciation and amortisation (EBITDA) 67.9 93.9 44.6 -43.4 60.4 92.1 37.8 -44.3 Depreciation. amortisation and impairment -28.0 -23.7 -21.5 -20.8 -20.5 -22.6 -21.1 -20.1 Earnings before interest and tax (EBIT) 39.8 70.2 23.1 -64.1 39.9 69.5 16.6 -64.4 Net financials -1.1 -1.1 -1.3 -1.4 -1.4 -1.2 -1.2 -1.4 Profit/loss before tax 38.8 69.1 21.8 -65.6 38.4 68.3 15.4 -65.8
Profit/loss for the period/year 24.4 51.5 17.4 -49.5 44.4 51.0 11.1 -49.7 Comprehensive income for the period/year 24.4 51.2 20.8 -50.5 40.0 9.0 -41.1 -50.9
Non-current assets 904.8 907.4 922.7 919.7 910.1 919.7 926.1 921.2 Current assets 139.3 101.8 111.4 99.3 121.6 95.2 101.4 92.1 Total assets 1,044.1 1,009.2 1,034.1 1,019.0 1,031.7 1,014.9 1,027.5 1,013.3 Share capital (Tivoli A/S) 57.2 57.2 57.2 57.2 57.2 57.2 57.2 57.2 Equity 727.4 702.8 651.6 642.1 692.6 661.6 611.5 610.9 Non-current liabilities 89.3 90.7 88.7 93.3 94.5 92.9 94.2 95.5 Current liabilities 227.4 215.7 293.9 283.6 244.5 260.4 321.8 306.9
Current assets 139.3 101.8 111.4 99.3 121.6 95.2 101.4 92.1 Invested capital 751.2 796.1 790.6 785.6 -46.7 14.5 -26.4 827.6 Investment in property, plant and equipment 28.2 5.9 24.4 33.6 8.4 15.4 26.0 34.8
Cash flows from operating activities 98.1 55.0 36.7 -41.6 96.5 51.9 62.5 -43.7 Cash flows from investing activities -28.2 -5.9 -24.4 -33.6 -26.1 -16.2 -7.6 -40.3 Hereof invested in property, plant and equipment -28.2 -5.9 -24.4 -33.6 -8.0 -15.4 -26.0 -34.8 Cash flows from financing activities -31.4 -59.7 -1.1 65.0 -69.3 -48.0 -22.4 69.6 Total cash flows 38.5 -10.6 11.2 -10.2 19.5 -12.2 14.0 -14.4
Q4 2015
Q3 2015
Q2 2015
Q1 2015
Q4 2014
Q3 2014
Q2 2014
Q1 2014
19

❖ TIVOLI ANNUAL REPORT 2015 ❖
INCOME STATEMENT 1 JANUARY - 31 DECEMBER
STATEMENT OF COMPREHENSIVE INCOME
Note
DKK million
REVENUE 4 Net revenue 905.9 804.8 897.3 801.2 5 Other operating income 49.3 57.1 49.3 57.1 955.2 861.9 946.6 858.3 EXPENSES 6 Other external expenses 371.0 346.7 375.8 335.8 7 Staff expenses 421.2 369.2 418.1 367.1 792.2 715.9 793.9 702.9 EBITDA 163.0 146.0 152.7 155.4 8 Depreciation, amortisation and impairment 94.0 84.4 93.7 84.2 EBIT 69.0 61.6 59.0 71.2
9 Financial income 0.4 0.9 0.9 1.0 10 Financial expenses 5.3 6.1 5.3 6.1 PROFIT BEFORE TAX 64.1 56.4 54.6 66.1 11 Tax on profit for the year -20.3 -12.0 -17.0 -15.3 NET PROFIT 43.8 44.4 37.6 50.8
12 EARNINGS PER SHARE Earnings in DKK, per share of DKK 100 (EPS) 76.6 77.7 - -
PROFIT FOR THE YEAR 43.8 44.4 37.6 50.8 Items subsequently recycled to income statement Value adjustments: Value adjustment hedging instruments 2.7 -5.8 2.7 -5.8 Other adjustments: Tax on value adjustments hedging instruments -0.6 1.4 -0.6 1.4 TOTAL COMPREHENSIVE INCOME 45.9 40.0 39.7 46.4
2015 2015GROUP PARENT COMPANY
2014 2014
20
❖ CASH FLOW STATEMENT ❖
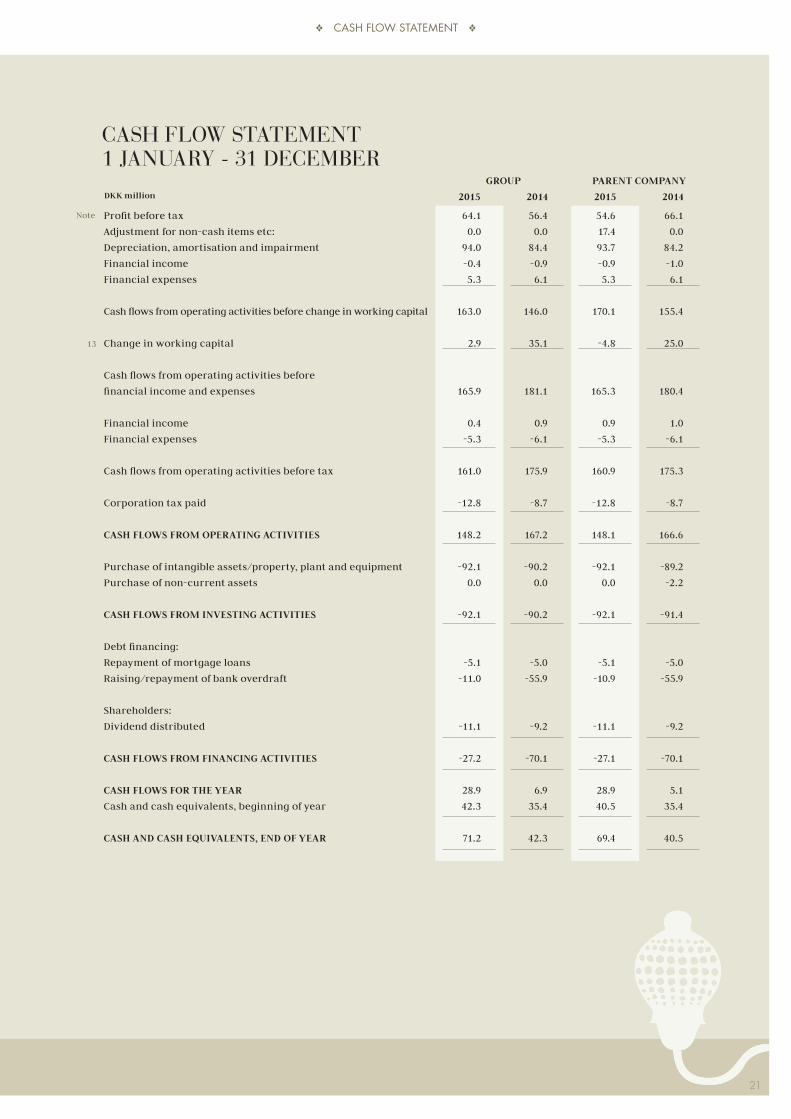
CASH FLOW STATEMENT 1 JANUARY - 31 DECEMBER
Note
DKK million
Profit before tax 64.1 56.4 54.6 66.1 Adjustment for non-cash items etc: 0.0 0.0 17.4 0.0 Depreciation, amortisation and impairment 94.0 84.4 93.7 84.2 Financial income -0.4 -0.9 -0.9 -1.0 Financial expenses 5.3 6.1 5.3 6.1 Cash flows from operating activities before change in working capital 163.0 146.0 170.1 155.4 13 Change in working capital 2.9 35.1 -4.8 25.0 Cash flows from operating activities before financial income and expenses 165.9 181.1 165.3 180.4 Financial income 0.4 0.9 0.9 1.0 Financial expenses -5.3 -6.1 -5.3 -6.1 Cash flows from operating activities before tax 161.0 175.9 160.9 175.3 Corporation tax paid -12.8 -8.7 -12.8 -8.7 CASH FLOWS FROM OPERATING ACTIVITIES 148.2 167.2 148.1 166.6 Purchase of intangible assets/property, plant and equipment -92.1 -90.2 -92.1 -89.2 Purchase of non-current assets 0.0 0.0 0.0 -2.2 CASH FLOWS FROM INVESTING ACTIVITIES -92.1 -90.2 -92.1 -91.4 Debt financing: Repayment of mortgage loans -5.1 -5.0 -5.1 -5.0 Raising/repayment of bank overdraft -11.0 -55.9 -10.9 -55.9 Shareholders: Dividend distributed -11.1 -9.2 -11.1 -9.2 CASH FLOWS FROM FINANCING ACTIVITIES -27.2 -70.1 -27.1 -70.1 CASH FLOWS FOR THE YEAR 28.9 6.9 28.9 5.1 Cash and cash equivalents, beginning of year 42.3 35.4 40.5 35.4 CASH AND CASH EQUIVALENTS, END OF YEAR 71.2 42.3 69.4 40.5
2015 2015GROUP PARENT COMPANY
2014 2014
21

❖ TIVOLI ANNUAL REPORT 2015 ❖
BALANCE SHEET AT 31 DECEMBERASSETS
Note
DKK million
NON-CURRENT ASSETS 14 INTANGIBLE ASSETS Rights 10.6 14.0 10.6 14.0 10.6 14.0 10.6 14.0 15 PROPERTY. PLANT AND EQUIPMENT Land and buildings 604.3 627.7 604.3 627.7 Other fixtures and fittings. tools and equipment 228.0 251.9 227.5 251.1 Assets under construction and prepayments for property. plant and equipment 61.9 13.2 61.9 13.2 894.2 892.8 893.7 892.0 OTHER NON-CURRENT ASSETS 16 Investments in subsidiaries - - 0.0 2.2 17 Deferred tax assets 0.0 3.3 0.0 0.0 0.0 3.3 0.0 2.2 TOTAL NON-CURRENT ASSETS 904.8 910.1 904.3 908.2 CURRENT ASSETS 18 Finished goods 8.9 9.6 8.9 9.6 19 Trade receivables 31.2 36.8 31.2 36.8 Receivables from subsidiaries 0.0 0.0 2.7 9.8 Other receivables 17.6 22.0 16.9 21.1 20 Prepayments 8.6 9.4 8.2 9.4 Deposits 1.8 1.5 1.6 1.5 Cash at bank and in hand 71.2 42.3 69.4 40.5 TOTAL CURRENT ASSETS 139.3 121.6 138.9 128.7 TOTAL ASSETS 1,044.1 1,031.7 1,043.2 1,036.9
2015 2015GROUP PARENT COMPANY
2014 2014
22

BALANCE SHEET AT 31 DECEMBERLIABILITIES AND EQUITY
Note
DKK million
EQUITY 21 Share capital 57.2 57.2 57.2 57.2 Reserves 659.2 624.3 659.2 630.7 716.4 681.5 716.4 687.9 Proposed dividend 11.0 11.1 11.0 11.1 TOTAL EQUITY 727.4 692.6 727.4 699.0
LIABILITIES NON-CURRENT LIABILITIES 22 Non-current debt 60.3 65.5 60.3 65.5 17 Deferred tax liabilities 29.0 29.0 29.0 29.0 TOTAL NON-CURRENT LIABILITIES 89.3 94.5 89.3 94.5 CURRENT LIABILITIES 22 Current debt 5.1 5.1 5.1 5.1 Bank overdraft 0.0 11.0 0.0 10.9 Trade payables 37.8 25.9 37.5 25.5 Corporation tax payable 10.6 5.8 10.6 5.8 23 Other payables 111.2 102.0 110.6 101.3 24 Deferred income 62.7 94.8 62.7 94.8
TOTAL CURRENT LIABILITIES 227.4 244.6 226.5 243.4
TOTAL LIABILITIES AND EQUITY 1,044.1 1,031.7 1,043.2 1,036.9
25 Contingent liabilities and security, etc 26 Financial risks 27 Cash flow hedges 28 Hedge transactions recognised directly in equity 29 Capital resources 30 Related party transactions
❖ BALANCE SHEET AT 31 DECEMBER ❖
2015 2015GROUP PARENT COMPANY
2014 2014
23

❖ TIVOLI ANNUAL REPORT 2015 ❖
STATEMENT OF CHANGES IN EQUITY
Share capital
Share capital
Retained earnings
Retained earnings
Proposed dividend
Proposed dividend
Total
Total
Reserves
Reserves
Hedgetrans-
actions1)
Hedgetrans-
actions1)
GROUPDKK million
PARENT COMPANYDKK million
EQUITY AT 1 JANUARY 2014 57.2 -12.3 607.7 9.2 661.8
Changes in equity in 2014 Comprehensive income for the year 0.0 -4.4 33.3 11.1 40.0 Total comprehensive income 0.0 -4.4 33.3 11.1 40.0 Dividend distributed 0.0 0.0 0.0 -9.2 -9.2 Total changes in equity in 2014 0.0 -4.4 33.3 1.9 30.8
Equity at 31 December 2014 57.2 -16.7 641.0 11.1 692.6
EQUITY AT 1 JANUARY 2015 57.2 -16.7 641.0 11.1 692.6
Changes in equity in 2015 Comprehensive income for the year 0.0 2.1 32.8 11.0 45.9 Total comprehensive income 0.0 2.1 32.8 11.0 45.9 Dividend distributed 0.0 0.0 0.0 -11.1 -11.1 Total changes in equity in 2015 0.0 2.1 32.8 -0.1 34.8 EQUITY AT 31 DECEMBER 2015 57.2 -14.6 673.8 11.0 727.4
EQUITY AT 1 JANUARY 2014 57.2 -12.3 607.7 9.2 661.8
Changes in equity in 2014 Comprehensive income for the year 0.0 -4.4 39.7 11.1 46.4 Total comprehensive income 0.0 -4.4 39.7 11.1 46.4 Dividend distributed 0.0 0.0 0.0 -9.2 -9.2 Total changes in equity in 2014 0.0 -4.4 39.7 1.9 37.2
Equity at 31 December 2014 57.2 -16.7 647.4 11.1 699.0
EQUITY AT 1 JANUARY 2015 57.2 -16.7 647.4 11.1 699.0
Changes in equity in 2015 Comprehensive income for the year 0.0 2.1 26.5 11.0 39.6 Total comprehensive income 0.0 2.1 26.5 11.0 39.6 Dividend distributed 0.0 0.0 0.0 -11.1 -11.1 Total changes in equity in 2015 0.0 2.1 26.5 -0.1 28.5 EQUITY AT 31 DECEMBER 2015 57.2 -14.6 673.8 11.0 727.4
1) Note 28 discloses changes in "Hedge transactions recognised directly in equity".
DIVIDENDDividend of DKK 11.0 million is proposed (2014: DKK 11.1 million), corresponding to dividend per share of DKK 19.24 (2014: DKK 19.47).Dividend of DKK 11.1 million has been distributed during the year (2014: DKK 9.2 million).Distribution of dividend to the shareholders of Tivoli A/S has no tax implications to Tivoli A/S.
24

❖ NOTES ❖
❖
NOTES
NOTE 1 – ACCOUNTING POLICIES
Tivoli A/S is a limited company registered in Denmark. The Annual Report of Tivoli A/S for 2015 comprises the Consolidated Financial Statements of Tivoli A/S and its subsidiaries (the Group) as well as separate Parent Company Financial Statements. The Consolidated Financial Statements and the Parent Company Financial Statements of Tivoli A/S for 2015 are presented in accordance with the International Financial Reporting Standards as issued by the IASB and as adopted by the EU as well as additional Danish disclosure requirements for annual reports of listed companies.
ACCOUNTING POLICY CHANGES, INCLUDING PRESENATION AND IMPLEMENTATION OF INTERNATIONAL FINANCIAL REPORTING STANDARDS
The accounting policies of Tivoli A/S, including the presentation, remain unchanged from last year.
Implementation of new International Financial Reporting StandardsTivoli A/S has implemented the International Financial Reporting Standards as subsequently amended adopted by the IASB and the EU as well as the Interpretations effective for the 2015 financial year.
Annual improvements (2010-2012). The annual improve-ments involve a number of minor IFRS amendments:
IFRS 2: Clarification of the definitions of “vesting condition”, “performance condition” and “service condition”.
IFRS 3: It is clarified that an obligation to pay contingent consideration that meets the definition of a financial instrument is to be classified as a financial liability or equity under IAS 32.
IFRS 8: Disclosure of Management’s assessments required in connection with aggregation of operating segments.
IFRS 13: Clarification that short-term receivables and payables may be regarded as having a fair value at the balance sheet date which equals the invoice amount.
IAS 16 and IAS 38: Clarification of the presentation of the fixed-asset movement schedule where an entity uses a revaluation model for intangible assets or property, plant and equipment.
IAS 24: Where an entity provides key management services to another entity or its parent company, payments for these services will be comprised by the disclosure requirements for key management personnel compensation of the paying entity.
Annual improvements (2011- 2013). The annual improve-ments involve a number of minor IFRS amendments:
IFRS 1: It is clarified that an entity may choose to
adopt early a standard that has not yet become mandatory in its first IFRS financial statements.
IFRS 13: Clarification that the portfolio exception of IFRS 13 for measuring the fair value of a group of financial assets and liabilities on a net basis applies also to non-financial contracts comprised by IAS 39 and IFRS 7.
Tivoli A/S has assessed the effect of the new standards and interpretations. Tivoli A/S has concluded that all of the existing standards and interpretations effective for financial years beginning on 1 January 2015 are either not relevant to the Tivoli A/S Group or have no material effect on the Financial Statements of the Tivoli A/S Group.
NEWEST INTERNATIONAL FINANCIAL REPORTING STANDARDS (IFRS) AND INTERPRETATIONS (IFRIC) ADOPTED FOR IMPLEMENTATION IN SUBSEQUENT FINANCIAL PERIODS
The following amended financial reporting standards and interpretations which may be of relevance to the Tivoli A/S Group have been adopted by the IASB. The standards have future effective dates and will therefore be imple-mented in the Annual Reports as they become effective.
IAS 1: Amendments to IAS 1 in order to improve disclosure requirements under IFRS. The amendments relate to materiality, presentation of items and subtotals in the income statement and the balance sheet as well as the order of the notes.Annual improvements (2012- 2014). The annual improve-ments involve a number of minor IFRS amendments:
IFRS 5: Changed treatment upon reclassification of an asset from “held for sale” to “held for distribution” or vice versa.
IFRS 7: Added disclosure requirements concerning continuing involvement by way of contracts to continue servicing transferred customer contracts as well as disclosure of financial instruments in interim financial statements.
IFRS 34: Clarification of the meaning of references to information being disclosed elsewhere in the interim financial report.
IAS 27: Option of using the equity method in parent company financial statements.
Tivoli A/S has assessed the effect of the new standards and interpretations. Tivoli A/S has concluded that all of the existing standards and interpretations effective for financial years beginning on 1 January 2015 are either not relevant to the Tivoli A/S Group or have no material effect on the Financial Statements of the Tivoli A/S Group.
25

❖ TIVOLI ANNUAL REPORT 2015 ❖
The IASB has issued the following amendments to standards and new interpretations which may be relevant to Tivoli A/S, but which have not yet been adopted by the EU:
IFRS 9: “Financial Instruments”. The number of categori-es of financial assets is reduced to three, measured at: amortised cost, fair value through profit or loss and fair value through other comprehensive income. IFRS 9 requires entities which choose to measure financial liabilities at fair value (the fair value option) to present the part of the fair value change for the period which is attributable to changes in the entity’s own credit risk in other comprehensive income. IFRS 14: “Regulatory Deferral Accounts”. New common standard on regulatory assets (over-/understated) in utility entities upon transition to IFRS. The standard regulates only the transition to IFRS.IFRS 15 “Revenue from Contracts with Customers”. A new standard on revenue recognition that may potentially affect recognition of revenue in a number of areas, depending on the entity’s line of business, including:
The timing of revenue recognition; Recognition of variable consideration; Allocation of revenue in bundled arrangements
(contracts with several services); Recognition of revenue from licence rights; Up-front fees; Additional disclosure requirements.
The effect of the standard on the Annual Report of Tivoli A/S is being assessed. IFRS 10/IFRS 12/IAS 28: Amendments concerning invest-ment entities applying the exemption from consolidating subsidiaries. IFRS 10/IAS 28: Contribution of assets in jointly controlled entities and associates.
Tivoli A/S expects to implement the above-mentioned standards and interpretations as they become effective. It is Management’s assessment that the amended standards and interpretations will have no material effect on the Financial Statements for the coming financial years.
In addition to the above, the IASB has issued IFRS 16 “Leases”, which changes the rules on accounting treatment of operating leases by lessees. Going forward, operating leases are therefore to be recognised as an asset and a corresponding lease liability in the balance sheet. The standard has not yet been adopted by the EU and will be effective for financial years beginning on or after 1 January 2019. Tivoli expects to implement the standard when it becomes effective. Tivoli is in the process of assessing the effect of the standard, which cannot be determined at this time.
Basis of preparationThe Consolidated Financial Statements and the Parent Company Financial Statements are presented in DKK rounded off to DKK 1,000,000 to one decimal place. The Consolidated Financial Statements and the Parent Company Financial Statements are prepared under the historical cost convention. The accounting policies described below have been applied consistently for the financial year and for comparative figures. The accounting policies are unchanged from last year.
DESCRIPTION OF ACCOUNTING POLICIES
The Consolidated Financial Statements comprise the Finan - cial Statements of Tivoli A/S (the Parent Company) and enterprises in which the Group holds more than 50% of the votes or in which the Group otherwise exercises control.
The Consolidated Financial Statements are prepared by combining the Financial Statements of the Parent Company and the subsidiaries, eliminating intercompany income and expenses, share holdings, accounts and unrealised intercompany gains and losses. All Financial Statements included in the consolidation are prepared in accordance with the Group’s accounting policies.
Translation policies The Consolidated Financial Statements are presented in DKK. Transactions in foreign currencies are translated into the functional currency at the exchange rates at the dates of transaction. Gains and losses arising due to differences between the transaction date rates and the rates at the dates of payment are recognised in financial income and expenses in the income statement.
Receivables, payables and other monetary items in foreign currencies are translated into the functional currency at the exchange rates at the balance sheet date. Any differences between the exchange rates at the balance sheet date and the rates at the date of contracting the receivable or payable or the rates in the latest Annual Report are recognised in financial income and expenses in the income statement.Balance sheet items of foreign subsidiaries are translated into DKK at the exchange rates at the balance sheet date, whereas income statement items are translated at average exchange rates.
Derivative financial instrumentsDerivative financial instruments are initially recognised in the balance sheet at cost and are subsequently remeasured at their market value.
The market value of derivative financial instruments is recognised in other receivables or other payables. Positive and negative values are offset only where the Group has a right to and intention of settling several financial instru-ments on a net basis. Market values of derivative financial instruments are calculated on the basis of current market data and recognised valuation methods.
Changes in the market value of derivative financial instruments that are designated and qualify as market value hedges of a recognised asset or a recognised liability are recognised in the income statement as are any changes in the value of the hedged asset or the hedged liability related to the hedged risk.
Changes in the part of the market value of derivative financial instruments that is designated and qualifies as a hedge of future cash flows and which effectively hedges changes in the value of the hedged transaction are recognised in other comprehensive income. When the hedged transaction is realised, any gain or loss on such hedging transactions is transferred from other compre-hensive income and recognised in the same item as the hedged transaction.
26

❖ NOTES ❖
Changes to the market value of derivative financial instruments which do not qualify for hedge accounting are recognised in financial income and expenses in the income statement as they occur.
LeasesThe Group has not entered into any finance leases.Payments made under operating leases are recognised in the income statement on a straight-line basis over the lease term.
INCOME STATEMENT
RevenueRevenue comprises net revenue as well as other operating income, see definitions below.
Net revenueNet revenue comprises operating income by way of earnings from entrance fees to the Gardens, including earnings from the sale of annual passes, earnings from rides, rental income from buildings, premises, etc as well as earnings from the sale of services.
Income is recognised in the income statement provided that delivery and transfer of risk have been made before year end and provided that the income can be measured reliably and is expected to be received.
Where a service is delivered over several financial periods, such as earnings from the sale of annual passes, it is accounted for on an accruals basis.
Net revenue is measured at fair value exclusive of VAT and duties charged on behalf of third parties. All types of discounts granted are recognised in net revenue.
Revenue from cash games is presented net of prize payments and gaming taxes.
Other operating incomeOther operating income comprises items of a secondary nature to the activities of the enterprises, including projecting fees earned, sponsorships received and gains on the sale of intangible assets and property, plant and equipment.
Other external expensesOther external expenses comprise expenses for leasing of premises, office expenses, external cash handling, IT, legal assistance and consulting services.
Financial income and expensesFinancial income and expenses comprise interest, capital gains and losses on securities, payables and transactions in foreign currencies, amortisation of financial assets and liabilities as well as extra payments and repayment under the on-account taxation scheme, etc.
Tax on profit for the yearTivoli A/S is jointly taxed with other enterprises under Chr. Augustinus Fabrikker Aktieselskab, Copenhagen. The joint taxation implies that the enterprises are jointly and severally liable for payment of taxes under the joint taxation.
Tax for the year consists of current tax for the year and changes in deferred tax. The tax attributable to the profit
for the year is recognised in the income statement, whereas the tax attributable to equity transactions is recognised directly in equity.
BALANCE SHEET
Intangible assetsIntangible rights acquired upon business combinations are measured at cost less accumulated amortisation and im - pairment losses. Intangible rights are amortised on a straight- line basis over their expected useful life (up to 10 years).
Development projects are measured at cost.
Property, plant and equipmentLand and buildings as well as other fixtures and fittings, tools and equipment are measured at cost less accumula-ted depreciation and impairment losses. Cost comprises the cost of acquisition and expenses directly related to the acquisition up until the time when the asset is ready for use.
The cost of assets of own construction comprises direct and indirect expenses for materials, components, sub-con-tractors and labour. The cost of a total asset is decomposed into separate constituent parts which are depreciated separately if the individual parts have different useful lives.
Subsequent expenses, eg to replace parts of an item of property, plant and equipment, are recognised in the carrying amount of the asset in question when it is probable that payment will result in future economic benefits to the Group.
The carrying amount of the parts replaced is derecognised in the balance sheet and transferred to the income statement. Expenses for ordinary repair and maintenance are recognised in the income statement as incurred.
Property, plant and equipment are depreciated on a straight-line basis over the estimated useful lives of the assets, which are:
Buildings 20-50 yearsReconstruction of buildings 10-15 yearsSpecial installations 10 yearsRides, stationary 15-25 yearsRides, mobile 10 yearsGardens 5-10 yearsOutlets, stalls, etc 6-10 yearsTools, equipment and IT 3-6 years
Land is not depreciated.
The basis for depreciation is calculated taking into account the residual value of the asset and is reduced by any impairment losses.
The residual value is determined at the date of acquisition based on a specific assessment and is reassessed annually. Where the residual value exceeds the carrying amount of the asset, depreciation ceases.
In the event of changes to the depreciation period or the residual value, the effect on depreciation is recognised prospectively as a change of accounting estimate.
27

❖ TIVOLI ANNUAL REPORT 2015 ❖
It should be noted specifically that the physical life of Tivoli’s rides may be significantly longer than their entertainment life. Tivoli has chosen to depreciate the rides over their entertainment life.
Tivoli does not apply residual values for rides since most of the individual ride cannot be re-established without material changes to the constituent parts of the asset in case of dismantling of the ride.
Profits and losses on the disposal of property, plant and equipment are calculated as the difference between selling price less costs to sell and carrying amount at the time of sale. Profits or losses are recognised in the income statement under other operating income or other external expenses.
Investments in subsidiariesInvestments in subsidiaries are measured at cost in the Parent Company Financial Statements. If there is any indication of impairment, an impairment test is carried out. Where cost exceeds recoverable amount, the investment is written down to its lower recoverable amount.
Impairment of non-current assets The carrying amounts of non-current assets are reviewed on an annual basis to determine whether there is any indication of impairment. If so, the recoverable amount of the asset is calculated.
The recoverable amount is the higher of the fair value of the asset less estimated costs to sell and value in use. Value in use is calculated as the net present value of expected future cash flows from the asset or the cash-generating unit of which the asset forms part.
Impairment losses are recognised where the carrying amount of an asset or a cash-generating unit exceeds the recoverable amount of the asset or the cash-generating unit. Impairment losses are recognised in the income statement.
It is Tivoli’s assessment that the Group has only two measurable cash-generating units: the legal entity Tivoli A/S and the activities in Malta.
Impairment losses on non-current assets are reversed to the extent of any changes to the assumptions and estimates on which the impairment loss was based. Impairment losses are reversed only where the new carrying amount of the asset does not exceed the carrying amount that the asset would have had after depreciation if the asset had not been impaired.
InventoriesInventories are measured at cost calculated under the average cost method. Where net realisable value is lower than cost, inventories are written down to the lower value.
The cost of goods for resale comprises cost of purchase, transport and handling costs.
The net realisable value of inventories is calculated at selling price with deduction of costs to sell and is determined allowing for marketability, obsolescence and development in expected sales sum.
ReceivablesReceivables are measured at amortised cost. Provisions for bad debts are made.
PrepaymentsPrepayments comprise prepaid expenses relating to subse - quent financial years and are measured at amortised cost.
EquityProposed dividend is recognised as a liability at the time of adoption at the Annual General Meeting (the time of declaration). Dividend expected to be distributed for the year is disclosed as a separate equity item.
Current tax and deferred taxCurrent tax liabilities and receivables are recognised in the balance sheet at the amount calculated on the taxable income for the year adjusted for tax on taxable incomes for prior years.
Deferred tax is measured under the balance sheet liability method in respect of all temporary differences between the carrying amount and the tax base of assets and liabilities. However, deferred tax is not recognised in respect of items where temporary differences have arisen at the time of acquisition without affecting the profit for the year or the taxable income. In cases where the computation of the tax base may be made according to different tax rules, deferred tax is measured on the basis of Management’s intended use of the asset and settlement of the liability, respectively.
Deferred tax assets, including the tax base of tax loss carry-forwards, are recognised at the value at which they are expected to be realised, either by elimination in tax on future earnings or by set-off against deferred tax liabilities within the same legal tax entity and jurisdiction.
Deferred tax is measured on the basis of the tax rules and tax rates that will be effective under the legislation at the balance sheet date when the deferred tax is expected to crystallise as current tax. Changes to deferred tax due to changed tax rates are recognised in the income statement.
Financial liabilitiesMortgage loans and loans from credit institutions are recognised initially at the proceeds received net of transaction expenses incurred. Subsequently, the financial liabilities are measured at amortised cost using the “effective interest method”; the difference between the proceeds and the nominal value is recognised in financial expenses in the income statement over the loan period.
Other liabilities are measured at amortised cost.
Deferred incomeDeferred income comprises payments received in respect of income for subsequent years measured at amortised cost.
28

❖ NOTES ❖
Cash flow statementThe cash flow statement shows cash flows for the year broken down by operating, investing and financing activities, changes for the year in cash and cash equiva-lents as well as cash and cash equivalents at the beginning and end of the year.
Cash flows from operating activities are calculated under the indirect method as profit before tax adjusted for non-cash operating items, changes in working capital, interest paid and corporation tax paid.
Cash flows from investing activities comprise cash flows from business acquisitions and sales, acquisition and disposal of intangible assets, property, plant and equip-ment and other non-current assets.
Cash flows from financing activities comprise changes to the amount or structure of share capital and related expenses as well as cash flows from the raising of loans, repayment of interest-bearing debt as well as dividend distribution to shareholders.
Cash and cash equivalents comprise cash at bank and in hand.
Segment reportingAt Tivoli, management responsibility is divided on 13 main areas managed by Vice Presidents. Six of the main areas generate revenue, whereas the seven remaining main areas undertake administrative functions within eg IT, Finance, Marketing and HR as well as operation and maintenance of the Gardens. Only the first six main areas are considered reportable according to IFRS 8.
Depreciation, amortisation and financial expenses are not allocated to the main areas. Therefore “Profit before depreciation, amortisation and impairment” has been chosen as a performance measure in the segment reporting. Similarly, the balance sheet has not been broken down on main areas and therefore total assets per main area are not presented.
Financial ratiosEarnings per share (EPS) and diluted earnings per share (EPS-D) are calculated in accordance with IAS 33. Other ratios are calculated in accordance with the Recommendations and Financial Ratios 2015 issued by the Danish Society of Financial Analysts.
The financial ratios disclosed in the Annual Report have been calculated as follows:
PROFIT MARGIN Ebit x 100(EBIT-MARGIN) Revenue
SOLVENCY RATIO Equity at year end x 100 Total assets at year end
RETURN ON Net profit/loss x 100EQUITY Average equity
EARNINGS PER SHARE (EPS) Net profit/loss Average number of shares in circulation
CASH FLOW Cash flows from operating activitiesPER SHARE (CFPS) Average number of shares in circulation
NET ASSET VALUE Equity Number of shares
DIVIDEND PER SHARE Dividend rate x nominal value of share 100
PAYOUT RATIO Dividend distributed Profit/loss for analytical purposes
PRICE/EARNINGS RATIO Market price EPS
PRICE/CASH FLOW (PCF) Market price CFPS
SHARE PRICE/ Market priceNET ASSET VALUE (P/NAV) Net asset value
29

❖ TIVOLI ANNUAL REPORT 2015 ❖
NOTE 2 – ACCOUNTING ESTIMATES AND JUDGEMENTS
The uncertainty of estimates Calculation of the carrying amount of certain assets and liabilities requires estimates, judgements and assumptions with respect to future events.
The estimates and assumptions made are based on historical experience and other factors which Management deems justifiable in the circumstances, but which are inherently uncertain and unpredictable. The assumptions may be incomplete or inaccurate, and unexpected events or circumstances may arise. Furthermore, the Group is subject to risks and uncertainties which may lead to the actual results deviating from estimates. Particular risks to which the Group is subject are mentioned in Management’s Review and note 26 to the Financial Statements.
It may be necessary to change previous estimates due to changes in the circumstances on which the previous estimates were based or due to new knowledge or subsequent events.
Estimates which are material to the financial reporting are made by, among other means, calculating depreciation, amortisation and impairment, residual values, provisions as well as contingent liabilities and assets.
Accounting policiesAs part of its application of the Group’s accounting policies, Management makes judgements, in addition to estimates, which may materially affect the amounts recognised in the Annual Report.
In 2015, Management has made judgements regarding:
Residual valuesResidual values are determined at the time of acquisition based on a specific assessment. Management believes that the residual value of rental buildings can be determined as twice the minimum rental income.
In the case of temporary structures or buildings for which there are specific plans to make major changes, the residual value is determined at DKK 0. For the Nimb Building, the Concert Hall, the Glass Hall Theatre and the Pantomime Theatre, the residual values have been determined at DKK 104.0 million, DKK 52.0 million, DKK 10.0 million and DKK 3.0 million, respectively.
In Management’s assessment, as in previous years, residual values are not to be applied to the year’s new rides since most of the individual ride cannot be re-established without material changes to the constituent parts of the asset in case of dismantling of the ride.
Useful livesIn Management’s assessment, the physical life of Tivoli’s rides may be significantly longer than their entertainment life. Tivoli has chosen to depreciate the rides over their entertainment life because the rides will only be capable of generating positive net cash flows during their entertainment life.
30

"At Tivoli, management responsibility is divided on 13 main areas managed by Vice Presidents. Six of the main areas generate revenue, whereas the seven remaining main areas undertake administrative functions within eg IT, Finance, Marketing and HR as well as operation and maintenance of the Gardens. Only the first six main areas are considered reportable according to IFRS 8.
Expenses for administrative functions as well as operation and maintenance of the Gardens are not allocated to the other main areas. Entertainment bears the expenses for Friday Rock concerts, Garden orchestras, Pantomime shows and other events in the Gardens. Earnings from entrance fees are
recognised in Sales. Entertainment does not receive a share of earnings from entrance fees and is, viewed in isolation, a loss-making segment.
Food & Beverage operates Tivoli's own restaurants whereas High End operates the House of Nimb and Nimb Terrasse. Income from tenanted restaurants is allocated to Real Estate.Depreciation, amortisation and financial expenses are not allocated on to the main areas. Therefore “Profit before depreciation, amortisation and impairment” has been chosen as a performance measure in the segment reporting. Similarly, the balance sheet has not been broken down on main areas and therefore total assets per main area are not presented. "
NOTES TO INCOME STATEMENT
3 SEGMENT REPORTING
Games & Casino
Food & beverage High-End Real Estate
Sales and Sponsors
Enter- tainment Total
Not allocated TotalDKK million
Net revenue 106.4 153.8 129.4 68.5 399.3 48.7 906.1 -0.2 905.9Other operating income - 4.3 1.0 0.2 18.3 12.4 36.2 13.1 49.3
Total revenue 106.4 158.1 130.4 68.7 417.6 61.1 942.3 12.9 955.2
EBITDA 25.1 22.9 16.8 60.7 344.1 -55.5 414.1 -251.1 163.0
Depreciation, amortisation and impairment -94.0 -94.0 Net financials -4.9 -4.9Profit before tax 64.1
Not allocated comprises administrative functions as well as operation and maintenance of the Gardens. These functions have no business activities and generate only very limited revenue. In 2015 ”not allocated” includes DKK 1.8 million relating to invoicing of cleaning and refuse collection. Moreover, royalty income and invoicing of architects are included.
Net revenue 87.0 130.4 111.9 70.0 367.1 42.2 808.6 -3.8 804.8Other operating income 0.1 0.1 1.5 -0.1 21.2 10.9 33.7 23.4 57.1
Total revenue 87.1 130.5 113.4 69.9 388.3 53.1 842.3 19.6 861.9
EBITDA 12.8 17.8 16.8 64.8 314.3 -53.0 373.5 -227.5 146.0
Depreciation, amortisation and impairment -84.4 -84.4 Net financials -5.2 -5.2Profit before tax 56.4
Not allocated comprises administrative functions as well as operation and maintenance of the Gardens. These functions have no business activities and generate only very limited revenue. In 2014 ”not allocated” includes DKK 2.9 million relating to invoicing of cleaning and refuse collection. Moreover, royalty income and invoicing of architects are included.
SEGMENT REPORTING 2015 | GROUP
Games & Casino
Food & Beverage High-End Real Estate
Sales and Sponsors
Enter- tainment Total
Not allocated Total
❖ NOTES ❖
SEGMENT REPORTING 2014 | GROUP
31

❖ TIVOLI ANNUAL REPORT 2015 ❖
4 NET REVENUE
Net revenue broken down by type Sale of goods 264.6 225.8 Services 641.3 579.0 905.9 804.8
Net revenue broken down by geographic area Denmark 897.3 801.2 Malta 8.6 3.6 905.9 804.8
2015
2015 2015
GROUP
GROUP PARENT COMPANY
DKK million
2014
2014 2014
5 OTHER OPERATING INCOME Planning fees and contract work 7.0 5,9 7.0 5.9 Sponsorships 18.3 21,6 18.3 21.6 Royalty 7.6 9,6 7.6 9.6 Other 16.4 20,0 16.4 20.0 49.3 57,1 49.3 57.1
6 OTHER EXTERNAL EXPENSES Fee to auditors appointed at the general meeting: PricewaterhouseCoopers 1.0 1.0 0.7 1.0 1.0 1.0 0.7 1.0 Specified as follows: Audit 0.8 0.8 0.5 0.8 Tax consultancy 0.1 0.0 0.1 0.0 Other services 0.1 0.2 0.1 0.2 1.0 1.0 0.7 1.0
32

❖ NOTES ❖
GROUP PARENT COMPANY2015 2015DKK million 2014 2014
7 STAFF EXPENSES Wages and salaries 375.5 328.0 372.4 325.9 Defined contribution plans 26.1 22.7 26.1 22.7 Other social security expenses 7.0 7.1 7.0 7.1 Other staff expenses 12.6 11.4 12.6 11.4 421.2 369.2 418.1 367.1 Wages and salaries are net of value of own work performed on investments etc totalling 1.9 1,.6 1.9 1.6 Average number of employees 886 810 886 804 Remuneration of Board of Directors, Executive Board and senior executives: Board of Directors, Remuneration 1.4 1.4 1.4 1.4 1.4 1.4 1.4 1.4 Lars Liebst, CEO Salary including value of car 3.9 3.8 3.9 3.8 Bonus 4.4 4.2 4.4 4.2 Pension 0.6 0.5 0.6 0.5 8.9 8.5 8.9 8.5 Claus Dyhr, CFO (resigned at 31 August 2015) Salary including value of car 1.3 1.8 1.3 1.8 Bonus 1.4 2.0 1.4 2.0 Pension 0.1 0.2 0.1 0.2 Severance payment 4.3 0.0 4.3 0.0 7.1 4.0 7.1 4.0 Andreas Morthorst, CFO (appointed at 1 September 2015) Salary including value of car 0.5 0.0 0.5 0.0 Bonus 0.6 0.0 0.6 0.0 Pension 0.1 0.0 0.1 0.0 1.2 0.0 1.2 0.0 Elisabeth Milton Hemmingsen, Commercial Director Salary including value of car 1.7 0.0 1.7 0.0 Bonus 1.8 0.0 1.8 0.0 Pension 0.2 0.0 0.2 0.0 3.7 0.0 3.7 0.0 Total Executive Board Salaries 7.4 5.6 7.4 5.6 Bonus 8.2 6.2 8.2 6.2 Pension 1.0 0.7 1.0 0.7 Severance payment 4.3 0.0 4.3 0.0 20.9 12.5 20.9 12.5 Senior executives Salaries and wages 4.8 5.9 4.8 5.9 Bonus 1.4 1.3 1.4 1.3 Pension 0.4 0.6 0.4 0.6 6.6 7.8 6.6 7.8 Board of Directors, Executive Board and senior executives Remuneration, salaries and wages including value of car 13.6 12.9 13.6 12.9 Bonus 9.6 7.5 9.6 7.5 Pension 1.4 1.3 1.4 1.3 Severance payment 4.3 0.0 4.3 0.0 28.9 21.7 28.9 21.7 Senior executives are Tivoli's Vice Presidents (see page 10).
Other than performance-based bonus programmes for the Executive Board and senior executives, Tivoli A/S has no incentive programmes, such as share option programmes etc. Severance programmes of 1.5 years and 1 year respectively have been agreed upon for the Executive Board and there are no retention schemes. The basic fee paid to each member of the Board of Directors amounts to DKK 160,000. The Chairman of Tivoli's Board of Directors is remunerated by 3 times the basic fee, a total of DKK 480,000, and the Deputy Chairman by 1.75 times the basic fee, a total of DKK 280,000.
33

❖ TIVOLI ANNUAL REPORT 2015 ❖
DKK million
8 DEPRECIATION, AMORTISATION AND IMPAIRMENT Rights 3.3 3.2 3.3 3.2 Buildings, depreciation 34.0 31.3 34.0 31.3 Other fixtures and fittings, tools and equipment 7.9 0.0 7.9 0.0 Buildings, impairment 48.8 49.9 48.5 49.7 94.0 84.4 93.7 84.2 9 FINANCIAL INCOME Interest, cash and bank, etc 0.1 0.5 0.1 0.5 Interest, loan to subsidiary - - 0.5 0.1 Exchange gains 0.3 0.4 0.3 0.4 0.4 0.9 0.9 1.0 10 FINANCIAL EXPENSES Interest, credit institutions etc 4.9 5.6 4.9 5.6 Exchange losses 0.4 0.5 0.4 0.5 5.3 6.1 5.3 6.111 TAX ON PROFIT FOR THE YEAR Tax on profit for the year breaks down as follows: Current tax 17.6 10.9 17.6 10.9 Change in deferred tax for the year 3.0 -0.3 -0.3 3.0 Adjustment prior year tax, deferred tax 0.3 0.0 0.3 0.0 Total tax for the year 20.9 10.6 17.6 13.9 Tax recognised in equity -0.6 1.4 -0.6 1.4 Tax recognised in income statement 20.3 12.0 17.0 15.3 Tax on profit for the year is explained as follows: Calculated 23.5% tax on profit before tax 15.1 13.8 12.8 16.2 Tax effect of: Non-deductible expenses 0.1 0.1 4.2 0.1 15% addition on plant and machinery -0.3 -0.4 -0.3 -0.4 Unrecognised loss (foreign activities) 5.1 -0.9 0.0 0.0 Adjustment re prior year 0.3 0.0 0.3 0.0 Effect of tax reduction 0.0 -0.6 0.0 -0.6 20.3 12.0 17.0 15.3 Effective tax rate 31.7 % 21.3 % 31.1 % 23.1 % 12 EARNINGS PER SHARE Profit for the year 43.8 44.4 37.6 50.8
Average number of shares 571.666 571.666 571.666 571.666 Average number of treasury shares 0 0 0 0 Average number of shares in circulation 571.666 571.666 571.666 571.666 Earnings in DKK, per share of DKK 100 (EPS) 76.6 77.7 - -
13 CHANGE IN WORKING CAPITAL Change in receivables etc 10.5 -0.5 0.6 -9.4 Change in inventories 0.7 1.6 0.7 1.6 Change in trade payables, other payables. etc -8.3 34.0 -6.1 32.8 2.9 35.1 -4.8 25.0
NOTES TO CASH FLOW STATEMENT
2015 2015GROUP
GROUP
PARENT COMPANY
PARENT COMPANY
2014 2014
2015 20152014 2014
34

❖ NOTES ❖
Rights Rights 14 INTANGIBLE ASSETS Cost at 1 January 2015 28.4 28.4 Additions 0.0 0.0 Disposals 0.0 0.0 Cost at 31 December 2015 28.4 28.4 Amortisation and impairment at 1 January 2015 14.4 14.4 Amortisation 3.3 3.3 Disposals 0.0 0.0 Amortisation and impairment at 31 December 2015 17.8 17.8 Carrying amount at 31 December 2015 10.6 10.6 Cost at 1 January 2014 24.9 24.9 Additions 5.6 5.6 Disposals -2.1 -2.1 Cost at 31 December 2014 28.4 28.4 Amortisation and impairment at 1 January 2014 13.3 13.3 Amortisation 3.2 3.2 Disposals -2.1 -2.1 Amortisation and impairment at 31 December 2014 14.4 14.4 Carrying amount at 31 December 2014 14.0 14.0
15 PROPERTY. PLANT AND EQUIPMENT
Cost at 1 January 2015 1,122.2 564.5 13.2 Additions 0.0 0.0 90.2 Reclassification -0.1 0.1 0.0 Disposals 0.0 0.0 0.0 Transferred from assets under construction 18.6 24.8 -43.4 Addition, value of own work 0.0 0.0 1.9 Cost at 31 December 2015 1,140.7 589.4 61.9 Depreciation and impairment at 1 January 2015 494.5 312.6 0.0 Depreciation and impairment 41.9 48.8 0.0 Disposals 0.0 0.0 0.0 Depreciation and impairment at 31 December 2015 536.4 361.4 0.0
Carrying amount at 31 December 2015 604.3 228.0 61.9
Cost at 1 January 2014 1,108.7 551.1 24.5 Additions 0.0 1.0 82.0 Disposals -2.8 -66.2 0.0 Transferred from assets under construction 16.3 78.6 -94.9 Addition, value of own work 0.0 0.0 1.6 Cost at 31 December 2014 1,122.2 564.5 13.2 Depreciation and impairment at 1 January 2014 466.0 328.9 0.0 Depreciation and impairment 31.3 49.9 0.0 Disposals -2.8 -66.2 0.0 Depreciation and impairment at 31 December 2014 494.5 312.6 0.0 Carrying amount at 31 December 2014 627.7 251.9 13.2
Depreciated over 10-50 år 3-25 år 0.0
Reference is made to note 25 for details on security relating to property. plant and equipment.
NOTES TO BALANCE SHEET
Land and buildings
Other fixtures and fittings,
tools and equipment
Assets underconstruction
GROUP PARENT COMPANYDKK million
35

❖ TIVOLI ANNUAL REPORT 2015 ❖
2015
PARENT COMPANY
DKK million
2014 16 INVESTMENTS IN SUBSIDIARIES Cost at 1 January 2.2 0.0 Additions 0.0 2.2 Disposals -2.2 0.0 Cost at 31 December 0.0 2.2 Value adjustment at 1 January 0.0 0.0 Value adjustment for the year 0.0 0.0 Value adjustment at 31 December 0.0 0.0
Carrying amount at 31 December 2015 0.0 2.2 Name Place of reg. office TivoliCasino Holding Limited Malta 100 % 100 % TivoliCasino.com Limited Malta 0 % 100 %
In 2015 and 2014 the Tivoli Group comprises Tivoli A/S and the two above-mentioned companies. All companies are wholly owned.
OWNERSHIP OWNERSHIP
15 PARENT COMPANY
Cost at 1 January 2015 1,122.2 563.5 13.2 Additions 0.0 0.0 90.2 Reclassification -0.1 0.1 0.0 Disposals 0.0 0.0 0.0 Transferred from assets under construction 18.6 24.8 -43.4 Addition, value of own work 0.0 0.0 1.9 Cost at 31 December 2015 1,140.7 588.4 61.9 Depreciation and impairment at 1 January 2015 494.5 312.4 0.0 Depreciation and impairment 41.9 48.5 0.0 Disposals 0.0 0.0 0.0 Depreciation and impairment at 31 December 2015 536.4 360.9 0.0
Carrying amount at 31 December 2015 604.3 227.5 61.9
Cost at 1 January 2014 1,108.7 551.1 24.5 Additions 0.0 0.0 82.0 Disposals -2.8 -66.2 0.0 Transferred from assets under construction 16.3 78.6 -94.9 Addition, value of own work 0.0 0.0 1.6 Cost at 31 December 2014 1,122.2 563.5 13.2 Depreciation and impairment at 1 January 2014 466.0 328.9 0.0 Depreciation and impairment 31.3 49.7 0.0 Disposals -2.8 -66.2 0.0 Depreciation and impairment at 31 December 2014 494.5 312.4 0.0
Carrying amount at 31 December 2014 627.7 251.1 13.2
Depreciated over 10-50 år 3-25 år 0.0
Reference is made to note 25 for details on security relating to property, plant and equipment. At the balance sheet date, the Group has an obligation to construct a new asset of DKK 10.6 million.
Land andbuildings
Other fixtures and fittings,
tools and equipment
Assets underconstruction
17 DEFERRED TAX Deferred tax at 1 January 25.7 26.0 29.0 26.0 Adjustment prior year tax -0.3 0.0 -0.3 0.0 Deferred tax for the year recognised in profit for the year 3.6 -0.3 0.3 3.0 Deferred tax at 31 December 29.0 25.7 29.0 29.0
2015 2015
GROUP PARENT COMPANY
2014 2014
(CONTINUED)
36

❖ NOTES ❖
GROUP
GROUP
GROUP
PARENT COMPANY
PARENT COMPANY
PARENT COMPANY
2015
2015
2015
2015
2015
2015
DKK million
2014
2014
2014
2014
2014
2014 19 TRADE RECEIVABLES Rent receivables 11.9 21.8 11.9 21.8 Miscellaneous receivables 19.3 15.0 19.3 15.0 31.2 36.8 31.2 36.8 Trade receivables fall due for payment as follows: Not due 20.2 19.2 20.2 19.2 Less than 60 days overdue 5.7 15.9 5.7 15.9 Between 61 and 120 days overdue 3.4 2.1 3.4 2.1 Between 121 and 180 days overdue 0.1 0.8 0.1 0.8 More than 180 days overdue 3.8 1.3 3.8 1.3 Carrying amount at 31 December 33.2 39.3 33.2 39.3
Provisions for bad debts have developed as follows: Provisions at 1 January 2.5 1.2 2.5 1.2 Provisions for the year 0.3 1.9 0.3 1.9 Bad debts incurred -0.8 -0.6 -0.8 -0.6 Provisions for bad debts at 31 December 2.0 2.5 2.0 2.5
Rent receivables are covered by a bank guarantee of DKK 14.2 million (2014: DKK 16.9 million)
20 PREPAYMENTS Prepaid expenses relate to: 8.6 9.4 8.2 9.4 Other 8.6 9.4 8.2 9.4
21 SHARE CAPITAL The share capital consists of 571,666 shares of DKK 100 each. The number of shares has been unchanged in the past five years. The share capital is fully paid up. All shares rank equally. The Company has not acquired or sold any treasury shares during the year. At year end, the Company holds no treasury shares.
18 FINISHED GOODS Retail 1.0 1.4 1.0 1.4 Food & beverage 6.7 7.1 6.7 7.1 Other inventories 1.2 1.1 1.2 1.1 8.9 9.6 8.9 9.6
17 DEFERRED TAX Deferred tax comprises: Non-current intangible assets 0.2 0.2 0.2 0.2 Non-current property, plant and equipment 30.0 30.5 30.0 30.5 Current assets 0.3 -3.4 0.3 -0.1 Current liabilities -1.5 -1.6 -1.5 -1.6 29.0 25.7 29.0 29.0 Expected utilisation as follows: Within 12 months of the balance sheet date 3.0 -3.7 3.0 -3.7 More than 12 months after the balance sheet date 26.0 29.4 26.0 32.7 29.0 25.7 29.0 29.0 Classified in the balance sheet as follows: Deferred tax re Parent Company 29.0 29.0 29.0 29.0 Deferred tax re subsidiary 0.0 -3.3 0.0 0.0 Total deferred tax 29.0 25.7 29.0 29.0 At December 31st there is not recognized deferred tax assets in the Group of DKK 5.4 million (2014: DKK 0.0 million)
(NOTE 17 CONTINUED)
37

❖ TIVOLI ANNUAL REPORT 2015 ❖
DKK million
22 LOANS Non-current debt: Mortgage loan 60.3 65.5 60.3 65.5 Total non-current debt 60.3 65.5 60.3 65.5
Current debt: Mortgage loan 5.1 5.1 5.1 5.1 Total current debt 5.1 5.1 5.1 5.1
Total non-current and current debt 65.4 70.6 65.4 70.6 Non-current debt falls due within the following periods from the balance sheet date: 1-2 years 2-3 years 3-4 years 4-5 years > 5 years Total Mortgage loan 2015 5.1 5.2 5.2 5.2 41.6 62.3 The mortgage loan is a 20-year loan maturing in 2028. The loan is floating-rate, but an interest rate swap with a fixed interest rate of 5.0% has been entered into for the full term of the loan. The fair value (level 2) of the loan equals carrying amount as the loan is floating-rate.
Carrying Payment amount obligation 2016 2017 2018 After 2018 Bond loan 65.4 71.6 5.7 5.8 5.7 54.4 Interest rate swap 25.6 3.6 3.3 3.1 15.6 97.2 9.3 9.1 8.8 70.0
Non-current debt falls due within the following periods from the balance sheet date:
1-2 years 2-3 years 3-4 years 4-5 years > 5 years Total Mortgage loan 2014 5.1 5.1 5.2 5.2 45.3 65.9
The mortgage loan is a 20-year loan maturing in 2028. The loan is floating-rate, but an interest rate swap with a fixed interest rate of 5.0% has been entered into for the full term of the loan. The fair value (level 2) of the loan equals carrying amount as the loan is floating-rate. Carrying Payment amount obligation 2015 2016 2017 After 2017 Bond loan 70.6 77.3 5.7 5.7 5.8 60.1 Interest rate swap 29.4 3.8 3.6 3.3 18.7 106.7 9.5 9.3 9.1 78.8
23 OTHER PAYABLES Accrued staff expenses 49.3 40.1 49.3 40.1 Market value of hedging instruments 19.4 22.1 19.4 22.1 VAT payable 21.6 22.2 21.6 22.2 Other 20.9 17.6 20.3 16.9 111.2 102.0 110.6 101.3 24 DEFERRED INCOME Current liabilities Deferred income relates to: Season Passes 42.2 36.7 42.2 36.7 Concert Hall etc 20.5 58.1 20.5 58.1 62.7 94.8 62.7 94.8
2015 2015
GROUP PARENT COMPANY
2014 2014
2015 2015
GROUP PARENT COMPANY
2014 2014
38

❖ NOTES ❖
DKK million
25 CONTINGENT LIABILITIES AND SECURITY, ETC Land and buildings with a carrying amount of DKK 604.3 million (2014: DKK 627.7 million) include registered indemnity bonds of
DKK 210.0 million (2014: DKK 210.0 million). At 31 December 2015, DKK 110.0 million has been provided as security for mortgage loan with Nykredit (2014: DKK 110.0 million), and DKK 100.0 million has been provided as security for overdraft facility (2014: DKK 100.0 million).
Operating leases Tivoli leases executive cars, vans, sweeping and suction machine as well as compressor for the Golden Tower on operating leases. The lease term is typically a period of between 3 and 6 years.
Future expenses relating to leases Due within 1 year 0.8 0.8 0.8 0.8 Due within 1 to 5 years 1.0 1.2 1.0 1.2 1.8 2.0 1.8 2.0 Operating lease expenses recognised in the income statement amount to 0.9 0.9 0.9 0.9 All lease commitments are non-cancellable for the lease term.
Rental obligations Tivoli rents storage and office premises as well as parking space for machines.
Future expenses relating to rental agreements Due within 1 year 3.0 2.8 3.0 2.8 Due within 1 to 5 years 4.6 4.4 4.6 4.4 Due after more than 5 years 4.2 5.5 4.2 5.5 11.8 12.7 11.8 12.7 Rental expenses recognised in the income statement amount to 4.9 6.5 4.9 6.5
Due to the nature of its operations, investments and financing, the Group is exposed to changes in exchange rates and interest rate levels. It is Group policy not to engage in speculation in relation to financial risks. The Group's financial management is directed solely at managing the financial risks relating to operations and financing.
For a description of accounting policies and methods, including recognition criteria and measurement basis, reference is made to the relevant sections under accoun-ting policies.
Currency riskTivoli A/S has only limited currency positions on existing or expected future financial assets or liabilities.
Liquidity riskTivoli A/S' cash funds/overdraft facilities show material fluctuations over the year due to seasonal fluctuations. The cash requirements are fully met by the current operating profit and the possibility of drawing on the bank overdraft. The credit facility amounts to DKK 230 million (2014: DKK 230 million).
Interest rate riskThe overdraft facility is a floating-rate facility. Therefore, interest income/expenses in the individual years will depend
on the short-term interest rate development. Tivoli A/S does not hedge this interest rate risk. An interest rate change of 0.5% will have a P/L effect of some DKK 0.2 million (2014: DKK 0.5 million).
In connection with raising material, long-term loans, it is Group policy to ensure that the interest rate risk is limited. This is ensured by raising a fixed-rate loan or hedging the interest rate risk of a floating-rate loan fully by an interest rate swap converting the floating rate to a fixed interest rate.
In 2008 the Company has raised a 20-year floating-rate mortgage loan of DKK 100 million for financing the Nimb reconstruction. At the same time, an interest rate swap with a fixed interest rate of 5.0% was entered into for the full term of the loan. Changes in the market value of the interest rate swap are recognised directly in Other comprehensive income.
Credit risksIn consequence of the Company's activities, receivables only arise to a minor extent. Furthermore, cash funds are utilised to a large extent to reduce drawing on the overdraft facility. Therefore, the Group is not materially exposed to credit risks.
26 FINANCIAL RISKS
2015 2015
GROUP PARENT COMPANY
2014 2014
39

❖ TIVOLI ANNUAL REPORT 2015 ❖
DKK million
27 CASH FLOW HEDGES
Total financial instruments (interest rate swaps) 73.5 -19.4 77.6 -22.1
The amount of contract has been indicated as debt outstanding at 31 December 2015. Fair value has been recognised in equity net of tax. Financial instruments hedging expected transactions but not qualifying for hedge accounting according to IAS 39.
Methods and assumptions for fair value calculations
Interest rate swaps and forward exchange contracts are valued according to generally accepted valuation methods based on relevant observable swap curves and exchange rates.
Fair value hierarchy for financial instruments measured at fair value in the balance sheet
Financial liabilities Derivative financial instruments entered into to hedge future cash flows 0.0 19.4 0.0 19.4
Financial liabilities Derivative financial instruments entered into to hedge future cash flows 0.0 22.1 0.0 22.1
Amount of contract
Listed prices
(level 1)
Listed prices
(level 1)
Amount of contract
Unobser- vable input
(level3)
Unobser- vable input
(level3)
Fair value at 31 December
Observable input
(level 2)
Observable input
(level 2)
Fair value at 31 December
Total
Total
2015
2015
2014
2014
40
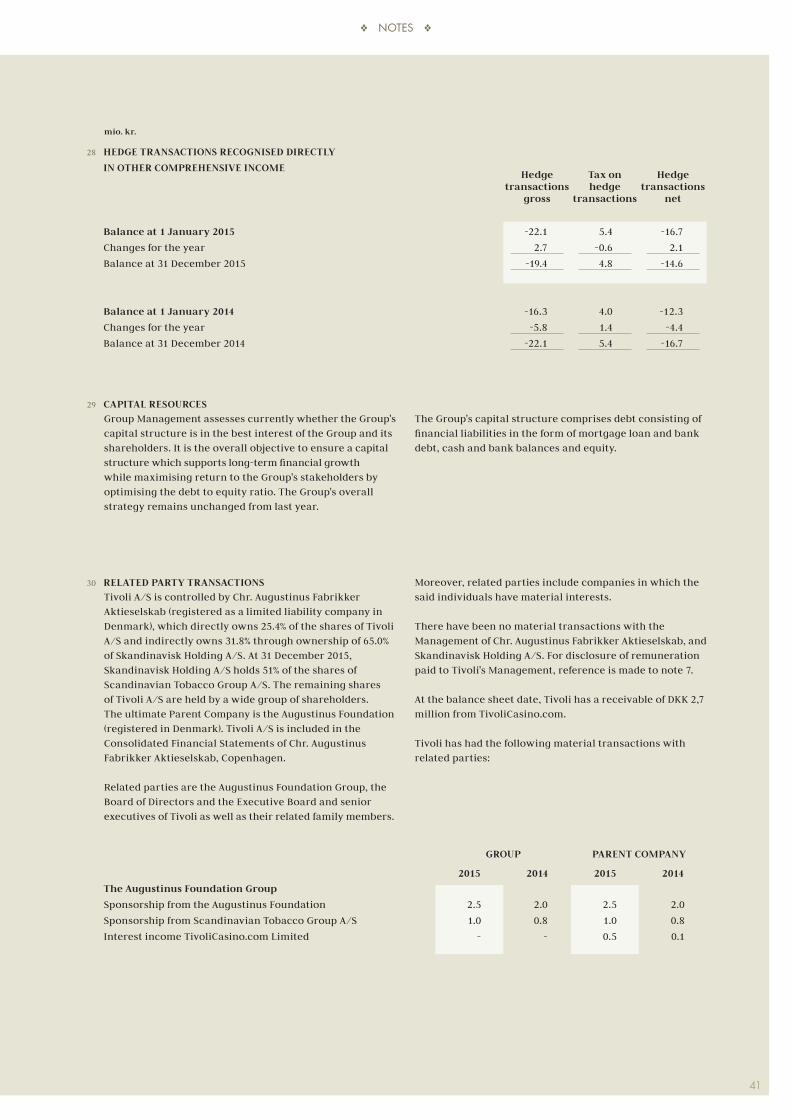
❖ NOTES ❖
28 HEDGE TRANSACTIONS RECOGNISED DIRECTLY IN OTHER COMPREHENSIVE INCOME
Balance at 1 January 2015 -22.1 5.4 -16.7 Changes for the year 2.7 -0.6 2.1 Balance at 31 December 2015 -19.4 4.8 -14.6
Balance at 1 January 2014 -16.3 4.0 -12.3 Changes for the year -5.8 1.4 -4.4 Balance at 31 December 2014 -22.1 5.4 -16.7
Tax on hedge
transactions
Hedge transactions
gross
Hedge transactions
net
Tivoli A/S is controlled by Chr. Augustinus Fabrikker Aktieselskab (registered as a limited liability company in Denmark), which directly owns 25.4% of the shares of Tivoli A/S and indirectly owns 31.8% through ownership of 65.0% of Skandinavisk Holding A/S. At 31 December 2015, Skandinavisk Holding A/S holds 51% of the shares of Scandinavian Tobacco Group A/S. The remaining shares of Tivoli A/S are held by a wide group of shareholders. The ultimate Parent Company is the Augustinus Foundation (registered in Denmark). Tivoli A/S is included in the Consolidated Financial Statements of Chr. Augustinus Fabrikker Aktieselskab, Copenhagen.
Related parties are the Augustinus Foundation Group, the Board of Directors and the Executive Board and senior executives of Tivoli as well as their related family members.
Moreover, related parties include companies in which the said individuals have material interests.
There have been no material transactions with the Management of Chr. Augustinus Fabrikker Aktieselskab, and Skandinavisk Holding A/S. For disclosure of remuneration paid to Tivoli's Management, reference is made to note 7.
At the balance sheet date, Tivoli has a receivable of DKK 2,7 million from TivoliCasino.com.
Tivoli has had the following material transactions with related parties:
Group Management assesses currently whether the Group's capital structure is in the best interest of the Group and its shareholders. It is the overall objective to ensure a capital structure which supports long-term financial growth while maximising return to the Group's stakeholders by optimising the debt to equity ratio. The Group's overall strategy remains unchanged from last year.
The Group's capital structure comprises debt consisting of financial liabilities in the form of mortgage loan and bank debt, cash and bank balances and equity.
30 RELATED PARTY TRANSACTIONS
29 CAPITAL RESOURCES
mio. kr.
The Augustinus Foundation Group Sponsorship from the Augustinus Foundation 2.5 2.0 2.5 2.0 Sponsorship from Scandinavian Tobacco Group A/S 1.0 0.8 1.0 0.8 Interest income TivoliCasino.com Limited - - 0.5 0.1
2015 2015
GROUP PARENT COMPANY
2014 2014
41

❖ TIVOLI ANNUAL REPORT 2015 ❖
TIVOLI A/SVesterbrogade 3DK-1630 Copenhagen V
Tel: +45 33 15 10 01 E-mail: [email protected]
VAT No 10 40 49 16
www.tivoli.dkwww.tivoligardens.com
–
Information on the Tivoli share and the Company is available on www.tivoligardens.com/en/om/virksomheden
Information on corporate governance at Tivoli is available onwww.tivoli.dk/en/om/virksomheden/aktionærinformation
Tivoli’s full CSR Report for 2015 is available on www.tivoligardens.com/en/om/virksomheden/csr
PHOTOGRAPHERSAnett AhrendsAnders BøggildClaudia DonsRasmus B.S. Hansen, TerranautKasper KristoffersenMiklos SzaboBjarke ØrstedTivoli:Ellen Dahl, Bjarke Posselt, Christoffer Anias Sandager, Simon Verheij, Lasse Salling
FRONT COVER PHOTOChristoffer Anias Sandager
TEXTTivoli
DESIGNTivoli
PRINTInnographic A/S
COLOPHON
❖
TIVOLI’S SPONSORS IN 2015
❖
42

CONTENTS
❖
3 Chairman’s Report
4 Financial Highlights
6 Management’s Statement and Independent Auditor’s Report
8 Board of Directors, Executive Board and Vice Presidents of Tivoli
12 Statutory Report on Corporate Governance
14 Financial Review
19 Financial Statements
25 Notes
42 Tivoli’s Sponsors
42 Colophon
❖ TIVOLI ANNUAL REPORT 2015 ❖ ❖ TIVOLI ANNUAL REPORT 2015 ❖
Shrimp open-faced sandwich, Fru Nimb restaurant
The Ferris Wheel and the Star Flyer
Come Together, the Tivoli Concert Hall
New illumination experience for Christmas at Tivoli
The main avenue, Halloween
Dog’s Day at Tivoli
Petzi and Park Attendant
Tivoli’s Aquarium
The Tivoli Lake
First girls accepted into the Tivoli Youth Guard
Tony Bennett and Lady Gaga

2015ANNUAL REPORT 2015TIVOLI A/S
Vesterbrogade 3DK-1630 Copenhagen V
Tivoli A/S • VAT 10404916