annual report 2016 - asxannual report 2016 swick mining services 5 swick’s ongoing client focus of...
TRANSCRIPT
ANNUAL REPORT 2016
THE LEADER IN MINERAL DRILLING INNOVATION
For
per
sona
l use
onl
y

CORPORATE DIRECTORY
DirectorsAndrew Simpson - Non-Executive Chairman
Kent Swick - Managing Director
David Nixon - Non-Executive Director
Phillip Lockyer - Non-Executive Director
Ian McCubbing - Non-Executive Director
Company SecretaryFrank Campagna
Registered and Operations Office64 Great Eastern Highway South Guildford, Western Australia
Telephone: +61 8 9277 8800 Facsimile: +61 8 9277 8844 Email: [email protected] Website: www.swickmining.com
Postal AddressPO Box 74 Guildford, Western Australia, 6935
AuditorDeloitte Touche TohmatsuTower 2, Brookfield Place 123 St. Georges Terrace Perth, Western Australia, 6000
SolicitorsSteinepreis Paganin Lawyers and ConsultantsLevel 4, The Read Buildings 16 Milligan Street Perth, Western Australia
Share RegistrySecurity Transfer Registrars Pty Ltd770 Canning Highway Applecross, Western Australia
Telephone: +61 8 9315 2333 Facsimile: +61 8 9315 2233
BankersNational Australia Bank Ltd
ASX Code: SWK (fully paid shares)Listed on the Australian Securities Exchange
ABN: 20 112 917 905
For
per
sona
l use
onl
y
1ANNUAL REPORT 2016 SWICK MINING SERVICES
Chairman’s Letter 4
Managing Director’s Report on Operations 7
Financial Report for the Year Ended 30 June 2016 13
Directors’ Report 14
Auditor’s Independence Declaration 31
Corporate Governance Statement 32
Consolidated Statement of Profit or Loss
and Other Comprehensive Income38
Consolidated Statement of Financial Position 39
Consolidated Statement of Changes in Equity 40
Consolidated Statement of Cash Flows 41
Notes to the Financial Statements 42
Directors’ Declaration 75
Independent Auditor’s Report 76
ASX ADDITIONAL INFORMATION 78
CONTENTS
For
per
sona
l use
onl
y

2 SWICK MINING SERVICES ANNUAL REPORT 2016
Decrease in Total Recordable Injury Frequency Rate (TRIFR) of 38% over the year.
Underground Diamond Drilling metres per shift and metres per man-hour increased by 16% over the year.
Most metres drilled in any one year by Swick’s Australian Underground Diamond Drilling division (total 941,112), an increase of 4.7% on the previous year.
Orexplore product progressed to industrial prototype stage.
2016 MILESTONES
For
per
sona
l use
onl
y

3ANNUAL REPORT 2016 SWICK MINING SERVICES
OUR LOCATIONS
Underground Diamond Drilling
Underground Longhole
Surface Reverse Circulation Drilling
Swick Office
70
14
66
15
76
16
70
14
57
7
61
10
63
8
68
8
65
8 7
60
1H12 2H12 1H13 2H13 1H14 2H14 1H15 2H15 1H16 2H16
EBITDA ($M)Revenue ($M)
Consolidated - Half Yearly Revenue and EBITDA (excluding significant items)1 July 2012 to 30 June 2016
For
per
sona
l use
onl
y

4 SWICK MINING SERVICES ANNUAL REPORT 2016
CHAIRMAN’S LETTER
Dear Shareholder,
On behalf of the Board of Directors of Swick Mining Services Ltd (“Swick” or the “Company”), I am pleased to present the Company’s 2016 Annual Report.
Our Company continued to work diligently to maintain the highest level of customer service and support during the 2016 financial year. This ongoing focus in conjunction with the advances in technology on our rigs has enabled the Company to maintain its market share in the underground core drilling market in Australia.
Despite the ongoing tough market operating conditions, the Company drilled more metres compared to the prior year.
SafetySafety continued to be an integral part of the Swick brand. Over the 2016 financial year Swick continued to improve its safety performance with the Total Recordable Injury Frequency Rate (TRIFR) reducing to 9.1 at year end, a 38% reduction over the year and a total reduction of 87% over the last four years.
This ongoing safety improvement is due to the continued investment in systems, competency based training and proactive injury management processes. The Project Implementation and Technical Training (PITT) team continues to ensure maximum safe utilisation of the innovative projects introduced by the Engineering Department, allowing for Swick to maintain its safe production targets.
Market LeadershipSwick’s ongoing client focus of providing a strong value proposition has seen Swick continue to cement its position as the proven market leader in the Mineral Drilling Industry, making Swick a trusted and reliable partner for many mining houses. Swick continues to have a strong client value focus resulting in high levels of client retention in the current highly competitive environment. Safety and efficiency remain top of mind with our clients and therefore a focus on continual improvement is essential for market success.
Strategic FocusSwick continues to minimise its risk exposure by focusing on providing drilling services to strategic clients, on a number of operating sites, across a wide range of commodities. With the ongoing market conditions, Swick is increasing its focus on the largest area of expertise, being underground diamond coring.
The strategic decision made a number of years ago to focus on brownfields operations in the underground diamond drilling sector, where the market leading mobile rig provides a competitive advantage has continued to see Swick outperform its peers. During the 2016 financial year the Underground Diamond (UD) Drilling division represented approximately 87% of the drilling fleet and contributed 88% of the Company‘s global revenue.
For our clients, underground core drilling provides information for grade control, reserve definition and exploration purposes and is an essential part of defining the ongoing underground mining development designs, ore extraction plans, budgets and the resource base. The ongoing decline in commodity prices has seen a slight reduction in total UD metres for the year (the APAC operations reported a 4.7% increase in UD metres while International reported a 52% decrease). The roll out of research and development initiatives has seen a 14.8% increase in metres per man-hour, a key strategic objective of the company.
For the Underground Production (Longhole) Drilling division, the number of market opportunities continued to be limited and highly competitive. For the Reverse Circulation (RC) Drilling division, Swick has been able to secure additional work with existing clients resulting in 80% utilisation at year end.
The Company’s near term strategy is to improve the return on existing capital invested by improving rig productivity and profitability and only seek growth in the Company’s three established regions of Australia, USA and Portugal.
The Company’s long-term strategy of providing a full suite mineral analysis service to mining clients is supported by the Company’s ongoing investment in Orexplore AB, a Swedish Company carrying out research and development in the field of using x-ray technology to scan and analyse mineral samples including core.
For
per
sona
l use
onl
y

5ANNUAL REPORT 2016 SWICK MINING SERVICES
Swick’s ongoing client focus of providing a strong value proposition has seen Swick continue to cement its position as the proven market leader in the Mineral Drilling Industry
Maintained Our Market PositionThe beginning of the 2016 financial year was characterised by declining revenues mainly resulting from reduced rig requirements from existing clients as commodity prices reduced. This trend was reversed in the second half as rigs from new contracts won commenced operations.
The renewal of the cornerstone Tanami contract with Newmont, with its expanded scope, coupled with the addition of the Nova and Jaguar contracts with Independence Group as a key new client enabled activity levels at the end of the year to almost return to those experienced at the start of the financial year. Subsequent to year end, the Company renewed its Jundee contract with Northern Star Resources for a further two years.
ResultsThe ongoing challenging economic conditions adversely impacted the financial results for the 2016 financial year. The Company recorded $125 million in revenue and other income, with an EBITDA before significant items of $14.8 million (EBITDA margin of 12%) which was $2.5 million below the 2015 financial year result. Non-cash items of impairment of non-core assets (skid rigs) and de-recognition of carried forward tax losses contributed to a reported loss after tax of $2.8 million.
The stability of performance of the core UD division provided a platform for the Company to embark on improving our balance sheet at the start of the 2016 financial year. A vast improvement in working capital management and discipline in capital expenditure during the year resulted in the Company generating free cash flow of $4.6 million. The free cash flow was used to service debt by paying down $4.9 million of debt and for servicing equity by embarking on a share buy-back.
With renewed optimism in the sector, the ongoing strong performance of the core UD division and healthy cash generation, Swick was able to declare a final dividend of 0.4 cents per share for the year.
Research & DevelopmentAs a leader in the mineral drilling industry, Swick has continued its commitment to research and development. With clients now more focused than ever on safety performance and cost reductions, together with the extremely competitive market, Swick’s dedication and investment towards improved safety and productivity is recognised by its clients as a key competitive advantage, and with it a strong market position has developed.
Swick’s strategic objective to ‘double the metres per man-hour’ from June 2012 to June 2017 has founded numerous strategic research and development projects, a number of which have now been implemented. Swick’s UD fleet is currently undergoing a major technology upgrade that will provide the Company with significant additional competitive advantages and allow continued improvement in the value delivered to its clients.
The FutureSwick enters financial year 2017 in a solid market position, on the back of a consistent performance in financial year 2016 which has seen us:
+ maintain market position;
+ significantly increase productivity per man-hour and per shift through innovation;
+ continue to improve safety through ongoing training and system improvement.
This continued focus on innovation and productivity will position the company for further optimisation of the existing drilling fleet and ensure Swick extracts maximum return from our assets when the market improves and all the new technologies are fully rolled out and embedded in our operations. This will also provide flexibility to take advantage of further global market opportunities as they present themselves. Every expanded activity will maintain our traditional focus on competitive advantage, resulting in ongoing market leadership.
On behalf of the Board, I would like to thank the Managing Director, the Chief Executive Officer and the Executive Leadership Team for developing and implementing the strategies that have led to another successful year for the Company. I would also like to recognise the broader Swick team – a committed group of people passionate about living the values of an industry leading company.
I would also like to thank Swick’s clients, partners and suppliers for the continued support of our business and their shared vision of further improving safety and productivity.
We look forward to further developing our market leading position in Australia and to sharing our innovations and values across the globe.
Yours faithfully,
Andrew Simpson Chairman
For
per
sona
l use
onl
y

6 SWICK MINING SERVICES ANNUAL REPORT 2016
For
per
sona
l use
onl
y

7ANNUAL REPORT 2016 SWICK MINING SERVICES
MANAGING DIRECTOR’S REPORT ON OPERATIONS
2016 Financial Year OverviewThe 2016 financial year saw a continuation of the ongoing uncertain global demand for metals. Commodity prices remained low and volatile, with a number of mines in the Australian market closing due to the low prices. Gold was the exception to this, rising in both US and Australian dollar terms. The wider market showed some levels of recovery through the second half as the Commodity Price Index returned to levels last seen in September 2015. Despite this recovery, the sector is still highly cost focused and trading conditions remain difficult.
Swick maintained its focus on executing its internal strategies and continued to invest in continuous improvement and research and development initiatives that moved the Company closer to its strategic goal of doubling its metres per man-hour production rate by June 2017. The 2016 financial year saw a significant step towards achieving this goal with the implementation of technologies allowing single-man shifts to be safely undertaken while maintaining production levels.
I would like to thank the Board of Directors for its guidance and support over the past twelve months, as well as the Executive and Management Teams, which were able to successfully implement many components of the strategic plan throughout our business during the year. The efforts of the team to minimise risk and to maximise performance has improved the Company’s market position and placed our Company in good stead for the future.
Safety and TrainingSwick’s core value of safe production was again demonstrated in the 2016 financial year, evidenced by the Total Recordable Frequency Rate (TRIFR) of 9.1 per million man-hours at June 30. The result is a reduction of 38.1% for the full year on the back of a 25% reduction in the prior financial year. This ongoing improvement is due to the continued investment in systems, competency based training and proactive injury management processes. The Project Implementation and Technical Training (PITT) team continues to ensure maximum safe utilisation of the innovative projects introduced by the Engineering Department, allowing for Swick to maintain its safe production targets.
Jul-2
013
Aug-
2013
Sep-
2013
Oct-2
013
Nov-
2013
Dec-
2013
Jul-2
014
Aug-
2014
Sep-
2014
Oct-2
014
Nov-
2014
Dec-
2014
Jan-
2014
Feb-
2014
Mar
-201
4
Apr-2
014
May
-201
4
Jun-
2014
Jul-2
015
Aug-
2015
Sep-
2015
Oct-2
015
Nov-
2015
Dec-
2015
Jan-
2015
Feb-
2015
Mar
-201
5
Apr-2
015
May
-201
5
Jun-
2015
Jan-
2016
Feb-
2016
Mar
-201
6
Apr-2
016
May
-201
6
Jun-
2016
Safety Performance
TRIFR Linear (TRIFR)
0
15
30
45
60
For
per
sona
l use
onl
y

8 SWICK MINING SERVICES ANNUAL REPORT 2016
MANAGING DIRECTOR’S REPORT ON OPERATIONS
Production and RevenueThe 2016 financial year was impacted by soft market conditions which resulted in lower overall revenues and revenue per metre. During the period Swick was able to reduce operating wage costs by reducing overall manning at its operations. A key achievement during the year was rolling out a number of research and development initiatives in the UD division which allows drillers to operate without any assistance through the shift (single-man operation). As shown in the graph below, this resulted in the metres drilled per man-hour increasing from a consistent 1.04 during the 2015 financial year to 1.3 at the end of the 2016 financial year.
0.0
0.2
0.4
0.6
0.8
1.0
1.2
1.4
Jul Aug Sep Oct Nov Dec Jan Feb Mar Apr May Jun
Met
res
per M
an-h
our
FY16 vs FY15 Metres per Man-hour
FY16 FY15 Linear (FY16) Linear (FY15)
Swick’s Australian UD division drilled a record 941,112 metres in the 2016 financial year, an increase of 4.7% on the previous year, despite a 6.6% reduction in the number of shifts. This was achieved through a 10.4% increase in metres per shift. International UD division drilled 54,067 metres in the 2016 financial year, a decrease from 112,834 metres drilled in the 2015 financial year due to lower drilling budgets of our international clients.
Underground Diamond Underground Production (Longhole) Reverse Circulation
-1Q12 2Q12 3Q12 4Q12 1Q13 2Q13 3Q13 4Q13 1Q14 2Q14 3Q14 4Q14 1Q15 2Q15 3Q15 4Q15 1Q16 2Q16 3Q16 4Q16
Met
res
Drill
ed (’
000)
50
100
150
200
250
300
350
400
Metres Drilled by Quarter
For
per
sona
l use
onl
y

9ANNUAL REPORT 2016 SWICK MINING SERVICES
MANAGING DIRECTOR’S REPORT ON OPERATIONS
Commodity prices remain highly volatile and difficult to predict. The gold price rose strongly through the second half of the year after being relatively stable for the first half. Both Nickel and Copper fell heavily in the first half of the year before stabilising. Zinc fell heavily in the first half before recovering, while Tin had a volatile first half before rebounding strongly in the second half. The graph below shows the commodity price movements over the year in percentage terms.
Tin
Copper Lead
Pric
e M
ovem
ent 1
-Jul
-15
to 3
0-Ju
n-16
-30.0%
-25.0%
-20.0%
-15.0%
-10.0%
-5.0%
0.0%
5.0%
10.0%
15.0%
20.0%
AUD Price Movement by Commodity (%)
Gold
Nickel
Zinc
During the year, the relative movements in the commodity prices outlined above resulted in revenue earned from Gold mines increasing by 5 percentage points. The revenue mix of the Company by type of commodity is shown below:
Revenue by Commodity
20.0%
10.0%
30.0%
50.0%
70.0%
90.0%
60.0%
100.0%
0.0%
40.0%
80.0%
Others
Diamond
Tin
Iron Ore
Lead/Zinc/Silver
Manganese
Copper/Zinc
Copper/Gold
Copper
Nickel
GoldFY12 FY13 FY14 FY15 FY16
“ A key achievement during the year was rolling out a number of research and development initiatives...”
For
per
sona
l use
onl
y
10 SWICK MINING SERVICES ANNUAL REPORT 2016
MANAGING DIRECTOR’S REPORT ON OPERATIONS
Underground Diamond (UD) DrillingThe 2016 financial year ended with total UD metres drilled of 995,179, a decrease from the prior year’s total of 1,011,911. Metres drilled in APAC operations increased 4.7% to 941,112 metres and was offset by a decrease in metres drilled in International operations. The decrease in metres drilled in International operations was due to reduced drilling budgets of our international clients.
The UD division reported revenue of $109.8 million, a reduction of 7.1% compared to prior year. The reduction in revenue was predominantly due to the renewal of the Tanami contract in January 2016 at lower rates as a result of rolling out new technology on rigs on this site. The long term gain of the equipment upgrades at the Tanami mine is that the technology allows for a lower manning ratio of 1.5 men per rig. The lower rates offered to Newmont are designed to share the benefits of lower labour costs, and the subsequent flight and accommodation savings over the tenure of the contract.
The roll-out of the new rig technology at the Tanami project in the second half of the year involved the removal of existing drilling equipment from the Northern Territory operation, upgrading those assets in the Perth workshop facility and returning the upgraded rigs to site. At the same time as the upgrades, the Company took the opportunity to carry out the required maintenance on the rigs which would otherwise have occurred at a future date at site and at a higher cost. Swick has ten underground rigs working fulltime at Tanami.
Ongoing productivity improvements and rollout of new technology resulted in the division reporting a 14% increase in metres per shift compared to the prior year.
Following a reduction in rigs during the first half of the year, largely attributable to reductions from existing clients as commodity prices dropped, the second half saw additional rigs being put to work at new sites as a result of new contract wins with Newmont and Independence Group.
Continuing with our innovative customer focussed approach, Swick used its underground mobile rig to complete a small series of surface holes, to a depth of over 550 metres, during the year. The flexibility to complete this work saved the client the costs of mobilising an additional contractor to site.
Despite Swick clearly demonstrating its value proposition as a drilling service provider over many years, the Company is respectful of the highly competitive operating environment and continues to recognise the need to assist in lowering the operating costs of their clients, to any extent possible. Swick’s value proposition was recently affirmed when we were successful in rolling over the Jundee contract with Northern Star Resources for a further two years through a competitive tender process. Swick has eight underground rigs working fulltime at Jundee.
The Swick research and development department has continued its efforts to look at ways of reducing non-drilling time. The 2016 financial year was again a year of consolidating gains made on projects commenced in prior years in line with spending controls required in the current competitive environment. The focus on the next step change developments during the second half of the 2015 financial year allowed for the significant manning reduction at our largest operation, which was progressively implemented over the second half of the 2016 financial year. The 2017 financial year will see continued development of this key initiative as the company continues its focus on increasing the metres drilled per man-hour.
For
per
sona
l use
onl
y

11ANNUAL REPORT 2016 SWICK MINING SERVICES
MANAGING DIRECTOR’S REPORT ON OPERATIONS
In addition to the temporary costs associated with the machinery upgrades at the Tanami project, a number of our other clients managed their drill programs tightly during the year resulting in an increase in rig mobilisations and de-mobilisations when compared to the normal market conditions. These temporary activities had a negative impact on overall margins of this division, contributing to the loss result for the year.
Reverse Circulation (RC) DrillingThe 2016 financial year saw the RC division report revenue of $5.4 million which was a decrease of 6.6% from prior year. Revenue in the second half of the year was 41% higher than the first half of the year boosted by a new contract win at Boddington mine with Newmont. The scope of this contract has since been increased beyond the initial contract terms providing the division with a core contract for ongoing work.
During the first quarter of the 2017 financial year, fleet utilisation for this division is expected to be over 80%.
Underground Production (Longhole) DrillingThe Longhole division experienced a 15% increase in revenue to $8.0 million for the year due to increase in demand from the client.
OrexploreSwick continues to fund research and development activities at Orexlore AB in return for equity. As of June 30, 2016 the Swick shareholding of Orexplore is at 60.4%.
The Orexplore product is a unique mineral analysis instrument that can provide highly accurate and high volume scanning of mineral samples at the mine site, including detailed computerised tomography (CT) showing the internal structure of the rock. This is unique in its ability to provide detailed, accurate mineral analysis in almost real-time, allowing better decision making by our mining clients and compressing their mine planning significantly.
The Orexplore product has progressed to the industrial prototype stage and the Company is planning to have a prototype core scanning machine operating on a full time basis at a major copper mine in northern Sweden later in calendar year 2016.
Outlook for the 2017 Financial YearSwick expects the market volatility faced in financial year 2016 to continue next year. However with the recent renewed optimism in the mining sector and therefore the drilling industry, Swick expects an increase in rig utilisation from current levels.
Swick continues to be ready and willing to assist clients achieve high productivity and is very well positioned to take full advantage of this expected uplift in market conditions.
Yours faithfully,
Kent Swick Managing Director
For
per
sona
l use
onl
y

12 SWICK MINING SERVICES ANNUAL REPORT 2016
For
per
sona
l use
onl
y
13ANNUAL REPORT 2016 SWICK MINING SERVICES
CONTENTS Page
Directors’ Report 14
Auditor’s Independence Declaration 31
Corporate Governance Statement 32
Consolidated Statement of Profit or Loss and Other Comprehensive Income
38
Consolidated Statement of Financial Position 39
Consolidated Statement of Changes in Equity 40
Consolidated Statement of Cash Flows 41
Notes to the Financial Statements 42
Directors’ Declaration 75
Independent Auditor’s Report 76
FINANCIAL REPORTFOR THE YEAR ENDED 30 JUNE 2016
For
per
sona
l use
onl
y

DIRECTORS’ REPORT
14 SWICK MINING SERVICES ANNUAL REPORT 2016
Your directors present their report, together with the financial statements of Swick Mining Services Ltd (the “Parent” or the “Company”) and its controlled entities (collectively referred to as “Swick Mining Services Group” or the “Group”) for the financial year ended 30 June 2016. The names and particulars of the directors of the company during or since the end of the financial year are:
Information on directorsAndrew Simpson Non-executive chairman
Qualifications Grad Dip (Bus), MAICD
Experience Mr Simpson is a senior marketing executive with extensive global marketing experience in the resource and mining industry, including more than 30 years of international marketing and distribution of minerals and metals. He is currently the Managing Director of Resource & Technology Marketing Services Pty Ltd, a company providing specialist marketing and business assessment advisory services to the mineral resources and technology industries, both in Australia and internationally. Mr Simpson graduated from Curtin University holding a Graduate Diploma in Business and Administration (majoring in Marketing and Finance). He has also completed the Advanced Management Program at the University of Western Australia and is a Member of the Australian Institute of Company Directors. Mr Simpson was appointed as a Director of the Company on 24 October 2006.
Interest in shares 605,000 Fully Paid Ordinary Shares
Special responsibilities Mr Simpson is a member of the Board’s Remuneration and Nomination Committee (Committee Chairman).
Directorships held in other listed entities during the three years prior to the current year
Territory Resources Limited non-executive director - 25 September 2007 to 31 January 2014Blackwood Corporation Ltd (formerly Matilda Minerals Ltd) non-executive director - 25 September 2007 to 31 December 2013India Resources Ltd non-executive director - 21 August 2006 to presentVital Metals Ltd non-executive director - 23 February 2005 to present
Kent Swick Managing director
Qualifications B.Eng (Mech)
Experience Mr Swick is a Mechanical Engineer with 25 years experience in civil construction, mining maintenance and surface and underground mineral drilling. He was previously employed by Atlas Copco Australia as a Maintenance Engineer managing underground maintenance, where he developed a strong understanding of underground mining methods and equipment. Mr Swick was the driving technical force behind the design of the Company’s innovative underground diamond drill rig and award winning surface reverse circulation drill rig. He graduated from the University of Western Australia holding a Bachelor of Engineering (majoring in Mechanical Engineering) and has completed the Owner/President Management program at Harvard Business School. Mr Swick was appointed as a Director of the Company on 24 October 2006.
Interest in shares 33,322,182 Fully Paid Ordinary Shares
Special responsibilities Nil
Directorships held in other listed entities during the three years prior to the current year
Nil
For
per
sona
l use
onl
y

DIRECTORS’ REPORT
15ANNUAL REPORT 2016 SWICK MINING SERVICES
David Nixon Non-executive director
Qualifications B.Sc. Eng (Mech), MAICD
Experience Mr Nixon is a Mechanical Engineer with over 40 years experience in the mining and construction industries in Southern Africa, Australia, New Zealand, Canada and Indonesia. He was a founding executive of Signet Engineering in 1990 and a director until its acquisition by Fluor Australia in 1996. Mr Nixon was the project director for the $1 billion BHP Billiton Iron Ore Asset Development projects, and is a past non-executive chairman of Atlas Iron and past non-executive director of Brockman Resources and Moly Mines. Mr Nixon graduated from the University of Natal (South Africa) holding a Bachelor of Science (Mechanical Engineering) and is a member of the Australian Institute of Company Directors. Mr Nixon was appointed as a Director of the Company on 1 January 2007.
Interest in shares 300,000 Fully Paid Ordinary Shares
Special responsibilities Mr Nixon is a member of the Board’s Audit and Corporate Governance Committee and the Remuneration and Nomination Committee.
Directorships held in other listed entities during the three years prior to the current year
Moly Mines Ltd non-executive director - 10 June 2008 to 31 May 2013
Phillip Lockyer Non-executive director
Qualifications Dip Met, Assoc Min Eng, M.Min Econs
Experience Mr Lockyer is a Mining Engineer and Metallurgist who has over 50 years experience in the mineral industry, with a focus on gold and nickel in both underground and open pit operations. He was employed by WMC Resources for 20 years and as General Manager for Western Australia was responsible for WMC’s nickel division and gold operations. Mr Lockyer also held the position of Director Operations for Dominion Mining Limited and Resolute Limited. He holds a Diploma of Metallurgy from the Ballarat School of Mines, an Associateship of Mining Engineering from the Western Australian School of Mines and a Masters of Minerals Economics from Curtin University. Mr Lockyer was appointed as a Director of the Company on 11 February 2008.
Interest in shares 200,000 Fully Paid Ordinary Shares
Special responsibilities Mr Lockyer is a member of the Board’s Audit and Corporate Governance Committee and the Remuneration and Nomination Committee.
Directorships held in other listed entities during the three years prior to the current year
CGA Mining Limited non-executive director - 9 January 2009 to 16 January 2013St Barbara Ltd non-executive director - 19 December 2006 to 31 March 2014Focus Minerals Ltd non-executive director - 7 December 2005 to 28 November 2013Western Desert Resources Ltd non-executive director - 1 June 2010 to presentRTG Mining Inc. non-executive director - 26 March 2013 to present
Ian McCubbing Non-executive director
Qualifications B.Com (Hons), CA, MBA (Ex), GAICD
Experience Mr McCubbing is a Chartered Accountant with more than 25 years experience, principally in the areas of corporate finance and mergers and acquisition. He spent more than 15 years working with ASX200 and other listed companies in senior finance roles, including positions as Finance Director and Chief Financial Officer in mining and industrial companies. Mr McCubbing was appointed as a Director of the Company on 1 August 2010.
Interest in shares 150,000 Fully Paid Ordinary Shares
Special responsibilities Mr McCubbing is a member of the Board’s Audit and Corporate Governance Committee (Committee Chairman).
Directorships held in other listed entities during the three years prior to the current year
Mirabela Nickel Ltd non-executive director - 1 January 2011 to 7 April 2014Alcyone Resources Ltd non-executive director - 17 February 2012 to 8 March 2013Avenira Limited non-executive director - 20 December 2012 to presentKasbah Resources Ltd non-executive director - 1 March 2011 to presentRimfire Pacific Limited Chairman – 25 July 2016 to present
For
per
sona
l use
onl
y
DIRECTORS’ REPORT
16 SWICK MINING SERVICES ANNUAL REPORT 2016
Company SecretaryMr Frank Campagna held the position of company secretary at the end of the financial year:
Qualifications B.Bus (Acc), CPA
Experience Company Secretary of Swick Mining Services Ltd since June 2014. Mr Campagna is a Certified Practicing Accountant with over 25 years’ experience as Company Secretary, Chief Financial Officer and Commercial Manager for listed resources and industrial companies. He presently operates a corporate consultancy practice which provides corporate secretarial and advisory services to both listed and unlisted companies.
Board committeesAt the date of this report, the committees and their current membership are as follows:
Audit and Corporate Governance Committee - Ian McCubbing (non-executive director and committee chairman), David Nixon (non-executive director) and Phillip Lockyer (non-executive director).
Remuneration and Nomination Committee - Andrew Simpson (non-executive chairman and committee chairman), David Nixon (non-executive director) and Phillip Lockyer (non-executive director).
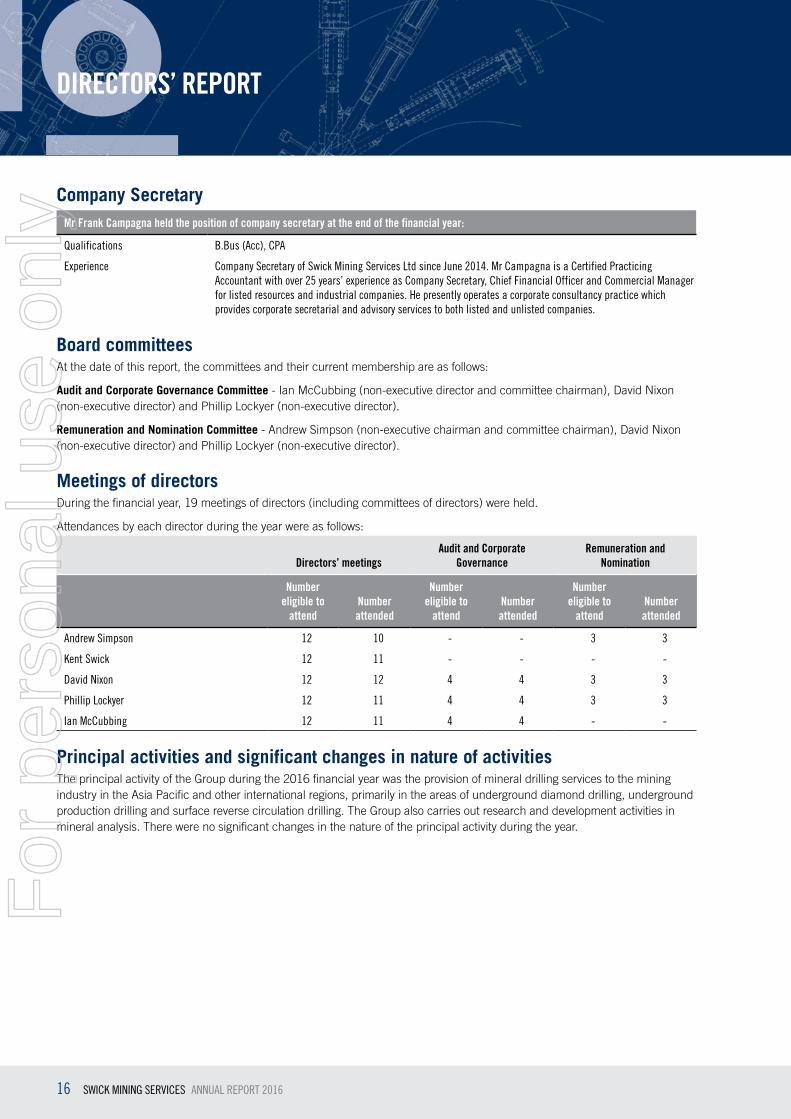
Meetings of directorsDuring the financial year, 19 meetings of directors (including committees of directors) were held.
Attendances by each director during the year were as follows:
Directors’ meetingsAudit and Corporate
GovernanceRemuneration and
Nomination
Number eligible to
attendNumber attended
Number eligible to
attendNumber attended
Number eligible to
attendNumber attended
Andrew Simpson 12 10 - - 3 3
Kent Swick 12 11 - - - -
David Nixon 12 12 4 4 3 3
Phillip Lockyer 12 11 4 4 3 3
Ian McCubbing 12 11 4 4 - -
Principal activities and significant changes in nature of activitiesThe principal activity of the Group during the 2016 financial year was the provision of mineral drilling services to the mining industry in the Asia Pacific and other international regions, primarily in the areas of underground diamond drilling, underground production drilling and surface reverse circulation drilling. The Group also carries out research and development activities in mineral analysis. There were no significant changes in the nature of the principal activity during the year.
For
per
sona
l use
onl
y

DIRECTORS’ REPORT
17ANNUAL REPORT 2016 SWICK MINING SERVICES
Operating results and review of operations for the yearReview of result
2016 FINANCIAL RESULTS (UNAUDITED NON-IFRS) 2016 2015 Change
$000 $000 %
Profit & Loss
Revenue and other income 124,885 131,981 (5.4%)
EBITDA (reported) 14,761 11,888 24.2%
EBITDA (before significant items) 14,761 17,227 (14.3%)
EBIT (reported) (1,076) (23,029) (95.3%)
EBIT (before significant items) (416) 1,975 (121.1%)
NPAT (reported) (2,806) (17,533) (84.0%)
NPAT (before significant items) (1,319) (30) (4297%)
Cash Flow
Net cash from operating activities 18,488 13,632 35.6%
Net cash used in investing activities (13,842) (15,426) (10.3%)
Free cash flow 4,646 (1,794) 359.0%
Operating cash flow before interest and taxes 17,790 16,668 6.7%
At Balance Date
Cash 4,690 5,729 (18.1%)
Debt 20,116 25,020 (19.6%)
Net Debt 15,426 19,291 (20.0%)
Ratios
EBITDA margin (before significant items) 11.8% 13.1%
EBIT margin (before significant items) (0.3%) 1.5%
Basic EPS (reported) – cents per share (1.2) (8.1)
EBITDA cash conversion (%) 120.5% 96.8%
Gearing (Net debt/equity) (%) 17.1% 20.7%
2016 Consolidated Results 2015 Consolidated Results
Before Tax$000
Tax$000
After Tax$000
Before Tax$000
Tax$000
After Tax$000
Significant items
1. One-off redundancy costs of restructuring - - - 472 (141) 331
2. Loss recognised on disposal of associate - - - 732 (220) 512
3. Increase in provision for stock obsolescence - - - 4,135 (1,241) 2,894
Significant items impacting EBITDA - - - 5,339 (1,602) 3,737
4. Impairment of assets 660 (115) 545 19,665 (5,899) 13,766
5. Derecognition of deferred tax assets - 942 942 - - -
Significant items impacting EBIT & NPAT 660 827 1,487 25,004 (7,501) 17,503
For
per
sona
l use
onl
y

DIRECTORS’ REPORT
18 SWICK MINING SERVICES ANNUAL REPORT 2016
Review of operationsThe net assets of the Group decreased by $3.4 million to $90.0 million at 30 June 2016. This decrease is primarily due to the loss incurred in the 2016 financial year as well as the reduction in equity as a result of share buyback. Working capital investment (trade receivables plus inventories plus prepayments less trade payables) and borrowings (debt) reduced by $3.1 million and $4.9 million respectively.
The Directors believe the Group is in a strong and stable financial position to weather the current tough trading conditions and take advantage of opportunities as they arise.
The underlying result for the 2016 financial year was a result which reflected the ongoing tough economic environment in which the Company operates. The Company was able to achieve improved efficiency and productivity to offset lower overall activity and ongoing price pressures. However, maintenance costs associated with rig upgrades and increased rig mobilisations and de-mobilisations compared to the normal market conditions as a result of clients managing their drill programs impacted margins and contributed to the underlying loss for the year.
The underlying result was impacted by non-cash write-off of non-core equipment and de-recognition of deferred tax assets in international operations during the first half of the year totalling $1.5 million after tax.
Diligent management of working capital and discipline on capital spending resulted in the Company generating free cash flows of $4.6 million. The Company used the free cash flow to pay down debt by $4.9 million and spent $0.8 million on share buyback during the financial year.
Swick achieved a record in metres drilled in its core UD division within Australia, driven by a 10.4% increase in metres per shift and a 16.4% improvement in metres per man-hour.
The Group’s revenue and EBITDA profile excluding significant items over the past five years is graphically illustrated below:
EBITDA ($M)Revenue ($M)
Half Yearly Revenue and EBITDA (excluding significant items)
78
6560
1H12 2H12 1H13 2H13 1H14 2H14 1H15 2H15 1H16 2H16
70
14
66
15
76
16
70
14
57
7
61
10
63
8 8
68
For
per
sona
l use
onl
y
DIRECTORS’ REPORT
19ANNUAL REPORT 2016 SWICK MINING SERVICES
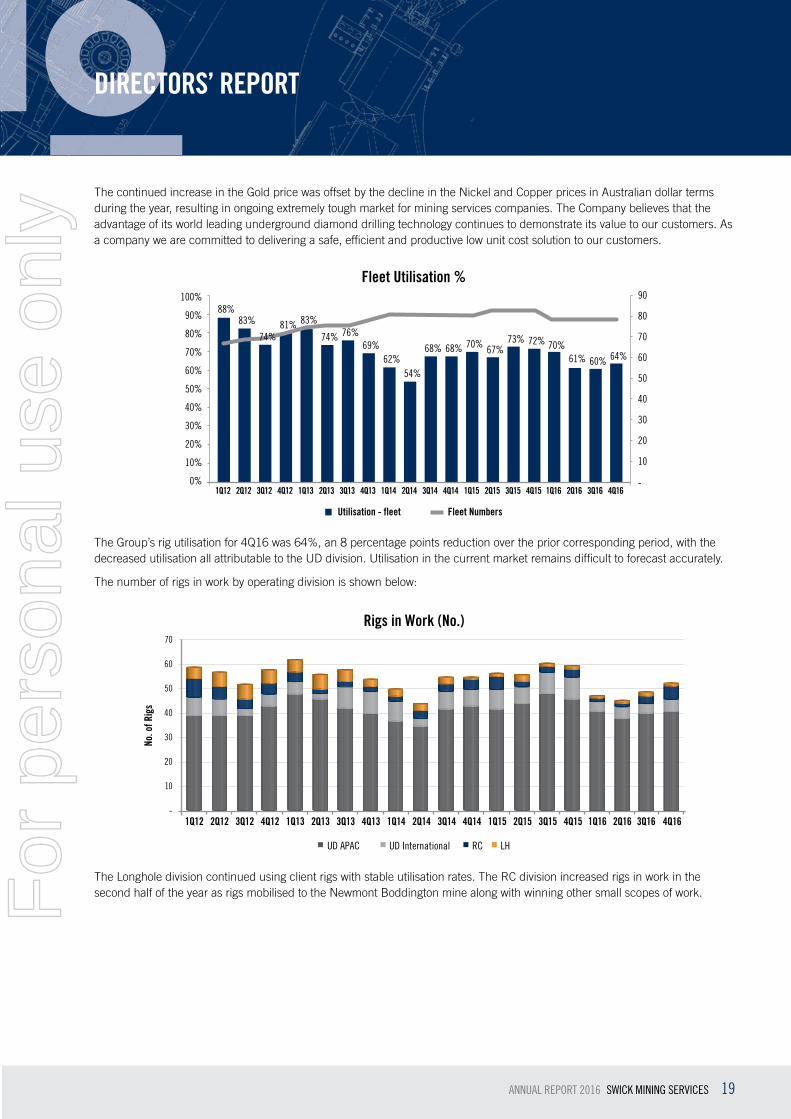
The continued increase in the Gold price was offset by the decline in the Nickel and Copper prices in Australian dollar terms during the year, resulting in ongoing extremely tough market for mining services companies. The Company believes that the advantage of its world leading underground diamond drilling technology continues to demonstrate its value to our customers. As a company we are committed to delivering a safe, efficient and productive low unit cost solution to our customers.
Utilisation - fleet Fleet Numbers
Fleet Utilisation %
68%68%
54%62%
69%74%
83%81%83%88%
1Q12 2Q12 3Q12 4Q12 1Q13 2Q13 3Q13 4Q13 1Q14 2Q14 3Q14 4Q14
70% 67%73% 72%
1Q15 2Q15 3Q15 4Q15
70%61% 60% 64%
1Q16 2Q16 3Q16 4Q16
76%
10
-
20
30
40
50
60
70
80
90
10%
0%
20%
30%
40%
50%
60%
70%
80%
90%
100%
74%
The Group’s rig utilisation for 4Q16 was 64%, an 8 percentage points reduction over the prior corresponding period, with the decreased utilisation all attributable to the UD division. Utilisation in the current market remains difficult to forecast accurately.
The number of rigs in work by operating division is shown below:
UD APAC UD International RC LH
1Q12 2Q12 3Q12 4Q12 1Q13 2Q13 3Q13 4Q13 1Q14 2Q14 3Q14 4Q14 1Q15 2Q15 3Q15 4Q15 1Q16 2Q16 3Q16 4Q16-
No. o
f Rig
s
10
20
30
40
50
60
70
Rigs in Work (No.)
The Longhole division continued using client rigs with stable utilisation rates. The RC division increased rigs in work in the second half of the year as rigs mobilised to the Newmont Boddington mine along with winning other small scopes of work.F
or p
erso
nal u
se o
nly
DIRECTORS’ REPORT
20 SWICK MINING SERVICES ANNUAL REPORT 2016
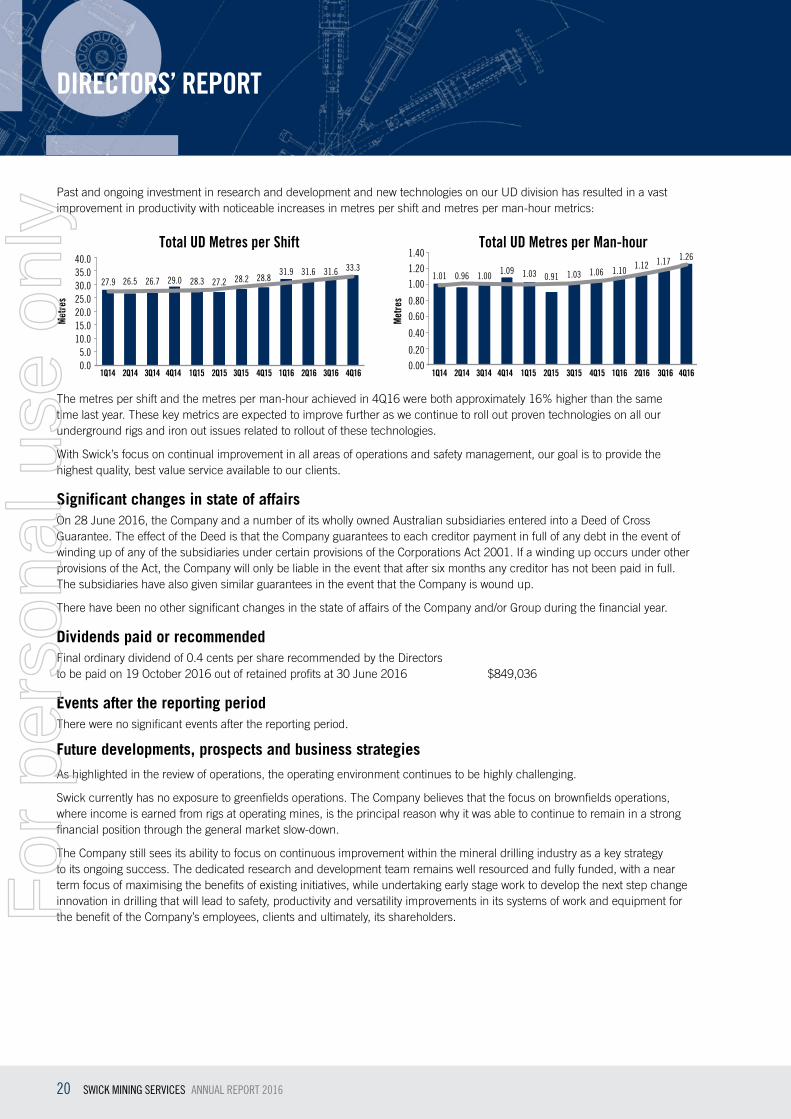
Past and ongoing investment in research and development and new technologies on our UD division has resulted in a vast improvement in productivity with noticeable increases in metres per shift and metres per man-hour metrics:
Total UD Metres per Shift Total UD Metres per Man-hour
27.9 27.2 28.2 28.831.9 31.6 31.6 33.3
1.01 0.96 1.00 1.09 1.03 0.91 1.03 1.06 1.10 1.12 1.17 1.26
26.5 26.7 29.0 28.3
1Q14 2Q14 3Q14 4Q14 1Q15 2Q15 3Q15 4Q15 1Q16 2Q16 3Q16 4Q16 1Q14 2Q14 3Q14 4Q14 1Q15 2Q15 3Q15 4Q15 1Q16 2Q16 3Q16 4Q160.0 0.00
0.20
0.40
0.60
0.80
1.00
1.20
1.40
5.010.015.020.025.030.035.040.0
Met
res
Met
res
The metres per shift and the metres per man-hour achieved in 4Q16 were both approximately 16% higher than the same time last year. These key metrics are expected to improve further as we continue to roll out proven technologies on all our underground rigs and iron out issues related to rollout of these technologies.
With Swick’s focus on continual improvement in all areas of operations and safety management, our goal is to provide the highest quality, best value service available to our clients.
Significant changes in state of affairsOn 28 June 2016, the Company and a number of its wholly owned Australian subsidiaries entered into a Deed of Cross Guarantee. The effect of the Deed is that the Company guarantees to each creditor payment in full of any debt in the event of winding up of any of the subsidiaries under certain provisions of the Corporations Act 2001. If a winding up occurs under other provisions of the Act, the Company will only be liable in the event that after six months any creditor has not been paid in full. The subsidiaries have also given similar guarantees in the event that the Company is wound up.
There have been no other significant changes in the state of affairs of the Company and/or Group during the financial year.
Dividends paid or recommendedFinal ordinary dividend of 0.4 cents per share recommended by the Directors to be paid on 19 October 2016 out of retained profits at 30 June 2016 $849,036
Events after the reporting periodThere were no significant events after the reporting period.
Future developments, prospects and business strategiesAs highlighted in the review of operations, the operating environment continues to be highly challenging.
Swick currently has no exposure to greenfields operations. The Company believes that the focus on brownfields operations, where income is earned from rigs at operating mines, is the principal reason why it was able to continue to remain in a strong financial position through the general market slow-down.
The Company still sees its ability to focus on continuous improvement within the mineral drilling industry as a key strategy to its ongoing success. The dedicated research and development team remains well resourced and fully funded, with a near term focus of maximising the benefits of existing initiatives, while undertaking early stage work to develop the next step change innovation in drilling that will lead to safety, productivity and versatility improvements in its systems of work and equipment for the benefit of the Company’s employees, clients and ultimately, its shareholders.F
or p
erso
nal u
se o
nly
DIRECTORS’ REPORT
21ANNUAL REPORT 2016 SWICK MINING SERVICES
Operational outlookSwick expects its rig utilisation to improve slightly above the current levels of 64% through at least the first half of the 2017 financial year. The utilisation in the longer term remains difficult to predict, with a continued recovery in commodity prices likely to have a favourable impact on utilisation, while a reversal of this trend could lead to further mine closures which would adversely impact utilisation. The Company’s forward order book as at 30 June 2016 is estimated at $99 million (excludes the Jundee contract renewal for a further two years worth $40 million finalised in August 2016). Swick is entering financial year 2017 with a record run rate in underground diamond coring in Australia, and has been able to maintain a level of stability in rigs in work and clientele in the UD division through the year.
Environmental regulationIn the course of its drilling activities, the Group is required to adhere to environmental regulations imposed on it by various regulatory authorities, particularly those regulations relating to ground disturbance and the protection of rare and endangered flora and fauna. From time to time, compliance with these environmental regulations is audited by client personnel, where deemed necessary.
The Group has not received any notification from any regulatory authority or client of any breaches of environmental regulations and to the best of its knowledge has complied with all material environmental requirements up to the date of this report.
Indemnifying officersDuring the financial year, the Company paid a premium to insure all the directors and officers against liabilities for any costs and expenses incurred by them in defending legal proceedings arising from their conduct while acting in the capacity of directors and officers of the Company, other than conduct which might be a wilful breach of duty in relation to the Company.
OptionsAs at the date of this report, there were no options on issue.
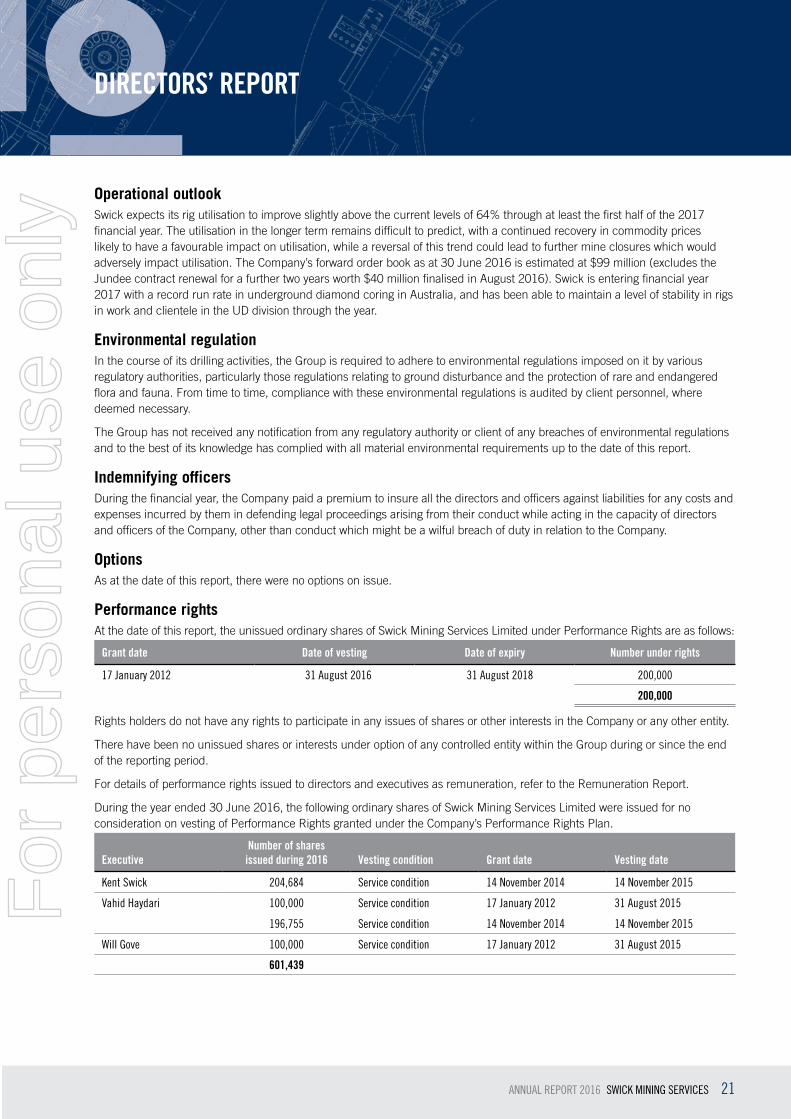
Performance rightsAt the date of this report, the unissued ordinary shares of Swick Mining Services Limited under Performance Rights are as follows:
Grant date Date of vesting Date of expiry Number under rights
17 January 2012 31 August 2016 31 August 2018 200,000
200,000
Rights holders do not have any rights to participate in any issues of shares or other interests in the Company or any other entity.
There have been no unissued shares or interests under option of any controlled entity within the Group during or since the end of the reporting period.
For details of performance rights issued to directors and executives as remuneration, refer to the Remuneration Report.
During the year ended 30 June 2016, the following ordinary shares of Swick Mining Services Limited were issued for no consideration on vesting of Performance Rights granted under the Company’s Performance Rights Plan.
ExecutiveNumber of shares issued during 2016 Vesting condition Grant date Vesting date
Kent Swick 204,684 Service condition 14 November 2014 14 November 2015
Vahid Haydari 100,000 Service condition 17 January 2012 31 August 2015
196,755 Service condition 14 November 2014 14 November 2015
Will Gove 100,000 Service condition 17 January 2012 31 August 2015
601,439
For
per
sona
l use
onl
y

DIRECTORS’ REPORT
22 SWICK MINING SERVICES ANNUAL REPORT 2016
Proceedings on behalf of CompanyNo person has applied for leave of Court to bring proceedings on behalf of the Company or intervene in any proceedings to which the Company is a party for the purpose of taking responsibility on behalf of the Company for all or any part of those proceedings. The Company was not a party to any such proceedings during the year.
Non-audit services provided by AuditorDetails of amounts paid or payable to the auditor for non-audit services provided during the year are outlined in Note 6.9 to the financial statements. No non-audit services were provided during the year.
The Board, in accordance with advice from the Audit and Corporate Governance Committee, is satisfied that the provision of non-audit services, when provided, is compatible with the general standard of independence for auditors imposed by the Corporations Act 2001. The directors use the principles set out below to judge whether the external auditor’s independence is compromised:
+ All non-audit services are reviewed and approved by the audit committee prior to commencement to ensure they do not adversely affect the integrity and objectivity of the auditor; and
+ The nature of the services provided does not compromise the general principles relating to auditor independence in accordance with APES 110: Code of Ethics for Professional Accountants set by the Accounting Professional and Ethical Standards Board.
Auditor’s Independence DeclarationThe lead auditor’s Independence Declaration for the year ended 30 June 2016 has been received.
ASIC Corporations Instrument 2016/191The company is of the kind referred to in ASIC Corporations (Rounding in Financials/Directors’ Reports) Instrument 2016/191, dated 24 March 2016, and in accordance with that Corporations Instrument amounts in the Directors’ Report and the financial statements are rounded off to the nearest thousand dollars, unless otherwise indicated.
Remuneration Report (Audited)Remuneration policyThe remuneration policy of the Group is designed to align the interests of directors and management with the interests of shareholders and the Company’s objectives by providing a fixed remuneration component and, where appropriate, offering specific short-term (cash bonuses) and long-term (equity schemes) incentives linked to performance. The Board considers that the remuneration policy is appropriate and effective in its ability to attract, retain and motivate suitably qualified and experienced directors and management to direct and manage the Group’s business and corporate activities, as well as to create goal congruence with the Company’s shareholders.
Specifically, the remuneration policy has been put in place with the following aims in mind:
+ remuneration practices and systems should support the Company’s wider objectives and strategies;
+ remuneration of directors and management should be aligned to the long-term interests of shareholders within an appropriate control framework;
+ remuneration of directors and management should reflect their duties and responsibilities;
+ remuneration of directors and management should be comparative and competitive, thereby allowing the Company to attract, retain and motivate suitably qualified and experienced people; and
+ there should be a clear relationship between performance and remuneration.
Relationship between remuneration policy and Company performanceThe remuneration policy has been tailored to increase goal congruence between shareholders, directors and executives. Two methods have been applied to achieve this aim, the first being a performance-based bonus based on key performance indicators (KPI’s), and the second being the issue of performance rights and share options to Key Management Personnel to encourage the alignment of personal and shareholder interests, as well as a longer term retention strategy. The Company believes this policy will be effective in increasing shareholder wealth over time.
For
per
sona
l use
onl
y

DIRECTORS’ REPORT
23ANNUAL REPORT 2016 SWICK MINING SERVICES
The following table shows the gross revenue, profits and dividends for the last five years for the Company, as well as the share price at the end of the respective financial year. Analysis of the figures show an increase in profits in years 2012 and 2013 before the impact of the tough operating environment was felt in financial years 2014, 2015 and 2016. The Board is of the opinion that, after excluding the significant one off items incurred in 2015 and 2016, the financial results are a result of the tough macro-economic market conditions and hence are satisfied with the current positioning of the remuneration policy.
2016 2015 2014 2013 2012
$’000 $’000 $’000 $’000 $’000
Revenue and other income 124,885 131,981 117,615 146,535 136,418
Net profit/(loss) before tax (2,243) (24,549) 1,815 14,680 12,783
Net profit/(loss) after tax (2,806) (17,533) 1,535 11,310 9,698
Share price at start of year $0.13 $0.26 $0.29 $0.27 $0.40
Share price at end of year $0.14 $0.13 $0.26 $0.29 $0.27
Basic earnings/(loss) per share (1.2cps) (8.1cps) 0.7cps 4.9cps 4.1cps
Dividends declared 0.4 cps 0.2 cps 0.4 cps 1.2 cps 1.0 cps
Remuneration and Nomination CommitteeThe Board has established a Remuneration and Nomination Committee to assist the Board in fulfilling its responsibilities in relation to developing and assessing the Group’s remuneration policies to ensure that remuneration is sufficient and reasonable and that its relationship to performance is clear. The primary objectives of the Remuneration and Nomination Committee is to develop remuneration policies for the Group that are appropriate to the organisation with respect to its size, peers and market conditions, and to recommend remuneration packages and incentive schemes for directors and management, and remuneration packages for non-executive directors, that motivate and reward performance, attract and retain quality people, and align interests with those of shareholders.
Remuneration structure - non-executive directorsObjectiveThe Board seeks to set remuneration for non-executive directors at a level which provides the Company with the ability to attract and retain suitably qualified and experienced directors, whilst incurring a cost which is acceptable to shareholders. Non- executive directors should be adequately remunerated for their time and effort and the risks inherently involved with holding such a position.
StructureRemuneration levels for non-executive directors are reviewed at least annually by the Remuneration and Nomination Committee. The Remuneration and Nomination Committee provides recommendations for the remuneration of non-executive directors, including the Chairman, and the Board is then responsible for ratifying the recommendations, if appropriate. As at the date of this report, remuneration for non-executive directors was set at $66,950 per annum plus superannuation, with remuneration for the non-executive chairman set at $100,425 per annum plus superannuation.
The Remuneration and Nomination Committee has also set an additional amount payable to the chairman of the Audit and Corporate Governance Committee of $10,300 per annum plus superannuation.
Remuneration structure - executive directors & managementObjectiveThe remuneration for executive directors and management is designed to promote superior performance and long-term commitment to the Company. The Board aims to reward executive directors and management with a level and mix of remuneration commensurate with their position and responsibilities within the Group.
The Company’s remuneration policy for executive directors and management reflects its commitment to align remuneration with shareholders’ interests and to retain appropriately qualified executive talent for the benefit of the Group.
For
per
sona
l use
onl
y

DIRECTORS’ REPORT
24 SWICK MINING SERVICES ANNUAL REPORT 2016
The principles of the policy are:
+ to provide rewards that reflect the competitive market in which the Company operates;
+ individual reward should be linked to performance criteria; and
+ executives should be rewarded for both financial and non-financial performance.
StructureRemuneration for executive directors and management may comprise fixed and variable remuneration components. Remuneration is reviewed at least annually by the Remuneration and Nomination Committee. The Remuneration and Nomination Committee provides recommendations for the remuneration of executive directors and management and the Board is then responsible for ratifying the recommendations, if appropriate. Remuneration packages for executive directors and management currently comprise a base salary and superannuation (fixed components), and may also include cash bonuses and securities (variable, performance based components).
In determining individual remuneration packages, the Remuneration and Nomination Committee reviews the individual’s annual performance, specific roles and responsibilities, and remuneration relative to their position within the Group and with positions in comparable companies through the use of market data and surveys. Where appropriate, a package may be adjusted to reflect the role, responsibilities and importance of that position and to keep pace with market trends and ensure continued remuneration competitiveness. In conducting a comparative analysis, the Group’s expected performance for the year is considered in the context of the Group’s capacity to fund remuneration budgets. From time to time, a review of the total remuneration package by an independent remuneration consultant may be undertaken to provide an independent reference point.
During the year, the Company carried out a review of its remuneration policy for executive directors and management. The review resulted in the following changes:
+ Minor changes to the remuneration mix of executive directors and management.
+ Introduction of “premium priced” options in the LTI for executive directors in lieu of performance rights.
+ Increasing the vesting period for performance rights from the current structure where 50% of the rights vest on grant and 50% vest after a year to now 100% of the rights granted vest after two years as long as all other conditions are met.
+ The Company has setup an employee share trust (Swick Mining Services Limited Employee Share Trust). The trust will purchase and hold Swick shares on-market for issue on vesting of outstanding performance rights or options. This approach to purchase shares on-market instead of issuing new shares for performance rights and options will minimise share dilution.
Fixed remunerationThe components of the fixed remuneration of executive directors and management are determined individually and may include:
+ cash remuneration;
+ superannuation;
+ accommodation and travel benefits;
+ motor vehicle; and
+ other benefits.
Variable remunerationThe components of the variable remuneration of executive directors and management are determined individually and may include:
+ Short term incentives (non-salary cash based incentives) – executive directors and management are eligible to participate in a cash bonus if so determined by the Remuneration and Nomination Committee and the Board: and
+ Long term incentives – executive directors and management are eligible to receive share options and performance rights if so determined by the Remuneration and Nomination Committee and the Board.F
or p
erso
nal u
se o
nly
DIRECTORS’ REPORT
25ANNUAL REPORT 2016 SWICK MINING SERVICES
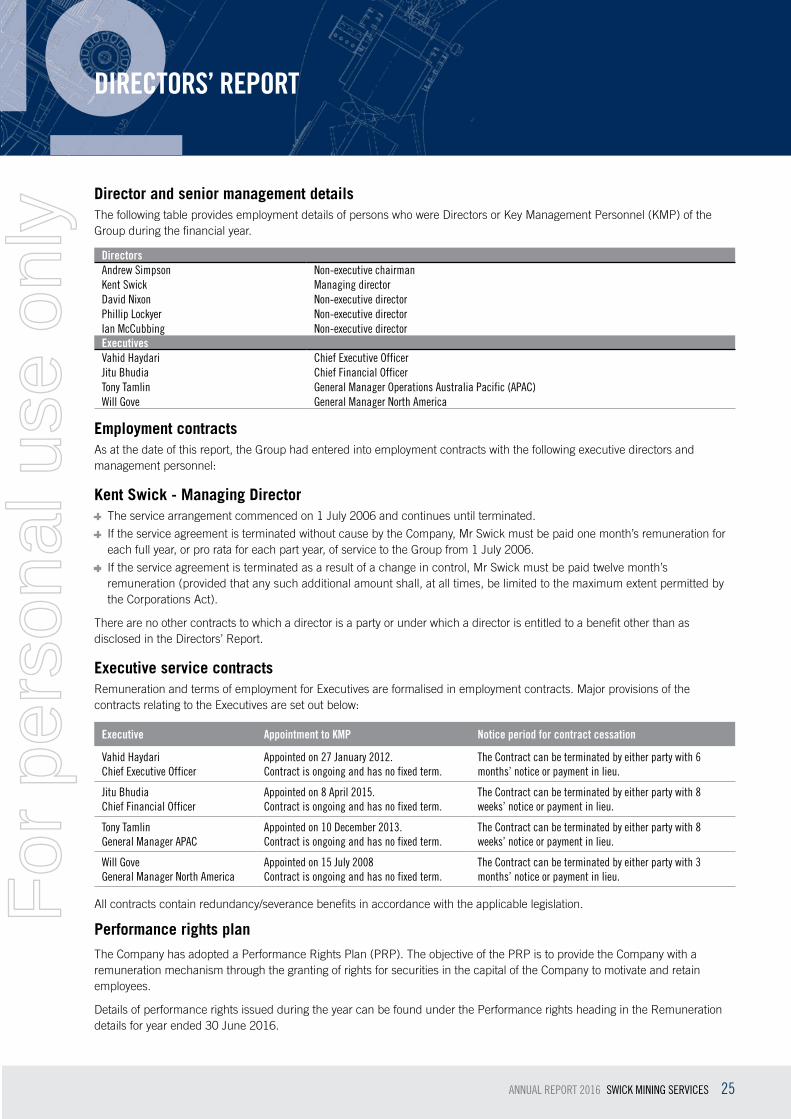
Director and senior management detailsThe following table provides employment details of persons who were Directors or Key Management Personnel (KMP) of the Group during the financial year.
DirectorsAndrew Simpson Non-executive chairmanKent Swick Managing directorDavid Nixon Non-executive directorPhillip Lockyer Non-executive directorIan McCubbing Non-executive directorExecutivesVahid Haydari Chief Executive OfficerJitu Bhudia Chief Financial OfficerTony Tamlin General Manager Operations Australia Pacific (APAC)Will Gove General Manager North America
Employment contractsAs at the date of this report, the Group had entered into employment contracts with the following executive directors and management personnel:
Kent Swick - Managing Director + The service arrangement commenced on 1 July 2006 and continues until terminated.
+ If the service agreement is terminated without cause by the Company, Mr Swick must be paid one month’s remuneration for each full year, or pro rata for each part year, of service to the Group from 1 July 2006.
+ If the service agreement is terminated as a result of a change in control, Mr Swick must be paid twelve month’s remuneration (provided that any such additional amount shall, at all times, be limited to the maximum extent permitted by the Corporations Act).
There are no other contracts to which a director is a party or under which a director is entitled to a benefit other than as disclosed in the Directors’ Report.
Executive service contractsRemuneration and terms of employment for Executives are formalised in employment contracts. Major provisions of the contracts relating to the Executives are set out below:
Executive Appointment to KMP Notice period for contract cessation
Vahid Haydari Chief Executive Officer
Appointed on 27 January 2012. Contract is ongoing and has no fixed term.
The Contract can be terminated by either party with 6 months’ notice or payment in lieu.
Jitu Bhudia Chief Financial Officer
Appointed on 8 April 2015. Contract is ongoing and has no fixed term.
The Contract can be terminated by either party with 8 weeks’ notice or payment in lieu.
Tony Tamlin General Manager APAC
Appointed on 10 December 2013. Contract is ongoing and has no fixed term.
The Contract can be terminated by either party with 8 weeks’ notice or payment in lieu.
Will Gove General Manager North America
Appointed on 15 July 2008Contract is ongoing and has no fixed term.
The Contract can be terminated by either party with 3 months’ notice or payment in lieu.
All contracts contain redundancy/severance benefits in accordance with the applicable legislation.
Performance rights planThe Company has adopted a Performance Rights Plan (PRP). The objective of the PRP is to provide the Company with a remuneration mechanism through the granting of rights for securities in the capital of the Company to motivate and retain employees.
Details of performance rights issued during the year can be found under the Performance rights heading in the Remuneration details for year ended 30 June 2016.
For
per
sona
l use
onl
y

DIRECTORS’ REPORT
26 SWICK MINING SERVICES ANNUAL REPORT 2016
Share options planThe Company has adopted a Share Options Plan (SOP) that provides the Company with a remuneration mechanism for executive directors through the granting of “premium priced” options for securities in the capital of the Company to motivate and retain executive directors.
Performance based remunerationThe table below outlines the theoretical split between fixed and performance based remuneration for the directors and Key Management Personnel. The estimated percentage splits are based on 100% compliance with any relevant performance criteria:
Proportions of elements of remuneration related
to performance
Proportions of elements of remuneration not related
to performance
Non-salary cash based incentives
%
Performance rights or options
%
Fixed salary/fees
%Total
%
Non-executive directorsAndrew Simpson 0% 0% 100% 100%David Nixon 0% 0% 100% 100%Phillip Lockyer 0% 0% 100% 100%Ian McCubbing 0% 0% 100% 100%Other executivesKent Swick 28% 17% 55% 100%Vahid Haydari 28% 17% 55% 100%Jitu Bhudia 24% 17% 59% 100%Tony Tamlin 27% 7% 66% 100%Will Gove 27% 7% 66% 100%
Remuneration details for the year ended 30 June 2016The following table of benefits and payment details, in respect to the financial year, the components of remuneration for the Key Management Personnel of the Group:
Table of benefits and payments for the year ended 30 June 2016
Short-term benefits Post-employment benefits
Equity-settled share-based
payments Total
2016
Salary, fees and leave
$
Profit share and bonuses
$
Non-monetary
$
Pension and superannuation
$
Termination benefits
$
Performance rights
$Total
$
Performance based
%
Andrew Simpson1 104,288 - - 9,907 - - 114,195 0%David Nixon 73,143 - - - - - 73,143 0%Phillip Lockyer1 69,525 - - 6,605 - - 76,130 0%Ian McCubbing1 80,221 - - 7,621 - - 87,842 0%Total non-executive directors 327,177 - - 24,133 - - 351,310 0%Kent Swick 609,369 48,822 - 25,000 - 19,591 702,782 10%Vahid Haydari 584,758 46,930 1,303 25,000 - 336,253 994,244 39%Jitu Bhudia 333,538 - 3,784 28,610 - 58,162 424,094 14%Tony Tamlin 303,739 23,778 10,605 27,023 - 24,000 389,145 12%Will Gove 280,792 - 29,068 28,058 - 13,258 351,176 4%Total other executives 2,112,196 119,530 44,760 133,691 - 451,264 2,861,441 20%Total payments and benefits 2,439,373 119,530 44,760 157,824 - 451,264 3,212,751 18%
Note: 1) Amounts differ to the amount in the structure because the year had 27 fortnightly pays, not the usual 26
For
per
sona
l use
onl
y

DIRECTORS’ REPORT
27ANNUAL REPORT 2016 SWICK MINING SERVICES
Table of benefits and payments for the year ended 30 June 2015
Short-term benefitsPost-employment
benefits
Equity-settled
share-based payments Total
2015
Salary, fees and leave
$
Profit share and bonuses
$Non-monetary
$
Pension and superannuation
$
Termination benefits
$
Performance rights
$Total
$
Performance based
%
Andrew Simpson 100,425 - - 9,540 - - 109,965 0%
David Nixon 73,310 - - - - - 73,310 0%
Phillip Lockyer 66,950 - - 6,360 - - 73,310 0%
Ian McCubbing 77,250 - - 7,339 - - 84,589 0%
Total non-executive directors 317,935 - - 23,239 - - 341,174 0%
Kent Swick 586,800 42,826 - 25,000 - 198,498 853,124 28%
Vahid Haydari 563,100 41,167 1,357 25,000 - 121,046 751,670 22%
Jitu Bhudia1 69,231 - 392 6,138 - - 75,761 -
Tony Tamlin 279,035 21,329 12,947 23,336 - 25,500 362,147 13%
Will Gove 276,284 19,361 19,642 25,701 - 15,676 356,664 10%
Bryan Wesley2 76,564 - 11,651 19,481 160,581 (17,107) 251,170 (7%)
Total other executives 1,851,014 124,683 45,989 124,656 160,581 343,613 2,650,536 18%
Total payments and benefits 2,168,949 124,683 45,989 147,895 160,581 343,613 2,991,710 16%
Notes: 1) commenced 8 April 2015 2) resigned 10 October 2014
Securities received that are not performance relatedNo members of KMP are entitled to receive securities which are not performance based as part of their remuneration.
BonusesDuring the year cash bonuses totalling $119,530 were paid in relation to the 2015 results in accordance with employment contracts. These bonus payments relate to the safety component of the short term incentives and were paid following an exceptional safety performance in 2015.
Performance rightsDuring the year the following share-based payment arrangements were in existence.
Rights series Grant date Expiry date Grant date fair value Vesting date
Issued 17 January 2012 17 January 2012 Note 1 $0.28 Note 1
Issued 14 November 2014 14 November 2014 Note 2 $0.26 Note 2For
per
sona
l use
onl
y

DIRECTORS’ REPORT
28 SWICK MINING SERVICES ANNUAL REPORT 2016
The terms and conditions relating to Performance Rights in operation during the year for KMP are as follows:
Grant dateVesting conditions
Vested/paid during year
Forfeited during year
Remaining as unvested Vesting date
Executive
Kent Swick 14 November 2014 Note 2 50% Note 2
Vahid Haydari 17 January 2012 Note 1 20% 20% Note 1
14 November 2014 Note 2 50% Note 2
Will Gove 17 January 2012 Note 1 20% 20% Note 1
Note 1 The performance rights with Swick Mining Services Limited vest in equal amounts of 100,000 annually subject to completion of each year of service. The performance rights vest evenly on 31 August of each year.
Note 2 The performance rights with Swick Mining Services Limited vested 50% on issue and 50% on 31 August 2014. In the case of Kent Swick, the relevant date is 14 November 2014, not 31 August.
Note 3 The dollar value of the percentage vested/paid during the period has been reflected in the table of benefits and payments.
All rights were issued by Swick Mining Services Limited and entitle the holder to 1 ordinary share in Swick Mining Services Limited upon vesting.
The following share-based payment compensation to KMP relate to the current financial year:
Executive Grant date
Balance at start of the year
Number granted in
2016
Number forfeited in
2016
Number vested
during year
Value on date of
exercise$
Balance at end of the
year
Financial year in which
grants vest2017
Kent Swick 14 November 2014 204,684 - - (204,684) 29,679 - -
Vahid Haydari 17 January 2012 200,000 - - (100,000) 14,500 100,000 100,000
14 November 2014 196,755 - - (196,755) 28,529 - -
Will Gove 17 January 2012 200,000 - - (100,000) 14,500 100,000 100,000
801,439 - - (601,439) 87,208 200,000 200,000
Note 1 The value of the Performance Rights granted is recognised in compensation over the vesting period of the grant, in accordance with Australian Accounting Standards. The value is based on the closing share price at the grant date.
The Company did not grant any new performance rights or options during the 2016 financial year due to the ongoing review of its remuneration policy for executive directors and management. This review was completed in August 2016 and the Company intends to make three grants of rights and options described below:
1. Performance rights to be granted to executive management under the old Performance Rights Plan. These grants pertain to entitlements for financial year 2015 and 100% of the rights under these grants are eligible to vest on grant date in accordance with the Company’s old Performance Plan rules:
Executive Expected grant date
Number of Performance Rights
granted Number forfeited
Financial year in which grants vest
2017 2018
Vahid Haydari 30 August 2016 1,267,345 - 1,267,345 -
Jitu Bhudia 30 August 2016 242,340 - 242,340 -
Tony Tamlin 30 August 2016 100,000 - 100,000 -
1,609,685 - 1,609,685 -
Note 1 The value of the Performance Rights granted is recognised in compensation over the vesting period of the grant, in accordance with Australian Accounting Standards. The value is based on the closing share price at the grant date.
For
per
sona
l use
onl
y

DIRECTORS’ REPORT
29ANNUAL REPORT 2016 SWICK MINING SERVICES
2. Performance rights to be granted to executive management under the new Performance Rights Plan. These grants pertain to entitlements for financial year 2016 and 100% of the rights under these grants will be eligible to vest after two years from grant date as long as all other plan conditions stipulated in the Company’s new Performance Plan rules are met:
Executive Expected grant date
Number of Performance
Rights grantedNumber forfeited
Financial year in which grants vest
2017 2018 2019
Vahid Haydari 30 August 2016 800,046 - - - 800,046
Jitu Bhudia 30 August 2016 477,075 - - - 477,075
Tony Tamlin 30 August 2016 443,857 - - - 443,857
Will Gove 30 August 2016 131,299 - - - 131,299
1,852,277 - - - 1,852,277
Note 1 The value of the Performance Rights granted is recognised in compensation over the vesting period of the grant, in accordance with Australian Accounting Standards. The value is based on the closing share price at the grant date.
3. Share options to be granted to the Managing Director (executive director) under the Company’s Share Option Plan. The Company intends to issue Share Options to Kent Swick at an exercise price based on a 43% premium to the Company’s 20 day volume weighted average share price at Grant date with an exercise period of two to four years. Grant date will be determined by shareholder approval at the next Annual General Meeting of the shareholders in November 2016.
KMP rights holdingsThe number of performance rights over ordinary shares held during the financial year by each KMP of the Group is as follows:
Balance at beginning of year
Granted during the year
Vested and exercised during the year
Forfeited during the year
Balance at end of year
Non-executive directorsAndrew Simpson - - - - -David Nixon - - - - -Phillip Lockyer - - - - -Ian McCubbing - - - - -
Other executivesKent Swick 204,684 - (204,684) - -Vahid Haydari 396,755 - (296,755) - 100,000Will Gove 200,000 - (100,000) - 100,000
801,439 - (601,439) - 200,000
For
per
sona
l use
onl
y

DIRECTORS’ REPORT
30 SWICK MINING SERVICES ANNUAL REPORT 2016
KMP shareholdingsThe number of ordinary shares in Swick Mining Services Limited held by each KMP of the Group during the financial year is as follows:
30 June 2016Balance at
beginning of year
Issued on exercise of rights during the year
Other changes during the year
Balance at end of year
Non-executive directorsAndrew Simpson 605,000 - - 605,000David Nixon 55,000 - 245,000 300,000Phillip Lockyer 200,000 - - 200,000Ian McCubbing 150,000 - - 150,000
Other executivesKent Swick 33,117,498 204,684 - 33,322,182Vahid Haydari 873,955 296,755 - 1,170,710Will Gove 900,000 100,000 - 1,000,000Tony Tamlin 100,000 - - 100,000
36,001,453 601,439 245,000 36,847,892
Other key management personnel transactionsThere have been no other transactions involving equity instruments other than those described in the tables above.
This Directors’ Report, incorporating the Remuneration Report, is signed in accordance with a resolution of the Board of Directors.
Kent SwickDated: 29 August 2016
For
per
sona
l use
onl
y
31ANNUAL REPORT 2016 SWICK MINING SERVICES
AUDITOR’S INDEPENDENCE DECLARATION
Liability limited by a scheme approved under Professional Standards Legislation.
Member of Deloitte Touche Tohmatsu Limited
Deloitte Touche Tohmatsu ABN 74 490 121 060 Tower 2, Brookfield Place 123 St Georges Terrace Perth WA 6000 GPO Box A46 Perth WA 6837 Australia Tel: +61 8 9365 7000 Fax: +61 9368 7001 www.deloitte.com.au
29 August 2016 Dear Board Members
Swick Mining Services Limited In accordance with section 307C of the Corporations Act 2001, I am pleased to provide the following declaration of independence to the directors of Swick Mining Services Limited. As lead audit partner for the audit of the financial statements of Swick Mining Services Limited for the financial year ended 30 June 2016, I declare that to the best of my knowledge and belief, there have been no contraventions of:
(i) the auditor independence requirements of the Corporations Act 2001 in relation to the audit; and
(ii) any applicable code of professional conduct in relation to the audit. Yours sincerely DELOITTE TOUCHE TOHMATSU D K Andrews Partner Chartered Accountants
The Board of Directors Swick Mining Services Limited 64 Great Eastern Highway South Guildford WA 6055
For
per
sona
l use
onl
y

CORPORATE GOVERNANCE STATEMENT
32 SWICK MINING SERVICES ANNUAL REPORT 2016
The Board and management of the Company are committed to high standards of corporate governance practices. Copies of relevant corporate governance policies and charters are available in the corporate governance section of the Company’s website at www.swickmining.com.
Board compositionDetails of the skills, experience and expertise relevant to the position of each director and Board committee member and their term of office and membership of each board committee and attendance at committee meetings, are set out in the Directors’ Report.
The Board sets out below details of those corporate governance matters where the Company’s practices depart from Corporate Governance Recommendations. Unless otherwise stated, corporate governance practices were in place for the entire financial year.
Recommendation Current practice
1.1 Disclose the respective roles and responsibilities of the board and management; and those matters expressly reserved to the board and those delegated to management.
The Board’s primary role is to formulate the strategic direction of the Company and to oversee the Company’s business activities and management. The Board Charter sets out the functions reserved for the Board and those delegated to senior management. A copy of the Board Charter is available on the Company’s website.
1.2 Companies should undertake appropriate checks before appointing a person as a director; and provide security holders with all material information in its possession relevant to a decision on whether or not to elect or re-elect a director.
Prior to a candidate being considered for appointment as a director of the Company, relevant enquiries are made as to the person’s character, experience, education, criminalrecord and bankruptcy history. Biographical details and other relevant information of directors standing for re-election are provided to shareholders in the notice of meeting. These requirements are contained in the Remuneration and Nomination Committee Charter, a copy of which is available on the Company’s website.
1.3 Companies should have a written agreement with each director and senior executive setting out the terms of their appointment.
Each director and senior executive of the Company has an agreement in writing with the Company, which sets out the key terms and conditions of their appointment including their duties, rights and responsibilities. These requirements are contained in the Remuneration and Nomination Committee Charter.
1.4 The company secretary should be accountable directly to the board, through the chair, on all matters to do with the proper functioning of the board.
The Board is responsible for the appointment and removal of the Company Secretary. The Board Charter sets out that the company secretary is accountable to the Board on all matters relating to the proper functioning of the Board.
1.5 Companies should have a diversity policy. A copy of the Company’s Diversity Policy is available on the website. The Company aims to achieve an appropriate mix of diversity on its Board, in senior management and throughout the organisation.Measurable diversity objectives have not yet been established as the Board is continuing to assess the merits of setting achievable targets. The proportion of female employees in the whole organisation is 5%. There are no females in senior executive positions or on the Board. The appropriate mix of skills and diversity for membership of the Board is considered by the Remuneration and Nomination Committee as part of ongoing nomination and succession planning and which recognises the value of balanced gender representation.
For
per
sona
l use
onl
y

CORPORATE GOVERNANCE STATEMENT
33ANNUAL REPORT 2016 SWICK MINING SERVICES
Recommendation Current practice
1.6 Disclose the process for periodically evaluating the performance of the board, its committees and individual directors; and whether a performance evaluation was undertaken in the reporting period.
The Board has adopted a formal process for an annual self-assessment of its collective performance, the performance of individual directors and of Board committees. The Board is required to meet annually with the purpose of reviewing the role of the Board, assessing its performance over the previous 12 months and examining ways in which the Board can better perform its duties. A formal assessment was undertaken in May 2016, using a self-assessment checklist as the basis for evaluation of performance against the requirements of the Board charter.
1.7 Companies should have and disclose a process for periodically evaluating the performance of its senior executives; and whether a performance evaluation was undertaken in the reporting period.
The performance of senior executives is reviewed annually by the Chief Executive Officer through a formal performance appraisal meeting, incorporating measurement against key performance indicators which are based on business plan initiatives. Formal appraisals of senior management were conducted during the year in accordance with performance evaluation policies. An annual performance appraisal of the Managing Director is undertaken by the Chairman and the Managing Director conducts a performance review of the Chief Executive Officer. The formal evaluation procedures are set out in the Board Charter.
2.1 The Board should establish a nomination committee. The Board has established a Remuneration and Nomination Committee which comprises a majority of independent directors and is chaired by an independent director. A copy of the charter is available on the Company’s website. Details of membership of the Committee are set out in the Directors’ Report.
2.2 Companies should have and disclose a board skills matrix. Requirements for the appropriate mix of skills and experience on the Board are contained in the Board Charter. The current skills matrix for the Board is as follows:
Experience and skillsNumber of directors
Accounting and finance 4
Business development and marketing 2
Research and development 1
Strategic planning and risk management 5
Mining and drilling industries 5
Public company directorship and management 5
Geographical
Australia 5
North America 3
2.3 Disclose the names of directors who are considered to be independent.
The independent directors of the Company are Andrew Simpson, David Nixon, Phillip Lockyer and Ian McCubbing. The Board has adopted ASX recommended principles in relation to the assessment of directors’ independence, other than the Board does not believe that length of service is a potential indicator that independence may have been compromised.
2.4 A majority of the board should be independent directors. The Board comprises five directors, four of whom are independent.
2.5 The chair should be an independent director and should not be the same person as the CEO.
Andrew Simpson is an independent director. The roles of chairman and chief executive officer are not combined.
For
per
sona
l use
onl
y

CORPORATE GOVERNANCE STATEMENT
34 SWICK MINING SERVICES ANNUAL REPORT 2016
Recommendation Current practice
2.6 Companies should have a program for inducting new directors and provide appropriate professional development opportunities.
New directors are provided with an induction including comprehensive briefings with the Chairman and senior executives, visits to operating sites and provision of information on the Company including Company and Board policies and other relevant corporate documents. Induction requirements are included in the Remuneration and Nomination Committee charter.All directors are expected to maintain the skills required to effectively discharge their obligations to the Company. Directors are encouraged to undertake professional development programs to develop and maintain the skills and knowledge needed to perform their role as directors of the Company.Directors have the right, in connection with their duties and responsibilities, to seek independent professional advice at the Company’s expense, subject to the prior written approval of the Chairman, which will not be unreasonably withheld.
3.1 Companies should have a code of conduct. A Code of Conduct has been established and applies to all directors and employees, to guide compliance with the legitimate interests of all stakeholders. A copy of the Company’s Code of Conduct is available on the website.
4.1 The Board should have an audit committee. The Board has established an Audit and Corporate Governance Committee which comprises a majority of independent directors and is chaired by an independent director. A copy of the charter is available on the Company’s website. Details of membership of the Committee are set out in the Directors’ Report.
4.2 The board should receive a declaration from the CEO and CFO that financial records have been properly maintained and that the financial statements comply with the appropriate accounting standards and give a true and fair view of the financial position and performance of the entity and that the opinion has been formed on the basis of a sound system of risk management and internal control which is operating effectively.
The Board requires the Chief Executive Officer and Chief Financial Officer to provide a declaration prior to the approval of the Company’s financial statements for each financial period.
4.3 Ensure that the external auditor attends the AGM and is available to answer questions.
The external auditor is requested to attend annual general meetings and to be available to answer shareholder questions about the conduct of the audit and the preparation and content of the audit report.
5.1 Have a written policy for complying with its continuous disclosure obligations under the Listing Rules.
The Board recognises the obligations of continuous disclosure and the Company has a formal written policy for the continuous disclosure of any price sensitive information concerning the Company. A copy of the Company’s Continuous Disclosure Policy is available on the website.
6.1 Provide information about itself and its corporate governance policies via its website.
Information relating to the Company and its governance practices is available on the Company’s website.
6.2 Design and implement an investor relations program to facilitate effective two-way communication with investors.
The Board has adopted a written policy covering arrangements to promote communications with shareholders. A copy of the Shareholder Communications policy is available on the website.
6.3 Disclose the policies and processes the company has in place to facilitate and encourage participation at meetings of security holders.
The Shareholder Communications policy sets out policies to encourage effective participation by shareholders at general meetings of the Company.
For
per
sona
l use
onl
y

CORPORATE GOVERNANCE STATEMENT
35ANNUAL REPORT 2016 SWICK MINING SERVICES
Recommendation Current practice
6.4 Give security holders the option to receive communications from and send communications to the Company and its security registry electronically.
The Company and the share registry offer mechanisms for electronic communication by shareholders, including an e-mail alert facility available through the Company’s website. Requirements are contained in the Shareholder Communications policy.
7.1 The board should have a committee or committees to oversee risk.
No separate risk committee has been established. The Board is responsible for the oversight of the Company’s risk management and control framework. Responsibility for internal control and risk management is delegated to the appropriate level of management within the Company with the Chief Executive Officer having ultimate responsibility to the Board for the risk management and control framework. The Audit and Corporate Governance Committee is responsible for oversight of risks relating to the finance functions of the Company, specifically in relation to managing exposure to credit, liquidity and market risks.A risk register has been developed which details material business risks arising from the Company’s operations. The risk register is presented to the Board annually and is reviewed and updated on a regular basis.The Company has procedures in place covering the oversight and management of material business risks arising within the minerals drilling industry. These policies and standards include management of hazards and exposures inherent in the Company’s business operations.Details of risk management practices are set out in the Risk Management Statement in the Corporate Governance section of the website.
7.2 The board or a committee of the board should review the Company’s risk management framework at least annually and disclose, in relation to each reporting period, whether such a review has taken place.
The Board conducts an annual review of the risk management framework. These reviews cover the process for the identification, assessment and management of material business risks. Management is required to report to the Board on the Company’s risk register and risk mitigation strategies on a regular basis. The Board has reviewed the risk register and risk management framework during the reporting period.
7.3 Disclose whether the Company has an internal audit function. The Company does not have a separate internal audit function as the Board believes that existing internal controls and management systems provide sufficient assurance that the Company’s risk management, governance and internal control processes are operating effectively. Senior management periodically undertake internal reviews of financial and operating systems and processes. External reviews of specific business activities or processes are undertaken as required.Operational, financial, legal, compliance, strategic and reputational risks are managed primarily by senior executives as part of the day-to-day management of the Company’s affairs. The support of relevant external professional advisers is engaged as required.F
or p
erso
nal u
se o
nly
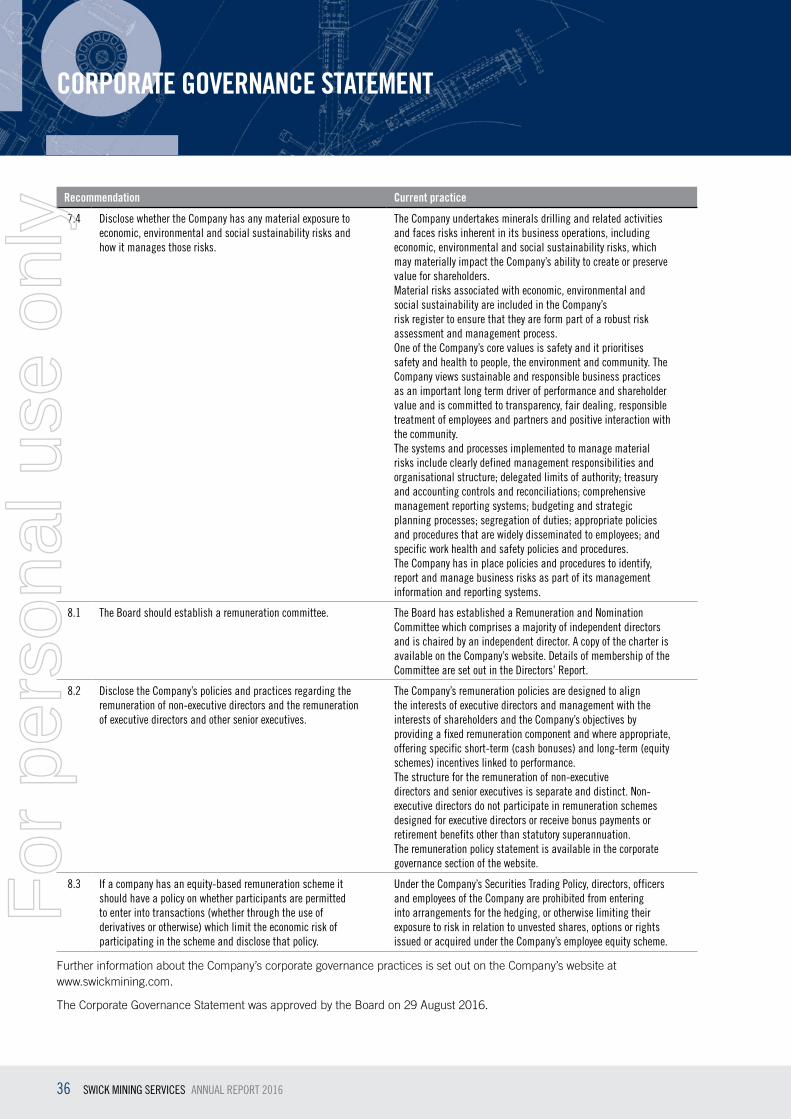
CORPORATE GOVERNANCE STATEMENT
36 SWICK MINING SERVICES ANNUAL REPORT 2016
Recommendation Current practice
7.4 Disclose whether the Company has any material exposure to economic, environmental and social sustainability risks and how it manages those risks.
The Company undertakes minerals drilling and related activities and faces risks inherent in its business operations, including economic, environmental and social sustainability risks, which may materially impact the Company’s ability to create or preserve value for shareholders.Material risks associated with economic, environmental and social sustainability are included in the Company’srisk register to ensure that they are form part of a robust risk assessment and management process.One of the Company’s core values is safety and it prioritises safety and health to people, the environment and community. The Company views sustainable and responsible business practices as an important long term driver of performance and shareholder value and is committed to transparency, fair dealing, responsible treatment of employees and partners and positive interaction with the community.The systems and processes implemented to manage material risks include clearly defined management responsibilities and organisational structure; delegated limits of authority; treasury and accounting controls and reconciliations; comprehensive management reporting systems; budgeting and strategic planning processes; segregation of duties; appropriate policies and procedures that are widely disseminated to employees; and specific work health and safety policies and procedures.The Company has in place policies and procedures to identify, report and manage business risks as part of its management information and reporting systems.
8.1 The Board should establish a remuneration committee. The Board has established a Remuneration and Nomination Committee which comprises a majority of independent directors and is chaired by an independent director. A copy of the charter is available on the Company’s website. Details of membership of the Committee are set out in the Directors’ Report.
8.2 Disclose the Company’s policies and practices regarding the remuneration of non-executive directors and the remuneration of executive directors and other senior executives.
The Company’s remuneration policies are designed to align the interests of executive directors and management with the interests of shareholders and the Company’s objectives by providing a fixed remuneration component and where appropriate, offering specific short-term (cash bonuses) and long-term (equity schemes) incentives linked to performance.The structure for the remuneration of non-executivedirectors and senior executives is separate and distinct. Non-executive directors do not participate in remuneration schemes designed for executive directors or receive bonus payments or retirement benefits other than statutory superannuation.The remuneration policy statement is available in the corporate governance section of the website.
8.3 If a company has an equity-based remuneration scheme it should have a policy on whether participants are permitted to enter into transactions (whether through the use of derivatives or otherwise) which limit the economic risk of participating in the scheme and disclose that policy.
Under the Company’s Securities Trading Policy, directors, officers and employees of the Company are prohibited from entering into arrangements for the hedging, or otherwise limiting their exposure to risk in relation to unvested shares, options or rights issued or acquired under the Company’s employee equity scheme.
Further information about the Company’s corporate governance practices is set out on the Company’s website at www.swickmining.com.
The Corporate Governance Statement was approved by the Board on 29 August 2016.
For
per
sona
l use
onl
y

For
per
sona
l use
onl
y

38 SWICK MINING SERVICES ANNUAL REPORT 2016
CONSOLIDATED STATEMENT OF PROFIT OR LOSS AND OTHER COMPREHENSIVE INCOME FOR THE YEAR ENDED 30 JUNE 2016
CONSOLIDATED GROUP
Note 2016 $000
2015 $000
Continuing operations
Revenue 2.2 123,178 130,976
Other income 2.2 1,707 1,005
Raw materials and consumables used (24,925) (23,434)
Employee benefits expense (68,012) (72,306)
Depreciation and amortisation expense 3.4, 3.5 (15,177) (15,252)
Increase in inventory obsolescence provision - (4,135)
Impairment of assets (660) (19,665)
Share of loss of associates - (229)
Loss recognised on gaining control in former associate 6.2 - (732)
Finance costs (1,167) (1,520)
Other expenses 2.3 (17,187) (19,257)
Loss before income tax (2,243) (24,549)
Income tax (expense)/benefit 2.4 (563) 7,016
Net loss from continuing operations after tax (2,806) (17,533)
Other comprehensive income:
Items that may be reclassified subsequently to profit or loss:
Exchange differences on translating foreign controlled entities 201 44
Reclassification adjustments relating to foreign associates disposed of in the year - 732
Net fair value gain on available-for-sale financial assets (84) 280
Other comprehensive income for the year, net of tax 117 1,056
Total comprehensive loss for the year (2,689) (16,477)
(Loss)/profit for the year attributable to:
Owners of the Company (2,675) (17,544)
Non-controlling interests (131) 11
(2,806) (17,533)
Earnings per share
Basic loss per share (cents) 2.6 (1.2) (8.1)
Diluted loss per share (cents) 2.6 (1.2) (8.1)
The consolidated statement of profit or loss and other comprehensive income should be read in conjunction with the accompanying notes.F
or p
erso
nal u
se o
nly

39ANNUAL REPORT 2016 SWICK MINING SERVICES
CONSOLIDATED STATEMENT OF FINANCIAL POSITIONAS AT 30 JUNE 2016
CONSOLIDATED GROUP
Note 2016 $000
2015 $000
Assets
Current assets
Cash 3.1 4,690 5,729
Trade and other receivables 3.2 19,127 21,779
Inventories 3.3 12,967 14,951
Prepayments 1,797 1,165
Current tax assets 1,225 2,036
Total current assets 39,806 45,660
Non-current assets
Property, plant and equipment 3.4 77,636 79,748
Intangible assets 3.5 10,079 9,851
Other financial assets 3.6 1,280 1,280
Net deferred tax assets 3.9 2,339 3,840
Total non-current assets 91,334 94,719
Total assets 131,140 140,379
Liabilities
Current liabilities
Trade and other payables 14,602 15,483
Borrowings 3.7 116 904
Provisions 3.8 4,822 5,321
Total current liabilities 19,540 21,708
Non-current liabilities
Borrowings 3.7 20,000 24,116
Provisions 3.8 1,567 1,128
Other financial liabilities 3.6 - 18
Total non-current liabilities 21,567 25,262
Total liabilities 41,107 46,970
Net assets 90,033 93,409
Equity
Issued capital 4.1 75,036 75,841
Reserves 4.2 2,604 2,360
Retained earnings 9,991 12,862
Equity attributable to owners of the Company 87,631 91,063
Non-controlling interests 2,402 2,346
Total equity 90,033 93,409
The consolidated statement of financial position should be read in conjunction with the accompanying notes.
For
per
sona
l use
onl
y

40 SWICK MINING SERVICES ANNUAL REPORT 2016
CONSOLIDATED STATEMENT OF CHANGES IN EQUITYFOR THE YEAR ENDED 30 JUNE 2016
RESERVES
Note
Issued capital
Retained earnings
Foreign currency
translation reserve
Asset revaluation
reserveShare-based
payments
Non-controlling
interest Total
$000 $000 $000 $000 $000 $000 $000
Consolidated Group
Balance at 1 July 2014 75,841 31,274 (145) - 1,001 - 107,971
Comprehensive income
(Loss)/profit for the year - (17,544) - - - 11 (17,533)
Other comprehensive income for the year - - 776 280 - 1,056
Total comprehensive income/(loss) for the year - (17,544) 776 280 - 11 (16,477)
Transactions with owners, in their capacity as owners, and other transfers
Additional non-controlling interests arising on the acquisition of Orexplore - - - - - 2,335 2,335
Share-based payments - - - - 448 - 448
Dividends recognised for the year 2.5 - (868) - - - - (868)
Total transactions with owners and other transfers - (868) - - 448 2,335 1,915
Balance at 30 June 2015 75,841 12,862 631 280 1,449 2,346 93,409
Comprehensive income
Loss for the year - (2,675) - - - (131) (2,806)
Other comprehensive income/ (loss) for the year - - 210 (84) - (9) 117
Total comprehensive income/ (loss) for the year - (2,675) 210 (84) - (140) (2,689)
Transactions with owners, in their capacity as owners, and other transfers
Change of interest in Orexplore - (196) - - - 196 -
Share-based payments - - - - 118 - 118
Transaction costs (2) - - - - - (2)
Shares bought back during the year (803) - - - - - (803)
Total transactions with owners and other transfers (805) (196) - - 118 196 (687)
Balance at 30 June 2016 75,036 9,991 841 196 1,567 2,402 90,033
The consolidated statement of changes in equity should be read in conjunction with the accompanying notes.
For
per
sona
l use
onl
y

41ANNUAL REPORT 2016 SWICK MINING SERVICES
CONSOLIDATED STATEMENT OF CASH FLOWSFOR THE YEAR ENDED 30 JUNE 2016
CONSOLIDATED GROUP
Note 2016 $000
2015 $000
Cash flows from operating activities
Receipts from customers 142,156 140,999
Payments to suppliers and employees (124,366) (124,331)
Income tax refund/(paid) 1,856 (1,525)
Net interest paid (1,158) (1,511)
Net cash provided by operating activities 3.1 18,488 13,632
Cash flows from investing activities
Proceeds from sale of property, plant and equipment 97 506
Purchase of property, plant and equipment (11,033) (12,824)
Payments for development costs (3,035) (2,721)
Investment in associates - (542)
Cash inflow on acquisition of subsidiary - 19
Investment income 129 136
Net cash used in investing activities (13,842) (15,426)
Cash flows from financing activities
Proceeds from borrowings - 5,000
Repayment of borrowings (4,904) (824)
Dividends paid by parent entity - (868)
Share buy-back payment (803) -
Share transaction costs (2) -
Net cash used in/(provided by) financing activities (5,709) 3,308
Net (decrease)/increase in cash (1,063) 1,514
Cash at beginning of financial year 5,729 4,194
Effects of exchange rate changes on cash 24 21
Cash at end of financial year 3.1 4,690 5,729
The consolidated statement of cash flows should be read in conjunction with the accompanying notes.
For
per
sona
l use
onl
y

NOTES TO THE FINANCIAL STATEMENTSFOR THE YEAR ENDED 30 JUNE 2016
42 SWICK MINING SERVICES ANNUAL REPORT 2016
1 General Notes1.1 General Information
Swick Mining Services Ltd (the “Parent” or the “Company”) (ASX:SWK) is a public company listed on the Australian Securities Exchange (“ASX”) and is incorporated in Australia. Swick Mining Services Ltd and its subsidiaries (collectively referred to as “Swick Mining Services Group” or the “Group”) operate extensively throughout Australia and internationally.
The address for its registered office and principal place of business is as follows:
64 Great Eastern Highway South Guildford, Western Australia 6055, Australia Tel: +61 8 9277 8800
The financial report of the Company and its controlled entities for the year ended 30 June 2016 was authorised for issue on 29 August 2016 by the directors of the Company.
1.2 Basis of PreparationThese financial statements are general purpose financial statements which have been prepared in accordance with the Corporations Act 2001, Accounting Standards and Interpretations, and comply with other requirements of the law. Accounting Standards include Australian Accounting Standards. Compliance with Australian Accounting Standards ensures that the financial statements and notes of the Company and the Group comply with International Financial Reporting Standards (‘IFRS’).
The financial statements comprise the consolidated financial statements of the Group. For the purposes of preparing the consolidated financial statements, the Company is a for-profit entity.
The consolidated financial statements have been prepared on the basis of historical cost, except for certain financial instruments that are measured at revalued amounts or fair values, as explained in the accounting policies below. Historical cost is generally based on the fair values of the consideration given in exchange for assets. All amounts are presented in Australian dollars, unless otherwise noted.
The company is a company of the kind referred to in ASIC Corporations (Rounding in Financials/Directors’ Report) Instrument 2016/191, dated 24 March 2016, and in accordance with that Corporations Instrument amounts in the financial report are rounded off to the nearest thousand dollars, unless otherwise indicated.
When required by Accounting Standards, comparative figures have been adjusted to conform to changes in presentation for the current financial year.
Significant and other accounting policies that summarise the measurement basis used and are relevant in understanding of the financial statements are provided throughout the notes to the financial statements to which it relates.
1.3 Functional currencyThe individual financial statements of each Group entity are presented in the currency of the primary economic environment in which the entity operates (its functional currency). For the purpose of the consolidated financial statements, the results and financial position of each entity are expressed in Australian dollars, which is the functional currency of the Group, and the presentation currency for the consolidated financial statements.
In preparing the financial statements of each individual entity, transactions in currencies other than the entity’s functional currency (foreign currencies) are recorded at the rates of exchange prevailing on the dates of the transactions. At each reporting date, monetary items denominated in foreign currencies are retranslated at the rates prevailing at the reporting date. Non-monetary items carried at fair value that are denominated in foreign currencies are retranslated at the rates prevailing on the date when the fair value was determined. Non-monetary items that are measured in terms of historical cost in a foreign currency are not re-translated.
For
per
sona
l use
onl
y

NOTES TO THE FINANCIAL STATEMENTSFOR THE YEAR ENDED 30 JUNE 2016
43ANNUAL REPORT 2016 SWICK MINING SERVICES
Exchange differences on monetary items are recognised in profit or loss in the period in which they arise except for:
+ exchange differences on foreign currency borrowings relating to assets under construction for future productive use, which are included in the cost of those assets when they are regarded as an adjustment to interest costs on those foreign currency borrowings;
+ exchange differences on transactions entered into in order to hedge certain foreign currency risks; and
+ exchange differences on monetary items receivable from or payable to a foreign operation for which settlement is neither planned nor likely to occur (therefore forming part of the net investment in the foreign operation), which are recognised initially in other comprehensive income and reclassified from equity to profit or loss on repayment of the monetary items.
For the purpose of presenting consolidated financial statements, the assets and liabilities of the Group’s foreign operations are translated into Australian dollars using exchange rates prevailing at the end of the reporting period. Income and expense items are translated at the exchange rates at the dates of the transactions. Exchange differences arising, if any, are recognised in other comprehensive income and accumulated in equity.
1.4 Principles of consolidationThe consolidated financial statements incorporate the financial statements of Swick Mining Services Limited and entities controlled by the Company and its subsidiaries. Control is achieved when the Company:
+ has power over the investee;
+ is exposed, or has rights, to variable returns from its involvement with the investee; and
+ has the ability to use its power to affect its returns.
The Company reassesses whether or not it controls an investee if facts and circumstances indicate that there are changes to one or more of the three elements of control listed above. When the Company has less than a majority of the voting rights of an investee, it has power over the investee when the voting rights are sufficient to give it the practical ability to direct the relevant activities of the investee unilaterally. The Company considers all relevant facts and circumstances in assessing whether or not the Company’s voting rights in an investee are sufficient to give it power, including:
+ the size of the Company’s holding of voting rights relative to the size and dispersion of holdings of the other vote holders;
+ potential voting rights held by the Company, other vote holders or other parties;
+ rights arising from other contractual arrangements; and
+ any additional facts and circumstances that indicate that the Company has, or does not have, the current ability to direct the relevant activities at the time that decisions need to be made, including voting patterns at previous shareholders’ meetings.
Consolidation of a subsidiary begins when the Company obtains control over the subsidiary and ceases when the Company loses control of the subsidiary. Specifically, income and expenses of a subsidiary acquired or disposed of during the year are included in the consolidated statement of profit or loss and other comprehensive income from the date the Company gains control until the date when the Company ceases to control the subsidiary.
Profit or loss and each component of other comprehensive income are attributed to the owners of the Company and to the non-controlling interests. Total comprehensive income of subsidiaries is attributed to the owners of the Company and to the non-controlling interests even if this results in the non-controlling interests having a deficit balance.
When necessary, adjustments are made to the financial statements of subsidiaries to bring their accounting policies into line with the Group’s accounting policies.
All intragroup assets and liabilities, equity, income, expenses and cash flows relating to transactions between members of the Group are eliminated in full on consolidation.
For
per
sona
l use
onl
y

NOTES TO THE FINANCIAL STATEMENTSFOR THE YEAR ENDED 30 JUNE 2016
44 SWICK MINING SERVICES ANNUAL REPORT 2016
1.5 Changes to accounting standards and interpretationsNew and revised accounting standards and interpretations adoptedThe consolidated entity has adopted the following new standards and amendments to standards issued by the Australian Accounting Standards Board (‘AASB’), including any consequential amendments to other standards, with a date of initial application of 1 July 2015.
+ AASB 2015-3 ‘Amendments to Australian Accounting Standards arising from the Withdrawal of AASB 1031 Materiality’
The application of these amendments did not have any material impact on the amounts recognised in the financial statements nor resulted in any additional disclosures upon adoption.
New standards and interpretations issued but not yet effectiveCertain new accounting standards and interpretations have been published that are not mandatory for 30 June 2016 reporting periods and have not been early adopted by the Group. The standards and interpretations that were issued but not yet effective are set out below. The Group is in the process of considering the impact of the new standards.
Standard/Interpretation
Effective for annual reporting periods
beginning on or after
Expected to be initially applied in the financial year ending
AASB 9 Financial Instruments, AASB 2010-7 Amendments to Australian Accounting Standards arising from AASB 9 (December 2010), AASB 2014-1 Amendments to Australian Accounting Standards [Part E – Financial Instruments], AASB 2014-7 Amendments to Australian Accounting Standards arising from AASB 9 (December 2014)
1 January 2018 30 June 2019
AASB 15 Revenue from Contracts with Customers, AASB 2014-5 Amendments to Australian Accounting Standards arising from AASB 15, AASB 2015-8 Amendments to Australian Accounting Standards – Effective Date of AASB 15
1 January 2018 30 June 2019
AASB 2014-3 Amendments to Australian Accounting Standards – Accounting for Acquisitions if Interests in Joint Operations
1 January 2016 30 June 2017
AASB 2014-4 Amendments to Australian Accounting Standards – Clarification of Acceptable Methods of Depreciation and Amortisation
1 January 2016 30 June 2017
AASB 2014-10 Amendments to Australian Accounting Standards – Sale or Contribution of Assets between an Investor and its Associate or Joint VentureAASB 2015-10 ‘Amendments to Australian Accounting Standards – Effective Date of Amendments to AASB 10 and AASB 128’
1 January 2018 30 June 2019
AASB 2015-1 Amendments to Australian Accounting Standards – Annual Improvements to Australian Accounting Standards 2012-2014 Cycle
1 January 2016 30 June 2017
AASB 2015-2 Amendments to Australian Accounting Standards – Disclosure Initiative: Amendments to AASB 101
1 January 2016 30 June 2017
AASB 16 Leases 1 January 2019 30 June 2019
AASB 2016-2 Amendments to Australian Accounting Standards – Disclosure Initiative: Amendments to AASB 107. Effective 1 Jan 17
1 January 2017 30 June 2018
1.6 Critical accounting estimates and judgementsIn the application of the Group’s accounting policies, management is required to make judgments, estimates and assumptions about carrying values of assets and liabilities that are not readily apparent from other sources. The directors evaluate estimates and judgments incorporated into the financial statements based on historical knowledge and best available current information. Estimates assume a reasonable expectation of future events and are based on current trends and economic data, obtained both externally and within the Group. Actual results may differ from these estimates.
For
per
sona
l use
onl
y

NOTES TO THE FINANCIAL STATEMENTSFOR THE YEAR ENDED 30 JUNE 2016
45ANNUAL REPORT 2016 SWICK MINING SERVICES
The estimates and underlying assumptions are reviewed on an ongoing basis. Revisions to accounting estimates are recognised in the period in which the estimate is revised if the revision affects only that period or in the period of the revision and future periods if the revision affects both current and future periods. Significant judgments, estimates and assumptions made by management in the preparation of these financial statements are outlined below:
+ Impairment of assets (Note 3.4)
+ Useful lives of property, plant & equipment (Note 3.4)
+ Recoverability of internally generated intangible assets (Note 3.5)
+ Recoverability of recognised tax losses (Note 3.9)
2 Financial performance2.1 Operating segments
General information Identification of reportable segmentsAASB 8 “Operating Segments” requires operating segments to be identified on the basis of internal reports about components of the Group that are regularly reviewed by the chief operating decision maker in order to allocate resources to the segments and assess their performance.
The Group’s chief operating decision maker for the purpose of resource allocation and assessment of performance of segments is specifically focused on Drilling Services in Asia Pacific and Drilling Services International.
Unless stated otherwise, all amounts reported to the Board of Directors, being the chief operating decision makers with respect to operating segments, are determined in accordance with accounting policies.
The Group’s revenue from continuing operations and information about its assets and liabilities by reportable segments are detailed below.
Segment revenue, expense and results for continuing operations
DRILLING SERVICES - ASIA PACIFIC
DRILLING SERVICES - INTERNATIONAL OTHER AND ELIMINATIONS TOTAL
2016$’000
2015$’000
2016$’000
2015$’000
2016$’000
2015$’000
2016$’000
2015$’000
Revenue 110,647 114,104 12,531 16,872 - - 123,178 130,976
Other Income 1,391 775 115 85 201 145 1,707 1,005
Inter-segment revenue 1,298 1,204 - - (1,298) (1,204) - -
Total revenue and other income 113,336 116,083 12,646 16,957 (1,097) (1,059) 124,885 131,981
Raw materials, consumables and employee benefits 84,020 84,066 8,605 11,591 312 83 92,937 95,740
Depreciation and amortisation 13,613 13,009 1,555 2,243 9 - 15,177 15,252
Increase in inventory obsolescence provision - 4,135 - - - - - 4,135
Impairment of assets 382 19,665 278 - - - 660 19,665
For
per
sona
l use
onl
y

NOTES TO THE FINANCIAL STATEMENTSFOR THE YEAR ENDED 30 JUNE 2016
46 SWICK MINING SERVICES ANNUAL REPORT 2016
DRILLING SERVICES - ASIA PACIFIC
DRILLING SERVICES - INTERNATIONAL OTHER AND ELIMINATIONS TOTAL
2016$’000
2015$’000
2016$’000
2015$’000
2016$’000
2015$’000
2016$’000
2015$’000
Finance costs 1,165 1,493 2 27 - - 1,167 1,520
Other expenses 14,769 18,075 2,085 2,105 333 38 17,187 20,218
Inter-segment expenses - - 1,298 1,204 (1,298) (1,204) - -
Total expense 113,949 140,443 13,823 17,170 (644) (1,083) 127,128 156,530
Segment loss before tax (613) (24,360) (1,177) (213) (453) 24 (2,243) (24,549)
(a) Segment loss represents the loss incurred by each segment after allocation of central administration costs and directors’ salaries, share of profits of associates, gain recognised on disposal of interest in former associate, investment income, gains and losses and finance costs. This is the measure reported to the chief operating decision maker for the purposes of resource allocation and assessment of segment performance.
(b) Included in the revenue arising from provision of drilling contract services of $123.2 million (2015: $131.0 million) are revenues of $62.1 million (2015: $38.9 million) which arose from sales to the Group’s three (2015: two) largest customers. No other single customer contributed 10% or more to the Group’s revenue for 2016. These customers provided $25.8 million, $20.4 million and $15.9 million (2015: $22.9 million and $16.0 million) respectively, and are all contained within the Drilling Services – Asia Pacific segment.
Segment assets and liabilities
DRILLING SERVICES - ASIA PACIFIC
DRILLING SERVICES - INTERNATIONAL OTHER TOTAL
2016 $’000
2015 $’000
2016 $’000
2015 $’000
2016 $’000
2015 $’000
2016 $’000
2015 $’000
Total segment assets 131,588 133,562 13,964 16,745 3,818 2,458 149,370 152,765
Total segment liabilities (39,668) (40,444) (17,865) (18,437) (221) (186) (57,754) (59,067)
Eliminations - - - - - - (1,583) (289)
Total net assets 91,920 93,118 (3,901) (1,692) 3,597 2,272 90,033 93,409
Other segment information
Additions to non-current assets
Property, plant and equipment 9,401 11,862 1,632 962 - - 11,033 12,824
Intangible assets 1,607 2,443 - - 1,428 4,338 3,035 6,781
Total additions to non-current assets 11,008 14,305 1,632 952 1,428 4,338 14,068 19,605
For
per
sona
l use
onl
y
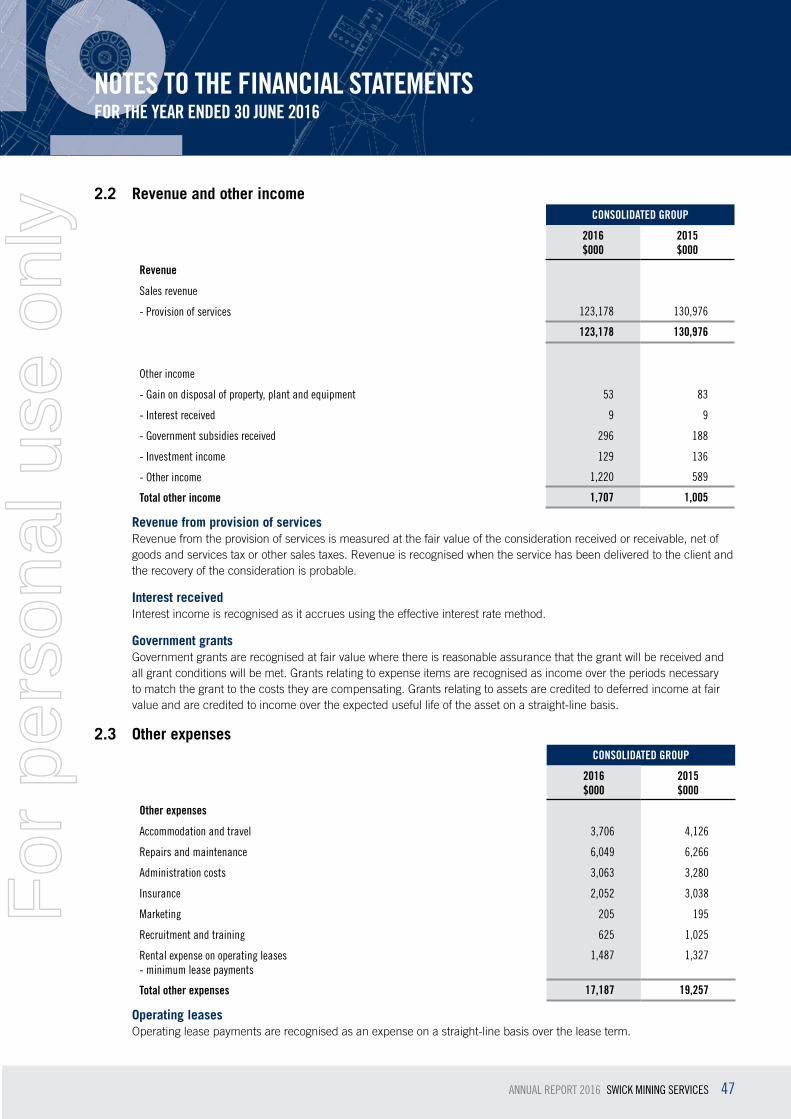
NOTES TO THE FINANCIAL STATEMENTSFOR THE YEAR ENDED 30 JUNE 2016
47ANNUAL REPORT 2016 SWICK MINING SERVICES
2.2 Revenue and other incomeCONSOLIDATED GROUP
2016 $000
2015 $000
Revenue
Sales revenue
- Provision of services 123,178 130,976
123,178 130,976
Other income
- Gain on disposal of property, plant and equipment 53 83
- Interest received 9 9
- Government subsidies received 296 188
- Investment income 129 136
- Other income 1,220 589
Total other income 1,707 1,005
Revenue from provision of servicesRevenue from the provision of services is measured at the fair value of the consideration received or receivable, net of goods and services tax or other sales taxes. Revenue is recognised when the service has been delivered to the client and the recovery of the consideration is probable.
Interest receivedInterest income is recognised as it accrues using the effective interest rate method.
Government grantsGovernment grants are recognised at fair value where there is reasonable assurance that the grant will be received and all grant conditions will be met. Grants relating to expense items are recognised as income over the periods necessary to match the grant to the costs they are compensating. Grants relating to assets are credited to deferred income at fair value and are credited to income over the expected useful life of the asset on a straight-line basis.
2.3 Other expensesCONSOLIDATED GROUP
2016 $000
2015 $000
Other expenses
Accommodation and travel 3,706 4,126
Repairs and maintenance 6,049 6,266
Administration costs 3,063 3,280
Insurance 2,052 3,038
Marketing 205 195
Recruitment and training 625 1,025
Rental expense on operating leases- minimum lease payments
1,487 1,327
Total other expenses 17,187 19,257
Operating leasesOperating lease payments are recognised as an expense on a straight-line basis over the lease term.
For
per
sona
l use
onl
y
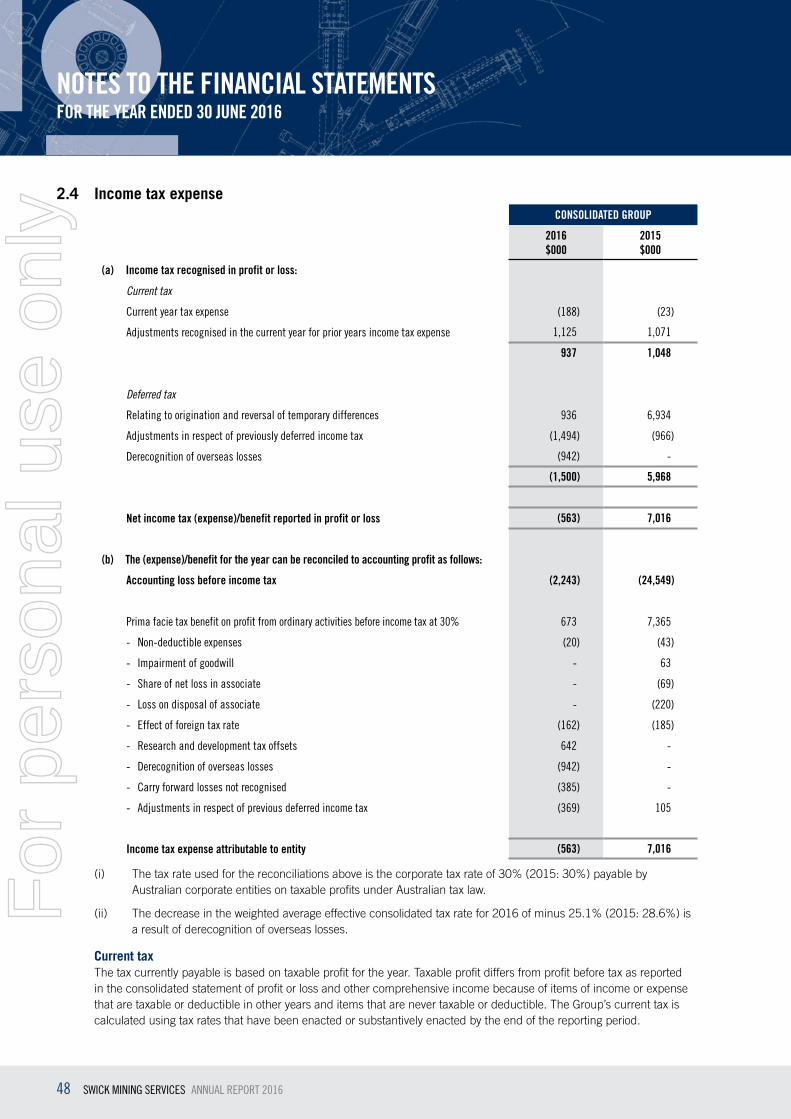
NOTES TO THE FINANCIAL STATEMENTSFOR THE YEAR ENDED 30 JUNE 2016
48 SWICK MINING SERVICES ANNUAL REPORT 2016
2.4 Income tax expenseCONSOLIDATED GROUP
2016 $000
2015 $000
(a) Income tax recognised in profit or loss:
Current tax
Current year tax expense (188) (23)
Adjustments recognised in the current year for prior years income tax expense 1,125 1,071
937 1,048
Deferred tax
Relating to origination and reversal of temporary differences 936 6,934
Adjustments in respect of previously deferred income tax (1,494) (966)
Derecognition of overseas losses (942) -
(1,500) 5,968
Net income tax (expense)/benefit reported in profit or loss (563) 7,016
(b) The (expense)/benefit for the year can be reconciled to accounting profit as follows:
Accounting loss before income tax (2,243) (24,549)
Prima facie tax benefit on profit from ordinary activities before income tax at 30% 673 7,365
- Non-deductible expenses (20) (43)
- Impairment of goodwill - 63
- Share of net loss in associate - (69)
- Loss on disposal of associate - (220)
- Effect of foreign tax rate (162) (185)
- Research and development tax offsets 642 -
- Derecognition of overseas losses (942) -
- Carry forward losses not recognised (385) -
- Adjustments in respect of previous deferred income tax (369) 105
Income tax expense attributable to entity (563) 7,016
(i) The tax rate used for the reconciliations above is the corporate tax rate of 30% (2015: 30%) payable by Australian corporate entities on taxable profits under Australian tax law.
(ii) The decrease in the weighted average effective consolidated tax rate for 2016 of minus 25.1% (2015: 28.6%) is a result of derecognition of overseas losses.
Current taxThe tax currently payable is based on taxable profit for the year. Taxable profit differs from profit before tax as reported in the consolidated statement of profit or loss and other comprehensive income because of items of income or expense that are taxable or deductible in other years and items that are never taxable or deductible. The Group’s current tax is calculated using tax rates that have been enacted or substantively enacted by the end of the reporting period.
For
per
sona
l use
onl
y

NOTES TO THE FINANCIAL STATEMENTSFOR THE YEAR ENDED 30 JUNE 2016
49ANNUAL REPORT 2016 SWICK MINING SERVICES
Tax consolidationThe Company and its wholly-owned Australian resident entities have formed a tax-consolidated Group with effect from 1 July 2009 and are therefore taxed as a single entity from that date. The head entity within the tax-consolidated Group is Swick Mining Services Limited. Tax expense/income, deferred tax liabilities and deferred tax assets arising from temporary differences of the members of the tax-consolidated Group are recognised in the separate financial statements of the members of the tax-consolidated Group using the ‘separate taxpayer within Group’ approach by reference to the carrying amounts in the separate financial statements of each entity and the tax values applying under tax consolidation. Current tax liabilities and assets and deferred tax assets arising from unused tax losses and relevant tax credits of the members of the tax-consolidated Group are recognised by the Company (as head entity in the tax-consolidated Group). Due to the existence of a tax funding arrangement between the entities in the tax-consolidated Group, amounts are recognised as payable to or receivable by the Company and each member of the Group in relation to the tax contribution amounts paid or payable between the parent entity and the other members of the tax-consolidated Group in accordance with the arrangement.
Goods and services tax (GST)Revenues, expenses and assets are recognised net of the amount of GST, except where the amount of GST incurred is not recoverable from the relevant tax authority. In these circumstances the GST is recognised as part of the cost of acquisition of the asset or as part of an item of the expense.
Receivables and payables in the statement of financial position are shown inclusive of GST. The net amount of GST recoverable from, or payable to, the relevant tax authority is included as a current asset or liability in the statement of financial position.
Cash flows are included in the statement of cash flows on a gross basis. The GST components of cash flows arising from investing and financing activities which are recoverable from, or payable to, the relevant tax authority are classified as operating cash flows.
2.5 DividendsCONSOLIDATED GROUP
Cents per Share
2016 $000
2015 $000
Distributions paid/payable
2014 final fully franked ordinary dividend franked at the tax rate of 30% 0.2 - 432
2015 interim fully franked ordinary dividend franked at a tax rate of 30% 0.2 - 436
Total dividends - 868
(a) Proposed final 2016 ordinary dividend of 0.4 cents per share fully franked at the tax rate of 30% (2015: nil)
849 -
(b) Franking account balance:
Closing balance 3,425 5,179
Subsequent to year-end, the franking account would be (decreased)/increased by income tax refunds as follows:
(1,763) 154
Subsequent to year-end, the franking account would be reduced by the proposed dividend reflected per (a) as follows:
(364) -
Adjusted franking account balance 1,298 5,333
For
per
sona
l use
onl
y

NOTES TO THE FINANCIAL STATEMENTSFOR THE YEAR ENDED 30 JUNE 2016
50 SWICK MINING SERVICES ANNUAL REPORT 2016
2.6 Earnings per shareThe earnings and weighted average number of ordinary shares used in the calculation of basic earnings per share are as follows:
CONSOLIDATED GROUP
2016 $000
2015 $000
Earnings used to calculate basic earnings per shareLoss after income tax expense attributable to owners of the Company (2,675)
(17,544)
(2,675) (17,544)
CONSOLIDATED GROUP
2016 No.
2015 No.
Weighted average number of ordinary shares outstanding during the year used in calculating basic EPS 216,030,553
216,883,515
Weighted average number of dilutive rights outstanding (i) - -
Weighted average number of ordinary shares outstanding during the year used in calculating dilutive EPS 216,030,553 216,883,515
Basic loss per share (cents) (1.2) (8.1)
Diluted loss per share (cents) (1.2) (8.1)
(i) The impact of performance rights and options in 2016 and 2015 has not been factored into the calculation of the diluted earnings per share as the Group is in a loss position. If used, the impact would be to increase the weighted average number of shares by 733,978 (2015: 1,003,782).
Basic earnings per shareBasic earnings per share is calculated as net profit attributable to members of the parent, adjusted to exclude any costs of servicing equity (other than dividends) and preference share dividends, divided by the weighted average number of ordinary shares, adjusted for any bonus element.
Diluted earnings per shareDiluted earnings per share are calculated as net profit attributable to members of the parent, adjusted for:
+ costs of servicing equity (other than dividends) and preference share dividends;
+ the after tax effect of dividends and interest associated with dilutive potential ordinary shares that have been recognised as an expense; and
+ other non-discretionary changes in revenue or expenses during the period that would result from the dilution of potential ordinary shares;
+ divided by the weighted average number of ordinary shares and dilutive potential ordinary shares, adjusted for any bonus element.
The dilutive effect, if any, of outstanding options and performance rights is reflected as additional share dilution in the computation of diluted earnings per share.F
or p
erso
nal u
se o
nly

NOTES TO THE FINANCIAL STATEMENTSFOR THE YEAR ENDED 30 JUNE 2016
51ANNUAL REPORT 2016 SWICK MINING SERVICES
3 Assets and Liabilities3.1 Cash
CONSOLIDATED GROUP
2016 $000
2015 $000
Cash at bank and in hand 4,690 5,729
The cash balance primarily consists of cash and on-call bank deposit.
CONSOLIDATED GROUP
2016 $000
2015 $000
Reconciliation of cash flow from operations with profit after income tax
Loss after income tax (2,806) (17,533)
Non-cash flows in profit
Depreciation and amortisation 15,177 15,252
Net loss on foreign exchange 248 71
Net gain on disposal of property, plant and equipment (53) (83)
Share options/performance rights expensed 118 448
Loss recognised on disposal of interest in associate - 732
Share of losses of associates - 228
Write-down of inventory to fair value - 4,135
Investment income classified as investing cash flow (129) (136)
Impairment of assets 660 19,665
Change in assets and liabilities, net of the effects of purchase and disposal of subsidiaries:
Decrease/(increase) in trade and other receivables 2,652 (3,598)
(Increase)/decrease in prepayments (632) 253
Decrease in other assets - 270
Decrease in inventories 1,984 460
(Decrease)/increase in trade payables and accruals (881) 1,609
Decrease/(increase) in current tax assets 811 (2,670)
Decrease/(increase) in deferred tax assets 1,417 (5,737)
Decrease in other liabilities (18) (18)
(Decrease)/increase in provisions (60) 284
Cash flow from operations 18,488 13,632
For
per
sona
l use
onl
y

NOTES TO THE FINANCIAL STATEMENTSFOR THE YEAR ENDED 30 JUNE 2016
52 SWICK MINING SERVICES ANNUAL REPORT 2016
3.2 Trade and other receivables
CONSOLIDATED GROUP
2016 $000
2015 $000
CURRENT
Trade receivables 18,677 20,576
Accrued income 215 1,040
Rebates and credit offsets 235 163
Total current trade and other receivables 19,127 21,779
Trade receivables are recognised initially at fair value less any allowance for impairment. The Group reviews the collectability of trade receivables on an ongoing basis and makes an objective judgement concerning amounts considered not collectible. The amount of the loss is recognised in the income statement within operating expenses and classified as doubtful debts. Any subsequent recovery of amounts previously written off, are recorded as other income in the income statement.
Due to the short term nature of these receivables their carrying value is assumed to approximate their fair values.
CONSOLIDATED GROUP
2016 $000
2015 $000
Current 18,854 20,592
Past due 0 to 30 days - -
Past due 31+ days 273 1,187
19,127 21,779
Trade debtors are non-interest bearing and generally on 30-60 day terms.
Amounts are considered as ‘past due’ when the debt has not been settled with the terms & conditions agreed between the Group and the customer or counter party to the transaction. Receivables that are past due are assessed for impairment by ascertaining solvency of the debtors and are provided for where there are specific circumstances indicating that the debt may not be fully repaid to the Group.
The balances of receivables that remain within initial trade terms (as detailed in the table) are considered to be of high credit quality. None of the receivables past due are considered impaired as these amounts had either been collected, are expected to be collected or payment arrangements agreed prior to the date of this report.
For
per
sona
l use
onl
y

NOTES TO THE FINANCIAL STATEMENTSFOR THE YEAR ENDED 30 JUNE 2016
53ANNUAL REPORT 2016 SWICK MINING SERVICES
3.3 Inventories
CONSOLIDATED GROUP
2016 $000
2015 $000
CURRENT
At cost
Raw materials and consumables 15,799 19,871
Allowance for obsolescence (2,832) (4,920)
12,967 14,951
The Group maintains an inventory of drilling consumables and parts & spares for use in the rendering of drilling services. Inventory is measured at the lower of cost and net realisable value. An on-going review is conducted in order to ascertain whether items are obsolete or damaged, and if so determined, the carrying amount of the item is written down to its net realisable value.
3.4 Property, plant and equipment
CONSOLIDATED GROUP
2016 $000
2015 $000
Plant and equipment
At cost 184,662 175,920
Accumulated depreciation (99,015) (92,664)
Impairment (15,542) (14,882)
Total plant and equipment 70,105 68,374
Leasehold improvements
At cost 3,230 3,228
Accumulated amortisation (2,080) (1,800)
Total leasehold improvements 1,150 1,428
Office furniture and equipment
At cost 7,415 5,722
Accumulated depreciation (5,350) (4,447)
Total office furniture and equipment 2,065 1,275
Motor vehicles
At cost 18,966 19,625
Accumulated depreciation (14,650) (10,954)
Total motor vehicles 4,316 8,671
Total property, plant and equipment 77,636 79,748
For
per
sona
l use
onl
y

NOTES TO THE FINANCIAL STATEMENTSFOR THE YEAR ENDED 30 JUNE 2016
54 SWICK MINING SERVICES ANNUAL REPORT 2016
Plant and equipment
Leasehold and improvements
Office furniture and equipment Motor vehicles Total
$000 $000 $000 $000 $000
Consolidated group
Balance at 1 July 2014 82,947 1,584 1,075 10,049 95,655
Additions 12,632 120 771 593 14,116
Disposals (324) - (5) (94) (423)
Additions as a result of the acquisition of Orexplore
15 - 4 - 19
Impairment (see below) (14,882) - - - (14,882)
Exchange rate revaluation 386 - 7 46 439
Depreciation expense (12,400) (276) (577) (1,923) (15,176)
Balance at 30 June 2015 68,374 1,428 1,275 8,671 79,748
Additions 11,444 - 1,694 580 13,718
Reclassification 3,281 - - (3,281) -
Disposals - - - (44) (44)
Impairment (see below) (660) - - - (660)
Exchange rate revaluation (69) 1 - 12 (56)
Depreciation expense (12,265) (279) (904) (1,622) (15,070)
Balance at 30 June 2016 70,105 1,150 2,065 4,316 77,636
Additions include $2.7 million (2015: $1.3 million) of development costs capitalised to plant and equipment.
Items of plant and equipment are measured at cost less accumulated depreciation and impairment. Cost includes acquisition, being the fair value of the consideration provided, plus incidental costs directly attributable to the acquisition.
Subsequent costs directly related to an item of plant and equipment are recognised in the carrying amount of that item of property, plant and equipment only when it is probable that the future economic benefits embodied within the item will flow to the consolidated entity and the cost of the item can be measured reliably. All other costs, including repairs and maintenance, are recognised in the statement of comprehensive income as an expense.
An asset’s carrying amount is written down immediately to its recoverable amount if the asset’s carrying amount is greater than its estimated recoverable amount.
Gains and losses on disposals are determined by comparing proceeds with the carrying amount. These gains and losses are included in the profit and loss. When revalued assets are sold, amounts included in the revaluation surplus relating to that asset are transferred to retained earnings.
DepreciationDepreciation is recognised in profit and loss on a straight-line or diminishing value basis over the estimated useful life of each part of an item of property plant and equipment. Those items of property, plant and equipment undertaking construction are not depreciated.
The following useful lives are used in the calculation of depreciation for each class of property, plant and equipment:
Class of fixed asset Useful life
Plant and equipment 5 - 20 years
Leasehold improvements 10 - 15 years
Office furniture & equipment 5 – 10 years
Motor vehicles 3 – 10 years
For
per
sona
l use
onl
y

NOTES TO THE FINANCIAL STATEMENTSFOR THE YEAR ENDED 30 JUNE 2016
55ANNUAL REPORT 2016 SWICK MINING SERVICES
Significant accounting estimates and assumptionsThe Group reviews the estimated useful lives of property, plant and equipment at the end of each reporting period. No changes to useful lives have been made for the financial year ending 30 June 2016.
Impairment of tangible and intangible assetsAt the end of each reporting period, the Group reviews the carrying amounts of its tangible and intangible assets to determine whether there is any indication that those assets have suffered an impairment loss. If any such indication exists, the recoverable amount of the asset is estimated in order to determine the extent of the impairment loss (if any). Where it is not possible to estimate the recoverable amount of an individual asset, the Group estimates the recoverable amount of the cash generating unit to which the asset belongs. Where a reasonable and consistent basis of allocation can be identified, corporate assets are also allocated to individual cash generating units, or otherwise they are allocated to the smallest group of cash generating units for which a reasonable and consistent allocation basis can be identified.
The carrying value of intangible assets with indefinite useful lives and intangible assets not yet available for use are tested for impairment annually when the asset is not yet available for use or more frequently when an indication of impairment arises during the reporting period.
Recoverable amount is the higher of fair value less costs to sell and value-in-use. In assessing value-in-use, the estimated future cash flows are discounted to their present value using a pre-tax discount rate that reflects current market assessments of the time value of money and the risks specific to the asset for which the estimates of future cash flows have not been adjusted.
If the recoverable amount of the cash generating unit (or group of cash generating units) is less than the carrying amount of the cash generating unit (or groups of cash generating units), the impairment loss is allocated to the assets of the cash generating units pro-rata on the basis of the carrying amount of each asset in the cash generating unit (or groups of cash generating units).
Where an impairment loss subsequently reverses, the carrying amount of the asset (cash generating unit) is increased to the revised estimate of its recoverable amount, but only to the extent that the increased carrying amount does not exceed the carrying amount that would have been determined had no impairment loss been recognised for the asset (cash generating unit) in prior years. A reversal of an impairment loss is recognised immediately in profit or loss, unless the relevant asset is carried at fair value, in which case the reversal of the impairment loss is treated as a revaluation increase.
In assessing any potential impairment of assets, management have identified 3 separate functional divisions as being the cash generating units (CGUs) within the Group:
+ Underground Diamond (UD) Drilling;
+ Reverse Circulation (RC) Drilling; and
+ Underground Production (Longhole) Drilling.
The Group considers the relationship between its market capitalisation and its book value, among other factors, when reviewing for indicators of impairment. As at 30 June 2016, the market capitalisation of the Group was below the book value of its equity, indicating a potential impairment of the assets of the cash generating units.
For
per
sona
l use
onl
y

NOTES TO THE FINANCIAL STATEMENTSFOR THE YEAR ENDED 30 JUNE 2016
56 SWICK MINING SERVICES ANNUAL REPORT 2016
Significant accounting estimates and assumptionsDetermining whether the assets of the Group are impaired requires an estimation of the value-in-use of the cash generating units to which the assets have been allocated. The value-in-use calculation requires the directors to estimate the future cash flows expected to arise from the cash generating unit and a suitable discount rate in order to calculate present value. Where the calculated future cash flows are less than expected, a material impairment loss may arise. In supporting the assumptions behind the value-in-use calculations, the directors have referenced externally available data and engaged independent advice as appropriate.
Impairment assumptionsThe recoverable amount of each cash generating unit is determined based on a value-in-use calculation. Value-in-use is calculated based on the present value of cash flow projections over a five year period with a terminal value. The cash flow projections are based on next year’s financial budget approved by the directors extended to the following 4 years using a combination of growth at management estimates and external market research, with a terminal value growth rate of 2.5%.
Management has conducted a review of the current development projects which have been capitalised to determine the expected future cash flows to be generated from future use.
The post-tax WACC (Weighted Average Cost of Capital) of the Company has been reduced to 9.0% per annum (2015: 10.5% per annum) to reflect the market changes to the cost of both debt and equity capital. Pre-tax WACC is 12.9% per annum (2015: 15.0% per annum).
Based on the testing performed, an impairment loss of $0.7 million (2015: $14.9 million) was required to be recognised on specific old Skid Rigs in the UD Drilling CGU (2015: LH and RC Drilling CGUs) during the year.
The table below shows the movements required in key assumptions to result in a break even position for the UD Drilling CGU which is identified as most sensitive to changes in assumptions.
Changes in key assumptions
Post-tax discount rate +0.7%
EBITDA margin -0.8%
3.5 Intangible assets
CONSOLIDATED GROUP
2016 $000
2015 $000
Development costs (net carrying amount)
Drilling Services:
Development amortising 1,758 1,440
Development non-amortising 2,509 4,012
Mineral Analysis:
Development non-amortising 5,812 4,399
Total intangibles (net carrying amount) 10,079 9,851For
per
sona
l use
onl
y

NOTES TO THE FINANCIAL STATEMENTSFOR THE YEAR ENDED 30 JUNE 2016
57ANNUAL REPORT 2016 SWICK MINING SERVICES
GOODWILL DRILLING SERVICESMINERAL ANALYSIS TOTAL
Development amortising
Development non-amortising
Development non-amortising
$000 $000 $000 $000 $000
Consolidated group
Balance at 1 July 2014 209 - 8,951 - 9,160
Internal development - 1,516 927 278 2,721
Transfers to plant and equipment
- - (1,292) - (1,292)
Amortisation expense - (76) - - (76)
Intangible development asset recognised as a result of the acquisition of Orexplore
- - - 4,060 4,060
Exchange revaluation - - - 61 61
Impairment of intangibles (209) - (4,574) - (4,783)
Balance at 30 June 2015 - 1,440 4,012 4,399 9,851
Internal development - 425 1,182 1,428 3,035
Transfers to plant and equipment
- - (2,685) - (2,685)
Amortisation expense - (107) - - (107)
Exchange revaluation - - - (15) (15)
Balance at 30 June 2016 - 1,758 2,509 5,812 10,079
An intangible asset arising from development expenditure on an internal project is recognised only when the Group can demonstrate the technical feasibility of completing the intangible asset so that it will be available for use or sale, its intention to complete and its ability to use or sell the asset, how the asset will generate future economic benefits, the availability of resources to complete the development and the ability to measure reliably the expenditure attributable to the intangible asset during its development. Following the initial recognition of the development expenditure, the cost model is applied requiring the asset to be carried at cost less any accumulated amortisation and accumulated impairment losses. Any expenditure so capitalised is amortised over the period of expected benefit from the related project.
The carrying value of an intangible asset arising from development expenditure is tested for impairment annually when the asset is not yet available for use or more frequently when an indication of impairment arises during the reporting period.
A summary of the policies applied to the Group’s intangible assets other than goodwill is as follows:
Development costsUseful livesFinite
Amortisation method usedAmortised over the period of between 5 and 15 years on a straight-line basis
Significant accounting estimates and assumptionsThe carrying value of an intangible asset arising from development expenditure is tested for impairment annually when the asset is not yet available for use or more frequently when an indication of impairment arises during the reporting period. The amortisation method is reviewed at each financial year-end.
For
per
sona
l use
onl
y

NOTES TO THE FINANCIAL STATEMENTSFOR THE YEAR ENDED 30 JUNE 2016
58 SWICK MINING SERVICES ANNUAL REPORT 2016
Recoverability of internally generated intangible assetsDuring the year, the directors considered the recoverability of the Group’s capitalised development costs included in the consolidated statement of financial position at 30 June 2016 of $10.1 million (2015: $9.9 million).
Development projects continue to progress in accordance with the Group’s project management plans. Research and development is conducted for the purpose of improved efficiency in the business’ operations. Sensitivity analysis has been carried out and directors are confident the carrying amount of the assets will be recovered in full.
Impairment of intangible assetsThe value of the intangibles in the drilling segments are included as appropriate under impairment testing for property, plant and equipment. In addition, each item is tested for expected recoverable value. Other intangibles are still in development and each item is tested for expected recoverable value.
Management has conducted a review of the current development projects which have been capitalised to determine the expected future cash flows to be generated from future use. As a result of this review, management has decided not to impair any development asset in financial year 2016 (2015: $4.6 million).
3.6 Other financial assets and liabilitiesCategories of financial instruments
CONSOLIDATED GROUP
2016 $’000
2015 $’000
Other financial assetsUnits in unlisted property trust 1,280 1,280
Other financial liabilitiesForeign currency forward contracts (i) - 18
(i) Foreign currency forward contracts are valued using discounted cash flow model. The future cash flows are estimated based on forward exchange rates at the end of the reporting period and contract forward rates, discounted at a rate that reflects the credit risk of various counterparties. This is classified as Level 2 of the fair value hierarchy
Fair valueFair value is the price at which an orderly transaction to sell the asset or to transfer the liability would take place between market participants at the measurement date under current market conditions. The fair values of financial assets and financial liabilities are determined as follows:
+ the fair values of financial assets and financial liabilities with standard terms and conditions and traded on active liquid markets are determined with reference to quoted market prices; and
+ the fair values of other financial assets and financial liabilities (excluding derivative instruments) are determined in accordance with generally accepted pricing models based on discounted cash flow analysis.
For financial reporting purposes, fair value measurements are categorised into Level 1, 2 or 3 based on the degree to which the inputs to the fair value measurements are observable and the significance of the inputs to the fair value measurement in its entirety, which are described as follows:
+ Level 1 inputs are quoted prices (unadjusted) in active markets for identical assets or liabilities that the entity can access at the measurement date;
+ Level 2 inputs are inputs, other than quoted prices included within Level 1, that are observable for the asset or liability, either directly or indirectly; and
+ Level 3 inputs are unobservable inputs for the asset or liability.
Impairment of financial assetsFinancial assets are assessed for indicators of impairment at the end of each reporting period. Financial assets are considered to be impaired when there is objective evidence that, as a result of one or more events that occurred after the initial recognition of the financial asset, the estimated future cash flows of the investment have been affected.
For
per
sona
l use
onl
y

NOTES TO THE FINANCIAL STATEMENTSFOR THE YEAR ENDED 30 JUNE 2016
59ANNUAL REPORT 2016 SWICK MINING SERVICES
FINANCIAL ASSET FAIR VALUE AS ATFAIR VALUE HIERARCHY
VALUATION TECHNIQUE(S) AND KEY INPUT(S)
SIGNIFICANT UNOBSERVABLE
INPUT(S)
RELATIONSHIP OF
UNOBSERVABLE INPUTS OF FAIR
VALUE
30/06/16$’000
30/06/15$’000
Investment in unlisted property trust (i)(ii)
1,280 1,280 Level 2 The underlying property was valued in accordance with Australian Property Institute guidelines by a Certified Practicing Valuer in July 2015. The valuation analysed sales of similar industrial properties within similar industrial areas taking into account the size, location and shape of the land.
N/A N/A
(i) A gain of nil (2015: $0.3 million) resulted from the revaluation of the underlying property in the unit trust.
(ii) Investment income of $129,000 (2015: $136,000) received during the financial year from the investment in the unlisted property trust has been included in other income.
The Group has an investment in an unlisted unit trust that is not traded in an active market but is classified as available-for-sale (AFS) financial asset and stated at fair value (because the directors consider that fair value can be reliably measured). Initial measurement is at cost. Gains and losses arising from changes in fair value are recognised in other comprehensive income and accumulated in the asset revaluation reserve, with the exception of impairment losses, interest calculated using the effective interest method, and foreign exchange gains and losses on monetary assets, which are recognised in profit or loss. Where the investment is disposed of or is determined to be impaired, the cumulative gain or loss previously accumulated in the asset revaluation reserve is reclassified to profit or loss.
Dividends on AFS equity instruments are recognised in profit or loss when the Group’s right to receive the dividends is established.
3.7 BorrowingsCONSOLIDATED GROUP
2016 $000
2015 $000
CURRENT
Secured liabilities
Hire purchase liabilities (i) 116 359
Other loans - 545
Total current borrowings 116 904
NON-CURRENT
Secured liabilities
Hire purchase liabilities (i) - 116
Bank loans (ii) 20,000 24,000
Total non-current borrowings 20,000 24,116
Total borrowings 20,116 25,020
(i) Hire purchase liabilities generally have a term of between 3 and 5 years with the financier having an interest in the asset until the final payment is made. The average interest rate is 6.6% (2015: 5.0%). Financiers secure their interest by registering a charge over the financed assets. Hire purchase liabilities are secured by the asset for which the agreement relates.
(ii) Bank loans and overdraft are secured by fixed and floating charges over the Group’s Asia Pacific assets. Pursuant to a bank loan, facility bills payable have been drawn as a source of long-term finance. During the 2016 year, the Company reduced its bank facility limit from $29.5 million to $25.5 million. The facility expires on 31 December 2017. Details of the Group’s exposure to interest rate changes on interest bearing liabilities are set out in Note 5.
For
per
sona
l use
onl
y

NOTES TO THE FINANCIAL STATEMENTSFOR THE YEAR ENDED 30 JUNE 2016
60 SWICK MINING SERVICES ANNUAL REPORT 2016
Loans and borrowings are initially recognised at fair value of the consideration received less directly attributable transaction costs incurred. Borrowings are subsequently measured at amortised cost utilising the effective interest rate method. Differences occurring between the proceeds (net of transaction costs) and the redemption amount are recognised in the income statement over the period of the borrowings using the effective interest method.
Borrowings are classified as current liabilities unless the Company has an unconditional right to defer settlement of the liability for at least 12 months after the statement of financial position date.
Available borrowing facilitiesCONSOLIDATED GROUP
2016 $000
2015 $000
Bank and other loan facilities
Total facilities 25,500 29,500
Used at balance date (20,000) (24,000)
Unused at balance date 5,500 5,500
Banking covenantsThe Company complied with and continues to comply with all banking covenants specified in the finance agreement with its financier.
3.8 ProvisionsCONSOLIDATED GROUP
2016 $000
2015 $000
CURRENT
Short-term employee benefits 4,822 5,321
Total current provisions 4,822 5,321
NON-CURRENT
Long-term employee benefits 1,567 1,128
Total non-current provisions 1,567 1,128
Provisions are recognised when the economic entity has a legal, equitable or constructive obligation to make a future sacrifice of economic benefits to other entities or employees as a result of past transactions or other past events, it is probable that a future sacrifice of economic benefits will be required and a reliable estimate can be made of the amount of the obligation. Provision for employee benefits represents amounts accrued for annual leave and long service leave.
Liabilities recognised in respect of short-term employee benefits, are measured at their nominal values using the remuneration rate expected to apply at the time of settlement.
Liabilities recognised in respect of long term employee benefits are measured as the present value of the estimated future cash outflows to be made by the Group in respect of services provided by employees up to the reporting date.F
or p
erso
nal u
se o
nly
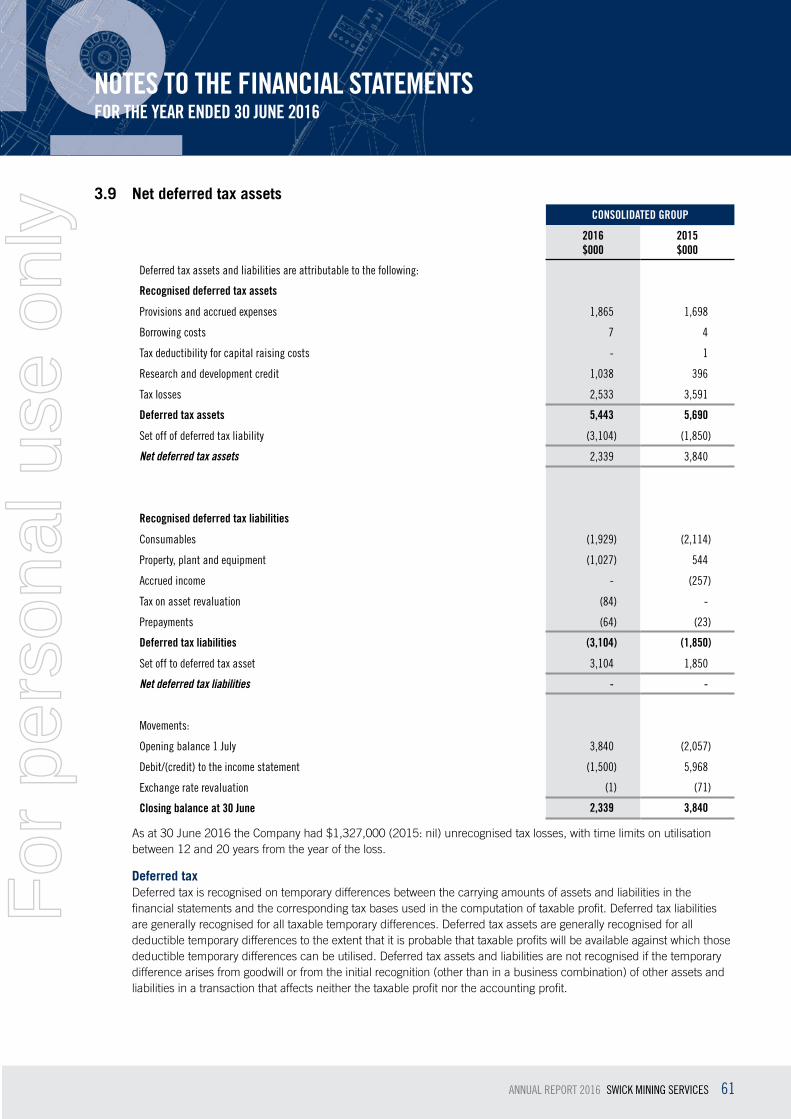
NOTES TO THE FINANCIAL STATEMENTSFOR THE YEAR ENDED 30 JUNE 2016
61ANNUAL REPORT 2016 SWICK MINING SERVICES
3.9 Net deferred tax assetsCONSOLIDATED GROUP
2016 $000
2015 $000
Deferred tax assets and liabilities are attributable to the following:
Recognised deferred tax assets
Provisions and accrued expenses 1,865 1,698
Borrowing costs 7 4
Tax deductibility for capital raising costs - 1
Research and development credit 1,038 396
Tax losses 2,533 3,591
Deferred tax assets 5,443 5,690
Set off of deferred tax liability (3,104) (1,850)
Net deferred tax assets 2,339 3,840
Recognised deferred tax liabilities
Consumables (1,929) (2,114)
Property, plant and equipment (1,027) 544
Accrued income - (257)
Tax on asset revaluation (84) -
Prepayments (64) (23)
Deferred tax liabilities (3,104) (1,850)
Set off to deferred tax asset 3,104 1,850
Net deferred tax liabilities - -
Movements:
Opening balance 1 July 3,840 (2,057)
Debit/(credit) to the income statement (1,500) 5,968
Exchange rate revaluation (1) (71)
Closing balance at 30 June 2,339 3,840
As at 30 June 2016 the Company had $1,327,000 (2015: nil) unrecognised tax losses, with time limits on utilisation between 12 and 20 years from the year of the loss.
Deferred taxDeferred tax is recognised on temporary differences between the carrying amounts of assets and liabilities in the financial statements and the corresponding tax bases used in the computation of taxable profit. Deferred tax liabilities are generally recognised for all taxable temporary differences. Deferred tax assets are generally recognised for all deductible temporary differences to the extent that it is probable that taxable profits will be available against which those deductible temporary differences can be utilised. Deferred tax assets and liabilities are not recognised if the temporary difference arises from goodwill or from the initial recognition (other than in a business combination) of other assets and liabilities in a transaction that affects neither the taxable profit nor the accounting profit.
For
per
sona
l use
onl
y

NOTES TO THE FINANCIAL STATEMENTSFOR THE YEAR ENDED 30 JUNE 2016
62 SWICK MINING SERVICES ANNUAL REPORT 2016
Deferred tax liabilities are recognised for taxable temporary differences associated with investments in subsidiaries and associates except where the Group is able to control the reversal of the temporary difference and it is probable that the temporary difference will not reverse in the foreseeable future. Deferred tax assets arising from deductible temporary differences associated with such investments and interests are only recognised to the extent that it is probable that there will be sufficient taxable profits against which to utilise the benefits of the temporary differences and they are expected to reverse in the foreseeable future.
The carrying amount of deferred tax assets is reviewed at the end of each reporting period and reduced to the extent that it is no longer probable that sufficient taxable profits will be available to allow all or part of the asset to be recovered.
Deferred tax assets and liabilities are offset when there is a legally enforceable right to set off current tax assets against current tax liabilities and when they relate to income taxes levied by the same taxation authority and the Group intends to settle its current tax assets and liabilities on a net basis.
Current & deferred tax for the periodCurrent and deferred tax are recognised as an expense or income in profit or loss, except when they relate to items that are recognised outside profit or loss (whether in other comprehensive income or directly in equity), in which case the tax is also recognised outside profit or loss, or where it arises from the initial accounting for a business combination. In the case of a business combination, the tax effect is included in the accounting for the business combination.
Significant accounting estimates and assumptionsRecoverability of tax lossesThe Group is subject to income taxes in Australia and foreign jurisdictions, significant estimates are required in determining the recoverability of deferred tax assets in these locations. The assumptions regarding future realisation, and therefore the recognition of deferred tax assets, may change due to future operating performance and other factors.
The directors have considered the recoverability of international tax losses as included in deferred tax balances at 30 June 2016 of $1.1 million (2015: $1.9 million). Having regard to the improved performance in the second half of the year, the length of contracts in place, proven past and forecast profitability, the directors believe it is probable that these amounts will be recovered.
4 Capital StructureThe Group manages its capital to ensure that entities in the Group will be able to continue as a going concern while maximising the return to stakeholders through the optimisation of the debt and equity balances. The capital structure of the Group consists of debt, which includes the borrowings disclosed in Note 3.7, cash and equity attributable to equity holders of the Parent, comprising issued capital as disclosed in Note 4.1, reserves as disclosed in Note 4.2, other equity and retained earnings.
There have been no changes in the strategy adopted by management to control the capital of the Group since the prior year. This strategy is to ensure that the Group’s gearing ratio (net debt/equity) remains below 30%. The gearing ratios at year end are as follows:
CONSOLIDATED GROUP
Note 2016 $000
2015 $000
Total borrowings 3.7 20,116 25,020
Less cash 3.1 (4,690) (5,729)
Net debt 15,426 19,291
Total equity 90,033 93,409
Total capital 105,459 112,700
Gross gearing ratio (gross debt/equity) 22.3% 26.8%
Net gearing ratio (net debt/equity) 17.1% 20.7%
For
per
sona
l use
onl
y

NOTES TO THE FINANCIAL STATEMENTSFOR THE YEAR ENDED 30 JUNE 2016
63ANNUAL REPORT 2016 SWICK MINING SERVICES
4.1 Issued capitalCONSOLIDATED GROUP
2016 $000
2015 $000
Share capital
Fully paid ordinary share capital 75,036 75,841
75,036 75,841
Fully paid ordinary shares carry one vote per share and carry the right to dividends. The Company does not have a limited amount of authorised capital and issued shares do not have a par value.
CONSOLIDATED GROUP
2016 No.
2015 No.
Movement in ordinary shares on issue
At the beginning of the reporting period 217,643,703 216,123,326
Issue of shares under the Company’s Performance Rights Plan 601,439 1,520,377
Shares bought back during the year (5,986,045) -
At the end of the reporting period 212,259,097 217,643,703
The shares bought back in the current year were cancelled immediately, other than 780,174 shares that were cancelled after 30 June 2016 (2015: nil).
Where any group company purchases the Company’s equity instruments, for example as the result of a share buy-back or a share-based payment plan, the consideration paid, including any directly attributable incremental costs (net of income taxes) is deducted from equity attributable to the owners of the Company as treasury shares until the shares are cancelled or reissued.
Where such ordinary shares are subsequently reissued, any consideration received, net of any directly attributable incremental transaction costs and the related income tax effects, is included in equity attributable to the owners of the Company.
4.2 ReservesCONSOLIDATED GROUP
2016 $000
2015 $000
Foreign exchange translation reserve 841 631
Share-based payments reserve 1,567 1,449
Asset revaluation reserve 196 280
Total reserves 2,604 2,360
Foreign currency translation reserveThe foreign currency translation reserve records exchange differences arising on translation of foreign controlled subsidiaries.
Share-based payments reserveThe share-based payments reserve records items recognised as expenses on valuation of employee share options or issue of performance rights. Details of share-based payments can be found in the Remuneration Report and below.
Asset revaluation reserveThe asset revaluation reserve represents the cumulative gains and losses arising on the revaluation of available-for-sale financial assets that have been recognised in other comprehensive income, net of amounts reclassified to profit or loss when those assets have been disposed of or are determined to be impaired.
For
per
sona
l use
onl
y

NOTES TO THE FINANCIAL STATEMENTSFOR THE YEAR ENDED 30 JUNE 2016
64 SWICK MINING SERVICES ANNUAL REPORT 2016
Share-based paymentsThe Company has established the Swick Mining Services Limited Performance Rights Plan. The rights were granted at no cost to the executives and will convert into ordinary shares on completion of specified periods of service.
A summary of the movements of all Company performance rights on issue is as follows:
CONSOLIDATED GROUP
2016 No.
2015 No.
Balance at the beginning of the year 801,439 1,206,124
Granted - 1,315,692
Vested (601,439) (1,520,377)
Expired - (200,000)
Balance at year end 200,000 801,439
Exercisable at year end - -
Performance rights vested on meeting the continuing service vesting condition. Further information relating to the Group’s Performance Rights, including details of issued, exercised, and lapsed Performance Rights is set out in the Directors Remuneration Report.
During the year no shares were purchased by the employee share trust. As at 30 June 2016, there are nil unallocated Swick shares held in trust.
The Group provides benefits to employees of the Group in the form of share-based payment transactions, whereby employees render services in exchange for shares or rights over shares (‘equity-settled transactions’). The cost of these equity-settled transactions with employees is measured by reference to the fair value at the date at which they are granted.
In valuing equity-settled transactions, the company uses the price of the shares of the Company. The cost of equity-settled transactions is recognised, together with a corresponding increase in equity, over the period in which the performance conditions are fulfilled, ending on the date on which the relevant employees become fully entitled to the award (‘vesting date’). The cumulative expense recognised for equity-settled transactions at each reporting date until vesting date reflects:
(i) the extent to which the vesting period has expired; and
(ii) the number of awards that, in the opinion of the directors of the Group, will ultimately vest. This opinion is formed based on the best available information at reporting date. No adjustment is made for the likelihood of market performance conditions being met as the effect of these conditions is included in the determination of fair value at grant date. No expense is recognised for awards that do not ultimately vest, except for awards where vesting is conditional upon a market condition.
Where the terms of an equity-settled award are modified, as a minimum an expense is recognised as if the terms had not been modified. In addition, an expense is recognised for any increase in the value of the transaction as a result of the modification, as measured at the date of modification. Where an equity-settled award is cancelled, it is treated as if it had vested on the date of cancellation, and any expense not yet recognised for the award is recognised immediately. However, if a new award is substituted for the cancelled award, and designated as a replacement award on the date that it is granted, the cancelled and new awards are treated as if they were a modification of the original award, as described in the previous paragraph.F
or p
erso
nal u
se o
nly

NOTES TO THE FINANCIAL STATEMENTSFOR THE YEAR ENDED 30 JUNE 2016
65ANNUAL REPORT 2016 SWICK MINING SERVICES
5 Financial Risk ManagementFinancial risk management objectivesThe Group’s corporate finance function provides services to the business, coordinates access to domestic and financial markets, and monitors and manages the financial risks relating to the operations of the Group through internal risk reports which analyse exposures by degree and magnitude of risks. These risks include market risk (including currency risk, fair value interest rate risk and price risk), credit risk, liquidity risk and cash flow interest rate risk. The Group seeks to minimise the effects of these risks, where deemed appropriate.
Specific financial risk exposures and managementThe main risks the Group is exposed to through its financial instruments are credit risk, liquidity risk and market risk consisting of interest rate risk, foreign currency risk and other price risk (commodity and equity price risk). There have been no substantive changes in the types of risks the Group is exposed to, how these risks arise, or the Board’s objectives, policies and processes for managing or measuring the risks from the previous period.
(a) Credit riskCredit risk refers to the risk that a counter party will default on its contractual obligations resulting in financial loss to the Group. The Group has adopted a policy of only dealing with credit worthy counterparties as a means of mitigating the risk of financial loss from defaults.
Trade receivables consist of a large number of customers, spread across diverse industries and geographical areas. Ongoing credit evaluation is performed on the financial condition of accounts receivable.
As disclosed in Note 2.1, the Group has three customers which individually contribute more than 10% of the revenue. Other than these three customers the Group does not have any significant credit risk exposure to any single counterparty or any Group of counterparties having similar characteristics. The credit risk on liquid funds is limited because the counterparties are banks with high credit ratings assigned by international credit-rating agencies.
The carrying amount of financial assets recorded in the financial statements, net of any allowances for losses, represents the Group’s maximum exposure to credit risk.
(b) Liquidity riskUltimate responsibility for liquidity risk management rests with management and the Board of Directors, who have built an appropriate liquidity risk management framework for the management of the Group’s short, medium and long-term funding and liquidity management requirements.
The Group manages liquidity risk by maintaining adequate reserves, banking facilities and reserve borrowing facilities by continuously monitoring forecast and actual cash flows and matching the maturity profiles of financial assets and liabilities. Included in Note 3.7 is a listing of undrawn facilities that the Group has at its disposal to further reduce liquidity risk.
(c) Market riskThe Group’s activities expose it primarily to the financial risks of changes in interest rates. The Group has entered into fixed and floating rate funding agreements with one financial institution to manage its exposure to interest rate risk. The Group is not exposed materially to financial risks of changes in foreign currency exchange rates.
(d) Interest rate riskThe Parent and the Group are exposed to interest rate risk as entities within the Group borrow funds at fixed and variable interest rates. The interest rate risk is managed using a mix of fixed and floating rate debt. At 30 June 2016 approximately 15% (2015: 16%) of Group debt is fixed. A one percentage point increase/decrease in interest rates would result in a net profit after tax decrease/increase of approximately $119,000 (2015: $147,000).
For
per
sona
l use
onl
y
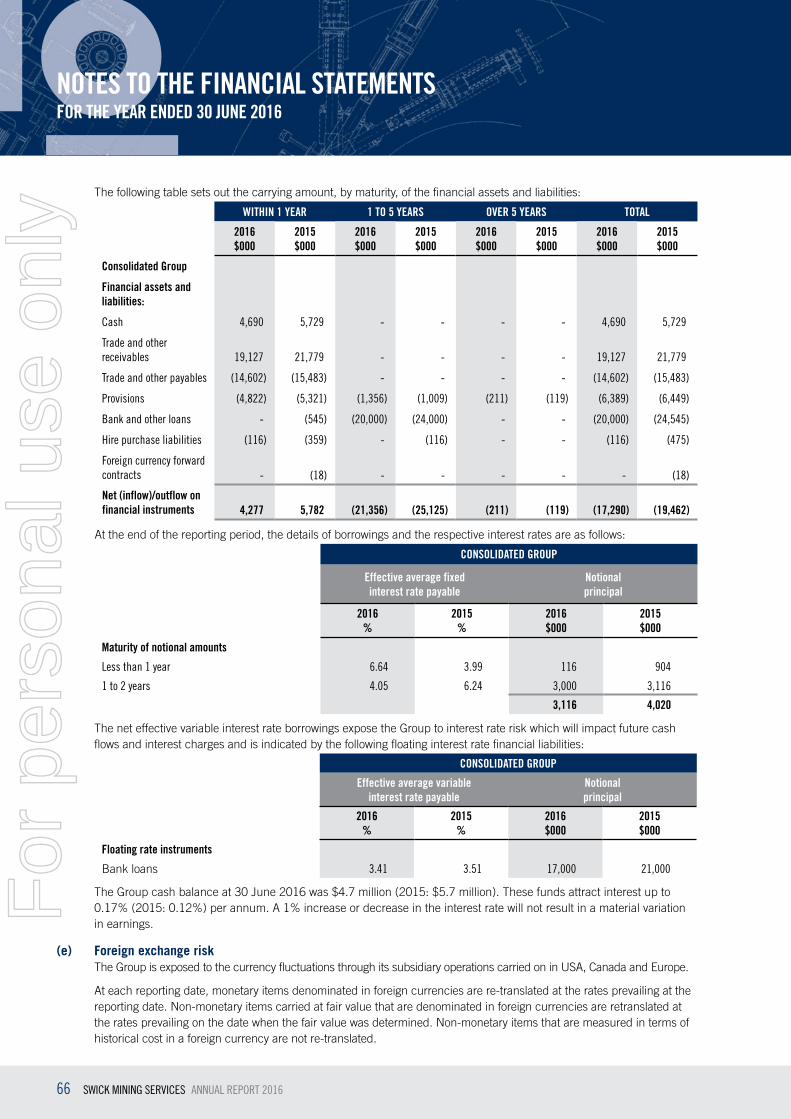
NOTES TO THE FINANCIAL STATEMENTSFOR THE YEAR ENDED 30 JUNE 2016
66 SWICK MINING SERVICES ANNUAL REPORT 2016
The following table sets out the carrying amount, by maturity, of the financial assets and liabilities:
WITHIN 1 YEAR 1 TO 5 YEARS OVER 5 YEARS TOTAL
2016 $000
2015 $000
2016 $000
2015 $000
2016 $000
2015 $000
2016 $000
2015 $000
Consolidated Group
Financial assets and liabilities:
Cash 4,690 5,729 - - - - 4,690 5,729
Trade and other receivables 19,127 21,779 - - - - 19,127 21,779
Trade and other payables (14,602) (15,483) - - - - (14,602) (15,483)
Provisions (4,822) (5,321) (1,356) (1,009) (211) (119) (6,389) (6,449)
Bank and other loans - (545) (20,000) (24,000) - - (20,000) (24,545)
Hire purchase liabilities (116) (359) - (116) - - (116) (475)
Foreign currency forward contracts - (18) - - - - - (18)
Net (inflow)/outflow on financial instruments 4,277 5,782 (21,356) (25,125) (211) (119) (17,290) (19,462)
At the end of the reporting period, the details of borrowings and the respective interest rates are as follows:
CONSOLIDATED GROUP
Effective average fixed interest rate payable
Notional principal
2016 %
2015 %
2016 $000
2015 $000
Maturity of notional amounts
Less than 1 year 6.64 3.99 116 904
1 to 2 years 4.05 6.24 3,000 3,116
3,116 4,020
The net effective variable interest rate borrowings expose the Group to interest rate risk which will impact future cash flows and interest charges and is indicated by the following floating interest rate financial liabilities:
CONSOLIDATED GROUP
Effective average variable interest rate payable
Notional principal
2016 %
2015 %
2016 $000
2015 $000
Floating rate instruments
Bank loans 3.41 3.51 17,000 21,000
The Group cash balance at 30 June 2016 was $4.7 million (2015: $5.7 million). These funds attract interest up to 0.17% (2015: 0.12%) per annum. A 1% increase or decrease in the interest rate will not result in a material variation in earnings.
(e) Foreign exchange riskThe Group is exposed to the currency fluctuations through its subsidiary operations carried on in USA, Canada and Europe.
At each reporting date, monetary items denominated in foreign currencies are re-translated at the rates prevailing at the reporting date. Non-monetary items carried at fair value that are denominated in foreign currencies are retranslated at the rates prevailing on the date when the fair value was determined. Non-monetary items that are measured in terms of historical cost in a foreign currency are not re-translated.
For
per
sona
l use
onl
y

NOTES TO THE FINANCIAL STATEMENTSFOR THE YEAR ENDED 30 JUNE 2016
67ANNUAL REPORT 2016 SWICK MINING SERVICES
Exchange differences arising, if any, are recognised in other comprehensive income and accumulated in equity.
The following table details the Group’s sensitivity to a 10% increase in the Australian dollar against the relevant foreign currencies. 10% is the sensitivity rate used when reporting foreign currency risk internally to Key Management Personnel and represents management’s assessment of the reasonably possible change in foreign exchange rates in a single year. The sensitivity analysis includes only outstanding foreign currency denominated monetary items and adjusts their translation at the year-end for a 10% change in foreign currency rates. The sensitivity analysis includes external loans as well as loans to foreign operations within the Group where the denomination of the loan is in a currency other than the functional currency of the lender or the borrower. A positive number below indicates an increase in equity.
CONSOLIDATED GROUP
Net Financial assets/(liabilities) Impact on equity
2016 $000
2015 $000
2016 $000
2015 $000
Currency
Canadian dollar (9,864) (8,551) 986 855
US dollar 1,657 1,438 (166) (144)
Euro (5,690) (3,759) 569 376
Swedish Krona (73) 188 7 (19)
Debt and equity instruments are classified as either financial assets, financial liabilities or as equity in accordance with the substance of the contractual arrangement.
(i) Financial assetsInvestments are recognised and derecognised on trade date where the purchase or sale of an investment is under contract whose terms require delivery of the investment within the timeframe established by the market concerned, and are initially measured at fair value, net of transaction costs except for those financial assets classified as fair value through profit or loss which are initially measured at fair value.
Subsequent to initial recognition, investments in subsidiaries are measured at cost in the Company financial statements. Subsequent to initial recognition, investments in associates are accounted for under the equity method in the consolidated financial statements and the cost method in the Company financial statements.
Financial assets are derecognised when the rights to receive cash flows from the financial assets have expired or have been transferred and the consolidated entity has transferred substantially all the risks and rewards of ownership.
(ii) Loans and receivablesTrade receivables, loans and other receivables that have fixed or determinable payments that are not quoted in an active market are classified as ‘loans and receivables’. Non-current loans and receivables are measured at amortised cost using the effective interest rate method less impairment. Interest is recognised by applying the effective interest rate. Current trade receivables are recorded at the invoiced amount and do not bear interest.
(iii) Other financial assetsOther financial assets held by the Company are classified as ‘available-for-sale’ financial assets. The classification is determined by the nature and purpose of the financial assets and is determined at the time of initial recognition.
(iv) Financial liabilitiesFinancial liabilities are classified as either financial liabilities at fair value through profit or loss or other financial liabilities.
Financial liabilities at fair value through profit or loss are stated at fair value, with any resultant gain or loss recognised in profit or loss. The net gain or loss recognised in profit or loss incorporates any interest paid on the financial liability.
For
per
sona
l use
onl
y

NOTES TO THE FINANCIAL STATEMENTSFOR THE YEAR ENDED 30 JUNE 2016
68 SWICK MINING SERVICES ANNUAL REPORT 2016
Other financial liabilities, including borrowings, are initially measured at fair value, net of transaction costs, and subsequently measured at amortised cost using the effective interest method, with interest expense recognised on an effective yield basis. The effective interest method is a method of calculating the amortised cost of a financial liability and of allocating interest expense over the relevant period. The effective interest rate is the rate that exactly discounts the estimated future cash payments through the expected life of the financial liability, or, where appropriate, a shorter period.
Financial liabilities are derecognised when the obligations to pay future cash flows for the financial liabilities have expired or have been transferred and the consolidated entity has transferred substantially all the risks and rewards of ownership.
(v) Trade and other payablesTrade and other payables are carried at amortised cost. They represent unsecured liabilities for goods and services procured by the Group prior to the financial period end that remain unpaid and occur when the Group becomes obligated to make future payments. The amounts are unsecured and are usually paid within 30-60 days of recognition.
6 Other Notes6.1 Business combinations
Summary of acquisitionThere was no acquisition carried out in 2016.
The assets and liabilities of Orexplore AB recognised as a result of the acquisition in the prior year are as follows:
CONSOLIDATED GROUP
2016 $000
2015 $000
Business combination:
Cash - 565
Intangible development asset - 4,060
Other assets - 207
Trade and other payables - (108)
Provisions - (43)
Fair value of net identifiable assets - 4,681
Less: non-controlling interest (49.5%) - (2,317)
Net identifiable assets acquired by the Group (50.5%) - 2,364
Consideration transferred comprising of:
Fair value of 46% investment - 2,153
Cash consideration - 546
- 2,699
Excess consideration, being recognised as goodwill - 335
The directors decided to write off the goodwill in the 2015 financial year considering that Orexplore AB is in intellectual property development phase and the product is not available for commercial use.
Revenue and profit contributionThe acquired business contributed income of $201,000 (2015: $145,000) and net loss before tax of $453,000 (2015: profit of $24,000) to the Group for the year ended to 30 June 2016 of which $131,000 (2015: $11,000) is attributable to non-controlling interests.
For
per
sona
l use
onl
y
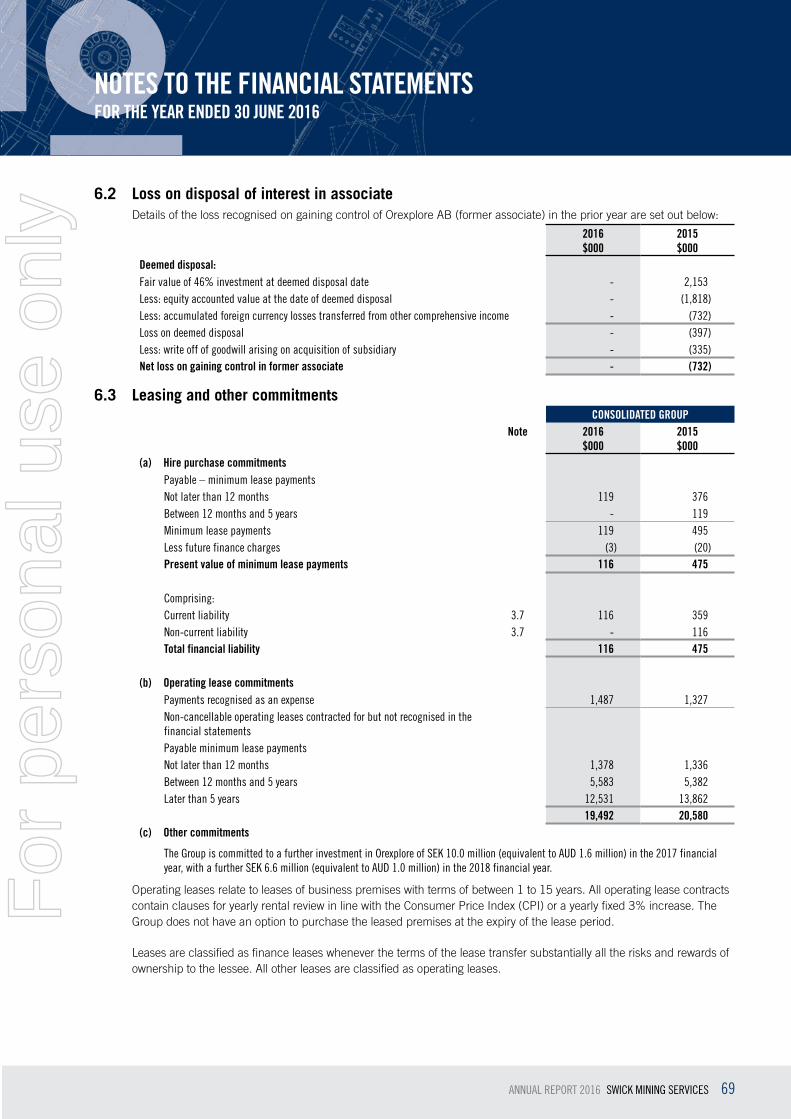
NOTES TO THE FINANCIAL STATEMENTSFOR THE YEAR ENDED 30 JUNE 2016
69ANNUAL REPORT 2016 SWICK MINING SERVICES
6.2 Loss on disposal of interest in associateDetails of the loss recognised on gaining control of Orexplore AB (former associate) in the prior year are set out below:
2016 $000
2015 $000
Deemed disposal:Fair value of 46% investment at deemed disposal date - 2,153Less: equity accounted value at the date of deemed disposal - (1,818)Less: accumulated foreign currency losses transferred from other comprehensive income - (732)Loss on deemed disposal - (397)Less: write off of goodwill arising on acquisition of subsidiary - (335)Net loss on gaining control in former associate - (732)
6.3 Leasing and other commitmentsCONSOLIDATED GROUP
Note 2016 $000
2015 $000
(a) Hire purchase commitmentsPayable – minimum lease paymentsNot later than 12 months 119 376Between 12 months and 5 years - 119Minimum lease payments 119 495Less future finance charges (3) (20)Present value of minimum lease payments 116 475
Comprising:Current liability 3.7 116 359Non-current liability 3.7 - 116Total financial liability 116 475
(b) Operating lease commitmentsPayments recognised as an expense 1,487 1,327Non-cancellable operating leases contracted for but not recognised in the financial statementsPayable minimum lease paymentsNot later than 12 months 1,378 1,336Between 12 months and 5 years 5,583 5,382Later than 5 years 12,531 13,862
19,492 20,580(c) Other commitments
The Group is committed to a further investment in Orexplore of SEK 10.0 million (equivalent to AUD 1.6 million) in the 2017 financial year, with a further SEK 6.6 million (equivalent to AUD 1.0 million) in the 2018 financial year.
Operating leases relate to leases of business premises with terms of between 1 to 15 years. All operating lease contracts contain clauses for yearly rental review in line with the Consumer Price Index (CPI) or a yearly fixed 3% increase. The Group does not have an option to purchase the leased premises at the expiry of the lease period.
Leases are classified as finance leases whenever the terms of the lease transfer substantially all the risks and rewards of ownership to the lessee. All other leases are classified as operating leases.
For
per
sona
l use
onl
y
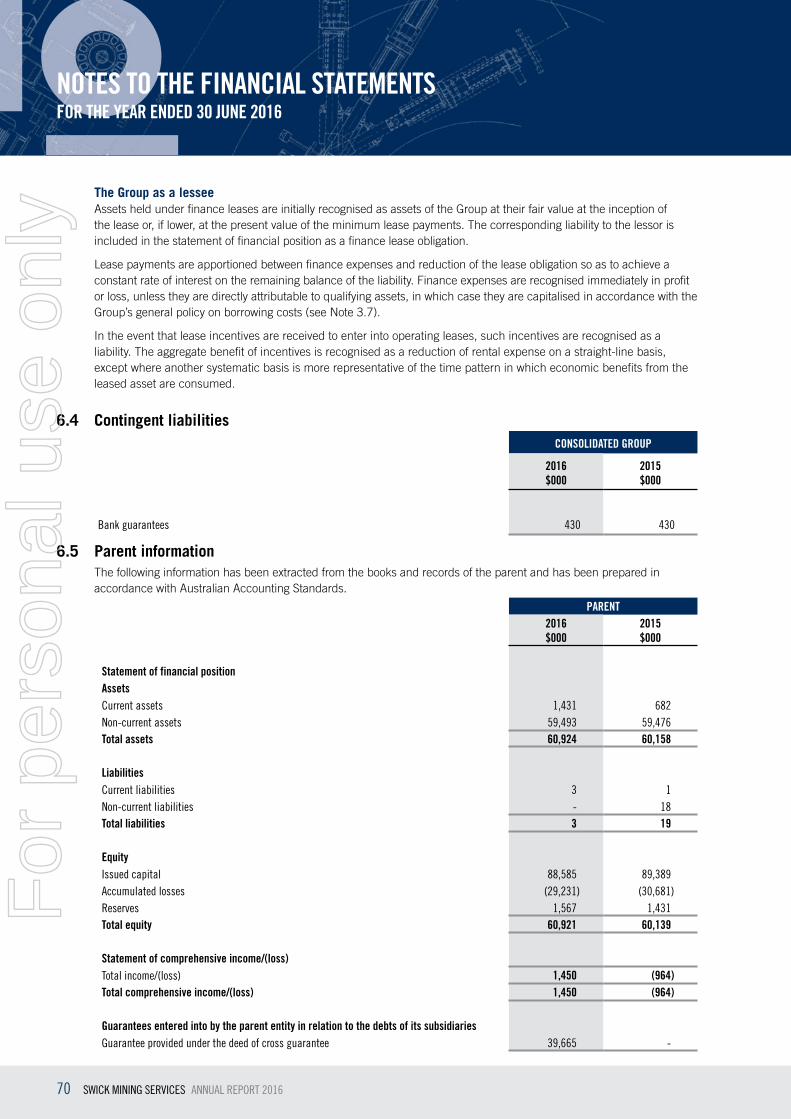
NOTES TO THE FINANCIAL STATEMENTSFOR THE YEAR ENDED 30 JUNE 2016
70 SWICK MINING SERVICES ANNUAL REPORT 2016
The Group as a lesseeAssets held under finance leases are initially recognised as assets of the Group at their fair value at the inception of the lease or, if lower, at the present value of the minimum lease payments. The corresponding liability to the lessor is included in the statement of financial position as a finance lease obligation.
Lease payments are apportioned between finance expenses and reduction of the lease obligation so as to achieve a constant rate of interest on the remaining balance of the liability. Finance expenses are recognised immediately in profit or loss, unless they are directly attributable to qualifying assets, in which case they are capitalised in accordance with the Group’s general policy on borrowing costs (see Note 3.7).
In the event that lease incentives are received to enter into operating leases, such incentives are recognised as a liability. The aggregate benefit of incentives is recognised as a reduction of rental expense on a straight-line basis, except where another systematic basis is more representative of the time pattern in which economic benefits from the leased asset are consumed.
6.4 Contingent liabilitiesCONSOLIDATED GROUP
2016 $000
2015 $000
Bank guarantees 430 430
6.5 Parent informationThe following information has been extracted from the books and records of the parent and has been prepared in accordance with Australian Accounting Standards.
PARENT2016 $000
2015 $000
Statement of financial positionAssetsCurrent assets 1,431 682Non-current assets 59,493 59,476Total assets 60,924 60,158
LiabilitiesCurrent liabilities 3 1Non-current liabilities - 18Total liabilities 3 19
EquityIssued capital 88,585 89,389Accumulated losses (29,231) (30,681)Reserves 1,567 1,431Total equity 60,921 60,139
Statement of comprehensive income/(loss)Total income/(loss) 1,450 (964)Total comprehensive income/(loss) 1,450 (964)
Guarantees entered into by the parent entity in relation to the debts of its subsidiariesGuarantee provided under the deed of cross guarantee 39,665 -
For
per
sona
l use
onl
y

NOTES TO THE FINANCIAL STATEMENTSFOR THE YEAR ENDED 30 JUNE 2016
71ANNUAL REPORT 2016 SWICK MINING SERVICES
On 28 June 2016, Swick Mining Services Limited entered into a deed of cross guarantee with a number of its subsidiaries listed in Note 6.6.
There are no commitments or contingent liabilities in the Parent Entity at 30 June 2016 (2015: nil).
The Company and its wholly-owned Australian resident entities have formed a tax-consolidated Group with effect from 1 July 2009 and are therefore taxed as a single entity from that date. The head entity within the tax-consolidated Group is Swick Mining Services Limited.
6.6 Controlled entities(a) Controlled entities consolidated
COUNTRY OF INCORPORATION PERCENTAGE OWNED (%)
2016 2015
Parent entity:
Swick Mining Services Limited Australia 100 100
Incorporated subsidiaries:
Subsidiaries who are parties to a deed of cross guarantee:
SMS Operations Pty Ltd Australia 100 100
SMS Asset Holdings Pty Ltd Australia 100 100
SMS Engineering Pty Ltd Australia 100 100
Other Subsidiaries of Swick Mining Services Limited:
Swick Mining Services (Indonesia) Pty Ltd Australia 100 100
Swick Mining Services (Canada) Inc Canada 100 100
Swick Mining Services (USA) Inc USA 100 100
Swick Drilling Portugal Unipossal Lda Portugal 100 100
Swick Drilling Europe Ltd United Kingdom 100 100
Orexplore AB Sweden 60.4* 50.5
Interest in trusts:
Swick Mining Services Limited Employee Share Trust Australia 100 N/A
* The Group acquired further interest in Orexplore AB during the 2016 financial year. Cash consideration of $1.6 million was transferred to the subsidiary for the acquisition of this additional interest.
(b) Deed of cross guaranteeOn 28 June 2016, the Company and a number of its wholly owned Australian subsidiaries entered into a deed of cross guarantee. Pursuant to ASIC Class Order 98/1418 (as amended) dated 22 June 2011, the wholly-owned subsidiaries listed above as parties to a deed of cross guarantee are relieved from the Corporations Act 2001 requirements for preparation, audit and lodgement of Financial Reports and Directors’ Reports.
The effect of the deed is that the Company guarantees to each creditor payment in full of any debt in the event of winding up of any of the subsidiaries under certain provisions of the Corporations Act 2001. If a winding up occurs under other provisions of the Act, the Company will only be liable in the event that after six months any creditor has not been paid in full. The subsidiaries have also given similar guarantees in the event that the Company is wound up. Swick Mining Services Limited acts as the trustee for the closed group who are parties to the Class Order.
For
per
sona
l use
onl
y
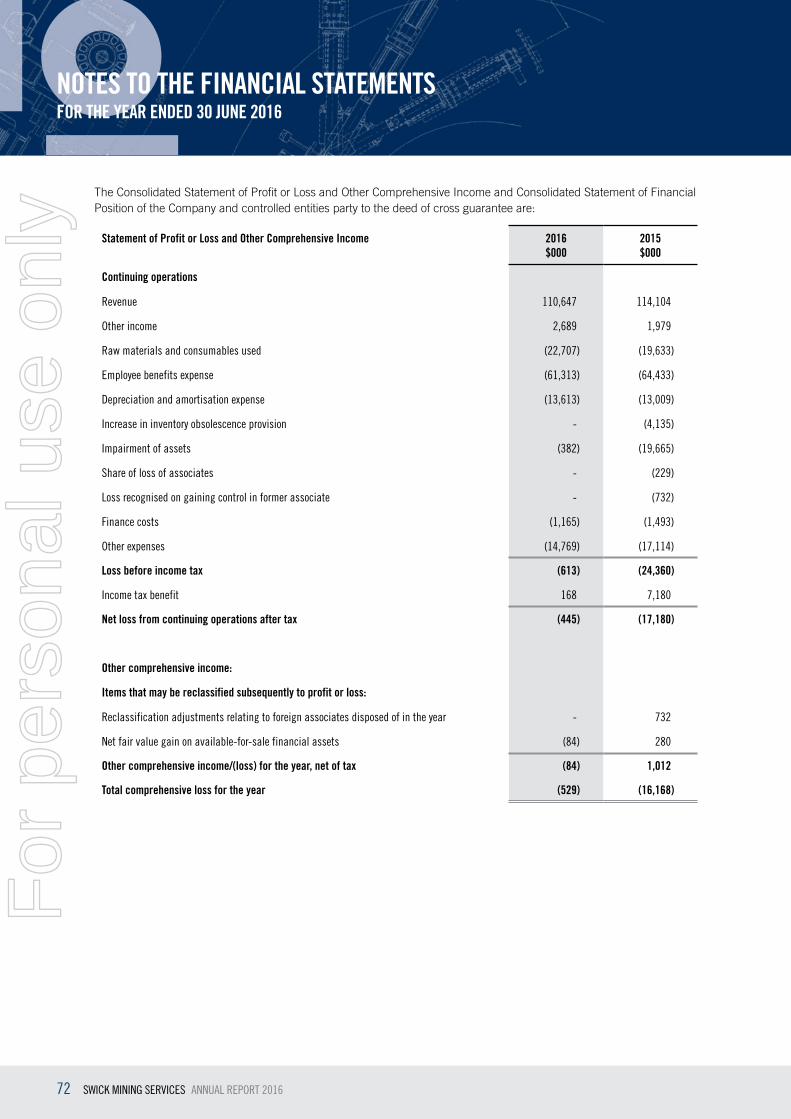
NOTES TO THE FINANCIAL STATEMENTSFOR THE YEAR ENDED 30 JUNE 2016
72 SWICK MINING SERVICES ANNUAL REPORT 2016
The Consolidated Statement of Profit or Loss and Other Comprehensive Income and Consolidated Statement of Financial Position of the Company and controlled entities party to the deed of cross guarantee are:
Statement of Profit or Loss and Other Comprehensive Income 2016 $000
2015 $000
Continuing operations
Revenue 110,647 114,104
Other income 2,689 1,979
Raw materials and consumables used (22,707) (19,633)
Employee benefits expense (61,313) (64,433)
Depreciation and amortisation expense (13,613) (13,009)
Increase in inventory obsolescence provision - (4,135)
Impairment of assets (382) (19,665)
Share of loss of associates - (229)
Loss recognised on gaining control in former associate - (732)
Finance costs (1,165) (1,493)
Other expenses (14,769) (17,114)
Loss before income tax (613) (24,360)
Income tax benefit 168 7,180
Net loss from continuing operations after tax (445) (17,180)
Other comprehensive income:
Items that may be reclassified subsequently to profit or loss:
Reclassification adjustments relating to foreign associates disposed of in the year - 732
Net fair value gain on available-for-sale financial assets (84) 280
Other comprehensive income/(loss) for the year, net of tax (84) 1,012
Total comprehensive loss for the year (529) (16,168)
For
per
sona
l use
onl
y
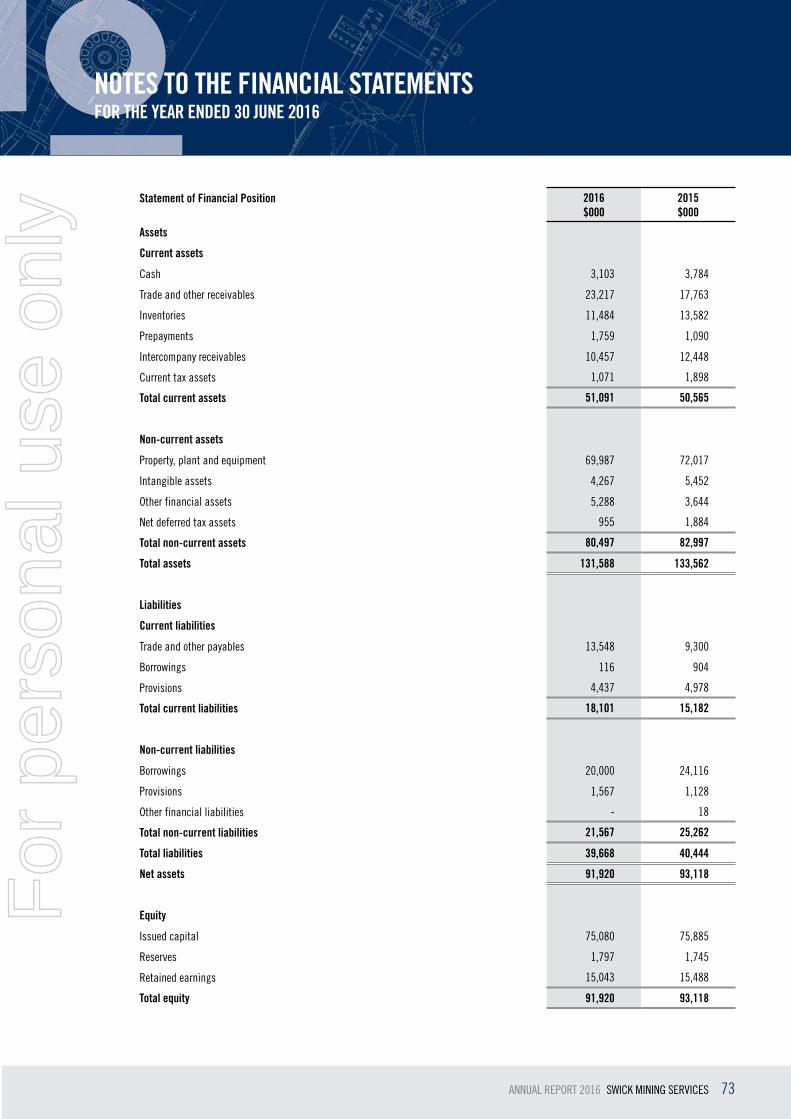
NOTES TO THE FINANCIAL STATEMENTSFOR THE YEAR ENDED 30 JUNE 2016
73ANNUAL REPORT 2016 SWICK MINING SERVICES
Statement of Financial Position 2016 $000
2015 $000
Assets
Current assets
Cash 3,103 3,784
Trade and other receivables 23,217 17,763
Inventories 11,484 13,582
Prepayments 1,759 1,090
Intercompany receivables 10,457 12,448
Current tax assets 1,071 1,898
Total current assets 51,091 50,565
Non-current assets
Property, plant and equipment 69,987 72,017
Intangible assets 4,267 5,452
Other financial assets 5,288 3,644
Net deferred tax assets 955 1,884
Total non-current assets 80,497 82,997
Total assets 131,588 133,562
Liabilities
Current liabilities
Trade and other payables 13,548 9,300
Borrowings 116 904
Provisions 4,437 4,978
Total current liabilities 18,101 15,182
Non-current liabilities
Borrowings 20,000 24,116
Provisions 1,567 1,128
Other financial liabilities - 18
Total non-current liabilities 21,567 25,262
Total liabilities 39,668 40,444
Net assets 91,920 93,118
Equity
Issued capital 75,080 75,885
Reserves 1,797 1,745
Retained earnings 15,043 15,488
Total equity 91,920 93,118
For
per
sona
l use
onl
y

NOTES TO THE FINANCIAL STATEMENTSFOR THE YEAR ENDED 30 JUNE 2016
74 SWICK MINING SERVICES ANNUAL REPORT 2016
6.7 Related party transactionsUltimate parentThe ultimate parent entity that exercises control over the Group is Swick Mining Services Limited, which is incorporated in Australia.
There were no related party transactions other than those related to Key Management Personnel.
For details of disclosures relating to Key Management Personnel, refer to Note 6.8 and the Remuneration Report.
6.8 Key management personnel compensationRefer to the Remuneration Report contained in the Director’s Report for details of the remuneration paid or payable to each member of the Group’s Key management personnel (KMP) for the year ended 30 June 2016.
The total remuneration paid to KMP of the Company and the Group during the year is as follow:
CONSOLIDATED GROUP
2016 $
2015 $
Short-term employee benefits 2,603,663 2,339,621
Post-employment benefits 157,824 147,895
Termination benefits - 160,581
Share-based payments 451,264 343,613
Total KMP compensation 3,212,751 2,991,710
6.9 Auditor’s remunerationCONSOLIDATED GROUP
2016 $
2015 $
Remuneration of the auditor for:
- Audit and review of the financial report 111,000 110,800
- Audit of subsidiary 21,000 26,612
132,000 137,412
The auditor of Swick Mining Services Limited is Deloitte Touche Tohmatsu.
6.10 Events after the reporting periodThe directors are not aware of any significant events since the end of the reporting period.
For
per
sona
l use
onl
y

75ANNUAL REPORT 2016 SWICK MINING SERVICES
In accordance with a resolution of the directors of Swick Mining Services Limited, the directors of the Company declare that:
1. in the directors’ opinion, there are reasonable grounds to believe that the Company will be able to pay its debts as and when they become due and payable;
2. in the directors’ opinion, there are reasonable grounds to believe that the Company and the companies who are party to the Deed of Cross Guarantee, as detailed in Note 6.6, will be able to meet existing or future obligations or liabilities to which they are, or may become subject to by virtue of the Deed of Cross Guarantee;
3. in the directors’ opinion, the attached financial statements are in compliance with International Financial Reporting Standards, as stated in Note 1.2 to the financial statements;
4. in the directors’ opinion, the attached financial statements and notes thereto are in accordance with the Corporations Act 2001, including compliance with accounting standards and giving a true and fair view of the financial position and performance of the consolidated entity; and
5. the directors have been given the declarations required by section 295A of the Corporations Act 2001 from the Chief Executive Officer and Chief Financial Officer.
Signed in accordance with a resolution of the directors made pursuant to section 295(5) of the Corporations Act 2001.
On behalf of the Directors
Kent SwickManaging Director
Dated this 29 day of August 2016
DIRECTORS’ DECLARATIONF
or p
erso
nal u
se o
nly

76 SWICK MINING SERVICES ANNUAL REPORT 2016
INDEPENDENT AUDITOR’S REPORT
Liability limited by a scheme approved under Professional Standards Legislation.
Member of Deloitte Touche Tohmatsu Limited
Independent Auditor’s Report to the members of Swick Mining Services Limited Report on the Financial Report We have audited the accompanying financial report of Swick Mining Services Limited, which comprises the consolidated statement of financial position as at 30 June 2016, the consolidated statement of profit or loss and other comprehensive income, the consolidated statement of cash flows and the consolidated statement of changes in equity for the year ended on that date, notes comprising a summary of significant accounting policies and other explanatory information, and the directors’ declaration of the consolidated entity, comprising the company and the entities it controlled at the year’s end or from time to time during the financial year as set out on pages 38 to 75. Directors’ Responsibility for the Financial Report The directors of the company are responsible for the preparation of the financial report that gives a true and fair view in accordance with Australian Accounting Standards and the Corporations Act 2001 and for such internal control as the directors determine is necessary to enable the preparation of the financial report that gives a true and fair view and is free from material misstatement, whether due to fraud or error. In Note 1.2, the directors also state, in accordance with Accounting Standard AASB 101 Presentation of Financial Statements, that the consolidated financial statements comply with International Financial Reporting Standards. Auditor’s Responsibility Our responsibility is to express an opinion on the financial report based on our audit. We conducted our audit in accordance with Australian Auditing Standards. Those standards require that we comply with relevant ethical requirements relating to audit engagements and plan and perform the audit to obtain reasonable assurance whether the financial report is free from material misstatement. An audit involves performing procedures to obtain audit evidence about the amounts and disclosures in the financial report. The procedures selected depend on the auditor’s judgement, including the assessment of the risks of material misstatement of the financial report, whether due to fraud or error. In making those risk assessments, the auditor considers internal control, relevant to the company’s preparation of the financial report that gives a true and fair view, in order to design audit procedures that are appropriate in the circumstances, but not for the purpose of expressing an opinion on the effectiveness of the company’s internal control. An audit also includes evaluating the appropriateness of accounting policies used and the reasonableness of accounting estimates made by the directors, as well as evaluating the overall presentation of the financial report.
Deloitte Touche Tohmatsu ABN 74 490 121 060 Tower 2, Brookfield Place 123 St Georges Terrace Perth WA 6000 GPO Box A46 Perth WA 6837 Australia Tel: +61 8 9365 7000 Fax: +61 8 9365 7001 www.deloitte.com.au
For
per
sona
l use
onl
y

77ANNUAL REPORT 2016 SWICK MINING SERVICES
INDEPENDENT AUDITOR’S REPORT
We believe that the audit evidence we have obtained is sufficient and appropriate to provide a basis for our audit opinion. Auditor’s Independence Declaration In conducting our audit, we have complied with the independence requirements of the Corporations Act 2001. We confirm that the independence declaration required by the Corporations Act 2001, which has been given to the directors of Swick Mining Services Limited, would be in the same terms if given to the directors as at the time of this auditor’s report. Opinion In our opinion: (a) the financial report of Swick Mining Services Limited is in accordance with the
Corporations Act 2001, including:
(i) giving a true and fair view of the consolidated entity’s financial position as at 30 June 2016 and of its performance for the year ended on that date; and
(ii) complying with Australian Accounting Standards and the Corporations Regulations
2001; and (b) the consolidated financial statements also comply with International Financial
Reporting Standards as disclosed in Note 1.2.
Report on the Remuneration Report We have audited the Remuneration Report included in pages 22 to 30 of the directors’ report for the year ended 30 June 2016. The directors of the company are responsible for the preparation and presentation of the Remuneration Report in accordance with section 300A of the Corporations Act 2001. Our responsibility is to express an opinion on the Remuneration Report, based on our audit conducted in accordance with Australian Auditing Standards. Opinion In our opinion the Remuneration Report of Swick Mining Services Limited for the year ended 30 June 2016, complies with section 300A of the Corporations Act 2001. DELOITTE TOUCHE TOHMATSU D K Andrews Partner Chartered Accountants Perth, 29 August 2016
For
per
sona
l use
onl
y

78 SWICK MINING SERVICES ANNUAL REPORT 2016
ASX ADDITIONAL INFORMATION
The additional information set out below is current as at 19 August 2016 and is provided in accordance with the ASX Listing Rules.
1. Substantial shareholdersThe following shareholders have lodged a notice of substantial shareholding in the Company.
SHAREHOLDER NUMBER OF SHARES
Kent Jason Swick 33,117,498
IOOF Holdings Limited 25,400,384
Hercules International Pty Ltd 24,703,502
Vanshap Capital LLC 21,739,586
Rosanne Thelma Swick 13,924,524
Schroder Investment Management Australia Limited 13,815,749
2. Distribution schedule of equity security holdersNUMBER OF HOLDERS
Fully paid shares
1 – 1,000 345
1,001 – 5,000 578
5,001 – 10,000 305
10,001 – 100,000 585
100,001 and over 104
Total number of holders 1,917
3. Holders of unmarketable parcelsThere are 585 shareholders holding less than a marketable parcel of ordinary shares (based on a market price of $0.24 per share).
4. Classes of shares and voting rightsThe voting rights attaching to the Company’s ordinary fully paid shares, as set out in Rule 12.11 of the Constitution, are as follows:
“Subject to any rights or restrictions for the time being attached to any class or classes of Shares, at meetings of Shareholders or classes of Shareholders:
(a) each Shareholder entitled to vote may vote in person or by proxy, attorney or Representative;
(b) on a show of hands, every person present who is a Shareholder or a proxy, attorney or Representative of a Shareholder has one vote; and
(c) on a poll, every person present who is a Shareholder or a proxy, attorney or Representative of a Shareholder shall, in respect of each fully paid Share held by him, or in respect of which he is appointed a proxy, attorney or Representative, have one vote for the Share, but in respect of partly paid Shares, shall have such number of votes being equivalent to the proportion which the amount paid (not credited) is of the total amounts paid and payable in respect of those Shares (excluding amounts credited).”
5. Register of securitiesThe register of securities is kept at the office of the Company’s share registry, Security Transfer Registrars Pty Ltd at 770 Canning Highway, Applecross, Western Australia.
For
per
sona
l use
onl
y

79ANNUAL REPORT 2016 SWICK MINING SERVICES
ASX ADDITIONAL INFORMATION
6. Stock Exchange listingThe Company’s securities are quoted on the Australian Securities Exchange (Trading code: SWK).
7. On-market buy-backThere is currently an on-market share buy-back being undertaken by the Company.
8. Twenty largest holders of fully paid sharesSHAREHOLDER SHARES %
1. Hercules International Pty Ltd 24,553,502 11.59
2. HSBC Custody Nominees (Australia) Limited – GSCO ECA 21,739,586 10.26
3. HSBC Custody Nominees (Australia) Limited 17,586,359 8.30
4. JP Morgan Nominees Australia Limited 15,865,078 7.49
5. Kent Jason Swick 15,030,651 7.09
6. Tanya Michelle Swick 14,500,651 6.84
7. Rosanne Thelma Swick 13,874,524 6.55
8. BNP Paribas Noms Pty Ltd 11,760,988 5.55
9. National Nominees Limited 6,184,509 2.92
10. ABN Amro Clearing Sydney Nominees Pty Ltd 5,125,617 2.42
11. Citicorp Nominees Pty Ltd 3,648,333 1.72
12. BNP Paribas Noms (NZ) Limited 3,558,337 1.68
13. Pyxis Holdings Pty Ltd 2,000,000 0.94
14. Hong Chiu & Yok Khoo 1,892,000 0.89
15. K & T Swick Pty Ltd 1,540,000 0.73
16. Jared Lawrence & Kathryn Zaccaria 1,445,559 0.68
17. Kent Swick & Tanya Swick 1,428,698 0.67
18. Seng Teoh & Sin Wong 1,308,267 0.62
19. Azimeh Pty Ltd 1,170,710 0.55
20. Cooee Investments Pty Ltd 960,000 0.45
165,173,369 77.94
9. Unquoted securitiesThere are 2 holders of 200,000 performance rights. Holders of more than 20% are as follows:
NAME OF HOLDER NUMBER
Vahid Haydari 100,000
William Gove 100,000
200,000For
per
sona
l use
onl
y

80 SWICK MINING SERVICES ANNUAL REPORT 2016
Notes
For
per
sona
l use
onl
y

For
per
sona
l use
onl
y

swickmining.com
SWICK MINING SERVICES LTD
64 Great Eastern Highway South Guildford, Western Australia 6055
T +61 8 9277 8800 F +61 8 9277 8844 E [email protected]
(ABN 20 112 917 905)
For
per
sona
l use
onl
y