annual report 2016 - gis | · 2017-04-27 · the registered head office is located at p.o. box...
TRANSCRIPT

A N N U A L
REPORT
2016
GULF INTERNATIONAL SERVICES


Address: P.O. Box 3212,Doha,QatarTel: + 974 4013 2088Fax: + 974 4013 9750Website: www.gis.com.qaEmail: [email protected]

CONTENTS
9 About Gulf International Services
15 Board of Directors
18 Chairman's Message
22 Board of Directors' Report
27 Managing Director's Statement
28 Independent Auditors' Report
42 Consolidated Statement of Profit or Loss and Other Comprehensive Income
44 Consolidated Statement of Financial Position
46 Consolidated Statement of Changes in Equity
47 Consolidated Statement of Cash Flow

His Highness Sheikh Tamim bin Hamad Al-Thani
The Emir of the State of Qatar
His HighnessSheikh Hamad bin Khalifa Al-Thani
The Father Emir

ABOUT GULF INTERNATIONAL SERVICES


ABOUT GULF INTERNATIONAL SERVICES
Gulf International Services Q.S.C. was incorporated as a Qatari joint stock company on February 12, 2008 by Resolution Number 42 of 2008 of the State of Qatar’s Ministry of Economy and Commerce, pursuant to its Memorandum and Articles of Association and Law Number 5 of 2002 concerning Commercial Companies. The authorised share capital is QR 2 billion with the issued share capital consisting of 185.8 million ordinary shares and 1 special share.
The registered office is located at P.O. Box 3212, Doha, State of Qatar. Through the group companies, GIS operates in four distinct segments - insurance and reinsurance, drilling and associated services, helicopter transportation services and catering services.
Head Office Functions and Management Structure Qatar Petroleum provides all of the head office functions for GIS through a comprehensive services agreement. The operations of the subsidiaries remain independently managed by their respective Boards of Directors and senior management teams.
DRILLING
Gulf Drilling International Q.S.C. (“GDI”) GDI was incorporated in 2004 as a joint venture between Qatar Petroleum (60%) and Japan Drilling Company (40%). Subsequent to exercising a share option provision within the joint venture agreement, QP increased its stake to 69.99% and then transferred this shareholding to GIS. With effect from May 1, 2014, GIS exercised an option in the joint venture agreement and acquired the remaining 30% of GDI, resulting in GDI becoming a wholly-owned subsidiary of GIS. The company’s authorized and issued share capital is QR 739.7 million.
The registered head office is located at Palm Tower B, West Bay, 9th Floor, P.O. Box 9072, Doha, State of Qatar. Total headcount as of December 31, 2016 is 1,588, split between head office (155) ,onshore (597) and offshore (836) staff.
Services
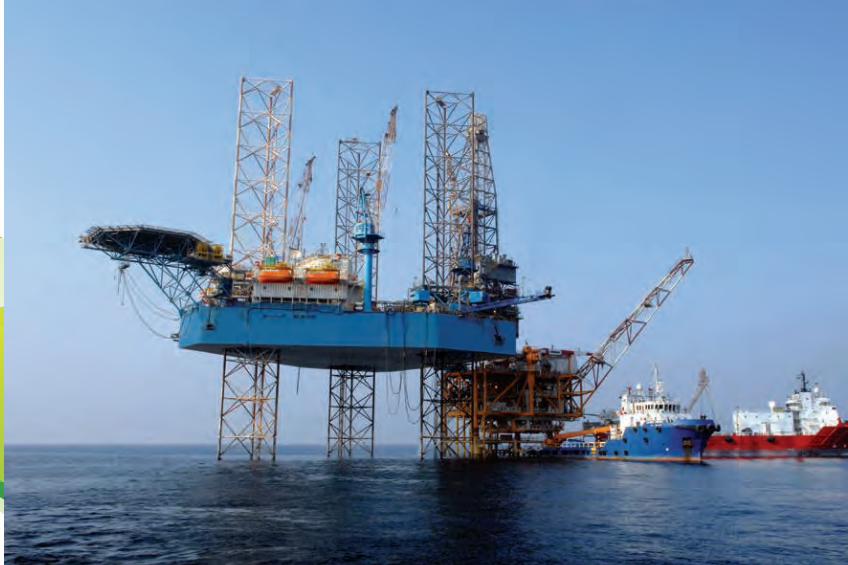
GDI currently has direct ownership of 18 drilling rigs (10 offshore rigs and 8 onshore rigs), which are used to drill wells suitable for oil and natural gas extraction, 1 jack-up accommodation barge and 2 liftboats.
As the only Qatari owned drilling contractor, GDI maintains a close relationship with Qatar Petroleum, due in part to QP’s indirect ownership, and has 12 of its drilling rigs currently contracted to QP.
Offshore Rigs GDI owns 10 offshore jack-up rigs, 4 of which are conventional rigs and 6 are hi-spec, premium rigs.
The conventional rigs Al Doha, Al Wajba and Msheireb are in Class and under contract for work in 2017, having each undergone extensive upgrades, refurbishments and life extension work over the last 5 years. The 4th conventional rig, Al Rayyan, can no longer provide sufficient economic returns and is being retired. The hi-spec, premium rigs, Al Khor, Al Zubarah, Al Jassra, Les-Hat, Dukhan and Halul, are all relatively new, having been built within the last 9 years. Each of those rigs has been specifically designed for operations in Qatar.
9

The 3 conventional rigs still active are rated for a maximum drilling depth of 6,000 meters while the hi-spec, premium rigs are rated for a maximum drilling depth of 9,000 meters.
Onshore Rigs GDI owns 8 onshore rigs, 5 of which are drilling rigs and 3 are work-over rigs. All onshore rigs are currently contracted exclusively to Qatar Petroleum and are rated for maximum drilling depths ranging between 3,000 meters and 9,000 meters.
Accommodation Jack-up Barges and Lift Boats GDI owns 1 jack-up accommodation barge, Zikreet, and 2 liftboats Rumailah and Al Safliya.
INSURANCE AND REINSURANCE
Al Koot Insurance And Reinsurance Company S.A.Q. Incorporated in 2003, it is currently a wholly-owned subsidiary of Gulf International Services (GIS). Al Koot’s authorized share capital is QR 500 million with its paid-in capital currently QR 218.6 million.The registered Head Office is located at Al Maha Building, Bin Omran Area, P.O. Box 24563, Doha, and State of Qatar.
Total headcount is 63 with all staff based at the Head Office.
Services Prior to its acquisition by GIS, Al Koot was the captive insurance company of Qatar Petroleum and hence was established with the primary aim of providing, risk management, insurance and reinsurance services to QP and its business ventures. Following acquisition, Al Koot, as an indirect subsidiary of QP, was providing a de facto captive insurance service to the QP Group until mid 2015. All of the company’s services are principally provided within the construction, operations, marine, and medical insurance and reinsurance fields. Since June 2015 and following QP circular ending the company’s status as QP captive, Al Koot formed various committees to change its structure to commercial entity.
The transformation committee submitted all required documents and necessary explanation about the company’s operation to S&P and got a credit rating of A- stable which enabled Al Koot continue to underwrite energy accounts that are the core business of the company. In the meantime the company started to consolidate its underwriting capabilities and change its structure to meet the new phase.
The company was able to maintain almost all its energy book of business but with reduced shares to allow for the entrance of other local insurers. Our aim is to secure a share of the commercial market and at the same time prepare the company to compete in all future tenders.
AVIATION
Gulf Helicopters Company Q.S.C. (“GHC”) Originally incorporated in 1970 under the name of Gulf Helicopters Limited as a subsidiary of British Overseas Airways Corporation, the company was subsequently acquired by Gulf Air, and then sold to Qatar Petroleum in 1998. QP transferred its 100% shareholding to GIS in 2008. GHC has 2 subsidiaries, Al Maha Aviation Company, in which it owns 92% of the shares and effective control over the remainder, and Redstar Havacilik Hizmetleri A.S., in which it owns 49% of the shares and effective control over the remainder. GHC also has a 36% investment in a joint venture in India, United Helicharters Private Limited, and owns 49% investment
10

in another joint venture in Malta, Gulf Mediterranean Aviation Services. GHC’s authorised and issued share capital is QR 66 million.
The registered head office is located at Ras Abu Aboud Street, P.O. Box 811, Doha, State of Qatar. Total headcount is 413, split between operations, engineering and administration.
Licenses GHC holds an Air Operators Certificate issued by the Qatar Civil Aviation Authority. GHC is recognised by the United States Federal Aviation Authority as an approved repair station and as a maintenance organisation by both the European Aviation Safety Agency and the Qatar Civil Aviation Authority. GHC, through its Libyan subsidiary Al Maha, is registered with the Libyan Civil Aviation Authority. Within Qatar, GHC operates as the sole provider of helicopter transportation services. GHC is also an EASA Part 147 approved Maintenance Training Organisation.
Services GHC’s core operational activities consist of a variety of helicopter transportation services, including offshore / onshore transporting, long- and short-line load lifting, seismic support, VIP executive transport, and ad-hoc short-term contracts. Remaining revenue consists of residential rental income, simulator training, sale of spare parts and third party aircraft and component maintenance.
Fleet GHC currently operates a fleet of 48 helicopters. Of these, 23 are twin-engine Agusta-Westland 139 and 189 helicopters, which can carry between 12 and 15 passengers, 20 twin-engine Bell 412 and 212 class helicopters, with a seating capacity of 13 persons , 3 Bell 206 class helicopters with a seating capacity of 6 persons and 2 Sikorsky S-92 helicopters configured for VVIP use. It’s Turkish subsidiary Redstar Aviation owns a fixed wing Learjet 45 aircraft.
CATERING
AMWAJ Catering Services Company Limited Q.S.C. Incorporated in 2006 as a wholly-owned subsidiary of Qatar Petroleum with an authorised capital of QR 400 million and paid-up capital of QR 100 million, AMWAJ was subsequently acquired by GIS on June 1, 2012.
The registered head office is located at P.O. Box 23904, Doha, State of Qatar. Total headcount is 6,387 with staffs are allocated to various projects in Qatar.
Operations and Services From the original objective to provide catering, AMWAJ has diversified its services to encompass cleaning, pest control, manpower supply, facilities management, waste management, camp management, retail and VIP catering. AMWAJ is perceived to provide “a one-stop solution” to its clients. Health, Safety and Environment matters are ranked as the top priorities for AMWAJ with AMWAJ Operations are covered by our prestigious Quality Management Systems. All Catering Operations were recertified for ISO 22000:2005. The scope for OHSAS 18001:2007 is covering not only Catering Operations but also all Facility Management tasks that are being undertaken by AMWAJ. The Certification of ISO 14001:2004 for Environmental Management System has also been obtained that covers the full scope of AMWAJ Operations.
11

BOARD OF DIRECTORS


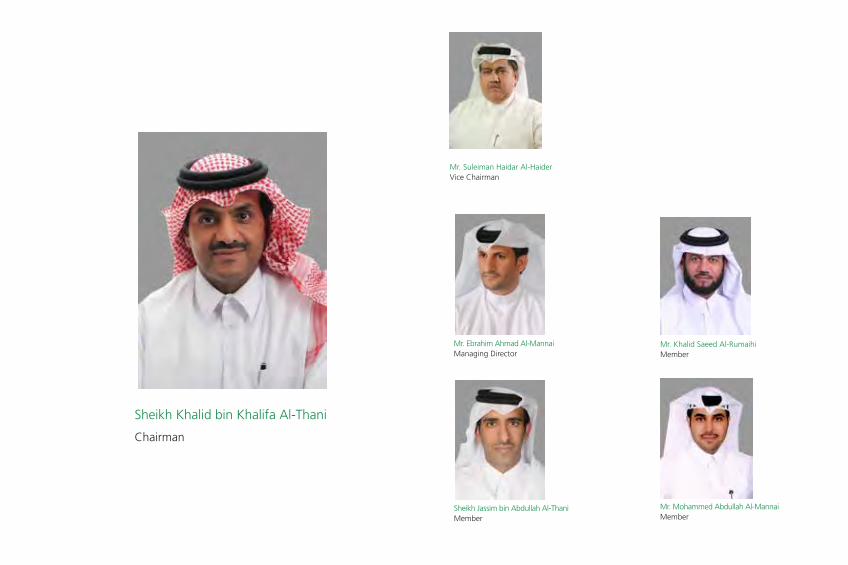
Mr. Suleiman Haidar Al-HaiderVice Chairman
Mr. Khalid Saeed Al-RumaihiMember
Sheikh Jassim bin Abdullah Al-Thani Member
Mr. Ebrahim Ahmad Al-MannaiManaging Director
Mr. Mohammed Abdullah Al-Mannai Member
Sheikh Khalid bin Khalifa Al-Thani
Chairman
CHAIRMAN’S MESSAGE

Sheikh Khalid bin Khalifa Al-Thani
Chairman

Introduction
It gives me great pleasure to welcome all of you to the 9th Annual General Assembly Meeting of Gulf International Services (GIS), the largest services group in the State of Qatar. I thank all of you for supporting me and my fellow Board members during this challenging period.
2016 started on a very cautious note with crude oil prices plunging to a record low which forced most of the global firms, notably oil and gas firms to revisit their corporate and business strategies. As a predominant service provider to the oil and gas sector in the State of Qatar, GIS operations were affected by the volatility in crude oil prices. Despite the unfavorable economic conditions, the insurance, aviation and catering segments continued to deliver solid earnings and cash flows for the group. Ongoing efforts were made to tender for new contracts to have a sustained growth during the turbulent times. The current financing strategy was revisited and efforts have been made to restructure some of the loans. All these efforts are in line with the strategy of maximizing the value of our shareholders. The management is at an advanced stage of engaging a strategy consultant to further enhance the business and corporate strategy of the group.
As the financial performance was mostly driven by factors outside the group’s control, the group has taken every step to rationalize and optimize the factors which are within our control. These efforts were not only crucial for GIS to survive the current position, but will also help to run the group as an effective and efficient organization in the future as well.
Financial Results
In what proved to be a very tough year, GIS recorded commendable financial results for the financial year 2016. The group reported a revenue of QR 3.0 billion and a net profit of QR 67 million while total assets of QR 11.1 billion as at 31 December 2016. Furthermore we were able to generate strong cash flows of QR 0.3 billion, affirming group’s ability to generate robust cash flows even under stressful trading conditions experienced during 2016.
Performance Improvement through Optimization and Rationalization As part of ongoing operations efforts, the group placed utmost importance on optimizing and rationalizing the operating costs leading to efficiency in business operations. This has enabled the group to successfully navigate through a series of global economic upheavals and financial crisis. The group will strive to become a low cost service provider, which would be one of the most important competitive strength for any entity. I am happy to let you know that the group realized savings from the cost optimization initiatives that were in place since late 2015. We were able to achieve these savings by realigning our operations to the group’s long-term strategy, and focus more on adding value through the entire value chain. We are working hard to live up to that promise, to further improve these savings in the years to come. Ongoing restructuring exercises through the group companies were aimed to formulate a business plan that focuses on core products and business competencies. Reducing operating costs by retrenchment of redundant staff, and ceasing unprofitable activities were some of the initiatives undertaken during the year.
18

Capital Expenditure and Business Development
We consider the current unpredictable business environment as an opportunity rather than a threat to the group, and believe that continued investment in operating assets under such environment is essential to reap the available opportunities. Therefore we will continue to invest selectively when the right opportunity becomes available to the group. As mentioned earlier, the group is planning to work with a consultant to refine and evolve a corporate strategy that will focus on identifying the growth opportunities, and to devise plans to execute those strategies.
With respect to the group’s future capital expenditure programs, the group expects to further invest QR 1.1 billion over the next five years. Much of these investments are aimed to respond to the challenges on improving the efficiency and reducing operating costs so that the group will continue to remain competitive.
Proposed Dividend Distribution
For the period from the initial public offering in February 2008 to 2015, the group’s shareholders have received accumulated cash dividends of QR 2.5 billion, which is equivalent to circa QR 13.3 per share, with an average payout ratio of approximately 52%. In addition, shareholders have received a total of 63 million additional shares through three bonus issuances.
The Board of Directors, after considering the operating, investing, and the financing needs of business, is pleased to recommend a dividend distribution for the year ended December 31, 2016 equivalent to a payout of QR 1.0 per share. Conclusion
I can assure you that me and my fellow members of the Board, will continue to put strenuous effort to improve GIS’s financial and operational performance, and to overcome the temporary difficulties faced by the group. I am sure GIS can continue to remain as the flag ship service provider especially in the oil and gas sector within the region by developing sustainable long-term strategies and business development programs. We will inculcate new thinking and infuse new processes to improve our business operations. We are also hopeful that the current gradual recovery of the crude oil prices will improve the confidence amongst our clients, which in turn will help us to better utilize our current asset base, and search for new business opportunities.
I would like to express my gratitude to His Highness, Sheikh Tamim bin Hamad Al-Thani, Emir of the State of Qatar, for his wise guidance and strategic vision. I also wish to thank our dedicated Board members and the senior management of the group companies for working tirelessly for GIS’s sustainable success.
Khalid bin Khalifa Al-Thani,
Chairman of the Board of Directors
19
BOARD OF DIRECTORS’ REPORT


Introduction
The Board of Directors is pleased to present its 9th report on the operational and financial performance of Gulf International Services, the largest services group in Qatar with interests in a broad cross-section of industries, ranging from insurance, re-insurance, onshore and offshore drilling, accommodation barge, helicopter transportation, and catering services.
Financial Results
Revenue Group revenue for the year ended December 31, 2016 was QR 3.0 billion, representing a significant decrease of QR 1.2 billion, or 28%, over last year.
Revenue in the drilling segment for the year ended December 31, 2016 was at QR 1.2 billion compared to QR 1.8 billion in the previous year.
Aviation segmental revenue for 2016 decreased by QR 95 million, or 15%, to close at QR 534 million. This reduction was primarily driven by the lower flying activities in some of the regional markets.
The group’s insurance subsidiary registered gross insurance revenue of QR 439 million, a decrease of QR 246 million, or 36%, compared to last year. The decrease was primarily due to a combination of factors including softening of insurance markets and changes to insurance renewal terms.
Amwaj Catering Services Limited contributed QR 837 million to group revenue, down by QR 168 million, or 17% compared to last year, due to re-pricing of some of its contracts within its core industrial catering services on account of the prevailing tight economic conditions and completion of few short-term projects.
Net Profit Net profit for the year closed at QR 67 million, a year-on-year decrease of QR 734 million, or 92%.This year-on-year decrease was primarily driven by Drilling segment.
The year-on-year net profit variance in the Drilling segment of QR 643 million, or 149%, was driven by a number of factors including lower daily rates, major assets being off contract and impairment of an asset.
Aviation segment earnings for the year ended December 31, 2016 were impacted by reduced revenue. This resulted in QR 28 million reduction in year-on-year net profit to close at QR 165 million.
Profit in the Insurance segment for the financial year reached QR 114 million, a slight increase of QR 2 million, or 1% primarily due to increase in investment income.
Net profit in the Catering segment for 2016 was QR 88 million, down by QR 27 million, or 23% due to significant reduction in revenue.
Despite the unfavorable economic conditions, the insurance, aviation and catering segments continued to deliver solid earnings and cash flows for the group. The group closed the year with a net profit that was 47% less than the budgeted expectations.
22

Ongoing initiatives
Ongoing efforts were made to tender for new contracts to have a sustained growth during the turbulent times. The current financing strategy was revisited and efforts were made to restructure some of the loans. All these efforts are in line with the strategy of maximizing the value of our shareholders. The daily rig rates were renegotiated by the drilling segment clients to be in line with the prevailing international daily rig rates. The management is at an advanced stage of engaging a strategy consultant to further enhance the business and corporate strategy of the group.
Although recent economic headwinds do present challenges to the company, GIS and it’s group companies will continue to strategically grow. Our aviation and insurance segments are planned to grow during the business plan period. Additionally, the group is currently contemplating a number of new strategies that will focus on three main areas namely: identifying growth opportunities within the existing segments, further optimizing the value chain within the group and potential restructuring of the operations, and to diversify into other related services segments within the economy. GIS is intending to appoint a consultancy firm to work with the management in order to support the finalization and implementation of these strategies.
Proposed Dividend Distribution
For the period from the initial public offering in February 2008 to 2015, the group’s shareholders have received accumulated cash dividends of QR 2.5 billion, which is equivalent to circa QR 13.3 per share, with an average payout ratio of approximately 52%. In addition, shareholders have received a total of 63 million additional shares through three bonus issuances.
The Board of Directors, after considering the operating, investing, and the financing needs of business, is pleased to recommend a dividend distribution for the year ended December 31, 2016 equivalent to a payout of QR 1.0 per share.
Conclusion
The Board of Directors expresses its gratitude to His Highness, Sheikh Tamim bin Hamad Al-Thani, Emir of the State of Qatar. Our gratitude is also extended to the Chairman of the Board of Directors, Sheikh Khalid bin Khalifa Al-Thani. We also extend our appreciation to the management and employees of the group companies for their immense work, commitment and dedication to Gulf International Services.
23
MANAGING DIRECTOR’S STATEMENT

Mr. Ebrahim Ahmad Al-Mannai
Managing Director


It is my privilege to present this short report to our respected shareholders on an overview of the performance, principle developments and challenges during 2016.
While GIS group companies witnessed significant challenges in 2016 mainly due to the notable downturn in the crude oil prices, the group was nevertheless able to withstand the challenges to post a net profit of QR 67 million in 2016 with group’s total assets exceeding QR 11.1 billion as of 31 December 2016. The group was also able to generate positive cash flows of QR 0.3 billion.
The net profit was impacted due to many factors, mostly market related. The unprecedented decrease in the oil prices put our drilling segment to face stiff challenges with clients continuously demanding for rate reductions. As oil prices were very low in the early part of 2016, there were excess supply of drilling rigs which forced our drilling subsidiary to adjust the daily rates together with lower utilization.
Other operating segments were also indirectly impacted by the depressed oil prices as much of our clients were oil price dependent. Accordingly, the performance of some of the segments were down on the previous year, except for insurance segment whose performance was up on last year.
The aviation and catering segments net profit exceeded the budget of 2016. In addition the insurance segment closed the year with a net profit that was 56% more than the budgeted expectations. The drop in the profits of the Drilling segment contributed to the overall reduction in the group performance due to assets off contract and lower utilization rates.
As stated by our respected Chairman of the Board of Directors, GIS is actively working on a number of initiatives including developing a new growth strategy to support the group in the future, and to further diversify the group operations to sustain in an uncertain economic environment, and to reduce the operational risks.
I hope we will be able to overcome the challenges caused by the current turbulent business environment, and to achieve excellence in the years to come. The recent recovery in the oil price will bode well with GIS in 2017 and for GIS to have a sound financial year.
Conclusion
In closing, I would like to extend my sincere gratitude to the Board of Directors of Gulf International Services, headed by Sheikh Khaled Bin Khalifa Al-Thani, the Chairman of GIS, the senior management and staff of our group companies for their hard work and support.
Ebrahim Ahmad Al-Mannai
Managing Director
27

INDEPENDENT AUDITORS’ REPORT


The Shareholders
Gulf International Services Q.S.C.
Doha – Qatar
Report on the Audit of the Consolidated Financial Statements
Opinion
We have audited the consolidated financial statements of Gulf International Services Q.S.C. (“the Company”) and its subsidiaries (together “the Group”), which comprise the consolidated statement of financial position as at December 31, 2016, and the consolidated statement of profit or loss and other comprehensive income, consolidated statement of changes in equity and consolidated statement of cash flows for the year then ended, and a summary of significant accounting policies and other explanatory information. In our opinion, the accompanying consolidated financial statements present fairly, in all material respects, the consolidated financial position of the Group as at December 31, 2016, and its consolidated financial performance and its consolidated cash flows for the year then ended in accordance with International Financial Reporting Standards (IFRSs).
Basis for Opinion
We conducted our audit in accordance with International Standards on Auditing (ISAs). Our responsibilities under those standards are further described in the Auditor’s Responsibilities for the Audit of the Consolidated Financial Statements section of our report. We are independent of the Group in accordance with the International Ethics Standards Board for Accountants’ Code of Ethics for Professional Accountants (IESBA Code) together with the other ethical requirements that are relevant to our audit of the Group’s consolidated financial statements in the state of Qatar, and we have fulfilled our other ethical responsibilities. We believe that the audit evidence we have obtained is sufficient and appropriate to provide a basis for our opinion.
INDEPENDENT AUDITOR'S REPORT TO THE SHAREHOLDERS OF GULF INTERNATIONAL SERVICES Q.S.C
31
32
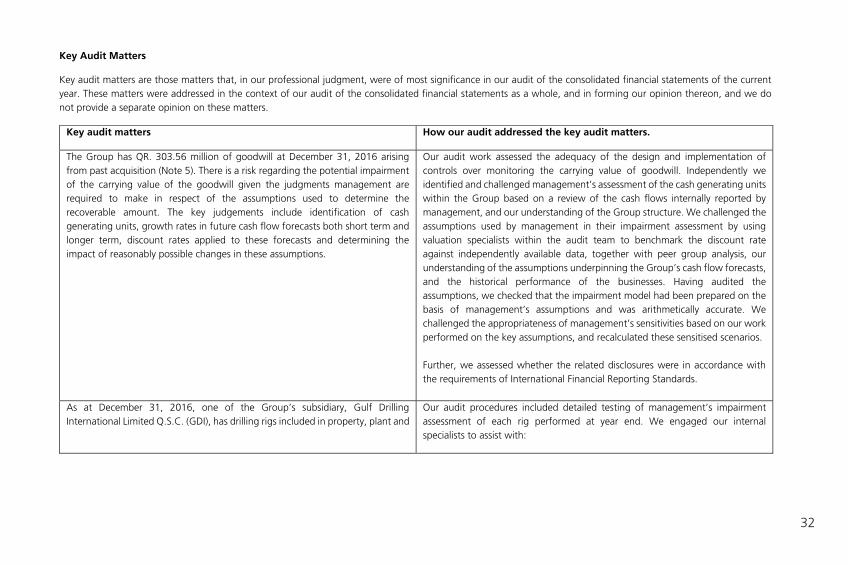
Key Audit Matters
Key audit matters are those matters that, in our professional judgment, were of most significance in our audit of the consolidated financial statements of the current year. These matters were addressed in the context of our audit of the consolidated financial statements as a whole, and in forming our opinion thereon, and we do not provide a separate opinion on these matters.
Key audit matters How our audit addressed the key audit matters.
The Group has QR. 303.56 million of goodwill at December 31, 2016 arising from past acquisition (Note 5). There is a risk regarding the potential impairment of the carrying value of the goodwill given the judgments management are required to make in respect of the assumptions used to determine the recoverable amount. The key judgements include identification of cash generating units, growth rates in future cash flow forecasts both short term and longer term, discount rates applied to these forecasts and determining the impact of reasonably possible changes in these assumptions.
Our audit work assessed the adequacy of the design and implementation of controls over monitoring the carrying value of goodwill. Independently we identified and challenged management’s assessment of the cash generating units within the Group based on a review of the cash flows internally reported by management, and our understanding of the Group structure. We challenged the assumptions used by management in their impairment assessment by using valuation specialists within the audit team to benchmark the discount rate against independently available data, together with peer group analysis, our understanding of the assumptions underpinning the Group’s cash flow forecasts, and the historical performance of the businesses. Having audited the assumptions, we checked that the impairment model had been prepared on the basis of management’s assumptions and was arithmetically accurate. We challenged the appropriateness of management’s sensitivities based on our work performed on the key assumptions, and recalculated these sensitised scenarios. Further, we assessed whether the related disclosures were in accordance with the requirements of International Financial Reporting Standards.
As at December 31, 2016, one of the Group’s subsidiary, Gulf Drilling International Limited Q.S.C. (GDI), has drilling rigs included in property, plant and
Our audit procedures included detailed testing of management’s impairment assessment of each rig performed at year end. We engaged our internal specialists to assist with:

Key audit matters How our audit addressed the key audit matters.
equipment amounting to QR. 5,903.75 million which accounts for 88% of the total assets of the component.
During past few years, the oil prices decreased significantly and some contracts with customers were amended to decrease the operating hours and day rates of some of the Group’s rigs.
As required by IAS 36 (Impairment of Assets), management conducts impairment tests to assess the recoverability of the carrying value of the property, plant and equipment whenever impairment indicators exist.
The assessment is performed using discounted cash flow models. A number of key judgments and assumptions made in determining the inputs into these models include:
Revenue growth Operating margins The discount rates applied to the projected future cash flows.
Critically evaluating whether the discounted cash flow model used by
management to calculate the value in use of the individual rigs complies with the requirements of IAS 36 (Impairment of Assets).
Validating the assumptions used to calculate the discount rates and recalculating these rates.
Analyzing the future projected cash flows used in the models to determine whether they are reasonable and supportable given the current macroeconomic climate and expected future performance of the individual rigs.
Subjecting the key assumptions to sensitivity analyses. Comparing the projected cash flows, including the assumptions relating to
revenue growth rates and operating margins, against historical performance, budgets and external data when available, to assess the reasonableness of management’s projections.
Further, we assessed whether the related disclosures were in accordance with the requirements of International Financial Reporting Standards.
One of the Group’s subsidiaries, Al Koot Insurance and Reinsurance Company S.A.Q. (Al Koot) has two insurance business segments, namely, medical and non-medical insurance.
We performed our audit procedures which were a combination of internal control reliance strategy and specific substantive procedures focusing on the significant risk. Such procedures, include, but are not limited to: Assessing appropriateness of the claims outstanding, IBNR and UPR reserves
computed by Al Koot;
33

34
Key audit matters How our audit addressed the key audit matters.
Al Koot maintained three main types of insurance contract liability to account for the claims incurred during the normal course of its insurance business, as follows: 1. Insurance claims outstanding (QAR 561.4 million) as of December 31, 2016
(Note 11.4): For non-medical claims, the claim is estimated based for interim loss adjusters’ reports, and for claims for which no loss recommendation is given by loss adjusters, interim provision is set up is accordance with the Group’s policy. For medical claims, the provision is determined based on monthly statement provided by the Group’s medical insurance partner.
2. Incurred But Not Reported (“IBNR”) (QAR 164.5 million) as of December 31, 2016 (Note 11.4): IBNR reserve for both medical and non-medical business had been estimated using actuarial assumptions, and internal assessment on adequacy of reserves recommended by an independent actuary.
3. Unearned Premium Reserve (“UPR”) (QAR 60.03 million) as of December 31, 2016 (Note 21): For both medical and non-medical, UPR is determined based on 1/365 method or the duration of the policy, whichever is longer.
Assessing the appropriateness of the claims outstanding, IBNR and UPR by
performing a review of retrospective historical performance of the estimates and judgements made by Al Koot; and
Engaging an actuarial specialist to evaluate the actuarial estimates performed by management’s expert for IBNR on medical and non-medical underwriting reinsurance business.
Further, we assessed whether the related disclosures were in accordance with the requirements of International Financial Reporting Standards.

Key audit matters How our audit addressed the key audit matters.
The computation of claims outstanding, IBNR and UPR are subject to assumptions and key judgment which includes range of historic trend analysis, empirical data and standard actuarial claim projection techniques. The Group has available-for-sale (AFS) financial assets amounting to QR 321.93 million as at December 31, 2016 (Note 9). The valuation and impairment assessment of AFS financial assets involve the use of key judgements.
We reviewed the accurate valuation of AFS financial assets by test checking the following:
The revaluation rates available from established market sources as at
December 31, 2016; and
Management assessments of significant or prolonged decline in value of available for sale investments and other indicators of potential impairment.
Further, we assessed whether the related disclosures were in accordance with the requirements of International Financial Reporting Standards.
Other Information
Management is responsible for the other information. The other information comprises Director’s Report, which we obtained prior to the date of this auditors’ report and annual report, which is expected to be made available to us after that date. The other information does not include the consolidated financial statements and our auditor’s report thereon.
Our opinion on the consolidated financial statements does not cover the other information and we do not express any form of assurance or conclusion thereon.
In connection with our audit of the consolidated financial statements, our responsibility is to read the other information and, in doing so, consider whether the other information is materially inconsistent with the consolidated financial statements or our knowledge obtained in the audit, or otherwise appears to be materially misstated.
If, based on the work we have performed on the other information that we obtained prior to the date of this auditor’s report, we conclude that there is a material misstatement of this other information, we are required to report that fact. We have nothing to report in this regard.
35

36
Responsibilities of Management and Those Charged with Governance for the Financial Statements
Management is responsible for the preparation and fair presentation of the consolidated financial statements in accordance with IFRS, the Company’s Article of associations and applicable provisions of Qatar Commercial Companies’ Law, and for such internal control as management determines is necessary to enable the preparation of consolidated financial statements that are free from material misstatement, whether due to fraud or error.
In preparing the consolidated financial statements, management is responsible for assessing the Group’s ability to continue as a going concern, disclosing, as applicable, matters related to going concern and using the going concern basis of accounting unless management either intends to liquidate the Group or to cease operations, or has no realistic alternative but to do so.
The Board of Directors is responsible for overseeing the Group’s financial reporting process.
Auditor’s Responsibilities for the Audit of the Consolidated Financial Statements
Our objectives are to obtain reasonable assurance about whether the consolidated financial statements as a whole are free from material misstatement, whether due to fraud or error, and to issue an auditor’s report that includes our opinion. Reasonable assurance is a high level of assurance, but is not a guarantee that an audit conducted in accordance with ISAs will always detect a material misstatement when it exists. Misstatements can arise from fraud or error and are considered material if, individually or in the aggregate, they could reasonably be expected to influence the economic decisions of users taken on the basis of these consolidated financial statements.
As part of an audit in accordance with ISA’s, we exercise professional judgement and maintain professional skepticism throughout the audit. We also;
Identify and assess the risks of material misstatement of the consolidated financial statements, whether due to fraud or error, design and perform audit procedures responsive to those risk, and obtain audit evidence that is sufficient and appropriate to provide a basis for our opinion. The risk of not detecting a material misstatement resulting from fraud is higher than the one resulting from error, as fraud may involve collusion, forgery, intentional omission, misrepresentations, or the override of internal control.
Obtain an understanding of internal control relevant to the audit in order to design audit procedures that are appropriate in the circumstances, but not for the purpose of expressing an opinion on the effectiveness of the internal control.
Evaluate the appropriateness of accounting policies used and the reasonableness of accounting estimates and related disclosures made by management.

Conclude on the appropriateness of management’s use of the going concern basis of accounting and based on the audit evidenced obtained, whether a material uncertainty exists related to events or conditions that may cast significant doubt on the Group’s ability to continue as a going concern. If we conclude that a material uncertainty exists, we are required to draw attention in our auditor’s report to the related disclosures in the consolidated financial statements or, if such disclosure are inadequate, to modify our opinion. Our conclusions are based on the audit evidence obtained up to the date of our auditor’s report. However, future events or conditions may cause the Group to cease to continue as a going concern.
Evaluate the overall presentation, structure and content of the consolidated financial statements, including the disclosures, and whether the consolidated financial statements represent the underlying transactions and events in a manner that achieves fair presentation.
Obtain sufficient appropriate audit evidence regarding the financial information of the entities or business activities within the Group to express an opinion on the consolidated financial statements. We are responsible for the direction, supervision and performance of the group audit. We remain solely responsible for our audit opinion.
We communicate with those charged with governance regarding, among other matters, the planned scope and timing of the audit and significant audit findings, including any significant deficiencies in internal control that we identify during our audit.
We also provide those charged with governance with a statement that we have complied with relevant ethical requirements regarding independence, and to communicate with them all relationships and other matters that may reasonably be thought to bear on our independence, and where applicable, related safeguards.
From the matters communicated with those charged with governance, we determine those matters that were of most significance in the audit of the consolidated financial statements of the current period and are therefore the key audit matters. We describe these matters in our auditor’s report unless law and regulations preclude public disclosure about the matter or when, in extremely rare circumstances, we determine that a matter should not be communicated in our report because the adverse consequences of doing so would reasonably be expected to outweigh the public interest benefits of such communication.
Report on Other Legal and Regulatory Requirements Further, as required by the Qatar Commercial Companies’ Law, we report the following:
We are also in the opinion that proper books of account were maintained by the Group, physical inventory verification has been duly carried out.
We obtained all the information and explanations which we considered necessary for our audit.
37

We further confirm that the financial information included in the Director’s report addressed to the General Assembly is in agreement with the books and records of the Group.
To the best of our knowledge and belief and according to the information given to us, no contraventions of the applicable provisions of Qatar Commercial Companies’ Law and the Company’s Articles of Associations were committed during the year which would materially affect the Group’s consolidated financial position and performance.
We draw attention to Note 3 to the consolidated financial statements which explains that a new Qatar commercial companies’ law was issued, replacing Law No. 5 of 2002. On July 7, 2015 the new law was included in the official Gazette for effective use and application. All entities were granted extensions to comply with the provisions of the law until August 7, 2017. The Company’s management is in the process of assessing the impact of the new law on their Articles of Association and the consolidated financial statements.
Doha – Qatar For Deloitte & Touche
February 6, 2017 Qatar Branch
Walid Slim
Partner
License No. 319
38


CONSOLIDATED FINANCIAL STATEMENTS


THE ACCOMPANYING NOTES ARE AN INTEGRAL PART OF THESE CONSOLIDATED FINANCIAL STATEMENTS - 4 -
GULF INTERNATIONAL SERVICES Q.S.C.
CONSOLIDATED STATEMENT OF PROFIT OR LOSS AND OTHER COMPREHENSIVE INCOME For the year ended December 31, 2016
December 31, December 31,
2016 2015
QR ’000 QR ‘000
Revenue 2,988,798 1 4,164,250
Direct costs (2,458,960) 3 (2,953,922)
Gross profit 529,838 5 1,210,328
6
Finance income 28,260 7 20,863 Net gains/(losses) on financial assets at fair value through profit or loss 7,732 (10,011)
Impairment losses on available-for-sale financial assets (2,701) (12,060)
Other income (expenses), net (122,280) 9 (61,799)
Share on loss of joint venture (191) --
Finance cost (125,163) 11 (78,493)
General and administrative expenses (248,534) 13 (267,400)
Profit for the year 66,961 16 801,428
17
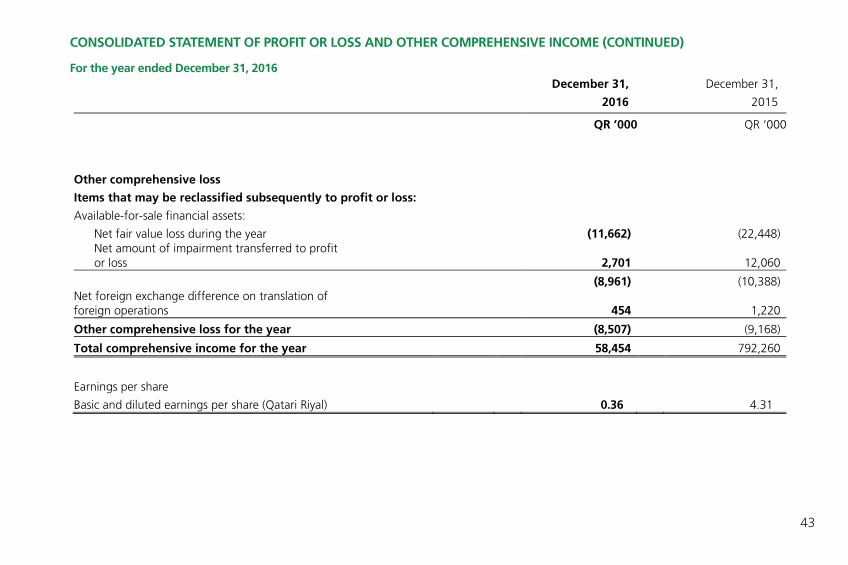
Other comprehensive loss 18
Items that may be reclassified subsequently to profit or loss:
Available-for-sale financial assets:
Net fair value loss during the year (11,662) (22,448) Net amount of impairment transferred to profit or loss 2,701 12,060
(8,961) (10,388) Net foreign exchange difference on translation of foreign operations 454 22 1,220
Other comprehensive loss for the year (8,507) 2 (9,168)
Total comprehensive income for the year 58,454 2 792,260
28
Earnings per share
Basic and diluted earnings per share (Qatari Riyal) 0.36 4.31
CONSOLIDATED STATEMENT OF PROFIT OR LOSS AND OTHER COMPREHENSIVE INCOME
For the year ended December 31, 2016
42
THE ACCOMPANYING NOTES ARE AN INTEGRAL PART OF THESE CONSOLIDATED FINANCIAL STATEMENTS - 4 -
GULF INTERNATIONAL SERVICES Q.S.C.
CONSOLIDATED STATEMENT OF PROFIT OR LOSS AND OTHER COMPREHENSIVE INCOME For the year ended December 31, 2016
December 31, December 31,
2016 2015
QR ’000 QR ‘000
Revenue 2,988,798 1 4,164,250
Direct costs (2,458,960) 3 (2,953,922)
Gross profit 529,838 5 1,210,328
6
Finance income 28,260 7 20,863 Net gains/(losses) on financial assets at fair value through profit or loss 7,732 (10,011)
Impairment losses on available-for-sale financial assets (2,701) (12,060)
Other income (expenses), net (122,280) 9 (61,799)
Share on loss of joint venture (191) --
Finance cost (125,163) 11 (78,493)
General and administrative expenses (248,534) 13 (267,400)
Profit for the year 66,961 16 801,428
17
Other comprehensive loss 18
Items that may be reclassified subsequently to profit or loss:
Available-for-sale financial assets:
Net fair value loss during the year (11,662) (22,448) Net amount of impairment transferred to profit or loss 2,701 12,060
(8,961) (10,388) Net foreign exchange difference on translation of foreign operations 454 22 1,220
Other comprehensive loss for the year (8,507) 2 (9,168)
Total comprehensive income for the year 58,454 2 792,260
28
Earnings per share
Basic and diluted earnings per share (Qatari Riyal) 0.36 4.31
CONSOLIDATED STATEMENT OF PROFIT OR LOSS AND OTHER COMPREHENSIVE INCOME (CONTINUED)
For the year ended December 31, 2016
43

CONSOLIDATED STATEMENT OF FINANCIAL POSITION
As at December 31, 2016
THE ACCOMPANYING NOTES ARE AN INTEGRAL PART OF THESE CONSOLIDATED FINANCIAL STATEMENTS - 2 -
December 31, December 31, 2016 2015 QR ‘000 2 QR ‘000 3 ASSETS 4 Non-current assets 5 Property, plant and equipment 7,338,859 6 7,364,128 Goodwill 303,559 7 303,559 Intangible assets 2,224 9 3,336 Held-to-maturity financial assets 85,468 10 85,521 Available-for-sale financial assets 321,930 11 314,419 Total non-current assets 8,052,040 13 8,070,963 Current assets Inventories 218,614 16 221,984 Due from related parties 309,533 17 598,460 Accounts receivable, prepayments and other debit balances 720,377 18 841,481 Insurance contract receivables 266,999 19 328,237 Financial assets at fair value through profit or loss 214,149 206,417 Cash and bank balances 1,335,724 21 961,207 Total current assets 3,065,396 23 3,157,786 Total assets 11,117,436 25 11,228,749 26 EQUITY AND LIABILITIES 27 Equity 28 Share capital 1,858,409 29 1,858,409 Legal reserve 352,294 30 340,893 General reserve 74,516 31 74,516 Foreign currency translation reserve 1,325 32 871 Fair value reserve 12,239 33 21,200 Retained earnings 1,499,985 34 1,631,940 Total equity 3,798,768 36 3,927,829 37
44

CONSOLIDATED STATEMENT OF FINANCIAL POSITION (CONTINUED)
As at December 31, 2016
THE ACCOMPANYING NOTES ARE AN INTEGRAL PART OF THESE CONSOLIDATED FINANCIAL STATEMENTS - 3 -
GULF INTERNATIONAL SERVICES Q.S.C.
CONSOLIDATED STATEMENT OF FINANCIAL POSITION (CONTINUED) As at December 31, 2016
These consolidated financial statements were approved by the Board of Directors and signed on its behalf on February 6, 2017 by:
December 31, December 31, 2016 2015 QR ‘000 2 QR ‘000 LIABILITIES 3 Non-current liabilities 38 Employees’ end of service benefits 70,794 74,631 Provision for decommissioning costs 92,088 85,460 Loans and borrowings 4,629,862 40 3,690,290 Total non-current liabilities 4,792,744 42 3,850,381 44 Current liabilities Accounts payable, insurance payables and accruals 1,483,030
1,860,136
Dividends payable 100,210 104,115 Due to related parties 2,712 45 19,533 Loans and borrowings 939,972 47 1,466,755 Total current liabilities 2,525,924 49 3,450,539 Total liabilities 7,318,668 51 7,300,920 Total equity and liabilities 11,117,436 11,228,749
Khalid Bin Khalifa Al-Thani Suleiman Haidar Al-Haider Ebrahim Ahmad Al-Mannai Chairman Vice-Chairman Managing Director
45

CONSOLIDATED STATEMENT OF CHANGES IN EQUITY
For the year ended December 31, 2016
GULF INTERNATIONAL SERVICES Q.S.C.
CONSOLIDATED STATEMENT OF CHANGES IN EQUITY (CONTINUED) For the year ended December 31, 2016
THE ACCOMPANYING NOTES ARE AN INTEGRAL PART OF THESE CONSOLIDATED FINANCIAL STATEMENTS - 6 -
Share capital
Legal reserve
General reserve
Foreign currency
translation reserve
Fair value reserve
Retained earnings
Total QR ‘000 QR ‘000 QR ‘000 QR ‘000 QR ‘000 QR ‘000 QR ‘000 Balance at January 1, 2016 1,858,409 340,893 74,516 871 21,200 1,631,940 3,927,829 Total comprehensive income for the year -- -- -- 454 (8,961) 66,961 58,454 Net movement in legal reserve -- 11,401 -- -- -- (11,401) -- Dividends declared -- -- -- -- -- (185,841) (185,841) Provision for social and sports fund -- -- -- -- -- (1,674) (1,674) Balance at December 31, 2016 1,858,409 352,294 74,516 1,325 12,239 1,499,985 3,798,768
GULF INTERNATIONAL SERVICES Q.S.C.
CONSOLIDATED STATEMENT OF CHANGES IN EQUITY For the year ended December 31, 2016
THE ACCOMPANYING NOTES ARE AN INTEGRAL PART OF THESE CONSOLIDATED FINANCIAL STATEMENTS - 5 -
Share capitalLegal
reserveGeneral reserve
Foreign currency
translation reserve
Fair value reserve
Retained earnings
Total QR ‘000 QR ‘000 QR ‘000 QR ‘000 QR ‘000 QR ‘000 QR ‘000 Balance at January 1, 2015 1,858,409 286,538 74,516 (349) 31,588 1,927,027 4,177,729 Total comprehensive income for the year -- -- -- 1,220 (10,388) 801,428 792,260 Net movement in legal reserve -- 54,355 -- -- -- (54,355) -- Dividends declared -- -- -- -- -- (1,022,124) (1,022,124) Provision for social and sports fund -- -- -- -- -- (20,036) (20,036) Balance at December 31, 2015 1,858,409 340,893 74,516 871 21,200 1,631,940 3,927,829
46
CONSOLIDATED STATEMENT OF CASH FLOWS
For the year ended December 31, 2016
GULF INTERNATIONAL SERVICES Q.S.C.
CONSOLIDATED STATEMENT OF CASH FLOWS For the year ended December 31, 2016
THE ACCOMPANYING NOTES ARE AN INTEGRAL PART OF THESE CONSOLIDATED FINANCIAL STATEMENTS - 7 -
December 31,
2016
December 31,
2015
QR ‘000 QR ‘000
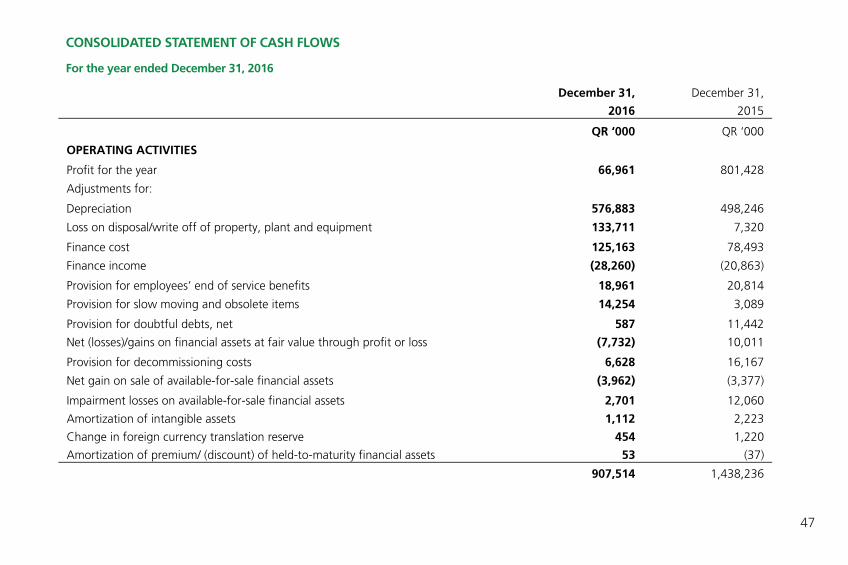
OPERATING ACTIVITIES
Profit for the year 66,961 801,428
Adjustments for:
Depreciation 576,883 498,246
Loss on disposal/write off of property, plant and equipment 133,711 7,320
Finance cost 125,163 78,493
Finance income (28,260) (20,863)
Provision for employees’ end of service benefits 18,961 20,814
Provision for slow moving and obsolete items 14,254 3,089
Provision for doubtful debts, net 587 11,442
Net (losses)/gains on financial assets at fair value through profit or loss (7,732) 10,011
Provision for decommissioning costs 6,628 16,167
Net gain on sale of available-for-sale financial assets (3,962) (3,377)
Impairment losses on available-for-sale financial assets 2,701 12,060
Amortization of intangible assets 1,112 2,223
Change in foreign currency translation reserve 454 1,220
Amortization of premium/ (discount) of held-to-maturity financial assets 53 (37)
907,514 1,438,236
Working capital changes:
Inventories (10,884) (22,307)
Accounts receivable, due from related parties, insurance contract
receivables, prepayments and other debit balances
470,682 (199,352)
Accounts payable, due to related parties, insurance payables and accruals (395,601) 256,160
Cash generated from operating activities 971,711 1,472,737
Employees’ end of service benefits paid (22,798) (10,585)
Net cash generated from operating activities 948,913 1,462,152
INVESTING ACTIVITIES
Proceeds from disposal of available-for-sale financial assets 73,276 25,691
Finance income 28,260 20,863
Proceeds from sale of financial assets at fair value through profit or loss -- 23,810
Acquisition of property, plant and equipment (693,295) (833,991)
Acquisition of financial assets at fair value through profit or loss -- (21,907)
Acquisition of available-for-sale financial assets (88,487) (58,685)
Time deposits with original maturities in excess of three months (75,358) 25,535
Cash at banks – restricted for dividends 3,905 (47,434)
Proceeds from disposal of property, plant and equipment 7,970 6,818
Net cash used in investing activities (743,729) (859,300)
47

CONSOLIDATED STATEMENT OF CASH FLOWS (CONTINUED)
For the year ended December 31, 2016
GULF INTERNATIONAL SERVICES Q.S.C.
CONSOLIDATED STATEMENT OF CASH FLOWS For the year ended December 31, 2016
THE ACCOMPANYING NOTES ARE AN INTEGRAL PART OF THESE CONSOLIDATED FINANCIAL STATEMENTS - 7 -
December 31,
2016
December 31,
2015
QR ‘000 QR ‘000
OPERATING ACTIVITIES
Profit for the year 66,961 801,428
Adjustments for:
Depreciation 576,883 498,246
Loss on disposal/write off of property, plant and equipment 133,711 7,320
Finance cost 125,163 78,493
Finance income (28,260) (20,863)
Provision for employees’ end of service benefits 18,961 20,814
Provision for slow moving and obsolete items 14,254 3,089
Provision for doubtful debts, net 587 11,442
Net (losses)/gains on financial assets at fair value through profit or loss (7,732) 10,011
Provision for decommissioning costs 6,628 16,167
Net gain on sale of available-for-sale financial assets (3,962) (3,377)
Impairment losses on available-for-sale financial assets 2,701 12,060
Amortization of intangible assets 1,112 2,223
Change in foreign currency translation reserve 454 1,220
Amortization of premium/ (discount) of held-to-maturity financial assets 53 (37)
907,514 1,438,236
Working capital changes:
Inventories (10,884) (22,307)
Accounts receivable, due from related parties, insurance contract
receivables, prepayments and other debit balances
470,682 (199,352)
Accounts payable, due to related parties, insurance payables and accruals (395,601) 256,160
Cash generated from operating activities 971,711 1,472,737
Employees’ end of service benefits paid (22,798) (10,585)
Net cash generated from operating activities 948,913 1,462,152
INVESTING ACTIVITIES
Proceeds from disposal of available-for-sale financial assets 73,276 25,691
Finance income 28,260 20,863
Proceeds from sale of financial assets at fair value through profit or loss -- 23,810
Acquisition of property, plant and equipment (693,295) (833,991)
Acquisition of financial assets at fair value through profit or loss -- (21,907)
Acquisition of available-for-sale financial assets (88,487) (58,685)
Time deposits with original maturities in excess of three months (75,358) 25,535
Cash at banks – restricted for dividends 3,905 (47,434)
Proceeds from disposal of property, plant and equipment 7,970 6,818
Net cash used in investing activities (743,729) (859,300)
GULF INTERNATIONAL SERVICES Q.S.C.
CONSOLIDATED STATEMENT OF CASH FLOWS For the year ended December 31, 2016
THE ACCOMPANYING NOTES ARE AN INTEGRAL PART OF THESE CONSOLIDATED FINANCIAL STATEMENTS - 8 -
December 31, 2016
December 31, 2015
QR ‘000 QR ‘000 FINANCING ACTIVITIES
Proceeds from loans and borrowings 1,838,200 1,079,279
Repayment of loans and borrowings (1,425,411) (776,921)
Dividends paid (189,746) (974,690)
Finance costs paid (125,163) (78,493)
Net cash generated from/(used in) financing activities 97,880 (750,825)
Increase/(decrease) in cash and cash equivalents 303,064 (147,973)
Cash and cash equivalents at the beginning of the year 394,480 542,453
Cash and cash equivalents at the end of the year 697,544 394,480
48

CONSOLIDATED STATEMENT OF CASH FLOWS (CONTINUED)
For the year ended December 31, 2016
GULF INTERNATIONAL SERVICES Q.S.C.
CONSOLIDATED STATEMENT OF CASH FLOWS For the year ended December 31, 2016
THE ACCOMPANYING NOTES ARE AN INTEGRAL PART OF THESE CONSOLIDATED FINANCIAL STATEMENTS - 8 -
December 31, 2016
December 31, 2015
QR ‘000 QR ‘000 FINANCING ACTIVITIES
Proceeds from loans and borrowings 1,838,200 1,079,279
Repayment of loans and borrowings (1,425,411) (776,921)
Dividends paid (189,746) (974,690)
Finance costs paid (125,163) (78,493)
Net cash generated from/(used in) financing activities 97,880 (750,825)
Increase/(decrease) in cash and cash equivalents 303,064 (147,973)
Cash and cash equivalents at the beginning of the year 394,480 542,453
Cash and cash equivalents at the end of the year 697,544 394,480
The notes to the consolidated financial statements are integral part of the consolidated financial statements. For more information, please visit GIS's website : www.gis.com.qa
49