annual report 2016 - incus investor · annual report 2016. table of contents ... capital and...
TRANSCRIPT
ANNUAL REPORT 2016
TABLE OF CONTENTS
KEY FIGURES 3
INCUS INVESTOR IN BRIEF 4
COMMENTS FROM THE CEO 5
PRESENTATION OF THE PORTFOLIO 6
SCANA STEEL AB 7
SCANA PROPULSION AS 8
SCANA PROPERTY AS 9
SCANA SKARPENORD AS 10
SCANA OFFSHORE AS 11
SCANA STEEL BOOFORGE AB 12
DIRECTORS’ REPORT 13
DECLARATION BY THE BOARD OF DIRECTORS AND THE CEO 20
CORPORATE GOVERNANCE 21
CONSOLIDATED FINANCIAL STATEMENTS FOR THE INCUS INVESTOR GROUP 25
NOTES 29
FINANCIAL STATEMENTS FOR INCUS INVESTOR ASA 65
NOTES 68
AUDITORS’ REPORT 74
PRESENTATION OF THE BOARD 78
PRESENTATION OF THE MANAGEMENT AND INVESTMENT DIRECTORS 79
CONTACT DETAILS Back
2
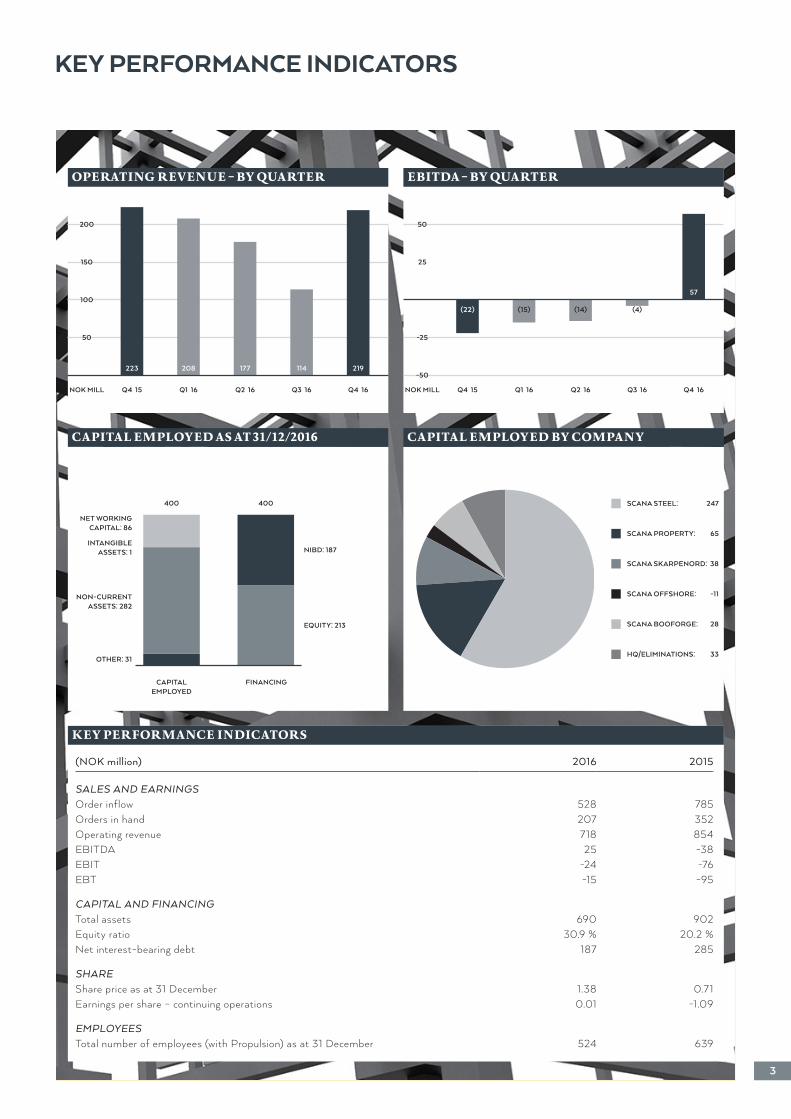
CAPITAL EMPLOYED BY COMPANY
KEY PERFORMANCE INDICATORS
OPERATING REVENUE – BY QUARTER EBITDA – BY QUARTER
CAPITAL EMPLOYED AS AT 31/12/2016
KEY PERFORMANCE INDICATORS
Q4 15 Q4 15Q1 16 Q1 16Q2 16 Q2 16Q3 16 Q3 16Q4 16 Q4 16NOK MILL NOK MILL
CAPITAL EMPLOYED
FINANCING
50 -25
100
25150
200 50
223
(22)
208
(15)
177
(14)
114
(4)
219
57
(NOK million) 2016 2015
SALES AND EARNINGSOrder inflow 528 785Orders in hand 207 352Operating revenue 718 854EBITDA 25 -38EBIT -24 -76EBT -15 -95
CAPITAL AND FINANCINGTotal assets 690 902Equity ratio 30.9 % 20.2 %Net interest-bearing debt 187 285
SHAREShare price as at 31 December 1.38 0.71Earnings per share – continuing operations 0.01 -1.09
EMPLOYEESTotal number of employees (with Propulsion) as at 31 December 524 639
SCANA STEEL: 247
SCANA PROPERTY: 65
SCANA SKARPENORD: 38
SCANA OFFSHORE: -11
SCANA BOOFORGE: 28
HQ/ELIMINATIONS: 33
NET WORKING CAPITAL: 86
INTANGIBLE ASSETS: 1
NON-CURRENT ASSETS: 282
OTHER: 31
NIBD: 187
EQUITY: 213
400 400
3
-50
INCUS INVESTOR ASA IN BRIEF
In 2015, the Board of Scana Industrier ASA voted to convert the business from a Nordic industrial group into an industrial investment company. In 2016, the company decided to change its name to Incus Investor ASA. The company aims to generate value through professional and active ownership of existing and future portfolio companies.
Incus Investor ASA’s organisation consists of a CEO, a Finance Department led by the CFO and a team of investment directors. The Board has the flexibility to choose between employing or hiring in resources as it deems appropriate. A long-term agreement has been entered into with consulting company Converto AS, which brings expertise and capacity both to the portfolio companies and to the head office in Stavanger.
An investment team has been established for each portfolio company, led by an investment director who is also the Chairman of the Board for that particular portfolio company. The investment directors maintain a close dialogue with the CEO and CFO, by means of both formal reporting structures and ongoing discussions on key issues. The aim is for each portfolio company to have the best Board composition based on its business and its strategic and market position.
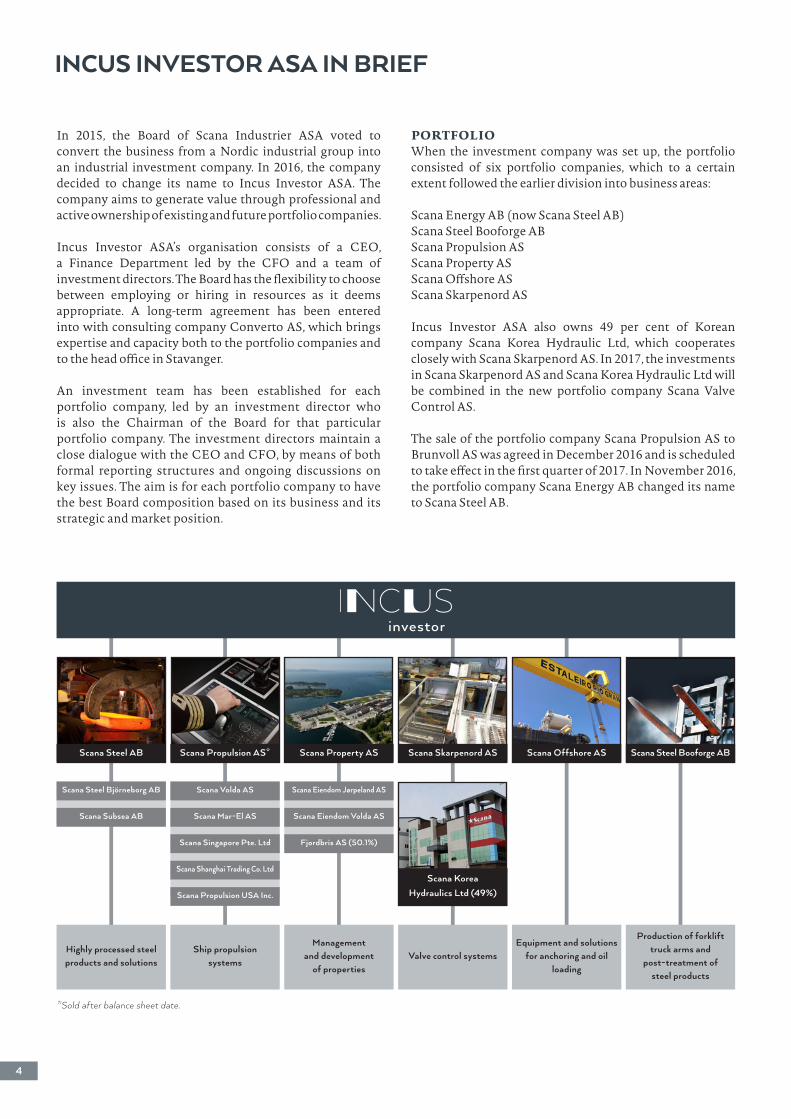
PORTFOLIOWhen the investment company was set up, the portfolio consisted of six portfolio companies, which to a certain extent followed the earlier division into business areas:
Scana Energy AB (now Scana Steel AB)Scana Steel Booforge ABScana Propulsion ASScana Property ASScana Offshore ASScana Skarpenord AS
Incus Investor ASA also owns 49 per cent of Korean company Scana Korea Hydraulic Ltd, which cooperates closely with Scana Skarpenord AS. In 2017, the investments in Scana Skarpenord AS and Scana Korea Hydraulic Ltd will be combined in the new portfolio company Scana Valve Control AS.
The sale of the portfolio company Scana Propulsion AS to Brunvoll AS was agreed in December 2016 and is scheduled to take effect in the first quarter of 2017. In November 2016, the portfolio company Scana Energy AB changed its name to Scana Steel AB.
Scana Steel AB Scana Propulsion AS* Scana Property AS Scana Offshore AS Scana Steel Booforge AB
Scana Steel Björneborg AB Scana Volda AS Scana Eiendom Jørpeland AS
Scana Subsea AB Scana Mar-El AS Scana Eiendom Volda AS
Scana Singapore Pte. Ltd Fjordbris AS (50.1%)
Scana Shanghai Trading Co. Ltd
Scana Propulsion USA Inc.
Highly processed steel products and solutions
Ship propulsion systems
Management and development
of propertiesValve control systems
Equipment and solutions for anchoring and oil
loading
Production of forklift truck arms and
post-treatment of steel products
*Sold after balance sheet date.
4
Scana Skarpenord AS
Scana Korea Hydraulics Ltd (49%)
COMMENTS FROM THE CEO
2016 certainly turned out to be a challenging year involving major changes for Incus Investor. The company has taken further steps in line with the strategic approach set out in 2015 when the company changed from being an industrial group to an industrial investment company. As part of this process, the company has changed its name from Scana Industrier ASA to Incus Investor ASA.
The work to restructure the company and gain control of the debt level has reaped benefits. Net interest-bearing debt has been significantly reduced and will be in the region of NOK 110 million once the last transaction has been completed (Propulsion – March 2017).
As part of the restructuring efforts, Scana Machining was sold to Motala Verkstad Group at the beginning of the year. An agreement to sell Scana Propulsion to Brunvoll was signed in December 2016. The company was at that point ready for sale following a range of improvement processes and the fact that a new and better market position had been secured. Scana Property has sold the properties in Karlskoga and parts of the property in Jørpeland, including the buildings belonging to the steelworks. The remaining property in Jørpeland is being redeveloped. Incus is ensuring extra value creation for the remaining portfolio companies by exercising active and professional ownership.
The work to enhance robustness in a demanding market will also continue into 2017. Costs have been reduced and competitiveness improved through efficiency measures and downsizing. A strong focus on the sales organisation has reaped benefits and several of the companies are seeing their levels of orders in hand rise once more.
The outlook is now brighter. We are seeing a slight improve-ment in the oil and gas industry and the market for our steel products is also improving. But there is still quite a way to go before normal market conditions are restored, so we are working hard to adapt operations to the prevailing situation. We also want to be as prepared as possible for better times and increased activity.
After a successful strategy in which debt reduction and restructuring were key themes, Incus is now in the process of putting a new growth strategy in place. We are now moving our focus from debt reduction to thinking
Regards
Bjørn TorkildsenCEO
proactively and identifying new value-added investments. As a listed company, Incus is a good starting point for companies wanting to make their share liquid. Incus will utilise its good experience of ongoing restructuring processes to cultivate and develop new investments and ensure a good return for our shareholders.
Our employees have shown a great willingness and ability to contribute to profitability throughout 2016. As a result, we have achieved significant improvement. I would like to say a big thank you here to all those who have contributed to the new Incus Investor, where we now see huge potential to generate value for our shareholders.
5
PRESENTATION OF THE PORTFOLIO
6
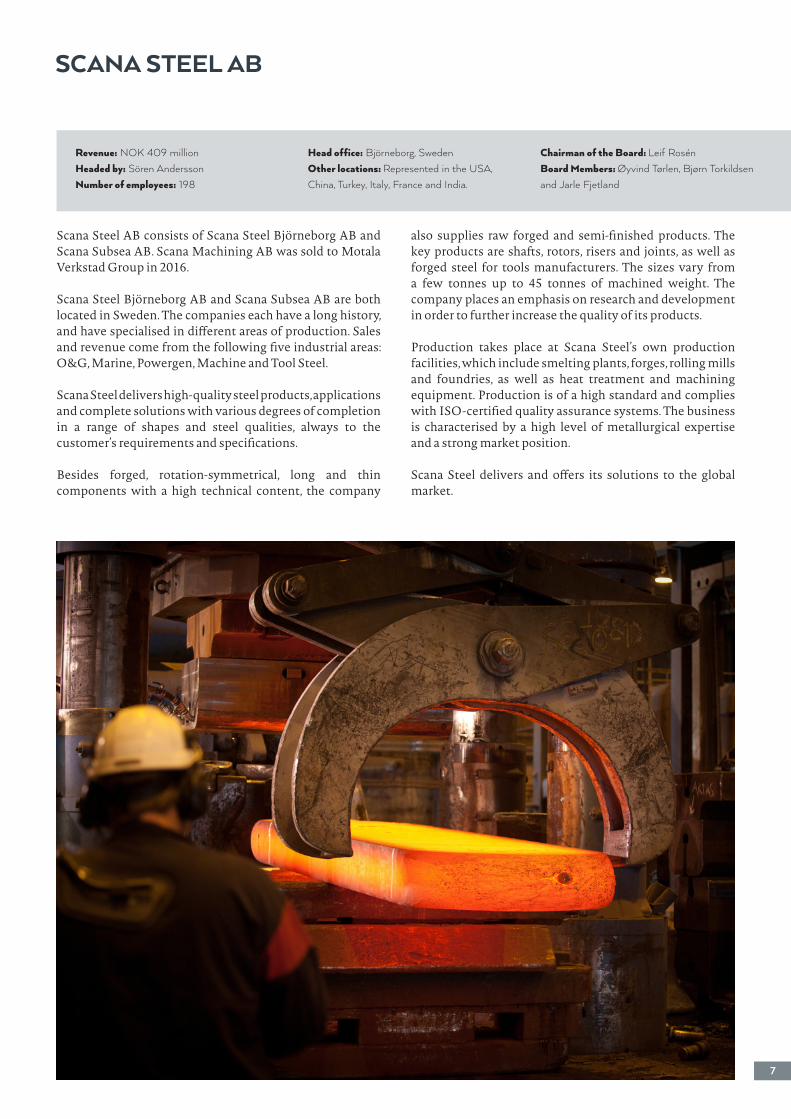
Scana Steel AB consists of Scana Steel Björneborg AB and Scana Subsea AB. Scana Machining AB was sold to Motala Verkstad Group in 2016.
Scana Steel Björneborg AB and Scana Subsea AB are both located in Sweden. The companies each have a long history, and have specialised in different areas of production. Sales and revenue come from the following five industrial areas: O&G, Marine, Powergen, Machine and Tool Steel.
Scana Steel delivers high-quality steel products, applications and complete solutions with various degrees of completion in a range of shapes and steel qualities, always to the customer’s requirements and specifications.
Besides forged, rotation-symmetrical, long and thin components with a high technical content, the company
also supplies raw forged and semi-finished products. The key products are shafts, rotors, risers and joints, as well as forged steel for tools manufacturers. The sizes vary from a few tonnes up to 45 tonnes of machined weight. The company places an emphasis on research and development in order to further increase the quality of its products.
Production takes place at Scana Steel’s own production facilities, which include smelting plants, forges, rolling mills and foundries, as well as heat treatment and machining equipment. Production is of a high standard and complies with ISO-certified quality assurance systems. The business is characterised by a high level of metallurgical expertise and a strong market position.
Scana Steel delivers and offers its solutions to the global market.
SCANA STEEL AB
Revenue: NOK 409 millionHeaded by: Sören AnderssonNumber of employees: 198
Head office: Björneborg, Sweden Other locations: Represented in the USA, China, Turkey, Italy, France and India.
Chairman of the Board: Leif RosénBoard Members: Øyvind Tørlen, Bjørn Torkildsen and Jarle Fjetland
7

Scana Propulsion AS is a leading supplier of propulsion equipment to the global shipbuilding market.
The company has its origins in the well-established companies Volda Mekaniske Verksted AS and Mar-El AS. Volda Mekaniske Verksted started out making engines and propellers all the way back in 1913 and the company later broadened its portfolio to include gears and tunnel thrusters. Mar-El has been producing control systems for propulsion equipment since 1974. The companies were acquired by Scana Industrier in 1998 and 1996 respectively. In addition to the development and production of propulsion equipment, Scana Propulsion has a high level of expertise and resources within service and modifications.
Scana Propulsion has sales and service companies in Singapore, China, the USA and Brazil, as well as sales representatives in South Korea, Chile, Turkey, Greece and Iceland.
PROPULSION SYSTEMSScana Propulsion supplies propulsion systems for most types of offshore vessels, tankers, container ships, fishing vessels, well boats, passenger ships, speed boats and yachts. Fuel savings and environmental considerations are central to the development of new propulsion concepts, which can provide significant savings in vessel operation. Scana Propulsion has very extensive experience in the engineering and production of gears and propeller equipment with control systems for advanced vessels in offshore, fishing and the speedboat/passenger ship segment.
The products are marketed globally by the company’s own sales team, as well as in cooperation with agents and strategic partners. Sales, marketing, engineering, production, project management and service are carried out by companies in Norway, while project follow-up, sales and service are supplemented from local offices.
INNOVATIVE SOLUTIONSScana Propulsion has positioned itself as a leading supplier of advanced propulsion equipment and control systems. With the addition of innovative solutions, including in the field of Permanent Magnet technology, and continuous product development within established product areas, Scana Propulsion provides effective propulsion systems for the shipping fleet of tomorrow that meet stringent requirements for fuel consumption and environmental considerations.
Scana Propulsion sees good growth potential for the company’s new products as a result of national and international shipping authorities increasingly setting requirements for green shipping.
Over the period between 2014 and 2016, the company implemented significant restructuring and cost-reduction measures that have had positive results for the business.
SCANA PROPULSION AS
Headed by: Inge BøenNumber of employees: 171 Head office: Volda, Norway
Other locations: Norway (Dalen), China (Shanghai), Brazil (Rio de Janeiro), USA (Florida), Singapore, South Korea, Turkey, Chile and Iceland
Chairman of the Board: Øyvind TørlenBoard Members: Bjørn Torkildsen and Oddbjørn Eliassen
8
Scana Property AS was established in 2012 as a holding company for Scana’s property companies in Norway and Sweden. The company will create values through the ownership, management, development and sale of proper-ties. At the start of 2016, the companies under Scana Property managed buildings with approx. 90,000 square metres of floor space.
In 2016, two important property sales were made at Scana Property:• 100 per cent of the shares in the Swedish subsidiary Scana
Property AB, which manages buildings with approx. 38,000 square metres of floor space in Karlskoga, were sold to the Swedish company Karlskoga Industrifastighets AB in the third quarter of the year. Following this transaction Scana Property no longer owns any properties in Sweden.
• The industrial premises associated with the smelting plant in Jørpeland were sold to the local company MT Eien-dom AS in the fourth quarter of the year. The transaction covered buildings with approx. 37,000 square metres of floor space and a building plot of approx. 7.5 hectares.
In connection with the agreement to sell the portfolio com pany Scana Propulsion, an agreement has also been entered into regarding a potential future sale of the property company Scana Eiendom Volda AS, a subsidiary of Scana Property AS, subject to specific conditions.
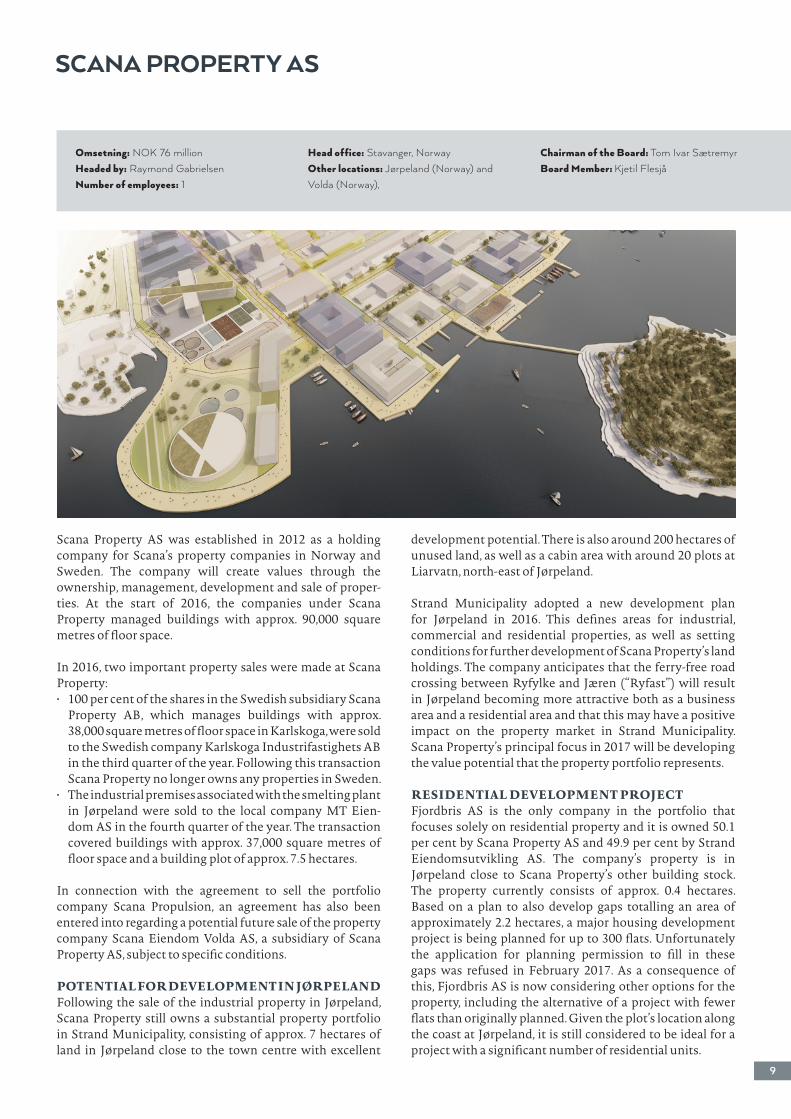
POTENTIAL FOR DEVELOPMENT IN JØRPELANDFollowing the sale of the industrial property in Jørpeland, Scana Property still owns a substantial property portfolio in Strand Municipality, consisting of approx. 7 hectares of land in Jørpeland close to the town centre with excellent
development potential. There is also around 200 hectares of unused land, as well as a cabin area with around 20 plots at Liarvatn, north-east of Jørpeland.
Strand Municipality adopted a new development plan for Jørpeland in 2016. This defines areas for industrial, commercial and residential properties, as well as setting conditions for further development of Scana Property’s land holdings. The company anticipates that the ferry-free road crossing between Ryfylke and Jæren (“Ryfast”) will result in Jørpeland becoming more attractive both as a business area and a residential area and that this may have a positive impact on the property market in Strand Municipality. Scana Property’s principal focus in 2017 will be developing the value potential that the property portfolio represents.
RESIDENTIAL DEVELOPMENT PROJECTFjordbris AS is the only company in the portfolio that focuses solely on residential property and it is owned 50.1 per cent by Scana Property AS and 49.9 per cent by Strand Eiendomsutvikling AS. The company’s property is in Jørpeland close to Scana Property’s other building stock. The property currently consists of approx. 0.4 hectares. Based on a plan to also develop gaps totalling an area of approximately 2.2 hectares, a major housing development project is being planned for up to 300 flats. Unfortunately the application for planning permission to fill in these gaps was refused in February 2017. As a consequence of this, Fjordbris AS is now considering other options for the property, including the alternative of a project with fewer flats than originally planned. Given the plot’s location along the coast at Jørpeland, it is still considered to be ideal for a project with a significant number of residential units.
SCANA PROPERTY AS
Omsetning: NOK 76 millionHeaded by: Raymond GabrielsenNumber of employees: 1
Head office: Stavanger, NorwayOther locations: Jørpeland (Norway) and Volda (Norway),
Chairman of the Board: Tom Ivar SætremyrBoard Member: Kjetil Flesjå
9

Scana Skarpenord AS was established in the late 1960s as a division of Norsk Hydro, Rjukan Fabrikker. In 1986, Skarpenord left Norsk Hydro and became an independent company. Three years later, the company was acquired by what is now Incus Investor. Scana Skarpenord is among the market’s leading suppliers of hydraulic and pneumatic valve control systems for the oil, gas and shipbuilding industries.
The company is located in Rjukan, and also has a service office in Shanghai, China. Incus Investor ASA owns 49 per cent of Scana Korea Hydraulic Ltd, which markets Scana Skarpenord’s products to the shipbuilding industry in South Korea. The company is also represented in Brazil and the USA.
OWN DESIGN Scana Skarpenord supplies valve control systems based on the company’s key products, which are hydraulic and pneumatic actuators mounted directly on valves. The actuators are of our own design and are manufactured at Rjukan. The control systems for the actuators include control panels, magnetic valve blocks, hydraulic oil generators and PC-based or PLS-based terminals for system operation and indication.
Tailored solutions and customisation are the company’s speciality, often with short delivery times. The company has also recently expanded its service into the after sales market for the oil and gas industry.
RENOVATIONOperators, valve suppliers and maintenance, modifications and operations companies (MMOs) with markets in the offshore industry represent an increasing proportion of Scana Skarpenord’s customer base. Renovation and upgrading of older offshore installations, vessels and rigs also represent an increasing share of the company’s activities.
The main market for new shipbuilding and floating offshore installations is currently in Korea, China and Singapore. The company also supplies equipment to customers in Europe, Russia and North America. Hydraulic actuators and their control systems are also supplied to valve producers and suppliers of gas handling systems for LPG and LNG vessels.
SCANA SKARPENORD AS
Revenue: NOK 108 millionHeaded by: Tony André Håvelsrud Number of employees: 67
Head office: Rjukan, NorwayOther locations: Korea, China (Shanghai) and Brazil
Chairman of the Board: Kjetil FlesjåBoard Members: Tom Ivar Sætremyr, Pål Lauluten (employee representative) and Stian Sætre (employee representative)
10From M/T Tordis Knutsen. Photo: Che. eng. Ø. S. Bakke.
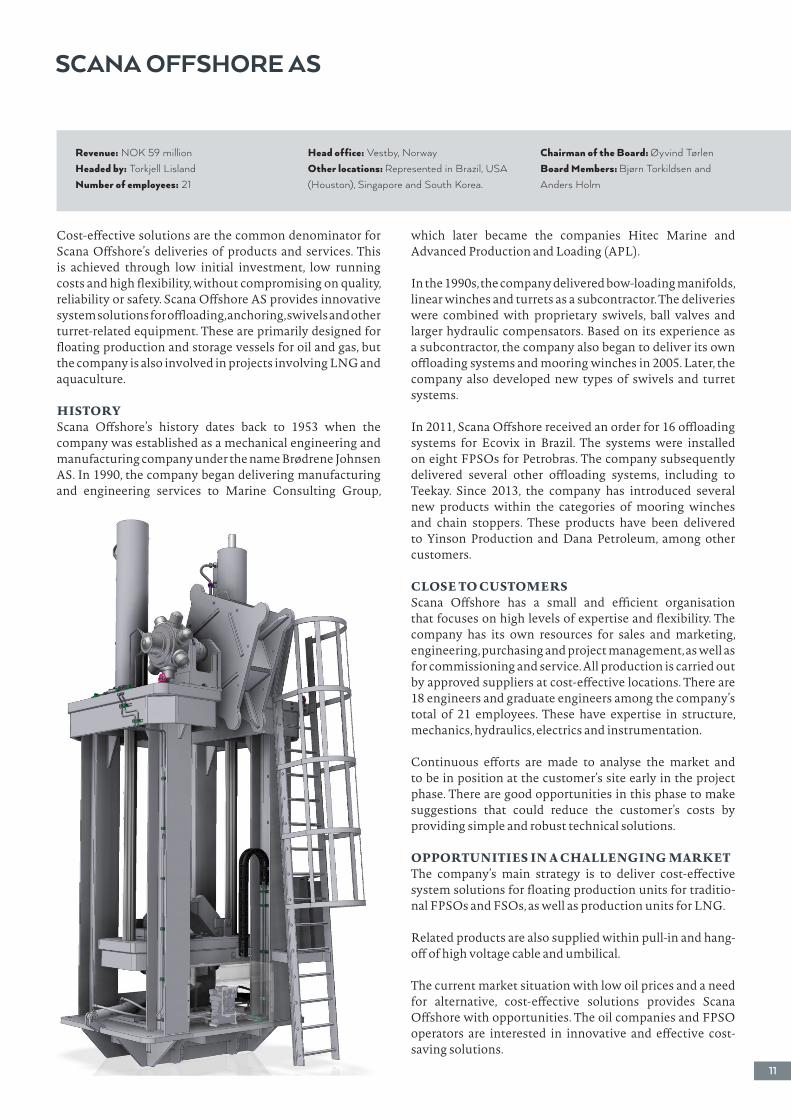
Cost-effective solutions are the common denominator for Scana Offshore’s deliveries of products and services. This is achieved through low initial investment, low running costs and high flexibility, without compromising on quality, reliability or safety. Scana Offshore AS provides innovative system solutions for offloading, anchoring, swivels and other turret-related equipment. These are primarily designed for floating production and storage vessels for oil and gas, but the company is also involved in projects involving LNG and aquaculture.
HISTORYScana Offshore’s history dates back to 1953 when the com pany was established as a mechanical engineering and manu facturing company under the name Brødrene Johnsen AS. In 1990, the company began delivering manufacturing and engineering services to Marine Consulting Group,
which later became the companies Hitec Marine and Advanced Production and Loading (APL).
In the 1990s, the company delivered bow-loading manifolds, linear winches and turrets as a subcontractor. The deliveries were combined with proprietary swivels, ball valves and larger hydraulic compensators. Based on its experience as a sub contractor, the company also began to deliver its own offl oading systems and mooring winches in 2005. Later, the com pany also developed new types of swivels and turret systems.
In 2011, Scana Offshore received an order for 16 offloading systems for Ecovix in Brazil. The systems were installed on eight FPSOs for Petrobras. The company subsequently deli vered several other offloading systems, including to Teekay. Since 2013, the company has introduced several new products within the categories of mooring winches and chain stoppers. These products have been delivered to Yinson Production and Dana Petroleum, among other customers.
CLOSE TO CUSTOMERSScana Offshore has a small and efficient organisation that focuses on high levels of expertise and flexibility. The company has its own resources for sales and marketing, engineering, purchasing and project management, as well as for commissioning and service. All production is carried out by approved suppliers at cost-effective locations. There are 18 engineers and graduate engineers among the company’s total of 21 employees. These have expertise in structure, mechanics, hydraulics, electrics and instrumentation.
Continuous efforts are made to analyse the market and to be in position at the customer’s site early in the project phase. There are good opportunities in this phase to make suggestions that could reduce the customer’s costs by providing simple and robust technical solutions.
OPPORTUNITIES IN A CHALLENGING MARKETThe company’s main strategy is to deliver cost-effective system solutions for floating production units for traditio-nal FPSOs and FSOs, as well as production units for LNG.
Related products are also supplied within pull-in and hang-off of high voltage cable and umbilical.
The current market situation with low oil prices and a need for alternative, cost-effective solutions provides Scana Offshore with opportunities. The oil companies and FPSO operators are interested in innovative and effective cost-saving solutions.
SCANA OFFSHORE AS
Revenue: NOK 59 millionHeaded by: Torkjell LislandNumber of employees: 21
Head office: Vestby, NorwayOther locations: Represented in Brazil, USA (Houston), Singapore and South Korea.
Chairman of the Board: Øyvind TørlenBoard Members: Bjørn Torkildsen and Anders Holm
11
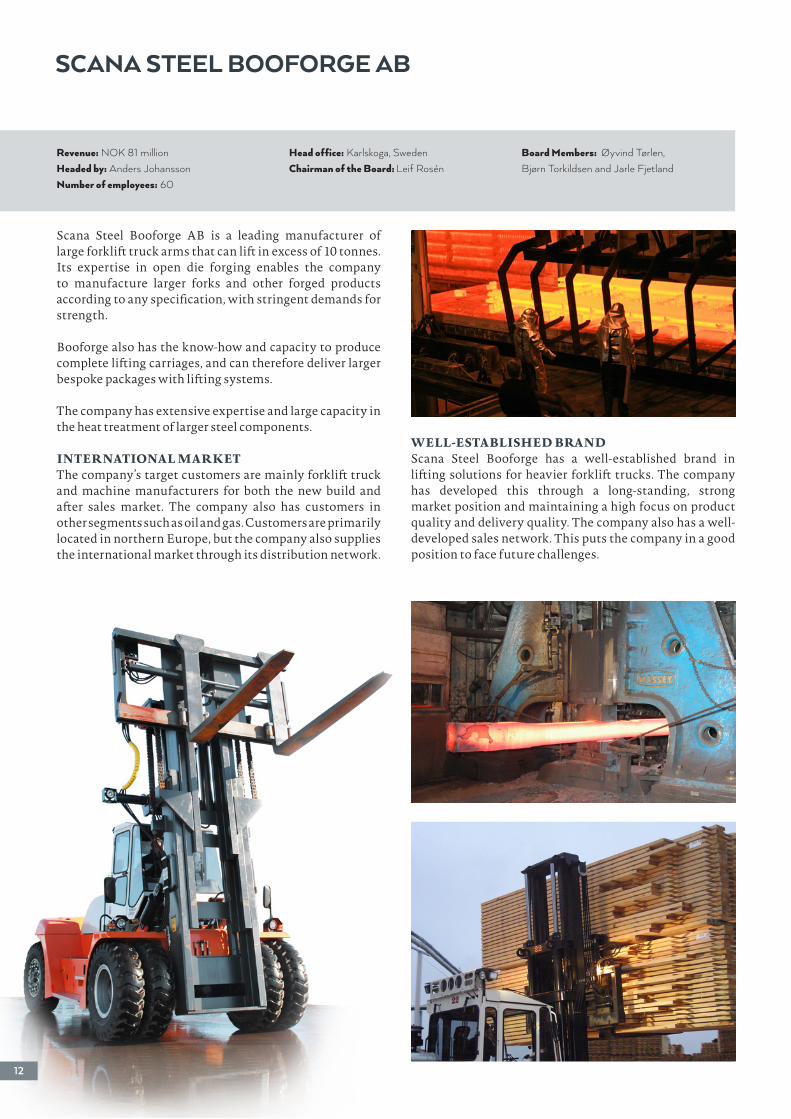
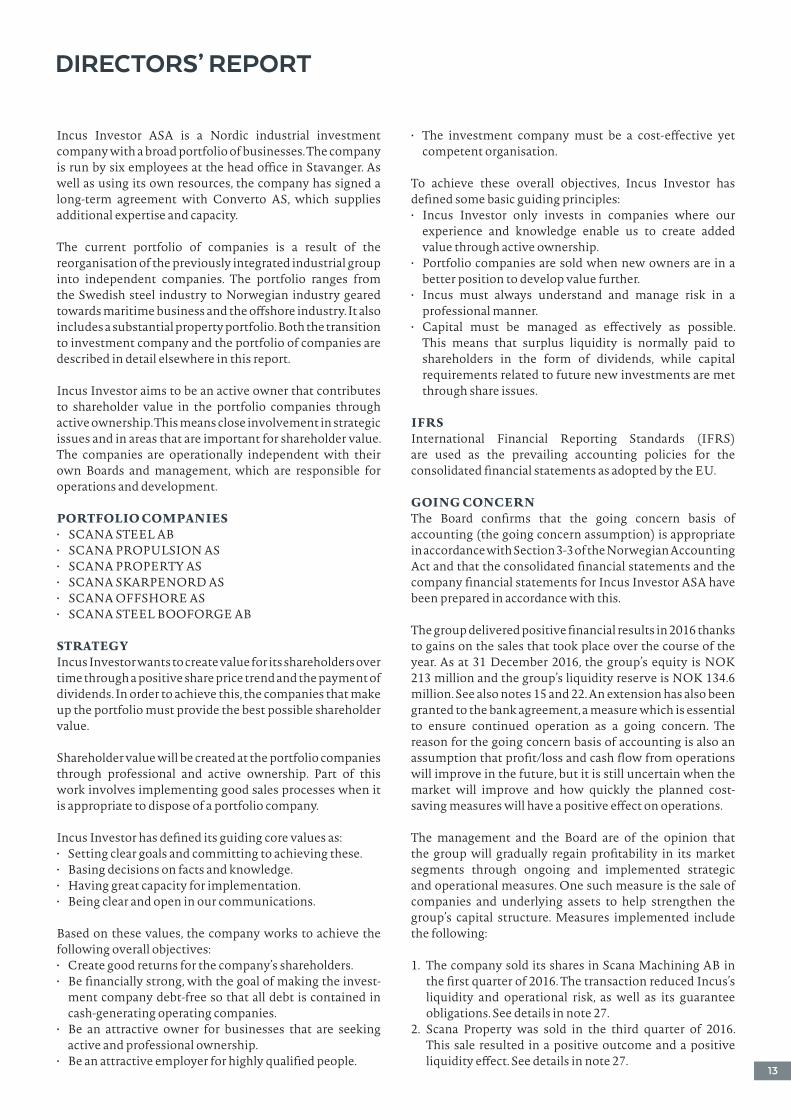
Scana Steel Booforge AB is a leading manufacturer of large forklift truck arms that can lift in excess of 10 tonnes. Its expertise in open die forging enables the company to manufacture larger forks and other forged products according to any specification, with stringent demands for strength.
Booforge also has the know-how and capacity to produce complete lifting carriages, and can therefore deliver larger bespoke packages with lifting systems.
The company has extensive expertise and large capacity in the heat treatment of larger steel components.
INTERNATIONAL MARKETThe company’s target customers are mainly forklift truck and machine manufacturers for both the new build and after sales market. The company also has customers in other segments such as oil and gas. Customers are primarily located in northern Europe, but the company also supplies the international market through its distribution network.
WELL-ESTABLISHED BRANDScana Steel Booforge has a well-established brand in lifting solutions for heavier forklift trucks. The company has developed this through a long-standing, strong market position and maintaining a high focus on product quality and delivery quality. The company also has a well-developed sales network. This puts the company in a good position to face future challenges.
SCANA STEEL BOOFORGE AB
Revenue: NOK 81 millionHeaded by: Anders JohanssonNumber of employees: 60
Head office: Karlskoga, SwedenChairman of the Board: Leif Rosén
Board Members: Øyvind Tørlen, Bjørn Torkildsen and Jarle Fjetland
12
DIRECTORS’ REPORT
• The investment company must be a cost-effective yet competent organisation.
To achieve these overall objectives, Incus Investor has defined some basic guiding principles:• Incus Investor only invests in companies where our
experience and knowledge enable us to create added value through active ownership.
• Portfolio companies are sold when new owners are in a better position to develop value further.
• Incus must always understand and manage risk in a professional manner.
• Capital must be managed as effectively as possible. This means that surplus liquidity is normally paid to shareholders in the form of dividends, while capital requirements related to future new investments are met through share issues.
IFRS International Financial Reporting Standards (IFRS) are used as the prevailing accounting policies for the consolidated financial statements as adopted by the EU.
GOING CONCERNThe Board confirms that the going concern basis of accounting (the going concern assumption) is appropriate in accordance with Section 3-3 of the Norwegian Accounting Act and that the consolidated financial statements and the company financial statements for Incus Investor ASA have been prepared in accordance with this.
The group delivered positive financial results in 2016 thanks to gains on the sales that took place over the course of the year. As at 31 December 2016, the group’s equity is NOK 213 million and the group’s liquidity reserve is NOK 134.6 million. See also notes 15 and 22. An extension has also been granted to the bank agreement, a measure which is essential to ensure continued operation as a going concern. The reason for the going concern basis of accounting is also an assumption that profit/loss and cash flow from operations will improve in the future, but it is still uncertain when the market will improve and how quickly the planned cost-saving measures will have a positive effect on operations.
The management and the Board are of the opinion that the group will gradually regain profitability in its market segments through ongoing and implemented strategic and operational measures. One such measure is the sale of companies and underlying assets to help strengthen the group’s capital structure. Measures implemented include the following:
1. The company sold its shares in Scana Machining AB in the first quarter of 2016. The transaction reduced Incus’s liquidity and operational risk, as well as its guarantee obligations. See details in note 27.
2. Scana Property was sold in the third quarter of 2016. This sale resulted in a positive outcome and a positive liquidity effect. See details in note 27.
Incus Investor ASA is a Nordic industrial investment company with a broad portfolio of businesses. The company is run by six employees at the head office in Stavanger. As well as using its own resources, the company has signed a long-term agreement with Converto AS, which supplies additional expertise and capacity.
The current portfolio of companies is a result of the reorganisation of the previously integrated industrial group into independent companies. The portfolio ranges from the Swedish steel industry to Norwegian industry geared towards maritime business and the offshore industry. It also includes a substantial property portfolio. Both the transition to investment company and the portfolio of companies are described in detail elsewhere in this report.
Incus Investor aims to be an active owner that contributes to shareholder value in the portfolio companies through active ownership. This means close involvement in strategic issues and in areas that are important for shareholder value. The companies are operationally independent with their own Boards and management, which are responsible for operations and development.
PORTFOLIO COMPANIES• SCANA STEEL AB• SCANA PROPULSION AS• SCANA PROPERTY AS• SCANA SKARPENORD AS• SCANA OFFSHORE AS• SCANA STEEL BOOFORGE AB
STRATEGYIncus Investor wants to create value for its shareholders over time through a positive share price trend and the payment of dividends. In order to achieve this, the companies that make up the portfolio must provide the best possible shareholder value.
Shareholder value will be created at the portfolio companies through professional and active ownership. Part of this work involves implementing good sales processes when it is appropriate to dispose of a portfolio company.
Incus Investor has defined its guiding core values as:• Setting clear goals and committing to achieving these.• Basing decisions on facts and knowledge.• Having great capacity for implementation.• Being clear and open in our communications.
Based on these values, the company works to achieve the following overall objectives:• Create good returns for the company’s shareholders.• Be financially strong, with the goal of making the invest-
ment company debt-free so that all debt is contained in cash-generating operating companies.
• Be an attractive owner for businesses that are seeking active and professional ownership.
• Be an attractive employer for highly qualified people.13
3. The company entered into an agreement to sell two properties in Scana Eiendom SSA AS. The purchase price is NOK 71 million. See details in note 27.
4. An agreement was signed in December 2016 to sell the shares in Scana Propulsion AS. The purchase price is NOK 84 million (Enterprise Value). See details in note 27.
5. The bank agreement has been extended by a year, so it now expires on 22 June 2019. This includes a payment holiday until the first quarter of 2018. See details in note 17.
6. Cost-saving measures that were initiated and imple-mented at Scana Steel produced an effect of approx. NOK 40 million during 2016. These cost savings have taken the form of downsizing and measures to cut production costs. The measures took full effect in the second half of 2016.
7. Further measures linked to sales and marketing have been introduced at all portfolio companies to increase sales in both existing and new markets.
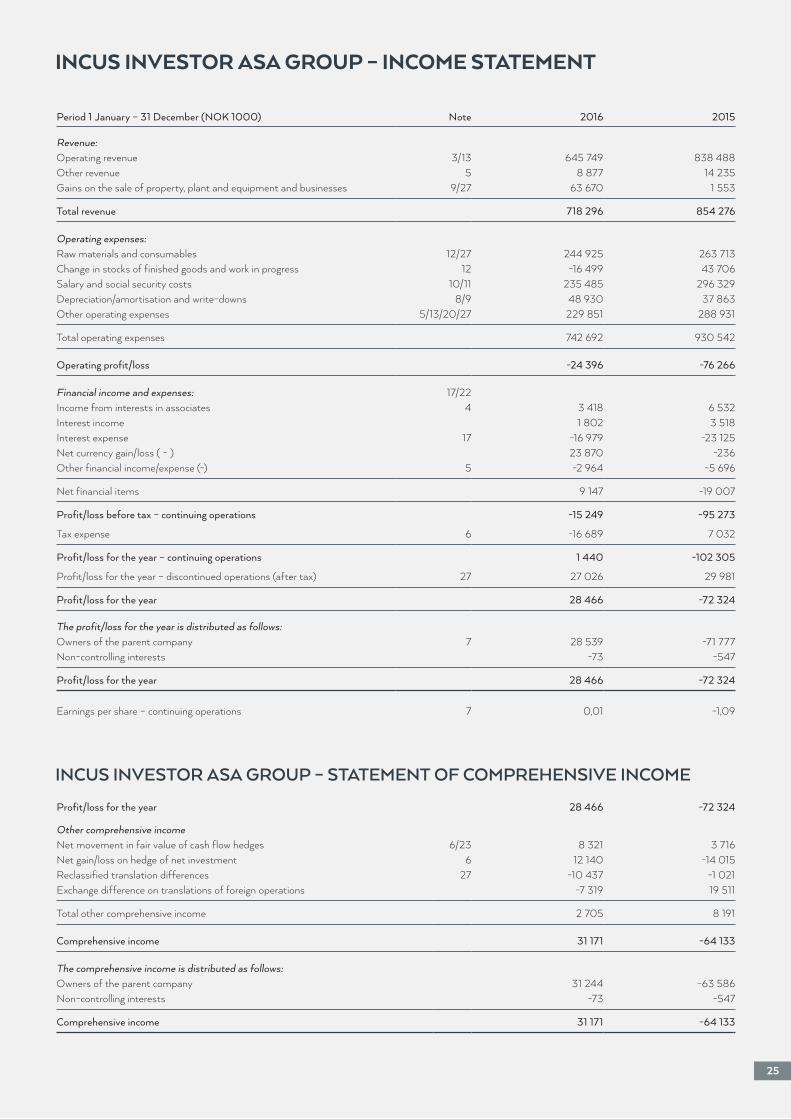
INCOME STATEMENT Consolidated revenue for 2016 amounts to NOK 718 million, which corresponds to a fall of NOK 136 million compared to 2015.
The group achieved earnings before depreciation and amortisation (EBITDA) of NOK 25 million, which represents an improvement of NOK 63 million compared to 2015, but is lower than expected. Adjusted for capital gains in 2016, EBITDA is NOK -39 million.
The income statement for 2016 includes write-downs totalling NOK 15 million. These are related to the following balance sheet items:• Write-downs of intangible assets in Scana Steel totalling
NOK 4 million, of which NOK 1.6 million relates to goodwill.
• Write-down of property, plant and equipment in Scana Steel by NOK 11 million.
The group’s interest expenses amounted to NOK 17 million in 2016.
The loss before tax from continuing operations was NOK -15 million.
The recognised tax expense for the year from continuing operations amounted to NOK 17 million. Profit after tax from discontinued operations was NOK 27 million and relates to the final settlement of the bankruptcy estate of Scana Steel Stavanger AS and profit from Scana Propulsion. See note 27 for further details.
The group’s total profit for the year was NOK 28.5 million, of which NOK -0.1 million is attributable to non-controlling interests. This amounts to earnings per share of NOK 0.27 compared to NOK -0.77 per share in 2015.
BALANCE SHEET The balance sheet total as at 31 December 2016 was NOK 690 million, which is a fall of NOK 213 million on the previous year. The group’s net interest-bearing debt at the end of 2016 was NOK 187 million, taking into account bank deposits and cash and cash equivalents. Gross interest-bearing debt was recognised at NOK 236 million, which is a reduction of NOK 159 million from the same date in 2015.
The group had the repayment date for the bank agreement put back to 22 June 2019 in 2016. The group has complied with the loan terms following refinancing and the debt was classified as non-current on the balance sheet date.
Recognised equity as at 31 December 2016 is NOK 213 million, which corresponds to an equity per share of NOK 1.99 and an equity ratio of 31 per cent. Equity per share was calculated on the basis of 107,511,831 shares, which is the number of shares in the company at year-end.
Intangible assets at the end of 2016 were recognised at NOK 1 million. Unrecognised deferred tax assets amount to NOK 75 million.
CASH FLOWNet cash flow from operating activities was NOK 29 million. The difference between the operating result and cash flow from operating activities was mainly due to depreciation, amortisation and write-downs, settlement relating to discontinued operations and changes in working capital.
During 2016, ordinary investments were made in the amount of NOK 16 million. Non-current assets (mainly property) were sold for NOK 71 million. Businesses were sold for NOK 27 million, as referred to in note 27. Net cash flow from investing activities was NOK 74 million. Net cash flow from financing activities was NOK -163 million.
The company paid off debt in the amount of NOK 82 million in 2016. The group has paid interest amounting to NOK 17 million and paid off current interest-bearing debt in the amount of NOK 64 million. The group’s cash and cash equivalents as at 31 December 2016 amount to NOK 51 million, of which NOK 2 million is classed as held for sale. See notes 15 and 22 for further details.
PORTFOLIO COMPANIES
SCANA STEEL AB2016 was characterised by a strong decline in the market in the first half of the year and some recovery in the second half. The decline was expected and essential consolidation of the business with downsizing throughout the organisation took place in the second half of the year. Scana Machining was sold to Motala Verkstad Group in 2016. The handover took place in March.
14
for the company’s remote control products. The cost reductions implemented have resulted in fewer employees in both operational and administrative functions. At the end of 2016, the number of employees at Scana Propulsion corresponded to 171 FTEs, compared to 179 FTEs at the end of 2015. As a result of the low order backlog, Propulsion continued to lay off employees temporarily at the start of 2016.
SCANA PROPERTY ASThe total revenue of the subsidiaries under Scana Property AS was NOK 76 million in 2016, compared to NOK 22 million in 2015. Total EBITDA in 2016 came to NOK 66 million, compared to NOK 9 million in 2015. Operating profit in 2016 amounted to NOK 63 million, compared to NOK 5 million in 2015.
The large increase in revenue and profit is due to considerable gains from the sale of the shares in Scana Property AB and the industrial property in Scana Eiendom SSA AS. Total capital gains amounted to NOK 59 million, of which NOK 49 million was included in the operating profit and NOK 11 million was recognised as financial income.
Following the sale of the shares in Scana Property AB and the steelworks property in Jørpeland in 2016, the rental income in Scana Property is much lower. The rental income after the sale is mainly associated with renting out the industrial property in Volda to Scana Volda AS, which is part of Scana Propulsion. Total rental income in 2017 from established contracts is expected to be NOK 6 million.
The new town centre plan for Jørpeland was approved in 2016. This also covers Scana Property’s properties in Jørpeland. Scana Property is considering various options for the development of the properties within the framework provided by the development plan. Strategic options may include developing the properties itself, entering into strategic or financial partnerships and selling off larger or smaller parts of the building stock.
KEY PERFORMANCE INDICATORS (Amounts in NOK million) 2016 2015
Operating revenue 76 22EBITDA 66 9EBIT 63 5
SCANA SKARPENORD ASThe company’s revenue in 2016 amounted to NOK 108 million, a fall of 11.5 per cent on 2015. The changes in revenue for the various segments were as follows: Marine O&G saw a fall of 5 per cent, Scana Korea Hydraulic a fall of 2 per cent, Spare parts and service a fall of 30 per cent and Offshore experienced a fall of 22 per cent.
Due to the very low activity within energy, oil and gas, the company has focused on expanding sales in other segments. Work is also underway to increase the customer base in brand new markets. The sale of tool steel to China has increased for the third year in a row. The steel offering has also expanded within certain applications and now appears more complete than before. In addition to this, the company is concentrating on further developing the market in the United States and Europe by establishing sales offices and distributors. After several tough years the marine segment began to show a positive trend towards the end of the year. In the year ahead, the company needs to position itself for further positive development, in terms of both capacity and equipment.
The gross margin fell from 21 per cent in 2015 to 15 per cent in 2016. EBITDA was NOK -6 million, compared to NOK -26 million the previous year.
KEY PERFORMANCE INDICATORS (Amounts in NOK million) 2016 2015
Operating revenue 409 539EBITDA (6) (26)EBIT (45) (50)Order inflow 327 506Orders in hand 144 249
SCANA PROPULSION ASThe sale of the portfolio company Scana Propulsion AS to Brunvoll AS was agreed in December 2016 and is scheduled to take effect in the first quarter of 2017. This company is therefore presented as discontinued operations in the income statement. See note 27.
The company has seen a reduction in activities associated with the delivery of new systems, while service-related activities have increased. The offshore market has been significantly weakened in recent years due to the sharp fall in oil prices and reduced investments in the sector. The overcapacity in available tonnage is expected to continue up to 2020 and new tonnage will therefore only be contracted in exceptional cases. A change in market focus and stronger marketing have led to a reversal in the negative trend in order inflow.
The company is actively working to improve its competi-tiveness within vessel segments other than offshore by strengthening its own sales organisation, reducing costs and streamlining project implementation. The company has had good order inflow within vessel segments associated with fishing and aquaculture, and is expecting further orders within these segments in addition to orders within inshore freight, smaller cruise ships and merchant vessels. The increasing level of activity on the ferry market and other passenger transport is also providing growing demand
15
EBITDA was 6 per cent lower compared to 2015, ending at NOK -2 million. Working capital fell by 26 per cent over the course of 2016 and amounted to NOK 15 million at year-end. This decline is mainly due to current assets being reduced by NOK 2.5 million and current liabilities increasing by NOK 3 million during the course of the year.
Deliveries to two companies that supply equipment packages to the gas freight market account for 20 per cent of revenue. This revenue amounted to 40 per cent in 2015 and consequently there was a dramatic fall in activity related to these deliveries in 2016. Scana Skarpenord has achieved a strong position in this segment and has a close and mutually beneficial relationship with both suppliers, but continued low activity is expected in this segment in 2017.
Revenue within spare parts and service to the existing customer base still accounts for more than 20 per cent of revenue as a whole and this revenue is relatively stable and predictable despite a decline in 2016. The channels into this market go either directly to shipping companies and ship operators or through agents and business partners. The company has increased its sales focus on these in an effort to further increase revenue in this market.
Sales to the South Korean shipyard market via the sister company in South Korea, Scana Korea Hydraulic (Scana owns 49 per cent of the company), account for 18 per cent of revenue. Revenue at Scana Korea amounted to NOK 137 million, with the company achieving a profit for the year of NOK 7 million. The financial statements were recognised in the consolidated financial statements using the equity method, with a profit share of NOK 3 million in 2016. Despite a general decline in the shipbuilding market in South Korea and the larger shipyards in this market facing financial challenges, Skarpenord has so far had stable revenue here and is slightly ahead of budget for 2016. However, this revenue is expected to decline in 2017. Skarpenord works closely with Scana Korea Hydraulic to secure new orders and cost-saving measures have been initiated to enhance the competitiveness of the companies in this market.
The Chinese market accounts for 16 per cent of revenue and the company has seen a sharp rise in tendering activity for this market in the past year. An increase in order inflow is therefore expected from this market in the future.
Revenue in the other markets in the marine segment is stable.
Revenue from the offshore segment represents only 5 per cent of total revenue, so offshore deliveries are not currently a critical part of activities in Rjukan. However, there has been a sharp reduction in order inflow from this segment in the past few years. Measures were initiated in 2015 and 2016 to increase sales to this market and this has resulted in an increase in the number of requests and tenders submitted in this segment. It is expected that order inflow from this segment will increase gradually in 2017.
KEY PERFORMANCE INDICATORS (Amounts in NOK million) 2016 2015
Operating revenue 108 122EBITDA (2) 4EBIT (4) 2Order inflow 90 96Orders in hand 11 28
SCANA OFFSHORE ASScana Offshore’s revenue ended at NOK 59 million in 2016, a fall of 45 per cent compared to 2015. The fall in revenue is linked to delivery of a number of the company’s major projects nearing completion. There have not been many new, large-scale projects through the year as a result of the challenging market situation caused by the low oil price. Throughout 2016 the company worked to position itself for more larger deliveries within offloading and anchoring systems.
The company’s EBITDA fell from NOK 13 million in 2015 to NOK -2 million in 2016. This negative trend is related to the fall in revenue.
The current market situation with low oil prices and the industry’s need for alternative, cost-effective solutions provides Scana Offshore with more opportunities than in a period of high oil prices, something that the company expects to profit from when the industry’s focus returns to scheduling projects. The oil companies and FPSO operators are extremely interested in good, cost-saving solutions. There are already signs at the start of 2017 of a greater willingness to initiate new projects than in recent years. The company’s order inflow in 2016 was NOK 36 million, compared to NOK 104 million in 2015. The company’s orders in hand at the end of 2016 amounted to NOK 43 million, compared to NOK 66 million at the end of 2015.
The company is actively working to improve its com-petitiveness by analysing the market and getting into position early in the contracting phase. This work gives the company an opportunity to propose simple and robust technical solutions that are cost-saving for customers. Scana Offshore has a small and efficient organisation, which helps keep the company’s ongoing operating expenses low.
At the end of 2016 there were 21 FTEs employed at Scana Offshore, compared to 25 FTEs at the end of 2015. The company has not replaced staff who have left, but has allocated their tasks within the framework of existing personnel.
Despite signs of improvement, the company assumes that the market will remain challenging in 2017. At the same time, this provides the company with excellent opportunities to win new contracts as our customers seek cost-effective and robust technical solutions.
16
electricity price trend. Incus Investor ASA has opted for market-based and contractual hedging against fluctuations in some of the risk areas.
The company is also exposed to financial risk:
Currency riskThe group is exposed to exchange rate fluctuations since large parts of production, purchasing and sales take place abroad and/or in foreign currency. The group’s internal banking function continuously monitors and reports the group’s currency positions. The currency risk is estimated for each foreign currency and takes account of assets, liabilities and probable purchases and sales in the relevant currency. The company tries to reduce the net currency risk by means of forward contracts, deposits and/or borrowings in the relevant currencies. The main risks associated with currency in the group are related to external financing, future sales payments and the group’s assets in foreign subsidiaries.
Liquidity riskSecuring good financial room to manoeuvre is an important aim of the group. The group is always working to reduce the financial risk, including through close monitoring of liquidity development and programmes to reduce working capital.
The group has controlled the liquidity situation in the short and long term by monitoring and maintaining active dialogue with the portfolio companies. The group has bank deposits of NOK 49 million as at 31 December 2016. The liquidity reserve is NOK 135 million as at 31 December 2016. See also note 15 regarding bank deposits and liquidity reserve. At the end of 2016 the group had unutilised credit facilities in the amount of NOK 83 million.
The financing agreement with the bank syndicate, including overdraft and guarantee facilities, expires on 22 June 2019.
Credit riskIncus Investor ASA’s portfolio companies have guidelines for ensuring that orders are not entered into with customers who have had major payment problems and for ensuring that outstanding amounts do not exceed defined credit limits.
The group regards its greatest risk exposure to be the carrying amount of trade receivables (see note 13) and other receivables (see note 14). The operating companies in Sweden have credit insurance with Euler Hermes Norge for some of the trade receivables in order to cover the exposure to credit risk. Otherwise, the majority of the deliveries to the portfolio companies Scana Steel, Scana Skarpenord and Scana Offshore are to financially sound international customers. The shipyards in China and South Korea are to a great extent owned by the state. Within the portfolio companies Scana Skarpenord and Scana Offshore, service
KEY PERFORMANCE INDICATORS (Amounts in NOK million) 2016 2015
Operating revenue 59 108EBITDA (2) 13EBIT (3) 10Order inflow 36 104Orders in hand 43 66
SCANA STEEL BOOFORGE ABRevenue at Scana Steel Booforge AB fell by 17 per cent in 2016 compared to the previous year and ended at NOK 81 million. The downturn in the oil and gas industry has had a negative impact on the order inflow for open die forging and heat-treated products. The fork arms and carriages product group also suffered a decline due to very challenging price competition.
The EBITDA margin fell from 0.2 per cent in 2015 to -3.3 per cent in 2016. Overall EBITDA was NOK -3 million. Profitability was weaker due to the aforementioned market climate in 2016.
In the period ahead, Scana Steel Booforge will increase its market activity within all product areas, with a particular focus on gaining new customers and developing existing customer relationships.
All the markets in which the company has products are facing significant challenges. As a consequence, the company is on the lookout for opportunities in the after sales market in particular, and not just within the Nordic region.
KEY PERFORMANCE INDICATORS (Amounts in NOK million) 2016 2015
Operating revenue 81 98EBITDA (3) 0EBIT (7) (4)Order inflow 75 80Orders in hand 10 9
RISK MANAGEMENTThe group’s most significant risk is linked to the real financial situation and developments in the global market. The companies have implemented a number of measures in order to address the change in activity seen in recent years. These include stepping up the marketing and sales effort, reductions in workforce and costs, restructuring operations and selling or shutting down some companies.
In addition to the risk associated with their own projects, several of the portfolio companies are exposed to risk associated with the uncertain price trend for raw materials such as scrap steel and alloys, as well as an uncertain
17
and after sales services are provided to major global players, with the credit risk considered limited here. Increased activity is expected in the long term within new projects and expansions. Historic losses are limited.
The counterparty in electricity derivatives is Vattenfall Power Management AB. The credit risk associated with derivatives is considered to be low.
CORPORATE SOCIAL RESPONSIBILITYThe investment company Incus Investor ASA is responsible for the general guidelines that apply to its portfolio com-panies. Each individual company is responsible for adding supporting guidelines adapted to the activities and the industry in which it operates.
Incus’s portfolio companies must operate in an econo-mically, socially and environmentally responsible manner. Corporate social responsibility must play a key role in the companies’ planning and execution of services. The companies must comply with international conventions and protocols relating to business, ethical guidelines and safety procedures.
Incus Investor’s corporate social responsibility guidelines have five main priority target areas:• Human rights• Corruption• Discrimination• Health and safety• Environmental impact
Human rightsIncus Investor and its portfolio companies must actively ensure that the activities they carry out do not violate fundamental human rights. Human values such as integrity, honesty, justice and respect are fundamental to exercising corporate social responsibility.
Incus Investor and its portfolio companies have not experienced any events in 2016 that are indicative of a breach of these values and in 2017 will work further to promote the safeguarding of good human values and prevailing rights.
CorruptionIncus Investor and its portfolio companies must at all times comply with the laws, guidelines and regulations that apply in each country and region in which the companies and their subsidiaries are located. The companies must also pay taxes and duties, as well as implementing measures to prevent corruption and mismanagement. Incus Investor has a zero tolerance policy with regard to corruption and encourages its employees to report any suspected breaches.
DiscriminationIncus Investor and its portfolio companies actively work to promote the objectives of the Norwegian Gender Equality
Act. This work focuses on processes relating to recruitment, promotions, development opportunities and protection against harassment, as well as salary and working conditions. It is also the companies’ objective to be a workplace free of disability-based discrimination.
Health and safetyIt is Incus Investor’s express aim to ensure safe working conditions and to provide a good work environment where employees flourish and develop their skills. Several of the investment company’s portfolio companies in Norway offer apprenticeships to help young people enter the world of work and to support the development of specialist skills in society. Incus Investor supports the right of our employees to join trade unions and trade organisations.
EmployeesIncus Investor had six employees at the end of 2016, including one woman. The company works to promote equal development opportunities and for there to be no discrimination of any kind. This work is described in the company’s ethical guidelines and the directive also applies to all Incus Investor’s portfolio companies.
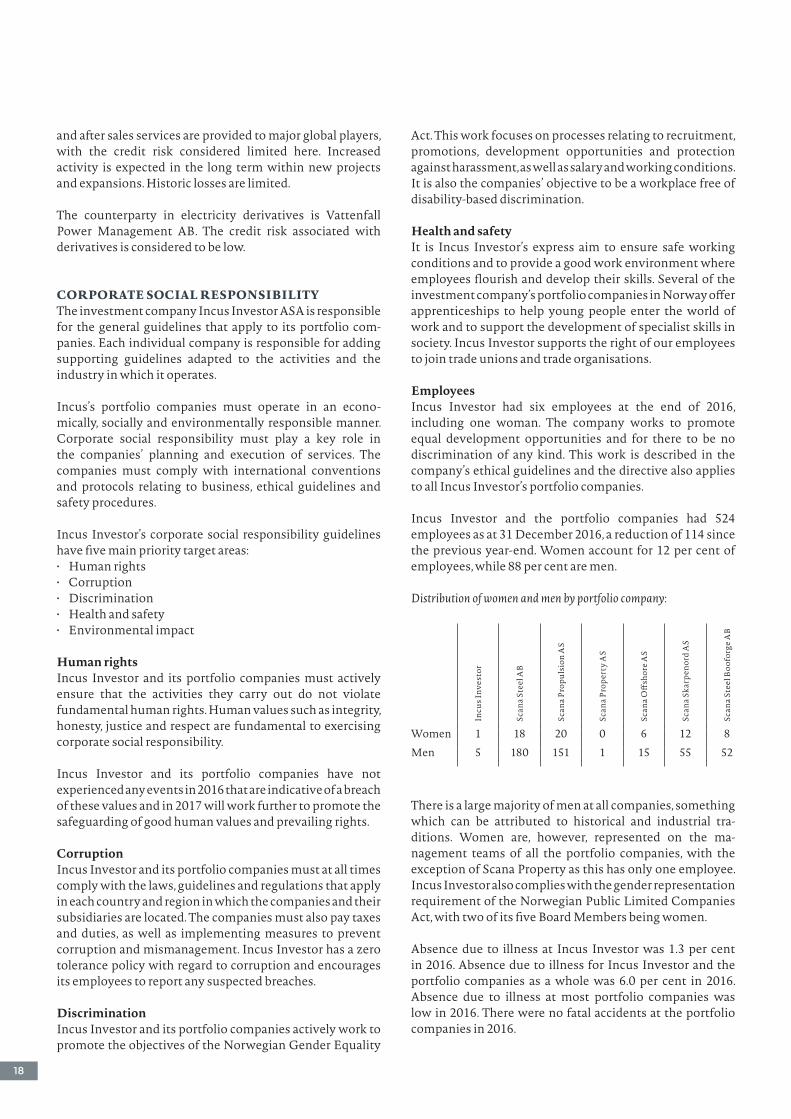
Incus Investor and the portfolio companies had 524 employees as at 31 December 2016, a reduction of 114 since the previous year-end. Women account for 12 per cent of employees, while 88 per cent are men.
Distribution of women and men by portfolio company:
Incu
s Inv
esto
r
Scan
a Ste
el A
B
Scan
a Pro
puls
ion
AS
Scan
a Pro
pert
y A
S
Scan
a Off
shor
e AS
Scan
a Ska
rpen
ord
AS
Scan
a Ste
el B
oofo
rge A
BWomen 1 18 20 0 6 12 8Men 5 180 151 1 15 55 52
There is a large majority of men at all companies, something which can be attributed to historical and industrial tra-ditions. Women are, however, represented on the ma-nage ment teams of all the portfolio companies, with the exception of Scana Property as this has only one employee. Incus Investor also complies with the gender representation requirement of the Norwegian Public Limited Companies Act, with two of its five Board Members being women.
Absence due to illness at Incus Investor was 1.3 per cent in 2016. Absence due to illness for Incus Investor and the portfolio companies as a whole was 6.0 per cent in 2016. Absence due to illness at most portfolio companies was low in 2016. There were no fatal accidents at the portfolio companies in 2016.
18
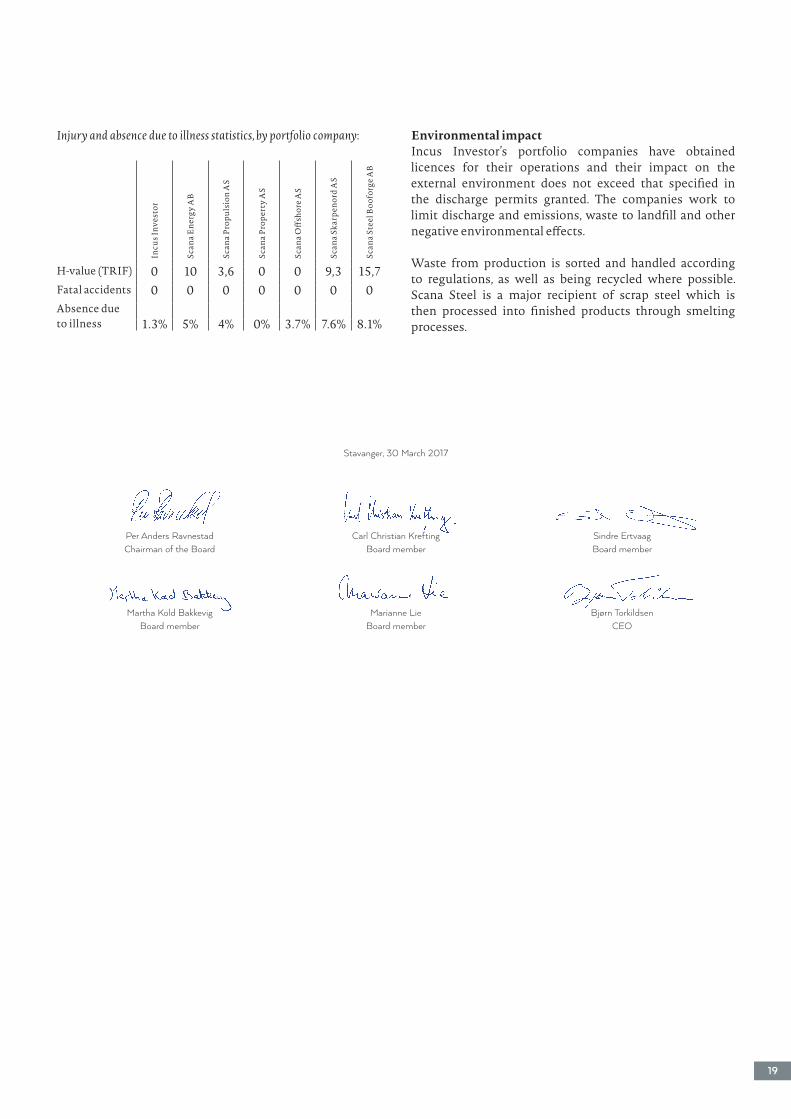
Environmental impactIncus Investor’s portfolio companies have obtained licences for their operations and their impact on the external environment does not exceed that specified in the discharge permits granted. The companies work to limit discharge and emissions, waste to landfill and other negative environmental effects.
Waste from production is sorted and handled according to regulations, as well as being recycled where possible. Scana Steel is a major recipient of scrap steel which is then processed into finished products through smelting processes.
Injury and absence due to illness statistics, by portfolio company:In
cus I
nves
tor
Scan
a Ene
rgy
AB
Scan
a Pro
puls
ion
AS
Scan
a Pro
pert
y A
S
Scan
a Off
shor
e AS
Scan
a Ska
rpen
ord
AS
Scan
a Ste
el B
oofo
rge A
B
H-value (TRIF) 0 10 3,6 0 0 9,3 15,7Fatal accidents 0 0 0 0 0 0 0Absence dueto illness 1.3% 5% 4% 0% 3.7% 7.6% 8.1%
19
Stavanger, 30 March 2017
Per Anders RavnestadChairman of the Board
Carl Christian KreftingBoard member
Sindre ErtvaagBoard member
Martha Kold BakkevigBoard member
Marianne LieBoard member
Bjørn TorkildsenCEO
20
Act and Norwegian Accounting Standard 16 as at 31 December 2016.
To the best of our knowledge:– the 2016 annual financial statements for the group and
parent company have been drawn up in compliance with the applicable accounting standards
– the information disclosed in the financial statements provides a true and fair view of the group’s and the parent company’s assets, liabilities and financial position and performance as a whole as at 31 December 2016
– the directors’ report for the group and parent company provides a true and fair view of the performance, profit and position of the group and parent company, as well as the most important risk and uncertainty factors that the group faces.
The Board of Directors and the CEO have today discussed and approved the directors’ report and annual financial statements for Incus Investor ASA, the group and the parent company for 2016.
The consolidated financial statements have been prepared in compliance with EU-approved IFRS and the associated interpretations, as well as with the additional Norwegian disclosure requirements pursuant to the Norwegian Accounting Act. The annual financial statements for the parent company have been prepared in compliance with the Norwegian Accounting Act and Norwegian good accounting practice as at 31 December 2016.
The directors’ report for the group and parent company is in line with the requirements of the Norwegian Accounting
DECLARATION BY THE BOARD OF DIRECTORS AND THE CEO
Stavanger, 30 March 2017
Per Anders RavnestadChairman of the Board
Carl Christian KreftingBoard member
Sindre ErtvaagBoard member
Martha Kold BakkevigBoard member
Marianne LieBoard member
Bjørn TorkildsenCEO
21
for added value through new investments. Based on this, the Board believes it is appropriate that the long-term dividend constitutes one-third of the profit for the year. The remainder will ensure further growth and a satisfactory level of equity.
The General Meeting determines the annual dividend, following a proposal by the Board.
Authorisation to issue new sharesAuthorisation for the Board to acquire own sharesTo ensure flexibility in connection with any acquisitions, the Board is authorised to acquire own shares.
Authorisation for the Board to issue new sharesAuthorisation for the Board to acquire own sharesTo ensure flexibility in connection with any acquisitions, the Board is authorised to acquire own shares.
Authorisation for the Board to issue new sharesTo ensure flexibility in connection with a) any acquisitions, b) strengthening the company’s capital structure, c) targeted share issues to the company’s senior employees and d) implementation of a share splice, the Board is authorised to carry out one or more targeted capital increases for the following purposes:• A capital increase in connection with the completion of
any acquisitions• A capital increase in connection with the strengthening
of the company’s capital structure• A capital increase in connection with targeted share
issues to the company’s senior employees• A capital increase to enable the implementation of a share
splice.
Share option scheme for employeesFrameworks for option schemes and schemes for allocating shares to employees will be dealt with and approved by the General Meeting. As at 31 December 2016, there is no share option scheme for employees.
Deviations from the Norwegian Code of Practice for Corporate Governance: None.
EQUAL TREATMENT OF SHAREHOLDERS AND RELATED-PARTY TRANSACTIONSIncus Investor ASA has one class of shares, with each share carrying one vote at the General Meeting. Each share has a nominal value of NOK 1.00. The company’s transactions in its own shares must normally take place on the stock exchange or at market price. Particular care must be taken with regard to transactions with others where Incus Investor’s shareholders, Board Members, management or related parties have a financial or personal interest. If the transaction is not of an insignificant nature or size, an assessment must be made by an independent third party.
With regard to shares held by Board Members and senior employees, please see notes 10 and 24 to the consolidated financial statements. Guidelines have been prepared to
CORPORATE GOVERNANCE REPORTThe principles for corporate governance are specified by the Board of Incus Investor ASA. The principles are based on the Norwegian Code of Practice for Corporate Governance published by the Norwegian Corporate Governance Board (NUES) and are designed to ensure that the com-panies’ business management is in line with general and recognised interpretations and standards, and that the companies operate in compliance with relevant legislation and regulations. Information on the code of practice can be found at www.nues.no.
Incus Investor is listed on the Oslo Stock Exchange and is subject to Norwegian securities legislation and stock exchange regulations. Information about current regulations for listed companies can be found at www.oslobors.no.
ABOUT THE BUSINESSThe Articles of Association of Incus Investor contain the following aims: to own and operate industrial and commercial enterprises and activity associated therewith, and to own and operate real property. The company’s aims encompass further investment in other companies in order to promote the company’s interests.
Incus Investor is a Nordic industrial investment company with a broad portfolio of businesses. The company aims to generate value through professional and active ownership of existing and future portfolio companies.
This means close involvement in strategic issues and in other areas that are important for shareholder value. The companies are operationally independent with their own Boards and management teams, which are responsible for operations and development.
Deviations from the Norwegian Code of Practice for Cor-porate Governance: None.
COMPANY CAPITAL AND DIVIDENDEquityThe Board and management regularly check that the group’s equity is appropriate to the goals, strategies and risk profiles of the companies. The group’s recognised equity as at 31 December 2016 was NOK 213 million. Further information about financial risk is provided in note 22 to the consolidated financial statements.
DividendIncus Investor’s shareholder policy is to give its share-holders a competitive return in the form of dividends and an increase in market value. Incus will pursue a conservative share issue policy in which the interests of existing shareholders are given precedence.
Satisfactory long-term growth and financial performance should provide shareholders with a good total value trend over time. The company’s dividend policy must consider the need to maintain adequate levels of capital and allow
CORPORATE GOVERNANCE
Stavanger, 30 March 2017
ELECTION COMMITTEEThe company must have an election committee consisting of at least three members, who are to be elected by the General Meeting. The election committee will prepare the General Meeting’s election of Board Members, propose candidates for the Board and recommend the level of remuneration for Board Members to the General Meeting. Shareholders are also given the opportunity to propose candidates to the election committee for board positions and other offices, e.g. by contacting the chairman of the election committee, the Chairman of the Board or the company’s administration team. The General Meeting may adopt instructions for the work of the election committee.
The members are:Henning StephansenBjørn DahleHans Eide
Deviations from the Norwegian Code of Practice for Cor-porate Governance: None.
COMPOSITION AND INDEPENDENCE OF THE BOARDCompositionThe Board must consist, in accordance with Article 6 of the Articles of Association, of three to seven members who are elected by the General Meeting for two years at a time. The age limit for Board Members is 68; Board Members must step down at the first Annual General Meeting after reaching the age limit. As adopted at the Annual General Meeting in 2010, the company’s entire Board must per-form the duties and functions of the audit committee in accordance with the requirements of the Norwegian Public Limited Companies Act at any given time. The Board does not have any employee representatives and no members of the company management sit on the Board. Incus Investor ASA does not have a corporate assembly.
The composition of the Board should reflect the necessary skills that are relevant to the company’s operations. Current Board regulations include a requirement for industry knowledge and relationships, an understanding of technology, international experience, market knowledge and experience in economics, finance and capital markets.
The Board currently consists of five people. Of these, Per Ravnestad (Chairman of the Board), Sindre Ertvaag and Carl Christian Krefting are significant shareholders or represent companies that are significant shareholders in Incus Investor ASA. A more detailed presentation of the Board Members is provided on page 78 of the annual report.
IndependenceThe composition of the Board must ensure that the interests of all shareholders and the company’s need for expertise, capacity and diversity are reflected. The Board regulations require at least two of the Board Members elected by the shareholders to be independent of the company’s main shareholders.
ensure that the Board Members and senior employees obtain prior approval and report any trading of Incus’s shares.
Incus Investor has its own insider regulations that must be signed by all those on the insider list.
Deviations from the Norwegian Code of Practice for Cor-porate Governance: None.
FREE TRADABILITYThe shares in Incus Investor ASA are listed on the Oslo Stock Exchange and are freely tradable. The Articles of Association do not impose any kind of trading restrictions.
Deviations from the Norwegian Code of Practice for Cor-porate Governance: None.
GENERAL MEETINGThe General Meeting is the supreme governing body of the company and an important forum for cooperation between the company’s shareholders, Board and management. Incus Investor has established routines and procedures in connection with convening and holding the General Meeting that comply with guidelines set out in the Norwegian Code of Practice for Corporate Governance. The notice of meeting and the minutes are available on the company’s website, www.incusinvestor.com, under “Investor Information”.
Notice of the General Meeting is given at least 21 days in advance, in accordance with the regulations and code of practice. Notice of the agenda and the election committee’s opinion must be available from the same date. The agenda must be prepared with sufficient detail for shareholders to be able to familiarise themselves with, and decide on, the issues to be discussed. The company’s financial calendar is published at the Oslo Stock Exchange and on the company’s website.
Registration for the General Meeting can take place by post, fax or e-mail. The Board encourages as many of the company’s shareholders as possible to attend the General Meeting, or to allow themselves to be represented by proxy. Information about the procedure for voting by proxy, proxy forms and information about persons appointed to vote as a proxy on behalf of the shareholders follows with the notice.
Incus’s General Meetings must be attended by at least the Chairman of the Board, the chair of the election committee and the auditor. The management must be represented by at least the CEO and the CFO. The General Meeting is chaired by the Chairman of the Board. Elections to the Board or other bodies of the company are structured to allow voting for individual candidates. The results of the elections at the General Meeting are published immediately after the General Meeting has been held.
Deviations from the Norwegian Code of Practice for Cor-porate Governance: None.
22
Minutes should be kept of each Board meeting and contain, among other things, a description of each item of business that has been discussed, what decision the Board has made and the basis of the decisions made in each case.
Audit committeeThe entire Board serves as the audit committee because this ensures the broadest possible expertise within the committee. This composition differs from that stipulated by the Norwegian Corporate Governance Board and was adopted at the company’s General Meeting in 2010.
Deviations from the Norwegian Code of Practice for Cor-porate Governance: See the section on audit committee.
RISK MANAGEMENT AND INTERNAL CONTROLThe Board ensures that the company has sound internal control and appropriate risk management systems in relation to the nature and scope of the business, as well as undertaking an annual review of the internal control system and the most significant risk areas. The objective is to maintain a comprehensive risk management process for the investment company Incus Investor ASA that also takes into account risk areas at the individual portfolio companies. Risk management is therefore followed up by both the CEO and the Board of Incus Investor ASA as well as the Boards and management teams of the portfolio companies. The Board conducts an annual review of the group’s main risk areas and internal control systems.
The reporting and monitoring procedures are adapted in line with the organisation’s development. In connection with the conversion from industrial group to industrial investment company, the procedures have been modified to reflect the formal and real adjustment in the areas of responsibility within the group. This means that the Board and management of each portfolio company have independent responsibility for internal control and risk management at their respective companies. Operational risk management is therefore delegated to the portfolio companies. The annual examination by the Board of Incus Investor ASA includes a review of the overall risk situation and risk management system of each portfolio company, as well as the aggregated operational risk in the portfolio.
The Board and the management of Incus Investor ASA focus mainly on risk management and control relating to its role as the owner of the portfolio companies and the factors that may affect the value of the investments or otherwise provide exposure to the company’s balance sheet, liquidity and reputation. These include liquidity development and liquidity requirements, guarantee exposure, risks in major customer contracts at the portfolio companies, interest and currency risk, the quality of the portfolio companies’ reporting and processes related to the acquisition and sale of companies, as well as reputation risk.
A joint financing solution has been established for Incus Investor ASA and its portfolio companies. This means that the primary responsibility for financial risk management
The Board carries out a self-assessment of its operations and expertise, as well as examining whether the composition of the Board is appropriate and how it works as a unit and individually in relation to the Board goals. The report is made available to the election committee.
A further requirement is that at least half of the Board must be independent of the company’s management and material business connections. Of the five members of the Board, Martha Kold Bakkevig and Marianne Lie are independent of the company’s significant shareholders. The entire Board is considered to be independent of the company’s management and business connections. An overview of shares owned by the Board Members and senior employees is presented in note 24.
Deviations from the Norwegian Code of Practice for Cor-porate Governance: None.
WORK OF THE BOARD OF DIRECTORSBoard meetingsThe Board should normally hold six to eight ordinary Board meetings per year according to a separate schedule that is drawn up each year. The Chairman of the Board may convene extraordinary Board meetings as deemed necessary. The CEO may convene an extraordinary Board meeting with the agreement of the Chairman of the Board. The Chairman may decide whether individual Board matters can be discussed via a conference call or by other means. There were 13 Board meetings in 2016.
The CEO should attend Board meetings, but according to the regulations cannot be a member of the Board. The CFO also usually attends the meetings. The Board is otherwise free to summon other members of the company’s management to the Board meetings.
The Chairman of the Board is responsible for leading the Board meetings. In their absence, the meeting is chaired by the Deputy Chairman of the Board. If both are absent, a Board member is elected to chair the meeting.
Duties of the BoardThe company’s Board has overall responsibility for the ma n-agement and control of the company. The Board must adopt the company’s strategy, budgets and business plans and at all times keep itself informed about the company’s opera-tions and financial performance. The Board is responsible for the adequate monitoring of the company’s operations, financial statements and liquidity. The Board must monitor the company’s management and ensure that the CEO performs the duties of the CEO in accordance with current instructions. At its discretion, the Board may issue additional guidelines for the company’s operations.
The CEO is responsible for the preparation and documen-tation of issues to be discussed by the Board. It is important that these preparations are of good quality and are sent to the Board Members at least one week before the Board meeting so that the Board has an adequate basis for discussions and decisions. 23
information purposes. See note 10 for further information regarding remuneration for senior employees.
Deviations from the Norwegian Code of Practice for Corporate Governance: None.
INFORMATION AND COMMUNICATIONIncus Investor must provide the stock market with relevant and complete information to enable the balanced and accurate pricing of the share. The company places great emphasis on having an open dialogue with the stock market and the media.
This is achieved through stock exchange announcements, press releases, quarterly presentations and presentations for analysts and investors. The company’s website (www.incusinvestor.com) contains information for investors. This includes annual reports, quarterly reports and company presentations.
Deviations from the Norwegian Code of Practice for Cor-porate Governance: None.
COMPANY TAKEOVERIncus has no defence mechanisms to protect against company takeover in the company’s articles of association. Nor are there any obstacles designed to limit acquisitions of the company’s shares.
No general principles have been established for the way in which Incus will act in the event of any takeover bids, apart from the fact that the Norwegian Code of Practice for Corporate Governance will have a normative function.
Deviations from the Norwegian Code of Practice for Cor-porate Governance: None.
AUDITORThe General Meeting appoints an independent external auditor and sets their fee. Incus Investor’s policy is to use the same auditors in all portfolio companies where practically possible, and where Incus alone can decide this.
The external auditor must confirm to the General Meeting that the group’s annual financial statements have been submitted in accordance with current legislation and regulations. The auditor also attends Board meetings that deal with the financial statements. Meetings may be arranged between the Board and auditor without the presence of the CEO or other representatives of the group management. In line with requirements for the independence of the auditor, Incus Investor will only use the appointed external auditor for work other than the statutory financial audit to a limited extent.
Incus Investor does not have its own internal auditing department, but uses resources from an external audit firm if the need for such audits arises.
Deviations from the Norwegian Code of Practice for Corporate Governance: None.
lies with the investment company. A system has also been established, whereby each portfolio company is allocated a certain percentage of the total available liquidity in line with its anticipated capital requirement. Incus Investor ASA also retains a portion of the liquidity, which is used for the investment company’s own purposes and also as available liquidity, which can be supplied to the portfolio companies under certain circumstances. Liquidity development and forecasts are reported regularly by the portfolio companies to the investment company and reviewed by the Board at each Board meeting.
The portfolio companies are exposed to currency risk, both together and individually. With portfolio companies in Norway and Sweden that have subsidiaries in several countries, the various companies have different currency positions and some of these are able to offset or support one another. A joint system has therefore been established to hedge currency risk at group level. Responsibility for interest rate hedging also lies with the investment company as part of the joint financing solution. See the annual financial statements for further details.
The portfolio companies have their own finance and control departments, with the exception of Scana Property, which purchases these services from Incus Investor ASA. The finance and control department of Incus Investor ASA is responsible for the consolidation of the group’s financial statements and reports and for reporting to the Board, banks, shareholders and the capital market. The department also provides specialist assistance to the portfolio companies and performs the control and risk management tasks that fall within the investment company’s area of responsibility.
The Board believes that Incus’s overall strategy, guiding principles, organisational structure and ethical guidelines help to ensure a satisfactory control environment.
Deviations from the Norwegian Code of Practice for Corporate Governance: None.
REMUNERATION OF THE BOARDThe Board has determined remuneration guidelines for senior employees; these specify the main principles of the company’s wage policy for management. The salary and other remuneration of the CEO are established at a Board meeting and presented to the General Meeting for information purposes. See note 10 for further information regarding remuneration for senior employees.
Deviations from the Norwegian Code of Practice for Cor_porate Governance: None.
REMUNERATION FOR SENIOR EMPLOYEESThe Board has determined remuneration guidelines for senior employees; These specify the main principles of the company’s wage policy for management and are presented to the company’s General Meeting. The salary and other remuneration of the senior employees are established at a Board meeting and presented to the General Meeting for 24
25
Period 1 January – 31 December (NOK 1000) Note 2016 2015
Revenue:Operating revenue 3/13 645 749 838 488Other revenue 5 8 877 14 235Gains on the sale of property, plant and equipment and businesses 9/27 63 670 1 553
Total revenue 718 296 854 276
Operating expenses:Raw materials and consumables 12/27 244 925 263 713Change in stocks of finished goods and work in progress 12 -16 499 43 706Salary and social security costs 10/11 235 485 296 329Depreciation/amortisation and write-downs 8/9 48 930 37 863Other operating expenses 5/13/20/27 229 851 288 931
Total operating expenses 742 692 930 542
Operating profit/loss -24 396 -76 266
Financial income and expenses: 17/22Income from interests in associates 4 3 418 6 532Interest income 1 802 3 518Interest expense 17 -16 979 -23 125Net currency gain/loss ( - ) 23 870 -236Other financial income/expense (-) 5 -2 964 -5 696
Net financial items 9 147 -19 007
Profit/loss before tax – continuing operations -15 249 -95 273
Tax expense 6 -16 689 7 032
Profit/loss for the year – continuing operations 1 440 -102 305
Profit/loss for the year – discontinued operations (after tax) 27 27 026 29 981
Profit/loss for the year 28 466 -72 324
The profit/loss for the year is distributed as follows:Owners of the parent company 7 28 539 -71 777Non-controlling interests -73 -547
Profit/loss for the year 28 466 -72 324
Earnings per share – continuing operations 7 0,01 -1,09
Profit/loss for the year 28 466 -72 324
Other comprehensive incomeNet movement in fair value of cash flow hedges 6/23 8 321 3 716Net gain/loss on hedge of net investment 6 12 140 -14 015Reclassified translation differences 27 -10 437 -1 021Exchange difference on translations of foreign operations -7 319 19 511
Total other comprehensive income 2 705 8 191
Comprehensive income 31 171 -64 133
The comprehensive income is distributed as follows:Owners of the parent company 31 244 -63 586Non-controlling interests -73 -547
Comprehensive income 31 171 -64 133
INCUS INVESTOR ASA GROUP – STATEMENT OF COMPREHENSIVE INCOME
INCUS INVESTOR ASA GROUP – INCOME STATEMENT
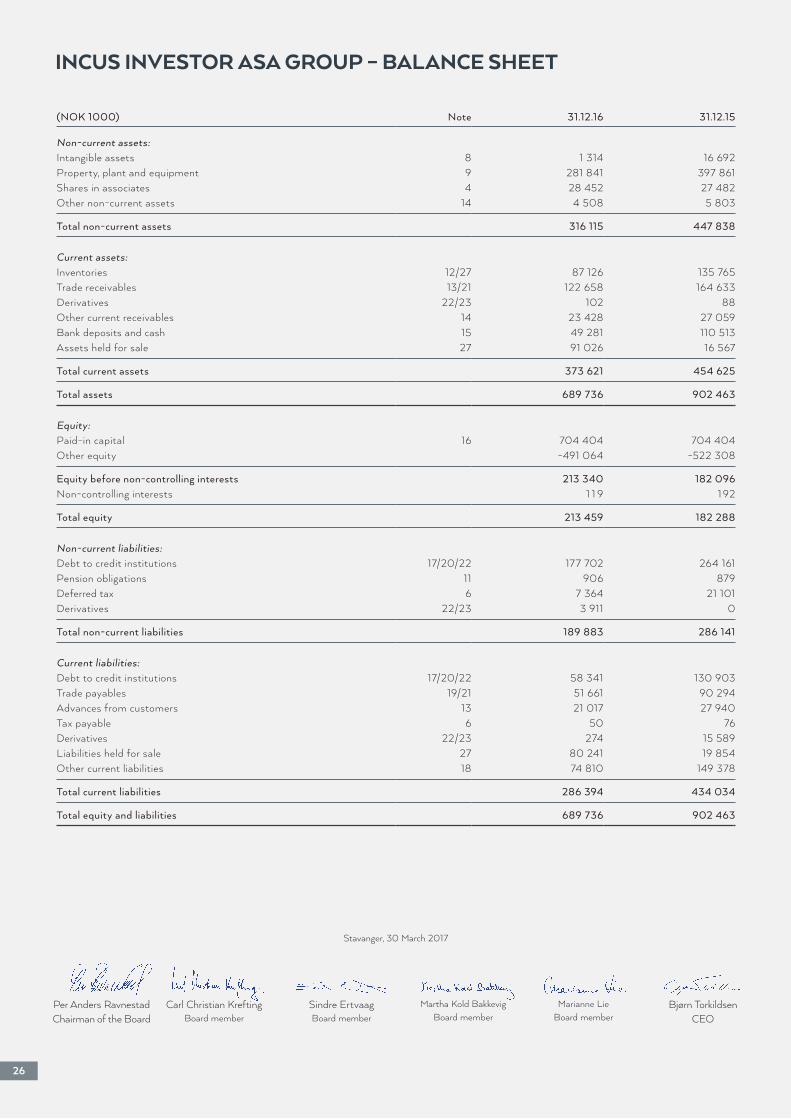
(NOK 1000) Note 31.12.16 31.12.15
Non-current assets:Intangible assets 8 1 314 16 692Property, plant and equipment 9 281 841 397 861Shares in associates 4 28 452 27 482Other non-current assets 14 4 508 5 803
Total non-current assets 316 115 447 838
Current assets:Inventories 12/27 87 126 135 765Trade receivables 13/21 122 658 164 633Derivatives 22/23 102 88Other current receivables 14 23 428 27 059Bank deposits and cash 15 49 281 110 513Assets held for sale 27 91 026 16 567
Total current assets 373 621 454 625
Total assets 689 736 902 463
Equity:Paid-in capital 16 704 404 704 404Other equity -491 064 -522 308
Equity before non-controlling interests 213 340 182 096Non-controlling interests 1 1 9 1 92
Total equity 213 459 182 288
Non-current liabilities:Debt to credit institutions 17/20/22 177 702 264 161Pension obligations 11 906 879Deferred tax 6 7 364 21 101Derivatives 22/23 3 911 0
Total non-current liabilities 189 883 286 141
Current liabilities:Debt to credit institutions 17/20/22 58 341 130 903Trade payables 19/21 51 661 90 294Advances from customers 13 21 017 27 940Tax payable 6 50 76Derivatives 22/23 274 15 589Liabilities held for sale 27 80 241 19 854Other current liabilities 18 74 810 149 378
Total current liabilities 286 394 434 034
Total equity and liabilities 689 736 902 463
INCUS INVESTOR ASA GROUP – BALANCE SHEET
26
Stavanger, 30 March 2017
Per Anders RavnestadChairman of the Board
Carl Christian KreftingBoard member
Sindre ErtvaagBoard member
Martha Kold BakkevigBoard member
Marianne LieBoard member
Bjørn TorkildsenCEO
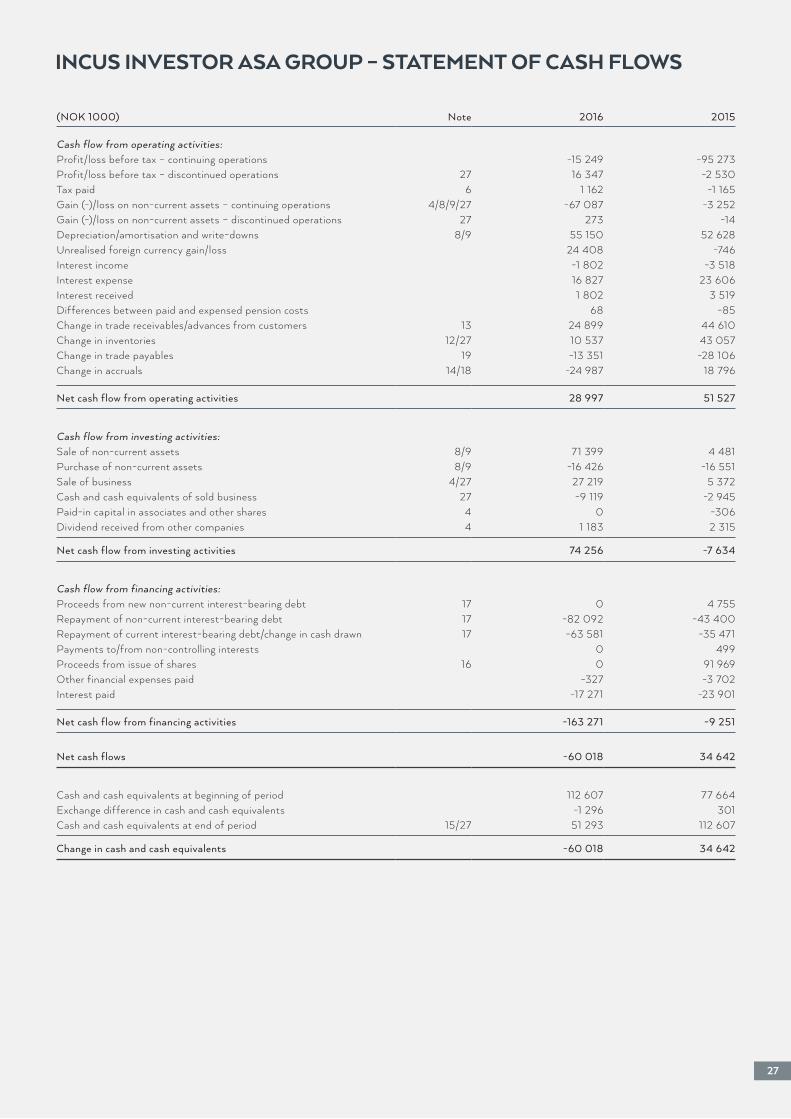
27
INCUS INVESTOR ASA GROUP – STATEMENT OF CASH FLOWS
(NOK 1000) Note 2016 2015
Cash flow from operating activities:Profit/loss before tax – continuing operations -15 249 -95 273Profit/loss before tax – discontinued operations 27 16 347 -2 530Tax paid 6 1 162 -1 165Gain (-)/loss on non-current assets – continuing operations 4/8/9/27 -67 087 -3 252Gain (-)/loss on non-current assets – discontinued operations 27 273 -14Depreciation/amortisation and write-downs 8/9 55 150 52 628Unrealised foreign currency gain/loss 24 408 -746Interest income -1 802 -3 518Interest expense 16 827 23 606Interest received 1 802 3 519Differences between paid and expensed pension costs 68 -85Change in trade receivables/advances from customers 13 24 899 44 610Change in inventories 12/27 10 537 43 057Change in trade payables 19 -13 351 -28 106Change in accruals 14/18 -24 987 18 796
Net cash flow from operating activities 28 997 51 527
Cash flow from investing activities:Sale of non-current assets 8/9 71 399 4 481Purchase of non-current assets 8/9 -16 426 -16 551Sale of business 4/27 27 219 5 372Cash and cash equivalents of sold business 27 -9 119 -2 945Paid-in capital in associates and other shares 4 0 -306Dividend received from other companies 4 1 183 2 315
Net cash flow from investing activities 74 256 -7 634
Cash flow from financing activities:Proceeds from new non-current interest-bearing debt 17 0 4 755Repayment of non-current interest-bearing debt 17 -82 092 -43 400Repayment of current interest-bearing debt/change in cash drawn 17 -63 581 -35 471Payments to/from non-controlling interests 0 499Proceeds from issue of shares 16 0 91 969Other financial expenses paid -327 -3 702Interest paid -17 271 -23 901
Net cash flow from financing activities -163 271 -9 251
Net cash flows -60 018 34 642
Cash and cash equivalents at beginning of period 112 607 77 664Exchange difference in cash and cash equivalents -1 296 301Cash and cash equivalents at end of period 15/27 51 293 112 607
Change in cash and cash equivalents -60 018 34 642
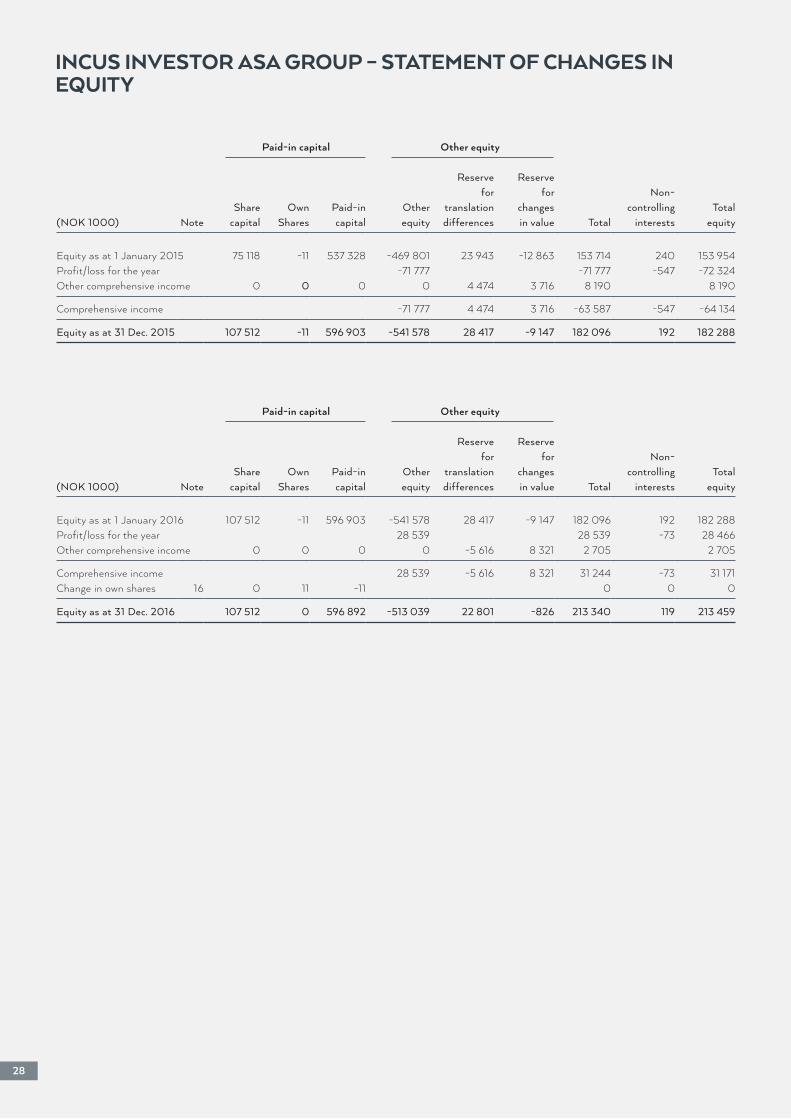
INCUS INVESTOR ASA GROUP – STATEMENT OF CHANGES IN EQUITY
28
Paid-in capital Other equity
Reserve Reservefor for Non-
Share Own Paid-in Other translation changes controlling Total(NOK 1000) Note capital Shares capital equity differences in value Total interests equity
Equity as at 1 January 2015 75 118 -11 537 328 -469 801 23 943 -12 863 153 714 240 153 954Profit/loss for the year -71 777 -71 777 -547 -72 324Other comprehensive income 0 0 0 0 4 474 3 716 8 190 8 190
Comprehensive income -71 777 4 474 3 716 -63 587 -547 -64 134
Equity as at 31 Dec. 2015 107 512 -11 596 903 -541 578 28 417 -9 147 182 096 192 182 288
Paid-in capital Other equity
Reserve Reservefor for Non-
Share Own Paid-in Other translation changes controlling Total(NOK 1000) Note capital Shares capital equity differences in value Total interests equity
Equity as at 1 January 2016 107 512 -11 596 903 -541 578 28 417 -9 147 182 096 192 182 288Profit/loss for the year 28 539 28 539 -73 28 466Other comprehensive income 0 0 0 0 -5 616 8 321 2 705 2 705
Comprehensive income 28 539 -5 616 8 321 31 244 -73 31 171Change in own shares 16 0 11 -11 0 0 0
Equity as at 31 Dec. 2016 107 512 0 596 892 -513 039 22 801 -826 213 340 119 213 459
29
INCUS INVESTOR ASA GROUP – NOTES
NOTE 1. CONSOLIDATED ACCOUNTING POLICIES 2016
General informationIncus Investor ASA is located at Strandkaien 2 in Stavanger, Norway. The company is a public limited company that is listed on the Oslo Stock Exchange. Its activities are described in note 3. The consolidated financial statements for Incus Investor ASA for 2016 were approved by the Board of Directors on 30 March 2017.
The consolidated financial statements are presented in Norwegian kroner (NOK), and all figures are rounded to the nearest thousand (’000) unless otherwise indicated.
Main principlesThe consolidated financial statements for Incus Investor ASA have been prepared in accordance with IFRS and the interpretations specified by the International Accounting Standards Board, as approved by the EU.
The consolidated financial statements have been prepared on the going concern basis of accounting (the going concern assumption). The annual financial statements consist of the income statement, statement of comprehensive income, balance sheet, statement of cash flows, statement of changes in equity and notes to the financial statements. The most important consolidation and accounting policies followed in the preparation of the annual financial statements are as follows:
The consolidated financial statements are based on the principles of historical cost accounting, with the exception of the following items:• Financial instruments at fair value through profit and loss and financial instruments available for sale which are recognised at fair value.
The consolidated financial statements have been prepared in accordance with the standard accounting policies for similar transactions and events under otherwise similar circumstances.
Functional currency and presentation currencyThe functional currency for the parent company Incus Investor ASA is NOK, while the functional currency for the subsidiaries is their local currency. The presentation currency for Incus Investor ASA is NOK.
Consolidation principlesThe consolidated financial statements include the parent company Incus Investor ASA and the companies over which Incus Investor ASA has control. Control is normally achieved when the group owns more than 50 per cent of shares in the company. Control can also be achieved where the group owns less than 50 per cent of the voting shares through an agreement or by the group being in a position to exercise effective control over the company. Non-controlling interests form part of the group’s equity.
The identifiable acquired assets and the assumed obligations, including contingent liabilities, are measured at their fair value on the date of transfer. Non-controlling interests in the acquired company are measured either at fair value or at a proportional share of the acquired company’s identifiable net assets. The transferred payment is measured at fair value. The additional part of the total sum of the transferred payment, amounts recognised for non-controlling interests and the fair value of any previously held equity interests in the acquired company in relation to the net value of identifiable acquired assets and assumed obligations is recognised as goodwill. Expenses incurred in connection with the acquisition, beyond those related to liabilities and equity, are expensed. Companies that are bought or sold during the course of the year are included in the consolidated financial statements from the date at which control was acquired and until control ceases.
Inter-company transactions and inter-company balances, including internal revenues and unrealised gains and losses, are eliminated. Unrealised gains relating to transactions with associates and joint ventures are eliminated through the group’s share of the company/business. Similarly, unrealised losses are eliminated, but only to the extent that there are no indications of a loss in value for the assets sold internally.
RevenueRevenue from the sale of goods is recognised when delivery takes place in accordance with the contract, i.e. the risk and potential gains associated with the goods have been transferred to the purchaser and the group has established a claim against the customer.
Rental income is recognised on a straight-line basis over the period of the lease.
Revenue related to long-term construction contracts (projects) is recognised in line with the progress of the project, where the outcome of the project can be measured reliably. The stage of completion is calculated using the most suitable method for the individual contract, which is normally the costs incurred as a percentage of the expected total cost. If the outcome of the project cannot be measured reliably, only revenue equivalent to the project costs incurred is recognised as revenue. Any loss on a contract is recognised in full in the period in which it is established that the project will result in a loss.
Advances on construction contracts are classified on the balance sheet under current liabilities.
Dividends are recognised when the rights to receive a dividend are established.
Interest income is recognised as it is accrued.
Currency translationTransactions in foreign currency are recognised using the exchange rate on the transaction date. Monetary items in foreign currency are translated using the exchange rate on the balance sheet date. Any exchange differences are recognised as financial items. Non-monetary items are translated at historical cost.
Balance sheet items at foreign subsidiaries are translated to NOK using the exchange rate as at 31 December. All items in the income statement are translated to NOK using the weighted average exchange rate per month, which is retrieved for the individual month from Norway’s central bank, Norges Bank. Consolidation leads to currency translation differences, which are presented as other comprehensive income in the statement of comprehensive income. Exchange rate gains and losses relating to liabilities in foreign currency which for accounting purposes are considered to hedge investments in foreign subsidiaries and the currency effects of monetary items which represent a portion of the net investment in the foreign subsidiaries are recognised as other comprehensive income in the statement of comprehensive income until the subsidiary is disposed of.
Intangible assetsIntangible assets with a definite life are depreciated over the expected useful life and are assessed for a possible write-down when there are indications that the value of the intangible assets may have been reduced. The depreciation period and method for intangible assets with a limited life are evaluated as a minimum at the end of each financial year. Changes to the expected useful life or anticipated pattern of use of the intangible assets are recognised by changing the depreciation period or method and are treated as changes to accounting estimates.
GoodwillGoodwill arising on acquisition is valued at acquisition cost. This represents the portion of the total acquisition cost that exceeds the net fair value of identifiable assets, liabilities and contingent liabilities. Following initial recognition, goodwill is valued at the acquisition cost less any accumulated impairment. The group tests goodwill for impairment annually or when there are indications of a loss in value. Impairment testing is carried out for the cash-generating units with recognised goodwill. Recognised goodwill is compared with the recoverable amount. The recoverable amount is the higher of the net realisable value and the utility value.
Research and development expenditureExpenditure on research is recognised on an ongoing basis. Development costs for an individual project are capitalised as intangible assets when it can be documented that:• It is feasible to complete the development of the intangible asset such
that it is available for use or sale• The intangible asset is intended to be completed and used or sold• The intangible asset can be used or sold• The asset will generate future economic benefits• The necessary resources to complete the development of the asset are
in place and• The development costs can be measured reliably.
All development costs that are recognised are to be reviewed by the Boards of the individual companies, and the way in which the intangible asset is expected to generate future cash flows for the group is to be documented.
Recognised development costs are reported on the balance sheet at acquisition cost less accumulated depreciation and write-downs. Recognised development costs are depreciated on a straight-line basis over the estimated useful life of the asset.
The carrying amount of the development costs is evaluated annually, or more frequently where there are indications of a reduction in value. Gains and losses on the disposal of an intangible asset, calculated as the difference between the net realisable value and the carrying amount, are recognised in the income statement.
Property, plant and equipmentProperty, plant and equipment are measured at acquisition cost, less accumulated depreciation and write-downs. When assets are sold or disposed of, the carrying amount is derecognised and any gains or losses are recognised in the income statement.
The acquisition cost of property, plant and equipment is the purchase price including fees, taxes and expenses directly linked to making the non-current asset ready for use. Expenses incurred once the non-current asset has been taken into use, such as ongoing maintenance, are recognised in the income statement, while other expenses, including larger-scale maintenance work that is expected to provide future economic benefit, are recognised on the balance sheet.
Properties and land are assets that will either be used by the group companies themselves or in order to obtain rental income. Properties and land are recognised at acquisition cost. Costs associated with real property are capitalised where the criteria for recognition are met, while ongoing maintenance is expensed.
Depreciation is calculated using the straight-line method over the anticipated useful life of the non-current assets with the exception of land. The useful life, residual value and depreciation method for non-current assets are assessed once a year.
The group capitalises larger-scale scheduled maintenance and depreciates it against income in relation to the maintenance interval.
Larger spare parts and spare equipment are considered to be part of non-current assets when the group expects them to be used in more than one accounting period. Similarly, where the spare parts and spare equipment can only be used in connection with the non-current assets, they are recognised as part of these.
Impairment of non-current assetsThe need for impairment of non-current assets is assessed when there are indications of a loss in value. Where the carrying amount of an asset is greater than its recoverable amount, the asset is written down in the income statement. The recoverable amount is the higher of the fair value less selling costs and the utility value (the discounted cash flow with continued use).
The fair value less selling costs is the value that can be realised on sale to an independent third party less the selling costs. The recoverable amount is determined separately for all non-current assets, but where this is not possible, it is determined together with the cash-generating unit with which the non-current assets are associated.
Write-downs recognised in the income statement from previous periods are reversed when there is information that the write-down is no longer necessary. Reversals are made via the income statement. No reversals are made, however, where this would mean that the carrying amount exceeds what the carrying amount would have been if ordinary depreciation had been applied.
Shares in associatesAn associate is an entity over which the group has significant influence, but not control, over the financial and operational management (normally a share of ownership of between 20 and 50 per cent). The consolidated financial statements include the group’s share of profits at associates according to the equity method from the point at which significant influence is achieved and until such influence ceases.
Where the group’s share of losses exceeds the investment in an associate, the group’s carrying amount is reduced to zero and further losses are not recognised in the income statement unless the group has an obligation to cover such losses.
Financial instrumentsFinancial instruments are classified in the following categories: fair value with revaluations through profit and loss, held to maturity, lending and receivables, available for sale and other liabilities.
Investments and other financial instrumentsFinancial assets are classified either as financial instruments with ongoing recognition of changes in fair value or as hedges. The group determines the classification of its financial assets on initial recognition and, where permitted and appropriate, this classification is reassessed at the end of each financial year.
Loans and receivables are non-derivative financial assets with fixed or variable cash flows where market prices are not continuously applied. Such assets are recognised at amortised cost using the effective interest method. Gains or losses are recognised when the loans and receivables are disposed of or are considered to be lost.
Financial assets that are not recognised at fair value are valued on the balance sheet date in order to identify any possible loss in value.
Financial instruments and hedgingThe group uses financial instruments (forward currency contracts, interest rate swaps and electricity derivatives) to hedge the risks associated with interest rates, exchange rates and fluctuations in the price of electricity. Such financial instruments are initially recognised at fair value on the date on which the contract is entered into and are valued in subsequent periods at fair value. A derivative is classified as an asset when its fair value is positive and as a liability when its fair value is negative.
The group’s criteria for the classification of a derivative or other financial instrument as a hedging instrument are as follows:• The hedge is expected to be highly effective in offsetting changes in fair
value or cash flows for a specific object – the effectiveness of the hedge must be expected to be within the range of 80–125 per cent
• The effectiveness of the hedge can be measured reliably• Adequate documentation has been established on entering into the hedge• For cash flow hedging, the future transaction must be likely, and• The hedge is continuously evaluated and has been shown to be effective.
On entering into a hedging contract, the group documents the assets, liabilities or future transactions to which it wishes to apply hedge accounting,
30
31
with associated risk-management targets and strategy. The documentation includes:• Identification of the hedging instrument• The hedged item or the transaction• The type of risk that is hedged• How the entity will assess the effectiveness of the hedging instrument
with regard to offsetting the exposure to changes in the fair value of the hedged item or cash flows associated with the hedged risk.
Hedges are expected to be highly effective with regard to offsetting changes in fair value or cash flows and are continuously assessed in order to determined whether they have actually been effective throughout the intended accounting period.
The group uses hedge accounting for cash flow hedges associated with the hedging of the future price of electricity and hedging future interest payments associated with external loans through interest rate swaps. Hedge accounting is also used to hedge currency effects on net investments in Swedish subsidiaries. Exchange gains/losses on loans that are used as hedging instruments for hedging net investment are recognised against comprehensive income.
The fair value of forward currency contracts is calculated in relation to the currency forward prices for contracts with similar terms. The fair value of interest rate swaps and electricity derivatives is determined on the basis of valuation input that is observable on the market, either directly or indirectly (level 2 in the valuation hierarchy).
Changes in the value of financial instruments that qualify for cash flow hedging are recognised as other comprehensive income in the statement of comprehensive income. Any ineffective elements of hedging are recognised in the income statement on an ongoing basis.
Gains and losses resulting from changes in the fair value of derivatives that do not qualify for hedge accounting are recognised in the income statement on an ongoing basis.
Interest-bearing loans and loan costsUpon initial recognition, interest-bearing loans are recognised at fair value. Fair value is normally the transaction price less directly related transaction costs. In subsequent periods, interest-bearing loans are recognised at amortised cost using the effective interest method. Gains and losses are recognised in the income statement where liabilities are derecognised from the balance sheet as well as through ordinary amortisation.
Derecognition of financial assets and liabilitiesA financial asset (or parts of a financial asset or parts of a group of similar financial assets) are derecognised from the balance sheet where:• The rights to receive cash flows from the asset expire,• The group has transferred its rights to receive cash flows from the asset
and has either (a) transferred substantially all the risks and rewards of ownership of the asset or (b) neither transferred nor retained the majority of the risks and rewards of ownership of the asset, but has transferred control of the asset.
A financial liability is derecognised when the liability has been settled, cancelled or has expired. Where an existing financial liability is replaced by another from the same lender on significantly different terms, or where the terms of an existing liability are significantly amended, such a change or amendment will be treated as the original liability being derecognised from the balance sheet and a new liability being recognised on the balance sheet. The difference in the respective carrying amounts will be recognised in the income statement.
InventoriesInventories, which comprise purchased goods and in-house manufactured products, are valued at the lower of the purchase/manufacturing cost and the expected net realisable value. The net realisable value is the
estimated selling price from ordinary operations, less the estimated costs of completion, marketing and distribution. The acquisition cost is allocated using the FIFO method and includes expenses incurred on the acquisition of the goods and the cost of bringing the goods to their present condition and location. In-house manufactured goods include raw materials, energy, direct work and a portion of indirect costs, including maintenance and depreciation.
Trade receivablesTrade receivables are normally recognised at the original invoice amount. Provisions for bad debts are made when there are objective grounds to believe that the group will not be able to collect a receivable. Earned revenue not yet received is classified on the balance sheet under trade receivables.
Cash and cash equivalentsCash and cash equivalents on the balance sheet comprise cash and bank balances with an original term of three months or less. Bank deposits may also include ring-fenced funds that may have a maturity of more than three months but less than 12 months. See note 15.
With regard to the group’s statement of cash flows, cash and cash equivalents comprise cash and cash equivalents as defined above. The statement of cash flows is prepared using the indirect method.
Non-current assets held for sale and discontinued operationsNon-current assets and liabilities are classified as held for sale if their carrying amount will be realised through a sales transaction rather than through continued use. This condition is considered to be met only if the sale is highly probable and the asset (or groups of assets and liabilities) are available for immediate sale in their current form. If the management decides that the sale is highly probable and the sale is expected to take place within one year of the date of classification as held for sale.
Assets and groups of assets and liabilities classified as held for sale are measured at the lower of the previous carrying amount and the fair value less selling costs. In the balance sheet, this is presented as “Assets held for sale” under “Total current assets” and “Liabilities held for sale” under “Total current liabilities”.
Discontinued operations are defined as part of the business that either has been disposed of or is classified as held for sale and• represents a separate, significant business or a separate, significant
geographic area of operations that is judged to be significant both with regard to the size of the business and to whether the business is different to other businesses in the group or the segment in general
• is part of an individual coordinated plan to dispose of a separate, signifi-cant business or a separate, significant geographic area of operation or
• is a subsidiary acquired solely for resale.
Discontinued operations are presented separately from the results from continuing operations in the line “Profit/loss for the year – discontinued operations (after tax)” in the income statement. Profit or loss after tax from discontinued operations and gains or losses for assets or disposal groups are included in the statement line item. Additional specifications are given in the notes. Comparative figures for discontinued operations are revised accordingly.
Equity
Own sharesHoldings of own shares are recognised against equity at nominal value.
LeasesThe group has entered into lease agreements as a lessee. Lease agreements are classified as finance or operating leases on the basis of a specific assessment of each lease.
For finance leases, an amount equivalent to the lower of the fair value
and the present value of the minimum lease payment is reported on the balance sheet at the beginning of the lease period. The same depreciation period is used as for the group’s other depreciable assets. Where there is no reasonable certainty that the group will take over the asset at the end of the lease period, the asset is depreciated over the shorter of the term of the lease and the asset’s economic life.
Operating leases are expensed on a straight-line basis over the period of the lease.
PensionsThe group’s pension schemes mainly consist of defined contribution pensions and contractual pension schemes for the group’s Norwegian employees and defined benefit (“multi employer”) plans for the group’s Swedish employees. The company has no legal or implied obligation to pay further contributions if the fund does not have sufficient assets to pay all benefits to employees related to work that employees perform or have performed in the current and previous accounting periods.
For pension plans where the agreed payments are made by the group and where the pension asset plans are administered separately (defined contribution pension schemes), the annual payments/contribution are included in personnel costs.
Pension obligations are valued at the present value of future pension rights accrued on the balance sheet date on the basis of the linear accrual method and estimated final salary. The pension plan assets are valued at estimated market value. Net pension obligations (pension obligations less pension plan assets) are classified on the balance sheet as non-current liabilities. Recognised net obligations include employer’s contributions.
The contractual pension scheme for the group’s Norwegian employees and the defined benefit plans for the group’s Swedish employees are regarded as “multi-employer plans”. These pension plans are treated as defined contribution pension plans in the financial statements, as the information required to treat the plans as defined benefit plans is not yet available from the life assurance company administering the pension plans. Once the required information is available and the pension plans are recognised as defined benefit plans in accordance with IAS 19, this may have an impact on the consolidated financial statements.
Tax
Deferred tax assetsDeferred tax assets are recognised on the balance sheet when it is probable that the group will have sufficient taxable surplus in future periods to make use of the tax assets. An assessment of whether deferred tax assets can be recognised, including deferred tax assets associated with loss to carry forward, is carried out separately within each individual tax regime. The companies recognise previously unrecognised deferred tax assets to the extent that it has become probable that the group will be able to make use of the deferred tax assets. Similarly, the group will reduce deferred tax assets to the extent that the group cannot adequately demonstrate that it will be able to make use of the deferred tax assets in future.
Deferred tax/tax asset on the balance sheet is recognised at nominal value and is calculated on the basis of temporary differences between the tax value and the carrying amount of assets and liabilities on the balance sheet date, adjusted for tax loss carryforward. Deferred tax assets or liabilities are assessed at the tax rates expected to apply to the period in which assets are realised or the liability is settled, based on tax rates and tax rules that have been adopted or largely adopted on the balance sheet date.
Tax payable and deferred tax are recognised directly against equity to the extent that the tax items relate to equity.
Tax payableReceivables and payables relating to tax payable for the current and
previous periods are valued at the amount which is expected to be paid to or from the tax authorities. ProvisionsProvisions are recognised when the group has an obligation (legal or constructive) as a result of a past event, it is probable (more probable than not) that the group will be required to settle the obligation through economic benefits and a reliable estimate can be made of the amount of the obligation. If the effect of the time value of money is significant, provisions are discounted using a discounting rate before tax that reflects the risks specific to the obligation in question. In the event of discounting, the increase in provisions is recognised in the income statement as a financial expense, since the assumed earning point has moved closer.
Guarantee provisions are recognised when the underlying products are sold. The provisions are based on historical information about guarantees and a weighting of possible outcomes against the likelihood of them occurring.
Provisions for restructuring are recognised when the group has approved a detailed, formal restructuring plan and the restructuring has either begun or been announced.
Provisions for unprofitable contracts are recognised when the group’s anticipated income from a contract is lower than the unavoidable costs incurred in order to meet the obligations under the contract.
Share-based paymentA share-based payment (incentive arrangement) has been entered into for the management of Incus and Converto, to be settled in cash, although Incus may choose to have up to 50 per cent settled by issuing shares.
The value of allotted options is allocated over the agreed period during which the employee earns the right to receive the options, or when services are purchased from external parties over the service period it is agreed that the share disbursement will cover. A Monte Carlo simulation is used to determine the value of the incentive arrangement.
Contingent liabilities and assetsContingent liabilities are not recognised in the annual financial statements. Significant contingent liabilities are disclosed with the exception of contingent liabilities where it is highly unlikely that the obligation will require settlement.
Contingent assets are not recognised in the financial statements, but are disclosed where it is probable that a benefit will accrue to the group.
Measurement of fair valueThe group measures individual financial instruments at fair value on the balance sheet date. This applies to, among other things, derivatives such as interest rate swaps and electricity derivatives. The fair value of financial obligations measured at amortised cost is also reported.
Fair value is the price that would have been used to sell an asset or paid to transfer a liability on the primary market on the measurement date under the prevailing market conditions, regardless of whether the price is directly observable or estimated using another valuation technique.
Going concernThe annual financial statements are prepared on the going concern basis of accounting (the going concern assumption); any uncertainty in this regard will be discussed. When there is significant uncertainty in relation to operation as a going concern, this is disclosed in a separate note. See note 28.
Events after the balance sheet dateNew information after the balance sheet date regarding the company’s financial position at the balance sheet date is taken into account in the annual financial statements. Events after the balance sheet date which
32
33
have no bearing on the company’s financial position at the balance sheet date but which will affect the company’s financial position in the future are disclosed where this is significant.
The accounting policies applied are consistent with those applied in previous accounting periods, with the exception of the changes to IFRS which have been implemented by the group in the current accounting period. Below is a list of the changes to IFRS applicable to 2016 which were relevant to the group, along with the effect these have had on the group’s annual financial statements.
The following new and revised financial reporting standards and interpretations were applied for the first time in 2016:
IAS 1 Presentation of Financial StatementsThe amendments to IAS 1 are intended to promote the use of professional judgement to a greater extent in terms of which information should be included in the notes and how the financial statements can be structured, as well as being part of the IASB’s Disclosure Initiative. The amendments clarify aspects including the following:• The materiality requirements in IAS 1• Specific lines in the income statement, the statement of other
comprehensive income and in the balance sheet can be disaggregated• The companies have flexibility when selecting the order of notes• The share of other comprehensive income from associates and joint
ventures, recognised using the equity method, must be presented aggregated on a line and classified between items that will/will not be reclassified to the income statement in subsequent periods.
The amendments take effect from 1 January 2016.
IAS 16 Property, Plant and Equipment and IAS 38 Intangible AssetsThe amendments entail a clarification of the basis for depreciation and amortisation. It is made clear that the use of a revenue-based method is not considered appropriate to calculate the depreciation or amortisation of an asset. This is justified by the fact that revenue generated from an activity that includes the use of an asset generally reflects more factors than consumption of future economic benefits of the asset. The amendments also clarify that revenue is generally assumed not to be a proper basis for measuring the consumption of the economic benefits of an intangible asset. The amendments will apply to financial statements from 1 January 2016 and have been implemented prospectively.
IFRS 2 Share-based PaymentThe amendments clarify definitions relating to vesting conditions, including the following:• A vesting condition must include a service condition.• A vesting target must be met while the counterparty is providing the
service.• A vesting target can be related to business or activities for a company, or
those of a company in the same group.• A vesting condition can be a market-based condition or a non-market
based condition.• If the counterparty, regardless of the reason, ceases to provide services
during the vesting period, this means the vesting condition is not met.The amendments have been implemented prospectively.
IFRS 8 DriftssegmenterThe amendments have been implemented retrospectively and this means that operating segments can be combined/merged if merging is consistent with the fundamental principles of the standard, if the segments possess equivalent financial characteristics and if they are similar based on other qualitative aspects. If operating segments are merged, the company must state whether the financial characteristics (e.g. sales and gross profit margins) used in the assessment of the segments are “equivalent”. The amendments also mean that reconciliation of segment assets against total assets only needs to be disclosed if the reconciliation is reported to the senior decision maker, equivalent to that for segment obligations.
IFRS 13 Fair Value MeasurementThe amendments entail a clarification that current trade receivables and payables which are not interest-bearing can be measured at the invoice amount when the effect of discounting is insignificant. The clarification is included in the Basis for Conclusions.
IAS 24 Related Party DisclosuresThe amendments have been implemented retrospectively and clarify that a company which supplies management services and key management personnel is a related party which is subject to the disclosure requirements for related parties. In addition, a company that makes use of such services must provide information on the costs incurred for these management services.
IAS 34 Interim Financial ReportingThe amendments clarify what is meant by to provide information “elsewhere in the interim report” (e.g. in the management statement) and state that the information required must be given either in the interim financial statements or “elsewhere in the interim report”. When the required information is given “elsewhere in the interim report”, the company must include a cross-reference between the summarised financial statements for the interim period and the location of this information. The amendments have been implemented retrospectively.
Future implementation effects associated with standards and interpretations
IFRS 9 Financial instrumentsIn July 2014, IASB published the final sub-project of IFRS 9 and the standard is now complete. IFRS 9 entails changes associated with classification and measurement, hedge accounting and write-downs. IFRS 9 will replace IAS 39 Financial Instruments: Recognition and Measurement. Those parts of IAS 39 that have not been changed as part of this project have been transferred and incorporated into IFRS 9.
The standard must be implemented retrospectively, with the exception of hedge accounting, but there is no requirement to draw up comparative figures. The rules for hedge accounting must largely be implemented prospectively, with a few exceptions. The group has no plans to implement the standard early. Based on a preliminary analysis, IFRS 9 is not expected to have a significant implementation effect for the group.
IFRS 15 Revenue from Contracts with CustomersThe IASB and FASB have issued a new joint revenue recognition standard: IFRS 15 Revenue from Contracts with Customers. The standard replaces all existing standards and interpretations for recognition of revenue. The core principle of IFRS 15 is that income (revenue) is recognised to reflect the transfer of agreed goods or services to customers, at an amount that reflects the payment to which the company expects to be entitled in exchange for those goods or services. With a few exceptions, the standard applies to all income-generating contracts with customers, and includes a model for calculating and measuring sales of individual non-financial assets (e.g. sale of property, plant and equipment). IFRS 15 must be implemented using either the full or modified retrospective method. Based on a provisional review of the possible implementation effect, the group does not expect IFRS 15 to have a significant impact on revenue recognition within the group.
FRS 16 Leases IASB has undertaken a joint project with FASB in order to draft a new leases standard. IFRS 16 Leases replaces the existing IFRS standard for leases, IAS 17 Leases. IFRS 16 sets out the principles for recognition, measurement, presentation and disclosures about leases for both parties in a lease, i.e. the customer (lessee) and the service provider (the lessor). The new standard requires the lessee to recognise assets and liabilities for most leases, something which is a significant change from current principles. As far as the lessor is concerned, IFRS 16 continues to follow the main existing
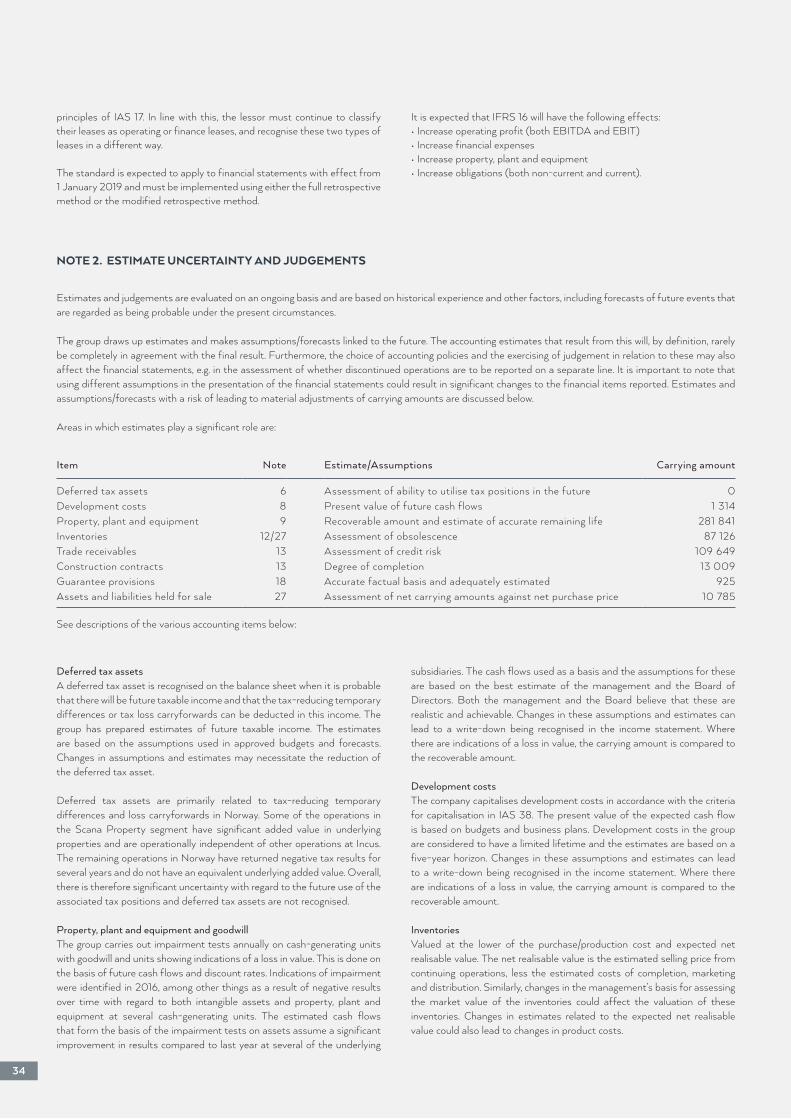
Estimates and judgements are evaluated on an ongoing basis and are based on historical experience and other factors, including forecasts of future events that are regarded as being probable under the present circumstances.
The group draws up estimates and makes assumptions/forecasts linked to the future. The accounting estimates that result from this will, by definition, rarely be completely in agreement with the final result. Furthermore, the choice of accounting policies and the exercising of judgement in relation to these may also affect the financial statements, e.g. in the assessment of whether discontinued operations are to be reported on a separate line. It is important to note that using different assumptions in the presentation of the financial statements could result in significant changes to the financial items reported. Estimates and assumptions/forecasts with a risk of leading to material adjustments of carrying amounts are discussed below.
Areas in which estimates play a significant role are:
Item Note Estimate/Assumptions Carrying amount
Deferred tax assets 6 Assessment of ability to utilise tax positions in the future 0 Development costs 8 Present value of future cash flows 1 314Property, plant and equipment 9 Recoverable amount and estimate of accurate remaining life 281 841Inventories 12/27 Assessment of obsolescence 87 126 Trade receivables 13 Assessment of credit risk 109 649 Construction contracts 13 Degree of completion 13 009 Guarantee provisions 18 Accurate factual basis and adequately estimated 925 Assets and liabilities held for sale 27 Assessment of net carrying amounts against net purchase price 10 785
See descriptions of the various accounting items below:
Deferred tax assetsA deferred tax asset is recognised on the balance sheet when it is probable that there will be future taxable income and that the tax-reducing temporary differences or tax loss carryforwards can be deducted in this income. The group has prepared estimates of future taxable income. The estimates are based on the assumptions used in approved budgets and forecasts. Changes in assumptions and estimates may necessitate the reduction of the deferred tax asset.
Deferred tax assets are primarily related to tax-reducing temporary differences and loss carryforwards in Norway. Some of the operations in the Scana Property segment have significant added value in underlying properties and are operationally independent of other operations at Incus. The remaining operations in Norway have returned negative tax results for several years and do not have an equivalent underlying added value. Overall, there is therefore significant uncertainty with regard to the future use of the associated tax positions and deferred tax assets are not recognised.
Property, plant and equipment and goodwillThe group carries out impairment tests annually on cash-generating units with goodwill and units showing indications of a loss in value. This is done on the basis of future cash flows and discount rates. Indications of impairment were identified in 2016, among other things as a result of negative results over time with regard to both intangible assets and property, plant and equipment at several cash-generating units. The estimated cash flows that form the basis of the impairment tests on assets assume a significant improvement in results compared to last year at several of the underlying
subsidiaries. The cash flows used as a basis and the assumptions for these are based on the best estimate of the management and the Board of Directors. Both the management and the Board believe that these are realistic and achievable. Changes in these assumptions and estimates can lead to a write-down being recognised in the income statement. Where there are indications of a loss in value, the carrying amount is compared to the recoverable amount.
Development costsThe company capitalises development costs in accordance with the criteria for capitalisation in IAS 38. The present value of the expected cash flow is based on budgets and business plans. Development costs in the group are considered to have a limited lifetime and the estimates are based on a five-year horizon. Changes in these assumptions and estimates can lead to a write-down being recognised in the income statement. Where there are indications of a loss in value, the carrying amount is compared to the recoverable amount.
InventoriesValued at the lower of the purchase/production cost and expected net realisable value. The net realisable value is the estimated selling price from continuing operations, less the estimated costs of completion, marketing and distribution. Similarly, changes in the management’s basis for assessing the market value of the inventories could affect the valuation of these inventories. Changes in estimates related to the expected net realisable value could also lead to changes in product costs.
principles of IAS 17. In line with this, the lessor must continue to classify their leases as operating or finance leases, and recognise these two types of leases in a different way.
The standard is expected to apply to financial statements with effect from 1 January 2019 and must be implemented using either the full retrospective method or the modified retrospective method.
It is expected that IFRS 16 will have the following effects:• Increase operating profit (both EBITDA and EBIT)• Increase financial expenses• Increase property, plant and equipment• Increase obligations (both non-current and current).
34
NOTE 2. ESTIMATE UNCERTAINTY AND JUDGEMENTS

Trade receivables and other current receivablesTrade receivables and other current receivables are assessed on an ongoing basis, and are written down if there are objective criteria for the occurrence of a loss-triggering event that can be measured reliably and will affect the payment of the receivable. Changes in the management’s basis for the assessment of the credit risk may affect the estimated loss provision. In the same way, changes in market conditions, internal conditions at our customers, etc. can mean a final result that deviates from the provisions made for bad debts.
Construction contractsWhen reporting construction contracts, assumptions are made regarding estimated costs and earnings, as well as the definition and measurement of degree of completion. Changes in these estimates may mean that the reporting of revenue and earnings deviates from the underlying value created, relative to the project’s overall revenue and earnings. Consequently, earnings can be reported too early or too late in the project.
Guarantee provisionsThe management estimates the provisions for future guarantee obligations based on information on historical guarantee requirements, together with other information used to calculate future guarantee obligations. Factors that can affect estimated obligations include unknown faults in completed deliveries.
Held for sale/Discontinued operationsAs part of the sales process, it is assessed whether the sale is highly probable and will take place within a year. If the held for sale criteria are met, the assets and liabilities are classified as held for sale in the balance sheet. Net carrying amounts are also compared to the gross purchase price less debt and transaction costs. If net carrying amounts exceed the net purchase price, carrying amounts are written down. In cases where the business represents a separate and significant geographic area of operations, profit/loss is revised using comparative figures on the line for discontinued operations in the income statement.
The segment distribution consists of the portfolio companies and any subsidiaries of these:
• Scana Steel consists of: Scana Steel AB, which owns 100 per cent of shares in: Scana Steel Björneborg AB and Scana Subsea AB. Scana Machining AB has been sold.
• Scana Property consists of: Scana Property AS, which owns 100 per cent of shares in: Scana Eiendom Volda AS, Scana Eiendom SSA AS, SCANA Eiendom Jørpeland AS and 50.1 per cent of shares in Fjordbris AS. Scana Property AB has been sold.
• Scana Skarpenord consists of: Scana Skarpenord AS
• Scana Offshore consists of: Scana Offshore AS
• Scana Booforge consists of: Scana Steel Booforge AB
• Incus HQ consists of: Incus Investor ASA owns 100 per cent of shares in Scana US Holding
Inc. and Scana Trading AS, which owns all the shares in Scana Energy Holding AB, which in turn owns 100 per cent of shares in Scana Steel AB. In addition, Scana Trading AS owns 49 per cent of shares in Scana Korea Hydraulic Ltd and 100 per cent of shares in Scana Valve Control AS. Incus Investor ASA owns 51 per cent of shares in Scana do Brasil Ltd.
The main products in the portfolio company Scana Steel are forged products for the oil and gas, energy, marine, machine and tool industries. Scana Property comprises the group’s property companies. Scana Skarpenord is a leading supplier of hydraulic and pneumatic valve systems for the oil, gas and shipbuilding industries. Scana Offshore supplies its own products and components to the oil and gas industry. Scana Booforge produces and supplies masts and lifting carriages and can therefore deliver complete lifting systems for forklift trucks in the heavy segment. “Incus HQ” includes the investment company Incus Investor ASA, three holding companies and the company in Brazil. The “Eliminations” column refers to eliminations between the portfolio companies.
The presentation coincides with the internal reporting to the Board. Income from sales to external customers and transactions with other portfolios are reported in each business area, and internal deliveries are recognised at estimated market value.
The portfolio company Scana Propulsion that was part of the Scana Propulsion segment has been sold. Scana Propulsion is deemed to meet the requirements for reporting as discontinued operations and is therefore not included in the segment report as at 31 December 2016 (see note 27). Last year’s figures have also been revised as a result of the sale. Scana Machining AB, which is part of the Scana Steel segment, was sold in the first quarter of 2016. The size and scope of the company are not deemed to meet the criteria for reclassification as discontinued operations. Scana Property AB, which is part of the Scana Property segment, was sold in the second quarter of 2016. The properties in Scana Eiendom SSA AS were also sold in 2016. The company Scana Property AB and the properties in Scana Eiendom SSA AS do not represent a significant portion and do not constitute a segment or geographic region for the group. They are not deemed to meet the criteria for reclassification as discontinued operations.
35
NOTE 3. SEGMENT INFORMATION
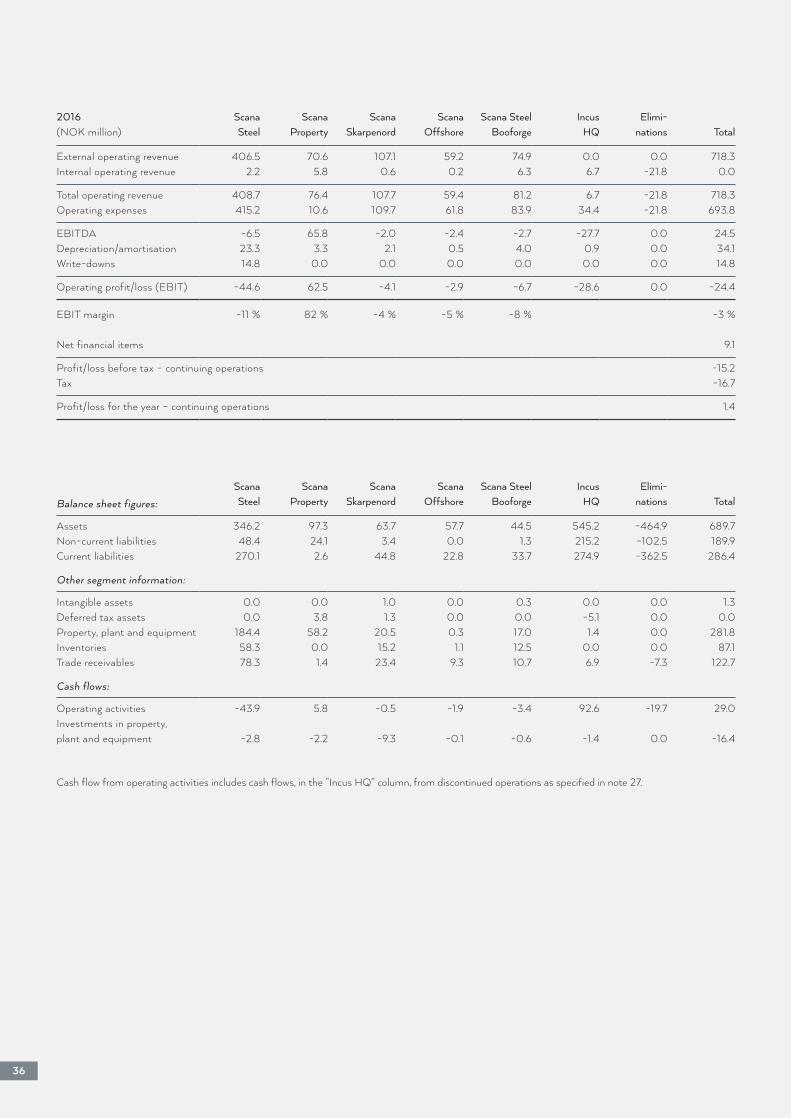
2016 Scana Scana Scana Scana Scana Steel Incus Elimi-(NOK million) Steel Property Skarpenord Offshore Booforge HQ nations Total
External operating revenue 406.5 70.6 107.1 59.2 74.9 0.0 0.0 718.3Internal operating revenue 2.2 5.8 0.6 0.2 6.3 6.7 -21.8 0.0
Total operating revenue 408.7 76.4 107.7 59.4 81.2 6.7 -21.8 718.3Operating expenses 415.2 10.6 109.7 61.8 83.9 34.4 -21.8 693.8
EBITDA -6.5 65.8 -2.0 -2.4 -2.7 -27.7 0.0 24.5Depreciation/amortisation 23.3 3.3 2.1 0.5 4.0 0.9 0.0 34.1Write-downs 14.8 0.0 0.0 0.0 0.0 0.0 0.0 14.8
Operating profit/loss (EBIT) -44.6 62.5 -4.1 -2.9 -6.7 -28.6 0.0 -24.4
EBIT margin -11 % 82 % -4 % -5 % -8 % -3 %
Net financial items 9.1
Profit/loss before tax – continuing operations -15.2Tax -16.7
Profit/loss for the year – continuing operations 1.4
Scana Scana Scana Scana Scana Steel Incus Elimi-Balance sheet figures: Steel Property Skarpenord Offshore Booforge HQ nations Total
Assets 346.2 97.3 63.7 57.7 44.5 545.2 -464.9 689.7Non-current liabilities 48.4 24.1 3.4 0.0 1.3 215.2 -102.5 189.9Current liabilities 270.1 2.6 44.8 22.8 33.7 274.9 -362.5 286.4
Other segment information:
Intangible assets 0.0 0.0 1.0 0.0 0.3 0.0 0.0 1.3Deferred tax assets 0.0 3.8 1.3 0.0 0.0 -5.1 0.0 0.0Property, plant and equipment 184.4 58.2 20.5 0.3 17.0 1.4 0.0 281.8Inventories 58.3 0.0 15.2 1.1 12.5 0.0 0.0 87.1Trade receivables 78.3 1.4 23.4 9.3 10.7 6.9 -7.3 122.7
Cash flows:
Operating activities -43.9 5.8 -0.5 -1.9 -3.4 92.6 -19.7 29.0Investments in property, plant and equipment -2.8 -2.2 -9.3 -0.1 -0.6 -1.4 0.0 -16.4
36
Cash flow from operating activities includes cash flows, in the “Incus HQ” column, from discontinued operations as specified in note 27.
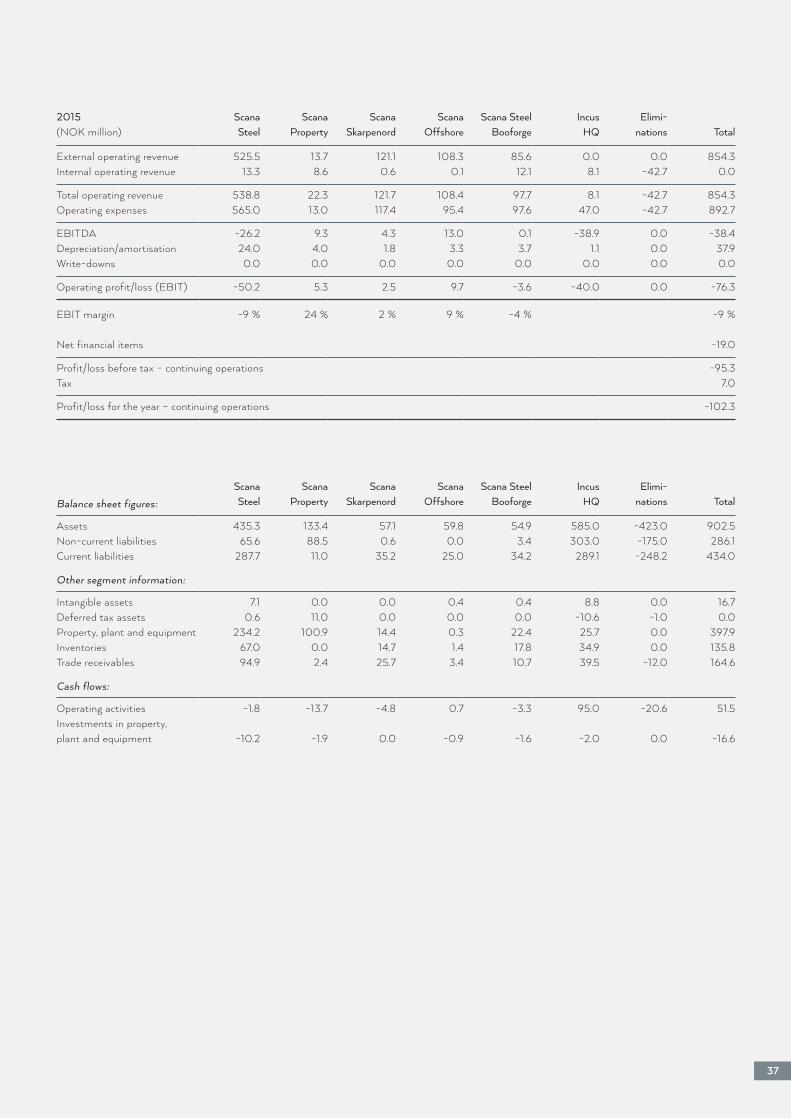
2015 Scana Scana Scana Scana Scana Steel Incus Elimi-(NOK million) Steel Property Skarpenord Offshore Booforge HQ nations Total
External operating revenue 525.5 13.7 121.1 108.3 85.6 0.0 0.0 854.3Internal operating revenue 13.3 8.6 0.6 0.1 12.1 8.1 -42.7 0.0
Total operating revenue 538.8 22.3 121.7 108.4 97.7 8.1 -42.7 854.3Operating expenses 565.0 13.0 117.4 95.4 97.6 47.0 -42.7 892.7
EBITDA -26.2 9.3 4.3 13.0 0.1 -38.9 0.0 -38.4Depreciation/amortisation 24.0 4.0 1.8 3.3 3.7 1.1 0.0 37.9Write-downs 0.0 0.0 0.0 0.0 0.0 0.0 0.0 0.0
Operating profit/loss (EBIT) -50.2 5.3 2.5 9.7 -3.6 -40.0 0.0 -76.3
EBIT margin -9 % 24 % 2 % 9 % -4 % -9 %
Net financial items -19.0
Profit/loss before tax – continuing operations -95.3Tax 7.0
Profit/loss for the year – continuing operations -102.3
Scana Scana Scana Scana Scana Steel Incus Elimi-Balance sheet figures: Steel Property Skarpenord Offshore Booforge HQ nations Total
Assets 435.3 133.4 57.1 59.8 54.9 585.0 -423.0 902.5Non-current liabilities 65.6 88.5 0.6 0.0 3.4 303.0 -175.0 286.1Current liabilities 287.7 11.0 35.2 25.0 34.2 289.1 -248.2 434.0
Other segment information:
Intangible assets 7.1 0.0 0.0 0.4 0.4 8.8 0.0 16.7Deferred tax assets 0.6 11.0 0.0 0.0 0.0 -10.6 -1.0 0.0Property, plant and equipment 234.2 100.9 14.4 0.3 22.4 25.7 0.0 397.9Inventories 67.0 0.0 14.7 1.4 17.8 34.9 0.0 135.8Trade receivables 94.9 2.4 25.7 3.4 10.7 39.5 -12.0 164.6
Cash flows:
Operating activities -1.8 -13.7 -4.8 0.7 -3.3 95.0 -20.6 51.5Investments in property, plant and equipment -10.2 -1.9 0.0 -0.9 -1.6 -2.0 0.0 -16.6
37
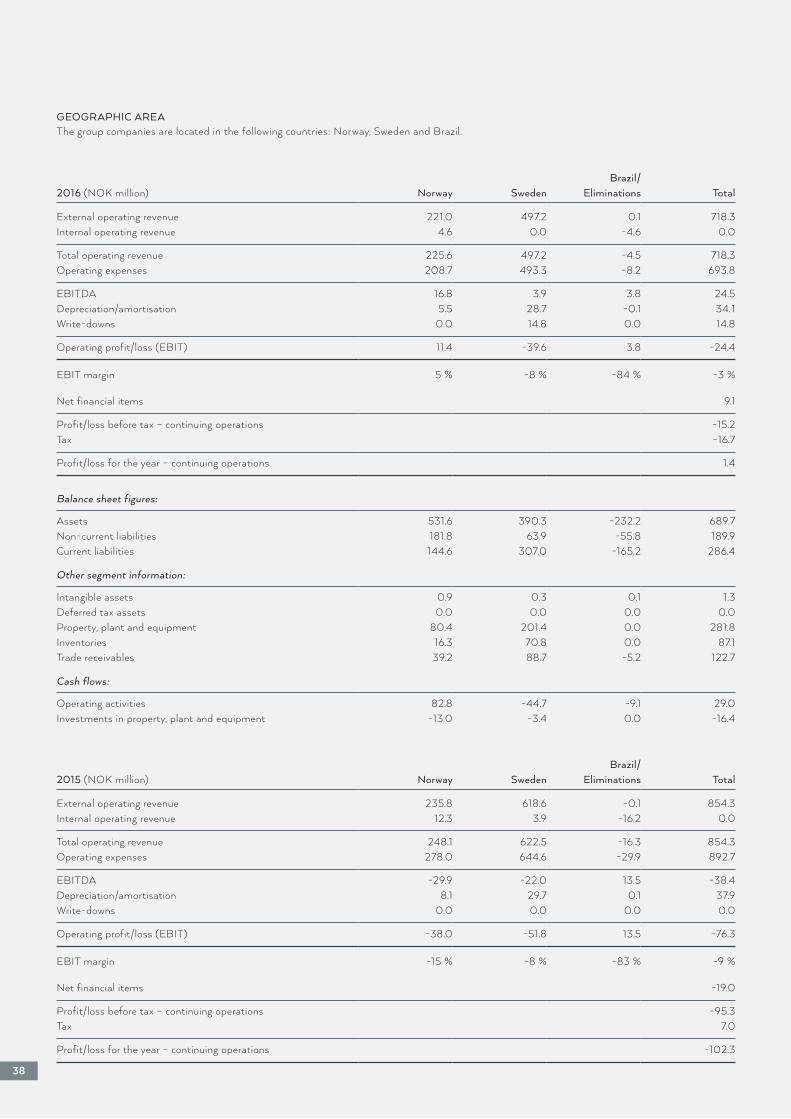
GEOGRAPHIC AREAThe group companies are located in the following countries: Norway, Sweden and Brazil.
Brazil/2016 (NOK million) Norway Sweden Eliminations Total
External operating revenue 221.0 497.2 0.1 718.3Internal operating revenue 4.6 0.0 -4.6 0.0
Total operating revenue 225.6 497.2 -4.5 718.3Operating expenses 208.7 493.3 -8.2 693.8
EBITDA 16.8 3.9 3.8 24.5Depreciation/amortisation 5.5 28.7 -0.1 34. 1Write-downs 0.0 14.8 0.0 14.8
Operating profit/loss (EBIT) 11.4 -39.6 3.8 -24.4
EBIT margin 5 % -8 % -84 % -3 %
Net financial items 9.1
Profit/loss before tax – continuing operations -15.2Tax -16.7
Profit/loss for the year – continuing operations 1.4
Balance sheet figures:
Assets 531.6 390.3 -232.2 689.7Non-current liabilities 181.8 63.9 -55.8 189.9Current liabilities 144.6 307.0 -165.2 286.4
Other segment information:
Intangible assets 0.9 0.3 0.1 1.3Deferred tax assets 0.0 0.0 0.0 0.0Property, plant and equipment 80.4 201.4 0.0 281.8Inventories 16.3 70.8 0.0 87.1Trade receivables 39.2 88.7 -5.2 122.7
Cash flows:
Operating activities 82.8 -44.7 -9.1 29.0Investments in property, plant and equipment -13.0 -3.4 0.0 -16.4
38
Brazil/2015 (NOK million) Norway Sweden Eliminations Total
External operating revenue 235.8 618.6 -0.1 854.3Internal operating revenue 12.3 3.9 -16.2 0.0
Total operating revenue 248.1 622.5 -16.3 854.3Operating expenses 278.0 644.6 -29.9 892.7
EBITDA -29.9 -22.0 13.5 -38.4Depreciation/amortisation 8.1 29.7 0.1 37.9Write-downs 0.0 0.0 0.0 0.0
Operating profit/loss (EBIT) -38.0 -51.8 13.5 -76.3
EBIT margin -15 % -8 % -83 % -9 %
Net financial items -19.0
Profit/loss before tax – continuing operations -95.3Tax 7.0
Profit/loss for the year – continuing operations -102.3
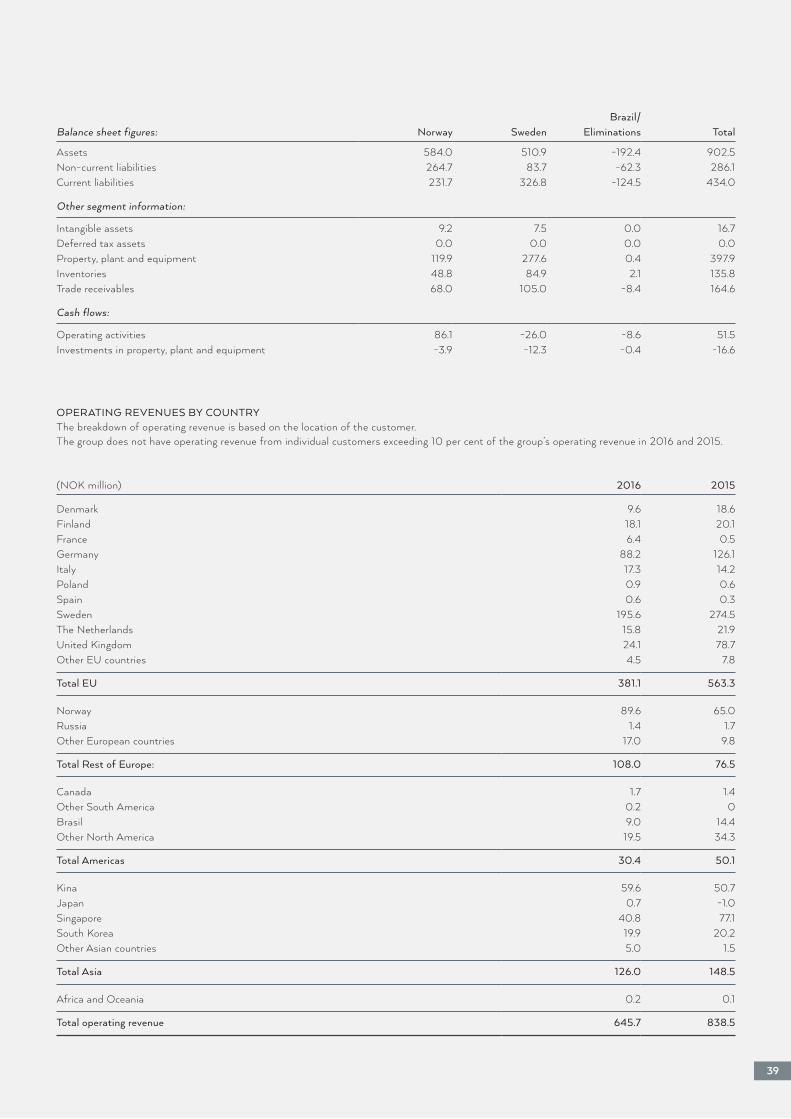
(NOK million) 2016 2015
Denmark 9.6 18.6 Finland 18.1 20.1 France 6.4 0.5 Germany 88.2 126.1 Italy 17.3 14.2 Poland 0.9 0.6 Spain 0.6 0.3 Sweden 195.6 274.5 The Netherlands 15.8 21.9 United Kingdom 24.1 78.7 Other EU countries 4.5 7.8
Total EU 381.1 563.3
Norway 89.6 65.0 Russia 1.4 1.7 Other European countries 17.0 9.8
Total Rest of Europe: 108.0 76.5
Canada 1.7 1.4 Other South America 0.2 0 Brasil 9.0 14.4 Other North America 19.5 34.3
Total Americas 30.4 50.1
Kina 59.6 50.7 Japan 0.7 -1.0Singapore 40.8 77.1 South Korea 19.9 20.2 Other Asian countries 5.0 1.5
Total Asia 126.0 148.5
Africa and Oceania 0.2 0.1
Total operating revenue 645.7 838.5
39
Brazil/Balance sheet figures: Norway Sweden Eliminations Total
Assets 584.0 510.9 -192.4 902.5Non-current liabilities 264.7 83.7 -62.3 286.1Current liabilities 231.7 326.8 -124.5 434.0
Other segment information:
Intangible assets 9.2 7.5 0.0 16.7Deferred tax assets 0.0 0.0 0.0 0.0Property, plant and equipment 119.9 277.6 0.4 397.9Inventories 48.8 84.9 2.1 135.8Trade receivables 68.0 105.0 -8.4 164.6
Cash flows:
Operating activities 86.1 -26.0 -8.6 51.5Investments in property, plant and equipment -3.9 -12.3 -0.4 -16.6
OPERATING REVENUES BY COUNTRYThe breakdown of operating revenue is based on the location of the customer.The group does not have operating revenue from individual customers exceeding 10 per cent of the group’s operating revenue in 2016 and 2015.
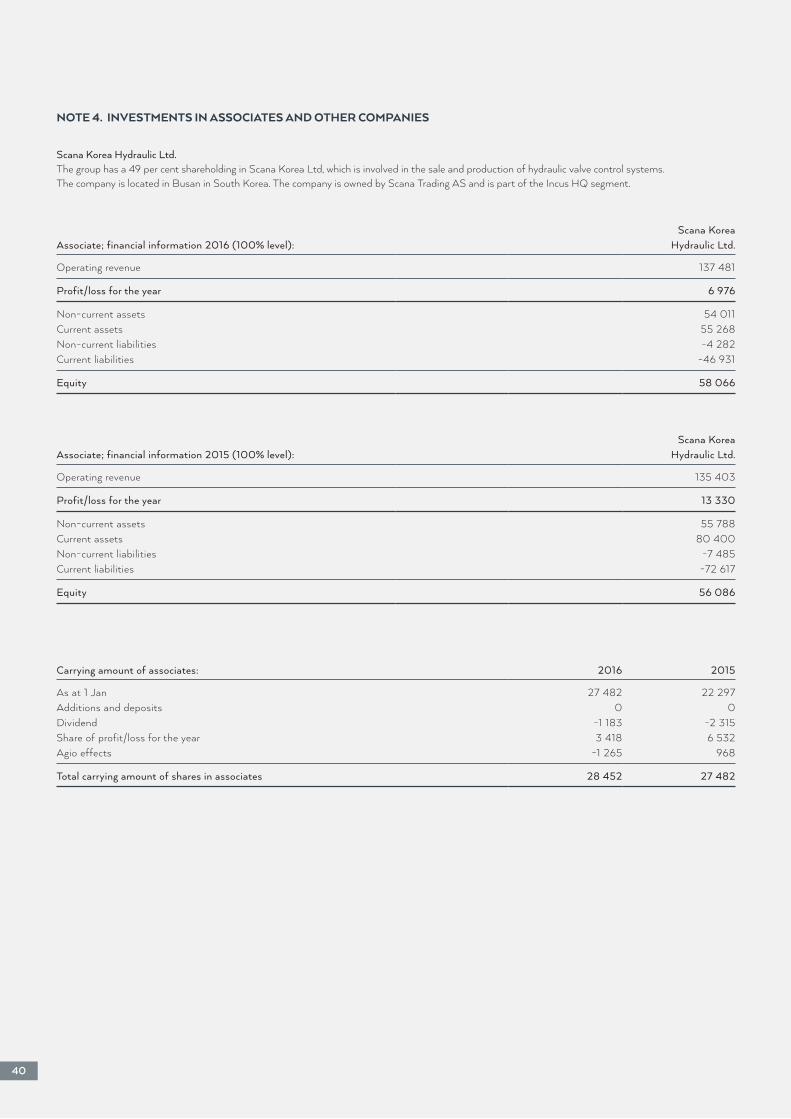
Carrying amount of associates: 2016 2015
As at 1 Jan 27 482 22 297Additions and deposits 0 0Dividend -1 183 -2 315Share of profit/loss for the year 3 418 6 532Agio effects -1 265 968
Total carrying amount of shares in associates 28 452 27 482
Scana Korea Hydraulic Ltd.The group has a 49 per cent shareholding in Scana Korea Ltd, which is involved in the sale and production of hydraulic valve control systems. The company is located in Busan in South Korea. The company is owned by Scana Trading AS and is part of the Incus HQ segment.
Scana KoreaAssociate; financial information 2016 (100% level): Hydraulic Ltd.
Operating revenue 137 481
Profit/loss for the year 6 976
Non-current assets 54 011Current assets 55 268Non-current liabilities -4 282Current liabilities -46 931
Equity 58 066
40
NOTE 4. INVESTMENTS IN ASSOCIATES AND OTHER COMPANIES
Scana KoreaAssociate; financial information 2015 (100% level): Hydraulic Ltd.
Operating revenue 135 403
Profit/loss for the year 13 330
Non-current assets 55 788Current assets 80 400Non-current liabilities -7 485Current liabilities -72 617
Equity 56 086
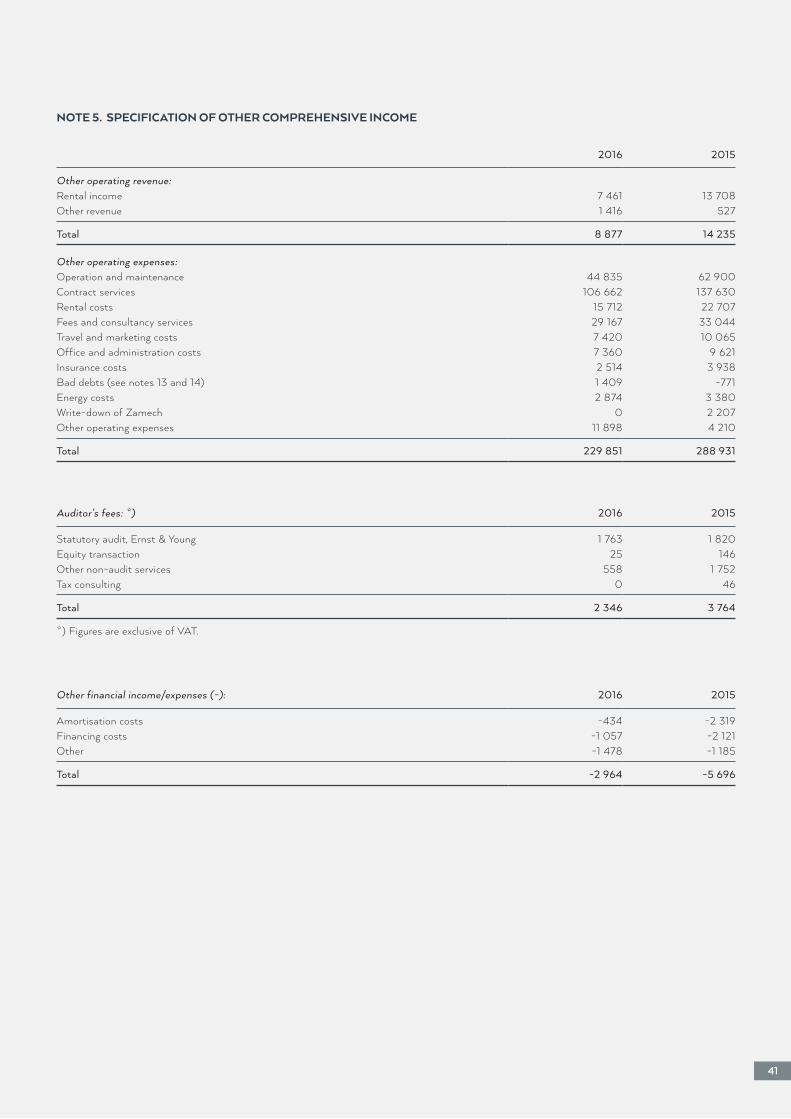
Other financial income/expenses (-): 2016 2015
Amortisation costs -434 -2 319Financing costs -1 057 -2 121Other -1 478 -1 185
Total -2 964 -5 696
2016 2015
Other operating revenue:Rental income 7 461 13 708Other revenue 1 416 527
Total 8 877 14 235
Other operating expenses:Operation and maintenance 44 835 62 900Contract services 106 662 137 630Rental costs 15 712 22 707Fees and consultancy services 29 167 33 044Travel and marketing costs 7 420 10 065Office and administration costs 7 360 9 621Insurance costs 2 514 3 938Bad debts (see notes 13 and 14) 1 409 -771Energy costs 2 874 3 380Write-down of Zamech 0 2 207Other operating expenses 11 898 4 210
Total 229 851 288 931
Auditor’s fees: *) 2016 2015
Statutory audit, Ernst & Young 1 763 1 820Equity transaction 25 146Other non-audit services 558 1 752Tax consulting 0 46
Total 2 346 3 764
*) Figures are exclusive of VAT.
41
NOTE 5. SPECIFICATION OF OTHER COMPREHENSIVE INCOME
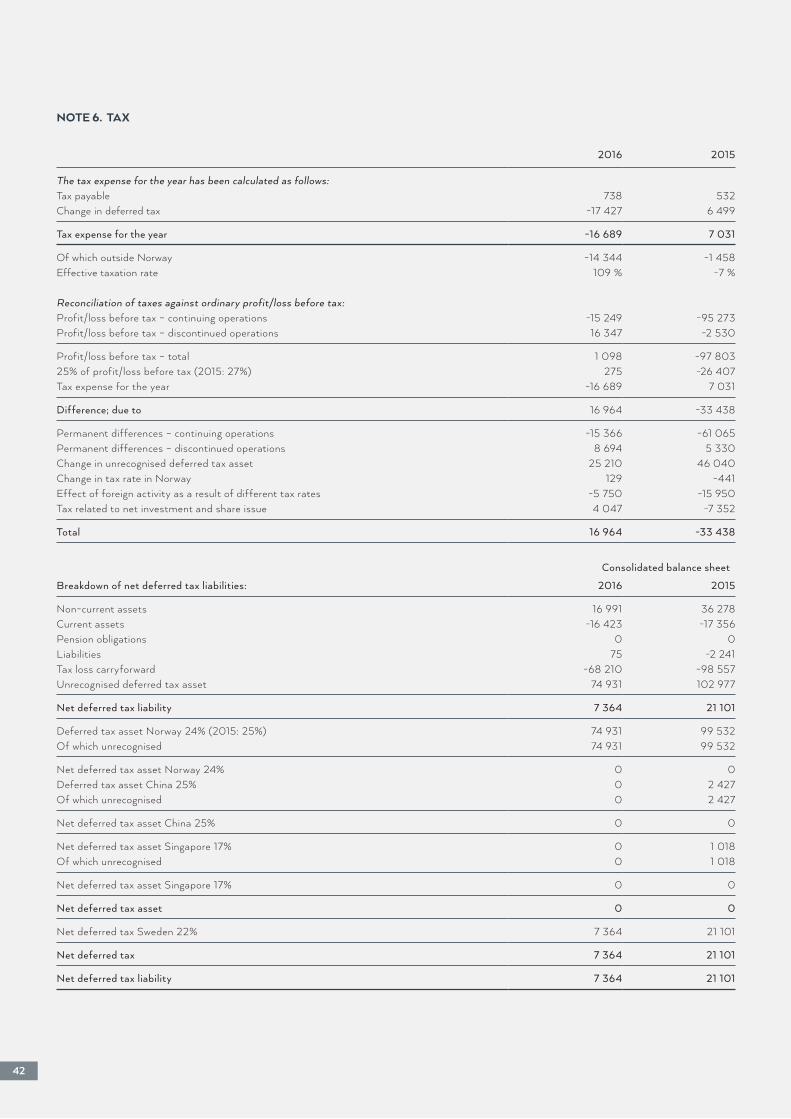
2016 2015
The tax expense for the year has been calculated as follows:Tax payable 738 532Change in deferred tax -17 427 6 499
Tax expense for the year -16 689 7 031
Of which outside Norway -14 344 -1 458Effective taxation rate 109 % -7 %
Reconciliation of taxes against ordinary profit/loss before tax:Profit/loss before tax – continuing operations -15 249 -95 273Profit/loss before tax – discontinued operations 16 347 -2 530
Profit/loss before tax – total 1 098 -97 80325% of profit/loss before tax (2015: 27%) 275 -26 407Tax expense for the year -16 689 7 031
Difference; due to 16 964 -33 438
Permanent differences – continuing operations -15 366 -61 065Permanent differences – discontinued operations 8 694 5 330Change in unrecognised deferred tax asset 25 210 46 040Change in tax rate in Norway 129 -441Effect of foreign activity as a result of different tax rates -5 750 -15 950Tax related to net investment and share issue 4 047 -7 352
Total 16 964 -33 438
Consolidated balance sheet
Breakdown of net deferred tax liabilities: 2016 2015
Non-current assets 16 991 36 278Current assets -16 423 -17 356Pension obligations 0 0Liabilities 75 -2 241Tax loss carryforward -68 210 -98 557Unrecognised deferred tax asset 74 931 102 977
Net deferred tax liability 7 364 21 101
Deferred tax asset Norway 24% (2015: 25%) 74 931 99 532Of which unrecognised 74 931 99 532
Net deferred tax asset Norway 24% 0 0Deferred tax asset China 25% 0 2 427Of which unrecognised 0 2 427
Net deferred tax asset China 25% 0 0
Net deferred tax asset Singapore 17% 0 1 018Of which unrecognised 0 1 018
Net deferred tax asset Singapore 17% 0 0
Net deferred tax asset 0 0
Net deferred tax Sweden 22% 7 364 21 101
Net deferred tax 7 364 21 101
Net deferred tax liability 7 364 21 101
42
NOTE 6. TAX
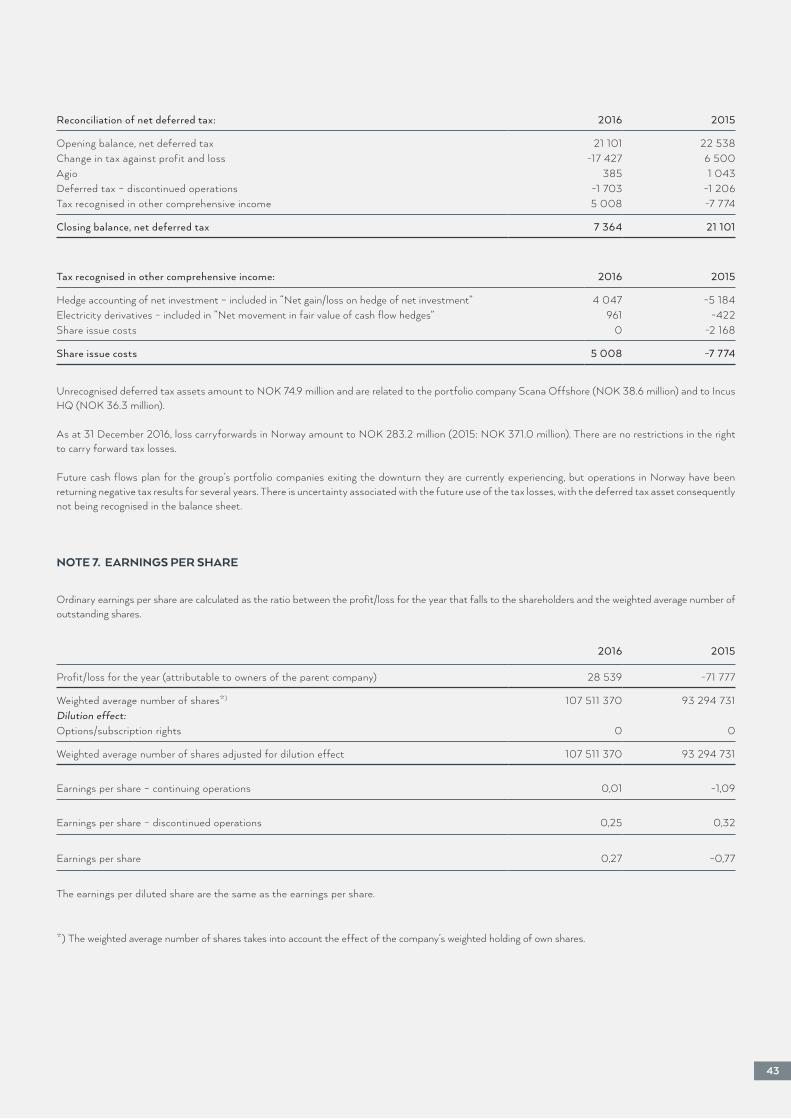
2016 2015
Profit/loss for the year (attributable to owners of the parent company) 28 539 -71 777
Weighted average number of shares*) 107 511 370 93 294 731Dilution effect:Options/subscription rights 0 0
Weighted average number of shares adjusted for dilution effect 107 511 370 93 294 731
Earnings per share – continuing operations 0,01 -1,09
Earnings per share – discontinued operations 0,25 0,32
Earnings per share 0,27 -0,77
The earnings per diluted share are the same as the earnings per share.
Ordinary earnings per share are calculated as the ratio between the profit/loss for the year that falls to the shareholders and the weighted average number of outstanding shares.
*) The weighted average number of shares takes into account the effect of the company’s weighted holding of own shares.
Unrecognised deferred tax assets amount to NOK 74.9 million and are related to the portfolio company Scana Offshore (NOK 38.6 million) and to Incus HQ (NOK 36.3 million).
As at 31 December 2016, loss carryforwards in Norway amount to NOK 283.2 million (2015: NOK 371.0 million). There are no restrictions in the right to carry forward tax losses.
Future cash flows plan for the group’s portfolio companies exiting the downturn they are currently experiencing, but operations in Norway have been returning negative tax results for several years. There is uncertainty associated with the future use of the tax losses, with the deferred tax asset consequently not being recognised in the balance sheet.
Reconciliation of net deferred tax: 2016 2015
Opening balance, net deferred tax 21 101 22 538Change in tax against profit and loss -17 427 6 500Agio 385 1 043Deferred tax – discontinued operations -1 703 -1 206Tax recognised in other comprehensive income 5 008 -7 774
Closing balance, net deferred tax 7 364 21 101
Tax recognised in other comprehensive income: 2016 2015
Hedge accounting of net investment – included in “Net gain/loss on hedge of net investment” 4 047 -5 184Electricity derivatives – included in “Net movement in fair value of cash flow hedges” 961 -422Share issue costs 0 -2 168
Share issue costs 5 008 -7 774
43
NOTE 7. EARNINGS PER SHARE
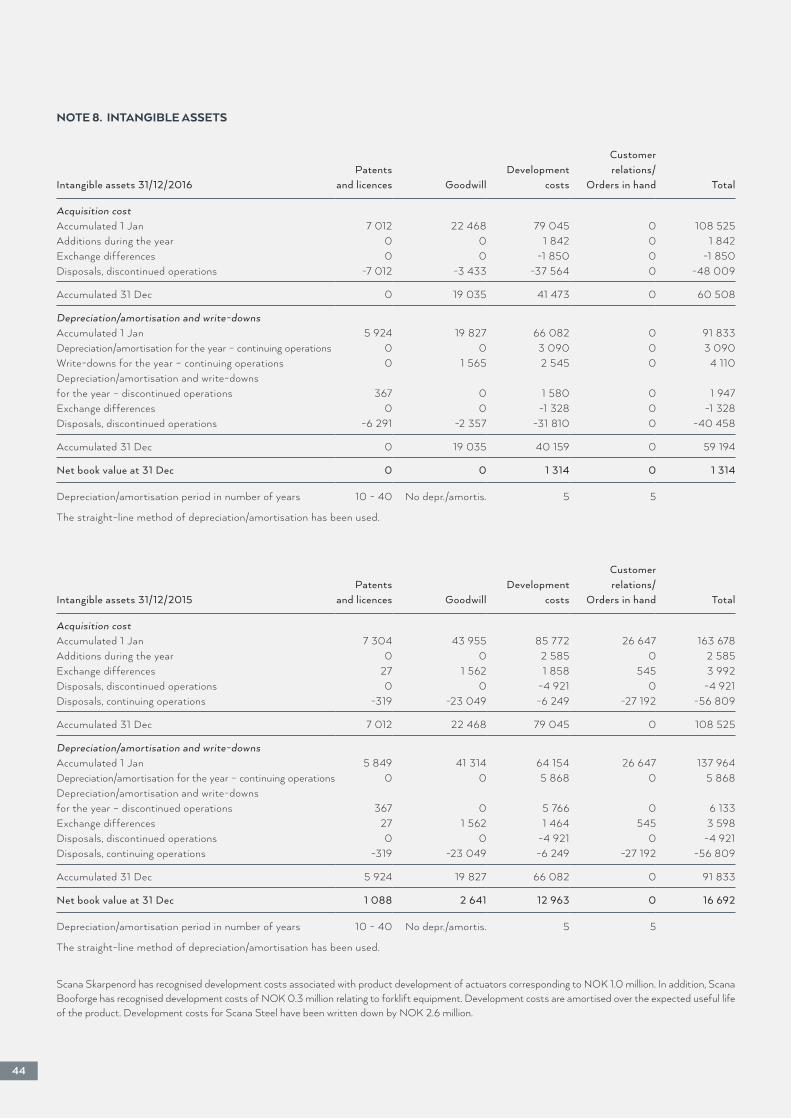
Scana Skarpenord has recognised development costs associated with product development of actuators corresponding to NOK 1.0 million. In addition, Scana Booforge has recognised development costs of NOK 0.3 million relating to forklift equipment. Development costs are amortised over the expected useful life of the product. Development costs for Scana Steel have been written down by NOK 2.6 million.
NOTE 8. INTANGIBLE ASSETS
CustomerPatents Development relations/
Intangible assets 31/12/2016 and licences Goodwill costs Orders in hand Total
Acquisition costAccumulated 1 Jan 7 012 22 468 79 045 0 108 525Additions during the year 0 0 1 842 0 1 842Exchange differences 0 0 -1 850 0 -1 850Disposals, discontinued operations -7 012 -3 433 -37 564 0 -48 009
Accumulated 31 Dec 0 19 035 41 473 0 60 508
Depreciation/amortisation and write-downsAccumulated 1 Jan 5 924 19 827 66 082 0 91 833Depreciation/amortisation for the year – continuing operations 0 0 3 090 0 3 090Write-downs for the year – continuing operations 0 1 565 2 545 0 4 110Depreciation/amortisation and write-downsfor the year – discontinued operations 367 0 1 580 0 1 947Exchange differences 0 0 -1 328 0 -1 328Disposals, discontinued operations -6 291 -2 357 -31 810 0 -40 458
Accumulated 31 Dec 0 19 035 40 159 0 59 194
Net book value at 31 Dec 0 0 1 314 0 1 314
Depreciation/amortisation period in number of years 10 - 40 No depr./amortis. 5 5
The straight-line method of depreciation/amortisation has been used.
CustomerPatents Development relations/
Intangible assets 31/12/2015 and licences Goodwill costs Orders in hand Total
Acquisition costAccumulated 1 Jan 7 304 43 955 85 772 26 647 163 678Additions during the year 0 0 2 585 0 2 585Exchange differences 27 1 562 1 858 545 3 992Disposals, discontinued operations 0 0 -4 921 0 -4 921Disposals, continuing operations -319 -23 049 -6 249 -27 192 -56 809
Accumulated 31 Dec 7 012 22 468 79 045 0 108 525
Depreciation/amortisation and write-downsAccumulated 1 Jan 5 849 41 314 64 154 26 647 137 964Depreciation/amortisation for the year – continuing operations 0 0 5 868 0 5 868Depreciation/amortisation and write-downsfor the year – discontinued operations 367 0 5 766 0 6 133Exchange differences 27 1 562 1 464 545 3 598Disposals, discontinued operations 0 0 -4 921 0 -4 921Disposals, continuing operations -319 -23 049 -6 249 -27 192 -56 809
Accumulated 31 Dec 5 924 19 827 66 082 0 91 833
Net book value at 31 Dec 1 088 2 641 12 963 0 16 692
Depreciation/amortisation period in number of years 10 - 40 No depr./amortis. 5 5
The straight-line method of depreciation/amortisation has been used.
44
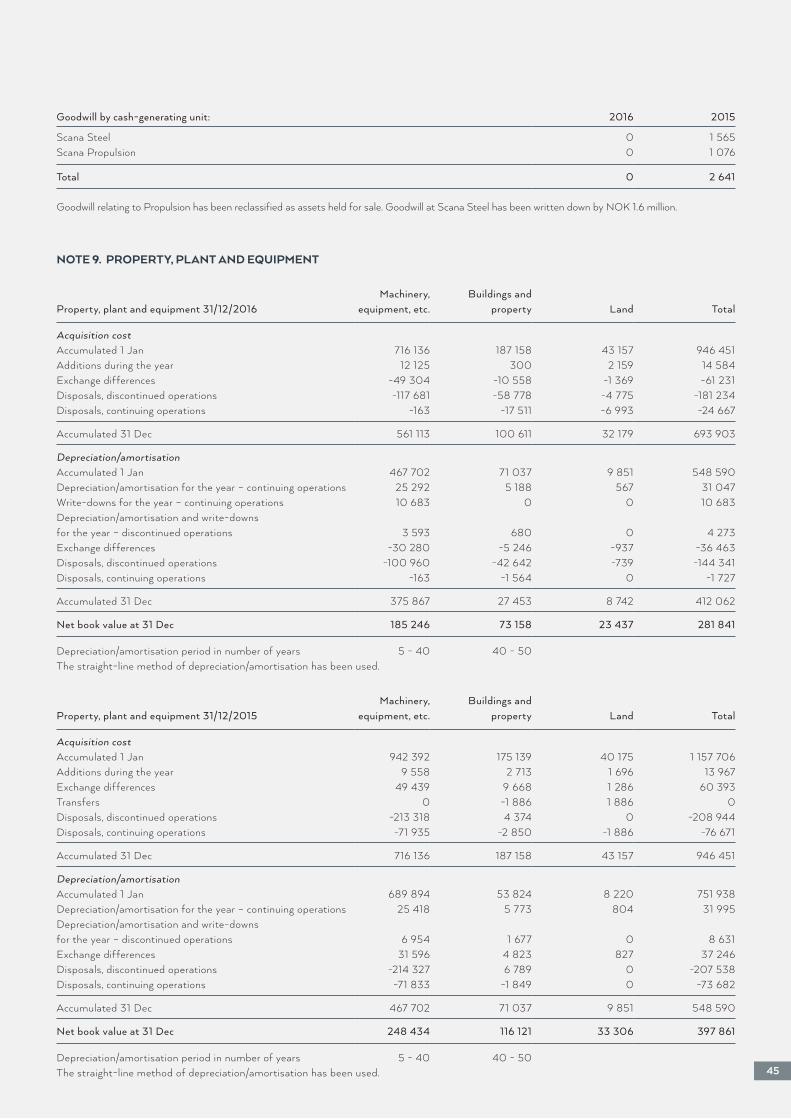
NOTE 9. PROPERTY, PLANT AND EQUIPMENT
Goodwill by cash-generating unit: 2016 2015
Scana Steel 0 1 565Scana Propulsion 0 1 076
Total 0 2 641
Machinery, Buildings andProperty, plant and equipment 31/12/2016 equipment, etc. property Land Total
Acquisition costAccumulated 1 Jan 716 136 187 158 43 157 946 451Additions during the year 12 125 300 2 159 14 584Exchange differences -49 304 -10 558 -1 369 -61 231Disposals, discontinued operations -117 681 -58 778 -4 775 -181 234Disposals, continuing operations -163 -17 511 -6 993 -24 667
Accumulated 31 Dec 561 113 100 611 32 179 693 903
Depreciation/amortisationAccumulated 1 Jan 467 702 71 037 9 851 548 590Depreciation/amortisation for the year – continuing operations 25 292 5 188 567 31 047Write-downs for the year – continuing operations 10 683 0 0 10 683Depreciation/amortisation and write-downsfor the year – discontinued operations 3 593 680 0 4 273Exchange differences -30 280 -5 246 -937 -36 463Disposals, discontinued operations -100 960 -42 642 -739 -144 341Disposals, continuing operations -163 -1 564 0 -1 727
Accumulated 31 Dec 375 867 27 453 8 742 412 062
Net book value at 31 Dec 185 246 73 158 23 437 281 841
Depreciation/amortisation period in number of years 5 - 40 40 - 50The straight-line method of depreciation/amortisation has been used.
Machinery, Buildings andProperty, plant and equipment 31/12/2015 equipment, etc. property Land Total
Acquisition costAccumulated 1 Jan 942 392 175 139 40 175 1 157 706Additions during the year 9 558 2 713 1 696 13 967Exchange differences 49 439 9 668 1 286 60 393Transfers 0 -1 886 1 886 0Disposals, discontinued operations -213 318 4 374 0 -208 944Disposals, continuing operations -71 935 -2 850 -1 886 -76 671
Accumulated 31 Dec 716 136 187 158 43 157 946 451
Depreciation/amortisationAccumulated 1 Jan 689 894 53 824 8 220 751 938Depreciation/amortisation for the year – continuing operations 25 418 5 773 804 31 995Depreciation/amortisation and write-downsfor the year – discontinued operations 6 954 1 677 0 8 631Exchange differences 31 596 4 823 827 37 246Disposals, discontinued operations -214 327 6 789 0 -207 538Disposals, continuing operations -71 833 -1 849 0 -73 682
Accumulated 31 Dec 467 702 71 037 9 851 548 590
Net book value at 31 Dec 248 434 116 121 33 306 397 861
Depreciation/amortisation period in number of years 5 - 40 40 - 50The straight-line method of depreciation/amortisation has been used. 45
Goodwill relating to Propulsion has been reclassified as assets held for sale. Goodwill at Scana Steel has been written down by NOK 1.6 million.

Depreciation period for machinery, equipment, etc.:5–10 years for office equipment, tools, vehicles and forklift trucks15–20 years for laboratory and test equipment, as well as small production equipment20–40 years for larger production machinery, electrical installations and transformers
The assets group for land includes investments in landfill sites and a dam used for cooling at Scana Steel’s production facility. The investments are depreciated over a period of five years.
Property, plant and equipment at Scana Steel have been written down by NOK 10.7 million. The calculation of the recoverable amount in the write-down was deemed to be level 3 according to the valuation hierarchy.
Property, plant and equipment are pledged in a way that means there are restrictions on disposal. This relates to companies in Norway and Sweden. The carrying amount of pledged assets is NOK 281.6 million as at 31 December 2016 (2015: NOK 397.5 million).
Financial leases of machinery are included in property, plant and equipment in the amount of NOK 10.2 million as at 31 December 2016 (2015: NOK 4.5 million).
Impairment testing – method descriptionThe group tests property, plant and equipment for each cash-generating unit (CGU) for impairment once a year or more frequently where there are any indications of a loss in value. Incus evaluates various impairment indicators in connection with impairment assessments, including the relationship between the market value on the Oslo Stock Exchange and the carrying amount. As at 31 December 2016, the market value of the company is lower than the carrying amount of equity, which indicates a possible need for the impairment of intangible assets including goodwill, as well as property, plant and equipment and other assets in the various CGUs. Several of the segments and the cash-generating units have also experienced a downturn on the market over a relatively long period.
The impairment tests estimate the utility value based on discounting of expected future cash flows. The cash flows are based on the budget and business plans determined by the management for the period 2017–2021. The estimates are based on a budgeting approach for the various cash-generating units. For the subsequent period, the model assumes a terminal growth rate which reflects the long-term inflation expectations. Revenues are based on contracts entered into, the management assessment and external information about the potential for new agreements. The estimated operating margin for the period is increased on the basis of positive market growth forecasts and whether the cost measures have an effect. The group recognises impairment loss in the income statement where the estimated recoverable amount is lower than the recognised assets for the cash-generating unit.
Recoverable amountProperty, plant and equipment are written down to the recoverable amount where the recoverable amount is lower than the carrying amount of the asset. The utility value is the present value of future cash flows which are expected to arise from an asset or cash-generating unit. The group uses impairment testing if there are indications of a loss in value. The impairment tests are performed for the cash-generating units with an indication of a possible loss in value for recognised assets in property, plant and equipment.
Scana SteelThe portfolio company Scana Steel, which is also a cash-generating unit and consists of Scana Steel AB, Scana Steel Björneborg AB and Scana Subsea AB, has identified impairment indicators for recognised property, plant and equipment in the light of declining results over several periods.
Impairment test for Scana Steel has been prepared on the basis of the method and principles described in the section above. The calculations are based on an average operating margin of 2.9 per cent. The discount rate is set to 8.2 per cent before tax. The average growth rate is set to 9.5 per cent for the period 2017–2021, with growth anticipated to be highest in the first couple of years. The growth rate has been estimated at 2 per cent in the final stage, which reflects the long-term inflation expectations in Sweden.
Scana Steel is experiencing reduced demand from the oil and gas market, a factor which, combined with a general overcapacity in the steel sector, is contributing to a challenging market situation with price pressure. Scana Steel has adjusted the cash flows downwards. The estimated cash flows that form the basis of the impairment test assume that the cost measures and the actions according to sales organisation will have the expected effect, but it is uncertain when they will have a positive effect on operations. Scana Steel expects the market to turn around, but it is uncertain when the market will do this and how high future growth will be. The cash flows used as a basis are based on the best estimate of the management and the Board of Directors. Scana Steel is of the opinion that the impairment assessment is realistic and the objectives achievable, and that the carrying amounts of property, plant and equipment are therefore justified.
Scana Steel BooforgeThe portfolio company Scana Steel Booforge, which is also a cash-generating unit and consists of the legal entity Scana Steel Booforge AB, has delivered poor results over several periods. In light of this, impairment indicators have been identified for the carrying amounts of property, plant and equipment.
Impairment test for Scana Steel Booforge has been prepared on the basis of the method and principles described in the section above. The calculations are based on an average operating margin of 3.6 per cent. The discount rate is set to 7.9 per cent before tax. The average growth rate is set to 8.0 per cent for the period 2017–2021, with growth anticipated to be highest in the first couple of years. The growth rate has been estimated at 2 per cent in the final stage, which reflects the long-term inflation expectations in Sweden.
Scana Steel Booforge is experiencing reduced demand for fork arms and heat treatment due to a challenging market situation with price pressure. Scana Steel Booforge has revised future cash flows downwards compared to 2015. The estimated cash flows that form the basis of the impairment test assume that the cost measures and the measures associated with the sales organisation will have the expected effect, but it is uncertain when they will have a positive effect on operations. Scana Steel Booforge expects the market to turn around, but it is uncertain when the market will do this and how high future growth will be. The cash flows used as a basis are based on the best estimate of the management and the Board of Directors. Scana Steel Booforge is of the opinion that the impairment assessment is realistic and the objectives achievable, and that the carrying amounts of property, plant and equipment are therefore justified.46

Sensitivity analysisSensitivity analysis in relation to impairment testing test for reasonable changes in the key assumptions. For example, a fall in the operating margin (with other assumptions remaining unchanged) at Scana Steel of more than 1.0 percentage point will result in the recoverable amount being reduced by SEK 78.5 million. An increase in the operating margin (with other assumptions remaining unchanged) of more than 1.0 percentage point will result in the recoverable amount increasing by SEK 78.5 million. An increase in the discount rate (with other assumptions remaining unchanged) of more than 1.0 percentage point will result in the recoverable amount being reduced by SEK 41.4 million; conversely, a reduction of 1.0 percentage point will result in an increase of SEK 41.4 million.
Key assumptions: Scana Steel Scana Steel Booforge
Operating margin 2.9 % 3.6 %Discount rate (nominal before tax) 8.2 % 7.9 %Rate of growth 2017–2021 9.5 % 8.0 %Annual rate of growth after 2021 (nominal) 2.0 % 2.0 %Functional currency SEK SEKRecoverable amount* (stated in the company’s functional currency) 267 166 52 201Property, plant and equipment and working capital as at 31 December 2016 (figures in functional currency) 267 166 30 719
*Recoverable amount includes working capital
Change Scana Steel Scana Steel Booforge
Operating margin 1.0 % 78 509 16 406Rate of growth 2017–2021 2.0 % 55 635 10 706Terminal growth rate 1.0 % 27 711 7 429Discount rate (nominal before tax) 1.0 % 41 438 8 312Functional currency SEK SEK
NOTE 10. PAYROLL COSTS
Payroll costs: 2016 2015
Payroll costs 165 293 208 284Employer’s contributions 48 796 61 754Pension costs 16 877 21 566Insurance 435 1 351Incentive arrangement 1 805 151Other payroll and staff costs 2 279 3 223
Total payroll costs 235 485 296 329
Of total payroll costs in 2016, NOK 0 million (2015: NOK 3.9 million) constitutes restructuring costs implemented during the year.
Average number of FTEsNorway 97 94Sweden 280 403Other 1 2
Total average number of FTEs 378 498
REMUNERATION TO KEY PERSONNEL (GROUP MANAGEMENT):
2016: PensionOther premium
benefits deposits/Name Position Salary in kind Pension Fees Total
Bjørn Torkildsen CEO 3 014 11 242 3 267Kjetil Flesjå CFO 1 572 192 112 1 876
Total remuneration to key personnel 4 586 203 354 0 5 143
47
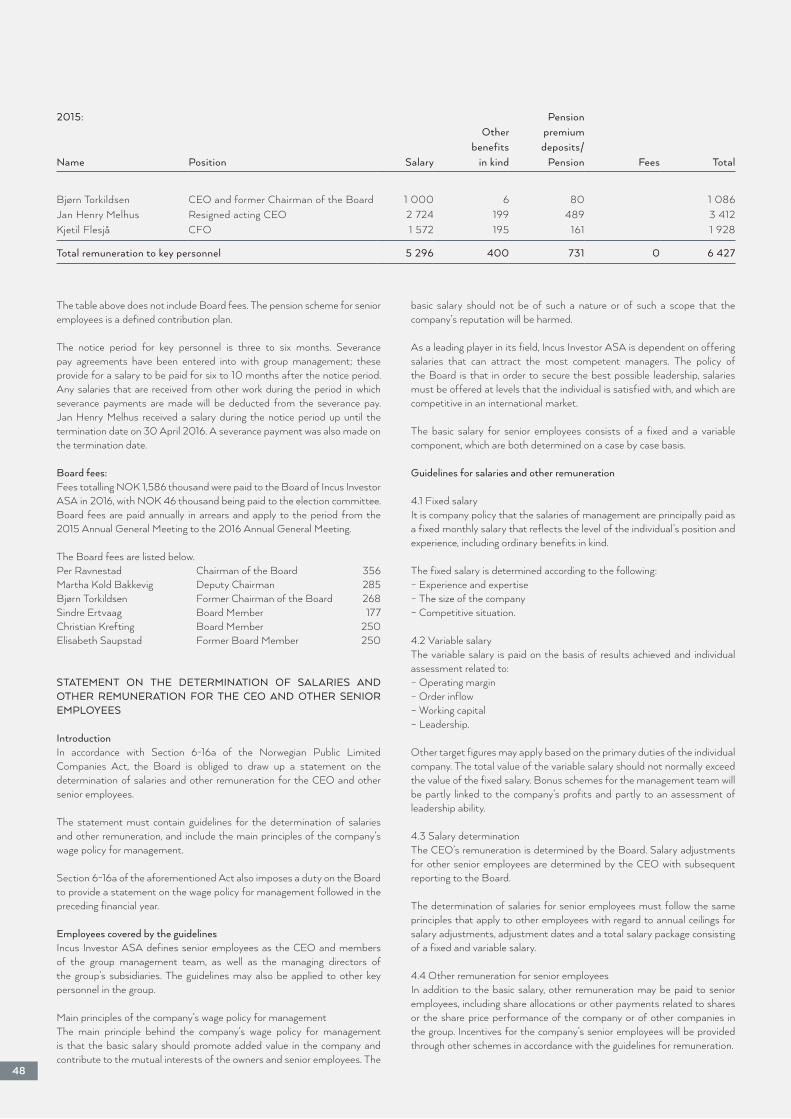
The table above does not include Board fees. The pension scheme for senior employees is a defined contribution plan.
The notice period for key personnel is three to six months. Severance pay agreements have been entered into with group management; these provide for a salary to be paid for six to 10 months after the notice period. Any salaries that are received from other work during the period in which severance payments are made will be deducted from the severance pay. Jan Henry Melhus received a salary during the notice period up until the termination date on 30 April 2016. A severance payment was also made on the termination date.
Board fees:Fees totalling NOK 1,586 thousand were paid to the Board of Incus Investor ASA in 2016, with NOK 46 thousand being paid to the election committee. Board fees are paid annually in arrears and apply to the period from the 2015 Annual General Meeting to the 2016 Annual General Meeting.
The Board fees are listed below.Per Ravnestad Chairman of the Board 356Martha Kold Bakkevig Deputy Chairman 285Bjørn Torkildsen Former Chairman of the Board 268Sindre Ertvaag Board Member 177Christian Krefting Board Member 250Elisabeth Saupstad Former Board Member 250
STATEMENT ON THE DETERMINATION OF SALARIES AND OTHER REMUNERATION FOR THE CEO AND OTHER SENIOR EMPLOYEES
IntroductionIn accordance with Section 6-16a of the Norwegian Public Limited Companies Act, the Board is obliged to draw up a statement on the determination of salaries and other remuneration for the CEO and other senior employees.
The statement must contain guidelines for the determination of salaries and other remuneration, and include the main principles of the company’s wage policy for management.
Section 6-16a of the aforementioned Act also imposes a duty on the Board to provide a statement on the wage policy for management followed in the preceding financial year.
Employees covered by the guidelinesIncus Investor ASA defines senior employees as the CEO and members of the group management team, as well as the managing directors of the group’s subsidiaries. The guidelines may also be applied to other key personnel in the group.
Main principles of the company’s wage policy for managementThe main principle behind the company’s wage policy for management is that the basic salary should promote added value in the company and contribute to the mutual interests of the owners and senior employees. The
basic salary should not be of such a nature or of such a scope that the company’s reputation will be harmed.
As a leading player in its field, Incus Investor ASA is dependent on offering salaries that can attract the most competent managers. The policy of the Board is that in order to secure the best possible leadership, salaries must be offered at levels that the individual is satisfied with, and which are competitive in an international market.
The basic salary for senior employees consists of a fixed and a variable component, which are both determined on a case by case basis.
Guidelines for salaries and other remuneration
4.1 Fixed salaryIt is company policy that the salaries of management are principally paid as a fixed monthly salary that reflects the level of the individual’s position and experience, including ordinary benefits in kind.
The fixed salary is determined according to the following:– Experience and expertise– The size of the company– Competitive situation.
4.2 Variable salaryThe variable salary is paid on the basis of results achieved and individual assessment related to:– Operating margin– Order inflow– Working capital– Leadership.
Other target figures may apply based on the primary duties of the individual company. The total value of the variable salary should not normally exceed the value of the fixed salary. Bonus schemes for the management team will be partly linked to the company’s profits and partly to an assessment of leadership ability.
4.3 Salary determinationThe CEO’s remuneration is determined by the Board. Salary adjustments for other senior employees are determined by the CEO with subsequent reporting to the Board.
The determination of salaries for senior employees must follow the same principles that apply to other employees with regard to annual ceilings for salary adjustments, adjustment dates and a total salary package consisting of a fixed and variable salary.
4.4 Other remuneration for senior employeesIn addition to the basic salary, other remuneration may be paid to senior employees, including share allocations or other payments related to shares or the share price performance of the company or of other companies in the group. Incentives for the company’s senior employees will be provided through other schemes in accordance with the guidelines for remuneration.
48
2015: PensionOther premium
benefits deposits/Name Position Salary in kind Pension Fees Total
Bjørn Torkildsen CEO and former Chairman of the Board 1 000 6 80 1 086Jan Henry Melhus Resigned acting CEO 2 724 199 489 3 412Kjetil Flesjå CFO 1 572 195 161 1 928
Total remuneration to key personnel 5 296 400 731 0 6 427
4.5 Pension schemes and severance pay arrangementsPension plans should in principle be the same for managers as those generally determined for employees of the company.
Severance pay arrangements that are established upon departure from the company will be viewed in conjunction with the mutual option to terminate the employment relationship and other restrictive clauses in the individual’s contract of employment.
Severance pay arrangements will in principle be subject to deductions for income earned elsewhere.
Consequences for the company and shareholdersThe wage policy for management in the financial year 2016 has been implemented in line with the above guidelines. The Board believes that the consequence of the guidelines is positive for the company and shareholders.
Incentive arrangementThe incentive-based payment provides an entitlement to a total bonus for the management of Incus and Converto of 12 per cent of any increase in the value of the shares in the company over three years in excess of an annual increase in value of 8 per cent.• Bjørn Torkildsen will be entitled to up to 4.8 per cent• Converto will be entitled to up to 4.8 per cent• Other key persons as specified by the CEO may be entitled to up to 2.4
per cent.
The incentive arrangement is based on a share price for the company of NOK 1.
The arrangement applies at present to Bjørn Torkildsen and Converto from 1 September 2015 until 31 August 2018. The CEO must still be employed at the end of this period in order to be entitled to a success fee. However, the CEO still has the right to a success fee at the end of the period if his conditions of employment have been concluded if this is due to the company having dismissed the CEO, provided that the dismissal is not due to the employee’s own circumstances constituting good cause for dismissal. The agreement applies correspondingly to Converto.
The arrangement may be settled in cash, but the company can choose to settle up to 50 per cent of the success fee in shares after the expiry date on 31 August 2018.
The value of the incentive agreement has been determined by means of a Monte Carlo simulation, which is a stochastic simulation method that can be used to generate future share prices.
Based on the simulations, this gives an indicative total option value of NOK 8.8 million, allocated as follows: The value of allotted options is allocated over the agreed period during which the employee earns the right to receive the options, or when services are purchased from external parties over the service period it is agreed that the share disbursement will cover. As at De-cember 2016, provisions of NOK 3.9 million had been made for the arrange-ment. NOK 3.6 million was expensed in 2016 for the incentive arrangement.
NOTE 11. PENSION OBLIGATIONS
In accordance with Section 7-30a of the Norwegian Accounting Act, the companies in Norway are obliged to have a company pension plan in line with the Norwegian Act on Compulsory Occupational Pensions, and the companies have a pension plan that meets these requirements.
Defined benefit plan in NorwayThe group’s Norwegian companies are covered by a contractual pension scheme. This scheme covers 105 individuals as at 31 December 2016 (2015: 84 individuals).
For accounting purposes, the scheme should be regarded as a defined benefit multi-employer plan. The group is unable to identify its share of the scheme’s underlying financial position and results with a sufficient level of reliability, and in light of this the scheme is recognised as a defined contribution plan. This means that the obligations from the contractual pension scheme have not been recognised. Premiums for the scheme are expensed as they accrue.
Defined contribution plan in NorwayCompanies in Norway have defined contribution plans. The defined contribution plans cover all employees over the age of 20 working more than 20 per cent of a full-time position. The contributions represent 4–5 per cent of the annual salary between 1 and 6 base amounts and 8 per cent between 6 and 12 base amounts. The pension assets are invested in funds, administered by an insurance company and managed by the employee. As at 31 December 2016, the plans had 99 members (2015: 99 members).
There is a supplementary defined contribution pension for senior employees. Prepaid pension costs are recognised as non-current receivables and the liabilities are recognised as non-current liabilities. As at 31 December 2016, NOK 906 thousand has been recognised in prepaid pension costs/pension obligations (2015: NOK 596 thousand).
Pension schemes in SwedenThere are two pension schemes in Sweden, an ordinary defined contribution
plan and a defined benefit multi-employer plan that is recognised as a defined contribution plan.
The defined benefit plans are organised as multi-employer plans and are insured with Alecta. The necessary information for recognising the plans as defined benefit plans is not available. This is why the group has recognised the scheme as a contribution-based scheme. The reason for the lack of adequate information to recognise the scheme as a defined benefit scheme is that Alecta does not possess information on the distribution of earnings of pension rights between the different employers and is therefore not able to carry out a precise and reliable distribution of assets and liabilities to the respective employers. Nor does Alecta have any rules in place for how to treat any surplus or deficit that may arise. This is why the group has recognised the scheme as a contribution-based scheme.
Alecta estimates the group’s expected contribution to the Alecta defined benefit plan in 2016 to be NOK 4.6 million (estimate for 2015 was NOK 6.6 million). The defined benefit multi-employer plan covers 61 of 258 employees (2015: 83 of 326 employees).
The collective financing ratio measures the distribution of assets in relation to the insurance commitment. The insurance commitment consists of guaranteed commitments and a bonus distributed to insured parties and policyholders, calculated on the basis of Alecta’s underwriting methods and assumptions, which are not the same as the methods and assumptions used to value defined benefit pensions in accordance with IAS 19.
According to Alecta’s financing policy for defined benefit pensions, the level of the collective financing ratio may vary between 125 and 155 per cent. If the level deviates from the normal level, action must be taken to bring the financing ratio back to the normal level. When there is a low financing ratio, one measure might be to increase the agreed price for new subscriptions and extend the existing benefits. When there is a high financing ratio, one measure might be to introduce premium reductions. Alecta’s financing ratio at the end of 2016 was 142 per cent (2015: 148 per cent).
49
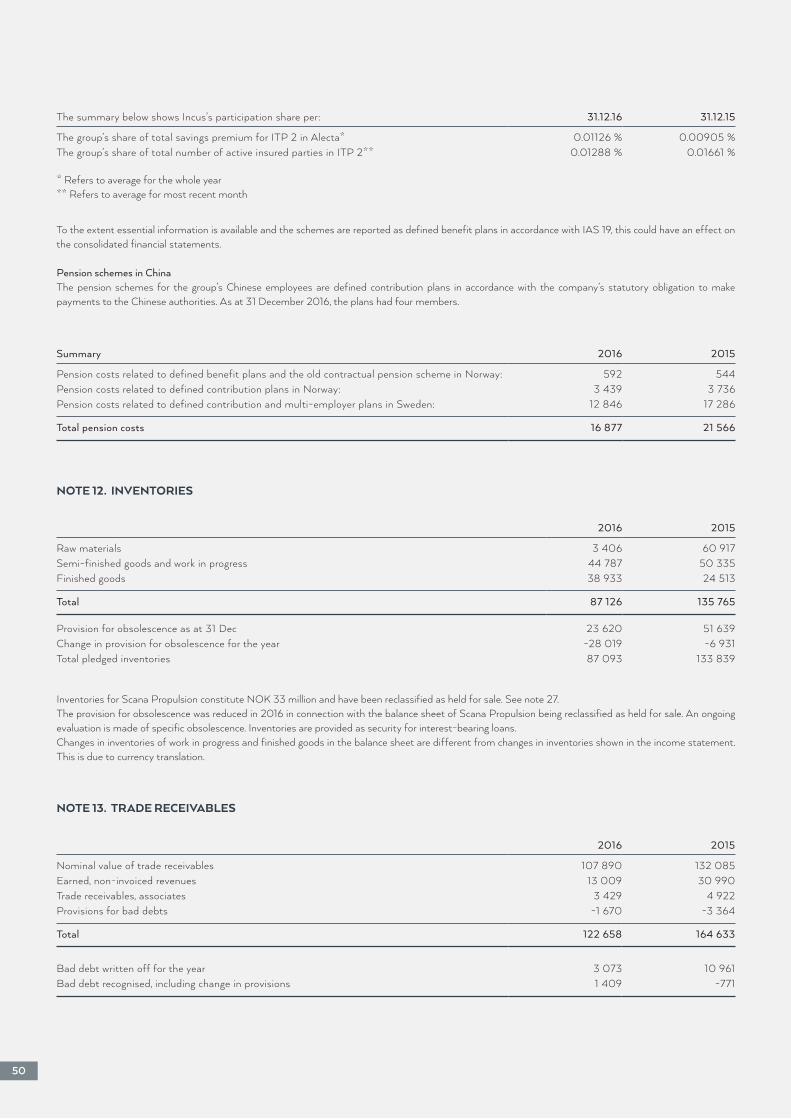
To the extent essential information is available and the schemes are reported as defined benefit plans in accordance with IAS 19, this could have an effect on the consolidated financial statements.
Pension schemes in ChinaThe pension schemes for the group’s Chinese employees are defined contribution plans in accordance with the company’s statutory obligation to make payments to the Chinese authorities. As at 31 December 2016, the plans had four members.
Summary 2016 2015
Pension costs related to defined benefit plans and the old contractual pension scheme in Norway: 592 544Pension costs related to defined contribution plans in Norway: 3 439 3 736Pension costs related to defined contribution and multi-employer plans in Sweden: 12 846 17 286
Total pension costs 16 877 21 566
2016 2015
Raw materials 3 406 60 917Semi-finished goods and work in progress 44 787 50 335Finished goods 38 933 24 513
Total 87 126 135 765
Provision for obsolescence as at 31 Dec 23 620 51 639Change in provision for obsolescence for the year -28 019 -6 931Total pledged inventories 87 093 133 839
Inventories for Scana Propulsion constitute NOK 33 million and have been reclassified as held for sale. See note 27.The provision for obsolescence was reduced in 2016 in connection with the balance sheet of Scana Propulsion being reclassified as held for sale. An ongoing evaluation is made of specific obsolescence. Inventories are provided as security for interest-bearing loans.Changes in inventories of work in progress and finished goods in the balance sheet are different from changes in inventories shown in the income statement. This is due to currency translation.
2016 2015
Nominal value of trade receivables 107 890 132 085Earned, non-invoiced revenues 13 009 30 990Trade receivables, associates 3 429 4 922Provisions for bad debts -1 670 -3 364
Total 122 658 164 633
Bad debt written off for the year 3 073 10 961Bad debt recognised, including change in provisions 1 409 -771
* Refers to average for the whole year** Refers to average for most recent month
The summary below shows Incus’s participation share per: 31.12.16 31.12.15
The group’s share of total savings premium for ITP 2 in Alecta* 0.01126 % 0.00905 %The group’s share of total number of active insured parties in ITP 2** 0.01288 % 0.01661 %
50
NOTE 12. INVENTORIES
NOTE 13. TRADE RECEIVABLES
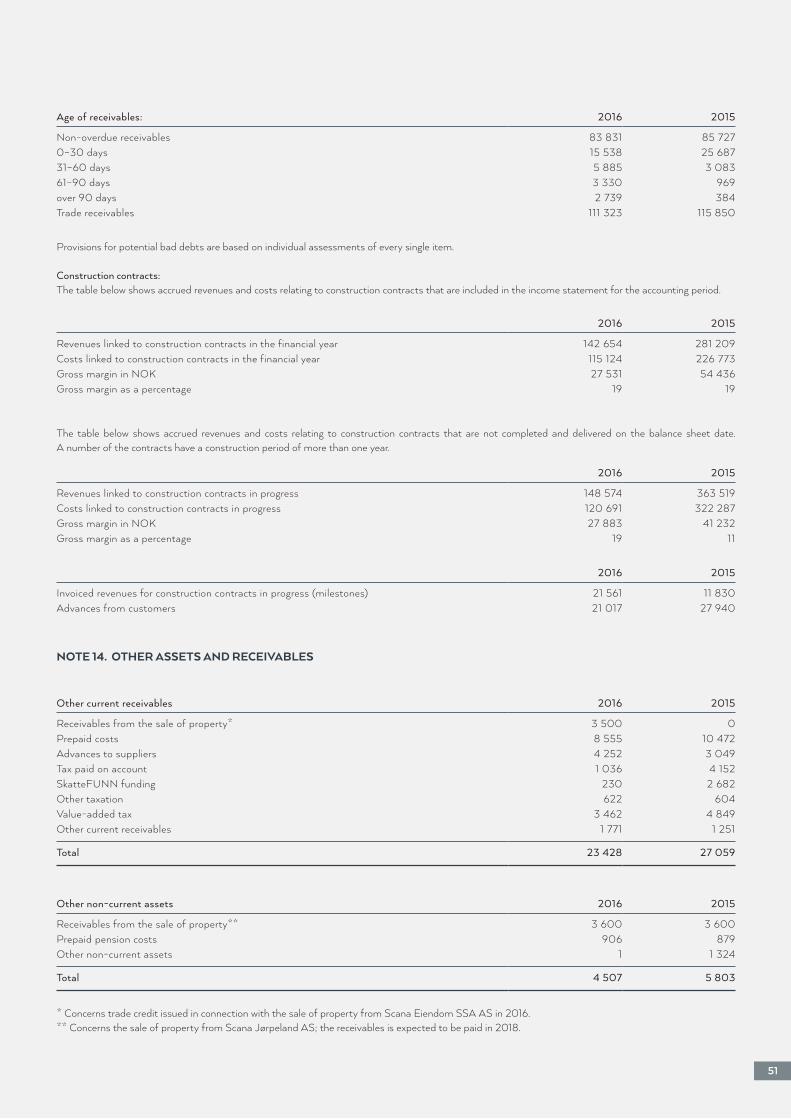
Provisions for potential bad debts are based on individual assessments of every single item.
Construction contracts:The table below shows accrued revenues and costs relating to construction contracts that are included in the income statement for the accounting period.
Age of receivables: 2016 2015
Non-overdue receivables 83 831 85 7270–30 days 15 538 25 68731–60 days 5 885 3 08361–90 days 3 330 969over 90 days 2 739 384Trade receivables 111 323 115 850
2016 2015
Revenues linked to construction contracts in the financial year 142 654 281 209Costs linked to construction contracts in the financial year 115 124 226 773Gross margin in NOK 27 531 54 436Gross margin as a percentage 19 19
2016 2015
Invoiced revenues for construction contracts in progress (milestones) 21 561 11 830Advances from customers 21 017 27 940
The table below shows accrued revenues and costs relating to construction contracts that are not completed and delivered on the balance sheet date. A number of the contracts have a construction period of more than one year.
2016 2015
Revenues linked to construction contracts in progress 148 574 363 519Costs linked to construction contracts in progress 120 691 322 287Gross margin in NOK 27 883 41 232Gross margin as a percentage 19 11
Other current receivables 2016 2015
Receivables from the sale of property* 3 500 0Prepaid costs 8 555 10 472Advances to suppliers 4 252 3 049Tax paid on account 1 036 4 152SkatteFUNN funding 230 2 682Other taxation 622 604Value-added tax 3 462 4 849Other current receivables 1 771 1 251
Total 23 428 27 059
Other non-current assets 2016 2015
Receivables from the sale of property** 3 600 3 600Prepaid pension costs 906 879Other non-current assets 1 1 324
Total 4 507 5 803
* Concerns trade credit issued in connection with the sale of property from Scana Eiendom SSA AS in 2016.** Concerns the sale of property from Scana Jørpeland AS; the receivables is expected to be paid in 2018.
51
NOTE 14. OTHER ASSETS AND RECEIVABLES
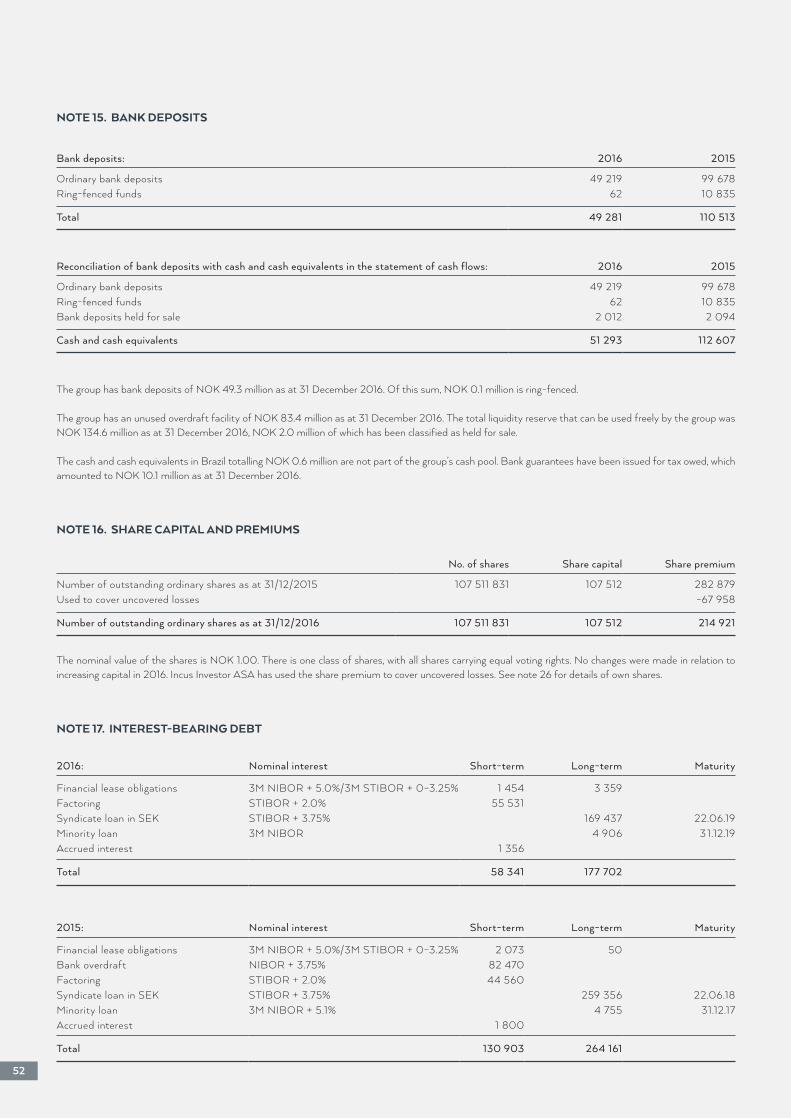
The group has bank deposits of NOK 49.3 million as at 31 December 2016. Of this sum, NOK 0.1 million is ring-fenced.
The group has an unused overdraft facility of NOK 83.4 million as at 31 December 2016. The total liquidity reserve that can be used freely by the group was NOK 134.6 million as at 31 December 2016, NOK 2.0 million of which has been classified as held for sale.
The cash and cash equivalents in Brazil totalling NOK 0.6 million are not part of the group’s cash pool. Bank guarantees have been issued for tax owed, which amounted to NOK 10.1 million as at 31 December 2016.
Bank deposits: 2016 2015
Ordinary bank deposits 49 219 99 678Ring-fenced funds 62 10 835
Total 49 281 110 513
No. of shares Share capital Share premium
Number of outstanding ordinary shares as at 31/12/2015 107 511 831 107 512 282 879Used to cover uncovered losses -67 958
Number of outstanding ordinary shares as at 31/12/2016 107 511 831 107 512 214 921
Reconciliation of bank deposits with cash and cash equivalents in the statement of cash flows: 2016 2015
Ordinary bank deposits 49 219 99 678Ring-fenced funds 62 10 835Bank deposits held for sale 2 012 2 094
Cash and cash equivalents 51 293 112 607
2016: Nominal interest Short-term Long-term Maturity
Financial lease obligations 3M NIBOR + 5.0%/3M STIBOR + 0–3.25% 1 454 3 359Factoring STIBOR + 2.0% 55 531Syndicate loan in SEK STIBOR + 3.75% 169 437 22.06.19Minority loan 3M NIBOR 4 906 31.12.19Accrued interest 1 356
Total 58 341 177 702
2015: Nominal interest Short-term Long-term Maturity
Financial lease obligations 3M NIBOR + 5.0%/3M STIBOR + 0–3.25% 2 073 50Bank overdraft NIBOR + 3.75% 82 470Factoring STIBOR + 2.0% 44 560Syndicate loan in SEK STIBOR + 3.75% 259 356 22.06.18Minority loan 3M NIBOR + 5.1% 4 755 31.12.17Accrued interest 1 800
Total 130 903 264 161
52
NOTE 15. BANK DEPOSITS
NOTE 16. SHARE CAPITAL AND PREMIUMS
NOTE 17. INTEREST-BEARING DEBT
The nominal value of the shares is NOK 1.00. There is one class of shares, with all shares carrying equal voting rights. No changes were made in relation to increasing capital in 2016. Incus Investor ASA has used the share premium to cover uncovered losses. See note 26 for details of own shares.
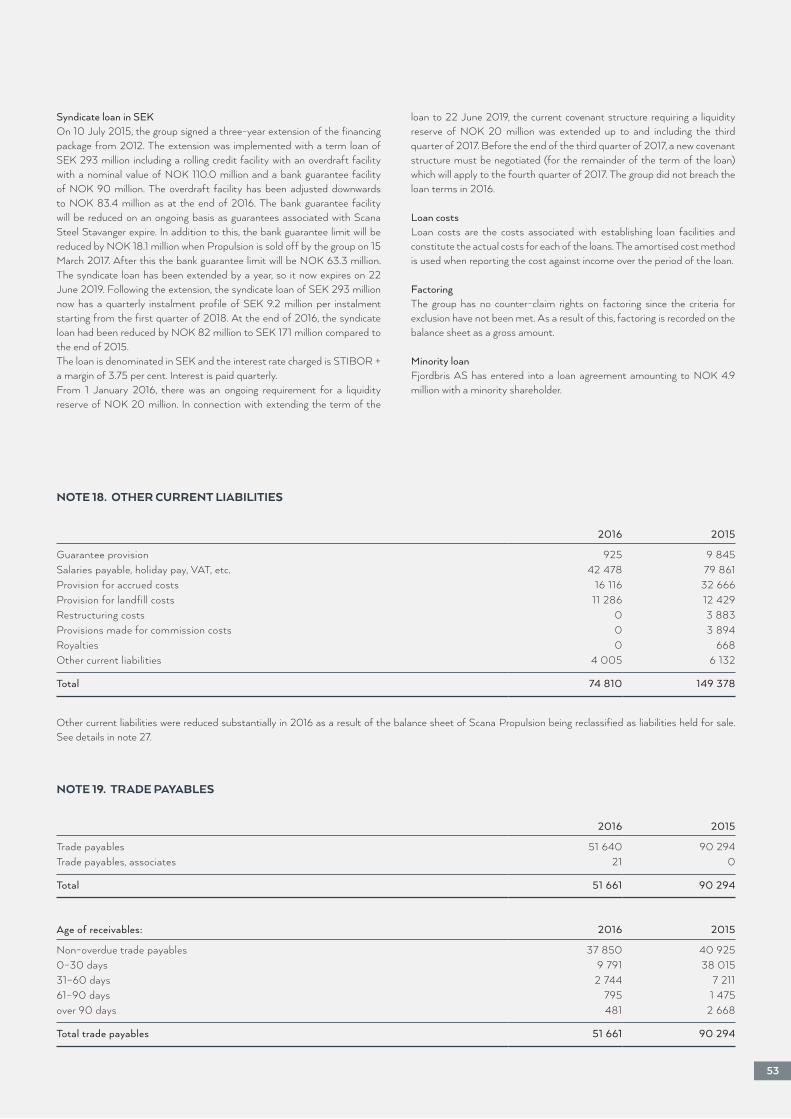
Syndicate loan in SEKOn 10 July 2015, the group signed a three-year extension of the financing package from 2012. The extension was implemented with a term loan of SEK 293 million including a rolling credit facility with an overdraft facility with a nominal value of NOK 110.0 million and a bank guarantee facility of NOK 90 million. The overdraft facility has been adjusted downwards to NOK 83.4 million as at the end of 2016. The bank guarantee facility will be reduced on an ongoing basis as guarantees associated with Scana Steel Stavanger expire. In addition to this, the bank guarantee limit will be reduced by NOK 18.1 million when Propulsion is sold off by the group on 15 March 2017. After this the bank guarantee limit will be NOK 63.3 million. The syndicate loan has been extended by a year, so it now expires on 22 June 2019. Following the extension, the syndicate loan of SEK 293 million now has a quarterly instalment profile of SEK 9.2 million per instalment starting from the first quarter of 2018. At the end of 2016, the syndicate loan had been reduced by NOK 82 million to SEK 171 million compared to the end of 2015.The loan is denominated in SEK and the interest rate charged is STIBOR + a margin of 3.75 per cent. Interest is paid quarterly.From 1 January 2016, there was an ongoing requirement for a liquidity reserve of NOK 20 million. In connection with extending the term of the
loan to 22 June 2019, the current covenant structure requiring a liquidity reserve of NOK 20 million was extended up to and including the third quarter of 2017. Before the end of the third quarter of 2017, a new covenant structure must be negotiated (for the remainder of the term of the loan) which will apply to the fourth quarter of 2017. The group did not breach the loan terms in 2016.
Loan costsLoan costs are the costs associated with establishing loan facilities and constitute the actual costs for each of the loans. The amortised cost method is used when reporting the cost against income over the period of the loan.
FactoringThe group has no counter-claim rights on factoring since the criteria for exclusion have not been met. As a result of this, factoring is recorded on the balance sheet as a gross amount.
Minority loanFjordbris AS has entered into a loan agreement amounting to NOK 4.9 million with a minority shareholder.
2016 2015
Guarantee provision 925 9 845Salaries payable, holiday pay, VAT, etc. 42 478 79 861Provision for accrued costs 16 116 32 666Provision for landfill costs 11 286 12 429Restructuring costs 0 3 883Provisions made for commission costs 0 3 894Royalties 0 668Other current liabilities 4 005 6 132
Total 74 810 149 378
Other current liabilities were reduced substantially in 2016 as a result of the balance sheet of Scana Propulsion being reclassified as liabilities held for sale. See details in note 27.
53
NOTE 18. OTHER CURRENT LIABILITIES
NOTE 19. TRADE PAYABLES
2016 2015
Trade payables 51 640 90 294Trade payables, associates 21 0
Total 51 661 90 294
Age of receivables: 2016 2015
Non-overdue trade payables 37 850 40 9250–30 days 9 791 38 01531–60 days 2 744 7 21161–90 days 795 1 475over 90 days 481 2 668
Total trade payables 51 661 90 294
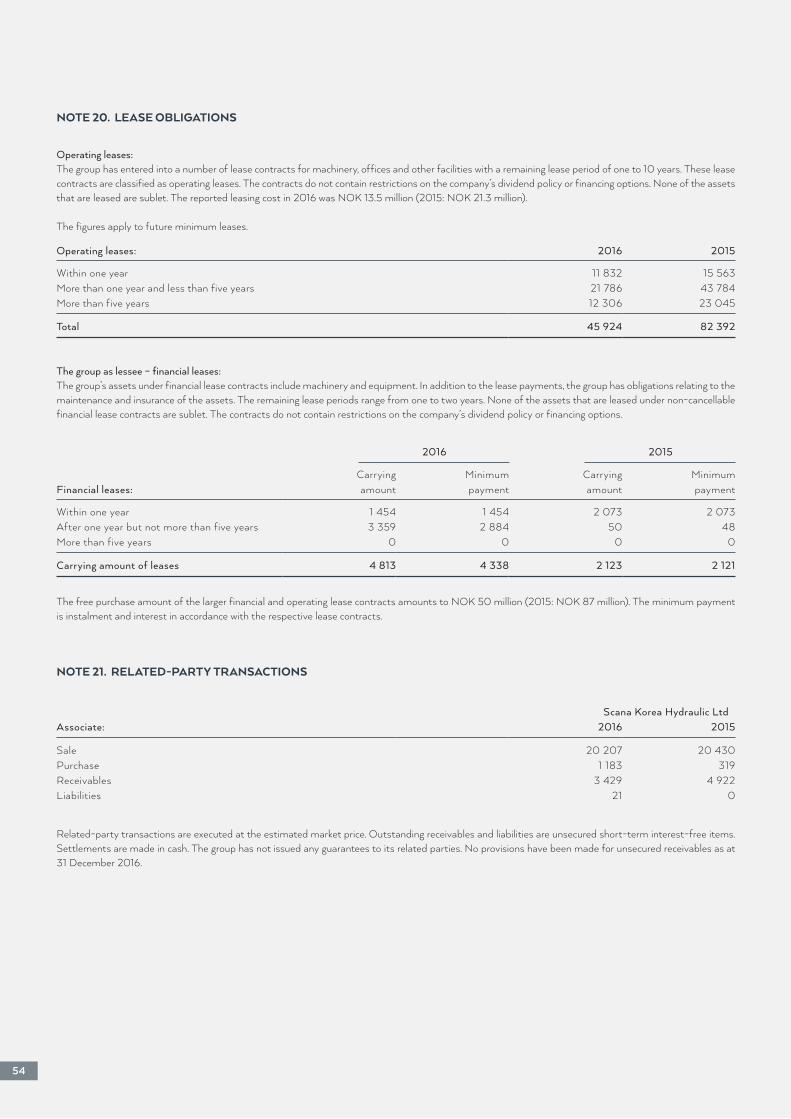
Operating leases:The group has entered into a number of lease contracts for machinery, offices and other facilities with a remaining lease period of one to 10 years. These lease contracts are classified as operating leases. The contracts do not contain restrictions on the company’s dividend policy or financing options. None of the assets that are leased are sublet. The reported leasing cost in 2016 was NOK 13.5 million (2015: NOK 21.3 million).
The figures apply to future minimum leases.
Operating leases: 2016 2015
Within one year 11 832 15 563More than one year and less than five years 21 786 43 784More than five years 12 306 23 045
Total 45 924 82 392
The group as lessee – financial leases:The group’s assets under financial lease contracts include machinery and equipment. In addition to the lease payments, the group has obligations relating to the maintenance and insurance of the assets. The remaining lease periods range from one to two years. None of the assets that are leased under non-cancellable financial lease contracts are sublet. The contracts do not contain restrictions on the company’s dividend policy or financing options.
2016 2015
Carrying Minimum Carrying MinimumFinancial leases: amount payment amount payment
Within one year 1 454 1 454 2 073 2 073After one year but not more than five years 3 359 2 884 50 48More than five years 0 0 0 0
Carrying amount of leases 4 813 4 338 2 123 2 121
The free purchase amount of the larger financial and operating lease contracts amounts to NOK 50 million (2015: NOK 87 million). The minimum payment is instalment and interest in accordance with the respective lease contracts.
54
NOTE 20. LEASE OBLIGATIONS
NOTE 21. RELATED-PARTY TRANSACTIONS
Related-party transactions are executed at the estimated market price. Outstanding receivables and liabilities are unsecured short-term interest-free items. Settlements are made in cash. The group has not issued any guarantees to its related parties. No provisions have been made for unsecured receivables as at 31 December 2016.
Scana Korea Hydraulic LtdAssociate: 2016 2015
Sale 20 207 20 430Purchase 1 183 319Receivables 3 429 4 922Liabilities 21 0
Centralised risk managementIncus has a centralised finance function. The most important task is to secure the group’s room to manoeuvre in the short and long term. The hedging of currency, interest and electricity price exposure is carried out in accordance with the group’s policy and routines. This is done centrally by the Finance Department on the basis of the needs reported by the operational units.
Financial riskThe group’s activities are exposed to financial market risk, which mainly encompasses exchange rate risk, interest rate risk and fluctuations in the price of electricity. Furthermore, the group – primarily the steel area – is also exposed to trends in raw material prices such as scrap steel and alloys. Incus aims to reduce the risk associated with currency, interest and electricity prices by means of hedging instruments. The group has chosen not to hedge against any fluctuations in other raw material prices, since Incus believes that any increases in these prices can mostly be offset by increased sale prices, albeit with a certain time lag.
Currency riskThe group is exposed to exchange rate fluctuations since large parts of production, purchasing and sales take place abroad and/or in foreign currency. The group’s internal banking function continuously monitors and reports the group’s currency positions. The currency risk is estimated for each foreign currency and takes account of assets, liabilities and probable purchases and sales in the relevant currency. The company tries to reduce the net currency risk by means of forward contracts, deposits and/or borrowings in the relevant currencies. The main risks associated with currency in the group are related to external financing, future sales payments and the group’s assets in foreign subsidiaries.
Interest rate riskThe group’s interest rate risk is mainly associated with the group’s debt portfolio. The risk is managed at group level. The group aims to offset major effects linked to changes in the market rate. Up until October 2016 Incus had therefore tied parts of the debt portfolio to fixed interest rates in order to curb short-term fluctuations in the market rate.Previous interest rate hedging ran until 25 October 2016. Incus has a future goal of financing each portfolio company separately, and has therefore decided not to take out a new interest rate hedge.
Price risk of electricityThe group has major electricity costs in relation to the production of its goods, primarily in the steel segment. Incus protects itself from fluctuations in electricity prices by buying electricity derivatives for the portfolio companies Scana Steel and Scana Booforge. The group has an agreement with Vattenfall AB/Vattenfall Energy Trading AB to administer Incus’s electricity derivatives with the aim of hedging future electricity prices in Sweden. The expected power consumption is hedged with a portion of future power consumption.
Liquidity riskSecuring good financial room to manoeuvre is an important aim of the group. The group is always working to reduce the financial risk, including through close monitoring of liquidity development and programmes to reduce working capital.The group has controlled the liquidity situation in the short and long term by monitoring and maintaining active dialogue with the portfolio companies. The group has bank deposits of NOK 49.3 million as at 31 December 2016. See also note 15 regarding bank deposits. At the end of 2016 the group had unutilised credit facilities in the amount of NOK 83.4 million.The financing agreement with the bank syndicate, including overdraft and guarantee facilities, expires on 22 June 2019. The loan agreement has been extended by 12 months relative to the original expiry date of 22 June 2018.
Credit riskThe group has guidelines for ensuring that orders are not entered into with customers who have had major payment problems and for ensuring that outstanding amounts do not exceed defined credit limits.The group regards its greatest risk exposure to be the carrying amount of trade receivables (see note 13) and other receivables (see note 14).The operating companies in Sweden have credit insurance with Euler Hermes Norge for some of the trade receivables in order to cover the exposure to credit risk. Otherwise, the majority of the deliveries to the portfolio companies Scana Steel, Scana Skarpenord and Scana Offshore are to financially sound international customers. The shipyards in China and South Korea are to a great extent owned by the state. Within the portfolio companies Scana Skarpenord and Scana Offshore, service and after sales services are provided to major global players, with the credit risk considered limited here. Increased activity is expected in the long term within new projects and expansions. Historic losses are limited.Risk exposure is represented by the carrying amount of the financial assets (shown in note 23), including derivatives, on the balance sheet. The counterparty in currency contracts is DnB. The credit risk associated with derivatives is considered to be low.The table overleaf shows the sensitivity analysis for currency risk. Tax effects are not taken into consideration in the calculations.
55
NOTE 22. FINANCIAL RISK
Effect on Effect on other Change in NOK profit before tax comprehensive income
2016 5 % 18 805 1 527-5 % -18 805 -1 527
2015 5 % 22 410 5 134-5 % -22 410 -5 134
Hedging of currency riskThe group is subject to currency exposure in the form of net investment in its Swedish subsidiaries. This net investment is defined as Incus’s share of the subsidiaries’ equity and long-term loans to Swedish businesses. In order to protect against major currency fluctuations, Incus has taken out a loan in SEK. In accordance with the rules on the hedge accounting of net investments, currency gains/losses on this loan are recognised against other comprehensive income to the degree that the loan is offset by the net investment.
Since a significant part of the group’s sales are carried out in foreign currencies, Incus is exposed to exchange rate fluctuations during the period from the time the sales contract is entered into up until final payment by the customer. There is also a risk associated with future payments in foreign currency. In order to secure the group’s net cash flow in the individual currencies, forward contracts are entered into that offset part of the estimated future incoming/outgoing pay-ments. A NOK +12.1 million loss on hedging of net investments was recognised for 2016 (2015: NOK -14.0 million) and NOK -17.5 million in foreign currency translation differences (2015: NOK 18.5 million). Translation differences for discontinued operations that have been reclassified are dealt with in note 27.
A summary of open currency contracts as at 31 December 2016 is shown below:
Unrealised Currency Net Nominal value Maturity gain/loss (-)
EUR Sale 1 000 2017 4
Total 4
Hedging of interest rate riskUp until 25 October 2016 floating interest-bearing liabilities were hedged against changes in the interest rate level by entering into interest rate swaps. As at 31 December 2016, the syndicate loan is not hedged at a fixed interest rate. The group has chosen not to enter into a new interest rate swap.
Hedging of fluctuations in electricity pricesThe group has major electricity costs in relation to the production of its goods. Incus protects itself from fluctuations in electricity prices by buying electricity derivatives for its Swedish subsidiaries. The group has an agreement with Vattenfall AB/Vattenfall Energy Trading AB to administer Incus’s electricity derivatives with the aim of hedging future electricity prices. The expected power consumption is hedged with a portion of this. The value of electricity derivatives is calculated on the basis of the difference between the agreed future electricity price and the market’s forward prices on the valuation date, multiplied by the hedged volume. The change in the fair value of electricity derivatives is recognised in other comprehensive income to the degree it satisfies the effectiveness requirements for hedge accounting in accordance with IAS 39. The ineffective portion of the changes in value is recognised in the income statement.
Unrealised Currency Net Nominal value Maturity gain/loss (-)
USD Sale 2 500 2016 -791EUR Sale 1 000 2016 -323
Total -1 114
A summary of all open currency contracts as at 31 December 2015 is shown below:
56
Sensitivity analysis
Currency riskThe balance sheet items that have currency effects are currency contracts, syndicate loans, trade receivables, trade payables and bank deposits. The table shows the effects of changes in the Norwegian krone (NOK) against foreign currency. If the NOK increases by 5 per cent against foreign currency, this will have a positive effect on profit linked to net assets of NOK 18.8 million. Correspondingly, if the NOK weakens against foreign currency, the effect on profit is negative. A change of 10 per cent will have an effect of NOK 37.6 million.
The total currency exposure as at 31 December 2016 consists of the following: For the column “Effect on profit before tax”, NOK/SEK represents 90% of the amount. This is because the group’s financing mainly takes place in SEK. NOK/EUR also represents 7% of the currency exposure that is mainly associated with operations. In the column “Effect on other comprehensive income”, NOK/EUR also represents 87% of the currency exposure that is mainly associated with operations.
Interest rate risk Sensitivity analysis related to the Group’s interest rate exposure are based on twelve months is as follows. If an interest rate increases by 1% point will result in a decrease in profit of NOK 2.4 million. An interest rate reduction by 1% point will increase profit before tax by NOK 2.4 million.
NOTE 23. FINANCIAL INSTRUMENTS
On the settlement of electricity derivatives, Incus receives a settlement amount from Vattenfall based on the difference between the agreed price in accordance with the electricity contracts and the price Incus has paid for its ongoing electricity consumption. This amount is recognised as other operating expenses in such a way that the expensed electricity consumption is based on the hedged electricity prices at all times.
The table below shows the effects on the income statement and the balance sheet. The figures are pre-tax.
Electricity derivatives: 2016 2015
Fair value as at 31 Dec -176 -7 668Recognised against other comprehensive income during the period 98 -5 324Hedging instruments removed from other comprehensive income during the period -274 -2 345
57
As at 31.12.16 2017.1Q 2017.2Q 2017.3Q 2017.4Q 2018 2019 2020 <
Bank overdraft 0 0Financial leases -4 813 -364 -364 -364 -364 -891 -939 -1 529Factoring -55 531Syndicate loan -169 437 -34 624 -134 813Minority loan -4 906 -4 906Trade payables -51 661 -51 661Forward contracts, derivatives -4 083Interest payments -1 356 -1 600 -1 600 -1 600 -1 600 -5 589 -2 226
Total payments made -53 625 -1 964 -1 964 -1 964 -46 009 -137 979 -1 529
As at 31.12.15 2016.1Q 2016.2Q 2016.3Q 2016.4Q 2017 2018 2019 <
Bank overdraft -82 470 -82 470Financial leases -2 123 -518 -518 -518 -518 -50 0 0Factoring -44 560Syndicate loan -259 355 -61 384 -197 971Minority loan -4 755 -4 755Trade payables -90 294 -90 294Forward contracts, derivatives -15 501Interest payments -1 800 -2 501 -2 416 -2 416 -2 416 -8 800 -3 537
Total payments made -93 313 -2 934 -2 934 -2 934 -74 989 -283 978 0
Maturity structure – financial obligationsThe table below shows the maturity structure for financial obligations as at 31 December 2016. Maturity in the next 12 months is broken down quarterly and then on an annual basis. See the section related to liquidity risk, where the bank deposits on the balance sheet date are NOK 49.3 million.
See note 27 for information on net assets held for sale.
See note 27 for information on net assets held for sale.
Forward contracts and electricity derivatives mature in the first quarter of 2017. Recognised net obligations are NOK -0.2 million. These net obligations are unrealised values and do not have any effect on liquidity. Actual interest payments relating to the existing loan agreement are included in the table.
Determining fair value:The fair value of forward currency contracts is calculated according to the closing rate on the balance sheet date adjusted for an interest addition or deduction based on the interest rate difference between the respective currencies. For forward currency contracts and electricity derivatives, the basis is the present value of the cash flow. The fair value of cash, bank overdrafts and other interest-bearing debt is considered to be almost equal to the carrying amount, since these have a short maturity period and thereby give floating interest rates that are adjusted in line with changes in the general interest rate level. Likewise, the fair value of trade receivables and payables is considered to be equal to the carrying amount, since both items have a short maturity period and were entered into under normal conditions.The fair value of interest rate swaps is calculated using the estimated discounted cash flow based on the market’s forward interest rates on the valuation date, with an addition to reflect the bank’s profit margins.
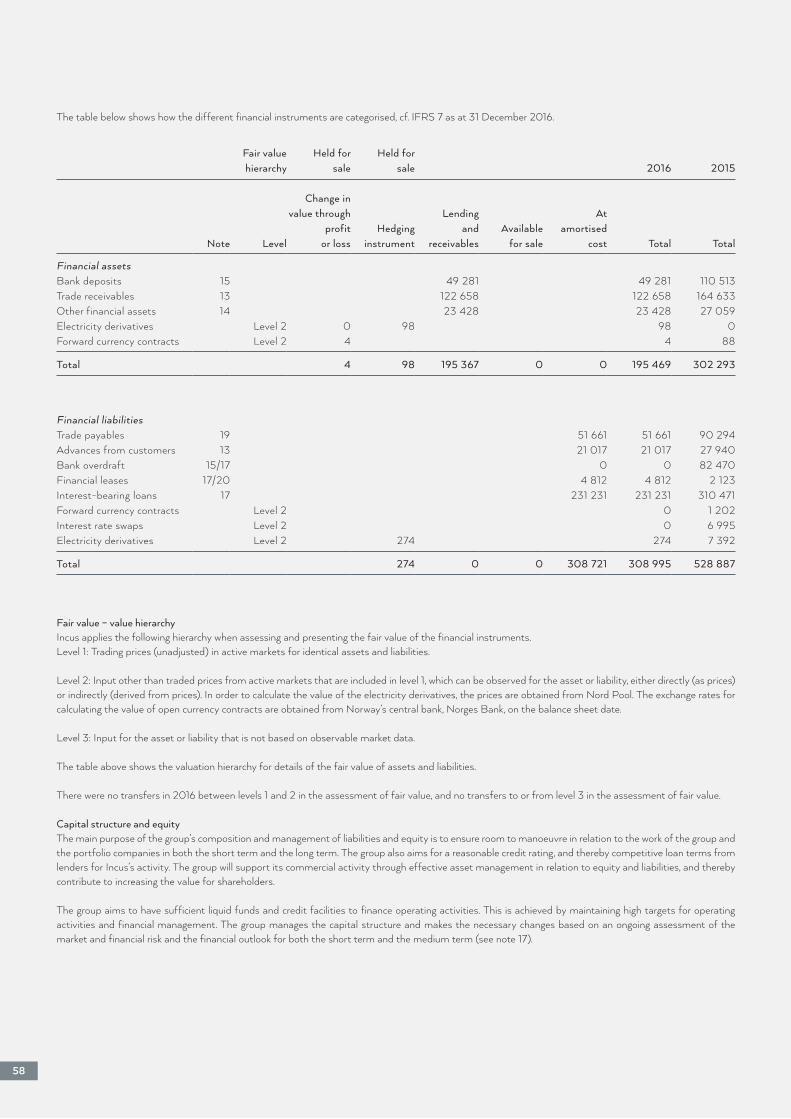
Financial liabilitiesTrade payables 19 51 661 51 661 90 294Advances from customers 13 21 017 21 017 27 940Bank overdraft 15/17 0 0 82 470Financial leases 17/20 4 812 4 812 2 123Interest-bearing loans 17 231 231 231 231 310 471Forward currency contracts Level 2 0 1 202Interest rate swaps Level 2 0 6 995Electricity derivatives Level 2 274 274 7 392
Total 274 0 0 308 721 308 995 528 887
Fair value – value hierarchyIncus applies the following hierarchy when assessing and presenting the fair value of the financial instruments.Level 1: Trading prices (unadjusted) in active markets for identical assets and liabilities.
Level 2: Input other than traded prices from active markets that are included in level 1, which can be observed for the asset or liability, either directly (as prices) or indirectly (derived from prices). In order to calculate the value of the electricity derivatives, the prices are obtained from Nord Pool. The exchange rates for calculating the value of open currency contracts are obtained from Norway’s central bank, Norges Bank, on the balance sheet date.
Level 3: Input for the asset or liability that is not based on observable market data.
The table above shows the valuation hierarchy for details of the fair value of assets and liabilities.
There were no transfers in 2016 between levels 1 and 2 in the assessment of fair value, and no transfers to or from level 3 in the assessment of fair value.
Capital structure and equityThe main purpose of the group’s composition and management of liabilities and equity is to ensure room to manoeuvre in relation to the work of the group and the portfolio companies in both the short term and the long term. The group also aims for a reasonable credit rating, and thereby competitive loan terms from lenders for Incus’s activity. The group will support its commercial activity through effective asset management in relation to equity and liabilities, and thereby contribute to increasing the value for shareholders.
The group aims to have sufficient liquid funds and credit facilities to finance operating activities. This is achieved by maintaining high targets for operating activities and financial management. The group manages the capital structure and makes the necessary changes based on an ongoing assessment of the market and financial risk and the financial outlook for both the short term and the medium term (see note 17).
Fair value Held for Held forhierarchy sale sale 2016 2015
Change invalue through Lending At
profit Hedging and Available amortisedNote Level or loss instrument receivables for sale cost Total Total
Financial assetsBank deposits 15 49 281 49 281 110 513Trade receivables 13 122 658 122 658 164 633Other financial assets 14 23 428 23 428 27 059Electricity derivatives Level 2 0 98 98 0Forward currency contracts Level 2 4 4 88
Total 4 98 195 367 0 0 195 469 302 293
The table below shows how the different financial instruments are categorised, cf. IFRS 7 as at 31 December 2016.
58

59
NOTE 24. SHARES AND SHAREHOLDERS
The 20 largest shareholders as at 31 December 2016: No. of shares % share
HIGH SEAS AS 26 000 000 24.2 %CAMAR A/S 23 342 548 21.7 %KREFTING AS 9 220 796 8.6 %STOLEN AS 7 354 248 6.8 %INTERNATIONAL OILFIELD SERVICES AS 6 198 852 5.8 %BEST INVEST AS 4 084 440 3.8 %LEIF INGE SLETHEI AS 3 010 054 2.8 %VERKET INVESTERING AS 1 406 703 1.3 %KJELL SIGVE LERVIK 1 350 000 1.3 %ARNE MORLAND 1 1 3 8 7 10 1.1 %KJETIL WERNER GULLIKSEN 1 000 000 0.9 %BERNT AS 8 1 7 086 0.8 %SPECTATIO INVEST AS 800 000 0.7 %MSIP EQUITY 7 9 1 1 1 1 0.7 %GUNNERS AS 650 000 0.6 %MAGNE THINGBØ 550 3 3 3 0.5 %HEDMANT INVEST AS 500 000 0.5 %KRISTIAN FALNES AS 500 000 0.5 %KLEIN AS 486 053 0.5 %HØILAND HOLDING ASA 476 998 0.4 %
Total holding for 20 largest shareholders 89 677 932 83.4 %Other 17 833 899 16.6 %
Total number of shares 107 5 1 1 831 100.0 %
Incus Investor ASA had 1,524 shareholders as at 31 December 2016. Foreign shareholders held shares totalling 2.4% of the share capital.
Number of shares held by Board Members and senior employees:Sindre Ertvaag (Through the company Camar AS) 23 342 548Carl Christian Krefting (Through the companies Krefting AS and Clean Ship AS) 9 420 796Per Ravnestad (Through the companies International Oilfield Services AS and Panda AS) 6 238 937Martha Kold Bakkevig (Through the company Kold Invest AS) 15 592Bjørn Torkildsen (Through the company Invenius AS) 186 061Kjetil Flesjå 106 501
Distribution of shareholders by size of shareholding
No. of shares No. of shareholders No. of shares Shareholding
1 - 1000 924 156 224 0.15 %1 001 - 10 000 324 1 326 247 1.23 %10 001 - 100 000 210 7 299 812 6.79 %100 001 - 1 000 000 56 15 623 197 14.53 %over 1 000 000 10 83 106 351 77.30 %
Quarterly share price data for 2016
Amounts in NOK Q4 2016 Q3 2016 Q2 2016 Q1 2016
Opening price 1.47 2.34 2.40 0.71Closing price 1.38 1.47 2.34 2.40Return for the period -6 % -37 % -3 % 238 %Highest closing price 1.79 2.38 2.55 2.40Lowest closing price 1.12 1.40 1.82 0.70Volume (in thousands of shares) 4 318 6 670 29 448 51 263

2016 2015
Pledged assets:Of the group’s recognised liabilities, the following were secured through pledges 234 688 393 264
Total pledged assets 234 688 393 264
Carrying amount of pledged items:Trade receivables 108 817 132 407 Inventories 86 982 133 715 Machinery, equipment 185 055 248 119 Buildings, land 96 593 149 425
Total 477 447 663 666
Guarantee obligations:Guarantees 37 845 129 349
The parent company guarantees come to NOK 7 million and almost the full amount consists of payment guarantees on behalf of the group’s subsidiaries.
Of the bank guarantees, approx. 67 per cent relate to performance guarantees. Faults with deliveries and an inability to correct faults will entitle the customer to draw on the guarantees. Around 33 per cent of the guarantees are “on demand” guarantees. In the event of non-payment the supplier can draw on the guarantee. See also note 27 for details of parent company guarantees and bank guarantees related to discontinued operations.
As at 31 December 2016, the company has 461 own shares, which is the same as at 31 December 2015.
The Annual General Meeting held on 26 April 2016 granted the Board authorisation to acquire the company’s own shares up to a nominal value of NOK 10,751 thousand. This authorisation is valid until the next Annual General Meeting in 2017. In 2016, the company did not trade own shares using the afore-mentioned authorisation granted by the Annual General Meeting of 2016.
NOTE 26. OWN SHARES
60
NOTE 25. PLEDGED ASSETS AND GUARANTEES
NOTE 27. DISCONTINUED OPERATIONS, NET ASSETS HELD FOR SALE AND OTHER DISPOSALS
1.0 DISCONTINUED OPERATIONS
The group has experienced the following effects on profit associated with discontinued operations shown in the table below.
Discontinued operations2016 2015
Discontinued operations Scana Propulsion AS 15 470 8 970Discontinued operations Scana Steel Söderfors AB 0 -3 351Discontinued operations Scana Steel Stavanger AS 11 556 14 359Discontinued operations Offshore Service 0 10 003
Total profit/loss for the year – discontinued operations 27 026 29 981
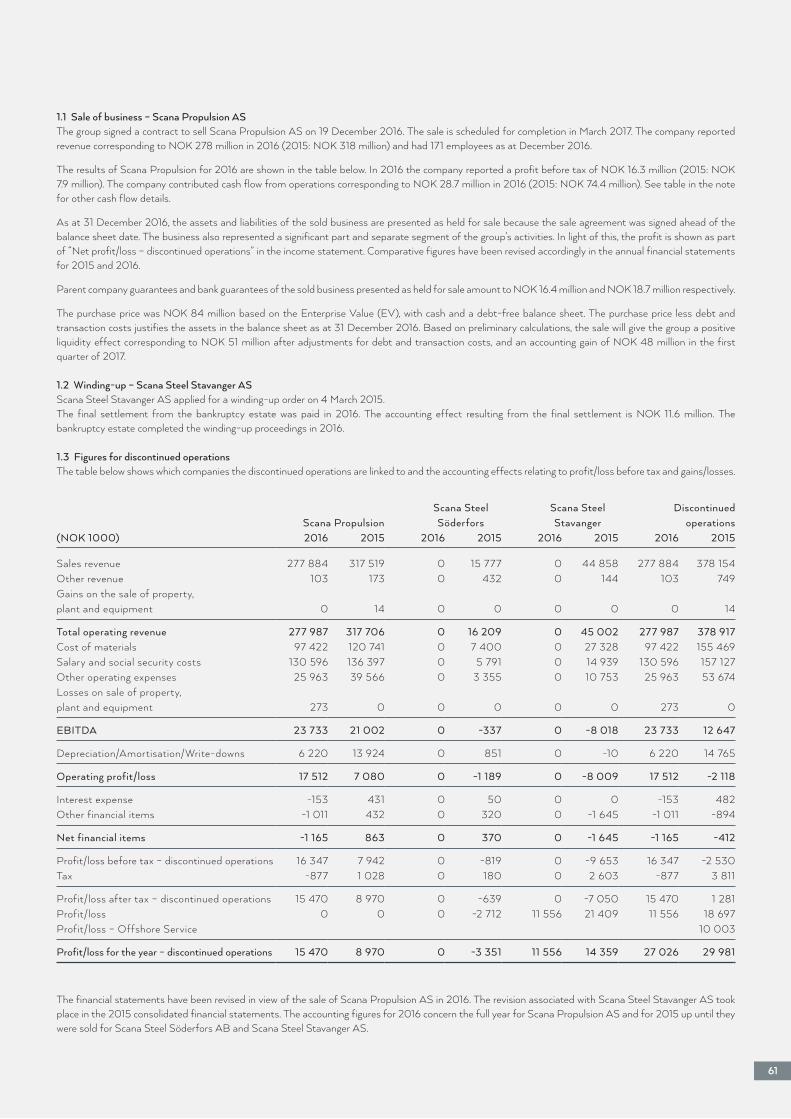
61
1.1 Sale of business – Scana Propulsion ASThe group signed a contract to sell Scana Propulsion AS on 19 December 2016. The sale is scheduled for completion in March 2017. The company reported revenue corresponding to NOK 278 million in 2016 (2015: NOK 318 million) and had 171 employees as at December 2016.
The results of Scana Propulsion for 2016 are shown in the table below. In 2016 the company reported a profit before tax of NOK 16.3 million (2015: NOK 7.9 million). The company contributed cash flow from operations corresponding to NOK 28.7 million in 2016 (2015: NOK 74.4 million). See table in the note for other cash flow details.
As at 31 December 2016, the assets and liabilities of the sold business are presented as held for sale because the sale agreement was signed ahead of the balance sheet date. The business also represented a significant part and separate segment of the group’s activities. In light of this, the profit is shown as part of “Net profit/loss – discontinued operations” in the income statement. Comparative figures have been revised accordingly in the annual financial statements for 2015 and 2016.
Parent company guarantees and bank guarantees of the sold business presented as held for sale amount to NOK 16.4 million and NOK 18.7 million respectively.
The purchase price was NOK 84 million based on the Enterprise Value (EV), with cash and a debt-free balance sheet. The purchase price less debt and transaction costs justifies the assets in the balance sheet as at 31 December 2016. Based on preliminary calculations, the sale will give the group a positive liquidity effect corresponding to NOK 51 million after adjustments for debt and transaction costs, and an accounting gain of NOK 48 million in the first quarter of 2017.
1.2 Windingup – Scana Steel Stavanger ASScana Steel Stavanger AS applied for a winding-up order on 4 March 2015.The final settlement from the bankruptcy estate was paid in 2016. The accounting effect resulting from the final settlement is NOK 11.6 million. The bankruptcy estate completed the winding-up proceedings in 2016.
1.3 Figures for discontinued operationsThe table below shows which companies the discontinued operations are linked to and the accounting effects relating to profit/loss before tax and gains/losses.
Scana Steel Scana Steel Discontinued Scana Propulsion Söderfors Stavanger operations
(NOK 1000) 2016 2015 2016 2015 2016 2015 2016 2015
Sales revenue 277 884 317 519 0 15 777 0 44 858 277 884 378 154Other revenue 103 173 0 432 0 144 103 749Gains on the sale of property, plant and equipment 0 14 0 0 0 0 0 14
Total operating revenue 277 987 317 706 0 16 209 0 45 002 277 987 378 917Cost of materials 97 422 120 741 0 7 400 0 27 328 97 422 155 469Salary and social security costs 130 596 136 397 0 5 791 0 14 939 130 596 157 127Other operating expenses 25 963 39 566 0 3 355 0 10 753 25 963 53 674Losses on sale of property, plant and equipment 273 0 0 0 0 0 273 0
EBITDA 23 733 21 002 0 -337 0 -8 018 23 733 12 647
Depreciation/Amortisation/Write-downs 6 220 13 924 0 851 0 -10 6 220 14 765
Operating profit/loss 17 512 7 080 0 -1 189 0 -8 009 17 512 -2 118
Interest expense -153 431 0 50 0 0 -153 482Other financial items -1 011 432 0 320 0 -1 645 -1 011 -894
Net financial items -1 165 863 0 370 0 -1 645 -1 165 -412
Profit/loss before tax – discontinued operations 16 347 7 942 0 -819 0 -9 653 16 347 -2 530Tax -877 1 028 0 180 0 2 603 -877 3 811
Profit/loss after tax – discontinued operations 15 470 8 970 0 -639 0 -7 050 15 470 1 281Profit/loss 0 0 0 -2 712 11 556 21 409 11 556 18 697Profit/loss – Offshore Service 10 003
Profit/loss for the year – discontinued operations 15 470 8 970 0 -3 351 11 556 14 359 27 026 29 981
The financial statements have been revised in view of the sale of Scana Propulsion AS in 2016. The revision associated with Scana Steel Stavanger AS took place in the 2015 consolidated financial statements. The accounting figures for 2016 concern the full year for Scana Propulsion AS and for 2015 up until they were sold for Scana Steel Söderfors AB and Scana Steel Stavanger AS.
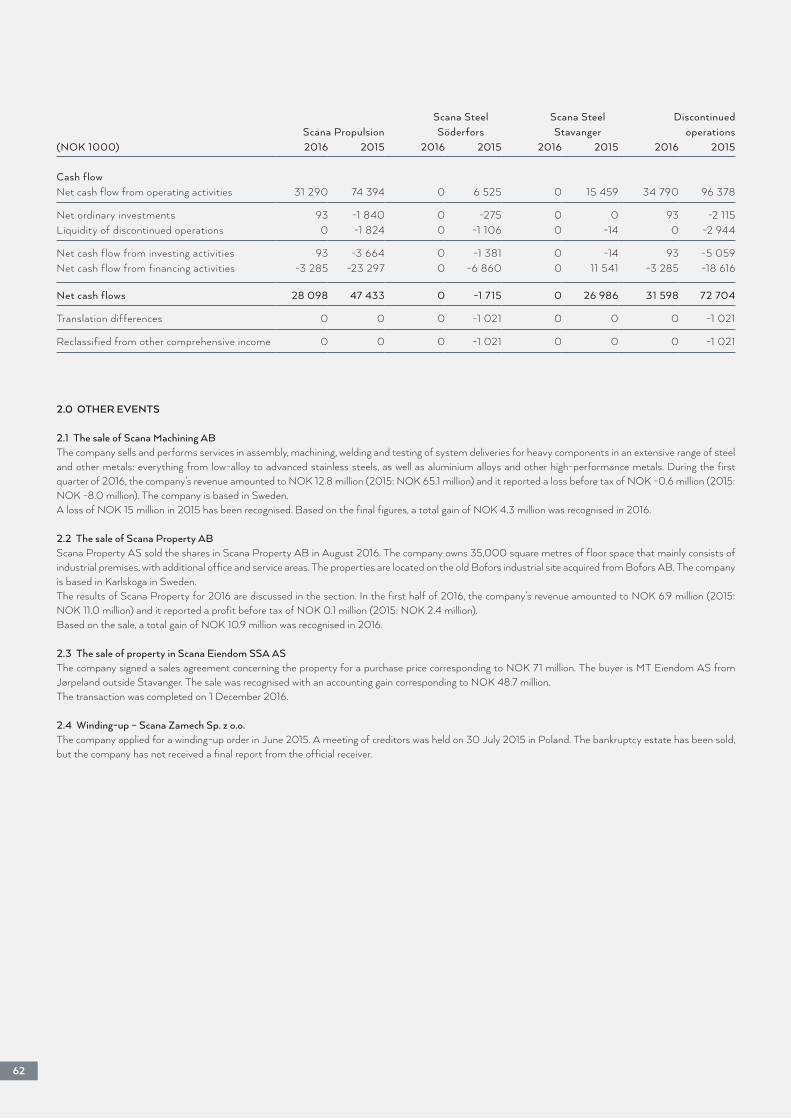
Scana Steel Scana Steel Discontinued Scana Propulsion Söderfors Stavanger operations
(NOK 1000) 2016 2015 2016 2015 2016 2015 2016 2015
Cash flowNet cash flow from operating activities 31 290 74 394 0 6 525 0 15 459 34 790 96 378
Net ordinary investments 93 -1 840 0 -275 0 0 93 -2 115Liquidity of discontinued operations 0 -1 824 0 -1 106 0 -14 0 -2 944
Net cash flow from investing activities 93 -3 664 0 -1 381 0 -14 93 -5 059Net cash flow from financing activities -3 285 -23 297 0 -6 860 0 11 541 -3 285 -18 616
Net cash flows 28 098 47 433 0 -1 715 0 26 986 31 598 72 704
Translation differences 0 0 0 -1 021 0 0 0 -1 021
Reclassified from other comprehensive income 0 0 0 -1 021 0 0 0 -1 021
2.0 OTHER EVENTS
2.1 The sale of Scana Machining ABThe company sells and performs services in assembly, machining, welding and testing of system deliveries for heavy components in an extensive range of steel and other metals: everything from low-alloy to advanced stainless steels, as well as aluminium alloys and other high-performance metals. During the first quarter of 2016, the company’s revenue amounted to NOK 12.8 million (2015: NOK 65.1 million) and it reported a loss before tax of NOK -0.6 million (2015: NOK -8.0 million). The company is based in Sweden.A loss of NOK 15 million in 2015 has been recognised. Based on the final figures, a total gain of NOK 4.3 million was recognised in 2016.
2.2 The sale of Scana Property ABScana Property AS sold the shares in Scana Property AB in August 2016. The company owns 35,000 square metres of floor space that mainly consists of industrial premises, with additional office and service areas. The properties are located on the old Bofors industrial site acquired from Bofors AB. The company is based in Karlskoga in Sweden.The results of Scana Property for 2016 are discussed in the section. In the first half of 2016, the company’s revenue amounted to NOK 6.9 million (2015: NOK 11.0 million) and it reported a profit before tax of NOK 0.1 million (2015: NOK 2.4 million).Based on the sale, a total gain of NOK 10.9 million was recognised in 2016.
2.3 The sale of property in Scana Eiendom SSA ASThe company signed a sales agreement concerning the property for a purchase price corresponding to NOK 71 million. The buyer is MT Eiendom AS from Jørpeland outside Stavanger. The sale was recognised with an accounting gain corresponding to NOK 48.7 million.The transaction was completed on 1 December 2016.
2.4 Windingup – Scana Zamech Sp. z o.o.The company applied for a winding-up order in June 2015. A meeting of creditors was held on 30 July 2015 in Poland. The bankruptcy estate has been sold, but the company has not received a final report from the official receiver.
62
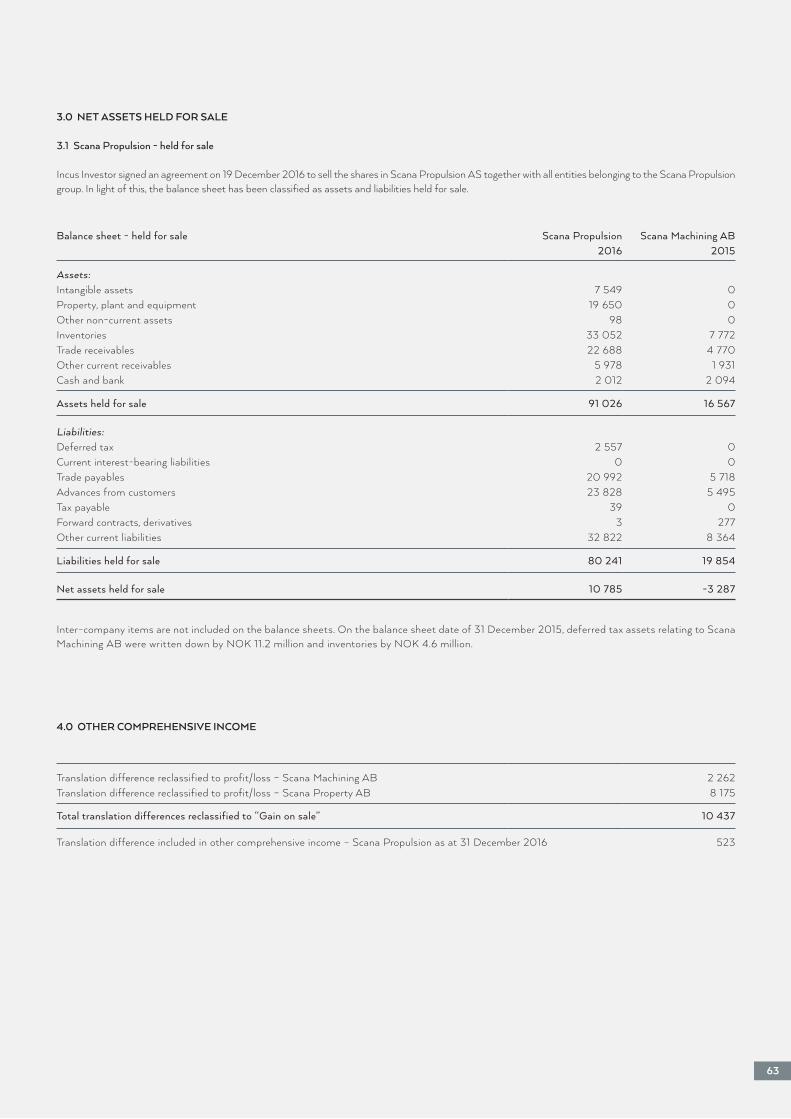
63
Balance sheet - held for sale Scana Propulsion Scana Machining AB2016 2015
Assets:Intangible assets 7 549 0 Property, plant and equipment 19 650 0 Other non-current assets 98 0 Inventories 33 052 7 772 Trade receivables 22 688 4 770 Other current receivables 5 978 1 931 Cash and bank 2 012 2 094
Assets held for sale 91 026 16 567
Liabilities:Deferred tax 2 557 0 Current interest-bearing liabilities 0 0 Trade payables 20 992 5 718 Advances from customers 23 828 5 495 Tax payable 39 0 Forward contracts, derivatives 3 277 Other current liabilities 32 822 8 364
Liabilities held for sale 80 241 19 854
Net assets held for sale 10 785 -3 287
Inter-company items are not included on the balance sheets. On the balance sheet date of 31 December 2015, deferred tax assets relating to Scana Machining AB were written down by NOK 11.2 million and inventories by NOK 4.6 million.
4.0 OTHER COMPREHENSIVE INCOME
Translation difference reclassified to profit/loss – Scana Machining AB 2 262 Translation difference reclassified to profit/loss – Scana Property AB 8 175
Total translation differences reclassified to “Gain on sale” 10 437
Translation difference included in other comprehensive income – Scana Propulsion as at 31 December 2016 523
3.0 NET ASSETS HELD FOR SALE
3.1 Scana Propulsion held for sale
Incus Investor signed an agreement on 19 December 2016 to sell the shares in Scana Propulsion AS together with all entities belonging to the Scana Propulsion group. In light of this, the balance sheet has been classified as assets and liabilities held for sale.
64
The sale of Scana Propulsion was completed in the end of March 2017 in line with the agreement that was made.
NOTE 29. EVENTS AFTER THE BALANCE SHEET DATE
NOTE 28. GOING CONCERN
The Board confirms that the going concern basis of accounting (the going concern assumption) is appropriate in accordance with Section 3-3 of the Norwegian Accounting Act and that the consolidated financial statements and the company financial statements for Incus Investor ASA have been prepared in accordance with this.
The group delivered positive financial results in 2016 thanks to gains on the sales that took place over the course of the year. As at 31 December 2016, the group’s equity is NOK 213 million and the group’s liquidity reserve is NOK 134.6 million. See also notes 15 and 22. An extension has also been granted to the bank agreement, a measure which is essential to ensure continued operation as a going concern. The reason for the going concern basis of accounting is also an assumption that profit/loss and cash flow from operations will improve in the future, but it is still uncertain when the market will improve and how quickly the planned cost-saving measures will have a positive effect on operations.
The management and the Board are of the opinion that the group will gradually regain profitability in its market segments through ongoing and implemented strategic and operational measures. One such measure is the sale of companies and underlying assets to help strengthen the group’s capital structure. Measures implemented include the following:
1. The company sold its shares in Scana Machining AB in the first quarter of 2016. The transaction reduced Incus’s liquidity and operational risk, as well as its guarantee obligations. See details in note 27.
2. Scana Property was sold in the third quarter of 2016. This sale resulted in a positive outcome and a positive liquidity effect. See details in note 27.
3. The company entered into an agreement to sell two properties in Scana Eiendom SSA AS. The purchase price is NOK 71 million. See details in note 27.
4. An agreement was signed in December 2016 to sell the shares in Scana Propulsion AS. The purchase price is NOK 84 million (Enterprise Value). See details in note 27.
5. The bank agreement has been extended by a year, so it now expires on 22 June 2019. This includes a payment holiday to first quarter of 2018. See details in note 17.
6. Cost-saving measures that were initiated and implemented at Scana Steel produced an effect of approx. NOK 40 million during 2016. These cost savings have taken the form of downsizing and measures to cut production costs. The measures took full effect in the second half of 2016.
7. Further measures linked to sales and marketing have been introduced at all portfolio companies to increase sales in both existing and new markets.
Stavanger, 30 March 2017
Per Anders RavnestadChairman of the Board
Carl Christian KreftingBoard member
Sindre ErtvaagBoard member
Martha Kold BakkevigBoard member
Marianne LieBoard member
Bjørn TorkildsenCEO
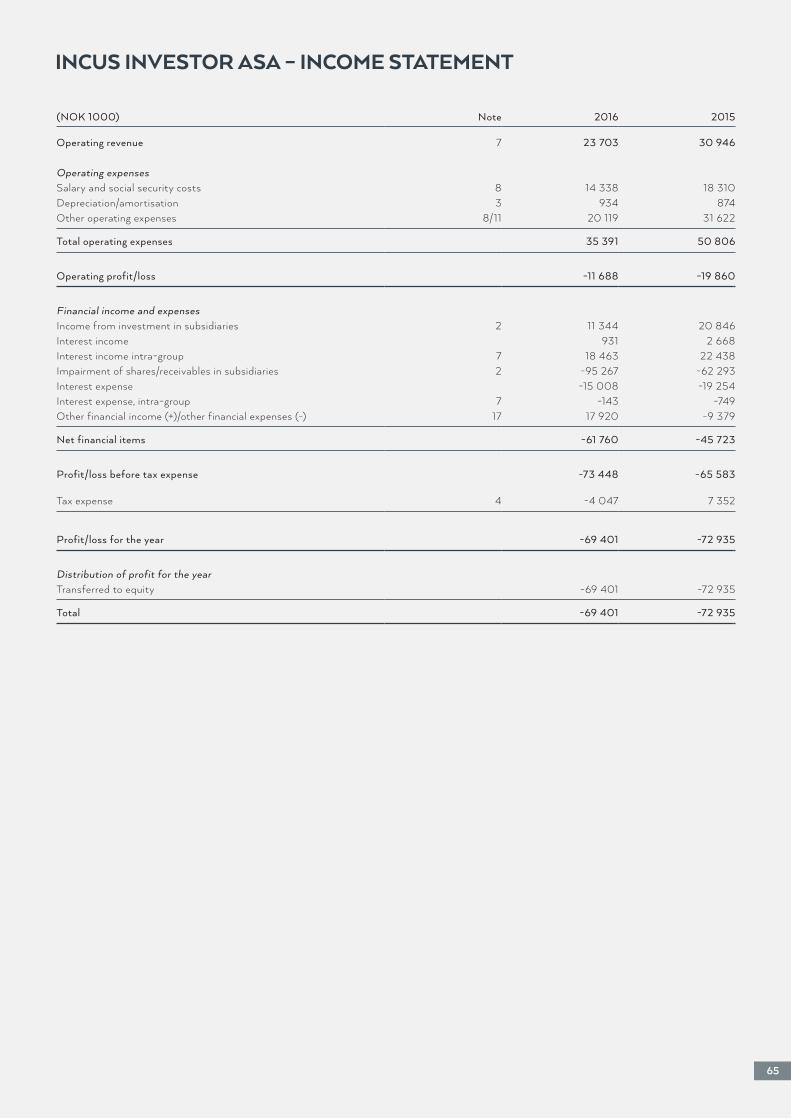
(NOK 1000) Note 2016 2015
Operating revenue 7 23 703 30 946
Operating expensesSalary and social security costs 8 14 338 18 310Depreciation/amortisation 3 934 874Other operating expenses 8/11 20 119 31 622
Total operating expenses 35 391 50 806
Operating profit/loss -11 688 -19 860
Financial income and expensesIncome from investment in subsidiaries 2 11 344 20 846Interest income 931 2 668Interest income intra-group 7 18 463 22 438Impairment of shares/receivables in subsidiaries 2 -95 267 -62 293Interest expense -15 008 -19 254Interest expense, intra-group 7 -143 -749Other financial income (+)/other financial expenses (-) 17 17 920 -9 379
Net financial items -61 760 -45 723
Profit/loss before tax expense -73 448 -65 583
Tax expense 4 -4 047 7 352
Profit/loss for the year -69 401 -72 935
Distribution of profit for the yearTransferred to equity -69 401 -72 935
Total -69 401 -72 935
65
INCUS INVESTOR ASA – INCOME STATEMENT
Stavanger, 30 March 2017

66
(NOK 1000) Note 31.12.16 31.12.15
Non-current assets:
Property, plant and equipment:Machinery, inventory, buildings, etc. 3 1 431 2 008Financial non-current assets:Shares in subsidiaries 2 321 319 434 267Other non-current receivables 11 906 596Loans to group companies 10 117 538 193 274
Total non-current assets 441 194 630 145
Current assetsReceivables:Receivables to group companies 10 193 214 135 810Other current receivables 11 720 522
Total receivables 193 934 136 332Bank deposits and cash 12 48 569 95 804
Total current assets 242 503 232 136
Total assets 683 697 862 281
EquityPaid-in capital:Share capital 9 107 512 107 512Own shares 0 0Share premium 214 921 282 879
Total paid-in capital 322 433 390 391
Total equity 5 322 433 390 391
Liabilities
Other non-current liabilities:Debt to credit institutions 13 169 437 259 355Pension obligations 11 906 596Other non-current liabilities 15 3 911 7 297
Total other non-current liabilities 174 254 267 248
Current liabilities:Debt to credit institutions 13 0 82 470Trade payables 733 1 003Current liabilities to group companies 10 179 046 110 460Other current liabilities 16 7 231 10 709
Total current liabilities 187 010 204 642
Total equity and liabilities 683 697 862 281
INCUS INVESTOR ASA – BALANCE SHEET
Stavanger, 30 March 2017
Per Anders RavnestadChairman of the Board
Carl Christian KreftingBoard member
Sindre ErtvaagBoard member
Martha Kold BakkevigBoard member
Marianne LieBoard member
Bjørn TorkildsenCEO
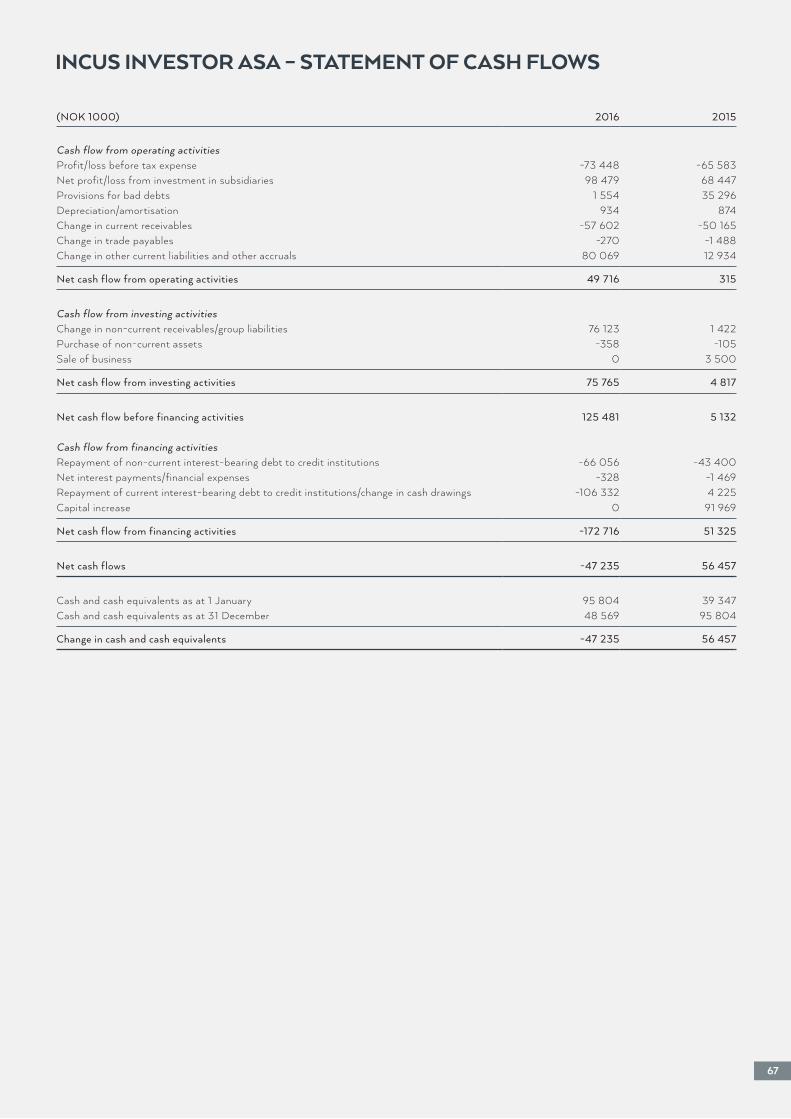
(NOK 1000) 2016 2015
Cash flow from operating activitiesProfit/loss before tax expense -73 448 -65 583Net profit/loss from investment in subsidiaries 98 479 68 447Provisions for bad debts 1 554 35 296Depreciation/amortisation 934 874Change in current receivables -57 602 -50 165Change in trade payables -270 -1 488Change in other current liabilities and other accruals 80 069 12 934
Net cash flow from operating activities 49 716 315
Cash flow from investing activitiesChange in non-current receivables/group liabilities 76 123 1 422Purchase of non-current assets -358 -105Sale of business 0 3 500
Net cash flow from investing activities 75 765 4 817
Net cash flow before financing activities 125 481 5 132 Cash flow from financing activitiesRepayment of non-current interest-bearing debt to credit institutions -66 056 -43 400Net interest payments/financial expenses -328 -1 469Repayment of current interest-bearing debt to credit institutions/change in cash drawings -106 332 4 225Capital increase 0 91 969
Net cash flow from financing activities -172 716 51 325
Net cash flows -47 235 56 457
Cash and cash equivalents as at 1 January 95 804 39 347Cash and cash equivalents as at 31 December 48 569 95 804
Change in cash and cash equivalents -47 235 56 457
INCUS INVESTOR ASA – STATEMENT OF CASH FLOWS
67
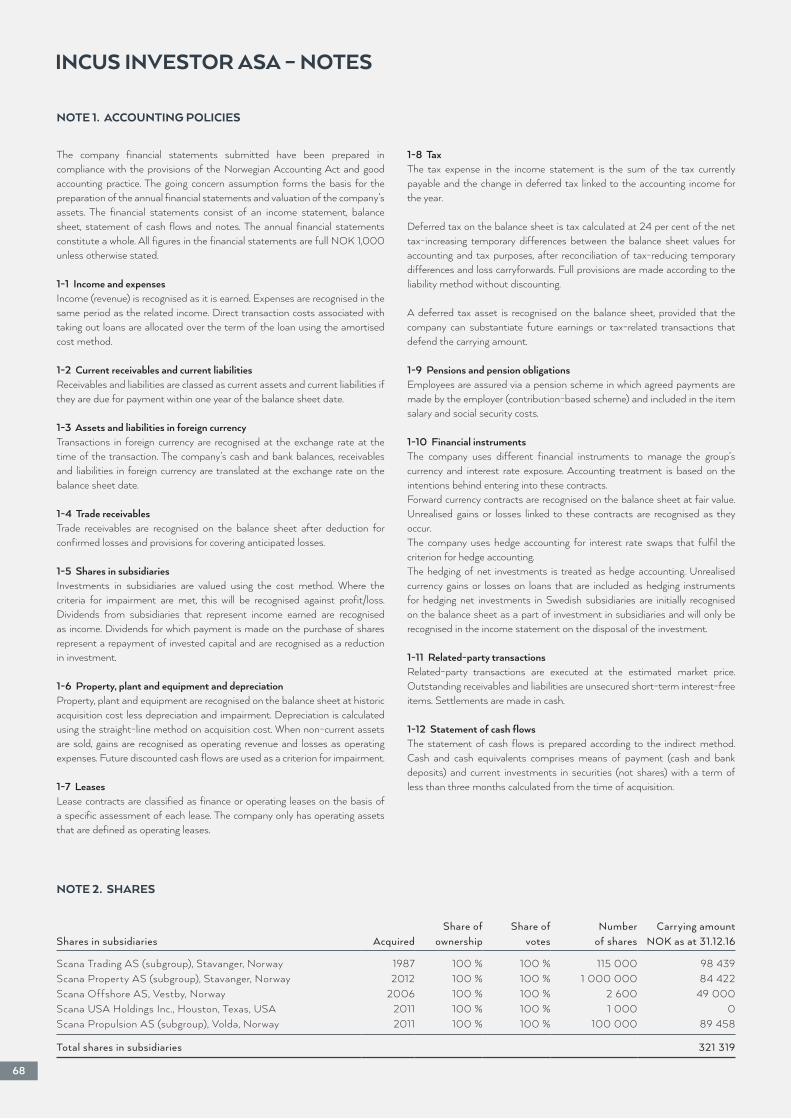
68
The company financial statements submitted have been prepared in compliance with the provisions of the Norwegian Accounting Act and good accounting practice. The going concern assumption forms the basis for the preparation of the annual financial statements and valuation of the company’s assets. The financial statements consist of an income statement, balance sheet, statement of cash flows and notes. The annual financial statements constitute a whole. All figures in the financial statements are full NOK 1,000 unless otherwise stated.
1-1 Income and expenses Income (revenue) is recognised as it is earned. Expenses are recognised in the same period as the related income. Direct transaction costs associated with taking out loans are allocated over the term of the loan using the amortised cost method.
1-2 Current receivables and current liabilitiesReceivables and liabilities are classed as current assets and current liabilities if they are due for payment within one year of the balance sheet date.
1-3 Assets and liabilities in foreign currencyTransactions in foreign currency are recognised at the exchange rate at the time of the transaction. The company’s cash and bank balances, receivables and liabilities in foreign currency are translated at the exchange rate on the balance sheet date.
1-4 Trade receivablesTrade receivables are recognised on the balance sheet after deduction for confirmed losses and provisions for covering anticipated losses.
1-5 Shares in subsidiariesInvestments in subsidiaries are valued using the cost method. Where the criteria for impairment are met, this will be recognised against profit/loss. Dividends from subsidiaries that represent income earned are recognised as income. Dividends for which payment is made on the purchase of shares represent a repayment of invested capital and are recognised as a reduction in investment.
1-6 Property, plant and equipment and depreciationProperty, plant and equipment are recognised on the balance sheet at historic acquisition cost less depreciation and impairment. Depreciation is calculated using the straight-line method on acquisition cost. When non-current assets are sold, gains are recognised as operating revenue and losses as operating expenses. Future discounted cash flows are used as a criterion for impairment.
1-7 LeasesLease contracts are classified as finance or operating leases on the basis of a specific assessment of each lease. The company only has operating assets that are defined as operating leases.
1-8 TaxThe tax expense in the income statement is the sum of the tax currently payable and the change in deferred tax linked to the accounting income for the year.
Deferred tax on the balance sheet is tax calculated at 24 per cent of the net tax-increasing temporary differences between the balance sheet values for accounting and tax purposes, after reconciliation of tax-reducing temporary differences and loss carryforwards. Full provisions are made according to the liability method without discounting.
A deferred tax asset is recognised on the balance sheet, provided that the company can substantiate future earnings or tax-related transactions that defend the carrying amount.
1-9 Pensions and pension obligationsEmployees are assured via a pension scheme in which agreed payments are made by the employer (contribution-based scheme) and included in the item salary and social security costs.
1-10 Financial instrumentsThe company uses different financial instruments to manage the group’s currency and interest rate exposure. Accounting treatment is based on the intentions behind entering into these contracts. Forward currency contracts are recognised on the balance sheet at fair value. Unrealised gains or losses linked to these contracts are recognised as they occur. The company uses hedge accounting for interest rate swaps that fulfil the criterion for hedge accounting.The hedging of net investments is treated as hedge accounting. Unrealised currency gains or losses on loans that are included as hedging instruments for hedging net investments in Swedish subsidiaries are initially recognised on the balance sheet as a part of investment in subsidiaries and will only be recognised in the income statement on the disposal of the investment.
1-11 Related-party transactionsRelated-party transactions are executed at the estimated market price. Outstanding receivables and liabilities are unsecured short-term interest-free items. Settlements are made in cash.
1-12 Statement of cash flowsThe statement of cash flows is prepared according to the indirect method. Cash and cash equivalents comprises means of payment (cash and bank deposits) and current investments in securities (not shares) with a term of less than three months calculated from the time of acquisition.
NOTE 2. SHARES
Share of Share of Number Carrying amountShares in subsidiaries Acquired ownership votes of shares NOK as at 31.12.16
Scana Trading AS (subgroup), Stavanger, Norway 1987 100 % 100 % 115 000 98 439Scana Property AS (subgroup), Stavanger, Norway 2012 100 % 100 % 1 000 000 84 422Scana Offshore AS, Vestby, Norway 2006 100 % 100 % 2 600 49 000Scana USA Holdings Inc. , Houston, Texas, USA 2011 100 % 100 % 1 000 0Scana Propulsion AS (subgroup), Volda, Norway 2011 100 % 100 % 100 000 89 458
Total shares in subsidiaries 321 319
NOTE 1. ACCOUNTING POLICIES
INCUS INVESTOR ASA – NOTES
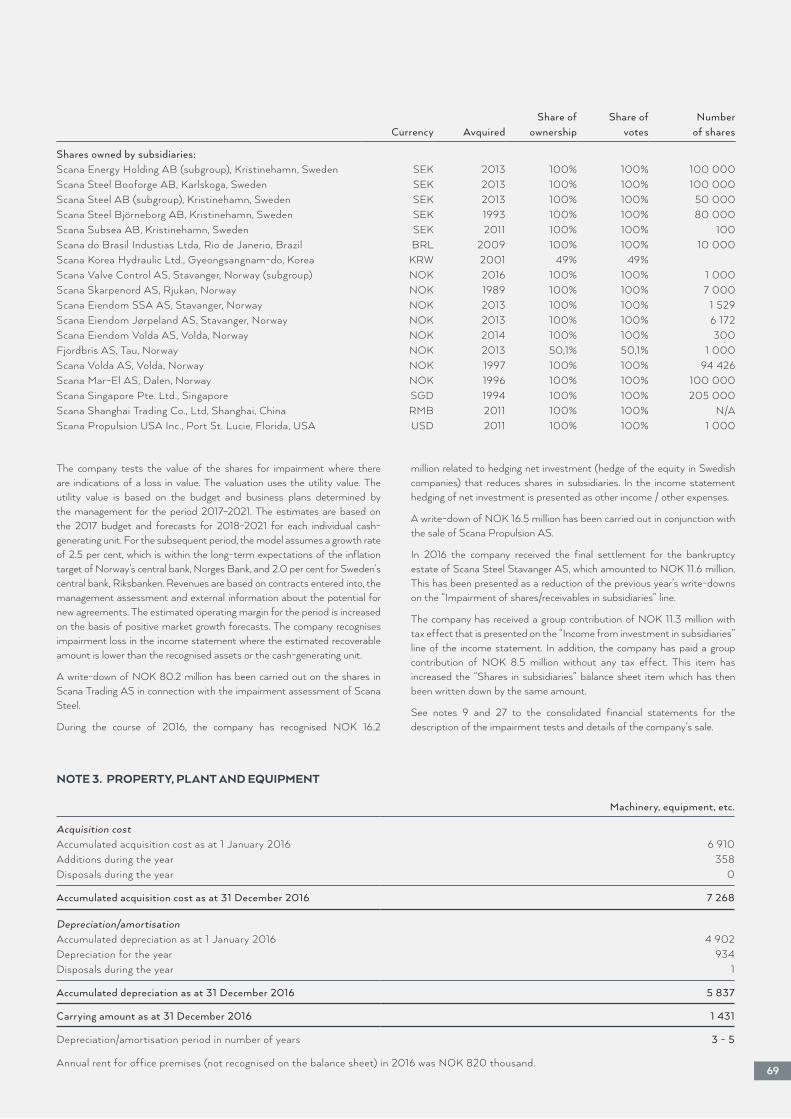
Share of Share of NumberCurrency Avquired ownership votes of shares
Shares owned by subsidiaries:Scana Energy Holding AB (subgroup), Kristinehamn, Sweden SEK 2013 100% 100% 100 000Scana Steel Booforge AB, Karlskoga, Sweden SEK 2013 100% 100% 100 000Scana Steel AB (subgroup), Kristinehamn, Sweden SEK 2013 100% 100% 50 000Scana Steel Björneborg AB, Kristinehamn, Sweden SEK 1993 100% 100% 80 000Scana Subsea AB, Kristinehamn, Sweden SEK 2011 100% 100% 100Scana do Brasil Industias Ltda, Rio de Janerio, Brazil BRL 2009 100% 100% 10 000Scana Korea Hydraulic Ltd. , Gyeongsangnam-do, Korea KRW 2001 49% 49%Scana Valve Control AS, Stavanger, Norway (subgroup) NOK 2016 100% 100% 1 000Scana Skarpenord AS, Rjukan, Norway NOK 1989 100% 100% 7 000Scana Eiendom SSA AS, Stavanger, Norway NOK 2013 100% 100% 1 529Scana Eiendom Jørpeland AS, Stavanger, Norway NOK 2013 100% 100% 6 172Scana Eiendom Volda AS, Volda, Norway NOK 2014 100% 100% 300Fjordbris AS, Tau, Norway NOK 2013 50,1% 50,1% 1 000Scana Volda AS, Volda, Norway NOK 1997 100% 100% 94 426Scana Mar-El AS, Dalen, Norway NOK 1996 100% 100% 100 000Scana Singapore Pte. Ltd. , Singapore SGD 1994 100% 100% 205 000Scana Shanghai Trading Co., Ltd, Shanghai, China RMB 2011 100% 100% N/AScana Propulsion USA Inc. , Port St. Lucie, Florida, USA USD 2011 100% 100% 1 000
The company tests the value of the shares for impairment where there are indications of a loss in value. The valuation uses the utility value. The utility value is based on the budget and business plans determined by the management for the period 2017–2021. The estimates are based on the 2017 budget and forecasts for 2018–2021 for each individual cash-generating unit. For the subsequent period, the model assumes a growth rate of 2.5 per cent, which is within the long-term expectations of the inflation target of Norway’s central bank, Norges Bank, and 2.0 per cent for Sweden’s central bank, Riksbanken. Revenues are based on contracts entered into, the management assessment and external information about the potential for new agreements. The estimated operating margin for the period is increased on the basis of positive market growth forecasts. The company recognises impairment loss in the income statement where the estimated recoverable amount is lower than the recognised assets or the cash-generating unit.
A write-down of NOK 80.2 million has been carried out on the shares in Scana Trading AS in connection with the impairment assessment of Scana Steel.
During the course of 2016, the company has recognised NOK 16.2
million related to hedging net investment (hedge of the equity in Swedish companies) that reduces shares in subsidiaries. In the income statement hedging of net investment is presented as other income / other expenses.
A write-down of NOK 16.5 million has been carried out in conjunction with the sale of Scana Propulsion AS.
In 2016 the company received the final settlement for the bankruptcy estate of Scana Steel Stavanger AS, which amounted to NOK 11.6 million. This has been presented as a reduction of the previous year’s write-downs on the “Impairment of shares/receivables in subsidiaries” line.
The company has received a group contribution of NOK 11.3 million with tax effect that is presented on the “Income from investment in subsidiaries” line of the income statement. In addition, the company has paid a group contribution of NOK 8.5 million without any tax effect. This item has increased the “Shares in subsidiaries” balance sheet item which has then been written down by the same amount.
See notes 9 and 27 to the consolidated financial statements for the description of the impairment tests and details of the company’s sale.
NOTE 3. PROPERTY, PLANT AND EQUIPMENT
Machinery, equipment, etc.
Acquisition cost Accumulated acquisition cost as at 1 January 2016 6 910Additions during the year 358Disposals during the year 0
Accumulated acquisition cost as at 31 December 2016 7 268
Depreciation/amortisationAccumulated depreciation as at 1 January 2016 4 902Depreciation for the year 934Disposals during the year 1
Accumulated depreciation as at 31 December 2016 5 837
Carrying amount as at 31 December 2016 1 431
Depreciation/amortisation period in number of years 3 - 5
Annual rent for office premises (not recognised on the balance sheet) in 2016 was NOK 820 thousand.69
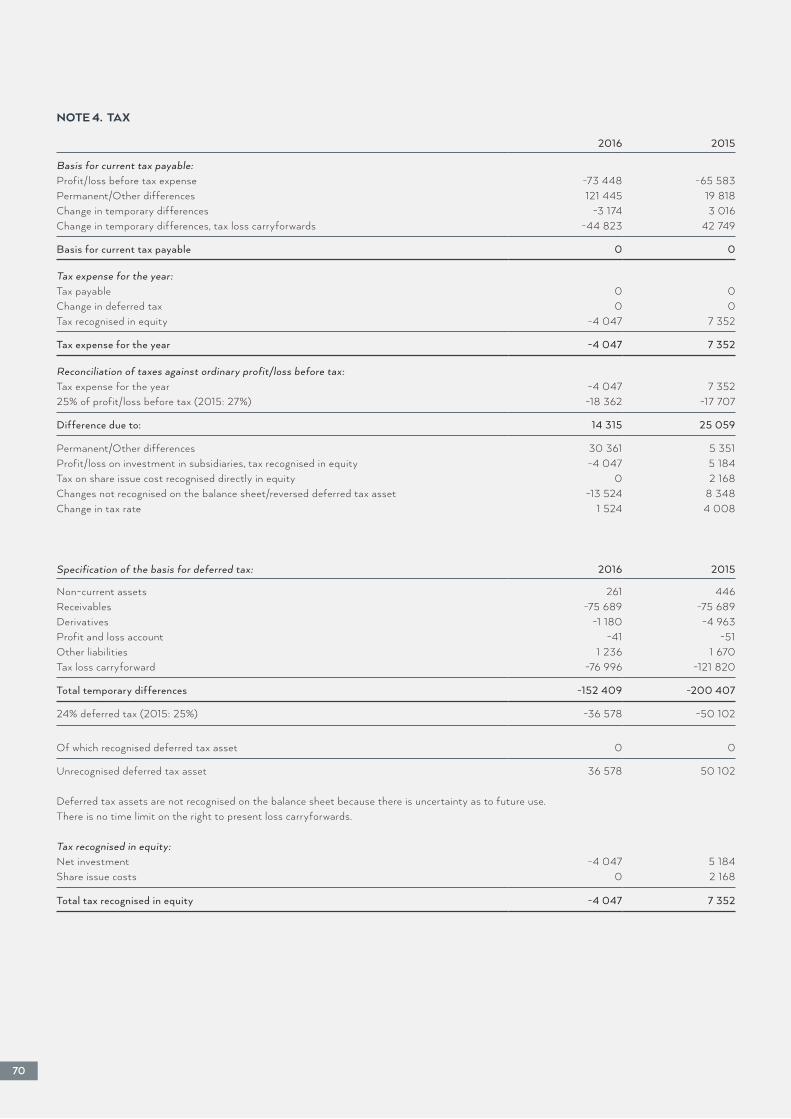
70
NOTE 4. TAX
2016 2015
Basis for current tax payable:Profit/loss before tax expense -73 448 -65 583Permanent/Other differences 121 445 19 818Change in temporary differences -3 174 3 016Change in temporary differences, tax loss carryforwards -44 823 42 749
Basis for current tax payable 0 0
Tax expense for the year:Tax payable 0 0Change in deferred tax 0 0Tax recognised in equity -4 047 7 352
Tax expense for the year -4 047 7 352
Reconciliation of taxes against ordinary profit/loss before tax:Tax expense for the year -4 047 7 35225% of profit/loss before tax (2015: 27%) -18 362 -17 707
Difference due to: 14 315 25 059
Permanent/Other differences 30 361 5 351Profit/loss on investment in subsidiaries, tax recognised in equity -4 047 5 184Tax on share issue cost recognised directly in equity 0 2 168Changes not recognised on the balance sheet/reversed deferred tax asset -13 524 8 348Change in tax rate 1 524 4 008
Specification of the basis for deferred tax: 2016 2015
Non-current assets 261 446Receivables -75 689 -75 689Derivatives -1 180 -4 963Profit and loss account -41 -51Other liabilities 1 236 1 670Tax loss carryforward -76 996 -121 820
Total temporary differences -152 409 -200 407
24% deferred tax (2015: 25%) -36 578 -50 102
Of which recognised deferred tax asset 0 0
Unrecognised deferred tax asset 36 578 50 102
Deferred tax assets are not recognised on the balance sheet because there is uncertainty as to future use.There is no time limit on the right to present loss carryforwards.
Tax recognised in equity:Net investment -4 047 5 184Share issue costs 0 2 168
Total tax recognised in equity -4 047 7 352
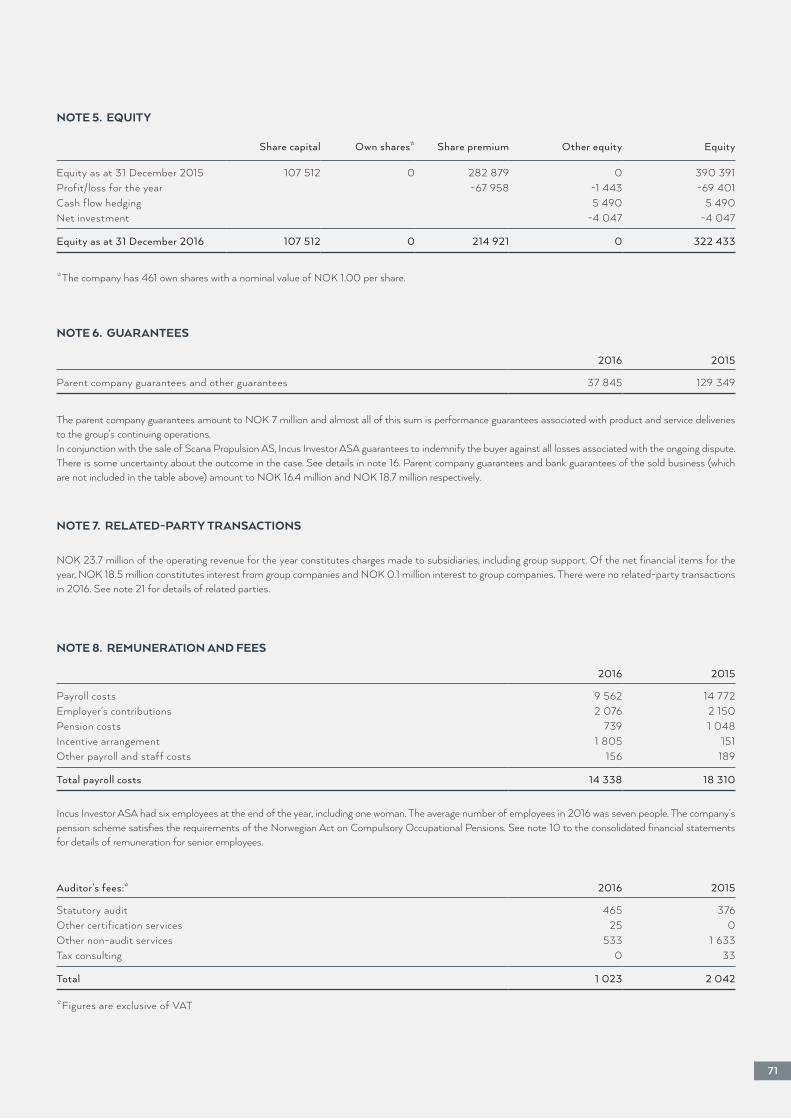
NOTE 5. EQUITY
NOTE 6. GUARANTEES
Share capital Own shares* Share premium Other equity Equity
Equity as at 31 December 2015 107 512 0 282 879 0 390 391Profit/loss for the year -67 958 -1 443 -69 401Cash flow hedging 5 490 5 490Net investment -4 047 -4 047
Equity as at 31 December 2016 107 512 0 214 921 0 322 433
2016 2015
Parent company guarantees and other guarantees 37 845 129 349
NOTE 7. RELATED-PARTY TRANSACTIONS
NOK 23.7 million of the operating revenue for the year constitutes charges made to subsidiaries, including group support. Of the net financial items for the year, NOK 18.5 million constitutes interest from group companies and NOK 0.1 million interest to group companies. There were no related-party transactions in 2016. See note 21 for details of related parties.
2016 2015
Payroll costs 9 562 14 772Employer’s contributions 2 076 2 150Pension costs 739 1 048Incentive arrangement 1 805 151Other payroll and staff costs 156 189
Total payroll costs 14 338 18 310
NOTE 8. REMUNERATION AND FEES
Auditor’s fees:* 2016 2015
Statutory audit 465 376Other certification services 25 0Other non-audit services 533 1 633Tax consulting 0 33
Total 1 023 2 042
*Figures are exclusive of VAT
Incus Investor ASA had six employees at the end of the year, including one woman. The average number of employees in 2016 was seven people. The company’s pension scheme satisfies the requirements of the Norwegian Act on Compulsory Occupational Pensions. See note 10 to the consolidated financial statements for details of remuneration for senior employees.
*The company has 461 own shares with a nominal value of NOK 1.00 per share.
The parent company guarantees amount to NOK 7 million and almost all of this sum is performance guarantees associated with product and service deliveries to the group’s continuing operations.In conjunction with the sale of Scana Propulsion AS, Incus Investor ASA guarantees to indemnify the buyer against all losses associated with the ongoing dispute. There is some uncertainty about the outcome in the case. See details in note 16. Parent company guarantees and bank guarantees of the sold business (which are not included in the table above) amount to NOK 16.4 million and NOK 18.7 million respectively.
71
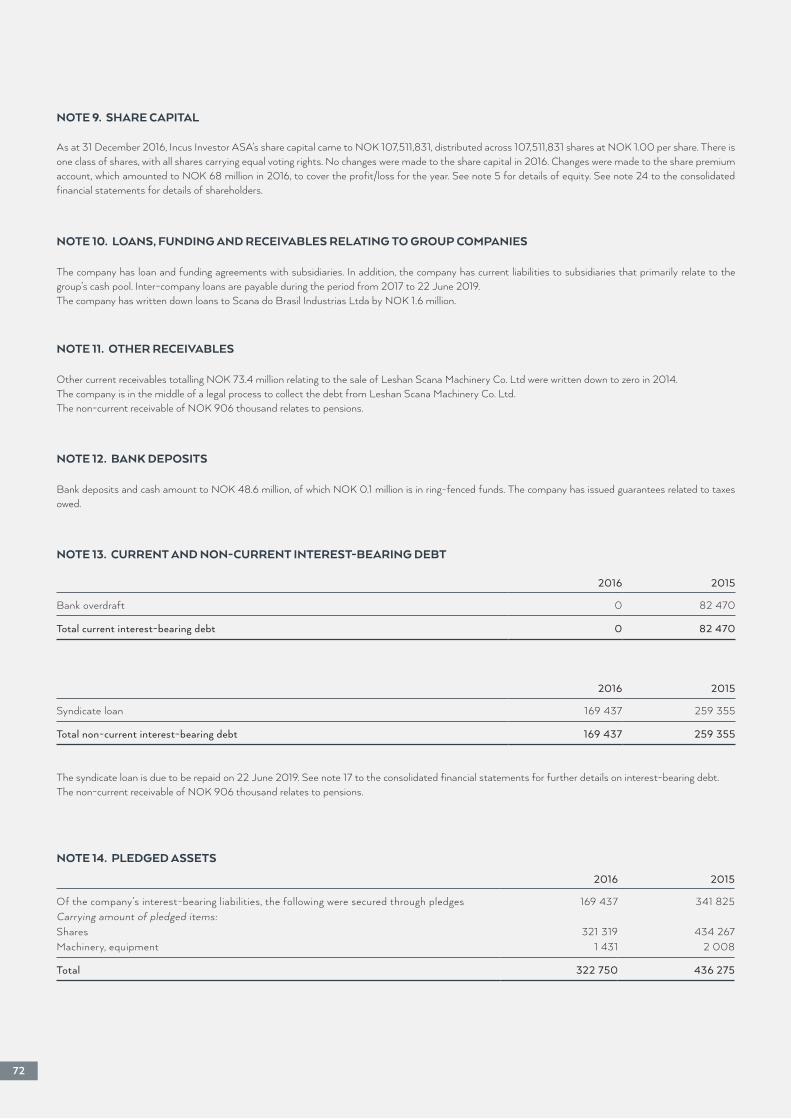
72
2016 2015
Bank overdraft 0 82 470
Total current interest-bearing debt 0 82 470
NOTE 13. CURRENT AND NON-CURRENT INTEREST-BEARING DEBT
NOTE 12. BANK DEPOSITS
NOTE 10. LOANS, FUNDING AND RECEIVABLES RELATING TO GROUP COMPANIES
NOTE 11. OTHER RECEIVABLES
NOTE 9. SHARE CAPITAL
As at 31 December 2016, Incus Investor ASA’s share capital came to NOK 107,511,831, distributed across 107,511,831 shares at NOK 1.00 per share. There is one class of shares, with all shares carrying equal voting rights. No changes were made to the share capital in 2016. Changes were made to the share premium account, which amounted to NOK 68 million in 2016, to cover the profit/loss for the year. See note 5 for details of equity. See note 24 to the consolidated financial statements for details of shareholders.
Bank deposits and cash amount to NOK 48.6 million, of which NOK 0.1 million is in ring-fenced funds. The company has issued guarantees related to taxes owed.
The company has loan and funding agreements with subsidiaries. In addition, the company has current liabilities to subsidiaries that primarily relate to the group’s cash pool. Inter-company loans are payable during the period from 2017 to 22 June 2019.The company has written down loans to Scana do Brasil Industrias Ltda by NOK 1.6 million.
Other current receivables totalling NOK 73.4 million relating to the sale of Leshan Scana Machinery Co. Ltd were written down to zero in 2014.The company is in the middle of a legal process to collect the debt from Leshan Scana Machinery Co. Ltd.The non-current receivable of NOK 906 thousand relates to pensions.
NOTE 14. PLEDGED ASSETS
2016 2015
Of the company’s interest-bearing liabilities, the following were secured through pledges 169 437 341 825Carrying amount of pledged items:Shares 321 319 434 267Machinery, equipment 1 431 2 008
Total 322 750 436 275
The syndicate loan is due to be repaid on 22 June 2019. See note 17 to the consolidated financial statements for further details on interest-bearing debt.The non-current receivable of NOK 906 thousand relates to pensions.
2016 2015
Syndicate loan 169 437 259 355
Total non-current interest-bearing debt 169 437 259 355
73
Unrealised gains/ Currency Net Nominal value Maturity losses (-)
SEK Sale -2 1 1 1 1 2017 -1 038USD Purchase 565 2017 169EUR Purchase 4 254 2017 -1 229GBP Purchase 140 2017 -120
Total value of open currency contracts as at 31 December 2016 -2 218
Currency contracts:A summary of all open currency contracts as at 31 December 2016 is shown below
Of the other current liabilities, NOK 1,423 thousand constitutes public charges payable.In conjunction with the sale of Scana Propulsion AS, Incus Investor ASA has a duty to indemnify the buyer against all losses associated with the ongoing dispute. The dispute arose in conjunction with Scana Volda AS being sued in France after a gearbox failed in 2010. The plaintiff is a shipowner insurer, which believes that Scana Volda AS’s selection of components for the gearbox caused the gearbox to fail. The total claim is for NOK 45 million for damages and financial loss.Scana Volda AS believes that the original delivery was made in accordance with the client’s specifications and that other conditions caused the damage. There have been several court hearings resulting in adjournments. There was also correspondence in 2014, 2015 and 2016, but the case has not been settled.Further court hearings are planned for 2017. The company has set aside NOK 3 million as at 31 December 2016.
NOTE 15. FINANCIAL INSTRUMENTS
The forward contracts are included as part of the group’s management of the exchange rate risk. See note 22 to the consolidated financial statements.
Interest rate swaps:Up until 25 October 2016 floating interest-bearing liabilities were hedged against changes in the interest rate level by entering into interest rate swaps.As at 31 December 2016, the syndicate loan is not hedged at a fixed interest rate. The company has chosen not to enter into a new interest rate swap.
Incentive arrangement:The incentive-based payment provides an entitlement to a total bonus for the management of Incus and Converto of 12 per cent of any increase in the value of the shares in the company over three years in excess of an annual increase in value of 8 per cent.• Bjørn Torkildsen will be entitled to up to 4.8 per cent• Converto will be entitled to up to 4.8 per cent As at December 2016, provisions of NOK 3.9 million had been made for the arrangement. NOK 3.6 million was charged to the income statement in 2016. See note 10 to the consolidated financial statements for further details.
NOTE 16. OTHER CURRENT LIABILITIES
Net other financial income amounts to NOK 17.9 million, of which gains on currencies account for NOK 73.6 million, losses on currencies NOK 54 million and financial expenses NOK 1.7 million.
NOTE 17. OTHER FINANCIAL INCOME/EXPENSES
See note 28 to the consolidated financial statements on operation as a going concern and note 29 on events after the balance sheet date.
NOTE 18. EVENTS AFTER THE BALANCE SHEET DATE AND GOING CONCERN
73
Stavanger, 30 March 2017
Per Anders RavnestadChairman of the Board
Carl Christian KreftingBoard member
Sindre ErtvaagBoard member
Martha Kold BakkevigBoard member
Marianne LieBoard member
Bjørn TorkildsenCEO
Statsautoriserte revisorerErnst & Young AS
Vassbotnen 11a Forus, NO-4313 SandnesPostboks 8015, NO-4068 Stavanger
Foretaksregisteret: NO 976 389 387 MVATlf: + 47 51 70 66 00Fax: + 47 51 70 66 01www.ey.noMedlemmer av den norske revisorforening
INDEPENDENT AUDITOR’S REPORT
To the Annual Shareholders' Meeting of Incus Investor ASA
Report on the audit of the financial statements
OpinionWe have audited the financial statements of Incus Investor ASA comprising the financial statements of theparent company and the Group. The financial statements of the parent company comprise the balancesheet as at 31 December 2016 and the statements of income and cash flows for the year then ended andnotes to the financial statements, including a summary of significant accounting policies.
The consolidated financial statements comprise the balance sheet as at 31 December 2016, the incomestatement, statements of comprehensive income, cash flows and changes in equity for the year thenended and notes to the financial statements, including a summary of significant accounting policies.
In our opinion,
► the financial statements are prepared in accordance with the law and regulations;► the financial statements present fairly, in all material respects, the financial position of the parent
company as at 31 December 2016, and of its financial performance and its cash flows for theyear ended in accordance with the Norwegian Accounting Act and accounting standards andpractices generally accepted in Norway;
► the consolidated financial statements present fairly, in all material respects the financial positionof the Group as at 31 December 2016 and of its financial performance and its cash flows for theyear then ended in accordance with International Financial Reporting Standards as adopted bythe EU.
Basis for opinionWe conducted our audit in accordance with laws, regulations, and auditing standards and practicesgenerally accepted in Norway, including International Standards on Auditing (ISAs). Our responsibilitiesunder those standards are further described in the Auditor’s responsibilities for the audit of the financialstatements section of our report. We are independent of the Company in accordance with the ethicalrequirements that are relevant to our audit of the financial statements in Norway, and we have fulfilled ourethical responsibilities as required by law and regulations. We have also complied with our other ethicalobligations in accordance with these requirements. We believe that the audit evidence we have obtainedis sufficient and appropriate to provide a basis for our opinion.
Key audit mattersKey audit matters are those matters that, in our professional judgment, were of most significance in ouraudit of the financial statements of the current period. These matters were addressed in the context of ouraudit of the financial statements as a whole, and in forming our opinion thereon, and we do not provide aseparate opinion on these matters. For each matter below, our description of how our audit addressed thematter is provided in that context.
We have fulfilled the responsibilities described in the Auditor’s responsibilities for the audit of the financialstatements section of our report, including in relation to these matters. Accordingly, our audit included theperformance of procedures designed to respond to our assessment of the risks of material misstatementof the financial statements. The results of our audit procedures, including the procedures performed toaddress the matters below, provide the basis for our audit opinion on the financial statements.
AUDITORS’ REPORT 2016
74
Independent auditor's report - Incus Investor ASA
Impairmentassessmentofnon-currenttangibleassets
The Group has reported negative results for several years, and indicators of impairment have beenidentified for assets in the cash-flow generating units (CGUs) Scana Steel and Scana Booforge, totalling57% of total assets amounting to NOK 689.7 million. The impairment assessments were a key auditmatter, as the carrying amount of the assets related to these two CGUs constitute a significant part of thenon-current assets in the consolidated financial statements, and the assessments imply a large degree ofjudgment from management related to the assumptions on future cash flows, including assumptionsconnected with growth in revenue and margins on future deliveries.
Our audit procedures included a review of the Group’s accuracy concerning previous estimates, acomparison of future estimated margins with historical margins together with a comparison of futureincome growth against historical growth and industry data. We have also considered the valuation modeland the discount interest rate applied in the value in use calculations, and recalculated the value in usecalculations. In addition, we have assessed the sensitivity of selected assumptions. We involved valuationexperts in the recalculation of the impairment model, the discount interest rate and the sensitivitycalculations.
With reference to Note 1. Consolidated accounting policies 2016, Note 2. Estimation uncertainty andjudgements, Note 8. Intangible assets and Note 9. Property, plant and equipment for details on thevaluation method, main assumptions and sensitivities.
Other informationOther information consists of the information included in the Company’s annual report other than thefinancial statements and our auditor’s report thereon. The Board of Directors and Chief Executive Officer(management) are responsible for the other information. Our opinion on the financial statements does notcover the other information, and we do not express any form of assurance conclusion thereon.
In connection with our audit of the financial statements, our responsibility is to read the other information,and, in doing so, consider whether the other information is materially inconsistent with the financialstatements or our knowledge obtained in the audit, or otherwise appears to be materially misstated. If,based on the work we have performed, we conclude that there is a material misstatement of this otherinformation, we are required to report that fact. We have nothing to report in this regard.
Responsibilities of management for the financial statementsManagement is responsible for the preparation and fair presentation of these financial statements inaccordance with the Norwegian Accounting Act and accounting standards and practices generallyaccepted in Norway for the financial statements of the parent company and International FinancialReporting Standards as adopted by the EU for the financial statements of the Group, and for such internalcontrol as management determines is necessary to enable the preparation of financial statements thatare free from material misstatement, whether due to fraud or error.
In preparing the financial statements, management is responsible for assessing the Company’s ability tocontinue as a going concern, disclosing, as applicable, matters related to going concern and using thegoing concern basis of accounting, unless management either intends to liquidate the Company or tocease operations, or has no realistic alternative but to do so.
Auditor’s responsibilities for the audit of the financial statementsOur objectives are to obtain reasonable assurance about whether the financial statements as a whole arefree from material misstatement, whether due to fraud or error, and to issue an auditor’s report thatincludes our opinion. Reasonable assurance is a high level of assurance, but is not a guarantee that anaudit conducted in accordance with ISAs will always detect a material misstatement when it exists.Misstatements can arise from fraud or error and are considered material if, individually or in theaggregate, they could reasonably be expected to influence the economic decisions of users taken on thebasis of these financial statements.
7375
76
Independent auditor's report - Incus Investor ASA
As part of an audit in accordance with law, regulations and generally accepted auditing principles inNorway, including ISAs, we exercise professional judgment and maintain professional scepticismthroughout the audit. We also:
► identify and assess the risks of material misstatement of the financial statements, whether due to fraud or error,design and perform audit procedures responsive to those risks, and obtain audit evidence that is sufficient andappropriate to provide a basis for our opinion. The risk of not detecting a material misstatement resulting fromfraud is higher than for one resulting from error, as fraud may involve collusion, forgery, intentional omissions,misrepresentations, or the override of internal control.
► obtain an understanding of internal control relevant to the audit in order to design audit procedures that areappropriate in the circumstances, but not for the purpose of expressing an opinion on the effectiveness of theCompany’s internal control
► evaluate the appropriateness of accounting policies used and the reasonableness of accounting estimates andrelated disclosures made by management.
► conclude on the appropriateness of management’s use of the going concern basis of accounting and, based onthe audit evidence obtained, whether a material uncertainty exists related to events or conditions that may castsignificant doubt on the Company’s ability to continue as a going concern. If we conclude that a materialuncertainty exists, we are required to draw attention in our auditor’s report to the related disclosures in thefinancial statements or, if such disclosures are inadequate, to modify our opinion. Our conclusions are based onthe audit evidence obtained up to the date of our auditor’s report. However, future events or conditions maycause the Company to cease to continue as a going concern.
► evaluate the overall presentation, structure and content of the financial statements, including the disclosures, andwhether the financial statements represent the underlying transactions and events in a manner that achieves fairpresentation.
► obtain sufficient appropriate audit evidence regarding the financial information of the entities or businessactivities within the Group to express an opinion on the consolidated financial statements. We are responsible forthe direction, supervision and performance of the group audit. We remain solely responsible for our audit opinion.
We communicate with those charged with governance regarding, among other matters, the plannedscope and timing of the audit and significant audit findings, including any significant deficiencies ininternal control that we identify during our audit.
We also provide those charged with governance with a statement that we have complied with relevantethical requirements regarding independence, and communicate with them all relationships and othermatters that may reasonably be thought to bear on our independence, and where applicable, relatedsafeguards.
From the matters communicated with those charged with governance, we determine those matters thatwere of most significance in the audit of the financial statements of the current period and are thereforethe key audit matters. We describe these matters in our auditor’s report unless law or regulationprecludes public disclosure about the matter or when, in extremely rare circumstances, we determine thata matter should not be communicated in our report because the adverse consequences of doing so wouldreasonably be expected to outweigh the public interest benefits of such communication.
Report on other legal and regulatory requirements
Opinion on the Board of Directors’ report and in the statements on corporate governanceand corporate social responsibilityBased on our audit of the financial statements as described above, it is our opinion that the informationpresented in the Board of Directors’ report and in the statements on corporate governance and corporatesocial responsibility concerning the financial statements and the going concern assumption is consistentwith the financial statements and complies with the law and regulations.
7377
Independent auditor's report - Incus Investor ASA
Opinion on registration and documentationBased on our audit of the financial statements as described above, and control procedures we haveconsidered necessary in accordance with the International Standard on Assurance Engagements (ISAE)3000, «Assurance Engagements Other than Audits or Reviews of Historical Financial Information», it isour opinion that management has fulfilled its duty to ensure that the Company's accounting information isproperly recorded and documented as required by law and bookkeeping standards and practicesaccepted in Norway.
Stavanger, 30 March 2017ERNST & YOUNG AS
Tor Inge SkjellevikState Authorised Public Accountant (Norway)
(This translation from Norwegian has been made for information purposes only.)
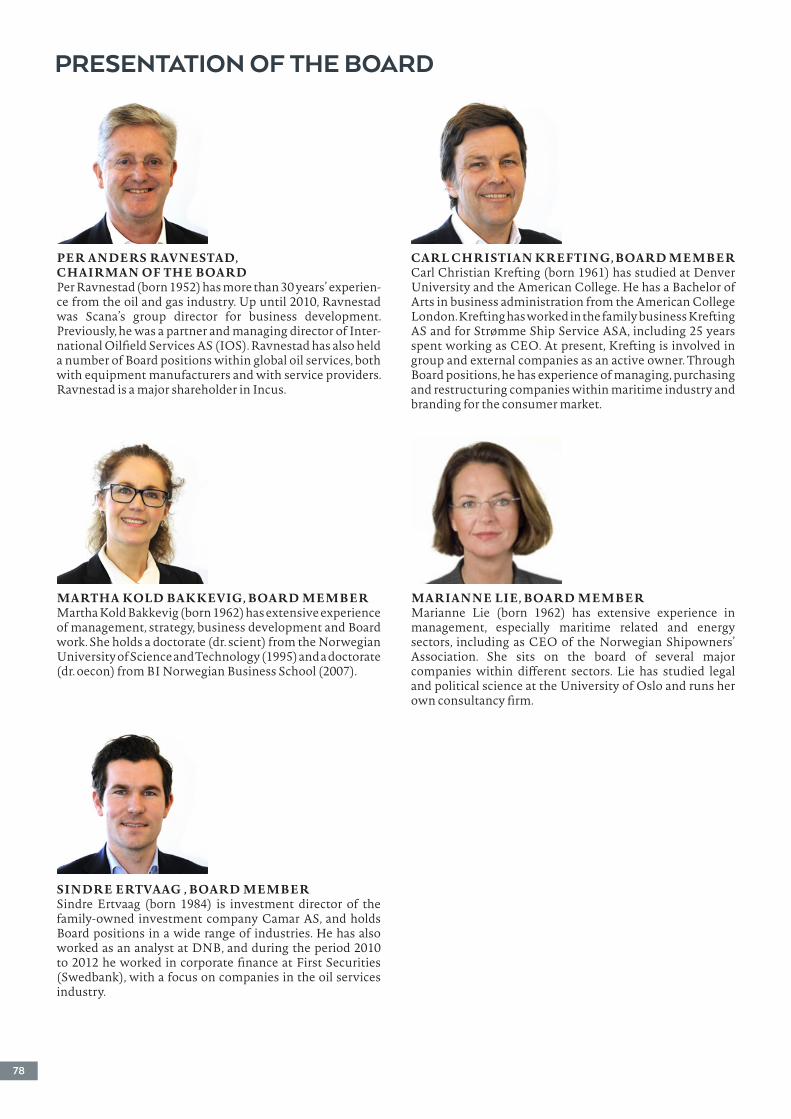
PER ANDERS RAVNESTAD, CHAIRMAN OF THE BOARDPer Ravnestad (born 1952) has more than 30 years’ experien-ce from the oil and gas industry. Up until 2010, Ravnestad was Scana’s group director for business development. Previously, he was a partner and managing director of Inter-national Oilfield Services AS (IOS). Ravnestad has also held a number of Board positions within global oil services, both with equipment manufacturers and with service providers. Ravnestad is a major shareholder in Incus.
MARTHA KOLD BAKKEVIG, BOARD MEMBERMartha Kold Bakkevig (born 1962) has extensive experience of management, strategy, business development and Board work. She holds a doctorate (dr. scient) from the Norwegian University of Science and Technology (1995) and a doctorate (dr. oecon) from BI Norwegian Business School (2007).
SINDRE ERTVAAG , BOARD MEMBERSindre Ertvaag (born 1984) is investment director of the family-owned investment company Camar AS, and holds Board positions in a wide range of industries. He has also worked as an analyst at DNB, and during the period 2010 to 2012 he worked in corporate finance at First Securities (Swedbank), with a focus on companies in the oil services industry.
78
PRESENTATION OF THE BOARD
CARL CHRISTIAN KREFTING, BOARD MEMBERCarl Christian Krefting (born 1961) has studied at Denver University and the American College. He has a Bachelor of Arts in business administration from the American College London. Krefting has worked in the family business Krefting AS and for Strømme Ship Service ASA, including 25 years spent working as CEO. At present, Krefting is involved in group and external companies as an active owner. Through Board positions, he has experience of managing, purchasing and restructuring companies within maritime industry and branding for the consumer market.
MARIANNE LIE, BOARD MEMBERMarianne Lie (born 1962) has extensive experience in management, especially maritime related and energy sectors, including as CEO of the Norwegian Shipowners’ Association. She sits on the board of several major companies within different sectors. Lie has studied legal and political science at the University of Oslo and runs her own consultancy firm.
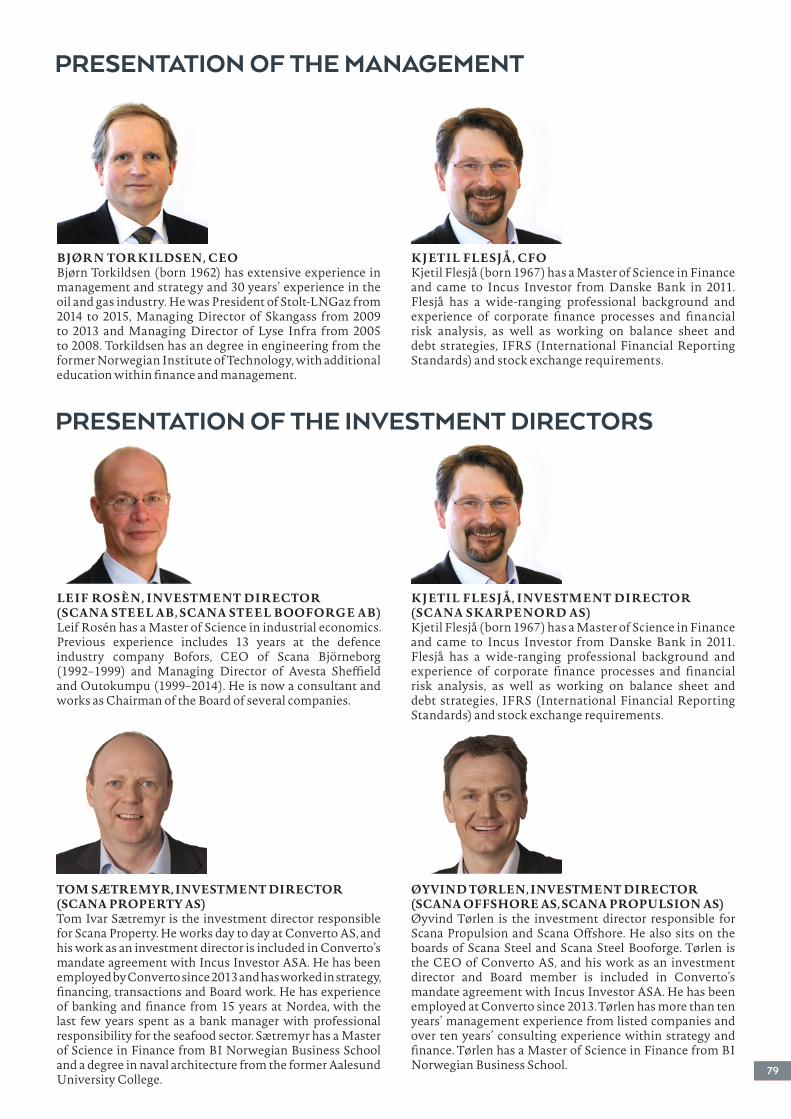
BJØRN TORKILDSEN, CEOBjørn Torkildsen (born 1962) has extensive experience in management and strategy and 30 years’ experience in the oil and gas industry. He was President of Stolt-LNGaz from 2014 to 2015, Managing Director of Skangass from 2009 to 2013 and Managing Director of Lyse Infra from 2005 to 2008. Torkildsen has an degree in engineering from the former Norwegian Institute of Technology, with additional education within finance and management.
LEIF ROSÈN, INVESTMENT DIRECTOR (SCANA STEEL AB, SCANA STEEL BOOFORGE AB)Leif Rosén has a Master of Science in industrial economics. Previous experience includes 13 years at the defence industry company Bofors, CEO of Scana Björneborg (1992–1999) and Managing Director of Avesta Sheffield and Outokumpu (1999–2014). He is now a consultant and works as Chairman of the Board of several companies.
KJETIL FLESJÅ, CFOKjetil Flesjå (born 1967) has a Master of Science in Finance and came to Incus Investor from Danske Bank in 2011. Flesjå has a wide-ranging professional background and experience of corporate finance processes and financial risk analysis, as well as working on balance sheet and debt strategies, IFRS (International Financial Reporting Standards) and stock exchange requirements.
KJETIL FLESJÅ, INVESTMENT DIRECTOR (SCANA SKARPENORD AS)Kjetil Flesjå (born 1967) has a Master of Science in Finance and came to Incus Investor from Danske Bank in 2011. Flesjå has a wide-ranging professional background and ex peri en ce of corporate finance processes and financial risk analysis, as well as working on balance sheet and debt strategies, IFRS (International Financial Reporting Standards) and stock exchange requirements.
PRESENTATION OF THE INVESTMENT DIRECTORS
7379
PRESENTATION OF THE MANAGEMENT
TOM SÆTREMYR, INVESTMENT DIRECTOR (SCANA PROPERTY AS)Tom Ivar Sætremyr is the investment director responsible for Scana Property. He works day to day at Converto AS, and his work as an investment director is included in Converto’s mandate agreement with Incus Investor ASA. He has been employed by Converto since 2013 and has worked in strategy, financing, transactions and Board work. He has experience of banking and finance from 15 years at Nordea, with the last few years spent as a bank manager with professional responsibility for the seafood sector. Sætremyr has a Master of Science in Finance from BI Norwegian Business School and a degree in naval architecture from the former Aalesund University College.
ØYVIND TØRLEN, INVESTMENT DIRECTOR (SCANA OFFSHORE AS, SCANA PROPULSION AS)Øyvind Tørlen is the investment director responsible for Scana Propulsion and Scana Offshore. He also sits on the boards of Scana Steel and Scana Steel Booforge. Tørlen is the CEO of Converto AS, and his work as an investment director and Board member is included in Converto’s mandate agreement with Incus Investor ASA. He has been employed at Converto since 2013. Tørlen has more than ten years’ management experience from listed companies and over ten years’ consulting experience within strategy and finance. Tørlen has a Master of Science in Finance from BI Norwegian Business School.

Photo front page, page 2, 3 and 6: ShutterstockDesign and production: Printers as
80

INCUS INVESTOR ASAStrandkaien 2, PO Box 878, N4004 Stavanger, NorwayTel +47 51 86 94 00
SCANA STEEL
Scana Steel ABKristinehamnsvegen 2SE680 Björneborg, SwedenTel: +46 550 251 00
Scana Steel Björneborg ABKristinehamnsvägen 2SE680 71 Björneborg, SwedenTel: +46 550 251 00
Scana Subsea ABKristinehamnsvägen 2SE680 71 Björneborg, SwedenTel: +46 550 253 90
SCANA PROPULSION
Scana Propulsion ASHamnegata 24 PO Box 205N6101 Volda, NorwayTel: +47 7005 9000
Scana Volda ASHamnegata 24 PO Box 205N6101 Volda, NorwayTel: +47 7005 9000
Scana Mar-El ASStorvegen 48N3880 Dalen, NorwayTel: 47 3507 5800
Scana Singapore Pte. Ltd.21 Bukit Batok Crescent#1873, WCEGA TowerSingapore 658065Tel: +65 6872 2702
Scana Shanghai Trading Co. LtdRoom 107, Building 2, No. 3601,Dongfang Road, Pudong District,Shanghai 200125, P.R. China.Tel: +86 21 6288 8881 Scana Propulsion USA Inc.5759 NW Zenith Dr.Port St. LucieFL 34986, USATel: +1 772 224 8889
SCANA PROPERTY
Scana Property ASStrandkaien 2, PO Box 878N4004 Stavanger, NorwayTel: +47 5186 9400
Scana Eiendom SSA ASStrandkaien 2, PO Box 878N4004 Stavanger, NorwayTel: +47 5186 9400
Scana Eiendom Jørpeland ASStrandkaien 2, PO Box 878N4004 Stavanger, NorwayTel: +47 5186 9400
Scana Eiendom Volda ASStrandkaien 2, PO Box 878N4004 Stavanger, NorwayTel: +47 5186 9400
Fjordbris ASStrandkaien 2, PO Box 878N4004 Stavanger, NorwayTel: +47 5186 940
SCANA SKARPENORD
Scana Skarpenord ASSåheimsveien 2N3660 Rjukan, NorwayTel: +47 3509 1800
Scana Korea Hydraulic Ltd.73, Goldrenrootro 130beongil, Juchonmyeon, Gimhaesi, Gyeongsangnamdo, Korea
Scana Skarpenord Shanghai Service StationTel: 0086 21 64330818*3091/ 64156980*3091Fax: 0086 21 64675223 Add: No.851, Zhongshan Nan Er Rd, Shanghai, P. R. China. Post Code: 200032
SCANA OFFSHORE
Scana Offshore ASDeliveien 10, PO Box 24N1541 Vestby, NorwayTel: +47 6495 6500
Scana do Brasil Industrias LdtaAv. Paisagista Jose da Silva de Azevedo neto 200, bloco 5, sala 133, Barra da Tijuca, Rio de Janeiro, RJ, +55 22775056, Brazil
SCANA STEEL BOOFORGE
Scana Steel Booforge ABPO Box 55SE691 21 Karlskoga, SwedenTel: +46 586 820 00