annual report 2016 - particuliers · • expansion of the energie eco-loans, ... of highly...
TRANSCRIPT

ANNUAL REPORT 2016161st Financial Year

Financial Highlights (in thousands of euros)
2015 2016 % change
2016/2015
TOTAL BALANCE SHEET 42.811.472 43.468.625 +1,5%
Deposits at amortised cost - Credit institutions 4.439.629 4.741.710 +6,8%
Deposits at amortised cost - Customers 26.923.488 28.115.936 +4,4%
Issuance of debt securities 5.791.365 4.918.235 -15,1%
Loans and receivables at amortised cost - Credit institutions 5.597.608 4.105.232 -26,7%
Loans and receivables at amortised cost - Customers 19.224.838 19.815.746 +3,1%
Available-for-sale securities - Fixed income securities 9.998.540 10.067.250 +0,7%
BANKING INCOME (1) 639.226 580.207 -9,2%
Total general expenses (2) 300.488 314.758 +4,7%
NET INCOME 273.161 259.793 -4,9%
COMMON EQUITY TIER 1 (CET1) RATIO (3) 17,8% 17,7%
AVERAGE WORKFORCE
(in number of contracts) 1.807,0 1.818,0 +0,6%
AVERAGE WORKFORCE
(in work units) 1.647,0 1.655,0 +0,5%
(1) Interest income, dividend income, fee and commission income, income from financial instruments and other operating income and expenses.
(2) General administrative expenses and depreciation allowances in respect of tangible and intangible assets.
(3) Common Equity Tier 1 (CET1) and solvency ratios were established according to applicable regulations.
FINANCIAL HIGHLIGHTS AND MAIN DEVELOPMENTS

Main developments in 2016: Income down slightly and financial strength confirmed
• Decrease in net profit (-4,9%).
• Dynamic growth in the home loan portfolio (+6,1%).
• Significant increase in customer deposit volumes (+4,4%) on
strong inflows of deposits from corporates and private customers.
• CET1 ratio maintained at a high level: 17,7%.
• Pressure on traditional bank revenues in a low rate environment.
• Official inauguration of “19 Liberté” on 5 July 2016 after
major renovation work.
• Optimisation of the in-house “lux | funds” open-end invest-
ment fund (SICAV) range finalised.
• Launch of a new sub-fund of the Lux-Portfolio SICAV, charac-
terised by its flexible weighting of different asset classes.
• Launch of the first gold ingots with Fairtrade certification on
the Luxembourg market.
• Expansion of the ENERGIE Eco-Loans, which aim to support
the rational use of energy.
• Development of a new version of the S-net Mobile application
which can now be used to buy and sell securities.
• Excellent AA+ rating with a stable outlook assigned by
Standard and Poor’s and Aa2 Long Term Deposit Rating with a
stable outlook by Moody’s.
• Recipient of “Best Bank 2016 - Luxembourg” prize, with
confirmation of BCEE’s ranking among the world’s 10 safest
banks by Global Finance magazine.
• Significant activity on the regulatory front due to the large
number of ongoing projects associated with the CRR and
MiFIR, the 4th AML Directive, CRD IV and MiFID II, the IFRS 9
project, the implementation of CRS reporting, and the Single
Supervisory and Resolution Mechanisms.
• 68 new employees hired.

5
2 RAPPORT DE GESTION DE LA BCEETHE BANK'S VALUES
All BCEE business lines embrace the principal values that are the hallmarks of the
Bank’s identity: customer-focus, service quality, stability and support for the eco-
nomy. These fundamental principles have guided the Bank since its creation in 1856
and continue to shape its future development. Our employees embody these same
values in their daily tasks. The entire staff at BCEE is highly attentive and responsive
as it strives to fulfil the Bank’s primary objective: providing the highest possible
level of customer satisfaction.
BCEE guides and supports its customers throughout the different stages of their
lives, maintaining long-term relationships based on trust and respect:
"Spuerkeess - Äert Liewen. Är Bank."

6
2 RAPPORT DE GESTION DE LA BCEE

7
2 RAPPORT DE GESTION DE LA BCEE TABLE OF CONTENTS
1 MESSAGE FROM THE PRESIDENT OF THE EXECUTIVE COMMITTEE AND
THE CHAIRMAN OF THE BOARD OF DIRECTORS 1
2 BCEE GROUP CONSOLIDATED MANAGEMENT REPORT 3
3 GOVERNING BODIES OF THE BANK 15
4 STATEMENT ON THE COMPLIANCE OF THE FINANCIAL STATEMENTS 17
5 AUDITED CONSOLIDATED FINANCIAL STATEMENTS 18
6 ORGANISATION CHART OF THE BANK 123
This document is a translation from the original Consolidated Annual Report in French. In case of differences between the French version and the translation, the French version is to be retained.

1 MESSAGE FROM THE PRESIDENT OF THE EXECUTIVE COMMITTEE AND THE CHAIRMAN OF THE BOARD OF DIRECTORS
1
“The global economy grew measurably in 2016 in an environment
of highly accommodative international monetary policies.
Despite slowing growth in China and the lack of investment in
developed countries, the resilience of international trade helped
support the economy at the global level. Regional conflicts and
terrorist attacks around the world, as well as plunging commodity
prices, are and will remain dampers on the economy.
Economic activity turned positive in Luxembourg as well,
although a number of uncertainties remained. The economic
climate continues to pose a major challenge for credit institutions.
Group Banque et Caisse d’Epargne de l’Etat, Luxembourg
(BCEE) ended the year with a banking income of EUR 580,2
million and net profit of EUR 261,8 million, down 4,8% from
2015.
BCEE continued to play its role in supporting the national
economy over the past year, and was also able to confirm its
excellent financial strength. Since November 2014, BCEE has
been under the supervision of the ECB due to the start of the
Single Supervisory Mechanism. The rating agencies Standard &
Poor’s and Moody's have again assigned excellent ratings of
AA+ and Aa2 (Long Term Deposit Rating) and thus affirmed
BCEE's exceptional financial strength. Further highlighting the
pertinence of these ratings, BCEE was once again ranked among
the world's 10 safest banks. Based on the above, the Board of
Directors and the Executive Committee remain confident in the
strategy of blending prudence with cutting-edge innovation
implemented since the Bank’s beginnings.
The loyalty of the existing customer base and the continual
addition of new banking customers are confirmation that BCEE
has taken the right approach to its customers. It is increasingly
omnichannel and has combined the traditional branch network
with digital means of customer communication. At the same
time, the Bank has pursued its goal of providing high-quality
services and products to its customers with professionalism. This
is reflected in the significant market share that the Bank enjoys
in the major customer segments in Luxembourg.
BCEE seeks to use its strengths, including its historical roots in
the Luxembourg economy, its experienced and dedicated sales
teams, its country-wide branch network and its capacity for
innovation, to partner not only with private customers but also
with commercial, cottage and industrial undertakings. Regular
discussions, transparency, understanding and trust remain the
key components of a successful long-term partnership between
customers and their bankers. The Bank listens closely to its
customers' needs so as to continue to offer the highest-quality
products and services.
The year 2016 brought some significant changes to the
Spuerkeess, including the arrival of a new Executive Committee
team. While the newly appointed Executive Committee intends
to pursue the directions outlined in the past and remains firmly
grounded in the Bank's policy, it has also embarked on a series
of internal restructurings to account for new regulatory
requirements and evolving customer needs. The very active
support of colleagues who are more closely involved in these
projects has enabled us to make tremendous progress in just a
few months.
Another key event in 2016 was the opening of the Bank’s new
building, formerly the headquarters of ARBED and now known
as “19 Liberté”. It was acquired in 2015 and became fully
operational in the summer of 2016 after major renovation work
and upgrades to meet the technical and security requirements of
a modern bank. This architectural gem has thus become an
exciting economic and cultural hub, to the great delight of our
employees, our customers and the visitors we welcome for any
kind of events.
Despite the many positive events in 2016, we believe that we
should also not lose sight of the challenges that the Bank is sure
to face during 2017. As in the past, BCEE will take the necessary
steps to overcome all these challenges, whether economic,
technical, regulatory or prudential, in keeping with its social
responsibility and its role in supporting the national economy.
Corporate social responsibility holds a specific place at BCEE,
deriving from its status as an autonomous public institution. It is
a factor that generates added value and is an integral part of the
corporate culture. For more than 160 years, BCEE has played its
role as a socially and economically responsible company. The
objective of social responsibility is also enshrined in article 5 of
the organic law of 24 March 1989 on BCEE: As a State bank,

2
1 MESSAGE FROM THE PRESIDENT OF THE EXECUTIVE COMMITTEE AND THE CHAIRMAN OF THE BOARD OF DIRECTORS 1 MESSAGE FROM THE PRESIDENT OF THE EXECUTIVE COMMITTEE AND THE CHAIRMAN OF THE BOARD OF DIRECTORS
“BCEE has the mission to contribute to the economic and social
development of the country in all areas through its activities,
particularly its financing activities, and to promote savings in all
forms”.
Finally, we would like to take this opportunity to thank all
members of staff at the Bank for their commitment throughout
Françoise THOMA
Chief Executive Officer
President of the Executive Committee
Victor ROD
Chairman of the
Board of Directors
the 2016 financial year. We firmly believe that, together with the
Bank's executive bodies, we can meet the challenges that the
Bank will no doubt face during 2017 and beyond."

3
2 BCEE GROUP CONSOLIDATED MANAGEMENT REPORT
The pace of the cyclical recovery in the global economy remained
modest in 2016 and slowed slightly from 2015. While growth
lost some momentum in developed countries, it stabilised in
most emerging countries.
Early-year concerns played a role in the first-quarter decline in
Luxembourg's GDP. Beginning in the second quarter, however,
economic activity in Luxembourg was boosted by a much more
buoyant business climate. According to the most recent STATEC
forecasts, GDP was expected to grow by nearly 3,7% in 2016,
i.e. fairly close to the average growth rate before the 2008 crisis.
In addition to these forecasts, the job market proved resilient
with the unemployment rate down slightly.
Trends in Luxembourg’s financial sector were positive in 2016
following the financial market recovery late in the year, despite
the extremely low rate environment. Luxembourg's investment
fund industry continued to improve and saw an increase in
assets under management.
The BCEE Group comprises the Banque et Caisse d’Epargne de
l’Etat, Luxembourg and its fully consolidated subsidiaries and
associates consolidated using the equity method.
COMMERCIAL MOMENTUM IN RETAIL, PROFESSIONAL,
CORPORATE AND PUBLIC SECTOR BANKING
Retail and Professional
The Bank continues to pursue its strategy of investing
simultaneously in modernising and optimising its branch network
and in developing digital banking solutions. It opened two new
branches in 2016, one in the European Commission building in
Gasperich and the other in the Euroforum building. The new
locations were all designed to give customers the best possible
welcome, and they reflect the Bank's current strategy of serving
the local community and offering the highest level of
convenience. These sites are equipped with the most modern
banking technologies and provide customers with self-service
banking kiosks in multipurpose reception areas, Wi-Fi connections
and tablets for optimum access to information.
BCEE manages the largest number of automated teller machines
(ATMs) in the country. These were extensively modernised to
give customers access to new functionalities, such as choice of
banknote denomination and higher withdrawal limits. A number
of ATMs offering the deposit/payment function have been
installed around the country, significantly facilitating cash
transactions. Mobile ATMs were supplied to several major events
and supplemented this infrastructure in 2016.
The Bank equipped all the teller windows in its branch network
with signing pad tablets. This new banking technology allows
transactions to be signed electronically and accounting
documents to be archived automatically.
In an effort to continue to modernise its communications with
its customers, BCEE continued to roll out digital displays with
dynamic screens placed both inside branches and in windows.
During 2016, 25 branches were equipped with screens used for
advertising and informational purposes.
To reduce the risk related to cash processing and its associated
costs, the branch network reached out to customers to advise
them about payment alternatives by promoting the use of digital
payment channels and the option of aggregating, or even
centralising, their cash transactions.
A new TWEENZ offer, intended for children 6 to 12 years old,
was launched and seeks to combine savings education with
leisure activities. They can use their membership card to obtain
reductions on entrance fees for certain activities and to attend
events.
The commercial results show that the branch network continues
to improve customer loyalty by developing a long-term
relationship of trust. Extensive training gives the sales force a
high level of knowledge of banking techniques and current
regulations.
Despite rising housing prices, BCEE has grown its home loan
business, with a sharp 6,1% increase in the portfolio over 2015.
A rising share of new home loans were granted at a fixed rate,
which protects the customer against future interest rate hikes.
Savings deposits continued to increase as customers seek
security amid financial market uncertainty.

4
As was the case in the branch networks, the encouraging
growth in Private Banking can be attributed to the loyalty of the
existing customer base and the continual addition of new
customers seeking a stable and skilled banking partner.
Returns on money-market investments remained very low as the
European Central Bank (ECB) continued to pursue its highly
accommodative monetary policy. On the other hand, BCEE was
able to successfully allocate assets to offer its customers
attractive investment solutions within its range of funds, along
with dedicated discretionary portfolio management solutions.
In 2016, the Bank launched a new sub-fund of the Lux-Portfolio
SICAV (open-end investment fund), called Lux-Portfolio Global
Flexible Serenity, which features flexible allocation among
different asset classes. This flexibility allows it to take advantage
of interest-rate or stock-market opportunities by investing up to
50% in equities.
Multiple training sessions have been held to give Private Banking
advisors and investment advisors a high level of skills in financial
market operations and regulations.
Through customised support from advisors, customer
conferences and financial publications, customers have the
economic and financial information they need to closely monitor
Private Banking's investment strategies and incorporate them
into their investment decisions.
In electronic banking services, BCEE added new functionalities
to its S-net Mobile application for smartphones and tablets in
2016, making it possible to manage standing orders as well as
buy and sell securities. This application was a huge success as
soon as it was launched and strengthened the perception of the
Bank as the standard-bearer in electronic banking. These
significant investments were made with the aim of offering a full
range of products and services online in the near term.
Corporate and Public Sector
BCEE held on to its leading position in the highly coveted public
sector customer financing segment.
The optimism expressed by business leaders in the most recent
report by the Luxembourg Business Compass in June 2016 was
reinforced when the latest growth forecasts were released.
These executives had in fact expected investment volumes to
increase steadily in 2016. The picture was muddied only by the
12% increase in the number of bankruptcies in 2016, to 983.
This uptick should nevertheless be viewed in context as total
domestic employment rose over the period.
Entrepreneurs’ optimism is reflected in the positive trend in the
corporate and public sector customer financing activities. As in
the previous year, funding granted was once again above the
EUR 2 billion mark. Loans outstanding in the Corporate Banking
unit increased primarily due to the strong performance by the
SME and Real Estate Development segment.
The Corporate Banking activities’ move to the “19 Liberté”
building, combined with the pick-up in commercial momentum,
helped build synergies with the Private Banking activity. The
move came with the development of a computerised paperless
system for the credit chain and electronic management of all
documentation.
FINANCIAL MARKETS AND INVESTMENT FUNDS REVENUES
Financial markets
Treasury activity volume was steady in 2016. Customer deposits
performed well and the Bank reduced the volume of its
international refinancing programmes due to the reduction in
financing requirements and in market opportunities.
In reinvestments, a significant share of the funds was directed to
government securities and other securities eligible for refinancing
with the ECB, especially a low-risk, high-liquidity bond portfolio
that reached EUR 10,1 billion. Loans and receivables to credit
institutions were down 26,7% to �EUR 4,1 billion as at 31
December 2016.
In order to improve the performance of cash transactions and
reduce their credit risk, BCEE made extensive use of derivatives.
At the end of 2016, outstanding foreign exchange swaps and
forward transactions amounted to more than EUR 13,3 billion.
At the same date, outstanding interest rate swaps (IRS) and cross

5
2 BCEE GROUP CONSOLIDATED MANAGEMENT REPORT
currency interest rate swaps (CIRS) totalled EUR 12,1 billion.
EUR 0.8 billion in loans were guaranteed by eurozone public
debt securities as part of repurchase agreements.
In 2016, the ECB further eased its monetary policy while the
Federal Reserve (Fed) continued to raise rates slightly. The main
surprise came from the United Kingdom, where the Bank of
England was forced to adapt to a new environment in light of
the outcome of the referendum on the European Union. All in
all, European and US monetary policies diverged, leading to a
significant widening of their short-term rate spreads.
The ECB cut its key rates again on 16 March 2016. The marginal
rate was lowered to 0,25% and the repo rate to 0%, while the
deposit rate sank a bit deeper into negative territory, to -0,40%.
Also in March, the ECB increased its monthly purchases and
introduced its new corporate sector purchase programme
(CSPP), which was also intended to improve the transmission
mechanisms of monetary policy. The only question mark for the
markets was the announcement of a possible recalibration of
the asset purchase programme (APP) in December. This did in
fact occur; in addition, the ECB eliminated the lower limit on the
yield and decreased the minimum maturity from two years to
one.
In 2016, the Fed showed some sensitivity to the international
environment. In particular, were it not for the uncertainties
caused by the UK's referendum on the European Union, it would
likely have raised rates earlier in the year. Ultimately, it waited
until December to lift the Fed funds target rate to 0,625% (mid-
range).
The foreign exchange market was extremely volatile in 2016 due
to the mounting political risks related to Brexit and the US
elections. It was dominated primarily by movements in the dollar
and indirectly by changing Fed policy expectations. The foreign
exchange market thus went through two phases. The dollar
depreciated significantly in the first half of the year due to fears
of a sharp slowdown in US growth related to the emerging crisis
in January/February and the Brexit victory in June. However, it
appreciated again in the second half of the year on rising
expectations of a Fed interest rate hike.
While the year got off to an especially risky start, the credit
markets performed surprisingly well. Credit spreads initially
widened amid falling oil prices, a surge in corporate defaults in
the United States and tension in the European banking sector.
The ECB's announcement that it would implement a corporate
sector purchase programme from March 2016 sparked a rally on
all the credit markets; further impetus came from the rebound
in oil prices which lasted through the end of June. The second
half of 2016 saw stabilising oil prices, rate hikes as from early
October, mounting political risks and a busy election season
starting in 2017.
As in previous years and in accordance with prudential rules on
liquidity, BCEE remained true in 2016 to its defensive investment
policy of generating returns appropriate to the risks incurred
while preserving invested capital. In a low interest rate
environment, the Bank was nevertheless able to invest selectively
in high-quality bonds that are eligible for the liquidity buffer and
in corporate and senior bank issues. It was thus once again able
to generate an entirely satisfactory level of profitability on a
high-quality investment portfolio that has improved from year to
year.
Investment Funds
At 31 December 2016, there were six open-end investment
funds (SICAV) in the in-house range, composed of 30 sub-funds,
representing EUR 3,5 billion in total assets, up compared with 31
December 2015.
The number of funds was reduced from 13 to 6 in 2016 to make
a clearer distinction between the different investment policies.
S-PENSION, BCEE’s private pension scheme product, the
underlyings of which are the sub-funds of the Lux-Pension open-
end investment fund, continued to find favour with customers
eager to have additional income for retirement while currently
enjoying tax benefits granted by the legislator.
Benefiting from BCEE’s confirmed financial soundness and the
excellent quality of services for Financial Sector Professionals
(FSP), the investment fund custodian bank business grew very
dynamically. With a total of some EUR 24,5 billion in assets
under management, BCEE was again among the leading service
providers for Luxembourg investment vehicles. The exposure of

6
2 BCEE GROUP CONSOLIDATED MANAGEMENT REPORT
third-party promoter funds, for which BCEE ensures the
administrative management and the function of custodian bank,
amounted to some EUR 21,0 billion at the end of 2016, a
11,5% increase compared with 2015.
OTHER ACTIVITIES
Other activities include back office and support activities, which
play an essential role in supporting the Bank’s strategic and
development goals. Back office activities make it possible to
process the growing volumes of payment, credit and securities
transactions from the commercial units and ensure control and
security in processing these transactions in accordance with the
laws in force. BCEE is continuing its efforts to improve
productivity in order to adapt to changing markets.
Support activities cover a wide variety of areas, such as Bank
finances, legal and regulatory matters, organisation, marketing,
logistics and IT.
At a time when good governance is gaining in importance, the
Compliance function manages its compliance and sanctions
risks under the increasingly complex rules applicable to the Bank
around anti-money laundering, counter-terrorist financing and
tax compliance.
Regulatory activities
The Bank remained very active on the regulatory front because
of the large number of ongoing projects and the work associated
with the Single Supervisory Mechanism (SSM) whose aim is to
ensure the safety and soundness of the European banking
system and to increase financial stability in Europe. The SSM is
one of the three pillars of the banking union, along with the
Single Resolution Mechanism (SRM) and the Deposit Guarantee
Scheme (DGS).
The SRM’s goal is to minimise the cost to taxpayers and the real
economy of resolving banks that are part of the banking union
which could face serious challenges. This mechanism has been
fully operational since 1 January 2016 and was transposed into
Luxembourg law by the law of 18 December 2015.
The DGS, also introduced in Luxembourg with the law of 18
December 2015, requires that each EU Member State establish
a deposit guarantee scheme that protects customers' bank
deposits up to EUR 100.000 per bank. In Luxembourg, this
responsibility has been given to the Fonds de garantie des
dépôts luxembourgeois (FGDL, Luxembourg deposit guarantee
fund), which replaced the Association pour la garantie des
dépôts Luxembourg (AGDL, Luxembourg deposit guarantee
association) on 1 January 2016.
In 2016, BCEE made its second contribution to the single bank
resolution fund established by the SRM. It made its first
contribution to the FGDL over the course of 2016.
The Bank also participated, in the context of the Supervisory
Review and Evaluation Process (SREP), in the 2016 stress test
organised by the ECB to verify the ability of systemically
important financial institutions to withstand adverse
macroeconomic developments. The results of this exercise,
which confirmed BCEE’s soundness, will be considered in the
ongoing assessment of BCEE’s risks.
In the context of the European tax transparency objective, the
automatic exchange of tax information was incorporated into
Luxembourg legislation with the transposition into Luxembourg
law of Directive 2014/107/EU, in force since 1 January 2015.
At the international level, the OECD has developed the Common
Reporting Standard (CRS) which manages the automatic
exchange of tax information at the global level between states
that have adopted the standard. The European Union has
adopted the CRS and in 2016 BCEE finalised the work of
complying with the new regulatory requirements. BCEE's first
transmission will be in 2017 and will cover the tax information
for 2016.
Management changes
Ms Françoise Thoma was appointed Chief Executive Officer
effective 1 June 2016. She succeeded Mr Jean-Claude Finck,
who has retired.
Mr Aly Kohll joined the Executive Committee effective 1 June
2016 following the retirement of Mr Gilbert Ernst.
Mr Romain Wehles joined the Executive Committee effective 1
February 2017.
7
2 BCEE GROUP CONSOLIDATED MANAGEMENT REPORT
Adjustments to the Bank’s organisational chart
The “Spuerkeess 2020” strategic plan was the starting point for
the Executive Committee to carefully consider the best way to
serve and grow the customer base. To that end, it decided to
create a new Institutional Clients department that would
absorb, in particular, the former Investment Funds department
but take on broader responsibilities. The clients served by the
new department will consist primarily of the Luxembourg state,
supranationals, banks, financial sector professionals, funds,
management companies, insurance companies and reinsurance
companies.
To account for the new regulatory requirements governing risk
management and the separation of the sales and control
functions, the Executive Committee also decided to create a Risk
Management function (formerly the Risk Control unit) that now
reports directly to it.
The new organisational chart, dated 1 March 2017 and provided
in Chapter 6 of the annual report, is also available on the Bank’s
website at www.bcee.lu under “Annual reports”.
Logistics infrastructure
The new “19 Liberté” building was inaugurated on 5 July 2016
after a one-and-a-half-year renovation project to improve its
energy efficiency and interior. The Corporate Banking and
Private Banking units, among others, now work out of this new
site, which enables them to give customers the best possible
welcome.
Shareholdings
Fulfilling one of its statutory tasks, which involves contributing
to the country’s economic and social development in all areas
through its financing activities, in addition to promoting savings,
BCEE continues to hold equity interests directly or indirectly, in
key sectors of Luxembourg’s economy. It also supports the start-
ups and the development of businesses with a national interest.
Since 1989, BCEE has been a 40,0% shareholder of
La Luxembourgeoise Société Anonyme d’Assurances and
La Luxembourgeoise-Vie Société Anonyme d’Assurances.
Compagnie Financière La Luxembourgeoise S.A. and BCEE are
indirectly shareholders of PECOMA Actuarial and Risk S.A.
which is active in the development and implementation of
supplementary pension schemes and which offers actuarial,
administrative and accounting management services for pension
schemes.
Media and telecommunications are also important sectors for
Luxembourg’s economy. The Bank is a founding shareholder of
SES S.A., the world leader in global satellite communications.
The Bank holds a 10,9% stake with the associated voting rights.
In the air transport sector, BCEE holds equity interests in Luxair,
Société Luxembourgeoise de Navigation Aérienne S.A. (21,8%),
which is active in air navigation, tour operation, cargo handling
and catering, and in Cargolux Airlines International S.A. (10,9%),
which is one of the world’s largest all-cargo airlines.
The Bank holds 22,7% of the capital of Société de la Bourse de
Luxembourg S.A., of which it is also a founding member and the
largest shareholder. Through its stake in Paul Wurth S.A., the
Bank continues to support design and industrial engineering
businesses.
Through its 11,0% stake in the capital of Société nationale des
habitations à bon marché S.A. (S.N.H.B.M.), which specialises in
the design and construction of single-family homes and
apartment buildings at affordable prices and under long-term
leases, BCEE is fulfilling its social mission of facilitating home
ownership for personal needs.
In March 2016, the Bank also acquired a 12,0% stake in the
capital of Encevo S.A., the holding company for Luxembourg's
market-leading energy group. The acquisition of this stake is
consistent with BCEE's past equity investments in other
Luxembourg economic sectors.
In addition to these major shareholdings, the BCEE Group has
interests in other companies active in the development of
economic life.
Human resources
BCEE remained an attractive employer on the Luxembourg job
market in 2016 and the number of applications it received
continued to rise. An effective orientation programme helps
integrate new hires in a changing professional environment
while providing extensive integration training geared to the

8
2 BCEE GROUP CONSOLIDATED MANAGEMENT REPORT
mounting challenges facing the Bank's various businesses. BCEE
again participated in various career fairs and the www.
mylittlebigstep.lu website remains the entry point for applications.
Candidates can find information there and also apply online.
The objective-based management approach provided for in the
civil service reform was introduced in 2016. All staff are
therefore given a formal job description covering both their
duties and the skills and knowledge required to fulfil them. This
approach clarifies where all staff are positioned within the Bank’s
organisational chart and is viewed as a real human resources
management tool. Similarly, professional performance
assessments were introduced in 2016 with the aim of conducting
regular reviews of staff knowledge and skills and providing
constructive feedback, thereby encouraging professional
development.
Bank employees’ continued professional development is also
supported by other tools, including a strong continuing
education programme and a proactive internal mobility
approach, to meet customers’ needs and satisfy regulatory
requirements.
Corporate governance
While BCEE has always been committed to a corporate culture
based on good governance rules, the principles of governance
have become the major pillars governing the organisation and
activities of financial institutions and have continued to evolve
since Circular CSSF 12/552. For systemically important banks
such as BCEE, the European regulator is increasingly stressing
the importance of good governance and continues to make it a
major theme for 2017.
Corporate social responsibility (CSR)
In keeping with its mandate under Article 5 of the organic law,
BCEE seeks to be the reference on Luxembourg’s financial centre
with regard to CSR, with particular emphasis on proximity to the
customer, promotion of savings, housing loans, granting of
loans according to social criteria, shareholding in major
Luxembourg companies, banking services for SMEs, and
financing of equipment and public and paragovernmental
authorities.
Furthermore, since 2012, BCEE has been certified as an
“Entreprise socialement responsable” (ESR, socially responsible
company) by the Institut national pour le développement
durable et de la responsabilité sociale des entreprises (INDR,
National Institute for Sustainable Development and Corporate
Social Responsibility).
The Bank’s social commitment was strengthened in 2016 with
the establishment of an internal CSR Committee. Its aim is to
promote all CSR actions and commitments, as well as to fulfil
any new relevant regulatory requirements in the future.
To establish its presence, BCEE will continue to promote this
philosophy and support various organisations and events to raise
awareness of sustainable development issues.
Cultural, sponsorship and patronage activities
BCEE supports actions promoting culture, sports, the
environment, and social welfare. Together with its partners, the
Bank makes a sustained commitment to actions and events in
keeping with its ethical standards and the values of proximity
and professionalism.
As it does every year, the Bank once again assisted in various key
music and sport events and supported a large number of local
cultural, sports and student initiatives across the country.
BCEE continues to demonstrate its cultural commitment through
its contemporary art gallery “Am Tunnel” & Espace Edward
Steichen.
The Bank Museum traces the history of Luxembourg’s financial
centre and of BCEE since 1856. It underwent a complete
renovation at the end of 2015 and was very popular in 2016,
particularly among student groups.
More than ever, these sites are now two of the capital's leading
attractions, both for Luxembourg's population and for its many
foreign visitors.
In addition, at the initiative of Their Royal Highnesses the Crown
Prince and the Crown Princess, an art exhibited titled “De Mains
de Maîtres” was organised from 1 to 5 December 2016 in the
new “19 Liberté” building. This extraordinary exhibit highlighted

9
2 BCEE GROUP CONSOLIDATED MANAGEMENT REPORT
talent and creativity and the importance of transferring
knowledge to younger generations of craftsmen and creative
artists. It was a great success among art lovers from Luxembourg
and abroad.
RISK MANAGEMENT POLICY
BCEE places a particular emphasis on risk management.
Creation of a Risk Management Committee
The Bank conducts its day-to-day business while pursuing its
strategic objectives and a prudent risk management policy,
within the Bank’s risk appetite limits. The Risk Committee is
made up of members of the Executive Committee and members
of the Risk Subcommittee.
Risk management is described in detail in note 6 to the financial
statements as at 31 December 2016. This chapter is subdivided
into several major risk categories.
Credit risk
Credit risk is the risk of financial loss on the Bank's receivables
due to a deterioration in the credit quality of debtors, which
could even result in the default of a debtor or the inability to
recover assets deposited with third parties. Credit risk concerns
both actual and potential receivables.
Each Bank commitment giving rise to a credit risk is subject to
prior analysis of the debtor's credit quality by the Credit Analysis
and Management department (formerly the Risk Analysis
department). The debtor's credit quality is thus assigned a
rating. The Bank's internal ratings are a direct component of the
credit risk management system insofar as they are one of the key
parameters used to set limits.
Decisions on loans to the domestic economy are made by the
various credit committees, organised hierarchically according to
the customer’s overall credit outstanding. Residential mortgage
loans account for more than half of the portfolio and credit risk
is assessed, first, on the basis of customers' general
creditworthiness and, second, through the process of assessing
their ability to repay loans or the existence of collateral.
A majority of counterparties in the international portfolio are
banks and financial institutions. Internal ratings are applied to
banking counterparties using a combination of quantitative and
qualitative analyses. The quantitative component is based on
financial ratios that best describe the counterparty’s profitability,
capital strength, liquidity and the quality of its assets, while the
qualitative component is based on the analyst’s own assessment
of non-financial factors such as market share and governance.
An initial investment is made only with counterparties classified
as investment grade.
For international commitments to non-financial entities, priority
is also given to counterparties classified as investment grade in
OECD countries, mainly in Europe and North America. Like all
the Bank’s counterparties, these are assigned an internal rating
based on rules similar to those applied to banks and financial
institutions.
Outstanding amounts are subject to counterparty and sector risk
monitoring and to regular checks based on updated financial
analyses and proposed adjustments to limits per counterparty.
The Bank also applies a country limit system for all foreign
countries in which it is active. These limits are periodically
reviewed.
The European Market Infrastructure Regulation (EMIR) aims to
reduce bilateral counterparty risk by requiring the use of central
counterparty (CCP) clearing for derivative financial instrument
transactions. To comply with this obligation, the Bank has opted
to work not through direct access to a central counterparty but
rather through direct members, known as clearing brokers.
Market risk
Market risk is the risk of loss arising from unfavourable changes
in various financial parameters, the main ones being interest
rates, share prices and foreign exchange rates.
The Bank’s market risk management policy distinguishes
between mismatch risk, which arises from structural mismatches
between the maturities of resources and the use made of those
resources in the Bank’s statement of financial position, and the
risk associated with cash management and trading activities.
Mismatch risk is handled by the Asset Liability Management
(ALM) Committee, consisting of the members of the Executive

10
2 BCEE GROUP CONSOLIDATED MANAGEMENT REPORT
Committee, several commercial department heads, and the
heads of the Credit Analysis & Management and the Accounting
departments. The ALM Committee is responsible for establishing
the broad guidelines for interest rate risk management beyond
two years and for setting the target ALM profitability. The ALM
Committee is assisted by an ALM Subcommittee, which meets
monthly.
IRRBB
In 2016, the Bank launched a comprehensive project to improve
its ability to analyse and manage interest rate risk (“Interest rate
risk in the banking book”).
Liquidity risk
Liquidity risk results from a potential mismatch between
financial inflows and outflows on a specific date. The risk for a
credit institution is that it may be unable to meet its payment
obligations at a given point in time as a result of having
insufficient liquid assets relative to its maturing liabilities. By
virtue of its financial structure, the Bank is generally in a position
of excess liquidity.
The Bank constantly monitors liquidity risk on the basis of
maturities, including both very detailed reconciliation of cash
inflows and outflows over a six-month horizon and a medium-
and long-term assessment of structural funding requirements
monitored by the ALM Committee.
In accordance with the Capital Requirements Regulation (CRR)
and with the Commission Delegated Regulation of 10 October
2014, BCEE has, since 2015, published its liquidity coverage
ratio (LCR), intended to ensure sufficient 30-day liquidity. At 31
December 2016, the LCR was 135%, well above the minimum
threshold of 70% for 2016. BCEE is moreover targeting a level
far above the regulatory minimum. The net stable funding ratio
(NSFR), intended to ensure sufficient one-year liquidity, will enter
into force in 2018.
Leverage ratio
The leverage ratio measures the proportion of Tier 1 capital to
total assets excluding collateral and including all risk-weighted
off-balance sheet commitments. In other words, it is the “Core
Tier 1 capital/total assets and risk-weighted off-balance sheet
commitments” ratio. This ratio is not based on risk but is an
additional tool intended to limit the use of excessive leverage in
the banking sector. BCEE's leverage ratio was 5,8% (regulatory
minimum: 3,0%) at 31 December 2016.
Operational risk
Generally speaking, operational risk is the risk of losses arising
from inadequate or faulty internal procedures, human or system
errors or external events. The Bank controls operational risk
through the application of detailed rules and procedures, as well
as an internal control system implemented at all levels and
monitored by the Bank’s senior management.
To centralise management of operational risk, the Bank uses a
computer application to manage internal incidents in accordance
with Basel III methodologies. The Bank maintains a database of
all incidents having an impact on its performance and relating to
human or system failure. These incidents are also analysed on a
recurring basis by a number of the Bank’s committees.
The Bank aims to reduce operational risk by continuously
improving its operating systems and organisational structures.
Financial risk and hedge accounting
The consolidated financial statements of the BCEE Group have
been prepared in accordance with IFRS as adopted by the
European Union and comprise the parent company, subsidiaries
and entities over which the Bank has control when it has rights
to economic returns, through its relationship with those entities,
and the ability to affect those returns through its power over
those entities.
Subsidiaries are consolidated from their date of acquisition,
when the Bank, as the parent company, has the power to direct
their financial policies. They are deconsolidated on the date such
control ceases.
The Bank uses derivative financial instruments to hedge against
interest-rate, foreign-exchange, and fixed-price risks (stock
market indices and share prices). The derivative financial
instruments commonly used are IRS and CIRS in standard plain
vanilla hedging transactions. In addition to these standardised
contracts, the Bank uses swaps with structured components to
specifically hedge structured issues and acquisitions of bonds
containing embedded derivatives, provided they are closely
related.

11
2 BCEE GROUP CONSOLIDATED MANAGEMENT REPORT
Derivative financial instruments are considered as being held for
trading except where they are designated as hedging instruments.
When entering into a contract, the Bank may designate certain
financial instruments as hedging instruments, if the transactions
meet the criteria set out in IAS 39. The Bank primarily uses fair
value hedges.
Management and monitoring of risks inherent in compiling
financial reporting
The Bank has developed procedures and control systems to
compile and monitor financial information. To provide an
assurance of the quality and completeness of financial
information, the Bank conducts daily checks on internal account
movements, monitors the main headings of the income
statement, including interest margin, fees and general and
administrative expenses, and verifies the completeness of the
information gathered through different IT applications before
being fed into the accounting information system. The Bank
reconciles the balances of pending accounts, interest accrual
accounts and other internal accounts on a monthly basis.
The Bank also draws up a daily trial balance so that each of its
entities, including the trading room, can monitor the impact of
their operations.
The accounting department and risk management unit work in
close cooperation to evaluate portfolio positions or to calculate
valuation allowances for assets showing evidence of impairment.
Besides purely accounting controls, the Bank regularly monitors
its profitability by customer, product and business line and
conducts a monthly analysis of the spending budget. The
Executive Committee uses a Management Information System
(MIS) to monitor the performance of the Bank’s business lines.
Similarly, it analyses and validates the Bank’s financial position
and monitoring of the spending budget on a monthly basis.
IFRS 9 “Financial instruments”
In 2016, the Bank prepared for inplementation of IFRS 9, which
will replace the current IAS 39 “Financial instruments: Recognition
and measurement” effective 1 January 2018. IFRS 9 has three
phases:
Phase 1: Classification and measurement. This phase involves
defining the Bank’s business models and determining financial
instruments’ compliance with the “solely payment of principal
and interest” (SPPI) criterion.
Phase 2: Impairment. This phase, which replaces the incurred
loss model under IAS 39 with a forward-looking impairment
model based on expected losses, was the focus of a great deal
of work in 2016 with the aim of evaluating its future impacts.
Phase 3: Hedge accounting. Application of this phase, which
covers the principles of hedge accounting and its implementation,
is not compulsory. This topic will be examined in the first-half
2017.
Compliance with the CRR
BCEE meets market requirements through compliance with
Regulation (EU) 575/2013, one of the objectives of which is to
disclose to the market the Bank's exposure to the above risks.
Information on the composition of capital, the risk management
strategy and the remuneration policy may be found in the
Bank's Pillar 3 publication. This information supplements the
information published in these annual financial statements.
The Pillar 3 report for 2016 is available on the Bank's website at
www.bcee.lu under Financial Reports.
INCOME DOWN SLIGHTLY AND FINANCIAL STRENGTH
CONFIRMED
The Group’s net profit fell by 4,9% compared with the 2015
financial year.
Net banking income declined by 9,2% to EUR 580,2 million as
at 31 December 2016.
Net interest margin fell by 4,5% due to the low, if not negative,
interest-rate environment which limits investment and maturity
switching opportunities despite higher business volumes.
Income from variable-income securities rose by 16,4%.
Fee income was down 1,6% on weakness in the securities
business due to adverse stock market conditions in the first half
of the year and a regulatory change that depressed income in
the payment activities.

12
2 BCEE GROUP CONSOLIDATED MANAGEMENT REPORT
Income from financial instruments decreased from EUR 81.5
million at the end of 2015 to EUR 44,8 million as at 31
December 2016. More volatile in nature, this revenue item
includes income from securities and derivatives trading, the
disposal of available-for-sale financial assets, fair value hedging
transactions and forex transactions. The decrease in revenue
from this category was due primarily to the decline in income
from the sale of securities and from financial instruments held
for trading.
The measurement of fixed-income securities, which are classified
as available-for-sale financial assets, is recognised in equity
under the heading “revaluation reserve”. The same is true for
the measurement of variable-income securities classified as
available-for-sale financial assets. The decrease in valuations of
securities during the year had an influence on the revaluation
reserve, which amounted to EUR 661,8 million at the end of
2016, down EUR 99,1 million or 13,0% compared with 31
December 2015.
Other operating income and expenditure fell from EUR 5,9
million at year-end 2015 to EUR -3,2 million at the end of 2016.
Despite a rigorous cost control policy, total general expenses,
including allowances for impairment of tangible and intangible
non-current assets, were up 4,7%. This stemmed primarily from
higher expenses associated with the implementation of new
banking regulations and with their supervision and from the
increase in allowances for impairment of tangible and intangible
non-current assets following the opening of the “19 Liberté”
building on 5 July 2016.
Following favourable resolutions of certain loans in default, for
which an allowance for impairment was recognised, the Bank
was able to record reversals of net allowances for impairment of
individual and collective credit risks of EUR 0,6 million in 2016.
The proceedings brought against BCEE by the German
authorities, which had opened tax investigations against certain
customers residing in Germany, were terminated after a
settlement was reached at the end of December 2016. The
amount of the provision the Bank had recorded in its financial
statements was high enough to prevent the settlement from
having a negative impact on the 2016 results.
In view of the above, the BCEE Group recorded a EUR 13,4
million decrease (-4,9%) in net profit to EUR 259,8 million in
2016 from EUR 273,2 million in the prior year.
ANALYSIS OF THE STATEMENT OF FINANCIAL POSITION
The statement of financial position totalled EUR 43.468,6 million
as at 31 December 2016, an increase of EUR 657,2 million
compared with the end of 2015. This increase came primarily
from the increase in customer deposits.
On the asset side of the statement of financial position, “Cash
and sight accounts with central banks” rose by EUR 1.374,6
million to EUR 2.687,9 million as at 31 December 2016, mainly
because of the increase in assets deposited with Banque centrale
du Luxembourg (BCL).
Outstanding fixed-income securities totalled EUR 10.067,2
million, an increase of EUR 68,7 million compared with the end
of the 2015 financial year because of the decline in interest rates
which continued on the markets in 2016 and resulted in an
increase in bond prices.
Under this same heading, outstanding variable-income securities
stood at EUR 1.074,1 million, up EUR 68,6 million compared
with end-2015, due primarily to the acquisition in 2016 of a
stake in Encevo S.A., the holding company for the Luxembourg
energy group.
Outstanding loans to credit institutions decreased by EUR
1.492,4 million to EUR 4.105,2 million. This item also includes
the Bank's deposits with other banks, whether or not they are
collateralised with securities.
Outstanding loans to customers increased by EUR 590,9 million
to EUR 19.815,7 million. The increase was driven by the
development of the housing loan and investment loan businesses,
illustrating the constant desire of BCEE to support the ventures
of individuals and businesses.
On the liabilities side of the statement of financial position,
issues of securities decreased by EUR 873,1 million to EUR
4.918,2 million. This decrease is explained by the reduction of
the Bank’s financing requirements due to the lack of attractive
investment opportunities.
Deposits from credit institutions increased by EUR 302,1 million
to EUR 4.741,7 million. This item also includes the Bank's loans
from other banks, whether or not they are collateralised with
securities.

13
2 BCEE GROUP CONSOLIDATED MANAGEMENT REPORT
Michel BIREL
Deputy Chief Executive Officer
Member of the Executive
Committee
Françoise THOMA
Chief Executive Officer
President of the Executive
Committee
Customer deposits increased by EUR 1.192,4 million to EUR
28.115,9 million, driven mainly by strong inflows of deposits
from corporates and individuals. Public sector deposits also
increased but changes in this item remain more volatile as it
depends on the State’s cash needs.
In accordance with Article 38-4 of the Law on the Financial
Sector, the Group reports its return on assets, which stood at
0,60% versus 0,64% in the prior year.
CHANGE IN OWN FUNDS
The BCEE Group’s equity amounted to EUR 4.231,6 million as at
31 December 2016 compared with EUR 4.151,9 million at the
end of 2015, i.e. an increase of 1,9%.
This EUR 79,7 million increase in equity stems from the increase
in consolidated reserves which more than offsets the decrease in
the revaluation reserve and the change in actuarial gains and
losses on the pension fund.
2017 OUTLOOK
The European Central Bank’s recent comments and statements
suggest that short- and medium-term interest rates will remain
extremely low throughout 2017.
In 2017, BCEE therefore expects ongoing pressure on its interest
margin insofar as assets will mature and be replaced at less
favourable conditions. However, barring another acute economic
or political crisis in Europe, BCEE's cost of credit risk should not
see any significant negative changes, apart from the impact of
the entry into force of IFRS 9 on 1 January 2018. Yet, in the
medium term, a prolonged policy of extremely low rates could
create a glut of certain asset classes.
Brexit will continue to have a limited economic impact on the
Bank's activities.
Against this backdrop, the Bank will monitor these developments
closely and will play its role and take its responsibilities, serving
its customers and the country’s economy at large, in line with its
mission statement under the law of 24 March 1989 on BCEE
and with the Bank’s history.
The Bank will also continue to implement its strategy as defined
in the “Spuerkeess 2020” business plan, in particular in the
branch network and in the area of digital banking.
This strategy calls for the gradual renovation of the branches
based on a new concept of service. Customers will also benefit
from a comprehensive and user-friendly electronic banking
interface. The budget provides for substantial investments to
ensure implementation of this omni-channel approach.
Also, significant efforts will be made on projects such as MiFID
II, PSD 2 and IFRS 9.
EVENTS AFTER THE REPORTING PERIOD
No significant events that could impact the normal course of the
BCEE Group’s business occurred after the close of financial year
2016.
Luxembourg, 23 March 2017
For the Executive Committee

14

15
3 GOVERNING BODIES OF THE BANK
The organisation of the Banque et Caisse d’Epargne de l’Etat,
Luxembourg, the leading national financial institution, founded
in 1856, is governed by the law of 24 March 1989, which
defined the respective powers of the Board of Directors and
the Executive Committee. Pursuant to Article 8 of this organic
law, “the Board of Directors defines the Bank’s general policy
and is responsible for management control of the Executive
Committee. All administrative acts and measures necessary or
relevant to the Bank’s purpose fall within the responsibility of the
Executive Committee, subject to such approvals as are required
by virtue of this law”.
Board of Directors (composition as at 1 March 2017)
Chairman M. Victor ROD Directeur honoraire du Commissariat aux Assurances
Vice-Chairman M. Patrick GILLEN Président du Fonds d'Urbanisation et d'Aménagement
du Plateau de Kirchberg
Members M. Georges DENNEWALD Représentant du Personnel
M. Paul ENSCH Directeur honoraire de la Chambre des Métiers
Mme Elisabeth MANNES-KIEFFER Premier Conseiller de Gouvernement, Ministère de l’Economie
M. Manuel NICOLAS Conseiller de Direction 1ère classe, Ministère de l’Economie
M. Nico RAMPONI Représentant du Personnel
M. Jean-Claude REDING Président de la Chambre des Salariés
Mme Betty SANDT Conseiller de Direction, Ministère des Finances
Supervisory Commissioner
M. Bob KIEFFER Premier Conseiller de Gouvernement, Ministère des Finances
Board of Directors
1st row from left to right:M. Bob Kieffer, M. Paul Ensch, Mme Betty Sandt,
M. Victor Rod, Mme Elisabeth Mannes-Kieffer,
2nd row from left to right:M. Nico Ramponi, M. Jean-Claude Reding
M. Patrick Gillen, M. Manuel Nicolas, M. Georges Dennewald

16
3 GOVERNING BODIES OF THE BANK
Executive Committee (composition as at 1 March 2017)
President Mme Françoise THOMA Chief Executive Officer
Members M. Michel BIREL Deputy Chief Executive Officer
M. Aly KOHLL Executive Vice President
M. Guy ROSSELJONG Executive Vice President
M. Romain WEHLES Executive Vice President
Statutory Auditor: PricewaterhouseCoopers S.C. Luxembourg
Executive Committee
From left to right:M. Aly Kohll, M. Guy Rosseljong, Mme Françoise Thoma, M. Michel Birel, M. Romain Wehles

17
Michel BIREL
Deputy Chief Executive Officer
Member of the Executive Committee
Françoise THOMA
Chief Executive Officer
President of the Executive Committee
4 STATEMENT ON THE COMPLIANCE OF THE FINANCIAL STATEMENTS
Luxembourg, 23 March 2017
Statement on the compliance of the consolidated financial statements and management report in accordance with the
provisions of article 3 of the Luxembourg transparency law (“Loi Transparence”).
We hereby declare that, to the best of our knowledge, the consolidated financial statements as at 31 December 2016 of the Banque
et Caisse d’Epargne de l’Etat, Luxembourg have been prepared in accordance with the applicable accounting standards and give a
true and fair view of the assets and liabilities as well as the financial position and results. We also hereby declare that the management
report presents an accurate description of the development, results and situation of the Banque et Caisse d’Epargne de l’Etat,
Luxembourg and of the group of companies included in the consolidated financial statements, taken as a whole, as well as the main
risks and uncertainties facing the Bank and the BCEE Group.
For the Executive Committee

18
5 AUDITED CONSOLIDATED FINANCIAL STATEMENTS
A. Statutory auditor's report
REPORT ON THE CONSOLIDATED FINANCIAL STATEMENTS
In accordance with our engagement by the Government of the
Grand Duchy of Luxembourg, on the proposal of the Board of
Directors of Banque et Caisse d’Epargne de l’Etat, Luxembourg,
we have audited the accompanying consolidated financial
statements of Banque et Caisse d’Epargne de l’Etat, Luxembourg,
and of its subsidiaries (“the Group”), which comprise the
consolidated balance sheet as at 31 December 2016, the
consolidated income statement and the consolidated statement
of comprehensive income, the consolidated statement of
changes in equity and the consolidated statement of cash flows
for the year then ended and a summary of significant accounting
policies and other explanatory information.
Executive Committee’s and Board of Directors’ responsibility for
the consolidated financial statements
The Executive Committee is responsible for the preparation and
fair presentation of these consolidated financial statements in
accordance with International Financial Reporting Standards as
adopted by the European Union, which are submitted for
approval to the Board of Directors, pursuant to the organic law
of 24 March 1989. The Executive Committee is also responsible
for implementing the internal control procedures deemed
necessary to enable the preparation of consolidated financial
statements that are free from material misstatement, whether
due to fraud or error.
Responsibility of the “Réviseur d’entreprises agréé”
Our responsibility is to express an opinion on these consolidated
financial statements based on our audit. We conducted our
audit in accordance with International Standards on Auditing as
adopted for Luxembourg by the “Commission de Surveillance
du Secteur Financier”. Those standards require that we comply
with ethical requirements and plan and perform the audit to
obtain reasonable assurance about whether the consolidated
financial statements are free from material misstatement.
An audit involves performing procedures to obtain audit
evidence about the amounts and disclosures in the consolidated
financial statements. The procedures selected depend on the
judgment of the “Réviseur d’entreprises agréé”, including the
assessment of the risks of material misstatement of the
consolidated financial statements, whether due to fraud or error.
In making those risk assessments, the “Réviseur d’entreprises
agréé” considers internal control relevant to the Group’s
preparation and fair presentation of the consolidated financial
statements in order to design audit procedures that are
appropriate in the circumstances, but not for the purpose of
expressing an opinion on the effectiveness of the Group’s
internal control. An audit also includes evaluating the
appropriateness of accounting policies used and the
reasonableness of accounting estimates made by the Executive
Committee and approved by the Board of Directors, as well as
evaluating the overall presentation of the consolidated financial
statements.
We believe that the audit evidence we have obtained is sufficient
and appropriate to provide a basis for our audit opinion.
Opinion
In our opinion, the consolidated financial statements give a true
and fair view of the financial position of the Group as of 31
December 2016, and of its financial performance and its
consolidated cash flows for the year then ended in accordance
with International Financial Reporting Standards as adopted by
the European Union.
OTHER INFORMATION
The Executive Committee is responsible for the other information.
The other information comprises the information included in the
consolidated management report but does not include the
consolidated financial statements and our audit report thereon.
Our opinion on the consolidated financial statements does not
cover the other information and we do not express any form of
assurance conclusion thereon.

19
5 AUDITED CONSOLIDATED FINANCIAL STATEMENTS
In connection with our audit of the consolidated financial
statements, our responsibility is to read the other information
and, in doing so, consider whether the other information is
materially inconsistent with the consolidated financial statements
or our knowledge obtained in the audit or otherwise appears to
be materially misstated. If, based on the work we have
performed, we conclude that there is a material misstatement of
this other information, we are required to report this fact. We
have nothing to report in this regard.
OTHER MATTER
The Corporate Governance Statement includes information
required by Article 70bis paragraph (1) of the law of 17 June
1992 as amended on the annual and consolidated accounts of
credit institutions governed by the laws of Luxembourg.
REPORT ON OTHER LEGAL AND REGULATORY REQUIREMENTS
The consolidated management report, which is the responsibility
of the Executive Committee and submitted for the approval of
the Board of Directors, is consistent with the consolidated
financial statements and has been prepared in accordance with
the applicable legal requirements.
The information required by Article 70bis paragraph (1) letters c)
and d) of the law of 17 June 1992 as amended on the annual
and consolidated accounts of credit institutions governed by the
laws of Luxembourg and included in the Corporate Governance
Statement is consistent with the consolidated financial
statements and has been prepared in accordance with applicable
legal requirements.
PricewaterhouseCoopers Luxembourg, 23 March 2017
Société coopérative
Represented by
Roxane Haas
Only the French version of the present report has been reviewed by the auditors. In case of differences between the French version and the translation, the French version should be retained.

20

21
5 AUDITED CONSOLIDATED FINANCIAL STATEMENTS
B. Consolidated statement of financial position as at 31 December 2016
ASSETS in euros Notes 31/12/2015 31/12/2016
Cash and sight accounts with central banks 4.1. 1.313.328.229 2.687.924.387
Loans and receivables at amortised cost - Credit institutions 4.2. 5.597.608.197 4.105.231.598
Loans and receivables at amortised cost - Customers 4.3. 19.224.838.123 19.815.745.830
Financial instruments held for trading 4.4. 4.9. 201.115.555 294.544.201
Hedging derivative financial instruments 4.9. 77.502.528 67.895.956
Financial assets designated at fair value through profit or loss 4.10. - 262.150.671
Available-for-sale securities – Fixed-income securities 4.4. 9.998.539.565 9.805.099.257
Available-for-sale securities – Variable-income securities 4.4. 1.005.562.944 1.074.144.424
Held-to-maturity securities 4.5. 4.683.501.426 4.572.783.470
Investments in associates accounted for using the equity method 4.6. 324.853.964 363.912.298
Change in fair value of a portfolio of financial instruments hedged
against interest rate risk 4.11. 52.453.419 80.022.997
Tangible assets for own use 4.12. 290.643.556 298.615.576
Investment property 4.13. 15.214.799 14.311.053
Intangible assets 4.14. 15.017.211 16.519.157
Other assets 4.16. 11.292.644 9.724.260
TOTAL ASSETS 42.811.472.160 43.468.625.135
The notes on pages 29 to 122 are an integral part of these consolidated financial statements.

22
5 AUDITED CONSOLIDATED FINANCIAL STATEMENTS
LIABILITIES in euros Notes 31/12/2015 31/12/2016
Deposits at amortised cost – Credit institutions 4.17. 4.439.629.040 4.741.710.246
Deposits at amortised cost – Customers 4.18. 26.923.488.031 28.115.936.115
Financial instruments held for trading 4.4. 4.9. 170.332.351 156.434.838
Hedging derivative financial instruments 4.9. 892.476.947 894.844.009
Financial liabilities designated at fair value through profit or loss 4.19. - 148.612.880
Issuance of debt securities 4.20. 5.791.365.039 4.769.621.682
Provisions 4.21. 47.215.958 4.883.234
Other liabilities 4.22. 29.644.261 58.188.728
Current taxes 4.15. 100.111.672 58.954.065
Deferred taxes 4.15. 86.149.649 58.327.625
Pension fund 4.23. 179.190.062 229.496.232
Sub-total of LIABILITIES (before equity capital) to be carried forward 38.659.603.010 39.237.009.654
EQUITY in euros 31/12/2015 31/12/2016
Sub-total of LIABILITIES (before equity capital) carried forward 38.659.603.010 39.237.009.654
Share capital 173.525.467 173.525.467
Revaluation reserve 760.854.618 661.775.701
Available-for-sale financial assets 760.720.239 661.880.411
Consolidated reserves 2.942.127.352 3.133.980.137
Equity method adjustment 247.189.320 278.196.348
Income for the year 273.161.115 259.792.789
Sub-total of equity attributable to equity holders of the parent company 4.149.668.552 4.229.074.094
Minority interests 2.200.598 2.541.387
Total equity 4.151.869.150 4.231.615.481
TOTAL LIABILITIES, including EQUITY 42.811.472.160 43.468.625.135
The notes on pages 29 to 122 are an integral part of these consolidated financial statements.
23
5 AUDITED CONSOLIDATED FINANCIAL STATEMENTS
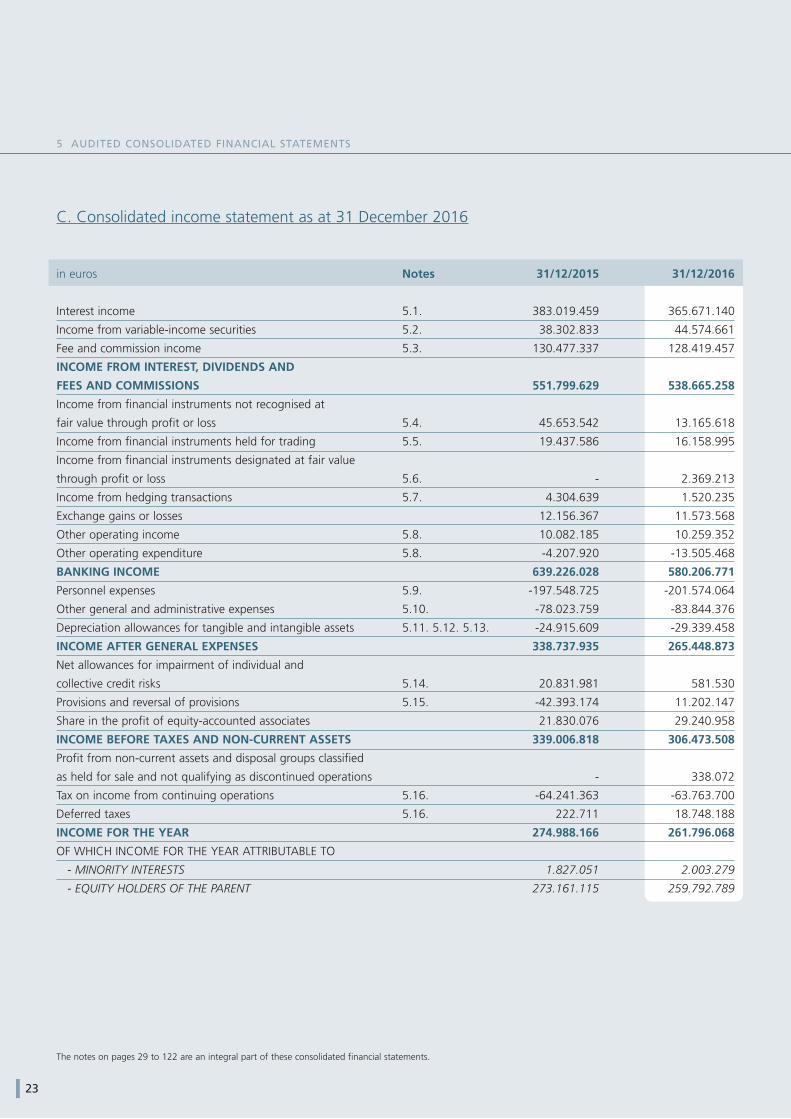
in euros Notes 31/12/2015 31/12/2016
Interest income 5.1. 383.019.459 365.671.140
Income from variable-income securities 5.2. 38.302.833 44.574.661
Fee and commission income 5.3. 130.477.337 128.419.457
INCOME FROM INTEREST, DIVIDENDS AND
FEES AND COMMISSIONS 551.799.629 538.665.258
Income from financial instruments not recognised at
fair value through profit or loss 5.4. 45.653.542 13.165.618
Income from financial instruments held for trading 5.5. 19.437.586 16.158.995
Income from financial instruments designated at fair value
through profit or loss 5.6. - 2.369.213
Income from hedging transactions 5.7. 4.304.639 1.520.235
Exchange gains or losses 12.156.367 11.573.568
Other operating income 5.8. 10.082.185 10.259.352
Other operating expenditure 5.8. -4.207.920 -13.505.468
BANKING INCOME 639.226.028 580.206.771
Personnel expenses 5.9. -197.548.725 -201.574.064
Other general and administrative expenses 5.10. -78.023.759 -83.844.376
Depreciation allowances for tangible and intangible assets 5.11. 5.12. 5.13. -24.915.609 -29.339.458
INCOME AFTER GENERAL EXPENSES 338.737.935 265.448.873
Net allowances for impairment of individual and
collective credit risks 5.14. 20.831.981 581.530
Provisions and reversal of provisions 5.15. -42.393.174 11.202.147
Share in the profit of equity-accounted associates 21.830.076 29.240.958
INCOME BEFORE TAXES AND NON-CURRENT ASSETS 339.006.818 306.473.508
Profit from non-current assets and disposal groups classified
as held for sale and not qualifying as discontinued operations - 338.072
Tax on income from continuing operations 5.16. -64.241.363 -63.763.700
Deferred taxes 5.16. 222.711 18.748.188
INCOME FOR THE YEAR 274.988.166 261.796.068
OF WHICH INCOME FOR THE YEAR ATTRIBUTABLE TO
- MINORITY INTERESTS 1.827.051 2.003.279
- EQUITY HOLDERS OF THE PARENT 273.161.115 259.792.789
The notes on pages 29 to 122 are an integral part of these consolidated financial statements.
C. Consolidated income statement as at 31 December 2016

24
5 AUDITED CONSOLIDATED FINANCIAL STATEMENTS
in euros 31/12/2015 31/12/2016
INCOME FOR THE YEAR 274.988.166 261.796.068
Items not reclassified in net income subsequently -52.248.068 -49.838.706
Actuarial gains/(losses) on the defined-benefit pension scheme -61.778.873 -71.218.221
Contribution of equity-accounted associates -8.520.982 7.573.222
Impact of deferred taxes 18.051.787 13.806.293
Items to be reclassified in net income subsequently -202.496.407 -99.078.917
Available-for-sale financial assets -208.026.382 -94.013.011
- Variation in measurement results -162.570.888 -80.625.697
- Net reclassification to the income statement of realised net gains -45.455.494 -13.387.314
Cash flow hedges -7.793.359 -333.449
Impact of deferred taxes 13.323.334 -4.732.457
Total items of comprehensive income for the year - net of tax -254.744.475 -148.917.623
TOTAL COMPREHENSIVE INCOME FOR THE YEAR 20.243.691 112.878.445
share attributable to
- minority interests: 1.827.051 2.003.279
- equity holders of the parent company: 18.416.640 110.875.166
For purposes of comparability, the period ending 31 December 2015 has been restated in accordance with the amendment to
IAS 1 §82A (b).
The notes on pages 29 to 122 are an integral part of these consolidated financial statements.
D. Consolidated statement of comprehensive income as at 31 December 2016

25
5 AUDITED CONSOLIDATED FINANCIAL STATEMENTS
E. Consolidated statement of changes in equity as at 31 December 2016
The Group's parent company has appropriated the sum of EUR 40,000,000 (same amount as in 2015) from its net income for financial year 2016 for
distribution to the State.
in euros Share Consolidated Revaluation Net Total Minority Total
capital reserves reserve income equity holders interests equity
of the parent
As at 1 January 2016 173.525.467 2.942.127.352 760.854.618 273.161.115 4.149.668.552 2.200.598 4.151.869.150
Appropriation of 2015 income - 273.161.115 - -273.161.115 - - -
2016 net income - - - 259.792.789 259.792.789 2.003.279 261.796.068
Distribution for FY 2015 - -40.000.000 - - -40.000.000 - -40.000.000
Actuarial gains/(losses)
on pension fund - -57.411.928 - - -57.411.928 - -57.411.928
Net measurement results of
available-for-sale financial instruments - - -98.839.828 - -98.839.828 - -98.839.828
Net measurement results of
cash flow hedges - - -239.089 - -239.089 - -239.089
Other - 16.103.599 - - 16.103.599 -1.662.490 14.441.109
As at 31 December 2016 173.525.467 3.133.980.137 661.775.701 259.792.789 4.229.074.094 2.541.387 4.231.615.481
in euros Share Consolidated Revaluation Net Total Minority Total
capital reserves reserve income equity holders interests equity
of the parent
As at 1 January 2015 173.525.467 2.751.830.181 963.351.024 273.748.936 4.162.455.608 1.673.467 4.164.129.075
Appropriation of 2014 income - 273.748.937 - -273.748.936 - - -
2015 net income - - - 273.161.115 273.161.115 1.827.051 274.988.166
Distribution for FY 2014 - -40.000.000 - - -40.000.000 - -40.000.000
Actuarial gains/(losses)
on pension fund - -43.727.086 - - -43.727.086 - -43.727.086
Net measurement results of
available-for-sale financial instruments - - -196.980.268 - -196.980.268 - -196.980.268
Net measurement results of
cash flow hedges - - -5.516.138 - -5.516.138 - -5.516.138
Other - 275.320 - - 275.320 -1.299.920 -1.024.600
As at 31 December 2015 173.525.467 2.942.127.352 760.854.618 273.161.115 4.149.668.552 2.200.598 4.151.869.150
The notes on pages 29 to 122 are an integral part of these consolidated financial statements.

26
5 AUDITED CONSOLIDATED FINANCIAL STATEMENTS
in euros 31/12/2015 31/12/2016
Cash and cash equivalents Cash and sight accounts with central banks 1.313.391.597 2.685.668.850
Loans and receivables at amortised cost – Credit institutions 2.457.868.404 1.217.012.620
Loans and receivables at amortised cost – Customers 1.897.391.042 1.656.102.720
Financial instruments held for trading - 98.512
Held-to-maturity securities 3.948.714 -
Total 5.672.599.757 5.558.882.703
The statement of cash flows represents the inflow and outflow of cash. Cash and cash equivalents include cash on hand, deposits
with central banks, and assets with an original maturity of 90 days or less and subject to an insignificant risk of change in fair value.
The cash flow statement classifies the cash flows of the period into operating activities, investment activities and financing activities.
Cash flow from operating activities
- Cash flow from operating activities before changes in operating assets and liabilities:
in euros 31/12/2015 31/12/2016
Interest received 866.122.867 850.865.685
Interest paid -461.293.743 -459.922.533
Income from variable-income securities 38.302.833 44.574.661
Fees and commissions received 171.222.653 174.398.522
Fees and commissions paid -40.745.316 -45.979.065
Other operating income 10.156.713 9.859.482
Other operating expenditure -3.962.939 -30.194.148
Current taxes -64.241.363 -63.763.700
General and administrative expenses -265.763.705 -272.458.782
Sub-total 249.798.000 207.380.122
The notes on pages 29 to 122 are an integral part of these consolidated financial statements.
F. Consolidated statement of cash flow as at 31 December 2016

27
5 AUDITED CONSOLIDATED FINANCIAL STATEMENTS
- Cash flow from changes in operating assets:
Net changes in euros 31/12/2015 31/12/2016
Financial instruments held for trading -422.495 977.657
Financial assets designated at fair value through profit or loss - -262.111.460
Available-for-sale securities – Fixed-income securities -379.886.459 190.322.898
Available-for-sale securities – Variable-income securities -2.329.088 -11.564.817
Loans and receivables at amortised cost – Credit institutions -171.958.364 253.898.787
Loans and receivables at amortised cost – Customers -559.487.858 -861.549.103
Hedging derivative financial instruments 4.332.258 -360.284
Other assets -36.862.288 -31.651.809
Sub-total -1.146.614.293 -722.038.132
- Cash flow from changes in operating liabilities:
Net changes in euros 31/12/2015 31/12/2016
Financial instruments held for trading 834.820 15.098.900
Financial liabilities designated at fair value through profit or loss - 148.056.795
Deposits at amortised cost – Credit institutions 294.672.900 280.504.010
Deposits at amortised cost – Customers 1.855.413.345 1.191.523.201
Hedging derivative financial instruments 8.824.595 76.533.165
Other liabilities -5.051.468 28.789.125
Issuance of debt securities -462.830.984 -998.507.757
Sub-total 1.691.863.207 741.997.439
Cash flow from operating activities 795.046.914 227.339.430
Cash flow from investment activities
in euros 31/12/2015 31/12/2016
Acquisition of available-for-sale securities – Variable-income securities -17.357.633 -173.827.950
Disposals of available-for-sale securities – Variable-income securities 45.013.830 13.203.553
Acquisition of held-to-maturity securities -1.539.058.298 -980.895.637
Redemption of held-to-maturity securities 1.533.333.706 1.053.680.838
Acquisitions/disposals of intangible and tangible assets -141.706.203 -36.703.184
Cash flow from investment activities -119.774.598 -124.542.380
The notes on pages 29 to 122 are an integral part of these consolidated financial statements.

28
5 AUDITED CONSOLIDATED FINANCIAL STATEMENTS
Cash flow from financing activities
in euros 31/12/2015 31/12/2016
Proceeds from subordinated liabilities -23.775.722 -25.000.000
Income distribution -40.000.000 -40.000.000
Cash flow from financing activities -63.775.722 -65.000.000
Net change 611.496.594 37.797.049
Change in cash and cash equivalents
in euros 2015 2016
Position as at 1 January 4.816.199.514 5.672.599.757
Net change in cash 611.496.594 37.797.049
Effect of exchange rates on cash and cash equivalents 244.903.649 -151.514.103
Position as at 31 December 5.672.599.757 5.558.882.703
The notes on pages 29 to 122 are an integral part of these consolidated financial statements.

29
5 AUDITED CONSOLIDATED FINANCIAL STATEMENTS
G. Notes to the consolidated financial statements
1. GENERAL INFORMATION
Banque et Caisse d’Epargne de l’Etat, Luxembourg (hereinafter
the “Bank” or the “Group's parent company”), established
by the law of 21 February 1856 and governed by the law of
24 March 1989, is an autonomous public institution endowed
with legal personality. Ultimate responsibility for the institution
lies with the Government Minister with responsibility for the
Treasury.
The Bank’s registered office is located at 1, place de Metz,
L-2954 Luxembourg.
Within the limits set by the laws and regulations applicable to
credit institutions, the objective of the Bank is to perform all
financial and banking activities, as well as all similar, related or
ancillary operations.
The consolidated financial statements concern the Group, of
which Banque et Caisse d’Epargne de l’Etat, Luxembourg is the
parent company. The bank had an average headcount in 2016
of 1.818 (1.807 for 2015), including staff on skills-acquisition
contracts.
The financial year coincides with the calendar year.
The consolidated financial statements were approved by the
Board of Directors meeting on 23 March 2017.
2. BASIS OF PREPARATION OF THE CONSOLIDATED
FINANCIAL STATEMENTS
2.1 COMPLIANCE WITH GENERAL ACCOUNTING PRINCIPLES
The Group’s consolidated financial statements for the
2016 financial year have been prepared in accordance with
International Financial Reporting Standards (IFRS) as adopted
by the European Union.
The consolidated financial statements are stated in euros, the
functional currency of the parent company and its subsidiaries.
They have been prepared on the basis of historical cost and
amortised cost respectively, adjusted to fair value for available-
for-sale financial assets, financial assets held for trading, deriva-
tive financial instruments and pension fund assets.
a) New or revised standards adopted by the Group's parent
company
The following standards, whose application is compulsory in
financial years beginning on or after 1 January 2016, were
adopted by the Group's parent company and have had no
material impact on the annual financial statements:
- Amendment to IAS 1: Disclosure Initiative,
- Amendment to IAS 19: Employee Contributions to Defined
Benefit Plans,
- Amendment to IAS 27: Equity Method in Separate Financial
Statements,
- Amendments to IAS 16 and IAS 38: Clarification of Acceptable
Methods of Depreciation and Amortisation,
- Amendment to IFRS 11: Accounting for Acquisitions of
Interests in Joint Operations,
- Amendments to IFRS 10, IFRS 12 and IAS 28: Investment
Entities: Applying the Consolidation Exception,
- Improvements to IFRS, 2012-2014 cycle, which are a series of
amendments to the existing standards.
b) The following standards, whose application is not compul-
sory in financial years beginning on or after 1 January 2016,
have not yet been adopted by the Group’s parent company:
- IFRS 9: Financial Instruments,
- IFRS 15: Revenue from Contracts with Customers.
c) New and revised standards and interpretations, relevant for
the Group’s parent company, which are not yet compulsory and
which have not been adopted by the European Union:
- Amendment to IFRS 2: Classification and Measurement of
Share-based Payment Transactions,
- IFRS 15 (clarifications): Revenue from Contracts with
Customers,
- IFRS 16: Leases,
- Improvements to IFRS, 2014-2016 cycle, which are a series of
amendments to the existing standards,
- Amendment to IAS 7: Disclosure Initiative,

30
5 AUDITED CONSOLIDATED FINANCIAL STATEMENTS
- Amendment to IAS 12: Recognition of Deferred Tax Assets for
Unrealised Losses,
- Amendment to IAS 40: Transfers of Investment Property,
- IFRIC 22: Foreign Currency Transactions and Advance
Consideration.
d) In light of the European Parliament’s adoption of IFRS 9 on
22 November 2016, the Group's parent company provides the
following overview of the status of its analytical and implemen-
tation work ahead of effective application of IFRS 9 in financial
years beginning on or after 1 January 2018:
- Phase 1: Classification and measurement. For the purposes
of this phase, the Group’s parent company reviewed all its
portfolios of financial asset instruments so they could be
grouped together based on a business-model assessment
and subjected to a “solely payment of principal and inte-
rest” (SPPI) test. Implementation is underway and not SPPI
positions will be transferred in the first half of 2017. Many
of the positions currently measured at fair value through the
revaluation reserve satisfy the conditions of the SPPI test and
will therefore be eligible for measurement at amortised cost.
For positions in financial assets held as shares, measured
under IAS 39 at fair value through the revaluation reserve
with gains or losses reclassified through profit or loss, the
Group’s parent company has opted to continue to use this
measurement method under IFRS 9. However, this approach
no longer allows gains or losses to be reclassified through
profit or loss.
- Phase 2: Impairment. The Group's parent company has defi-
ned the allocation and migration procedures for the three
levels of impairment provided for in the standard. These
procedures account, among others, for changes in the inter-
nal rating of the counterparty as well as the status of the
exposure. The different types of status that determine the
migration of an exposure between the three levels of impair-
ment are as follows: performing, past due, non-performing,
forbearance and default. The calibration of the calculation
of the losses expected over the life of the exposure is being
finalised.
- Phase 3: Hedge accounting. Application of this phase of IFRS
9 relates to the principles of hedge accounting. However,
implementation is not compulsory in financial years begin-
ning on or after 1 January 2018. The standard-setter is
allowing entities the freedom to apply the earlier version of
IAS 39 until the macro-hedging project is completed. The
Group’s parent company has therefore not yet made a final
decision.
e) The Group’s parent company has not yet begun to imple-
ment IFRS 16 “Leases” applicable in financial years beginning
on or after 1 January 2019.
2.2 CONSOLIDATION
2.2.1 Scope of consolidation
The consolidated financial statements comprise the parent
company, subsidiaries and entities over which the Bank has
control when it has rights to variable returns, because of its
relationships with those entities, and the ability to affect those
returns through its power over those entities. Subsidiaries are
consolidated from their date of acquisition, when the Bank, as
the parent company, has the power to direct their financial poli-
cies. They are deconsolidated on the date such control ceases.
Consolidation has not generated any goodwill as the subsidia-
ries have been majority Group-owned since their creation.
Acquisitions are recognised at cost, i.e. the amount of cash or
cash equivalents paid representing the fair value, plus all costs
directly attributable to the acquisition. All intra-group transac-
tions and unrealised gains on transactions between Group com-
panies are eliminated. Unrealised losses on intra-group transac-
tions are also eliminated unless the cost can be recovered.
If any member of the Group applies accounting standards dif-
ferent from those applied to the preparation of consolidated
financial statements, appropriate restatements are made to
ensure consistency with the Group’s accounting policies.

31
5 AUDITED CONSOLIDATED FINANCIAL STATEMENTS
If the reporting date for a company within the consolidated
group is different from the Group’s reporting date, adjustments
are made to take into account transactions made and any other
significant events that occurred between the company’s year-
end and that of the parent.
The portion of Group equity attributable to minority interests
is given on a separate line. Similarly, the portion of Group
earnings attributable to minority interests is also shown on a
separate line.
2.2.1.1 Fully consolidated subsidiaries
The consolidated financial statements record the assets, liabilities,
income and expenditure of the parent company and its subsi-
diaries. A subsidiary is an entity over which the parent company
exercises control. The parent company controls an entity if it is
exposed or has the right to variable income from its interest in
the entity and if it has the power to influence the amount of
this variable income.
Subsidiaries are fully consolidated as of the date on which the
Group took control. They are deconsolidated on the date such
control ceases.
The subsidiaries included in the scope of consolidation are as
follows:
Name % of voting rights held
31/12/15 31/12/16
Lux-Fund Advisory S.A. 89,16 88,58
BCEE Asset Management S.A. 90,00 90,00
Bourbon Immobilière S.A. 99,90 99,90
Luxembourg State and Savings Bank
Trust Company S.A. 100,00 100,00
Spuerkeess Ré S.A. 100,00 100,00
2.2.1.2 Investments in associates
Associates are companies over which the Group exercises signi-
ficant influence and are accounted for using the equity method.
Significant influence means the Group has the power to direct a
company’s financial and operating policies in order to obtain a
substantial share of the economic benefits. Significant influence
is presumed when the Group holds, directly or indirectly through
its subsidiaries, 20% or more of the voting rights.
Investments in associates are recognised at cost, and the book
value is subsequently adjusted to reflect the investor’s share of
the net profit or loss of the associate after the acquisition date.
The Group’s share of the associate’s profit or loss is recognised
in the income statement.
Equity-method consolidation ceases when the Group no longer
has significant influence over the shareholding, unless the
Group has incurred legal or constructive obligations to assume
or guarantee commitments on behalf of the associate.
The Group’s investments in associates:
Associates % of capital held
31/12/15 31/12/16
Direct interests
Société Nationale de Circulation
Automobile S.à r.l. 20,00 20,00
Luxair S.A. 21,81 21,81
Société de la Bourse de
Luxembourg S.A. 22,75 22,75
Europay Luxembourg S.C. 25,40 25,40
FS-B S.à.r.l 28,70 28,70
FS-T S.à.r.l 28,70 28,70
Visalux S.C. 36,26 36,26
La Luxembourgeoise S.A. 40,00 40,00
La Luxembourgeoise-Vie S.A. 40,00 40,00
BioTechCube (BTC) Luxembourg S.A. 50,00 50,00
Indirect interests
Pecoma International S.A. 33,33 33,33
EFA Partners S.A. 29,05 29,05
2.3 FOREIGN CURRENCY TRANSACTIONS
The impact of exchange rate fluctuations on income statement
items is detailed below. The Group’s functional currency is the
euro (EUR).
Foreign currency transactions are translated into the functional
currency using the exchange rates prevailing at the date of the
transactions.

32
5 AUDITED CONSOLIDATED FINANCIAL STATEMENTS
Monetary items denominated in foreign currency are translated
at the closing rate on each balance sheet date.
Non-monetary items recognised at historical cost denominated
in a foreign currency are translated using the exchange rate on
the transaction date, while non-monetary items recognised at
fair value in a foreign currency are translated at the exchange
rates prevailing on the date of fair value measurement.
Foreign exchange gains and losses resulting from monetary
assets and liabilities are recognised in the income statement,
except where the transaction is classed as a cash flow hedge.
For monetary assets classified as “available-for-sale assets”,
translation differences resulting from the variance between
their fair value on the balance sheet date and their acquisition
cost are recognised in the revaluation reserve, whereas trans-
lation differences relating to the adjustment of the amortised
cost relative to the acquisition value are recognised through
profit or loss.
Translation differences relating to adjustments in the fair value
of non-monetary items are recognised in the same way as the
recognition of these changes in fair value.
The following exchange rates were used for translation of the
main currencies in the annual financial statements, where one
euro is equal to:
Currency 31/12/15 31/12/16
CHF 1,0828 1,0747
GBP 0,7368 0,8578
JPY 131,4000 123,2500
SEK 9,1796 9,5720
USD 1,0916 1,0547
2.4 BANKING TRANSACTIONS
2.4.1 Initial recognition and measurement
Purchases and sales of financial assets and liabilities whose
delivery or settlement are made after the transaction date are
recognised on the balance sheet on the delivery and settlement
date respectively.
All financial instruments are recognised at fair value when initially
recognised, increased by directly attributable costs when the
financial instruments are not entered at fair value through profit
or loss.
Derivative financial instruments are recognised on the balance
sheet at fair value on the transaction date. The classification of
derivative financial instruments on initial recognition depends
on their characteristics and purpose. Therefore, they may be
classified as “financial instruments held for trading” or as “hed-
ging instruments”.
Derivative financial instruments are recognised in assets when
the fair value is positive, and in liabilities when it is negative. By
fair value here is meant the “dirty price” of the instruments, i.e.,
including the accrued interest.
According to the definition in IAS 39, derivative financial instru-
ments embedded into other financial instruments are separated
from the host contract and accounted for at fair value if the
economic risks and characteristics of the embedded derivative
are not closely related to those of the host contract, and the
entire instrument is not classed as held for trading, or has not
been designated as measured at fair value in the income state-
ment. Embedded derivative financial instruments that have
been separated from their host contract are recognised at fair
value in the trading portfolio and changes in fair value are reco-
gnised in the income statement.
Gains or losses on the sale of financial assets that are not subject
to revaluation through the income statement are calculated as
the difference between the amount received net of transaction
costs and the acquisition cost and amortised cost of the financial
asset.
2.4.2 Subsequent measurement
Subsequent to initial recognition, financial instruments are
measured according to their characteristics and the valuation
categories to which they belong. The valuation categories used
are: financial instruments held for trading or hedging, financial
assets held to maturity, available-for-sale assets, financial instru-
ments designated at fair value through profit or loss, and loans
and receivables.

33
5 AUDITED CONSOLIDATED FINANCIAL STATEMENTS
2.4.2.1 Historical cost
Financial assets and liabilities recognised at historical cost are
valued at the initial recognition amount.
2.4.2.2 Amortised cost
The amortised cost corresponds to the amount initially reco-
gnised, less repayments of capital, adjusted for premiums
and discounts, calculated as the difference between the initial
amount and the repayment amount on maturity, over the life of
the asset, less impairment recognised whenever there is objec-
tive evidence of impairment of the asset in question.
2.4.2.3 Fair value
The fair value of the counterpart received or tendered can
usually be determined by reference to an active market or by
using valuation techniques based chiefly on observable market
inputs.
To determine a consistent value for the financial instruments
measured at fair value, the Group uses the following methods:
- derivative financial instruments held for trading or hedging:
the Bank uses the discounted cash flow (DCF) method for
plain vanilla contracts and the Black & Scholes model for
structured contracts. In addition to these fair value measure-
ments, the Group calculates, after application of ISDA-CSA
agreements, an adjustment for counterparty risk, or a “Credit
Value Adjustment” (CVA), to account for the credit qua-
lity of the counterparty for derivative financial instruments
recognised on the assets side of the balance sheet, and a
Bank-specific adjustment for credit risk, or a “Debit Value
Adjustment” (DVA), for derivative financial instruments reco-
gnised on the liabilities side of the balance sheet.
The valuation model is based on exposures derived from
regulatory calculations while using the same concepts:
• Exposure at Default (EaD),
• Loss Given Default (LGD),
• Probability of Default (PD).
- financial assets:
• fixed-income securities:
• for assets quoted on an active market, the bid price pub-
lished by an official quotation agent is used;
• for assets quoted on a market considered inactive, the
valuation price is calculated by the Bank’s internal valua-
tion model.
• variable-income securities:
• for assets quoted on an active market, the bid price pub-
lished by an official quotation agent is used;
• for assets quoted on a market considered inactive or for
unquoted assets, the Bank determines the value by ana-
lysing the last available annual financial statements, as
well as recent transaction prices.
- financial liabilities:
• EMTNs issued by the BCEE Group are initially recognised at
amortised cost. These transactions are subsequently desi-
gnated as fair value hedges to avoid an accounting impact
on the income statement due to hedging these issues with
derivative financial instruments. Thus the fair value mea-
surement method applied to the issue and to the hedge
are identical, namely the discounted cash flow and Black &
Scholes method.
2.4.3 Accounting judgements and estimates
The preparation of the consolidated financial statements under
IFRS requires the Group to make a number of accounting
estimates and judgements in order to determine the reported
amounts of certain items.
The most significant of these are:
2.4.3.1 Fair value of financial instruments
When the fair value of a financial instrument recognised in the
balance sheet cannot be determined based on an active market,
it is calculated using valuation techniques mostly based on
mathematical models. Insofar as possible, the inputs to mathe-
matical models come from market observations.

34
5 AUDITED CONSOLIDATED FINANCIAL STATEMENTS
Active and inactive market
The Group uses the following five criteria to determine whether
or not a fixed-income securities market is active:
- percentage holding of the issue volume;
- quotation provided by at least two market participants;
- overall observable minimum bid size greater than or equal to
EUR 2 million;
- observable spread between observable bid and ask prices less
than 200 basis points;
- spread between bid and ask prices for the representative price
(e.g., Bloomberg Generic Price) less than 250 basis points.
When a market is considered active, i.e., at least four of the
five criteria have been met, the Group uses the prices published
by an official quotation agent. For issues for which the Group
estimates that the market is inactive based on its criteria (when
at least two criteria are not met), it first calculates a price using
the DCF (discounted cash flow) method based on the yield
curves and spreads, determined according to the issuer’s rating.
The price thus calculated is then weighted with a price indica-
tion provided by a quotation source, even if the price indication
originates from a market which the Bank considered inactive
based on its active / inactive market analysis.
Fair value hierarchy
The Group uses valuation techniques based on observable and
non-observable market data to determine fair value:
- observable data reflect market variations collected from
independent sources and reflecting real transactions (e.g. a
three-year swap rate);
- non-observable data reflect estimates and internal assump-
tions adopted by the Group relating to market variations (e.g.
an estimation of the payment plan of an MBS).
A fair value hierarchy was established according to the type of
observable and non-observable data:
- Level 1 fair value: Level 1 inputs are essentially quoted prices
in active markets for identical financial instruments. This level
includes equity securities and debt instruments listed on stock
exchanges, as well as derivative financial instruments traded
on a regulated market. Financial instruments not listed on a
market but that were recently involved in a transaction are
also included in Level 1.
- Level 2 fair value: Level 2 inputs are inputs other than quoted
market prices included within Level 1 that are observable
for the financial instruments, either directly or indirectly, i.e.
derived from observable prices, such as implied volatilities of
a share derived from observable prices of option contracts on
this share. This level includes the majority of over-the-counter
derivative financial instruments and structured debt securities
issued. These inputs, such as “EURIBOR” yield curves or cre-
dit spreads, are initially provided by specialised financial data
providers.
- Level 3 fair value: Level 3 inputs are mainly unobservable
inputs for the asset or liability on a market. This level includes
equity instruments or debt securities for which significant
parameters used in the valuation models are based on inter-
nal estimations and assumptions.
To determine the fair value hierarchy, the Group reviewed all
financial instruments measured at fair value to assess the impor-
tance of observable data directly or indirectly on the markets.
Observable market data include among others:
- credit spread curves based on CDS prices,
- interbank interest rates or swap rate,
- foreign exchange rates,
- stock indices,
- counterparty credit spreads.
2.4.3.2 Impairment of financial assets measured at amortised
cost
In accordance with IAS 39, the Bank recognises an impairment
whenever there is objective indication of impairment of the
asset.
For retail banking, the non-recoverable amount for specific
cases is estimated based on observations of historical loss data,
while case-by-case appraiser assessments are used to estimate
the non-recoverable amount for professional customers (whole-
sale portfolio), taking any collateral into account, and a specific
value adjustment is recognised as a result.

35
5 AUDITED CONSOLIDATED FINANCIAL STATEMENTS
The Group assimilates the concept of default with objective
indications of impairment as determined by IFRS, by applying
the internal credit risk management regulations defined for
the calculation of the capital adequacy ratio according to the
Capital Requirements Regulation (CRR).
The Group's parent company also recognises “collective impair-
ment” of loans and advances not identified individually as being
in default in order to take account of the progressive credit risk
after the date on which the loan was granted.
The Group's parent company bases its calculation of this collec-
tive value adjustment on historic loss data on its loan portfolio,
determining the probability of default for different loan types
according to the time elapsed from granting of loan up to the
time of the default event.
The collective value adjustment, also known as IBNR (Incurred
But Not Reported) impairment, is calculated on all individually
performing loans and receivables belonging to the “Loans and
receivables at amortised cost - customers” portfolio.
Collective impairment is calculated based on the concept of
expected loss and is defined as the product of exposure at
default (EaD), probability of default estimated on historical data
(PD) and the CRR loss given default (LGD).
Pursuant to IFRS, the Group considers the impact of economic
developments by using best-estimate LGD’s, i.e. by over-wei-
ghting recent LGD historical data relative to older ones.
2.4.3.3 Impairment of Available-for-sale assets
The Group considers securities in the “available-for-sale financial
assets” (AFS) portfolio to be impaired when it expects a permanent
reduction in future contractual cash flows because of “objective
impairment evidence”.
The following are some of the objective indications of impairment
used by the Bank:
- cash problems due to one or more late payments or reimburse-
ments,
- downgrade of ratings below a critical threshold (B+),
- deterioration of solvency.
Accordingly, a fall in price of more than 20% triggers an impair-
ment test, irrespective of the existence of objective evidence of
impairment.
When the Group recognises impairment on fixed-income secu-
rities, the difference between the fair value and amortised cost
will be entered on the income statement and therefore will no
longer be recognised in equity under “Revaluation reserve”.
Similarly, when the Group recognises impairment on variable-
income securities, the difference between the fair value and
acquisition cost will be entered on the income statement
and therefore will no longer be recognised in equity under
“Revaluation reserve”.
Regarding the objective criteria for impairment of variable-
income securities, the Group recognises impairment only if the
fair value is permanently lower than the historical cost. The
monitoring and valuation of these positions and the decision to
apply impairment are the responsibility of a group of appraisers
on the basis of the following criteria:
- changes in market value for listed assets, or recent transaction
prices,
- changes in net assets on the basis of published results for
unlisted securities,
- projected changes in the counterparty in terms of business
model or turnover and by appraiser assessments.
2.4.3.4 Impairment of held-to-maturity assets
For held-to-maturity assets, the Group applies the same prin-
ciple regarding impairment as for fixed-income securities in the
available-for-sale assets category.
2.5 CASH FLOW STATEMENT
The statement of cash flows represents the inflow and outflow
of cash. Cash and cash equivalents include cash on hand, deposits
with central banks, and assets with an original maturity of less
than 90 days.
The cash flow statement classifies the cash flows of the period
into operating activities, investment activities and financing
activities.

36
5 AUDITED CONSOLIDATED FINANCIAL STATEMENTS
3.2 FINANCIAL INSTRUMENTS
3.2.1 Assets and liabilities held for trading
Financial instruments held to make a profit from short-term price
fluctuations are classified as assets or liabilities held for trading.
This category includes fixed-income securities, variable-income
securities, short sales on these same financial instruments, as
well as derivative financial instruments used for trading.
Since the concept of short-term is not defined by IAS 39, the
Group considers six months as the average duration for non-
derivative financial instruments.
Financial Instruments held for trading are initially designated at
fair value, with any subsequent gains and losses arising from
changes in fair value recognised in the income statement under
“Income from financial instruments held for trading”. Accrued
interest incurred and received is recognised in the income state-
ment under “Interest income”, and dividends are recognised
under “Income from variable-income securities” from the time
the right to payment becomes established.
3.2.2 Fixed-income securities held to maturity
Listed securities with a fixed maturity that are actively quoted at
the acquisition date and that the Group expressly intends and
has the means to hold to maturity are recognised at amortised
cost under “Held-to-maturity securities”, using the effective
interest rate method integrating premiums and discounts spread
over the life of the asset, after deduction of impairment, if
any. The spread of discounts and premiums is entered under
“Interest income” in the income statement.
The conditions for classification as held-to-maturity assets and
the strict portfolio requirements in terms of limited conditions
for transfer and sale have led the Group to limit the use of this
portfolio. Assets held to maturity (and therefore not measured at
fair value) are not exposed to the risk of interest rate fluctuation; as
a result, this risk cannot be hedged. However, foreign currency
risk and credit risk may be hedged. The Group primarily invests
in securities issued or guaranteed by first-class bank or sovereign
issuers under its Asset and Liabilities Management policy.
The Group uses the indirect method to determine the cash
flows. To do this, it eliminates from the net result all pure
accounting flows that do not translate into an inflow or outflow
of liquid funds and directly presents the items of the net result
arising from operating activities before changes in operating
assets and liabilities.
Operating activities
Operating activities are the main revenue generating activities.
They comprise all activities other than investment or financing.
They consist of the operating income and expenses, cash flows
relating to financial and other income and expenses, as well as
the different categories of taxes paid during the year.
Investing activities
Investing activities comprise the acquisition and disposal of
assets in the long term and all other investments not included
in cash equivalents.
Financing activities
Financing activities comprise activities leading to changes in the
breadth and composition of equity, and subordinated capital
issued by the Bank.
3 INFORMATION ON ACCOUNTING POLICIES APPLIED TO
BALANCE SHEET CATEGORIES
3.1 CASH AND SIGHT ACCOUNTS WITH CENTRAL BANKS
Cash consists essentially of “Cash”, the various banks' nostro
accounts and cash with central banks.
This item also includes the minimum mandatory reserve funded
to satisfy the reserve requirement imposed by the BCL. Hence,
these funds are not available to finance the Bank’s ordinary
operations. The reserve basis is calculated on a monthly basis
and is defined according to liability items on the balance sheet,
according to Luxembourg accounting principles. The calculation
of the basis that determines the reserve requirements is made by
the Banque centrale de Luxembourg.

37
5 AUDITED CONSOLIDATED FINANCIAL STATEMENTS
The Group has adopted a procedure in compliance with IAS 39
AG 22 (a) detailing the conditions of sales before maturity in
order to respect the conditions set out in paragraph 9 of this
standard so as to not raise doubts as to the entity’s intention to
hold its other investments to maturity.
3.2.3 Available-for-sale assets
Available-for-sale assets correspond to positions initially designated
as such, or those that were not classified in one of the other
four asset categories (assets held for trading, financial assets
designated at fair value through profit or loss, held-to-maturity
assets or receivables at amortised cost) at the time of initial
recognition.
Available-for-sale financial assets include fixed-income secu-
rities, loans quoted in an active market, and variable-income
securities, notably investments in shares and in open-end
investment funds (SICAV). The Group has opted for fair value
measurement of equity interests in companies at least 20%
held, according to IAS 39, by classing these investments as avai-
lable-for-sale financial assets for the purposes of the separate
consolidated financial statements. Available-for-sale financial
assets are initially recognised at fair value, including transaction
costs. Interest is recognised in interest income using the effec-
tive interest rate method, while dividends are recognised in the
income statement under “Income from variable-income securities”
from the time the right to payment becomes established.
Available-for-sale financial assets are measured at fair value,
based on the bid price for securities listed in an active market
or based on observable market data or internal estimations.
Unrealised gains or losses resulting from changes in fair value
of these assets are recognised in equity under “Revaluation
reserve”. Impairment is recognised in the income statement and
is therefore no longer recorded in equity under “Revaluation
reserve”.
When available-for-sale assets are sold, the gain or loss is recognised
through profit or loss under “Income from financial instruments
not recognised at fair value through profit or loss”. If the Group
has several investments in the same security, the sale is recorded
using the first in - first out (FIFO) method.
Unrealised and realised gains or losses from fixed-income secu-
rities are determined by comparing the fair value of the bond
with its amortised cost. Gains or losses on variable-income secu-
rities are measured by comparing the acquisition cost, including
transaction costs, with the fair value.
The following paragraph explains the specific accounting
treatment for bonds included in the available-for-sale portfolio,
which are hedged against interest rate risk.
3.2.4 Derivative financial instruments used for hedging purposes
The Group uses derivative financial instruments to hedge inte-
rest rate, foreign exchange, credit and price risk such as stock
market indices or share prices. The derivative financial instru-
ments commonly used are interest rate swaps (IRS) and cross
currency interest rate swaps (CIRS) in standard plain vanilla hed-
ging transactions. In addition to these standardised contracts,
the Group uses swaps with structured components to specifi-
cally hedge structured Euro Medium Term Notes (EMTN) issues
and acquisitions of structured bonds included in its portfolio of
available-for-sale assets and containing embedded derivatives.
Only structures that are closely related are hedged in this way.
Derivatives are considered as being held for trading except
where they are designated as hedging instruments. When
entering into a contract, the Group may designate derivative
financial instruments as hedging instruments in assets or liabi-
lities on the balance sheet, if the transactions meet the criteria
set out in IAS 39.
The Group classifies hedging instruments in the following cate-
gories:
- fair value hedge of an asset, a liability or a firm commitment,
- fair value hedge of a portfolio or a sub-portfolio of assets,
- cash flow hedge of future cash flows attributable to a specific
asset or liability or future transaction.
The Group primarily uses fair value hedges and, secondarily,
cash flow hedges.
Hedge accounting must comply with the following restrictive
conditions set out in IAS 39:

38
5 AUDITED CONSOLIDATED FINANCIAL STATEMENTS
- Prior to being set up, the hedging relationship is formally
designated and documented, including the entity’s risk mana-
gement objective and strategy for undertaking the hedge,
identification of the hedging instrument, the hedged item, the
nature of the risk being hedged, and how the entity will assess
the hedging instrument’s effectiveness;
- The hedging starts with the designation of the derivative
financial instrument used for hedging and ends either at the
derecognition of the hedged instrument or if the effectiveness
of the hedge is no longer given;
- Prospective effectiveness: as soon as the transaction is set up,
it is expected to be highly effective in offsetting changes in fair
value or cash flows attributable to the hedged risk during the
hedging period. Prospective effectiveness is established when
the main characteristics between hedged items and hedging
items are substantially identical (par value, interest rate, matu-
rity and currency) within the hedging period designated by the
Group for the transaction;
- Retrospective effectiveness: effectiveness is assessed retros-
pectively (results within a range of 80 to 125%) at each
reporting date.
Changes in the fair value of derivative financial instruments desi-
gnated as fair value hedges which meet the criteria for hedge
accounting and have demonstrated their effectiveness relative
to the hedged instrument are recognised in profit or loss under
“Income from hedging transactions”.
If the hedge no longer meets the criteria for hedge accounting
at a given time, the fair value adjustment to the interest-bearing
hedged item must be amortised to profit or loss over the remai-
ning period to maturity as an adjustment to the return on the
hedged item.
Changes in the fair value of derivative financial instruments desi-
gnated as cash flow hedges, which meet the criteria for hedge
accounting and have proven their effectiveness relative to the
underlying instrument to be hedged, are recognised in equity
under “Revaluation reserve – cash flow hedges”.
If a hedging instrument expires or is sold, terminated, or exer-
cised, or if the hedge no longer meets the hedge accounting
criteria, the Group ceases to apply hedge accounting. Any
adjustment in the book value of an interest-bearing hedged ins-
trument is amortised through profit or loss, and must be totally
amortised at maturity. If the item is derecognised, i.e. removed
from the balance sheet, the change in fair value is recognised
immediately in profit or loss.
The Group's parent company applies fair value macro-hedging
on fixed-rate loans in accordance with the principles of IAS 39
in its “carve-out” version for the European Union. The decrease
in the interest-rate curve favoured the marketing of fixed-rate
loans, primarily in the area of mortgage loans. Hedging is done
exclusively using IRS derivative financial instruments.
3.2.5 Financial assets and liabilities designated at fair value
through profit or loss
The Group’s parent company designates as financial instruments
measured at fair value through profit or loss any financial assets
and liabilities with structures that are not closely related and there-
fore not initially eligible for measurement at fair value through
the revaluation reserve, but that are hedged economically with
derivative financial instruments. With this designation for the
financial asset or liability, the Bank offsets the impact of the
accounting mismatch with the derivative financial instrument.
Derivative financial instruments used for that purpose are exclu-
sively IRS or CIRS instruments. The fair values are simply offset
at the Bank’s profit or loss level under “Income from financial
instruments held for trading” and “Income from financial ins-
truments designated at fair value through profit or loss”. The
Group implemented this new category effective 1 January 2016
for new acquisitions of financial assets and new issues of finan-
cial liabilities.
3.2.6 Securities transactions: Repurchase and reverse repurchase
agreements - Lending and borrowing of securities
3.2.6.1 Repurchases and reverse repurchases
Securities covered by repurchase agreements (repo transactions)
concerning the same or a substantially identical asset remain on
the balance sheet and are considered as financial assets held
for trading, available-for-sale financial assets or held-to-maturity
financial assets. The amount due to the counterparty is entered
in liabilities under “Deposits at amortised cost”.

39
5 AUDITED CONSOLIDATED FINANCIAL STATEMENTS
- Forbearance (Restructuring): this indicator was transposed in
early 2014 in accordance with the EBA definition;
- Group contagion: in the event of default, the need to expand
the default to any other group entities is systematically
assessed;
- Indicators based on the balance sheet of professional custo-
mers, for example:
• Insufficient capital;
• Significant decline in turnover;
• Negative cash flow.
On completion of the impairment test, the Group's parent
company makes an individual impairment decision for each
instrument subject to review. The level of impairment depends
primarily on collateral and on personal guarantees, valued by
applying prudent haircuts, and the relevant customer's estima-
ted ability to repay loans.
IAS 18 requires loan administration expenses to be recorded as
origination fees to be included in the calculation of the effective
interest rate. According to the actuarial method, the material
expenses and commissions linked to fixed-rate loans are spread
over the life of the asset and recognised as an adjustment to the
asset’s effective rate of return. If the amounts are not significant,
they are recognised directly in profit or loss.
In the case of variable- or adjustable-rate loans, the straight-line
method is used and not the actuarial method.
Since the Group opted to measure loans and advances not evi-
denced by a security at amortised cost, measurement based on
the yield curve is only used if the loan is hedged by a derivative
instrument and when the Group has formally designated the
transaction as a hedging transaction in accordance with IFRS.
Fixed-income financial assets traded on an inactive market and
intended to be held to maturity are also included in the “Loans
and receivables at amortised cost” category.
3.2.8 Interbank market
3.2.8.1 Borrowings
Borrowings are initially recognised at fair value net of transaction
costs. Subsequently, borrowings are recognised at amortised
In the main, the Group enters into firm repurchase agreements
relating to the same or substantially identical assets.
By analogy, securities purchased subject to resale agreements
(reverse repo) relating to the same or substantially identical asset
are not recorded in the balance sheet. The consideration for
securities purchased under reverse repo agreements is entered
under “Loans and receivables at amortised cost”.
The Group carries out tri-party repo and tri-party reverse repo
transactions with counterparties rated “A” or higher. The struc-
ture involves a third-party intermediary throughout the life of
the tri-party repo to manage delivery versus payment, control
the eligibility criteria of securities, calculate and manage margin
calls and manage substitutions of securities. Maturity varies from
overnight to 12 months.
Income and expenses from repurchase and reverse repurchase
agreements are entered under “Interest income” in the income
statement.
3.2.6.2 Lending and borrowing of securities
Securities lent remain on the balance sheet, while securities
borrowed are not entered on the balance sheet.
3.2.7 Loans and receivables at amortised cost
Loans and receivables at amortised cost are financial assets
issued by the Group with fixed or adjustable payments and
which are not listed on an active market.
Loans and receivables with fixed maturity issued by the Group
are recorded at amortised cost using the effective interest rate
method.
These financial instruments are tested for impairment at the end
of each quarter, using a variety of indicators:
- Default: this indicator was transposed in accordance with the
CRR definition and has been used for years;
- Non-performing: this indicator was transposed in accor-
dance with the European Banking Authority (EBA) definition
published in 2014;

40
5 AUDITED CONSOLIDATED FINANCIAL STATEMENTS
The Bank distinguishes between two classes of impairment:
Impairments recognised by individual value adjustments: the
amount of the impairment loss is the difference between the
book value of the asset and its recoverable amount. Financial
assets are valued contract by contract. However, in principle,
financial assets of small amounts, such as retail loans, presen-
ting similar risk characteristics, are grouped together for the
purposes of an overall assessment of the impairment rate.
Impairments recognised by collective value adjustments: in
the absence of individual value adjustments, IFRS provide for
collective impairment to cover the risk of potential loss, if there
are one or more objective indications of probable loss in certain
portfolio segments or in other loan commitments granted but
not drawn on the reporting date. As things currently stand,
the Group only applies this principle to retail customers in the
“Loans and receivables at amortised cost” portfolio.
The Group bases its calculation of collective impairments on
experience and historical data for realised losses. The default
probability for the different types of loans is calculated based on
the length of time between granting of the loan and the default.
If the Group’s management considers a financial asset as being
totally unrecoverable, according to objective indications, it is
written off in full. In the event any inflows of funds are reco-
gnised subsequently on this asset, they are recognised in the
income statement under “Other operating income”.
3.2.10 Other financial assets and liabilities
Other assets comprise short-term receivables. Other liabilities
mainly consist of short-term payables, coupons due and other
amounts payable on behalf of third parties, debts to preferential
and sundry creditors.
3.2.11 Income and expenses relative to financial assets and liabilities
Interest income and expenses are recognised in profit or loss for
all financial instruments measured at amortised cost, according
to the effective interest rate method.
cost and any difference between the net amount received and
the amount repaid is recorded in the income statement over the
duration of the loan, using the effective interest rate method.
3.2.8.2 Issuance of debt securities
Initially, debt issued by the Group is measured at amortised cost.
However, as part of its EMTN programmes, the Group issues a
large number of structured bonds containing embedded deriva-
tive financial instruments whose price fluctuations are hedged
by swaps with a structure identical to that of the swap contai-
ned in the bond.
The Group’s parent company has designated closely related
transactions as fair value hedge relationships. This allows it to
offset the impact of changes in market prices at the income
statement level.
For transactions that are not closely related, the Group’s parent
company applies the fair value option by including them under
“Financial liabilities designated at fair value through profit or
loss”. As the heading indicates, they are measured at fair value
through profit of loss.
3.2.9 Impairment of financial assets
In accordance with IAS 39, the Bank recognises an impairment
whenever there is objective indication of impairment of the
asset.
With regard to assets at amortised cost, the recoverable amount
is net of pledges and guarantees and corresponds to estimated
future cash flows discounted at the initial effective interest
rate or, in the case of variable-income instruments, at the last
effective interest rate. The impairment amount recognised is the
difference between the book value and the recoverable value.
The recoverable amount for instruments measured at fair
value is either the fair value or the estimated future cash flows
discounted at the market rate applicable to similar financial
instruments.
Allowances for impairment of the available-for-sale portfolio
and loans and advances reduce the book value of the asset
concerned.

41
5 AUDITED CONSOLIDATED FINANCIAL STATEMENTS
Tangible assets are recognised at historical cost less accumulated
amortisation and possible impairment. Costs related directly to
the acquisition are capitalised and amortised as an integral part
of the acquisition cost at the same pace as for the principal
asset. The amortisable amount of these assets is calculated after
deduction of their residual value. The Group applies the compo-
nent approach to depreciation according to IAS 16 on tangible
construction assets. Components related to tangible assets are
amortised over their estimated useful life using the straight-line
method. Land is recognised at cost.
Useful life for the main types of tangible assets:
- constructions:
• Structural works components 30 - 50 years
• Finishing component 1 30 years
• Finishing component 2 10 years
• Other components 10 - 20 years
- computer hardware: 4 years
- office fixtures, furniture and other equipment: 2 - 10 years
- vehicles: 4 years
Finishing component 1 includes, among other things, lightweight
partitions, screeds, tiles and joinery, whereas finishing com-
ponent 2 includes resilient floor coverings and paint. “Other
components” consists, among others, of electrical facilities,
plumbing, and heating and air-conditioning facilities.
Investments on leased buildings are amortised over the remai-
ning term of the lease. If the term is not fixed, amortisation
takes place over 10 years.
Maintenance and repairs that do not increase the economic
benefits of the tangible asset are accounted for in the income
statement when incurred.
If the recoverable amount of an asset falls below its book value,
an impairment must be recognised to adjust the book value on
the balance sheet to the estimated recoverable amount.
Expenses incurred for the purpose of increasing the economic
benefits generated by a tangible asset or real estate asset, or
which extend its useful life, are recognised in assets on the
balance sheet and amortised over the underlying asset’s estima-
ted useful life.
The effective interest rate is the rate that exactly discounts future
cash disbursements or receipts over the expected life of the
financial instrument in order to obtain the net book value of the
financial asset or liability. The calculation includes transaction
costs and income, premiums and discounts. Transaction costs
and income that are an integral part of the contract’s effective
rate, such as loan administration fees for instance, can be trea-
ted as additional interest.
Financial instruments held for trading are recorded at their fair
value. Changes in their fair value are recognised in the income
statement under “Income from financial instruments held for
trading”. Dividends are entered under "Income from securities",
while interest is entered under "Interest income".
The Group recognises fees in the income statement according to
the type of services rendered and the accounting method of the
financial instruments to which the service relates:
- Fees paid for continuing services are spread out as income
over the duration of the rendered service (loan administration
costs, transaction costs, etc.),
- Fees paid for one-off services are fully recognised as income
when the service has been delivered,
- Fees paid for the execution of an important transaction are
fully recognised in the income statement at the time the tran-
saction is executed.
For certain operations relating to wholesale international custo-
mers, commitment and utilisation fees are determined based on
a percentage of the credit line. These fees are integrated on a
“prorata temporis” base over the life of the credit line, except
if the fees should be integrated in the acquisition cost of the
balance sheet exposure which may result from the credit line.
3.3 TANGIBLE ASSETS
Tangible assets for own use as well as investment property are
recorded at acquisition cost. Costs related directly to the acqui-
sition are capitalised as an integral part of the acquisition cost.
Tangible assets for own use consist of land and buildings, facili-
ties and installations, computer hardware and other equipment.
The heading “Investment property” in IAS 40 includes the
Group’s rented property.

42
5 AUDITED CONSOLIDATED FINANCIAL STATEMENTS
and the arrangement costs for the lease are spread over the
term of the agreement so that the income generates a constant
effective interest rate.
3.6 EMPLOYEE BENEFITS
Employee benefits are measured in accordance with revised IAS
19. The benefits granted to employees by the Group are divided
into the three categories described hereafter.
3.6.1 Short-term benefits
Short-term benefits mainly comprise wages, annual holidays and
bonuses paid within twelve months of the end of the financial
year in respect of that financial year. They are recognised in
the income statement under “Personnel expenses”, including
amounts remaining due on the reporting date.
3.6.2 Long-term benefits
Long-term benefits are benefits generally related to seniority,
paid to active employees more than twelve months after the
closing of the financial year. These commitments are provisioned
based on the value on the reporting date. They are measured
using the same actuarial method as that applied to post-employ-
ment benefits.
3.6.3 Post-employment benefits
In accordance with the organic law of 24 March 1989 on the
Banque et Caisse d’Epargne de l’Etat, Luxembourg, employees
not considered as civil servants (“agents employés”) receive a
pension supplement, paid by the Bank, if they are eligible for the
Luxembourg civil service pension scheme. Pension supplements
concern the following benefits:
- old age pension;
- disability pension;
- surviving spouse/partner pension;
- surviving orphan pension;
- three-month additional pension.
Pensions for employees who are classed as civil servants are also
paid for by the Bank.
Gains or losses arising from the removal from active use or
disposal of tangible assets are determined by the difference
between the proceeds of the disposal and the residual value of
the assets, and are recognised in profit or loss under “Profit from
non-current assets and disposal groups classified as held for sale
and not qualifying as discontinued operations” as at the date of
disposal or removal from active use.
The acquisition cost of equipment and furniture whose normal
useful life is less than one year is recognised directly in profit
or loss for the period under “Other general and administrative
expenses”.
3.4 INTANGIBLE ASSETS
The Group considers software, whether acquired or inter-
nally generated, as well as the related development and set-up
expenses, as intangible assets. Software is amortised over a
3-year period using the straight-line method.
3.5 LEASE AGREEMENTS
A lease agreement which transfers substantially all the risks
and advantages incidental to ownership of an asset is a finance
lease, otherwise it is an operating lease.
3.5.1 A Group entity is a lessee
The Group has essentially entered into operating lease agree-
ments for the rental of its offices or equipment. Lease payments
are recognised in the income statement and when a lease
contract is terminated in advance, the penalties to be paid are
recognised as an expense in the reporting period during which
the termination occurred.
3.5.2 A Group entity is a lessor
When the Group leases an asset within the framework of a
finance lease, the net present value of the lease payments is
recognised as a receivable under “Loans and receivables at
amortised cost” for customers or credit institutions respectively.
The difference between the payments due and their pres-
ent value is recognised as unrealised financial income under
“Interest income” in the income statement. The lease payments

43
5 AUDITED CONSOLIDATED FINANCIAL STATEMENTS
3.6.4 Investment policy of the Compagnie Luxembourgeoise de
Pension (CLP)
The management objective of the “CLP-BCEE” sub-fund is
three-fold: to coordinate the various cash flows, to minimise
the portfolio’s volatility and the probability of an extraordinary
contribution request, and to coincide the actual yield with the
induced yield. To achieve these objectives, the “CLP-BCEE” sub-
fund is authorised to invest in the following instruments:
- Conventional financial instruments:
• Securities negotiable on the capital market:
- Shares in companies or other equivalent securities,
- Bonds and other debt securities,
• Money market instruments such as treasury bills, certificates
of deposit, commercial paper and treasury notes,
• Shares and units in undertakings for collective investment,
including Exchange Traded Funds.
- Derivative financial instruments: options, futures, swaps, rate
agreements and all other derivatives related to securities,
money market instruments, undertakings for collective invest-
ment, currencies, interest rates, exchange rates, commodities,
yields, other derivative financial instruments, financial indices
or financial measures.
- Liquidity:
• All forms of conventional deposits at sight and at term.
- Other instruments: this category includes instruments that
do not fall under one of the above-referenced categories,
for example, units in specialised investment funds, in venture
capital firms, etc., as well as real estate and land.
The “CLP-BCEE” sub-fund invests a minimum of 65% of
its gross assets in bonds, debt securities and money market
financial instruments. Secondarily, “CLP-BCEE” can invest up
to 35% of its assets in shares, equivalent securities and other
instruments, but may not exceed the limit of 10% of gross
assets for other instruments. For the purpose of diversification,
investments made with the same issuer or counterparty may not
exceed 25% of gross assets. The use of derivative financial ins-
truments is permitted by the investment policy for the purpose
of hedging and/or efficient management of the portfolio.
Eligible bonds and money market financial instruments will have
a minimum rating of BBB- (Standard & Poor’s) or Baa3 (Moody’s);
similarly, the issuer must be from a member country of the
European Union or the OECD.
A civil servant’s pension entitlement is determined according
to the civil service pension scheme. However, the pension sup-
plement for an “agent employé” is based on the difference
between the amount of the said benefit as provided by the civil
service pension scheme and the amount of the benefit under
the pension scheme for private sector employees.
Thus, this scheme is inherently a defined-benefit plan which
finances commitments relating to the first pillar.
On 1 December 2009, the pension fund was outsourced to
the BCEE sub-fund of the “Compagnie Luxembourgeoise de
Pension (CLP)”, established as a retirement saving association
(association d’épargne-pension - ASSEP). Therefore, the amount
entered in the balance sheet is the present value of the defined
benefit obligation as at the reporting date, net of plan assets
and of adjustments related to unrecognised actuarial gains and
losses and past services costs.
The defined benefit obligation is calculated each year by inde-
pendent actuaries according to the projected unit credit method.
The present value of the defined benefit obligation is determi-
ned by discounting the future cash disbursements based on the
interest rate of high-quality corporate bonds, denominated in
the currency of the payment of the benefit, the term of which
is close to the estimated average term of the post-employment
benefit obligation.
The sum total of the following amounts represents the annual
pension expenses of the Group’s parent:
- the current service cost;
- interest cost resulting from the application of the discount rate;
- all actuarial gains and losses;
these amounts are net of the expected return on plan assets.
Actuarial gains and losses are systematically recognised under
“Consolidated reserves” in equity.
The calculation of the defined-benefit obligation has, since 2015,
been based on the DAV2004R generation tables which most
closely resemble the longevity of Luxembourg's white-collar
population. In prior years, the calculation of the defined-benefit
obligation had been based on the IGSS (General Inspectorate of
Social Security) mortality tables with an allowance made for a
five-year improvement.

44
When the 0,8% level is reached, Luxembourg credit institutions
will continue to contribute for another eight years to provide an
additional cushion of 0,8% of covered deposits as defined in
Article 163(8) of the Law.
3.8 DEFERRED TAXES
Deferred tax assets and liabilities are recognised on temporary
differences arising between the tax base of assets and liabilities
and their book values. Deferred tax assets and liabilities are
calculated using the comprehensive calculation method, which
takes into account all temporary differences, regardless of the
date on which the tax will become payable or recoverable.
The rates used and tax laws applied to calculate deferred taxes
are those that will apply when the tax becomes payable or
recoverable.
Deferred tax assets are recognised to the extent that it is pro-
bable that the entity will recover the asset within a given time
frame. Deferred taxes on unrealised gains or losses on available-
for-sale assets and on changes in the value of derivative financial
instruments designated as cash flow hedges are recognised in
equity under “Revaluation reserve”. Deferred taxes on actuarial
gains and losses related to pension plan commitments are reco-
gnised in equity under “Consolidated reserves”.
The "CLP-BCEE" sub-fund’s investment policy authorises securi-
ties lending and repo transactions.
Any change to the investment policy is subject to the prior
approval of the Board of Directors of the CLP and the
Supervisory Authority.
3.7 PROVISIONS
According to IAS 37, a provision is a liability of uncertain timing
or amount, but which represents an obligation towards a third
party arising from past events and the settlement of which is
more than 50% likely to result in an outflow of resources embo-
dying economic benefits.
The Bank recognises a provision at the present value when a
reliable estimate can be made of the amount of the obligation.
On 18 December 2015, Luxembourg passed the law on the
resolution, recovery and liquidation measures of credit insti-
tutions and some investment firms and on deposit guarantee
and investor compensation schemes (the “Law”), transposing
into Luxembourg law Directive 2014/59/EU establishing a fra-
mework for the recovery and resolution of credit institutions
and investment firms, as well as Directive 2014/49/EU on deposit
guarantee and investor compensation schemes.
The Law replaces Luxembourg's deposit guarantee and investor
compensation scheme, implemented by the AGDL, with a new
contribution-based deposit guarantee and investor compensa-
tion scheme. The new scheme covers all eligible deposits by a
single depositor up to EUR 100.000 and investments up to EUR
20.000. In addition, the Law requires that deposits arising from
specific transactions, fulfilling a social objective, or relating to
particular life events be covered above the limit of EUR 100.000
for a 12-month period.
The target level of funding of the new “Fonds de Garantie
des Dépôts Luxembourg” (FGDL) is set at 0,8% of the covered
deposits (as defined in Article 163(8) of the Law) of member
institutions and will have to be reached by the end of 2018.
Contributions are to be made annually between 2016 and
2018. For 2015, a provision of 0,2% of covered deposits was
established in anticipation of these contributions. This provision
was used in full in 2016.

45
5 AUDITED CONSOLIDATED FINANCIAL STATEMENTS
4. NOTES TO THE STATEMENT OF FINANCIAL POSITION 1 (in euros)
4.1 CASH AND SIGHT ACCOUNTS WITH CENTRAL BANKS
Cash consists of cash, cash balances with central banks and other sight deposits with banks. The minimum reserve requirement with
the Banque centrale du Luxembourg is entered under “Deposits with central banks”. This is the minimum mandatory reserve to
satisfy the reserve requirement imposed by the Luxembourg central bank. Hence, these funds are not available to finance the Group’s
ordinary operations.
Headings 2 31/12/2015 31/12/2016
Cash 81.173.833 65.263.697
Deposits with central banks 1.034.557.318 2.444.190.562
Other sight deposits 197.597.078 178.470.127
Total 1.313.328.229 2.687.924.387
1 Minor differences between the figures in the notes to the consolidated financial statements and the figures in the different consolidated statements are rounding differences only.2 Term of less than one year.

46
5 AUDITED CONSOLIDATED FINANCIAL STATEMENTS
4.2 LOANS AND RECEIVABLES AT AMORTISED COST – CREDIT INSTITUTIONS
Headings
=<1 year > 1 year total =<1 year > 1 year total
Interbank loans 3.297.098.213 5.285.818 3.302.384.031 2.639.186.453 100.460.473 2.739.646.926
Reverse repurchase/Repurchase agreements 1.981.927.781 88.203 1.982.015.984 887.762.601 - 887.762.601
Roll-over loans 42.146.088 -420.710 41.725.378 52.679.714 -380.959 52.298.755
Finance leases 107.322 126.745 234.067 19.189 644.410 663.599
Fixed-income securities 152.234.534 60.427.343 212.661.878 265.431.436 149.056.108 414.487.544
Other 58.586.858 - 58.586.858 10.372.173 - 10.372.173
Sub-total 5.532.100.797 65.507.400 5.597.608.197 3.855.451.566 249.780.033 4.105.231.598
Undrawn confirmed loans 414.589.158 133.073.006
Impairment of financial assets - -
In the case of reverse repurchase transactions, the Group becomes the legal owner of the securities received as collateral and has the
right to sell or collateralise these securities. No security received as collateral was sold or collateralised as at 31 December 2016.
The Group does not include in this category of loans and receivables outstanding loans that are defined as restructured loans according
to the EBA.
Impairment of loans and receivables – Credit institutions
Credit institutions
Position as at 1 January 2015 48.631
Reclassification -48.631
Additions -
Reversals -
Write-off of receivables -
Exchange gain or loss -
Position as at 31 December 2015 -
Position as at 1 January 2016 -
Reclassification -
Additions -
Reversals -
Write-off of receivables -
Exchange gain or loss -
Position as at 31 December 2016 -
31/12/2015 31/12/2016

47
5 AUDITED CONSOLIDATED FINANCIAL STATEMENTS
31/12/2015
4.3 LOANS AND RECEIVABLES AT AMORTISED COST – CUSTOMERS
Headings
=<1 year > 1 year total =<1 year > 1 year total
“Retail” customers 385.109.542 11.718.515.817 12.103.625.359 407.250.704 12.462.249.821 12.869.500.525
“Corporate” customers 1.610.776.748 3.144.158.817 4.754.935.565 1.444.242.773 3.418.295.199 4.862.537.972
Public sector 870.427.825 1.495.849.374 2.366.277.199 540.179.213 1.543.528.119 2.083.707.332
Sub-total 2.866.314.115 16.358.524.008 19.224.838.123 2.391.672.691 17.424.073.139 19.815.745.830
Undrawn confirmed loans 4.540.799.967 4.443.842.905
Impairment of financial assets -95.013.749 -99.947.678
Of which finance leases:
Headings
=<1 year > 1 year total =<1 year > 1 year total
Finance leases 15.801.208 90.963.700 106.764.908 9.957.968 96.776.040 106.734.007
Sub-total 15.801.208 90.963.700 106.764.908 9.957.968 96.776.040 106.734.007
31/12/2015 31/12/2016
31/12/2015 31/12/2016

48
5 AUDITED CONSOLIDATED FINANCIAL STATEMENTS
Impairment of loans and receivables - Customers
Retail customers Corporate Total
Position as at 1 January 2015 31.890.072 81.087.522 112.977.593
Additions 6.284.911 11.919.145 18.204.056
Reversals -7.061.655 -27.883.135 -34.944.789
Write-off of receivables (*) -524.497 -970.380 -1.494.877
Exchange gain or loss - 271.766 271.766
Position as at 31 December 2015 30.588.831 64.424.918 95.013.749
Impairment of assets - individual risk 16.741.289 64.424.918 81.166.207
Impairment of assets - collective risk 13.847.542 - 13.847.542
Total 30.588.831 64.424.918 95.013.749
Position as at 1 January 2016 30.588.831 64.424.918 95.013.749
Additions 5.632.288 26.217.404 31.849.692
Reversals -4.376.901 -19.386.723 -23.763.624
Write-off of receivables (*) -227.588 -2.275.323 -2.502.911
Exchange gain or loss - -649.226 -649.226
Position as at 31 December 2016 31.616.628 68.331.050 99.947.679
Impairment of assets - individual risk 18.013.531 68.331.050 86.344.581
Impairment of assets - collective risk 13.603.097 - 13.603.097
Total 31.616.628 68.331.050 99.947.678
(*) Write-off of receivables represents the amounts considered as permanently lost on impaired assets.
Outstanding amounts of impaired loans: EUR 262.049.637 as at 31 December 2016, compared with EUR 225.673.254 a year earlier.
Value adjustments cover the principal and interest.
In addition to information on impairments of loans and receivables at amortised cost for customers, the Group reports restructured
loans by type of customer. Financial restructurings follow the EBA's definition and are characterised by a deterioration in financial
position due to the customer's financial difficulties and the fact that new financing conditions are granted to the customer, including
in the form of an extension of the final maturity by more than six months or the partial or total deferment of payment beyond the
concessions the Group would have been willing to accept for a customer under normal circumstances.

49
5 AUDITED CONSOLIDATED FINANCIAL STATEMENTS
as at 31/12/2016 Unimpaired Total
restructured loans Carring amount Impairment Total restructured loans
“Retail” customers 33.725.865 13.073.834 1.953.561 11.120.273 44.846.138
“Corporate” customers 102.620.861 95.606.685 36.583.649 59.023.036 161.643.898
Total 136.346.727 108.680.519 38.537.210 70.143.309 206.490.036
Impaired restructured loans
as at 31/12/2015 Unimpaired Total
restructured loans Carring amount Impairment Total restructured loans
“Retail” customers 47.512.488 10.102.172 1.233.884 8.868.288 56.380.776
“Corporate” customers 199.238.006 36.725.200 20.834.492 15.890.708 215.128.714
Total 246.750.494 46.827.372 22.068.376 24.758.996 271.509.490
Impaired restructured loans

50
5 AUDITED CONSOLIDATED FINANCIAL STATEMENTS
4.4 FINANCIAL INSTRUMENTS
Financial instruments are analysed by counterparty and type, differentiating between the instruments with a maturity up to one year
and those with a maturity of more than one year.
4.4.1 Assets and liabilities held for trading
Assets
=<1 year > 1 year total =<1 year > 1 year total
Non-derivative financial instruments 166.342 251.422 417.765 530.849 218.162 749.011
Derivative financial instruments (note 4.9.) 154.228.960 46.468.831 200.697.791 245.859.185 47.936.005 293.795.190
Total 154.395.302 46.720.254 201.115.555 246.390.034 48.154.167 294.544.201
Liabilities
Non-derivative financial instruments - 785 785 378.511 9.571 388.083
Derivative financial instruments (note 4.9) 106.791.783 63.539.784 170.331.566 82.621.136 73.425.619 156.046.755
Total 106.791.783 63.540.569 170.332.351 82.999.648 73.435.190 156.434.838
Assets - Non-derivative financial instruments
Debt instruments 166.342 251.422 417.765 530.849 218.162 749.011
Public sector - - - - - -
Credit institutions 121.682 63.715 185.397 151.389 9.217 160.607
Corporate customers 44.660 187.708 232.368 379.460 208.944 588.405
Equity instruments - - - - - -
Total 166.342 251.422 417.765 530.849 218.162 749.011
Unrealised profit/loss at the reporting date 566 - 566 - 7.436 7.436
Liabilities - Non-derivative financial instruments
Short sales
Bonds - 785 785 378.511 9.571 388.083
Shares - - - - - -
Total - 785 785 378.511 9.571 388.083
31/12/2015 31/12/2016
31/12/2015 31/12/2016
31/12/2015 31/12/2016
31/12/2015 31/12/2016

51
5 AUDITED CONSOLIDATED FINANCIAL STATEMENTS
4.4.2 Available-for-sale financial assets
Headings
=<1 year > 1 year total =<1 year > 1 year total
Debt instruments 2.511.965.171 7.486.574.394 9.998.539.565 1.677.692.041 8.127.407.216 9.805.099.257
Public sector 427.812.071 2.224.857.745 2.652.669.817 285.691.014 1.979.864.215 2.265.555.229
Credit institutions 1.487.938.200 3.643.625.069 5.131.563.268 929.691.960 4.073.054.292 5.002.746.252
Corporate customers 596.214.900 1.618.091.580 2.214.306.480 462.309.067 2.074.488.709 2.536.797.776
Equity instruments 1.005.562.944 - 1.005.562.944 1.074.144.424 - 1.074.144.424
Credit institutions 4.312.411 - 4.312.411 3.487.377 - 3.487.377
Corporate customers 1.000.517.065 - 1.000.517.065 1.069.758.547 - 1.069.758.547
Other 733.468 - 733.468 898.500 - 898.500
Total 3.517.528.115 7.486.574.394 11.004.102.509 2.751.836.464 8.127.407.216 10.879.243.681
Impairment of financial assets -13.140.711 -47.339.316 -60.480.026 -18.279.111 -25.434.693 -43.713.804
Unrealised profit/loss at the reporting date 753.202.704 350.196.534 1.103.399.237 627.175.701 341.834.062 969.009.764
Creditinstitutions
Impairment of available-for-sale financial assets:
Total
Position as at 1 January 2015 39.582.130 10.342.515 12.949.978 62.874.623
Reclassification - 1.749.978 -1.749.978 -
Additions - 3.002.020 - 3.002.020
Reversals -7.046.650 - - -7.046.650
Write-off of receivables1 - - - -
Exchange gain or loss 1.042.626 607.408 - 1.650.035
Position as at 31 December 2015 33.578.106 15.701.922 11.200.000 60.480.028
Position as at 1 January 2016 33.578.106 15.701.922 11.200.000 60.480.028
Additions - 9 - 9
Reversals -5.262.890 -2.012 -3.400.692 -8.665.594
Write-off of receivables1 - - -7.799.308 -7.799.308
Exchange gain or loss -509.657 208.328 - -301.329
Position as at 31 December 2016 27.805.559 15.908.247 - 43.713.806
1 Write-off of receivables represents the amounts considered as permanently lost on impaired assets.
Corporate customers
ABS/MBS Other
31/12/2015 31/12/2016

52
5 AUDITED CONSOLIDATED FINANCIAL STATEMENTS
Unrealised profit/loss on available-for-sale financial assets:
The unrealised profit/loss as at the reporting date breaks down as follows:
Debt instruments
Debt instruments include variable-rate bonds, fixed-rate bonds and structured bonds. Fixed-rate and structured bonds are converted
into variable-rate bonds using derivative financial instruments (asset swaps). The Group applies fair value hedge accounting to these
transactions. The prospective and retrospective efficiencies are close to 100%.
31/12/2016 Fair value adjustment of debt instruments
Changes in unhedged Changes in Changes Retrospective
risk (“credit and hedged risk in hedge risk efficiency
liquidity spread”) (interest rate and price) rate
Fixed-rate bonds and
structured bonds 52.750.909 293.218.390 -293.218.390 100,00%
Variable-rate bonds 6.664.132
31/12/2015 Fair value adjustment of debt instruments
Changes in unhedged Changes in Changes Retrospective
risk (“credit and hedged risk in hedge risk efficiency
liquidity spread”) (interest rate and price) rate
Fixed-rate bonds and
structured bonds 34.350.120 333.788.834 -333.788.834 100,00%
Variable-rate bonds 2.476.449
Fair value adjustments of the
swap leg hedging the asset
Fair value adjustments of the
swap leg hedging the asset

53
5 AUDITED CONSOLIDATED FINANCIAL STATEMENTS
Breakdown of changes in carrying amount:
Debt instruments 2015 2016
Position as at 1 January 9.750.181.015 9.998.539.565
Acquisitions 2.210.496.540 2.338.827.314
Sales -33.118.160 -40.478.982
Repayments -1.844.341.731 -2.510.175.757
Realised profit/(loss) 441.590 185.135
Pro-rata interest -23.337.189 -535.095
Unrealised valuations -112.117.050 -17.981.972
Impairment 3.002.003 16.974.548
Exchange gain or loss 47.332.547 19.744.502
Position as at 31 December 9.998.539.565 9.805.099.257
Equity instruments
Headings 31/12/2015 31/12/2016
Equity instruments 1.005.562.944 1.074.144.424
Total 1.005.562.944 1.074.144.424
Impairment of financial assets -10.949.922 -11.158.250
Unrealised profit/loss at the reporting date 732.977.818 616.376.333
Breakdown of changes in carrying amount:
Equity instruments 2015 2016
Position as at 1 January 1.153.020.266 1.005.562.944
Acquisitions 71.542.822 231.393.824
Sales -46.453.383 -47.899.129
Realised profit/(loss) 24.320.973 13.201.972
Unrealised valuations -200.770.106 -129.803.457
Impairment -607.408 -208.328
Exchange gain or loss 4.509.778 1.896.598
Position as at 31 December 1.005.562.944 1.074.144.424

54
5 AUDITED CONSOLIDATED FINANCIAL STATEMENTS
4.5 SECURITIES HELD TO MATURITY
Headings
=<1 year > 1 year total =<1 year > 1 year total
Debt instruments
Public sector 89.255.453 876.492.822 965.748.275 90.204.773 687.730.575 777.935.349
Credit institutions 715.001.018 2.093.586.193 2.808.587.211 1.052.383.514 1.779.528.827 2.831.912.342
Corporate customers 233.828.001 675.337.939 909.165.940 334.364.359 628.571.421 962.935.780
Total 1.038.084.472 3.645.416.954 4.683.501.426 1.476.952.647 3.095.830.823 4.572.783.470
No impairment loss on held-to-maturity securities has been recognised by the Group.
The decrease in assets under this heading is explained by the non-replacement of assets that reached maturity in the context of reinvest-
ments of liabilities with maturity of less than two years in bonds of the same duration.
Breakdown of changes in carrying amount:
Held-to-maturity securities 2015 2016
Position as at 1 January 4.699.397.776 4.683.501.426
Acquisitions 1.530.998.811 976.290.449
Repayments -1.531.637.151 -1.053.341.489
Pro-rata interest -15.505.388 -33.666.916
Exchange gain or loss 247.379 -
Position as at 31 December 4.683.501.426 4.572.783.470
31/12/2015 31/12/2016
4.6 INVESTMENTS IN ASSOCIATES ACCOUNTED FOR USING THE EQUITY METHOD
31/12/2015 31/12/2016
Acquisition value as at 1 January 54.227.635 54.227.635
Establishment - -
Disposals - -
Total (as acquisition value) 54.227.635 54.227.635

55
5 AUDITED CONSOLIDATED FINANCIAL STATEMENTS
List of associates:
Associates Fraction of Acquisition Equity-accounted
capital held (%) value value 2016
Société Nationale de Circulation Automobile S.à r.l. 20,00 24.789 7.212.095
Luxair S.A. 21,81 14.830.609 98.195.329
Société de la Bourse de Luxembourg S.A. 22,75 128.678 23.771.577
Europay Luxembourg S.C. 25,40 96.279 3.342.696
FS-B S.à.r.l. 28,70 3.003.694 3.686.819
FS-T S.à.r.l. 28,70 1.104.793 1.083.292
Visalux S.C. 36,25 412.506 8.706.031
La Luxembourgeoise S.A. 40,00 16.856.760 128.413.431
La Luxembourgeoise-Vie S.A. 40,00 12.047.625 87.962.975
BioTechCube (BTC) Luxembourg S.A. 50,00 5.000.000 752.205
Sub-total direct holdings in associates 53.505.734 363.126.451
EFA Partners S.A. 29,05 551.900 598.236
Pecoma International S.A. 33,33 170.000 187.610
Sub-total indirect holdings in associates 721.900 785.846
Total 54.227.634 363.912.297
Associates Fraction of Acquisition Equity-accounted
capital held (%) value value 2015
Société Nationale de Circulation Automobile S.à r.l. 20,00 24.789 6.958.027
Luxair S.A. 21,81 14.830.609 88.912.700
Société de la Bourse de Luxembourg S.A. 22,75 128.678 22.389.641
Europay Luxembourg S.C. 25,40 96.279 392.557
FS-B S.à.r.l. 28,70 3.003.694 3.616.094
FS-T S.à.r.l. 28,70 1.104.793 1.064.526
Visalux S.C. 36,26 412.506 454.933
La Luxembourgeoise S.A. 40,00 16.856.760 117.728.292
La Luxembourgeoise-Vie S.A. 40,00 12.047.625 81.765.414
BioTechCube (BTC) Luxembourg S.A. 50,00 5.000.000 762.950
Sub-total direct holdings in associates 53.505.734 324.045.135
EFA Partners S.A. 29,05 551.900 598.811
Pecoma International S.A. 33,33 170.000 210.018
Sub-total indirect holdings in associates 721.900 808.829
Total 54.227.634 324.853.964

56
5 AUDITED CONSOLIDATED FINANCIAL STATEMENTS
Pursuant to the provisions of IFRS 12 Disclosure of Interests in Other Entities, the Group considers all interests in other companies to be
immaterial and therefore provides the following information:
Net income from Net income Other items of Total comprehensive
continuing after tax from comprehensive income
operations discontinued income
operations
Sub-total direct holdings in associates
Société Nationale de Circulation Automobile S.à r.l. 111.502 - 142.566 254.068
Luxair S.A. 433.284 - 8.849.345 9.282.629
Société de la Bourse de Luxembourg S.A. 2.965.194 - -1.583.258 1.381.936
Europay Luxembourg S.C. 132.738 - 2.817.401 2.950.139
FS-B S.à.r.l. 70.725 - - 70.725
FS-T S.à.r.l. 18.766 - - 18.766
Visalux S.C. 8.391.645 - -140.547 8.251.098
La Luxembourgeoise S.A. 13.214.457 - -2.529.316 10.685.141
La Luxembourgeoise-Vie S.A. 6.180.531 - 17.030 6.197.561
BioTechCube (BTC) Luxembourg S.A. -9.264 - - -9.264
Indirect interests
EFA Partners S.A. -2.371 - - -2.371
Pecoma International S.A. -18.892 - - -18.892
2016
Associates
Net income from Net income Other items of Total comprehensive
continuing after tax from comprehensive income
operations discontinued income
operations
Sub-total direct holdings in associates
Société Nationale de Circulation Automobile S.à r.l. 122.987 - 1.437.280 1.560.267
Luxair S.A. 3.645.137 - 494.568 4.139.705
Société de la Bourse de Luxembourg S.A. 2.959.780 - -3.373.657 -413.877
Europay Luxembourg S.C. 17.229 - -129.748 -112.519
FS-B S.à.r.l. 65.179 - - 65.179
FS-T S.à.r.l. 18.449 - - 18.449
Visalux S.C. -71.398 - -351.456 -422.854
La Luxembourgeoise S.A. 14.614.076 - -280.867 14.333.209
La Luxembourgeoise-Vie S.A. 2.092.895 - -6.324.974 -4.232.079
BioTechCube (BTC) Luxembourg S.A. -7.783 - 7.872 89
Indirect interests
EFA Partners S.A. -4.167 - - -4.167
Pecoma International S.A. -15.376 - - -15.376
The table for financial year 2015 has been included to facilitate the comparison with the new format of the table for financial year 2016.
The Group has no structured investment vehicles and has not issued any securitisations.
2015
Associates

57
5 AUDITED CONSOLIDATED FINANCIAL STATEMENTS
4.7 SECURITIES COLLATERALISED
- Securities collateralised in the framework of repurchase agreements
Headings 31/12/2015 31/12/2016
Debt instruments issued by the public sector 250.169.147 382.035.302
Debt instruments issued by credit institutions 136.080.118 4.522.630
Debt instruments issued - others 11.496.150 1.897.074
Equity instruments 13.457.516 -
Total 411.202.931 388.455.006
Debt instruments issued are primarily available-for-sale and held-to-maturity assets.
The decrease observed in debt instruments issued by credit institutions stems from the lower number of collateral security agreements
as at 31 December 2016.
- Securities lent and other collateral
Headings 31/12/2015 31/12/2016
Securities lending
Debt instruments issued by the public sector 177.989.435 275.591.249
Debt instruments issued by credit institutions 22.376.369 153.128.809
Debt instruments issued - others - 37.545.163
Other collateral
Debt instruments issued by the public sector 37.184.960 11.220.393
Total 237.550.764 477.485.614
4.8 CONVERTIBLE BONDS INCLUDED IN THE DIFFERENT PORTFOLIOS
Headings 31/12/2015 31/12/2016
Convertible bonds - -
As in the prior year, the Group held no convertible bonds in its portfolio at 31 December 2016.

58

59
5 AUDITED CONSOLIDATED FINANCIAL STATEMENTS
4.9 DERIVATIVES
Balances as at 31/12/2016 Assets Liabilities Notional
Derivative financial instruments held for trading 293.795.190 156.046.755 15.456.350.456
Operations linked to exchange rates 240.877.112 73.222.832 13.498.790.756
- Foreign exchange swaps and forward exchange contracts 240.126.534 73.013.627 13.292.261.196
- CCIS economic hedge (FVO) 743.144 - 3.763.000
- other 7.434 209.204 202.766.559
Operations linked to interest rates 49.838.662 79.744.508 1.801.183.947
- IRS 47.565.808 61.793.370 1.245.011.854
- IRS economic hedge (FVO) 654.722 16.010.539 390.407.000
- other 1.618.133 1.940.600 165.765.093
Operations linked to equity 3.079.415 3.079.415 156.375.753
- Equity and index options 3.079.415 3.079.415 156.375.753
Fair value hedges (micro) 50.612.290 762.595.111 8.872.933.993
Operations linked to exchange rates 37.766.679 181.160.462 1.498.702.420
- CCIS 37.766.679 181.160.462 1.498.702.420
Operations linked to interest rates 10.473.198 533.520.886 6.325.921.922
- IRS (interest rate) 10.473.198 533.520.886 6.325.921.922
Operations linked to other indices 2.372.413 47.913.762 1.048.309.651
- IRS (other indices) 2.372.413 47.913.762 1.048.309.651
Fair value hedges (macro) 7.027.110 116.582.787 1.127.307.347
Operations linked to interest rates 7.027.110 116.582.787 1.127.307.347
- IRS (interest rate) 7.027.110 116.582.787 1.127.307.347
Cash flow hedges 10.256.556 15.666.111 493.003.125
Operations linked to exchange rates 4.432.589 15.666.111 453.403.125
- CCIS 4.432.589 15.666.111 453.403.125
Operations linked to interest rates 5.823.967 - 39.600.000
- IRS 5.823.967 - 39.600.000

60
5 AUDITED CONSOLIDATED FINANCIAL STATEMENTS
Balances as at 31/12/2015 Assets Liabilities Notional
Derivative financial instruments held for trading 200.697.791 170.331.566 19.516.887.031
Operations linked to exchange rates 145.598.727 93.731.726 13.104.220.860
- Foreign exchange swaps and forward exchange contracts 145.578.609 93.711.640 12.909.650.578
- other 20.117 20.086 194.570.282
Operations linked to interest rates 49.904.951 71.403.808 1.855.947.923
- IRS 48.339.956 69.532.422 1.647.953.336
- other 1.564.995 1.871.386 207.994.587
Operations linked to equity 5.194.113 5.194.113 4.533.816.085
- Equity and index options 5.194.113 5.194.113 4.533.816.085
Operations linked to credit risk - 1.918 22.902.162
- Credit derivatives (CDS) - 1.918 22.902.162
Fair value hedges (micro) 56.524.246 801.865.324 9.984.086.409
Operations linked to exchange rates 43.647.665 201.534.710 2.655.377.634
- CCIS 43.647.665 201.534.710 2.655.377.634
Operations linked to interest rates 5.863.014 519.786.850 6.024.570.165
- IRS (interest rate) 5.863.014 519.786.850 6.024.570.165
Operations linked to other indices 7.013.567 80.543.765 1.304.138.610
- IRS (other indices) 7.013.567 80.543.765 1.304.138.610
Fair value hedges (macro) 7.569.597 87.942.227 866.183.649
Operations linked to interest rates 7.569.597 87.942.227 866.183.649
- IRS (interest rate) 7.569.597 87.942.227 866.183.649
Cash flow hedges 13.408.685 2.669.396 375.105.385
Operations linked to exchange rates 6.870.920 2.669.396 330.305.385
- CCIS 6.870.920 2.669.396 330.305.385
Operations linked to interest rates 6.537.765 - 44.800.000
- IRS 6.537.765 - 44.800.000

61
5 AUDITED CONSOLIDATED FINANCIAL STATEMENTS
4.10 FINANCIAL ASSETS DESIGNATED AT FAIR VALUE THROUGH PROFIT OR LOSS
Headings
=<1 year > 1 year total =<1 year > 1 year total
Debt instruments
Credit institutions - - - - 174.490.246 174.490.246
“Corporate” customers - - - - 87.660.425 87.660.425
Total - - - - 262.150.671 262.150.671
Unrealised profit/loss at the
reporting date - - - - 689.762 689.762
This item includes financial instruments which, depending on their characteristics, incorporate derivative components that are not
directly related and are therefore not eligible for measurement at fair value through the revaluation reserve.
4.11 CHANGE IN FAIR VALUE OF A PORTFOLIO OF FINANCIAL INSTRUMENTS HEDGED AGAINST INTEREST RATE RISK
Headings 31/12/2015 31/12/2016
Assets: Change in fair value of a portfolio of financial instruments
hedged against interest rate risk 52.453.419 80.022.997
Total 52.453.419 80.022.997
This item includes the fair value of the “Loans and receivables at amortised cost - Customers” portfolios hedged against interest rate
risk using a fair value macro-hedging strategy. The hedging relates solely to a portfolio of fixed-rate loans hedged by IRS derivative
financial instruments.
The change in this item between 2015 and 2016 is due primarily to a volume effect and to the change in the interest-rate curves used
to determine fair value.
31/12/2015 31/12/2016

62

63
5 AUDITED CONSOLIDATED FINANCIAL STATEMENTS
4.12 TANGIBLE ASSETS FOR OWN USE
Land and Other equipment Total
construction and furniture
Position as at 1 January 2016 370.031.349 63.944.361 433.975.710
Increase 20.390.221 7.305.751 27.695.972
Decrease -1.580.706 -9.406.237 -10.986.943
Position as at 31 December 2016 388.840.864 61.843.875 450.684.739
Accumulated depreciation
Position as at 1 January 2016 111.983.899 31.348.255 143.332.154
Basis adjustment -935.798 -9.370.563 -10.306.361
Additions 10.123.602 8.919.768 19.043.370
Position as at 31 December 2016 121.171.703 30.897.460 152.069.163
Net book value
Position as at 1 January 2016 258.047.450 32.596.106 290.643.556
Position as at 31 December 2016 267.669.161 30.946.415 298.615.576
Land and Other equipment Total
construction and furniture
Position as at 1 January 2015 248.848.171 62.372.727 311.220.898
Increase 121.202.181 10.793.974 131.996.155
Transfer 89.344 - 89.344
Decrease -108.347 -9.222.340 -9.330.687
Position as at 31 December 2015 370.031.349 63.944.361 433.975.710
Accumulated depreciation
Position as at 1 January 2015 104.128.168 31.866.283 135.994.451
Basis adjustment -108.347 -9.222.340 -9.330.687
Additions 7.964.078 8.704.312 16.668.390
Position as at 31 December 2015 111.983.899 31.348.255 143.332.154
Net book value
Position as at 1 January 2015 144.720.003 30.506.444 175.226.447
Position as at 31 December 2015 258.047.450 32.596.106 290.643.556
The significant increase in 2015 in net book value relates to the Group's parent company's acquisition of the “19 Liberté” building at
the beginning of the first quarter of 2015.

64
5 AUDITED CONSOLIDATED FINANCIAL STATEMENTS
4.13 INVESTMENT PROPERTY
Position as at 1 January 2016 30.579.274
Increase (acquisitions) -
Increase (investment expenditure) 484.573
Decrease -699.208
Position as at 31 December 2016 30.364.639
Accumulated depreciation
Position as at 1 January 2016 15.364.475
Basis adjustment -347.984
Additions 1.037.095
Position as at 31 December 2016 16.053.586
Net book value
Position as at 1 January 2016 15.214.799
Position as at 31 December 2016 14.311.053
Position as at 1 January 2015 30.438.089
Increase (acquisitions) -
Increase (investment expenditure) 230.529
Exceptional transfer -89.344
Decrease -
Position as at 31 December 2015 30.579.274
Accumulated depreciation
Position as at 1 January 2015 14.323.707
Basis adjustment -
Additions 1.040.768
Position as at 31 December 2015 15.364.475
Net book value
Position as at 1 January 2015 16.114.382
Position as at 31 December 2015 15.214.799

65
5 AUDITED CONSOLIDATED FINANCIAL STATEMENTS
Rental income from rented investment property amounted to EUR 2.588.894 for the 2016 financial year, versus EUR 2.545.303 in the
prior year. Maintenance costs related to investment property were EUR 329.877 in 2016, down from EUR 435.931 one year earlier.
The fair value of investment property stood at EUR 61.422.940 at year-end 2016, compared with EUR 59.812.131 at end-2015. This fair
value measurement is categorised as Level 2 in the fair value hierarchy.
This fair value is estimated by an appraiser according to the following criteria:
- Geographical location of the buildings,
- General condition of the building,
- Use for residential or commercial purposes,
- Surface area of the object.

66
5 AUDITED CONSOLIDATED FINANCIAL STATEMENTS
4.14 INTANGIBLE ASSETS
Position as at 1 January 2016 27.745.317
Increase 10.760.937
Decrease -
Position as at 31 December 2016 38.506.254
Accumulated depreciation
Position as at 1 January 2016 12.728.105
Basis adjustment -
Additions 9.258.992
Position as at 31 December 2016 21.987.097
Net book value
Position as at 1 January 2016 15.017.211
Position as at 31 December 2016 16.519.156
Position as at 1 January 2015 30.230.768
Increase 9.479.520
Decrease -11.964.971
Position as at 31 December 2015 27.745.317
Accumulated depreciation
Position as at 1 January 2015 17.486.627
Basis adjustment -11.964.971
Additions 7.206.449
Position as at 31 December 2015 12.728.105
Net book value
Position as at 1 January 2015 12.744.140
Position as at 31 December 2015 15.017.211
The depreciation expense related to intangible assets is recognised under “Depreciation allowances for tangible and intangible assets”
in the income statement.

67
5 AUDITED CONSOLIDATED FINANCIAL STATEMENTS
4.15 TAXES: TAX ASSETS AND LIABILITIES
Whereas current tax is a current liability, deferred taxes are the amounts of income taxes that may be payable in the future in respect
of taxable temporary differences.
The Group posted a current tax liability of EUR 58.954.065 as at 31 December 2016 versus EUR 100.111.672 in the previous year.
As no tax law incorporating IFRS standards has been passed in Luxembourg, the Group calculates the tax liability payable based on the
increase in net assets of the balance sheet items valued through the income statement.
As at 31 December 2016, the Group posted a deferred tax asset of EUR 104.323.210, and a deferred tax liability of EUR 162.650.834.
The table below gives a breakdown of the changes to deferred tax assets and liabilities, depending on whether the changes relate to
items that are charged or credited to equity, or relate to items that are charged or credited to the income statement.
Headings 01/01/2016 Movements in Movements in 31/12/2016
equity income statement
Deferred tax assets 91.996.961 12.326.249 - 104.323.210
Deferred tax liabilities -178.146.610 -3.252.412 18.748.187 -162.650.835
Net deferred tax assets / liabilities -86.149.649 9.073.837 18.748.187 -58.327.625
Headings 01/01/2015 Movements in Movements in 31/12/2015
equity income statement
Deferred tax assets 67.991.244 24.005.717 - 91.996.961
Deferred tax liabilities -185.738.723 7.369.402 222.711 -178.146.610
Net deferred tax assets / liabilities -117.747.479 31.375.119 222.711 -86.149.649

68
5 AUDITED CONSOLIDATED FINANCIAL STATEMENTS
4.15.1 Tax assets
Headings 31/12/2015 31/12/2016
Deferred taxes 91.996.961 104.323.210
Tax assets 91.996.961 104.323.210
Breakdown of deferred tax assets according to origin:
Headings 31/12/2015 31/12/2016
Derivative financial instruments - application of fair value 1.853.467 1.614.763
Debt instruments - application of fair value 9.028.872 6.718.311
Equity instruments - application of fair value 1.192.634 1.971.568
Pension funds - actuarial gain or loss 79.921.988 94.018.568
Deferred tax assets 91.996.961 104.323.210
4.15.2 Tax liabilities
Headings 31/12/2015 31/12/2016
Current tax liabilities 100.111.672 58.954.065
Income tax 59.015.599 35.472.913
Municipal business tax 41.074.673 23.459.752
Wealth tax 21.400 21.400
Deferred taxes 178.146.610 162.650.834
Tax liabilities 278.258.282 221.604.899
Breakdown of deferred tax liabilities according to origin:
Headings 31/12/2015 31/12/2016
Derivative financial instruments - application of fair value 1.908.942 1.575.878
Debt instruments - application of fair value 19.789.596 22.807.904
Equity instruments - application of fair value 4.042.739 4.319.620
Regulatory and other provisions 147.302.941 128.554.753
Pension funds - actuarial gain or loss 5.102.392 5.392.679
Deferred tax liabilities 178.146.610 162.650.834

69
5 AUDITED CONSOLIDATED FINANCIAL STATEMENTS
31/12/2015 31/12/2016
31/12/2015 31/12/2016
4.16 OTHER ASSETS
Headings 31/12/2015 31/12/2016
Operational outstandings 4.646.806 5.743.579
Preferential or secured debtors 6.615.162 3.536.490
Other 30.676 444.191
Total 11.292.644 9.724.260
31/12/2015 31/12/2016
4.17 DEPOSITS AT AMORTISED COST - CREDIT INSTITUTIONS
Headings
=<1 year > 1 year total =<1 year > 1 year total
Inter-bank deposits 3.863.496.486 189.372.404 4.052.868.890 4.589.192.076 132.277.203 4.721.469.279
Repurchase agreements 386.750.291 9.859 386.760.150 20.240.967 - 20.240.967
Total 4.250.246.777 189.382.263 4.439.629.039 4.609.433.043 132.277.203 4.741.710.246
4.18 DEPOSITS AT AMORTISED COST - CUSTOMERS
Headings
=<1 year > 1 year total =<1 year > 1 year total
Private sector 21.015.084.258 1.222.276.989 22.237.361.247 22.211.262.928 813.125.092 23.024.388.020
Demand deposit and
notice accounts 6.886.156.912 - 6.886.156.912 7.090.126.964 - 7.090.126.964
Time deposit accounts 3.648.589.611 1.222.276.989 4.870.866.600 3.122.863.671 813.125.092 3.935.988.764
Savings 10.453.520.746 - 10.453.520.746 11.998.272.293 - 11.998.272.293
Repurchase agreements 26.816.989 -26.816.989 - - - -
Public sector 4.675.925.127 10.201.657 4.686.126.784 4.199.307.047 892.241.048 5.091.548.095
Total 25.691.009.385 1.232.478.646 26.923.488.031 26.410.569.975 1.705.366.140 28.115.936.115
4.19 FINANCIAL LIABILITIES DESIGNATED AT FAIR VALUE THROUGH PROFIT OR LOSS
Headings
=<1 year > 1 year total =<1 year > 1 year total
Issues - - - - 148.612.880 148.612.880
Total - - - - 148.612.880 148.612.880
Unrealised profit/loss
at the reporting date - - - - 1.679.451 1.679.451
This item includes financial instruments which, depending on their characteristics, incorporate derivative components that are not
directly related and are therefore not eligible for measurement at fair value through the revaluation reserve.

70
5 AUDITED CONSOLIDATED FINANCIAL STATEMENTS
31/12/2015 31/12/2016
4.20 ISSUANCE OF DEBT SECURITIES
Headings
=<1 year > 1 year total =<1 year > 1 year total
Cash certificates 183.321.626 223.213.925 406.535.551 95.955.811 141.724.486 237.680.296
Commercial paper 3.760.296.156 - 3.760.296.156 4.041.253.629 - 4.041.253.629
Medium Term Notes and
other securities issued 1.401.904.454 222.628.878 1.624.533.332 - 490.687.756 490.687.756
Total 5.345.522.236 445.842.803 5.791.365.039 4.137.209.440 632.412.242 4.769.621.682
of which:
- Subordinated notes 25.683.615 102.028.137 127.711.752 - 101.479.685 101.479.685
The Group issued EMTNs for a nominal amount of EUR 276.620.000 in 2016, as against EUR 1.404.675.877 the previous year.
New issues 2015 2016
maturing in < 2 years 1.323.863.943 -
maturing in 2 - 5 years - 40.500.000
maturing in > 5 years 80.811.934 236.120.000
Total 1.404.675.877 276.620.000
of which:
- Structured notes (at issue value) 1.404.675.877 90.000.000
The main structured notes issued in 2016 were in the plain vanilla category.
Securities issued which have either come to maturity or have been reimbursed prior to maturity during 2015 and 2016, respectively:
2015 2016
Maturities/repayments 1.580.183.207 1.412.871.538
Total 1.580.183.207 1.412.871.538
of which:
- Subordinated notes (at issue value) 23.800.000 25.000.000
- Structured notes (at issue value) 1.547.163.207 33.442.595
The Group bought back its own issues in the amount of EUR 390.000 during 2016 (vs. EUR 1.290.000 in 2015).

71
5 AUDITED CONSOLIDATED FINANCIAL STATEMENTS
Breakdown of subordinated loans as at 31 December 2016
Description Rate Issue currency Nominal amount Assimilated Non assimilated
issued - EUR portion EUR portion - EUR
Loan 2000-2020 0,058 EUR 8.600.000 6.239.562 2.360.438
Loan 2001-2021 0,162 EUR 11.000.000 8.950.582 2.049.418
Loan 2001-2021 0,162 EUR 30.000.000 24.410.678 5.589.322
Loan 2002-2022 0,185 EUR 50.000.000 50.000.000 -
Total 99.600.000 89.600.821 9.999.179
The interest expense on subordinated notes stood at EUR 978.026 as at 31 December 2016, compared with EUR 1.871.271 as at 31
December 2015.
4.21 PROVISIONS
Changes during the financial year:
2015 2016
Position as at 1 January 4.899.785 47.215.958
Additions 43.035.888 101.766
Reversals -642.715 -11.303.913
Application -77.000 -31.130.577
Position as at 31 December 47.215.958 4.883.234
The “Provisions” line includes provisions recorded under IAS 37, consisting of provisions for risks related to litigation and to guarantees
given or commitments made to customers, and of provisions for personnel costs not covered by other standards. The decrease in this
provision primarily stems from the first contribution to the "Fonds de garantie des dépôts, Luxembourg" and from payment made to
the German authorities under the settlement reached in a tax matter. The excess provision related to these proceedings against BCEE
was reversed through the income statement.
4.22 OTHER LIABILITIES
Headings 31/12/2015 31/12/2016
Operational outstandings 1.791.387 28.982.559
Preferential or secured creditors 24.036.392 26.042.764
Other 3.816.482 3.163.405
Total 29.644.261 58.188.728

72
5 AUDITED CONSOLIDATED FINANCIAL STATEMENTS
4.23 PENSION FUNDS - DEFINED-BENEFIT PENSION PLAN
Main estimates used to determine pension commitments:
Variables 31/12/2015 31/12/2016
Discount rate for active employees 2,20% 1,65%
Discount rate for beneficiaries 1,80% 1,20%
Salary increases (including indexation) 3,25% 3,25%
Pension increases (including indexation) 2,25% 2,25%
Induced yield 1,98% 1,40%
The induced yield of 1,40% in 2016 corresponds to the weighted average of the discount rates for working people and for annuitants
as fixed at the end of the 2016 financial year.
Net pension fund allowance under heading “Personnel expenses” in the income statement:
Components 31/12/2015 31/12/2016
Current service cost 7.364.779 9.418.011
Interest cost 8.696.608 11.051.611
Induced yield -6.252.608 -7.509.964
Total 9.808.779 12.959.658
Pension commitments:
2015 2016
Commitments as at 1 January 495.752.808 559.157.615
Current service cost 7.364.779 9.418.011
Interest cost 8.696.608 11.051.611
Benefits paid -11.732.352 -11.871.096
Actuarial gains or losses 59.075.773 73.670.117
Commitments as at 31 December 559.157.615 641.426.258
Civil servants’ pension payments are initially made directly by the State to civil servants. The Group's parent company only recognises
the payments when the amounts are repaid to the State. Hence, “Benefits paid” amounting to EUR 11.871.096 include the repay-
ments to the Luxembourg State of civil servants’ pensions in respect of the 2015 financial year.

73
5 AUDITED CONSOLIDATED FINANCIAL STATEMENTS
Breakdown of actuarial gains and losses:
2015 2016
Actuarial gains and losses arising from changes in actuarial assumptions 53.125.164 73.397.696
- financial assumptions -21.751.712 73.397.696
- demographic assumptions 74.876.876 -
Actuarial gains and losses arising from experience adjustments 5.950.609 272.421
Total actuarial gains and losses 59.075.773 73.670.117
Sensitivity analysis of pension commitments:
Impact of changes in actuarial assumptions decrease increase
on the pension commitment as at 31/12/2016
Change in average actuarial rate (-/+ 50 bps) 76.397.984 -64.921.709
Change in wage increase rate (-/+ 50 bps) -67.252.028 86.153.781
Change in pension increase rate (-/+ 25 bps) -27.314.254 29.093.752
Change in mortality tables (-/+ 5 years) 136.485.307 -126.166.591
Cumulative effect 118.317.009 -75.840.767
Impact of changes in actuarial assumptions decrease increase
on the pension commitment as at 31/12/2015
Change in average actuarial rate (-/+ 50 bps) 63.377.907 -54.137.748
Change in wage increase rate (-/+ 50 bps) -65.706.428 76.033.057
Change in pension increase rate (-/+ 50 bps) -22.705.693 24.138.133
Change in mortality tables (-/+ 5 years) 116.021.723 -109.053.480
Cumulative effect 90.987.509 -63.020.038
Maturity analysis of pension commitments:
31/12/2015 31/12/2016
Average duration of the pension commitment 21.36 years 22.30 years
Analysis of maturities of commitments to be paid 559.157.616 641.426.257
Pensions outstanding for the year 6.733.651 6.946.714
Commitments to be paid within 12 months 12.435.454 12.299.186
Commitments to be paid in 1-3 years 26.170.543 25.942.819
Commitments to be paid in 3-6 years 41.331.965 42.205.210
Commitments to be paid in 6-11 years 71.388.676 75.550.159
Commitments to be paid in 11-16 years 73.447.846 80.979.139
Commitments to be paid after 16 years 327.649.481 397.503.031

74
5 AUDITED CONSOLIDATED FINANCIAL STATEMENTS
Pension plan assets:
2015 2016
Assets as at 1 January 356.431.857 379.967.554
Benefits paid -11.732.352 -11.871.096
Contribution 31.718.541 33.871.709
Induced yield 6.252.608 7.509.964
Fair value gain / loss -2.703.099 2.451.896
Assets as at 31 December 379.967.554 411.930.026
In 2016, the Group's parent company made an annual contribution of EUR 9.871.709 and an extraordinary contribution of EUR
24.000.000 compared with a contribution of EUR 7.718.541 and an extraordinary contribution of EUR 24.000.000 in the previous
year. The extraordinary contributions for 2015 and 2016 were used to offset the impact of the switch from the IGSS mortality tables
to DAV2004R.
Pension plan investments:
2016 Credit institutions Public sector Corporate Total
Fixed-income securities 101.617.521 144.909.333 19.828.256 266.355.110
Variable-income securities - - 121.024.297 121.024.297
Other assets (primarily deposits) 24.550.619 - - 24.550.619
Total 126.168.140 144.909.333 140.852.553 411.930.026
2015 Credit institutions Public sector Corporate Total
Fixed-income securities 150.743.047 123.060.588 - 273.803.634
Variable-income securities - - 49.883.790 49.883.790
Other assets (primarily deposits) 56.280.130 - - 56.280.130
Total 207.023.176 123.060.588 49.883.790 379.967.553
Net pension commitments:
2014 2015 2016
Pension commitments 495.752.808 559.157.615 641.426.257
Plan assets measured at fair value -356.431.857 -379.967.554 -411.930.026
Unfinanced commitments 139.320.951 179.190.062 229.496.231

75
5 AUDITED CONSOLIDATED FINANCIAL STATEMENTS
Stock of actuarial gains and losses:
Stock as at 1 January 2016 191.832.821
2016 net change 71.218.221
Stock as at 31 December 2016 263.051.042
Stock as at 1 January 2015 130.053.949
2015 net change 61.778.872
Stock as at 31 December 2015 191.832.821
The Group’s parent company's estimated total contribution to the pension fund for 2017 is EUR 32.974.689. This contribution is
divided into an extraordinary contribution of EUR 24.000,000 to offset the impact of the switch from the IGSS mortality tables to
DAV2004R and an annual contribution of EUR 8.974.689.
4.24 RELATED-PARTY TRANSACTIONS
The related parties of the parent company are the governmental institutions and the Group’s key management personnel.
All transactions with related parties are completed under market conditions.
4.24.1 Government institutions
The Group's parent company, established by the law of 21 February 1856 and governed by the organic law of 24 March 1989, is
an autonomous public institution endowed with legal personality. Ultimate responsibility for the institution lies with the Government
Minister with responsibility for the Treasury.
Therefore, the Luxembourg Government controls the Group and as a result, must comply with the requirements of IAS 24.
The Group makes the following disclosures concerning its commercial relationship with the Luxembourg State and other governmental
institutions.
in euros 31/12/2015 31/12/2016
ASSETS (mainly loans at amortised cost) 3.596.212.235 3.304.634.344
in euros 31/12/2015 31/12/2016
LIABILITIES (deposits at amortised cost) 3.160.746.884 4.129.756.087

76
4.24.2 Compensation paid to the members of the management and administrative bodies
Compensation paid to the members of the governing bodies of the Group’s parent company breaks down as follows:
31/12/2015 31/12/2016
Board of Directors (nine members) 120.450 357.000
Management body (five directors at 31/12/2015 and four directors at 31/12/2016) 1.014.106 867.143
Total 1.134.556 1.224.143
Like all civil servants, the members of the management body participate in the Luxembourg civil service pension scheme. These government
pensions are paid out by the Group's pension fund.
4.24.3 Loans and receivables granted to members of the Bank’s management and administrative bodies
Loans and advances granted to members of the management and administrative bodies of the Group’s parent company are as follows:
31/12/2015 31/12/2016
Board of Directors (nine members) 2.594.592 2.530.234
Management body (five directors at 31/12/2015 and four directors at 31/12/2016) 1.773.559 472.512
Total 4.368.151 3.002.745
4.25 STATUTORY AUDITOR’S FEES
31/12/2015 31/12/2016
Statutory audit of the annual financial statements 509.885 535.500
Other audit services 135.380 142.475
Tax services - 3.100
Other 166.775 331.000
Total 812.040 1.012.075
The amounts included in the above item are exclusive of VAT.

77
5 AUDITED CONSOLIDATED FINANCIAL STATEMENTS
4.26 DIRECT FEES AND CONTRIBUTIONS RELATED TO THE EUROPEAN BANKING UNION
2015 2016
European Central Bank supervision fees 689.028 967.270
CSSF supervision fees 133.500 133.500
Single Resolution Board fees - 108.299
Total 822.528 1.209.069
Contribution to the "Fonds de Garantie des Dépôts, Luxembourg" - 22.437.405
Contribution to the "Fonds de Resolution Luxembourg" 2.478.856 6.403.010
Total 2.478.856 28.840.415
4.27 OFF-BALANCE SHEET ITEMS
Type of guarantees issued
Headings 31/12/2015 31/12/2016
Completion bonds 323.133.147 367.502.011
Letters of credit 41.223.892 56.906.464
Counter-guarantees 408.246.517 362.821.031
Documentary credits 13.191.609 -
Other 6.406.041 25.762.576
Total 792.201.205 812.992.082
Commitments
Headings 31/12/2015 31/12/2016
Amounts subscribed and unpaid on securities, equity interests and
shares in affiliated companies 9.993.882 6.640.000
Undrawn confirmed loans 4.955.389.125 4.576.915.911
Financing 2.289.688.993 1.878.365.528
Current accounts 1.737.325.997 2.250.906.966
Money-market contracts 471.196.867 -
Other 457.177.269 447.643.417
Other 160.680.424 13.344.619
Total 5.126.063.431 4.596.900.530

78
Starting in 2016, the Group reclassified documentary credits from “Type of guarantees issued” to the “Other” subheading under
“Commitments”, to comply with the requirements of the reporting methods defined by the EBA.
The Bank acquired a 12% stake in the capital of Encevo S.A., the holding company for Luxembourg's market-leading energy group.
The transaction was finalised on 7 March 2016. In 2015, the commitment reflecting the acquisition is included under “Other”.
Management of third-party assets
The Group provides management and representation services to third parties, particularly wealth management services, custody and
administration of securities, hire of safe deposit boxes, fiduciary representation and agent functions.

79
5 AUDITED CONSOLIDATED FINANCIAL STATEMENTS
5. NOTES TO THE INCOME STATEMENT 1 (in euros)
5.1 INTEREST INCOME
Interest received and similar income 2015 2016
Assets repayable on demand 46.884 43.754
Financial assets held for trading 64.320.713 117.375.057
Financial assets designated at fair value through profit or loss - 1.018.236
Available-for-sale financial assets 209.585.075 199.512.401
Receivables at amortised cost - Loans and advances 401.761.880 383.135.846
Investments held to maturity at amortised cost 75.706.301 63.439.177
Derivatives - Hedge accounting, interest rate risk 115.456.591 89.097.890
Other assets 5.200.966 6.958.538
Total 872.078.408 860.580.899
Interest paid and similar expenses 2015 2016
Financial liabilities held for trading -21.042.110 -28.851.333
Financial liabilities designated at fair value through profit or loss - -3.520.696
Liabilities at amortised cost - Deposits -72.006.649 -75.328.843
Liabilities at amortised cost - Debt certificates -36.114.847 -39.224.582
Liabilities at amortised cost - Subordinated loans -1.173.169 -355.150
Derivatives - Hedge accounting, interest rate risk -350.522.654 -331.847.449
Other liabilities -8.199.522 -15.781.706
Total -489.058.950 -494.909.759
Interest income 383.019.458 365.671.140
Total interest received and similar income not recognised at fair value
through the income statement 807.757.695 743.205.842
Total interest paid and similar expenses not recognised at fair value
through the income statement -468.016.840 -466.058.426
5.2 INCOME FROM VARIABLE-INCOME SECURITIES
Headings 2015 2016
Available-for-sale financial assets 38.302.833 44.574.661
Income from variable-income securities 38.302.833 44.574.661
1 Minor differences between the figures in the notes to the consolidated financial statements and the figures in the different consolidated statements are rounding differences only.

80
5 AUDITED CONSOLIDATED FINANCIAL STATEMENTS
5.3 FEE AND COMMISSION INCOME
Headings 2015 2016
Loan activities 42.607.290 43.611.098
Asset management 39.079.661 37.970.132
Investment fund activities 48.328.495 49.519.189
Demand deposit accounts and related activities 29.535.253 30.186.158
Insurance premiums 5.311.042 4.937.654
Other (*) 6.360.912 8.174.291
Total commissions received 171.222.653 174.398.522
Loan activities -2.527.254 -2.472.667
Asset management -17.202.647 -19.684.686
Investment fund activities -10.295.883 -10.666.936
Demand deposit accounts and related activities -7.517.446 -8.179.289
Other (*) -3.202.086 -4.975.487
Total commissions paid -40.745.316 -45.979.065
Total commissions 130.477.337 128.419.457
(*) mostly fees on derivative financial instruments
The fee breakdown for 2015 has been restated for comparison purposes.
5.4 INCOME FROM FINANCIAL INSTRUMENTS NOT RECOGNISED AT FAIR VALUE THROUGH PROFIT OR LOSS
Headings 2015 2016
Available-for-sale financial instruments 45.455.523 13.387.314
Loans and receivables at amortised cost 135.877 -221.696
Financial liabilities at amortised cost 62.142 -
Total 45.653.542 13.165.618
The amount in “Available-for-sale financial instruments” for 2016 relates primarily to the sale of SES S.A. shares.

81
5 AUDITED CONSOLIDATED FINANCIAL STATEMENTS
5.5 INCOME FROM FINANCIAL INSTRUMENTS HELD FOR TRADING
Headings 2015 2016
Equity instruments and related derivatives 4.173.287 5.229.942
Foreign exchange instruments and related derivatives -3.072.240 1.193.059
Interest rate instruments and related derivatives 17.854.399 9.733.691
Credit derivatives 30.291 2.303
Commodities and related derivatives 451.850 -
Total 19.437.586 16.158.995
5.6 INCOME FROM FINANCIAL INSTRUMENTS DESIGNATED AT FAIR VALUE THROUGH PROFIT OR LOSS
Headings 2015 2016
Financial assets designated at fair value through profit or loss - 689.762
Financial liabilities designated at fair value through profit or loss - 1.679.451
Total - 2.369.213
5.7 NET INCOME FROM HEDGING TRANSACTIONS
Headings 2015 2016
Fair value hedge
Debt instruments (assets) hedged by derivative financial instruments 2.103.742 -155.927
Debt issues hedged by derivative financial instruments -49.454 110.505
Loans hedged by derivative financial instruments 2.250.351 1.565.657
Total 4.304.639 1.520.235
Value adjustment on hedged instruments -159.589.329 -33.594.887
Value adjustment on hedging instruments 163.893.968 35.115.122
Total 4.304.639 1.520.235
Market risk hedging operations are highly efficient. Loans are hedged by derivative financial instruments using micro-hedge or macro-
hedge transactions, in accordance with IAS 39.

82
5 AUDITED CONSOLIDATED FINANCIAL STATEMENTS
5.8 OTHER NET OPERATING INCOME
Headings 2015 2016
Other operating income 10.082.185 10.259.352
Other operating expenditure -4.207.920 -13.505.468
Other net operating income 5.874.265 -3.246.116
“Other operating income and expenditure” mainly include:
- the rent from property rented and miscellaneous advances from tenants,
- VAT repayments relating to previous financial years,
- income on amortised loans,
- the share of annual contributions to the FRL and FGDL for which no provision has been recorded.
5.9 PERSONNEL EXPENSES
Headings 2015 2016
Compensation 161.798.304 162.819.659
Social security charges 9.582.996 9.336.777
Pensions and similar expenses 12.545.220 12.639.697
Pension fund expense 9.808.779 12.959.658
Other personnel expenses 3.813.426 3.818.273
Total 197.548.725 201.574.064
5.10 OTHER GENERAL AND ADMINISTRATIVE EXPENSES
Headings 2015 2016
Expenses related to movable and immovable property 20.869.848 22.844.983
Rents and maintenance of software 18.561.989 20.191.216
Operating expenditure related to the banking business 25.833.299 27.431.518
Other 12.758.623 13.376.659
Total 78.023.759 83.844.376

83
5 AUDITED CONSOLIDATED FINANCIAL STATEMENTS
5.11 DEPRECIATION ALLOWANCES FOR TANGIBLE ASSETS
Depreciation
Headings 2015 2016
Depreciation - buildings 7.964.080 10.123.604
Depreciation - equipment and furniture 8.704.312 8.919.766
Depreciation of tangible assets 16.668.392 19.043.370
The increase in the “Depreciation - buildings” line stems from the opening of the “19 Liberté” beginning in the second half of 2016.
Impairment
No impairment of tangible assets according to IAS 36 was recognised by the Group in 2015 or 2016.
5.12 DEPRECIATION ALLOWANCES FOR INTANGIBLE ASSETS
Depreciation
Headings 2015 2016
Depreciation 7.206.449 1.037.095
Depreciation of intangible assets 7.206.449 1.037.095
Impairment
No impairment of intangible assets according to IAS 36 was recognised by the Group in 2015 or 2016.
5.13 DEPRECIATION ALLOWANCES FOR INVESTMENT PROPERTIES
Depreciation
Headings 2015 2016
Depreciation 1.040.768 9.258.993
Depreciation of tangible assets - investment 1.040.768 9.258.993
Impairment
No impairment of investment properties according to IAS 36 was recognised by the Group in 2015 or 2016.

84
5 AUDITED CONSOLIDATED FINANCIAL STATEMENTS
5.14 NET IMPAIRMENT ALLOWANCES FOR INDIVIDUAL AND COLLECTIVE CREDIT RISKS
2015 2016
Additions Reversals Total Additions Reversals Total
Available-for-sale securities -3.002.020 7.046.650 4.044.629 -9 8.665.594 8.665.585
Loans and receivables -18.204.056 34.991.407 16.787.352 -31.849.692 23.765.636 -8.084.056
of which individual impairment -17.631.892 34.716.852 17.084.959 -31.454.902 23.126.398 -8.328.504
of which collective impairment -572.163 274.556 -297.608 -394.790 639.238 244.448
-21.206.076 42.038.057 20.831.981 -31.849.701 32.431.230 581.529
2015 2016
Interest on impaired available-for-sale financial assets 387.190 515.432
Interest on impaired loans and receivables 6.717.337 4.934.297
Total 7.104.526 5.449.729
5.15 PROVISIONS AND REVERSAL OF PROVISIONS
Headings 2015 2016
Provisions -43.548.472 -614.349
Reversal of provisions 1.155.299 11.816.496
Net allowances -42.393.173 11.202.147
The significant allowance in 2015 resulted from the recognition of provisions for risks related to litigation and to guarantees
given or commitments made to customers, and of provisions for personnel costs not covered by other standards and for future contri-
butions to the FGDL.
5.16 TAX EXPENSE
Headings 2015 2016
Tax on income from continuing operations 64.241.363 63.763.700
Deferred taxes -222.711 -18.748.188
Tax on profit/(loss) for the period 64.018.652 45.015.512
The standard tax rate applicable in Luxembourg was 29,22% as at 31 December 2016 and 31 December 2015. The Group’s effective
tax rate was 14,67% in 2016 and 18,88% in 2014, given the differences between the Luxembourg tax base and the accounting
principles for consolidated financial statements under IFRS as adopted by the European Union.

85
5 AUDITED CONSOLIDATED FINANCIAL STATEMENTS
The difference between these two rates may be analysed as follows:
2015 2016
Income before tax 339.006.818 306.811.580
Tax rate 29,22% 29,22%
Theoretical tax at standard rate 99.057.792 89.650.344
Tax impact of non-deductible expenses 7.373.567 141.122
Tax impact of non-taxable income -14.862.548 -20.763.084
Share in the income of equity-accounted associates -6.378.748 -8.544.208
Tax rebates and reductions -18.393.214 -6.010.386
Change in deferred tax rate - -9.726.280
Tax refund/payment from previous financial years - -1.980.041
Other -2.778.197 2.248.046
Tax on profit/(loss) for the period 64.018.652 45.015.512
As in 2015, the Group had the benefit of an investment tax allowance in respect of 2016, deducted at the line “Tax rebates and
reductions”.
5.17 RETURN ON ASSETS
In accordance with Article 38-4 of the Law on the Financial Sector, the Group reported its return on assets, which stood at 0,60%
versus 0,64% in the prior year.

86

87
6. FINANCIAL RISK MANAGEMENT 1
6.1 GENERAL RULES FOR MANAGING FINANCIAL RISK
Traditionally, the Group's parent company has pursued a
prudent and conservative risk management policy.
6.1.1 Role of the Board of Directors
The Group’s parent company established the Internal Capital
Adequacy Assessment Process (ICAAP) to make a comprehensive
assessment of all risks the Bank could be exposed to. For each
risk identified, the parent company estimates the materiality and
probability of occurrence, and assesses its resources for the
management of the risk identified.
It prepares an annual ICAAP report, which is submitted for the
approval of the Board of Directors of the Group’s parent
company and then filed with the CSSF and the European Central
Bank.
6.1.2 Role of the Executive Committee
The parent company’s Executive Committee (Senior Management)
sets the objectives for the commercial entities, the type of
transactions to perform and the limits applicable to such
transactions, as well as the organisation and internal control
rules.
6.1.3 Role of the Audit and Risk Committee
The Group's parent company's Audit and Risk Committee is
made up of four members of the Board of Directors and is
tasked with periodically assessing the status of internal control,
the work and conclusions of internal and external audits, the
status of implementation of any recommendations made, the
status of implementation of the annual audit plan and the
budget, and any documents relating to the annual internal
control report.
The Chief Executive Officer, Deputy Chief Executive Officer,
Chief Risk Officer and Chief Internal Auditor are invited to all
meetings of the Audit and Risk Committee. The statutory
auditor of the Group's parent company is invited to those
meetings held to prepare and approve the annual financial
statements and other reports it issues.
The Audit and Risk Committee's role is to facilitate the effective
control by the Board of Directors by providing a more
comprehensive analysis of the position of the Group's parent
company and by giving members of the Board of Directors
access to information enabling them to fulfil their oversight
responsibilities.
6.1.4 Responsibilities of the Risk Management function
From an organisational point of view, the risk control function is
delegated to the Risk Management function. This function
reports directly to the Executive Committee and operates
independently from all commercial activities within the Bank.
On 1 July 2016, the Bank established a set of risk monitoring
committees made up of the heads of different Bank units.
6.1.5 Responsibilities of the Credit Analysis and Management
department
From an organisational point of view, credit risk control is
delegated to the Credit Risk Analysis and Management
department, a unit which operates independently from all
commercial activities. It is responsible for:
- establishing a consistent framework to analyse credit risks,
performing the analysis itself and continuously monitoring this
risk;
- approving or rejecting applications from commercial entities,
and escalating cases to the Executive Committee that involve
transactions whose outstanding amounts are above a limit set
for processing by the Credit Committee, which reports to the
Executive Committee.
The Credit Analysis unit therefore monitors both credit risk and
counterparty risk. This involves analysing loan applications from
all commercial entities and performing analyses in order to set
ex ante limits, including responsibility for internal ratings-based
models for wholesale exposures (appraiser models). The head of
the Credit Analysis unit is in charge of the Credit Risk Analysis
and Management department.
5 AUDITED CONSOLIDATED FINANCIAL STATEMENTS
1 Minor differences between the figures in the notes to the consolidated financial statements and the figures in the different consolidated statements are rounding differences only.

88
5 AUDITED CONSOLIDATED FINANCIAL STATEMENTS
6.1.6 Compliance
Compliance risk - also called non-conformity risk - generally
refers to the risk of loss stemming from activities not carried out
in accordance with current standards.
Compliance risk is the responsibility of the Compliance unit,
which ensures in particular:
- compliance with anti-money laundering requirements through
the use of a tool designed to detect suspect transactions;
- in general, compliance with the Group's parent company's
regulatory environment, delegating a number of elements to
other departments, including Internal Audit;
- monitoring of customer complaints.
The Group's parent company has a Compliance Committee
tasked with handling all compliance matters outside the scope
of the Compliance unit itself.
6.1.7 Internal Audit
Internal Audit performs regular and repeated audits of the Risk
Management environment. During these audit missions, Internal
Audit checks the appropriateness of procedures and their
application by the Risk Management Department.
6.1.8 Systems for measuring and tracking limits
6.1.8.1 Credit risk
The Risk Management Department continuously monitors the
quality of all debtors.
The credit quality of retail commitments is monitored on the
basis of internal ratings that include a behavioural analysis.
Wholesale records also have internal ratings, derived from
appraiser models. Very often, these commitments also have
external ratings. The gap analysis between the internal and
external ratings is part of the monitoring.
The Risk Management Department reports to Senior
Management on a continuous basis on changes in the quality of
debtors. The department conducts a quarterly analysis of the
changes in credit quality with regard to the Bank’s portfolios and
submits the results to Senior Management.
The positions held by the trading room are subject to daily ex
post monitoring to ensure compliance with the credit limits set
by Senior Management. Traders have real-time access to these
limits.
In addition to counterparty limits, the Group's parent company
has set up a system of limits by sector and region to monitor
concentration risk.
6.1.8.2 Market risk
Market risk is generally the risk of the Group suffering financial
loss on the instruments it holds as a result of unfavourable
developments in market parameters, such as interest rates,
foreign exchange rates, share prices, etc.
The Group's parent company takes an integrated approach to
managing interest rate risk for its entire banking book.
The parent company thus implements a set of methods to assess
and monitor interest rate risk:
- permanent calculation of the Basis Point Value (BPV) indicators
for trading room and Asset Liability Management (ALM)
positions exposed to interest rate risk. BPV is a simple and
effective method of quantifying the market risk generated by
small interest rate fluctuations for the positions held. Traders
and ALM analysts are required to always operate within the
BPVs set by Senior Management and monitored by Risk
Control.
- value-at-risk (VaR) for trading floor and ALM positions, to
determine the amounts at risk with respect to the positions
held by the Bank. Risk amounts are subject to limits set by
Senior Management and supervised by the Risk Control unit.
VaR is a more sophisticated measurement tool than simpler
indicators such as BPV, since it:
• integrates correlations of changes in risk factors between
positions held;
• expresses the potential loss as a single amount that can be
compared with the Bank’s equity;
• quantifies the probability of the occurrence of the loss.

The VaR method is also used to manage the parent company's
equity portfolio with VaR and stop-loss limits.
The parent company uses a set of absolute limits to manage
foreign exchange risk. The foreign exchange position is
monitored on an aggregated basis by traders in the Financial
Markets (FIM) unit.
6.1.8.3 Counterparty risk stemming from derivative financial
instrument transactions
The parent company has negotiated International Swaps and
Derivatives Association Inc. (ISDA) framework agreements
including Credit Support Annexes (CSA) designed to limit
counterparty risk on derivative financial instrument trades with
a positive mark-to-market valuation. At end-2016, 75,1% of
derivative financial instrument transaction outstandings were
covered by such agreements.
Alongside ISDA-CSA framework agreements, the parent
company uses increasingly central counterparties (CCPs) to limit
counterparty risk. At end-2016, 13,1% of derivative financial
instrument transaction outstandings were liquidated through
these CCPs.
6.1.8.4 Liquidity risk
Liquidity risk results from a mismatch between financial inflows
and outflows on a specific date. The risk for a financial institution
is that it may be unable to meet its payment obligations at a
given point in time as a result of having insufficient liquid assets
relative to its maturing liabilities. By virtue of its financial
structure, the Group's parent company is generally in a position
of excess liquidity.
The parent company constantly monitors liquidity risk on the
basis of maturities, including both very detailed reconciliation of
cash inflows and outflows over a six-month horizon and a
medium- and long-term assessment of structural funding
requirements. Short-time financing needs in the main currencies
are subject to specific limits.
The parent company conducted the stress tests required by
circular CSSF 09/403 in 2016 on at least a monthly basis to show
that it would have sufficient liquid assets to cope with
unexpected large-scale withdrawals over an extended period.
Under normal circumstances, the parent company has stable
and diversified liabilities, notably in the form of a very solid
customer deposit base and Euro Commercial Paper (ECP), US
Commercial Paper (USCP) and Euro Medium Term Note (EMTN)
refinancing programmes, which ensure a comfortable liquidity
position. Furthermore, due to its high-quality fixed-income
securities portfolio, the parent company would be able, if
necessary, to access the repo market or participate in the ECB's
money-market operations.
In the event of an urgent need for large amounts of liquidity, the
parent company has an intraday and overnight credit line with
the Luxembourg Central Bank (BCL) secured by pledges of
public sector bonds or other fixed-income securities. To this end,
the parent company aims to continually have a portfolio of a
minimum of EUR 3 billion in fixed-income securities that can
serve as a guarantee to the BCL. As at 31 December 2016, this
portfolio amounted to EUR 3,5 billion. At year-end 2016, the
amount of the portfolio of assets eligible for refinancing with
the BCL or usable on the interbank market exceeded EUR 10
billion.
§ II.1. of CSSF Circular 07/301 “Risk identification” explicitly
mentions the securitisation risk of which the credit institution is
the originator or sponsor. Securitisation is one of the techniques
used to manage liquidity, since it allows a bank to remove assets
from the balance sheet to raise funds. The parent company has
not participated in such an operation as either an initiator or a
sponsor and it is not likely to do so in the future.
The parent company is an indirect member of the CLS
(Continuous-Linked Settlement) foreign exchange transaction
settlement system. The overwhelming majority of foreign-
exchange transactions are now handled by the CLS. Transaction
date flows of overnight transactions are not processed through
CLS. For these transactions, the settlement of initial flows, i.e.
those that took place on the transaction date, is done in the
conventional manner through correspondent banks. Maturity
date flows for these same transactions are in principle settled
through CLS.
89
5 AUDITED CONSOLIDATED FINANCIAL STATEMENTS

Membership in the CLS system virtually eliminates counterparty
risk (settlement risk) arising from foreign-exchange transactions
through the “payment-versus-payment” principle and reduces
the parent company’s liquidity risk by netting transactions,
which considerably reduces settlement volumes.
6.2 EXPOSURE TO CREDIT AND COUNTERPARTY RISK
6.2.1 Objectives and management of credit and counterparty risk
Each parent company commitment giving rise to a credit risk is
subject to prior analysis by the Credit Analysis and Management
department.
For loans granted to the domestic economy recognised in the
statement of financial position under “Loans and receivables at
amortised cost - Customers”, the decision-making structure is
hierarchically organised into a number of credit committees,
depending on the customer’s overall outstanding amount. From
a specified threshold, loan files must be decided on by the
parent company’s Executive Committee. The portfolio structure
breaks down into residential mortgage loans for over half of the
outstanding amount. Credit risk relating to residential mortgage
loans is covered by the process of assessing customers’ ability to
repay loans and the existence of actual guarantees. The parent
company follows rigorous procedures for analysing loan
applications and obtaining the related collateral for corporate
loans and receivables. Basel III methodology is used to
continuously monitor risk trends across all portfolios.
The parent company did not change its risk management policy
in the 2016 financial year.
For interbank markets and international loans, contracts are
recognised in the statement of financial position under “Loans
and receivables at amortised cost - Credit institutions”, “Loans
and receivables at amortised cost - Customers”, “Available-for-
sale financial assets - Fixed-income securities”, “Held-to-maturity
securities” and “Assets designated at fair value through profit or
loss”; a large majority of counterparties consist of banking and
financial institutions. Internal ratings are applied to banking
counterparties using a combination of quantitative and
qualitative analyses. The quantitative component is based on
ratios that best describe the counterparty’s profitability, level of
capital, liquidity and the quality of its assets, while the qualitative
component is based on the analyst’s own assessment of non-
financial factors such as market share, quality of management
and external ratings. The parent company pursued its prudent
investment policy in 2016, resulting in:
- a large proportion of investments in covered bonds, which
offer more security than senior unsecured bonds;
- a concentration in investments in debt guaranteed by the
European Union or some of its member States.
With regard to international loans to non-financial entities
recognised in the statement of financial position under “Loans
and receivables at amortised cost - Customers”, “Available-for-
sale financial assets - Fixed-income securities”, “Held-to-maturity
securities” and “Assets designated at fair value through profit or
loss”, priority is given to commitments in OECD countries
classified as at least Investment Grade. Like all the parent
company’s other counterparties, these are assigned an internal
rating based on rules similar to those applied to banks and
financial institutions.
Outstanding amounts are subject to counterparty risk monitoring
and to regular checks based on updated financial analyses and
proposed adjustments to limits per counterparty. The parent
company also applies a country limit system for all countries in
which it is present. These limits are reviewed on a periodic basis
(at least annually).
Investments in derivative financial instruments are heavily
regulated through the use of industry standard ISDA agreements
that include compensation clauses in the event of default by
either party. The parent company has also adopted an additional
risk mitigation mechanism by negotiating the CSA to ISDA
agreements with the largest counterparties in respect of off-
balance sheet transactions.
The CSA specifies the type of collateral permitted, in the form of
cash or first-class securities, on the basis of periodic reassessments
of bilateral positions when the net value of outstanding
agreements exceeds a certain threshold.
90
5 AUDITED CONSOLIDATED FINANCIAL STATEMENTS

6.2.2 Credit and concentration risk
Concentration risk is the risk resulting from an excessive
exposure with regard to one single debtor, a group of debtors,
an economic sector or a country. To avoid this risk, the parent
company has implemented a set of procedures to efficiently
manage the limits set. Concentration risk can be measured
either from the commitment point of view or from the point of
view of the parent company’s resources. In the latter case, the
risk is correlated with liquidity risk.
The parent company reviews at least annually the different types
of limits affecting the components of concentration risk.
It has therefore invested in appropriate risk management tools
in line with the range of risk profiles and different financing
techniques.
In addition to counterparty limits, the parent company has set
up a system of limits by sector and region to control concentration
risk.
Generally speaking, commitments are concentrated in high
credit ratings (AAA, AA and A) to limit risk exposure and
volatility, systematically avoiding riskier segments of the market.
91
5 AUDITED CONSOLIDATED FINANCIAL STATEMENTS

92
Maximum exposure to credit risk 31/12/2015 31/12/2016
Cash and sight accounts with central banks 1.313.328.229 2.687.924.387
Loans and receivables at amortised cost – Credit institutions 5.597.608.197 4.105.231.598
Loans and receivables at amortised cost – Customers 19.224.838.123 19.815.745.830
Financial instruments held for trading 201.115.555 294.544.201
Hedging derivative financial instruments 77.502.528 67.895.956
Financial assets designated at fair value through profit or loss - 262.150.671
Available-for-sale securities – Fixed-income securities 9.998.539.565 9.805.099.257
Held-to-maturity securities 4.683.501.426 4.572.783.470
Exposure of balance sheet commitments 41.096.433.623 41.611.375.370
Completion bonds 323.133.147 367.502.011
Letters of credit 41.223.892 56.906.464
Counter-guarantees 408.246.517 362.821.031
Documentary credits 13.191.609 -
Other 6.406.041 25.762.576
Undrawn confirmed loans 4.955.389.125 4.576.915.911
Exposure off-balance sheet commitments 5.747.590.330 5.389.907.993
Total exposure 46.844.023.954 47.001.283.363
Variable-income securities are not included in the above table.
The parent company uses the following standard techniques to mitigate credit and counterparty risk:
- collateral:
Breakdown by type of collateral 31/12/15 31/12/16
Mortgages 12.371.600.949 13.216.386.919
Reverse repurchase agreements 2.616.441.507 1.643.048.260
Pledge through cash or securities deposits 116.734.465 106.585.815
- personal guarantees: EUR 54.955.960 at year-end 2016, compared with EUR 56.160.060 one year earlier,
- ISDA – CSA contracts,
- Global Master Repurchase Agreements (GMRA).

93
5 AUDITED CONSOLIDATED FINANCIAL STATEMENTS
Financial assets, subject to a legally enforceable netting framework agreement or a similar agreement:
31/12/2016 Financial assets Balance sheet Financial assets Financial liabilities Collateral
before balance netting with recorded on the received
sheet netting financial balance sheet
liabilities
Reverse repurchase /
Repurchase agreements 1.643.108.329 375.304.222 1.267.804.107 - 1.272.466.104 -
Derivatives 181.890.223 - 181.890.223 43.975.716 133.638.589 4.275.918
Total assets 1.824.998.553 375.304.222 1.449.694.331 43.975.716 1.406.104.694 4.275.918
Financial assets that are the subject of netting Potential netting not recognised
on the balance sheet
Financial assets
after taking
potential netting
into account
31/12/2015 Financial assets Balance sheet Financial assets Financial liabilities Collateral
before balance netting with recorded on the received
sheet netting financial balance sheet
liabilities
Reverse repurchase /
Repurchase agreements 948.008.654 - 948.008.654 3.579.862 300.783.957 643.644.835
Derivatives 124.291.018 - 124.291.018 51.311.127 36.940.914 36.038.977
Total assets 1.072.299.672 - 1.072.299.672 54.890.989 337.724.871 679.683.811
Financial assets that are the subject of netting Potential netting not recognised
on the balance sheet
Financial assets
after taking
potential netting
into account

94
5 AUDITED CONSOLIDATED FINANCIAL STATEMENTS
Financial liabilities, subject to a legally enforceable netting framework agreement or a similar agreement:
31/12/2016 Financial liabilities Balance sheet Financial liabilities Financial assets Collateral
before balance netting with recorded on the given
sheet netting financial balance sheet
assets
Repurchase/Reverse
repurchase agreements 20.240.967 - 20.240.967 - 20.058.237 182.730
Derivatives 987.451.854 - 987.451.854 143.117.201 772.685.121 71.649.532
Total liabilities 1.007.692.822 - 1.007.692.822 143.117.201 792.743.358 71.832.263
Financial liabilities that are the subject of netting Potential netting not recognised
on the balance sheet
Financial liabilities
after taking
potential netting
into account
31/12/2015 Financial liabilities Balance sheet Financial liabilities Financial assets Collateral
before balance netting with recorded on the given
sheet netting financial balance sheet
assets
Repurchase/Reverse
repurchase agreements 334.999.085 - 334.999.085 73.601.094 250.316.153 11.081.838
Derivatives 996.606.723 - 996.606.723 127.405.814 839.604.816 29.596.093
Total liabilities 1.331.605.808 - 1.331.605.808 201.006.908 1.089.920.969 40.677.931
Financial liabilities that are the subject of netting Potential netting not recognised
on the balance sheet
Financial liabilities
after taking
potential netting
into account

95
5 AUDITED CONSOLIDATED FINANCIAL STATEMENTS
6.2.3. Analysis of credit risk relating to financial assets
Pursuant to IFRS, the Group assess its exposure to financial asset credit risk as the book value.
In the “Quantitative tables of exposures and concentrations” section, exposure to credit risk is indicated at book value before collate-
ralisation. The application of a collateralisation ratio is a technique to reduce the risk of the underlying asset.
Credit risk is shown according to exposures:
• by geography;
• by counterparty category;
• by risk class (internal ratings).

96
5 AUDITED CONSOLIDATED FINANCIAL STATEMENTS
Exposure by geographical area:
Geographical area European Other North Asia and Supra- Other Total
as at 31/12/2016 Union and European America Australasia national
(in thousands of euros) Switzerland countries
Cash and sight accounts with
central banks 2.642.281 1.197 27.463 4.666 55 12.263 2.687.924
Loans and receivables at
amortised cost 23.327.400 20.873 314.994 96.872 4.340 156.499 23.920.977
Financial instruments held
for trading and hedging
derivative financial instruments 341.266 176 17.987 2.978 - 33 362.440
Available-for-sale securities 8.068.564 203.701 1.632.324 652.363 568.825 117.379 11.243.156
Held-to-maturity securities 3.566.243 172.328 631.356 68.657 134.200 - 4.572.783
Other 561.004 11.349 84.907 - 1.915 22.170 681.344
Total 38.506.757 409.624 2.709.031 825.535 709.335 308.343 43.468.625
Geographical area European Other North Asia and Supra- Other Total
as at 31/12/2015 Union and European America Australasia national
(in thousands of euros) Switzerland countries
Cash and sight accounts with
central banks 1.276.547 1.155 19.370 4.329 76 11.851 1.313.328
Loans and receivables at
amortised cost 24.294.865 47.803 131.155 301.265 1.945 45.413 24.822.446
Financial instruments held
for trading and hedging
derivative financial instruments 275.961 55 1.206 1.124 - 272 278.618
Available-for-sale securities 8.326.718 204.544 1.343.356 774.348 597.290 82.700 11.328.956
Held-to-maturity securities 3.880.302 165.871 371.199 103.283 162.846 - 4.683.501
Other 384.622 - - - - - 384.622
Total 38.439.016 419.428 1.866.286 1.184.349 762.158 140.236 42.811.472
In the following table, to meet the requirements of IFRS 7 “Financial instruments: Disclosures”, exposure to credit risk as at 31 December
2015 and 2016 is presented according to internal ratings.

97
5 AUDITED CONSOLIDATED FINANCIAL STATEMENTS
Exposure by counterparty category and risk class:
Outstanding Outstanding Average Outstanding Outstanding Average
excluding with collateralisation excluding with collateralisation
impairment impairment ratio impairment impairment ratio
Cash and sight accounts
with central banks
High grade 1.138.428.726 1.138.428.726 - 2.538.955.467 2.538.955.467 -
Standard grade 174.471.838 174.471.838 - 146.355.860 146.355.860 -
Sub-standard grade 20 20 100,00% - - -
Past due but not impaired - - - - - -
Impaired 4.025 2.013 - - - -
Not rated 425.632 425.632 - 2.613.060 2.613.060 -
Total of categories 1.313.330.241 1.313.328.229 2.687.924.387 2.687.924.387
Loans and receivables
at amortised cost
Banks
High grade 2.892.231.663 2.892.231.663 17,76% 1.342.519.969 1.342.519.969 11,95%
Standard grade 2.562.254.230 2.562.254.230 57,29% 2.750.969.196 2.750.969.196 37,21%
Sub-standard grade 74.626.707 74.626.707 3,88% 7.908.788 7.908.788 0,00%
Past due but not impaired - - - 2.895.600 2.895.600 100,00%
Impaired - - - - - -
Not rated 68.495.597 68.495.597 0,13% 938.046 938.046 -
Corporates
High grade 1.858.617.539 1.858.617.539 31,31% 2.170.513.630 2.170.513.630 34,41%
Standard grade 1.733.294.356 1.733.294.356 53,10% 1.437.939.621 1.437.939.621 45,70%
Sub-standard grade 680.345.560 680.345.560 45,90% 923.298.741 923.298.741 47,82%
Past due but not impaired 203.444.520 203.444.520 20,98% 49.201.367 49.201.367 90,95%
Impaired 117.836.254 53.411.334 70,29% 247.104.127 178.773.077 34,49%
Not rated 225.822.255 225.822.255 62,19% 102.811.536 102.811.536 20,60%
Sovereigns
High grade 2.313.066.006 2.313.066.006 - 2.060.711.501 2.060.711.501 -
Standard grade 7.739 7.739 - 8.245 8.245 -
Sub-standard grade - - - 3 3 -
Past due but not impaired 53.195.129 53.195.129 - 22.985.325 22.985.325 -
Impaired - - - - - -
Not rated 8.324 8.324 - 2.258 2.258 -
Retail
High grade 8.684.362.085 8.684.362.085 91,94% 9.296.027.275 9.296.027.275 92,13%
Standard grade 1.765.814.203 1.765.814.203 92,57% 1.940.260.139 1.940.260.139 92,52%
Sub-standard grade 1.418.777.710 1.418.777.710 89,50% 1.393.401.453 1.393.401.453 88,62%
Past due but not impaired 123.129.635 123.129.635 93,70% 149.777.876 149.777.876 92,32%
Impaired 107.837.000 91.095.716 85,76% 108.047.817 90.034.286 81,13%
Not rated 20.446.011 20.446.011 9,75% -505 -505 -
Total of categories 24.903.612.524 24.822.446.320 24.007.322.009 23.920.977.428
2015 2016

98
5 AUDITED CONSOLIDATED FINANCIAL STATEMENTS
Outstanding Outstanding Average Outstanding Outstanding Average
excluding with collateralisation excluding with collateralisation
impairment impairment ratio impairment impairment ratio
Financial instruments
held for trading and
hedging derivatives
Banks
High grade 82.317.344 82.317.344 11,16% 170.500.449 170.500.449 77,80%
Standard grade 143.416.408 143.416.408 24,61% 137.518.285 137.518.285 49,70%
Sub-standard grade 1.084.189 1.084.189 100,00% 223.112 223.112 98,61%
Past due but not impaired - - - - - -
Impaired - - - - - -
Not rated 151.331 151.331 - - - -
Corporates
High grade 7.197.944 7.197.944 - 10.689.768 10.689.768 -
Standard grade 26.303.019 26.303.019 - 19.500.890 19.500.890 -
Sub-standard grade 5.092.560 5.092.560 - 3.160.379 3.160.379 -
Past due but not impaired - - - - - -
Impaired - - - - - -
Not rated 9.142.080 9.142.080 - 20.172.004 20.172.004 -
Sovereigns
High grade - - - - - -
Standard grade - - - - - -
Sub-standard grade - - - - - -
Past due but not impaired - - - - - -
Impaired - - - - - -
Not rated - - - - - -
Retail
High grade 2.430.066 2.430.066 - 504.278 504.278 -
Standard grade 457.108 457.108 - 4.547 4.547 -
Sub-standard grade 12.815 12.815 - 24.564 24.564 -
Past due but not impaired - - - - - -
Impaired - - - - - -
Not rated 1.013.219 1.013.219 - 141.880 141.880 -
Total of categories 278.618.084 278.618.084 362.440.156 362.440.156
2015 2016

99
5 AUDITED CONSOLIDATED FINANCIAL STATEMENTS
Outstanding Outstanding Average Outstanding Outstanding Average
excluding with collateralisation excluding with collateralisation
impairment impairment ratio impairment impairment ratio
Available-for-sale
securities and invest-
ments in associates
accounted for using the
equity method
Banks
High grade 4.097.029.359 4.097.029.359 - 3.531.593.231 3.531.593.231 -
Standard grade 1.029.280.797 1.029.280.797 - 1.475.538.898 1.475.538.898 -
Sub-standard grade 8.251.866 8.251.866 - - - -
Past due but not impaired - - - - - -
Impaired 12.513.658 1.313.658 - - - -
Not rated - - - - - -
Corporates
High grade 1.193.879.313 1.193.879.313 - 1.336.685.336 1.336.685.336 -
Standard grade 2.005.919.403 2.005.919.403 - 2.339.475.765 2.339.475.765 -
Sub-standard grade 76.854.355 76.854.355 - 75.133.315 75.133.315 -
Past due but not impaired - - - - - -
Impaired 33.513.503 11.190.338 - 28.611.536 11.164.593 -
Not rated 93.350.345 93.350.345 - 108.620.898 108.620.898 -
Sovereigns
High grade 1.638.272.097 1.638.272.097 - 1.580.378.447 1.580.378.447 -
Standard grade 985.609.533 985.609.533 - 657.025.344 657.025.344 -
Sub-standard grade 29.112.152 29.112.152 - 28.151.438 28.151.438 -
Past due but not impaired - - - - - -
Impaired - - - - - -
Not rated - - - - - -
Securitisation
High grade 91.701.325 91.701.325 - 64.235.993 64.235.993 -
Standard grade 35.776.895 35.776.895 - 12.169.620 12.169.620 -
Sub-standard grade 2.927.449 2.927.449 - 2.566.357 2.566.357 -
Past due but not impaired - - - - - -
Impaired 60.444.447 28.487.583 - 46.683.607 20.416.742 -
Not rated - - - - - -
Other
High grade - - - - - -
Standard grade - - - - - -
Sub-standard grade - - - - - -
Past due but not impaired - - - - - -
Impaired - - - - - -
Not rated - - - - - -
Total of categories 11.394.436.498 11.328.956.469 11.286.869.786 11.243.155.978
2015 2016

100
5 AUDITED CONSOLIDATED FINANCIAL STATEMENTS
Outstanding Outstanding Average Outstanding Outstanding Average
excluding with collateralisation excluding with collateralisation
impairment impairment ratio impairment impairment ratio
Held-to-maturity
securities
Banks
High grade 2.029.170.330 2.029.170.330 - 1.889.005.877 1.889.005.877 -
Standard grade 753.056.683 753.056.683 - 932.652.716 932.652.716 -
Sub-standard grade 26.360.198 26.360.198 - 10.253.749 10.253.749 -
Past due but not impaired - - - - - -
Impaired - - - - - -
Not rated - - - - - -
Corporates
High grade 462.829.478 462.829.478 - 320.379.720 320.379.720 -
Standard grade 446.336.462 446.336.462 - 642.556.060 642.556.060 -
Sub-standard grade - - - - - -
Past due but not impaired - - - - - -
Impaired - - - - - -
Not rated - - - - - -
Sovereigns
High grade 891.711.988 891.711.988 - 706.202.684 706.202.684 -
Standard grade 74.036.287 74.036.287 - 71.732.664 71.732.664 -
Sub-standard grade - - - - - -
Past due but not impaired - - - - - -
Impaired - - - - - -
Not rated - - - - - -
Total of categories 4.683.501.426 4.683.501.426 4.572.783.470 4.572.783.470
Other (*) 384.621.631 384.621.631 - 681.343.714 681.343.714 -
Total of categories 384.621.631 384.621.631 681.343.714 681.343.714
Total 42.958.120.404 42.811.472.161 43.598.683.523 43.468.625.135
(*) “Other” comprises “Assets designated at fair value through profit or loss”, “Change in fair value of a portfolio of financial instruments hedged against interest rate risk”,
“Tangible assets for own use”, “Investment property”, “Intangible assets” and “Other assets”.
2015 2016

101
5 AUDITED CONSOLIDATED FINANCIAL STATEMENTS
For simplicity's sake, “Shares in associates and subsidiaries” was
included in “Available-for-sale securities”.
The Group enters outstandings where the contractual payment
maturity is past due by at least one day on the line “Past due
but not impaired” under “Loans and receivables at amortised
cost”. In “Available-for-sale securities”, the Group does not
record any items in the line “Past due but not impaired”, and
uses the “Objective impairment evidence” to determine indivi-
dual impairments.
The average collateralisation ratio gives the average hedging
ratio of outstanding amounts by collateral held.
An indication of the level of impairment is provided in the
columns “Outstanding amount excluding impairment” and
“Outstanding amount including impairment”.
Banks, Corporates and Sovereigns:
The grouping according to internal risk category corresponds,
for example with the following “S&P” equivalents:
High grade: from AAA to A+
Standard grade: from A to BBB-
Sub-standard grade: from BB+ to BB-
Outstanding amounts described as “Impaired” relate to outs-
tanding amounts showing objective impairment evidence and
whose internal risk category (internal rating) is equal to or lower
than a B+ rating.
Securitisation:
The grouping according to internal risk category corresponds,
for example with the following “S&P” equivalents:
High grade: from AAA to A+
Standard grade: from A to BBB-
Outstanding amounts described as “Impaired” relate to outs-
tanding amounts showing objective impairment evidence and
whose internal risk category (internal rating) is equal to or lower
than a BB+ rating.
6.3 MARKET RISK
6.3.1 Objectives and management of risk
“Short-term” liquidity, up to six months, and interest rate risk,
up to two years, are managed by the Money Market desk (trea-
sury) of the FIM unit (“Financial Markets”).
Mismatch and long-term liquidity risks are handled by the
ALM (Asset Liability Management) Committee. The Committee
ensures that the Bank’s equity capital and invested funds are
appropriately managed, and that its national and international
loan portfolios and proprietary bond and equity portfolios are
refinanced in such a way as to minimise the negative impact of
yield curve movements on the parent company’s performance.
The ALM committee comprises the members of the Executive
Committee and a number of department and unit heads.
All components of market risk, such as interest rate risk, foreign
exchange risk and share price risk affecting the on- and off-
balance sheet positions managed by ALM or treasury, are cen-
tralised in real time in the trading room’s front-office system
and are managed within the limits set by the parent company’s
Executive Committee. The Risk Management unit, which ope-
rates independently of the trading room, is responsible for regu-
lar reporting on compliance with the limits and the levels of risk
incurred to the Executive Committee.
The parent company did not change its market risk management
policy in the 2016 financial year.

102
5 AUDITED CONSOLIDATED FINANCIAL STATEMENTS
Scope Average daily VaR Maximum daily VaR VaR limit for the
in 2016 in 2016 scope in question
in 2016
ALM 8,98 10,45 12,50
Treasury 0,27 0,67 2,50
Trading 0,04 0,23 no limit
Scope Average daily VaR Maximum daily VaR VaR limit for the
in 2015 in 2015 scope in question
in 2015
ALM 6,38 7,38 12,50
Treasury 0,21 0,04 2,50
Trading 0,05 0,02 no limit
In addition to VaR, used for the aggregate management of the different types of market risk, the Group's parent company uses
other risk management tools depending on the characteristics of the financial instruments concerned. Accordingly, interest rate risk is
managed by simulating the financial impact of a parallel one basis point (0,01%) shift in the yield curve on each positions' net present
value (NPV). Daily reports show the total financial impact arising from a parallel one basis point shift in all yield curves, also known as
basis point value (BPV), which must stay within pre-set limits.
Risk levels are primarily monitored using a VaR (Value at Risk) model. Trading and cash management activities are each subject to their
own VaR limits. The following table sets out VaR for the different scopes in millions of euros:

103
5 AUDITED CONSOLIDATED FINANCIAL STATEMENTS
6.3.2 Analysis of the value of financial instruments
The following table presents the comparison by category of the carrying amounts and fair values of the Group’s financial instruments
included in the consolidated financial statements.
Categories as at 31/12/2016 Carrying amount Fair value Unrealised valuation
Financial assets
Cash and sight accounts with central banks 2.687.924.387 2.687.924.387 -
Loans and receivables at amortised cost – Credit institutions 4.105.231.597 4.105.020.275 -211.322
Loans and receivables at amortised cost – Customers 19.815.745.830 22.238.030.315 2.422.284.485
of which measured at fair value for hedging purposes 1.620.406.763 1.620.406.763 -
Financial instruments held for trading 294.544.201 294.544.201 -
Hedging derivative financial instruments 67.895.956 67.895.956 -
Financial assets designated at fair value through profit or loss 262.150.671 262.150.671 -
Available-for-sale securities – Fixed-income securities 9.805.099.257 9.805.099.257 -
Available-for-sale securities – Variable-income securities 1.074.144.424 1.074.144.424 -
Held-to-maturity securities 4.572.783.470 4.736.608.990 163.825.520
Investments in associates accounted for using the
equity method 363.912.298 363.912.298 -
Change in fair value of a portfolio of financial instruments
hedged against interest rate risk 80.022.997 80.022.997 -
TOTAL 43.129.455.088 45.715.353.771 2.585.898.683
Financial liabilities
Deposits at amortised cost – Credit institutions 4.741.710.246 4.741.710.246 -
Deposits at amortised cost – Customers 28.115.936.115 28.470.177.029 354.240.914
Financial instruments held for trading 156.434.838 156.434.838 -
Hedging derivative financial instruments 894.844.009 894.844.009 -
Financial liabilities designated at fair value through profit or loss 148.612.880 148.612.880 -
Debt securities in issue 4.769.621.682 4.769.753.068 131.386
of which measured at fair value for hedging purposes 329.208.071 329.208.071 -
TOTAL 38.827.159.770 39.181.532.070 354.372.300

104
5 AUDITED CONSOLIDATED FINANCIAL STATEMENTS
Categories as at 31/12/2015 Carrying amount Fair value Unrealised valuation
Financial assets
Cash and sight accounts with central banks 1.313.328.229 1.313.328.229 -
Loans and receivables at amortised cost – Credit institutions 5.597.608.197 5.597.016.193 -592.004
Loans and receivables at amortised cost – Customers 19.224.838.123 21.534.677.192 2.309.839.069
of which measured at fair value for hedging purposes 2.054.732.187 2.054.732.187 -
Financial instruments held for trading 201.115.555 201.115.555 -
Hedging derivative financial instruments 77.502.528 77.502.528 -
Available-for-sale securities – Fixed-income securities 9.998.539.565 9.998.539.565 -
Available-for-sale securities – Variable-income securities 1.005.562.944 1.005.562.944 -
Held-to-maturity securities 4.683.501.426 4.858.421.747 174.920.321
Investments in associates accounted for using the equity method 324.853.964 324.853.964 -
Change in fair value of a portfolio of financial instruments
hedged against interest rate risk 52.453.419 52.453.419 -
TOTAL 42.479.303.950 44.963.471.336 2.484.167.386
Financial liabilities
Deposits at amortised cost – Credit institutions 4.439.629.040 4.439.629.040 -
Deposits at amortised cost – Customers 26.923.488.031 27.197.078.625 273.590.594
Financial instruments held for trading 170.332.351 170.332.351 -
Hedging derivative financial instruments 892.476.947 892.476.947 -
Debt securities in issue 5.791.365.039 5.791.390.508 25.469
of which measured at fair value for hedging purposes 1.522.505.195 1.522.505.195 -
TOTAL 38.217.291.408 38.490.907.471 273.616.063

105
5 AUDITED CONSOLIDATED FINANCIAL STATEMENTS
Financial instruments' fair value not recognised at fair value in
the consolidated financial statements is determined according
to the methods and estimates described below.
The fair value measurements presented in “Loans and recei-
vables at amortised cost - Customers”, “Held-to-maturity secu-
rities” and “Debt securities in issue” are categorised as Levels 1
and 2 in the fair value hierarchy.
Assets and liabilities at amortised coast in the statement of
financial position with a fair value close to the carrying amount
In respect of financial assets and liabilities with a maturity date
of 6 months or less, the Group estimates their fair value as very
close to their carrying amount. The credit risk is considered
to be immaterial due to the Group’s prudent policy and the
imminent maturity. The low residual duration also means that
the rate risk is immaterial.
Similarly, the fair value of assets collateralised is very close to
their book value, since the credit risk is hedged. These are
essentially repurchase agreements, secured loans and equip-
ment loans.
Financial assets and liabilities at amortised cost in the statement
of financial position with a fair value different from the carrying
amount
Financial assets and liabilities towards customers, as well as
fixed income securities held to maturity are recognised at amor-
tised cost in the statement of financial position.
For the purpose of fair value calculation, the Group distin-
guishes between instruments quoted on a market and over-the-
counter instruments.
The fixed-income securities included in the held-to-maturity
portfolio are bonds quoted on a market.
The Group calculates the fair value of financial assets and liabili-
ties towards customers using the discounted cash flow method
based on:
a. credit risk data such as the customer’s risk classification, pro-
bability of default and loss given default. These criteria were
established based on historical observations of defaults and
are used to determine credit risk premiums (credit spreads)
by risk class, duration and type of financial instrument;
b. a reference yield curve.

106

107
5 AUDITED CONSOLIDATED FINANCIAL STATEMENTS
Hierarchy of assets and liabilities at fair value
Assets and liabilities at fair value:
Categories as at 31 December 2016 Level 1 Level 2 Level 3 Total
Financial assets
Financial assets held for trading
- Debt instruments 749.011 - - 749.011
- Equity instruments - - - -
- Derivative financial instruments - 293.795.190 - 293.795.190
Available-for-sale financial assets
- Debt instruments 6.628.511.963 3.066.786.194 109.801.099 9.805.099.257
- Equity instruments 206.208.769 703.197.263 164.738.391 1.074.144.424
Financial assets designated at fair value through profit or loss - 262.150.671 - 262.150.671
Hedging derivative financial instruments - 67.895.956 - 67.895.956
TOTAL 6.835.469.744 4.393.825.273 274.539.491 11.503.834.508
Financial liabilities
Financial instruments held for trading 388.083 - - 388.083
Derivative financial instruments held for trading - 156.046.755 - 156.046.755
Financial liabilities designated at fair value through profit or loss - 148.612.880 - 148.612.880
Hedging derivative financial instruments - 894.844.009 - 894.844.009
TOTAL 388.083 1.199.503.644 - 1.199.891.727

108
5 AUDITED CONSOLIDATED FINANCIAL STATEMENTS
Categories as at 31 December 2015 Level 1 Level 2 Level 3 Total
Financial assets
Financial assets held for trading
- Debt instruments 417.765 - - 417.765
- Equity instruments - - - -
- Derivative financial instruments - 200.697.791 - 200.697.791
Available-for-sale financial assets
- Debt instruments 7.118.451.729 2.709.453.537 170.634.299 9.998.539.565
- Equity instruments 240.526.357 630.834.847 134.201.738 1.005.562.942
Hedging derivative financial instruments - 77.502.528 - 77.502.528
TOTAL 7.359.395.851 3.618.488.703 304.836.036 11.282.720.591
Financial liabilities
Financial instruments held for trading 785 - - 785
Derivative financial instruments held for trading - 170.331.566 - 170.331.566
Hedging derivative financial instruments - 892.476.947 - 892.476.947
TOTAL 785 1.062.808.513 - 1.062.809.298
Changes in outstanding financial assets in the table above from one year to the next are primarily the result of the decrease in the
share prices of equity instruments at end-2016, offset by an increase in investments in debt instruments, and of the increase in derivative
financial instruments.
A comparison of the breakdown of financial assets by level at end-2016 and end-2015 shows that 59,4% of financial assets are classified
as Level 1 (65,2% in 2015), 38,2% as Level 2 (32,1% in 2015) and 2,4% as Level 3 (2,7% in 2015). Debt instruments account for
most of the 5,8% migration from Level 1 to Level 2. New acquisitions in 2016 generally used less liquid instruments.
The Bank therefore used measurement models based on market data to calculate the fair value of Level 2 positions and measurement
models based on estimates and market data to calculate the value of Level 3 positions.
The decrease in the amount of debt instruments recognised as Level 3 can be attributed to repayments of asset-backed security (ABS)
and mortgage-backed security (MBS) debt. The Level 2 amount for this type of instrument increased as many of the new acquisitions
are not actively quoted, but their fair value is determined chiefly through the use of market data.
The Level 2 amount for equity instruments increased due primarily to higher share prices.

109
5 AUDITED CONSOLIDATED FINANCIAL STATEMENTS
Level 3 breakdown:
Total financial Total
assets financial
Debt Equity Debt Hedging liabilities
instruments instruments securities derivates
in issue financial
instruments
Total as at 1 January 2016 170.634.299 134.201.738 - 304.836.037 - - -
Total gains / losses 18.657.986 28.662.817 - 47.320.803 - - -
- Income statement 16.884.343 -208.328 - 16.676.016 - - -
- Revaluation reserve 1.773.642 28.871.145 - 30.644.787 - - -
Purchases 17.933.484 1.896.598 - 19.830.081 - - -
Reimbursements/sales -97.424.669 -22.762 - -97.447.431 - - -
Transfers from Level 1 to Level 3 - - - - - - -
Transfers from Level 2 to Level 3 - - - - - - -
Transfers from Level 3 - - - - - - -
Total as at 31 December 2016 109.801.100 164.738.391 - 274.539.491 - - -
Total gains/losses for the
period included in the income
statement for financial assets
and liabilities held as at
31 December 2016 16.884.343 -208.328 - 16.676.016 - - -
Available-for-sale financial assets
Financial liabilitiesHedging
derivatives
financial
instruments
Total financial Total
assets financial
Debt Equity Debt Hedging liabilities
instruments instruments securities derivates
in issue financial
instruments
Total as at 1 January 2015 206.544.432 140.014.417 346.558.849 - -
Total gains / losses 2.560.859 -39.668.057 -37.107.198 - -
- Income statement 2.984.803 -29.855.970 -26.871.167 - -
- Revaluation reserve -423.945 -9.812.087 -10.236.032 - -
Purchases 18.992.715 33.247.969 52.240.684 - -
Reimbursements/sales -22.007.849 607.409 -21.400.440 - -
Transfers from Level 1 to Level 3 -35.455.857 - -35.455.857 - -
Transfers from Level 2 to Level 3 - - -
Transfers from Level 3 - - -
Total as at 31 December 2015 170.634.299 134.201.738 304.836.037 - -
Total gains/losses for the
period included in the income
statement for financial assets
and liabilities held as at
31 December 2015 2.984.803 -29.855.970 -26.871.167 - -
Available-for-sale financial assets
Financial liabilitiesHedging
derivatives
financial
instruments

110
5 AUDITED CONSOLIDATED FINANCIAL STATEMENTS
Financial assets total Level 3 volume corresponds to 2,4% of total financial assets measured at fair value for financial year 2016,
compared with 2,7% in 2015. The Group did not include Level 3 financial liabilities measured at fair value in financial years 2016
and 2015.
Methods used for the Level 3 valuation:
Category Method
- Debt instruments Securitisations fair value measurement is based on an estimate of future
flows and on a dedicated basis spread (J.P. Morgan Int ABS & CB Research or
SIFMA Markit).
Some positions include an impairment that does not result solely from a deter-
mination based on the cash flow method but also takes an appraiser assessment
into account.
- Equity instruments Application of the fair value estimate method based on net assets. Net assets
are based on recent financial statements and a discount, determined from an
appraiser assessment, is applied.
If the fair value is less than the acquisition price, the Bank applies an impairment
to the position in question.
Sensitivity analysis for Level 3:
The sensitivity analysis was only performed for debt instruments. As such, the parent company did not change the assumptions used
in the cash flow model, but simulated a one-basis-point increase in credit risk:
Category Fair value as at 31/12/2016 Sensitivity to a one-
basis-point increase in
credit risk
Debt instruments 109.801.099 -28.306
Category Fair value as at 31/12/2015 Sensitivity to a one-
basis-point increase in
credit risk
Debt instruments 170.634.299 36.404

111
5 AUDITED CONSOLIDATED FINANCIAL STATEMENTS
6.3.3 Analysis of foreign exchange risk: Net currency positions
As at 31/12/2016 Net balance sheet position
CHF 2.819.110
USD 28.728.718
Other 1.631.754
Total 33.179.582
As at 31/12/2015 Net balance sheet position
CHF 2.631.960
GBP 2.447.039
USD 20.110.290
Other -3.010.447
Total 22.178.843
Only currencies with a net currency position exceeding EUR 2 million are recorded on a separate line.

112

113
5 AUDITED CONSOLIDATED FINANCIAL STATEMENTS
6.4 LIQUIDITY RISK
6.4.1 Schedule of liabilities
Tables showing balance sheet liabilities over the remaining residual life until repayment according to contractual data:
Current accounts and savings accounts are considered as repayable on demand.
Headings On demand - 3 months - Sub-total 1 - 5 years > 5 years Sub-total Total 2016
3 months 1 year < 1 year > 1 year
Issuance of debt
securities* 2.274.946.650 1.880.737.783 4.155.684.433 258.987.983 643.747.554 902.735.537 5.058.419.970
Deposits at amortised
cost -
Credit institutions 3.948.986.995 667.413.906 4.616.400.901 89.050.319 56.626.264 145.676.583 4.762.077.484
Customers 24.464.820.316 2.110.702.024 26.575.522.340 1.586.006.618 11.154.925 1.597.161.542 28.172.683.882
Total 30.688.753.960 4.658.853.713 35.347.607.673 1.934.044.920 711.528.743 2.645.573.663 37.993.181.336
Headings On demand - 3 months - Sub-total 1 - 5 years > 5 years Sub-total Total 2015
3 months 1 year < 1 year > 1 year
Issuance of debt
securities 2.165.362.926 3.185.335.320 5.350.698.245 228.095.389 247.827.942 475.923.331 5.826.621.577
Deposits at amortised
cost -
Credit institutions 4.064.929.958 297.061.797 4.361.991.755 47.473.372 61.804.527 109.277.899 4.471.269.654
Customers 23.555.534.737 2.106.891.972 25.662.426.709 1.263.598.335 25.758.008 1.289.356.342 26.951.783.051
Total 29.785.827.621 5.589.289.089 35.375.116.710 1.539.167.095 335.390.478 1.874.557.573 37.249.674.282
* including financial liabilities designated at fair value through profit or loss

114
5 AUDITED CONSOLIDATED FINANCIAL STATEMENTS
Table showing deposits from customers and the public sector according to 'expected' maturity dates determined in accordance with
the ALM policy:
Headings On demand - 3 months - Sub-total 1 - 5 years > 5 years Sub-total Total 2016
3 months 1 year < 1 year > 1 year
Deposits at amortised
cost -
Customers 8.294.468.700 4.764.476.014 13.058.944.714 9.134.179.361 6.030.858.437 15.165.037.799 28.223.982.513
Headings On demand - 3 months - Sub-total 1 - 5 years > 5 years Sub-total Total 2015
3 months 1 year < 1 year > 1 year
Deposits at amortised
cost -
Customers 8.871.012.181 4.596.206.007 13.467.218.188 7.805.810.232 5.651.520.662 13.457.330.894 26.924.549.082

115
5 AUDITED CONSOLIDATED FINANCIAL STATEMENTS
6.4.2 Schedule of derivative financial instruments
Table showing derivative instruments settled in gross cash flows:
In view of the fact that residual life is calculated on the basis of contractual data, the optional feature of some contracts has not been
taken into account.
Amounts are shown in euros at the exchange rates on 31 December 2016 and 31 December 2015.
Headings On demand - 3 months - 1 - 5 years > 5 years Total 2016
3 months 1 year
Derivative instruments held for trading
Foreign exchange swaps and
forward exchange contracts
Inflows 10.362.470.537 2.986.663.342 131.381.192 5.363.083 13.485.878.154
Outflows -10.217.819.124 -2.948.401.898 -129.768.759 -4.610.296 -13.300.600.077
Derivative financial instruments used for hedging purposes
CCIS
Inflows 208.426.502 400.857.765 1.122.299.490 146.239.732 1.877.823.489
Outflows -219.810.002 -446.335.298 -1.304.206.989 -163.123.223 -2.133.475.511
Total inflows 10.570.897.039 3.387.521.107 1.253.680.682 151.602.815 15.363.701.643
Total outflows -10.437.629.126 -3.394.737.196 -1.433.975.748 -167.733.518 -15.434.075.588
Headings On demand - 3 months - 1 - 5 years > 5 years Total 2015
3 months 1 year
Derivative instruments held for trading
Foreign exchange swaps and
forward exchange contracts
Inflows 9.472.509.260 3.502.466.712 - - 12.974.975.972
Outflows -9.450.575.087 -3.459.075.491 - - -12.909.650.578
Derivative financial instruments used for hedging purposes
CCIS
Inflows 442.441.983 1.206.635.826 967.918.457 233.729.700 2.850.725.966
Outflows -457.668.081 -1.294.524.581 -1.146.046.022 -275.940.583 -3.174.179.267
Total inflows 9.914.951.243 4.709.102.538 967.918.457 233.729.700 15.825.701.938
Total outflows -9.908.243.168 -4.753.600.072 -1.146.046.022 -275.940.583 -16.083.829.845

116
5 AUDITED CONSOLIDATED FINANCIAL STATEMENTS
Table showing derivative financial instruments settled in net cash flows:
Net cash flow liabilities from derivative financial instruments settled net are as follows:
Headings On demand - 3 months - 1 - 5 years > 5 years Total 2016
3 months 1 year
Derivative financial instruments held for trading
IRS 975.858 8.132.120 7.608.176 -36.002.409 -19.286.255
Derivative financial instruments used for hedging purposes
IRS 50.703.891 110.849.691 366.547.067 256.608.911 784.709.560
Total outflows 51.679.749 118.981.811 374.155.243 220.606.502 765.423.305
Headings On demand - 3 months - 1 - 5 years > 5 years Total 2015
3 months 1 year
Derivative financial instruments held for trading
IRS 1.851.365 11.397.749 13.655.936 2.263.275 29.168.325
Derivative financial instruments used for hedging purposes
IRS 63.396.554 136.784.954 435.337.040 278.261.647 913.780.195
Total outflows 65.247.919 148.182.703 448.992.976 280.524.922 942.948.520

117
5 AUDITED CONSOLIDATED FINANCIAL STATEMENTS
6.5 ECONOMIC CAPITAL
The Group has embarked on a process of measuring economic
risk and planning the assignment of its equity resources to the
various business lines.
This process and associated work are formally drawn up and
reported to the CSSF in the ICAAP report, in accordance
with Basel III Pillar 2. CSSF Circular 07/301 (as amended),
“Implementation of the Internal Capital Adequacy Assessment
Process (ICAAP)” provides for “a system of sound, effective and
complete strategies and processes allowing credit institutions to
assess and maintain, on an ongoing basis, the amounts, types
and distribution of internal capital that they consider adequate
to cover the nature and level of risks to which they are or might
be exposed”.
The ICAAP document describes the identification of and fra-
mework for managing the risks to which the Group's parent
company is exposed, either under Basel III Pillar 1 or other risks,
such as liquidity, profitability, etc.
The methods used for the economic quantification of the
risks are based on adjustments and supplements to regulatory
methods, as well as on measuring non-Pillar 1 risks.
The Group’s capital management policy meets the objectives
of the mission defined in the Bank’s Articles of Association,
namely “to contribute to the development of the Luxembourg
economy”. Accordingly, the Group aims to retain moderate
leverage, which is reflected in a high target capitalisation ratio.
Moreover, business within the domestic market is given priority
in the allocation of capital resources.
6.5.1 Capital management policy
6.5.1.1 Determining equity capital
The Group’s objective is to contribute to the development
of Luxembourg’s economy and to generate enough profit to
strengthen its financial position.
In the framework of its economic capital model, the Group
determines capital according to an economic capital approach,
as opposed to its regulatory capital requirement. The Bank’s
basic principle for economic capital is based on a very prudent
approach which consists of considering only the funds immediately
available to the Group without restriction as economic capital to
cover potential losses or to grow its business.
6.5.1.2 Implementation of internal capital adequacy policy
The Group and its parent company have adopted the following
methodology to implement their internal capital adequacy
policy:
- Development of an internal risk assessment model (Basel III
Pillar 1 risks plus non-Pillar 1 risks);
- Determination of a substantial safety margin between avai-
lable capital and risk hedging, reflected in a high target
capitalisation ratio. Note that throughout 2016, the Group's
parent company complied with the regulatory capital require-
ments of Basel III Pillar 1;
- Distribution of capital according to the internal organisation
of the Group’s business lines and its projected results;
- Risk exposure forecasts by business;
- Calculation of the projected capital requirements to cover the
Bank’s risks;
- When the minimum ratio requirements are fulfilled, allocation
of the surplus capital according to the Group’s strategic gui-
delines.
In terms of internal governance, the ICAAP report and the 2016
ILAAP report were submitted to the Group’s Board of Directors,
which approved the proposed guidelines. In accordance with
the ICAAP circular, authorised management will report to the
Board of Directors at least annually, and more frequently as
needed or in the case of a major change in methodology.

118
5 AUDITED CONSOLIDATED FINANCIAL STATEMENTS
Equity, Regulatory Own Funds and Solvency Ratio (in euros) 31/12/2015 31/12/2016
Total equity 4.151.869.150 4.231.615.481
Prudential provision adjustments 349.007.522 345.388.174
Profit or loss adjustments transition to IFRS -3.619.348 -13.967.445
Consolidation adjustments -470.809.250 -489.457.750
Total adjusted equity 4.026.448.074 4.073.578.460
IFRS income for the year not included in Common Equity Tier 1 (CET1) -226.173.815 -226.516.491
CET1 before regulatory adjustments 3.800.274.259 3.847.061.969
Regulatory adjustments to CET1 -1.271.930.671 -1.220.064.779
Fair value reserves related to gains or losses on cash flow hedges -134.378 104.709
Intangible assets -15.017.211 -16.519.158
Negative amounts resulting from the calculation of expected loss amounts -58.216.999 -93.203.294
Direct, indirect and synthetic holdings of CET1 instruments of financial sector
entities in which the institution has a significant investment -4.928.618 -12.785.008
Regulatory adjustments related to unrealised gains and losses pursuant to
Articles 467 and 468 and Article 8 of circular CSSF 14-01 on the implementation
of certain discretions of Regulation (EU) 575/2013 -998.980.798 -917.245.709
Amount to be deducted or added to CET1 pursuant to circular CSSF 14/599
on the treatment of the flat-rate provision and the AGDL provision -194.652.666 -180.416.319
Tier 1 Regulatory Own Funds (CET 1) 2.528.343.588 2.626.997.190
Tier 2 Regulatory Own Funds 100.071.923 89.600.821
Tier 2 Regulatory Own Funds 100.071.923 89.600.821
Total regulatory Own Funds 2.628.415.511 2.716.598.011
Total capital requirement 1.134.090.186 1.186.721.040
Solvency ratios
Tier 1 solvency ratio 17,84% 17,71%
Total solvency ratio 18,54% 18,31%
The regulatory own funds and the solvency ratios apply only to the Group’s parent company.
In 2016, regulatory own funds were determined in accordance with the Basel III regulation on the basis of IFRS balance sheet equity,
and including AGDL, flat-rate and immune provisions.

119
5 AUDITED CONSOLIDATED FINANCIAL STATEMENTS
7. SEGMENT REPORTING
In accordance with IFRS 8, segment reporting is presented in line
with the Group’s internal organisation and its internal reporting
system (management approach).
7.1 BUSINESS SEGMENTS
The Group’s operations are organised into significant segments,
as defined by the parent company’s Executive Committee,
with similar profitability and risk characteristics, representing
coherent product groups aimed at the same type of customers
and counterparties. The businesses defined in this way are
managed separately and are grouped into specific business lines
in the Group’s organisational chart. The segments are:
- Retail, Professional, Corporate and Public Sector Banking:
business line including deposits, loans, advisory and trans-
actions activities for this customer base, excluding activities
directly handled by the trading room. From an organisational
point of view, these activities fall within the remit of the Retail
and Private Banking and Corporate Banking departments.
- Financial Markets and Investment Funds: activities relating to
Treasury, Trading, Asset and Liability Management, Customer
Desk, mutual fund administration and management. From an
organisational point of view, these activities fall within the remit
of the Financial Markets and Investment Funds departments.
- Other: includes all back-office and support activities, revenues
from investments and costs not allocated to a specific busi-
ness on a reasonable basis.
The results of these businesses include inter-entity transactions,
which are valued by reference to a market price for transac-
tions relating to financing and lending between businesses.
Back-office services are also valued according to a market price,
where available.
The difference between the sum of the figures for the segments
and the Group’s overall consolidated financial statements stems
from the following items:
- Interest margin: the difference between the interest margin
allocated to businesses and the total margin results from
differences in valuation methods for internal transactions
between the Financial Markets department and the other
segments.
Similarly, the commercial interest margin includes income
valued using a method favouring commercial momentum.
In 2016, the margin difference was below the Group’s materiality
limit.
- Commissions: the reconciliation difference consists of the sum
of commissions not directly attributable to a business. It is the
Group’s view that the development cost for allocating these
flows to a business would exceed the benefit obtained from
this information.
- Assets and liabilities are valued according to IFRS rules which
are valid for global reporting.
Gross receivables and deposits of the Retail and Private Banking
and Corporate Banking businesses are recognised at their
annual average amount and not their year-end amount, in line
with the management approach.
The reconciliation difference for assets and liabilities stems from
taking into account average outstanding amounts compared
with end-of-period outstanding amounts, assets for customers
not attributable to a business and from assets not spread out
over businesses (suspense accounts, tax assets and liabilities and
internal accounts).
7.2 GEOGRAPHICAL SEGMENTS
All BCEE Group operations are carried out from within the
Grand Duchy of Luxembourg.

120
5 AUDITED CONSOLIDATED FINANCIAL STATEMENTS
7.3 INFORMATION ON PRODUCTS AND SERVICES
The Group’s Net Banking Income breaks down between the
following main products:
- deposits from private customers, business customers, corporates
and the public sector;
- loans and advances to private customers, business customers,
corporates and the public sector;
- other products for private customers, business customers,
corporates and the public sector;
- other products.
Net Banking Income is measured taking into account the inte-
rest, fees and commissions re-invoiced between businesses.

121
5 AUDITED CONSOLIDATED FINANCIAL STATEMENTS
7.4 INFORMATION ON MAJOR CUSTOMERS
Neither one individual customer nor any consolidated group of customers generates more than 10% of the Group’s NBI.
31/12/2016 Retail, Financial Markets Other Reconciliation Total
Thousands of euros Professional, and Investment
Corporate Funds
and Public
Sector Banking
Net interest margin 249.680 82.345 35.488 -1.842 365.671
Income from variable-income
securities - 11.004 33.571 - 44.575
Fee and commission income 40.247 33.235 54.938 - 128.419
External commissions 71.273 48.618 8.529 - 128.419
Internal commissions -31.026 -15.383 46.409 - - Income from financial instruments
and foreign exchange 3.855 40.532 401 - 44.788
Net Banking Income 293.782 167.116 124.397 -1.842 583.453
Other operating income and
expenses - 39 -3.285 - -3.246
Banking income 293.782 167.155 121.112 -1.842 580.207
General administrative expenses
plus valuation allowances in respect
of intangible and tangible assets -175.146 -32.000 -107.612 - -314.758
Net allowances for valuation and
impairment -8.170 9.007 10.946 - 11.784
Other - 338 - - 338
Income before tax 110.466 144.501 24.446 -1.842 277.571
Tax on income for the period and
deferred taxes - - -45.016 - -45.016
Minority interests / income from
associates - -2.025 29.262 - 27.238
Income/(loss) 110.466 142.476 8.693 -1.842 259.793
Assets 17.806.317 24.769.123 893.186 - 43.468.625
Liabilities 25.518.738 14.943.248 3.008.481 -1.842 43.468.625

122
5 AUDITED CONSOLIDATED FINANCIAL STATEMENTS
31/12/2015 Retail, Financial Markets Other Reconciliation Total
Thousands of euros Professional, and Investment
Corporate Funds
and Public
Sector Banking
Net interest margin 261.657 90.014 39.806 -8.458 383.019
Income from variable-income
securities - 12.005 26.298 - 38.303
Fee and commission income 41.967 26.524 61.987 - 130.478
External commissions 74.597 47.654 8.227 - 130.478
Internal commissions -32.630 -21.130 53.760 - -
Income from financial instruments
and foreign exchange 4.203 76.306 1.043 - 81.552
Net Banking Income 307.826 204.849 129.134 -8.458 633.352
Other operating income and
expenses - -71 5.945 - 5.874
Banking income 307.826 204.778 135.078 -8.458 639.226
General administrative expenses
plus valuation allowances in respect
of intangible and tangible assets -171.070 -29.370 -100.048 - -300.488
Net allowances for valuation and
impairment 15.795 4.634 -41.990 - -21.561
Other - - - - -
Income before tax 152.551 180.042 -6.959 -8.458 317.177
Tax on income for the period and
deferred taxes - - -64.019 - -64.019
Minority interests / income from
associates - -1.847 21.850 - 20.003
Income/(loss) 152.551 178.195 -49.128 -8.458 273.161
Assets 16.812.936 24.160.046 1.838.490 - 42.811.472
Liabilities 22.130.373 18.421.084 2.268.472 -8.457 42.811.472
Net banking income in thousands of euros 31/12/2015 31/12/2016
Deposits from private customers, business customers,
corporates and the public sector 78.458 41.200
Loans and receivables to private customers, business customers,
corporates and the public sector 180.939 210.590
Other products for private customers, business customers,
corporates and the public sector 48.429 41.992
Other products 333.983 289.671

123
6 ORGANISATION CHART OF THE BANK (as at 1 March 2017)
CorrespondentBanking and Control
Luc HIERONIMY
Operations and Support
Michel KIEFFER
Institutional Relationship Manag.
Alain UHRES
SecuritiesAlex REVELANT
OrganisationMarc ANDRE
Financial MarketsClaude ORIGER
MarketingLisa WELLS
Administration des Marchés Financiers
Jean LAUX
Juridique et Contentieux
Joseph DELHAYE
DéveloppementsInformatiques Jean HILGER
ProductionInformatique
Michel MERGEN
Compt. Centrale et Budgétisation
Doris ENGEL
Private BankingClaude HIRTZIG
Corporate Banking
Norbert BRAUSCH
PaiementsSerge WAGENER
Crédits aux Professionnels
Christian SCHOTT
Back-Office des Produits Financiers
Michel ZIMER
Electronic Banking and BusinessLysiane BACK
Coordination du Réseau des Agences
Gaston MOLLING
Banque PrivéeClaude HIRTZIG
Risk ManagementJean-Claude WILMES
ComplianceFrank MOSAR
Internal AuditJean-Nico SCHAMBOURGEXECUTIVE COMMITTEE
Françoise THOMA Chief Executive Officer President of the Executive CommitteeMichel BIREL Deputy Chief Executive OfficerAly KOHLL Executive Vice President and Member of the Executive CommitteeGuy ROSSELJONG Executive Vice President and Member of the Executive CommitteeRomain WEHLES Executive Vice President and Member of the Executive Committee
Corporate BankingNorbert BRAUSCH
Financial MarketsClaude ORIGER
LegalJoseph DELHAYE
Loans and CreditsChristian SCHOTT
Crédits aux ParticuliersJean THEIN
Financial ReportingDoris ENGEL
OperationsMarc ANDRE
Institutional ClientsPaolo VINCIARELLI
Information TechnologiesJean HILGER
Secretary GeneralRodolphe BELLI
DEPARTMENTS UNITS
ValeursGeorges
DENNEWALD
Immeubles etSupport LogistiqueJean-Louis SALES
Gestion du PersonnelMichèle FOHL
Secrétariat Général
Rodolphe BELLI

124

Photos : BCEE-Service Marketing
Claudine Bosseler (page 14)
Christophe Van Biessen (page 2)
Christophe Weber (table of contents)
Layout: BCEE-Service Marketing
Editor: Banque et Caisse d’Epargne de l’Etat, Luxembourg
Etablissement Public Autonome
Head office: 1, Place de Metz, L-2954 Luxembourg
Phone: (+352) 4015-1, Fax: (+352) 4015-2099
BIC: BCEELULL
R.C.S. Luxembourg B 30775
www.bcee.lu

Banque et Caisse d’Epargne de l’Etat, LuxembourgEtablissement Public Autonome
Siège Central : 1, Place de Metz L-2954 LuxembourgBIC : BCEELULL R.C.S. Luxembourg B 30775
www.bcee.lu tél. (+352) 4015 -1