annual report 2017 - bapcor report 2017 1 group ebitda* 52.4% to $117.4m ebitda margin* 12% group...
TRANSCRIPT

Annual Report 2017

BAPCOR
TABLE OF CONTENTS
GROUP REVENUE*
48%
RETAIL & SERVICE REVENUE^
28.3%
SPECIALIST WHOLESALE REVENUE^
105.7%
TOTAL GROUP LOCATIONS*
800+
Contents
Highlights 1
Chairman’s Report 2
Board of Directors 4
Chief Executive Officer’s Report 6
Executive Team 12
Our Reach 14
Our History 16
Segment Overview 18
Trade 20
Retail & Service 24
Specialist Wholesale 28
Non-Core 32
Community and Sustainability 36
Directors’ Report 43
Auditor’s Independence Declaration 74
Financial Statements 75
Consolidated Statement of Comprehensive Income 76
Consolidated Statement of Financial Position 78
Consolidated Statement of Changes in Equity 79
Consolidated Statement of Cash Flows 80
Notes to the Consolidated Financial Statements 81
Directors’ Declaration 130
Independent Auditor’s report to the members 131
Information for Shareholders 137
Corporate Directory IBC
Annual General MeetingDate: 2 November 2017Time: 1pm – 2pmAddress: Level 37, 101 Collins St, Melbourne, VIC, 3000, Australia
Bapcor LimitedACN 153 199 912
TRADE REVENUE^
11%

1 ANNUAL REPORT 2017
GROUP EBITDA*
52.4%TO $117.4M
EBITDA MARGIN*
12%
GROUP NPAT (PROFORMA) $71.5m
SHARE PRICE CAGR
44.5%SINCE LISTING
DIVIDENDS PER SHARE
18.2%
GROUP STATUTORY EPS*
36.4%
NEW STORES ACROSS AUSTRALIA
23
HIGHLIGHTS
BURSON TRADE STORES
160
Bapcor Limited is Australia’s leading provider of automotive aftermarket parts, accessories, automotive equipment and services, and motor vehicle servicing; operating out of over 800 locations across Australia and New Zealand.
Bapcor’s core business segment is the automotive aftermarket. Our automotive business segment covers Trade, Retail & Service, and Specialist Wholesale businesses. Non-core Group businesses currently include Footwear and Resource Services.
*Continuing Operations ^Excluding Hellaby

2 BAPCOR
CHAIRMAN’S REPORT
“In the year ahead, the focus of the Board will be to oversee the consolidation and optimisation of the expanded Bapcor Group, and to support the future strategy of Bapcor to ensure continued growth and sustained success on behalf of our shareholders.”

NPAT (PRO-FORMA)
$71.5m
3 ANNUAL REPORT 2017
The 2017 financial year ("FY2017") has been another record year of growth for Bapcor. Bapcor’s core automotive businesses delivered revenue growth of 48% and strong sales growth. Net profit after tax growth was 51% to $66m and 64% to $72m when including non-core operations. Further details on this very pleasing result are provided in the CEO and Directors’ reports.
Since its initial public offering in 2014, Bapcor’s journey has been a very exciting one over a relatively short period of time. Through a combination of sustained organic growth and strategic acquisitions Bapcor Limited, previously known as Burson Group Limited, has transformed from a business primarily focused on the trade segment of the automotive aftermarket into a Group which now covers the end-to-end automotive aftermarket supply chain; with businesses in specialist wholesale, trade, retail and service, operating across Australia and New Zealand.
Bapcor successfully completed a number of acquisitions in FY2017, including Hellaby Holdings Limited which was acquired in January 2017. Hellaby Holdings provides Bapcor with a complementary fit of automotive businesses within the specialty wholesale and trade segments in Australia and New Zealand. The natural alignment of the acquisition will provide many opportunities for future growth and improved efficiencies. I would like to thank both existing and new shareholders for their support in this acquisition, and welcome the Hellaby team to the Bapcor Group.
In addition to the acquisition of Hellaby, Bapcor’s Specialist Wholesale segment expanded with the acquisitions of Roadsafe, Baxters Auto Electrical and MTQ Engine Systems. These newly acquired businesses, combined with the strong performance of the existing specialist wholesale businesses, delivered revenue growth of 106% for the segment.
Bapcor’s Trade segment remains the engine room of the Group’s financial performance. In FY2017 Burson Trade delivered revenue growth of 11%. Combined with Hellaby's trade business, trade now accounts for more than half of the total revenue generated from Bapcor’s core automotive operations.
The Retail and Service segment delivered revenue growth during the year of 28% and 2% same store sales growth. Our franchise and company-owned store network expanded strongly in the financial year via a combination of Greenfield sites and acquisitions.
Bapcor has a very clear vision and growth strategy. Bapcor’s 5 year strategic targets sees Burson Trade grow to 200 stores (15 were added in FY2017), Retail’s Autobarn chain expand to 200 stores (8 were added in FY2017), and Specialist Wholesale deliver revenue of $500m. We believe these targets will continue to deliver strong growth for our shareholders. Further details of the 5 year strategic targets can be found on the Bapcor website (www.bapcor.com.au).
The Board has declared a final dividend in respect of FY2017 of 7.5 cents per share, fully franked, resulting in total dividends for FY2017 of 13.0 cents, fully franked, representing an increase of 18.2% on FY2016.
In the year ahead, the focus of the Board will be to oversee the consolidation and optimisation of the expanded Bapcor Group, and to support the future strategy of Bapcor to ensure continued growth and sustained success on behalf of our shareholders. The 2018 financial year ("FY2018") promises to be another exciting year for Bapcor as the Group continues its growth trajectory through continued improved performance of its existing operations, network expansion, and strategic acquisitions.
I would personally like to thank our CEO, Darryl Abotomey, his senior leadership team, and our dedicated and passionate Bapcor team members for delivering yet another outstanding result. Finally, I would like to express my thanks to our shareholders, franchisees, customers and suppliers who have contributed to Bapcor’s success and for their continued support.
Robert McEniry Chairman
On behalf of the Board and all Bapcor team members, I’m proud to present Bapcor Limited’s annual report for the year ending 30 June 2017.

4 BAPCOR
BOARD OF DIRECTORS
Robert McEniry Independent, Non Executive Chairman
Robert was appointed to the Bapcor Board in March 2014 as an Independent Non-Executive Chairman. Robert has extensive experience in the automotive industry both in Australia and overseas, holds a Master of Business Administration from the University of Melbourne and is a Member of the Australian Institute of Directors.
Therese RyanIndependent, Non Executive Director
Therese was appointed to the Board in March 2014 as an Independent, Non-Executive Director. Therese is a professional non-executive director and has extensive experience as a senior business executive and commercial lawyer working in widely diversified businesses in Australia and internationally, holds a Bachelor of Laws from the University of Melbourne and is a Graduate Member of the Australian Institute of Directors.
Darryl AbotomeyManaging Director and Chief Executive Officer
Darryl was appointed to the Board in October 2011 as Chief Executive Officer and Managing Director. Darryl has more than ten years’ experience in the automotive aftermarket industry with extensive experience in business acquisitions, strategy, finance, information technology and general management in distribution and other industrial businesses, holds a Bachelor of Commerce (Hons) majoring in accounting and economics from the University of Melbourne and is a Member of the Australian Institute of Directors.
Margaret HaseltineIndependent, Non Executive Director
Margaret brings more than 30 years’ business experience in a broad range of senior positions and 10 years experience in broad directorship. A proven executive leader, Margaret has significant experience in the areas of supply chain and logistics, customer interface in the FMCG sector, change management, governance, and management within a large corporate environment. Margaret holds a Bachelor of Arts Degree, Diploma in Secondary Teaching from the Auckland University and is a Fellow of the Australian Institute of Company Directors.
Andrew HarrisonIndependent, Non Executive Director
Andrew was appointed to the Board in March 2014 as an Independent Non-Executive Director. Andrew is an experienced company director and corporate advisor with public, private and private equity owned companies. Andrew, holds a Bachelor of Economics from the University of Sydney and a Master of Business Administration from The Wharton School at the University of Pennsylvania, is a Chartered Accountant is and a Member of the Australian Institute of Directors.

5 ANNUAL REPORT 2017
” We are proudly diverse at Bapcor but not resting on our laurels and always looking to be better at everything we do.”

6 BAPCOR
CHIEF EXECUTIVE OFFICER’S REPORT
"Bapcor’s achievements this year have been possible due to the focus and dedication of Bapcor’s team members and franchisees."

FY2017 has been another transformational year for Bapcor, continuing a sustained trend of strong performance since Bapcor’s initial public offering (IPO) in 2014. An exceptional set of financial results have been delivered this financial year, with excellent growth achieved across all measures and the acquisition of Hellaby Holdings exceeding expectations.
A number of key acquisitions took place during the year, the most sizeable being Hellaby Holdings Limited which Bapcor acquired in January 2017.
It has been pleasing to see in the six months post-acquisition how complementary Hellaby Automotive businesses have proven to be with Bapcor’s existing operations. The acquisition, integration and optimisation process has surpassed initial business case projections. In addition, Hellaby produced an excellent result in the six months to June 2017, demonstrating a very good return on investment with further upside potential.
Bapcor has completed a strategic review of the Hellaby Resource Services and Footwear businesses and have classified these businesses as non-core operations. The Resource Services and Footwear businesses are now progressing through a divestment program.
Whilst Bapcor’s performance has been accelerated by the inclusion of Hellaby, it has also been supported by the strong performance of its underlying businesses, as well as by other acquisitions made during the year including Roadsafe, Baxters Auto Electrical and MTQ Engine Systems. In addition, Bapcor added 8 Autobarn and 15 Burson stores to our national network.
All acquisitions are performing well and have made positive contributions to Bapcor’s growth throughout the year. A year which has seen Bapcor grow to employ over 6,000 team members and operate in more than 1,000 locations worldwide, including over 800 locations and 3,700 team members in the core automotive businesses.
The focus and dedication of Bapcor’s team members and franchisees has again enabled us to deliver strong growth. I’d like to express my thanks for their continued contribution to our great business.
Key highlights for the continuing automotive business in comparison to FY2016;
• Revenue – Growth of 48% to $1,014M; 77% growth when including non-core operations.
• Same Store Sales – Burson Trade Up 4.6%; Autobarn Up 2%; Brake & Transmission NZ (“BNT”) Up 8%.
• EBITDA pro-forma – Increased 52.4% to $117.4m.
• NPAT pro-forma – Increased 50.9% to $65.8m; 64.2% to $71.5m when including non-core operations.
• EPS pro-forma – Up 36%; 48% including non-core operations.
Revenue and Same Store Sales GrowthRevenue growth was 48% to $1,014m or 77% to $1,210m when including non-core operations in FY2017. Growth was largely driven by: the acquisition of Hellaby Holdings, which contributed six months of revenue; additional acquisitions including Roadsafe, Baxters Auto Electrical and MTQ Engine Systems; 23 stores added to the network, 8 Autobarn stores and 15 Burson stores; as well as solid organic sales growth from existing stores.
Burson Trade revenue growth was 11% in FY2017 compared with FY2016, and included 4.6% same store sales. Retail and Service revenue increased 28.3%, including one additional month due to the timing of the Metcash Auto acquisition in FY2016, and included 2% same store sales in Autobarn. Specialist Wholesale revenue growth was 105.7%, driven by new acquisitions and underlying growth. Hellaby Automotive contributed sales of $146.7m, and generated 8% same store sales growth in its New Zealand Trade business, and 7% same store sales growth in its Specialist Wholesale business.
Earnings before interest, tax, depreciation and amortization (EBITDA)Proforma EBITDA in FY2017 increased by 52.4% on FY2016 to $117.4m, or by 74.1% to $134.2m including non-core operations. Burson Trade EBITDA increased by 22.2% to $63.3m, driven by sales growth and margin improvement. As a percentage of sales, Burson Trade EBITDA increased by 1.2 percentage points. Retail and Service EBITDA increased by 30.3%, including one additional month due to the timing of the Metcash Auto acquisition in FY2016, including increased revenue and improved margin from its underlying businesses. Specialist Wholesale EBITDA increased by 141% in FY2017 driven by new acquisitions and complemented by growth in intercompany sales. Hellaby Automotive contributed $15.1m EBITDA, with improving profitability.
Net Profit After Tax (NPAT)NPAT grew by 51% to $65.8m in FY2017 on a pro-forma basis or increased by 64.2% to $71.5m including non-core operations. The NPAT growth reflects the profit related to business acquisitions and the solid growth of Bapcor’s existing businesses across each of the Trade, Retail & Service and Specialist Wholesale business segments.
Earnings Per Share (EPS) EPS growth was significant in FY2017, up 36% on a pro-forma basis or up 48% on a proforma basis including non-core operation; continuing a positive trend of growth, which delivered 31.0% growth in FY2016 and 19.1% growth in FY2015.
GROUP REVENUE* UP BY 48% TO
$1,014m
An exceptional set of financial results have been delivered in FY2017, with excellent growth achieved across all measures and the acquisition of Hellaby Holdings exceeding expectations.
7 ANNUAL REPORT 2017

8 BAPCOR
CHIEF EXECUTIVE OFFICER’S REPORT
SEGMENT HIGHLIGHTS OPERATIONAL RESULTS STRATEGY
TRAD
E
Trade delivered revenue growth of 26% in FY2017. Burson Trade, being Burson Auto Parts and Precision Automotive Equipment, generated 11% revenue growth. BNT Automotive, acquired through the Hellaby Holdings acquisition, contributed $62m in revenue for the 6 months to June 2017.
Burson Trade same store sales increased by 4.6% in FY2017, and experienced positive growth in every state and region. People development continues to be a key priority, Burson Trade ran 26 development courses throughout the year with over 600 participants. BNT demonstrated excellent same store sales growth of 8%, and expanded into commercial parts.
Bapcor’s Trade strategy is to be the “parts professionals” in supplying mechanical workshops. Burson Trade continued its progress toward its 5 year strategic target of 200 stores Australia-wide, with the addition of 15 new stores. The segment made significant progress toward its target of 30% Own Brand products reaching 22%.
RE
TAIL
& S
ERVI
CE
The Retail & Service store network stands at 385 stores, comprised of 331 franchise stores and 54 company owned stores. Our network includes the premium retail channel Autobarn as well as Autopro, Sprint, 4WD specialist Opposite Lock, and auto service centres under the Midas, ABS and The Shock Shop brands. Revenue growth was 28% and EBITDA increased 30% in FY2017, with one additional month included in comparison to FY2016 due to timing of the Metcash Automotive Holdings acquisition.
Autobarn same store sales growth was 2% in FY2017. With national campaigns (up 10%), click and collect (up 45%) and new loyalty programs contributing to the positive sales growth. Autobarn achieved its single largest sales day in history and its highest greenfield growth in 20 years. Service sales were at its highest rate in over 10 years, and had its highest average store sales ever. FY2017 also saw the benefits of the Metcash acquisition optimisation program delivered and the implementation of retail franchisee incentive programs.
The Retail strategy remains unchanged, Autobarn continues to be the premium retailer of automotive accessories, and has continued its progress toward 200 stores with the addition of 8 stores to bring its total store network to 122; comprising 91 franchise stores (75%) and 31 (25%) company owned stores. Retail made progress on its Own Brand products target of 35%, reaching 16% in FY2017. A strategic review of Service has been completed, our Service strategy is to be 'the experts at scheduled car servicing at affordable prices'.
SPEC
IALI
ST
WH
OLE
SAL
E Bapcor’s Specialist Wholesale businesses are industry leaders in their specialist key product categories covering braking, bearings, suspension, thermal cooling, electrical, diesel, 4WD and batteries. Specialist Wholesale experienced significant growth in FY2017, due to a combination of acquisitions and organic growth; revenue increased 106% and EBIT increased by 141%.
The Specialist Wholesale segment expanded significantly in FY2017 with the acquisition of Hellaby Holdings as well as specialist wholesale businesses of Roadsafe, Baxters Auto Electrical and MTQ Engine Systems. All Specialist Wholesale business units achieved revenue and profit growth in FY2017. Hellaby Holdings Specialist Wholesale businesses contributed $84.9m revenue in the six months post-acquisition and 7% same store sales growth.
Specialist Wholesale made great strides toward its 5 year strategic target in FY2017, with turnover in Australia reaching $350m compared to the strategic target of $450m. In New Zealand, turnover was $35m against the strategic target of $50m. Intercompany sales continued its year on year growth trajectory.
NO
N-C
OR
E
Through the Hellaby Holdings acquisition Bapcor acquired assets classified as non-core to its continuing operations; the Resource Services Group and Footwear business segments. These non-core assets have provided a good return on investment in the six months to June post-acquisition.
Footwear and the TBS component of Resource Services have demonstrated strong performance. For the six month period post-acquisition, Resource Services revenue was $132m and proforma EBITDA was $11m. Footwear recorded $65m revenue and $6m EBITDA.
Bapcor believes these businesses will better achieve their full potential with owners focused on the respective segments. Accordingly, a divestment program for the Resource Services Group and Footwear is underway and progressing through the appropriate stages.

9 ANNUAL REPORT 2017
"The Retail & Service store network stands at 385 stores, comprised of 331 franchise stores and 54 company owned stores."

10 BAPCOR
CHIEF EXECUTIVE OFFICER’S REPORT
Share PriceThe sustained growth of Bapcor across all key indicators has been reflected in the Group’s share price since listing on the Australian Securities Exchange (ASX) in April 2014 at a price of $1.82. At 30 June 2017 the share price has increased more than 200% since the IPO to $5.49.
Optimisation ProgramHellaby management have been highly cooperative in assisting the transition of Hellaby businesses into the Bapcor group. This has included gaining a greater understanding of the businesses and looking at opportunities to optimise the expanded Bapcor Group. In April 2017, all automotive business unit managers met to discuss optimisation opportunities for the Group. Approximately 75 opportunities were identified, with the majority emanating from the Hellaby acquisition. The opportunities identified were consolidated down to nine categories, including; intercompany sales, direct and indirect procurement, increased sales, strategic growth, shared services and people development.
The benefit expected to be realised from the Optimisation Program was announced to investors in July 2017. Total benefits in the range of $8m and $11m EBIT are expected to be delivered by FY2020, not including reductions in head office costs. The optimisation benefits are in addition to the returns previously indicated, which would result in an indicative EPS growth percentage in the low 20’s by FY2020. The return on investment including optimisation benefits will exceed the original business case for the Hellaby Holdings acquisition.
Warehouse Evolution ProjectBapcor aims to be the most efficient in the automotive aftermarket supply chain and we plan to evolve our warehousing and logistics function into world class state of the art facilities. External consultants have completed a 12-month review of our distribution centres and developed a 5 to 7 year implementation program which will prioritise a new warehouse management system, port splitting on imports, transport contracts, and new
warehousing facilities utilising the latest technology. The project is expected to cost c. $30m to $40m in capital expenditure and project expenses and generate annual returns of $10m to $15m EBIT by year 5.
Online Retailing and Electric CarsOver the course of FY2017, two of the most frequently asked questions from investors have been in regard to the topics of on-line retailing and electric cars.
Bapcor has a growing online presence however with more than 75% of our business in Trade and Wholesale, we see minimal online impact in these areas due to the high level of product expertise as well as the requirement to deliver parts quickly to workshops that necessitates an extensive store network. Automotive parts are not currently amongst the most popular online sales categories for Amazon or eBay. When international players such as Amazon do enter the market, we anticipate their primary focus will be on consumer goods such as electronics, health & beauty, kitchen & home, etc. in the initial stages. If and when new market entrants do introduce auto parts online, it’s likely these will be consumer products which do not require professional fitment or advice. It’s in these areas of fitment and advice that Bapcor’s retail stores focus on. However, there may be an opportunity for Bapcor businesses to further increase its participation in the online channel for certain product categories.
Hybrid and electric cars in Australia currently make up just 2.2% of the Australasian car parc. In the last quarter of FY2017, sales of hybrid and electric cars accounted for only 1% of car sales. This underlines what will be a very slow rate of change for the car parc in Australia and New Zealand. Based on Bapcor’s projections, it will be many years before electric cars reach a significant portion of the car parc. This being said, Bapcor will continue to evolve and adapt to the car parc as it has done so historically. Bapcor is well placed to supply electronic components and batteries, especially through our electrical and electronics wholesale businesses. Bapcor is well prepared to deal with car parc changes in the future, and we will continue to optimise the business as is appropriate.
Revenue* ($m)
0
200
400
600
800
1000
FY2017FY2016FY2015FY2014FY2013
306.3 341.6 375.3
685.6
1,013.6
0
20
40
60
80
100
120
FY2017FY2016FY2015FY2014
36.0
19.3
41.5
23.1
77.0
43.6
117.4
65.8
NPAT
EBITDA
EBITDA* & NPAT* ($m)
* Based on continuing operations only and proforma results where appropriate

11 ANNUAL REPORT 2017
0
3
6
9
12
15
FY2017FY2016FY2015
8.7
11.0
13.0
4.05.0 5.5
Final
Interim
4.7
6.07.5
0
5
10
15
20
25
FY2017FY2016FY2015
13.6
17.9
24.4
Dividends per share*EPS (cps)*
Bapcor’s strategy will focus on consolidating and optimising the business covering the end-to-end automotive aftermarket supply chain.
Outlook The outlook for FY2018 is very positive, with continued business and profit growth, and the inclusion of a full twelve months trading of Hellaby Automotive, Roadsafe, Baxters Auto Electrical and MTQ Engine Systems. NPAT from continuing operations is forecast for further growth of circa 30%.
Bapcor’s strategy will focus on consolidating and optimising the business covering the end-to-end automotive aftermarket supply chain. Benefit from the vertical integration and optimisation programs will begin to be realised in FY2018 with an estimated EBIT benefit of $2 — $3m. Trade and Retail business segments will continue to achieve organic growth and store network expansion.
Bapcor’s exceptional growth trajectory and robust performance since its IPO in 2014 would not be possible without the contribution of each and every Bapcor team member and franchisee. It’s thanks to the unrelenting passion and drive of Bapcor team members and franchisees that Bapcor continues to be Australasia’s leading provider of aftermarket parts, accessories, equipment and services.
Darryl AbotomeyManaging Director and Chief Executive Officer

12 BAPCOR
EXECUTIVE TEAM
Darryl AbotomeyManaging Director & Chief Executive Officer
Darryl is the Managing Director & CEO of Bapcor Limited, having been appointed in October 2011. He is also Chairman of Bapcor Finance Pty Ltd. Darryl has more than 10 years’ experience in the automotive industry and extensive knowledge in business acquisitions, mergers and strategy. Previous Director and Executive roles have been with Repco, Paperlinx, Amcor, Signcraft and CPI. He holds a Bachelor of Commerce majoring in accounting and economics from the University of Melbourne.
Mathew Cooper Executive General Manager – Development
Mat has over 15 years’ experience in the automotive, industrial and public accounting sectors. Mat commenced as Executive General Manager – Development within Bapcor in February 2016 and previously was the General Manager – Commercial of the ANA business. Prior, he held other roles with Amcor, General Motors and Deloitte Touche Tohmatsu. Mat is responsible for the development, co-ordination and consolidation of strategies and plans for the expansion of Bapcor.
Colin DalyChief Executive Officer – Hellaby Automotive Group
Colin has been the Chief Executive Officer of the Hellaby Automotive Group since April 2013. Colin has held senior leadership roles in the UK and NZ supermarket sector, led Repco’s businesses throughout Australasia and was CEO of Ideal and Rexel Electrical distribution businesses. Colin has a Post Grad Diploma in Operations Management and is a member of the New Zealand Institute of Directors.
Paul DumbrellChief Operating Officer – Specialist Wholesale
Paul has been in the automotive industry for over 15 years and commenced with Automotive Brands Group in 2007 within their marketing department. Prior to his current role, he was the Chief Executive Officer of Aftermarket Network Australia under both Metcash and Bapcor ownership. Paul is now responsible for the Specialist Wholesale segment including AAD, Opposite Lock, Bearing Wholesalers, Baxters, Roadsafe and MTQ.
Greg Fox Chief Financial Officer and Company Secretary
Greg has more than 25 years’ experience in the automotive, industrial and public accounting sectors. Greg joined Bapcor as Chief Financial Officer in 2012 with responsibility for finance, legal, business services, company secretarial and plays a key role in strategic initiatives. Greg was previously Chief Financial Officer at Atlas Steels and at Plexicor, which was a major supplier to the automotive industry. Greg also held various senior financial positions with Amcor after commencing his career as a Chartered Accountant.

13 ANNUAL REPORT 2017
Grant JarrettExecutive General Manager – Operations
Grant brings over 35 years’ experience in the automotive industry to Bapcor, holding various senior roles at components manufacturer RMP, new vehicle dealerships and within the Automotive Brands Group. Grant is responsible for the Group’s distribution centres and logistics as well as merchandise and product development, wholesale sales, replenishment and events within the Retail business unit.
Alison LaingExecutive General Manager – Human Resources
Alison joined Bapcor as the Executive General Manager – Human Resources in May 2017. With more than 20 years’ Human Resources experience Alison has spent much of her career partnering with senior leaders to develop team capability and drive business outcomes and has worked with organisations such as Orora, PaperlinX and Coles Myer. Alison holds a Bachelor of Commerce, majoring in management and industrial relations, from the University of Newcastle.
Craig MagillExecutive General Manager – Trade
Craig has an extensive career in the automotive after-market industry spanning more than 25 years. Starting as a management cadet and working through most of the key operational and sales positions in after-market parts distributors. Before joining Bapcor, he was the General Manager of RAC’S (WA) automotive workshops, which was preceded by many years at Repco. He holds a Masters in Business from Melbourne University. Craig joined Bapcor February 2012 and is responsible for all aspects of the Burson Trade segment.
Peter Tilley Executive General Manager – Retail
Peter is responsible for the Company and Franchise Retail Operations for the Autobarn, Autopro, Sprint, Midas and ABS networks. This includes development and implementation of retail programs across brand marketing, retail training, business field support, property management and new store development. Peter has spent over 30 years in Retail and has worked with a variety of national retail businesses most recently as GM Retail for the Amcal and Guardian Pharmacy networks.

OUR REACH THROUGH OVER 800 AUTOMOTIVE LOCATIONS
14 BAPCOR
NO. OF LOCATIONS WESTERN AUSTRALIA
60
NO. OF LOCATIONS NORTHERN TERRITORY
13
NO. OF LOCATIONS SOUTH AUSTRALIA
101
NO. OF LOCATIONS VICTORIA
191NO. OF LOCATIONS TASMANIA
14
10
41
913
82
6
3
6
4

15 ANNUAL REPORT 2017
AUTOMOTIVE Trade
Retail & Service
Specialist Wholesale
NO OF LOCATIONS QUEENSLAND
159
NO OF LOCATIONS NEW ZEALAND
106NO OF LOCATIONS NEW SOUTH WALES
159
NO OF LOCATIONS ACT
64
9
1
50 119 22
2 3 1
42 101 16
40
93
26
55
27
24

16 BAPCOR
OUR HISTORY
2014Burson Group Limited lists on the Australia Securities Exchange (ASX).
1971Burson founded by Garry Johnson and Ron Burgoine in Victoria, Australia.
1986Garry Johnson acquires 100% holding.
2004Burson opens its 50th store.
2005Burson moves into purpose built head office and distribution centre in Preston, Victoria.

17 ANNUAL REPORT 2017
2011Burson acquired by MBO and Quadrant Private Equity.
2016Burson Group Limited acquires Precision Automotive Equipment, Bearing Wholesalers and Sprint Auto Parts.
Burson Group Limited becomes Bapcor Limited.
Bapcor acquires Roadsafe Automotive Products, Baxters Auto Electrical and MTQ Engine Systems (Aust) Pty Ltd.
2017Bapcor acquires Hellaby Holdings.
2015Burson Group Limited acquires Metcash Automotive Holdings (renamed Aftermarket Network Australia or ANA).
18 BAPCOR
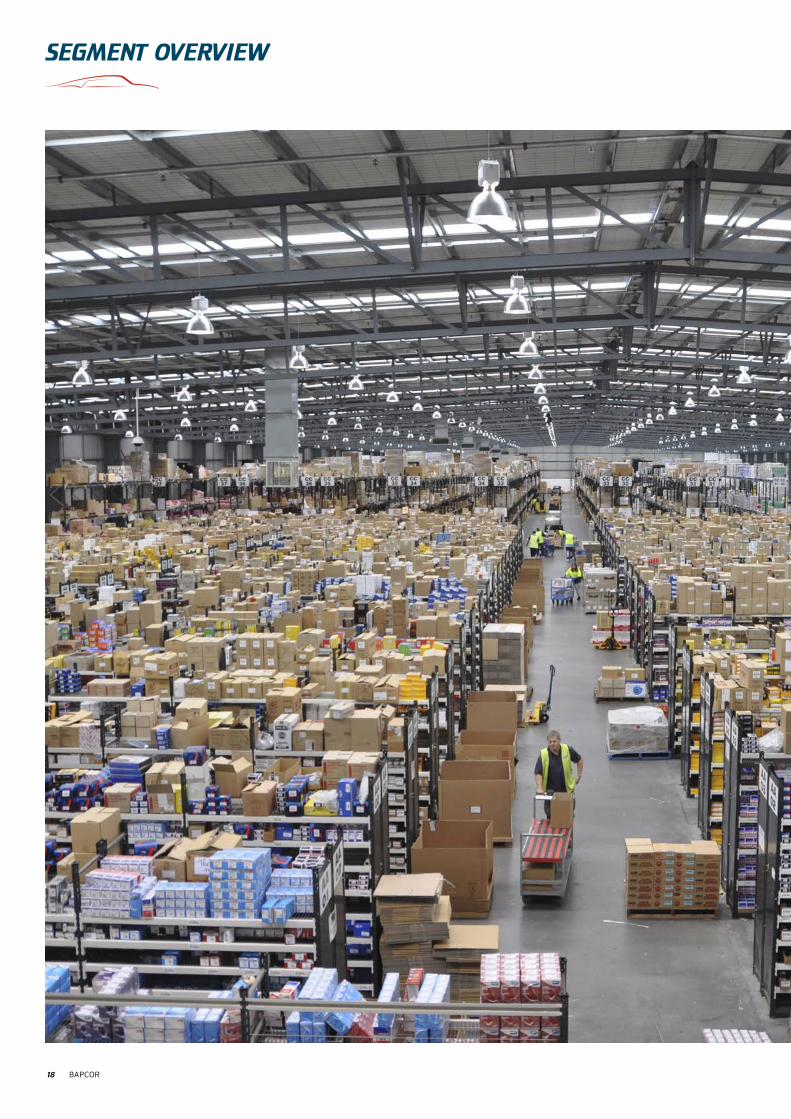
SEGMENT OVERVIEW

19 ANNUAL REPORT 2017
Bapcor is Australasia's leading trade focused automotive aftermarket parts distributor and operates in one of the most complex car parcs in the world with over 400 makes and models.
Bapcor's focus is the distribution of auto parts to independent and chain mechanic workshops throughout Australia and New Zealand. Bapcor distributes over 500,000 unique parts from over 1,000 suppliers through an extensive distribution network. Bapcor Trade similarly offer a complete range of workshop equipment to fit-out and maintain a workshop.
Bapcor’s ‘Retail & Service’ segment distributes parts and accessories from a wide variety of brands via a network of over 385 company-owned and franchise stores. Bapcor’s auto service centres are trusted household names in the Australian market and are experts at scheduled car services at affordable prices
As industry leaders, Bapcor's Specialist Wholesale segment supplies an extensive range of products through a vertically integrated supply chain within the Bapcor Group and to the broader Automotive Aftermarket. Key product categories include, braking, bearings, suspension, thermal cooling, electrical, electric controls, diesel, 4WD and batteries.
Principally sourced from overseas and imported for supply to the industry, Bapcor's extensive range of own branded products is augmented by locally sourced premium brands.
Hellaby AutomotiveHellaby Automotive was acquired as part of the Hellaby Holdings Ltd takeover in January 2017 and has locations in New Zealand and Australia operating across more than 120 locations.
Complementing Bapcor’s existing Trade distribution and auto-electrical Specialist Wholesale businesses, Hellaby introduces BNT and Truck & Trailer Parts to the Trade segment which supplies automotive and truck parts and accessories to workshops in New Zealand and is akin to the Burson Automotive Business in Australia. Hellaby Speciality Wholesale businesses that operate trans-tasman include the supply of auto-electrical components, batteries, diesel fuel components and agricultural tyres and wheels.
Integrating the Hellaby Automotive business units under the existing Bapcor segments of Trade and Specialty Wholesale aligns the Bapcor group and its vision as being Australasia's Leading Provider of Aftermarket Parts, Accessories and Services.
Bapcor is confident that the expanded Bapcor businesses will work together to capitalise on its optimisation program as announced in July 2017. Bapcor estimates that it will achieve optimisation benefits over the next three years predominately from the areas of direct and indirect procurement, intercompany sourcing, increased sales, freight, shared business services and expansion in product ranges.
Accompanying the acquisition of the Hellaby core automotive businesses were Resource Services and Footwear; while these business units provided a good return on assets for the 6 months to June 2017, Bapcor have deemed these businesses as non-core and are currently undergoing a divestment program.
Bapcor Limited is Australasia’s leading provider of automotive aftermarket parts, accessories, automotive equipment and services. Bapcor’s core business is the automotive aftermarket operating throughout the supply chain segments Trade, Retail & Service, and Specialist Wholesale across Australia; and extending to New Zealand with the recent acquisition of Hellaby Automotive.
TRADE
RETAIL & SERVICE
SPECIALIST WHOLESALE
NON-CORE

20 BAPCOR
SEGMENT REVIEW
Burson Auto Parts and BNT are renowned for their continually ascending trade market leadership within each of their territories. The trade segment has also embarked on a detailed store benchmarking program, as part of the company’s continuous process of best practice development across its store network.
Bapcor’s Trade segment has performed strongly throughout FY2017. During this period the company’s extensive automotive trade operations across Australia have returned solid same store sales and EBIT growth.
The New Zealand based Brake & Transmission NZ (“BNT”) and Truck & Trailer Parts’ ("TATP") businesses have been a part of the Bapcor trade segment for the second half of FY2017, with sales and profit performance having exceeded the company’s expectations.
Burson Auto PartsBurson Auto Parts has grown significantly during FY2017, with 15 new stores added to the fully company owned and operated national network, taking the Burson Auto Parts store total to 160 across each state and territory of Australia. Same store sales growth across the year reached 4.6%.
Burson Auto Parts attributes the impressive store sales growth results throughout the national network to a number of factors. The first being continued investment in learning and development for its store staff and management personnel. During FY2017, Bapcor organised and delivered more training days to focus on building the capabilities of its Burson Auto Parts staff teams than ever before in order to facilitate the company's continued growth along with its leadership status as the Australian automotive trade’s supplier of choice.
The company has also invested in programs that have been designed to provide business support to its Australian trade customers, assisting in areas such as sales training and marketing. This has further enhanced Burson Auto Parts’ trade customer loyalty.
It has also been a successful year of integration for Precision Auto Equipment to the Bapcor trade segment. A migration of the company’s equipment product offering has taken place and the sales performance during this period is tracking ahead of target.
BNT Automotive/Truck & Trailer Parts New ZealandBNT and TATP performed very strongly throughout FY2017. The BNT group comprises 53 BNT branded automotive parts stores across New Zealand and two TATP stores, providing a market leading footprint of 55 automotive aftermarket channels to market across the country.
Sales growth of 9% from major franchise chain stores contributed to BNT’s FY2017 total year on year sales growth result of 8% and wiith the support of TATP’s 220% sales revenue growth from direct account sales and marketing expertise, BNT’s commercial vehicle segment saw year on year sales grow by 42% during FY2017.
North Island based BNT store performance was very strong with a significant increase in sales that offset the impact of earthquake events in the South Island. Focus has been placed on BNT store network optimisation, with a number of store relocation and expansion activities completed with additional branch location improvements identified.
Since becoming a part of the Bapcor group in January 2017, significant focus has been placed on process integration and learnings between the Australian and New Zealand businesses. This has been instrumental in achieving consistent sales disciplines and margin performance across the group.
Bapcor’s Trade segment is made up of Burson Auto Parts and Precision Automotive Equipment in Australia along with the New Zealand based BNT and Truck & Trailer Parts companies.

21 ANNUAL REPORT 2017
TRAD
E“Bapcor’s Trade segment continues to perform very strongly with strong store and sales growth. The successful integration of strategically aligned businesses in both Australia and New Zealand has also contributed to the segment’s strong 2017 Financial Year results.”
Craig Magill – Executive General Manager, Bapcor Trade.
Image: David Anderson, Store Manager, Burson – Mitcham Store

22 BAPCOR
TRAD
ESEGMENT REVIEW
There are now 160 stores in the Burson Auto Parts national network with 15 new stores added in strategic automotive repairer locations during 2017. Same store sales growth across the year reached 4.6%.
Image: Above: Burson – Mitcham Store Team Members, Kristofer Lethborg, Kim Hamilton, Todd Lewis and David Anderson – Store Manager

23 ANNUAL REPORT 2017
There are 53 BNT Automotive stores across the North and South Islands of New Zealand. Store performance has been strong with year on year sales growth of 8%. The expansion and relocation of key stores during FY2017 is set to continue.
Precision Automotive Equipment is one of Australia’s leading suppliers of automotive workshop equipment to car dealerships, service and repair franchise groups and independent repairers. This recent acquisition to Bapcor’s trade segment is performing beyond its investment expectations.
Truck and Trailer Parts in New Zealand operates in the heavy haulage and general commercial vehicle aftermarket.
Development of Burson Auto Parts’ high quality own brand automotive aftermarket product range is continuing to generate increased sales and profit for the business. Expanded ranges across many product groups are being developed.

24 BAPCOR
SEGMENT REVIEW
The Retail and Service segment delivered revenues of $221.0m an increase of 28.3% on FY2016, with an EBITDA of $28.2m up 30.3% on the FY2016 results. EBITDA as a percentage of sales increased by 0.2 percentage points from 12.6% in FY2016 to 12.8% in FY2017. As at June 30 2017 the total number of company and franchised stores in the Retail and Service segment reached 385 consisting of 122 Autobarn, 86 Autopro and 38 Sprint Auto Parts stores with 139 Midas and ABS Service Centres.
Autobarn remains the premium retailer of automotive parts and accessories in Australia. During FY2017 Autobarn delivered a solid performance in a very competitive retail environment. FY2017 saw growth in a number of key categories where Autobarn can offer a full solution to the consumer with range, advice and fitment on a number of key categories. Autobarns full service offer, in-store product fitment, extensive range and high profile stores differentiates Autobarn in the automotive retail segment.
Autobarn continued to grow the store network in line with our growth targets. During FY2017 Autobarn store numbers increased by 8 to 122. Company stores now represent 25% of the network with the remaining 75% operating under our franchise program. Bapcor will continue to evolve both the Autobarn store design to provide an enhanced consumer shopping experience and its marketing and support programs.
FY2018 will see more store growth along with refurbishments of existing stores.
Our franchisees are incredibly important to the growth and development of the Autobarn brand in Australia; they offer an unparalleled level of knowledge and experience that sets them apart. Bapcor has given a firm commitment to continue to support our franchisees with the extensive services we provide.
The Bapcor business continues to offer extensive support to the other Bapcor franchise groups which include Autopro and Sprint Auto Parts. Autopro has been part of the automotive aftermarket landscape in Australia for over 35 years providing high levels of service in the markets that they operate. The Autopro group are majority franchise operated and benefit from the support Bapcor can provide with retail catalogues, brand support and product access via our extensive supply chain capabilities. Sprint Auto Parts has had its first full year under Bapcor ownership delivering a solid result to the group. Sprint Auto Parts are a primarily franchisee operated group with the majority of their stores located in South Australia.
Opposite Lock are a network of 4 wheel drive specialist stores. With the continuing growth of 4 wheel drive vehicles in Australia, the Opposite Lock offer remains highly relevant. Opposite Lock stores offer a comprehensive range of quality products, years of experience and can provide the right solutions for the 4 wheel drive enthusiast. With stores throughout Australia, the Opposite Lock team are all 4WD enthusiasts, ensuring that consumers are being guided and supported by the best experts in the nation.
The Service division delivered a solid performance in FY2017. Midas posted its most successful sales result in the last 10 years. The 89 store Midas network included the addition of 4 new franchisees to the system and a new location in Ballarat, Victoria. Well positioned with its combination of brake specialty and general servicing consumer offer the ABS group also delivered a solid FY2017 performance including great results for the franchisee of the new store located in Midland, Western Australia.
The Retail and Service division reported very strong earnings growth in FY2017 with good performance from all business units which include Autobarn, Autopro, Sprint Auto Parts, CarParts, The Shock Shop, Midas and ABS.

25 ANNUAL REPORT 2017
RE
TAIL
& S
ERVI
CE
Image: Alex Goljanin, Autobarn Team Member, Nunawading

26 BAPCOR
RE
TAIL
& S
ERVI
CESEGMENT REVIEW
ABS Automotive Service Centres are a network of automotive specialists operating across Australia.
ABS is a one stop shop for all servicing needs; spanning logbook services, brake, clutch, cooling system, suspension, steering and any other mechanical repairs or services.
Autobarn is the premium retail offering in our network.With over 120 stores throughout Australia, the team at Autobarn can help customers get exactly what it is they want for their car.
Providing customers with the latest in car audio, keeping their car looking show room new, making sure the engine gets the care it needs or finding just the right parts and tools to do it yourself, the Autobarn team can help.
Autobarn stores also fit what they sell on site including wiper blades, light globes, car audio, dash cams, batteries, roof racks, storage pods and seat covers.

27 ANNUAL REPORT 2017
Established in 1982, Autopro is Australia’s oldest independent automotive aftermarket parts and accessories retailer.
Autopro stores are locally owned and operated and therefore can respond to their community’s unique needs by adding specialised ranges to their core offer.
Autopro dealers are very knowledgeable about all things automotive and provide customers with the right information and advice to keep them out on the road.
Sprint Auto Parts is a South Australian icon in the automotive aftermarket servicing the local community for 33 years.
The 40 Sprint branded outlets take to market and promote a full range of quality automotive parts and accessories for both the retail and trade customer.Midas has been well known in the Australian automotive
service and maintenance landscape for more than 40 years. Midas stores across Australia today are full auto service experts, providing car servicing, brakes, suspension and all general repair requirements for the growing and ever more diverse automotive car parc.
It is the Midas goal to be the most technically proficient automotive service group in Australia.
Opposite Lock is a chain of over 70 4WD specialist accessory stores in Australia and selected export markets. OL offers a comprehensive range of accessories and equipment to suit all popular 4x4s and SUV’s.
Encompassed within the Hellaby acquisition and located across 26 stores, The Shock Shop is New Zealand’s largest chain of dedicated steering and suspension specialist workshops. With the largest range of Shock Absorbers each Shock Shop owner is a dedicated professional, committed to providing customers with specialist knowledge and expertise in a very specialist area of vehicle performance.

28 BAPCOR
SEGMENT REVIEW
Companies comprising the Specialist Wholesale segment are AAD, Bearing Wholesalers, Baxters, MTQ Engine Systems, Roadsafe, Autolign, Diesel Distributors, Premier Auto Trade (PAT), Federal Batteries, HCB Technologies, TRS Tyre & Wheel (TRS) and JAS. All but two of these companies were acquired by Bapcor during FY2017.
The combination of these companies has formed one of Australasia’s largest automotive wholesale distribution channels for electrical parts, under-car parts and aftermarket diesel fuel injection and turbo charger products.
Bapcor’s Specialist Wholesale segment initiated a highly productive strategy to cross-pollinate the specialisations of the 12 companies across Australia and New Zealand during FY2017.
Bapcor’s strategic intent with all of the Specialist Wholesale companies is to develop each of them to become either the number one or number two business within their specific automotive aftermarket specialisations. Bapcor’s focus is on developing the companies people, product range and service to ensure this outcome.
The segment has been focused on identifying opportunities between the businesses and providing Bapcor with significant competitive advantages in relation to the internal sourcing and development of own brand and exclusively branded automotive aftermarket products.
An extensive inter-company product range replacement program initiated during FY2017 continues to gain pace, taking maximum advantage of the vast range development opportunities that exist among all of the Bapcor Specialist Wholesale companies.
Consolidation of company sites across Australia during FY2017 has resulted in significant cost reductions and increases in operational efficiencies. Four of the Specialist Wholesale segment companies, Federal Batteries, Diesel Distributors, JAS and PAT were consolidated into single sites in both Townsville and Perth. Further consolidation of JAS and PAT operations into single sites ensued in Brisbane and Adelaide. An additional benefit of these locational consolidations is their closer proximity to their customers.
These efficiencies, along with increased sales of lighting and power products, delivered the JAS Group year on year sales growth of 24% during FY2017.
In New Zealand, TRS performed strongly in difficult market conditions primarily due to the downturn in dairy related activity. Trading conditions recovered significantly during the second half of FY2017 providing an encouraging outlook moving forward.
HCB continues to perform to high levels in New Zealand and achieved an almost double digit sales increase.
Bapcor’s Specialist Wholesale companies are extensively located throughout Australia and New Zealand giving it unparalleled channels to trans tasman aftermarket customers. The majority of these companies service multiple industries across both metropolitan and rural areas.
Bapcor’s successful integration of these strong performing companies has contributed significantly to Bapcor's successful FY2017 results.
Bapcor’s Specialist Wholesale segment consists of a number of companies that specialise in the automotive aftermarket wholesale sector, supplying national distributors, re-sellers and repairers directly.

29 ANNUAL REPORT 2017
SPEC
IALI
ST
WH
OLE
SAL
E
Image: Lidan Zhao (Chloe), Storeperson, Nunawading Distribution Centre

30 BAPCOR
SPEC
IALI
ST
WH
OLE
SAL
ESEGMENT REVIEW
The Specialist Wholesale segment expanded significantly in FY2017 with the acquisition of Hellaby Holdings as well as specialist wholesale businesses of Roadsafe, Baxters Auto Electrical and MTQ Engine Systems. The combination of these specialist wholesale companies has formed one of Australasia’s largest automotive wholesale distribution channels for electrical parts, under-car parts and aftermarket diesel fuel injection and turbo charger products.
AAD specialises in the import, manufacture, re-manufacture and wholesale of premium quality brake, clutch, steering, suspension, cooling, engine and servicing products. AAD enjoys market leadership with the industry’s most comprehensive parts range.
Autolign is New Zealand’s largest specialised steering and suspension product importer and distributor. The company supplies world renowned automotive suspension components to wholesalers, resellers and the trade. Autolign also represents leading suspension and ride performance product manufacturers including Monroe, Bilstein, Nolathane, Tein and others across New Zealand. The company has nine branches located throughout the country and support their suspension product sales with industry leading technical support.
Baxters is one of Australia’s largest automotive electrical parts distributors, specialising in heavy duty and industrial applications. Operating from 10 locations across the country, Baxters deliver the latest technological innovations to the aftermarket.
Australia’s top selling distributor of automotive bearings, Bearing Wholesalers provides repairers with a comprehensive range of bearings, oil seals, drive shafts, CV joints and engine belts among a total of 35 product classifications.
Federal Batteries is an Australian specialist supplier of premium and high end quality batteries for use across a wide range of passenger and commercial vehicle applications. With more than 60 years of combined experience in the battery industry, Federal Batteries also has strong distribution alliances with many of the world’s leading Battery manufacturers. These include Johnson Controls, East-Penn Manufacturing, Optima Batteries, Varta, Enersys Amara Raja, Remco, US Battery and Lifeline Batteries.
A leading New Zealand battery and associated accessories supplier for automotive, commercial, marine and deep cycle applications. HCB Technologies supplies premium quality products from nine strategically located outlets across the country.Diesel Distributors is a leading
supplier of spare parts and components for Diesel fuel injection systems. The Australian company is also a national distributor of global brands Delphi, Bosch, HKT, Hartridge, Denso and Stanadyne.
Premier Auto Trade is a leading importer and wholesaler of electronic fuel injection, engine management and service components, and is a major supplier to the Australian automotive aftermarket. Premier Auto Trade carries one of Australia’s most extensive ranges of these specialised components, from the World’s leading manufacturers, specialising in genuine and original equipment (OEM) products including Delphi, Bosch, Pierburg, Standard Motor Products, Denso, Bougicord, VDO, Walker Products, Walbro, Hitachi, Bremi, FAE, TE Automotive, Hella and Valeo.
Premier Auto Trade distributes throughout Australia via its reputable network of specialist resellers, national distributors and leading automotive retail groups. Premier Auto Trade also exports to several other countries in the region.
TRS Tyre & Wheel is New Zealand’s leading importer and distributor of agricultural and industrial tyre and wheel products. TRS provides the country’s most comprehensive range of agricultural and industrial tyre and wheel products. TRS is also the only company in New Zealand that custom manufactures wheels for many agricultural and industrial applications. The company’s superb engineering capabilities and dedication to customer service has earned its solid leadership status.
For 40 years Roadsafe has proudly serviced the Australian aftermarket.
As a wholesale distributor, marketing nationally, specialising in undercar and 4wd components, Roadsafe offer Australia’s most comprehensive array of steering and suspension components to the aftermarket, including a well-rounded program of 4wd components and associated accessories.. Dealing with Roadsafe represents genuine savings, while still having access to experienced staff and high quality products.

31 ANNUAL REPORT 2017
MTQ Engine Systems is the country’s largest Diesel fuel injection and turbo charger sales and service provider to the trade. MTQ operates from nine locations across Australia equipped with the latest specification diagnostic, repair and dynamometer equipment. MTQ is both an authorised distributor and service dealer for the world’s leading brands of turbo chargers and Diesel fuel injection parts. MTQ also services the mining, marine, rail, earth moving, transport, agriculture and power generation industries.
JAS is a leading trans tasman based supplier of quality automotive electrical parts and accessories for passenger cars, commercial vehicles, agricultural machinery and marine applications. With more than 2,000 replacement starter motor and alternator part numbers available to repairers across New Zealand and Australia, JAS supplies an unrivalled range of applications with genuine quality, dependable and price competitive products.

32 BAPCOR
SEGMENT REVIEW
The Resource Services division comprises two businesses, Contract Resources and TBS. The Resource Services business operates in Australia, New Zealand, the Middle East and the Americas. These businesses provide highly specialised, essential maintenance solutions to industrial clients, particularly in the oil and gas industries.
The Footwear division comprises two retail networks in New Zealand, Hannahs and Number One Shoes, across 117 stores.
Both the Contract Resources and Footwear assets have been deemed non-core and a process to divest these assets is underway.
Resource Services Group Resource Services Group is a long term partnership business providing highly specialised, essential maintenance solutions to industrial clients that make their plants and businesses efficient and safe.
In FY2016, the Resource Services Group consisted of one business, Contract Resources, which is 85% owned by Bacpor Ltd and 15% by three of the founding management members. Going into FY2017, Contract Resources was joined by the TBS Group which was acquired on 1 July 2016 and is 100% owned by Bapcor.
Recognised as an industry leader in New Zealand in its areas of service provision, TBS is a specialist industrial asset maintenance provider with an award-winning approach to safety. TBS has approximately 450 employees working across New Zealand and holds preferred contractor status with key clients as a result of their high quality workmanship, integrated operations management systems while achieving superior health and safety performance.
Resource Services reported revenue of $132m and proforma EBITDA of $11m in H2 FY2017 up 90.5% above H2 FY2016 largely due to the acquisition of the TBS Group.
“We knocked on the doorsof heavy industrial companies and asked them to show us the jobs no one else could do....The work no one else wanted to do. The projects others said were just too hard.”
Footwear GroupNew Zealand’s largest footwear retail group was acquired by Bapcor as part of the Hellaby acquisition in January 2017.
The retail footwear chain Hannahs and Number One Shoes employ over 1,000 staff and has 117 locations throughout New Zealand.
Management estimate that the Footwear Group holds a 25% share of the New Zealand footwear market through its two retail brands. Traditional bricks and mortar retail continue to provide growth opportunities for the brands despite a tough retail environment which has seen the decline of competitors across New Zealand. Online shopping continues to provide both opportunities and increasing competitive pressure which the Footwear Group continue to evolve with as they aim to strategically drive more sales through their online channels and their ‘click & collect’ capability through their network of own brand stores.
Under the effective management of experienced retail specialists H2 FY2017 saw Footwear’s EBITDA increase by 29% above H2 FY2016 to $6m.
Through the Hellaby Holdings acquisition Bapcor acquired assets classified as non-core to its continuing operations; the Resource Services Group and Footwear business segments. These non-core assets have provided a solid return on investment in the six months to June 2017.

33 ANNUAL REPORT 2017
NO
N-C
OR
E
CR’s currently part of a team at Longford, Victoria installing vessel internals on a newly constructed Gas Conditioning Plant.

34 BAPCOR
SEGMENT REVIEWR
ESO
UR
CE S
ERVI
CES
The TBS Group was founded over 45 years ago, and from its inception has had a reputation for delivering a quality product, on time and with the least fuss to our clients. This reputation has grown to the point where we are now the preferred or sole provider to a significant number of infrastructure asset owners.
Our company motto is “We Do It Right” and this embodies everything we stand for and strive for in the projects we undertake.
Contract Resources was founded in New Zealand back in 1989 by five people passionate about offering clients specialised industrial services that were uncompromising on quality and safety.
The company today has grown to at times 2000 employees across a network spanning five continents. With three of the founding partners still working in the business, this entrepreneurial approach to service delivery still lives on in the company today.

35 ANNUAL REPORT 2017
FOO
TWE
AR
“We are very proud of our heritage
at Hannahs. We have provided
New Zealand families with
quality footwear for almost 150 years”
Hannahs and Number One Shoes work together to maximise synergies between the groups to maximise resources and market share, whilst ensuring brand positioning of each entity within the New Zealand market is maintained.
With a proud history in New Zealand for 150 years in 2018, Hannahs stocks quality international brands such as Clarks, Hush Puppies, Steve Madden and Keds for men, women and children as well as well-known local brands such as Pulp, Noir and Creatures of Comfort which take on-trend, international influence catered to the New Zealand market. Number One Shoes continues to offer a wide range of value footwear including licenced kids products.

36 BAPCOR
COMMUNITY AND SUSTAINABILITY
Value Statement: Economic, Environmental and Social Sustainability
Bapcor recognises a sustainable and successful business is impacted by the engagement of employees, delivery of shareholder wealth and optimising business operations in an affordable, social and environmentally responsible manner.
Bapcor takes an integrated approach, aligning company values and strategic direction with positive outcomes for Bapcor’s stakeholders, and the wider community in which we operate. Bapcor views investment in these areas as an important driver of long-term performance and value creation.
Bapcor’s Head Office Makes The Switch
Bapcor’s Preston Head Office and Distribution Centre underwent a complete changeover of all light fittings to LED lighting. The initiative provides equivalent light levels while using less energy and heat, and extending lamp life. All light fittings meet Australian Standards and comply with the Victorian Energy Efficient Council..
Light fittings changed over
1,000An energy reduction of
80%Annual energy saving of (kW)
437,000
” The 17th annual FICU led by Four Wheel Drive Queensland with the Queensland Parks and Wildlife Service, was supported by Opposite Lock.”

37 ANNUAL REPORT 2017
Recycle at work
As well as energy reduction initiatives, Bapcor’s Preston Head Office has made big inroads in paper reduction and is on the road to transitioning toward a paper free future.
Over 450,000 sheets of paper have been removed from the office and won’t be replaced – with storage moving online. Further paper reduction initiatives see employee files now being stored electronically and the roll out of an online expense management system.
At store level, the Bapcor network continues its commitment to good recycling practices and energy reduction initiatives. In addition to the regular vehicle servicing and maintenance of tyre pressures to sustain efficiency and reduce fuel consumption, Burson Auto Parts stores like the Richmond team are always looking to reduce their footprint and create a greener workplace; cutting monthly paper consumption by a third, and reducing plastic bag and foam cup usage.
Fraser Island Clean Up 2017 The 2017 edition witnessed more than 700 volunteers from the 4x4 community across Australia give their time and energy to lend a hand.
With approximately 120 kilometres of beachfront to cover and tough, windy conditions, it was a tremendous effort by all, with a total of over 1100 bags of rubbish collected!
Volunteers in attendance
700Vehicles participating
300Total rubbish bags filled
1,100Four Wheel Drive Clubs
25
38 BAPCOR
COMMUNITY AND SUSTAINABILITY
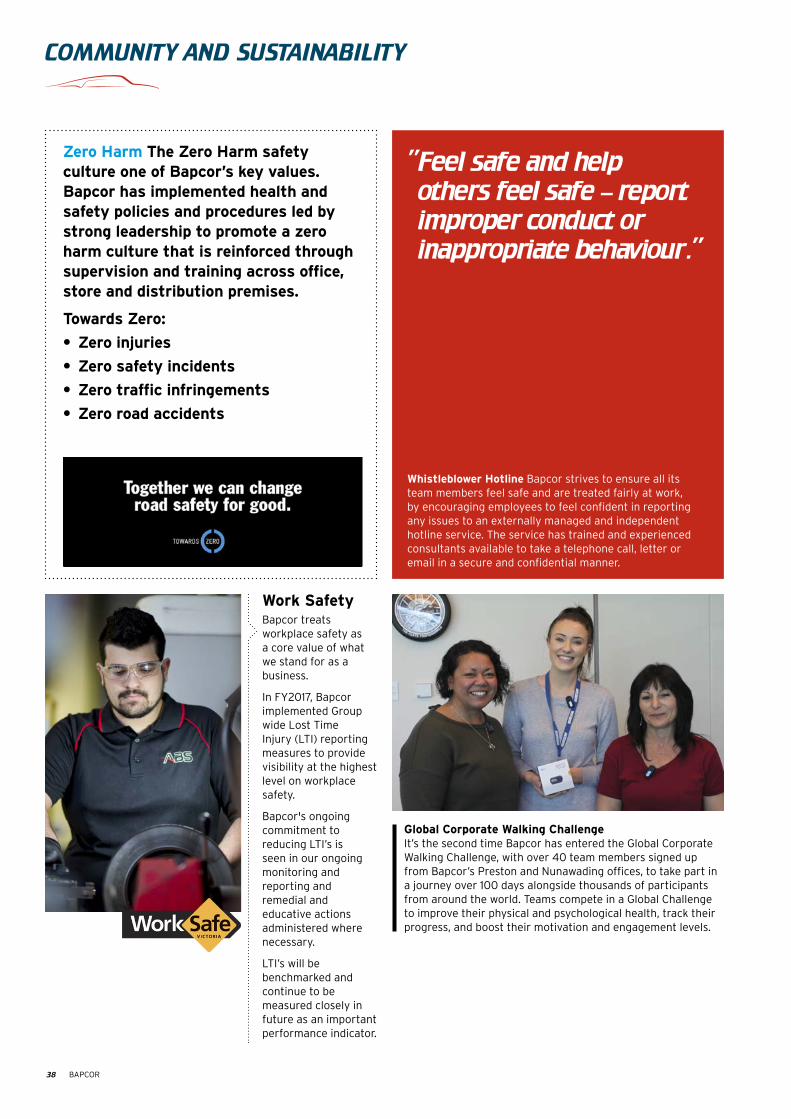
Global Corporate Walking ChallengeIt’s the second time Bapcor has entered the Global Corporate Walking Challenge, with over 40 team members signed up from Bapcor’s Preston and Nunawading offices, to take part in a journey over 100 days alongside thousands of participants from around the world. Teams compete in a Global Challenge to improve their physical and psychological health, track their progress, and boost their motivation and engagement levels.
Work SafetyBapcor treats workplace safety as a core value of what we stand for as a business.
In FY2017, Bapcor implemented Group wide Lost Time Injury (LTI) reporting measures to provide visibility at the highest level on workplace safety.
Bapcor's ongoing commitment to reducing LTI’s is seen in our ongoing monitoring and reporting and remedial and educative actions administered where necessary.
LTI’s will be benchmarked and continue to be measured closely in future as an important performance indicator.
Whistleblower Hotline Bapcor strives to ensure all its team members feel safe and are treated fairly at work, by encouraging employees to feel confident in reporting any issues to an externally managed and independent hotline service. The service has trained and experienced consultants available to take a telephone call, letter or email in a secure and confidential manner.
” Feel safe and help others feel safe – report improper conduct or inappropriate behaviour.”
Zero Harm The Zero Harm safety culture one of Bapcor’s key values. Bapcor has implemented health and safety policies and procedures led by strong leadership to promote a zero harm culture that is reinforced through supervision and training across office, store and distribution premises.
Towards Zero:
• Zero injuries
• Zero safety incidents
• Zero traffic infringements
• Zero road accidents

39 ANNUAL REPORT 2017
Women in the workplace – 26.3% Women in full-time work – 22.9% Women in Part-Time Work – 41.1%
Women in the workforce
Bapcor acknowledges the positive outcomes and benefits that can be achieved through a diverse workplace including the ability to attract, retain and motivate team members from the widest possible pool of available talent. With this in mind Bapcor has identified a range of activities that will support gender diversity across the Group. These initiatives include formalising current practices into policies regarding family and careers’ responsibilities as well as developing a policy for flexible working arrangements. The focus on developing people leaders and providing them with the tools to support diversity will continue through a broader implementation of the Leadership Development Program and education regarding unconscious bias.
Female Male
Women on the Bapcor Board (excluding CEO) – 2/4, 50%
Diversity at Bapcor Bapcor is committed to progressing diversity within the workplace and is an equal opportunity employer. Bapcor strongly advocates for the benefits that are realised from having different talents, experiences and perspectives that comes from hiring, developing and retaining a diverse workforce.

40 BAPCOR
COMMUNITY AND SUSTAINABILITY
To raise awareness of men’s health issues such as prostate cancer, testicular cancer and men’s suicide the Opposite Lock team participated in the annual 'Movember' fundraising campaign by growing a moustache during November. The team, in-conjunction with the Automotive Brands Group (ABG) Social Club, raised over $3,400.
Blue September aims to reduce the impact of prostate cancer on Australian men by raising awareness through the Prostate Cancer Foundation of Australia. The Autobarn, ABS and Midas brands have raised in excess of $250,000 through their involvement with the cause.
Biggest Morning Tea An impressive $1,270 was raised by AAD Derrimut for the Cancer Council Australia’s Biggest Morning Tea, helping raise vital funds for cancer research, prevention programs, advocacy and support services.
Burson Rookie Of The Year The Burson Auto Parts Rookie of the Year Award is open to drivers under the age of 18 competing in the CAMS Jayco Australian Formula 4 Championship. Winners receive a special medal and the overall winner at the conclusion of the championship receives a prize of $20,000 towards competing in their next CAMS Jayco Australian Formula 4 championship.

41 ANNUAL REPORT 2017
Youth Sport Involvement Initially funding a full set of replacement football jumpers, Bapcor has supported Rupertswood Football Clubs junior football program, located in Sunbury, Victoria for the last three years. Rupertswood is a community based club, which encourages participation at all levels of ability. The junior football program has 11 teams playing from under 10’s through to under 16.5’s.
Community InvolvementBapcor recognises its responsibility to serve the communities in which its businesses operate. The Bapcor Group supports a wide variety of social, charitable and sporting initiatives across Australia and New Zealand. Employees are encouraged to support their local community and foster a culture of workplace giving. Organisations which have benefited from Bapcor’s support in FY2017 include:
The Pyjama Foundation Fundraiser
NZ – St John Fundraiser
Fraser Island Clean Up
Purple Bra Day WA
Young Care
Motor Neuron Disease Australia
BeyondBlue
Kids with Cancer
Breast Cancer Foundation Australia
Prostate Cancer Foundation of Australia #getchecked
Run for Kids (Royal Childrens Hospital Good Friday Appeal)
Breast Cancer – Pink Pallet Campaign
ANA The Colour Run NIGHT!
Cancel Council
Pink Ribbon Day
Mo-Vember Foundation – Men’s Health
Blue September – Prostate Cancer Foundation of Australia and The Australian Cancer Research Foundation
Biggest Morning Tea/Cancer Council
Camp Quality – Laughter is the best Medicine
Pink Ribbon Day 2017 The Nunawading and Preston offices participated in a pink inspired bake-off and raised a grand total of over $1,400 to support breast cancer awareness and research.

42 BAPCOR
Bapcor Limited(formerly Burson Group Limited)ABN 80 153 199 912
Lodged with the ASX under Listing Rule 4.3AThese financial statements are the consolidated financial statements of the consolidated entity consisting of Bapcor Limited and its subsidiaries. The financial statements are presented in the Australian currency.
Bapcor Limited is a company limited by shares, incorporated and domiciled in Australia. Its registered office and principal place of business is:Bapcor Limited61–63 Gower StreetPreston VIC 3072
A description of the nature of the consolidated entity’s operations and its principal activities is included in the Directors’ Report commencing on page 43, which is not part of these financial statements.
The financial statements were authorised for issue by the Directors’ on 18 August 2016. The Directors have the power to amend and reissue the financial statements.

43 ANNUAL REPORT 2017
DIRECTORS’ REPORT
The directors present their report, together with the financial statements, on the consolidated entity (referred to hereafter as the ‘consolidated entity’) consisting of Bapcor Limited (referred to hereafter as the ‘company’ or ‘parent entity’) and the entities it controlled at the end of, or during, the year ended 30 June 2017 (‘FY17’).
1. DirectorsThe following persons were directors of Bapcor Limited during the whole of the financial year and up to the date of this report, unless otherwise stated:
Robert McEniry Independent Non-Executive ChairmanDarryl Abotomey Chief Executive Officer and Managing DirectorAndrew Harrison Independent, Non-Executive DirectorTherese Ryan Independent, Non-Executive DirectorMargaret Haseltine Independent, Non-Executive Director
2. Principal activitiesDuring the year the principal activities of Bapcor were the sale and distribution of motor vehicle aftermarket parts and accessories, automotive equipment and services, and motor vehicle servicing.
Bapcor is one of the largest automotive aftermarket parts, accessories, equipment and services supplier in Australasia with a continuing operations store network covering over 850 sites.
3. Significant changes in the state of affairsOn 27 September 2016, Bapcor announced a cash takeover offer for 100% of the shares in Hellaby Holdings Limited (‘Hellaby’), a publicly listed entity on the New Zealand stock exchange (NZX: HBY). Bapcor was successful in its offer, assuming control over Hellaby on 13 January 2017. The transaction was finalised in March 2017 and Hellaby was delisted from the New Zealand stock exchange accordingly.
Hellaby comprises of three divisions — Automotive, Resource Services and Footwear. The divisions of Resource Services and Footwear are considered non-core and are being actively marketed and are at various stages through a potential divestment program.
The Hellaby Automotive division comprises respected, well established, market leading wholesale and distribution businesses with over 120 locations in both New Zealand and Australia. The business units include Brake and Transmission (‘BNT’), HCB Technologies (‘HCB’), Diesel Distributors, JAS Oceania, Federal Batteries and Premier Auto Trade (‘PAT’) and are complementary to Bapcor’s existing Trade distribution and auto-electrical Specialist Wholesale businesses.
The Footwear retail division comprises two retail chains; Hannahs and No.1 Shoes; across 117 stores in New Zealand. The Resource Services division provides highly specialised, essential maintenance solutions to industrial clients. These two divisions are considered non-core and it is Bapcor’s intention to divest them.
The Hellaby acquisition was fully funded by a combination of cash and debt facilities, being a new acquisition facility with the Australia and New Zealand Banking Group ('ANZ'), and $181.3M capital raised in September 2016 via a placement of shares to institutional investors, and a share purchase plan offer to existing Bapcor shareholders.
During the financial year, Bapcor also completed a number of other acquisitions including Baxters Pty Ltd (‘Baxters’), MTQ Engine Systems Pty Ltd (‘MTQ’) and Roadsafe Automotive (‘Roadsafe’) expanding the depth and breadth of its Specialist Wholesale offering.
On 30 June 2017, Bapcor successfully refinanced its debt facilities establishing a new $500M debt facility with pre-existing lenders ANZ and Westpac Banking Corporation, as well as two new lenders being The Bank of Tokyo-Mitsubishi UFJ and The Hongkong and Shanghai Banking Corporation. Proceeds were used to repay the existing debt facilities including the acquisition facility for the acquisition of Hellaby.
4. DividendsFully franked dividends paid during the financial year were as follows:
30 September 2016 14,781,000 (6.0 cents per share) 21 April 2017* 15,278,000 (5.5 cents per share)
* $4,558,000 of the interim dividend for the year ended 30 June 2017 was settled under the Dividend Reinvestment Plan.
The Board has declared a final dividend in respect of the current financial year of 7.5 cents per share, fully franked. The final dividend will be paid on 29 September 2017 to shareholders registered on the record date of 31 August 2017. Bapcor’s Dividend Reinvestment Plan which was implemented on 16 February 2017 will be in operation for this final FY17 dividend.
The final dividend takes the total dividends declared in relation to the current financial year to 13.0 cents per share, fully franked, representing an increase of dividends paid of 18.2% compared to the prior financial year. Dividends paid and declared in relation to the current financial year represents 56.7% of statutory net profit after tax (‘NPAT’).

44 BAPCOR
DIRECTORS’ REPORT continued
5. Review of operationsThe key highlights of Bapcor’s financial results for FY17 were:
• Revenue from continuing operations increased by 47.8% compared to FY16, from $685.6M to $1,013.6M
• Statutory earnings before interest, taxes, depreciation and amortisation (‘EBITDA’) from continuing operations increased by 33.7% to $103M
• Pro-forma EBITDA from continuing operations increased by 52.4% to $117.4M
• Statutory NPAT from continuing operations increased by 23.3% to $53.7M
• Pro-forma NPAT from continuing operations increased by 50.9% compared to FY16, from $43.6M to $65.8M
• Statutory NPAT including contribution from discontinued operations increased by 46.5% to $63.8M
• Pro-forma NPAT including contribution from discontinued operations increased by 64.2% compared to FY16, from $43.6M to $71.5M
• Pro-forma EPS based on NPAT from continuing operations increased by 36.4% compared to FY16 to 24.4 cents per share
• Pro-forma EPS based on NPAT including contribution from discontinued operations increased by 48.4% compared to FY16 to 26.5 cents per share
• Net debt at 30 June 2017 was $381.9M representing a leverage ratio of less than 2.5X (Net Debt : FY17 EBITDA) on an annualised pro-forma EBITDA including discontinued operations basis allowing for a full twelve months of trading for acquisitions made during FY17 (the leverage ratio on a non-annualised EBITDA basis was 2.9X).
The table below reconciles the pro-forma result to the statutory result for FY17 and FY16.
Consolidated
Notes
2017 Continuing Operations
$’M
2017 Discontinued
Operations$’M
2017 Total$’M
2016$’M
Statutory NPAT 53.7 10.1 63.8 43.6
Costs associated with the Hellaby acquisition 1 15.3 — 15.3 —
Interest adjustment 2 (0.7) — (0.7) —
Depreciation and amortisation adjustment 3 — (6.4) (6.4) —
Tax adjustment 4 (2.5) 2.0 (0.5) —
Pro-forma NPAT 65.8 5.7 71.5 43.6
Notes on pro-forma adjustments:
1. Relates to one off costs incurred during the acquisition of Hellaby. These costs related to professional advisory fees, target defensive costs, finance costs relating to the bridging facility and refinancing, restructuring costs, one time elimination of intercompany profit in stock and other costs.
2. The interest adjustment reflects the additional interest expense that would have been incurred if the Hellaby related capital raising did not occur due to the reduction in borrowings between the time of the capital raising and the payment for Hellaby shares.
3. The depreciation and amortisation adjustment relates to the depreciation and amortisation that would have occurred in the Resource Services and Footwear divisions that was not recorded due to their held for sale status.
4. The tax adjustment reflects the tax effect of the Hellaby transaction costs and the finance, depreciation and amortisation adjustments based on local effective tax rates.
Note: The Directors’ Report includes references to pro-forma results to exclude the impact of Hellaby related acquisition costs as detailed above. The directors believe the presentation of non-IFRS financial measures are useful for the users of this financial report as they provide additional and relevant information that reflect the underlying financial performance of the business. Non-IFRS financial measures contained within this report are not subject to audit or review.

45 ANNUAL REPORT 2017
Pro-forma revenue and EBITDA by segment is as follows:
Revenue EBITDA
2017 $’M
2016 $’M
Change %
2017 $’M
2016 $’M
Change %
Trade 465.1 419.1 11.0% 63.3 51.8 22.2%
Retail & Service 221.0 172.3 28.3% 28.2 21.6 30.3%
Specialist Wholesale 212.7 103.4 105.7% 22.9 9.5 141.1%
Hellaby Automotive 146.7 15.1
Unallocated/Head Office1 (31.9) (9.2) (246.7%) (12.1) (5.9) (107.1%)
Total continuing operations 1,013.6 685.6 47.8% 117.4 77.0 52.4%
Assets held for sale 196.6 16.9
Total 1,210.2 685.6 76.5% 134.3 77.0 74.3%
1. Includes intersegment sales eliminations.
One of the largest contributors to Bapcor’s increase in revenue and profit was the acquisition of Hellaby. In addition, the results reflect the acquisitions of Baxters, MTQ and Roadsafe (all within the Specialist Wholesale segment) which were completed during the first half of FY17. FY17 also includes a full twelve months results of acquisitions made during FY16 including Aftermarket Network Australia Pty Ltd (previously Metcash Automotive Holdings Pty Ltd), Sprint Auto Parts and Bearing Wholesalers.
Further details of the operating and financial performance of each segment follows below.
5.1 Operating and financial review — Trade The Trade segment currently consists of the Burson Auto Parts and Precision Automotive Equipment business units. This segment is a distributor of:
• Automotive aftermarket parts and consumables to trade workshops for the service and repair of passenger and commercial vehicles
• Automotive workshop equipment such as vehicle hoists and scanning equipment, including servicing of the equipment
• Automotive accessories and maintenance products to do-it-yourself vehicle owners.
The Trade segment had another successful year recording revenue and EBITDA growth of 11.0% and 22.2% respectively.
The increase in revenue of 11.0% in FY17 included same store sales growth of 4.6% (compared to 4.6% in FY16) with every state recording positive growth. Same store sales growth in H2 FY17 was below H1 FY17 due to the comparative period in H2 FY16 including selling price increases above the rate recorded in H2 FY17. Whilst growing its revenue Trade was also successful in growing its gross margin percentage, which increased by 1.2 percentage points compared to FY16. The increase in gross margin percentage was a result of supplier negotiations as well as ongoing price management.
During FY17, Burson Auto Parts continued to expand its store network with the number of stores increasing from 145 at 30 June 2016 to 160 at 30 June 2017. The increase of 15 stores consisted of three individual store acquisitions and twelve greenfield store developments including a conversion of a company owned ABS store. The average cost per new store including inventory was $774,000.
The new stores are located as follows:
• Acquisitions — Colac in Victoria; Gladstone in Queensland; and Raymond Terrace in New South Wales.
• Greenfields — Oxenford and Warwick in Queensland; Grafton, Griffith, Hornsby, Morisset and Taree in New South Wales; Tuggeranong in the Australian Capital Territory; and Canningvale, Joondalup, Mandurah and Midvale in Western Australia.
The cost of doing business (‘CODB’) percentage decreased by 0.3 percentage points in FY17 mainly as a result of FY16 including costs associated with the bedding down of the new Trade Brisbane Distribution Centre and costs associated with the start-up stores in Western Australia.
As a result of the increased gross margin and lower CODB, EBITDA as a percentage of sales increased by 1.3%. In total EBITDA increased by $11.5M to $63.3M or by 22.2%.
The Trade businesses continue to see aggressive price competition. In particular, the Western Australian market continues to be very price competitive resulting in lower margins. Bapcor remains committed to its strategy to grow the store network across Western Australia.
A key focus for the Trade business is the development and training of employees. A total of 26 development training courses were conducted throughout FY17, with over 600 employees attending, as well as the continual provision of online training in areas such as safe driving.
46 BAPCOR
DIRECTORS’ REPORT continued
5.2 Operating and financial review — Retail & ServiceThe Retail & Service segment consists of business units that are retail customer focused, and include the Autobarn, Autopro, Sprint Auto Parts and Car Parts retail store brands, and the Midas and ABS workshop service brands. The majority of this segment is franchised stores and workshops. There are also 54 company owned stores.
The Retail segment performed well during the year recording EBITDA of $28.2M compared to $21.6M in FY16, an increase of 30.3%. Revenue increased by 28.3% to $221.0M which includes the impact of a higher ratio of company owned stores versus franchise operations. As a result of the higher mix of company owned stores generating a higher level of sales relative to profit, EBITDA as a percentage of sales increased by 0.2 percentage points from 12.6% in FY16 to 12.8% in FY17.
Bapcor has previously stated its intention of growing the number of company owned Autobarn stores via both new Autobarn store locations as well as some select conversion of franchise stores to company owned stores. The total number of Autobarn stores at 30 June 2017 was a record high 122 stores, a net increase of eight stores since 30 June 2016. The number of company owned stores increased from 15 to 31, with the 16 new stores consisting of seven greenfield stores and the conversion of nine franchise operations. The percentage of company owned Autobarn stores is now 25%, up from 14% at 30 June 2016. Autobarn achieved its largest single trading day in June 2017; catalogues delivered were up 7% and click and collect sales increased by 45%.
At 30 June 2017 the total number of company owned and franchise stores in the Retail segment was 385 consisting of Autobarn 122 stores, Autopro 86 stores, Sprint Auto Parts 38 stores and Midas and ABS 139 stores.
Bapcor has completed a strategic review of the Service businesses and based on the level of vertical integration as well as potential growth opportunities, it has been decided to retain and grow this business. In FY17 Midas achieved its highest average sales per store.
5.3 Operating and financial review — Specialist WholesaleThe Specialist Wholesale segment consists of the operations that specialise in automotive aftermarket wholesale and include AAD, Bearing Wholesalers and Opposite Lock, as well as Baxters, MTQ and Roadsafe that were acquired during FY17.
Baxters and Roadsafe were acquired by Bapcor in August 2016, while MTQ was acquired in November 2016. These entities form part of Australia’s largest automotive electrical, under car parts, and aftermarket diesel fuel injection and turbocharger distributorship. With a nationwide network, these entities service rural and metropolitan areas and multiple industries. The newly acquired businesses performed strongly in the months they formed part of the group, and have exceeded their investment business cases to date.
The original Specialist Wholesale business of AAD performed well growing both revenue and profit. AAD gross margin percentage was above FY16. Including the full year impact of FY16 acquisitions as well as the acquisitions completed during FY17, Specialist Wholesale revenue increased 105.7% and EBITDA by 141.1%.
Good progress was made during the financial year to increase the volume and product groups that the Specialist Wholesale segment sells into other Bapcor group businesses and this will continue in FY18 with growing the level of intercompany sales being a key business strategy.
5.4 Operating and financial review — Hellaby Automotive1
The Hellaby Automotive business was acquired in January 2017 as part of the takeover of Hellaby. The Hellaby Automotive business consists of Trade and Specialist Wholesale businesses located in New Zealand and Australia and operates across more than 120 locations.
In New Zealand, Trade operates from 65 locations, of which BNT is the predominant business operating from 53 stores supplying automotive and truck parts and accessories to workshops. BNT is similar to Bapcor’s Burson Auto Parts business that operates in Australia. Also in New Zealand are the Specialist Wholesale businesses of JAS Oceania NZ — an auto electrical business, HCB — a battery business, Diesel Distributors — a distributor of diesel fuel components, and TRS — a tyre and wheel business predominantly supplying the agricultural market.
In Australia, Hellaby Automotive operates the auto electrical businesses of JAS Oceania, PAT and Federal Batteries, as well as Diesel Distributors.
Hellaby Automotive performed strongly and above the acquisition business case in H2 FY17 contributing EBITDA of $15.1M. EBITDA was up 20.7% compared to H1 FY17 and 28.5% higher than H2 FY16. BNT achieved same store sales growth of 8.0%. In the future, Hellaby Automotive will be reported as part of Bapcor’s Trade and Specialist Wholesale segments.
5.5 Operating and financial review — Unallocated/Head OfficeThe Unallocated/Head Office segment consists of all elimination and head office costs or adjustments that are not in the control of the other segments. Unallocated costs increased from $5.9M in FY16 to $12.1M in FY17 due largely to $3.1M of intercompany profit in stock eliminations, the inclusion of Hellaby head office costs of $2.0M and an increase on normal acquisition associated costs of $0.5M. Additional resources were also employed in head office due to the significant increase in size of the business. As of end of September 2017, Hellaby head office costs will be reduced to approximately $1.5M per annum.
1. Historical metrics are presented for comparative purposes only and have been sourced from internal management reports.

47 ANNUAL REPORT 2017
5.6 Operating and financial review — Assets Held for Sale2 As part of the acquisition of Hellaby, Bapcor acquired the divisions of Resource Services and Footwear. These assets have been deemed non-core and a process to divest these assets is underway.
The Resource Services division comprises two businesses, Contract Resources and TBS. The Resource Services business operates in Australia, New Zealand, the Middle East and the Americas. These businesses provide highly specialised, essential maintenance solutions to industrial clients, particularly in the oil and gas industries. Resource Services’ EBITDA of $11.0 in H2 FY17 was 90.5% above H2 FY16 year largely due to the acquisition of TBS which was effective 1 July 2016.
The Footwear division comprises two retail networks in New Zealand, Hannahs and No.1 Shoes, across 117 stores. After experiencing challenging retail conditions in previous years, the Footwear business is now under the management of experienced retail specialists, and in H2 FY17 Footwear’s EBITDA of $5.9M was 28.5% above H2 FY16.
5.7 Financial position — Capital raising and debt The number of ordinary shares on issue in Bapcor increased in August 2016 by 500,000, due to the issue of shares by Bapcor to the vendors of Baxters Pty Ltd as part consideration for that acquisition.
In H1 FY17, Bapcor raised $181.3M of share capital to fund its acquisition of Hellaby through the issue of 28,205,129 shares under a placement to institutional investors, and the issue of 3,115,772 shares under a share purchase plan offer to existing shareholders.
In September 2016, Bapcor issued a further 138,519 shares to participating employees under the Bapcor Employee Salary Sacrifice Share Plan.
In April 2017, Bapcor issued 816,309 shares to participating shareholders under its Dividend Reinvestment Plan, in respect of the FY17 interim dividend.
As a result of the issues of shares described above, ordinary shares on issue increased from 245,857,351 as at 30 June 2016 to 278,633,080 as at 30 June 2017.
Bapcor’s external debt facility was refinanced and increased to $500M during the year allocated across four providers, to replace current existing debt and for future general corporate purposes, capital expenditure and acquisitions.
Net debt of $381.9M represented a leverage ratio of less than 2.5X on an annualised EBITDA basis allowing for a full twelve months of trading for acquisitions completed during FY17.
6. StrategyBapcor’s strategy is to be Australasia’s leading provider of motor vehicle aftermarket parts and accessories, automotive equipment and services, and motor vehicle servicing.
TradeTrade consists of the businesses Burson Auto Parts, Precision Automotive Equipment and the recently acquired Tricor Engineering. The business units are trade focussed “parts professionals” businesses supplying service workshops. Bapcor’s target is to grow Burson Auto Parts’ store numbers from 160 at the end of June 2017 to 200 stores by 2021 with 30% home brand product content.
Retail & ServiceAutobarn — The premium retailer of automotive accessories, Autobarn had 91 franchise stores and 31 company owned stores at 30 June 2017 with a target to grow to 200 stores by 2023, with a majority of growth being company owned stores, and 35% home brand product content.
Independents — The independents group consists of the franchise stores of Autopro, Car Parts and Sprint Auto Parts. The strategy is to supply the independent parts stores via Bapcor’s extensive supply chain capabilities and brand support. There were 215 independent stores at 30 June 2017. The target is to maintain the number of independent stores at over 200 and convert these stores to Burson Auto Parts or Autobarn stores when commercially sensible opportunities arise.
Service — The service business consists of the brands Midas and ABS and aims to be experts at scheduled car servicing at affordable prices. There were 139 stores at 30 June 2017 of which 125 were franchised.
Specialist WholesaleThe Specialist Wholesale business strategy objective is to be the number one or number two industry category specialists in the parts programs in which it operates. The parts programs in which the Specialist Wholesale segment has historically operated are brake, bearings, electrical, suspension, 4WD, cooling, engine and gaskets.
The Specialist Wholesale businesses are focused on maximising internal sales, developing private label product ranges, and the evaluation of its distribution footprint including opportunities for shared facilities.
2. EBITDA metrics are presented for comparative purposes only and have been sourced from internal management reports.

48 BAPCOR
DIRECTORS’ REPORT continued
Hellaby optimisationFollowing an internal review of the optimisation opportunities from the Hellaby acquisition, $8M to $11M in EBIT benefits have been identified in direct and indirect procurement, intercompany sourcing, freight, increased sales through expanded product ranges, developing shared services and optimising category expertise. These benefits are in addition to the forecast benefits of the Hellaby acquisition that were announced at the time of the acquisition and the reduction in Hellaby head office costs from an annual $6M to $7M, to approximately $1M.
Strategic divestmentsBapcor is continuing the process of divestment of non-core assets. Further announcements regarding the divestments will be made at the appropriate time.
Competitive advantagesPeople — Bapcor has a strong and experienced management team and a proven record of attracting, retaining and growing key talent across the group. Training and development of team members are a priority for the group.
Supply Chain — strength of distribution network ensures fast delivery to trade customers who rely on quick access to parts to improve service time to their customers.
Diversification — extensive breadth and depth of product range and capability across the group provides multiple revenue streams and continues to drive intercompany sales and margin improvement opportunities, whilst spreading reliance on profitability.
7. Industry trendsThe automotive aftermarket parts market in Australasia continues to experience growth based on:
i. population growth;
ii. increasing number of vehicles per person;
iii. change in the age mix and complexity of vehicles (i.e. more vehicles in the four years or older range); and
iv. an increase in the value of parts sold.
Demand for automotive parts, accessories and services is resilient as vehicle maintenance is critical to operating a vehicle. Vehicle servicing is driven by the number of kilometres travelled, with the number of kilometres travelled by passenger and light commercial vehicles not significantly impacted by economic conditions. Volatility in new vehicle sales does not directly impact demand as parts distributed by Bapcor are predominantly used to service vehicles that are aged four years or older.
Original equipment manufacturers ('OEMs') are ceasing to manufacture cars in Australia. Ford ceased production in October 2016, and Toyota and Holden have announced production will cease in October 2017. Bapcor does not expect demand for parts to be affected by the decline in the Australian vehicle manufacturing industry, as Bapcor distributes parts for a wide range of vehicle makes and models irrespective of where the vehicle is manufactured, and demand for Bapcor’s services is driven by the total number of registered vehicles on the road in Australia and not the location of vehicle manufacture.
On-line channels to market is now a common medium for retail businesses albeit only a small percentage of automotive retail sales are on-line. Amazon has announced its intention to start trading in the Australian market at some point in the future and it is expected this will present a market place for Automotive parts and accessories. Due to its fast delivery capabilities, wide product range and knowledgeable people being the key to Bapcor’s customer offering which on-line businesses cannot match, Bapcor does not believe the introduction of on-line competition will have a material impact to Bapcor’s business.
There is increased interest and production of electric vehicles. As Bapcor’s target market is vehicles greater than three to four years old, and due to the large size of the conventional vehicle car parc and how long it would take for electric vehicles to become a meaningful percentage of the total number of vehicles on the road, Bapcor considers that any impact to the Bapcor business within the foreseeable future is minimal.

49 ANNUAL REPORT 2017
8. Key business risks There are a number of factors that could have an effect on the financial prospects of Bapcor. These include:
Competition risk — The Australian automotive aftermarket parts and accessories distribution industry is competitive and Bapcor may face increased competition from existing competitors (including through downward price pressure), new competitors that enter the industry, vehicle manufacturers, and new technologies or technical advances in vehicles or their parts. Increased competition could have an adverse effect on the financial performance, industry position and future prospects of Bapcor.
Increased bargaining power of customers — A significant majority of Bapcor’s sales are derived from repeat orders from customers. Bapcor may experience increased bargaining power from customers due to consolidation of existing workshops forming larger chains, greater participation of existing workshops in purchasing and buying groups, and closure of independent workshops resulting in greater market share of larger chains. An increase in bargaining power of customers may result in a decrease in prices or loss of customer accounts, which may in turn adversely affect Bapcor’s sales and profitability.
Supplier pressure or relationship damage — Bapcor’s business model depends on having access to a wide range of automotive parts, in particular parts with established brands that drive customer orders. An increase in pricing pressure from suppliers or a damaged relationship with a supplier may increase the prices at which Bapcor procures parts or limit Bapcor’s ability to procure parts from that supplier. If prices of parts increase, Bapcor will be required to pass on or absorb the price increases, which may result in a decreased demand for Bapcor’s products or a decrease in profitability. If Bapcor is no longer able to order parts from a key supplier, Bapcor may lose customer orders and accounts, resulting in lower sales. Any decline in demand, sales or profitability may have an adverse effect on Bapcor’s business and financial performance.
Exchange rate risk — A large proportion of Bapcor’s parts are sourced from overseas, either indirectly through local suppliers or directly by Bapcor. This exposes Bapcor to potential changes in the purchase price of products due to exchange rate movements. Historically Bapcor has been able to pass on the majority of the impact of foreign exchange movements through to the market. If the situation arises where Bapcor is not able to recoup foreign exchange driven cost increases, this may lead to a decrease in profitability. To mitigate this risk, Bapcor enters into forward exchange contracts based on expected purchases for the upcoming twelve months.
Managing growth and integration risk — The integration of acquired businesses and the continued strategy of growing the store network will require Bapcor to integrate these businesses and where appropriate upscale its operational and financial systems, procedures and controls and expand and retain, manage and train its employees. There is a risk of a material adverse impact on Bapcor if it is not able to manage its expansion and growth efficiently and effectively, or if the performance of new stores or acquisitions does not meet expectations. Bapcor senior management take an active role in the integration of acquired businesses.
Expansion — A key part of Bapcor’s growth strategy is to increase the size of its store network, which it intends to achieve through store acquisitions and greenfield developments. If suitable acquisition targets are not able to be identified; acquisitions are not able to be made on acceptable terms; or suitable greenfield sites are not available, this may limit Bapcor’s ability to execute its growth strategy within its expected timeframe. Further, new stores may not prove to be as successful as Bapcor anticipates including due to issues arising from integrating new businesses. This could negatively impact Bapcor’s financial performance and its capacity to pursue further acquisitions. Bapcor senior management take an active role in the rollout and progress of store expansion.
Divestments — As part of the acquisition of Hellaby, two non-core divisions were acquired, being Resource Services and Footwear. It is Bapcor’s intention to divest these businesses in an orderly manner. There is a risk these divestments could take longer or will be at lower value than expected.
Franchise regulations — Bapcor has a large franchise network within its Retail & Service segment. Changes in franchise law or regulations may have an impact on the responsibilities of the franchisor or the operations of these franchise businesses. Bapcor senior management seek ongoing professional advice to monitor any developments.
ACCC new car retailing industry market study — The Australian Competition and Consumer Commission (‘ACCC’) is currently conducting a review into the new car retailing industry that includes a review into consumer guarantees, access to technical information and fuel consumption and emissions. This study has the potential to influence Bapcor’s ability to access technical data from OEMs and also Bapcor’s workshop customers. Bapcor have provided a submission into this study and will continue to monitor the ACCC findings.
9. Likely development and expected results of operations Bapcor expects to continue to see growth in FY18 due to a number of factors as follows:
• A full twelve months of results will be included for the Hellaby acquisition (six months in FY17) as well as other acquisitions made during FY17;
• Forecasted intra business synergies as a result of the Hellaby acquisition; and
• Continued store network growth and solid performance in the underlying businesses.
Trading trends in July and for the month to date of August have been consistent with expectations.
As a result of the above Bapcor is forecasting FY18 NPAT from continuing operations to be circa 30% above FY17 pro-forma NPAT from continuing operations.

50 BAPCOR
DIRECTORS’ REPORT continued
10. Information on directors
Robert McEniry, Independent, Non-Executive Director and Chairman
Qualifications: Master of Business Administration from the University of Melbourne Member of the Australian Institute of Company Directors
Experience and expertise: Robert has extensive experience in the automotive industry both in Australia and overseas. Robert’s former roles include President and Chief Executive Officer (and Chairman) of Mitsubishi Motors Australia Ltd, Chief Executive Officer of Nucleus Network Ltd, Chief Executive Officer of South Pacific Tyres Ltd, and board member of the Executive Committee for the Federal Chamber of Automotive Industries.
Other current directorships: Robert is currently on the boards of Multiple Sclerosis Ltd, Australian Home Care Services Ltd (Chairman), Automotive Holdings Group Ltd and Stillwell Motor Group Ltd (Chairman).
Former directorships (last 3 years): None
Special responsibilities: Chair of the Board Member of the Nomination and Remuneration Committee Member of the Audit and Risk Committee
Interests in shares: 43,163 ordinary shares
Darryl Abotomey, Chief Executive Officer and Managing Director
Qualifications: Bachelor of Commerce majoring in accounting and economics from the University of Melbourne. Member of the Australian Institute of Company Directors
Experience and expertise: Darryl has more than ten years’ experience in the automotive aftermarket industry. Darryl has extensive experience in business acquisitions, strategy, finance, information technology and general management in distribution and other industrial businesses. Darryl was a former Director and Chief Financial Officer of Exego Group (Repco). He has also previously held directorships with The Signcraft Group, PaperlinX Limited, CPI Group Limited and Pinegro Products Pty Ltd.
Other current directorships: None
Former directorships (last 3 years): None
Interests in shares: 1,860,246 ordinary shares
Interests in rights: 381,077 performance rights
Andrew Harrison, Independent, Non-Executive Director
Qualifications: Bachelor of Economics from the University of Sydney Master of Business Administration from The Wharton School at the University of Pennsylvania Member of the Australian Institute of Company Directors Chartered Accountant
Experience and expertise: Andrew is an experienced company director and corporate advisor. Andrew has previously held executive and non-executive directorships with public, private and private equity owned companies; including as Chief Financial Officer of Seven Group Holdings, Group Finance Director of Landis and Gyr, and Chief Financial Officer and a director of Alesco Limited. Andrew was previously a Senior Manager at Gresham Partners Limited, an Associate at Chase Manhattan Bank (New York) and a Senior Manager at Ernst & Young (Sydney and London).
Other current directorships: Andrew is currently on the boards of Estia Health Limited, WiseTech Global Limited, Xenith IP Limited and IVE Group Limited
Former directorships (last 3 years): None
Special responsibilities: Chair of the Audit and Risk Committee Member of the Nomination and Remuneration Committee
Interests in shares: 56,869 ordinary shares

51 ANNUAL REPORT 2017
Therese Ryan, Independent, Non-Executive Director
Qualifications: Bachelor of Laws from the University of Melbourne Graduate of the Australian Institute of Company Directors
Experience and expertise: Therese is a professional non-executive director and has extensive experience as a senior business executive and commercial lawyer working in widely diversified businesses in Australia and internationally. Previously, she was Vice President and General Counsel of General Motors International Operations based in Shanghai, Assistant Secretary of General Motors Corporation and prior to that General Counsel and Company Secretary of GM Holden.
Other current directorships: Therese is currently a board member of the Victorian Managed Insurance Authority, VicForests, Gippsland Water and WA Super
Former directorships (last 3 years): None
Special responsibilities: Chair of the Nomination and Remuneration Committee Member of the Audit and Risk Committee
Interests in shares: 32,976 ordinary shares
Margaret Haseltine, Independent, Non-Executive Director
Qualifications: Bachelor of Arts Degree Diploma in Secondary Teaching from the Auckland University Fellow of the Australian Institute of Company Directors
Experience and expertise: Margaret has more than 30 years’ business experience in a broad range of senior positions, and ten years’ experience in board directorship. A proven executive leader, Margaret has significant experience in the areas of supply chain and logistics, customer interface in the FMCG sector, change management, governance, and management within a large corporate environment. Previously, she held various senior positions with Mars Food Australia, including CEO, spanning a 20-year career.
Other current directorships: Margaret is currently a board member of Southern Hospitality Ltd, Bagtrans Pty. Ltd. (Chairman) and Stuart Alexander and Co Pty Ltd
Former directorships (last 3 years): Fantastic Holdings Ltd
Special responsibilities: Member of the Nomination and Remuneration Committee Member of the Audit and Risk Committee
Interests in shares: 15,713 ordinary shares
Former directorships (last 3 years) quoted above are directorships held in the last 3 years for listed entities only and excludes directorships of all other types of entities.
11. Company secretary and officers
Current Chief Financial Officer and Company Secretary:
Gregory Lennox Fox (2 March 2012 — present)Greg has more than 25 years’ experience in the automotive, industrial and public accounting sectors. Greg joined Bapcor as Chief Financial Officer in 2012 with responsibility for finance, legal, company secretarial and plays a key role in strategic initiatives. Greg was previously Chief Financial Officer at Atlas Steels and at Plexicor, which was a major supplier to the automotive industry. Greg also held various senior financial positions with Amcor Ltd after commencing his career as a chartered accountant.

52 BAPCOR
DIRECTORS’ REPORT continued
12. Meetings of directorsThe number of meetings of the company’s Board of Directors (‘the Board’) and of each Board committee held during the year ended 30 June 2017, and the number of meetings attended by each director were:
Full BoardNomination and
Remuneration Committee Audit and Risk Committee
Attended Held Attended Held Attended Held
Robert McEniry 13 13 3 3 4 4
Darryl Abotomey1 13 13 — — — —
Andrew Harrison 13 13 3 3 4 4
Therese Ryan 13 13 3 3 4 4
Margaret Haseltine 13 13 3 3 4 4
Held: represents the number of meetings held during the time the director held office or was a member of the relevant committee.
1. The members of the Audit and Risk Committee are Andrew Harrison (Chair), Therese Ryan, Margaret Haseltine and Robert McEniry. By invitation from the Audit and Risk Committee, Darryl Abotomey attended all Audit and Risk Committee meetings.
The members of the Nomination and Remuneration Committee are Therese Ryan (Chair), Robert McEniry, Andrew Harrison and Margaret Haseltine. By invitation from the Nomination and Remuneration Committee, Darryl Abotomey attended all Nomination and Remuneration Committee meetings.
13. Remuneration report — Introduction from Bapcor’s Independent Non-Executive DirectorsThe independent non-executive directors of Bapcor are pleased to present the 2017 Remuneration Report.
The format and presentation of the Remuneration Report has changed this year to reflect feedback we have had from shareholders and make it more extensive and to more clearly detail the link between Bapcor remuneration and the company’s performance.
13.1 Remuneration increasesBapcor operates in a highly competitive market, and is focused on profitable growth. We have been so successful that executive pay and board fees have failed in successive years to keep pace with Bapcor’s size and complexity. This presents an unacceptable risk that we may not be able to attract and retain the expertise and experience required for an ever-demanding business. So again this year we have adjusted remuneration to reflect the changing nature and challenge of the tasks facing our directors and executives. The increase in remuneration is well below the growth of the company, whether measured in market capitalisation, revenue, earnings or share price.
Remuneration Analysis FY14 — FY17% increases of Market Cap, Revenue, Pro-forma NPAT and KMP Fixed Remuneration
0%
50%
100%
150%
200%
250%
300%
350%
KMP Fixed Rem
Revenue
Pro-forma NPAT
Market Cap
FY17FY16FY15FY14
% in
crea
se
Exec KMP Fixed $M 1.66 1.87 2.87 3.91Exec KMP number 5 6 7 9Avg per Exec $000’s 333 312 410 435

53 ANNUAL REPORT 2017
Realising the potential issue the increased executive and director remuneration could create for some investors, we engaged an external adviser to benchmark remuneration. The results confirmed our initial assessment that substantial remuneration increases were required. Hence, we acted by adjusting fixed remuneration for executives, and board fees for non-executive directors:
• an increase of 39% in fixed pay for the Chief Executive Officer and Managing Director (‘CEO’);
• an increase of broadly 28% in fixed pay for executive Key Management Personnel (‘KMP’) (excluding CEO); and
• an average increase of 40% in board director fees.
Notwithstanding these adjustments, fixed and total remuneration remain below the median for peer companies.
Executive short-term and long-term incentive pay opportunities remain the same percentage of fixed pay and are contingent on achieving growth objectives.
13.2 FY17 performance and remuneration outcomesFY17 was another very successful year for the company with outstanding efforts and outcomes from the executives and all employees. Significant outcomes for the year include:
• Increase in revenues of 76.5% to $1,210.2M, including revenue of $196.6M from non-core businesses
• Increase in net profit after tax (‘NPAT’) of 46.5% to $63.8M
• Increase in pro-forma NPAT of 64.2% to $71.5M
• Increase in pro-forma earnings per share (‘EPS’) of 48.4%
• Increase in dividends of 18.2% to 13.0 cents per share
• Integration of the Aftermarket Network Australia Pty Ltd (previously Metcash Automotive Holdings Pty Ltd) business successfully executed
• Acquisition of Hellaby and a number of Specialist Wholesale businesses
The incentive pay outcomes detailed in this report are a direct result of exceeding short-term incentive (‘STI’) targets primarily based on exceeding NPAT and earnings before interest and tax (‘EBIT’) budgets. At the time the budgets were set, they exceeded market expectations, including the benefits of acquisitions.
Non-financial targets of up to 30% also play a key role particularly as they contribute to the longer-term sustainability of the business.
As a result of achieving and exceeding the group’s objectives, on average 81% of the maximum FY17 STI was awarded to executive KMP. The Board is pleased with this outcome as it reflects the experience enjoyed by shareholders.
The long-term incentive (‘LTI’) measures of relative total shareholder return (‘TSR’) and EPS growth have been consistently applied since the initial public offering (‘IPO’). The Board is pleased that management exceeded maximum LTI requirements for both TSR and EPS, so that 100% of the relevant tranches of the FY14 and FY15 LTI’s vested.
13.3 FY17 & FY18 equity grant for the CEOAt our 2016 Annual General Meeting (‘AGM’) we asked our shareholders to approve a three year grant of LTI to our CEO. The resolution did not receive majority shareholder support, so the planned LTI opportunity was not granted to the CEO. Feedback indicated that annual tranches were preferred and that there was insufficient detail in respect of the proposed grants of equity for a majority of shareholders to approve the resolution. Therefore, the Notice of Meeting for this year’s AGM will provide more specific detail of the annual LTI to be granted to the CEO and for which the Board will seek shareholder approval.
The Board will again seek approval for the LTI grant with performance measured from FY17. The basis of the grant will be detailed in the Notice of Meeting for the 2017 AGM and reflects the goals and objectives set by the board for the management team, including the CEO at that time. The Board believes it is essential the CEO is subject to exactly the same LTI performance requirements as his management team. The management team are operating on this assumption, and the Board considers it prudent these expectations be met.
We will also be seeking approval for the CEO LTI grant with performance measured from FY18. The performance requirements and grant basis will be consistent with that applying to other executives.
We trust that between the attached Remuneration Report and the details that will be contained in the Notice of Meeting for the 2017 AGM that we have provided sufficient details for the number of rights for both grants to receive shareholder support.
On behalf of the independent non-executive directors of the Board, we recommend the following Remuneration Report to you.

54 BAPCOR
DIRECTORS’ REPORT continued
14. Remuneration report — Overview
Key Items Our Approach
How is FY17 executive remuneration different from FY16?
Fixed remuneration for FY17 was adjusted to position it around 90% of the median of the comparator peer companies, based on the information obtained from the independent advisor retained by the Board, Godfrey Remuneration Group.
The CEO was not granted an LTI in FY17 as the majority of shareholders did not approve the resolution put to the AGM.
Why has fixed remuneration of KMP been increased?
The Board obtained independent market data (from Godfrey Remuneration Group) to ensure that executive and non-executive KMP were fairly compensated for their position.
The company has experienced significant growth in the size and complexity of the business, geographical scope, number of employees and revenues since the IPO in 2014. Consequently, increases to the fixed remuneration of executive KMP were considered by the Board to be fair and appropriate, necessary to ensure market equity, and to mitigate against the risk of losing key people, and of regretted executive turnover.
It should be noted that, notwithstanding the increases in FY17, fixed and total remuneration of executive KMP remain below the median for peer companies. Also, since the FY17 review the company has acquired Hellaby Holdings Limited in New Zealand and numerous other businesses.
The independent market review of board fees undertaken by Godfrey Remuneration Group indicated that board fees were below market levels for comparable roles in peer companies. This was largely because of the company’s growth as outlined above. Accordingly the non-executive director (‘NED’) fees were adjusted to a level that remains below the median of the peer group based on the independent market data.
Average NED fees increased by 40%, excluding Margaret Haseltine who commenced in May 2016.
How much STI was earned by the executives for FY17 and what were the reasons for the level of payment?
STIs earned by executive KMP are based on targets set at the beginning of the financial year. The STIs at target level are 70% financial measures and 30% personal objectives. At maximum level, the STIs are weighted 83.5% and 80% to financial measures respectively for the CEO and other executives.
The aggregate of STI paid to the executive KMP for FY17 performance was $2,121,000 (excluding Colin Daly who commenced with Bapcor as part of the Hellaby acquisition) which is 81% of the maximum that could have been paid to them.
As the awards exceeded the target value, $607,000 will be deferred and paid to the executives in August 2018.
These payments were made because the company’s financial performance exceeded target against a range of measures including:• Group pro-forma NPAT increase of 64.2% over FY16• Group pro-forma EBITDA increase of 74.3% over FY16• Group revenue from continuing operations increase of 47.8% over FY16
For each executive KMP, specific personal objectives are agreed at the beginning of the year and these are measured against actual performance at the end of the year. The objectives include such areas as safety, progression and succession, employee development, employee engagement, strategic growth, same store sales growth, customer satisfaction, corporate compliance and governance and investor relations.
Why was the CEO’s equity grant for FY17 not approved by the shareholders at the AGM in October 2016?
The Board sought the approval of shareholders for flexibility in the grant of equity to the CEO over the following three years. Feedback indicated that there was insufficient detail in respect of the proposed grants of equity for a majority of shareholders to approve the resolution.
The Notice of Meeting for this year’s AGM will provide more specific detail of the LTI to be granted to the CEO and for which the Board will seek shareholder approval. The Board will seek approval for two tranches of LTI to be granted to the CEO, one for performance from FY17 and one for performance from FY18.
Why grant an LTI opportunity to the CEO encompassing FY17 performance?
The Board wants to ensure that the CEO is aligned with other members of the executive team in his focus on board priorities as well as aligned to growth in shareholder value. Therefore a grant was communicated to the CEO, subject to shareholder approval.
What LTI grants have vested in FY17?
What was the basis for the vesting of those grants?
One tranche of the LTI granted to five executives on 11 April 2014, being 65% of the total number granted, was independently tested by a third party against the company’s FY17 TSR and EPS performance. The extent to which they vested is as follows:
Relative TSR Rights: Bapcor’s TSR performance ranked at the 100th percentile of the comparator group. This resulted in 100% of the tranche vesting.

55 ANNUAL REPORT 2017
Key Items Our Approach
What LTI grants have vested in FY17?
What was the basis for the vesting of those grants?
(continued)
Compound annual growth rate (‘CAGR’) of EPS: Bapcor’s CAGR of EPS was 30.4%. This resulted in 100% of the tranche vesting.
One tranche of the LTI granted to eleven executives on 24 December 2015, being 35% of the total number granted, was independently tested by a third party against the company’s FY17 TSR and EPS performance. The extent to which they vested is as follows:
Relative TSR Rights: Bapcor’s TSR performance ranked at the 80th percentile of the comparator group. This resulted in 100% of the tranche vesting.
CAGR of EPS: Bapcor’s CAGR of EPS was 36.5%. This resulted in 100% of the tranche vesting.
Shares from vested Performance Rights remain under a restriction on sale for a further twelve months, reflecting further alignment of executive and shareholder interests.
What is the performance period for the LTIs?
The grants of LTI in the years up to and including FY17 were for performance periods of two and three years, with both tranches having a further twelve month restriction on sale for vested LTI.
The FY18 LTI opportunity will be subject to a minimum performance period of three years with a further twelve month restriction on sale for vested LTI.
Are you disclosing the executive KMP cash and realisable pay in FY17?
Yes. Recognising an increasing interest in it from some proxy advisers and investors, in addition to the required statutory format, the Board is disclosing cash paid and the value of vested deferred awards. Some payments are for performance in previous years (e.g. where there has been an STI deferral). Accordingly, cash and realisable pay is not an absolute indicator of pay for performance in this particular year.
Section 15.5 of this report provides the detail.
Did the Board make any one-off payment to executive KMP in FY17?
There were no one-off payments to executive KMP in FY17.
A payment of $6,000 was made to Margaret Haseltine, a non-executive director in FY17 for the additional workload required of her in respect of her role on the Board of Hellaby Holdings Limited during its acquisition and while it remained a listed entity in New Zealand. Refer to section 15.6.3.
Did the Board exercise discretion when determining the payments under the STI plan?
The personal objective component of the STI’s requires some degree of judgement as to the achievement of the objectives as these are not all based on numeric outcomes.
What were the FY17 STI performance measures for KMP?
Section 15.5.2 and 15.5.3 of this report provides more details of the performance measures for FY17.
In summary, the CEO could earn:• 38.5% of fixed remuneration for meeting the NPAT target (which was set significantly higher than
FY16 actual NPAT), and • 83.5% of his fixed remuneration if the NPAT target was exceeded by more than 10%, and• up to 16.5% of fixed remuneration for meeting personal objectives in respect of safety, progression
and succession, people development, strategic growth (including acquisitions), organic growth, delivery of optimisation benefits, employee engagement and customer satisfaction, corporate governance and shareholder relations.
How did the Board determine the STI performance measures for FY17?
The Board determined that the focus of the executive team should be on growing NPAT for group management and EBIT for business segment managers. For this reason, 70% of the target STI award is tied to these financial measures. All above target STI is based on the financial measures.
Achievement of the non-financial measures will underpin the future growth and sustainability of the company.
Is there provision for deferral of STI and what if any has been deferred?
The Board’s current policy is to defer for twelve months the amount of STI awarded to executive KMP that is above target.
Has the company changed the method it uses to determine the number of LTI Performance Rights to grant?
For the period from listing in FY14 to FY17 there has been no change to the methodology used to calculate the number of LTI Performance Rights granted.
Responding to investor feedback, for FY18 the company proposes to change from using a fair-value calculation methodology to the weighted average face value of shares in the interests of better transparency. The transition to this methodology will not disadvantage executives and will be fully detailed in the Notice of Meeting for the AGM.
Has the company made any loans to the executives in FY17?
No. It is noted that there is no outstanding loan balance for the CEO.
56 BAPCOR
DIRECTORS’ REPORT continued
15. Remuneration report (audited)The directors present the Remuneration Report setting out the principles, policy and practices adopted by the Bapcor Board in respect of remuneration for the group’s non-executive and executive KMP in accordance with the requirements of the Corporations Act 2001 and its Regulations.
The Remuneration Report is set out under the following main headings:
15.1 Principles used to determine the nature and amount of remuneration
15.2 Key management personnel
15.3 Remuneration governance
15.4 Executive remuneration
15.5 Cash and realisable remuneration
15.6 Statutory details of remuneration
The information provided in this Remuneration Report, which forms part of the Directors’ Report has been audited as required by section 308(3C) of the Corporations Act 2001.
15.1 Principles used to determine the nature and amount of remunerationThe Board and Nomination and Remuneration Committee (‘NRC’) consider executive KMP remuneration should be structured in a way that provides fair, market competitive fixed remuneration with an at-risk remuneration opportunity that will focus executives on achieving company objectives and aligning their interests with shareholder outcomes.
At all times, the Board retains discretion to continually review and adjust the remuneration framework and structures in response to corporate changes, the commercial environment, shareholder feedback, good governance practices and market demands.
Fees and payments to NEDs reflect the demands and responsibilities of the directors. NED fees and payments are reviewed annually by the NRC.
The Board obtains external, independent specialist advice on remuneration and benchmarking to inform its decisions.

57 ANNUAL REPORT 2017
15.2 Key management personnelBapcor’s KMP, as defined by AASB 124 Related Party Disclosures, are those people with the authority and responsibility for planning, directing and controlling the activities of the consolidated entity, directly or indirectly, and includes non-executive and executive directors. The KMP as at 30 June 2017 and their position are those in the following table.
Name Position
Non-executive Directors
Robert McEniry Board ChairMember Audit and Risk CommitteeMember Nomination and Remuneration Committee
Andrew Harrison Chair Audit and Risk CommitteeMember Nomination and Remuneration Committee
Therese Ryan Chair Nomination and Remuneration CommitteeMember Audit and Risk Committee
Margaret HaseltineMember Nomination and Remuneration CommitteeMember Audit and Risk Committee
Executive Director
Darryl Abotomey Chief Executive Officer and Managing Director
Other KMP
Greg Fox Chief Financial Officer and Company Secretary
Mathew Cooper Executive General Manager, Strategic Development
Paul Dumbrell Chief Operating Officer, Specialist Wholesale
Grant Jarrett Executive General Manager, Operations
Craig Magill Executive General Manager, Burson Trade
Peter Tilley Executive General Manager, Retail & Service
Alison Laing1 Executive General Manager, Human Resources
Colin Daly2 Chief Executive Officer, Hellaby Automotive
1. Alison Laing commenced May 2017.
2. Colin Daly joined on acquisition of Hellaby effective Jan 2017.
15.3 Remuneration governance The NRC is responsible for reviewing the remuneration framework to ensure it remains fit for purpose and, as appropriate, making recommendations to the Board on how it should be structured for the company at a particular time. The NRC’s charter can be found at www.bapcor.com.au/about/governance.
Remuneration quantum and structure for executive and non-executive KMP are determined by the Board after considering recommendations made by the NRC.
The NRC meets regularly throughout the year to review and understand the effectiveness of the remuneration arrangements for the business, to assess executive KMP performance, to determine recommendations in respect of changes in fixed remuneration, STI awards and outcomes, and LTI awards and outcomes, among other matters.
The NRC and the Board have absolute discretion in determining the outcomes of incentive arrangements to ensure anomalous outcomes do not arise. This discretion can be exercised for both positive and negative adjustments to incentive outcomes to ensure the outcomes reflect the shareholders’ experience.
The NRC seeks external advice and assistance as it considers appropriate. During FY17 and in respect of FY17, the NRC engaged Godfrey Remuneration Group to provide benchmarking reports in respect of executive KMP remuneration and NED fees and to assist with setting the comparator group for the relative TSR measure of the LTI. That work resulted in Godfrey Remuneration Group providing remuneration recommendations as defined in section 9B of the Corporations Act 2001 in respect of the quantum and mix of the executive KMP remuneration and in respect of the NED fees. Godfrey Remuneration Group was paid $30,000 excluding GST and disbursements for these services.
The Board and the NRC have protocols in place to ensure the engagement of the remuneration advisers is and was independent of management and able to be carried out free of any undue influence. The Board is satisfied the recommendations were made free of any undue influence by KMP about whom the recommendations may relate.
During FY17, the NRC also engaged the services of Guerdon Associates to provide assistance in respect of market practices and trends, remuneration frameworks and structures, stakeholder engagement, and disclosures. Guerdon Associates did not provide any remuneration recommendations as defined in section 9B of the Corporations Act 2001.

58 BAPCOR
DIRECTORS’ REPORT continued
15.4 Executive remunerationThe following sections explain FY17 executive KMP remuneration:
15.4.1 Executive remuneration structure
15.4.2 Financial performance over the last three years
15.4.3 STI performance metrics and outcomes
15.4.4 STI payment, deferral and clawback
15.4.5 LTI plan
15.4.6 LTI outcomes
15.4.1 Executive remuneration structureThe Board has implemented a total remuneration structure or executive KMP remuneration comprising:
Component of total remuneration How is it delivered? Purpose How does it link to company performance?
Fixed annual remuneration (‘FAR’)
Comprises base salary, superannuation and non-cash benefits such as motor vehicles.
To provide competitive, market based fixed remuneration for senior executives. The level of FAR is set with regard for the scope of the position, and the knowledge, skill and experience required of the individual to perform the role.
The complexity of the business requires highly skilled executives to achieve a company performance that meets shareholder expectations.
Company and individual performance are considered during the annual remuneration review.
STI Paid in cash after results released except for any amount above target.
Any amount paid for above target performance is deferred for twelve months and paid in cash after release of the following year’s results, subject to claw back provisions.
To motivate executives to achieve specific financial and non-financial objectives and reward them in line with the actual achievements.
The key financial metric is NPAT for the group and EBIT for business segments with a threshold requirement of 95% of target. The target is set at a growth level to the prior year so that executives will be rewarded only if the company achieves growth.
The non-financial measures include objectives for safety, people management, sustainability, compliance, and optimisation of acquisitions that are the foundation of a sustainable company performance.
LTI Awards are made in the form of Performance Rights, which do not attract dividends or voting rights.
To motivate executives to take a long-term view of company performance, reward them in line with the company’s performance over the longer term, and to link their reward with the investors’ experience.
The value of the Performance Rights will increase in line with an increasing shareholder return for investors and, as such, is effective in retaining executives.
Vesting of half of the Performance Rights is contingent on Bapcor’s total shareholder return (‘TSR’) being better than 50% of the companies in a comparable peer group.
The other half of the Performance Rights will only vest if the company’s compound annual growth rate of EPS is not less than 7.5%, with the maximum vesting at a compound annual growth rate of 15%.
Performance is measured over 24 and 36 months with shares from the vested Performance Rights restricted from sale for a further twelve months.

59 ANNUAL REPORT 2017
The specific details of the STI and LTI opportunities are explained in the sections below.
The pay mix of the executive KMP in FY17 is shown below:
Executive Fixed remuneration Maximum STI Maximum LTI Total
CEO 50% 50% 0%1 100%
CFO 48% 28% 24% 100%
Other KMP 50% 30% 20% 100%
1. The CEO was not granted an LTI opportunity. The resolution for the grant of equity to the CEO, who is an executive director, was not approved by a majority of shareholders at the AGM in October 2016.
15.4.2 Financial performance over the last three yearsBapcor’s financial performance over the last three years will assist readers to understand the context of the remuneration framework, management’s performance and how the company’s performance impacts the remuneration outcomes for the executive KMP.
The table below shows measures of Bapcor’s financial performance over the three complete financial years since it listed on 23 April 2014.
2015 2016 2017
Revenue from continuing operations $m 375.3 685.6 1,013.6
Increase/(decrease) in revenue 9.9% 82.7% 47.8%
Pro-forma NPAT $m 23.1 43.6 71.5
Increase/(decrease) in pro-forma NPAT 19.7% 88.7% 64.2%
Dividend declared (cents per share) 8.7 11.0 13.0
Increase/(decrease) in dividend declared n/a 26.4% 18.2%
Share price 30 June $ 3.40 5.52 5.49
Increase/(decrease) in share price 60.4% 62.4% (0.05%)
Market capitalisation $m 30 June 746.9 1,357.1 1,529.7
Pro-forma EPS — TERP adjusted (cents)1 13.62 17.85 26.54
Increase/(decrease) in pro-forma EPS — TERP adjusted 19.1% 31.0% 48.4%
1. 2015 EPS has been adjusted to take into consideration the impact of the rights issue performed in 2016 and the impact on the number of shares as per AASB 133 Earnings Per Share

60 BAPCOR
DIRECTORS’ REPORT continued
15.4.3 STI performance metrics and outcomesParticipants in the STI plan have a target cash payment that is a percentage of their fixed annual remuneration. Actual STI payments may be below, at or above that target depending on the achievement of financial and non-financial objectives set each year by the Board. 70% of the target STI opportunity of the executive KMP is contingent on meeting annual NPAT objectives for group and EBIT objectives for business segments. 30% of target STI is subject to meeting other annual non-financial objectives.
No incentive payment for financial performance is payable if the threshold of 95% of financial target performance is not met.
Weighting of performance measure at target Performance measure FY17 performance
70% At the group level, NPAT is the primary financial metric and by business segment EBIT is the primary financial objective. They were selected by the Board to focus management on achieving a growth in profit that would deliver significant returns to shareholders.
For executive KMP, the financial metric is the group NPAT for group executives, whereas the financial targets for business segment executives are split between EBIT of the business segment they manage and group EBIT.
The group target was set significantly higher than the FY16 actual result and was set in the context of the business strategy and growth objectives.
Percentage of FAR
CEO CFO EGM Other KMP
< Threshold Nil Nil Nil Nil
Threshold 28.5% 20% 20% 20%
Target 38.5% 28% 28% 28%
Maximum 83.5% 48% 48% 48%
Threshold level is 95% of target and requires significant improvement over FY16 actual result.
Reported pro-forma NPAT for FY17 was $71.5M, a 64.2% increase over FY16.
The group NPAT performance was above target and above maximum.
EBIT by business segment varied as detailed in the financial report.
30% Non-financial objectives were set for each of the executive KMP (as well as other managers) and have a common stream as well as specific targets by business segment. As the executives’ roles differ and performance expectations vary accordingly, the weightings of the measures may vary for each executive. This is because each will have a particular focus on the business segment they manage.
There is a range of metrics across the following criteria that are applicable to the executive KMP depending on their role and accountabilities:
• Safety: requiring improved performance year on year.
• Strategic acquisitions: with objectives requiring the identification of suitable businesses for acquisition, implementation of the business case and optimal integration.
• Organic growth: for each business segment, organic growth targets and market share gains.
• Systems and processes: with objectives focused on the long term sustainability of the company covering areas of information technology and warehousing and distribution.
• Human resources: with objectives requiring people development, culture strategies, succession planning, training and development outcomes, and employee engagement.
• Business unit: objectives involving store growth and customer engagement.
• Compliance and governance: requiring processes and procedures to ensure achievement of compliance requirements.
• Optimisation projects: for achieving optimisation from acquisitions and improved cost structures.
A detailed explanation of the group’s achievements in the non-financial areas are contained in section 5 of this Directors’ Report.

61 ANNUAL REPORT 2017
The following table shows the actual STI outcomes for each of the executive KMP for FY17:
KMPTarget STI as a
% of FARMaximum STI as a % of FAR
Actual STI as a % of maximum
STI forfeited as a % of maximum
Actual STI awarded
$
Darryl Abotomey 55% 100.0% 95.0% 5.0% 1,015,402
Greg Fox 40% 60.0% 92.9% 7.1% 320,340
Mathew Cooper 40% 60.0% 83.7% 16.3% 195,780
Paul Dumbrell 40% 60.0% 70.5% 29.5% 192,374
Grant Jarrett 40% 60.0% 42.6% 57.4% 93,294
Craig Magill 40% 60.0% 82.1% 17.9% 204,385
Peter Tilley 40% 60.0% 42.4% 57.6% 99,216
Colin Daly1 40% 60.0% 78.8% 21.2% 108,698
Alison Laing2 n/a n/a n/a n/a n/a
1. Colin Daly joined Bapcor as part of the Hellaby acquisition in January 2017. The Hellaby plan was continued until June 2017.
2. Alison Laing joined Bapcor in May 2017 and is not eligible to participate in STI or LTI until 1 July 2017.
The STI performance measures are tested annually after the end of the relevant financial year.
15.4.4 STI payment, deferral and clawbackWhere STI awards have been determined, payments under the STI plan are made immediately after the release of full year financial results to the ASX except in relation to any portion of an award above the target up to the maximum award.
The amount of STI award above target is deferred for a period of twelve months. The deferred amount is payable to the executive immediately after the release of the year ending 30 June 2018 financial results.
All payments are in cash.
Awards are subject to claw back for any material financial misstatements that are subsequently determined in respect of Bapcor’s performance for the relevant period.

62 BAPCOR
DIRECTORS’ REPORT continued
15.4.5 LTI plan The LTI is contingent on company performance over a two and three year performance period. Payments are rights to acquire shares (‘Performance Rights’). Performance Rights are granted at the start of the performance period. Vesting of Performance Rights varies with the extent that performance requirements have been met. On vesting, the Performance Rights entitle the executive to receive fully paid shares in the company.
The key terms of the LTI under which grants were made in FY17 and prior years are as follows:
Administration The LTI is administered by the Board.
Who participates? In FY17 executive KMP, other than the CEO, and a number of other senior executives were invited to participate.
The CEO did not participate in the FY17 LTI opportunity because majority shareholder approval was not received.
What is the LTI opportunity?
The LTI opportunity is the grant of Performance Rights that will vest on satisfaction of the applicable performance, service or other vesting conditions specified in the offer at the time of the grant. The Board sets the terms and conditions on which it will offer Performance Rights under the LTI, including the vesting conditions, at the time of the offer.
Performance Rights The LTI opportunity granted to participants in FY17 provides for the Performance Rights, upon satisfaction of the vesting conditions, to convert into a fully paid ordinary share for each vested right. The Performance Rights do not carry any voting rights or dividend entitlements.
How was the number of Performance Rights determined?
For the grants made in FY17, the number of Performance Rights was determined by dividing the executive’s LTI value by the fair value of the Performance Rights at the time of grant.
For grants of LTI in FY18 and beyond, the Board intends to determine the number of equity instruments to allocate by dividing the executive’s LTI value by the face value of a Bapcor share for better transparency. The transition to the face value allocation methodology will be at no disadvantage to executive participants.
Performance period Performance is assessed over a performance period specified at the time of the grant. The performance period for the LTI opportunities granted in FY17 are set out following this table.
The Board intends the performance period for the grants of LTI to be made in FY18 will be for three years.
Performance measures Each executive is granted two tranches of Performance Rights.
50% of the total grant value of Performance Rights granted to the executive under each tranche are subject to the satisfaction of a TSR performance hurdle for the relevant performance period (‘TSR Rights’), and 50% are subject to satisfaction of an EPS performance hurdle for the relevant performance period (‘EPS Rights’).
These are described in more detail in the section following this table.
Shares Fully paid ordinary shares allocated on conversion of Performance Rights rank equally with the other issued ordinary shares and carry the same rights and entitlements, including dividend and voting rights. Shares may be issued by Bapcor or acquired on or off market by a nominee or trustee on behalf of Bapcor, then transferred to the participant.
Participation in new issues
Performance Rights granted in FY17 and earlier do not confer on a participant the right to participate in new issues of shares or other securities in Bapcor, including by way of bonus issues, rights issues or otherwise.
Limitations The number of shares to be received by participants on the conversion of the Performance Rights must not exceed 5% of the total number of issued shares over a 5 year period.
Trustee Bapcor may appoint a trustee for the purpose of administering the LTI, including to acquire and hold shares, or other securities of the company, on behalf of participants or otherwise for the purposes of the LTI.
Quotation Performance Rights are not quoted on the ASX. Bapcor will apply for official quotation of any shares issued under the LTI, in accordance with the ASX Listing Rules and having regard for any disposal restrictions in place under the LTI.
Amendments To the extent permitted by the ASX Listing Rules, the Board retains the discretion to vary the terms and conditions of the LTI. This includes varying the number of Performance Rights or the number of shares to which a participant is entitled upon a reorganisation of the capital of Bapcor. No discretion to vary LTI terms and conditions was made in FY17 or prior years.
Other terms Shares acquired on the conversion of vested Performance Rights cannot be sold for a period of twelve months from vesting date. Performance Rights cannot be transferred, encumbered or hedged.
The LTI contains other terms relating to the administration, variation, suspension and termination of the LTI.

63 ANNUAL REPORT 2017
In FY17 an offer to participate in the LTI was made to nine of Bapcor’s senior executives. Each executive’s LTI opportunity comprised two tranches whereby:
• 34% of the allocated Performance Rights have a performance period that ends on 30 June 2018 at which time the performance hurdles for this tranche are tested; and
• 66% of the allocated Performance Rights have a performance period that ends on 30 June 2019 at which time the performance hurdles for this tranche are tested.
A summary of the terms for the Performance Rights granted in FY17 is set out in the following table.
Tranche 1 Tranche 2
Grant date 20/12/2016 20/12/2016
Performance hurdle Relative TSR EPS CAGR Relative TSR EPS CAGR
Performance period 1/07/2016 to 30/06/2018 1/07/2016 to 30/06/2018 1/07/2016 to 30/06/2019 1/07/2016 to 30/06/2019
Test date 30/06/2018 30/06/2019
Expiry date Once tested Once tested
Quantity granted 77,891 46,395 145,742 91,647
Exercise price Nil Nil
Fair value at 1/07/2016 $3.1696 $5.3213 $3.2883 $5.2293
Other conditions Restriction on sale to 30/06/2019 Restriction on sale to 30/06/2020
Relative total shareholder return hurdle Fifty per cent of the Performance Rights granted to a participant will vest subject to a TSR performance hurdle that assesses performance by measuring capital growth in the share price together with income returned to shareholders, measured over the performance period against a Comparator Group of companies. The Performance Rights will vest by reference to Bapcor’s TSR performance ranking against this Comparator Group of companies, as follows:
Bapcor’s TSR relative to the Comparator Group over the performance period Percentage of TSR Rights vesting
Less than 50th percentile Nil
Equal to 50th percentile 50%
Greater than 50th percentile and less than 75th percentile Pro-rata straight-line vesting
Equal to or greater than 75th percentile 100%
TSR for Bapcor and the companies in the Comparator Group will be calculated as follows:
• TSR will be measured between 30 June 2016 and 30 June 2018 or 2019 ('Performance Period');
• For the purpose of this measurement, dividends will be assumed to have been re-invested on the ex-dividend date;
• Tax and any franking credits (or equivalent) will be ignored; and
• For the purpose of this measurement, the share price of Bapcor and the Comparator Group companies will be averaged over the ten trading days up to and including 30 June at the start and end date of the Performance Period.

64 BAPCOR
DIRECTORS’ REPORT continued
The Comparator Group for the FY17 LTI is set out below. The Board has the discretion to adjust the Comparator Group to take into account events including but not limited to takeovers, suspensions, mergers or demergers that might occur during the Performance Period.
ASX Code Company Name
AAD Ardent Leisure Group
AHG Automotive Holdings Group
ARB ARB Corporation Limited
BRG Breville Group Limited
CTD Corporate Travel Management Limited
DMP Domino’s Pizza Enterprises Ltd
FLT Flight Centre Travel Group
GEM G8 Education Ltd
GUD GUD Holdings Ltd
GXL Greencross Limited
HVN Harvey Norman Holdings Ltd
IVO InvoCare Limited
JBH JB Hi-Fi Limited
MTR Mantra Group Ltd
MYR Myer Holdings Limited
NVT Navitas Limited
PMV Premier Investments Limited
RFG Retail Food Group Limited
SUL Super Retail Group Limited
TME Trade Me Group Ltd
Earnings per share growthFifty per cent of the Performance Rights granted to a participant will vest by reference to an EPS performance hurdle that measures the basic EPS on a normalised basis over the performance period. Each tranche of Performance Rights subject to an EPS hurdle will vest as follows:
• The Board has determined that the EPS hurdle will be based on a compound annual growth rate (‘CAGR’) of basic EPS of between 7.5% and 15%, respectively, over the Performance Period.
• The starting point for these EPS rights is the FY16 Actual EPS of 17.85 cents per share.
• Basic EPS is calculated in accordance with AASB 133 Earnings Per Share.
• The proportion of the EPS Rights that vest at the end of the Performance Period will be determined as follows:
Bapcor’s compound annual EPS growth over the performance period Percentage of EPS Rights Vesting
Less than 7.5% Nil
Equal to 7.5% 20%
Greater than 7.5% and less than 15% Pro-rata straight-line vesting
Equal to or greater than 15% 100%
If vesting conditions are met, Performance Rights granted in FY17 will convert into fully paid ordinary shares of the company. Shares that are allocated in respect of each tranche will be subject to a restriction on sale for twelve months from vesting of the Performance Rights.

65 ANNUAL REPORT 2017
15.4.6 LTI outcomes During FY17 the following Performance Rights were independently tested by a third party;
• One tranche of the LTI granted to five executives on 11 April 2014, being 65% of the total number granted, was tested against the company’s FY17 TSR and EPS performance. The extent to which they vested is as follows.
Relative TSR Rights: Bapcor’s TSR performance ranked at the 100th percentile of the comparator. This resulted in 100% of the tranche vesting.
CAGR of EPS: Bapcor’s CAGR of EPS was 30.4%. This resulted in 100% of the tranche vesting.
• One tranche of the LTI granted to eleven executives on 24 December 2015, being 35% of the total number granted, was tested against the company’s FY17 TSR and EPS performance. The extent to which they vested is as follows.
Relative TSR Rights: Bapcor’s TSR performance ranked at the 80th percentile of the comparator group. This resulted in 100% of the tranche vesting.
CAGR of EPS: Bapcor’s CAGR of EPS was 36.5%. This resulted in 100% of the tranche vesting.
Shares from vested Performance Rights remain under a restriction on sale for a further twelve months, reflecting further alignment of executive and shareholder interests.
15.5 Cash and realisable remunerationThe following table shows the total cash remuneration received by executive KMP in respect of FY17. The total cash payments received are made up of fixed remuneration inclusive of superannuation and benefits and the amount of the FY17 STI award that is not deferred and is paid in August 2017.
The table also includes the value of previous years’ deferred STI and LTI awards that vested during FY17 and became realisable. These values differ from the values in the table in section 15.6.1 that shows the accounting expense for both vested and unvested awards. The table does not show values for vested LTI that are not realisable because they remain under restriction on sale for twelve months after vesting.
Previous year awards that vested during FY17
Executive KMP
Fixed remuneration1
$
FY17 cash STI2
$
Total cash in respect
of FY17 $
Prior year deferred STI
received3 $
Vested and unrestricted
LTI4 $
Total received and realisable
during FY17 $
Darryl Abotomey 1,068,300 587,565 1,655,865 129,178 — 1,785,043
Greg Fox 575,000 230,000 805,000 — — 805,000
Mathew Cooper 390,000 156,000 546,000 — — 546,000
Paul Dumbrell 400,810 182,000 582,810 — — 582,810
Grant Jarrett 373,334 93,294 466,628 — — 466,628
Craig Magill 415,000 166,000 581,000 — — 581,000
Peter Tilley 390,004 99,216 489,220 — — 489,220
Colin Daly5 229,806 108,698 338,504 — — 338,504
Alison Laing6 44,999 — 44,999 — — 44,999
1. Fixed remuneration is the aggregate of cash salary, superannuation and fringe benefits.
2. FY17 cash STI is the amount accrued and payable in respect of FY17 STI opportunity. It is the cash amount to be paid in August 2017 and does not include any deferred amount in respect of the FY17 STI award.
3. Prior year deferred STI received is the STI amount awarded in August 2016 in respect of FY16 and deferred for twelve months. It is to be paid in August 2017.
4. Vested and unrestricted LTI is the value of the vested LTI on the day it is no longer under restriction on sale. The value is the closing share price on the date the LTI is no longer subject to restriction on sale. The FY14 LTI that vested during FY17 was restricted on sale until 1 Aug 2017.
5. Colin Daly is Chief Executive — Hellaby Automotive and has been included from when Bapcor took effective control of Hellaby in January 2017.
6. Alison Laing commenced as Executive General Manager — Human Resources in May 2017.

66 BAPCOR
DIRECTORS’ REPORT continued
15.6 Statutory details of remunerationThe statutory remuneration disclosures for the year ended 30 June 2017 are detailed below under the following headings and are prepared in accordance with Australian Accounting Standards (AASBs).
15.6.1 Remuneration of KMP
15.6.2 Service agreements
15.6.3 NED remuneration
15.6.4 Share-based compensation
15.6.5 Equity instrument disclosures relating to KMP
15.6.6 Total shares under option or right to KMP
15.6.7 Loans to KMP

67 ANNUAL REPORT 2017
15.6.1 Remuneration of KMP
Short term benefits
Post employment
benefits
Long term
benefits
Share based
paymentsPercentage of remuneration
fixed and at risk
2017
Cash salary and fees5
$Bonus4
$
Non-monetary
$
Super-annuation
$
Long service
leave$
Equity settled
$Total
$Fixed
%
At risk — STI
%
At risk — LTI%
NED
Robert McEniry 260,384 — — 19,616 — — 280,000 100% — —
Andrew Harrison 126,700 — — 13,300 — — 140,000 100% — —
Therese Ryan 126,700 — — 13,300 — — 140,000 100% — —
Margaret Haseltine 123,080 — — 12,920 — — 136,000 100% — —
Executive Director
Darryl Abotomey 1,043,300 1,005,402 — 25,000 16,555 334,616 2,424,873 45% 41% 14%
Other KMP
Greg Fox 551,112 305,340 — 19,616 9,256 263,113 1,148,437 51% 26% 23%
Craig Magill 395,384 203,185 — 19,616 6,590 152,397 777,172 54% 26% 20%
Paul Dumbrell1 372,179 192,374 21,250 6,894 166,372 759,069 53% 25% 22%
Mathew Cooper 370,384 190,780 — 19,616 6,173 111,639 698,592 57% 27% 16%
Peter Tilley 360,175 99,216 — 21,250 5,310 109,405 595,356 65% 17% 18%
Grant Jarrett 352,083 93,294 — 21,250 5,469 111,185 583,281 65% 16% 19%
Colin Daly2 222,912 108,698 — 6,894 — — 338,504 68% 32% —
Alison Laing3 40,724 — — 4,275 4,173 — 49,172 100% — —
Total 4,345,117 2,198,289 — 217,903 60,420 1,248,727 8,070,456
2016 $ $ $ $ $ $ $ % % %
NED
Robert McEniry 170,000 — — 16,150 — — 186,150 100% — —
Andrew Harrison 97,800 — — 9,291 — — 107,091 100% — —
Therese Ryan 97,800 — — 9,291 — — 107,091 100% — —
Margaret Haseltine 6,780 — — 644 — — 7,424 100% — —
Executive Director
Darryl Abotomey 745,000 562,678 — 25,000 11,917 355,697 1,700,292 46% 33% 21%
Other KMP
Greg Fox 430,693 232,400 — 19,207 7,178 160,518 849,996 54% 27% 19%
Craig Magill 301,902 165,474 — 19,547 5,178 93,000 585,101 56% 28% 16%
Paul Dumbrell 368,716 159,775 — 17,743 5,852 77,194 629,280 62% 26% 12%
Mathew Cooper 292,656 140,070 — 17,442 5,011 50,728 505,907 62% 28% 10%
Peter Tilley 282,304 124,350 — 17,743 4,179 47,925 476,501 64% 26% 10%
Grant Jarrett 316,360 136,069 — 17,817 5,303 53,521 529,070 64% 26% 10%
Total 3,110,011 1,520,816 — 169,875 44,618 838,583 5,683,903
1. Paul Dumbrell took 6.8 weeks leave without pay during FY17.
2. Colin Daly is Chief Executive — Hellaby Automotive and has been included from when Bapcor took effective control of Hellaby in January 2017.
3. Alison Laing commenced as Executive General Manager — Human Resources in May 2017.
4. As per the prior year financial report, bonuses in relation to the sale of ANA in FY16 have been excluded from the above table.
5. Cash salary and fees includes accrued annual leave.

68 BAPCOR
DIRECTORS’ REPORT continued
15.6.2 Service agreements Remuneration and other terms of employment for KMP are formalised in service agreements. Details of these agreements are as follows.
Name Darryl Abotomey
Title Chief Executive Officer and Managing Director
Agreement commenced 21 April 2014
Term of agreement 5 years (to 30 April 2019)
Details Fixed annual remuneration was increased to $1,068,300 (inclusive of superannuation). This is adjusted annually. Fixed remuneration and incentives are based on independent advice from Godfrey Remuneration Group.
Bapcor or Darryl may terminate his employment contract by giving the other twelve months’ written notice before the proposed date of termination, or in Bapcor’s case, payment in lieu of notice. Bapcor may terminate Darryl’s employment immediately and without payment in lieu of notice in certain circumstances including for any serious misconduct. Darryl’s employment contract also includes a restraint of trade period of twelve months.
Other KMPEach of Bapcor’s executive KMP is employed under an individual employment agreement. The provisions of the employment agreements include:
Contract terms The commencement dates vary and all contracts are open ended.
Fixed annual remuneration Each executive’s contract specifies the FAR inclusive of superannuation, motor vehicle, non-cash benefits and FBT thereon. The amount for each executive is as set out earlier in this report.
Review of FAR The executives’ FAR is subject to annual review with no obligation on the company to make changes.
Variable pay Each executive is eligible to participate in the company’s incentive arrangements that can vary from time to time. The maximum STI opportunity is 60% of the executive’s FAR and the maximum LTI opportunity is between 40% and 50% of the executive’s FAR.
Notice period The executive KMP are subject to a three to six month notice period both by the company and by the executive.
Confidentiality Each contract includes provisions requiring the executive to maintain the confidentiality of company information.
Leave Each contract provides for leave entitlements, as a minimum, as per the National Employment Standard.
Restraint of trade Each contract includes restraint of trade provisions for a period after termination of employment.
As Alison Laing commenced employment in May 2017, she has not participated in STI or LTI opportunities for FY17, but will do so in future years. Colin Daly has participated for part of the FY17 year in the former Hellaby STI plan and will participate in the Bapcor LTI.

69 ANNUAL REPORT 2017
15.6.3 NED remuneration Fees and payments to NEDs reflect the demands and the responsibilities of the directors. NED fees and payments are reviewed annually by the NRC. The NRC seeks to set fees at a level that will attract and retain high calibre NEDs who have a diverse range of experience, skills and qualifications to enable effective oversight of management and the company. The NRC may, from time to time, receive advice from independent remuneration consultants to ensure NED fees and payments are competitive, appropriate and in line with the market.
The maximum aggregate fee pool of $1,000,000 was approved by shareholders at the AGM on 21 October 2016.
A review of NED remuneration was undertaken by the NRC in August 2016. The NRC engaged Godfrey Remuneration Group to undertake an independent benchmarking of NED fees. The review determined that the base board fees and committee fees were significantly below market levels for the workload commitments particularly given the company’s growth and complexity.
The following fee policy for the board and committees took effect from 1 July 2016.
NED typeBoard
$
Nomination & Remuneration Committee
$
Audit & Risk Management Committee
$
Chairman 280,000 20,000 20,000
Member 110,000 10,000 10,000
All fee amounts are inclusive of compulsory superannuation obligations.
Fees paid to NEDs in FY17 are set out in the following table. Fees are paid in cash and NEDs were not granted options or share rights in FY17. NEDs are not entitled to any payment on retirement or resignation from the Board. Directors may also be reimbursed for expenses properly incurred by the director in connection with the affairs of Bapcor including travel and other expenses whilst attending to company affairs.
An additional amount of $6,000 was paid to Margaret Haseltine for the additional workload required of her in respect of her role on the Board of the Hellaby Holdings Limited during its acquisition and while it remained a listed entity in New Zealand.
NEDFinancial
yearBoard fees
$Committee fees
$ Superannuation $Total
$
Robert McEniry 2017 258,646 — 18,949 277,595
2016 162,600 7,400 16,150 186,150
Andrew Harrison 2017 100,002 27,273 12,091 139,367
2016 85,000 12,800 9,291 107,091
Therese Ryan 2017 100,002 27,273 12,091 139,367
2016 85,000 12,800 9,291 107,091
Margaret Haseltine 2017 105,948 18,267 11,800 136,016
2016 5,997 783 644 7,424
Shares held by NEDsThe Board has a policy of encouraging directors to increase their holding of shares in the company so that over time it reaches a minimum level of one times the base board fees. The current shareholding interests of the NEDs is set out in section 15.6.5.

70 BAPCOR
DIRECTORS’ REPORT continued
15.6.4 Share-based compensation The following table outlines the details of the LTI grants outstanding for each executive KMP participant and other movements in options and performance rights in the year. As options will not vest if the performance conditions are not satisfied, the minimum value of the option yet to vest is nil. Fair value is calculated in accordance with Bapcor’s accounting policy as discussed in note 1 of the financial statements. There were no amounts paid and there were no amounts outstanding or due from KMP in relation to the grant of options during the year.
KMP Grant dateQuantity granted Vest date
Exercise price
$
Value at grant date1
$ Vested
%Quantity
vestedQuantity
remaining
Forfeited/ lapsed
%
Value expensed this year2
$
Darryl Abotomey 24/04/2014 70,071 30/06/2016 — 382,342 24% 70,071 — 0% 112,063
220,089 30/06/2017 220,089
24/12/2015 55,198 30/06/2017 — 574,449 0% — 55,198 0% 222,553
105,790 30/06/2018 105,790
Greg Fox 24/04/2014 31,778 30/06/2016 — 173,398 24% 31,778 — 0% 60,987
99,814 30/06/2017 99,814
24/12/2015 24,814 30/06/2017 — 258,243 0% — 24,814 0% 100,048
47,558 30/06/2018 47,558
20/12/2016 24,605 30/06/2018 — 307,393 0% — 24,605 0% 102,078
46,995 30/06/2019 46,995
Craig Magill 24/04/2014 18,114 30/06/2016 — 93,634 24% 18,114 — 0% 34,763
24/12/2015 56,894 30/06/2017 56,894
14,558 30/06/2017 — 151,505 0% — 14,558 0% 58,696
27,901 30/06/2018 27,901
20/12/2016 14,206 30/06/2018 — 177,485 0% — 14,206 0% 58,938
27,135 30/06/2019 27,135
Paul Dumbrell 24/12/2015 21,230 30/06/2017 — 220,940 0% — 21,230 0% 85,597
40,688 30/06/2018 40,688
20/12/2016 19,470 30/06/2018 — 243,244 0% — 19,470 0% 80,775
37,188 30/06/2019 37,188
Mathew Cooper 24/12/2015 13,951 30/06/2017 — 145,189 0% — 13,951 0% 56,249
26,738 30/06/2018 26,738
20/12/2016 13,351 30/06/2018 — 166,799 0% — 13,351 0% 55,390
25,501 30/06/2019 25,501
Peter Tilley 24/12/2015 13,180 30/06/2017 — 137,168 0% — 13,180 0% 54,015
25,261 30/06/2018 25,261
20/12/2016 13,351 30/06/2018 — 166,799 0% — 13,351 0% 55,390
25,501 30/06/2019 25,501
Grant Jarrett 24/12/2015 14,719 30/06/2017 — 153,186 0% — 14,719 0% 59,347
28,211 30/06/2018 28,211
20/12/2016 12,495 30/06/2018 — 156,102 0% — 12,495 0% 51,838
23,865 30/06/2019 23,865
Total 1,240,220 3,507,876 119,963 1,120,257 1,248,727
1. Value at grant date has been determined as the fair value of performance rights at grant.
2. Value expensed this year is the current years expense calculated by allocating the fair value (determined at grant), of the performance rights, over the relevant vesting period as required by the Accounting Standards.

71 ANNUAL REPORT 2017
15.6.5 Equity instrument disclosures relating to KMP The numbers of ordinary voting shares in the company held during the financial year by each director and other KMP, including their personally related parties, are set out below.
2017
Balance at start of the
yearReceived during
the yearRetail share
offerPurchase of
shares Sale of sharesBalance at the end of the year
Directors
Robert McEniry 40,294 — 2,869 — — 43,163
Andrew Harrison 44,000 — 2,869 10,000 — 56,869
Therese Ryan 32,976 — — — — 32,976
Margaret Haseltine — — 153 15,560 — 15,713
Darryl Abotomey 1,787,306 70,071 2,869 — — 1,860,246
Other KMP
Greg Fox 762,417 31,778 — — (200,000) 594,195
Craig Magill 809,246 18,114 — — — 827,360
Paul Dumbrell 2,817,313 — — — — 2,817,313
Mathew Cooper — — — 8,500 — 8,500
Peter Tilley — — — — — —
Grant Jarrett — — — — — —
Total 6,293,552 119,963 8,760 34,060 (200,000) 6,256,335
2016
Directors
Robert McEniry 27,473 — 12,821 — — 40,294
Andrew Harrison 30,000 — 14,000 — — 44,000
Therese Ryan 22,483 — 10,493 — — 32,976
Margaret Haseltine — — — — — —
Darryl Abotomey 1,559,526 — 727,780 — (500,000) 1,787,306
Other KMP
Greg Fox 656,193 — 306,223 — (199,999) 762,417
Craig Magill 1,078,714 — 503,400 — (772,868) 809,246
Paul Dumbrell1 — — — 4,695,525 (1,878,210) 2,817,313
Mathew Cooper — — — — — —
Peter Tilley — — — — — —
Grant Jarrett — — — — — —
Total 3,374,389 — 1,574,717 4,695,523 (3,351,077) 6,293,552
1. The issue of shares to Paul Dumbrell (via his related entities) in FY16 occurred as part of the ANA acquisition settlement.

72 BAPCOR
DIRECTORS’ REPORT continued
15.6.6 Total shares under option or right to KMP
Date granted Vest date Expiry dateExercise price
of rights Quantity
Performance rights plans
24/04/2014 30/06/2017 n/a $0.00 376,797
24/12/2015 30/06/2017 n/a $0.00 157,650
24/12/2015 30/06/2018 n/a $0.00 302,147
20/12/2016 30/06/2018 n/a $0.00 97,478
20/12/2016 30/06/2019 n/a $0.00 186,185
Total shares under option of right 1,120,257
15.6.7 Loans to executive KMP During FY16, loans were made to executive KMP (Darryl Abotomey, Greg Fox and Craig Magill) and some other executives to assist in the purchase of shares under the retail component of the Entitlements Offer in that year. These loans are secured by the underlying shares. The loans are interest bearing and are repayable on the earlier of sale of the underlying shares, termination of employment or 5 years from the date of the loan. Any remuneration in relation to over achievement of target STIs is to be applied to repay the outstanding loan balance. The total amount of loans made during FY16 to executive KMP was $3,050,000. Subsequent to the loans being made, there have been repayments of $1,696,000 and as at 30 June 2017, the outstanding balance on these loans to executive KMP is $1,354,000. There are no outstanding loans to the CEO.
16. Matters subsequent to the end of the financial yearOn 3 July 2017, Bapcor purchased Tricor Engineering ('Tricor') for a total of $2.4M of which $1.0M is deferred over the next two years. Tricor specialises in the supply and installation of lubrication equipment in the car dealership and heavy vehicle workshop market. The business will operate within the Precision Automotive Equipment business within the Trade segment.
Apart from the dividend declared as discussed above, no other matter or circumstance has arisen since 30 June 2017 that has significantly affected, or may significantly affect the consolidated entity’s operations, the results of those operations, or the consolidated entity’s state of affairs in future financial years.
17. Environmental regulationThe consolidated entity is not subject to any significant environmental regulation under Australian Commonwealth or State law.
18. Indemnity and insurance of officersDuring the financial year, the company paid a premium of $190,250 in respect of a contract to insure the directors and executives of the company against a liability for costs that may be incurred in defending civil or criminal proceedings that may be brought against the directors, in their capacity as a director, except where there is a lack of good faith.
19. Proceedings on behalf of the companyNo person has applied to the Court under section 237 of the Corporations Act 2001 for leave to bring proceedings on behalf of the company, or to intervene in any proceedings to which the company is a party for the purpose of taking responsibility on behalf of the company for all or part of those proceedings.
20. AuditorPricewaterhouseCoopers continues in office in accordance with section 327 of the Corporations Act 2001.

73 ANNUAL REPORT 2017
21. Remuneration of auditorsDetails of the amounts paid or payable to the auditor for audit and non-audit services provided during the financial year by the auditor are outlined in note 29 to the financial statements.
The directors are satisfied that the provision of non-audit services during the financial year, by the auditor (or by another person or firm on the auditor’s behalf), is compatible with the general standard of independence for auditors imposed by the Corporations Act 2001.
The directors are of the opinion that the services as disclosed in note 29 to the financial statements do not compromise the external auditor’s independence requirements of the Corporations Act 2001 for the following reasons:
• all non-audit services have been reviewed and approved to ensure that they do not impact the integrity and objectivity of the auditor; and
• none of the services undermine the general principles relating to auditor independence as set out in APES 110 Code of Ethics for Professional Accountants issued by the Accounting Professional and Ethical Standards Board, including reviewing or auditing the auditor’s own work, acting in a management or decision-making capacity for the company, acting as advocate for the company or jointly sharing economic risks and rewards.
22. Auditor’s independence declarationA copy of the auditor’s independence declaration as required under section 307C of the Corporations Act 2001 is set out on page 74 of the Directors’ Report.
23. Rounding of amountsThe company is of a kind referred to in Corporations Instrument 2016/191, issued by the Australian Securities and Investments Commission, relating to ‘rounding-off’. Amounts in this report have been rounded off in accordance with that Corporations Instrument to the nearest thousand dollars, or in certain cases, the nearest dollar.
This report is made in accordance with a resolution of directors, pursuant to section 298(2)(a) of the Corporations Act 2001.
On behalf of the directors
Robert McEniry Darryl AbotomeyChairman Chief Executive Officer and Managing Director
23 August 2017Melbourne

74 BAPCOR
AUDITOR’S INDEPENDENCE DECLARATION
PricewaterhouseCoopers, ABN 52 780 433 757 74 2 Riverside Quay, SOUTHBANK VIC 3006, GPO Box 1331, MELBOURNE VIC 3001 T: 61 3 8603 1000, F: 61 3 8603 1999, www.pwc.com.au
Liability limited by a scheme approved under Professional Standards Legislation.
Bapcor Limited Directors' report (continued)
30 June 2017
Auditor’s Independence Declaration
As lead auditor for the audit of Bapcor Limited for the year ended 30 June 2017, I declare that to the best of my knowledge and belief, there have been:
(a) no contraventions of the auditor independence requirements of the Corporations Act 2001 in relation to the audit; and
(b) no contraventions of any applicable code of professional conduct in relation to the audit.
This declaration is in respect of Bapcor Limited and the entities it controlled during the period.
Daniel Rosenberg Melbourne Partner 23 August 2017 PricewaterhouseCoopers

75 ANNUAL REPORT 2017
Consolidated statement of comprehensive income 76
Consolidated statement of financial position 78
Consolidated statement of changes in equity 79
Consolidated statement of cash flows 80
Notes to the consolidated financial statements 81
Directors’ declaration 130
Independent auditor’s report to the members of Bapcor Limited 131
Shareholder information 137
Corporate directory IBC
FINANCIAL STATEMENTSFOR THE YEAR ENDED 30 JUNE 2017
General informationThe financial statements cover Bapcor Limited as a consolidated entity consisting of Bapcor Limited and the entities it controlled at the end of, or during, the year. The financial statements are presented in Australian dollars, which is Bapcor Limited’s functional and presentation currency.
Bapcor Limited is a listed public company limited by shares, incorporated and domiciled in Australia. Its registered office and principal place of business is:
61 Gower Street, Preston VIC 3072 AUSTRALIA
A description of the nature of the consolidated entity’s operations and its principal activities are included in the Directors’ Report, which is not part of the financial statements.
The financial statements were authorised for issue, in accordance with a resolution of directors, on 23 August 2017. The directors have the power to amend and reissue the financial statements.

76 BAPCOR
CONSOLIDATED STATEMENT OF COMPREHENSIVE INCOME for the year ended 30 June 2017
Consolidated
Note2017
$’0002016
$’000
Revenue from continuing operations 1,013,553 685,629 Expenses
Cost of sales (552,683) (382,679)
Employee benefits expense (209,013) (132,714)
Freight (17,982) (11,470)
Advertising (23,773) (17,324)
Administration (42,026) (25,956)
Motor vehicles (9,113) (6,499)
IT & communications (10,441) (6,912)
Occupancy (37,027) (23,897)
Acquisition costs 5 (8,482) (1,149)
Depreciation and amortisation expense 5 (13,527) (10,055)
Finance costs 5 (9,766) (4,858)
Profit before income tax expense from continuing operations 79,720 62,116 Income tax expense 6 (25,988) (18,534)
Profit after income tax expense from continuing operations 53,732 43,582
Profit after income tax expense from discontinued operations 7 10,098 —
Profit after income tax expense for the year 63,830 43,582 Other comprehensive income
Items that may be reclassified to profit or loss
Foreign currency translation (891) —
Changes in the fair value of cash flow hedges (1,967) (1,256)
Other comprehensive income for the year, net of tax (2,858) (1,256)
Total comprehensive income for the year 60,972 42,326 Profit for the year is attributable to:
Non-controlling interest (214) —
Owners of Bapcor Limited 23 64,044 43,582
63,830 43,582 Total comprehensive income for the year is attributable to:
Non-controlling interest:
Continuing operations — —
Discontinued operations (244) —
Total non-controlling interest (244) —
Owners of Bapcor Limited:
Continuing operations 52,524 42,326
Discontinued operations 8,692 —
Total owners of Bapcor Limited 61,216 42,326
60,972 42,326
The above consolidated statement of comprehensive income should be read in conjunction with the accompanying notes.

77 ANNUAL REPORT 2017
Consolidated
Note2017
Cents2016
Cents
Earnings per share for profit from continuing operations attributable to the owners of Bapcor Limited
Basic earnings per share 40 19.93 17.89
Diluted earnings per share 40 19.83 17.82
Earnings per share for profit from discontinued operations attributable to the owners of Bapcor Limited
Basic earnings per share 40 3.75 —
Diluted earnings per share 40 3.73 —
Earnings per share for profit attributable to the owners of Bapcor Limited
Basic earnings per share 40 23.76 17.89
Diluted earnings per share 40 23.64 17.82
The above consolidated statement of comprehensive income should be read in conjunction with the accompanying notes.

78 BAPCOR
CONSOLIDATED STATEMENT OF FINANCIAL POSITION as at 30 June 2017
Consolidated
Note2017
$’0002016
$’000
Assets
Current assets
Cash and cash equivalents 8 39,755 22,392
Trade and other receivables 9 135,784 87,304
Inventories 10 261,627 163,020
Derivative financial instruments 27 40 —
Assets held for sale 11 178,860 —
Total current assets 616,066 272,716
Non-current assets
Trade and other receivables 12 296 573
Property, plant and equipment 13 49,781 36,213
Intangibles 14 647,831 362,207
Deferred tax asset 6 18,664 7,247
Other 15 4,061 4,466
Total non-current assets 720,633 410,706
Total assets 1,336,699 683,422 Liabilities
Current liabilities
Trade and other payables 16 174,768 121,507
Derivative financial instruments 27 1,780 420
Income tax 3,455 6,236
Provisions 17 32,131 26,607
Liabilities relating to assets held for sale 18 70,842 —
Total current liabilities 282,976 154,770
Non-current liabilities
Borrowings 19 429,747 148,184
Derivative financial instruments 27 637 1,374
Provisions 20 33,372 12,874
Total non-current liabilities 463,756 162,432
Total liabilities 746,732 317,202
Net assets 589,967 366,220 Equity
Issued capital 21 600,675 416,427
Reserves 22 (202) 845
Accumulated losses 23 (17,067) (51,052)
Equity attributable to the owners of Bapcor Limited 583,406 366,220
Non-controlling interest 24 6,561 —
Total equity 589,967 366,220
The above consolidated statement of financial position should be read in conjunction with the accompanying notes.

79 ANNUAL REPORT 2017
CONSOLIDATED STATEMENT OF CHANGES IN EQUITYfor the year ended 30 June 2017
Consolidated Note
Contributed equity $’000
Reserves $’000
Accumulated losses $’000
Total equity $’000
Balance at 1 July 2015 337,390 441 (70,906) 266,925
Profit after income tax expense for the year — — 43,582 43,582
Other comprehensive income for the year, net of tax — (1,256) — (1,256)
Total comprehensive income for the year — (1,256) 43,582 42,326
Transactions with owners in their capacity as owners:
Contributions of equity, net of transaction costs 22 79,037 — — 79,037
Share-based payments 21 — 1,660 — 1,660
Dividends paid 25 — — (23,728) (23,728)
Balance at 30 June 2016 416,427 845 (51,052) 366,220
Consolidated Note
Contributed equity $’000
Other $’000
Reserves $’000
Accumulated losses ’000
Non-controlling Interests
$’000Total equity
$’000
Balance at 1 July 2016 416,427 — 845 (51,052) — 366,220
Profit/(loss) after income tax expense for the year — — — 64,044 (214) 63,830
Other comprehensive income for the year, net of tax — — (2,828) — (30) (2,858)
Total comprehensive income for the year
— — (2,828) 64,044 (244) 60,972
Transactions with owners in their capacity as owners:
Contributions of equity, net of transaction costs
21186,144 — — — — 186,144
Non-controlling interests on acquisition
24— — — — 6,804 6,804
Share-based payments 22 — — 1,782 — — 1,782
Treasury shares 21 — (1,896) — — — (1,896)
Dividends paid 25 — — — (30,059) — (30,059)
Balance at 30 June 2017 602,571 (1,896) (201) (17,067) 6,560 589,967
The above consolidated statement of changes in equity should be read in conjunction with the accompanying notes.

80 BAPCOR
CONSOLIDATED STATEMENT OF CASH FLOWSfor the year ended 30 June 2017
Consolidated
Note2017
$’0002016
$’000
Cash flows from operating activities
Receipts from customers (inclusive of GST) 1,114,521 771,029
Payments to suppliers and employees (inclusive of GST) (994,123) (702,626)
120,398 68,403
Payments for new store initial inventory purchases (11,532) (6,150)
Borrowing costs (9,288) (3,957)
Transaction costs relating to acquisition of business (8,482) (1,029)
Income taxes paid (30,002) (18,004)
Net cash from operating activities 39 61,094 39,263
Cash flows from investing activities
Payment for purchase of business, net of cash and cash equivalents 35 (373,238) (289,012)
Payment for deferred settlements (6,511) —
Payments for property, plant and equipment 13 (15,096) (12,020)
Payments for intangibles 14 (1,120) (2,149)
Proceeds from disposal of property, plant and equipment 974 471
Net cash used in investing activities (394,991) (302,710)
Cash flows from financing activities
Proceeds from issue of shares 21 182,022 54,306
Share issue transaction costs 21 (4,596) (1,068)
Purchase of treasury shares 21 (1,896) —
Repayment of acquired loans via acquisition 35 (79,487) —
Net proceeds from borrowings 19 283,429 148,800
Dividends paid 25 (25,501) (23,728)
Borrowing transaction costs (2,618) (367)
Net cash from financing activities 351,353 177,943
Net increase/(decrease) in cash and cash equivalents 17,456 (85,504)
Cash and cash equivalents at the beginning of the financial year 22,392 107,896
Effects of exchange rate changes on cash and cash equivalents (93) —
Cash and cash equivalents at the end of the financial year 8 39,755 22,392
Note: the consolidated statement of cash flows represents the statement of cash flows of the continuing operations only. Discontinued operation's cash flows have been excluded as cash flow disclosures are not required for disposal groups that are classified as held for sale on acquisition in accordance with AASB 5 Non-current Assets Held for Sale and Discontinued Operations.
The above consolidated statement of cash flows should be read in conjunction with the accompanying notes.

81 ANNUAL REPORT 2017
NOTES TO THE CONSOLIDATED FINANCIAL STATEMENTSfor the year ended 30 June 2017
Note 1. Significant accounting policiesThe principal accounting policies adopted in the preparation of the financial statements are set out below. These policies have been consistently applied to all the years presented, unless otherwise stated.
New or amended Accounting Standards and Interpretations adoptedThe consolidated entity has adopted all of the new or amended Accounting Standards and Interpretations issued by the Australian Accounting Standards Board (‘AASB’) that are mandatory for the current reporting period.
Any new or amended Accounting Standards or Interpretations that are not yet mandatory have not been early adopted.
Basis of preparationThese general purpose financial statements have been prepared in accordance with Australian Accounting Standards and Interpretations issued by the AASB and the Corporations Act 2001, as appropriate for for-profit oriented entities. These financial statements also comply with International Financial Reporting Standards as issued by the International Accounting Standards Board (‘IASB’).
Historical cost conventionThe financial statements have been prepared under the historical cost convention, except for, where applicable, the revaluation of available-for-sale financial assets, financial assets and liabilities at fair value through profit or loss, investment properties, certain classes of property, plant and equipment and derivative financial instruments.
Critical accounting estimatesThe preparation of the financial statements requires the use of certain critical accounting estimates. It also requires management to exercise its judgement in the process of applying the consolidated entity’s accounting policies. The areas involving a higher degree of judgement or complexity, or areas where assumptions and estimates are significant to the financial statements, are disclosed in note 2.
Parent entity informationIn accordance with the Corporations Act 2001, these financial statements present the results of the consolidated entity only. Supplementary information about the parent entity is disclosed in note 34.
Principles of consolidationThe consolidated financial statements incorporate the assets and liabilities of all subsidiaries of Bapcor Limited (‘company’ or ‘parent entity’) as at 30 June 2017 and the results of all subsidiaries for the year then ended. Bapcor Limited and its subsidiaries together are referred to in these financial statements as the ‘consolidated entity’.
Subsidiaries are all those entities over which the consolidated entity has control. The consolidated entity controls an entity when the consolidated entity is exposed to, or has rights to, variable returns from its involvement with the entity and has the ability to affect those returns through its power to direct the activities of the entity. Subsidiaries are fully consolidated from the date on which control is transferred to the consolidated entity. They are de-consolidated from the date that control ceases.
Intercompany transactions, balances and unrealised gains on transactions between entities in the consolidated entity are eliminated. Unrealised losses are also eliminated unless the transaction provides evidence of the impairment of the asset transferred. Accounting policies of subsidiaries have been changed where necessary to ensure consistency with the policies adopted by the consolidated entity.
The acquisition of subsidiaries is accounted for using the acquisition method of accounting. A change in ownership interest, without the loss of control, is accounted for as an equity transaction, where the difference between the consideration transferred and the book value of the share of the non-controlling interest acquired is recognised directly in equity attributable to the parent.
Non-controlling interest in the results and equity of subsidiaries are shown separately in the statement of comprehensive income, statement of financial position and statement of changes in equity of the consolidated entity. Losses incurred by the consolidated entity are attributed to the non-controlling interest in full, even if that results in a deficit balance.
Where the consolidated entity loses control over a subsidiary, it derecognises the assets including goodwill, liabilities and non-controlling interest in the subsidiary together with any cumulative translation differences recognised in equity. The consolidated entity recognises the fair value of the consideration received and the fair value of any investment retained together with any gain or loss in profit or loss.
Operating segmentsOperating segments are presented using the ‘management approach’, where the information presented is on the same basis as the internal reports provided to the Chief Operating Decision Makers (‘CODM’). The CODM is responsible for the allocation of resources to operating segments and assessing their performance.
Foreign currency translationThe financial statements are presented in Australian dollars, which is Bapcor Limited’s functional and presentation currency.

82 BAPCOR
NOTES TO THE CONSOLIDATED FINANCIAL STATEMENTS continuedfor the year ended 30 June 2017
Note 1. Significant accounting policies (continued)
Transactions and balancesForeign currency transactions are translated into Australian dollars using the exchange rates prevailing at the dates of the transactions. Foreign exchange gains and losses resulting from the settlement of such transactions and from the translation at financial year-end exchange rates of monetary assets and liabilities denominated in foreign currencies are recognised in profit or loss, except when deferred in equity as qualifying cash flow hedges and qualifying net investment hedges.
Foreign operationsThe assets and liabilities of foreign operations are translated into Australian dollars using the exchange rates at the reporting date. The revenues and expenses of foreign operations are translated into Australian dollars using the average exchange rates, which approximate the rates at the dates of the transactions, for the period. All resulting foreign exchange differences are recognised in other comprehensive income through the foreign currency reserve in equity.
The foreign currency reserve is recognised in profit or loss when the foreign operation or net investment is disposed.
Goodwill and fair value adjustments arising on the acquisition Note 1. Significant accounting policies (continued) of a foreign operation are treated as assets and liabilities of the foreign operation and translated at the closing rate.
Revenue recognitionRevenue is measured at the fair value of the consideration received or receivable. Amounts disclosed as revenue are net of returns, trade allowances, rebates and amounts collected on behalf of third parties.
Revenue is recognised when the amount of revenue can be reliably measured, it is probable that future economic benefits will flow to the consolidated entity and specific criteria have been met for each of the revenue activities as described below. Where estimates are used, they are based on historical results, taking into consideration the type of customer, the type of transaction and the specifics of each arrangement.
Sale of goodsA sale is recorded when goods have been delivered to the customer, the customer has accepted the goods and collectability of the related receivables is probable.
Rendering of services - franchise and service feesRevenue from the provision of franchise and advertising services is recognised on an accruals basis.
Revenue from the provision of accounting and information technology support services is recognised on a periodical as-delivered basis.
Other revenueOther revenue is recognised when it is received or when the right to receive payment is established.
Income taxThe income tax expense or benefit for the period is the tax payable on that period’s taxable income based on the applicable income tax rate for each jurisdiction, adjusted by the changes in deferred tax assets and liabilities attributable to temporary differences, unused tax losses and the adjustment recognised for prior periods, where applicable.
Deferred tax assets and liabilities are recognised for temporary differences at the tax rates expected to be applied when the assets are recovered or liabilities are settled, based on those tax rates that are enacted or substantively enacted, except for:
• When the deferred income tax asset or liability arises from the initial recognition of goodwill or an asset or liability in a transaction that is not a business combination and that, at the time of the transaction, affects neither the accounting nor taxable profits; or
• When the taxable temporary difference is associated with interests in subsidiaries, associates or joint ventures, and the timing of the reversal can be controlled and it is probable that the temporary difference will not reverse in the foreseeable future.
Deferred tax assets are recognised for deductible temporary differences and unused tax losses only if it is probable that future taxable amounts will be available to utilise those temporary differences and losses.
The carrying amount of recognised and unrecognised deferred tax assets are reviewed at each reporting date. Deferred tax assets recognised are reduced to the extent that it is no longer probable that future taxable profits will be available for the carrying amount to be recovered. Previously unrecognised deferred tax assets are recognised to the extent that it is probable that there are future taxable profits available to recover the asset.
Deferred tax assets and liabilities are offset only where there is a legally enforceable right to offset current tax assets against current tax liabilities and deferred tax assets against deferred tax liabilities; and they relate to the same taxable authority on either the same taxable entity or different taxable entities which intend to settle simultaneously.

83 ANNUAL REPORT 2017
Discontinued operationsA discontinued operation is a component of the consolidated entity that has been disposed of or is classified as held for sale and that represents a separate major line of business or geographical area of operations, is part of a single co-ordinated plan to dispose of such a line of business or area of operations, or is a subsidiary acquired exclusively with a view to resale. The results of discontinued operations are presented separately on the face of the statement of comprehensive income.
Discontinued operations adhere to the accounting policies of the consolidated entity except for the following specific recognition and measurement policies only relating to the discontinued operations:
Revenue recognition and measurement:Sale of services and unbilled revenue (specific to the Resource Services discontinued operation):
Where services are charged on the basis of actual time and materials incurred, revenue is recognised as costs are incurred. Revenue is generally calculated based on contractual billing rates for the services performed. To the extent that services rendered have not been invoiced at balance date but are billable under agreed contractual terms, an amount is recorded as unbilled revenue in the balance sheet as part of assets held for sale.
Where services are under a fixed price arrangement then the percentage-of-completion method of contract accounting is applied. When the outcome of fixed price contracts can be measured reliably, revenue is recognised based on the proportion of work performed to date relative to the estimated total contract costs. When the outcome of fixed price contracts cannot be measured reliably, revenue is recognised only to the extent of the expenses incurred under the contract that are expected to be recoverable. If these services have not been invoiced at balance date but are billable, an amount is recorded as unbilled revenue in the balance sheet as part of assets held for sale.
Current and non-current classificationAssets and liabilities are presented in the statement of financial position based on current and non-current classification.
An asset is classified as current when: it is either expected to be realised or intended to be sold or consumed in the consolidated entity’s normal operating cycle; it is held primarily for the purpose of trading; it is expected to be realised within twelve months after the reporting period; or the asset is cash or cash equivalent unless restricted from being exchanged or used to settle a liability for at least twelve months after the reporting period. All other assets are classified as non-current.
A liability is classified as current when: it is either expected to be settled in the consolidated entity’s normal operating cycle; it is held primarily for the purpose of trading; it is due to be settled within twelve months after the reporting period; or there is no unconditional right to defer the settlement of the liability for at least twelve months after the reporting period. All other liabilities are classified as non-current.
Deferred tax assets and liabilities are always classified as non-current.
Cash and cash equivalentsCash and cash equivalents includes cash on hand, deposits held at call with financial institutions, other short-term, highly liquid investments with original maturities of three months or less that are readily convertible to known amounts of cash and which are subject to an insignificant risk of changes in value.
Trade and other receivablesTrade receivables are initially recognised at fair value and subsequently measured at amortised cost using the effective interest method, less any provision for impairment. Trade receivables are generally due for settlement within 30 to 60 days.
Collectability of trade receivables is reviewed on an ongoing basis. Debts which are known to be uncollectable are written off by reducing the carrying amount directly. A provision for impairment of trade receivables is raised when there is objective evidence that the consolidated entity will not be able to collect all amounts due according to the original terms of the receivables. Significant financial difficulties of the debtor, probability that the debtor will enter bankruptcy or financial reorganisation and default or delinquency in payments (more than 60 days overdue) are considered indicators that the trade receivable may be impaired. The amount of the impairment allowance is the difference between the asset’s carrying amount and the present value of estimated future cash flows, discounted at the original effective interest rate. Cash flows relating to short-term receivables are not discounted if the effect of discounting is immaterial.
Other receivables are recognised at amortised cost, less any provision for impairment.
InventoriesStock in transit is stated at the lower of cost and net realisable value. Cost comprises of purchase and delivery costs, net of rebates and discounts received or receivable.
Stock on hand is stated at the lower of cost and net realisable value. Cost comprises of purchase and delivery costs, net of rebates and discounts received or receivable.
Net realisable value is the estimated selling price in the ordinary course of business less the estimated costs of completion and the estimated costs necessary to make the sale.

84 BAPCOR
NOTES TO THE CONSOLIDATED FINANCIAL STATEMENTS continuedfor the year ended 30 June 2017
Note 1. Significant accounting policies (continued)
Derivative financial instrumentsDerivatives are initially recognised at fair value on the date a derivative contract is entered into and are subsequently remeasured to their fair value at each reporting date. The accounting for subsequent changes in fair value depends on whether the derivative is designated as a hedging instrument, and if so, the nature of the item being hedged.
Derivatives are classified as current or non-current depending on the expected period of realisation.
Cash flow hedgesCash flow hedges are used to cover the consolidated entity’s exposure to variability in cash flows that is attributable to particular risks associated with a recognised asset or liability or a firm commitment which could affect profit or loss. The effective portion of the gain or loss on the hedging instrument is recognised in other comprehensive income through the cash flow hedges reserve in equity, whilst the ineffective portion is recognised in profit or loss. Amounts taken to equity are transferred out of equity and included in the measurement of the hedged transaction when the forecast transaction occurs.
Cash flow hedges are tested for effectiveness on a regular basis both retrospectively and prospectively to ensure that each hedge is highly effective and continues to be designated as a cash flow hedge. If the forecast transaction is no longer expected to occur, the amounts recognised in equity are transferred to profit or loss.
If the hedging instrument is sold, terminated, expires, exercised without replacement or rollover, or if the hedge becomes ineffective and is no longer a designated hedge, the amounts previously recognised in equity remain in equity until the forecast transaction occurs.
Hedges of a net investmentHedges of a net investment in a foreign operation include monetary items that are considered part of the net investment. Gains or losses on the hedging instrument relating to the effective portion of the hedge are recognised directly in equity whilst gains or losses relating to the ineffective portion are recognised in profit or loss. On disposal of the foreign operation, the cumulative value of any such gains or losses recognised directly in equity is transferred to profit or loss.
Plant and equipmentPlant and equipment is stated at historical cost less accumulated depreciation and impairment. Historical cost includes expenditure that is directly attributable to the acquisition of the items.
Subsequent costs are included in the asset’s carrying amount or recognised as a separate asset, as appropriate, only when it is probable that future economic benefits associated with the item will flow to the consolidated entity and the cost of the item can be measured reliably. The carrying amount of any component accounted for as a separate asset is derecognised when replaced. All other repairs and maintenance are charged to profit or loss during the reporting period in which they are incurred.
Depreciation is calculated on a straight-line basis to write off the net cost of each item of plant and equipment over their expected useful lives as follows:
Plant and equipment 2-15 yearsMotor vehicles 3-7 years
The residual values, useful lives and depreciation methods are reviewed, and adjusted if appropriate, at each reporting date.
An item of plant and equipment is derecognised upon disposal or when there is no future economic benefit to the consolidated entity. Gains and losses between the carrying amount and the disposal proceeds are taken to profit or loss. Any revaluation surplus reserve relating to the item disposed of is transferred directly to retained profits.
LeasesThe determination of whether an arrangement is or contains a lease is based on the substance of the arrangement and requires an assessment of whether the fulfilment of the arrangement is dependent on the use of a specific asset or assets and the arrangement conveys a right to use the asset.
A distinction is made between finance leases, which effectively transfer from the lessor to the lessee substantially all the risks and benefits incidental to the ownership of leased assets, and operating leases, under which the lessor effectively retains substantially all such risks and benefits.
Finance leases are capitalised. A lease asset and liability are established at the fair value of the leased assets, or if lower, the present value of minimum lease payments. Lease payments are allocated between the principal component of the lease liability and the finance costs, so as to achieve a constant rate of interest on the remaining balance of the liability.
Leased assets acquired under a finance lease are depreciated over the asset’s useful life or over the shorter of the asset’s useful life and the lease term if there is no reasonable certainty that the consolidated entity will obtain ownership at the end of the lease term.
Operating lease payments, net of any incentives received from the lessor, are charged to profit or loss on a straight-line basis over the term of the lease.

85 ANNUAL REPORT 2017
Intangible assetsIntangible assets acquired as part of a business combination, other than goodwill, are initially measured at their fair value at the date of the acquisition. Intangible assets acquired separately are initially recognised at cost. Indefinite life intangible assets are not amortised and are subsequently measured at cost less any impairment. Finite life intangible assets are subsequently measured at cost less amortisation and any impairment. The gains or losses recognised in profit or loss arising from the derecognition of intangible assets are measured as the difference between net disposal proceeds and the carrying amount of the intangible asset. The method and useful lives of finite life intangible assets are reviewed annually. Changes in the expected pattern of consumption or useful life are accounted for prospectively by changing the amortisation method or period.
GoodwillGoodwill arises on the acquisition of a business. Goodwill is not amortised. Instead, goodwill is tested annually for impairment, or more frequently if events or changes in circumstances indicate that it might be impaired, and is carried at cost less accumulated impairment losses. Impairment losses on goodwill are taken to profit or loss and are not subsequently reversed.
Brands and trademarksBrands and trademarks are recognised as intangible assets where a registered trademark is acquired with attributable value. They are valued using a relief from royalty method and are considered indefinite life intangibles and are not amortised unless there is an intention to discontinue their use in which it is amortised over the estimated remaining useful life.
Customer contractsCustomer contracts acquired in a business combination are amortised on a straight-line basis over the period of their expected benefit, being their finite life which is currently between 10 and 20 years.
SoftwareCosts incurred in acquiring, developing, and implementing new software are recognised as intangible assets only when it is probable that future economic benefits associated with the item will flow to the consolidated entity and the cost of the item can be measured reliably. The expenditure capitalised comprises all directly attributable costs, including costs of materials, services, licenses and direct labour. Software is amortised on a straight-line basis over the period of their expected benefit, being their finite life which is currently between 2 and 4 years.
Impairment of assetsGoodwill and other intangible assets that have an indefinite useful life are not subject to amortisation and are tested annually for impairment, or more frequently if events or changes in circumstances indicate that they might be impaired. Other assets are reviewed for impairment whenever events or changes in circumstances indicate that the carrying amount may not be recoverable. An impairment loss is recognised for the amount by which the asset’s carrying amount exceeds its recoverable amount.
Recoverable amount is the higher of an asset’s fair value less costs of disposal and value-in-use. The value-in-use is the present value of the estimated future cash flows relating to the asset using a pre-tax discount rate specific to the asset or cash-generating unit to which the asset belongs. Assets that do not have independent cash flows are grouped together to form a cash-generating unit.
Trade and other payablesThese amounts represent liabilities for goods and services provided to the consolidated entity prior to the end of the financial year and which are unpaid. Due to their short-term nature they are measured at amortised cost and are not discounted. The amounts are unsecured and are usually paid within 30 to 90 days of recognition.
BorrowingsLoans and borrowings are initially recognised at the fair value of the consideration received, net of transaction costs. They are subsequently measured at amortised cost using the effective interest method.
Where there is an unconditional right to defer settlement of the liability for at least twelve months after the reporting date, the loans or borrowings are classified as non-current.
Fees paid on the establishment of loan facilities are recognised as transaction costs of the loan to the extent that it is probable that some or all of the facility will be drawn down. In this case, the fee is deferred until the draw down occurs. To the extent there is no evidence that it is probable that some or all of the facility will be drawn down, the fee is amortised on a straight-line basis over the term of the facility.
ProvisionsProvisions are recognised when the consolidated entity has a present (legal or constructive) obligation as a result of a past event, it is probable the consolidated entity will be required to settle the obligation, and a reliable estimate can be made of the amount of the obligation. The amount recognised as a provision is the best estimate of the consideration required to settle the present obligation at the reporting date, taking into account the risks and uncertainties surrounding the obligation. If the time value of money is material, provisions are discounted using a current pre-tax rate specific to the liability. The increase in the provision resulting from the passage of time is recognised as a finance cost.

86 BAPCOR
NOTES TO THE CONSOLIDATED FINANCIAL STATEMENTS continuedfor the year ended 30 June 2017
Note 1. Significant accounting policies (continued)
Employee benefits
Short-term employee benefits Liabilities for wages and salaries, including non-monetary benefits, annual leave and long service leave expected to be settled wholly within twelve months of the reporting date are measured at the amounts expected to be paid when the liabilities are settled.
Long-term employee benefitsThe liability for annual leave and long service leave not expected to be settled within twelve months of the reporting date are measured at the present value of expected future payments to be made in respect of services provided by employees up to the reporting date using the projected unit credit method. Consideration is given to expected future wage and salary levels, experience of employee departures and periods of service. Expected future payments are discounted using market yields at the reporting date on corporate bonds with terms to maturity and currency that match, as closely as possible, the estimated future cash outflows.
Share-based paymentsShare-based compensation benefits are provided to employees via the Long-Term Incentive ('LTI') plan. The fair value of performance rights granted under the LTI is recognised as an employee benefit expense over the period during which the employees become unconditionally entitled to the rights and options with a corresponding increase in equity.
The total amount to be expensed is determined by reference to the fair value of the rights and options granted, which includes any market performance conditions and the impact of any non-vesting conditions but excludes the impact of any service and non-market performance vesting conditions. Non-market vesting conditions are included in assumptions about the number of options that are expected to vest which are revised at the end of each reporting period. The impact of the revision to original estimates, if any, is recognised in profit or loss, with a corresponding adjustment to equity.
The fair value is measured at grant date and the expense recognised over the life of the plan. The fair value is independently determined using a Black-Scholes or similar option pricing model that takes into account the exercise price, the term of the option, the impact of dilution, the share price at grant date and expected price volatility of the underlying share, the expected dividend yield and the risk-free interest rate for the term of the option.
Fair value measurementWhen an asset or liability, financial or non-financial, is measured at fair value for recognition or disclosure purposes, the fair value is based on the price that would be received to sell an asset or paid to transfer a liability in an orderly transaction between market participants at the measurement date; and assumes that the transaction will take place either: in the principal market; or in the absence of a principal market, in the most advantageous market.
Fair value is measured using the assumptions that market participants would use when pricing the asset or liability, assuming they act in their economic best interests. For non-financial assets, the fair value measurement is based on its highest and best use. Valuation techniques that are appropriate in the circumstances and for which sufficient data are available to measure fair value, are used, maximising the use of relevant observable inputs and minimising the use of unobservable inputs.
Assets and liabilities measured at fair value are classified, into three levels, using a fair value hierarchy that reflects the significance of the inputs used in making the measurements. Classifications are reviewed at each reporting date and transfers between levels are determined based on a reassessment of the lowest level of input that is significant to the fair value measurement.
For recurring and non-recurring fair value measurements, external valuers may be used when internal expertise is either not available or when the valuation is deemed to be significant. External valuers are selected based on market knowledge and reputation. Where there is a significant change in fair value of an asset or liability from one period to another, an analysis is undertaken, which includes a verification of the major inputs applied in the latest valuation and a comparison, where applicable, with external sources of data.
Issued capitalOrdinary shares are classified as equity.
Incremental costs directly attributable to the issue of new shares or options are shown in equity as a deduction, net of tax, from the proceeds.

87 ANNUAL REPORT 2017
DividendsDividends are recognised when declared during the financial year and no longer at the discretion of the company.
Business combinationsThe acquisition method of accounting is used to account for all business combinations, regardless of whether equity instruments or other assets are acquired. The consideration transferred for the acquisition of a subsidiary comprises the fair values of the assets transferred, the liabilities incurred and the equity interests issued. The consideration transferred also includes the fair value of any asset or liability resulting from a contingent consideration arrangement and the fair value of any pre-existing equity interest in the subsidiary.
Acquisition-related costs are expensed as incurred. Identifiable assets acquired and liabilities and contingent liabilities assumed in a business combination are, with limited exceptions, measured initially at their fair values at the acquisition-date. On an acquisition-by-acquisition basis, any non-controlling interest in the acquiree is recognised either at fair value or at the non-controlling interest’s proportionate share of the acquiree’s net identifiable assets.
Business combinations (continued)The excess of the consideration transferred and the amount of any non-controlling interest in the acquiree over the fair value of the net identifiable assets acquired is recorded as goodwill. If those amounts are less than the fair value of the net identifiable assets of the subsidiary acquired and the measurement of all amounts has been reviewed, the difference is recognised directly in profit or loss as a bargain purchase.
Where settlement of any part of cash consideration is deferred, the amounts payable in the future are discounted to their present value as at the date of exchange. The discount rate used is the entity’s incremental borrowing rate, being the rate at which a similar borrowing could be obtained from an independent financier under comparable terms and conditions.
Contingent consideration is classified either as equity or a financial liability. Amounts classified as a financial liability are subsequently remeasured to fair value with changes in fair value recognised in profit or loss.
Earnings per share
Basic earnings per shareBasic earnings per share is calculated by dividing the profit attributable to the owners of Bapcor Limited, excluding any costs of servicing equity other than ordinary shares, by the weighted average number of ordinary shares outstanding during the financial year, adjusted for bonus elements in ordinary shares issued during the financial year and excluding treasury shares.
Diluted earnings per shareDiluted earnings per share adjusts the figures used in the determination of basic earnings per share to take into account the after income tax effect of interest and other financing costs associated with dilutive potential ordinary shares and the weighted average number of shares assumed to have been issued for no consideration in relation to dilutive potential ordinary shares.
Goods and Services Tax (‘GST’) and other similar taxesRevenues, expenses and assets are recognised net of the amount of associated GST, unless the GST incurred is not recoverable from the tax authority. In this case it is recognised as part of the cost of the acquisition of the asset or as part of the expense.
Receivables and payables are stated inclusive of the amount of GST receivable or payable. The net amount of GST recoverable from, or payable to, the tax authority is included in other receivables or other payables in the statement of financial position.
Cash flows are presented on a gross basis. The GST components of cash flows arising from investing or financing activities which are recoverable from, or payable to the tax authority, are presented as operating cash flows.
Rounding of amountsThe company is of a kind referred to in Corporations Instrument 2016/191, issued by the Australian Securities and Investments Commission, relating to ‘rounding-off’. Amounts in this report have been rounded off in accordance with that Corporations Instrument to the nearest thousand dollars, or in certain cases, the nearest dollar.
New Accounting Standards and Interpretations not yet mandatory or early adoptedAustralian Accounting Standards and Interpretations that have recently been issued or amended but are not yet mandatory, have not been early adopted by the consolidated entity for the annual reporting period ended 30 June 2017. The consolidated entity’s assessment of the impact of these new or amended Accounting Standards and Interpretations, most relevant to the consolidated entity, are set out below.

88 BAPCOR
NOTES TO THE CONSOLIDATED FINANCIAL STATEMENTS continuedfor the year ended 30 June 2017
Note 1. Significant accounting policies (continued)
AASB 9 Financial InstrumentsThis standard is applicable to annual reporting periods beginning on or after 1 January 2018. The standard replaces all previous versions of AASB 9 and completes the project to replace IAS 39 Financial Instruments: Recognition and Measurement. AASB 9 introduces new classification and measurement models for financial assets. A financial asset shall be measured at amortised cost, if it is held within a business model whose objective is to hold assets in order to collect contractual cash flows, which arise on specified dates and are solely repayable of principal and interest. All other financial instrument assets are to be classified and measured at fair value through profit or loss unless the entity makes an irrevocable election on initial recognition to present gains and losses on equity instruments (that are not held-for-trading) in other comprehensive income (‘OCI’). For financial liabilities, the standard requires the portion of the change in fair value that relates to the entity’s own credit risk to be presented in OCI (unless it would create an accounting mismatch). New simpler hedge accounting requirements are intended to more closely align the accounting treatment with the risk management activities of the entity. New impairment requirements will use an ‘expected credit loss’ (‘ECL’) model to recognise an allowance. Impairment will be measured under a 12-month ECL method unless the credit risk on a financial instrument has increased significantly since initial recognition in which case the lifetime ECL method is adopted. The standard introduces additional new disclosures. The consolidated entity will adopt this standard from 1 January 2018. The consolidated entity is still assessing the impact of its adoption but do not expect it to be material.
AASB 15 Revenue from Contracts with CustomersThis standard is applicable to annual reporting periods beginning on or after 1 January 2018. The standard provides a single standard for revenue recognition. The core principle of the standard is that an entity will recognise revenue to depict the transfer of promised goods or services to customers in an amount that reflects the consideration to which the entity expects to be entitled in exchange for those goods or services. The standard will require: contracts (either written, verbal or implied) to be identified, together with the separate performance obligations within the contract; determine the transaction price, adjusted for the time value of money; allocation of the transaction price to the separate performance obligations on a basis of relative stand-alone selling price of each distinct good or service and recognition of revenue when each performance obligation is satisfied. Credit risk will be presented separately as an expense rather than adjusted to revenue. For goods, the performance obligation would be satisfied when the customer obtains control of the goods. For services, the performance obligation is satisfied when the service has been provided. For performance obligations satisfied over time, an entity would select an appropriate measure of progress to determine how much revenue should be recognised as the performance obligation is satisfied. Contracts with customers will be presented in an entity’s statement of financial position as a contract liability, a contract asset, or a receivable, depending on the relationship between the entity’s performance and the customer’s payment. Sufficient quantitative and qualitative disclosure is required to enable users to understand the contracts with customers; the significant judgements made in applying the guidance to those contracts; and any assets recognised from the costs to obtain or fulfil a contract with a customer.
The consolidated entity will adopt this standard from 1 January 2018 and has commenced obtaining and tracking information in relation to the quantification of this change on its different revenue streams but the impact of its adoption is yet to be completed by the consolidated entity.
AASB 16 LeasesThis standard is applicable to annual reporting periods beginning on or after 1 January 2019. The standard replaces AASB 117 Leases and for lessees will eliminate the classifications of operating leases and finance leases. Subject to exceptions, a ‘right-of-use’ asset will be capitalised in the statement of financial position, measured at the present value of the unavoidable future lease payments to be made over the lease term. The exceptions relate to short-term leases of twelve months or less and leases of low-value assets (such as personal computers and small office furniture) where an accounting policy choice exists whereby either a ‘right-of-use’ asset is recognised or lease payments are expensed to profit or loss as incurred. A liability corresponding to the capitalised lease will also be recognised, adjusted for lease prepayments, lease incentives received, initial direct costs incurred and an estimate of any future restoration, removal or dismantling costs. Straight-line operating lease expense recognition will be replaced with a depreciation charge for the leased asset (included in operating costs) and an interest expense on the recognised lease liability (included in finance costs). In the earlier periods of the lease, the expenses associated with the lease under AASB 16 will be higher when compared to lease expenses under AASB 117. However EBITDA (Earnings Before Interest, Tax, Depreciation and Amortisation) results will be improved as the operating expense is replaced by interest expense and depreciation in profit or loss under AASB 16. For classification within the statement of cash flows, the lease payments will be separated into both a principal (financing activities) and interest (either operating or financing activities) component. For lessor accounting, the standard does not substantially change how a lessor accounts for leases.
The consolidated entity will adopt this standard from 1 July 2019 and has commenced obtaining and tracking information in relation to the quantification of this change. Given the number of operating leases in relation to warehouse and stores that the consolidated entity has in place, it is expected that this change will have a material impact on the balance sheet in particular via the recognition of the respective right-of-use asset and corresponding liability. The consolidated entity will continue to assess the quantification of this change and the impact of its adoption.

89 ANNUAL REPORT 2017
Note 2. Critical accounting judgements, estimates and assumptionsThe preparation of the financial statements requires management to make judgements, estimates and assumptions that affect the reported amounts in the financial statements. Management continually evaluates its judgements and estimates in relation to assets, liabilities, contingent liabilities, revenue and expenses. Management bases its judgements, estimates and assumptions on historical experience and on other various factors, including expectations of future events, management believes to be reasonable under the circumstances. The resulting accounting judgements and estimates will seldom equal the related actual results. The judgements, estimates and assumptions that have a significant risk of causing a material adjustment to the carrying amounts of assets and liabilities (refer to the respective notes) within the next financial year are discussed below.
Share-based payment transactionsThe consolidated entity measures the cost of equity-settled transactions with employees by reference to the fair value of the equity instruments at the date at which they are granted. The fair value is determined by using either the Binomial or Black-Scholes model taking into account the terms and conditions upon which the instruments were granted. The accounting estimates and assumptions relating to equity-settled share-based payments would have no impact on the carrying amounts of assets and liabilities within the next annual reporting period but may impact profit or loss and equity. Refer to note 41.
Provision for impairment of receivablesThe provision for impairment of receivables assessment requires a degree of estimation and judgement. The level of provision is assessed by taking into account the ageing of receivables, historical collection rates and specific knowledge of the individual debtor’s financial position. Refer to notes 9 and 12.
Provision for slow moving inventoryThe provision for slow moving inventory assessment requires a degree of estimation and judgement. The level of the provision is assessed by taking into account the recent sales experience, the ageing of inventories and other factors that affect inventory obsolescence. Refer to note 10.
Estimation of useful lives of assetsThe consolidated entity determines the estimated useful lives and related depreciation and amortisation charges for its property, plant and equipment and finite life intangible assets. The useful lives could change significantly as a result of technical innovations or some other event. The depreciation and amortisation charge will increase where the useful lives are less than previously estimated lives, or technically obsolete or non-strategic assets that have been abandoned or sold will be written off or written down. Refer to notes 13 and 14.
Goodwill and other indefinite life intangible assetsThe consolidated entity tests annually, or more frequently if events or changes in circumstances indicate impairment, whether goodwill and other indefinite life intangible assets have suffered any impairment, in accordance with the accounting policy stated in note 1. The recoverable amounts of cash-generating units have been determined based on value-in-use calculations. These calculations require the use of assumptions, including estimated discount rates based on the current cost of capital and growth rates of the estimated future cash flows. Refer to note 14.
Deferred considerationThe deferred consideration liability is the difference between the total purchase consideration, usually on an acquisition of a business combination, and the amounts paid or settled up to the reporting date, discounted to net present value. The consolidated entity applies provisional accounting for any business combination. Any reassessment of the liability during the provisional period is adjusted for retrospectively as part of the fair value of consideration. Thereafter, at each reporting date, the deferred consideration liability is reassessed against revised estimates and any increase or decrease in the net present value of the liability will result in a corresponding gain or loss to profit or loss. The increase in the liability resulting from the passage of time is recognised as a finance cost. Refer to notes 17 and 20.
Business combinationsAs discussed in note 1, business combinations are initially accounted for on a provisional basis. The fair value of assets acquired, liabilities and contingent liabilities assumed are initially estimated by the consolidated entity taking into consideration all available information at the reporting date. Fair value adjustments on the finalisation of the business combination accounting is retrospective, where applicable, to the period the combination occurred and may have an impact on the assets and liabilities, depreciation and amortisation reported. Refer to note 35.

90 BAPCOR
NOTES TO THE CONSOLIDATED FINANCIAL STATEMENTS continuedfor the year ended 30 June 2017
Note 3. Restatement of comparatives
Change in accounting policyIn November 2016, the IFRS Interpretations Committee ('IFRIC') provided clarification on the recognition of deferred tax liabilities on intangible assets with an indefinite useful lives. The guidance determined that indefinite does not mean unlimited or infinite, but is only used because the amortisation period is arbitrary due to the fact that the end of the life is not known. The IFRIC noted that non-amortisation did not necessarily mean that the entity will recover the carrying amount of that asset only through sale and not through use. Based on this clarification, the company has elected to change its accounting policy and recognise deferred tax liabilities on its intangible assets with indefinite useful lives on the basis that recovery is through use. The adjustment has been made retrospectively.
The impact of this change to the prior year statement of financial position was an increase to both deferred tax liability and goodwill of $13,367,000.
ReclassificationsThe financial statements contain reclassifications of prior year disclosures to ensure comparability with the current year presentation.
Note 4. Operating segments
Description of segmentsThe consolidated entity has identified four operating segments based on the internal reports that are reviewed and used by the Board of Directors (who are identified as the Chief Operating Decision Makers (‘CODM’)) in assessing performance and in determining the allocation of resources including capital allocations.
The operating results of the consolidated entity are currently reviewed by the CODM and decisions are based on four operating segments which also represent the four reporting segments, as follows:
Trade Represents the trade focused automotive aftermarket parts distribution to independent and chain mechanic workshops. Includes the operations of Burson Auto Parts and Precision Automotive Equipment.
Retail & Service Represents the retail focused accessory stores that are positioned as the first choice destination for both the everyday consumer and automotive enthusiast as well as the service areas of Bapcor. Includes the operations of Autobarn, Autopro, Sprint Auto Parts, Midas and ABS.
Specialist Wholesale Includes the specialised wholesale distribution areas of the organisation that focus on a specific automotive area. Includes the operations of AAD, Baxters, Bearing Wholesalers, MTQ Engine Systems and Roadsafe.
Hellaby Automotive Represents the recently acquired Hellaby business including the operations of Brake & Transmission, Autolign, Diesel Distributors, Federal Batteries, HCB Technologies, JAS Oceania, Premier Auto Trade, and TRS Tyre & Wheel.
There is likely to be changes in reportable segments in the near future as the Hellaby businesses become integrated into the consolidated entity.
Segment revenueIntersegment transactions are carried out at arm’s length and eliminated on consolidation. The revenue from external parties reported to the CODM is measured in a manner consistent with that in the statement of comprehensive income.
Segment EBITDASegment performance is assessed on the basis of segment EBITDA. Segment EBITDA comprises expenses which are incurred in the normal trading activity of the segments and excludes the impact of depreciation, amortisation, interest, share-based payments and other items which are determined to be outside of the control of the respective segments.

91 ANNUAL REPORT 2017
Operating segment information
Consolidated — 2017Trade
$’000
Retail & Service $’000
Specialist Wholesale
$’000
Hellaby Automotive
$’000
Unallocated/Head Office
$’000Total
$’000
Revenue
Sales 465,102 220,996 212,715 146,670 — 1,045,483
Total segment revenue 465,102 220,996 212,715 146,670 — 1,045,483
Intersegment sales (31,930)
Discontinued operations (note 7) 196,603
Total revenue 1,210,156
EBITDA 63,296 28,190 22,948 15,057 (12,397) 117,094
Intersegment EBITDA (5,599)
Depreciation and amortisation (13,527)
Finance costs (9,766)
Acquisition costs (8,482)
Discontinued operations (note 7) 15,135
Profit before income tax expense 94,855
Income tax expense (31,025)
Profit after income tax expense 63,830
Assets
Segment assets 280,947 274,241 196,610 358,191 47,850 1,157,839
Held for sale assets (note 11) 178,860
Total assets 1,336,699
Liabilities
Segment liabilities 91,273 37,549 30,493 44,794 471,781 675,890
Held for sale liabilities (note 18) 70,842
Total liabilities 746,732

92 BAPCOR
NOTES TO THE CONSOLIDATED FINANCIAL STATEMENTS continuedfor the year ended 30 June 2017
Note 4. Operating segments (continued)
Operating segment information (continued)
Consolidated — 2016Trade
$’000
Retail &Service$’000
Specialist Wholesale
$’000
Unallocated/Head Office1
$’000 Total
Revenue
Sales 419,139 172,264 103,423 — 694,826
Total segment revenue 419,139 172,264 103,423 — 694,826
Intersegment sales (9,197)
Total revenue 685,629
EBITDA 51,794 20,915 9,517 (2,711) 79,515
Intersegment EBITDA (1,337)
Depreciation and amortisation (10,055)
Finance costs (4,858)
Acquisition costs (1,149)
Profit before income tax expense 62,116
Income tax expense (18,534)
Profit after income tax expense 43,582
Assets
Segment assets 274,887 263,943 123,482 21,110 683,422
Total assets 683,422
Liabilities
Segment liabilities 88,760 36,786 12,337 179,319 317,202
Total liabilities 317,202
1. There has been reclassification of inter-segment transactions from the Unallocated/Head Office segment to the segment they relate to, to ensure comparability between years.
Geographical information
Sales toexternal customers
Geographicalnon-current assets
2017 $’000
2016 $’000
2017 $’000
2016 $’000
Australia 926,638 685,629 531,719 403,459
New Zealand 86,915 — 170,250 —
1,013,553 685,629 701,969 403,459
The geographical non-current assets above are exclusive of, where applicable, financial instruments, deferred tax assets and balances such as intercompany and investments that are eliminated on consolidation. It only pertains to the continuing operations of the consolidated entity.
Revenue is allocated to geographical segments on the basis of where the sale is recorded.

93 ANNUAL REPORT 2017
Note 5. Expenses
Consolidated
2017 $’000
2016 $’000
Profit before income tax from continuing operations includes the following specific expenses:
Depreciation and amortisation expense
Plant and equipment 5,519 4,593
Motor vehicles 4,012 2,604
Amortisation 3,667 2,476
Make good provision 329 382
13,527 10,055
Acquisition costs
Professional consultant costs 2,369 652
Transaction success fees paid to advisors 3,793 —
Other transaction costs 2,320 497
8,482 1,149
Finance costs
Interest and finance charges paid/payable 9,185 4,858
Borrowing cost write-offs due to refinancing process 581 —
9,766 4,858
Rental expense relating to operating leases
Minimum lease payments 31,902 26,122
Superannuation expense
Defined contribution superannuation expense 13,740 8,596

94 BAPCOR
NOTES TO THE CONSOLIDATED FINANCIAL STATEMENTS continuedfor the year ended 30 June 2017
Note 6. Income tax
Consolidated
2017 $’000
2016 $’000
Income tax expense
Current tax on profits for the year 26,907 19,319
Deferred tax expense (610) (638)
Adjustment recognised for prior periods (309) (147)
Relating to discontinued operations 5,037 —
31,025 18,534
Income tax expense is attributable to:
Profit from continuing operations 25,988 18,534
Profit from discontinued operations 5,037 —
31,025 18,534
Deferred tax included in income tax expense comprises:
Increase in deferred tax assets (561) (638)
Decrease in deferred tax liabilities (49) —
(610) (638)
Numerical reconciliation of income tax expense and tax at the statutory rate
Profit before income tax expense from continuing operations 79,720 62,116
Profit before income tax expense from discontinued operations 15,135 —
94,855 62,116
Tax at the statutory tax rate of 30% 28,457 18,635
Tax effect amounts which are not deductible/(taxable) in calculating taxable income:
Acquisition costs 2,134 7
Other 321 39
Adjustment recognised for prior periods (309) (147)
Difference in overseas tax rates 422 —
31,025 18,534
Amounts charged/(credited) directly to equity
Deferred tax assets (1,359) (321)
(1,359) (321)
Amounts charged/(credited) directly to other comprehensive income
Deferred tax assets (1,329) (1,263)
Deferred tax liabilities 228 —
(1,101) (1,263)

95 ANNUAL REPORT 2017
Consolidated
2017 $’000
2016 $’000
Deferred tax asset
Deferred tax asset comprises temporary differences attributable to:
Amounts recognised in profit or loss:
Property, plant and equipment 2,259 1,671
Employee benefits 11,737 8,417
Trade and other receivables 2,663 2,269
Inventory 15,810 7,368
Other 8,520 6,419
40,989 26,144
Amounts recognised in equity:
Transaction costs on share issue 1,359 321
Amounts recognised in other comprehensive income:
Cash flow hedge 447 538
Share-based payment 882 725
1,329 1,263
Total deferred tax asset 43,677 27,728
Set off deferred tax liabilities pursuant to set-off provisions (25,013) (20,481)
Net deferred tax asset 18,664 7,247
Movements in deferred tax asset
Opening balance 27,728 11,925
Credited to profit or loss 561 638
Charged to equity 1,038 321
Charged to other comprehensive income 66 1,263
Additions through business combinations (note 35) 13,778 13,628
Adjustment recognised for prior periods 53 (47)
Foreign currency translation 453 —
Closing balance 43,677 27,728

96 BAPCOR
NOTES TO THE CONSOLIDATED FINANCIAL STATEMENTS continuedfor the year ended 30 June 2017
Note 6. Income tax (continued)
Consolidated
2017 $’000
2016 $’000
Deferred tax liability
Deferred tax liability comprises temporary differences attributable to:
Amounts recognised in profit or loss:
Customer contracts 6,688 7,053
Trademarks 17,721 13,367
Other 376 61
24,785 20,481
Amounts recognised in other comprehensive income:
Cash flow hedge 228 —
Total deferred tax liability 25,013 20,481
Set off deferred tax liabilities pursuant to set-off provisions (25,013) (20,481)
Net deferred tax liability — —
Movements in deferred tax liability
Opening balance 20,481 78
Credited to profit or loss (49) —
Charged to other comprehensive income 228 —
Additions through business combinations (note 35) 4,353 20,420
Adjustment recognised for prior periods — (17)
Closing balance 25,013 20,481

97 ANNUAL REPORT 2017
Note 7. Discontinued operationsThe discontinued operations relate to the business units of Footwear and Resource Services that were acquired as part of the Hellaby Holdings Limited acquisition and deemed assets held for sale on acquisition. Refer to notes 11 and 18 for further information.
Financial performance information
Consolidated
2017 $’000
2016 $’000
Revenues
Footwear 64,697 —
Resource Services 131,906 —
196,603 —
Expenses
Footwear (59,498) —
Resource Services (121,970) —
(181,468) —
Profit before income tax expense 15,135 —
Income tax expense (5,037) —
Profit after income tax expense from discontinued operations 10,098 —
Cash flow disclosures are not required for disposal groups that are classified as held for sale on acquisition in accordance with AASB 5 Non-current Assets Held for Sale and Discontinued Operations.
Note 8. Current assets — cash and cash equivalents
Consolidated
2017 $’000
2016 $’000
Australian dollars 29,772 19,210
New Zealand dollars 6,965 —
United States dollars 3,017 3,107
Other currencies 1 75
39,755 22,392

98 BAPCOR
NOTES TO THE CONSOLIDATED FINANCIAL STATEMENTS continuedfor the year ended 30 June 2017
Note 9. Current assets — trade and other receivables
Consolidated
2017 $’000
2016 $’000
Trade receivables 126,524 80,489
Less: Provision for impairment of receivables (8,296) (6,963)
118,228 73,526
Customer loans 1,366 2,040
Less: Provision for impairment of customer loans (851) (840)
515 1,200
Other receivables 12,118 9,086
Prepayments 4,923 3,492
17,041 12,578
135,784 87,304
Trade receivables are non-interest bearing and repayment terms vary by business unit. The amount of provision for impairment of trade receivables has been measured as the difference between the carrying amount of the trade receivables and the estimated future cash flows expected to be received from the relevant debtors.
Customer loans relate to loans with franchisees. Loans with repayment terms of less than twelve months are classified as current. Non-current customer loans are discounted to their present value. Of the total customer loans balance including the non-current portion disclosed in note 12, $265,000 (2016: $678,000) are non-interest bearing. $1,704,000 (2016: $2,427,000) of loans have a weighted average annual interest rate of 9.9% (2016: 9.1%).
Other receivables are non-interest bearing. Receivables with repayment terms of less than twelve months are classified as current. These receivables are all neither past due nor impaired.
The ageing of the net trade receivables and loans above (including the non-current portion from note 12) are as follows:
Consolidated
2017 $’000
2016 $’000
Current and not due 84,431 47,245
31 — 60 days 28,424 22,405
61 — 90 days 6,184 5,519
91 — 120 days — 130
119,039 75,299
As at 30 June the amount of the provision for impairment of receivables and loans was $9,454,000 (2016: $8,295,000) represented by:
• Provision for trade doubtful debts $7,130,000 (2016: $6,576,000)
• Provision for credit notes $1,166,000 (2016: $387,000)
• Provision for customer loans $1,158,000 (2016: $1,332,000) Bapcor recognised a loss of $254,000 (2016: $447,000) in respect of impaired receivables during the financial year.

99 ANNUAL REPORT 2017
Movements in the provision for impairment of receivables and loans
Consolidated
2017 $’000
2016 $’000
Opening balance 8,295 532
Additional provisions recognised 254 447
Additions through business combinations (note 35) 2,846 7,949
Amounts used (1,356) (633)
Foreign currency translation (9) —
Change in provision from re-measurement (576) —
Closing balance 9,454 8,295
Note 10. Current assets — inventories
Consolidated
2017 $’000
2016 $’000
Stock in transit — at cost 13,325 6,496
Stock on hand — at cost 302,287 181,213
Less: Provision for slow moving inventory (53,985) (24,689)
248,302 156,524
261,627 163,020
The current year increase in provision for slow moving inventory is due to the Hellaby and other acquisition fair value adjustments consistent with the Bapcor provision policy. Refer to note 35.
Note 11. Current assets — assets held for sale
Consolidated
2017 $’000
2016 $’000
Footwear 27,391 —
Resource Services 151,469 —
178,860 —
As part of the Hellaby Holdings Limited acquisition, the two acquired business segments of Footwear and Resource Services were immediately deemed assets held for sale at the time of acquisition. The consolidated entity has been actively marketing the sale of the Hellaby Resource Services Limited, Number 1 Shoes Limited and R Hannah & Co Limited subsidiaries, with completion expected during H1 FY18. The assets and liabilities of these business segments are classified as held for sale as at 30 June 2017 and the results from acquisition to the year ended 30 June 2017 have been reported as discontinued operations (refer note 7).
AASB 5 Non-current Assets Held for Sale and Discontinued Operations requires that when the disposal group is acquired as part of a business combination, it is measured at fair value less costs to sell. The fair value less costs to sell have been determined to be NZD $84.1M and NZD $15.5M, for Resource Services and Footwear respectively. The assets held for sale component has been grossed up by the current book value of the associated liabilities which are reported in note 18, as well as the net cash on hand as at 30 June 2017 as these disposals are intended to be net of debt and cash balances. Net cash as at 30 June 2017 for these business segments was NZD $9.0M and NZD $4.7M for Resource Services and Footwear respectively.
Refer to note 29 for information relating to the determination of the fair value of the assets held for sale.

100 BAPCOR
NOTES TO THE CONSOLIDATED FINANCIAL STATEMENTS continuedfor the year ended 30 June 2017
Note 12. Non-current assets — trade and other receivables
Consolidated
2017 $’000
2016 $’000
Customer loans 603 1,065
Less: Provision for impairment of receivables (307) (492)
296 573
Customer loans relate to loans with franchisees. Refer to note 9 for further information on these customer loans.
Note 13. Non-current assets — property, plant and equipment
Consolidated
2017 $’000
2016 $’000
Plant and equipment — at cost 55,016 40,997
Less: Accumulated depreciation (22,409) (17,174)
32,607 23,823
Motor vehicles — at cost 27,396 19,654
Less: Accumulated depreciation (10,222) (7,264)
17,174 12,390
49,781 36,213
ReconciliationsReconciliations of the written down values at the beginning and end of the current and previous financial year are set out below:
Consolidated
Plant and equipment
$’000
Motorvehicles
$’000Total
$’000
Balance at 1 July 2015 14,046 9,011 23,057
Additions 7,334 4,686 12,020
Additions through business combinations 7,122 1,712 8,834
Disposals (86) (415) (501)
Depreciation expense (4,593) (2,604) (7,197)
Balance at 30 June 2016 23,823 12,390 36,213
Additions 9,399 5,697 15,096
Additions through business combinations (note 35) 4,722 4,182 8,904
Disposals (210) (685) (895)
Foreign currency translation (1) (5) (6)
Transfers in/(out) 393 (393) —
Depreciation expense (5,519) (4,012) (9,531)
Balance at 30 June 2017 32,607 17,174 49,781

101 ANNUAL REPORT 2017
Note 14. Non-current assets — intangibles
Consolidated
2017 $’000
2016 $’000
Goodwill 561,843 289,231
Trademarks 59,443 44,581
Customer contracts 25,543 25,543
Less: Accumulated amortisation (3,251) (1,519)
22,292 24,024
Software 8,959 7,306
Less: Accumulated amortisation (4,706) (2,935)
4,253 4,371
647,831 362,207
ReconciliationsReconciliations of the written down values at the beginning and end of the current and previous financial year are set out below:
Consolidated
Computer software
$’000
Customer contracts
$’000Trade names
$’000Goodwill
$’000Total
$’000
Balance at 1 July 2015 1,537 — — 98,317 99,854
Additions 2,069 56 24 — 2,149
Additions through business combinations 1,724 25,487 44,557 190,914 262,682
Disposals (2) — — — (2)
Amortisation expense (957) (1,519) — — (2,476)
Balance at 30 June 2016 4,371 24,024 44,581 289,231 362,207
Additions 1,101 — 19 — 1,120
Additions through business combinations (note 35) 716 — 14,889 273,599 289,204
Foreign currency translation — — (47) (986) (1,033)
Amortisation expense (1,935) (1,732) — — (3,667)
Balance at 30 June 2017 4,253 22,292 59,442 561,844 647,831

102 BAPCOR
NOTES TO THE CONSOLIDATED FINANCIAL STATEMENTS continuedfor the year ended 30 June 2017
Note 14. Non-current assets — intangibles (continued)
Impairment testingImpairment testing of assets including goodwill and other intangible assets occurs each year on 31 March balances or when impairment indicators arise. The recoverable amount of assets including goodwill and other indefinite useful life intangible assets is determined based on value-in-use calculations at an individual or a combination of cash-generating units ('CGU') up to the operating segment level, with the exception outlined below in relation to the Hellaby acquired goodwill. These calculations require the use of key assumptions on which management has based its cash flow projections, as well as pre-tax discount rates.
Cash flow projections were derived from management forecasts based on the five year strategic plan. This has been compiled based on past experience, current performance and market position as well as structural changes and economic factors which have been derived based on external data and internal analysis.
The following key assumptions were used in testing for impairment:
• Pre-tax discount rate: 11.96% (2016: 10.42%)
• Terminal value growth rate beyond 5 years (set at current CPI): 1.30% (2016: 1.70%)
• Forecast year on year revenue and EBITDA margin growth ranges as follows:
CGU Revenue growth EBITDA growth
Trade 3.0% — 4.8% 0 — 0.3 percentage points
Retail & Service 3.1% — 6.8% 0 — 0.6 percentage points
Specialist Wholesale 3.0% — 3.6% 0 — 0.2 percentage points
A reasonable possible change in assumptions would not cause the carrying value of the CGUs to exceed its recoverable amount.
Hellaby acquired goodwill In relation to the recent Hellaby acquisition, goodwill of $241,000,000 was acquired. Management have performed impairment testing using fair value less cost to sell with reference to the fair value being the purchase price paid at acquisition with no impairment indicators being noted since acquisition.
There have been no further indicators of impairment after the impairment testing date of 31 March 2017 up until the date of this report.
The balances of goodwill and other intangible assets excluding computer software allocated to each segment as at 30 June were:
Consolidated
2017 $’000
2016 $’000
Goodwill:
Trade 106,529 105,261
Retail & Service 126,738 125,116
Specialist Wholesale 88,420 58,854
Hellaby Automotive 240,156 —
561,843 289,231 Other intangible assets:
Retail & Service 54,815 56,456
Specialist Wholesale 16,298 12,149
Hellaby Automotive 10,622 —
81,735 68,605

103 ANNUAL REPORT 2017
Note 15. Non-current assets — other
Consolidated
2017 $’000
2016 $’000
Make good asset 1,085 941
Employee loans 2,976 3,525
4,061 4,466
Employee loans were made to key management personnel and other personnel to assist in the purchase of shares. These loans are secured by the underlying shares acquired. The loans are interest bearing and are repayable on the earlier of sale of the underlying shares, termination of employment or five years from the date of the loan in cash, and cannot be settled by the employees returning the shares to the company.
Note 16. Current liabilities — trade and other payables
Consolidated
2017 $’000
2016 $’000
Trade payables 133,966 95,871
Accrued expenses 40,802 25,636
174,768 121,507
Refer to note 28 for further information on financial risk management.
Note 17. Current liabilities — provisions
Consolidated
2017 $’000
2016 $’000
Employee benefits 27,191 20,124
Deferred settlements 4,267 5,570
Onerous lease provision 673 913
32,131 26,607
Deferred settlementsThis provision represents the obligation to pay consideration following the acquisition of a business. Some of these are only due to the vendor if certain future targets are met. It is measured at the present value of the estimated liability.
As at 30 June 2017, the following deferred settlements are provided for (across both current and non-current deferred settlement provisions; refer to note 20 for details on non-current portion):
• Sprint Auto Parts; currently provided at $3,298,000
• Precision Automotive; currently provided at $1,594,000
• Baxters Pty Ltd; currently provided at $20,288,000
Onerous lease provisionThis provision represents the present value of the estimated costs, net of any sub-lease revenue that will be incurred until the end of the lease terms where the obligation is expected to exceed the economic benefit to be received.

104 BAPCOR
NOTES TO THE CONSOLIDATED FINANCIAL STATEMENTS continuedfor the year ended 30 June 2017
Note 17. Current liabilities — provisions (continued)
Amounts not expected to be settled within the next twelve monthsThe current provision for employee benefits includes all unconditional entitlements where employees have completed the required period of service and also those where employees are entitled to pro-rata payments in certain circumstances. The entire amount is presented as current, since the consolidated entity does not have an unconditional right to defer settlement. However, based on past experience, the consolidated entity does not expect all employees to take the full amount of accrued leave or require payment within the next twelve months.
The following amounts reflect leave that is not expected to be taken within the next twelve months:
Consolidated
2017 $’000
2016 $’000
Employee benefits obligation expected to be settled after twelve months 4,742 4,345
Note 18. Current liabilities — liabilities relating to assets held for sale
Consolidated
2017 $’000
2016 $’000
Footwear 8,184 —
Resource Services 63,000 —
Eliminations (342) —
70,842 —
The liabilities relating to assets held for sale relate to the Footwear and Resource Services business segments which were deemed to be held for sale on business combination of Hellaby Holdings Limited. Refer to note 11 for further information.
The liabilities relating to Resource Services includes a contingent consideration payable of $6,800,000.
On 2 April 2013 Hellaby Holdings Limited entered into a deed with the non-controlling shareholders of Contract Services Investments Limited which included a put and call option. The liability is currently measured at fair value based on the fair value being attributed to the held for sale Resource Services business segment and the respective non-controlling shareholders interest held.
All other liabilities have been measured in accordance with the accounting policies of the consolidated entity.
Note 19. Non-current liabilities — borrowings
Consolidated
2017 $’000
2016 $’000
Secured bank loans 432,229 148,800
Less: unamortised transaction costs capitalised (2,482) (616)
429,747 148,184
Refer to note 28 for further information on financial risk management.

105 ANNUAL REPORT 2017
RefinancingOn 30 June 2017, the consolidated entity successfully refinanced its debt facilities establishing a new $500M debt facility with the pre-existing lenders ANZ and Westpac, as well as two new lenders being The Bank of Tokyo-Mitsubishi UFJ and The Hongkong and Shanghai Banking Corporation. Proceeds were used to repay the existing debt facilities including the bridging loan for the acquisition of Hellaby Holdings Limited. The $500M debt facility comprises funding in three and five year tranches as follows:
• $200M three year tranche, available for general corporate purposes;
• $250M five year tranche, available for general corporate purposes;
• $50M three year tranche, available for working capital requirements.
The facility is secured by way of a fixed and floating charge over Bapcor’s assets. There were no changes to the debt covenants with the net leverage ratio being >3.0X and the fixed cover charge ratio being >1.75X. Refer to note 28 for further information.
As part of the refinancing process, the unamortised transactions costs that related to the pre-existing debt facilities of $581,000 was expensed in the statement of comprehensive income and accounted for as part of finance costs.
Borrowing costs of $2,482,000 were incurred in establishing the new facility, and are being amortised over the life of the facility and will be expensed to finance costs as effective interest expense in the statement of comprehensive income. As at 30 June 2017 total borrowing costs of $2,482,000 (2016: $616,000) have not yet been amortised through the statement of comprehensive income.
Financing arrangementsUnrestricted access was available at the reporting date to the following lines of credit:
Consolidated
2017 $’000
2016 $’000
Total facilities
Bank loans including overdraft1 497,500 184,850
Used at the reporting date
Bank loans including overdraft1 432,229 148,800
Unused at the reporting date
Bank loans including overdraft1 65,271 36,050
1. Total facilities available at 30 June was $500M (2016: $200M). The amount used in the above table excludes $2.5M (2016: $15.2M) of facility which relates to bank guarantees under the working capital tranche.

106 BAPCOR
NOTES TO THE CONSOLIDATED FINANCIAL STATEMENTS continuedfor the year ended 30 June 2017
Note 20. Non-current liabilities — provisions
Consolidated
2017 $’000
2016 $’000
Employee benefits 2,644 1,821
Deferred settlements 20,913 7,178
Make good provision 8,169 2,512
Onerous lease provision 1,646 1,363
33,372 12,874
Deferred settlements and onerous lease provisionRefer to note 17.
Make good provisionThis provision represents the present value of the estimated costs to make good the premises leased by the consolidated entity at the end of the respective lease terms. The current year increase in make good provision is due to the Hellaby and other acquisition (refer note 35) fair value adjustments consistent with the Bapcor's make good provision policy.
Movements in provisionsMovements in each class of provision during the current financial year, other than employee benefits, are set out below:
Consolidated — 2017
Deferred consideration
$’000Make good
$’000Onerous lease
$’000
Carrying amount at the start of the year 7,178 2,512 1,363
Additional provisions recognised — 386 —
Additions through business combinations (note 35) 28,622 5,322 1,058
Amounts used (17,086) (34) (428)
Foreign currency translation — (17) —
Movement between current and non-current classification 1,302 — (347)
Unwinding of discount 897 — —
Carrying amount at the end of the year 20,913 8,169 1,646

107 ANNUAL REPORT 2017
Note 21. Equity — issued capital
Consolidated
2017 Shares
2016 Shares
2017 $’000
2016 $’000
Ordinary shares 278,633,080 245,857,351 602,571 416,427
Treasury shares (200,000) — (1,896) —
278,433,080 245,857,351 600,675 416,427
Movements in ordinary share capital
Details Date Shares $’000
Opening balance 1 July 2016 245,857,351 416,427
Issue for Baxters Pty Ltd acquisition 3 August 2016 500,000 2,780
Exempt Employee Share Scheme offer 9 September 2016 138,519 734
Issue for Hellaby Holdings Limited acquisition — Institutional placement (net of costs)
30 September 2016 28,205,129 161,051
Issue for Hellaby Holdings Limited acquisition — Retail placement (net of costs) 4 November 2016 3,115,772 16,288
Issue for Dividend Reinvestment Plan 21 April 2017 816,309 4,558
Transactions costs arising on share issue — (648)
Deferred tax credit recognised directly in equity — 1,381
Closing balance 30 June 2017 278,633,080 602,571
Movements in treasury shares
Details Date Shares $’000
Opening balance 1 July 2016 — —
Treasury shares purchased 16 December 2016 (351,344) (1,896)
Allocation as part of the FY14 LTI 16 December 2016 151,344 —
Closing balance 30 June 2017 (200,000) (1,896)
Ordinary sharesOrdinary shares entitle the holder to participate in dividends and the proceeds on the winding up of the company in proportion to the number of and amounts paid on the shares held. The fully paid ordinary shares have no par value and the company does not have a limited amount of authorised capital.
On a show of hands every member present at a meeting in person or by proxy shall have one vote and upon a poll each share shall have one vote.
Treasury sharesThe average purchase price of treasury shares during the period was $5.40 per share.

108 BAPCOR
NOTES TO THE CONSOLIDATED FINANCIAL STATEMENTS continuedfor the year ended 30 June 2017
Note 22. Equity — reserves
Consolidated
2017 $’000
2016 $’000
Foreign currency reserve (918) —
Cash flow hedge reserve (2,519) (1,256)
Share-based payments reserve 3,883 2,101
Net investment hedge reserve (648) —
(202) 845
Foreign currency reserveThis reserve is used to recognise exchange differences arising from the translation of the financial statements of foreign operations to Australian dollars.
Cash flow hedge reserveThis reserve is used to recognise the effective portion of the gain or loss of cash flow hedge instruments that is determined to be an effective hedge.
Share-based payments reserveThis reserve is used to recognise the value of equity benefits provided to employees and directors as part of their remuneration, and other parties as part of their compensation for services.
Net investment hedge reserveThis reserve is used to recognise the effective portion of the gain or loss of net investment hedge instruments that is determined to be an effective hedge.
Movements in reservesMovements in each class of reserve during the current and previous financial year are set out below:
Consolidated
Foreign currency
reserve $’000
Cash flow hedge reserve
$’000
Share-based payments
reserve $’000
Net investment hedge reserve
$’000Total
$’000
Balance at 1 July 2015 — — 441 — 441
Revaluation — (1,794) — — (1,794)
Share-based payment expense — — 1,081 — 1,081
Deferred tax — 538 579 — 1,117
Balance at 30 June 2016 — (1,256) 2,101 — 845
Revaluation — (1,860) — (631) (2,491)
Share-based payment expense — — 1,625 — 1,625
Deferred tax — 541 157 (17) 681
Foreign currency translation (918) 56 — — (862)
Balance at 30 June 2017 (918) (2,519) 3,883 (648) (202)

109 ANNUAL REPORT 2017
Note 23. Equity — accumulated losses
Consolidated
2017 $’000
2016 $’000
Accumulated losses at the beginning of the financial year (51,052) (70,906)
Profit after income tax expense for the year 64,044 43,582
Dividends paid (note 25) (30,059) (23,728)
Accumulated losses at the end of the financial year (17,067) (51,052)
Note 24. Equity — non-controlling interest
Consolidated
2017 $’000
2016 $’000
Resource Services — Asset Held for Sale acquired 129,780 —
Resource Services — Liability Held for Sale acquired (46,851) —
Resource Services — Net Assets Held for Sale acquired 82,929 —
Non-controlling interest acquired 6,805 —
Non-controlling interest loss for the period (214) —
Foreign currency revaluation (30) —
6,561 —
As part of the current year acquisition of Hellaby Holdings Limited, the acquired Resource Services held for sale asset has a non-controlling interest that is material to the consolidated entity. Refer to note 35. The amounts relating to this non-controlling interest and subsequent transactions are as represented above.

110 BAPCOR
NOTES TO THE CONSOLIDATED FINANCIAL STATEMENTS continuedfor the year ended 30 June 2017
Note 25. Equity — dividendsDividends paid during the financial year were as follows:
Consolidated
2017 $’000
2016 $’000
Final dividend for the year ended 30 June 2016 (2016: 30 June 2015) of 6.0 cents (2016: 4.7 cents) per ordinary share
14,781 11,497
Interim dividend for the year ended 30 June 2017 (2016: 30 June 2016) of 5.5 cents (2016: 5.0 cents) per ordinary share1
15,278 12,231
30,059 23,728
1. In the current year, $4,558,000 of the interim dividend for the year ended 30 June 2017 was settled under the Dividend Reinvestment Plan.
The Board has declared a final dividend in respect of the current financial year of 7.5 cents per share, fully franked. The final dividend will be paid on 29 September 2017 to shareholders registered on 31 August 2017.
The final dividend takes the total dividends declared in relation to the current financial year to 13.0 cents per share, fully franked, representing an increase of dividends paid of 18.2% compared to the prior financial year. Dividends paid and declared in relation to the current financial year represents 56.7% of net profit after tax.
Franking credits
Consolidated
2017 $’000
2016 $’000
Franking credits available for subsequent financial years based on a tax rate of 30% 38,252 28,480
The above amounts represent the balance of the franking account as at the end of the financial year, adjusted for:
• franking credits that will arise from the payment of the amount of the provision for income tax at the reporting date
• franking debits that will arise from the payment of dividends recognised as a liability at the reporting date
• franking credits that will arise from the receipt of dividends recognised as receivables at the reporting date
Note 26. Net tangible assetsA large proportion of the consolidated entity's assets are intangible in nature, consisting of goodwill, customer contracts and trademarks acquired on business combination as well as software. These assets as well as any deferred taxes are excluded from the calculation of net tangible assets per security.
Net tangible assets per share at 30 June was (16.0) (2016: 1.6) cents per share.
Net assets per share at 30 June was $2.12 (2016: $1.49) per share.

111 ANNUAL REPORT 2017
Note 27. Derivative financial instruments
Consolidated
2017 $’000
2016 $’000
Current assets
Forward foreign exchange contracts — cash flow hedges 40 —
Current liabilities
Forward foreign exchange contracts — cash flow hedges (1,780) (420)
Non-current liabilities
Interest rate swap contracts — cash flow hedges (637) (1,374)
(2,377) (1,794)
Refer to note 28 for further information on financial risk management.
Refer to note 29 for further information on fair value measurement.
Note 28. Financial risk management
Financial risk management objectivesThe consolidated entity’s activities expose it to a variety of financial risks: market risk (including foreign currency risk, price risk and interest rate risk), credit risk and liquidity risk. The consolidated entity’s overall risk management program focuses on the unpredictability of financial markets and seeks to minimise potential adverse effects on the financial performance of the consolidated entity. The consolidated entity uses derivative financial instruments such as forward foreign exchange contracts to hedge certain risk exposures. Derivatives are exclusively used for hedging purposes, i.e. not as trading or other speculative instruments. The consolidated entity uses different methods to measure different types of risk to which it is exposed. These methods include sensitivity analysis in the case of interest rate, foreign exchange and other price risks, ageing analysis for credit risk and beta analysis in respect of investment portfolios to determine market risk.
Risk management is carried out by senior finance executives (‘finance’) under policies approved by the Board of Directors (‘the Board’). These policies include identification and analysis of the risk exposure of the consolidated entity and appropriate procedures, controls and risk limits. Finance identifies, evaluates and manages financial risks within the consolidated entity’s operating units. Finance reports to the Board on a monthly basis.
The consolidated entity holds the following financial instruments:
Consolidated
2017 $’000
2016 $’000
Financial assets
Cash and cash equivalents 39,755 22,392
Trade and other receivables1 131,157 84,385
Derivative financial instruments 40 —
170,952 106,777
Financial liabilities
Trade and other payables 174,768 121,507
Derivative financial instruments 2,417 1,794
Deferred consideration 25,180 12,748
Borrowings2 432,229 148,800
634,594 284,849
1. Trade and other receivables in the table excludes prepayments which are not classified as financial instruments.
2. Borrowings excludes any unamortised transaction costs capitalised.

112 BAPCOR
NOTES TO THE CONSOLIDATED FINANCIAL STATEMENTS continuedfor the year ended 30 June 2017
Note 28. Financial risk management (continued)
Market risk
Foreign currency riskThe consolidated entity undertakes certain transactions denominated in foreign currency and is exposed to foreign currency risk through foreign exchange rate fluctuations, primarily with respect to the United States dollar and the New Zealand dollar.
Foreign exchange risk arises from future commercial transactions, primarily the purchase of inventory for sales, recognised financial assets and financial liabilities and net investments in foreign operations.
In order to protect against exchange rate movements, the consolidated entity has entered into forward foreign exchange contracts. These contracts are hedging highly probable forecasted cash flows for the ensuing financial year. Management has a risk management policy to hedge between 25% and 100% of anticipated foreign currency transactions for the subsequent twelve months. As well as this the consolidated entity also has foreign currency loans to offset foreign investments which create a natural hedge against foreign currency fluctuations.
The following table demonstrates the sensitivity to a change in the Australian dollar against other currencies, with all other variables held constant. The impact on profit before tax is due to changes in the fair value of monetary assets and liabilities. The pre-tax impact on equity is due to changes in the fair value of forward exchange contracts designated as cash flow hedges as well as foreign currency loans designated as net investment hedges.
AUD strengthened AUD weakened
Consolidated — 2017 % change
Effect on profit before tax
$’000
Effect on equity $’000 % change
Effect on profit before tax
$’000
Effect on equity $’000
Derivative financial instruments 1% — 589 (1%) — (601)
Other financial assets 1% (287) — (1%) 293 —
Other financial liabilities 1% 259 943 (1%) (264) (962)
(28) 1,532 29 (1,563)
AUD strengthened AUD weakened
Consolidated — 2016 % change
Effect on profit before tax
$’000
Effect on equity $’000 % change
Effect on profit before tax
$’000
Effect on equity $’000
Derivative financial instruments 1% — 204 (1%) — (209)
Other financial assets 1% (31) — (1%) 31 —
(31) 204 31 (209)
Price riskThe consolidated entity is not exposed to any significant price risk.

113 ANNUAL REPORT 2017
Interest rate riskThe consolidated entity’s main interest rate risk arises from long-term borrowings. The interest rate and term for bank borrowings is determined at the date of each drawdown.
Borrowings obtained at variable rates expose the consolidated entity to cash flow interest rate risk. The consolidated entity, from time to time, enters into interest rate swap contracts under which it receives interest at variable rates and pays interest at fixed rates to manage the risk of adverse fluctuations in the floating interest rate on its borrowings.
As at the reporting date, the consolidated entity had the following variable rate borrowings and interest rate swap contracts outstanding:
2017 2016
Consolidated
Weighted average
interest rate %
Balance $’000
Weighted average
interest rate %
Balance $’000
Borrowings (principal) 3.30% 432,229 3.35% 148,800
Less: amounts covered by interest rate swaps 2.39% (60,000) 2.39% (60,000)
Net exposure to cash flow interest rate risk 372,229 88,800
As at 30 June 2017, if the weighted average interest rate of the bank borrowings had changed by a factor of +/- 10%, interest expense would increase/decrease by $1,427,000 (2016: $499,000).
The amount recognised in other comprehensive income net of tax in relation to interest rate swaps was $516,000 (2016: ($637,000)).
Credit riskCredit risk refers to the risk that a counterparty will default on its contractual obligations resulting in financial loss to the consolidated entity. Credit risk is managed in the following ways:
• The consolidated entity has a strict code of credit for all customers, including obtaining agency credit information, confirming references and setting appropriate credit limits.
• Derivative counterparties and cash transactions are limited to high quality independently rated financial institutions with a minimum rating of ‘A’.
• Concentrations of credit risk are minimised by undertaking transactions with a large number of customers.
• In some instances the consolidated entity holds collateral over its trade receivables and loans in the form of personal guarantees and charges under the Personal Property Securities Register.
The maximum exposure to credit risk at the reporting date to recognised financial assets is the carrying amount, net of any provisions for impairment of those assets, as disclosed in the statement of financial position and notes 9 and 12.
Liquidity riskVigilant liquidity risk management requires the consolidated entity to maintain sufficient liquid assets (mainly cash and cash equivalents) and available borrowing facilities to be able to pay debts as and when they become due and payable.
The consolidated entity manages liquidity risk by maintaining adequate cash reserves and available borrowing facilities by continuously monitoring actual and forecast cash flows and matching the maturity profiles of financial assets and liabilities.
Financing arrangementsUnused borrowing facilities at the reporting date:
Consolidated
2017 $’000
2016 $’000
Bank loans including overdraft1 65,271 36,050
1. The unused facility value excludes any facility that relates to bank guarantees. Refer to note 19 for further information.

114 BAPCOR
NOTES TO THE CONSOLIDATED FINANCIAL STATEMENTS continuedfor the year ended 30 June 2017
Note 28. Financial risk management (continued)
Remaining contractual maturitiesThe following tables detail the consolidated entity’s remaining contractual maturity for its financial instrument liabilities. The tables have been drawn up based on the undiscounted cash flows of financial liabilities based on the earliest date on which the financial liabilities are required to be paid. The tables include both interest and principal cash flows disclosed as remaining contractual maturities and therefore these totals may differ from their carrying amount in the statement of financial position.
Consolidated — 20171 year or less
$’000
Between 1 and 2 years
$’000
Between 2 and 5 years
$’000Over 5 years
$’000
Remaining contractual maturities
$’000
Non-derivatives
Trade payables 174,768 — — — 174,768
Borrowings1 16,633 16,633 466,062 — 499,328
Deferred consideration 4,369 22,069 — — 26,438
195,770 38,702 466,062 — 700,534
Derivatives
Interest rate swaps — 116 521 — 637
Forward foreign exchange contracts 1,780 — — — 1,780
1,780 116 521 — 2,417
Consolidated — 20161 year or less
$’000
Between 1 and 2 years
$’000
Between 2 and 5 years
$’000Over 5 years
$’000
Remaining contractual maturities
$’000
Non-derivatives
Trade payables 121,507 — — — 121,507
Borrowings1 4,633 4,633 149,186 — 158,452
Deferred consideration 8,195 5,019 — — 13,214
134,335 9,652 149,186 — 293,173
Derivatives
Interest rate swaps — — 1,374 — 1,374
Forward foreign exchange contracts 420 — — — 420
420 — 1,374 — 1,794
1. Borrowings’ contractual cash flows includes an interest component based on the drawn/undrawn ratio and interest rate applicable as at reporting date until maturity of the loan facility.
Fair value of financial instrumentsThe fair value of financial assets and liabilities disclosed in the statement of financial position do not differ materially from their carrying values.

115 ANNUAL REPORT 2017
Capital risk managementThe consolidated entity’s policy is to maintain a capital structure for the business which ensures sufficient liquidity and support for business operations, maintains shareholder and market confidence, provides strong stakeholder returns and positions the business for future growth. In assessing capital management both equity and debt instruments are taken into consideration. The ongoing maintenance of this policy is characterised by:
• ongoing cash flow forecast analysis and detailed budgeting processes which, combined with continual development of banking relationships, is directed at providing a sound financial positioning for the consolidated entity’s operations and financial management activities; and
• a capital structure that provides adequate funding for potential acquisition and investment strategies, building future growth in shareholder value. The loan facility can be partly used to fund significant investments as part of this growth strategy.
The consolidated entity is not subject to externally imposed capital requirements, other than contractual banking covenants and obligations. All bank lending requirements have been complied with during the year and at the date of this report, which include the following covenants:
• Net leverage ratio not exceeding 3.00:1 (Net Debt : EBITDA);
• Fixed charge cover ratio not exceeding 1.75:1 (EBITDA plus Rent : Net Total Cash Interest plus Rent).
Note 29. Fair value measurement
Fair value hierarchyThe following tables detail the consolidated entity’s financial instruments, measured or disclosed at fair value, using a three level hierarchy, based on the lowest level of input that is significant to the entire fair value measurement, being:
Level 1: Quoted prices (unadjusted) in active markets for identical assets or liabilities that the entity can access at the measurement date.
Level 2: Inputs other than quoted prices included within Level 1 that are observable for the asset or liability, either directly or indirectly.
Level 3: Unobservable inputs for the asset or liability.
Consolidated — 2017Level 1 $’000
Level 2 $’000
Level 3 $’000
Total $’000
Assets
Derivative financial instruments — 40 — 40
Assets held for sale — — 178,860 178,860
— 40 178,860 178,900
Liabilities
Derivative financial instruments — 2,417 — 2,417
Liabilities held for sale — — 70,842 70,842
Deferred consideration — — 25,180 25,180
— 2,417 96,022 98,439
Consolidated — 2016Level 1 $’000
Level 2 $’000
Level 3 $’000
Total $’000
Liabilities
Derivative financial liabilities — 1,794 — 1,794
Deferred consideration — — 12,748 12,748
— 1,794 12,748 14,542

116 BAPCOR
NOTES TO THE CONSOLIDATED FINANCIAL STATEMENTS continuedfor the year ended 30 June 2017
Note 29. Fair value measurement (continued)
Fair value hierarchy (continued)There were no transfers between levels during the financial year.
Derivative financial instruments carried at fair value are forward foreign exchange contracts and floating interest rate to fixed interest rate swaps. These are considered to be Level 2 financial instruments because their measurement is derived from inputs other than quoted prices included within Level 1 that are observable for the asset or liability, either directly or indirectly.
Deferred consideration is considered to be a Level 3 financial instrument because inputs in valuing this instrument are not based on observable market data. The fair value of this instrument is determined based on an estimated discounted cash flow analysis.
Assets and liabilities held for sale are considered to be a Level 3 financial instrument because inputs in valuing these assets are not based on observable market data. The fair value of these instruments are determined based on information obtained by management during the sale process (e.g. indicative bids, adviser estimates) as well as estimates derived on earning multiples.
Note 30. Remuneration of auditorsDuring the financial year the following fees were paid or payable for services provided by PricewaterhouseCoopers, the auditor of the company, and its network firms:
Consolidated
2017$
2016$
Audit services — PricewaterhouseCoopers
Audit or review of the financial statements 510,000 310,000
Other services — PricewaterhouseCoopers
Tax compliance services 60,602 54,315
Consulting services 106,000 11,302
166,602 65,617
676,602 375,617
Audit services — network firms
Audit or review of the financial statements 333,010 —
Other services — network firms
Tax compliance services 88,102 —
Consulting services 12,000 —
100,102 —
433,112 —
Total auditor remuneration 1,109,713 375,617

117 ANNUAL REPORT 2017
Note 31. Commitments and contingent liabilities
Consolidated
2017$’000
2016$’000
Commitments
Committed at the reporting date but not recognised as liabilities, payable:
Guarantees in relation to leases 2,982 3,455
Letters of credit in relation to the purchase of inventory 343 —
Guarantees in relation to performance of contracts1 483 —
Other commitments in relation to facility construction and consumable purchases1 1,571 —
5,379 3,455
Operating lease payables — continuing operations
Committed at the reporting date but not recognised as liabilities, payable:
Within one year 40,650 28,397
One to five years 72,802 54,642
More than five years 6,257 11,823
119,709 94,862
Operating lease receivables — continuing operations
Committed at the reporting date and recognised as assets, receivable:
Within one year 4,298 7,047
One to five years 7,110 11,774
More than five years 291 1,202
11,699 20,023
1. The commitments in relation to performance of contracts and facility construction and consumable purchases relate to the discontinued operations of Resource Services
Operating lease commitments includes contracted amounts for various retail outlets, warehouses, offices and plant and equipment under non-cancellable operating leases with, in some cases, options to extend. The leases have various escalation clauses. On renewal, the terms of the leases are renegotiated.
Contingent liabilitiesOther than the put and call option disclosed in note 18, there are no other unrecorded contingent liabilities (2016: Nil).

118 BAPCOR
NOTES TO THE CONSOLIDATED FINANCIAL STATEMENTS continuedfor the year ended 30 June 2017
Note 32. Related party transactions
Parent entityBapcor Limited is the parent entity.
SubsidiariesInterests in subsidiaries are set out in note 36.
Key management personnelDisclosures relating to key management personnel are set out in note 33 and the audited Remuneration Report included in the Directors’ Report.
Note 33. Related party transactions — key management personnel disclosures
Consolidated
2017$’000
2016$’000
Compensation
Short-term employee benefits 6,543 4,631
Post-employment benefits 218 170
Long-term benefits 60 45
Share-based payments 1,249 839
8,070 5,685
Loans
Opening balance 1,780 3,050
Amounts repaid (426) (1,270)
Closing balance 1,354 1,780
Refer to the audited Remuneration Report within the Directors’ Report for further details on key management personnel compensation, as well as note 15 for details on the loans made to key management personnel.

119 ANNUAL REPORT 2017
Note 34. Parent entity informationSet out below is supplementary information about the parent entity.
Parent
2017 $’000
2016 $’000
Statement of comprehensive income
Loss after income tax (18,276) (5,161)
Internal dividend income 108,000 —
Total comprehensive income 89,724 (5,161)
Parent
2017 $’000
2016 $’000
Statement of financial position
Total current assets — —
Total assets 672,422 426,596
Total current liabilities — —
Total liabilities — —
Equity
Issued capital 600,675 416,427
Other reserves 4,014 2,101
Current year profits/(losses) 89,724 (5,161)
Dividends paid (30,059) (23,728)
Prior years retained earnings 8,068 36,957
Total equity 672,422 426,596
Note 35. Business combinations
Current financial year acquisitionsThe consolidated entity acquired the net assets of the following businesses:
• Roadsafe Automotive Products (‘Roadsafe’)
• Autopro Raymond Terrace
• Autopro Gladstone
• Autopro Colac
• Autopro Gawler
• Autobarn Burleigh Heads
• Autobarn Beenleigh
• Autobarn Nambour
• Autobarn Orange
• Autobarn Virginia
The consolidated entity also acquired 100% of the following companies:
• Baxters Pty Ltd (‘Baxters’) in July 2016
• MTQ Engine Systems (Aust) Pty Ltd (‘MTQ’) in November 2016
• Hellaby Holdings Limited (‘Hellaby’) in January 2017
These acquisitions were made to strengthen the Bapcor offering as well as to enter the New Zealand market via the Hellaby acquisition.

120 BAPCOR
NOTES TO THE CONSOLIDATED FINANCIAL STATEMENTS continuedfor the year ended 30 June 2017
Note 35. Business combinations (continued)
Current financial year acquisitions (continued)The assets and liabilities recognised as a result of these acquisitions are set out below. Non-material business combinations have been aggregated. Acquisitions still within the acquisition period of twelve months from acquisition date are provisional at the time of this report.
Hellaby Roadsafe Baxters MTQ Other
Fair value$’000
Fair value$’000
Fair value$’000
Fair value$’000
Fair value$’000
Cash and cash equivalents — 2 — 1,112 11
Trade and other receivables 36,280 1,163 4,875 4,512 219
Inventories 65,581 1,300 8,294 8,686 2,296
Assets held for sale 163,334 — — — —
Plant and equipment 5,328 200 1,177 2,132 56
Intangible assets 11,384 1,886 1,772 562 —
Deferred tax assets 9,952 410 1,428 1,610 378
Deferred tax liabilities (3,087) (566) (532) (169) —
Trade and other payables (34,984) (506) (3,937) (3,740) (380)
Liabilities held for sale (64,423) — — — —
Provisions (8,323) (446) (1,134) (2,637) (834)
Bank overdraft (1,065) — (316) — —
Bank loans (79,487) — — — —
Net assets attributable to non-controlling interests (6,805) — — — —
Net assets acquired 93,685 3,443 11,627 12,068 1,746
Goodwill 241,000 7,824 13,008 8,722 3,045
Acquisition-date fair value of the total consideration transferred
334,685 11,267 24,635 20,790 4,791
Representing:
Cash paid 334,685 11,267 2,124 20,790 4,117
Shares issued — — 2,780 — —
Deferred and contingent consideration — — 19,731 — —
Debt forgiven — — — — 674
334,685 11,267 24,635 20,790 4,791
Cash used to acquire business, net of cash acquired:
Cash consideration 334,685 11,267 2,124 20,790 4,116
Add: bank overdraft 1,065 — 316 — —
Less: cash and cash equivalents — (2) — (1,112) (11)
Net cash used 335,750 11,265 2,440 19,678 4,105
Goodwill in relation to these acquisitions relates to the anticipated future probability of their contribution to the consolidated entity’s total business.

121 ANNUAL REPORT 2017
The Hellaby business acquisition took place on 13 January 2017 when control was deemed to have been in place. Refer to the segment disclosures for details of continuing operations contribution since acquisition at note 4. The discontinued operations contribution are disclosed in note 7. The contribution of the continuing operations of the Hellaby acquisition if the acquisition had taken place on 1 July 2016 (excluding any acquisition accounting adjustments) would have been an incremental revenue of $142.3M and EBITDA of $10.6M to the consolidated entity.
Each of the other business acquisitions took place on different dates and are heavily integrated into the consolidated entity’s operations and as such it is impractical to disclose the amount of profit since acquisition date. The amount of revenue contributed by these acquisitions for FY17 are as follows:
Business Acquired Revenue in FY17
Baxters Jul-16 $37.2M
Roadsafe Aug-16 $10.3M
MTQ Nov-16 $28.8M
Refer to note 5 for details on acquisition related costs incurred.
Deferred and contingent considerationA contingent consideration has been estimated and provided for on the Baxters acquisition and is currently accrued at $20,288,000 which is based on expected future earnings. This payment is due to the vendor if certain future targets are met.
Net assets attributable to non-controlling interestsAs part of the Hellaby business acquisition, within the Resource Services division there existed a minority interest in relation to a number of the Contract Services subsidiaries. The fair value attributable to this minority interest has been determined by reference to the fair value of that part of the business at the percentage held by the minority interest.
Prior financial year acquisitionsIn the previous financial year the consolidated entity made the following acquisitions:
• Aftermarket Network Australia Pty Ltd (formerly Metcash Automotive Holdings Pty Ltd)
• Bearing Wholesalers
• DB’s Auto One
• Precision Equipment
• Illawarra Auto Spares
• Revvin’s Auto Parts
• QAH North Geelong
• Sprint Auto Parts
• Manning River Autoparts
Due to an accounting policy change as outlined in note 3, a retrospective adjustment was made during the current year to recognise deferred tax liabilities on the indefinite life trademarks acquired as part of the above acquisitions. The impact of this adjustment to deferred tax liability and goodwill in the prior year was $13,367,000. No other material change to these business combinations occurred during the current year.

122 BAPCOR
NOTES TO THE CONSOLIDATED FINANCIAL STATEMENTS continuedfor the year ended 30 June 2017
Note 36. Interests in subsidiariesThe consolidated financial statements incorporate the assets, liabilities and results of the following subsidiaries in accordance with the accounting policies of the consolidated entity:
Ownership interest
NamePrincipal place of business/Country of incorporation
2017%
2016%
Bapcor Finance Pty Ltd (formerly Burson Finance Pty Ltd) Australia 100.0% 100.0%
Burson Automotive Pty Ltd Australia 100.0% 100.0%
Car Bitz & Accessories Pty Ltd Australia 100.0% 100.0%
Aftermarket Network Australia Pty Ltd (formerly Metcash Automotive Holdings Pty Ltd) Australia 100.0% 100.0%
Specialist Wholesalers Pty Ltd (formerly Australian Automotive Distribution Pty Ltd) Australia 100.0% 100.0%
Automotive Brands Group Pty Ltd Australia 100.0% 100.0%
Midas Australia Pty Ltd Australia 100.0% 100.0%
ACN 610 722 168 Australia 100.0% 100.0%
MTQ Engine Systems (Aust) Pty Ltd Australia 100.0% —
Baxters Pty Ltd Australia 100.0% —
Hellaby Holdings Limited New Zealand 100.0% —
Hellaby Automotive Limited New Zealand 100.0% —
Brake & Transmission NZ Limited New Zealand 100.0% —
Dasko Limited New Zealand 100.0% —
HCB Technologies Limited New Zealand 100.0% —
Diesel Distributors Limited New Zealand 100.0% —
TRS Tyre & Wheel Limited New Zealand 100.0% —
Truck & Trailer Parts Limited *** New Zealand 100.0% —
Hellaby Automotive Australia Pty Limited Australia 100.0% —
Ryde Batteries Pty Limited Australia 100.0% —
Ryde Batteries (Wholesale) Pty Limited Australia 100.0% —
Federal Batteries Qld Pty Limited Australia 100.0% —
Diesel Distributors Australia Pty Limited Australia 100.0% —
TRS Tyre & Wheel Pty Limited *** Australia 100.0% —
Hellaby Auto Electrical Pty Limited Australia 100.0% —
JAS Oceania Pty Limited Australia 100.0% —
Australian Automotive Electrical Wholesale Pty Ltd Australia 100.0% —
Low Voltage Pty Limited Australia 100.0% —
Premier Auto Trade Pty Limited Australia 100.0% —
Hellaby Auto Fuel Pty Limited *** Australia 100.0% —
Hellaby Australia Pty Limited Australia 100.0% —
Renouf Corporation International United States 100.0% —
Benequity Properties, LLC United States 100.0% —
Hellaby Investment No 13 Limited *** New Zealand 100.0% —
Hellaby Investment No 14 Limited *** New Zealand 100.0% —
Discount Shoe Warehouse Limited *** New Zealand 100.0% —
Generator Fund Limited *** New Zealand 100.0% —
Hellaby Brands Limited *** New Zealand 100.0% —
Number 1 Shoes Limited * New Zealand 100.0% —

123 ANNUAL REPORT 2017
Ownership interest
NamePrincipal place of business/Country of incorporation
2017%
2016%
R Hannah & Co Limited * New Zealand 100.0% —
Hellaby Resource Services Limited ** New Zealand 100.0% —
TBS Group Limited ** New Zealand 100.0% —
TBS Farnsworth Limited ** New Zealand 100.0% —
Total Bridge Services JV ** New Zealand 50.0% —
T.B.S. Coatings Limited ** New Zealand 100.0% —
TBS Remcon Limited ** New Zealand 100.0% —
Crow Refractory Limited ** New Zealand 100.0% —
Hellaby Investment No 8 Limited ** New Zealand 100.0% —
Hellaby Investments Number 10 Limited ** New Zealand 100.0% —
Contract Resources Investments Limited ** New Zealand 85.0% —
Contract Resources South America Limited ** New Zealand 85.0% —
Nexxo Contract Resources Do Brasil Manuseio De Catalisadores Ltda JV ** United States 42.5% —
Contract Resources (New Zealand) Limited ** New Zealand 85.0% —
Contract Resources Holdings Pty Limited ** Australia 85.0% —
Contract Resources Finance Pty Limited ** Australia 85.0% —
Contract Resources Australia Pty Limited ** Australia 85.0% —
Contract Resources Equipment Pty Limited ** Australia 85.0% —
DDT International Pty Limited ** Australia 85.0% —
Contract Resources Pty Limited ** Australia 85.0% —
CR Travel Pty Limited ** Australia 85.0% —
Contract Resources (Karratha) Pty Limited ** Australia 85.0% —
Contract Resources USA Inc ** United States 85.0% —
Contract Resources Limited LLC ** United States 85.0% —
Catalyst Handling Resources Holdings LLC ** United States 68.0% —
Catalyst Handling Resources Ltd ** Trinidad & Tobago 68.0% —
Catalyst Handling Resources LLC ** United States 68.0% —
JACR (JV) **The Kingdom of Saudi Arabia 41.7% —
Contract Resources Technical and Industrial Services LLC ** Oman 85.0% —
Contract Resources Oilfield Services LLC ** United Arab Emirates 85.0% —
Contract Resources Oilfield Services WLL ** Qatar 85.0% —
* These subsidiaries relate to the Footwear business unit of the Hellaby Holdings Limited acquisition performed in the current period and are held for sale.
** These subsidiaries relate to the Resource Services business unit of the Hellaby Holdings Limited acquisition performed in the current period and are held for sale. Minority shareholding is held in the intermediate group holding company, Contract Resources Investments Limited, except for the United States entities where there is an additional minority interest of 20%.
*** These subsidiaries are non-trading.

124 BAPCOR
NOTES TO THE CONSOLIDATED FINANCIAL STATEMENTS continuedfor the year ended 30 June 2017
Note 37. Deed of cross guaranteeThe following entities are party to a deed of cross guarantee under which each company guarantees the debts of the others. The companies below represent a ‘Closed Group’ for the purposes of the class order outlined below.
• Bapcor Limited
• Bapcor Finance Pty Limited (formerly Burson Finance Pty Limited)
• Burson Automotive Pty Limited
• Aftermarket Network Australia Pty Ltd (formerly Metcash Automotive Holdings Pty Ltd)
• Specialist Wholesalers Pty Ltd (formerly Australian Automotive Distribution Pty Ltd)
• Automotive Brands Group Pty Ltd
• Midas Australia Pty Ltd
• MTQ Engine Systems (Aust) Pty Ltd
• Baxters Pty Ltd
• Car Bitz & Accessories Pty Ltd
• ACN 610 722 168
• Australian Automotive Electrical Wholesale Pty Limited
• Diesel Distributors Australia Pty Limited
• Federal Batteries Qld Pty Limited
• Hellaby Australia Pty Limited
• Hellaby Automotive Australia Pty Limited
• Hellaby Auto Electrical Pty Limited
• Hellaby Auto Fuel Pty Limited
• JAS Oceania Pty Limited
• Low Voltage Pty Limited
• Premier Auto Trade Pty Limited
• Ryde Batteries Pty Limited
• Ryde Batteries (Wholesale) Pty Limited
• TRS Tyre & Wheel Pty Limited
By entering into the deed, the wholly-owned entities have been relieved from the requirement to prepare financial statements and Directors’ Report under Class Order 98/1418 issued by the Australian Securities and Investments Commission.
Set out below is a consolidated statement of comprehensive income and statement of financial position of the Closed Group.
2017 $’000
2016 $’000
Statement of comprehensive income
Revenue 922,348 685,629
Expenses (844,420) (623,513)
Profit before income tax expense 77,928 62,116
Income tax expense (25,001) (18,534)
Profit after income tax expense 52,927 43,582
Other comprehensive income
Changes in the fair value of cash flow hedges 2,191 (1,256)
Other comprehensive income for the year, net of tax 2,191 (1,256)
Total comprehensive income for the year 55,118 42,326

125 ANNUAL REPORT 2017
2017$’000
2016$’000
Equity — accumulated losses
Accumulated losses at the beginning of the financial year (51,052) (70,906)
Profit after income tax expense 52,927 43,582
Dividends paid (30,059) (23,728)
Accumulated losses at the end of the financial year (28,184) (51,052)
2017$’000
2016$’000
Statement of financial position
Current assets
Cash and cash equivalents 30,905 22,392
Trade and other receivables 114,618 87,304
Inventories 221,179 163,020
Derivative financial instruments 27 —
Income tax refund due 1,045 —
367,774 272,716
Non-current assets
Trade and other receivables 296 573
Property, plant and equipment 46,679 36,213
Intangibles 426,157 362,207
Deferred tax asset 10,356 7,247
Other 4,061 4,466
Intercompany 30,879 —
Investments 334,685 —
853,113 410,706
Total assets 1,220,887 683,422
Current liabilities
Trade and other payables 150,446 121,507
Derivative financial instruments 934 420
Income tax 4,998 6,236
Provisions 30,195 26,607
186,573 154,770
Non-current liabilities
Borrowings 429,747 148,184
Derivative financial instruments 637 1,374
Provisions 28,402 12,874
458,786 162,432
Total liabilities 645,359 317,202
Net assets 575,528 366,220
Equity
Issued capital 600,676 416,427
Reserves 3,036 845
Accumulated losses (28,184) (51,052)
Total equity 575,528 366,220

126 BAPCOR
NOTES TO THE CONSOLIDATED FINANCIAL STATEMENTS continuedfor the year ended 30 June 2017
Note 38. Events after the reporting periodOn 3 July 2017, Bapcor purchased Tricor Engineering ('Tricor') for a total of $2.4M of which $1.0M is deferred over the next two years. Tricor specialises in the supply and installation of lubrication equipment in the car dealership and heavy vehicle workshop market. The business will operate within the Precision Automotive Equipment business within the Trade segment.
Apart from the dividend declared as disclosed in note 25, no other matter or circumstance has arisen since 30 June 2017 that has significantly affected, or may significantly affect the consolidated entity’s operations, the results of those operations, or the consolidated entity’s state of affairs in future financial years.
Note 39. Reconciliation of profit after income tax to net cash from operating activities
Consolidated
2017$’000
2016$’000
Profit after income tax expense for the year 63,830 43,582
Adjustments for:
Depreciation and amortisation 13,527 9,673
Net gain on disposal of property, plant and equipment (80) (32)
Amortisation of capitalised borrowing costs 752 459
Amortisation of share-based payment 1,625 1,081
Component relating to discontinued operations (10,098) —
Change in operating assets and liabilities:
Decrease/(increase) in trade and other receivables (396) 631
Increase in inventories (12,450) (20,382)
Decrease/(increase) in other operating assets (1,027) 13,859
Increase/(decrease) in trade and other payables 10,737 (11,230)
Increase/(decrease) in provision for income tax (3,623) 1,676
Decrease in other operating liabilities (1,703) (54)
Net cash from operating activities 61,094 39,263

127 ANNUAL REPORT 2017
Note 40. Earnings per share
Consolidated
2017$’000
2016$’000
Earnings per share for profit from continuing operations
Profit after income tax attributable to the owners of Bapcor Limited 53,732 43,582
Cents Cents
Basic earnings per share 19.93 17.89
Diluted earnings per share 19.83 17.82
Consolidated
2017 $’000
2016 $’000
Earnings per share for profit from discontinued operations
Profit after income tax attributable to the owners of Bapcor Limited 10,098 —
Cents Cents
Basic earnings per share 3.75 —
Diluted earnings per share 3.73 —
Consolidated
2017 $’000
2016 $’000
Earnings per share for profit
Profit after income tax 63,830 43,582
Non-controlling interest 214 —
Profit after income tax attributable to the owners of Bapcor Limited 64,044 43,582
Cents Cents
Basic earnings per share 23.76 17.89
Diluted earnings per share 23.64 17.82
Number Number
Weighted average number of ordinary shares
Weighted average number of ordinary shares used in calculating basic earnings per share 269,599,050 243,646,174
Adjustments for calculation of diluted earnings per share:
Options over ordinary shares 1,337,272 935,184
Weighted average number of ordinary shares used in calculating diluted earnings per share 270,936,322 244,581,358
The weighted average number of ordinary shares for 2016 has been restated for the effect of the rights issues performed in accordance with AASB 133 Earnings Per Share.

128 BAPCOR
NOTES TO THE CONSOLIDATED FINANCIAL STATEMENTS continuedfor the year ended 30 June 2017
Note 41. Share-based payments
Long Term Incentive planThe Long Term Incentive ('LTI') plan is intended to assist in the motivation, retention and reward of certain senior executives. The LTI is a payment contingent on two and three year performance and the payments are rights to acquire shares ('Performance Rights'). Refer to the audited Remuneration Report within the Directors’ Report for further information on the LTI.
In FY17 an offer to participate in the LTI was made to nine of Bapcor’s senior executives. Each executive’s LTI opportunity comprised two tranches whereby:
• 34% of the allocated Performance Rights have a performance period that ends on 30 June 2018 at which time the performance hurdles for this tranche are tested; and
• 66% of the allocated Performance Rights have a performance period that ends on 30 June 2019 at which time the performance hurdles for this tranche are tested.
A summary of the terms for the Performance Rights granted in the current and prior financial years are set out in the following tables:
2017 Tranche 1 Tranche 2
Grant date 20/12/2016 20/12/2016
Performance hurdle Relative TSR EPS Relative TSR EPS
Performance period 1/07/2016 to 30/06/2018 1/07/2016 to 30/06/2018 1/07/2016 to 30/06/2019 1/07/2016 to 30/06/2019
Test date 30/06/2018 30/06/2019
Expiry date Once tested Once tested
Quantity granted 77,891 46,395 145,742 91,647
Exercise price Nil Nil
Fair value at 20/12/2016 $2.696 $5.265 $2.897 $5.160
Other conditions Restriction on sale to 30/06/2019 Restriction on sale to 30/06/2020
2016 Tranche 1 Tranche 2
Grant date 24/12/2015 24/12/2015
Performance hurdle Relative TSR EPS Relative TSR EPS
Performance period 1/07/2016 & 1/08/2016 to 30/06/2017
1/07/2016 & 1/08/2016 to 30/06/2017
1/07/2016 & 1/08/2016 to 30/06/2018
1/07/2016 & 1/08/2016 to 30/06/2018
Test date 30/06/2017 30/06/2018
Expiry date Once tested Once tested
Quantity granted 102,673 102,673 196,780 196,780
Exercise price Nil Nil
Fair value at 24/12/2015 $3.368 $3.958 $3.196 $3.842
Other conditions Restriction on sale to 30/06/2018 Restriction on sale to 30/06/2019
Relative total shareholder return (‘TSR’) hurdleFifty per cent of the Performance Rights granted to a participant will vest subject to a TSR performance hurdle that assesses performance by measuring capital growth in the share price together with income returned to shareholders, measured over the performance period against a Comparator Group of companies. The Performance Rights will vest by reference to Bapcor’s TSR performance ranking against this Comparator Group of companies, as follows:
Bapcor’s TSR relative to the Comparator Group over the performance period Percentage of TSR Rights vesting
Less than 50th percentile Nil
Equal to 50th percentile 50%
Greater than 50th percentile and less than 75th percentile Pro-rata straight-line vesting
Equal to or greater than 75th percentile 100%

129 ANNUAL REPORT 2017
Earnings per share (‘EPS’) growthFifty per cent of the Performance Rights granted to a participant will vest by reference to an EPS performance hurdle that measures the basic EPS on a normalised basis over the performance period. Each tranche of Performance Rights subject to an EPS hurdle will vest as follows:
Bapcor’s compound annual EPS growth over the performance period Percentage of EPS Rights Vesting
Less than 7.5% Nil
Equal to 7.5% 20%
Greater than 7.5% and less than 15% Pro-rata straight-line vesting
Equal to or greater than 15% 100%
There is no expiry date. The Performance Rights are exercised as soon as the vesting conditions are met. If vesting conditions are met, Performance Rights will automatically convert into fully paid ordinary shares of the company. Shares that are allocated in respect of each tranche will be subject to a restriction on sale for twelve months from vesting of the Performance Rights.
Set out below are summaries of Performance Rights granted under the LTI:
Grant date Vesting date Exercise priceBalance at the
start of the year Granted Exercised
Expired/ forfeited/
otherBalance at the end of the year
2017
24/04/2014 30/06/2016 $0.00 151,344 — (151,344) — —
24/04/2014 30/06/2017 $0.00 475,362 — — — 475,362
1/07/2015 30/06/2017 $0.00 128,868 — — — 128,868
1/07/2015 30/06/2018 $0.00 246,986 — — — 246,986
1/08/2015 30/06/2017 $0.00 76,478 — — — 76,478
1/08/2015 30/06/2018 $0.00 146,574 — — — 146,574
1/07/2016 30/06/2018 $0.00 — 124,286 — — 124,286
1/07/2016 30/06/2019 $0.00 — 237,389 — — 237,389
1,225,612 361,675 (151,344) — 1,435,943
Grant date Vesting date Exercise priceBalance at the
start of the year Granted Exercised
Expired/ forfeited/
otherBalance at the end of the year
2016
24/04/2014 30/06/2016 $0.00 151,344 — — — 151,344
24/04/2014 30/06/2017 $0.00 475,362 — — — 475,362
1/07/2015 30/06/2017 $0.00 — 128,868 — — 128,868
1/07/2015 30/06/2018 $0.00 — 246,986 — — 246,986
1/08/2015 30/06/2017 $0.00 — 76,478 — — 76,478
1/08/2015 30/06/2018 $0.00 — 146,574 — — 146,574
626,706 598,906 — — 1,225,612
The weighted average exercise price for the Performance Rights exercised in FY17 was $5.3958 (2016: N/a).
The weighted average contractual lives are 1.48 years (2016: 1.54 years). The expense arising from share-based payment transactions relating to the LTI during the year as part of employee benefits expense was $1,625,000 (2016: $1,081,000).
Refer to note 1 for details on the fair value determination of the share-based payments.
Employee Salary Sacrifice Share plan During the financial year, Bapcor issued shares to employees via an Employee Salary Sacrifice Share plan (‘ESSS’). The ESSS allowed eligible employees to acquire up to $1,000 of shares from their pre-tax wages. The value of this share-based payment transaction is deemed immaterial to the financial statements.

130 BAPCOR
DIRECTORS’ DECLARATION
In the directors’ opinion:
• the attached financial statements and notes comply with the Corporations Act 2001, the Accounting Standards, the Corporations Regulations 2001 and other mandatory professional reporting requirements;
• the attached financial statements and notes comply with International Financial Reporting Standards as issued by the International Accounting Standards Board as described in note 1 to the financial statements;
• the attached financial statements and notes give a true and fair view of the consolidated entity’s financial position as at 30 June 2017 and of its performance for the financial year ended on that date;
• there are reasonable grounds to believe that the company will be able to pay its debts as and when they become due and payable; and
• at the date of this declaration, there are reasonable grounds to believe that the members of the Extended Closed Group will be able to meet any obligations or liabilities to which they are, or may become, subject by virtue of the deed of cross guarantee described in note 37 to the financial statements.
The directors have been given the declarations required by section 295A of the Corporations Act 2001.
Signed in accordance with a resolution of directors made pursuant to section 295(5)(a) of the Corporations Act 2001.
On behalf of the directors
Robert McEniry Darryl AbotomeyChairman Chief Executive Officer
23 August 2017Melbourne

131 ANNUAL REPORT 2017
INDEPENDENT AUDITOR’S REPORT TO THE MEMBERS OF BAPCOR LIMITED
PricewaterhouseCoopers, ABN 52 780 433 757 2 Riverside Quay, SOUTHBANK VIC 3006, GPO Box 1331, MELBOURNE VIC 3001 T: 61 3 8603 1000, F: 61 3 8603 1999, www.pwc.com.au Liability limited by a scheme approved under Professional Standards Legislation.
Independent auditor’s report To the shareholders of Bapcor Limited Report on the audit of the financial report Our opinion In our opinion:
The accompanying financial report of Bapcor Limited (the Company) and its controlled entities (together the Group) is in accordance with the Corporations Act 2001, including:
a) giving a true and fair view of the Group’s financial position as at 30 June 2017 and of its financial performance for the year then ended
b) complying with Australian Accounting Standards and the Corporations Regulations 2001.
What we have audited The Group financial report comprises:
• the Consolidated statement of financial position as at 30 June 2017
• the Consolidated statement of comprehensive income for the year then ended
• the Consolidated statement of changes in equity for the year then ended
• the Consolidated statement of cash flows for the year then ended
• the Notes to the consolidated financial statements, which include a summary of Significant accounting policies
• the directors’ declaration
Basis for opinion We conducted our audit in accordance with Australian Auditing Standards. Our responsibilities under those standards are further described in the Auditor’s responsibilities for the audit of the financial report section of our report.
We believe that the audit evidence we have obtained is sufficient and appropriate to provide a basis for our opinion.
Independence
We are independent of the Group in accordance with the auditor independence requirements of the Corporations Act 2001 and the ethical requirements of the Accounting Professional and Ethical Standards Board’s APES 110 Code of Ethics for Professional Accountants (the Code) that are relevant to our audit of the financial report in Australia. We have also fulfilled our other ethical responsibilities in accordance with the Code.
Our audit approach An audit is designed to provide reasonable assurance about whether the financial report is free from material misstatement. Misstatements may arise due to fraud or error. They are considered material if individually or in aggregate, they could reasonably be expected to influence the economic decisions of users taken on the basis of the financial report.
131

132 BAPCOR
INDEPENDENT AUDITOR’S REPORT TO THE MEMBERS OF BAPCOR LIMITED continued
We tailored the scope of our audit to ensure that we performed enough work to be able to give an opinion on the financial report as a whole, taking into account the geographic and management structure of the Group, its accounting processes and controls and the industry in which it operates.
Materiality
• For the purpose of our audit we used overall group materiality of $4.1 million, which represents approximately 5% of the Group’s adjusted profit before tax.
• We applied this threshold, together with qualitative considerations, to determine the scope of our audit and the nature, timing and extent of our audit procedures and to evaluate the effect of misstatements on the financial report as a whole.
• We chose Group profit before tax because, in our view, it is the metric against which the performance of the Group is most commonly measured. Adjustments have been made for business combination transactions costs as they are considered to be unusual or infrequently occurring items impacting profit and loss.
• We utilised a 5% threshold based on our professional judgement, noting it is within the range of commonly acceptable thresholds.
Audit scope
• Our audit focused on areas where the Group made subjective judgements; for example, significant accounting estimates involving assumptions and inherently uncertain future events.
• Audit procedures were performed on the Australian and New Zealand operations assisted by local component auditors in New Zealand under the instruction and supervision of the group engagement team.
• Our team included specialists in taxation and experts in valuations to assist in the audit procedures over the fair value of intangible assets identified in the Hellaby Holdings Limited acquisition and goodwill impairment.
Key audit matters Key audit matters are those matters that, in our professional judgement, were of most significance in our audit of the financial report for the current period. The key audit matters were addressed in the context of our audit of the financial report as a whole, and in forming our opinion thereon, and we do not provide a separate opinion on these matters. Further, any commentary on the outcomes of a particular audit procedure is made in that context.
Key audit matter How our audit addressed the key audit matter
Accounting for acquisition of Hellaby Holdings Limited Refer to note 35 of the financial report
The Group made a number of acquisitions during the financial year ended 30 June 2017. The most significant completed was the
Our audit procedures included the following, amongst others:
• Considering whether the relevant evidence, including share registers and ASX announcements by the Group, was consistent with the Group’s determination
132

133 ANNUAL REPORT 2017
Key audit matter How our audit addressed the key audit matter acquisition of Hellaby Holdings Limited (Hellaby) in January 2017 for $334.6 million.
As per note 35 of the financial statements, the Group has recognised the fair value of assets and liabilities for each acquired business, which included identifiable intangible assets totalling $11.4 million and goodwill of $241 million. The fair value of assets held for sale at acquisition amounted to $163.3 million, representing the Resource Services Group and Footwear business acquired as part of the Hellaby acquisition.
The fair value of assets held for sale has been determined based on indicative bids, adviser estimates and estimates derived from earnings multiples (as described in note 29 of the financial statements).
We focused on this matter because of the significant judgement involved in the Group estimating the fair values of net assets acquired and the material impact on the financial report of the acquisition.
of the acquisition date of Hellaby based on the requirements of Australian Accounting Standards.
• Agreeing the fair value of consideration paid to third party records, including agreeing a sample of payments to bank records, and ASX take over announcements.
• Assessing the Group’s identification of
intangible assets, including consideration of whether the intangibles identified were complete. These procedures were performed with the support of PwC valuation experts.
• Assessing valuations of identified intangibles by testing the mathematical accuracy of valuation calculations, agreement of a sample of key valuation inputs to source documents and consideration of the appropriateness of a sample of other key valuation inputs, including the discount rate used. Agreeing inputs used in the calculation to those assessed in the Group’s expert report. These procedures were performed with the support of PwC valuation experts.
• Consideration of the competence, qualifications, experience and objectivity of the Group’s valuation experts who assisted with the Group’s valuations adopted for the Hellaby acquisition.
• Assessment of identification of business units held for sale in the acquisition in accordance with accounting standards.
• Consideration of the adequacy of the disclosures made in note 35, including with regard to the requirements of Australian Accounting Standards.
Carrying value of goodwill and intangible assets with indefinite lives Refer to note 14 of the financial report
At 30 June 2017, the Group recognised $561.8m of goodwill and $59.4m of intangible assets with indefinite lives (trademarks). At least annually, an impairment test is
Goodwill and intangible assets with indefinite lives
In assessing the models, our audit procedures included, amongst others:
• Assessing whether the grouping of CGUs (which was up to the Group’s operating segments) used to test impairment was appropriate in light of how
133

134 BAPCOR
INDEPENDENT AUDITOR’S REPORT TO THE MEMBERS OF BAPCOR LIMITED continued
Key audit matter How our audit addressed the key audit matter performed by the Group to assess whether the carrying value of the goodwill and intangible assets with indefinite lives, in each of the Group’s cash generating units (CGUs) are recoverable based on a ‘value in use’, using a discounted cashflow model, or ‘fair value less costs of disposal’ model (the models). Where a shortfall in value is identified, an impairment charge is recognised in the Consolidate statement of comprehensive income. Significant judgement is required by the Group to estimate the key assumptions in the models to determine the recoverable amount of the goodwill and the amount of any impairment. The most significant areas of judgment relate to:
• cash flow forecasts, including the terminal value forecast;
• short-term and future growth rates in revenue and EBITDA margin; and
• the discount rate adopted in the models.
Given the level of judgement applied by the Group and the magnitude of the goodwill and intangible assets with indefinite lives recognised on the Group’s Consolidated statement of financial position we determined that this was a key audit matter.
synergies were shared across the Group’s business based on our consideration of internal Group reporting, discussions and our understanding of the operation of the Group’s business.
• Assessing whether the grouping of CGUs appropriately included the assets, liabilities and cash flows directly attributable and a reasonable allocation of corporate overheads.
• Testing that forecast cash flows used in the models were consistent with the Group’s most up-to-date budgets and business plans formally approved by the Board and assessing whether the key assumptions used in the models were reasonable based on supporting evidence.
• Assessing the Group’s forecasting ability by comparing budgets with reported actuals.
• As part of our sensitivity analysis on key assumptions in the models, considering changes in the Group’s assumptions used in the models.
• With the assistance of PwC valuation experts, evaluating the appropriateness of the discount rates by assessing the reasonableness of the relevant inputs to the calculation against industry and market factors.
• Testing the mathematical accuracy of the models’ calculations.
• Considered the adequacy and accuracy of disclosures in note 14, including those regarding the key assumptions, in accordance with the requirements of Australian Accounting Standards.
Carrying value of Inventory Refer to note 10 of the financial report
At 30 June 2017 the Group recognised inventory of $261.6 million. The Group’s inventory is held at the lower of cost or net realisable value. Cost includes the purchase price of inventory, landing costs, such as freight and are reduced for related supplier rebates. The Group has recorded a provision for aged and slow moving inventory of $54 million. The provision is estimated based on the application of judgemental provisioning rates to aged and slow moving inventory categories. Specific
Our audit procedures included the following, amongst others:
• Considering if all inventory balances were included in the provision calculation.
• An evaluation of whether the methodology applied to calculate the provision was consistent with that applied in the prior year.
• Assessing the Group’s historical ability to make estimates by testing a sample of products included in the prior year inventory provision, including comparing the estimated recoverable amount to the
134

135 ANNUAL REPORT 2017
Key audit matter How our audit addressed the key audit matter provisioning for items where the known net realisable value is lower than cost are also recorded. We consider this to be a key audit matter because of the significant judgement and estimation involved by the Group in determining the net realisable value of inventory and the potentially material impact on the financial report.
actual gross margin earned on those products sold in the financial year and the clearance rate achieved.
• Testing of the mathematical accuracy of the provision calculation.
• Evaluating whether the provision for inventory was adequate by assessing:
• the gross margins recognised by the Group; and
• the inventory turnover ratio and ageing, including a comparison to the prior year.
Other information The directors are responsible for the other information. The other information included in the Group’s annual report for the year ended 30 June 2017 comprises the Director’s Report and Corporate Directory (but does not include the financial report and our auditor’s report thereon), which we obtained prior to the date of this auditor’s report. We also expect other information to be made available to us after the date of this auditor's report, including the Chairman’s Report, CEO’s Report, Corporate Governance Statement, Segment overview, Community & Sustainability and Shareholder Information.
Our opinion on the financial report does not cover the other information and we do not and will not express any opinion or form of assurance conclusion thereon.
In connection with our audit of the financial report, our responsibility is to read the other information identified above and, in doing so, consider whether the other information is materially inconsistent with the financial report or our knowledge obtained in the audit, or otherwise appears to be materially misstated.
If, based on the work we have performed on the other information that we obtained prior to the date of this auditor’s report, we conclude that there is a material misstatement of this other information, we are required to report that fact. We have nothing to report in this regard.
When we read the other information not yet received as identified above, if we conclude that there is a material misstatement therein, we are required to communicate the matter to the directors and use our professional judgement to determine the appropriate action to take.
Responsibilities of the directors for the financial report The directors of the Company are responsible for the preparation of the financial report that gives a true and fair view in accordance with Australian Accounting Standards and the Corporations Act 2001 and for such internal control as the directors determine is necessary to enable the preparation of the financial report that gives a true and fair view and is free from material misstatement, whether due to fraud or error.
In preparing the financial report, the directors are responsible for assessing the ability of the Group to continue as a going concern, disclosing, as applicable, matters related to going concern and using the going concern basis of accounting unless the directors either intend to liquidate the Group or to cease operations, or have has no realistic alternative but to do so.
135

136 BAPCOR
INDEPENDENT AUDITOR’S REPORT TO THE MEMBERS OF BAPCOR LIMITED continued
Auditor’s responsibilities for the audit of the financial report Our objectives are to obtain reasonable assurance about whether the financial report as a whole is free from material misstatement, whether due to fraud or error, and to issue an auditor’s report that includes our opinion. Reasonable assurance is a high level of assurance, but is not a guarantee that an audit conducted in accordance with the Australian Auditing Standards will always detect a material misstatement when it exists. Misstatements can arise from fraud or error and are considered material if, individually or in the aggregate, they could reasonably be expected to influence the economic decisions of users taken on the basis of the financial report.
A further description of our responsibilities for the audit of the financial report is located at the Auditing and Assurance Standards Board website at: http://www.auasb.gov.au/auditors_responsibilities/ar1.pdf. This description forms part of our auditor’s report.
Report on the remuneration report Our opinion on the remuneration report We have audited the remuneration report included in pages 20 to 38 of the directors’ report for the year ended 30 June 2017.
In our opinion, the remuneration report of Bapcor Limited for the year ended 30 June 2017 complies with section 300A of the Corporations Act 2001.
Responsibilities The directors of Bapcor Limited are responsible for the preparation and presentation of the remuneration report in accordance with section 300A of the Corporations Act 2001. Our responsibility is to express an opinion on the remuneration report, based on our audit conducted in accordance with Australian Auditing Standards.
PricewaterhouseCoopers
Daniel Rosenberg Melbourne Partner 23 August 2017
136

137 ANNUAL REPORT 2017
SHAREHOLDER INFORMATION
In accordance with ASX Listing Rule 4.10, the company provides the following information to shareholders not elsewhere disclosed in this Annual Report. The information provided is current as at 23 August 2017 (‘reporting date’).
1. Corporate Governance StatementBapcor (‘the company’) has prepared a Corporate Governance Statement which sets out the corporate governance practices that were in operation throughout the financial year for the company. In accordance with ASX Listing Rule 4.10.3, the Corporate Governance Statement will be available for review on the company’s website www.bapcor.com.au, and will be lodged with ASX at the same time that this Annual Report is lodged with ASX.
2. Distribution and number of shareholders of equity securitiesThe distribution and number of holders of equity securities on issue in the company as at the reporting date, and the number of holders holding less than a marketable parcel of the company’s ordinary shares, based on the closing market price as at the reporting date, is as follows:
2.1 Distribution of ordinary shareholders
Range Total holders Shares% of Issued
Capital
1 — 1,000 4,633 2,510,073 0.90
1,001 — 5,000 6,363 16,724,850 6.00
5,001 — 10,000 1,848 13,416,808 4.82
10,001 — 100,000 1,161 23,964,043 8.60
100,001 + 59 222,017,306 79.68
Total 14,064 278,633,080 100.00
Holders of less than a marketable parcel of $500 included in above total 182 6,085
2.2 Distribution of holders of performance rights
Range Total holdersPerformance
Rights %
1 — 1,000 — — —
1,001 — 5,000 — — —
5,001 — 10,000 — — —
10,001 — 100,000 6 415,023 28.90
100,001 + 5 1,020,920 71.10
Total 11 1,435,943 100.00

138 BAPCOR
SHAREHOLDER INFORMATION continued
3. Twenty largest quoted equity security holders The company only has one class of quoted securities, being ordinary shares. The names of the twenty largest holders of ordinary shares, the number of ordinary shares and the percentage of capital held by each holder is as follows:
Ordinary Shares
Name Number Held% of Issued
Capital
HSBC Custody Nominees 87,697,774 31.47
J P Morgan Nominees Australia 36,742,072 13.19
BNP Paribas Nominees Pty Ltd 23,754,242 8.53
Citicorp Nominees Pty Limited 22,723,071 8.16
National Nominees Limited 21,075,272 7.56
Garrmar Investments Pty Ltd 7,372,699 2.65
Glendale Investment Group Pty 2,817,313 1.01
Bond Street Custodians Limited 2,532,449 0.91
Netwealth Investments Limited 1,938,267 0.70
D Abotomey 1,689,912 0.61
AMP Life Limited 1,657,961 0.60
Schram Investments Pty Ltd 1,514,557 0.54
One Managed Investment 1,247,961 0.45
Shoppee Nominees Pty Ltd 1,234,567 0.44
Forsyth Barr Custodians Ltd 1,159,096 0.42
UBS Nominees Pty Ltd 999,951 0.36
BT Portfolio Services Limited 925,730 0.33
Invia Custodian Pty Limited 859,520 0.31
C Magill 809,246 0.29
Warbont Nominees Pty Ltd 700,362 0.25
219,452,022 78.78
Other Shareholders 59,181,058 21.22
Total Shareholders 278,633,080 100.00
4. Substantial holdersAs at the reporting date, the names of the substantial holders of the company and the number of equity securities in which those substantial holders and their associates have a relevant interest, as disclosed in substantial holding notices given to the company, are as follows:
Name Number Held% of Issued
Capital
FMR LLC 16,844,711 6.05
Commonwealth Bank of Australia 14,312,201 5.14
BT Investment Management 14,245,535 5.11

139 ANNUAL REPORT 2017
5. Voting rightsThe voting rights attaching to each class of equity securities are set out below:
5.1 Ordinary sharesAt a general meeting of the company, every holder of ordinary shares present in person or by proxy, attorney or representative has one vote on a show of hands and on a poll, one vote for each ordinary share held.
5.2 Performance rightsPerformance rights do not carry any voting rights.
6. Unquoted equity securities1,435,943 unlisted performance rights have been granted to 11 persons. There are no persons who hold 20% or more of performance rights that were not issued or acquired under an employee incentive scheme.
7. Voluntary escrowThere are no securities subject to voluntary escrow in the company as at the reporting date.
8. On-market buy-backThe company is not currently conducting an on-market buy-back.

140 BAPCOR
Corporate Information
DirectorsRobert McEniry (Independent, Non-Executive Director and Chairman)Darryl Abotomey (Chief Executive Officer and Managing Director)Andrew Harrison (Independent, Non-Executive Director)Therese Ryan (Independent, Non-Executive Director)Margaret Haseltine (Independent, Non-Executive Director)
Company secretaryGregory Fox
Notice of annual general meetingThe details of the annual general meeting of Bapcor Limited are:
Date: 2 November 2017Time: 1.00pm (Melbourne time)Address: Level 37, 101 Collins Street, Melbourne VIC 3000.
Registered office61 Gower StreetPreston VIC 3072Australia
Share registerComputershare Investor Services Pty Ltd452 Johnston StreetAbbotsford VIC 3067AustraliaPh: +61 3 9415 4000
AuditorPricewaterhouseCoopers2 Riverside QuaySouthbank VIC 3006Australia
Stock exchange listingBapcor Limited shares are listed on the Australian Securities Exchange (ASX code: BAP)
Websitewww.bapcor.com.au

ANNUAL REPORT 2017
RM
-17
076
